AES CORP
10-Ks and 10-Qs
|
|
|
|
|
|
|
|
|
|
|
|
|
|
|
|
|
|
|
|
|
|
|
|
|
|
|
|
|
|
|
|
|
|
|
|
|
|
|
|
|
|
|
|
|
|
|
|
|
|
|
|
|
|
|
|
|
|
|
UNITED STATES
SECURITIES AND EXCHANGE COMMISSION
WASHINGTON, D.C. 20549
______________________________________________________________________________________________
FORM 10-Q
(Mark One)
|
x
|
QUARTERLY REPORT PURSUANT TO SECTION 13 OR 15(d) OF THE SECURITIES EXCHANGE ACT OF 1934
|
For the Quarterly Period Ended
June 30, 2016
or
|
¨
|
TRANSITION REPORT PURSUANT TO SECTION 13 OR 15(d) OF THE SECURITIES EXCHANGE ACT OF 1934
|
Commission file number 1-12291

THE AES CORPORATION
(Exact name of registrant as specified in its charter)
|
Delaware
|
54 1163725
|
|
|
(State or other jurisdiction of incorporation or organization)
|
(I.R.S. Employer Identification No.)
|
|
|
4300 Wilson Boulevard Arlington, Virginia
|
22203
|
|
|
(Address of principal executive offices)
|
(Zip Code)
|
|
(703) 522-1315
Registrant’s telephone number, including area code:
______________________________________________________________________________________________
Indicate by check mark whether the registrant (1) has filed all reports required to be filed by Section 13 or 15(d) of the Securities Exchange Act of 1934 during the preceding 12 months (or for such shorter period that the registrant was required to file such reports), and (2) has been subject to such filing requirements for the past 90 days. Yes
x
No
¨
Indicate by check mark whether the registrant has submitted electronically and posted on its corporate Web site, if any, every Interactive Data File required to be submitted and posted pursuant to Rule 405 of Regulation S-T (§232.405 of this chapter) during the preceding 12 months (or for such shorter period that the registrant was required to submit and post such files). Yes
x
No
¨
Indicate by check mark whether the registrant is a large accelerated filer, an accelerated filer, a non-accelerated filer, or a smaller reporting company. See the definitions of “large accelerated filer”, “accelerated filer”, and “smaller reporting company” in Rule 12b-2 of the Exchange Act. (Check one):
|
Large accelerated filer
x
|
Accelerated filer
¨
|
Non-accelerated filer
¨
|
Smaller reporting company
¨
|
|||
|
(Do not check if a smaller reporting company)
|
||||||
Indicate by check mark whether the registrant is a shell company (as defined in Rule 12b-2 of the Exchange Act). Yes
¨
No
x
______________________________________________________________________________________________
The number of shares outstanding of Registrant’s Common Stock, par value
$0.01
per share, on
July 29, 2016
was
659,089,478
THE AES CORPORATION
FORM 10-Q
FOR THE QUARTERLY PERIOD ENDED
JUNE 30, 2016
TABLE OF CONTENTS
|
ITEM 1.
|
||
|
ITEM 2.
|
||
|
ITEM 3.
|
||
|
ITEM 4.
|
||
|
ITEM 1.
|
||
|
ITEM 1A.
|
||
|
ITEM 2.
|
||
|
ITEM 3.
|
||
|
ITEM 4.
|
||
|
ITEM 5.
|
||
|
ITEM 6.
|
||
GLOSSARY OF TERMS
The following terms and acronyms appear in the text of this report and have the definitions indicated below:
|
Adjusted EPS
|
Adjusted Earnings Per Share, a non-GAAP measure
|
|
Adjusted PTC
|
Adjusted Pretax Contribution, a non-GAAP measure of operating performance
|
|
AES
|
The Parent Company and its subsidiaries and affiliates
|
|
AFS
|
Available For Sale
|
|
ANEEL
|
Brazilian National Electric Energy Agency
|
|
AOCL
|
Accumulated Other Comprehensive Loss
|
|
ASC
|
Accounting Standards Codification
|
|
ASU
|
Accounting Standards Update
|
|
BNDES
|
Brazilian Development Bank
|
|
BoD
|
Board of Directors
|
|
CAA
|
United States Clean Air Act
|
|
CAMMESA
|
Wholesale Electric Market Administrator in Argentina
|
|
CCR
|
Coal Combustion Residuals
|
|
CCGT
|
Combined Cycle Gas Turbine
|
|
CDPQ
|
La Caisse de depot et placement du Quebec
|
|
CFE
|
Federal Commission of Electricity
|
|
CO
2
|
Carbon Dioxide
|
|
CTA
|
Cumulative Translation Adjustment
|
|
DP&L
|
The Dayton Power & Light Company
|
|
DPL
|
DPL Inc.
|
|
DPLER
|
DPL Energy Resources, Inc.
|
|
EPA
|
United States Environmental Protection Agency
|
|
EPC
|
Engineering, Procurement and Construction
|
|
EURIBOR
|
Euro Interbank Offered Rate
|
|
FASB
|
Financial Accounting Standards Board
|
|
FCA
|
Federal Court of Appeals
|
|
FERC
|
Federal Energy Regulatory Commission
|
|
FX
|
Foreign Exchange
|
|
GAAP
|
Generally Accepted Accounting Principles in the United States
|
|
GHG
|
Greenhouse Gas
|
|
GWh
|
Gigawatt Hours
|
|
HLBV
|
Hypothetical Liquidation Book Value
|
|
ICC
|
International Chamber of Commerce
|
|
IPALCO
|
IPALCO Enterprises, Inc.
|
|
IPL
|
Indianapolis Power & Light Company
|
|
IURC
|
Indiana Utility Regulatory Commission
|
|
kWh
|
Kilowatt Hours
|
|
LIBOR
|
London Interbank Offered Rate
|
|
MATS
|
Mercury and Air Toxics Standards
|
|
MW
|
Megawatts
|
|
MWh
|
Megawatt Hours
|
|
NEK
|
Natsionalna Elektricheska Kompania (state-owned electricity public supplier in Bulgaria)
|
|
NOV
|
Notice of Violation
|
|
NO
X
|
Nitrogen Oxides
|
|
NCI
|
Noncontrolling Interest
|
|
OCI
|
Other Comprehensive Income
|
|
O&M
|
Operations and Maintenance
|
|
OPGC
|
Odisha Power Generation Corporation
|
|
PIS
|
Partially Integrated System
|
|
PPA
|
Power Purchase Agreement
|
|
PREPA
|
Puerto Rico Electric Power Authority
|
|
RSU
|
Restricted Stock Unit
|
|
RTO
|
Regional Transmission Organization
|
|
SIC
|
Central Interconnected Electricity System
|
|
SBU
|
Strategic Business Unit
|
|
SEC
|
United States Securities and Exchange Commission
|
|
SO
2
|
Sulfur Dioxide
|
|
TA
|
Transportation Agreement
|
|
U.S.
|
United States
|
|
USD
|
United States Dollar
|
|
VAT
|
Value-Added Tax
|
1
THE AES CORPORATION
(Unaudited)
|
June 30, 2016
|
December 31, 2015
|
||||||
|
(in millions, except share and per share data)
|
|||||||
|
ASSETS
|
|||||||
|
CURRENT ASSETS
|
|||||||
|
Cash and cash equivalents
|
$
|
1,265
|
|
$
|
1,257
|
|
|
|
Restricted cash
|
250
|
|
295
|
|
|||
|
Short-term investments
|
544
|
|
469
|
|
|||
|
Accounts receivable, net of allowance for doubtful accounts of $108 and $87 respectively
|
2,087
|
|
2,302
|
|
|||
|
Inventory (see Note 2)
|
655
|
|
671
|
|
|||
|
Prepaid expenses
|
91
|
|
106
|
|
|||
|
Other current assets
|
1,441
|
|
1,318
|
|
|||
|
Current assets of discontinued operations and held-for-sale businesses
|
1,048
|
|
424
|
|
|||
|
Total current assets
|
7,381
|
|
6,842
|
|
|||
|
NONCURRENT ASSETS
|
|||||||
|
Property, Plant and Equipment:
|
|||||||
|
Land
|
785
|
|
702
|
|
|||
|
Electric generation, distribution assets and other
|
28,416
|
|
27,751
|
|
|||
|
Accumulated depreciation
|
(9,705
|
)
|
(9,327
|
)
|
|||
|
Construction in progress
|
3,539
|
|
3,029
|
|
|||
|
Property, plant and equipment, net
|
23,035
|
|
22,155
|
|
|||
|
Other Assets:
|
|||||||
|
Investments in and advances to affiliates (see Note 6)
|
615
|
|
610
|
|
|||
|
Debt service reserves and other deposits
|
700
|
|
555
|
|
|||
|
Goodwill
|
1,157
|
|
1,157
|
|
|||
|
Other intangible assets, net of accumulated amortization of $97 and $93, respectively
|
219
|
|
207
|
|
|||
|
Deferred income taxes
|
483
|
|
410
|
|
|||
|
Service concession assets, net of accumulated amortization of $71 and $34, respectively
|
1,486
|
|
1,543
|
|
|||
|
Other noncurrent assets
|
1,898
|
|
2,109
|
|
|||
|
Noncurrent assets of discontinued operations and held-for-sale businesses
|
—
|
|
882
|
|
|||
|
Total other assets
|
6,558
|
|
7,473
|
|
|||
|
TOTAL ASSETS
|
$
|
36,974
|
|
$
|
36,470
|
|
|
|
LIABILITIES AND EQUITY
|
|||||||
|
CURRENT LIABILITIES
|
|||||||
|
Accounts payable
|
$
|
1,434
|
|
$
|
1,571
|
|
|
|
Accrued interest
|
249
|
|
236
|
|
|||
|
Accrued and other liabilities
|
2,082
|
|
2,286
|
|
|||
|
Non-recourse debt, including $190 and $258, respectively, related to variable interest entities (see Note 7)
|
1,610
|
|
2,172
|
|
|||
|
Current liabilities of discontinued operations and held-for-sale businesses
|
841
|
|
661
|
|
|||
|
Total current liabilities
|
6,216
|
|
6,926
|
|
|||
|
NONCURRENT LIABILITIES
|
|||||||
|
Recourse debt (see Note 7)
|
4,909
|
|
4,966
|
|
|||
|
Non-recourse debt, including $1,059 and $1,531, respectively, related to variable interest entities (see Note 7)
|
14,261
|
|
12,943
|
|
|||
|
Deferred income taxes
|
1,036
|
|
1,090
|
|
|||
|
Pension and other post-retirement liabilities (see Note 9)
|
1,054
|
|
919
|
|
|||
|
Other noncurrent liabilities
|
3,072
|
|
2,794
|
|
|||
|
Noncurrent liabilities of discontinued operations and held-for-sale businesses
|
—
|
|
123
|
|
|||
|
Total noncurrent liabilities
|
24,332
|
|
22,835
|
|
|||
|
Commitments and Contingencies (see Note 8)
|
|
|
|||||
|
Redeemable stock of subsidiaries
|
753
|
|
538
|
|
|||
|
EQUITY (see Note 10)
|
|||||||
|
THE AES CORPORATION STOCKHOLDERS’ EQUITY
|
|||||||
|
Common stock ($0.01 par value, 1,200,000,000 shares authorized; 815,894,592 issued and 659,001,121 outstanding at June 30, 2016 and 815,846,621 issued and 666,808,790 outstanding at December 31, 2015)
|
8
|
|
8
|
|
|||
|
Additional paid-in capital
|
8,714
|
|
8,718
|
|
|||
|
Retained earnings (accumulated deficit)
|
(284
|
)
|
143
|
|
|||
|
Accumulated other comprehensive loss
|
(3,768
|
)
|
(3,883
|
)
|
|||
|
Treasury stock, at cost (156,893,471 shares at June 30, 2016 and 149,037,831 at December 31, 2015)
|
(1,904
|
)
|
(1,837
|
)
|
|||
|
Total AES Corporation stockholders’ equity
|
2,766
|
|
3,149
|
|
|||
|
NONCONTROLLING INTERESTS
|
2,907
|
|
3,022
|
|
|||
|
Total equity
|
5,673
|
|
6,171
|
|
|||
|
TOTAL LIABILITIES AND EQUITY
|
$
|
36,974
|
|
$
|
36,470
|
|
|
See Notes to Condensed Consolidated Financial Statements.
2
THE AES CORPORATION
(Unaudited)
|
Three Months Ended June 30,
|
Six Months Ended June 30,
|
||||||||||||||
|
2016
|
2015
|
2016
|
2015
|
||||||||||||
|
(in millions, except per share amounts)
|
|||||||||||||||
|
Revenue:
|
|||||||||||||||
|
Regulated
|
$
|
1,565
|
|
$
|
1,794
|
|
$
|
3,141
|
|
$
|
3,628
|
|
|||
|
Non-Regulated
|
1,664
|
|
1,862
|
|
3,359
|
|
3,786
|
|
|||||||
|
Total revenue
|
3,229
|
|
3,656
|
|
6,500
|
|
7,414
|
|
|||||||
|
Cost of Sales:
|
|||||||||||||||
|
Regulated
|
(1,431
|
)
|
(1,432
|
)
|
(2,898
|
)
|
(2,989
|
)
|
|||||||
|
Non-Regulated
|
(1,224
|
)
|
(1,469
|
)
|
(2,519
|
)
|
(2,949
|
)
|
|||||||
|
Total cost of sales
|
(2,655
|
)
|
(2,901
|
)
|
(5,417
|
)
|
(5,938
|
)
|
|||||||
|
Operating margin
|
574
|
|
755
|
|
1,083
|
|
1,476
|
|
|||||||
|
General and administrative expenses
|
(47
|
)
|
(50
|
)
|
(95
|
)
|
(105
|
)
|
|||||||
|
Interest expense
|
(390
|
)
|
(287
|
)
|
(732
|
)
|
(630
|
)
|
|||||||
|
Interest income
|
138
|
|
116
|
|
255
|
|
195
|
|
|||||||
|
Gain (loss) on extinguishment of debt
|
—
|
|
(117
|
)
|
4
|
|
(141
|
)
|
|||||||
|
Other expense
|
(21
|
)
|
(12
|
)
|
(29
|
)
|
(29
|
)
|
|||||||
|
Other income
|
12
|
|
15
|
|
25
|
|
30
|
|
|||||||
|
Gain (loss) on disposal and sale of businesses
|
(17
|
)
|
—
|
|
30
|
|
—
|
|
|||||||
|
Asset impairment expense
|
(235
|
)
|
(37
|
)
|
(394
|
)
|
(45
|
)
|
|||||||
|
Foreign currency transaction gains (losses)
|
(36
|
)
|
13
|
|
4
|
|
(8
|
)
|
|||||||
|
INCOME (LOSS) FROM CONTINUING OPERATIONS BEFORE TAXES AND EQUITY IN EARNINGS OF AFFILIATES
|
(22
|
)
|
396
|
|
151
|
|
743
|
|
|||||||
|
Income tax benefit (expense)
|
7
|
|
(123
|
)
|
(90
|
)
|
(223
|
)
|
|||||||
|
Net equity in earnings of affiliates
|
7
|
|
1
|
|
14
|
|
15
|
|
|||||||
|
INCOME (LOSS) FROM CONTINUING OPERATIONS
|
(8
|
)
|
274
|
|
75
|
|
535
|
|
|||||||
|
Income (loss) from operations of discontinued businesses, net of income tax (expense) benefit of $(1), $3, $3 and $7, respectively
|
3
|
|
(10
|
)
|
(6
|
)
|
(17
|
)
|
|||||||
|
Net loss from disposal and impairments of discontinued businesses, net of income tax benefit of $401, $0, $401 and $0, respectively
|
(382
|
)
|
—
|
|
(382
|
)
|
—
|
|
|||||||
|
NET INCOME (LOSS)
|
(387
|
)
|
264
|
|
(313
|
)
|
518
|
|
|||||||
|
Less: Net income attributable to noncontrolling interests
|
(95
|
)
|
(195
|
)
|
(43
|
)
|
(307
|
)
|
|||||||
|
NET INCOME (LOSS) ATTRIBUTABLE TO THE AES CORPORATION
|
$
|
(482
|
)
|
$
|
69
|
|
$
|
(356
|
)
|
$
|
211
|
|
|||
|
AMOUNTS ATTRIBUTABLE TO THE AES CORPORATION COMMON STOCKHOLDERS:
|
|||||||||||||||
|
Income (loss) from continuing operations, net of tax
|
$
|
(103
|
)
|
$
|
79
|
|
$
|
32
|
|
$
|
228
|
|
|||
|
Loss from discontinued operations, net of tax
|
(379
|
)
|
(10
|
)
|
(388
|
)
|
(17
|
)
|
|||||||
|
NET INCOME (LOSS) ATTRIBUTABLE TO THE AES CORPORATION
|
$
|
(482
|
)
|
$
|
69
|
|
$
|
(356
|
)
|
$
|
211
|
|
|||
|
BASIC EARNINGS PER SHARE:
|
|||||||||||||||
|
Income (loss) from continuing operations attributable to The AES Corporation common stockholders, net of tax
|
$
|
(0.16
|
)
|
$
|
0.11
|
|
$
|
0.05
|
|
$
|
0.33
|
|
|||
|
Loss from discontinued operations attributable to The AES Corporation common stockholders, net of tax
|
(0.57
|
)
|
(0.01
|
)
|
(0.59
|
)
|
(0.03
|
)
|
|||||||
|
NET INCOME (LOSS) ATTRIBUTABLE TO THE AES CORPORATION COMMON STOCKHOLDERS
|
$
|
(0.73
|
)
|
$
|
0.10
|
|
$
|
(0.54
|
)
|
$
|
0.30
|
|
|||
|
DILUTED EARNINGS PER SHARE:
|
|||||||||||||||
|
Income (loss) from continuing operations attributable to The AES Corporation common stockholders, net of tax
|
$
|
(0.16
|
)
|
$
|
0.11
|
|
$
|
0.05
|
|
$
|
0.33
|
|
|||
|
Loss from discontinued operations attributable to The AES Corporation common stockholders, net of tax
|
(0.57
|
)
|
(0.01
|
)
|
(0.59
|
)
|
(0.03
|
)
|
|||||||
|
NET INCOME (LOSS) ATTRIBUTABLE TO THE AES CORPORATION COMMON STOCKHOLDERS
|
$
|
(0.73
|
)
|
$
|
0.10
|
|
$
|
(0.54
|
)
|
$
|
0.30
|
|
|||
|
DILUTED SHARES OUTSTANDING
|
659
|
|
695
|
|
662
|
|
701
|
|
|||||||
|
DIVIDENDS DECLARED PER COMMON SHARE
|
$
|
—
|
|
$
|
0.10
|
|
$
|
0.11
|
|
$
|
0.10
|
|
|||
See Notes to Condensed Consolidated Financial Statements.
3
THE AES CORPORATION
Condensed Consolidated Statements of Comprehensive (Loss) Income
(Unaudited)
|
Three Months Ended
June 30, |
Six Months Ended
June 30, |
||||||||||||||
|
2016
|
2015
|
2016
|
2015
|
||||||||||||
|
(in millions)
|
|||||||||||||||
|
NET INCOME (LOSS)
|
$
|
(387
|
)
|
$
|
264
|
|
$
|
(313
|
)
|
$
|
518
|
|
|||
|
Foreign currency translation activity:
|
|||||||||||||||
|
Foreign currency translation adjustments, net of income tax benefit of $1, $0, $1 and $0 respectively
|
120
|
|
77
|
|
248
|
|
(344
|
)
|
|||||||
|
Total foreign currency translation adjustments
|
120
|
|
77
|
|
248
|
|
(344
|
)
|
|||||||
|
Derivative activity:
|
|||||||||||||||
|
Change in derivative fair value, net of income tax benefit (expense) of $25, $(20), $46 and $(3), respectively
|
(93
|
)
|
82
|
|
(157
|
)
|
10
|
|
|||||||
|
Reclassification to earnings, net of income tax expense of $4, $1, $1 and $3, respectively
|
3
|
|
7
|
|
2
|
|
19
|
|
|||||||
|
Total change in fair value of derivatives
|
(90
|
)
|
89
|
|
(155
|
)
|
29
|
|
|||||||
|
Pension activity:
|
|||||||||||||||
|
Change in pension adjustments due to prior service cost, net of $0 income tax for all periods
|
—
|
|
—
|
|
1
|
|
—
|
|
|||||||
|
Change in pension adjustments due to net actuarial loss for the period, net of $0 income tax for all periods
|
—
|
|
—
|
|
(1
|
)
|
—
|
|
|||||||
|
Reclassification to earnings due to amortization of net actuarial loss, net of income tax expense of $1, $2, $2 and $5, respectively
|
4
|
|
4
|
|
7
|
|
9
|
|
|||||||
|
Total pension adjustments
|
4
|
|
4
|
|
7
|
|
9
|
|
|||||||
|
OTHER COMPREHENSIVE INCOME (LOSS)
|
34
|
|
170
|
|
100
|
|
(306
|
)
|
|||||||
|
COMPREHENSIVE INCOME (LOSS)
|
(353
|
)
|
434
|
|
(213
|
)
|
212
|
|
|||||||
|
Less: Comprehensive loss attributable to noncontrolling interests
|
(90
|
)
|
(261
|
)
|
(28
|
)
|
(173
|
)
|
|||||||
|
COMPREHENSIVE INCOME (LOSS) ATTRIBUTABLE TO THE AES CORPORATION
|
$
|
(443
|
)
|
$
|
173
|
|
$
|
(241
|
)
|
$
|
39
|
|
|||
See Notes to Condensed Consolidated Financial Statements.
4
THE AES CORPORATION
(Unaudited)
|
Six Months Ended June 30,
|
|||||||
|
2016
|
2015
|
||||||
|
(in millions)
|
|||||||
|
OPERATING ACTIVITIES:
|
|||||||
|
Net income (loss)
|
$
|
(313
|
)
|
$
|
518
|
|
|
|
Adjustments to net income:
|
|||||||
|
Depreciation and amortization
|
586
|
|
597
|
|
|||
|
Gain on sales and disposals of businesses
|
(30
|
)
|
—
|
|
|||
|
Impairment expenses
|
396
|
|
45
|
|
|||
|
Deferred income taxes
|
(443
|
)
|
17
|
|
|||
|
Provisions for (reversals of) contingencies
|
21
|
|
(134
|
)
|
|||
|
(Gain) loss on extinguishment of debt
|
(4
|
)
|
145
|
|
|||
|
Loss on sales of assets
|
14
|
|
12
|
|
|||
|
Impairments of discontinued operations and held-for-sale businesses
|
783
|
|
—
|
|
|||
|
Other
|
79
|
|
70
|
|
|||
|
Changes in operating assets and liabilities
|
|||||||
|
(Increase) decrease in accounts receivable
|
366
|
|
(444
|
)
|
|||
|
(Increase) decrease in inventory
|
12
|
|
(54
|
)
|
|||
|
(Increase) decrease in prepaid expenses and other current assets
|
473
|
|
132
|
|
|||
|
(Increase) decrease in other assets
|
(172
|
)
|
(815
|
)
|
|||
|
Increase (decrease) in accounts payable and other current liabilities
|
(557
|
)
|
179
|
|
|||
|
Increase (decrease) in income tax payables, net and other tax payables
|
(255
|
)
|
(131
|
)
|
|||
|
Increase (decrease) in other liabilities
|
407
|
|
453
|
|
|||
|
Net cash provided by operating activities
|
1,363
|
|
590
|
|
|||
|
INVESTING ACTIVITIES:
|
|||||||
|
Capital expenditures
|
(1,255
|
)
|
(1,168
|
)
|
|||
|
Acquisitions, net of cash acquired
|
(11
|
)
|
(18
|
)
|
|||
|
Proceeds from the sale of businesses, net of cash sold
|
156
|
|
2
|
|
|||
|
Sale of short-term investments
|
2,762
|
|
2,460
|
|
|||
|
Purchase of short-term investments
|
(2,806
|
)
|
(2,270
|
)
|
|||
|
Increase in restricted cash, debt service reserves and other assets
|
(142
|
)
|
(51
|
)
|
|||
|
Other investing
|
(30
|
)
|
(25
|
)
|
|||
|
Net cash used in investing activities
|
(1,326
|
)
|
(1,070
|
)
|
|||
|
FINANCING ACTIVITIES:
|
|||||||
|
Borrowings under the revolving credit facilities
|
664
|
|
361
|
|
|||
|
Repayments under the revolving credit facilities
|
(681
|
)
|
(359
|
)
|
|||
|
Issuance of recourse debt
|
500
|
|
575
|
|
|||
|
Repayments of recourse debt
|
(611
|
)
|
(915
|
)
|
|||
|
Issuance of non-recourse debt
|
1,534
|
|
1,940
|
|
|||
|
Repayments of non-recourse debt
|
(1,054
|
)
|
(1,457
|
)
|
|||
|
Payments for financing fees
|
(55
|
)
|
(40
|
)
|
|||
|
Distributions to noncontrolling interests
|
(236
|
)
|
(113
|
)
|
|||
|
Contributions from noncontrolling interests
|
94
|
|
97
|
|
|||
|
Proceeds from the sale of redeemable stock of subsidiaries
|
134
|
|
461
|
|
|||
|
Dividends paid on AES common stock
|
(145
|
)
|
(141
|
)
|
|||
|
Payments for financed capital expenditures
|
(87
|
)
|
(84
|
)
|
|||
|
Purchase of treasury stock
|
(79
|
)
|
(307
|
)
|
|||
|
Other financing
|
(21
|
)
|
(29
|
)
|
|||
|
Net cash used in financing activities
|
(43
|
)
|
(11
|
)
|
|||
|
Effect of exchange rate changes on cash
|
8
|
|
(19
|
)
|
|||
|
Decrease in cash of discontinued operations and held-for-sale businesses
|
6
|
|
12
|
|
|||
|
Total increase (decrease) in cash and cash equivalents
|
8
|
|
(498
|
)
|
|||
|
Cash and cash equivalents, beginning
|
1,257
|
|
1,517
|
|
|||
|
Cash and cash equivalents, ending
|
$
|
1,265
|
|
$
|
1,019
|
|
|
|
SUPPLEMENTAL DISCLOSURES:
|
|||||||
|
Cash payments for interest, net of amounts capitalized
|
$
|
615
|
|
$
|
665
|
|
|
|
Cash payments for income taxes, net of refunds
|
$
|
347
|
|
$
|
247
|
|
|
|
SCHEDULE OF NONCASH INVESTING AND FINANCING ACTIVITIES:
|
|||||||
|
Assets acquired through capital lease and other liabilities
|
$
|
5
|
|
$
|
10
|
|
|
See Notes to Condensed Consolidated Financial Statements.
5
THE AES CORPORATION
Notes to Condensed Consolidated Financial Statements
For the
Three and Six
Months Ended
June 30, 2016
and
2015
1
. FINANCIAL STATEMENT PRESENTATION
The prior-period condensed consolidated financial statements in this Quarterly Report on Form 10-Q (“Form 10-Q”) have been reclassified to reflect the businesses held-for-sale and discontinued operations as discussed in Note
15
—Discontinued Operations and Held-for-Sale Businesses
.
Consolidation
—
In this Quarterly Report the terms “AES,” “the Company,” “us” or “we” refer to the consolidated entity including its subsidiaries and affiliates. The terms “The AES Corporation” or “the Parent Company” refer only to the publicly held holding company, The AES Corporation, excluding its subsidiaries and affiliates. Furthermore, variable interest entities (“VIEs”) in which the Company has a variable interest have been consolidated where the Company is the primary beneficiary. Investments in which the Company has the ability to exercise significant influence, but not control, are accounted for using the equity method of accounting. All intercompany transactions and balances have been eliminated in consolidation.
Interim Financial Presentation
—
The accompanying unaudited condensed consolidated financial statements and footnotes have been prepared in accordance with GAAP, as contained in the FASB ASC, for interim financial information and Article 10 of Regulation S-X issued by the SEC. Accordingly, they do not include all the information and footnotes required by GAAP for annual fiscal reporting periods. In the opinion of management, the interim financial information includes all adjustments of a normal recurring nature necessary for a fair presentation of the results of operations, financial position, comprehensive income and cash flows. The results of operations for the
three and six
months ended
June 30, 2016
are not necessarily indicative of results that may be expected for the year ending December 31,
2016
. The accompanying condensed consolidated financial statements are unaudited and should be read in conjunction with the
2015
audited consolidated financial statements and notes thereto, which are included in the
2015
Form 10-K filed with the SEC on
February 23, 2016
(the “
2015
Form 10-K”).
New Accounting Pronouncements
—
The following table provides a brief description of recent accounting pronouncements that had and/or could have a material impact on the Company’s consolidated financial statements:
|
New Accounting Standards Adopted
|
|||
|
ASU Number and Name
|
Description
|
Date of Adoption
|
Effect on the financial statements upon adoption
|
|
2015-03, Interest — Imputation of Interest (Subtopic 835-30)
|
The standard simplifies the presentation of debt issuance costs by requiring that debt issuance costs related to a recognized debt liability be presented in the balance sheet as a direct deduction from the carrying amount of that debt liability, consistent with debt discounts. The recognition and measurement guidance for debt issuance costs are not affected by the standard. Transition method: retrospective.
|
January 1, 2016
|
Deferred financing costs of $24 million previously classified within other current assets and $357 million previously classified within other noncurrent assets were reclassified to reduce the related debt liabilities as of December 31, 2015.
|
|
2015-15, Interest — Imputation of Interest (Subtopic 835-30): Presentation and Subsequent Measurement of Debt Issuance Costs Associated with Line-of-Credit Arrangements
|
Given the absence of authoritative guidance within ASU 2015-03, this standard clarifies that the SEC Staff would not object to an entity presenting debt issuance costs related to line-of-credit arrangements as an asset that is subsequently amortized ratably over the term of the line-of-credit arrangement, regardless of whether there are any outstanding borrowings on the line-of-credit arrangement. Transition method: retrospective.
|
January 1, 2016
|
Deferred financing costs related to lines-of-credit of $1 million recorded within other current assets and $23 million recorded within other noncurrent assets were not reclassified as of December 31, 2015.
|
|
2015-02, Consolidation — Amendments to the Consolidation Analysis (Topic 810)
|
The standard makes targeted amendments to the current consolidation guidance and ends the deferral granted to investment companies from applying the VIE guidance. The standard amends the evaluation of whether (1) fees paid to a decision-maker or service providers represent a variable interest, (2) a limited partnership or similar entity has the characteristics of a VIE and (3) a reporting entity is the primary beneficiary of a VIE. Transition method: retrospective.
|
January 1, 2016
|
None, other than that some entities previously consolidated under the voting model are now consolidated under the VIE model.
|
|
New Accounting Standards Issued But Not Yet Effective
|
|||
|
ASU Number and Name
|
Description
|
Date of Adoption
|
Effect on the financial statements upon adoption
|
|
2016-13, Financial Instruments-Credit Losses (Topic 326): Measurement of Credit Losses on Financial Instruments
|
The standard updates the impairment model for financial assets measured at amortized cost to an expected loss model rather than an incurred loss model. It also allows for the presentation of credit losses on available-for-sale debt securities as an allowance rather than a write down. Transition method: various.
|
January 1, 2020 Early adoption is permitted only as of January 1, 2019.
|
The Company is currently evaluating the impact of adopting the standard on its consolidated financial statements.
|
6
|
2016-09, Compensation — Stock Compensation (Topic 718): Improvements to Employee Share-Based Payment Accounting
|
The standard simplifies the following aspects of accounting for share-based payments awards: accounting for income taxes, classification of excess tax benefits on the statement of cash flows, forfeitures, statutory tax withholding requirements, classification of awards as either equity or liabilities and classification of employee taxes paid on statement of cash flows when an employer withholds shares for tax-withholding purposes. Transition method: various.
|
January 1, 2017. Early adoption is permitted.
|
The Company is currently evaluating the impact of adopting the standard on its consolidated financial statements.
|
|
2016-06, Derivatives and Hedging (Topic 815) — Contingent Put and Call Options in Debt Instruments
|
This standard clarifies the requirements for assessing whether contingent call (put) options that can accelerate the payment of principal on debt instruments are clearly and closely related to their debt hosts. When a call (put) option is contingently exercisable, an entity will no longer assess whether the event that triggers the ability to exercise a call (put) option is related to interest rates or credit risks. Transition method: a modified retrospective basis to existing debt instruments as of the effective date.
|
January 1, 2017. Early adoption is permitted.
|
The Company is currently evaluating the impact of adopting the standard, but does not anticipate a material impact on its consolidated financial statements.
|
|
2016-05, Derivatives and Hedging (Topic 815) — Effect of Derivative Contract Novations on Existing Hedge Accounting Relationships
|
The standard clarifies that a change in the counterparty to a derivative instrument that has been designated as the hedging instrument does not require de-designation of that hedging relationship provided that all other hedge accounting criteria continue to be met. Transition method: prospective or a modified retrospective basis.
|
January 1, 2017. Early adoption is permitted.
|
The Company is currently evaluating the impact of adopting the standard, but does not anticipate a material impact on its consolidated financial statements.
|
|
2016-02, Leases (Topic 842)
|
The standard creates Topic 842, Leases, which supersedes Topic 840, Leases. It introduces a lessee model that brings substantially all leases onto the balance sheet while retaining most of the principles of the existing lessor model in U.S. GAAP and aligning many of those principles with ASC 606, Revenue from Contracts with Customers. Transition method: modified retrospective approach with certain practical expedients.
|
January 1, 2019. Early adoption is permitted.
|
The Company is currently evaluating the impact of adopting the standard on its consolidated financial statements.
|
|
2016-01, Financial Instruments — Overall (Topic 825-10): Recognition and Measurement of Financial Assets and Financial Liabilities
|
The standard significantly revises an entity’s accounting related to (1) the classification and measurement of investments in equity securities and (2) the presentation of certain fair value changes for financial liabilities measured at fair value. Also, it amends certain disclosure requirements associated with the fair value of financial instruments. Transition method: cumulative effect in Retained Earnings as of adoption or prospectively for equity investments without readily determinable fair value.
|
January 1, 2018. Limited early adoption permitted.
|
The Company is currently evaluating the impact of adopting the standard, but does not anticipate a material impact on its consolidated financial statements.
|
|
2015-11, Inventory (Topic 330): Simplifying the Measurement of Inventory
|
The standard replaces the current lower of cost or market test with a lower of cost or net realizable value test. Transition method: prospectively.
|
January 1, 2017. Early adoption is permitted.
|
The Company is currently evaluating the impact of adopting the standard on its consolidated financial statements.
|
|
2014-09, 2016-08, 2016-10, 2016-12 Revenue from Contracts with Customers (Topic 606),
|
The Revenue from Contracts with Customers standard provides a single and comprehensive revenue recognition model for all contracts with customers to improve comparability. The standard contains principles to determine the measurement and timing of revenue recognition. The standard requires an entity to recognize revenue to depict the transfer of goods or services to customers at an amount that the entity expects to be entitled to in exchange for those goods or services. The amendments to the standard provide further clarification on contract revenue recognition specifically related to the implementation of the principal versus agent evaluation, the identification of performance obligations, clarification on accounting for licenses of intellectual property, and allows for the election to account for shipping and handling activities performed after control of a good has been transferred to the customer as a fulfillment cost. Transition method: a full retrospective or modified retrospective approach.
|
January 1, 2018 (deferred by ASU No. 2015-14). Earlier application is permitted only as of January 1, 2017.
|
The Company is currently evaluating the impact of adopting the standard on its consolidated financial statements.
|
2
. INVENTORY
The following table summarizes the Company’s inventory balances as of the periods indicated (in millions):
|
June 30, 2016
|
December 31, 2015
|
||||||
|
Fuel and other raw materials
|
$
|
312
|
|
$
|
343
|
|
|
|
Spare parts and supplies
|
343
|
|
328
|
|
|||
|
Total
|
$
|
655
|
|
$
|
671
|
|
|
3
. FAIR VALUE
The fair value of current financial assets and liabilities, debt service reserves and other deposits approximate their reported carrying amounts. The estimated fair value of the Company’s assets and liabilities has been determined using available market information. By virtue of these amounts being estimates and based on hypothetical transactions to sell assets or transfer liabilities, the use of different market assumptions and/or estimation methodologies may have a material effect on the estimated fair value amounts. The Company made no changes during the period to the fair valuation techniques described in Note 4.—
Fair Value
in Item 8.—
Financial Statements and Supplementary Data
of its
2015
Form 10-K.
7
Recurring Measurements
—
The following table presents, by level within the fair value hierarchy, the Company’s financial assets and liabilities that were measured at fair value on a recurring basis as of the periods indicated (in millions). For the Company’s investments in marketable debt and equity securities, the security classes presented are determined based on the nature and risk of the security and are consistent with how the Company manages, monitors and measures its marketable securities:
|
|
June 30, 2016
|
December 31, 2015
|
|||||||||||||||||||||||||||||
|
|
Level 1
|
Level 2
|
Level 3
|
Total
|
Level 1
|
Level 2
|
Level 3
|
Total
|
|||||||||||||||||||||||
|
Assets
|
|||||||||||||||||||||||||||||||
|
AVAILABLE FOR SALE:
|
|||||||||||||||||||||||||||||||
|
Debt securities:
|
|||||||||||||||||||||||||||||||
|
Unsecured debentures
|
$
|
—
|
|
$
|
299
|
|
$
|
—
|
|
$
|
299
|
|
$
|
—
|
|
$
|
318
|
|
$
|
—
|
|
$
|
318
|
|
|||||||
|
Certificates of deposit
|
—
|
|
213
|
|
—
|
|
213
|
|
—
|
|
129
|
|
—
|
|
129
|
|
|||||||||||||||
|
Government debt securities
|
—
|
|
9
|
|
—
|
|
9
|
|
—
|
|
28
|
|
—
|
|
28
|
|
|||||||||||||||
|
Subtotal
|
—
|
|
521
|
|
—
|
|
521
|
|
—
|
|
475
|
|
—
|
|
475
|
|
|||||||||||||||
|
Equity securities:
|
|||||||||||||||||||||||||||||||
|
Mutual funds
|
—
|
|
24
|
|
—
|
|
24
|
|
—
|
|
15
|
|
—
|
|
15
|
|
|||||||||||||||
|
Subtotal
|
—
|
|
24
|
|
—
|
|
24
|
|
—
|
|
15
|
|
—
|
|
15
|
|
|||||||||||||||
|
Total available for sale
|
—
|
|
545
|
|
—
|
|
545
|
|
—
|
|
490
|
|
—
|
|
490
|
|
|||||||||||||||
|
TRADING:
|
|||||||||||||||||||||||||||||||
|
Equity securities:
|
|||||||||||||||||||||||||||||||
|
Mutual funds
|
16
|
|
—
|
|
—
|
|
16
|
|
15
|
|
—
|
|
—
|
|
15
|
|
|||||||||||||||
|
Total trading
|
16
|
|
—
|
|
—
|
|
16
|
|
15
|
|
—
|
|
—
|
|
15
|
|
|||||||||||||||
|
DERIVATIVES:
|
|||||||||||||||||||||||||||||||
|
Cross-currency derivatives
|
—
|
|
1
|
|
—
|
|
1
|
|
—
|
|
—
|
|
—
|
|
—
|
|
|||||||||||||||
|
Foreign currency derivatives
|
—
|
|
46
|
|
271
|
|
317
|
|
—
|
|
35
|
|
292
|
|
327
|
|
|||||||||||||||
|
Commodity derivatives
|
—
|
|
53
|
|
13
|
|
66
|
|
—
|
|
41
|
|
7
|
|
48
|
|
|||||||||||||||
|
Total derivatives
|
—
|
|
100
|
|
284
|
|
384
|
|
—
|
|
76
|
|
299
|
|
375
|
|
|||||||||||||||
|
TOTAL ASSETS
|
$
|
16
|
|
$
|
645
|
|
$
|
284
|
|
$
|
945
|
|
$
|
15
|
|
$
|
566
|
|
$
|
299
|
|
$
|
880
|
|
|||||||
|
Liabilities
|
|||||||||||||||||||||||||||||||
|
DERIVATIVES:
|
|||||||||||||||||||||||||||||||
|
Interest rate derivatives
|
$
|
—
|
|
$
|
104
|
|
$
|
421
|
|
$
|
525
|
|
$
|
—
|
|
$
|
54
|
|
$
|
304
|
|
$
|
358
|
|
|||||||
|
Cross-currency derivatives
|
—
|
|
39
|
|
—
|
|
39
|
|
—
|
|
43
|
|
—
|
|
43
|
|
|||||||||||||||
|
Foreign currency derivatives
|
—
|
|
66
|
|
—
|
|
66
|
|
—
|
|
41
|
|
15
|
|
56
|
|
|||||||||||||||
|
Commodity derivatives
|
—
|
|
56
|
|
2
|
|
58
|
|
—
|
|
29
|
|
4
|
|
33
|
|
|||||||||||||||
|
Total derivatives
|
—
|
|
265
|
|
423
|
|
688
|
|
—
|
|
167
|
|
323
|
|
490
|
|
|||||||||||||||
|
TOTAL LIABILITIES
|
$
|
—
|
|
$
|
265
|
|
$
|
423
|
|
$
|
688
|
|
$
|
—
|
|
$
|
167
|
|
$
|
323
|
|
$
|
490
|
|
|||||||
As of
June 30, 2016
, all AFS debt securities had stated maturities within one year. Gains and losses on the sale of investments are determined using the specific-identification method. For the three and
six months ended
June 30, 2016
and
2015
no
other-than-temporary impairments of marketable securities were recognized in earnings or OCI. The table below presents gross proceeds from the sale of available for sale securities during the periods indicated (in millions):
|
Three Months Ended June 30,
|
Six Months Ended June 30,
|
||||||||||||||
|
2016
|
2015
|
2016
|
2015
|
||||||||||||
|
Gross proceeds from sale of AFS securities
|
$
|
785
|
|
$
|
1,170
|
|
$
|
2,404
|
|
$
|
2,180
|
|
|||
The following tables present a reconciliation of net derivative assets and liabilities by type measured at fair value on a recurring basis using significant unobservable inputs (Level 3) for the
three and six
months ended
June 30, 2016
and
2015
(in millions). Transfers between Level 3 and Level 2 are determined as of the end of the reporting period and principally result from changes in the significance of unobservable inputs used to calculate the credit valuation adjustment.
|
Three Months Ended June 30, 2016
|
Interest Rate
|
Foreign Currency
|
Commodity
|
Total
|
|||||||||||
|
Balance at the beginning of the period
|
$
|
(416
|
)
|
$
|
290
|
|
$
|
—
|
|
$
|
(126
|
)
|
|||
|
Total realized and unrealized gains (losses):
|
|||||||||||||||
|
Included in earnings
|
—
|
|
(31
|
)
|
2
|
|
(29
|
)
|
|||||||
|
Included in other comprehensive income — derivative activity
|
(80
|
)
|
—
|
|
—
|
|
(80
|
)
|
|||||||
|
Included in other comprehensive income — foreign currency translation activity
|
1
|
|
(4
|
)
|
—
|
|
(3
|
)
|
|||||||
|
Included in regulatory (assets) liabilities
|
—
|
|
—
|
|
11
|
|
11
|
|
|||||||
|
Settlements
|
21
|
|
(3
|
)
|
(2
|
)
|
16
|
|
|||||||
|
Transfers of liabilities into Level 3
|
(17
|
)
|
—
|
|
—
|
|
(17
|
)
|
|||||||
|
Transfers of liabilities out of Level 3
|
70
|
|
19
|
|
—
|
|
89
|
|
|||||||
|
Balance at the end of the period
|
$
|
(421
|
)
|
$
|
271
|
|
$
|
11
|
|
$
|
(139
|
)
|
|||
|
Total gains (losses) for the period included in earnings attributable to the change in unrealized gains (losses) relating to assets and liabilities held at the end of the period
|
$
|
1
|
|
$
|
(28
|
)
|
$
|
2
|
|
$
|
(25
|
)
|
|||
8
|
Three Months Ended June 30, 2015
|
Interest Rate
|
Foreign Currency
|
Commodity
|
Cross Currency
|
Total
|
||||||||||||||
|
Balance at the beginning of the period
|
$
|
(302
|
)
|
$
|
223
|
|
$
|
4
|
|
$
|
(33
|
)
|
$
|
(108
|
)
|
||||
|
Total realized and unrealized gains (losses):
|
|||||||||||||||||||
|
Included in earnings
|
—
|
|
7
|
|
—
|
|
—
|
|
7
|
|
|||||||||
|
Included in other comprehensive income — derivative activity
|
57
|
|
—
|
|
—
|
|
—
|
|
57
|
|
|||||||||
|
Included in other comprehensive income — foreign currency translation activity
|
(4
|
)
|
(6
|
)
|
—
|
|
—
|
|
(10
|
)
|
|||||||||
|
Included in regulatory liabilities
|
—
|
|
—
|
|
8
|
|
—
|
|
8
|
|
|||||||||
|
Settlements
|
5
|
|
(2
|
)
|
5
|
|
1
|
|
9
|
|
|||||||||
|
Transfers of liabilities out of Level 3
|
53
|
|
—
|
|
—
|
|
32
|
|
85
|
|
|||||||||
|
Balance at the end of the period
|
$
|
(191
|
)
|
$
|
222
|
|
$
|
17
|
|
$
|
—
|
|
$
|
48
|
|
||||
|
Total gains (losses) for the period included in earnings attributable to the change in unrealized gains (losses) relating to assets and liabilities held at the end of the period
|
$
|
—
|
|
$
|
5
|
|
$
|
(1
|
)
|
$
|
—
|
|
$
|
4
|
|
||||
|
Six Months Ended June 30, 2016
|
Interest Rate
|
Foreign Currency
|
Commodity
|
Total
|
|||||||||||
|
Balance at the beginning of the period
|
$
|
(304
|
)
|
$
|
277
|
|
$
|
3
|
|
$
|
(24
|
)
|
|||
|
Total realized and unrealized gains (losses):
|
|
||||||||||||||
|
Included in earnings
|
2
|
|
16
|
|
2
|
|
20
|
|
|||||||
|
Included in other comprehensive income — derivative activity
|
(174
|
)
|
5
|
|
—
|
|
(169
|
)
|
|||||||
|
Included in other comprehensive income — foreign currency translation activity
|
(1
|
)
|
(38
|
)
|
—
|
|
(39
|
)
|
|||||||
|
Included in regulatory liabilities
|
—
|
|
—
|
|
11
|
|
11
|
|
|||||||
|
Settlements
|
37
|
|
(5
|
)
|
(5
|
)
|
27
|
|
|||||||
|
Transfers of liabilities into Level 3
|
(51
|
)
|
—
|
|
—
|
|
(51
|
)
|
|||||||
|
Transfers of liabilities out of Level 3
|
70
|
|
16
|
|
—
|
|
86
|
|
|||||||
|
Balance at the end of the period
|
$
|
(421
|
)
|
$
|
271
|
|
$
|
11
|
|
$
|
(139
|
)
|
|||
|
Total gains for the period included in earnings attributable to the change in unrealized gains (losses) relating to assets and liabilities held at the end of the period
|
$
|
5
|
|
$
|
17
|
|
$
|
2
|
|
$
|
24
|
|
|||
|
Six Months Ended June 30, 2015
|
Interest Rate
|
Foreign Currency
|
Commodity
|
Total
|
|||||||||||
|
Balance at the beginning of the period
|
$
|
(210
|
)
|
$
|
209
|
|
$
|
6
|
|
$
|
5
|
|
|||
|
Total realized and unrealized gains (losses):
|
|||||||||||||||
|
Included in earnings
|
—
|
|
30
|
|
2
|
|
32
|
|
|||||||
|
Included in other comprehensive income — derivative activity
|
3
|
|
—
|
|
—
|
|
3
|
|
|||||||
|
Included in other comprehensive income — foreign currency translation activity
|
7
|
|
(13
|
)
|
—
|
|
(6
|
)
|
|||||||
|
Included in regulatory liabilities
|
—
|
|
—
|
|
8
|
|
8
|
|
|||||||
|
Settlements
|
9
|
|
(4
|
)
|
1
|
|
6
|
|
|||||||
|
Balance at the end of the period
|
$
|
(191
|
)
|
$
|
222
|
|
$
|
17
|
|
$
|
48
|
|
|||
|
Total gains for the period included in earnings attributable to the change in unrealized gains (losses) relating to assets and liabilities held at the end of the period
|
$
|
—
|
|
$
|
26
|
|
$
|
2
|
|
$
|
28
|
|
|||
The table below summarizes the significant unobservable inputs used for Level 3 derivative assets (liabilities) as of
June 30, 2016
(in millions, except range amounts):
|
Type of Derivative
|
Fair Value
|
Unobservable Input
|
Amount or Range (Weighted Avg)
|
|||||
|
Interest rate
|
$
|
(421
|
)
|
Subsidiaries’ credit spreads
|
2.9% to 11.2% (4.4%)
|
|||
|
Foreign currency:
|
||||||||
|
Argentine Peso
|
271
|
|
Argentine Peso to USD currency exchange rate after one year
|
18.6 to 35.2 (26.8)
|
||||
|
Other
|
11
|
|
||||||
|
Total
|
$
|
(139
|
)
|
|||||
Nonrecurring Measurements
When evaluating impairment of long-lived assets and equity method investments, the Company measures fair value using the applicable fair value measurement guidance. Impairment expense is measured by comparing the fair value at the evaluation date to its then-latest available carrying amount. The following table summarizes our major categories of assets and liabilities measured at fair value on a nonrecurring basis and their level within the fair value hierarchy (in millions):
9
|
Six Months Ended June 30, 2016
|
Measurement Date
|
Carrying Amount
(1)
|
Fair Value
|
Pretax Loss
|
|||||||||||||||||
|
Assets
|
Level 1
|
Level 2
|
Level 3
|
||||||||||||||||||
|
Long-lived assets held and used:
(2)
|
|||||||||||||||||||||
|
DPL
|
06/30/2016
|
$
|
324
|
|
$
|
—
|
|
$
|
—
|
|
$
|
89
|
|
$
|
235
|
|
|||||
|
Buffalo Gap II
|
03/31/2016
|
251
|
|
—
|
|
—
|
|
92
|
|
159
|
|
||||||||||
|
Discontinued operations and held-for-sale businesses:
(3)
|
|||||||||||||||||||||
|
Sul
|
06/30/2016
|
1,581
|
|
—
|
|
470
|
|
—
|
|
783
|
|
||||||||||
|
Six Months Ended June 30, 2015
|
Measurement Date
|
Carrying Amount
(1)
|
Fair Value
|
Pretax Loss
|
|||||||||||||||||
|
Assets
|
Level 1
|
Level 2
|
Level 3
|
||||||||||||||||||
|
Long-lived assets held and used:
(2)
|
|||||||||||||||||||||
|
UK Wind
|
06/30/2015
|
$
|
38
|
|
$
|
—
|
|
$
|
1
|
|
$
|
—
|
|
$
|
37
|
|
|||||
|
Other
|
Various
|
29
|
|
—
|
|
21
|
|
—
|
|
8
|
|
||||||||||
|
Equity method investments:
|
|||||||||||||||||||||
|
Solar Spain
|
02/09/2015
|
29
|
|
—
|
|
—
|
|
29
|
|
—
|
|
||||||||||
_____________________________
|
(1)
|
Represents the carrying values at the dates of measurement, before fair value adjustment.
|
|
(2)
|
See Note
13
—Asset Impairment Expense
for further information.
|
|
(3)
|
Per the Company’s policy, pre-tax loss is limited to the impairment of long-lived assets. Any additional loss will be recognized on completion of the sale. See Note
15
—Discontinued Operations and Held-for-Sale Businesses
for further information.
|
The following table summarizes the significant unobservable inputs used in the Level 3 measurement on a nonrecurring basis during the
six
months ended
June 30, 2016
(in millions, except range amounts):
|
Fair Value
|
Valuation Technique
|
Unobservable Input
|
Range (Weighted Average)
|
|||||||
|
Long-lived assets held and used:
|
||||||||||
|
DPL
|
$
|
89
|
|
Discounted cash flow
|
Annual revenue growth
|
-11% to 13% (1%)
|
|
|||
|
Annual pretax operating margin
|
-50% to 60% (5%)
|
|
||||||||
|
Weighted-average cost of capital
|
7% to 12%
|
|
||||||||
|
Buffalo Gap II
|
$
|
92
|
|
Discounted cash flow
|
Annual revenue growth
|
-17% to 21% (20%)
|
|
|||
|
Annual pretax operating margin
|
-166% to 48% (18%)
|
|
||||||||
|
Weighted-average cost of capital
|
9
|
%
|
||||||||
Financial Instruments not Measured at Fair Value in the Condensed Consolidated Balance Sheets
The next table presents (in millions) the carrying amount, fair value and fair value hierarchy of the Company’s financial assets and liabilities that are not measured at fair value in the Condensed Consolidated Balance Sheets as of
June 30, 2016
and
December 31, 2015
, but for which fair value is disclosed:
|
June 30, 2016
|
||||||||||||||||||||
|
Carrying
Amount
|
Fair Value
|
|||||||||||||||||||
|
Total
|
Level 1
|
Level 2
|
Level 3
|
|||||||||||||||||
|
Assets:
|
Accounts receivable — noncurrent
(1)
|
$
|
224
|
|
$
|
316
|
|
$
|
—
|
|
$
|
—
|
|
$
|
316
|
|
||||
|
Liabilities:
|
Non-recourse debt
|
15,871
|
|
16,216
|
|
—
|
|
14,761
|
|
1,455
|
|
|||||||||
|
Recourse debt
|
4,909
|
|
5,176
|
|
—
|
|
5,176
|
|
—
|
|
||||||||||
|
December 31, 2015
|
||||||||||||||||||||
|
Carrying
Amount
|
Fair Value
|
|||||||||||||||||||
|
Total
|
Level 1
|
Level 2
|
Level 3
|
|||||||||||||||||
|
Assets:
|
Accounts receivable — noncurrent
(1)
|
$
|
238
|
|
$
|
310
|
|
$
|
—
|
|
$
|
20
|
|
$
|
290
|
|
||||
|
Liabilities:
|
Non-recourse debt
|
15,115
|
|
15,592
|
|
—
|
|
13,325
|
|
2,267
|
|
|||||||||
|
Recourse debt
|
4,966
|
|
4,696
|
|
—
|
|
4,696
|
|
—
|
|
||||||||||
_____________________________
|
(1)
|
These amounts principally relate to amounts due from CAMMESA, and are included in
Noncurrent assets—Other
in the accompanying Condensed Consolidated Balance Sheets. The fair value and carrying amount of these receivables exclude VAT of
$24 million
and
$27 million
as of
June 30, 2016
and
December 31, 2015
, respectively.
|
4
. DERIVATIVE INSTRUMENTS AND HEDGING ACTIVITIES
There are no changes to the information disclosed in Note 1—
General and Summary of Significant Accounting Policies
—
Derivatives and Hedging Activities
of Item 8.—
Financial Statements and Supplementary Data
in the
2015
Form 10-K.
10
Volume of Activity
— The following table presents the Company’s significant outstanding notional (in millions) by type of derivative as of
June 30, 2016
, regardless of whether they are in qualifying cash flow hedging relationships, and the dates through which the maturities for each type of derivative range:
|
Derivatives
|
Current Notional Translated to USD
|
Latest Maturity
|
||||
|
Interest Rate (LIBOR and EURIBOR)
|
$
|
3,267
|
|
2033
|
||
|
Cross-Currency Swaps (Chilean Unidad de Fomento and Chilean Peso)
|
375
|
|
2029
|
|||
|
Foreign Currency:
|
||||||
|
Argentine Peso
|
161
|
|
2026
|
|||
|
Chilean Unidad de Fomento
|
264
|
|
2019
|
|||
|
Others, primarily with weighted average remaining maturities of a year or less
|
861
|
|
2018
|
|||
Accounting and Reporting
—
Assets and Liabilities
— The following tables present the fair value of assets and liabilities related to the Company’s derivative instruments as of
June 30, 2016
and
December 31, 2015
(in millions):
|
Fair Value
|
June 30, 2016
|
December 31, 2015
|
|||||||||||||||||||||
|
Assets
|
Designated
|
Not Designated
|
Total
|
Designated
|
Not Designated
|
Total
|
|||||||||||||||||
|
Cross-currency derivatives
|
$
|
1
|
|
$
|
—
|
|
$
|
1
|
|
$
|
—
|
|
$
|
—
|
|
$
|
—
|
|
|||||
|
Foreign currency derivatives
|
10
|
|
307
|
|
317
|
|
8
|
|
319
|
|
327
|
|
|||||||||||
|
Commodity derivatives
|
27
|
|
39
|
|
66
|
|
30
|
|
18
|
|
48
|
|
|||||||||||
|
Total assets
|
$
|
38
|
|
$
|
346
|
|
$
|
384
|
|
$
|
38
|
|
$
|
337
|
|
$
|
375
|
|
|||||
|
Liabilities
|
|||||||||||||||||||||||
|
Interest rate derivatives
|
$
|
524
|
|
$
|
1
|
|
$
|
525
|
|
$
|
358
|
|
$
|
—
|
|
$
|
358
|
|
|||||
|
Cross-currency derivatives
|
39
|
|
—
|
|
39
|
|
43
|
|
—
|
|
43
|
|
|||||||||||
|
Foreign currency derivatives
|
36
|
|
30
|
|
66
|
|
35
|
|
21
|
|
56
|
|
|||||||||||
|
Commodity derivatives
|
26
|
|
32
|
|
58
|
|
12
|
|
21
|
|
33
|
|
|||||||||||
|
Total liabilities
|
$
|
625
|
|
$
|
63
|
|
$
|
688
|
|
$
|
448
|
|
$
|
42
|
|
$
|
490
|
|
|||||
|
June 30, 2016
|
December 31, 2015
|
||||||||||||||
|
Fair Value
|
Assets
|
Liabilities
|
Assets
|
Liabilities
|
|||||||||||
|
Current
|
$
|
104
|
|
$
|
172
|
|
$
|
86
|
|
$
|
144
|
|
|||
|
Noncurrent
|
280
|
|
516
|
|
289
|
|
346
|
|
|||||||
|
Total
|
$
|
384
|
|
$
|
688
|
|
$
|
375
|
|
$
|
490
|
|
|||
|
Credit Risk-Related Contingent Features
(1)
|
June 30, 2016
|
December 31, 2015
|
|||||||||||||
|
Present value of liabilities subject to collateralization
|
$
|
68
|
|
$
|
58
|
|
|||||||||
|
Cash collateral held by third parties or in escrow
|
$
|
34
|
|
$
|
38
|
|
|||||||||
_____________________________
|
(1)
|
Based on the credit rating of certain subsidiaries
|
Earnings and Other Comprehensive (Loss) Income
— The next table presents (in millions) the pretax gains (losses) recognized in AOCL and earnings related to all derivative instruments for the periods indicated:
|
Three Months Ended June 30,
|
Six Months Ended June 30,
|
||||||||||||||
|
2016
|
2015
|
2016
|
2015
|
||||||||||||
|
Effective portion of cash flow hedges:
|
|||||||||||||||
|
Gain (Losses) recognized in AOCL
|
|||||||||||||||
|
Interest rate derivatives
|
$
|
(90
|
)
|
$
|
94
|
|
$
|
(220
|
)
|
$
|
(4
|
)
|
|||
|
Cross-currency derivatives
|
(11
|
)
|
1
|
|
(3
|
)
|
1
|
|
|||||||
|
Foreign currency derivatives
|
(5
|
)
|
(1
|
)
|
(5
|
)
|
1
|
|
|||||||
|
Commodity derivatives
|
(12
|
)
|
8
|
|
25
|
|
15
|
|
|||||||
|
Total
|
$
|
(118
|
)
|
$
|
102
|
|
$
|
(203
|
)
|
$
|
13
|
|
|||
|
Gain (Losses) reclassified from AOCL into earnings
|
|||||||||||||||
|
Interest rate derivatives
|
$
|
(26
|
)
|
$
|
(16
|
)
|
$
|
(55
|
)
|
$
|
(40
|
)
|
|||
|
Cross-currency derivatives
|
1
|
|
—
|
|
10
|
|
(1
|
)
|
|||||||
|
Foreign currency derivatives
|
2
|
|
2
|
|
4
|
|
8
|
|
|||||||
|
Commodity derivatives
|
16
|
|
6
|
|
38
|
|
11
|
|
|||||||
|
Total
|
$
|
(7
|
)
|
$
|
(8
|
)
|
$
|
(3
|
)
|
|
$
|
(22
|
)
|
||
|
Gain (Losses) recognized in earnings related to
|
|||||||||||||||
|
Ineffective portion of cash flow hedges
|
$
|
—
|
|
$
|
(1
|
)
|
$
|
2
|
|
$
|
(3
|
)
|
|||
|
Not designated as hedging instruments:
|
|||||||||||||||
|
Foreign currency derivatives
|
(24
|
)
|
7
|
|
15
|
|
39
|
|
|||||||
|
Commodity derivatives and Other
|
(9
|
)
|
—
|
|
(17
|
)
|
(8
|
)
|
|||||||
|
Total
|
$
|
(33
|
)
|
$
|
7
|
|
$
|
(2
|
)
|
$
|
31
|
|
|||
|
Twelve Months Ended June 30, 2017
|
|||||||||||||||
|
AOCL expected to decrease pre-tax income from continuing operations
(1)
|
$
|
119
|
|
||||||||||||
|
(1)
|
Primarily due to interest rate derivatives
|
11
5
. FINANCING RECEIVABLES
Financing receivables are defined as receivables with contractual maturities of greater than one year. The Company’s financing receivables are primarily related to amended agreements or government resolutions that are due from CAMMESA. Presented below are financing receivables by country as of the periods indicated (in millions):
|
June 30, 2016
|
December 31, 2015
|
||||||
|
Argentina
|
$
|
218
|
|
$
|
237
|
|
|
|
United States
|
21
|
|
20
|
|
|||
|
Brazil
|
9
|
|
7
|
|
|||
|
Total long-term financing receivables
|
$
|
248
|
|
$
|
264
|
|
|
Argentina —
Collection of the principal and interest on these receivables is subject to various business risks and uncertainties including, but not limited to, the completion and operation of power plants which generate cash for payments of these receivables, regulatory changes that could impact the timing and amount of collections, and economic conditions in Argentina. The Company monitors these risks, including the credit ratings of the Argentine government, on a quarterly basis to assess the collectability of these receivables. The Company accrues interest on these receivables once the recognition criteria have been met. The Company’s collection estimates are based on assumptions that it believes to be reasonable but are inherently uncertain. Actual future cash flows could differ from these estimates.
6
. INVESTMENTS IN AND ADVANCES TO AFFILIATES
Summarized Financial Information —
The following table summarizes financial information of the Company’s 50%-or-less-owned affiliates that are accounted for using the equity method (in millions):
|
|
Six Months Ended June 30,
|
||||||
|
50%-or-less-Owned Affiliates
|
2016
|
2015
|
|||||
|
Revenue
|
$
|
286
|
|
$
|
357
|
|
|
|
Operating margin
|
69
|
|
86
|
|
|||
|
Net income
|
30
|
|
35
|
|
|||
7
. DEBT
Recourse Debt
In May 2016, the Company issued
$500 million
aggregate principal amount of
6.00%
senior notes due 2026. The Company used these proceeds to redeem at par
$495 million
aggregate principal of its existing LIBOR + 3.00% senior unsecured notes due 2019. As a result of the latter transaction, the Company recognized a net loss on extinguishment of debt of
$4 million
for the three and
six months ended June 30, 2016
that is included in the Condensed Consolidated Statement of Operations.
In January 2016, the Company redeemed
$125 million
of its senior unsecured notes outstanding. The repayment included a portion of the
7.375%
senior notes due in 2021, the
4.875%
senior notes due in 2023, the
5.5%
senior notes due in 2024, the
5.5%
senior notes due in 2025 and the floating rate senior notes due in 2019. As a result of these transactions, the Company recognized a net gain on extinguishment of debt of
$7 million
for the
six months ended June 30, 2016
that is included in the Condensed Consolidated Statement of Operations.
In April 2015, the Company issued
$575 million
aggregate principal amount of
5.50%
senior notes due 2025. Concurrent with this offering, the Company redeemed via tender offers
$344 million
aggregate principal of its existing
8.00%
senior unsecured notes due 2017, and
$156 million
of its existing
8.00%
senior unsecured notes due 2020. As a result of the latter transaction, the Company recognized a loss on extinguishment of debt of
$82 million
for the three and
six months ended June 30, 2015
that is included in the Condensed Consolidated Statement of Operations.
In March 2015, the Company redeemed in full the
$151 million
balance of its
7.75%
senior unsecured notes due October 2015 and the
$164 million
balance of its
9.75%
senior unsecured notes due April 2016. As a result of these transactions, the Company recognized a loss on extinguishment of debt of
$23 million
for the
six months ended June 30, 2015
that is included in the Condensed Consolidated Statement of Operations.
12
Non-Recourse Debt
During the
six months ended June 30, 2016
, the Company’s subsidiaries engaged in the following significant debt transactions:
|
Subsidiary
|
Issuances
|
Repayments
|
Gain (Loss) on Extinguishment of Debt
|
|||||||||
|
IPALCO
|
$
|
573
|
|
|
$
|
(390
|
)
|
|
$
|
—
|
|
|
|
Gener
|
575
|
|
|
(228
|
)
|
|
7
|
|
||||
|
Andres
|
220
|
|
(180
|
)
|
(2
|
)
|
||||||
|
Los Mina
|
118
|
|
—
|
|
—
|
|
||||||
|
Itabo Opco
|
100
|
|
(70
|
)
|
(1
|
)
|
||||||
|
Maritza
|
18
|
|
(106
|
)
|
—
|
|
||||||
|
Other
|
171
|
|
(398
|
)
|
(3
|
)
|
||||||
|
$
|
1,775
|
|
$
|
(1,372
|
)
|
$
|
1
|
|
||||
Non-recourse debt in default
— The following table summarizes the Company’s subsidiary non-recourse debt in default as of
June 30, 2016
(in millions). Due to the defaults, these amounts are included in the current portion of non-recourse debt:
|
Subsidiary
|
Primary Nature of Default
|
Debt in Default
|
Net Assets
|
|||||||
|
Kavarna (Bulgaria)
|
Covenant
|
$
|
133
|
|
$
|
46
|
|
|||
|
Sogrinsk (Kazakhstan)
|
Covenant
|
5
|
|
6
|
|
|||||
|
$
|
138
|
|
||||||||
The above defaults are not payment defaults. All of the subsidiary non-recourse debt defaults were triggered by failure to comply with covenants and/or other conditions such as (but not limited to) failure to meet information covenants, complete construction or other milestones in an allocated time, meet certain minimum or maximum financial ratios, or other requirements contained in the non-recourse debt documents of the applicable subsidiary.
In the event that there is a default, bankruptcy or maturity acceleration at a subsidiary or group of subsidiaries that meets the applicable definition of materiality under the Parent Company’s corporate debt agreements, there could be a cross-default to the Company’s recourse debt. A material subsidiary is defined in the Parent Company’s senior secured credit facility as any business that contributed
20%
or more of the Parent Company’s total cash distributions from businesses for the four most recently completed fiscal quarters. As of
June 30, 2016
,
none
of the defaults listed above individually or in the aggregate result in or are at risk of triggering a cross-default under the recourse debt of the Parent Company. In the event the Parent Company is not in compliance with the financial covenants of its senior secured credit facility, restricted payments will be limited to regular quarterly shareholder dividends at the then-prevailing rate. Payment and bankruptcy defaults would preclude the making of any restricted payments.
8
. COMMITMENTS AND CONTINGENCIES
Guarantees, Letters of Credit and Commitments
— In connection with certain project financing, acquisition, power purchase and other agreements, the Parent Company has expressly undertaken limited obligations and commitments, most of which will only be effective or will be terminated upon the occurrence of future events. In the normal course of business, the Parent Company has entered into various agreements, mainly guarantees and letters of credit, to provide financial or performance assurance to third parties on behalf of AES subsidiaries. These agreements are entered into primarily to support or enhance the creditworthiness otherwise achieved by a business on a stand-alone basis, thereby facilitating the availability of sufficient credit to accomplish their intended business purposes. Most of the contingent obligations relate to future performance commitments which the Company or its businesses expect to fulfill within the normal course of business. The expiration dates of these guarantees vary from
less than one year to more than 18 years
.
Presented below is the Parent Company’s current undiscounted exposure to guarantees and the potential range of maximum undiscounted exposure. The maximum exposure is not reduced by the amounts, if any, that could be recovered under the recourse or collateralization provisions in the guarantees. The table below summarizes the Parent Company’s contingent contractual obligations as of
June 30, 2016
(in millions, except range amounts).
13
|
Contingent Contractual Obligations
|
Amount
|
No. of Agreements
|
Maximum Exposure Range for Each Agreement
|
||||||
|
Guarantees and commitments
|
$
|
416
|
|
15
|
|
<$1 — 53
|
|||
|
Letters of credit under the unsecured credit facility
|
75
|
|
4
|
|
$2 — 29
|
||||
|
Asset sale related indemnities
(1)
|
27
|
|
1
|
|
$27
|
||||
|
Cash collateralized letters of credit
|
2
|
|
1
|
|
$3
|
||||
|
Letters of credit under the senior secured credit facility
|
7
|
|
18
|
|
<$1 — 1
|
||||
|
Total
|
$
|
527
|
|
39
|
|
||||
_____________________________
|
(1)
|
Excludes normal and customary representations and warranties in agreements for the sale of assets (including ownership in associated legal entities) where the associated risk is considered to be nominal.
|
During the
six months ended June 30, 2016
, the Company paid letter of credit fees ranging from
0.2%
to
2.5%
per annum on the outstanding amounts of letters of credit.
Contingencies
Environmental
— The Company periodically reviews its obligations as they relate to compliance with environmental laws, including site restoration and remediation. As of
June 30, 2016
and
December 31, 2015
, the Company had recognized liabilities of
$10 million
for both periods, relating to projected environmental remediation costs. Due to the uncertainties associated with environmental assessment and remediation activities, future costs of compliance or remediation with current legislation or costs for new legislation introduced could be higher or lower than the amount currently accrued. Moreover, where no liability has been recognized, it is reasonably possible that the Company may be required to incur remediation costs or make expenditures in amounts that could be material but could not be estimated as of
June 30, 2016
. In aggregate, the Company estimates the potential losses related to environmental matters, where estimable, to be up to
$22 million
. The amounts considered reasonably possible do not include amounts accrued as discussed above.
Litigation
—
The Company is involved in certain claims, suits and legal proceedings in the normal course of business. The Company accrues for litigation and claims when it is probable that a liability has been incurred and the amount of loss can be reasonably estimated. The Company has evaluated claims in accordance with the accounting guidance for contingencies that it deems both probable and reasonably estimable and, accordingly, has recognized aggregate liabilities for all claims of approximately
$208 million
and
$179 million
as of
June 30, 2016
and
December 31, 2015
, respectively. Recognized aggregate liabilities for these claims are reported on the Condensed Consolidated Balance Sheets within
Accrued and other liabilities
and
Other noncurrent liabilities
. A significant portion of these accrued liabilities relate to labor and employment, non-income tax and customer disputes in international jurisdictions, principally Brazil where there are a number of labor and employment lawsuits. The complaints generally seek unspecified monetary damages, injunctive relief, or other relief. The AES subsidiaries have denied any liability and intend to vigorously defend themselves in all of these proceedings. There can be no assurance that these accrued liabilities will be adequate to cover all existing and future claims or that we will have the liquidity to pay such claims as they arise.
The Company believes, based upon information it currently possesses and taking into account established accruals for liabilities and its insurance coverage, that the ultimate outcome of these proceedings and actions is unlikely to have a material effect on the Company’s consolidated financial statements. However, where no accrued liability has been recognized, it is reasonably possible that some matters could be decided unfavorably to the Company and could require the Company to pay damages or make expenditures in amounts that could be material but could not be estimated as of
June 30, 2016
. The material contingencies where a loss is reasonably possible primarily include (1) claims under financing agreements, including the Eletrobrás case (see Part II—Item 1—
Legal Proceedings
of this Form 10-Q
); (2) disputes with offtakers, suppliers and EPC contractors; (3) alleged violation of monopoly laws and regulations; (4) income tax and non-income tax matters with tax authorities; and (5) regulatory matters. In aggregate, the Company estimates that the range of potential losses, where estimable, related to these reasonably possible material contingencies is between
$1.4 billion
and
$1.7 billion
. Certain claims are in settlement negotiations. These claims considered reasonably possible do not include the amounts accrued, as discussed in the preceding paragraph, nor do they include income tax-related contingencies which are considered part of our uncertain tax positions.
Regulatory
— During the fourth quarter of 2013, the Company recognized a regulatory liability of
$269 million
for a contingency related to an administrative ruling which required Eletropaulo to refund customers’ amounts due to the regulatory asset base. During the second half of 2014, Eletropaulo started refunding customers as part of the tariff. In January 2015, ANEEL updated the tariff to exclude any further customer refunds. On June 30, 2015, ANEEL included in the tariff reset the reimbursement to Eletropaulo of these amounts previously refunded to customers to begin in July 2015. During the second quarter of 2015, as a result of favorable events, management
14
reassessed the contingency and determined that it no longer meets the recognition criteria under ASC 450
Contingencies
. Management believes that it is now only reasonably possible that Eletropaulo will have to refund these amounts to customers. Accordingly, the Company reversed the remaining regulatory liability for this contingency of
$161 million
in the second quarter of 2015, which increased
Regulated Revenue
by
$97 million
and reduced
Interest Expense
by
$64 million
. Amounts related to this case are now included as part of our reasonably possible contingent range discussed in the preceding paragraph.
9
. PENSION PLANS
Total pension cost and employer contributions were as follows for the periods indicated (in millions):
|
Three Months Ended June 30,
|
Six Months Ended June 30,
|
||||||||||||||||||||||||||||||
|
2016
|
2015
|
2016
|
2015
|
||||||||||||||||||||||||||||
|
U.S.
|
Foreign
|
U.S.
|
Foreign
|
U.S.
|
Foreign
|
U.S.
|
Foreign
|
||||||||||||||||||||||||
|
Service cost
|
$
|
3
|
|
$
|
3
|
|
$
|
4
|
|
$
|
4
|
|
$
|
6
|
|
$
|
6
|
|
$
|
8
|
|
$
|
8
|
|
|||||||
|
Interest cost
|
10
|
|
86
|
|
11
|
|
95
|
|
20
|
|
163
|
|
23
|
|
197
|
|
|||||||||||||||
|
Expected return on plan assets
|
(16
|
)
|
(55
|
)
|
(17
|
)
|
(66
|
)
|
(33
|
)
|
(105
|
)
|
(34
|
)
|
(138
|
)
|
|||||||||||||||
|
Amortization of prior service cost
|
2
|
|
—
|
|
2
|
|
—
|
|
4
|
|
—
|
|
4
|
|
—
|
|
|||||||||||||||
|
Amortization of net loss
|
4
|
|
4
|
|
5
|
|
7
|
|
9
|
|
9
|
|
10
|
|
15
|
|
|||||||||||||||
|
Total pension cost
|
$
|
3
|
|
$
|
38
|
|
$
|
5
|
|
$
|
40
|
|
$
|
6
|
|
$
|
73
|
|
$
|
11
|
|
$
|
82
|
|
|||||||
|
Six Months Ended
June 30, 2016 |
Remainder of 2016 (Expected)
|
||||||||||||||||||||||||||||||
|
U.S.
|
Foreign
|
U.S.
|
Foreign
|
||||||||||||||||||||||||||||
|
Total employer contributions
|
$
|
21
|
|
$
|
59
|
|
$
|
—
|
|
$
|
38
|
|
|||||||||||||||||||
10
. EQUITY
Changes in Equity
— The table below is a reconciliation of the beginning and ending equity attributable to stockholders of The AES Corporation, noncontrolling interests (“NCI”) and total equity as of the periods indicated:
|
Six Months Ended June 30, 2016
|
Six Months Ended June 30, 2015
|
||||||||||||||||||||||
|
(in millions)
|
The Parent Company Stockholders’ Equity
|
NCI
|
Total Equity
|
The Parent Company Stockholders’ Equity
|
NCI
|
Total Equity
|
|||||||||||||||||
|
Balance at the beginning of the period
|
$
|
3,149
|
|
$
|
3,022
|
|
$
|
6,171
|
|
$
|
4,272
|
|
$
|
3,053
|
|
$
|
7,325
|
|
|||||
|
Net income (loss)
|
(356
|
)
|
43
|
|
(313
|
)
|
211
|
|
307
|
|
518
|
|
|||||||||||
|
Total foreign currency translation adjustment, net of income tax
|
193
|
|
55
|
|
248
|
|
(204
|
)
|
(140
|
)
|
(344
|
)
|
|||||||||||
|
Total change in derivative fair value, net of income tax
|
(80
|
)
|
(75
|
)
|
(155
|
)
|
30
|
|
(1
|
)
|
29
|
|
|||||||||||
|
Total pension adjustments, net of income tax
|
2
|
|
5
|
|
7
|
|
2
|
|
7
|
|
9
|
|
|||||||||||
|
Cumulative effect of a change in accounting principle
|
—
|
|
—
|
|
—
|
|
(5
|
)
|
—
|
|
(5
|
)
|
|||||||||||
|
Acquisition of businesses
(1)
|
—
|
|
—
|
|
—
|
|
—
|
|
16
|
|
16
|
|
|||||||||||
|
Disposition of businesses
|
—
|
|
18
|
|
18
|
|
—
|
|
—
|
|
—
|
|
|||||||||||
|
Distributions to noncontrolling interests
|
(2
|
)
|
(187
|
)
|
(189
|
)
|
—
|
|
(119
|
)
|
(119
|
)
|
|||||||||||
|
Contributions from noncontrolling interests
|
—
|
|
12
|
|
12
|
|
—
|
|
97
|
|
97
|
|
|||||||||||
|
Dividends declared on common stock
|
(71
|
)
|
—
|
|
(71
|
)
|
(70
|
)
|
—
|
|
(70
|
)
|
|||||||||||
|
Purchase of treasury stock
|
(79
|
)
|
—
|
|
(79
|
)
|
(307
|
)
|
—
|
|
(307
|
)
|
|||||||||||
|
Issuance and exercise of stock-based compensation benefit plans, net of income tax
|
12
|
|
—
|
|
12
|
|
17
|
|
—
|
|
17
|
|
|||||||||||
|
Sale of subsidiary shares to noncontrolling interests
|
—
|
|
17
|
|
17
|
|
(82
|
)
|
—
|
|
(82
|
)
|
|||||||||||
|
Acquisition of subsidiary shares from noncontrolling interests
|
(2
|
)
|
(3
|
)
|
(5
|
)
|
—
|
|
—
|
|
—
|
|
|||||||||||
|
Balance at the end of the period
|
$
|
2,766
|
|
$
|
2,907
|
|
$
|
5,673
|
|
$
|
3,864
|
|
$
|
3,220
|
|
$
|
7,084
|
|
|||||
_____________________________
|
(1)
|
Fair value of a tax equity partner’s right to preferential returns as a result of the acquisition of Solar Power PR, LLC (Solar Puerto Rico), which was previously accounted for as an equity method investment.
|
Equity Transactions with Noncontrolling Interests
IPALCO
— In March 2016, La Caisse de depot et placement du Quebec (“CDPQ”) completed its investment commitment in IPALCO by investing
$134 million
in IPALCO Enterprises, Inc. (“IPALCO”). As a result of this transaction, IPALCO is owned by AES U.S. Investments (
82%
) and CDPQ (
18%
), and AES U.S. Investments is owned by AES U.S. Holdings, LLC (
85%
) and CDPQ (
15%
).
As a cumulative result of CDPQ’s investment transactions, the Company recognized an increase of
$463 million
to additional paid-in capital and a reduction to retained earnings of
$463 million
for the excess of the fair value of the shares over their book value. Additionally,
$84 million
in taxes and transaction costs were recognized as a net decrease to equity. Since the NCI is contingently redeemable, the total fair value of the consideration received of
$594 million
is classified in temporary equity as redeemable stock of subsidiaries on the Condensed Consolidated Balance Sheet as of
June 30, 2016
.
No
gain or loss was recognized in net income as the sale is not considered to be a sale of in-substance real estate. Any subsequent adjustments to allocate earnings and dividends to CDPQ will be classified as NCI within permanent equity and adjustments to the amount in temporary equity will occur only if and
15
when it is probable that the shares will become redeemable. As the Company maintained control after the sale, IPALCO continues to be accounted for as a consolidated subsidiary within the US SBU reportable segment.
Jordan
— On February 18, 2016, the Company completed the sale of
40%
of its interest in a wholly owned subsidiary in Jordan which owns a controlling interest in the Jordan IPP4 gas-fired plant, for
$21 million
. The transaction was accounted for as a sale of in-substance real estate and a pretax gain of
$4 million
, net of transaction costs, was recognized in net income. The cash proceeds from the sale are reflected in
Proceeds from the sale of businesses, net of cash sold
on the Consolidated Statement of Cash Flows for the period ended
June 30, 2016
. After completion of the sale, the Company has a
36%
net ownership interest in Jordan IPP4 and will continue to manage and operate the plant, with
40%
owned by Mitsui Ltd. and
24%
owned by Nebras Power Q.S.C. As the Company maintained control after the sale, Jordan IPP4 continues to be consolidated by the Company within the Europe SBU reportable segment.
Deconsolidations
UK Wind
— During the second quarter of 2016, the Company determined it no longer had control of its wind development projects in the United Kingdom (“UK Wind”) as the Company no longer held seats on the board of directors. In accordance with the accounting guidance, UK Wind was deconsolidated and a loss on deconsolidation of
$20 million
was recorded to
Gain (loss) on disposal and sale of businesses
in the Condensed Consolidated Statement of Operations to write off the Company’s non-controlling interest in the project. The UK Wind projects were reported in the Europe SBU reportable segment.
Accumulated Other Comprehensive Loss
—
See below for the changes in AOCL by component, net of tax and NCI, for the
six months ended
June 30, 2016
(in millions):
|
Foreign currency translation adjustment, net
|
Unrealized derivative gains (losses), net
|
Unfunded pension obligations, net
|
Total
|
||||||||||||
|
Balance at the beginning of the period
|
$
|
(3,256
|
)
|
$
|
(353
|
)
|
$
|
(274
|
)
|
$
|
(3,883
|
)
|
|||
|
Other comprehensive income (loss) before reclassifications
|
193
|
|
(83
|
)
|
—
|
|
110
|
|
|||||||
|
Amount reclassified to earnings
|
—
|
|
3
|
|
2
|
|
5
|
|
|||||||
|
Other comprehensive income (loss)
|
193
|
|
(80
|
)
|
2
|
|
115
|
|
|||||||
|
Balance at the end of the period
|
$
|
(3,063
|
)
|
$
|
(433
|
)
|
$
|
(272
|
)
|
$
|
(3,768
|
)
|
|||
Reclassifications out of AOCL are presented in the following table. Amounts for the periods indicated are in millions and those in parenthesis indicate debits to the Condensed Consolidated Statements of Operations:
|
Details About
|
Affected Line Item in the Condensed Consolidated Statements of Operations
|
Three Months Ended June 30,
|
Six Months Ended June 30,
|
|||||||||||||||
|
AOCL Components
|
2016
|
2015
|
2016
|
2015
|
||||||||||||||
|
Unrealized derivative gains (losses), net
|
||||||||||||||||||
|
Non-regulated revenue
|
$
|
32
|
|
$
|
10
|
|
$
|
74
|
|
$
|
15
|
|
||||||
|
Non-regulated cost of sales
|
(16
|
)
|
(5
|
)
|
(37
|
)
|
(5
|
)
|
||||||||||
|
Interest expense
|
(32
|
)
|
(15
|
)
|
(61
|
)
|
(40
|
)
|
||||||||||
|
Foreign currency transaction gains (losses)
|
9
|
|
2
|
|
21
|
|
8
|
|
||||||||||
|
Income (loss) from continuing operations before taxes and equity in earnings of affiliates
|
(7
|
)
|
(8
|
)
|
(3
|
)
|
(22
|
)
|
||||||||||
|
Income tax benefit (expense)
|
4
|
|
1
|
|
1
|
|
3
|
|
||||||||||
|
Income (loss) from continuing operations
|
(3
|
)
|
(7
|
)
|
(2
|
)
|
(19
|
)
|
||||||||||
|
Less: Net income attributable to noncontrolling interests
|
—
|
|
4
|
|
(1
|
)
|
7
|
|
||||||||||
|
Net income (loss) attributable to The AES Corporation
|
$
|
(3
|
)
|
$
|
(3
|
)
|
$
|
(3
|
)
|
$
|
(12
|
)
|
||||||
|
Amortization of defined benefit pension actuarial loss, net
|
||||||||||||||||||
|
Regulated cost of sales
|
$
|
(5
|
)
|
$
|
(6
|
)
|
$
|
(9
|
)
|
$
|
(14
|
)
|
||||||
|
Income (loss) from continuing operations before taxes and equity in earnings of affiliates
|
(5
|
)
|
(6
|
)
|
(9
|
)
|
(14
|
)
|
||||||||||
|
Income tax benefit (expense)
|
1
|
|
2
|
|
2
|
|
5
|
|
||||||||||
|
Income (loss) from continuing operations
|
(4
|
)
|
(4
|
)
|
(7
|
)
|
(9
|
)
|
||||||||||
|
Less: Net income attributable to noncontrolling interests
|
3
|
|
3
|
|
5
|
|
7
|
|
||||||||||
|
Net income (loss) attributable to The AES Corporation
|
$
|
(1
|
)
|
$
|
(1
|
)
|
$
|
(2
|
)
|
$
|
(2
|
)
|
||||||
|
Total reclassifications for the period, net of income tax and noncontrolling interests
|
$
|
(4
|
)
|
$
|
(4
|
)
|
$
|
(5
|
)
|
$
|
(14
|
)
|
||||||
Common Stock Dividends
— The Company paid dividends of
$0.11
per outstanding share to its common stockholders during both the first and
second
quarter of
2016
for dividends declared in December 2015 and February 2016 respectively.
Stock Repurchase Program
— During the
six months ended June 30, 2016
, the Parent Company repurchased
8.7 million
shares of its common stock at a total cost of
$79 million
under the existing stock repurchase program (the “Program”). The cumulative repurchases from the commencement of the Program in
July 2010
through
June 30, 2016
totaled
154.3 million
shares for a total cost of
$1.9 billion
, at an average price per share of
$12.12
(including a nominal amount of commissions). As of
June 30, 2016
,
$264 million
remained available for repurchase under the
16
Program.
11
. SEGMENTS
The segment reporting structure uses the Company’s management reporting structure as its foundation to reflect how the Company manages the businesses internally and is organized by geographic regions which provides a socio-political-economic understanding of our business. The management reporting structure is organized by
six
SBUs led by our President and Chief Executive Officer: US; Andes; Brazil; MCAC; Europe; and Asia SBUs. Using the accounting guidance on segment reporting, the Company determined that it has
six
reportable segments corresponding to its
six
SBUs.
Corporate and Other
— Corporate overhead costs which are not directly associated with the operations of our
six
reportable segments are included in “Corporate and Other.” Also included are certain intercompany charges such as self-insurance premiums which are fully eliminated in consolidation.
The Company uses Adjusted PTC as its primary segment performance measure. Adjusted PTC, a non-GAAP measure, is defined by the Company as pretax income from continuing operations attributable to AES excluding (1) unrealized gains or losses related to derivative transactions, (2) unrealized foreign currency gains or losses, (3) gains or losses due to dispositions and acquisitions of business interests, (4) losses due to impairments, and (5) costs due to the early retirement of debt. The Company has concluded that Adjusted PTC best reflects the underlying business performance of the Company and is the most relevant measure considered in the Company’s internal evaluation of the financial performance of its segments. Additionally, given its large number of businesses and complexity, the Company concluded that Adjusted PTC is a more transparent measure that better assists investors in determining which businesses have the greatest impact on the Company’s results.
Revenue and Adjusted PTC are presented before inter-segment eliminations, which includes the effect of intercompany transactions with other segments except for interest, charges for certain management fees, and the write-off of intercompany balances, as applicable. All intra-segment activity has been eliminated within the segment. Inter-segment activity has been eliminated within the total consolidated results.
The following tables present financial information by segment for the periods indicated (in millions):
|
Three Months Ended June 30,
|
Six Months Ended June 30,
|
||||||||||||||
|
Total Revenue
|
2016
|
2015
|
2016
|
2015
|
|||||||||||
|
US SBU
|
$
|
811
|
|
$
|
831
|
|
$
|
1,666
|
|
$
|
1,828
|
|
|||
|
Andes SBU
|
575
|
|
630
|
|
1,197
|
|
1,242
|
|
|||||||
|
Brazil SBU
|
895
|
|
1,113
|
|
1,734
|
|
2,217
|
|
|||||||
|
MCAC SBU
|
530
|
|
601
|
|
1,049
|
|
1,199
|
|
|||||||
|
Europe SBU
|
222
|
|
299
|
|
468
|
|
629
|
|
|||||||
|
Asia SBU
|
201
|
|
187
|
|
395
|
|
306
|
|
|||||||
|
Corporate and Other
|
1
|
|
6
|
|
2
|
|
10
|
|
|||||||
|
Eliminations
|
(6
|
)
|
(11
|
)
|
(11
|
)
|
(17
|
)
|
|||||||
|
Total Revenue
|
$
|
3,229
|
|
$
|
3,656
|
|
$
|
6,500
|
|
$
|
7,414
|
|
|||
|
|
Three Months Ended June 30,
|
Six Months Ended June 30,
|
|||||||||||||
|
Total Adjusted PTC
|
2016
|
2015
|
2016
|
2015
|
|||||||||||
|
US SBU
|
$
|
58
|
|
$
|
56
|
|
$
|
143
|
|
$
|
162
|
|
|||
|
Andes SBU
|
84
|
|
81
|
|
145
|
|
172
|
|
|||||||
|
Brazil SBU
|
7
|
|
51
|
|
12
|
|
82
|
|
|||||||
|
MCAC SBU
|
75
|
|
106
|
|
123
|
|
156
|
|
|||||||
|
Europe SBU
|
34
|
|
41
|
|
103
|
|
126
|
|
|||||||
|
Asia SBU
|
26
|
|
30
|
|
48
|
|
42
|
|
|||||||
|
Corporate and Other
|
(124
|
)
|
(105
|
)
|
(229
|
)
|
(218
|
)
|
|||||||
|
Total Adjusted PTC
|
$
|
160
|
|
$
|
260
|
|
345
|
|
522
|
|
|||||
|
Reconciliation to Income (loss) from Continuing Operations before Taxes and Equity Earnings of Affiliates:
|
|||||||||||||||
|
Non-GAAP Adjustments:
|
|||||||||||||||
|
Unrealized derivative (losses) gains
|
(30
|
)
|
2
|
|
4
|
|
17
|
|
|||||||
|
Unrealized foreign currency (losses) gains
|
(17
|
)
|
4
|
|
(9
|
)
|
(43
|
)
|
|||||||
|
Disposition/acquisition (losses) gains
|
(17
|
)
|
4
|
|
2
|
|
9
|
|
|||||||
|
Impairment losses
|
(235
|
)
|
(30
|
)
|
(285
|
)
|
(36
|
)
|
|||||||
|
Loss on extinguishment of debt
|
(6
|
)
|
(112
|
)
|
(6
|
)
|
(138
|
)
|
|||||||
|
Pretax contribution
|
$
|
(145
|
)
|
$
|
128
|
|
$
|
51
|
|
$
|
331
|
|
|||
|
Add: Income from continuing operations before taxes attributable to noncontrolling interests
|
130
|
|
269
|
|
114
|
|
427
|
|
|||||||
|
Less: Net equity in earnings of affiliates
|
7
|
|
1
|
|
14
|
|
15
|
|
|||||||
|
Income (loss) from continuing operations before taxes and equity in earnings of affiliates
|
$
|
(22
|
)
|
$
|
396
|
|
151
|
|
743
|
|
|||||
17
|
Total Assets
|
June 30, 2016
|
December 31, 2015
|
|||||
|
US SBU
|
$
|
9,705
|
|
$
|
9,800
|
|
|
|
Andes SBU
|
8,755
|
|
8,594
|
|
|||
|
Brazil SBU
|
6,085
|
|
5,209
|
|
|||
|
MCAC SBU
|
5,146
|
|
4,820
|
|
|||
|
Europe SBU
|
2,807
|
|
3,101
|
|
|||
|
Asia SBU
|
3,126
|
|
3,099
|
|
|||
|
Assets of discontinued operations and held-for-sale businesses
|
1,048
|
|
1,306
|
|
|||
|
Corporate and Other
|
302
|
|
541
|
|
|||
|
Total Assets
|
$
|
36,974
|
|
$
|
36,470
|
|
|
12
. OTHER INCOME AND EXPENSE
Other income generally includes gains on asset sales and liability extinguishments, favorable judgments on contingencies, and other income from miscellaneous transactions. Other expense generally includes losses on asset sales and dispositions, losses on legal contingencies and losses from other miscellaneous transactions. The components are summarized as follows (in millions):
|
Three Months Ended June 30,
|
Six Months Ended June 30,
|
|||||||||||||||
|
2016
|
2015
|
2016
|
2015
|
|||||||||||||
|
Other Income
|
Allowance for funds used during construction (US utilities)
|
$
|
7
|
|
$
|
3
|
|
$
|
14
|
|
$
|
7
|
|
|||
|
Gain on sale of assets
|
1
|
|
6
|
|
3
|
|
11
|
|
||||||||
|
Other
|
4
|
|
6
|
|
8
|
|
12
|
|
||||||||
|
Total other income
|
$
|
12
|
|
$
|
15
|
|
$
|
25
|
|
$
|
30
|
|
||||
|
Other Expense
|
Loss on sale and disposal of assets
|
$
|
9
|
|
$
|
7
|
|
$
|
14
|
|
$
|
20
|
|
|||
|
Water rights write-off
|
6
|
|
—
|
|
7
|
|
—
|
|
||||||||
|
Legal settlement
|
4
|
|
5
|
|
4
|
|
8
|
|
||||||||
|
Other
|
2
|
|
—
|
|
4
|
|
1
|
|
||||||||
|
Total other expense
|
$
|
21
|
|
$
|
12
|
|
$
|
29
|
|
$
|
29
|
|
||||
13
. ASSET IMPAIRMENT EXPENSE
|
Three Months Ended June 30,
|
Six Months Ended June 30,
|
||||||||||||||
|
(in millions)
|
2016
|
2015
|
2016
|
2015
|
|||||||||||
|
Buffalo Gap II
|
$
|
—
|
|
$
|
—
|
|
$
|
159
|
|
$
|
—
|
|
|||
|
UK Wind
|
—
|
|
37
|
|
—
|
|
37
|
|
|||||||
|
DPL
|
235
|
|
—
|
|
235
|
|
—
|
|
|||||||
|
Other
|
—
|
|
—
|
|
—
|
|
8
|
|
|||||||
|
Total asset impairment expense
|
$
|
235
|
|
$
|
37
|
|
$
|
394
|
|
$
|
45
|
|
|||
DPL
— During the second quarter of 2016, the Company tested the recoverability of its long-lived generation assets at DPL. Uncertainty created by the Supreme Court of Ohio’s June 20, 2016 opinion, lower expectations of future revenue resulting from the most recent PJM capacity auction, and higher anticipated environmental compliance costs resulting from third party studies were collectively determined to be an impairment indicator for these assets. The Company performed a long-lived asset impairment analysis and determined that the carrying amount of Killen, a coal-fired generation facility, and certain DPL peaking generation facilities were not recoverable. The Killen and DPL peaking generation asset groups were determined to have a fair value of
$84 million
and
$5 million
, respectively, using the income approach. As a result, the Company recognized a total asset impairment expense of
$235 million
. DPL is reported in the US SBU reportable segment.
Buffalo Gap II
— During the first quarter of 2016, the Company tested the recoverability of its long-lived assets at Buffalo Gap II. Impairment indicators were identified based on a decline in forward power curves. The Company determined that the carrying amount was not recoverable. The Buffalo Gap II asset group was determined to have a fair value of
92 million
using the income approach. As a result, the Company recognized an asset impairment expense of
$159 million
(
$49 million
attributable to AES). Buffalo Gap II is reported in the US SBU reportable segment.
UK Wind
— During the second quarter of 2015, the Company decided to no longer pursue
two
wind projects in the United Kingdom based on recent regulatory clarifications specific to these projects, resulting in a full impairment. Impairment indicators were also identified at
four
other wind projects based on their development status and a reassessment of the likelihood that each project would be pursued given aviation concerns, regulatory changes, economic considerations and other factors. The Company determined that the carrying amounts of each of these asset groups, which totaled
$38 million
, were not recoverable. In aggregate, the asset groups were determined to have a fair value of
$1 million
using the market approach and, as a result, the Company recognized an asset impairment expense of
$37 million
. The UK Wind projects were reported in the Europe SBU reportable segment.
18
14
. INCOME TAXES
Chilean Tax Reform
— In February 2016, the Chilean government enacted further reforms to its income tax laws that resulted in an increase to statutory income tax rates for most of our Chilean businesses from
25%
to
25.5%
in 2017 and to
27%
for 2018 and future years. The impact of remeasuring deferred taxes to account for the enacted change in future applicable income tax rates was recognized as discrete income tax expense in the first quarter of 2016, resulting in an increase of
$26 million
to consolidated income tax expense.
15
. DISCONTINUED OPERATIONS AND HELD-FOR-SALE BUSINESSES
Discontinued Operations
Sul —
In June 2016, the Company executed an agreement for the sale of its wholly-owned subsidiary AES Sul, a distribution business in Brazil. Upon meeting the held-for-sale criteria, the Company recognized an after tax loss of
$382 million
comprised of a pretax impairment charge of
$783 million
, offset by a tax benefit of
$266 million
related to the impairment of the Sul long lived assets and a tax benefit of
$135 million
for deferred taxes related to the investment in AES Sul. The carrying value of the AES Sul asset group of
$1.6 billion
was greater than its approximate fair value less costs to sell of
$470 million
. However, the impairment charge was limited to the carrying value of the long lived assets of the AES Sul disposal group as of
June 30, 2016
. The sale is subject to regulatory approval and is expected to close in the second half of 2016.
Upon disposal of AES Sul, we expect to incur an additional after tax loss on sale of approximately
$700 million
subject to factors such as adjustments to sales proceeds and potential future movements in exchange rates. The cumulative impact to earnings of the impairment and loss on sale is expected to be approximately
$1.1 billion
. This includes the reclassification of approximately
$1 billion
of cumulative translation losses, resulting in an expected net reduction to the Company’s stockholders’ equity of approximately
$100 million
.
Due to a recent portfolio evaluation, we determined that AES Sul is no longer aligned with our strategic goals and its disposal is part of a strategic shift of the Company in the Brazil distribution sector. Therefore, we have reported the results of operations and financial position of Sul as discontinued operations in the consolidated financial statements for all periods presented. Sul’s pretax loss attributable to AES was
$779 million
and
$792 million
, respectively, for the three and
six months ended June 30, 2016
, and
$13 million
and
$24 million
, respectively, for the three and
six months ended June 30, 2015
. Prior to its classification as discontinued operations, Sul was reported in the Brazil SBU reportable segment.
The following table summarizes the carrying amounts of the major classes of assets and liabilities of discontinued operations and held-for-sale businesses at
June 30, 2016
and
December 31, 2015
:
|
(in millions)
|
June 30, 2016
|
December 31, 2015
|
|||||
|
Assets of discontinued operations and held-for-sale businesses:
|
|||||||
|
Cash and cash equivalents
|
$
|
5
|
|
$
|
5
|
|
|
|
Short-term investments
|
78
|
|
15
|
|
|||
|
Accounts receivable, net of allowance for doubtful accounts of $18 and $8 respectively
|
183
|
|
171
|
|
|||
|
Property, plant and equipment and intangibles, net
|
837
|
|
668
|
|
|||
|
Deferred income taxes
|
594
|
|
133
|
|
|||
|
Other classes of assets that are not major
|
188
|
|
218
|
|
|||
|
Loss recognized on classification as held-for-sale
(3)
|
(837
|
)
|
—
|
|
|||
|
Total assets of discontinued operations
|
$
|
1,048
|
|
$
|
1,210
|
|
|
|
Other assets of businesses classified as held-for-sale
(2)
|
—
|
|
96
|
|
|||
|
Total assets of discontinued operations and held-for-sale businesses
(1)
|
$
|
1,048
|
|
$
|
1,306
|
|
|
|
Liabilities of discontinued operations and held-for-sale businesses:
|
|||||||
|
Accounts payable
|
$
|
133
|
|
$
|
150
|
|
|
|
Accrued interest
|
20
|
|
15
|
|
|||
|
Accrued and other liabilities
|
151
|
|
150
|
|
|||
|
Non-recourse debt
|
373
|
|
346
|
|
|||
|
Other classes of liabilities that are not major
|
164
|
|
110
|
|
|||
|
Total liabilities of discontinued operations
|
$
|
841
|
|
$
|
771
|
|
|
|
Other liabilities of businesses classified as held-for-sale
(2)
|
—
|
|
13
|
|
|||
|
Total liabilities of discontinued operations and held-for-sale businesses
(1)
|
$
|
841
|
|
$
|
784
|
|
|
_____________________________
|
(1)
|
Amounts at
December 31, 2015
are classified as both current and long-term on the Condensed Consolidated Balance Sheet.
|
|
(2)
|
DPLER and Kelanitissa classified as held-for-sale at
December 31, 2015
. See Note
16
—Dispositions
for further information.
|
|
(3)
|
Pre-tax impairment expense of
$783 million
is net of the impact from cumulative translation adjustments.
|
19
The following table summarizes the carrying amounts of the major line items constituting losses from discontinued operations for the three and
six months ended June 30, 2016
and
2015
:
|
(in millions)
|
Three Months Ended June 30,
|
Six Months Ended June 30,
|
|||||||||||||
|
Loss from discontinued operations, net of tax:
|
2016
|
2015
|
2016
|
2015
|
|||||||||||
|
Revenue - regulated
|
$
|
219
|
|
$
|
202
|
|
$
|
419
|
|
$
|
428
|
|
|||
|
Cost of sales
|
(204
|
)
|
(203
|
)
|
(408
|
)
|
(428
|
)
|
|||||||
|
Asset impairment expense
|
(783
|
)
|
—
|
|
(783
|
)
|
—
|
|
|||||||
|
Other income and expense items that are not major
|
(11
|
)
|
(12
|
)
|
(20
|
)
|
(24
|
)
|
|||||||
|
Pretax loss from discontinued operations
|
(779
|
)
|
(13
|
)
|
(792
|
)
|
(24
|
)
|
|||||||
|
Income tax benefit
|
400
|
|
3
|
|
404
|
|
7
|
|
|||||||
|
Loss from discontinued operations, net of tax
|
$
|
(379
|
)
|
$
|
(10
|
)
|
$
|
(388
|
)
|
$
|
(17
|
)
|
|||
The following table summarizes the operating and investing cash flows from discontinued operations for the
six months ended June 30, 2016
and
2015
:
|
Six Months Ended June 30,
|
|||||||
|
(in millions)
|
2016
|
2015
|
|||||
|
Cash flows from operating activities of discontinued operations
|
$
|
57
|
|
$
|
(47
|
)
|
|
|
Cash flows from investing activities of discontinued operations
|
(84
|
)
|
7
|
|
|||
Held-For-Sale Businesses
U.S. wind projects —
In November 2013, the Company executed an agreement for the sale of its
100%
membership interests in
three
wind projects: Condon in California, Lake Benton I in Minnesota and Storm Lake II in Iowa. The sale transaction closed on January 30, 2014 and net proceeds of
$27 million
were received. These wind projects were previously reported in the US SBU reportable segment.
Under the terms of the sale agreement, the buyer was provided an option to purchase the Company's
100%
interest in Armenia Mountain, a wind project in Pennsylvania, at a fixed price of
$75 million
. Approximately
$3 million
of the
$27 million
net proceeds was deferred and allocated to this option.
The buyer exercised the option on March 31, 2015 and the sale was completed on July 1, 2015. Accordingly, Armenia Mountain was classified as held-for-sale as of June 30, 2015, but did not meet the criteria to be reported as a discontinued operation. Armenia Mountain’s results were therefore reflected within continuing operations in the Condensed Consolidated Statements of Operations. Armenia Mountain’s pretax income attributable to AES was
$2 million
and
$6 million
, respectively, for the three and six months ended June 30, 2015. Armenia Mountain was reported in the US SBU reportable segment.
16
. DISPOSITIONS
DPLER
—
On January 1, 2016, the Company completed the sale of its interest in DPLER, a competitive retail marketer selling electricity to customers in Ohio. Upon completion, proceeds of
$76 million
were received and a gain on sale of
$49 million
was recognized. The sale of DPLER did not meet the criteria to be reported as a discontinued operation. Prior to its sale, DPLER was reported in the US SBU reportable segment.
Kelanitissa
—
On January 27, 2016, the Company completed the sale of its interest in Kelanitissa, a diesel-fired generation station in Sri Lanka. Upon completion, proceeds of
$18 million
were received and a loss on sale of
$5 million
was recognized. The sale of Kelanitissa did not meet the criteria to be reported as a discontinued operation. Prior to its sale, Kelanitissa was reported in the Asia SBU reportable segment.
UK Wind
—
During the second quarter of 2016, the Company deconsolidated UK Wind and recorded a loss on deconsolidation of
$20 million
to
Gain (loss) on disposal and sale of businesses
in the Condensed Consolidated Statement of Operations. Prior to deconsolidation, UK Wind was reported in the Europe SBU reportable segment. See Note
10
—
Equity
for additional information.
17
. ACQUISITIONS
Main Street Power
—
On February 18, 2015, the Company completed the acquisition of
100%
of the common stock of Main Street Power Company, Inc. for approximately
$25 million
pursuant to the terms and condition of a definitive agreement dated January 24, 2015. The purchase consideration was composed of
$20 million
cash and the fair value of earn-out payments of
$5 million
. At December 31, 2015, the assets acquired (including
$4 million
cash) and liabilities assumed at the acquisition date were recorded at fair value based on the final purchase price allocation, which resulted in the recognition of
$16 million
of goodwill. Subsequent changes to the fair value of earn-out payments will be reflected in earnings. Since the date of acquisition, Main Street Power Company, Inc. has been renamed Distributed Energy, Inc.
20
18
. EARNINGS PER SHARE
Basic and diluted earnings per share are based on the weighted average number of shares of common stock and potential common stock outstanding during the period. Potential common stock, for purposes of determining diluted earnings per share, includes the effects of dilutive RSUs, stock options and convertible securities. The effect of such potential common stock is computed using the treasury stock method or the if-converted method, as applicable. Presented below is a reconciliation, for the periods indicated, of the numerator and denominator of the basic and diluted earnings per share computation for income from continuing operations, where income represents the numerator and weighted average shares represents the denominator:
|
(in millions, except per share data)
|
2016
|
2015
|
|||||||||||||||||||
|
Three Months Ended June 30,
|
Income
|
Shares
|
$ per Share
|
Income
|
Shares
|
$ per Share
|
|||||||||||||||
|
BASIC EARNINGS PER SHARE
|
|||||||||||||||||||||
|
Income (loss) from continuing operations attributable to The AES Corporation common stockholders
|
$
|
(103
|
)
|
659
|
|
$
|
(0.16
|
)
|
$
|
79
|
|
693
|
|
$
|
0.11
|
|
|||||
|
EFFECT OF DILUTIVE SECURITIES
|
|
||||||||||||||||||||
|
Restricted stock units
|
—
|
|
—
|
|
—
|
|
—
|
|
2
|
|
—
|
|
|||||||||
|
DILUTED EARNINGS PER SHARE
|
$
|
(103
|
)
|
659
|
|
$
|
(0.16
|
)
|
$
|
79
|
|
695
|
|
$
|
0.11
|
|
|||||
|
Six Months Ended June 30,
|
|||||||||||||||||||||
|
BASIC EARNINGS PER SHARE
|
|||||||||||||||||||||
|
Income from continuing operations attributable to The AES Corporation common stockholders
|
$
|
32
|
|
660
|
|
$
|
0.05
|
|
$
|
228
|
|
698
|
|
$
|
0.33
|
|
|||||
|
EFFECT OF DILUTIVE SECURITIES
|
|||||||||||||||||||||
|
Stock options
|
—
|
|
—
|
|
—
|
|
—
|
|
1
|
|
—
|
|
|||||||||
|
Restricted stock units
|
—
|
|
2
|
|
—
|
|
—
|
|
2
|
|
—
|
|
|||||||||
|
DILUTED EARNINGS PER SHARE
|
$
|
32
|
|
662
|
|
$
|
0.05
|
|
$
|
228
|
|
701
|
|
$
|
0.33
|
|
|||||
For the
three and six
months ended
June 30, 2016
and
2015
, respectively, the calculation of diluted earnings per share excluded
8 million
and
6 million
outstanding stock awards which could potentially dilute basic earnings per share in the future. Additionally, for the
three and six
months ended
June 30, 2016
and
2015
, all
15 million
shares of potential common stock associated with convertible debentures were omitted from the earnings per share calculation as the impact would have been anti-dilutive.
For the
three months ended June 30, 2016
, the calculation of diluted earnings per share also excluded
5 million
outstanding restricted stock units, that could potentially dilute earnings per share in the future. These restricted units were not included in the computation of diluted earnings per share for
three months ended June 30, 2016
, because their impact would be anti-dilutive given the loss from continuing operations. Had the Company generated income from continuing operations in
three months ended June 30, 2016
,
3 million
potential shares of common stock related to the restricted stock units would have been included in diluted average shares outstanding.
19
. SUBSEQUENT EVENTS
In July 2016, the Company redeemed in full the
$181 million
balance of its
8%
outstanding senior notes due 2017. As a result, the Company expects to recognize a loss on extinguishment of debt of approximately
$16 million
during the third quarter of 2016.
21
In this Quarterly Report on Form 10-Q (“Form 10-Q”), the terms “AES,” “the Company,” “us,” or “we” refer to the consolidated entity and all of its subsidiaries and affiliates, collectively. The term “The AES Corporation” or “the Parent Company” refers only to the publicly held holding company, The AES Corporation, excluding its subsidiaries and affiliates. The condensed consolidated financial statements included in Item 1.—
Financial Statements
of this Form 10-Q and the discussions contained herein should be read in conjunction with our
2015
Form 10-K.
The prior-period condensed consolidated financial statements and management’s discussion and analysis in this Form 10-Q have been reclassified to reflect the businesses held-for-sale and discontinued operations as discussed in Note
15
—Discontinued Operations and Held-for-Sale Businesses
.
FORWARD-LOOKING INFORMATION
The following discussion may contain forward-looking statements regarding us, our business, prospects and our results of operations that are subject to certain risks and uncertainties posed by many factors and events that could cause our actual business, prospects and results of operations to differ materially from those that may be anticipated by such forward-looking statements. Factors that could cause or contribute to such differences include, but are not limited to, those described in Item 1A.—
Risk Factors
and Item 7.—
Management’s Discussion and Analysis of Financial Condition and Results of Operations
of our
2015
Form 10-K and subsequent filings with the SEC. Readers are cautioned not to place undue reliance on these forward-looking statements which speak only as of the date of this report. We undertake no obligation to revise any forward-looking statements in order to reflect events or circumstances that may subsequently arise. If we do update one or more forward-looking statements, no inference should be drawn that we will make additional updates with respect to those or other forward-looking statements. Readers are urged to carefully review and consider the various disclosures made by us in this report and in our other reports filed with the SEC that advise of the risks and factors that may affect our business.
Overview of Our Business
—
We are a diversified power generation and utility company organized into the following six market-oriented SBUs:
US
(
United States
);
Andes
(
Chile, Colombia and Argentina
);
Brazil
;
MCAC
(
Mexico, Central America and the Caribbean
);
Europe
(
Europe and Middle East
); and
Asia
(India, Philippines, Vietnam, and Sri Lanka)
. For additional information regarding our business, see Item 1.—
Business
of our
2015
Form 10-K.
Within our six SBUs listed above, we have two lines of business. The first business line is generation, where we own and/or operate power plants to generate and sell power to customers such as utilities, industrial users and other intermediaries. The second business line is utilities, where we own and/or operate utilities to generate or purchase, distribute, transmit and sell electricity to end-user customers in the residential, commercial, industrial and governmental sectors within a defined service area. In certain circumstances, our utilities also generate and sell electricity on the wholesale market.
Key Topics in Management’s Discussion and Analysis
— Our discussion covers the following:
|
•
|
Overview of
Q2 2016
Results and Strategic Performance
|
|
•
|
Review of Consolidated Results of Operations
|
|
•
|
Non-GAAP Measures and SBU Performance Analysis
|
|
•
|
Key Trends and Uncertainties
|
|
•
|
Capital Resources and Liquidity
|
Overview of
Q2 2016
Results and Strategic Performance
Management’s Strategic Priorities
— Management is focused on the following priorities:
|
•
|
Leveraging our platforms
— We are focusing our growth on platform expansions in markets where we already operate and have a competitive advantage to realize attractive risk-adjusted returns. We currently have 3,921 MW under construction. These projects represent $7.8 billion in total capital expenditures, with the majority of AES’ $1.3 billion in equity already funded. These projects are expected to come on-line through 2019. Beyond the projects we currently have under construction, we will continue to advance select projects from our development pipeline.
|
|
•
|
Reducing complexity
— By exiting businesses and markets where we do not have a competitive advantage, we are simplifying our portfolio and reducing risk. Year-to-date 2016, we announced or closed $540 million in equity proceeds from the sales or sell-downs of six businesses.
|
22
|
•
|
Performance excellence
— We strive to be the low-cost manager of a portfolio of assets and to derive synergies and scale from our businesses. In late 2015, we launched a $150 million cost reduction and revenue enhancement initiative. This initiative will include overhead reductions, procurement efficiencies and operational improvements. We expect to achieve at least $50 million in savings in 2016, ramping up to a total of $150 million in 2018.
|
|
•
|
Expanding access to capital
— We are building strategic partnerships at the project and business levels. Through these partnerships, we aim to optimize our risk-adjusted returns in our existing businesses and growth projects. By selling down portions of certain businesses, we can adjust our global exposure to commodity, fuel, country and other macroeconomic risks. Partial sell-downs of our assets can also serve to highlight or enhance the value of businesses in our portfolio.
|
|
•
|
Allocating capital in a disciplined manner
— Our top priority is to maximize risk-adjusted returns to our shareholders, which we achieve by investing our discretionary cash and recycling the capital we receive from asset sales and strategic partnerships. Year-to-date 2016, we generated substantial cash by executing on our strategy, which we allocated in line with our capital allocation framework:
|
|
◦
|
Used $312 million to prepay and refinance the Parent Company debt;
|
|
◦
|
Returned $224 million to shareholders through share repurchases and quarterly dividends; and
|
|
◦
|
Invested $248 million in our subsidiaries.
|
Safe Operations
Safety is our first value and a top priority. We consistently analyze and evaluate our safety performance in order to capture lessons learned and strengthen mitigation plans that improve our safety performance.
Q2 2016
Strategic Performance
Earnings Per Share and Proportional Free Cash Flow Results in
Q2 2016
(in millions, except per share amounts)
|
Three Months Ended June 30,
|
Six Months Ended June 30,
|
||||||||||||||||||||||||||||
|
2016
|
2015
|
Change
|
% Change
|
2016
|
2015
|
$ Change
|
% Change
|
||||||||||||||||||||||
|
Diluted earnings per share from continuing operations
|
$
|
(0.16
|
)
|
$
|
0.11
|
|
$
|
(0.27
|
)
|
NM
|
|
$
|
0.05
|
|
$
|
0.33
|
|
$
|
(0.28
|
)
|
-85
|
%
|
|||||||
|
Adjusted EPS (a non-GAAP measure)
(1)
|
0.17
|
|
0.26
|
|
(0.09
|
)
|
-35
|
%
|
0.32
|
|
0.52
|
|
(0.20
|
)
|
-38
|
%
|
|||||||||||||
|
Net cash provided by operating activities
|
723
|
|
153
|
|
570
|
|
NM
|
|
1,363
|
|
590
|
|
773
|
|
NM
|
|
|||||||||||||
|
Proportional free cash flow (a non-GAAP measure)
(1)
|
417
|
|
62
|
|
355
|
|
NM
|
|
670
|
|
327
|
|
343
|
|
NM
|
|
|||||||||||||
_____________________________
|
(1)
|
See Item 2.—
SBU Performance Analysis
—
Non-GAAP Measures
for reconciliation and definition.
|
Three Months Ended June 30, 2016
Diluted earnings per share from continuing operations decreased
$0.27
, to a loss of
$0.16
, primarily due to lower operating margin at our Brazil and MCAC SBUs, higher impairment expense, higher interest expense and unfavorable foreign currency exchange; partially offset by lower share count and lower losses on extinguishment of debt.
Adjusted EPS, a non-GAAP measure, decreased
$0.09
, or
35%
, to
$0.17
, primarily due to lower operating margins at our Brazil and MCAC SBUs, higher interest expense and unfavorable foreign currency exchange; partially offset by lower share count.
Net cash provided by operating activities
increased
by
$570 million
to
$723 million
, primarily driven by the collection of overdue receivables at Maritza and increased collections at our Brazil utilities, which were partially offset by the timing of payments for energy purchases at our Brazil utilities.
Proportional Free Cash Flow, a non-GAAP measure,
increased
by
$355 million
to
$417 million
, primarily driven by the collection of overdue receivables at Maritza, increased collections at our Brazil utilities, and lower working capital requirements. These increases were partially offset by a decrease in Adjusted Operating Margin (a non-GAAP measure).
Six Months Ended June 30, 2016
Diluted earnings per share from continuing operations decreased
$0.28
, or
85%
, to
$0.05
, primarily due to lower operating margins at our Brazil, US, MCAC and Europe SBUs, higher impairment expense and higher interest expense; partially offset by lower share count, higher gains on extinguishment of debt, gain on sale of our interest in DPLER and higher interest income.
23
Adjusted EPS, a non-GAAP measure, decreased
$0.20
, or
38%
, to
$0.32
, primarily due to lower operating margins at our Brazil, US, MCAC and Europe SBUs and higher interest expense; partially offset by lower share count and higher interest income.
Net cash provided by operating activities
increased
by
$773 million
to
$1.4 billion
, primarily driven by the collection of overdue receivables at Maritza and an increase in collections at our Brazil utilities, which were partially offset by the timing of payments for energy purchases at our Brazil utilities and lower net income adjusted for non-cash items.
Proportional Free Cash Flow, a non-GAAP measure,
increased
by
$343 million
to
$670 million
, primarily driven by the collection of overdue receivables at Maritza, increased collections at our Brazil utilities, and lower working capital requirements. These increases were partially offset by a decrease in Adjusted Operating Margin (a non-GAAP measure).
Review of Consolidated Results of Operations
|
Three Months Ended June 30,
|
Six Months Ended June 30,
|
||||||||||||||||||||||||||||
|
(in millions, except per share amounts)
|
2016
|
2015
|
$ change
|
% change
|
2016
|
2015
|
$ change
|
% change
|
|||||||||||||||||||||
|
Revenue:
|
|||||||||||||||||||||||||||||
|
US SBU
|
$
|
811
|
|
$
|
831
|
|
$
|
(20
|
)
|
-2
|
%
|
$
|
1,666
|
|
$
|
1,828
|
|
$
|
(162
|
)
|
-9
|
%
|
|||||||
|
Andes SBU
|
575
|
|
630
|
|
(55
|
)
|
-9
|
%
|
1,197
|
|
1,242
|
|
(45
|
)
|
-4
|
%
|
|||||||||||||
|
Brazil SBU
|
895
|
|
1,113
|
|
(218
|
)
|
-20
|
%
|
1,734
|
|
2,217
|
|
(483
|
)
|
-22
|
%
|
|||||||||||||
|
MCAC SBU
|
530
|
|
601
|
|
(71
|
)
|
-12
|
%
|
1,049
|
|
1,199
|
|
(150
|
)
|
-13
|
%
|
|||||||||||||
|
Europe SBU
|
222
|
|
299
|
|
(77
|
)
|
-26
|
%
|
468
|
|
629
|
|
(161
|
)
|
-26
|
%
|
|||||||||||||
|
Asia SBU
|
201
|
|
187
|
|
14
|
|
7
|
%
|
395
|
|
306
|
|
89
|
|
29
|
%
|
|||||||||||||
|
Corporate and Other
|
1
|
|
6
|
|
(5
|
)
|
-83
|
%
|
2
|
|
10
|
|
(8
|
)
|
-80
|
%
|
|||||||||||||
|
Intersegment eliminations
|
(6
|
)
|
(11
|
)
|
5
|
|
45
|
%
|
(11
|
)
|
(17
|
)
|
6
|
|
35
|
%
|
|||||||||||||
|
Total Revenue
|
3,229
|
|
3,656
|
|
(427
|
)
|
-12
|
%
|
6,500
|
|
7,414
|
|
(914
|
)
|
-12
|
%
|
|||||||||||||
|
Operating Margin:
|
|
|
|||||||||||||||||||||||||||
|
US SBU
|
133
|
|
125
|
|
8
|
|
6
|
%
|
247
|
|
298
|
|
(51
|
)
|
-17
|
%
|
|||||||||||||
|
Andes SBU
|
140
|
|
119
|
|
21
|
|
18
|
%
|
263
|
|
250
|
|
13
|
|
5
|
%
|
|||||||||||||
|
Brazil SBU
|
78
|
|
224
|
|
(146
|
)
|
-65
|
%
|
121
|
|
401
|
|
(280
|
)
|
-70
|
%
|
|||||||||||||
|
MCAC SBU
|
134
|
|
165
|
|
(31
|
)
|
-19
|
%
|
230
|
|
268
|
|
(38
|
)
|
-14
|
%
|
|||||||||||||
|
Europe SBU
|
47
|
|
64
|
|
(17
|
)
|
-27
|
%
|
130
|
|
167
|
|
(37
|
)
|
-22
|
%
|
|||||||||||||
|
Asia SBU
|
46
|
|
47
|
|
(1
|
)
|
-2
|
%
|
83
|
|
71
|
|
12
|
|
17
|
%
|
|||||||||||||
|
Corporate and Other
|
(4
|
)
|
12
|
|
(16
|
)
|
NM
|
|
4
|
|
24
|
|
(20
|
)
|
-83
|
%
|
|||||||||||||
|
Intersegment eliminations
|
—
|
|
(1
|
)
|
1
|
|
NM
|
|
5
|
|
(3
|
)
|
8
|
|
NM
|
|
|||||||||||||
|
Total Operating Margin
|
574
|
|
755
|
|
(181
|
)
|
-24
|
%
|
1,083
|
|
1,476
|
|
(393
|
)
|
-27
|
%
|
|||||||||||||
|
General and administrative expenses
|
(47
|
)
|
(50
|
)
|
3
|
|
-6
|
%
|
(95
|
)
|
(105
|
)
|
10
|
|
-10
|
%
|
|||||||||||||
|
Interest expense
|
(390
|
)
|
(287
|
)
|
(103
|
)
|
36
|
%
|
(732
|
)
|
(630
|
)
|
(102
|
)
|
16
|
%
|
|||||||||||||
|
Interest income
|
138
|
|
116
|
|
22
|
|
19
|
%
|
255
|
|
195
|
|
60
|
|
31
|
%
|
|||||||||||||
|
Gain (loss) on extinguishment of debt
|
—
|
|
(117
|
)
|
117
|
|
NM
|
|
4
|
|
(141
|
)
|
145
|
|
NM
|
|
|||||||||||||
|
Other expense
|
(21
|
)
|
(12
|
)
|
(9
|
)
|
75
|
%
|
(29
|
)
|
(29
|
)
|
—
|
|
—
|
%
|
|||||||||||||
|
Other income
|
12
|
|
15
|
|
(3
|
)
|
-20
|
%
|
25
|
|
30
|
|
(5
|
)
|
-17
|
%
|
|||||||||||||
|
Gain (loss) on disposal and sale of businesses
|
(17
|
)
|
—
|
|
(17
|
)
|
NM
|
|
30
|
|
—
|
|
30
|
|
NM
|
|
|||||||||||||
|
Asset impairment expense
|
(235
|
)
|
(37
|
)
|
(198
|
)
|
NM
|
|
(394
|
)
|
(45
|
)
|
(349
|
)
|
NM
|
|
|||||||||||||
|
Foreign currency transaction gains (losses)
|
(36
|
)
|
13
|
|
(49
|
)
|
NM
|
|
4
|
|
(8
|
)
|
12
|
|
NM
|
|
|||||||||||||
|
Income tax benefit (expense)
|
7
|
|
(123
|
)
|
130
|
|
NM
|
|
(90
|
)
|
(223
|
)
|
133
|
|
-60
|
%
|
|||||||||||||
|
Net equity in earnings of affiliates
|
7
|
|
1
|
|
6
|
|
NM
|
|
14
|
|
15
|
|
(1
|
)
|
-7
|
%
|
|||||||||||||
|
INCOME (LOSS) FROM CONTINUING OPERATIONS
|
(8
|
)
|
274
|
|
(282
|
)
|
NM
|
|
75
|
|
535
|
|
(460
|
)
|
-86
|
%
|
|||||||||||||
|
Income (loss) from operations of discontinued businesses, net of income tax (expense) benefit of $(1), $3, $3 and $7, respectively
|
3
|
|
(10
|
)
|
13
|
|
NM
|
|
(6
|
)
|
(17
|
)
|
11
|
|
-65
|
%
|
|||||||||||||
|
Net loss from disposal and impairments of discontinued businesses, net of income tax benefit of $401, $0, $401 and $0, respectively
|
(382
|
)
|
—
|
|
(382
|
)
|
100
|
%
|
(382
|
)
|
—
|
|
(382
|
)
|
100
|
%
|
|||||||||||||
|
NET INCOME (LOSS)
|
(387
|
)
|
264
|
|
(651
|
)
|
NM
|
|
(313
|
)
|
518
|
|
(831
|
)
|
NM
|
|
|||||||||||||
|
Less: Net income attributable to noncontrolling interests
|
(95
|
)
|
(195
|
)
|
100
|
|
-51
|
%
|
(43
|
)
|
(307
|
)
|
264
|
|
-86
|
%
|
|||||||||||||
|
NET INCOME (LOSS) ATTRIBUTABLE TO THE AES CORPORATION
|
$
|
(482
|
)
|
$
|
69
|
|
$
|
(551
|
)
|
NM
|
|
$
|
(356
|
)
|
$
|
211
|
|
$
|
(567
|
)
|
NM
|
|
|||||||
|
AMOUNTS ATTRIBUTABLE TO THE AES CORPORATION COMMON STOCKHOLDERS:
|
|||||||||||||||||||||||||||||
|
Income (loss) from continuing operations, net of tax
|
$
|
(103
|
)
|
$
|
79
|
|
$
|
(182
|
)
|
NM
|
|
$
|
32
|
|
$
|
228
|
|
$
|
(196
|
)
|
-86
|
%
|
|||||||
|
Loss from discontinued operations, net of tax
|
(379
|
)
|
(10
|
)
|
(369
|
)
|
NM
|
|
(388
|
)
|
(17
|
)
|
(371
|
)
|
NM
|
|
|||||||||||||
|
NET INCOME (LOSS) ATTRIBUTABLE TO THE AES CORPORATION
|
$
|
(482
|
)
|
$
|
69
|
|
$
|
(551
|
)
|
NM
|
|
$
|
(356
|
)
|
$
|
211
|
|
$
|
(567
|
)
|
NM
|
|
|||||||
|
Net cash provided by operating activities
|
$
|
723
|
|
$
|
153
|
|
$
|
570
|
|
NM
|
|
$
|
1,363
|
|
$
|
590
|
|
$
|
773
|
|
NM
|
|
|||||||
|
DIVIDENDS DECLARED PER COMMON SHARE
|
$
|
—
|
|
$
|
0.10
|
|
$
|
(0.10
|
)
|
-100
|
%
|
$
|
0.11
|
|
$
|
0.10
|
|
$
|
0.01
|
|
10
|
%
|
|||||||
NM - Not Meaningful
24
Components of Revenue, Cost of Sales, Operating Margin, and Operating Cash Flow —
Revenue includes revenue earned from the sale of energy from our utilities and the production of energy from our generation plants, which are classified as regulated and non-regulated
,
respectively, on the Condensed Consolidated Statements of Operations. Revenue also includes the gains or losses on derivatives associated with the sale of electricity.
Cost of sales includes costs incurred directly by the businesses in the ordinary course of business. Examples include electricity and fuel purchases, O&M costs, depreciation and amortization expense, bad debt expense and recoveries, and general administrative and support costs (including employee-related costs directly associated with the operations of the business). Cost of sales also includes the gains or losses on derivatives (including embedded derivatives other than foreign currency embedded derivatives) associated with the purchase of electricity or fuel.
Operating margin is defined as revenue less cost of sales.
Consolidated Revenue and Operating Margin — Executive Summary
Three months ended June 30, 2016
:


Consolidated Revenue
— Revenue
decrease
d
$427 million
, or
12%
, to
$3.2 billion
for the three months ended
June 30, 2016
, compared with
$3.7 billion
for the three months ended
June 30, 2015
. This
decrease
was driven by
unfavorable
FX impact of
$219 million
, primarily in Brazil, of $152 million. Additionally, revenues were impacted in Brazil due to lower rates for energy sold under new contracts at Tietê, Uruguiana operating in 2015 but not in 2016, and the reversal of a contingent regulatory liability at Eletropaulo in 2015. These decreases were partially offset by higher retail revenue driven by environmental revenues and higher rates due to a new rate order at IPL and the impact of a full three months of operations at Mong Duong in comparison with commencement of principal operations in mid-April 2015.
Consolidated Operating Margin
— Operating margin
decrease
d
$181 million
, or
24%
, to
$574 million
for the three months ended
June 30, 2016
, compared with
$755 million
for the three months ended
June 30, 2015
. In addition to the
unfavorable
FX impact of
$31 million
primarily in Kazakhstan, Brazil, and Colombia, the
decrease
was driven primarily by the reversal of a contingent regulatory liability at Eletropaulo in 2015, higher fixed costs, and lower demand due to economic decline. These decreases were partially offset by higher margin and lower fixed costs at Gener and higher margin driven by environmental revenues and higher rates due to a new rate order at IPL.
Six months ended June 30, 2016
:


Consolidated Revenue
— Revenue
decrease
d
$914 million
, or
12%
, to
$6.5 billion
for the
six months ended
June 30, 2016
, compared with
$7.4 billion
for the
six months ended
June 30, 2015
. This
decrease
was driven by
unfavorable
FX impact of
$686 million
, primarily in Brazil, of
$530 million
. Additionally, revenues were impacted in Brazil due to lower rates for energy sold under new contracts at Tietê, Uruguiana operating in 2015 but not in 2016, and the reversal of a contingent regulatory liability at Eletropaulo in 2015. Revenues also declined due to lower pass-through costs at El Salvador and IPP4 plant in Jordan, the sale of DPLER in January 2016 and lower rates at DPL. These decreases were partially offset by the impact of full operations at Mong Duong in 2016 compared to Unit 1 in March 2015 with principal operations commencing in April 2015.
25
Consolidated Operating Margin
— Operating margin
decrease
d
$393 million
, or
27%
, to
$1.1 billion
for the
six months ended
June 30, 2016
, compared with
$1.5 billion
for the
six months ended
June 30, 2015
. In addition to the
unfavorable
FX impact of
$72 million
primarily in Kazakhstan, Brazil, and Colombia, the
decrease
was driven primarily by the reversal of a contingent regulatory liability in 2015 and higher fixed costs at Eletropaulo and lower rates for energy sold under new contracts at Tietê. These decreases were partially offset by higher margin and lower fixed costs at Gener.
See Item 2.—
SBU Performance Analysis
of this Form 10-Q for additional discussion and analysis of operating results for each SBU.
Consolidated Results of Operations — Other
General and administrative expenses
General and administrative expenses
decrease
d
$3 million
, or
6%
, to
$47 million
for the three months ended
June 30, 2016
. The
decrease
was primarily due to decreased employee-related costs.
General and administrative expenses
decrease
d
$10 million
, or
10%
, to
$95 million
for the
six months ended
June 30, 2016
. The
decrease
was primarily due to decreased employee-related costs and professional fees.
Interest expense
Interest expense
increase
d
$103 million
, or
36%
, to
$390 million
for the three months ended
June 30, 2016
. The increase was primarily due to a
$100 million
increase at Eletropaulo as a result of the prior year reversal of
$64 million
in interest expense, previously recognized on a contingent regulatory liability, and higher interest expense due to higher regulatory liability balances and higher interest rates.
Interest expense
increase
d
$102 million
, or
16%
, to
$732 million
for the
six months ended
June 30, 2016
. The increase was primarily due to a
$104 million
increase at Eletropaulo as a result of the prior year reversal of $
64 million
in interest expense previously recognized on a contingent regulatory liability and higher interest expense due to higher regulatory liability balances and higher interest rates; an increase of
$23 million
at Mong Duong mainly due to lower capitalized interest as a result of the commencement of operations in April 2015. These increases were partially offset by lower interest expense of
$18 million
at the Parent Company and DPL due to a reduction in debt principal and lower interest rates, and lower interest expense of
$8 million
at IPALCO mainly due to increased capitalized interest.
Interest income
Interest income
increase
d
$22 million
, or
19%
, to
$138 million
for the three months ended
June 30, 2016
. The
increase
was primarily due to higher interest income of
$24 million
at Eletropaulo due to an increase in regulatory assets and higher interest rates.
Interest income
increase
d
$60 million
, or
31%
, to
$255 million
for the
six months ended
June 30, 2016
. The
increase
was primarily due to higher interest income of
$39 million
at Eletropaulo mainly due to an increase in regulatory assets and
$26 million
recognized on the financing element of the service concession arrangement at Mong Duong, which only became fully operational from April 2015.
Gain (loss) on extinguishment of debt
Gain on extinguishment of debt was
zero
and
$4 million
for the
three and six
months ended
June 30, 2016
, and loss on extinguishment of debt was
$117 million
and
$141 million
for the
three and six
months ended
June 30, 2015
, respectively. See Note
7
—
Debt
included in Item 1.—
Financial Statements
of this Form 10-Q for further information.
Other income and expense
Other income was
$12 million
and
$25 million
for the
three and six
months ended
June 30, 2016
, and
$15 million
and
$30 million
for the
three and six
months ended
June 30, 2015
, respectively.
Other expense was
$21 million
and
$29 million
for the
three and six
months ended
June 30, 2016
, and
$12 million
and
$29 million
for the
three and six
months ended
June 30, 2015
, respectively.
See Note
12
—
Other Income and Expense
included in Item 1.—
Financial Statements
of this Form 10-Q for further information.
Gain (loss) on disposal and sale of businesses
Loss on disposal and sale of businesses was
$17 million
for the three months ended
June 30, 2016
whereas
26
there was
no
comparable amount for the three months ended
June 30, 2015
. This decrease was primarily due to a loss on deconsolidation of
$20 million
for UK Wind during the three months ended
June 30, 2016
.
Gain on disposal and sale of businesses was
$30 million
for the six months ended
June 30, 2016
, whereas there was
no
comparable amount for the six months ended
June 30, 2015
. This increase was primarily due to a gain on sale of
$49 million
for the sale of the Company’s interest in DPLER, partially offset by a loss on deconsolidation of
$20 million
for UK Wind during the six months ended
June 30, 2016
.
See Note
16
—
Dispositions
included in Item 1.—
Financial Statements
of this Form 10-Q for further information.
Asset impairment expense
Asset impairment expense was
$235 million
and
$394 million
for the
three and six
months ended
June 30, 2016
, and
$37 million
and
$45 million
for the
three and six
months ended
June 30, 2015
, respectively. See Note
13
—
Asset Impairment Expense
included in Item 1.—
Financial Statements
of this Form 10-Q for further information.
Foreign currency transaction gains (losses)
:
|
Three Months Ended June 30,
|
Six Months Ended June 30,
|
||||||||||||||
|
(in millions)
|
2016
|
2015
|
2016
|
2015
|
|||||||||||
|
Argentina
|
$
|
(29
|
)
|
$
|
2
|
|
$
|
1
|
|
$
|
17
|
|
|||
|
Parent Company
|
(13
|
)
|
14
|
|
(5
|
)
|
(19
|
)
|
|||||||
|
Other
|
6
|
|
(3
|
)
|
8
|
|
(6
|
)
|
|||||||
|
Total
(1)
|
$
|
(36
|
)
|
$
|
13
|
|
$
|
4
|
|
$
|
(8
|
)
|
|||
___________________________________________
|
(1)
|
Includes
$22 million
of losses and
$10 million
of gains on foreign currency derivative contracts for the
three months ended June 30, 2016
and
2015
, respectively, and
$23 million
and
$46 million
of gains on foreign currency derivative contracts for the
six months ended
June 30, 2016
and
2015
, respectively.
|
The Company recognized net foreign currency transaction losses of
$36 million
for the three months ended
June 30, 2016
, primarily due to:
|
•
|
a loss of
$29 million
in Argentina, which was primarily related to the unfavorable impact of foreign currency derivatives associated with government receivables at AES Argentina (an Argentine Peso functional currency subsidiary), and losses from devaluation of the Argentine Peso associated with U.S. Dollar denominated debt; and
|
|
•
|
a loss of
$13 million
at the Parent Company, which was primarily related to remeasurement losses on intercompany notes.
|
The Company recognized net foreign currency transaction gains of
$13 million
for the three months ended
June 30, 2015
, primarily due to:
|
•
|
a gain of
$14 million
at the Parent Company resulting from net gains on remeasurement of intercompany notes, partially offset by losses on foreign currency options.
|
There were no significant foreign currency transaction gains or losses for the
six months ended
June 30, 2016
.
The Company recognized net foreign currency transaction losses of
$8 million
for the
six months ended
June 30, 2015
, primarily due to:
|
•
|
a loss of
$19 million
at the Parent Company, which was primarily due to net remeasurement losses on intercompany notes, partially offset by gains on foreign currency options; and
|
|
•
|
a gain of
$17 million
in Argentina, which was primarily related to the favorable impact of foreign currency derivatives associated with government receivables at AES Argentina (an Argentine Peso functional currency subsidiary), partially offset by losses from the remeasurement of U.S. Dollar denominated debt, and losses from the remeasurement of local currency asset balances at Termoandes (a U.S. Dollar functional currency subsidiary).
|
Income tax benefit (expense)
Income tax benefit was
$7 million
for the three months ended
June 30, 2016
as compared to income tax expense of $
123 million
for the three months ended
June 30, 2015
. The Company’s effective tax rates were
32%
and
31%
for the three months ended
June 30, 2016
and
2015
, respectively.
The net
increase
in the effective tax rate for the three months ended
June 30, 2016
, compared to the same period in
2015
was principally due to the release of the valuation allowance at our Vietnam operating subsidiary during the second quarter of 2015, partially offset by tax benefit related to the devaluation of the Peso in certain of
27
our Mexican subsidiaries during the second quarter of 2016.
Income tax expense
decrease
d
$133 million
, or
60%
, to
$90 million
for the
six months ended
June 30, 2016
compared to
$223 million
for the
six months ended
June 30, 2015
. The Company’s effective tax rates were
60%
and
30%
for the
six months ended
June 30, 2016
and
2015
, respectively.
The net
increase
in the effective tax rate for the
six months ended
June 30, 2016
, compared to the same period in
2015
was principally due to the unfavorable impact of Chilean income tax law reform enacted during the first quarter of 2016 and the 2016 asset impairments recorded at Buffalo Gap II and DPL. See Note
13
—
Asset Impairment Expense
included in Item 1.—
Financial Statements
of this Form 10-Q for further information regarding the Buffalo Gap II and DPL asset impairments.
Our effective tax rate reflects the tax effect of significant operations outside the U.S. which are generally taxed at lower rates than the U.S. statutory rate of 35%. A future proportionate change in the composition of income before income taxes from foreign and domestic tax jurisdictions could impact our periodic effective tax rate.
Net equity in earnings of affiliates
Net equity in earnings of affiliates
increase
d
$6 million
to
$7 million
for the three months ended
June 30, 2016
compared to the three months ended
June 30, 2015
. The
increase
was primarily due to higher earnings at Guacolda.
Net equity in earnings of affiliates
decrease
d
$1 million
to
$14 million
for the
six months ended
June 30, 2016
compared to the
six months ended
June 30, 2015
. There were no significant changes in earnings at our equity method affiliates.
Net income attributable to noncontrolling interests
Net income attributable to NCI
decrease
d
$100 million
, or
51%
, to
$95 million
for the three months ended
June 30, 2016
. The
decrease
was primarily due to lower operating margin at Eletropaulo resulting from the reversal of a contingent regulatory liability in 2015 with no similar reversal in 2016.
Net income attributable to NCI
decrease
d
$264 million
, or
86%
, to
$43 million
for the
six months ended
June 30, 2016
. The
decrease
was primarily due to lower operating margin at Eletropaulo resulting from the the reversal of a contingent regulatory liability in 2015, impairment at Buffalo Gap II in 2016, and lower operating margin at Tietê resulting from lower rates.
Discontinued operations
Net losses from discontinued operations were
$379 million
and
$388 million
for the
three and six
months ended
June 30, 2016
, and
$10 million
and
$17 million
for the
three and six
months ended
June 30, 2015
, respectively. See Note
15
—
Discontinued Operations and Held-for-Sale Businesses
included in Item 1.—
Financial Statements
of this Form 10-Q for further information regarding the Sul discontinued operations.
Net (loss) income attributable to The AES Corporation
Net income attributable to The AES Corporation
decrease
d
$551 million
to a loss of
$482 million
in the three months ended
June 30, 2016
compared to income of
$69 million
in the three months ended
June 30, 2015
. Key drivers of the
decrease
were:
|
•
|
impairments at discontinued business;
|
|
•
|
lower operating margins at our Brazil and MCAC SBUs;
|
|
•
|
higher impairment expense on long lived assets;
|
|
•
|
higher interest expense;
|
|
•
|
unfavorable foreign currency exchange.
|
These
decrease
s were partially offset by:
|
•
|
lower losses on extinguishment of debt.
|
Net income attributable to The AES Corporation
decrease
d
$567 million
to a loss of
$356 million
in the
six months ended
June 30, 2016
compared to income of
$211 million
in the six months ended
June 30, 2015
. Key drivers of the
decrease
were:
|
•
|
impairments at discontinued business;
|
|
•
|
lower operating margins at our Brazil, US, MCAC and Europe SBUs;
|
28
|
•
|
higher impairment expense on long lived assets;
|
|
•
|
higher interest expense.
|
These
decrease
s were partially offset by:
|
•
|
higher gains on extinguishment of debt;
|
|
•
|
gain on sale of our interest in DPLER;
|
|
•
|
higher interest income.
|
SBU Performance Analysis
Non-GAAP Measures
Adjusted Operating Margin, Adjusted PTC, Adjusted EPS, and Proportional Free Cash Flow are non-GAAP supplemental measures that are used by management and external users of our consolidated financial statements such as investors, industry analysts and lenders. The Adjusted Operating Margin, Adjusted PTC, and Proportional Free Cash Flow by SBU for the three and
six months ended June 30, 2016
are shown below. The percentages represent the contribution by each SBU to the gross metric, excluding Corporate.
Three months ended June 30, 2016
:


Six months ended June 30, 2016
:
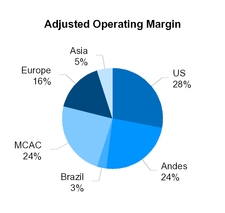


29
Adjusted Operating Margin


Operating Margin is defined as revenue less cost of sales. Cost of sales includes costs incurred directly by the businesses in the ordinary course of business. Examples include electricity and fuel purchases, O&M costs, depreciation and amortization expense, bad debt expense and recoveries, and general administrative and support costs (including employee-related costs directly associated with the operations of the business). Cost of sales also includes the gains or losses on derivatives (including embedded derivatives other than foreign currency embedded derivatives) associated with the purchase of electricity or fuel.
We define Adjusted Operating Margin as Operating Margin, adjusted for the impact of NCI, excluding unrealized gains or losses related to derivative transactions.
The GAAP measure most comparable to Adjusted Operating Margin is Operating Margin. We believe that Adjusted Operating Margin better reflects the underlying business performance of the Company. Factors in this determination include the impact of NCI, where AES consolidates the results of a subsidiary that is not wholly owned by the Company, as well as the variability due to unrealized derivatives gains or losses. Adjusted Operating Margin should not be construed as an alternative to Operating Margin, which is determined in accordance with GAAP.
Adjusted PTC and Adjusted EPS

30

We define Adjusted PTC as pretax income from continuing operations attributable to The AES Corporation excluding gains or losses of the consolidated entity due to (a) unrealized gains or losses related to derivative transactions, (b) unrealized foreign currency gains or losses, (c) gains or losses due to dispositions and acquisitions of business interests, (d) losses due to impairments, and (e) costs due to the early retirement of debt. Adjusted PTC also includes net equity in earnings of affiliates on an after-tax basis adjusted for the same gains or losses excluded from consolidated entities.
Adjusted PTC reflects the impact of NCI and excludes the items specified in the definition above. In addition to the revenue and cost of sales reflected in Operating Margin, Adjusted PTC includes the other components of our income statement, such as
general and administrative expense
in the corporate segment, as well as business development costs;
interest expense
and
interest income
;
other expense
and
other income
;
realized foreign currency transaction gains and losses
; and
net equity in earnings of affiliates
.
We define Adjusted EPS as diluted earnings per share from continuing operations excluding gains or losses of both consolidated entities and entities accounted for under the equity method due to (a) unrealized gains or losses related to derivative transactions, (b) unrealized foreign currency gains or losses, (c) gains or losses due to dispositions and acquisitions of business interests, (d) losses due to impairments, and (e) costs due to the early retirement of debt.
The GAAP measure most comparable to Adjusted PTC is
income from continuing operations attributable to The AES Corporation
. The GAAP measure most comparable to Adjusted EPS is diluted earnings per share from continuing operations. We believe that Adjusted PTC and Adjusted EPS better reflect the underlying business performance of the Company and are considered in the Company’s internal evaluation of financial performance. Factors in this determination include the variability due to unrealized gains or losses related to derivative transactions, unrealized foreign currency gains or losses, losses due to impairments and strategic decisions to dispose of or acquire business interests or retire debt, which affect results in a given period or periods. In addition, for Adjusted PTC, earnings before tax represents the business performance of the Company before the application of statutory income tax rates and tax adjustments, including the effects of tax planning, corresponding to the various jurisdictions in which the Company operates. Adjusted PTC and Adjusted EPS should not be construed as alternatives to income from continuing operations attributable to The AES Corporation and diluted earnings per share from continuing operations, which are determined in accordance with GAAP.
Proportional Free Cash Flow

31

Refer to Item 2.—
Management’s Discussion and Analysis of Financial Condition and Results of Operations—Capital Resources and Liquidity—Proportional Free Cash Flow (a non-GAAP measure)
for the discussion and reconciliation of Proportional Free Cash Flow to its nearest GAAP measure.
Reconciliations of Non-GAAP Measures
|
Adjusted Operating Margin (in millions)
|
Three Months Ended June 30,
|
Six Months Ended June 30,
|
|||||||||||||
|
2016
|
2015
|
2016
|
2015
|
||||||||||||
|
US SBU
|
$
|
114
|
|
$
|
117
|
|
$
|
218
|
|
$
|
292
|
|
|||
|
Andes SBU
|
94
|
|
90
|
|
182
|
|
189
|
|
|||||||
|
Brazil SBU
|
16
|
|
44
|
|
25
|
|
84
|
|
|||||||
|
MCAC SBU
|
108
|
|
136
|
|
183
|
|
214
|
|
|||||||
|
Europe SBU
|
44
|
|
57
|
|
120
|
|
154
|
|
|||||||
|
Asia SBU
|
21
|
|
22
|
|
39
|
|
33
|
|
|||||||
|
Corporate and Other
|
1
|
|
12
|
|
10
|
|
24
|
|
|||||||
|
Intersegment Eliminations
|
—
|
|
(1
|
)
|
5
|
|
(3
|
)
|
|||||||
|
Total Adjusted Operating Margin
|
398
|
|
477
|
|
782
|
|
987
|
|
|||||||
|
Noncontrolling Interests Adjustment
|
184
|
|
277
|
|
315
|
|
492
|
|
|||||||
|
Unrealized derivative gains (losses)
|
(8
|
)
|
1
|
|
(14
|
)
|
(3
|
)
|
|||||||
|
Operating Margin
|
$
|
574
|
|
$
|
755
|
|
$
|
1,083
|
|
$
|
1,476
|
|
|||
|
Adjusted PTC
(1)
(in millions)
|
Three Months Ended June 30,
|
Six Months Ended June 30,
|
|||||||||||||
|
2016
|
2015
|
2016
|
2015
|
||||||||||||
|
US SBU
|
$
|
58
|
|
$
|
56
|
|
$
|
143
|
|
$
|
162
|
|
|||
|
Andes SBU
|
84
|
|
81
|
|
145
|
|
172
|
|
|||||||
|
Brazil SBU
|
7
|
|
51
|
|
12
|
|
82
|
|
|||||||
|
MCAC SBU
|
75
|
|
106
|
|
123
|
|
156
|
|
|||||||
|
Europe SBU
|
34
|
|
41
|
|
103
|
|
126
|
|
|||||||
|
Asia SBU
|
26
|
|
30
|
|
48
|
|
42
|
|
|||||||
|
Corporate and Other
|
(124
|
)
|
(105
|
)
|
(229
|
)
|
(218
|
)
|
|||||||
|
Total Adjusted PTC
|
$
|
160
|
|
$
|
260
|
|
$
|
345
|
|
$
|
522
|
|
|||
|
Reconciliation to Income from continuing operations, net of tax, attributable to The AES Corporation:
|
|||||||||||||||
|
Non-GAAP Adjustments:
|
|||||||||||||||
|
Unrealized derivative (losses) gains
|
(30
|
)
|
2
|
|
4
|
|
17
|
|
|||||||
|
Unrealized foreign currency (losses) gains
|
(17
|
)
|
4
|
|
(9
|
)
|
(43
|
)
|
|||||||
|
Disposition/acquisition (losses) gains
|
(17
|
)
|
4
|
|
2
|
|
9
|
|
|||||||
|
Impairment losses
|
(235
|
)
|
(30
|
)
|
(285
|
)
|
(36
|
)
|
|||||||
|
Loss on extinguishment of debt
|
(6
|
)
|
(112
|
)
|
(6
|
)
|
(138
|
)
|
|||||||
|
Pretax contribution
|
(145
|
)
|
128
|
|
51
|
|
331
|
|
|||||||
|
Income tax benefit (expense) attributable to The AES Corporation
|
42
|
|
(49
|
)
|
(19
|
)
|
(103
|
)
|
|||||||
|
Income from continuing operations, net of tax, attributable to The AES Corporation
|
$
|
(103
|
)
|
|
$
|
79
|
|
|
$
|
32
|
|
$
|
228
|
|
|
_____________________________
|
(1)
|
Adjusted PTC for each segment includes the effect of intercompany transactions with other segments, except for interest, charges for certain management fees, and the write-off of intercompany balances.
|
Adjusted EPS
The Company reported a loss from continuing operations of $
0.16
per share
for the three months ended June 30, 2016
. For purposes of measuring diluted loss per share under GAAP, common stock equivalents were excluded from weighted-average shares as their inclusion would be anti-dilutive. However, for purposes of computing Adjusted EPS, the Company has included the impact of dilutive common stock equivalents. The table below reconciles the weighted-average shares used in GAAP diluted earnings per share to the weighted-average shares used in calculating the non-GAAP measure of Adjusted EPS.
32
|
Reconciliation of Denominator Used For Adjusted Earnings Per Share
|
Three Months Ended June 30, 2016
|
||||||||||
|
(in millions, except per share data)
|
Loss
|
Shares
|
$ per share
|
||||||||
|
GAAP DILUTED (LOSS) PER SHARE
|
|||||||||||
|
Loss from continuing operations attributable to The AES Corporation common stockholders
|
$
|
(103
|
)
|
659
|
|
$
|
(0.16
|
)
|
|||
|
EFFECT OF DILUTIVE SECURITIES
|
|||||||||||
|
Restricted stock units
|
—
|
|
3
|
|
—
|
|
|||||
|
NON-GAAP DILUTED (LOSS) PER SHARE
|
$
|
(103
|
)
|
662
|
|
$
|
(0.16
|
)
|
|||
|
Adjusted EPS
|
Three Months Ended June 30,
|
Six Months Ended June 30,
|
||||||||||||||
|
2016
|
2015
|
2016
|
2015
|
|||||||||||||
|
Diluted earnings per share from continuing operations
|
$
|
(0.16
|
)
|
$
|
0.11
|
|
$
|
0.05
|
|
$
|
0.33
|
|
||||
|
Unrealized derivative losses (gains)
|
0.04
|
|
—
|
|
—
|
|
(0.02
|
)
|
||||||||
|
Unrealized foreign currency transaction losses
|
0.02
|
|
—
|
|
—
|
|
0.06
|
|
||||||||
|
Disposition/acquisition losses (gains)
|
0.03
|
|
(6)
|
(0.01
|
)
|
—
|
|
(7)
|
(0.01
|
)
|
||||||
|
Impairment losses
|
0.36
|
|
(8)
|
0.04
|
|
(9)
|
0.43
|
|
(10)
|
0.05
|
|
(9)
|
||||
|
Loss on extinguishment of debt
|
0.01
|
|
|
0.16
|
|
(11)
|
0.01
|
|
|
0.20
|
|
(12)
|
||||
|
Less: Net income tax benefit
(1) (2) (3) (4) (5)
|
(0.13
|
)
|
(0.04
|
)
|
(0.17
|
)
|
(0.09
|
)
|
||||||||
|
Adjusted EPS
|
$
|
0.17
|
|
$
|
0.26
|
|
$
|
0.32
|
|
$
|
0.52
|
|
||||
_____________________________
|
(1)
|
The per share income tax benefit (expense) associated with unrealized derivative (gains) losses were
$0.01
and
$0.00
in the three months ended
June 30, 2016
and
2015
, and
$0.00
and
$0.00
in the six months ended
June 30, 2016
and
2015
, respectively.
|
|
(2)
|
The per share income tax benefit (expense) associated with unrealized foreign currency transaction losses were
$0.01
and
$(0.01)
in the three months ended
June 30, 2016
and
2015
, and
$0.00
and
$0.03
in the six months ended
June 30, 2016
and
2015
, respectively.
|
|
(3)
|
The per share income tax benefit (expense) associated with disposition/acquisition (gains) losses were
$0.00
and
$0.00
in the three months ended
June 30, 2016
and
2015
, and
$(0.01)
and
$0.00
in the six months ended
June 30, 2016
and
2015
, respectively.
|
|
(4)
|
The per share income tax benefit (expense) associated with impairment losses were
$0.11
and
$0.00
in the three months ended
June 30, 2016
and
2015
, and
$0.18
and
$0.00
in the six months ended
June 30, 2016
and
2015
, respectively.
|
|
(5)
|
The per share income tax benefit (expense) associated with loss on extinguishment of debt were
$0.00
and
$0.05
in the three months ended
June 30, 2016
and
2015
, and
$0.00
and
$0.06
in the six months ended
June 30, 2016
and
2015
, respectively.
|
|
(6)
|
Amount primarily relates to the loss from the deconsolidation of UK Wind of
$20 million
, or
$0.03
per share.
|
|
(7)
|
Amount primarily relates to the loss from the deconsolidation of UK Wind of
$20 million
, or
$0.03
per share; and the gain from the sale of DPLER of
$22 million
, or $0.03 per share.
|
|
(8)
|
Amount primarily relates to the asset impairment at DPL of
$235 million
, or
$0.36
per share.
|
|
(9)
|
Amount primarily relates to the asset impairment at UK Wind of
$37 million
(
$30 million
or
$0.04
per share, net of NCI).
|
|
(10)
|
Amount primarily relates to the asset impairment at DPL of
$235 million
,or
$0.36
per share; and at Buffalo Gap II of
$159 million
(
$49 million
, or
$0.07
per share, net of NCI).
|
|
(11)
|
Amount primarily relates to the loss on early retirement of debt at the Parent Company of
$85 million
, or
$0.12
per share; and at IPL of
$19 million
(
$15 million
, or
$0.02
per share, net of NCI).
|
|
(12)
|
Amount primarily relates to the loss on early retirement of debt at the Parent Company of
$111 million
, or
$0.16
per share; and at IPL of
$19 million
(
$15 million
, or
$0.02
per share, net of NCI).
|
US SBU
The following table summarizes Operating Margin, Adjusted Operating Margin, Adjusted PTC, and Proportional Free Cash Flow (in millions) for our US SBU for the periods indicated:
|
Three Months Ended June 30,
|
Six Months Ended June 30,
|
||||||||||||||||||||||||||||
|
2016
|
2015
|
$ Change
|
% Change
|
2016
|
2015
|
$ Change
|
% Change
|
||||||||||||||||||||||
|
Operating Margin
|
$
|
133
|
|
$
|
125
|
|
$
|
8
|
|
6
|
%
|
$
|
247
|
|
$
|
298
|
|
$
|
(51
|
)
|
-17
|
%
|
|||||||
|
Noncontrolling Interests Adjustment
|
(19
|
)
|
(8
|
)
|
(33
|
)
|
(10
|
)
|
|||||||||||||||||||||
|
Derivatives Adjustment
|
—
|
|
—
|
|
4
|
|
4
|
|
|||||||||||||||||||||
|
Adjusted Operating Margin
|
$
|
114
|
|
$
|
117
|
|
$
|
(3
|
)
|
-3
|
%
|
$
|
218
|
|
$
|
292
|
|
$
|
(74
|
)
|
-25
|
%
|
|||||||
|
Adjusted PTC
|
$
|
58
|
|
$
|
56
|
|
$
|
2
|
|
4
|
%
|
$
|
143
|
|
$
|
162
|
|
$
|
(19
|
)
|
-12
|
%
|
|||||||
|
Proportional Free Cash Flow
|
$
|
117
|
|
$
|
104
|
|
$
|
13
|
|
13
|
%
|
$
|
250
|
|
$
|
259
|
|
$
|
(9
|
)
|
-3
|
%
|
|||||||
33
Operating Margin for the three months ended
June 30, 2016
increase
d by
$8 million
, or
6%
, which was driven primarily by the following (in millions):
|
IPL
|
|||
|
Higher retail margin driven by environmental revenues and higher rates due to a new rate order
|
$
|
10
|
|
|
Change in accrual resulting from the implementation of new base rates
|
18
|
|
|
|
Total IPL Increase
|
28
|
|
|
|
US Generation
|
|||
|
Southland due to lower availability during peak periods and higher depreciation expense due to a change in useful lives
|
(5
|
)
|
|
|
Impact from sale of Armenia Mountain in July 2015
|
(4
|
)
|
|
|
Hawaii due to better availability primarily due to major outages in 2015
|
8
|
|
|
|
Other
|
(4
|
)
|
|
|
Total US Generation Decrease
|
(5
|
)
|
|
|
DPL
|
|||
|
Impact of lower wholesale prices and completion of DP&L’s required transition to a competitive-bid market
|
(17
|
)
|
|
|
Decrease in RTO capacity and other revenues, primarily due to lower capacity cleared in the auction
|
(4
|
)
|
|
|
Decrease in generating facility maintenance and other expenses
|
6
|
|
|
|
Total DPL Decrease
|
(15
|
)
|
|
|
Total US SBU Operating Margin Increase
|
$
|
8
|
|
Adjusted Operating Margin
decrease
d by
$3 million
for the US SBU due to the drivers above, adjusted for NCI and excluding unrealized gains and losses on derivatives. AES owns 100% of its businesses in the U.S. with the exception of IPL, which is wholly owned by its indirect subsidiary IPALCO. As of
June 30, 2016
, CDPQ owns a combined direct and indirect interest in IPALCO of 30%.
Adjusted PTC
increase
d by
$2 million
, driven by lower interest expense at DPL and IPL, offset by the
$3 million
decrease
in Adjusted Operating Margin described above and a decrease in the Company’s share of earnings under the HLBV accounting allocation at Buffalo Gap.
Proportional Free Cash Flow
increase
d by
$13 million
, primarily driven by lower proportional interest payments of $19 million due to the timing of interest payments and lower interest rates on new bonds issued by IPL in 2016, which was partially offset by the
$3 million
decrease
in Adjusted Operating Margin as described above.
Operating Margin for the
six months ended
June 30, 2016
decrease
d by
$51 million
, or
17%
, which was driven primarily by the following (in millions):
|
DPL
|
|||
|
Impact of lower wholesale prices and completion of DP&L’s required transition to a competitive-bid market
|
$
|
(46
|
)
|
|
Decrease in RTO capacity and other revenues, primarily due to lower capacity cleared in the auction
|
(10
|
)
|
|
|
Other
|
(2
|
)
|
|
|
Total DPL Decrease
|
(58
|
)
|
|
|
US Generation
|
|||
|
Impact from sale of Armenia Mountain in July 2015
|
(10
|
)
|
|
|
Southland primarily an increase in depreciation expense due to a change in estimated useful lives of the plants
|
(9
|
)
|
|
|
Hawaii due to better availability primarily due to major outages in 2015
|
10
|
|
|
|
Other
|
(6
|
)
|
|
|
Total US Generation Decrease
|
(15
|
)
|
|
|
IPL
|
|||
|
Higher retail margin driven by environmental revenues and higher rates due to a new rate order
|
10
|
|
|
|
Change in accrual resulting from the implementation of new rates
|
18
|
|
|
|
Unfavorable weather impact on retail margin
|
(6
|
)
|
|
|
Total IPL Increase
|
22
|
|
|
|
Total US SBU Operating Margin Decrease
|
$
|
(51
|
)
|
Adjusted Operating Margin
decrease
d by
$74 million
for the US SBU due to the drivers above, adjusted for NCI and excluding unrealized gains and losses on derivatives. AES owns 100% of its businesses in the U.S. with the exception of IPL, which is wholly owned by its indirect subsidiary IPALCO. As of
June 30, 2016
, CDPQ owns a combined direct and indirect interest in IPALCO of 30%.
Adjusted PTC
decrease
d by
$19 million
, driven by the
$74 million
decrease
in Adjusted Operating Margin described above, partially offset by a gain on contract termination at DP&L and lower interest expense at DPL and IPL in part due to the sell-down impacts as discussed above.
Proportional Free Cash Flow
decrease
d by
$9 million
, primarily driven by the
$74 million
decrease
in Adjusted Operating Margin as described above, which was partially offset by a $27 million decrease in coal purchases at IPL due to the ongoing conversion of two coal-fired plants to natural gas and a build-up of inventory in December 2015 due to mild winter weather, a net increase of $17 million in settlements of accounts receivables primarily due to the
34
sale of DPLER in 2016, lower coal purchases of $9 million at DPL from inventory optimization efforts, and lower interest payments of $15 million due to the timing of interest payments and lower interest rates on new bonds issued by IPL in 2016.
ANDES SBU
The following table summarizes Operating Margin, Adjusted Operating Margin, Adjusted Proportional Free Cash Flow (in millions) for our Andes SBU for the periods indicated:
|
Three Months Ended June 30,
|
Six Months Ended June 30,
|
||||||||||||||||||||||||||||
|
2016
|
2015
|
$ Change
|
% Change
|
2016
|
2015
|
$ Change
|
% Change
|
||||||||||||||||||||||
|
Operating Margin
|
$
|
140
|
|
$
|
119
|
|
$
|
21
|
|
18
|
%
|
$
|
263
|
|
$
|
250
|
|
$
|
13
|
|
5
|
%
|
|||||||
|
Noncontrolling Interests Adjustment
|
(46
|
)
|
(29
|
)
|
(81
|
)
|
(61
|
)
|
|||||||||||||||||||||
|
Adjusted Operating Margin
|
$
|
94
|
|
$
|
90
|
|
$
|
4
|
|
4
|
%
|
$
|
182
|
|
$
|
189
|
|
$
|
(7
|
)
|
-4
|
%
|
|||||||
|
Adjusted PTC
|
$
|
84
|
|
$
|
81
|
|
$
|
3
|
|
4
|
%
|
$
|
145
|
|
$
|
172
|
|
$
|
(27
|
)
|
-16
|
%
|
|||||||
|
Proportional Free Cash Flow
|
$
|
56
|
|
$
|
(20
|
)
|
$
|
76
|
|
NM
|
|
$
|
60
|
|
$
|
(3
|
)
|
$
|
63
|
|
NM
|
|
|||||||
Including
unfavorable
FX and remeasurement impacts of
$12 million
, Operating Margin for the three months ended
June 30, 2016
increase
d by
$21 million
, or
18%
, which was driven primarily by the following (in millions):
|
Gener
|
|||
|
Lower spot prices on energy and coal purchases
|
$
|
22
|
|
|
Higher spot sales driven by better availability and higher contract sales, partially offset by termination of Nueva Renca tolling agreement.
|
11
|
|
|
|
Lower fixed costs, mainly associated with lower maintenance expenses and lower salaries
|
11
|
|
|
|
Other
|
2
|
|
|
|
Total Gener Increase
|
46
|
|
|
|
Argentina
|
|||
|
Higher fixed costs, mainly driven by higher inflation and maintenance costs
|
(13
|
)
|
|
|
Lower availability mainly associated with planned major maintenance
|
(12
|
)
|
|
|
Unfavorable FX impact
|
(3
|
)
|
|
|
Higher rates driven by annual price review
|
12
|
|
|
|
Other
|
1
|
|
|
|
Total Argentina Decrease
|
(15
|
)
|
|
|
Chivor
|
|||
|
Unfavorable FX impact
|
(8
|
)
|
|
|
Other
|
(2
|
)
|
|
|
Total Chivor Decrease
|
(10
|
)
|
|
|
Total Andes SBU Operating Margin Increase
|
$
|
21
|
|
Adjusted Operating Margin
increase
d by
$4 million
due to the drivers above, adjusted for the impact of NCI. AES owned 71% of Gener and Chivor as of
June 30, 2015
and 67% as of
June 30, 2016
, and 100% of AES Argentina.
Adjusted PTC
increase
d by
$3 million
, driven by the
increase
of
$4 million
in Adjusted Operating Margin described above.
Proportional Free Cash Flow
increase
d by
$76 million
, primarily driven by collections of $27 million from CAMMESA for increases in tariffs and non-recurring remuneration of maintenance costs, $16 million in lower income tax payments in Chile and Argentina, a decrease in fuel purchases of $12 million in Argentina, a $10 million decrease in interest payments primarily associated with a change in the repayment schedule after the Ventanas debt refinancing in July 2015 and the
$4 million
increase
in Adjusted Operating Margin as described above. These positive impacts were partially offset by $17 million in higher income tax payments in Colombia as a consequence of the increase in 2015 taxable income.
35
Including
unfavorable
FX and remeasurement impacts of
$28 million
, Operating Margin for the
six months ended
June 30, 2016
increase
d by
$13 million
, or
5%
, which was driven primarily by the following (in millions):
|
Gener
|
|||
|
Higher spot sales driven by better availability and higher contract sales, partially offset by decrease in margin from Nueva Renca tolling agreement in 2015
|
$
|
36
|
|
|
Lower fixed costs mainly associated with lower maintenance expenses and lower salaries
|
19
|
|
|
|
Lower spot prices on energy and coal purchases, partially offset by impact of lower spot prices on sales in the SIC
|
4
|
|
|
|
Higher depreciation expenses related to capitalization of environmental equipment and Cochrane transmission line
|
(4
|
)
|
|
|
Other
|
3
|
|
|
|
Total Gener Increase
|
58
|
|
|
|
Argentina
|
|||
|
Higher fixed costs, mainly driven by higher inflation and planned major maintenance costs
|
(32
|
)
|
|
|
Lower availability mainly associated with planned major maintenance
|
(12
|
)
|
|
|
Unfavorable FX impact
|
(12
|
)
|
|
|
Higher rates driven by annual price review
|
40
|
|
|
|
Other
|
(1
|
)
|
|
|
Total Argentina Decrease
|
(17
|
)
|
|
|
Chivor
|
|||
|
Unfavorable FX impact
|
(16
|
)
|
|
|
Lower margin on contracted energy associated a decrease in volume and prices
|
(16
|
)
|
|
|
Higher margin on spot sales, partially offset by lower ancillary services
|
3
|
|
|
|
Other
|
1
|
|
|
|
Total Chivor Decrease
|
(28
|
)
|
|
|
Total Andes SBU Operating Margin Increase
|
$
|
13
|
|
Adjusted Operating Margin
decrease
d by
$7 million
due to the drivers above, adjusted for the impact of NCI. AES owned 71% of Gener and Chivor as of
June 30, 2015
and 67% as of
June 30, 2016
, and 100% of AES Argentina.
Adjusted PTC
decrease
d by
$27 million
, driven by the
decrease
of
$7 million
in Adjusted Operating Margin described above, as well as higher realized FX losses associated with the sale of short term investments at Termoandes and negative results on settlement of FX forwards at Gener and higher interest expenses mainly associated with tax payment programs in Argentina. These results were partially offset by lower interest expenses at Gener due to the sell down in 2015.
Proportional Free Cash Flow
increase
d by
$63 million
, primarily driven by collections of $12 million from CAMMESA associated with non-recurring remuneration of maintenance costs, $27 million at Chivor associated with collections from prior periods, $47 million of lower payments for fuel, a decrease of $12 million in proportional maintenance and non-recoverable environmental capital expenditures due to lower expenditures on emissions control equipment at Chile, and lower interest payments of $8 million associated with the Ventanas debt refinancing in July 2015. These positive impacts were partially offset by higher net tax payments of $40 million primarily related to withholding taxes paid on Chilean distributions to AES affiliates and higher taxable income in Colombia, $10 million of higher insurance payments, and the
$7 million
decrease
in Adjusted Operating Margin as described above.
BRAZIL SBU
The following table summarizes Operating Margin, Adjusted Operating Margin, Adjusted PTC, and Proportional Free Cash Flow (in millions) for our Brazil SBU for the periods indicated:
|
Three Months Ended June 30,
|
Six Months Ended June 30,
|
||||||||||||||||||||||||||||
|
2016
|
2015
|
$ Change
|
% Change
|
2016
|
2015
|
$ Change
|
% Change
|
||||||||||||||||||||||
|
Operating Margin
|
$
|
78
|
|
$
|
224
|
|
$
|
(146
|
)
|
-65
|
%
|
$
|
121
|
|
$
|
401
|
|
$
|
(280
|
)
|
-70
|
%
|
|||||||
|
Noncontrolling Interests Adjustment
|
(62
|
)
|
(180
|
)
|
(96
|
)
|
(317
|
)
|
|||||||||||||||||||||
|
Adjusted Operating Margin
|
$
|
16
|
|
$
|
44
|
|
$
|
(28
|
)
|
-64
|
%
|
$
|
25
|
|
$
|
84
|
|
$
|
(59
|
)
|
-70
|
%
|
|||||||
|
Adjusted PTC
|
$
|
7
|
|
$
|
51
|
|
$
|
(44
|
)
|
-86
|
%
|
$
|
12
|
|
$
|
82
|
|
$
|
(70
|
)
|
-85
|
%
|
|||||||
|
Proportional Free Cash Flow
|
$
|
48
|
|
$
|
(20
|
)
|
$
|
68
|
|
NM
|
|
$
|
82
|
|
$
|
(67
|
)
|
$
|
149
|
|
NM
|
|
|||||||
36
Including
unfavorable
FX impacts of
$11 million
, Operating Margin for the three months ended
June 30, 2016
decrease
d by
$146 million
, or
65%
, which was driven primarily by the following (in millions):
|
Eletropaulo
|
|||
|
Negative impact of reversal of contingent regulatory liability in 2015
|
$
|
(97
|
)
|
|
Higher fixed costs driven by salaries and wages and higher bad debt expense
|
(49
|
)
|
|
|
Lower demand mainly due to economic decline
|
(22
|
)
|
|
|
Higher tariffs
|
54
|
|
|
|
Other
|
(4
|
)
|
|
|
Total Eletropaulo Decrease
|
(118
|
)
|
|
|
Tietê
|
|||
|
Lower rates for energy sold under new contracts
|
(19
|
)
|
|
|
Unfavorable FX impacts
|
(9
|
)
|
|
|
Lower purchase spot prices/volume
|
12
|
|
|
|
Total Tietê Decrease
|
(16
|
)
|
|
|
Uruguaiana
|
|||
|
No operation in 2016 compared to 61 days of operation in 2015
|
(12
|
)
|
|
|
Total Uruguaiana Decrease
|
(12
|
)
|
|
|
Total Brazil SBU Operating Margin Decrease
|
$
|
(146
|
)
|
Adjusted Operating Margin
decrease
d by
$28 million
, primarily due to the drivers discussed above, adjusted for the impact of NCI. As of
June 30, 2016
, AES owns 16% of Eletropaulo, 46% of Uruguaiana and 24% of Tietê.
Adjusted PTC
decrease
d by
$44 million
, driven by the
decrease
of
$28 million
in Adjusted Operating Margin as described above, as well as higher interest expense of $10 million related to the reversal of a contingent regulatory liability at Eletropaulo in 2015.
Proportional Free Cash Flow
increase
d by
$68 million
, primarily driven by favorable timing of $96 million in net collections of higher costs deferred in the prior year at Eletropaulo and Sul as a result of unfavorable hydrology in prior periods, favorable timing of $57 million in collections on current year energy sales, lower interest payments of $13 million at Sul due to its debt restructuring in 2016, and the positive impact of Sul’s $16 million in Operating Margin included in operating cash flows but classified as a discontinued operation on the income statement. These positive impacts were offset by the
$28
million
decrease
in Adjusted Operating Margin as described above (excluding the $16 million non-cash impact included in Adjusted Operating Margin related to the reversal of a contingent regulatory liability at Eletropaulo in 2015), and unfavorable timing of $95 million of payments for energy purchases and regulatory charges.
Including
unfavorable
FX impacts of
$21 million
, Operating Margin for the
six months ended
June 30, 2016
decrease
d by
$280 million
, or
70%
, which was driven primarily by the following (in millions):
|
Eletropaulo
|
|||
|
Negative impact of reversal of contingent regulatory liability in 2015
|
$
|
(97
|
)
|
|
Higher fixed costs driven by salaries and wages, higher bad debt expense and penalties
|
(91
|
)
|
|
|
Lower demand mainly due to economic decline
|
(35
|
)
|
|
|
Higher tariffs
|
70
|
|
|
|
Other
|
(2
|
)
|
|
|
Total Eletropaulo Decrease
|
(155
|
)
|
|
|
Tietê
|
|||
|
Lower rates for energy sold under new contracts
|
(88
|
)
|
|
|
Unfavorable FX impacts
|
(24
|
)
|
|
|
Lower purchase spot prices/volume
|
10
|
|
|
|
Other
|
(4
|
)
|
|
|
Total Tietê Decrease
|
(106
|
)
|
|
|
Uruguaiana
|
|||
|
No operation in 2016 compared to 108 days of operation in 2015
|
(19
|
)
|
|
|
Total Uruguaiana Decrease
|
(19
|
)
|
|
|
Total Brazil SBU Operating Margin Decrease
|
$
|
(280
|
)
|
Adjusted Operating Margin
decrease
d by
$59 million
, primarily due to the drivers discussed above, adjusted for the impact of NCI. As of
June 30, 2016
, AES owns 16% of Eletropaulo, 46% of Uruguaiana and 24% of Tietê.
Adjusted PTC
decrease
d by
$70 million
, driven by the
decrease
of
$59 million
in Adjusted Operating Margin as described above, as well as higher interest expense of $10 million related to the reversal of a contingent regulatory liability at Eletropaulo in 2015.
Proportional Free Cash Flow
increase
d by
$149 million
, primarily driven by favorable timing of $279 million in net collections of higher costs deferred in the prior year at Eletropaulo and Sul as a result of unfavorable hydrology in prior periods, favorable timing of $99 million in collections on current year energy sales, lower energy purchases
37
of $26 million at Tietê due to favorable hydrology, lower interest payments of $16 million at Sul due to its debt restructuring in 2016, and the positive impact of Sul’s $11 million in Operating Margin included in operating cash flows but classified as a discontinued operation on the income statement. These favorable impacts were offset by the
$59 million
decrease
in Adjusted Operating Margin as described above (excluding the $16 million non-cash impact included in Adjusted Operating Margin related to the reversal of a contingent regulatory liability at Eletropaulo in 2015), and unfavorable timing of $229 million in payments for energy purchases and regulatory charges at Eletropaulo and Sul.
MCAC SBU
The following table summarizes Operating Margin, Adjusted Operating Margin, Adjusted PTC, and Proportional Free Cash Flow (in millions) for our MCAC SBU for the periods indicated:
|
Three Months Ended June 30,
|
Six Months Ended June 30,
|
||||||||||||||||||||||||||||
|
2016
|
2015
|
$ Change
|
% Change
|
2016
|
2015
|
$ Change
|
% Change
|
||||||||||||||||||||||
|
Operating Margin
|
$
|
134
|
|
$
|
165
|
|
$
|
(31
|
)
|
-19
|
%
|
$
|
230
|
|
$
|
268
|
|
$
|
(38
|
)
|
-14
|
%
|
|||||||
|
Noncontrolling Interests Adjustment
|
(24
|
)
|
(29
|
)
|
(46
|
)
|
(52
|
)
|
|||||||||||||||||||||
|
Derivatives Adjustment
|
(2
|
)
|
—
|
|
(1
|
)
|
(2
|
)
|
|||||||||||||||||||||
|
Adjusted Operating Margin
|
$
|
108
|
|
$
|
136
|
|
$
|
(28
|
)
|
-21
|
%
|
$
|
183
|
|
$
|
214
|
|
$
|
(31
|
)
|
-14
|
%
|
|||||||
|
Adjusted PTC
|
$
|
75
|
|
$
|
106
|
|
$
|
(31
|
)
|
-29
|
%
|
$
|
123
|
|
$
|
156
|
|
$
|
(33
|
)
|
-21
|
%
|
|||||||
|
Proportional Free Cash Flow
|
$
|
(6
|
)
|
$
|
18
|
|
$
|
(24
|
)
|
NM
|
|
$
|
7
|
|
$
|
132
|
|
$
|
(125
|
)
|
-95
|
%
|
|||||||
Operating Margin for the three months ended
June 30, 2016
decrease
d by
$31 million
, or
19%
, which was driven primarily by the following (in millions):
|
Panama
|
|||
|
Lower generation and higher energy purchases driven by weaker hydrological conditions
|
$
|
(6
|
)
|
|
Expenses related to the construction in progress of a natural gas generation plant and a liquefied natural gas terminal
|
(5
|
)
|
|
|
Total Panama Decrease
|
(11
|
)
|
|
|
Dominican Republic
|
|
||
|
Lower fuel costs due to timing of cargoes
|
6
|
|
|
|
Lower gas sales to third parties due to lower demand
|
(7
|
)
|
|
|
Lower availability
|
(4
|
)
|
|
|
Other
|
(5
|
)
|
|
|
Total Dominican Republic Decrease
|
(10
|
)
|
|
|
Puerto Rico
|
|||
|
Residual waste disposal expense adjustment
|
(3
|
)
|
|
|
Lower availability
|
(2
|
)
|
|
|
Total Puerto Rico Decrease
|
(5
|
)
|
|
|
Other Business Drivers
|
(5
|
)
|
|
|
Total MCAC SBU Operating Margin Decrease
|
$
|
(31
|
)
|
Adjusted Operating Margin
decrease
d by
$28 million
due to the drivers above, adjusted for the impact of NCI and excluding unrealized gains and losses on derivatives. As of
June 30, 2016
, AES owns 90% of Changuinola and 49% of its other generation facilities in Panama, 90% of Andres and Los Mina (92% in 2015) and 45% of Itabo (46% in 2015) in the Dominican Republic, 99% of TEG/TEP and 55% of Merida in Mexico, and a weighted average of 77% of its businesses in El Salvador.
Adjusted PTC
decrease
d by
$31 million
, driven by the
decrease
of
$28 million
in Adjusted Operating Margin as described above.
Proportional Free Cash Flow
decrease
d by $
24 million
, primarily driven by the
$28 million
decrease
in Adjusted Operating Margin described above, $21 million from unfavorable timing of collections and lower sales in the Puerto Rico, and $15 million from unfavorable timing of coal payments in Puerto Rico. These decreases were partially offset in the Dominican Republic by $14 million of lower tax payments due to the timing of tax filings, $12 million of lower LNG payments, and $8 million of lower interest payments.
38
Operating Margin for the
six months ended
June 30, 2016
decrease
d by
$38 million
, or
14%
, which was driven primarily by the following (in millions):
|
Mexico
|
|||
|
Lower availability and related costs
|
$
|
(11
|
)
|
|
Asset retirement obligation recognized in the first quarter of 2016
|
(4
|
)
|
|
|
Other
|
(2
|
)
|
|
|
Total Mexico Decrease
|
(17
|
)
|
|
|
Panama
|
|||
|
Lower generation and higher energy purchases driven by weaker hydrological conditions
|
(15
|
)
|
|
|
Expenses related to the construction in progress of a natural gas generation plant and a liquefied natural gas terminal
|
(9
|
)
|
|
|
Commencement of power barge operations at the end of March 2015
|
10
|
|
|
|
Other
|
2
|
|
|
|
Total Panama Decrease
|
(12
|
)
|
|
|
Puerto Rico
|
|||
|
Lower availability
|
(7
|
)
|
|
|
Other
|
(1
|
)
|
|
|
Total Puerto Rico Decrease
|
(8
|
)
|
|
|
El Salvador
|
|||
|
Lower energy sales margin
|
(10
|
)
|
|
|
Lower energy losses due to lower prices
|
5
|
|
|
|
Other
|
(1
|
)
|
|
|
Total El Salvador Decrease
|
(6
|
)
|
|
|
Dominican Republic
|
|||
|
Lower fuel costs due to timing of cargoes
|
23
|
|
|
|
Lower gas sales to third parties due to lower demand
|
(12
|
)
|
|
|
Lower frequency regulation due to changes in regulations
|
(6
|
)
|
|
|
Other
|
(1
|
)
|
|
|
Total Dominican Republic Increase
|
4
|
|
|
|
Other business drivers
|
1
|
|
|
|
Total MCAC SBU Operating Margin Decrease
|
$
|
(38
|
)
|
Adjusted Operating Margin
decrease
d by
$31 million
due to the drivers above, adjusted for the impact of NCI and excluding unrealized gains and losses on derivatives. As of
June 30, 2016
, AES owns 90% of Changuinola and 49% of its other generation facilities in Panama, 90% of Andres and Los Mina (92% in 2015) and 45% of Itabo (46% in 2015) in the Dominican Republic, 99% of TEG/TEP and 55% of Merida in Mexico, and a weighted average of 77% of its businesses in El Salvador.
Adjusted PTC
decrease
d by
$33 million
, driven by the
decrease
of
$31 million
in Adjusted Operating Margin as described above.
Proportional Free Cash Flow
decrease
d by
$125 million
, primarily driven by the
$31 million
decrease
in Adjusted Operating Margin described above, $34 million from unfavorable timing of collections and lower sales in the Dominican Republic, $13 million of higher tax payments in the Dominican Republic primarily related to withholding taxes paid on distributions to AES affiliates, and $46 million of lower collections in Puerto Rico due to lower sales.
EUROPE SBU
The following table summarizes Operating Margin, Adjusted Operating Margin, Adjusted PTC, and Proportional Free Cash Flow (in millions) for our Europe SBU for the periods indicated:
|
Three Months Ended June 30,
|
Six Months Ended June 30,
|
||||||||||||||||||||||||||||
|
2016
|
2015
|
$ Change
|
% Change
|
2016
|
2015
|
$ Change
|
% Change
|
||||||||||||||||||||||
|
Operating Margin
|
$
|
47
|
|
$
|
64
|
|
$
|
(17
|
)
|
-27
|
%
|
$
|
130
|
|
$
|
167
|
|
$
|
(37
|
)
|
-22
|
%
|
|||||||
|
Noncontrolling Interests Adjustment
|
(8
|
)
|
(6
|
)
|
(15
|
)
|
(14
|
)
|
|||||||||||||||||||||
|
Derivatives Adjustment
|
5
|
|
(1
|
)
|
5
|
|
1
|
|
|||||||||||||||||||||
|
Adjusted Operating Margin
|
$
|
44
|
|
$
|
57
|
|
$
|
(13
|
)
|
-23
|
%
|
$
|
120
|
|
$
|
154
|
|
$
|
(34
|
)
|
-22
|
%
|
|||||||
|
Adjusted PTC
|
$
|
34
|
|
$
|
41
|
|
$
|
(7
|
)
|
-17
|
%
|
$
|
103
|
|
$
|
126
|
|
$
|
(23
|
)
|
-18
|
%
|
|||||||
|
Proportional Free Cash Flow
|
$
|
343
|
|
$
|
35
|
|
$
|
308
|
|
NM
|
|
$
|
419
|
|
$
|
174
|
|
$
|
245
|
|
NM
|
|
|||||||
Including
unfavorable
FX impacts of
$9 million
, Operating Margin for the three months ended
June 30, 2016
decrease
d by
$17 million
, or
27%
, which was driven primarily by the following (in millions):
39
|
Kazakhstan
|
|||
|
FX impact
|
$
|
(10
|
)
|
|
Other
|
(4
|
)
|
|
|
Total Kazakhstan Decrease
|
(14
|
)
|
|
|
Ballylumford
|
|||
|
Lower plant capacity resulting from the retirement of one generation facility
|
(4
|
)
|
|
|
Higher fixed costs
|
(2
|
)
|
|
|
Higher contracted revenues partially offset by lower regulated prices
|
3
|
|
|
|
Other
|
(3
|
)
|
|
|
Total Ballylumford Decrease
|
(6
|
)
|
|
|
Kilroot
|
|||
|
Higher availability and plant dispatch due to lower planned outages
|
13
|
|
|
|
Lower depreciation due to impairment in prior year
|
5
|
|
|
|
Lower coal/gas spread, lower hedge income as well as unfavorable FX impact
|
(12
|
)
|
|
|
Total Kilroot Increase
|
6
|
|
|
|
Maritza
|
|||
|
Lower contracted capacity prices due to PPA negotiation
|
(5
|
)
|
|
|
Other
|
1
|
|
|
|
Total Maritza Decrease
|
(4
|
)
|
|
|
Other business drivers
|
1
|
|
|
|
Total Europe SBU Operating Margin Decrease
|
$
|
(17
|
)
|
Adjusted Operating Margin
decrease
d by
$13 million
due to the drivers above, adjusted for NCI and excluding unrealized gains and losses on derivatives. As of
June 30, 2016
, AES owns 89% of Kavarna in Bulgaria, and 37% and 36% respectively, of the Amman East and IPP4 projects in Jordan.
Adjusted PTC
decrease
d by
$7 million
, driven by the
decrease
of
$13 million
in Adjusted Operating Margin described above,
partially offset by lower interest expense in Bulgaria due to less debt and a non-recurring provision in Kazakhstan in 2015.
Proportional Free Cash Flow
increase
d by
$308 million
, primarily driven by $306 million of increased collections at Maritza from NEK, net of payments to the fuel supplier (MMI), and lower capital expenditures in Kazakhstan and Ballylumford. These favorable increases were partially offset by the
$13 million
decrease
in Adjusted Operating Margin as described above.
Including
unfavorable
FX impacts of
$23 million
, Operating Margin for the
six months ended
June 30, 2016
decrease
d by
$37 million
, or
22%
, which was driven primarily by the following (in millions):
|
Kazakhstan
|
|||
|
FX impact
|
$
|
(22
|
)
|
|
Other
|
(1
|
)
|
|
|
Total Kazakhstan Decrease
|
(23
|
)
|
|
|
Ballylumford
|
|||
|
Lower plant capacity resulting from the retirement of one generation facility
|
(10
|
)
|
|
|
Higher contracted revenues partially offset by lower regulated prices
|
6
|
|
|
|
Other
|
(1
|
)
|
|
|
Total Ballylumford Decrease
|
(5
|
)
|
|
|
Jordan IPP4
|
|||
|
Primarily lower plant dispatch
|
(5
|
)
|
|
|
Maritza
|
|||
|
Lower contracted capacity prices due to PPA negotiation
|
(8
|
)
|
|
|
Lower fixed costs
|
4
|
|
|
|
Other
|
2
|
|
|
|
Total Maritza Decrease
|
(2
|
)
|
|
|
Other business drivers
|
(2
|
)
|
|
|
Total Europe SBU Operating Margin Decrease
|
$
|
(37
|
)
|
Adjusted Operating Margin
decrease
d by
$34 million
due to the drivers above, adjusted for NCI and excluding unrealized gains and losses on derivatives. As of
June 30, 2016
, AES owns 89% of Kavarna in Bulgaria, and 37% and 36% respectively, of the Amman East and IPP4 projects in Jordan.
Adjusted PTC
decrease
d by
$23 million
, driven by the
decrease
of
$34 million
in Adjusted Operating Margin described above,
partially offset by lower interest expense in Bulgaria due to less debt and a non-recurring provision in Kazakhstan in 2015.
Proportional Free Cash Flow
increase
d by
$245 million
, primarily driven by $293 million of increased collections at Maritza from NEK, net of payments to the fuel supplier (MMI). This favorable increase was partially offset by the
$34 million
decrease
in Adjusted Operating Margin as described above.
40
ASIA SBU
The following table summarizes Operating Margin, Adjusted Operating Margin, Adjusted PTC, and Proportional Free Cash Flow (in millions) for our Asia SBU for the periods indicated:
|
Three Months Ended June 30,
|
Six Months Ended June 30,
|
||||||||||||||||||||||||||||
|
2016
|
2015
|
$ Change
|
% Change
|
2016
|
2015
|
$ Change
|
% Change
|
||||||||||||||||||||||
|
Operating Margin
|
$
|
46
|
|
$
|
47
|
|
$
|
(1
|
)
|
-2
|
%
|
$
|
83
|
|
$
|
71
|
|
$
|
12
|
|
17
|
%
|
|||||||
|
Noncontrolling Interests Adjustment
|
(25
|
)
|
(25
|
)
|
(44
|
)
|
(38
|
)
|
|||||||||||||||||||||
|
Adjusted Operating Margin
|
$
|
21
|
|
$
|
22
|
|
$
|
(1
|
)
|
-5
|
%
|
$
|
39
|
|
$
|
33
|
|
$
|
6
|
|
18
|
%
|
|||||||
|
Adjusted PTC
|
$
|
26
|
|
$
|
30
|
|
$
|
(4
|
)
|
-13
|
%
|
$
|
48
|
|
$
|
42
|
|
$
|
6
|
|
14
|
%
|
|||||||
|
Proportional Free Cash Flow
|
$
|
19
|
|
$
|
5
|
|
$
|
14
|
|
NM
|
|
$
|
62
|
|
$
|
9
|
|
$
|
53
|
|
NM
|
|
|||||||
Operating Margin for the three months ended
June 30, 2016
decrease
d by
$1 million
, or
2%
, with no significant drivers.
Adjusted Operating Margin
decrease
d by
$1 million
due to Operating Margin adjusted for the impact of NCI. As of
June 30, 2016
, AES owns 51% of Masinloc, 90% of Kelanitissa (prior to sale in January 2016) and 51% of Mong Duong.
Adjusted PTC
decrease
d by
$4 million
, primarily driven by the
decrease
of
$1 million
in Adjusted Operating Margin described above as well as a net decrease of $3 million at Mong Duong due to higher interest expense, as interest is no longer capitalized partially offset by a component of service concession revenue recognized as interest income.
Proportional Free Cash Flow
increase
d by
$14 million
, primarily driven by a decrease of $28 million in working capital requirements at Muong Dong due to a buildup in the prior year in preparation for commencement of plant operations. This favorable increase was partially offset by higher interest expense of $13 million as interest is no longer capitalized as part of service concession asset expenditures, and the
$1 million
decrease
in Adjusted Operating Margin as described above.
Operating margin for the
six months ended
June 30, 2016
increase
d by
$12 million
, or
17%
, which was driven primarily by the following (in millions):
|
Mong Duong
|
|||
|
Impact of full year operations for 2016 compared to commencement of principal operations in April 2015
|
$
|
11
|
|
|
Total Mong Duong Increase
|
11
|
|
|
|
Other business drivers
|
1
|
|
|
|
Total Asia SBU Operating Margin Increase
|
$
|
12
|
|
Adjusted Operating Margin
increase
d by
$6 million
due to the driver above adjusted for the impact of NCI. As of
June 30, 2016
, AES owns 51% of Masinloc, 90% of Kelanitissa (prior to sale in January 2016) and 51% of Mong Duong.
Adjusted PTC
increase
d by
$6 million
, primarily driven by the
increase
of
$6 million
in Adjusted Operating Margin described above.
Proportional Free Cash Flow
increase
d by
$53 million
, primarily driven by a decrease of $54 million in working capital requirements at Mong Duong due to a build up in the prior year in preparation for commencement of plant operations, and the
$6 million
increase
in Adjusted Operating Margin as described above.
Key Trends and Uncertainties
During the remainder of
2016
and beyond, we expect to face the following challenges at certain of our businesses. Management expects that improved operating performance at certain businesses, growth from new businesses and global cost reduction initiatives may lessen or offset their impact. If these favorable effects do not occur, or if the challenges described below and elsewhere in this section impact us more significantly than we currently anticipate, or if volatile foreign currencies and commodities move more unfavorably, then these adverse factors, a combination of factors, (or other adverse factors unknown to us) may have a material impact on our operating margin, net income attributable to The AES Corporation and cash flows. We continue to monitor our operations and address challenges as they arise.
Macroeconomic and Political
During the past few years, economic conditions in some countries where our subsidiaries conduct business have deteriorated. Global economic conditions remain volatile and could have an adverse impact on our businesses in the event these recent trends continue.
41
Brazil
— In Brazil, economic conditions remain unfavorable, as indicated by such factors as higher interest rates and inflation, increasing unemployment, and a negative GDP growth rate for 2015, which is expected to continue for the remainder of 2016 and recover in 2017. As a consequence, our distribution businesses have experienced a decline in demand. If these economic conditions persist or worsen, there could be a material impact on our businesses and AES’ results of operations, particularly in our distribution businesses in Brazil.
In addition, the political landscape in Brazil remains uncertain. President Dilma Rousseff’s impeachment proceedings are ongoing and Michel Temer, Vice President of Brazil, has been appointed as interim president until the impeachment trial is complete. Mr. Temer has committed to implement needed fiscal reforms, which has had a positive response in the market. As the interim government has only been in place for a few months, it is too early to determine the impact that these changes in the political landscape will have on our businesses.
In June 2016, AES announced the sale of the Company’s 100% ownership interest in AES Sul. The sale is due to a recent portfolio evaluation where it was determined that AES Sul is no longer aligned with the Company’s strategic goals and therefore its disposal is part of a strategic shift in the Brazil distribution sector. Upon completion of the sale in the second half of 2016, the Company expects to realize an after-tax loss on disposal of approximately
$700 million
, subject to foreign currency movements and adjustments to the final sale proceeds. The cumulative impact of the sale to earnings is expected to be approximately $1.1 billion. This includes the reclassification of approximately $1 billion of cumulative foreign currency translation losses, resulting in an expected net reduction to AES equity of approximately $100 million.
In addition, AES Sul has deferred tax assets (“DTA”) of $451 million as of June 30, 2016. These relate primarily to the impact of impairments on fixed assets as well as net operating loss carryforwards which are not subject to expiration. Realization is dependent on generating sufficient taxable income. Although realization is not assured, management believes it is more likely than not that all of the DTA will be realized. The amount of DTA that is considered realizable, however, could be reduced in the near term if estimates of future taxable income are reduced. The DTA is classified held-for-sale in the Condensed Consolidated Balance Sheet and its impact is reflected in the expected after-tax loss on completion of the sale.
United Kingdom
—
On
June 23, 2016, the United Kingdom (U.K.) held a referendum in which voters approved an exit from the European Union (“E.U.”), commonly referred to as “Brexit”. As a result of the referendum, it is expected that the British government will begin negotiating the terms of the U.K.’s future relationship with the E.U. Although it is unclear what the long-term global implications will be, it is possible that the European or U.K. economy could weaken and our businesses may experience a decline in demand. While the full impact of the Brexit is uncertain, these changes may adversely affect our operations and financial results. The most immediate impact has been a devaluation of the pound and euro against the US dollar. For 2016, the Company has hedged against these foreign currency movements, however, the impact could be greater in future years.
Bulgaria
- As of June 30, 2016, Maritza’s total outstanding receivables were $24 million, none of which were overdue. On April 26, 2016, Maritza received payments from NEK totaling $291 million pursuant to the previously disclosed PPA amendment executed in August 2015. In addition to this payment, NEK directly paid $57 million to MMI, a Maritza fuel supplier, for invoices due to MMI from Maritza. See additional background within our 2015 Form 10-K-Part I.-Item 1-
Business
-
Our Organization and Segments
-
Europe
-
Bulgaria
-
Regulatory Framework.
Puerto Rico
— Our subsidiaries in Puerto Rico have long term PPAs with state-owned PREPA. Due to the ongoing economic situation in the territory, PREPA faces significant financial challenges.
On June 28, 2014, the Puerto Rico Public Corporation Debt Enforcement and Recovery Act (the “Recovery Act”) was signed into law, which allows public corporations, including PREPA, to adjust their debts. As a result of this event, on July 6, 2014, PREPA entered into a Forbearance Agreement with its lenders in order to permit an opportunity for negotiation of a possible financial restructuring of PREPA. In February 2015, the negotiating position of PREPA was weakened when the federal court deemed the Recovery Act unconstitutional. The Supreme Court upheld the federal court’s opinion on June 13, 2016. Despite this setback, PREPA managed to extend the expiration of the Forbearance Agreement several times, achieving in December 2015 certain preliminary restructuring agreements, called Restructuring Support Agreements (“RSAs”). Under these agreements, bondholders would take a reduction in principal after exchanging their bonds for new securities that would be backed by a special charge on clients’ bills. For its part, the utility would receive five-year debt-service relief, while freeing up cash to modernize its power plants.
On June 28, 2016, PREPA authorized the issuance of the restructuring bonds, based on the approval of the Puerto Rico Energy Commission of a transition charge and adjustment mechanism that PREPA had proposed to pay for the utility’s securitized debt. PREPA is expecting to complete this new bond issuance by December 31
st
,
42
2016. As a result of the impending restructuring, Fitch has downgraded PREPA´s bonds to “C”, from “CC”, causing the downgrade of AES Puerto Rico, as PREPA is our only off taker.
On June 30, 2016, the Puerto Rico Oversight, Management, and Economic Stability Act (PROMESA) was signed into law. PROMESA creates a structure for exercising federal oversight over the fiscal affairs of U.S. territories and allows for the establishment an Oversight Board with broad powers of budgetary and financial control over Puerto Rico. PROMESA also creates procedures for adjusting debts accumulated by the Puerto Rico government and, potentially, other territories. Finally, PROMESA expedites the approval of key energy projects and other critical projects in Puerto Rico. The impact PROMESA will have on PREPAs contracts and PPA is uncertain.
Other than the downgrade of AES Puerto Rico discussed above, there have been no adverse impacts to AES Puerto Rico due to PREPA’s financial challenges. AES Puerto Rico’s receivables balance as of
June 30, 2016
, is
$91 million
, of which $28 million was overdue. Subsequent to June 30, 2016, the full overdue amount has been collected. If the situation declines, there could be a material impact on the Company.
Macroeconomic and Political
—
Summary
If global economic conditions deteriorate further, it could also affect the prices we receive for the electricity we generate or transmit. Utility regulators or parties to our generation contracts may seek to lower our prices based on prevailing market conditions pursuant to PPAs, concession agreements or other contracts as they come up for renewal or reset. In addition, rising fuel and other costs coupled with contractual price or tariff decreases could restrict our ability to operate profitably in a given market. Additionally, we operate in multiple countries and as such are subject to volatility in exchange rates at the subsidiary level and between our functional currency, the U.S. Dollar, and currencies of the countries in which we operate. The above mentioned market drivers have already impacted us significantly in 2016 and we expect them to continue to do so during the remainder of the year. See Item 3.—Q
uantitative and Qualitative Disclosures About Market Risk
for further information
.
Each of these factors, as well as those discussed above, could result in a decline in the value of our assets including those at the businesses we operate, our equity investments and projects under development could result in asset impairments that could be material to our operations. We continue to monitor our projects and businesses.
Regulatory
In March 2016, the IURC issued an order authorizing IPL to increase its basic rates and charges by approximately $31 million annually. The order also authorized IPL to collect, over a ten-year period, approximately $118 million of previously deferred regulatory assets related to IPL’s participation in the regional transmission organization known as MISO. Such deferred costs will be amortized to expense over ten years. The rate order also authorized an increase in IPL’s depreciation rates of $24 million annually compared to the twelve months ended June 30, 2014, which is the period upon which the rate increase was calculated. IPL also received approval to implement three new rate riders for current recovery of ongoing MISO costs, capacity costs and sharing of wholesale sales margins with customers at 50%. The order approved recovery of IPL’s pension expenses and return on IPL’s discretionary pension fundings. As part of the order, the IURC also noted that they found IPL’s service company cost allocations to be reasonable and directed IPL to request FERC to review its Service Company allocations. The IURC also closed their investigation into IPL’s underground network. Some of the intervening parties in the IURC rate case have filed petitions for reconsideration of the IURC's March 2016 order with respect to certain issues. The IURC has not yet acted on those petitions. In addition, the Indiana Office of Utility Consumer Counselor and some other intervening parties have filed notices of appeal of the order.
In June 2016, the Supreme Court of Ohio issued an opinion to repeal the current electric security plan (“ESP”)of DPL which had been approved by the Public Utilities Commission of Ohio (“PUCO”) in September 2013 and was in effect for the years 2014-2016 (“ESP 2”). ESP 2, among other matters, permitted DPL to collect a non-bypassable service stability rider (“SSR”) equal to approximately $9 million per month for each of those years. In the opinion, the court briefly stated, without expanding upon the basis, that the PUCO’s approval of ESP 2 was reversed on the authority of one of the court’s prior rulings in a separate case not involving DPL. In view of that reversal, on July 27, 2016, DPL filed a motion to withdraw its ESP 2 and implement rates consistent with those in effect under its June 2009 ESP (ESP 1). If PUCO approves DPL’s request, the ESP 1 rates will be in place temporarily until the rates consistent with the outcome of DPL’s pending ESP filed in February 2016 (“ESP 3”) become effective. The impact of reverting to the ESP 1 rates, if implemented, is expected to be neutral during this interim period.
DPL’s $445 million 1.875% Bonds are due September 15, 2016. DPL intends to refinance these bonds prior to maturity with newly issued debt. If the terms of the regulatory outcome as discussed above are not favorably resolved, this could have a significant adverse impact on the DPL results of operations, financial condition, cash
43
flows, credit ratings and ability to refinance this debt with favorable terms. It could also impact the earnings of AES in the periods in which the SSR is lost or reduced. However, since DPL and its subsidiaries do not pay dividends to AES, there would be no material impact on AES dividends from subsidiaries.
Operational
Sensitivity to Hydrological Conditions
— Our hydroelectric generation facilities are sensitive to changes in the weather, particularly the level of water inflows into generation facilities. At times, dry hydrological conditions in Panama, Brazil, Colombia and Chile have presented challenges for our businesses in these markets. While these dry conditions are expected to continue to abate over the course of 2016, there still remains a risk that low rainfall and water inflows could reduce reservoir levels, generation output, and increase prices for electricity. Alternatively, wet conditions could also have an adverse impact by depressing spot prices for excess energy sales for generation businesses. For distribution businesses, wet conditions could result in lowered demand as well as floods and other damage which could disrupt service and require emergency repairs. Future hydrology conditions are always uncertain, but currently the Company does not expect a material impact due to hydrology in 2016.
Foreign Exchange and Commodities
Our businesses are exposed to and proactively manage market risk. Our primary market risk exposure is to the price of commodities, particularly electricity, oil, natural gas, coal, and environmental credits. In 2015, large declines in commodities and appreciation in the USD had a significant impact on our results. During the six months ended June 30, 2016, commodities and FX have remained volatile; continued volatility in these markets could have a material impact on our full year 2016 results. For additional information, refer to Item 3.—
Quantitative and Qualitative Disclosures About Market Risk
.
Impairments
Long-lived Assets
—
During the
six months ended
June 30, 2016
, the Company recognized an asset impairment expense of
$159 million
(
$49 million
attributable to AES) at Buffalo Gap II. See Note
13
—
Asset Impairment Expense
included in Item 1.—
Financial Statements
of this Form 10-Q for further information. After recognizing this asset impairment expense at Buffalo Gap II, the carrying value of the long-lived asset groups at Buffalo Gap I, II, and III totaled
$325 million
at
June 30, 2016
.
During the
six months ended
June 30, 2016
, the Company recognized an asset impairment expense of
$235 million
at DPL. See Note
13
—
Asset Impairment Expense
included in Item 1.—
Financial Statements
of this Form 10-Q for further information. After recognizing this asset impairment expense at DPL, the carrying value of the long-lived asset groups at DPL, including those that were not impaired, totaled
$1,047 million
at
June 30, 2016
.
Events or changes in circumstances that may necessitate further recoverability tests and potential impairments of long-lived assets may include, but are not limited to, adverse changes in the regulatory environment, unfavorable changes in power prices or fuel costs, increased competition due to additional capacity in the grid, technological advancements, declining trends in demand, or an expectation that it is more likely than not that the asset will be disposed of before the end of its previously estimated useful life.
Environmental
The Company is subject to numerous environmental laws and regulations in the jurisdictions in which it operates. The Company expenses environmental regulation compliance costs as incurred unless the underlying expenditure qualifies for capitalization under its property, plant and equipment policies. The Company faces certain risks and uncertainties related to these environmental laws and regulations, including existing and potential GHG legislation or regulations, and actual or potential laws and regulations pertaining to water discharges, waste management (including disposal of coal combustion byproducts) and certain air emissions, such as SO
2
, NO
x
, particulate matter and mercury. Such risks and uncertainties could result in increased capital expenditures or other compliance costs which could have a material adverse effect on certain of our U.S. or international subsidiaries and our consolidated results of operations. For further information about these risks, see Item 1A.—
Risk Factors—Our businesses are subject to stringent environmental laws and regulations; Our businesses are subject to enforcement initiatives from environmental regulatory agencies; and Regulators, politicians, non-governmental organizations and other private parties have expressed concern about greenhouse gas, or GHG, emissions and the potential risks associated with climate change and are taking actions which could have a material adverse impact on our consolidated results of operations, financial condition and cash flows
included in the 2015 Form 10-K. The following discussion of the impact of environmental laws and regulations on the Company updates the discussion provided in Item 1.—
Business—Environmental and Land Use Regulations
of the 2015 Form 10-K.
44
Update on National Ambient Air Quality Standards
— As discussed in
Item 1.
—
Business
—
United States Environmental and Land
—
Use Regulations-National Ambient Air Quality Standards (“NAAQS”)
in the Company’s 2015 Form 10-K, on August 23, 2010, a new one-hour SO
2
primary NAAQS became effective. On August 5, 2013, EPA published in the Federal Register its final designations, which include portions of Marion, Morgan, and Pike counties in Indiana as nonattainment with respect to the one-hour SO
2
standard. On September 30, 2015, IDEM published its final rule establishing reduced SO
2
limits for IPL facilities in accordance with a new one-hour standard of 75 parts per billion, for the areas in which IPL’s Harding Street, Petersburg, and Eagle Valley Generating Stations operate with compliance required by January 1, 2017. There will be no impact for Eagle Valley or Harding Street Generating Stations because these facilities have ceased coal combustion in advance of the compliance date. Improvements to the existing flue gas desulphurization (“FGD”) systems at Petersburg will be required in order to comply. IPL estimates costs for compliance at Petersburg at approximately $48 million for measures that enhance the performance and integrity of the FGDs systems. On May 31, 2016, IPL filed its SO
2
NAAQS compliance plans with the IURC. IPL is seeking approval for a CPCN for these measures at its Petersburg Generating Station. IPL expects to recover through its environmental rate adjustment mechanism any operating or capital expenditures related to compliance with these requirements. Recovery of these costs is sought through an Indiana statute that allows for 80% recovery of qualifying costs through a rate adjustment mechanism, with the remainder recorded as a regulatory asset to be considered for recovery in the next base rate case proceeding. However, there can be no assurances that IPL will be successful in that regard. In light of the uncertainties at this time, we cannot predict the impact of these permit requirements on our consolidated results of operations, cash flows, or financial condition, but it may be material.
Update on Waste Management
—
As discussed in Item 1.—
Business
—
United States Environmental and Land Use Regulations
—
Waste Management Regulation
in the Company's 2015 Form 10-K, the EPA’s rule regulating CCR under the Resource Conservation and Recovery Act became effective in October 2015. The rule established nationally applicable minimum criteria for the disposal of CCR in new and currently operating landfills and surface impoundments, and may impose closure and/or corrective action requirements for existing CCR landfills and impoundments under certain specified conditions. IPL does not reasonably anticipate that the existing ash ponds at its Petersburg Generating Station will be able to successfully demonstrate compliance with certain structural stability requirements set forth in the CCR rule by the October 17, 2016 deadline. As such, IPL would be required to cease use of the ash ponds by April 17, 2017. However, the Indiana Department of Environmental Management (“IDEM”) has granted IPL a variance extending that deadline to April 11, 2018. In order to handle the bottom ash material that would otherwise be sluiced to the ash ponds, IPL plans to install a dry bottom ash handling system at an estimated cost of approximately $47 million. On May 31, 2016, IPL filed its CCR compliance plans with the Indiana Utility Regulatory Commission (“IURC”). IPL is seeking approval for a Certificate of Public Convenience and Necessity (“CPCN”) to install the bottom ash dewatering system at its Petersburg Generating Station. IPL expects to recover through its environmental rate adjustment mechanism any operating or capital expenditures related to compliance with these requirements. Recovery of these costs is sought through an Indiana status that allows for 80% recovery of qualifying costs through a rate adjustment mechanism with the remainder recorded as a regulator asset to be considered for recovery in the next base rate case proceeding. However, there can be no assurances that IPL will be successful in that regard. In light of the uncertainties at this time, we cannot predict the impact of these permit requirements on our consolidated results of operations, cash flows, or financial condition, but it may be material.
Capital Resources and Liquidity
Overview
—
As of
June 30, 2016
, the Company had unrestricted cash and cash equivalents of
$1.3 billion
, of which
$30 million
was held at the Parent Company and qualified holding companies. The Company had
$544 million
in short-term investments, held primarily at subsidiaries. In addition, we had restricted cash and debt service reserves of
$950 million
. The Company also had non-recourse and recourse aggregate principal amounts of debt outstanding of
$15.9 billion
and
$4.9 billion
, respectively. Of the approximately
$1.6 billion
of our current non-recourse debt,
$1.5 billion
was presented as such because it is due in the next 12 months and
$138 million
relates to debt considered in default due to covenant violations. The defaults are not payment defaults, but are instead technical defaults triggered by failure to comply with other covenants and/or conditions such as (but not limited to) failure to meet information covenants, complete construction or milestones in an allocated time, and meet minimum or maximum financial ratios, or other requirements contained in the non-recourse debt documents of the Company.
We expect such current maturities will be repaid from net cash provided by operating activities of the subsidiary to which the debt relates, through opportunistic refinancing activity, or some combination thereof.
None
of our recourse debt matures within the next twelve months. From time to time, we may elect to repurchase our outstanding debt through cash purchases, privately negotiated transactions or otherwise when management
45
believes that such securities are attractively priced. Such repurchases, if any, will depend on prevailing market conditions, our liquidity requirements and other factors. The amounts involved in any such repurchases may be material.
We rely mainly on long-term debt obligations to fund our construction activities. We have, to the extent available at acceptable terms, utilized non-recourse debt to fund a significant portion of the capital expenditures and investments required to construct and acquire our electric power plants, distribution companies and related assets. Our non-recourse financing is designed to limit cross-default risk to the Parent Company or other subsidiaries and affiliates. Our non-recourse long-term debt is a combination of fixed and variable interest rate instruments. Generally, a portion or all of the variable rate debt is fixed through the use of interest rate swaps. In addition, the debt is typically denominated in the currency that matches the currency of the revenue expected to be generated from the benefiting project, thereby reducing currency risk. In certain cases, the currency is matched through the use of derivative instruments. The majority of our non-recourse debt is funded by international commercial banks, with debt capacity supplemented by multilaterals and local regional banks.
Given our long-term debt obligations, the Company is subject to interest rate risk on debt balances that accrue interest at variable rates. When possible, the Company will borrow funds at fixed interest rates or hedge its variable rate debt to fix its interest costs on such obligations. In addition, the Company has historically tried to maintain at least 70% of its consolidated long-term obligations at fixed interest rates, including fixing the interest rate through the use of interest rate swaps. These efforts apply to the notional amount of the swaps compared to the amount of related underlying debt. Presently, the Parent Company’s only material unhedged exposure to variable interest rate debt relates to indebtedness under its floating rate senior unsecured notes due 2019. On a consolidated basis, of the Company’s
$15.9 billion
of total non-recourse debt outstanding as of
June 30, 2016
, approximately
$3.6 billion
bore interest at variable rates that were not subject to a derivative instrument which fixed the interest rate.
In addition to utilizing non-recourse debt at a subsidiary level when available, the Parent Company provides a portion, or in certain instances all, of the remaining long-term financing or credit required to fund development, construction or acquisition of a particular project. These investments have generally taken the form of equity investments or intercompany loans, which are subordinated to the project’s non-recourse loans. We generally obtain the funds for these investments from our cash flows from operations, proceeds from the sales of assets and/or the proceeds from our issuances of debt, common stock and other securities. Similarly, in certain of our businesses, the Parent Company may provide financial guarantees or other credit support for the benefit of counterparties who have entered into contracts for the purchase or sale of electricity, equipment or other services with our subsidiaries or lenders. In such circumstances, if a business defaults on its payment or supply obligation, the Parent Company will be responsible for the business’ obligations up to the amount provided for in the relevant guarantee or other credit support. At
June 30, 2016
, the Parent Company had provided outstanding financial and performance-related guarantees, indemnities or other credit support commitments to or for the benefit of our businesses, which were limited by the terms of the agreements, of approximately
$443 million
in aggregate (excluding those collateralized by letters of credit and other obligations discussed below). These amounts exclude normal and customary representations and warranties in agreements for the sale of assets (including ownership in associated legal entities) where the associated risk is considered to be nominal.
As a result of the Parent Company’s below-investment-grade rating, counterparties may be unwilling to accept our general unsecured commitments to provide credit support. Accordingly, with respect to both new and existing commitments, the Parent Company may be required to provide some other form of assurance, such as a letter of credit, to backstop or replace our credit support. The Parent Company may not be able to provide adequate assurances to such counterparties. To the extent we are required and able to provide letters of credit or other collateral to such counterparties, this will reduce the amount of credit available to us to meet our other liquidity needs. At
June 30, 2016
, we had
$7 million
in letters of credit outstanding, provided under our senior secured credit facility,
$75 million
in letters of credit outstanding under unsecured credit facilities and
$2 million
in cash collateralized letters of credit outstanding outside of our senior secured credit facility. These letters of credit operate to guarantee performance relating to certain project development activities, construction activities and subsidiary operations. During the quarter ended
June 30, 2016
, the Company paid letter of credit fees ranging from
0.2%
to
2.5%
per annum on the outstanding amounts.
We expect to continue to seek, where possible, non-recourse debt financing in connection with the assets or businesses that we or our affiliates may develop, construct or acquire. However, depending on local and global market conditions and the unique characteristics of individual businesses, non-recourse debt may not be available on economically attractive terms or at all. If we decide not to provide any additional funding or credit support to a subsidiary project that is under construction or has near-term debt payment obligations and that subsidiary is unable to obtain additional non-recourse debt, such subsidiary may become insolvent, and we may lose our
46
investment in that subsidiary. Additionally, if any of our subsidiaries lose a significant customer, the subsidiary may need to withdraw from a project or restructure the non-recourse debt financing. If we or the subsidiary choose not to proceed with a project or are unable to successfully complete a restructuring of the non-recourse debt, we may lose our investment in that subsidiary.
Many of our subsidiaries depend on timely and continued access to capital markets to manage their liquidity needs. The inability to raise capital on favorable terms, to refinance existing indebtedness or to fund operations and other commitments during times of political or economic uncertainty may have material adverse effects on the financial condition and results of operations of those subsidiaries. In addition, changes in the timing of tariff increases or delays in the regulatory determinations under the relevant concessions could affect the cash flows and results of operations of our businesses.
Long-Term Receivables
— As of
June 30, 2016
, the Company had approximately
$248 million
and
$29 million
of accounts receivable classified as
Noncurrent assets—other
and
Current assets—Accounts receivable
, respectively, related to certain of its generation businesses in Argentina and the United States, and its utility business in Brazil. The noncurrent portion primarily consists of accounts receivable in Argentina that, pursuant to amended agreements or government resolutions, have collection periods that extend beyond
June 30,
2017
, or one year from the latest balance sheet date. The majority of Argentinian receivables have been converted into long-term financing for the construction of power plants. See Note
5
—Financing Receivables
included in Part I—Item 1.—
Financial Statements
of this Form 10-Q and Item 1.—
Business—Regulatory Matters—Argentina
included in our
2015
Form 10-K for further information.
Consolidated Cash Flows
The following table reflects the changes in operating, investing, and financing cash flows for the comparative
three and six
month periods (in millions):
|
Three Months Ended June 30,
|
Six Months Ended June 30,
|
|||||||||||||||||||||||
|
Cash flows provided by (used in):
|
2016
|
2015
|
$ Change
|
2016
|
2015
|
$ Change
|
||||||||||||||||||
|
Operating activities
|
$
|
723
|
|
$
|
153
|
|
$
|
570
|
|
$
|
1,363
|
|
$
|
590
|
|
$
|
773
|
|
||||||
|
Investing activities
|
(778
|
)
|
(350
|
)
|
(428
|
)
|
(1,326
|
)
|
(1,070
|
)
|
(256
|
)
|
||||||||||||
|
Financing activities
|
137
|
|
(124
|
)
|
261
|
|
(43
|
)
|
(11
|
)
|
(32
|
)
|
||||||||||||
Operating Activities
The following table summarizes the key components of our consolidated operating cash flows:
|
Three Months Ended June 30,
|
Six Months Ended June 30,
|
|||||||||||||||||||||||
|
(in millions)
|
2016
|
2015
|
$ Change
|
2016
|
2015
|
$ Change
|
||||||||||||||||||
|
Net Income
|
$
|
(387
|
)
|
$
|
264
|
|
$
|
(651
|
)
|
$
|
(313
|
)
|
$
|
518
|
|
$
|
(831
|
)
|
||||||
|
Depreciation and amortization
|
296
|
|
299
|
|
(3
|
)
|
586
|
|
597
|
|
(11
|
)
|
||||||||||||
|
Impairment expenses
|
1,018
|
|
37
|
|
981
|
|
1,179
|
|
45
|
|
1,134
|
|
||||||||||||
|
(Gain) loss on the extinguishment of debt
|
—
|
|
122
|
|
(122
|
)
|
(4
|
)
|
145
|
|
(149
|
)
|
||||||||||||
|
Other adjustments to net income
|
(339
|
)
|
(101
|
)
|
(238
|
)
|
(359
|
)
|
(35
|
)
|
(324
|
)
|
||||||||||||
|
Non-cash adjustments to net income
|
975
|
|
357
|
|
618
|
|
1,402
|
|
752
|
|
650
|
|
||||||||||||
|
Net income, adjusted for non-cash items
|
$
|
588
|
|
$
|
621
|
|
$
|
(33
|
)
|
$
|
1,089
|
|
$
|
1,270
|
|
$
|
(181
|
)
|
||||||
|
Net change in operating assets and liabilities
(1)
|
$
|
135
|
|
$
|
(468
|
)
|
$
|
603
|
|
$
|
274
|
|
$
|
(680
|
)
|
$
|
954
|
|
||||||
|
Net Cash Provided by Operating Activities
(2)
|
$
|
723
|
|
$
|
153
|
|
$
|
570
|
|
$
|
1,363
|
|
$
|
590
|
|
$
|
773
|
|
||||||
(1)
Refer to the table below for explanations of the variance in operating assets and liabilities.
(2)
Amounts included in the table above include the results of discontinued operations, where applicable.
The variance of
$603 million
in changes in operating assets and liabilities for the
three months ended June 30, 2016
compared to the
three months ended June 30, 2015
was driven by:
|
(In millions)
|
|||
|
Decreases in:
|
|||
|
Accounts receivable, primarily at Maritza
|
$
|
436
|
|
|
Prepaid expenses and other current assets, primarily regulatory assets at Eletropaulo
|
135
|
|
|
|
Other assets, primarily long-term regulatory assets at Eletropaulo
|
374
|
|
|
|
Accounts payable and other current liabilities, primarily at Eletropaulo
|
(391
|
)
|
|
|
Other operating assets and liabilities
|
49
|
|
|
|
Total increase in cash from changes in operating assets and liabilities
|
$
|
603
|
|
47
The variance of
$954 million
in changes in operating assets and liabilities for the
six months ended June 30, 2016
compared to the
six months ended June 30, 2015
was driven by:
|
(In millions)
|
|||
|
Decreases in:
|
|||
|
Accounts receivable, primarily at Maritza and Eletropaulo
|
$
|
810
|
|
|
Prepaid expenses and other current assets, primarily regulatory assets at Eletropaulo and Sul
|
341
|
|
|
|
Other assets, primarily long-term regulatory assets at Eletropaulo
|
643
|
|
|
|
Accounts payable and other current liabilities, primarily at Eletropaulo and Sul
|
(736
|
)
|
|
|
Income taxes payable, net and other taxes payable, primarily at Tietê and Chivor
|
(124
|
)
|
|
|
Other operating assets and liabilities
|
20
|
|
|
|
Total increase in cash from changes in operating assets and liabilities
|
$
|
954
|
|
Investing Activities
Net cash used in investing activities increased by
$428 million
for the
three months ended June 30, 2016
, compared to the
three months ended June 30, 2015
, which was primarily driven by:
|
Increases in:
|
(In millions)
|
||
|
Capital expenditures
(1)
|
$
|
(66
|
)
|
|
Proceeds from the sales of businesses, net of cash sold (primarily related to the sale of Cameroon)
|
38
|
|
|
|
Restricted cash, debt service and other assets
|
(262
|
)
|
|
|
Decrease in:
|
|||
|
Net sales of short-term investments
|
(107
|
)
|
|
|
Other investing activities
|
(31
|
)
|
|
|
Total increase in net cash used in investing activities
|
$
|
(428
|
)
|
|
(1)
|
Refer to the tables below for a breakout of capital expenditures by type and by primary business driver.
|
Net cash used in investing activities increased
$256 million
for the
six months ended June 30, 2016
, compared to the
six months ended June 30, 2015
, which was primarily driven by:
|
Increases in:
|
(In millions)
|
||
|
Capital expenditures
(1)
|
$
|
(87
|
)
|
|
Proceeds from the sales of businesses, net of cash sold (primarily related to the sales of DPLER, Cameroon, Kelanitissa and Jordan)
|
153
|
|
|
|
Net purchases of short-term investments
|
(234
|
)
|
|
|
Restricted cash, debt service and other assets
|
(91
|
)
|
|
|
Other investing activities
|
3
|
|
|
|
Total increase in net cash used in investing activities
|
$
|
(256
|
)
|
|
(1)
|
Refer to the tables below for a breakout of capital expenditures by type and by primary business driver.
|
Capital Expenditures
The following table summarizes the Company's capital expenditures for growth investments, maintenance, and environmental reported in investing cash activities for the periods indicated:
|
Three Months Ended June 30,
|
Six Months Ended June 30,
|
|||||||||||||||||||||||
|
(In millions)
|
2016
|
2015
|
$ Change
|
2016
|
2015
|
$ Change
|
||||||||||||||||||
|
Growth Investments
|
$
|
(395
|
)
|
$
|
(316
|
)
|
$
|
(79
|
)
|
$
|
(787
|
)
|
$
|
(742
|
)
|
$
|
(45
|
)
|
||||||
|
Maintenance
|
(156
|
)
|
(157
|
)
|
1
|
|
(317
|
)
|
(304
|
)
|
(13
|
)
|
||||||||||||
|
Environmental
(1)
|
(64
|
)
|
(76
|
)
|
12
|
|
(151
|
)
|
(122
|
)
|
(29
|
)
|
||||||||||||
|
Total capital expenditures
|
$
|
(615
|
)
|
$
|
(549
|
)
|
$
|
(66
|
)
|
$
|
(1,255
|
)
|
$
|
(1,168
|
)
|
$
|
(87
|
)
|
||||||
|
(1)
|
Includes both recoverable and non-recoverable environmental capital expenditures. See Non-GAAP Proportional Free Cash Flow for more information.
|
Cash used for capital expenditures
increased
by
$66 million
for the
three months ended June 30, 2016
, compared to the
three months ended June 30, 2015
, which was primarily driven by:
|
Increases in:
|
(In millions)
|
||
|
Growth expenditures at IPALCO, due to additional spending related to CCGT and Transmission & Distribution projects
|
$
|
(28
|
)
|
|
Growth expenditures at Atlantico, due to the timing of construction activities related to the Colon project
|
(43
|
)
|
|
|
Growth expenditures at Los Mina, due to the timing of construction activities related to Combined Cycle project at DPP
|
(17
|
)
|
|
|
Other capital expenditures
|
(18
|
)
|
|
|
Decreases in:
|
|||
|
Growth expenditures at Gener, due to lower spending related to Andes Solar and the Cochrane unit 1 project, partially offset by a higher spending at Alto Maipo
|
25
|
|
|
|
Maintenance and environmental expenditures at IPALCO, primarily due to lower spending on the MATS compliance project
|
15
|
|
|
|
Total increase in net cash used for capital expenditures
|
$
|
(66
|
)
|
48
Cash used for capital expenditures
increased
by
$87 million
for the
six months ended June 30, 2016
, compared to the
six months ended June 30, 2015
, which was primarily driven by:
|
Increases in:
|
(In millions)
|
||
|
Growth expenditures at IPALCO, due to additional spending related to CCGT and Transmission & Distribution projects
|
$
|
(110
|
)
|
|
Growth expenditures at Atlantico, due to the timing of construction activities related to the Colon project
|
(74
|
)
|
|
|
Growth expenditures at Los Mina, due to the timing of construction activities related to Combined Cycle project at DPP
|
(35
|
)
|
|
|
Growth expenditures at Masinloc, due to construction of a coal fired plant and investments in battery energy storage
|
(29
|
)
|
|
|
Maintenance and environmental expenditures at IPALCO, due to additional spending related to the NPDES, Harding Street refueling and CCR compliance projects, partially offset by a decrease in MATS spending
|
(23
|
)
|
|
|
Other capital expenditures
|
(15
|
)
|
|
|
Decreases in:
|
|||
|
Growth expenditures at Gener, due to lower spending related to Andes Solar and the Cochrane unit 1 project, partially offset by a higher payment at Alto Maipo
|
199
|
|
|
|
Total increase in net cash used for capital expenditures
|
$
|
(87
|
)
|
Financing Activities
Net cash provided by financing activities increased
$261 million
for the
three months ended June 30, 2016
, compared to the
three months ended June 30, 2015
, which was primarily driven by:
|
(In millions)
|
|||
|
Increase in borrowing under the revolving credit facilities, primarily at the Parent Company of $138
|
$
|
156
|
|
|
Increase in repayment under the revolving credit facilities, primarily at the Parent Company of $158 and IPALCO of $153
|
(268
|
)
|
|
|
Increase in distributions to noncontrolling interests, primarily at Tietê of $99, partially offset by decrease at Brasiliana Participações of $15 and Itabo $9
|
(64
|
)
|
|
|
Decrease in non-recourse debt repayment, primarily at Sul of $320, IPALCO of $292 and Panama of $275, partially offset by an increase in repayment, primarily at Gener of $227, Andres of $180, and Maritza of $71
(1)
|
382
|
|
|
|
Decrease in proceeds from the sale of redeemable stock of subsidiaries at IPALCO
|
(214
|
)
|
|
|
Decrease in purchases of treasury stock by the Parent Company
|
272
|
|
|
|
Other financing activities
|
(3
|
)
|
|
|
Total increase in net cash provided by financing activities
|
$
|
261
|
|
|
(1)
|
See Note
7
—
Debt
in Item 1—
Financial Statements
of this Form 10-Q for more information regarding significant non-recourse debt transactions.
|
Net cash used in financing activities increased
$32 million
for the
six months ended June 30, 2016
, compared to the
six months ended June 30, 2015
, which was primarily driven by:
|
(In millions)
|
|||
|
Increase in borrowing under the revolving credit facilities, primarily at the Parent Company of $238 and IPALCO of $91
|
$
|
303
|
|
|
Increase in repayment under the revolving credit facilities, primarily at IPALCO of $221 and the Parent Company of $178
|
(322
|
)
|
|
|
Increase in distributions to noncontrolling interests, primarily at Tietê of $99 and Brasiliana Participações of $22
|
(123
|
)
|
|
|
Increase in payments for financing fees, primarily at Andres of $8 and the Parent Company of $6
|
(15
|
)
|
|
|
Decrease in proceeds from the sale of redeemable stock of subsidiaries at IPALCO
|
(327
|
)
|
|
|
Decrease in net repayments of recourse debt at the Parent Company
(1)
|
229
|
|
|
|
Decrease in purchases of treasury stock by the Parent Company
|
228
|
|
|
|
Other financing activities
|
(5
|
)
|
|
|
Total increase in net cash used in financing activities
|
$
|
(32
|
)
|
|
(1)
|
See Note
7
—
Debt
in Item 1—
Financial Statements
of this Form 10-Q for more information regarding significant recourse debt transactions.
|
Reconciliation of Proportional Free Cash Flow (a non-GAAP measure)
We define Proportional Free Cash Flow as cash flows from operating activities (adjusted for service concession asset capital expenditures), less maintenance capital expenditures (including non-recoverable environmental capital expenditures and net of reinsurance proceeds), adjusted for the estimated impact of NCI. The proportionate share of cash flows and related adjustments attributable to NCI in our subsidiaries comprise the proportional adjustment factor presented in the reconciliation below. Upon the Company’s adoption of the accounting guidance for service concession arrangements effective January 1, 2015, capital expenditures related to service concession assets that would have been classified as investing activities on the Condensed Consolidated Statement of Cash Flows are now classified as operating activities. See Note 1
—Financial Statement Presentation
included in Item 1.—
Financial Statements
of this Form 10-Q for further information on the adoption of this guidance.
Beginning in the quarter ended March 31, 2015, the Company changed the definition of Proportional Free Cash Flow to exclude the cash flows for capital expenditures related to service concession assets that are now classified within net cash provided by operating activities on the Condensed Consolidated Statement of Cash Flows. The proportional adjustment factor for these capital expenditures is presented in the reconciliation below.
We exclude environmental capital expenditures that are expected to be recovered through regulatory, contractual or other mechanisms. An example of recoverable environmental capital expenditures is IPALCO’s
49
investment in MATS-related environmental upgrades that are recovered through a tracker. See Item 1.
—Business—US SBU—IPALCO—Environmental Matters
included in our 2015 Form 10-K for details of these investments.
The GAAP measure most comparable to proportional free cash flow is cash flows from operating activities. We believe that proportional free cash flow better reflects the underlying business performance of the Company, as it measures the cash generated by the business, after the funding of maintenance capital expenditures, that may be available for investing or repaying debt or other purposes. Factors in this determination include the impact of NCI, where AES consolidates the results of a subsidiary that is not wholly owned by the Company.
The presentation of free cash flow has material limitations. Proportional free cash flow should not be construed as an alternative to cash from operating activities, which is determined in accordance with GAAP. Proportional free cash flow does not represent our cash flow available for discretionary payments because it excludes certain payments that are required or to which we have committed, such as debt service requirements and dividend payments. Our definition of proportional free cash flow may not be comparable to similarly titled measures presented by other companies.
|
(in millions)
|
Three Months Ended June 30,
|
Six Months Ended June 30,
|
||||||||||||||||||||||
|
Calculation of Proportional Free Cash Flow
|
2016
|
2015
|
$ Change
|
2016
|
2015
|
$ Change
|
||||||||||||||||||
|
Net Cash provided by operating activities
|
$
|
723
|
|
153
|
|
$
|
570
|
|
$
|
1,363
|
|
$
|
590
|
|
$
|
773
|
|
|||||||
|
Add: capital expenditures related to service concession assets
(1)
|
2
|
|
51
|
|
(49
|
)
|
26
|
|
71
|
|
(45
|
)
|
||||||||||||
|
Adjusted Operating Cash Flow
|
$
|
725
|
|
$
|
204
|
|
$
|
521
|
|
$
|
1,389
|
|
$
|
661
|
|
$
|
728
|
|
||||||
|
Less: proportional adjustment factor on operating cash activities
(2) (3)
|
(185
|
)
|
(13
|
)
|
(172
|
)
|
(474
|
)
|
(85
|
)
|
(389
|
)
|
||||||||||||
|
Proportional Adjusted Operating Cash Flow
|
$
|
540
|
|
$
|
191
|
|
$
|
349
|
|
$
|
915
|
|
$
|
576
|
|
$
|
339
|
|
||||||
|
Less: proportional maintenance capital expenditures, net of reinsurance proceeds
(2)
|
(114
|
)
|
(117
|
)
|
3
|
|
(226
|
)
|
(230
|
)
|
4
|
|
||||||||||||
|
Less: proportional non-recoverable environmental capital expenditures
(2) (4)
|
(9
|
)
|
(12
|
)
|
3
|
|
(19
|
)
|
(19
|
)
|
—
|
|
||||||||||||
|
Proportional Free Cash Flow
|
$
|
417
|
|
$
|
62
|
|
$
|
355
|
|
$
|
670
|
|
$
|
327
|
|
$
|
343
|
|
||||||
____________________________
|
(1)
|
Service concession asset expenditures excluded from proportional free cash flow non-GAAP metric.
|
|
(2)
|
The proportional adjustment factor, proportional maintenance capital expenditures (net of reinsurance proceeds) and proportional non-recoverable environmental capital expenditures are calculated by multiplying the percentage owned by noncontrolling interests for each entity by its corresponding consolidated cash flow metric and are totaled to the resulting figures. For example, Parent Company A owns 80% of Subsidiary Company B, a consolidated subsidiary. Thus, Subsidiary Company B has a 20% noncontrolling interest. Assuming a consolidated net cash flow from operating activities of $100 from Subsidiary B, the proportional adjustment factor for Subsidiary B would equal ($20), or $100 x (20%). The Company calculates the proportional adjustment factor for each consolidated business in this manner and then sums these amounts to determine the total proportional adjustment factor used in the reconciliation. The proportional adjustment factor may differ from the proportion of income attributable to noncontrolling interests as a result of (a) non-cash items which impact income but not cash and (b) AES' ownership interest in the subsidiary where such items occur.
|
|
(3)
|
Includes proportional adjustment amount for service concession asset expenditures of
$1 million
and
$26 million
for the three months ended June 30, 2016
and
2015
, as well as,
$13 million
and
$36 million
for the
six months ended
June 30, 2016
and
2015
, respectively.
|
|
(4)
|
Excludes IPALCO's proportional recoverable environmental capital expenditures of
$38 million
and
$47 million
for the three months ended June 30, 2016
and
2015
, as well as,
$94 million
and
$86 million
for the
six months ended June 30, 2016
and
2015
, respectively.
|
Operating Cash Flow and Proportional Free Cash Flow Analysis
(1)
|
Operating Cash Flow by Segment
|
Three Months Ended June 30,
|
Six Months Ended June 30,
|
||||||||||||||||||||||
|
(in millions)
|
2016
|
2015
|
$ Change
|
2016
|
2015
|
$ Change
|
||||||||||||||||||
|
US
|
$
|
193
|
|
$
|
166
|
|
$
|
27
|
|
$
|
400
|
|
$
|
378
|
|
$
|
22
|
|
||||||
|
Andes
|
105
|
|
(4
|
)
|
109
|
|
143
|
|
56
|
|
87
|
|
||||||||||||
|
Brazil
|
168
|
|
(6
|
)
|
174
|
|
409
|
|
(37
|
)
|
446
|
|
||||||||||||
|
MCAC
|
21
|
|
36
|
|
(15
|
)
|
60
|
|
198
|
|
(138
|
)
|
||||||||||||
|
Europe
|
363
|
|
59
|
|
304
|
|
455
|
|
212
|
|
243
|
|
||||||||||||
|
Asia
|
31
|
|
(40
|
)
|
71
|
|
103
|
|
(42
|
)
|
145
|
|
||||||||||||
|
Corporate
|
(158
|
)
|
(58
|
)
|
(100
|
)
|
(207
|
)
|
(175
|
)
|
(32
|
)
|
||||||||||||
|
Total
|
$
|
723
|
|
$
|
153
|
|
$
|
570
|
|
$
|
1,363
|
|
$
|
590
|
|
$
|
773
|
|
||||||
|
Proportional Free Cash Flow by Segment
|
Three Months Ended June 30,
|
Six Months Ended June 30,
|
||||||||||||||||||||||
|
(in millions)
|
2016
|
2015
|
$ Change
|
2016
|
2015
|
$ Change
|
||||||||||||||||||
|
US
|
$
|
117
|
|
$
|
104
|
|
$
|
13
|
|
$
|
250
|
|
$
|
259
|
|
$
|
(9
|
)
|
||||||
|
Andes
|
56
|
|
(20
|
)
|
76
|
|
60
|
|
(3
|
)
|
63
|
|
||||||||||||
|
Brazil
|
48
|
|
(20
|
)
|
68
|
|
82
|
|
(67
|
)
|
149
|
|
||||||||||||
|
MCAC
|
(6
|
)
|
18
|
|
(24
|
)
|
7
|
|
132
|
|
(125
|
)
|
||||||||||||
|
Europe
|
343
|
|
35
|
|
308
|
|
419
|
|
174
|
|
245
|
|
||||||||||||
|
Asia
|
19
|
|
5
|
|
14
|
|
62
|
|
9
|
|
53
|
|
||||||||||||
|
Corporate
|
(160
|
)
|
(60
|
)
|
(100
|
)
|
(210
|
)
|
(177
|
)
|
(33
|
)
|
||||||||||||
|
Total
|
$
|
417
|
|
$
|
62
|
|
$
|
355
|
|
$
|
670
|
|
$
|
327
|
|
$
|
343
|
|
||||||
|
(1)
|
Operating cash flow and proportional free cash flow as presented above include the effects of intercompany transactions with other segments except for interest, tax sharing, charges for management fees and transfer pricing.
|
50
US SBU
The following table summarizes Operating Cash Flow and Proportional Free Cash Flow for our US SBU for the periods indicated:
|
(in millions)
|
Three Months Ended June 30,
|
Six Months Ended June 30,
|
||||||||||||||||||||||
|
Calculation of Proportional Free Cash Flow
|
2016
|
2015
|
$ Change
|
2016
|
2015
|
$ Change
|
||||||||||||||||||
|
Net Cash Provided by Operating Activities
|
$
|
193
|
|
$
|
166
|
|
$
|
27
|
|
$
|
400
|
|
$
|
378
|
|
$
|
22
|
|
||||||
|
Less: proportional adjustment factor on operating cash activities
|
(18
|
)
|
(4
|
)
|
(14
|
)
|
(37
|
)
|
(7
|
)
|
(30
|
)
|
||||||||||||
|
Proportional Adjusted Operating Cash Flow
|
175
|
|
162
|
|
13
|
|
363
|
|
371
|
|
(8
|
)
|
||||||||||||
|
Less: proportional maintenance capital expenditures, net of reinsurance proceeds
|
(57
|
)
|
(58
|
)
|
1
|
|
(111
|
)
|
(111
|
)
|
—
|
|
||||||||||||
|
Less: proportional non-recoverable environmental capital expenditures
(1)
|
(1
|
)
|
—
|
|
(1
|
)
|
(2
|
)
|
(1
|
)
|
(1
|
)
|
||||||||||||
|
Proportional Free Cash Flow
|
$
|
117
|
|
$
|
104
|
|
$
|
13
|
|
$
|
250
|
|
$
|
259
|
|
$
|
(9
|
)
|
||||||
|
(1)
|
Excludes IPALCO's proportional recoverable environmental capital expenditures of
$38 million
and
$47 million
for the three months ended June 30, 2016
and
2015
, as well as,
$94 million
and
$86 million
for the
six months ended June 30, 2016
and
2015
, respectively.
|
Three months ended June 30, 2016
:
The
increase
in Operating Cash Flow of
$27 million
was driven primarily by the following:
|
US SBU
|
(In millions)
|
|||
|
DPL
|
||||
|
Lower operating margin
|
$
|
(15
|
)
|
|
|
Timing of receivable settlement related to sale of MC2 in previous year
|
(16
|
)
|
||
|
Timing of payments, primarily for O&M and purchased power
|
(7
|
)
|
||
|
Timing of coal purchases
|
(5
|
)
|
||
|
Decreased storm collections
|
(6
|
)
|
||
|
Other
|
(7
|
)
|
||
|
Total DPL Decrease
|
(56
|
)
|
||
|
IPL
|
||||
|
Lower coal inventory purchases due to the ongoing conversion to natural gas and higher inventory levels at December 2015 due to mild Winter weather
|
30
|
|
||
|
Higher operating margin
|
28
|
|
||
|
Lower interest payments due to the timing of interest payments and lower rates on new bonds issued in 2016
|
24
|
|
||
|
Higher receivables due to higher rates as a result of the new rate order
|
(24
|
)
|
||
|
Other
|
10
|
|
||
|
Total IPL Increase
|
68
|
|
||
|
Southland
|
||||
|
Timing of annual property insurance premium payments to Corporate
|
10
|
|
||
|
Other
|
3
|
|
||
|
Total Southland Increase
|
13
|
|
||
|
Other business drivers
|
2
|
|
||
|
Total US SBU Operating Cash Increase
|
$
|
27
|
|
|
Proportional Free Cash Flow
increased
by
$13 million
primarily due to the drivers above, adjusted for the impact of noncontrolling interests and reflective of an increase in the proportional adjustment factor as a result of the additional sell-down of IPL in 2016.
Six months ended June 30, 2016
:
The
increase
in Operating Cash Flow of
$22 million
was driven primarily by the following:
|
US SBU
|
(In millions)
|
|||
|
DPL
|
||||
|
Lower operating margin
|
$
|
(58
|
)
|
|
|
Net impact of receivable settlements related to the sale of DPLER in the current year and MC2 in the previous year
|
17
|
|
||
|
Lower coal inventory purchases
|
9
|
|
||
|
Other
|
(8
|
)
|
||
|
Total DPL Decrease
|
(40
|
)
|
||
|
IPL
|
||||
|
Lower coal inventory purchases due to the ongoing conversion to natural gas and higher inventory levels at December 2015 due to mild Winter weather
|
38
|
|
||
|
Higher operating margin
|
22
|
|
||
|
Lower interest payments due to the timing of interest payments and lower rates on new bonds issued in 2016
|
16
|
|
||
|
Decreased contribution to defined benefit plans
|
9
|
|
||
|
Higher receivables due to higher rates as a result of the new rate order
|
(28
|
)
|
||
|
Other
|
4
|
|
||
|
Total IPL Increase
|
61
|
|
||
|
Other business drivers
|
1
|
|
||
|
Total US SBU Operating Cash Increase
|
$
|
22
|
|
|
51
Proportional Free Cash Flow
decreased
by
$9 million
primarily due to the drivers above, adjusted for the impact of noncontrolling interests and reflective of an increase in the proportional adjustment factor as a result of the additional sell-down of IPL in 2016.
ANDES SBU
The following table summarizes Operating Cash Flow and Proportional Free Cash Flow for our Andes SBU for the periods indicated:
|
(in millions)
|
Three Months Ended June 30,
|
Six Months Ended June 30,
|
||||||||||||||||||||||
|
Calculation of Proportional Free Cash Flow
|
2016
|
2015
|
$ Change
|
2016
|
2015
|
$ Change
|
||||||||||||||||||
|
Net Cash Provided by Operating Activities
|
$
|
105
|
|
$
|
(4
|
)
|
$
|
109
|
|
$
|
143
|
|
$
|
56
|
|
$
|
87
|
|
||||||
|
Less: proportional adjustment factor on operating cash activities
|
(27
|
)
|
6
|
|
(33
|
)
|
(47
|
)
|
(11
|
)
|
(36
|
)
|
||||||||||||
|
Proportional Adjusted Operating Cash Flow
|
78
|
|
2
|
|
76
|
|
96
|
|
45
|
|
51
|
|
||||||||||||
|
Less: proportional maintenance capital expenditures, net of reinsurance proceeds
|
(21
|
)
|
(12
|
)
|
(9
|
)
|
(32
|
)
|
(32
|
)
|
—
|
|
||||||||||||
|
Less: proportional non-recoverable environmental capital expenditures
|
(1
|
)
|
(10
|
)
|
9
|
|
(4
|
)
|
(16
|
)
|
12
|
|
||||||||||||
|
Proportional Free Cash Flow
|
$
|
56
|
|
$
|
(20
|
)
|
$
|
76
|
|
$
|
60
|
|
$
|
(3
|
)
|
$
|
63
|
|
||||||
Three months ended June 30, 2016
:
The
increase
in Operating Cash Flow of
$109 million
was driven primarily by the following:
|
Andes SBU
|
(In millions)
|
|||
|
Gener
|
||||
|
Higher operating margin
|
$
|
46
|
|
|
|
Higher income tax and VAT refunds
|
18
|
|
||
|
Lower interest payments as a result of a change in debt repayment schedule
|
13
|
|
||
|
Other
|
6
|
|
||
|
Total Gener Increase
|
83
|
|
||
|
Argentina
|
||||
|
Increased collections as a result of tariff increases and collections from prior periods
|
27
|
|
||
|
Lower fuel purchases
|
12
|
|
||
|
Lower income tax payments
|
8
|
|
||
|
Lower operating margin
|
(15
|
)
|
||
|
Other
|
1
|
|
||
|
Total Argentina Increase
|
33
|
|
||
|
Colombia
|
||||
|
Lower payment advances for energy purchases to Market Administrator
|
12
|
|
||
|
Higher income tax payments
|
(25
|
)
|
||
|
Lower operating margin
|
(10
|
)
|
||
|
Other
|
16
|
|
||
|
Total Colombia Decrease
|
(7
|
)
|
||
|
Total Andes SBU Operating Cash Increase
|
$
|
109
|
|
|
Proportional Free Cash Flow
increased
by
$76 million
primarily due to the drivers above, adjusted for the impact of noncontrolling interests.
52
Six months ended June 30, 2016
:
The
increase
in Operating Cash Flow of
$87 million
was driven primarily by the following:
|
Andes SBU
|
(In millions)
|
|||
|
Gener
|
||||
|
Higher operating margin
|
$
|
58
|
|
|
|
Lower interest payments as a result of a change in debt repayment schedule
|
11
|
|
||
|
Lower fuel purchases
|
29
|
|
||
|
Higher withholding taxes paid on dividend distributions to AES affiliates
|
(27
|
)
|
||
|
Other
|
(4
|
)
|
||
|
Total Gener Increase
|
67
|
|
||
|
Argentina
|
||||
|
Lower operating margin
|
(17
|
)
|
||
|
Higher insurance payments
|
(10
|
)
|
||
|
Increased collections as a result of tariff increases and collections from prior periods
|
12
|
|
||
|
Lower fuel purchases
|
25
|
|
||
|
Other
|
11
|
|
||
|
Total Argentina Increase
|
21
|
|
||
|
Colombia
|
||||
|
Higher collections from prior periods
|
40
|
|
||
|
Higher income tax payments
|
(28
|
)
|
||
|
Lower operating margin
|
(28
|
)
|
||
|
Other
|
15
|
|
||
|
Total Colombia Decrease
|
(1
|
)
|
||
|
Total Andes SBU Operating Cash Increase
|
$
|
87
|
|
|
Proportional Free Cash Flow
increased
$63 million
primarily due to the drivers above, adjusted for the impact of noncontrolling interests, as well as a
$12 million
net
decrease
in proportional maintenance and non-recoverable environmental capital expenditures primarily from lower payments for emissions reduction equipment at the Tocopilla and Ventanas Plants.
BRAZIL SBU
The following table summarizes Operating Cash Flow and Proportional Free Cash Flow for our Brazil SBU for the periods indicated:
|
(in millions)
|
Three Months Ended June 30,
|
Six Months Ended June 30,
|
||||||||||||||||||||||
|
Calculation of Proportional Free Cash Flow
|
2016
|
2015
|
$ Change
|
2016
|
2015
|
$ Change
|
||||||||||||||||||
|
Net Cash Provided by Operating Activities
|
$
|
168
|
|
$
|
(6
|
)
|
$
|
174
|
|
$
|
409
|
|
$
|
(37
|
)
|
$
|
446
|
|
||||||
|
Less: proportional adjustment factor on operating cash activities
|
(101
|
)
|
(1
|
)
|
(100
|
)
|
(291
|
)
|
(1
|
)
|
(290
|
)
|
||||||||||||
|
Proportional Adjusted Operating Cash Flow
|
67
|
|
(7
|
)
|
74
|
|
118
|
|
(38
|
)
|
156
|
|
||||||||||||
|
Less: proportional maintenance capital expenditures, net of reinsurance proceeds
|
(19
|
)
|
(13
|
)
|
(6
|
)
|
(36
|
)
|
(29
|
)
|
(7
|
)
|
||||||||||||
|
Proportional Free Cash Flow
|
$
|
48
|
|
$
|
(20
|
)
|
$
|
68
|
|
$
|
82
|
|
$
|
(67
|
)
|
$
|
149
|
|
||||||
53
Three months ended June 30, 2016
:
The
increase
in Operating Cash Flow of
$174 million
was driven primarily by the following:
|
Brazil SBU
|
(In millions)
|
|||
|
Sul
|
||||
|
Timing of collections on net regulatory assets and liabilities (net recovery of costs from prior periods)
|
$
|
41
|
|
|
|
Timing of collections on energy sales in the current year
|
40
|
|
||
|
Higher operating margin due to higher tariff in current year
|
16
|
|
||
|
Lower interest payments due to the restructuring of Sul’s debt in March 2016
|
13
|
|
||
|
Timing of payments for energy purchases in the current year
|
(45
|
)
|
||
|
Other
|
(2
|
)
|
||
|
Total Sul Increase
|
63
|
|
||
|
Eletropaulo
|
||||
|
Timing of payments on energy purchases in the current year
|
(185
|
)
|
||
|
Timing of payments related to regulatory charges and tariff flags due to improved hydrology in 2016
|
(92
|
)
|
||
|
Lower operating margin, net of the $97 non-cash impact of the reversal of a contingent regulatory liability in 2015
|
(21
|
)
|
||
|
Timing of collections on net regulatory assets and liabilities (net recovery of costs from prior periods)
|
341
|
|
||
|
Timing of collections on higher tariffs in the current year
|
106
|
|
||
|
Other
|
12
|
|
||
|
Total Eletropaulo Increase
|
161
|
|
||
|
Tietê
|
||||
|
Timing of payments for energy purchases in the spot market in the prior year
|
(21
|
)
|
||
|
Higher interest payments due to higher debt and interest rates
|
(7
|
)
|
||
|
Other
|
(7
|
)
|
||
|
Total Tietê Decrease
|
(35
|
)
|
||
|
Other business drivers
|
(15
|
)
|
||
|
Total Brazil SBU Operating Cash Increase
|
$
|
174
|
|
|
Proportional Free Cash Flow
increased
by
$68 million
primarily due to the drivers above, adjusted for the impact of noncontrolling interests.
Six months ended June 30, 2016
:
The
increase
in Operating Cash Flow of
$446 million
was driven primarily by the following:
|
Brazil SBU
|
(In millions)
|
|||
|
Sul
|
||||
|
Timing of collections on net regulatory assets and liabilities (net recovery of costs from prior periods)
|
$
|
167
|
|
|
|
Timing of collections on energy sales in the current year
|
62
|
|
||
|
Lower interest payments due to the restructuring of Sul’s debt in March 2016
|
16
|
|
||
|
Higher operating margin due to higher tariff in current year
|
11
|
|
||
|
Timing of payments for energy purchases in the current year
|
(122
|
)
|
||
|
Timing of payments for regulatory charges due to improved hydrology
|
(29
|
)
|
||
|
Other
|
(1
|
)
|
||
|
Total Sul Increase
|
104
|
|
||
|
Eletropaulo
|
||||
|
Timing of collections on net regulatory assets and liabilities (net recovery of costs from prior periods)
|
694
|
|
||
|
Timing on collections of higher tariffs in the current year
|
227
|
|
||
|
Timing of payments related to regulatory charges and tariff flags due to improved hydrology in 2016
|
(361
|
)
|
||
|
Timing of payments on energy purchases in the current year
|
(125
|
)
|
||
|
Lower operating margin, net of the $97 non-cash impact of the reversal of a contingent regulatory liability in 2015
|
(58
|
)
|
||
|
Other
|
(36
|
)
|
||
|
Total Eletropaulo Increase
|
341
|
|
||
|
Tietê
|
||||
|
Lower margin due lower contracted pricing of energy sales
|
(106
|
)
|
||
|
Lower energy purchases in spot market in the current year as result of favorable hydrology
|
110
|
|
||
|
Other
|
13
|
|
||
|
Total Tietê Increase
|
17
|
|
||
|
Other business drivers
|
(16
|
)
|
||
|
Total Brazil SBU Operating Cash Increase
|
$
|
446
|
|
|
Proportional Free Cash Flow
increased
by
$149 million
primarily due to the drivers above, adjusted for the impact of noncontrolling interests.
54
MCAC SBU
The following table summarizes Operating Cash Flow and Proportional Free Cash Flow for our MCAC SBU for the periods indicated:
|
(in millions)
|
Three Months Ended June 30,
|
Six Months Ended June 30,
|
||||||||||||||||||||||
|
Calculation of Proportional Free Cash Flow
|
2016
|
2015
|
$ Change
|
2016
|
2015
|
$ Change
|
||||||||||||||||||
|
Net Cash Provided by Operating Activities
|
$
|
21
|
|
$
|
36
|
|
$
|
(15
|
)
|
$
|
60
|
|
$
|
198
|
|
$
|
(138
|
)
|
||||||
|
Less: proportional adjustment factor on operating cash activities
|
(12
|
)
|
1
|
|
(13
|
)
|
(18
|
)
|
(32
|
)
|
14
|
|
||||||||||||
|
Proportional Adjusted Operating Cash Flow
|
9
|
|
37
|
|
(28
|
)
|
42
|
|
166
|
|
(124
|
)
|
||||||||||||
|
Less: proportional maintenance capital expenditures, net of reinsurance proceeds
|
(13
|
)
|
(18
|
)
|
5
|
|
(33
|
)
|
(33
|
)
|
—
|
|
||||||||||||
|
Less: proportional non-recoverable environmental capital expenditures
|
(2
|
)
|
(1
|
)
|
(1
|
)
|
(2
|
)
|
(1
|
)
|
(1
|
)
|
||||||||||||
|
Proportional Free Cash Flow
|
$
|
(6
|
)
|
$
|
18
|
|
$
|
(24
|
)
|
$
|
7
|
|
$
|
132
|
|
$
|
(125
|
)
|
||||||
Three months ended June 30, 2016
:
The
decrease
in Operating Cash Flow of
$15 million
was driven primarily by the following:
|
MCAC SBU
|
(In millions)
|
|||
|
Puerto Rico
|
||||
|
Lower collections from the off-taker primarily due to lower sales from Q1 2016
|
$
|
(21
|
)
|
|
|
Timing of coal payments
|
(15
|
)
|
||
|
Total Puerto Rico Decrease
|
(36
|
)
|
||
|
El Salvador
|
||||
|
Higher income tax payment as a result of higher taxable income in 2015 vs. 2014
|
(18
|
)
|
||
|
Other
|
(1
|
)
|
||
|
Total El Salvador Decrease
|
(19
|
)
|
||
|
Dominican Republic
|
||||
|
Lower income tax payment due to timing of tax return filings
|
19
|
|
||
|
Lower LNG Payments in current year due to lower purchase volumes and lower prices
|
12
|
|
||
|
Other
|
6
|
|
||
|
Total Dominican Republic Increase
|
37
|
|
||
|
Other business drivers
|
3
|
|
||
|
Total MCAC Operating Cash Decrease
|
$
|
(15
|
)
|
|
Proportional Free Cash Flow
decreased
by
$24 million
primarily due to the drivers above, adjusted for the impact of noncontrolling interests.
Six months ended June 30, 2016
:
The
decrease
in Operating Cash Flow of
$138 million
was driven primarily by the following:
|
MCAC SBU
|
(In millions)
|
|||
|
Puerto Rico
|
||||
|
Lower collections from the off-taker primarily due to lower sales from Q4 2015
|
$
|
(46
|
)
|
|
|
Other
|
(6
|
)
|
||
|
Total Puerto Rico Decrease
|
(52
|
)
|
||
|
Dominican Republic
|
||||
|
Lower collections from distribution companies due primarily to lower sales
|
(41
|
)
|
||
|
Total Dominican Republic Decrease
|
(41
|
)
|
||
|
El Salvador
|
||||
|
Higher income tax payment as a result of higher taxable income in 2015 vs. 2014
|
(17
|
)
|
||
|
Other
|
(7
|
)
|
||
|
Total El Salvador Decrease
|
(24
|
)
|
||
|
Mexico
|
||||
|
Lower operating margin
|
(17
|
)
|
||
|
Other
|
(2
|
)
|
||
|
Total Mexico Decrease
|
(19
|
)
|
||
|
Other business drivers
|
(2
|
)
|
||
|
Total MCAC Operating Cash Decrease
|
$
|
(138
|
)
|
|
Proportional Free Cash Flow
decreased
by
$125 million
primarily due to the drivers above, adjusted for the impact of noncontrolling interests.
55
EUROPE SBU
The following table summarizes Operating Cash Flow and Proportional Free Cash Flow for our Europe SBU for the periods indicated:
|
(in millions)
|
Three Months Ended June 30,
|
Six Months Ended June 30,
|
||||||||||||||||||||||
|
Calculation of Proportional Free Cash Flow
|
2016
|
2015
|
$ Change
|
2016
|
2015
|
$ Change
|
||||||||||||||||||
|
Net Cash Provided by Operating Activities
|
$
|
363
|
|
$
|
59
|
|
$
|
304
|
|
$
|
455
|
|
$
|
212
|
|
$
|
243
|
|
||||||
|
Less: proportional adjustment factor on operating cash activities
|
(10
|
)
|
(10
|
)
|
—
|
|
(16
|
)
|
(17
|
)
|
1
|
|
||||||||||||
|
Proportional Adjusted Operating Cash Flow
|
353
|
|
49
|
|
304
|
|
439
|
|
195
|
|
244
|
|
||||||||||||
|
Less: proportional maintenance capital expenditures, net of reinsurance proceeds
|
(5
|
)
|
(13
|
)
|
8
|
|
(9
|
)
|
(20
|
)
|
11
|
|
||||||||||||
|
Less: proportional non-recoverable environmental capital expenditures
|
(5
|
)
|
(1
|
)
|
(4
|
)
|
(11
|
)
|
(1
|
)
|
(10
|
)
|
||||||||||||
|
Proportional Free Cash Flow
|
$
|
343
|
|
$
|
35
|
|
$
|
308
|
|
$
|
419
|
|
$
|
174
|
|
$
|
245
|
|
||||||
Three months ended June 30, 2016
:
The
increase
in Operating Cash Flow of
$304 million
was driven primarily by the following:
|
Europe SBU
|
(In millions)
|
|||
|
Maritza
|
||||
|
Increase in collections from NEK (off-taker)
|
$
|
378
|
|
|
|
Higher payments to fuel suppliers
|
(72
|
)
|
||
|
Other
|
2
|
|
||
|
Total Maritza Increase
|
308
|
|
||
|
Other business drivers
|
(4
|
)
|
||
|
Total Europe SBU Operating Cash Increase
|
$
|
304
|
|
|
Proportional Free Cash Flow
increased
by
$308 million
primarily due to the drivers above, adjusted for the impact of noncontrolling interests.
Six months ended June 30, 2016
:
The
increase
in Operating Cash Flow of
$243 million
was driven primarily by the following:
|
Europe SBU
|
(In millions)
|
|||
|
Maritza
|
||||
|
Increase in collections from NEK (the off-taker)
|
$
|
388
|
|
|
|
Higher payments to fuel suppliers
|
(95
|
)
|
||
|
Other
|
(6
|
)
|
||
|
Total Maritza Increase
|
287
|
|
||
|
Kazakhstan
|
||||
|
Lower operating margin
|
(23
|
)
|
||
|
Other
|
2
|
|
||
|
Total Altai Decrease
|
(21
|
)
|
||
|
Ballylumford
|
||||
|
Increase in income tax payments
|
(7
|
)
|
||
|
Lower operating margin
|
(5
|
)
|
||
|
Other
|
(4
|
)
|
||
|
Total Ballylumford Decrease
|
(16
|
)
|
||
|
Other business drivers
|
(7
|
)
|
||
|
Total Europe SBU Operating Cash Increase
|
$
|
243
|
|
|
Proportional Free Cash Flow
increased
$245 million
primarily due to the drivers above, adjusted for the impact of noncontrolling interests.
ASIA SBU
The following table summarizes Operating Cash Flow and Proportional Free Cash Flow for our Asia SBU for the periods indicated:
|
(in millions)
|
Three Months Ended June 30,
|
Six Months Ended June 30,
|
||||||||||||||||||||||
|
Calculation of Proportional Free Cash Flow
|
2016
|
2015
|
$ Change
|
2016
|
2015
|
$ Change
|
||||||||||||||||||
|
Net Cash Provided by Operating Activities
|
$
|
31
|
|
$
|
(40
|
)
|
$
|
71
|
|
$
|
103
|
|
$
|
(42
|
)
|
$
|
145
|
|
||||||
|
Add: capital expenditures related to service concession assets
(1)
|
2
|
|
51
|
|
(49
|
)
|
26
|
|
71
|
|
(45
|
)
|
||||||||||||
|
Adjusted Operating Cash Flow
|
33
|
|
11
|
|
22
|
|
129
|
|
29
|
|
100
|
|
||||||||||||
|
Less: proportional adjustment factor on operating cash activities
(2)
|
(17
|
)
|
(5
|
)
|
(12
|
)
|
(65
|
)
|
(17
|
)
|
(48
|
)
|
||||||||||||
|
Proportional Adjusted Operating Cash Flow
|
16
|
|
6
|
|
10
|
|
64
|
|
12
|
|
52
|
|
||||||||||||
|
Less: proportional maintenance capital expenditures, net of reinsurance proceeds
|
3
|
|
(1
|
)
|
4
|
|
(2
|
)
|
(3
|
)
|
1
|
|
||||||||||||
|
Proportional Free Cash Flow
|
$
|
19
|
|
$
|
5
|
|
$
|
14
|
|
$
|
62
|
|
$
|
9
|
|
$
|
53
|
|
||||||
(1)
Service concession asset expenditures are included in operating cash flows but are excluded from the calculation of proportional free cash flows.
(2)
Includes proportional adjustment for service concession asset expenditures of
$1 million
and
$26 million
for the three months ended June 30,
2016
and 2015, as well as,
$13 million
and
$36 million
for the six months ended June 30, 2016 and
2015
, respectively.
56
Three months ended June 30, 2016
:
The
increase
in Operating Cash Flow of
$71 million
was driven primarily by the following:
|
Asia SBU
|
(In millions)
|
|||
|
Mong Duong
|
||||
|
Decrease in working capital requirements as the plant was fully operational in 2016
|
$
|
55
|
|
|
|
Reduction in service concession asset expenditures, net of previously capitalized interest payments
|
23
|
|
||
|
Other
|
1
|
|
||
|
Total Mong Duong Increase
|
79
|
|
||
|
Other business drivers
|
(8
|
)
|
||
|
Total Asia SBU Operating Cash Increase
|
$
|
71
|
|
|
Proportional Free Cash Flow
increased
by
$14 million
primarily due to the drivers above, adjusted for the impact of noncontrolling interests and exclusive of the
$49 million
favorable decrease in service concession asset expenditures, which are excluded from the calculation of proportional free cash flows.
Six months ended June 30, 2016
:
The
increase
in Operating Cash Flow of
$145 million
was driven primarily by the following:
|
Asia SBU
|
(In millions)
|
|||
|
Mong Duong
|
||||
|
Decrease in working capital requirements as the plant was fully operational in 2016
|
$
|
105
|
|
|
|
Higher interest income as a result of the financing component under service concession accounting
|
26
|
|
||
|
Reduction in service concession asset expenditures, net of previously capitalized interest payments
|
19
|
|
||
|
Other
|
(5
|
)
|
||
|
Total Asia SBU Operating Cash Increase
|
$
|
145
|
|
|
Proportional Free Cash Flow
increased
by
$53 million
primarily due to the drivers above, adjusted for the impact of noncontrolling interests and exclusive of the
$45 million
favorable decrease in service concession asset expenditures, which are excluded from the calculation of proportional free cash flows.
CORPORATE AND OTHER
The following table summarizes Operating Cash Flow and Proportional Free Cash Flow for our Corporate and Other operations for the periods indicated:
|
(in millions)
|
Three Months Ended June 30,
|
Six Months Ended June 30,
|
||||||||||||||||||||||
|
Calculation of Proportional Free Cash Flow
|
2016
|
2015
|
$ Change
|
2016
|
2015
|
$ Change
|
||||||||||||||||||
|
Net Cash Used by Operating Activities
|
$
|
(158
|
)
|
$
|
(58
|
)
|
$
|
(100
|
)
|
$
|
(207
|
)
|
$
|
(175
|
)
|
$
|
(32
|
)
|
||||||
|
Proportional Adjusted Operating Cash Flow
|
(158
|
)
|
(58
|
)
|
(100
|
)
|
(207
|
)
|
(175
|
)
|
(32
|
)
|
||||||||||||
|
Less: proportional maintenance capital expenditures, net of reinsurance proceeds
|
(2
|
)
|
(2
|
)
|
—
|
|
(3
|
)
|
(2
|
)
|
(1
|
)
|
||||||||||||
|
Proportional Free Cash Flow
|
$
|
(160
|
)
|
$
|
(60
|
)
|
$
|
(100
|
)
|
$
|
(210
|
)
|
$
|
(177
|
)
|
$
|
(33
|
)
|
||||||
Three months ended June 30, 2016
:
The
decrease
in Operating Cash Flow of
$100 million
was driven primarily by the following:
|
Corporate
|
(In millions)
|
|||
|
Timing of annual property insurance premiums received from SBUs due to change in policy year to a calendar year basis
|
$
|
(21
|
)
|
|
|
Timing of payments for reinsurance costs
|
(17
|
)
|
||
|
Decrease in cash from higher premiums and net settlements of FX derivatives
|
(17
|
)
|
||
|
Higher payments for people-related costs, primarily due to inflation
|
(10
|
)
|
||
|
Other
|
(35
|
)
|
||
|
Total Corporate and Other Operating Cash Decrease
|
$
|
(100
|
)
|
|
Proportional Free Cash Flow
decreased
by
$100 million
primarily due to the drivers above.
Six months ended June 30, 2016
:
The
decrease
in Operating Cash Flow of
$32 million
was driven primarily by the following:
|
Corporate
|
(In millions)
|
|||
|
Timing of annual property insurance premiums received from SBUs
|
$
|
59
|
|
|
|
Lower interest payments due principal repayments on debt
|
14
|
|
||
|
Decrease in cash from higher premiums and net settlements of FX derivatives
|
(29
|
)
|
||
|
Timing of net settlements on intercompany payables and receivables with SBUs
|
(26
|
)
|
||
|
Timing of payments for reinsurance costs
|
(17
|
)
|
||
|
Higher payments for people-related costs, primarily due to inflation and severance
|
(14
|
)
|
||
|
Other
|
(19
|
)
|
||
|
Total Corporate and Other Operating Cash Decrease
|
$
|
(32
|
)
|
|
Proportional Free Cash Flow
decreased
by
$33 million
primarily due to the drivers above.
57
Parent Company Liquidity
The following discussion is included as a useful measure of the liquidity available to The AES Corporation, or the Parent Company, given the non-recourse nature of most of our indebtedness. Parent Company Liquidity as outlined below is a non-GAAP measure and should not be construed as an alternative to
cash and cash equivalents
which are determined in accordance with GAAP as a measure of liquidity, and are disclosed in the Condensed Consolidated Statements of Cash Flows. Parent Company Liquidity may differ from similarly titled measures used by other companies.
The principal sources of liquidity at the Parent Company level are dividends and other distributions from our subsidiaries, including refinancing proceeds; proceeds from debt and equity financings at the Parent Company level, including availability under our credit facility; and proceeds from asset sales.
Cash requirements at the Parent Company level are primarily (1) to fund interest; (2) principal repayments of debt; (3) acquisitions; (4) construction commitments; (5) other equity commitments; (6) common stock repurchases and dividends; (7) taxes; and (8) Parent Company overhead and development costs.
The Company defines Parent Company Liquidity as cash available to the Parent Company plus available borrowings under existing credit facility. The cash held at qualified holding companies represents cash sent to subsidiaries of the Company domiciled outside of the U.S. Such subsidiaries have no contractual restrictions on their ability to send cash to the Parent Company. Parent Company Liquidity is reconciled to its most directly comparable GAAP financial measure,
cash and cash equivalents
, at the periods indicated as follows (in millions):
|
June 30, 2016
|
December 31, 2015
|
||||||
|
Consolidated cash and cash equivalents
|
$
|
1,265
|
|
$
|
1,257
|
|
|
|
Less: Cash and cash equivalents at subsidiaries
|
(1,235
|
)
|
(857
|
)
|
|||
|
Parent and qualified holding companies’ cash and cash equivalents
|
30
|
|
400
|
|
|||
|
Commitments under Parent credit facilities
|
800
|
|
800
|
|
|||
|
Less: Letters of credit under the credit facilities
|
(7
|
)
|
(62
|
)
|
|||
|
Less: Borrowings under the credit facilities
|
(60
|
)
|
—
|
|
|||
|
Borrowings available under Parent credit facilities
|
733
|
|
738
|
|
|||
|
Total Parent Company Liquidity
|
$
|
763
|
|
$
|
1,138
|
|
|
The Company paid dividends of
$0.11
per share to its common stockholders during both the first and second quarters of
2016
for dividends declared in December 2015 and February 2016, respectively. While we intend to continue payment of dividends, and believe we will have sufficient liquidity to do so, we can provide no assurance that we will continue to pay dividends, or if continued, the amount of such dividends.
Recourse Debt
Our total recourse debt was
$4.9 billion
and
$5.0 billion
as of
June 30, 2016
and
December 31, 2015
, respectively. See Note
7
—
Debt
in Item 1.—
Financial Statements
of this Form 10-Q and Note 12—
Debt
in Item 8.—
Financial Statements and Supplementary Data
of our
2015
Form 10-K for additional detail.
While we believe that our sources of liquidity will be adequate to meet our needs for the foreseeable future, this belief is based on a number of material assumptions, including, without limitation, assumptions about our ability to access the capital markets (see Item 2.—
Key Trends and Uncertainties
)
, the operating and financial performance of our subsidiaries, currency exchange rates, power market pool prices, and the ability of our subsidiaries to pay dividends. In addition, our subsidiaries’ ability to declare and pay cash dividends to us (at the Parent Company level) is subject to certain limitations contained in loans, governmental provisions and other agreements. We can provide no assurance that these sources will be available when needed or that the actual cash requirements will not be greater than anticipated. We have met our interim needs for shorter-term and working capital financing at the Parent Company level with our senior secured credit facility. See Item 1A.—
Risk Factors
—
The AES Corporation is a holding company and its ability to make payments on its outstanding indebtedness, including its public debt securities, is dependent upon the receipt of funds from its subsidiaries by way of dividends, fees, interest, loans or otherwise
of the Company’s
2015
Form 10-K for additional information.
Various debt instruments at the Parent Company level, including our senior secured credit facility, contain certain restrictive covenants. The covenants provide for — among other items — (1) limitations on other indebtedness; (2) liens, investments and guarantees, limitations on dividends, stock repurchases and other equity transactions; (3) restrictions and limitations on mergers and acquisitions, sales of assets, leases, transactions with affiliates and off-balance sheet and derivative arrangements; (4) maintenance of certain financial ratios; and (5) financial and other reporting requirements. As of
June 30, 2016
, we were in compliance with these covenants at the Parent Company level.
58
Non-Recourse Debt
While the lenders under our non-recourse debt financings generally do not have direct recourse to the Parent Company, defaults thereunder can still have important consequences for our results of operations and liquidity, including, without limitation:
|
•
|
Reducing our cash flows as the subsidiary will typically be prohibited from distributing cash to the Parent Company during the time period of any default;
|
|
•
|
Triggering our obligation to make payments under any financial guarantee, letter of credit or other credit support we have provided to or on behalf of such subsidiary;
|
|
•
|
Causing us to record a loss in the event the lender forecloses on the assets; and
|
|
•
|
Triggering defaults in our outstanding debt at the Parent Company.
|
For example, our senior secured credit facility and outstanding debt securities at the Parent Company include events of default for certain bankruptcy-related events involving material subsidiaries. In addition, our senior secured credit facility at the Parent Company includes events of default related to payment defaults and accelerations of outstanding debt of material subsidiaries.
Some of our subsidiaries are currently in default with respect to all or a portion of their outstanding indebtedness. The total non-recourse debt classified as current in the accompanying Condensed Consolidated Balance Sheets amounts to
$1.6 billion
. The portion of current debt related to such defaults was
$138 million
at
June 30, 2016
, all of which was non-recourse debt related to two subsidiaries — Kavarna and Sogrinsk. See Note
7
—
Debt
in Item 1.—
Financial Statements
of this Form 10-Q for additional detail.
None of the subsidiaries that are currently in default are subsidiaries that met the applicable definition of materiality under AES’ corporate debt agreements as of
June 30, 2016
, in order for such defaults to trigger an event of default or permit acceleration under AES’ indebtedness. However, as a result of additional dispositions of assets, other significant reductions in asset carrying values or other matters in the future that may impact our financial position and results of operations or the financial position of the individual subsidiary, it is possible that one or more of these subsidiaries could fall within the definition of a “material subsidiary” and thereby upon an acceleration trigger an event of default and possible acceleration of the indebtedness under the Parent Company’s outstanding debt securities. A material subsidiary is defined in the Company’s senior secured credit facility as any business that contributed 20% or more of the Parent Company’s total cash distributions from businesses for the four most recently ended fiscal quarters. As of
June 30, 2016
, none of the defaults listed above individually or in the aggregate results in or is at risk of triggering a cross-default under the recourse debt of the Company.
Critical Accounting Policies and Estimates
The condensed consolidated financial statements of AES are prepared in conformity with U.S. GAAP, which requires the use of estimates, judgments and assumptions that affect the reported amounts of assets and liabilities at the date of the financial statements and the reported amounts of revenue and expenses during the periods presented. The Company’s significant accounting policies are described in Note 1—
General and Summary of Significant Accounting Policies
of our
2015
Form 10-K. The Company’s critical accounting estimates are described in
Management’s Discussion and Analysis of Financial Condition and Results of Operations
in the
2015
Form 10-K. An accounting estimate is considered critical if the estimate requires management to make an assumption about matters that were highly uncertain at the time the estimate was made, different estimates reasonably could have been used, or if changes in the estimate that would have a material impact on the Company’s financial condition or results of operations are reasonably likely to occur from period to period. Management believes that the accounting estimates employed are appropriate and resulting balances are reasonable; however, actual results could differ from the original estimates, requiring adjustments to these balances in future periods. The Company has reviewed and determined that these remain as critical accounting policies as of and for the
six months ended June 30, 2016
.
Overview Regarding Market Risks
— Our generation and utility businesses are exposed to and proactively manage market risk. Our primary market risk exposure is to the price of commodities, particularly electricity, oil, natural gas, coal and environmental credits. We operate in multiple countries and as such are subject to volatility in exchange rates at varying degrees at the subsidiary level and between our functional currency, the U.S. Dollar, and currencies of the countries in which we operate. We are also exposed to interest rate fluctuations due to our issuance of debt and related financial instruments.
The disclosures in this Item 3 are based upon a number of assumptions; actual effects may differ. The safe harbor provided in Section 27A of the Securities Act of 1933 and Section 21E of the Securities Exchange Act of
59
1934 shall apply to the disclosures contained in this Item 3. For further information regarding market risk, see Item 1A.—
Risk Factors
,
Our financial position and results of operations may fluctuate significantly due to fluctuations in currency exchange rates experienced at our foreign operations
;
Our businesses may incur substantial costs and liabilities and be exposed to price volatility as a result of risks associated with the wholesale electricity markets, which could have a material adverse effect on our financial performance
; and
We may not be adequately hedged against our exposure to changes in commodity prices or interest rates
of the
2015
Form 10-K.
Commodity Price Risk
— Although we prefer to hedge our exposure to the impact of market fluctuations in the price of electricity, fuels and environmental credits, some of our generation businesses operate under short-term sales or under contract sales that leave an un-hedged exposure on some of our capacity or through imperfect fuel pass-throughs. In our utility businesses, we may be exposed to commodity price movements depending on our excess or shortfall of generation relative to load obligations and sharing or pass-through mechanisms. These businesses subject our operational results to the volatility of prices for electricity, fuels and environmental credits in competitive markets. We employ risk management strategies to hedge our financial performance against the effects of fluctuations in energy commodity prices. The implementation of these strategies can involve the use of physical and financial commodity contracts, futures, swaps and options.
When hedging the output of our generation assets, we utilize contract strategies that lock in the spread per MWh between variable costs and the price at which the electricity can be sold. The portion of our sales and purchases that are not subject to such agreements or contracted businesses where indexation is not perfectly matched to business drivers will be exposed to commodity price risk.
AES businesses will see changes in variable margin performance as global commodity prices shift. We have entered into hedges to partially mitigate the exposure of variable margin to commodity moves. As of
June 30, 2016
, the portfolio’s adjusted pretax earnings exposure for the remainder of 2016 to a 10% move in commodity prices would be approximately $10 million for U.S. power (DPL), and less than $5 million for natural gas, less than $5 million for oil and $10 million for coal. Our estimates exclude correlation of oil with coal or natural gas. For example, a decline in oil or natural gas prices can be accompanied by a decline in coal price if commodity prices are correlated. In aggregate, the Company’s downside exposure occurs with lower oil, lower natural gas, and higher coal prices. Exposures at individual businesses will change as new contracts or financial hedges are executed, and our sensitivity to changes in commodity prices generally increases in later years with reduced hedge levels at some of our businesses.
Commodity prices affect our businesses differently depending on the local market characteristics and risk management strategies. Spot power prices, contract indexation provisions and generation costs can be directly or indirectly affected by movements in the price of natural gas, oil and coal. We have some natural offsets across our businesses such that low commodity prices may benefit certain businesses and be a cost to others. Exposures are not perfectly linear or symmetric. The sensitivities are affected by a number of local or indirect market factors. Examples of these factors include hydrology, local energy market supply/demand balances, regional fuel supply issues, regional competition, bidding strategies and regulatory interventions such as price caps. Operational flexibility changes the shape of our sensitivities. For instance, certain power plants may limit downside exposure by reducing dispatch in low market environments. Volume variation also affects our commodity exposure. The volume sold under contracts or retail concessions can vary based on weather and economic conditions resulting in a higher or lower volume of sales in spot markets. Thermal unit availability and hydrology can affect the generation output available for sale and can affect the marginal unit setting power prices.
In the US SBU, the generation businesses are largely contracted but may have residual risk to the extent contracts are not perfectly indexed to the business drivers. IPL sells power at wholesale once retail demand is served, so retail sales demand may affect commodity exposure. Additionally, at DPL, open access allows our retail customers to switch to alternative suppliers; falling energy prices may increase the rate of switching; DPL sells generation in excess of its retail demand under short-term sales. Given that natural gas-fired generators set power prices for many markets, higher natural gas prices expand margins. The positive impact on margins will be moderated if natural gas-fired generators set the market price only during some periods.
In the Andes SBU, our business in Chile owns assets in the central and northern regions of the country and has a portfolio of contract sales in both. In the central region, the contract sales generally cover the efficient generation from our coal-fired and hydroelectric assets. Any residual spot price risk will primarily be driven by the amount of hydrological inflows. In the case of low hydroelectric generation, spot price exposure is capped by the ability to dispatch our natural gas/diesel assets, the price of which depends on fuel pricing at the time required. There is a small amount of coal generation in the northern region that is not covered by the portfolio of contract sales and therefore subject to spot price risk. In both regions, generators with oil or oil-linked fuel generally set
60
power prices. In Colombia, we operate under a short-term sales strategy and have commodity exposure to unhedged volumes. Because we own hydroelectric assets there, contracts are not indexed to fuel.
In the Brazil SBU, the hydroelectric generating facility is covered by contract sales. Under normal hydrological volatility, spot price risk is mitigated through a regulated sharing mechanism across all hydroelectric generators in the country. Under drier conditions, the sharing mechanism may not be sufficient to cover the business’ contract position, and therefore it may have to purchase power at spot prices driven by the cost of thermal generation.
In the MCAC SBU, our businesses have commodity exposure on unhedged volumes. Panama is highly contracted under a portfolio of fixed volume contract sales. To the extent hydrological inflows are greater than or less than the contract sales volume, the business will be sensitive to changes in spot power prices which may be driven by oil prices in some time periods. In the Dominican Republic, we own natural gas-fired assets contracted under a portfolio of contract sales and a coal-fired asset contracted with a single contract, and both contract and spot prices may move with commodity prices. Additionally, the contract levels do not always match our generation availability and our assets may be sellers of spot prices in excess of contract levels or a net buyer in the spot market to satisfy contract obligations.
In the Europe SBU, our Kilroot facility operates on a short-term sales strategy. To the extent that sales are unhedged, the commodity risk at our Kilroot business is to the clean dark spread — the difference between electricity price and our coal-based variable dispatch cost including emissions. Natural gas-fired generators set power prices for many periods, so higher natural gas prices generally expand margins and higher coal or emissions prices reduce them. Similarly, increased wind generation displaces higher cost generation, reducing Kilroot’s margins, and vice versa.
In the Asia SBU, our Masinloc business is a coal-fired generation facility which hedges its output under a portfolio of contract sales that are indexed to fuel prices, with generation in excess of contract volume or shortfalls of generation relative to contract volumes settled in the spot market. Low oil prices may be a driver of margin compression since oil affects spot power sale prices. Our Mong Duong business has minimal exposure to commodity price risk as it has no merchant exposure and fuel is subject to a pass-through mechanism.
Foreign Exchange Rate Risk
— In the normal course of business, we are exposed to foreign currency risk and other foreign operations risks that arise from investments in foreign subsidiaries and affiliates. A key component of these risks stems from the fact that some of our foreign subsidiaries and affiliates utilize currencies other than our consolidated reporting currency, the U.S. Dollar. Additionally, certain of our foreign subsidiaries and affiliates have entered into monetary obligations in the U.S. Dollar or currencies other than their own functional currencies. We have varying degrees of exposure to changes in the exchange rate between the U.S. Dollar and the following currencies: Argentine Peso, Brazilian Real, British Pound, Chilean Peso, Colombian Peso, Dominican Peso, Euro, Indian Rupee, Kazakhstani Tenge, Mexican Peso and Philippine Peso. These subsidiaries and affiliates have attempted to limit potential FX exposure by entering into revenue contracts that adjust to changes in FX rates. We also use foreign currency forwards, swaps and options, where possible, to manage our risk related to certain foreign currency fluctuations.
We have entered into hedges to partially mitigate the exposure of earnings translated into the U.S. Dollar to foreign exchange volatility. The largest FX risks over a 12-month forward-looking period stem from the following currencies: Argentine Peso, British Pound, Brazilian Real, Colombian Peso, Euro, and Kazakhstani Tenge. As of
June 30, 2016
, assuming a 10% U.S. Dollar appreciation, adjusted pretax earnings attributable to foreign subsidiaries exposed to movement in the exchange rate of the Argentine Peso is projected to be $5 million for the remainder of 2016. The Colombian Peso, Brazilian Real, Kazakhstani Tenge, Euro and British Pound impacts are projected to be less than $5 million for each currency for the remainder of 2016. These numbers have been produced by applying a one-time 10% U.S. Dollar appreciation to forecasted exposed pretax earnings for 2016 coming from the respective subsidiaries exposed to the currencies listed above, net of the impact of outstanding hedges and holding all other variables constant. The numbers presented above are net of any transactional gains/losses. These sensitivities may change in the future as new hedges are executed or existing hedges are unwound. Additionally, updates to the forecasted pretax earnings exposed to FX risk may result in further modification. The sensitivities presented do not capture the impacts of any administrative market restrictions or currency inconvertibility.
Interest Rate Risks
— We are exposed to risk resulting from changes in interest rates as a result of our issuance of variable and fixed-rate debt, as well as interest rate swap, cap and floor and option agreements.
Decisions on the fixed-floating debt ratio are made to be consistent with the risk factors faced by individual businesses or plants. Depending on whether a plant’s capacity payments or revenue stream is fixed or varies with inflation, we partially hedge against interest rate fluctuations by arranging fixed-rate or variable-rate financing. In
61
certain cases, particularly for non-recourse financing, we execute interest rate swap, cap and floor agreements to effectively fix or limit the interest rate exposure on the underlying financing. Most of our interest rate risk is related to non-recourse financings at our businesses.
As of
June 30, 2016
, the portfolio’s pretax earnings exposure for the remainder of 2016 to a 100-basis-point increase in interest rates for our Argentine Peso, Brazilian Real, Colombian Peso, Euro, Kazakhstani Tenge and U.S. Dollar denominated debt would be approximately $10 million based on the impact of a one time, 100-basis-point upward shift in interest rates on interest expense for the debt denominated in these currencies. The amounts do not take into account the historical correlation between these interest rates.
Evaluation of Disclosure Controls and Procedures
— The Company, under the supervision and with the participation of its management, including the Company’s CEO and Chief Financial Officer (“CFO”), evaluated the effectiveness of its “disclosure controls and procedures,” as such term is defined in Rule 13a-15(e) under the Securities Act of 1934, as amended (the “Exchange Act”), as of the end of the period covered by this Quarterly Report on Form 10-Q. Based on that evaluation, our CEO and CFO have concluded that our disclosure controls and procedures were effective as of
June 30, 2016
, to ensure that information required to be disclosed by the Company in reports that we file or submit under the Exchange Act is recorded, processed, summarized and reported within the time periods specified in SEC rules and forms, and include controls and procedures designed to ensure that information required to be disclosed by us in such reports is accumulated and communicated to our management, including our CEO and CFO, as appropriate, to allow timely decisions regarding required disclosures.
Changes in Internal Controls over Financial Reporting
—
There were no changes that occurred during the fiscal quarter covered by this Quarterly Report on Form 10-Q that have materially affected, or are reasonably likely to materially affect, our internal control over financial reporting.
62
The Company is involved in certain claims, suits and legal proceedings in the normal course of business. The Company has accrued for litigation and claims where it is probable that a liability has been incurred and the amount of loss can be reasonably estimated. The Company believes, based upon information it currently possesses and taking into account established reserves for estimated liabilities and its insurance coverage, that the ultimate outcome of these proceedings and actions is unlikely to have a material adverse effect on the Company's financial statements. It is reasonably possible, however, that some matters could be decided unfavorably to the Company and could require the Company to pay damages or make expenditures in amounts that could be material but cannot be estimated as of
June 30, 2016
.
In 1989, Centrais Elétricas Brasileiras S.A. (“Eletrobrás”) filed suit in the Fifth District Court in the state of Rio de Janeiro (“FDC”) against Eletropaulo Eletricidade de São Paulo S.A. (“EEDSP”) relating to the methodology for calculating monetary adjustments under the parties' financing agreement. In April 1999, the FDC found for Eletrobrás and in September 2001, Eletrobrás initiated an execution suit in the FDC to collect approximately
R$1.9 billion
(
$535 million
) from Eletropaulo as estimated by Eletropaulo (or approximately
R$2.4 billion
(
$689 million
) plus legal costs according to Eletrobrás as of December 2015) and a lesser amount from an unrelated company, Companhia de Transmissão de Energia Elétrica Paulista (“CTEEP”) (Eletropaulo and CTEEP were spun off of EEDSP pursuant to its privatization in 1998). In November 2002, the FDC rejected Eletropaulo's defenses in the execution suit. On appeal, the case was remanded to the FDC for further proceedings to determine whether Eletropaulo is liable for the debt. In December 2012, the FDC issued a decision that Eletropaulo is liable for the debt. However, that decision was annulled on appeal and the case was remanded to the FDC for further proceedings. On remand at the FDC, the FDC appointed an accounting expert to analyze the issues in the case. In September 2015, the expert issued a preliminary report concluding that Eletropaulo is liable for the debt, without quantifying the debt. Eletropaulo thereafter submitted questions to the expert and reports rebutting the expert's preliminary report. In April 2016, Eletrobrás requested that the expert determine both the criteria to calculate the debt and the amount of the debt. The FDC is considering whether the criteria can be determined by the expert or must be determined by the FDC. After that issue is resolved,
t
he expert may issue a final report. Ultimately, a decision will be issued by the FDC, which will be free to reject or adopt in whole or in part the expert's report. If the FDC again determines that Eletropaulo is liable for the debt, Eletrobrás will be entitled to resume the execution suit in the FDC. If Eletrobrás does so, Eletropaulo will be required to provide security for its alleged liability. In addition, in February 2008, CTEEP filed a lawsuit in the FDC against Eletrobrás and Eletropaulo seeking a declaration that CTEEP is not liable for any debt under the financing agreement. Eletropaulo believes it has meritorious defenses to the claims asserted against it and will defend itself vigorously in these proceedings; however, there can be no assurances that it will be successful in its efforts. If Eletrobrás requests the seizure of such security and the FDC grants such request (or if a court determines that Eletropaulo is liable for the debt), Eletropaulo's results of operations will be materially adversely affected and, in turn, the Company's results of operations would also be materially adversely affected. Eletropaulo and the Company could face a loss of earnings and/or cash flows and may have to provide loans or equity to support affected businesses or projects, restructure them, write down their value and/or face the possibility that Eletropaulo cannot continue operations or provide returns consistent with our expectations, any of which could have a material impact on the Company.
In September 1996, a public civil action was asserted against Eletropaulo and Associação Desportiva Cultural Eletropaulo (the “Associação”) relating to alleged environmental damage caused by construction of the Associação near Guarapiranga Reservoir. The initial decision that was upheld by the Appellate Court of the state of São Paulo in 2006 found that Eletropaulo should repair the alleged environmental damage by demolishing certain construction and reforesting the area, and either sponsor an environmental project which would cost approximately
R$2 million
(
$521 thousand
) as of December 31, 2015, or pay an indemnification amount of approximately
R$15 million
(
$4 million
). Eletropaulo has appealed this decision to the Supreme Court and the Supreme Court affirmed the decision of the Appellate Court. Following the Supreme Court's decision, the case has been remanded to the court of first instance for further proceedings and to monitor compliance by the defendants with the terms of the decision. In January 2014, Eletropaulo informed the court that it intended to comply with the court's decision by donating a green area inside a protection zone and restore watersheds, the aggregate cost of which is expected to be approximately
R$2 million
(
$521 thousand
). Eletropaulo also requested that the court add the current owner of the land where the Associação facilities are located, Empresa Metropolitana de Águas e Energia S.A. (“EMAE”), as a party to the lawsuit and order EMAE to perform the demolition and reforestation aspects of the court's decision. In July 2014, the court requested the Secretary of the Environment for the State of São Paulo to notify the court of its opinion regarding the acceptability of the green areas to be donated by Eletropaulo to the State of São Paulo. In January 2015, the Secretary of the Environment for the State of São Paulo notified Eletropaulo and the court that it
63
would not accept Eletropaulo's proposed green areas donation. Instead of such green areas donation, the Secretary of the Environment proposed in March 2015 that Eletropaulo undertake an environmental project to offset the alleged environmental damage. Since March 2015, Eletropaulo and the Secretary of Environment have been working together to define an environmental project, which will be submitted for approval by the Public Prosecutor. The cost of such project is currently estimated to be
R$3 million
(
$897 thousand
).
In December 2001, Gridco Ltd. (“Gridco”) served a notice to arbitrate pursuant to the Indian Arbitration and Conciliation Act of 1996 on the Company, AES Orissa Distribution Private Limited (“AES ODPL”), and Jyoti Structures (“Jyoti”) pursuant to the terms of the shareholders agreement between Gridco, the Company, AES ODPL, Jyoti and the Central Electricity Supply Company of Orissa Ltd. (“CESCO”), an affiliate of the Company. In the arbitration, Gridco asserted that a comfort letter issued by the Company in connection with the Company's indirect investment in CESCO obligates the Company to provide additional financial support to cover all of CESCO's financial obligations to Gridco. Gridco appeared to be seeking approximately $189 million in damages, plus undisclosed penalties and interest, but a detailed alleged damage analysis was not filed by Gridco. The Company counterclaimed against Gridco for damages. In June 2007, a 2-to-1 majority of the arbitral tribunal rendered its award rejecting Gridco's claims and holding that none of the respondents, the Company, AES ODPL, or Jyoti, had any liability to Gridco. The respondents' counterclaims were also rejected. A majority of the tribunal later awarded the respondents, including the Company, some of their costs relating to the arbitration. Gridco filed challenges of the tribunal's awards with the local Indian court. Gridco's challenge of the costs award has been dismissed by the court, but its challenge of the liability award remains pending. The Company believes that it has meritorious defenses to the claims asserted against it and will defend itself vigorously in these proceedings; however, there can be no assurances that it will be successful in its efforts.
In March 2003, the office of the Federal Public Prosecutor for the State of São Paulo, Brazil (“MPF”) notified Eletropaulo that it had commenced an inquiry into the BNDES financings provided to AES Elpa and AES Transgás, the rationing loan provided to Eletropaulo, changes in the control of Eletropaulo, sales of assets by Eletropaulo, and the quality of service provided by Eletropaulo to its customers. The MPF requested various documents from Eletropaulo relating to these matters. In July 2004, the MPF filed a public civil lawsuit in the Federal Court of São Paulo (“FCSP”) alleging that BNDES violated Law 8429/92 (“the Administrative Misconduct Act”) and BNDES's internal rules by (1) approving the AES Elpa and AES Transgás loans; (2) extending the payment terms on the AES Elpa and AES Transgás loans; (3) authorizing the sale of Eletropaulo's preferred shares at a stock-market auction; (4) accepting Eletropaulo's preferred shares to secure the loan provided to Eletropaulo; and (5) allowing the restructurings of Light Serviços de Eletricidade S.A. and Eletropaulo. The MPF also named AES Elpa and AES Transgás as defendants in the lawsuit because they allegedly benefited from BNDES's alleged violations. In May 2006, the FCSP ruled that the MPF could pursue its claims based on the first, second, and fourth alleged violations noted above. The MPF subsequently filed an interlocutory appeal with the Federal Court of Appeals (“FCA”) seeking to require the FCSP to consider all five alleged violations. In April 2015, the FCA issued a decision holding that the FCSP should consider all five alleged violations. AES Elpa and AES Brasiliana (the successor of AES Transgás) have appealed to the Superior Court of Justice. The lawsuit remains pending before the FCSP. AES Elpa and AES Brasiliana believe they have meritorious defenses to the allegations asserted against them and will defend themselves vigorously in these proceedings; however, there can be no assurances that they will be successful in their efforts.
Pursuant to their environmental audit, AES Sul and AES Florestal discovered 200 barrels of solid creosote waste and other contaminants at a pole factory that AES Florestal had been operating. The conclusion of the audit was that a prior operator of the pole factory, Companhia Estadual de Energia (“CEEE”), had been using those contaminants to treat the poles that were manufactured at the factory. On their initiative, AES Sul and AES Florestal communicated with Brazilian authorities and CEEE about the adoption of containment and remediation measures. In March 2008, the State Attorney of the state of Rio Grande do Sul, Brazil filed a public civil action against AES Sul, AES Florestal and CEEE seeking an order requiring the companies to recover the contaminated area located on the grounds of the pole factory and an indemnity payment of approximately
R$6 million
(
$2 million
) to the state's Environmental Fund. In October 2011, the State Attorney Office filed a request for an injunction ordering the defendant companies to contain and remove the contamination immediately. The court granted injunctive relief on October 18, 2011, but determined only that defendant CEEE was required to proceed with the removal work. In May 2012, CEEE began the removal work in compliance with the injunction. The removal costs are estimated to be approximately
R$60 million
(
$17 million
) and the work was completed in February 2014. In parallel with the removal activities, a court-appointed expert investigation took place, which was concluded in May 2014. The court-appointed expert final report was presented to the State Attorneys in October 2014, and in January 2015 to the defendant companies. In March 2015, AES Sul and AES Florestal submitted comments and supplementary questions regarding the expert report. The Company believes that it has meritorious defenses to the claims asserted against it
64
and will defend itself vigorously in these proceedings; however, there can be no assurances that it will be successful in its efforts.
In March 2009, AES Uruguaiana Empreendimentos S.A. (“AESU”) in Brazil initiated arbitration in the ICC against YPF S.A. (“YPF”) seeking damages and other relief relating to YPF's breach of the parties' gas supply agreement (“GSA”). Thereafter, in April 2009, YPF initiated arbitration in the ICC against AESU and two unrelated parties, Companhia de Gas do Estado do Rio Grande do Sul and Transportador de Gas del Mercosur S.A. (“TGM”), claiming that AESU wrongfully terminated the GSA and caused the termination of a transportation agreement (“TA”) between YPF and TGM (“YPF Arbitration”). YPF sought an unspecified amount of damages from AESU, a declaration that YPF's performance was excused under the GSA due to certain alleged force majeure events, or, in the alternative, a declaration that the GSA and the TA should be terminated without a finding of liability against YPF because of the allegedly onerous obligations imposed on YPF by those agreements. In addition, in the YPF Arbitration, TGM asserted that if it was determined that AESU was responsible for the termination of the GSA, AESU was liable for TGM's alleged losses, including losses under the TA. In April 2011, the arbitrations were consolidated into a single proceeding. The hearing on liability issues took place in December 2011. In May 2013, the arbitral tribunal issued a liability award in AESU's favor. YPF thereafter challenged the award in Argentine court. In December 2015, an Argentine court issued a decision purporting to annul the liability award. AESU has appealed to the Supreme Court of Argentina. Also, AESU has initiated an action in New York federal court to recognize the liability award. The damages hearing in the arbitration took place on November 16-17, 2015. In April 2016, the tribunal issued a damages award in AESU’s favor. YPF has not paid the damages awarded to AESU and may attempt to challenge the damages award. AESU believes it has meritorious claims and defenses and will assert them vigorously; however, there can be no assurances that it will be successful in its efforts.
In October 2009, AES Mérida III, S. de R.L. de C.V. (“AES Mérida”), one of our businesses in Mexico, initiated arbitration against its fuel supplier and electricity offtaker, Comisión Federal de Electricidad (“CFE”), seeking a declaration that CFE breached the parties' PPA by supplying gas that did not comply with the PPA's specifications. Alternatively, AES Mérida requested a declaration that the supply of such gas by CFE is a force majeure event under the PPA. CFE disputed the claims. Although it did not assert counterclaims, in its closing brief CFE asserted that it is entitled to a partial refund of the capacity charge payments that it made for power generated with the out-of-specification gas. In July 2012, the arbitral tribunal issued an award in AES Mérida's favor. In December 2012, CFE initiated an action in Mexican court seeking to nullify the award. AES Mérida opposed the request and asserted a counterclaim to confirm the award. In February 2014, the court rejected CFE's claims and granted AES Mérida's request to confirm the award. CFE has appealed the court's decision. In May 2016,
the Mexican Supreme Court affirmed the court’s decision, rejecting CFE’s request to annul the arbitration award in AES Mérida’s favor.
In October 2009, IPL received a NOV and Finding of Violation from the EPA pursuant to the CAA Section 113(a). The NOV alleges violations of the CAA at IPL's three primarily coal-fired electric generating facilities dating back to 1986. The alleged violations primarily pertain to the Prevention of Significant Deterioration and nonattainment New Source Review requirements under the CAA. Since receiving the letter, IPL management has met with EPA staff regarding possible resolutions of the NOV. At this time, we cannot predict the ultimate resolution of this matter. However, settlements and litigated outcomes of similar cases have required companies to pay civil penalties, install additional pollution control technology on coal-fired electric generating units, retire existing generating units, and invest in additional environmental projects. A similar outcome in this case could have a material impact to IPL and could, in turn, have a material impact on the Company. IPL would seek recovery of any operating or capital expenditures related to air pollution control technology to reduce regulated air emissions; however, there can be no assurances that it would be successful in that regard.
In June 2011, the São Paulo Municipal Tax Authority (the “Tax Authority”) filed 60 tax assessments in São Paulo administrative court against Eletropaulo, seeking to collect services tax (“ISS”) that allegedly had not been paid on revenues for services rendered by Eletropaulo. Eletropaulo challenged the assessments on the ground that the revenues at issue were not subject to ISS. In October 2013, the First Instance Administrative Court determined that Eletropaulo was liable for ISS, interest, and related penalties totaling approximately
R$3.3 billion
(
$955 million
) as estimated by Eletropaulo. Eletropaulo thereafter appealed to the Second Instance Administrative Court (“SIAC”). In January 2016, the Tax Authority reduced the total amount of the ISS assessments to approximately
R$250 million
(
$72 million
). The reduced amount of ISS remains under consideration by the SIAC. No tax is due while the appeal is pending. Eletropaulo believes it has meritorious defenses and will defend itself vigorously in these proceedings; however, there can be no assurances that it will be successful in its efforts.
In January 2012, the Brazil Federal Tax Authority issued an assessment alleging that AES Tietê paid PIS and COFINS taxes from 2007 to 2010 at a lower rate than the tax authority believed was applicable. AES Tietê
65
challenged the assessment on the ground that the tax rate was set in the applicable legislation. In April 2013, the First Instance Administrative Court determined that AES Tietê should have calculated the taxes at the higher rate and that AES Tietê was liable for unpaid taxes, interest and penalties totaling approximately
R$935 million
(
$270 million
) as estimated by AES Tietê. AES Tietê appealed to the SIAC. In January 2015, the SIAC issued a decision in AES Tietê's favor, finding that AES Tietê was not liable for unpaid taxes. The public prosecutor subsequently filed an appeal, which was denied as untimely. The Tax Authority thereafter filed a motion for clarification of the SIAC's decision, which motion remains pending. AES Tietê believes it has meritorious defenses to the claim and will defend itself vigorously in these proceedings; however, there can be no assurances that it will be successful in its efforts.
In August 2012, Fondo Patrimonial de las Empresas Reformadas (“FONPER”) (the Dominican instrumentality that holds the Dominican Republic's shares in Empresa Generadora de Electricidad Itabo, S.A. (“Itabo”)) filed a criminal complaint against certain current and former employees of AES. The criminal proceedings include a related civil component initiated against, among others, Coastal Itabo, Ltd. (“Coastal”) (the AES affiliate shareholder of Itabo) and New Caribbean Investment, S.A. (“NC”) (the AES affiliate that manages Itabo). FONPER asserts claims relating to the alleged mismanagement of Itabo and seeks approximately $270 million in damages. The Dominican District Attorney (“DA”) thereafter admitted the criminal complaint and requested that the Dominican Republic's Cámara de Cuentas (“Cámara”) perform an audit of the allegations in the criminal complaint. In October 2015, the Cámara issued its final report, determining that the contested actions of the AES employees were in accordance with Dominican law. Further, in August 2012, Coastal and NC initiated an international arbitration proceeding against FONPER and the Dominican Republic (“Respondents”), seeking a declaration that Coastal and NC have acted both lawfully and in accordance with the relevant contracts with the Respondents in relation to the management of Itabo. Coastal and NC also seek a declaration that the criminal complaint is a breach of the relevant contracts between the parties, including the obligation to arbitrate disputes. Coastal and NC further seek damages from the Respondents resulting from their breach of contract. The Respondents have denied the claims and challenged the jurisdiction of the arbitral tribunal. In February 2015, the Respondents made an application requesting that the tribunal rule on their jurisdictional objections prior to giving any consideration to the merits of the claims of Coastal and NC. In August 2015, the tribunal rejected the application. The tribunal has established the procedural schedule for the arbitration, but has not yet scheduled dates for the final evidentiary hearing. At the parties' request, the tribunal has suspended the arbitration until August 15, 2016. The AES parties believe they have meritorious claims and defenses, which they will assert vigorously; however, there can be no assurances that they will be successful in their efforts.
In January 2015, DPL received NOVs from the EPA alleging violations of opacity at Stuart and Killen Stations, and in October 2015, IPL received a similar NOV alleging violations at Petersburg Station. In February 2016, IPL received an NOV from the EPA alleging violations of NSR and other CAA regulations, the Indiana SIP, and the Title V operating permit at Petersburg Station. It is too early to determine whether the NOVs could have a material impact on our business, financial condition or results of our operations. We would seek recovery of any operating or capital expenditures for IPL, but not fines or penalties, related to air pollution control technology to reduce regulated air emissions; however, there can be no assurances that we would be successful in this regard.
In July 2015, BTG Pactual (“BTG”) initiated arbitration against AES Tietê under the parties' PPA. BTG claims that AES Tietê breached the PPA by purchasing more power than it was entitled to take under the PPA. BTG seeks to recover the payments that AES Tietê received from its spot-market sales of BTG's power, totaling approximately
R$30 million
(
$9 million
). BTG also seeks to terminate the PPA and to collect a termination payment of approximately
R$560 million
(
$162 million
). AES Tietê has placed
R$30 million
(
$9 million
) into escrow, with a full reservation of rights. AES Tietê has responded to the arbitration demand, contesting the claims against it. The evidentiary hearing is scheduled for August 29, 2016. AES Tietê believes it has meritorious defenses to the claims asserted against it and will defend itself vigorously in this proceeding; however, there can be no assurances that it will be successful in its efforts.
In September 2015, AES Southland Development, LLC and AES Redondo Beach, LLC filed a lawsuit against the California Coastal Commission (the “CCC”) over the CCC's determination that the site of AES Redondo Beach included approximately 5.93 acres of CCC-jurisdictional wetlands. The CCC has asserted that AES Redondo Beach has improperly installed and operated water pumps affecting the alleged wetlands in violation of the California Coastal Act and Redondo Beach Local Coastal Program and has ordered AES Redondo Beach to restore the site. Additional potential outcomes of the CCC determination could include an order requiring AES Redondo Beach to fund a wetland mitigation project and/or pay fines or penalties. AES Redondo Beach believes that it has meritorious arguments and intends to vigorously prosecute such lawsuit, but there can be no assurances that it will be successful.
66
In October 2015, Ganadera Guerra, S.A. (“GG”) and Constructora Tymsa, S.A. (“CT”) filed separate lawsuits against AES Panama in the local courts of Panama. The claimants allege that AES Panama profited from a hydropower facility (La Estrella) being partially located on land owned initially
by GG and currently by CT, and that AES Panama must pay compensation for its use of the land. The damages sought from AES Panama are approximately $680 million (GG) and $100 million (CT). Also, there are ongoing administrative proceedings concerning whether AES Panama is entitled to purchase the land and whether AES Panama can continue to occupy the land. AES Panama believes it has meritorious defenses and claims and will assert them
vigorously; however, there can be no assurances that it will be successful in its efforts.
There have been no material changes to the risk factors disclosed in Part I
—
Item 1A.
—Risk Factors
of our
2015
Form 10-K.
None.
None.
Not applicable.
In June 2016, the Company executed an agreement for the sale of its wholly-owned subsidiary AES Sul, a distribution business in Brazil. On August 3, 2016, the Company determined that an impairment at Sul is required. Accordingly, as disclosed in Item 2: Management’s Discussion and Analysis of Financial Condition and Results of Operations - Key Trends and Uncertainties, the Company recognized an after tax loss of $382 million comprised of a pretax impairment charge of $783 million, offset by a tax benefit of $266 million related to the impairment of the Sul long lived assets and a tax benefit of $135 million for deferred taxes related to the investment in AES Sul. The carrying value of the AES Sul asset group of $1.6 billion was greater than its approximate fair value less costs to sell of $470 million. However, the impairment charge was limited to the carrying value of the long lived assets of the AES Sul disposal group as of June 30, 2016. Upon disposal of AES Sul, we expect to incur an additional after tax loss on sale of approximately $700 million subject to factors such as adjustments to sales proceeds and potential future movements in exchange rates. The cumulative impact to earnings of the impairment and loss on sale is expected to be approximately $1.1 billion. This includes the reclassification of approximately $1 billion of cumulative translation losses, resulting in an expected net reduction to the Company’s stockholders’ equity of approximately $100 million.
|
4.1
|
Twentieth Supplemental Indenture, dated May 25, 2016, between The AES Corporation and Wells Fargo Bank, N.A., as Trustee is incorporated herein by reference to Exhibit 4.1 of the Company’s 8-K filed on May 25, 2016.
|
|
|
10.1
|
Amendment No.1, dated as of May 6, 2016, to the Sixth Amended and Restated Credit and Reimbursement Agreement, dated as of July 26, 2013 among The AES Corporation, a Delaware corporation, the Banks listed on the signature pages thereof and Citibank, N.A., as Administrative Agent and Collateral Agent is incorporated herein by reference to Exhibit 10.1 of the Company’s Form 8-K filed on May 9, 2016.
|
|
|
31.1
|
Rule13a-14(a)/15d-14(a) Certification of Andrés Gluski (filed herewith).
|
|
|
31.2
|
Rule 13a-14(a)/15d-14(a) Certification of Thomas M. O’Flynn (filed herewith).
|
|
|
32.1
|
Section 1350 Certification of Andrés Gluski (filed herewith).
|
|
|
32.2
|
Section 1350 Certification of Thomas M. O’Flynn (filed herewith).
|
|
|
101.INS
|
XBRL Instance Document (filed herewith).
|
|
|
101.SCH
|
XBRL Taxonomy Extension Schema Document (filed herewith).
|
|
|
101.CAL
|
XBRL Taxonomy Extension Calculation Linkbase Document (filed herewith).
|
|
|
101.DEF
|
XBRL Taxonomy Extension Definition Linkbase Document (filed herewith).
|
|
|
101.LAB
|
XBRL Taxonomy Extension Label Linkbase Document (filed herewith).
|
|
|
101.PRE
|
XBRL Taxonomy Extension Presentation Linkbase Document (filed herewith).
|
|
67
SIGNATURES
Pursuant to the requirements of the Securities Exchange Act of 1934, the registrant has duly caused this report to be signed on its behalf by the undersigned thereunto duly authorized.
|
THE AES CORPORATION
(Registrant)
|
|||||
|
Date:
|
August 4, 2016
|
By:
|
/s/ T
HOMAS
M. O’F
LYNN
|
||
|
Name:
|
Thomas M. O’Flynn
|
||||
|
Title:
|
Executive Vice President and Chief Financial Officer (Principal Financial Officer)
|
||||
|
By:
|
/s/ F
ABIAN
E. S
OUZA
|
||||
|
Name:
|
Fabian E. Souza
|
||||
|
Title:
|
Vice President and Controller (Principal Accounting Officer)
|
||||
68
TABLE OF CONTENTS
Part I: Financial InformationItem 1. Financial StatementsItem 2. Management S Discussion and Analysis Of Financial Condition and Results Of OperationsItem 3. Quantitative and Qualitative Disclosures About Market RiskItem 4. Controls and ProceduresPart Ii: Other InformationItem 1. Legal ProceedingsItem 1A. Risk FactorsItem 2. Unregistered Sales Of Equity Securities and Use Of ProceedsItem 3. Defaults Upon Senior SecuritiesItem 4. Mine Safety DisclosuresItem 5. Other InformationItem 6. Exhibits