AES CORP
10-Ks and 10-Qs
|
|
|
|
|
|
|
|
|
|
|
|
|
|
|
|
|
|
|
|
|
|
|
|
|
|
|
|
|
|
|
|
|
|
|
|
|
|
|
|
|
|
|
|
|
|
|
|
|
|
|
|
|
|
|
|
|
|
|
UNITED STATES
SECURITIES AND EXCHANGE COMMISSION
WASHINGTON, D.C. 20549
______________________________________________________________________________________________
FORM
10-Q
(Mark One)
|
x
|
QUARTERLY REPORT PURSUANT TO SECTION 13 OR 15(d) OF THE SECURITIES EXCHANGE ACT OF 1934
|
For the Quarterly Period Ended
September 30, 2018
or
|
¨
|
TRANSITION REPORT PURSUANT TO SECTION 13 OR 15(d) OF THE SECURITIES EXCHANGE ACT OF 1934
|
Commission file number 1-12291

THE AES CORPORATION
(Exact name of registrant as specified in its charter)
|
Delaware
|
54 1163725
|
|
|
(State or other jurisdiction of incorporation or organization)
|
(I.R.S. Employer Identification No.)
|
|
|
4300 Wilson Boulevard Arlington, Virginia
|
22203
|
|
|
(Address of principal executive offices)
|
(Zip Code)
|
|
(703) 522-1315
Registrant’s telephone number, including area code:
______________________________________________________________________________________________
Indicate by check mark whether the registrant (1) has filed all reports required to be filed by Section 13 or 15(d) of the Securities Exchange Act of 1934 during the preceding 12 months (or for such shorter period that the registrant was required to file such reports), and (2) has been subject to such filing requirements for the past 90 days. Yes
x
No
¨
Indicate by check mark whether the registrant has submitted electronically every Interactive Data File required to be submitted pursuant to Rule 405 of Regulation S-T (§232.405 of this chapter) during the preceding 12 months (or for such shorter period that the registrant was required to submit such files). Yes
x
No
¨
Indicate by check mark whether the registrant is a large accelerated filer, an accelerated filer, a non-accelerated filer, a smaller reporting company, or an emerging growth company. See the definitions of “large accelerated filer”, “accelerated filer”, “smaller reporting company”, and “emerging growth company” in Rule 12b-2 of the Exchange Act.
|
Large accelerated filer
x
|
Accelerated filer
¨
|
Smaller reporting company
¨
|
Emerging growth company
¨
|
Non-accelerated filer
¨
|
||||
If an emerging growth company, indicate by check mark if the registrant has elected not to use the extended transition period for complying with any new or revised financial accounting standards provided pursuant to Section 13(a) of the Exchange Act.
¨
Indicate by check mark whether the registrant is a shell company (as defined in Rule 12b-2 of the Exchange Act). Yes
¨
No
x
______________________________________________________________________________________________
The number of shares outstanding of Registrant’s Common Stock, par value
$
0.01
per share, on
October 30, 2018
was
662,297,479
.
THE AES CORPORATION
FORM 10-Q
FOR THE QUARTERLY PERIOD ENDED
SEPTEMBER 30, 2018
TABLE OF CONTENTS
|
ITEM 1.
|
||
|
ITEM 2.
|
||
|
ITEM 3.
|
||
|
ITEM 4.
|
||
|
ITEM 1.
|
||
|
ITEM 1A.
|
||
|
ITEM 2.
|
||
|
ITEM 3.
|
||
|
ITEM 4.
|
||
|
ITEM 5.
|
||
|
ITEM 6.
|
||
GLOSSARY OF TERMS
The following terms and acronyms appear in the text of this report and have the definitions indicated below:
|
Adjusted EPS
|
Adjusted Earnings Per Share, a non-GAAP measure
|
|
Adjusted PTC
|
Adjusted Pretax Contribution, a non-GAAP measure of operating performance
|
|
AFS
|
Available For Sale
|
|
AOCI
|
Accumulated Other Comprehensive Income
|
|
AOCL
|
Accumulated Other Comprehensive Loss
|
|
ASC
|
Accounting Standards Codification
|
|
ASU
|
Accounting Standards Update
|
|
CAA
|
United States Clean Air Act
|
|
CAMMESA
|
Wholesale Electric Market Administrator in Argentina
|
|
CHP
|
Combined Heat and Power
|
|
COFINS
|
Contribution for the Financing of Social Security
|
|
DG Comp
|
Directorate-General for Competition
|
|
DP&L
|
The Dayton Power & Light Company
|
|
DPL
|
DPL Inc.
|
|
EPA
|
United States Environmental Protection Agency
|
|
EPC
|
Engineering, Procurement and Construction
|
|
EURIBOR
|
Euro Interbank Offered Rate
|
|
FASB
|
Financial Accounting Standards Board
|
|
FX
|
Foreign Exchange
|
|
GAAP
|
Generally Accepted Accounting Principles in the United States
|
|
GHG
|
Greenhouse Gas
|
|
GILTI
|
Global Intangible Low Taxed Income
|
|
GW
|
Gigawatts
|
|
HLBV
|
Hypothetical Liquidation Book Value
|
|
HPP
|
Hydropower Plant
|
|
IPALCO
|
IPALCO Enterprises, Inc.
|
|
IPL
|
Indianapolis Power & Light Company
|
|
ISO
|
Independent System Operator
|
|
LIBOR
|
London Interbank Offered Rate
|
|
MW
|
Megawatts
|
|
MWh
|
Megawatt Hours
|
|
NCI
|
Noncontrolling Interest
|
|
NEK
|
Natsionalna Elektricheska Kompania (state-owned electricity public supplier in Bulgaria)
|
|
NM
|
Not Meaningful
|
|
NOV
|
Notice of Violation
|
|
NO
X
|
Nitrogen Oxides
|
|
OPGC
|
Odisha Power Generation Corporation
|
|
PIS
|
Program of Social Integration
|
|
PPA
|
Power Purchase Agreement
|
|
PREPA
|
Puerto Rico Electric Power Authority
|
|
RSU
|
Restricted Stock Unit
|
|
RTO
|
Regional Transmission Organization
|
|
SBU
|
Strategic Business Unit
|
|
SEC
|
United States Securities and Exchange Commission
|
|
SO
2
|
Sulfur Dioxide
|
|
TCJA
|
Tax Cuts and Jobs Act
|
|
U.S.
|
United States
|
|
USD
|
United States Dollar
|
|
VAT
|
Value-Added Tax
|
|
VIE
|
Variable Interest Entity
|
1
THE AES CORPORATION
(Unaudited)
|
September 30,
2018 |
December 31,
2017 |
||||||
|
(in millions, except share and per share data)
|
|||||||
|
ASSETS
|
|||||||
|
CURRENT ASSETS
|
|||||||
|
Cash and cash equivalents
|
$
|
|
|
$
|
|
|
|
|
Restricted cash
|
|
|
|
|
|||
|
Short-term investments
|
|
|
|
|
|||
|
Accounts receivable, net of allowance for doubtful accounts of $16 and $10, respectively
|
|
|
|
|
|||
|
Inventory
|
|
|
|
|
|||
|
Prepaid expenses
|
|
|
|
|
|||
|
Other current assets
|
|
|
|
|
|||
|
Current held-for-sale assets
|
|
|
|
|
|||
|
Total current assets
|
|
|
|
|
|||
|
NONCURRENT ASSETS
|
|||||||
|
Property, Plant and Equipment:
|
|||||||
|
Land
|
|
|
|
|
|||
|
Electric generation, distribution assets and other
|
|
|
|
|
|||
|
Accumulated depreciation
|
(
|
)
|
(
|
)
|
|||
|
Construction in progress
|
|
|
|
|
|||
|
Property, plant and equipment, net
|
|
|
|
|
|||
|
Other Assets:
|
|||||||
|
Investments in and advances to affiliates
|
|
|
|
|
|||
|
Debt service reserves and other deposits
|
|
|
|
|
|||
|
Goodwill
|
|
|
|
|
|||
|
Other intangible assets, net of accumulated amortization of $472 and $441, respectively
|
|
|
|
|
|||
|
Deferred income taxes
|
|
|
|
|
|||
|
Service concession assets, net of accumulated amortization of $0 and $206, respectively
|
|
|
|
|
|||
|
Loan receivable
|
|
|
|
|
|||
|
Other noncurrent assets
|
|
|
|
|
|||
|
Total other assets
|
|
|
|
|
|||
|
TOTAL ASSETS
|
$
|
|
|
$
|
|
|
|
|
LIABILITIES AND EQUITY
|
|||||||
|
CURRENT LIABILITIES
|
|||||||
|
Accounts payable
|
$
|
|
|
$
|
|
|
|
|
Accrued interest
|
|
|
|
|
|||
|
Accrued and other liabilities
|
|
|
|
|
|||
|
Non-recourse debt, includes $368 and $1,012, respectively, related to variable interest entities
|
|
|
|
|
|||
|
Current held-for-sale liabilities
|
|
|
|
|
|||
|
Total current liabilities
|
|
|
|
|
|||
|
NONCURRENT LIABILITIES
|
|||||||
|
Recourse debt
|
|
|
|
|
|||
|
Non-recourse debt, includes $2,832 and $1,358, respectively, related to variable interest entities
|
|
|
|
|
|||
|
Deferred income taxes
|
|
|
|
|
|||
|
Other noncurrent liabilities
|
|
|
|
|
|||
|
Total noncurrent liabilities
|
|
|
|
|
|||
|
Commitments and Contingencies (see Note 8)
|
|||||||
|
Redeemable stock of subsidiaries
|
|
|
|
|
|||
|
EQUITY
|
|||||||
|
THE AES CORPORATION STOCKHOLDERS’ EQUITY
|
|||||||
|
Common stock ($0.01 par value, 1,200,000,000 shares authorized; 817,203,691 issued and 662,297,479 outstanding at September 30, 2018 and 816,312,913 issued and 660,388,128 outstanding at December 31, 2017)
|
|
|
|
|
|||
|
Additional paid-in capital
|
|
|
|
|
|||
|
Accumulated deficit
|
(
|
)
|
(
|
)
|
|||
|
Accumulated other comprehensive loss
|
(
|
)
|
(
|
)
|
|||
|
Treasury stock, at cost (154,906,212 and 155,924,785 shares at September 30, 2018 and December 31, 2017, respectively)
|
(
|
)
|
(
|
)
|
|||
|
Total AES Corporation stockholders’ equity
|
|
|
|
|
|||
|
NONCONTROLLING INTERESTS
|
|
|
|
|
|||
|
Total equity
|
|
|
|
|
|||
|
TOTAL LIABILITIES AND EQUITY
|
$
|
|
|
$
|
|
|
|
See Notes to Condensed Consolidated Financial Statements.
2
THE AES CORPORATION
(Unaudited)
|
Three Months Ended September 30,
|
Nine Months Ended September 30,
|
||||||||||||||
|
2018
|
2017
|
2018
|
2017
|
||||||||||||
|
(in millions, except per share amounts)
|
|||||||||||||||
|
Revenue:
|
|||||||||||||||
|
Regulated
|
$
|
|
|
$
|
|
|
$
|
|
|
$
|
|
|
|||
|
Non-Regulated
|
|
|
|
|
|
|
|
|
|||||||
|
Total revenue
|
|
|
|
|
|
|
|
|
|||||||
|
Cost of Sales:
|
|||||||||||||||
|
Regulated
|
(
|
)
|
(
|
)
|
(
|
)
|
(
|
)
|
|||||||
|
Non-Regulated
|
(
|
)
|
(
|
)
|
(
|
)
|
(
|
)
|
|||||||
|
Total cost of sales
|
(
|
)
|
(
|
)
|
(
|
)
|
(
|
)
|
|||||||
|
Operating margin
|
|
|
|
|
|
|
|
|
|||||||
|
General and administrative expenses
|
(
|
)
|
(
|
)
|
(
|
)
|
(
|
)
|
|||||||
|
Interest expense
|
(
|
)
|
(
|
)
|
(
|
)
|
(
|
)
|
|||||||
|
Interest income
|
|
|
|
|
|
|
|
|
|||||||
|
Loss on extinguishment of debt
|
(
|
)
|
(
|
)
|
(
|
)
|
(
|
)
|
|||||||
|
Other expense
|
(
|
)
|
(
|
)
|
(
|
)
|
(
|
)
|
|||||||
|
Other income
|
|
|
|
|
|
|
|
|
|||||||
|
Gain (loss) on disposal and sale of businesses
|
(
|
)
|
(
|
)
|
|
|
(
|
)
|
|||||||
|
Asset impairment expense
|
(
|
)
|
(
|
)
|
(
|
)
|
(
|
)
|
|||||||
|
Foreign currency transaction gains (losses)
|
|
|
|
|
(
|
)
|
|
|
|||||||
|
INCOME FROM CONTINUING OPERATIONS BEFORE TAXES AND EQUITY IN EARNINGS OF AFFILIATES
|
|
|
|
|
|
|
|
|
|||||||
|
Income tax expense
|
(
|
)
|
(
|
)
|
(
|
)
|
(
|
)
|
|||||||
|
Net equity in earnings of affiliates
|
|
|
|
|
|
|
|
|
|||||||
|
INCOME FROM CONTINUING OPERATIONS
|
|
|
|
|
|
|
|
|
|||||||
|
Income (loss) from operations of discontinued businesses, net of income tax expense of $0, $17, $2 and $24, respectively
|
(
|
)
|
|
|
(
|
)
|
|
|
|||||||
|
Gain from disposal of discontinued businesses, net of income tax expense of $2, $0, $44 and $0, respectively
|
|
|
|
|
|
|
|
|
|||||||
|
NET INCOME
|
|
|
|
|
|
|
|
|
|||||||
|
Noncontrolling interests:
|
|||||||||||||||
|
Less: Income from continuing operations attributable to noncontrolling interests and redeemable stocks of subsidiaries
|
(
|
)
|
(
|
)
|
(
|
)
|
(
|
)
|
|||||||
|
Less: Loss (income) from discontinued operations attributable to noncontrolling interests
|
|
|
(
|
)
|
|
|
(
|
)
|
|||||||
|
NET INCOME ATTRIBUTABLE TO THE AES CORPORATION
|
$
|
|
|
$
|
|
|
$
|
|
|
$
|
|
|
|||
|
AMOUNTS ATTRIBUTABLE TO THE AES CORPORATION COMMON STOCKHOLDERS:
|
|||||||||||||||
|
Income from continuing operations, net of tax
|
$
|
|
|
$
|
|
|
$
|
|
|
$
|
|
|
|||
|
Income (loss) from discontinued operations, net of tax
|
(
|
)
|
|
|
|
|
|
|
|||||||
|
NET INCOME ATTRIBUTABLE TO THE AES CORPORATION
|
$
|
|
|
$
|
|
|
$
|
|
|
$
|
|
|
|||
|
BASIC EARNINGS PER SHARE:
|
|||||||||||||||
|
Income from continuing operations attributable to The AES Corporation common stockholders, net of tax
|
$
|
|
|
$
|
|
|
$
|
|
|
$
|
|
|
|||
|
Income from discontinued operations attributable to The AES Corporation common stockholders, net of tax
|
|
|
|
|
|
|
|
|
|||||||
|
NET INCOME ATTRIBUTABLE TO THE AES CORPORATION COMMON STOCKHOLDERS
|
$
|
|
|
$
|
|
|
$
|
|
|
$
|
|
|
|||
|
DILUTED EARNINGS PER SHARE:
|
|||||||||||||||
|
Income from continuing operations attributable to The AES Corporation common stockholders, net of tax
|
$
|
|
|
$
|
|
|
$
|
|
|
$
|
|
|
|||
|
Income from discontinued operations attributable to The AES Corporation common stockholders, net of tax
|
|
|
|
|
|
|
|
|
|||||||
|
NET INCOME ATTRIBUTABLE TO THE AES CORPORATION COMMON STOCKHOLDERS
|
$
|
|
|
$
|
|
|
$
|
|
|
$
|
|
|
|||
|
DILUTED SHARES OUTSTANDING
|
|
|
|
|
|
|
|
|
|||||||
|
DIVIDENDS DECLARED PER COMMON SHARE
|
$
|
|
|
$
|
|
|
$
|
|
|
$
|
|
|
|||
See Notes to Condensed Consolidated Financial Statements.
3
THE AES CORPORATION
Condensed Consolidated Statements of Comprehensive Income
(Unaudited)
|
Three Months Ended September 30,
|
Nine Months Ended September 30,
|
||||||||||||||
|
2018
|
2017
|
2018
|
2017
|
||||||||||||
|
(in millions)
|
|||||||||||||||
|
NET INCOME
|
$
|
|
|
$
|
|
|
$
|
|
|
$
|
|
|
|||
|
Foreign currency translation activity:
|
|||||||||||||||
|
Foreign currency translation adjustments, net of income tax benefit of $2, $1, $3 and $0, respectively
|
(
|
)
|
|
|
(
|
)
|
|
|
|||||||
|
Reclassification to earnings, net of $0 income tax
|
(
|
)
|
|
|
(
|
)
|
|
|
|||||||
|
Total foreign currency translation adjustments
|
(
|
)
|
|
|
(
|
)
|
|
|
|||||||
|
Derivative activity:
|
|||||||||||||||
|
Change in derivative fair value, net of income tax benefit (expense) of $(3), $(6), $(3) and $15, respectively
|
|
|
|
|
|
|
(
|
)
|
|||||||
|
Reclassification to earnings, net of income tax benefit (expense) of $(7), $5, $(15) and $(6), respectively
|
|
|
|
|
|
|
|
|
|||||||
|
Total change in fair value of derivatives
|
|
|
|
|
|
|
|
|
|||||||
|
Pension activity:
|
|||||||||||||||
|
Reclassification to earnings, net of income tax expense of $0, $4, $2 and $10, respectively
|
|
|
|
|
|
|
|
|
|||||||
|
Total pension adjustments
|
|
|
|
|
|
|
|
|
|||||||
|
OTHER COMPREHENSIVE INCOME (LOSS)
|
(
|
)
|
|
|
(
|
)
|
|
|
|||||||
|
COMPREHENSIVE INCOME
|
|
|
|
|
|
|
|
|
|||||||
|
Less: Comprehensive income attributable to noncontrolling interests
|
(
|
)
|
(
|
)
|
(
|
)
|
(
|
)
|
|||||||
|
COMPREHENSIVE INCOME ATTRIBUTABLE TO THE AES CORPORATION
|
$
|
|
|
$
|
|
|
$
|
|
|
$
|
|
|
|||
See Notes to Condensed Consolidated Financial Statements.
4
THE AES CORPORATION
(Unaudited)
|
Nine Months Ended September 30,
|
|||||||
|
2018
|
2017
|
||||||
|
(in millions)
|
|||||||
|
OPERATING ACTIVITIES:
|
|||||||
|
Net income
|
$
|
|
|
$
|
|
|
|
|
Adjustments to net income:
|
|||||||
|
Depreciation and amortization
|
|
|
|
|
|||
|
Loss (gain) on disposal and sale of businesses
|
(
|
)
|
|
|
|||
|
Impairment expenses
|
|
|
|
|
|||
|
Deferred income taxes
|
|
|
(
|
)
|
|||
|
Provisions for contingencies
|
|
|
|
|
|||
|
Loss on extinguishment of debt
|
|
|
|
|
|||
|
Net loss on sales of assets
|
|
|
|
|
|||
|
Gain on sale of discontinued operations
|
(
|
)
|
|
|
|||
|
Other
|
|
|
|
|
|||
|
Changes in operating assets and liabilities
|
|||||||
|
(Increase) decrease in accounts receivable
|
(
|
)
|
(
|
)
|
|||
|
(Increase) decrease in inventory
|
(
|
)
|
(
|
)
|
|||
|
(Increase) decrease in prepaid expenses and other current assets
|
|
|
|
|
|||
|
(Increase) decrease in other assets
|
(
|
)
|
(
|
)
|
|||
|
Increase (decrease) in accounts payable and other current liabilities
|
(
|
)
|
|
|
|||
|
Increase (decrease) in income taxes payable, net and other taxes payable
|
(
|
)
|
(
|
)
|
|||
|
Increase (decrease) in other liabilities
|
|
|
|
|
|||
|
Net cash provided by operating activities
|
|
|
|
|
|||
|
INVESTING ACTIVITIES:
|
|||||||
|
Capital expenditures
|
(
|
)
|
(
|
)
|
|||
|
Acquisitions of businesses, net of cash and restricted cash acquired, and equity method investments
|
(
|
)
|
(
|
)
|
|||
|
Proceeds from the sale of businesses, net of cash and restricted cash sold, and equity method investments
|
|
|
|
|
|||
|
Proceeds from the sale of assets
|
|
|
|
|
|||
|
Sale of short-term investments
|
|
|
|
|
|||
|
Purchase of short-term investments
|
(
|
)
|
(
|
)
|
|||
|
Contributions to equity affiliates
|
(
|
)
|
(
|
)
|
|||
|
Other investing
|
(
|
)
|
(
|
)
|
|||
|
Net cash used in investing activities
|
(
|
)
|
(
|
)
|
|||
|
FINANCING ACTIVITIES:
|
|||||||
|
Borrowings under the revolving credit facilities
|
|
|
|
|
|||
|
Repayments under the revolving credit facilities
|
(
|
)
|
(
|
)
|
|||
|
Issuance of recourse debt
|
|
|
|
|
|||
|
Repayments of recourse debt
|
(
|
)
|
(
|
)
|
|||
|
Issuance of non-recourse debt
|
|
|
|
|
|||
|
Repayments of non-recourse debt
|
(
|
)
|
(
|
)
|
|||
|
Payments for financing fees
|
(
|
)
|
(
|
)
|
|||
|
Distributions to noncontrolling interests
|
(
|
)
|
(
|
)
|
|||
|
Contributions from noncontrolling interests and redeemable security holders
|
|
|
|
|
|||
|
Dividends paid on AES common stock
|
(
|
)
|
(
|
)
|
|||
|
Payments for financed capital expenditures
|
(
|
)
|
(
|
)
|
|||
|
Proceeds from sales to noncontrolling interests
|
|
|
|
|
|||
|
Other financing
|
|
|
(
|
)
|
|||
|
Net cash provided by (used in) financing activities
|
(
|
)
|
|
|
|||
|
Effect of exchange rate changes on cash, cash equivalents and restricted cash
|
(
|
)
|
|
|
|||
|
(Increase) decrease in cash, cash equivalents and restricted cash of discontinued operations and held-for-sale businesses
|
|
|
(
|
)
|
|||
|
Total increase in cash, cash equivalents and restricted cash
|
|
|
|
|
|||
|
Cash, cash equivalents and restricted cash, beginning
|
|
|
|
|
|||
|
Cash, cash equivalents and restricted cash, ending
|
$
|
|
|
$
|
|
|
|
|
SUPPLEMENTAL DISCLOSURES:
|
|||||||
|
Cash payments for interest, net of amounts capitalized
|
$
|
|
|
$
|
|
|
|
|
Cash payments for income taxes, net of refunds
|
|
|
|
|
|||
|
SCHEDULE OF NON-CASH INVESTING AND FINANCING ACTIVITIES:
|
|||||||
|
Non-cash acquisition of intangible assets
|
$
|
|
|
$
|
|
|
|
|
Non-cash contributions of assets and liabilities for Fluence acquisition
|
|
|
|
|
|||
|
Non-cash exchange of debentures for the acquisition of the Guaimbê Solar Complex (see Note 18—Acquisitions)
|
|
|
|
|
|||
|
Conversion of Alto Maipo loans and accounts payable into equity (see Note 10—Equity)
|
|
|
|
|
|||
See Notes to Condensed Consolidated Financial Statements.
5
THE AES CORPORATION
Notes to Condensed Consolidated Financial Statements
For the
Three and Nine
Months Ended
September 30, 2018
and
2017
(Unaudited)
1
.
FINANCIAL STATEMENT PRESENTATION
The prior period condensed consolidated financial statements in this Quarterly Report on Form 10-Q (“Form 10-Q”) have been reclassified to reflect the businesses classified as discontinued operations as discussed in Note
16
—Discontinued Operations
. Certain prior period amounts have been reclassified to comply with newly adopted accounting standards. See further detail in the new accounting pronouncements discussion.
|
September 30, 2018
|
December 31, 2017
|
||||||
|
Cash and cash equivalents
|
$
|
|
|
$
|
|
|
|
|
Restricted cash
|
|
|
|
|
|||
|
Debt service reserves and other deposits
|
|
|
|
|
|||
|
Cash, Cash Equivalents, and Restricted Cash
|
$
|
|
|
$
|
|
|
|
New Accounting Pronouncements Adopted in 2018
—
The following table provides a brief description of recent accounting pronouncements that had an impact on the Company’s consolidated financial statements. Accounting pronouncements not listed below were assessed and determined to be either not applicable or did not have a material impact on the Company’s consolidated financial statements.
6
|
New Accounting Standards Adopted
|
|||
|
ASU Number and Name
|
Description
|
Date of Adoption
|
Effect on the financial statements upon adoption
|
|
2017-07, Compensation — Retirement Benefits (Topic 715): Improving the Presentation of Net Periodic Pension Cost and Net Periodic Postretirement Benefit Cost
|
This standard changes the presentation of non-service costs associated with defined benefit plans and updates the guidance so that only the service cost component will be eligible for capitalization.
Transition method: retrospective for presentation of non-service cost and prospective for the change in capitalization.
|
January 1, 2018
|
For the three and nine months ended September 30, 2017, $2 million and $1 million of gains primarily related to the expected return on plan assets were reclassified from Costs of Sales to Other Expense, respectively.
|
|
2017-05, Other Income — Gains and Losses from the Derecognition of Nonfinancial Assets (Topic 610-20): Clarifying the Scope of Asset Derecognition Guidance and Accounting for Partial Sales of Nonfinancial Assets
|
This standard clarifies the scope and application of ASC 610-20 on the sale, transfer, and derecognition of nonfinancial assets and in substance nonfinancial assets to non-customers, including partial sales. It also provides guidance on how gains and losses on transfers of nonfinancial assets and in substance nonfinancial assets to non-customers are recognized. The standard also clarifies that the derecognition of businesses is under the scope of ASC 810. The standard must be adopted concurrently with ASC 606, however an entity will not have to apply the same transition method as ASC 606.
Transition method: modified retrospective.
|
January 1, 2018
|
As more transactions will not meet the definition of a business due to the adoption of ASU 2017-01, more dispositions or partial sales will be out of the scope of ASC 810 and will be under this standard.
|
|
2017-01, Business Combinations (Topic 805): Clarifying the Definition of a Business
|
The standard requires an entity to first evaluate whether substantially all of the fair value of the gross assets acquired is concentrated in a single identifiable asset or a group of similar identifiable assets, and if that threshold is met, the set is not a business. As a second step, at least one substantive process should exist to be considered a business.
Transition method: prospective.
|
January 1, 2018
|
Some acquisitions and dispositions will now fall under a different accounting model. This will reduce the number of transactions that are accounted for as business combinations and therefore future acquired goodwill.
|
|
2016-18, Statement of Cash Flows (Topic 230): Restricted Cash (a consensus of the FASB Emerging Issues Task Force)
|
This standard requires that a statement of cash flows explain the change during the period in the total of cash, cash equivalents, and amounts generally described as restricted cash or restricted cash equivalents. Therefore, amounts generally described as restricted cash and restricted cash equivalents should be included with cash and cash equivalents when reconciling the beginning-of-period and end-of-period total amounts shown on the statement of cash flows.
Transition method: retrospective. |
January 1, 2018
|
For the nine months ended September 30, 2017, cash provided by operating activities increased by $12 million, cash used in investing activities decreased by $327 million, and cash provided by financing activities was unchanged.
|
|
2016-01, Financial Instruments — Overall (Subtopic 825-10): Recognition and Measurement of Financial Assets and Financial Liabilities
|
The standard significantly revises an entity’s accounting related to (1) classification and measurement of investments in equity securities and (2) the presentation of certain fair value changes for financial liabilities measured at fair value. It also amends certain disclosures of financial instruments.
Transition method: modified retrospective. Prospective for equity investments without readily determinable fair value.
|
January 1, 2018
|
No material impact upon adoption of the standard.
|
|
2014-09, 2015-14, 2016-08, 2016-10, 2016-12, 2016-20, 2017-10, 2017-13, Revenue from Contracts with Customers (Topic 606)
|
See discussion of the ASU below.
|
January 1, 2018
|
See impact upon adoption of the standard below.
|
On January 1, 2018, the Company adopted ASU 2014-09, "Revenue from Contracts with Customers," and its subsequent corresponding updates ("ASC 606"). Under this standard, an entity shall recognize revenue to depict the transfer of promised goods or services to customers in an amount that reflects the consideration to which the entity expects to be entitled in exchange for those goods or services. The Company applied the modified retrospective method of adoption to the contracts that were not completed as of January 1, 2018. Results for reporting periods beginning January 1, 2018 are presented under ASC 606, while prior period amounts were not adjusted and continue to be reported in accordance with the previous revenue recognition standard. For contracts that were modified before January 1, 2018, the Company reflected the aggregate effect of all modifications when identifying the satisfied and unsatisfied performance obligations, determining the transaction price and allocating the transaction price.
|
Condensed Consolidated Balance Sheet
|
Balance at
December 31, 2017
|
Adjustments Due to ASC 606
|
Balance at
January 1, 2018
|
||||||||
|
Assets
|
|||||||||||
|
Other current assets
|
$
|
|
|
$
|
|
|
$
|
|
|
||
|
Deferred income taxes
|
|
|
(
|
)
|
|
|
|||||
|
Service concession assets, net
|
|
|
(
|
)
|
|
|
|||||
|
Loan receivable
|
|
|
|
|
|
|
|||||
|
Equity
|
|||||||||||
|
Accumulated deficit
|
(
|
)
|
|
|
(
|
)
|
|||||
|
Accumulated other comprehensive loss
|
(
|
)
|
|
|
(
|
)
|
|||||
|
Noncontrolling interest
|
|
|
|
|
|
|
|||||
The Mong Duong II power plant in Vietnam is the primary driver of changes in revenue recognition under the new standard. This plant is operated under a build, operate, and transfer contract and will be transferred to the Vietnamese government after the completion of a 25-year PPA. Under the previous revenue recognition standard, construction costs were deferred to a service concession asset, which was expensed in proportion to revenue recognized for the construction element over the term of the PPA. Under ASC 606, construction revenue and associated costs are recognized as construction activity occurs. As construction of the plant was substantially completed in 2015, revenues and costs associated with the construction were recognized through retained earnings, and the service concession asset was derecognized. A loan receivable was recognized for the future expected payments for the construction performance obligation. As the payments for the construction performance obligation occur over a 25-year term, a significant financing element was determined to exist which is accounted for
7
under the effective interest rate method. The other performance obligation to operate and maintain the facility is measured based on the capacity made available.
|
September 30, 2018
|
|||||||||||
|
Condensed Consolidated Balance Sheet
|
As Reported
|
Balances Without Adoption of ASC 606
|
Adoption Impact
|
||||||||
|
Assets
|
|||||||||||
|
Other current assets
|
$
|
|
|
$
|
|
|
$
|
|
|
||
|
Deferred income taxes
|
|
|
|
|
(
|
)
|
|||||
|
Service concession assets, net
|
|
|
|
|
(
|
)
|
|||||
|
Loan receivable
|
|
|
|
|
|
|
|||||
|
TOTAL ASSETS
|
|
|
|
|
|
|
|||||
|
Equity
|
|||||||||||
|
Accumulated deficit
|
(
|
)
|
(
|
)
|
|
|
|||||
|
Accumulated other comprehensive loss
|
(
|
)
|
(
|
)
|
|
|
|||||
|
Noncontrolling interest
|
|
|
|
|
|
|
|||||
|
TOTAL LIABILITIES AND EQUITY
|
|
|
|
|
|
|
|||||
|
Three Months Ended September 30, 2018
|
|||||||||||
|
Condensed Consolidated Statement of Operations
|
As Reported
|
Balances Without Adoption of ASC 606
|
Adoption Impact
|
||||||||
|
Total revenue
|
$
|
|
|
$
|
|
|
$
|
(
|
)
|
||
|
Total cost of sales
|
(
|
)
|
(
|
)
|
|
|
|||||
|
Operating margin
|
|
|
|
|
(
|
)
|
|||||
|
Interest income
|
|
|
|
|
|
|
|||||
|
Income from continuing operations before taxes and equity in earnings of affiliates
|
|
|
|
|
|
|
|||||
|
Income tax expense
|
(
|
)
|
(
|
)
|
|
|
|||||
|
INCOME FROM CONTINUING OPERATIONS
|
|
|
|
|
|
|
|||||
|
NET INCOME
|
|
|
|
|
|
|
|||||
|
NET INCOME ATTRIBUTABLE TO THE AES CORPORATION
|
|
|
|
|
|
|
|||||
|
Nine Months Ended September 30, 2018
|
|||||||||||
|
Condensed Consolidated Statement of Operations
|
As Reported
|
Balances Without Adoption of ASC 606
|
Adoption Impact
|
||||||||
|
Total revenue
|
$
|
|
|
$
|
|
|
$
|
(
|
)
|
||
|
Total cost of sales
|
(
|
)
|
(
|
)
|
|
|
|||||
|
Operating margin
|
|
|
|
|
(
|
)
|
|||||
|
Interest income
|
|
|
|
|
|
|
|||||
|
Income from continuing operations before taxes and equity in earnings of affiliates
|
|
|
|
|
|
|
|||||
|
Income tax expense
|
(
|
)
|
(
|
)
|
|
|
|||||
|
INCOME FROM CONTINUING OPERATIONS
|
|
|
|
|
|
|
|||||
|
NET INCOME
|
|
|
|
|
|
|
|||||
|
NET INCOME ATTRIBUTABLE TO THE AES CORPORATION
|
|
|
|
|
|
|
|||||
New Accounting Pronouncements Issued But Not Yet Effective
—
The following table provides a brief description of recent accounting pronouncements that could have a material impact on the Company’s consolidated financial statements once adopted. Accounting pronouncements not listed below were assessed and determined to be either not applicable or are expected to have no material impact on the Company’s consolidated financial statements.
8
|
New Accounting Standards Issued But Not Yet Effective
|
|||
|
ASU Number and Name
|
Description
|
Date of Adoption
|
Effect on the financial statements upon adoption
|
|
2018-15, Intangibles—Goodwill and Other—Internal-Use Software (Subtopic 350-40): Customer’s Accounting for Implementation Costs Incurred in a Cloud Computing Arrangement That Is a Service Contract
|
This standard aligns the accounting for implementation costs incurred for a cloud computing arrangement that is a service with the requirement for capitalizing implementation costs associated with developing or obtaining internal-use software.
Transition method: retrospective or prospective.
|
January 1, 2020. Early adoption is permitted.
|
The Company is currently evaluating the impact of adopting the standard on its consolidated financial statements.
|
|
2018-02, Income Statement — Reporting Comprehensive Income (Topic 220), Reclassification of Certain Tax Effects from AOCI
|
This amendment allows a reclassification of the stranded tax effects resulting from the implementation of the Tax Cuts and Jobs Act from AOCI to retained earnings. Because this amendment only relates to the reclassification of the income tax effects of the Tax Cuts and Jobs Act, the underlying guidance that requires that the effect of a change in tax laws or rates be included in income from continuing operations is not affected.
|
January 1, 2019. Early adoption is permitted.
|
The Company is currently evaluating the impact of adopting the standard on its consolidated financial statements.
|
|
2017-12, Derivatives and Hedging (Topic 815): Targeted improvements to Accounting for Hedging Activities
|
The standard updates the hedge accounting model to expand the ability to hedge nonfinancial and financial risk components, reduce complexity, and ease certain documentation and assessment requirements. When facts and circumstances are the same as at the previous quantitative test, a subsequent quantitative effectiveness test is not required. The standard also eliminates the requirement to separately measure and report hedge ineffectiveness. For cash flow hedges, this means that the entire change in the fair value of a hedging instrument will be recorded in other comprehensive income and amounts deferred will be reclassified to earnings in the same income statement line as the hedged item.
Transition method: modified retrospective with the cumulative effect adjustment recorded to the opening balance of retained earnings as of the initial application date. Prospective for presentation and disclosures. |
January 1, 2019. Early adoption is permitted.
|
The Company is currently evaluating the impact of adopting the standard on its consolidated financial statements.
|
|
2017-11, Earnings Per Share (Topic 260); Distinguishing Liabilities from Equity (Topic 480); Derivatives and Hedging (Topic 815): Accounting for Certain Financial Instruments and Certain Mandatorily Redeemable Noncontrolling Interests
|
Part 1 of this standard changes the classification of certain equity-linked financial instruments when assessing whether the instrument is indexed to an entity’s own stock.
Transition method: retrospective.
|
January 1, 2019. Early adoption is permitted.
|
The Company is currently evaluating the impact of adopting the standard on its consolidated financial statements.
|
|
2017-08, Receivables — Nonrefundable Fees and Other Costs (Subtopic 310-20): Premium Amortization on Purchased Callable Debt Securities
|
This standard shortens the period of amortization for the premium on certain callable debt securities to the earliest call date.
Transition method: modified retrospective.
|
January 1, 2019. Early adoption is permitted.
|
The Company is currently evaluating the impact of adopting the standard on its consolidated financial statements.
|
|
2017-04, Intangibles — Goodwill and Other (Topic 350): Simplifying the Test for Goodwill Impairment
|
This standard simplifies the accounting for goodwill impairment by removing the requirement to calculate the implied fair value. Instead, it requires that an entity records an impairment charge based on the excess of a reporting unit's carrying amount over its fair value.
Transition method: prospective. |
January 1, 2020. Early adoption is permitted.
|
The Company is currently evaluating the impact of adopting the standard on its consolidated financial statements.
|
|
2016-13, Financial Instruments — Credit Losses (Topic 326): Measurement of Credit Losses on Financial Instruments
|
The standard updates the impairment model for financial assets measured at amortized cost. For trade and other receivables, held-to-maturity debt securities, loans and other instruments, entities will be required to use a new forward-looking "expected loss" model that generally will result in the earlier recognition of allowance for losses. For available-for-sale debt securities with unrealized losses, entities will measure credit losses as it is done today, except that the losses will be recognized as an allowance rather than a reduction in the amortized cost of the securities.
Transition method: various. |
January 1, 2020. Early adoption is permitted only as of January 1, 2019.
|
The Company is currently evaluating the impact of adopting the standard on its consolidated financial statements.
|
|
2016-02, 2018-01, 2018-10, 2018-11, Leases (Topic 842)
|
See discussion of the ASU below.
|
January 1, 2019. Early adoption is permitted.
|
The Company will adopt the standard on January 1, 2019; see below for the evaluation of the impact of its adoption on the consolidated financial statements.
|
9
The standard must be adopted using a modified retrospective approach at the beginning of the earliest comparative period presented in the financial statements (January 1, 2017). The FASB amended the standard to add an optional transition method that allows entities to continue to apply the guidance in ASC 840 Leases in the comparative periods presented in the year they adopt the new lease standard. Under this transition method, the Company will apply the transition provisions on January 1, 2019. At transition, lessees and lessors are permitted to make an election to apply a package of practical expedients that allow them not to reassess: (1) whether any expired or existing contracts are or contain leases, (2) lease classification for any expired or existing leases, and (3) whether initial direct costs for any expired or existing leases qualify for capitalization under ASC 842. These three practical expedients must be elected as a package and must be consistently applied to all leases. Furthermore, entities are also permitted to make an election to use hindsight when determining lease term and lessees can elect to use hindsight when assessing the impairment of right-of-use assets.
The Company has established a task force focused on the identification of contracts that would be under the scope of the new standard and on the assessment and measurement of the right-of-use asset and related liability. Additionally, the implementation team has been working on the configuration of a lease accounting tool that will support the implementation and the subsequent accounting. The implementation of this tool is in the latest phase and it is expected to be completed by the effective date. The implementation team is also in the process of evaluating changes to our business processes, systems and controls to support recognition and disclosure under the new standard.
The Company has preliminarily concluded that it will use the package of practical expedients at transition. The main impact expected as of the effective date is the recognition of right-of-use assets and related liabilities for all contracts that contain a lease and for which the Company is the lessee. However, the income statement presentation and the expense recognition pattern are not expected to change.
2
.
INVENTORY
|
September 30, 2018
|
December 31, 2017
|
||||||
|
Fuel and other raw materials
|
$
|
|
|
$
|
|
|
|
|
Spare parts and supplies
|
|
|
|
|
|||
|
Total
|
$
|
|
|
$
|
|
|
|
3
.
FAIR VALUE
The fair value of current financial assets and liabilities, debt service reserves and other deposits approximate their reported carrying amounts. The estimated fair values of the Company’s assets and liabilities have been determined using available market information. By virtue of these amounts being estimates and based on hypothetical transactions to sell assets or transfer liabilities, the use of different market assumptions and/or estimation methodologies may have a material effect on the estimated fair value amounts. For further information on our valuation techniques and policies, see Note 4—
Fair Value
in Item 8.—
Financial Statements and Supplementary Data
of our
2017
Form 10-K.
Recurring Measurements
—
The following table presents, by level within the fair value hierarchy, the Company’s financial assets and liabilities that were measured at fair value on a recurring basis as of the dates indicated (in millions). For the Company’s investments in marketable debt securities, the security classes presented are determined based on the nature and risk of the security and are consistent with how the Company manages, monitors and measures its marketable securities:
10
|
|
September 30, 2018
|
December 31, 2017
|
|||||||||||||||||||||||||||||
|
|
Level 1
|
Level 2
|
Level 3
|
Total
|
Level 1
|
Level 2
|
Level 3
|
Total
|
|||||||||||||||||||||||
|
Assets
|
|||||||||||||||||||||||||||||||
|
DEBT SECURITIES:
|
|||||||||||||||||||||||||||||||
|
Available-for-sale:
|
|||||||||||||||||||||||||||||||
|
Unsecured debentures
|
$
|
|
|
$
|
|
|
$
|
|
|
$
|
|
|
$
|
|
|
$
|
|
|
$
|
|
|
$
|
|
|
|||||||
|
Certificates of deposit
|
|
|
|
|
|
|
|
|
|
|
|
|
|
|
|
|
|||||||||||||||
|
Total debt securities
|
|
|
|
|
|
|
|
|
|
|
|
|
|
|
|
|
|||||||||||||||
|
EQUITY SECURITIES:
|
|||||||||||||||||||||||||||||||
|
Mutual funds
|
|
|
|
|
|
|
|
|
|
|
|
|
|
|
|
|
|||||||||||||||
|
Other equity securities
|
|
|
|
|
|
|
|
|
|
|
|
|
|
|
|
|
|||||||||||||||
|
Total equity securities
|
|
|
|
|
|
|
|
|
|
|
|
|
|
|
|
|
|||||||||||||||
|
DERIVATIVES:
|
|||||||||||||||||||||||||||||||
|
Interest rate derivatives
|
|
|
|
|
|
|
|
|
|
|
|
|
|
|
|
|
|||||||||||||||
|
Cross-currency derivatives
|
|
|
|
|
|
|
|
|
|
|
|
|
|
|
|
|
|||||||||||||||
|
Foreign currency derivatives
|
|
|
|
|
|
|
|
|
|
|
|
|
|
|
|
|
|||||||||||||||
|
Commodity derivatives
|
|
|
|
|
|
|
|
|
|
|
|
|
|
|
|
|
|||||||||||||||
|
Total derivatives — assets
|
|
|
|
|
|
|
|
|
|
|
|
|
|
|
|
|
|||||||||||||||
|
TOTAL ASSETS
|
$
|
|
|
$
|
|
|
$
|
|
|
$
|
|
|
$
|
|
|
$
|
|
|
$
|
|
|
$
|
|
|
|||||||
|
Liabilities
|
|||||||||||||||||||||||||||||||
|
DERIVATIVES:
|
|||||||||||||||||||||||||||||||
|
Interest rate derivatives
|
$
|
|
|
$
|
|
|
$
|
|
|
$
|
|
|
$
|
|
|
$
|
|
|
$
|
|
|
$
|
|
|
|||||||
|
Cross-currency derivatives
|
|
|
|
|
|
|
|
|
|
|
|
|
|
|
|
|
|||||||||||||||
|
Foreign currency derivatives
|
|
|
|
|
|
|
|
|
|
|
|
|
|
|
|
|
|||||||||||||||
|
Commodity derivatives
|
|
|
|
|
|
|
|
|
|
|
|
|
|
|
|
|
|||||||||||||||
|
Total derivatives — liabilities
|
|
|
|
|
|
|
|
|
|
|
|
|
|
|
|
|
|||||||||||||||
|
TOTAL LIABILITIES
|
$
|
|
|
$
|
|
|
$
|
|
|
$
|
|
|
$
|
|
|
$
|
|
|
$
|
|
|
$
|
|
|
|||||||
As of
September 30, 2018
, all AFS debt securities had stated maturities within one year. For the
three and nine
months ended
September 30, 2018
and
2017
,
no
other-than-temporary impairments of marketable securities were recognized in earnings or
Other Comprehensive Income
. Gains and losses on the sale of investments are determined using the specific-identification method.
The following table presents gross proceeds from the sale of AFS securities during the periods indicated (in millions):
|
Three Months Ended September 30,
|
Nine Months Ended September 30,
|
||||||||||||||
|
2018
|
2017
|
2018
|
2017
|
||||||||||||
|
Gross proceeds from sale of AFS securities
(1)
|
$
|
|
|
$
|
|
|
$
|
|
|
$
|
|
|
|||
_____________________________
|
(1)
|
Three and nine months ended September 30, 2018 include
$
|
|
Three Months Ended September 30, 2018
|
Interest Rate
|
Foreign Currency
|
Commodity
|
Total
|
|||||||||||
|
Balance at July 1
|
$
|
(
|
)
|
$
|
|
|
$
|
|
|
$
|
|
|
|||
|
Total realized and unrealized gains (losses):
|
|||||||||||||||
|
Included in other comprehensive income — derivative activity
|
|
|
|
|
|
|
|
|
|||||||
|
Included in regulatory liabilities
|
|
|
|
|
(
|
)
|
(
|
)
|
|||||||
|
Settlements
|
|
|
|
|
|
|
|
|
|||||||
|
Balance at September 30
|
$
|
(
|
)
|
$
|
|
|
$
|
|
|
$
|
|
|
|||
|
Total gains for the period included in earnings attributable to the change in unrealized gains (losses) relating to assets and liabilities held at the end of the period
|
$
|
|
|
$
|
|
|
$
|
|
|
$
|
|
|
|||
|
Three Months Ended September 30, 2017
|
Interest Rate
|
Foreign Currency
|
Commodity
|
Total
|
|||||||||||
|
Balance at July 1
|
$
|
(
|
)
|
$
|
|
|
$
|
|
|
$
|
|
|
|||
|
Total realized and unrealized gains (losses):
|
|||||||||||||||
|
Included in earnings
|
(
|
)
|
|
|
|
|
|
|
|||||||
|
Included in other comprehensive income — derivative activity
|
(
|
)
|
|
|
|
|
(
|
)
|
|||||||
|
Settlements
|
|
|
(
|
)
|
(
|
)
|
(
|
)
|
|||||||
|
Balance at September 30
|
$
|
(
|
)
|
$
|
|
|
$
|
|
|
$
|
|
|
|||
|
Total gains (losses) for the period included in earnings attributable to the change in unrealized gains (losses) relating to assets and liabilities held at the end of the period
|
$
|
(
|
)
|
$
|
|
|
$
|
|
|
$
|
|
|
|||
11
|
Nine Months Ended September 30, 2018
|
Interest Rate
|
Foreign Currency
|
Commodity
|
Total
|
|||||||||||
|
Balance at January 1
|
$
|
(
|
)
|
$
|
|
|
$
|
|
|
$
|
|
|
|||
|
Total realized and unrealized gains (losses):
|
|
||||||||||||||
|
Included in earnings
|
|
|
(
|
)
|
|
|
|
|
|||||||
|
Included in other comprehensive income — derivative activity
|
|
|
|
|
|
|
|
|
|||||||
|
Included in regulatory liabilities
|
|
|
|
|
|
|
|
|
|||||||
|
Settlements
|
|
|
(
|
)
|
(
|
)
|
(
|
)
|
|||||||
|
Transfers of assets/(liabilities), net into Level 3
|
|
|
|
|
|
|
|
|
|||||||
|
Transfers of (assets)/liabilities, net out of Level 3
|
(
|
)
|
|
|
|
|
(
|
)
|
|||||||
|
Balance at September 30
|
$
|
(
|
)
|
$
|
|
|
$
|
|
|
$
|
|
|
|||
|
Total gains (losses) for the period included in earnings attributable to the change in unrealized gains (losses) relating to assets and liabilities held at the end of the period
|
$
|
|
|
$
|
(
|
)
|
$
|
|
|
$
|
|
|
|||
|
Nine Months Ended September 30, 2017
|
Interest Rate
|
Foreign Currency
|
Commodity
|
Total
|
|||||||||||
|
Balance at January 1
|
$
|
(
|
)
|
$
|
|
|
$
|
|
|
$
|
|
|
|||
|
Total realized and unrealized gains (losses):
|
|||||||||||||||
|
Included in earnings
|
(
|
)
|
|
|
(
|
)
|
|
|
|||||||
|
Included in other comprehensive income — derivative activity
|
(
|
)
|
|
|
|
|
(
|
)
|
|||||||
|
Included in regulatory liabilities
|
|
|
|
|
|
|
|
|
|||||||
|
Settlements
|
|
|
(
|
)
|
(
|
)
|
(
|
)
|
|||||||
|
Transfers of assets/(liabilities), net into Level 3
|
(
|
)
|
|
|
|
|
(
|
)
|
|||||||
|
Balance at September 30
|
$
|
(
|
)
|
$
|
|
|
$
|
|
|
$
|
|
|
|||
|
Total losses for the period included in earnings attributable to the change in unrealized gains (losses) relating to assets and liabilities held at the end of the period
|
$
|
|
|
$
|
(
|
)
|
$
|
|
|
$
|
(
|
)
|
|||
|
Type of Derivative
|
Fair Value
|
Unobservable Input
|
Amount or Range (Weighted Average)
|
|||||
|
Interest rate
|
$
|
(
|
)
|
Subsidiaries’ credit spreads
|
1.78% to 4.38% (3.63%)
|
|||
|
Foreign currency:
|
||||||||
|
Argentine Peso
|
|
|
Argentine peso to USD currency exchange rate after one year
|
42.08 to 166.5 (99.21)
|
||||
|
Commodity:
|
||||||||
|
Other
|
|
|
||||||
|
Total
|
$
|
|
|
|||||
For interest rate derivatives and foreign currency derivatives, increases (decreases) in the estimates of the Company’s own credit spreads would decrease (increase) the value of the derivatives in a liability position. For foreign currency derivatives, increases (decreases) in the estimate of the above exchange rate would increase (decrease) the value of the derivative.
Nonrecurring Measurements
The Company measures fair value using the applicable fair value measurement guidance. Impairment expense is measured by comparing the fair value at the evaluation date to the then-latest available carrying amount
. The following table summarizes our major categories of assets measured at fair value on a nonrecurring basis and their level within the fair value hierarchy (in millions):
|
Measurement Date
|
Carrying Amount
(1)
|
Fair Value
|
Pretax Loss
|
||||||||||||||||||
|
Nine months ended September 30, 2018
|
Level 1
|
Level 2
|
Level 3
|
||||||||||||||||||
|
Equity Method Investments
|
|||||||||||||||||||||
|
Elsta
|
09/30/2018
|
$
|
|
|
$
|
|
|
$
|
|
|
$
|
|
|
$
|
|
|
|||||
|
Long-lived assets held and used:
(2)
|
|||||||||||||||||||||
|
U.S. generation facility
|
09/30/2018
|
|
|
|
|
|
|
|
|
|
|
||||||||||
|
Measurement Date
|
Carrying Amount
(1)
|
Fair Value
|
Pretax Loss
|
||||||||||||||||||
|
Nine Months Ended September 30, 2017
|
Level 1
|
Level 2
|
Level 3
|
||||||||||||||||||
|
Long-lived assets held and used:
(2)
|
|||||||||||||||||||||
|
DPL
|
02/28/2017
|
$
|
|
|
$
|
|
|
$
|
|
|
$
|
|
|
$
|
|
|
|||||
|
Other
|
02/28/2017
|
|
|
|
|
|
|
|
|
|
|
||||||||||
|
Held-for-sale businesses:
(3)
|
|||||||||||||||||||||
|
Kazakhstan Hydroelectric
|
06/30/2017
|
|
|
|
|
|
|
|
|
|
|
||||||||||
|
Kazakhstan
|
03/31/2017
|
|
|
|
|
|
|
|
|
|
|
||||||||||
____________________________
_
|
(1)
|
|
|
(2)
|
|
|
(3)
|
|
12
When determining the fair value of the U.S. generation facility’s long-lived assets, the Company used the market approach based on prices and unobservable inputs from transactions involving comparable assets as the inputs for the Level 3 nonrecurring measurement.
Asset Retirement Obligation
— During the nine months ended
September 30, 2018
, the Company increased the asset retirement obligation at IPL by
$
53
million
. This increase was due to ash pond closure costs and revised closure dates associated with an EPA rule regulating CCR and additional coal pile remediation costs. The Company uses the cost approach to determine the fair value of ARO liabilities, which is estimated by discounting expected cash outflows to their present value using market based rates at the initial recording of the liabilities. Cash outflows are based on the approximate future disposal costs as determined by market information, historical information or other management estimates. These inputs to the fair value of the ARO liabilities would be considered Level 3 inputs under the fair value hierarchy.
Financial Instruments not Measured at Fair Value in the Condensed Consolidated Balance Sheet
s
The following table presents (in millions) the carrying amount, fair value and fair value hierarchy of the Company’s financial assets and liabilities that are not measured at fair value in the Condensed Consolidated Balance Sheets as of
September 30, 2018
and
December 31, 2017
, but for which fair value is disclosed:
|
September 30, 2018
|
||||||||||||||||||||
|
Carrying
Amount
|
Fair Value
|
|||||||||||||||||||
|
Total
|
Level 1
|
Level 2
|
Level 3
|
|||||||||||||||||
|
Assets:
|
Accounts receivable — noncurrent
(1)
|
$
|
|
|
$
|
|
|
$
|
|
|
$
|
|
|
$
|
|
|
||||
|
Liabilities:
|
Non-recourse debt
|
|
|
|
|
|
|
|
|
|
|
|||||||||
|
Recourse debt
|
|
|
|
|
|
|
|
|
|
|
||||||||||
|
December 31, 2017
|
||||||||||||||||||||
|
Carrying
Amount
|
Fair Value
|
|||||||||||||||||||
|
Total
|
Level 1
|
Level 2
|
Level 3
|
|||||||||||||||||
|
Assets:
|
Accounts receivable — noncurrent
(1)
|
$
|
|
|
$
|
|
|
$
|
|
|
$
|
|
|
$
|
|
|
||||
|
Liabilities:
|
Non-recourse debt
|
|
|
|
|
|
|
|
|
|
|
|||||||||
|
Recourse debt
|
|
|
|
|
|
|
|
|
|
|
||||||||||
_____________________________
|
(1
|
|
4
.
DERIVATIVE INSTRUMENTS AND HEDGING ACTIVITIES
For further information on the derivative and hedging accounting policies see Note 1—
General and Summary of Significant Accounting Policies
—
Derivatives and Hedging Activities
of Item 8.—
Financial Statements and Supplementary Data
in the
2017
Form 10-K.
Volume of Activity
—
The following table presents the Company’s maximum notional (in millions) over the remaining contractual period by type of derivative as of
September 30, 2018
, regardless of whether they are in qualifying cash flow hedging relationships, and the dates through which the maturities for each type of derivative range:
|
Derivatives
|
Maximum Notional Translated to USD
|
Latest Maturity
|
||||
|
Interest rate (LIBOR and EURIBOR)
|
$
|
|
|
2042
|
||
|
Cross-currency swaps (Chilean Unidad de Fomento and Chilean peso)
|
|
|
2029
|
|||
|
Foreign Currency:
|
||||||
|
Argentine peso
|
|
|
2026
|
|||
|
Chilean peso
|
|
|
2021
|
|||
|
Colombian peso
|
|
|
2020
|
|||
|
Brazilian real
|
|
|
2019
|
|||
|
Others, primarily with weighted average remaining maturities of a year or less
|
|
|
2021
|
|||
13
|
Fair Value
|
September 30, 2018
|
December 31, 2017
|
|||||||||||||||||||||
|
Assets
|
Designated
|
Not Designated
|
Total
|
Designated
|
Not Designated
|
Total
|
|||||||||||||||||
|
Interest rate derivatives
|
$
|
|
|
$
|
|
|
$
|
|
|
$
|
|
|
$
|
|
|
$
|
|
|
|||||
|
Cross-currency derivatives
|
|
|
|
|
|
|
|
|
|
|
|
|
|||||||||||
|
Foreign currency derivatives
|
|
|
|
|
|
|
|
|
|
|
|
|
|||||||||||
|
Commodity derivatives
|
|
|
|
|
|
|
|
|
|
|
|
|
|||||||||||
|
Total assets
|
$
|
|
|
$
|
|
|
$
|
|
|
$
|
|
|
$
|
|
|
$
|
|
|
|||||
|
Liabilities
|
|||||||||||||||||||||||
|
Interest rate derivatives
|
$
|
|
|
$
|
|
|
$
|
|
|
$
|
|
|
$
|
|
|
$
|
|
|
|||||
|
Cross-currency derivatives
|
|
|
|
|
|
|
|
|
|
|
|
|
|||||||||||
|
Foreign currency derivatives
|
|
|
|
|
|
|
|
|
|
|
|
|
|||||||||||
|
Commodity derivatives
|
|
|
|
|
|
|
|
|
|
|
|
|
|||||||||||
|
Total liabilities
|
$
|
|
|
$
|
|
|
$
|
|
|
$
|
|
|
$
|
|
|
$
|
|
|
|||||
|
September 30, 2018
|
December 31, 2017
|
||||||||||||||
|
Fair Value
|
Assets
|
Liabilities
|
Assets
|
Liabilities
|
|||||||||||
|
Current
|
$
|
|
|
$
|
|
|
$
|
|
|
$
|
|
|
|||
|
Noncurrent
|
|
|
|
|
|
|
|
|
|||||||
|
Total
|
$
|
|
|
$
|
|
|
$
|
|
|
$
|
|
|
|||
As of
September 30, 2018
, all derivative instruments subject to credit risk-related contingent features were in an asset position.
|
Credit Risk-Related Contingent Features
(1)
|
December 31, 2017
|
||||||||
|
Present value of liabilities subject to collateralization
|
$
|
|
|
||||||
|
Cash collateral held by third parties or in escrow
|
|
|
|||||||
_____________________________
|
(1)
|
|
Earnings and Other Comprehensive Income (Loss)
—
The next table presents (in millions) the pre-tax gains (losses) recognized in AOCL and earnings related to all derivative instruments for the periods indicated:
|
Three Months Ended September 30,
|
Nine Months Ended September 30,
|
||||||||||||||
|
2018
|
2017
|
2018
|
2017
|
||||||||||||
|
Effective portion of cash flow hedges
|
|||||||||||||||
|
Gains (losses) recognized in AOCL
|
|||||||||||||||
|
Interest rate derivatives
|
$
|
|
|
$
|
(
|
)
|
$
|
|
|
$
|
(
|
)
|
|||
|
Cross-currency derivatives
|
|
|
|
|
(
|
)
|
|
|
|||||||
|
Foreign currency derivatives
|
(
|
)
|
(
|
)
|
(
|
)
|
(
|
)
|
|||||||
|
Commodity derivatives
|
|
|
|
|
|
|
|
|
|||||||
|
Total
|
$
|
|
|
$
|
|
|
$
|
|
|
$
|
(
|
)
|
|||
|
Gains (losses) reclassified from AOCL into earnings
|
|||||||||||||||
|
Interest rate derivatives
|
$
|
(
|
)
|
$
|
(
|
)
|
$
|
(
|
)
|
$
|
(
|
)
|
|||
|
Cross-currency derivatives
|
(
|
)
|
|
|
(
|
)
|
|
|
|||||||
|
Foreign currency derivatives
|
(
|
)
|
(
|
)
|
(
|
)
|
(
|
)
|
|||||||
|
Commodity derivatives
|
|
|
|
|
(
|
)
|
|
|
|||||||
|
Total
|
$
|
(
|
)
|
$
|
|
|
$
|
(
|
)
|
|
$
|
(
|
)
|
||
|
Loss reclassified from AOCL to earnings due to discontinuance of hedge accounting
(1)
|
$
|
|
|
$
|
|
|
$
|
|
|
$
|
(
|
)
|
|||
|
Gains (losses) recognized in earnings related to
|
|||||||||||||||
|
Ineffective portion of cash flow hedges
|
$
|
|
|
$
|
|
|
$
|
(
|
)
|
$
|
|
|
|||
|
Not designated as hedging instruments:
|
|||||||||||||||
|
Foreign currency derivatives
|
(
|
)
|
|
|
|
|
(
|
)
|
|||||||
|
Commodity derivatives and other
|
|
|
|
|
|
|
|
|
|||||||
|
Total
|
$
|
(
|
)
|
$
|
|
|
$
|
|
|
$
|
(
|
)
|
|||
_____________________________
|
(1)
|
Cash flow hedge was discontinued because it was probable the forecasted transaction will not occur.
|
5
.
FINANCING RECEIVABLES
Receivables with contractual maturities of greater than one year are considered financing receivables. The Company’s financing receivables are primarily related to amended agreements or government resolutions that are
14
due from CAMMESA, the administrator of the wholesale electricity market in Argentina.
The following table presents financing receivables by country as of the dates indicated (in millions):
|
September 30, 2018
|
December 31, 2017
|
||||||
|
Argentina
|
$
|
|
|
$
|
|
|
|
|
Panama
|
|
|
|
|
|||
|
Other
|
|
|
|
|
|||
|
Total
|
$
|
|
|
$
|
|
|
|
6
.
INVESTMENTS IN AND ADVANCES TO AFFILIATES
Summarized Financial Information —
The following table summarizes financial information of the Company’s 50%-or-less-owned affiliates that are accounted for using the equity method (in millions):
|
|
Nine Months Ended September 30,
|
||||||
|
50%-or-less-Owned Affiliates
|
2018
|
2017
|
|||||
|
Revenue
|
$
|
|
|
$
|
|
|
|
|
Operating margin
|
|
|
|
|
|||
|
Net income
|
|
|
|
|
|||
Simple Energy —
In April 2018, the Company invested
$
35
million
in Simple Energy, a provider of utility-branded marketplaces and omni-channel instant rebates. As the Company does not control Simple Energy, the investment is accounted for as an equity method investment and is reported as part of Corporate and Other.
Fluence —
On January 1, 2018, Siemens and AES closed on the creation of the Fluence joint venture with each party holding a
50
%
ownership interest. The Company contributed
$
7
million
in cash and
$
20
million
in non-cash assets from the AES Advancion energy storage development business as consideration for the transaction, and received an equity interest in Fluence with a fair value of
$
50
million
. See Note
17
—Held-for-Sale and Dispositions
for further discussion. Fluence is a global energy storage technology and services company. As the Company does not control Fluence, the investment is accounted for as an equity method investment. The Fluence equity method investment is reported as part of Corporate and Other.
7
.
DEBT
Recourse Debt
In March 2018, the Company repurchased via tender offers
$
671
million
aggregate principal of its existing
5.50
%
senior unsecured notes due in
2024
and
$
29
million
of its existing
5.50
%
senior unsecured notes due in
2025
. As a result of these transactions, the Company recognized a
loss
on extinguishment of debt of
$
44
million
for the
nine months ended September 30, 2018
.
In March 2018, the Company issued
$
500
million
aggregate principal of
4.00
%
senior notes due in
2021
and
$
500
million
of
4.50
%
senior notes due in
2023
. The Company used the proceeds from these issuances to repurchase via tender offer in full the
$
228
million
balance of its
8.00
%
senior notes due in
2020
and the
$
690
million
million balance of its
7.375
%
senior notes due in
2021
. As a result of these transactions, the Company recognized a
loss
on extinguishment of debt of
$
125
million
for the
nine months ended September 30, 2018
.
In August 2017, the Company issued
$
500
million
aggregate principal amount of
5.125
%
senior notes due in
15
2027
. The Company used these proceeds to redeem at par
$
240
million
aggregate principal of its existing
LIBOR + 3.00%
senior unsecured notes due in
2019
and repurchased
$
217
million
of its existing
8.00
%
senior unsecured notes due in
2020
. As a result of the latter transactions, the Company recognized a
loss
on extinguishment of debt of
$
36
million
for the
nine months ended September 30, 2017
.
In May 2017, the Company closed on
$
525
million
aggregate principal
LIBOR + 2.00%
secured term loan due in
2022
. In June 2017, the Company used these proceeds to redeem at par all
$
517
million
aggregate principal of its existing Term Convertible Securities. As a result of the latter transaction, the Company recognized a net loss on extinguishment of debt of
$
6
million
for the three and six months ended
September 30, 2017
.
In March 2017, the Company repurchased via tender offers
$
276
million
aggregate principal of its existing
7.375
%
senior unsecured notes due in
2021
and
$
24
million
of its existing
8.00
%
senior unsecured notes due in
2020
. As a result of these transactions, the Company recognized a
loss
on extinguishment of debt of
$
47
million
for the
nine months ended September 30, 2017
.
Non-Recourse Debt
|
Subsidiary
|
Transaction Period
|
Issuances
|
Repayments
|
Loss on Extinguishment of Debt
|
||||||||||
|
Southland
|
Q1, Q2, Q3
|
$
|
|
|
$
|
|
|
$
|
|
|
||||
|
Tietê
|
Q1
|
|
|
(
|
)
|
|
|
|||||||
|
Alto Maipo
|
Q2
|
|
|
|
|
|
|
|||||||
|
DPL
|
Q2
|
|
|
(
|
)
|
(
|
)
|
|||||||
|
Gener
|
Q3
|
|
|
(
|
)
|
(
|
)
|
|||||||
|
Angamos
|
Q3
|
|
|
(
|
)
|
|
|
|||||||
AES Argentina
— In February 2017, AES Argentina issued
$
300
million
aggregate principal of unsecured and unsubordinated notes due in
2024
. The net proceeds from this issuance were used for the prepayment of
$
75
million
of non-recourse debt related to the construction of the San Nicolas Plant resulting in a gain on extinguishment of debt of approximately
$
65
million
.
Non-Recourse Debt in Default
—
The current portion of non-recourse debt includes the following subsidiary debt in default as of
September 30, 2018
(in millions).
|
Subsidiary
|
Primary Nature of Default
|
Debt in Default
|
Net Assets
|
|||||||
|
AES Puerto Rico
|
Covenant
|
$
|
|
|
$
|
|
|
|||
|
AES Ilumina (Puerto Rico)
|
Covenant
|
|
|
|
|
|||||
|
$
|
|
|
||||||||
The above defaults are not payment defaults. All of the subsidiary non-recourse debt defaults were triggered by failure to comply with covenants and/or other conditions such as (but not limited to) failure to meet information covenants, complete construction or other milestones in an allocated time, meet certain minimum or maximum financial ratios, or other requirements contained in the non-recourse debt documents of the applicable subsidiary.
8
.
COMMITMENTS AND CONTINGENCIES
Guarantees, Letters of Credit and Commitments
— In connection with certain project financings, acquisitions and dispositions, power purchases and other agreements, the Parent Company has expressly undertaken limited obligations and commitments, most of which will only be effective or will be terminated upon the occurrence of future events. In the normal course of business, the Parent Company has entered into various agreements, mainly guarantees and letters of credit, to provide financial or performance assurance to third parties on behalf of AES businesses. These agreements are entered into primarily to support or enhance the creditworthiness otherwise achieved by a business on a stand-alone basis, thereby facilitating the availability of
16
sufficient credit to accomplish their intended business purposes. Most of the contingent obligations relate to future performance commitments which the Company or its businesses expect to fulfill within the normal course of business. The expiration dates of these guarantees vary from
less than one year to more than 18 years
.
The following table summarizes the Parent Company’s contingent contractual obligations as of
September 30, 2018
. Amounts presented in the following table represent the Parent Company’s current undiscounted exposure to guarantees and the range of maximum undiscounted potential exposure. The maximum exposure is not reduced by the amounts, if any, that could be recovered under the recourse or collateralization provisions in the guarantees.
|
Contingent Contractual Obligations
|
Amount
(in millions)
|
Number of Agreements
|
Maximum Exposure Range for Individual Agreements (in millions)
|
||||||
|
Guarantees and commitments
|
$
|
|
|
|
|
<$1 — 68
|
|||
|
Letters of credit under the unsecured credit facility
|
|
|
|
|
$2 — 247
|
||||
|
Letters of credit under the senior secured credit facility
|
|
|
|
|
<$1 — 14
|
||||
|
Asset sale related indemnities
(1)
|
|
|
|
|
$27
|
||||
|
Total
|
$
|
|
|
|
|
||||
_____________________________
|
|
|
During the
nine months ended September 30, 2018
, the Company paid letter of credit fees ranging from
1
%
to
3
%
per annum on the outstanding amounts of letters of credit.
Contingencies
Environmental
— The Company periodically reviews its obligations as they relate to compliance with environmental laws, including site restoration and remediation. For each period ended
September 30, 2018
and
December 31, 2017
, the Company had recognized liabilities of
$
5
million
for projected environmental remediation costs. Due to the uncertainties associated with environmental assessment and remediation activities, future costs of compliance or remediation could be higher or lower than the amount currently accrued. Moreover, where no liability has been recognized, it is reasonably possible that the Company may be required to incur remediation costs or make expenditures in amounts that could be material but could not be estimated as of
September 30, 2018
. In aggregate, the Company estimates the range of potential losses, where estimable, related to environmental matters to be up to
$
16
million
. The amounts considered reasonably possible do not include amounts accrued as discussed above.
17
9
.
REDEEMABLE STOCK OF SUBSIDIARIES
|
September 30, 2018
|
December 31, 2017
|
||||||
|
IPALCO common stock
|
$
|
|
|
$
|
|
|
|
|
Colon quotas
(1)
|
|
|
|
|
|||
|
IPL preferred stock
|
|
|
|
|
|||
|
Total redeemable stock of subsidiaries
|
$
|
|
|
$
|
|
|
|
_____________________________
|
|
|
10
.
EQUITY
Changes in Equity
—
The following table is a reconciliation of the beginning and ending equity attributable to stockholders of The AES Corporation, NCI and total equity as of the periods indicated (in millions):
|
Nine Months Ended September 30, 2018
|
Nine Months Ended September 30, 2017
|
||||||||||||||||||||||
|
The Parent Company Stockholders’ Equity
|
NCI
|
Total Equity
|
The Parent Company Stockholders’ Equity
|
NCI
|
Total Equity
|
||||||||||||||||||
|
Balance at the beginning of the period
|
$
|
|
|
$
|
|
|
$
|
|
|
$
|
|
|
$
|
|
|
$
|
|
|
|||||
|
Net income
|
|
|
|
|
|
|
|
|
|
|
|
|
|||||||||||
|
Total foreign currency translation adjustment, net of income tax
|
(
|
)
|
|
|
(
|
)
|
|
|
|
|
|
|
|||||||||||
|
Total change in derivative fair value, net of income tax
|
|
|
|
|
|
|
|
|
|
|
|
|
|||||||||||
|
Total pension adjustments, net of income tax
|
|
|
|
|
|
|
|
|
|
|
|
|
|||||||||||
|
Cumulative effect of a change in accounting principle
(1)
|
|
|
|
|
|
|
|
|
|
|
|
|
|||||||||||
|
Fair value adjustment
(2)
|
(
|
)
|
|
|
(
|
)
|
(
|
)
|
|
|
(
|
)
|
|||||||||||
|
Disposition of businesses
(3)
|
|
|
(
|
)
|
(
|
)
|
|
|
|
|
|
|
|||||||||||
|
Distributions to noncontrolling interests
|
|
|
(
|
)
|
(
|
)
|
|
|
(
|
)
|
(
|
)
|
|||||||||||
|
Contributions from noncontrolling interests
|
|
|
|
|
|
|
|
|
|
|
|
|
|||||||||||
|
Dividends declared on common stock
|
(
|
)
|
|
|
(
|
)
|
(
|
)
|
|
|
(
|
)
|
|||||||||||
|
Issuance and exercise of stock-based compensation
|
|
|
|
|
|
|
|
|
|
|
|
|
|||||||||||
|
Sale of subsidiary shares to noncontrolling interests
|
(
|
)
|
|
|
|
|
|
|
|
|
|
|
|||||||||||
|
Acquisition of subsidiary shares from noncontrolling interests
|
|
|
|
|
|
|
|
|
(
|
)
|
|
|
|||||||||||
|
Less: Net loss attributable to redeemable stock of subsidiaries
|
|
|
|
|
|
|
|
|
|
|
|
|
|||||||||||
|
Balance at the end of the period
|
$
|
|
|
$
|
|
|
$
|
|
|
$
|
|
|
$
|
|
|
$
|
|
|
|||||
_____________________________
|
(1)
|
|
|
(2)
|
|
|
(3)
|
|
Equity Transactions with Noncontrolling Interests
Dominican Republic
— On September 28, 2017, Linda Group, an investor-based group in the Dominican Republic acquired an additional
5
%
of our Dominican Republic business for
$
60
million
, pre-tax. This transaction resulted in a net increase of
$
25
million
to the Company’s additional paid-in capital and noncontrolling interest, respectively.
No
gain or loss was recognized in net income as the sale was not considered a sale of in-substance real estate. As the Company maintained control after the sale, our businesses in the Dominican Republic continue to be consolidated by the Company within the MCAC SBU reportable segment.
Alto Maipo
— On March 17, 2017, AES Gener completed the legal and financial restructuring of Alto Maipo. As part of this restructuring, AES indirectly acquired the
40
%
ownership interest of the noncontrolling shareholder, for a de minimis payment, and sold a
6.7
%
interest in the project to the construction contractor. This transaction resulted in a
$
196
million
increase to the Parent Company’s Stockholders’ Equity due to an increase in additional-paid-in capital of
$
229
million
, offset by the reclassification of accumulated other comprehensive losses from NCI to the Parent Company Stockholders’ Equity of
$
33
million
.
No
gain or loss was recognized in net income as the sale was not considered to be a sale of in-substance real estate. After completion of the sale, the Company has an effective
62
%
economic interest in Alto Maipo. As the Company maintained control of the partnership after the sale, Alto Maipo continues to be consolidated by the Company within the South America SBU reportable segment.
18
Accumulated Other Comprehensive Loss
—
The following table summarizes the changes in AOCL by component, net of tax and NCI, for the
nine months ended
September 30, 2018
(in millions):
|
Foreign currency translation adjustment, net
|
Unrealized derivative gains (losses), net
|
Unfunded pension obligations, net
|
Total
|
||||||||||||
|
Balance at the beginning of the period
|
$
|
(
|
)
|
$
|
(
|
)
|
$
|
(
|
)
|
$
|
(
|
)
|
|||
|
Other comprehensive income (loss) before reclassifications
|
(
|
)
|
|
|
|
|
(
|
)
|
|||||||
|
Amount reclassified to earnings
|
(
|
)
|
|
|
|
|
|
|
|||||||
|
Other comprehensive income (loss)
|
(
|
)
|
|
|
|
|
(
|
)
|
|||||||
|
Cumulative effect of a change in accounting principle
|
|
|
|
|
|
|
|
|
|||||||
|
Balance at the end of the period
|
$
|
(
|
)
|
$
|
(
|
)
|
$
|
(
|
)
|
$
|
(
|
)
|
|||
Reclassifications out of AOCL are presented in the following table. Amounts for the periods indicated are in millions and those in parentheses indicate debits to the Condensed Consolidated Statements of Operations:
|
AOCL Components
|
Affected Line Item in the Condensed Consolidated Statements of Operations
|
Three Months Ended September 30,
|
Nine Months Ended September 30,
|
|||||||||||||||
|
2018
|
2017
|
2018
|
2017
|
|||||||||||||||
|
Foreign currency translation adjustment, net
|
||||||||||||||||||
|
Gain (loss) on disposal and sale of businesses
|
$
|
|
|
$
|
|
|
$
|
|
|
$
|
(
|
)
|
||||||
|
Net gain from disposal of discontinued businesses
|
|
|
|
|
(
|
)
|
$
|
|
|
|||||||||
|
Net income attributable to The AES Corporation
|
$
|
|
|
$
|
|
|
$
|
|
|
$
|
(
|
)
|
||||||
|
Unrealized derivative gains (losses), net
|
||||||||||||||||||
|
Non-regulated revenue
|
$
|
(
|
)
|
$
|
|
|
$
|
(
|
)
|
$
|
|
|
||||||
|
Non-regulated cost of sales
|
(
|
)
|
(
|
)
|
$
|
(
|
)
|
(
|
)
|
|||||||||
|
Interest expense
|
(
|
)
|
(
|
)
|
$
|
(
|
)
|
(
|
)
|
|||||||||
|
Foreign currency transaction gains (losses)
|
(
|
)
|
|
|
$
|
(
|
)
|
(
|
)
|
|||||||||
|
Income from continuing operations before taxes and equity in earnings of affiliates
|
(
|
)
|
|
|
(
|
)
|
(
|
)
|
||||||||||
|
Income tax expense
|
|
|
(
|
)
|
|
|
|
|
||||||||||
|
Income from continuing operations
|
(
|
)
|
(
|
)
|
(
|
)
|
(
|
)
|
||||||||||
|
Less: Income from continuing operations attributable to noncontrolling interests and redeemable stock of subsidiaries
|
|
|
|
|
|
|
|
|
||||||||||
|
Net income attributable to The AES Corporation
|
$
|
(
|
)
|
$
|
|
|
$
|
(
|
)
|
$
|
(
|
)
|
||||||
|
Amortization of defined benefit pension actuarial loss, net
|
||||||||||||||||||
|
General and administrative expenses
|
$
|
(
|
)
|
$
|
|
|
$
|
(
|
)
|
$
|
|
|
||||||
|
Other expense
|
|
|
(
|
)
|
(
|
)
|
(
|
)
|
||||||||||
|
Income from continuing operations before taxes and equity in earnings of affiliates
|
(
|
)
|
(
|
)
|
(
|
)
|
|
|
||||||||||
|
Income from continuing operations
|
(
|
)
|
(
|
)
|
(
|
)
|
|
|
||||||||||
|
Net income (loss) from operations of discontinued businesses
|
|
|
(
|
)
|
|
|
(
|
)
|
||||||||||
|
Net gain from disposal of discontinued operations
|
|
|
|
|
(
|
)
|
|
|
||||||||||
|
Net income
|
(
|
)
|
(
|
)
|
(
|
)
|
(
|
)
|
||||||||||
|
Less: Loss (income) from discontinued operations attributable to noncontrolling interest
|
|
|
|
|
|
|
|
|
||||||||||
|
Net income attributable to The AES Corporation
|
$
|
(
|
)
|
$
|
(
|
)
|
$
|
(
|
)
|
$
|
(
|
)
|
||||||
|
Total reclassifications for the period, net of income tax and noncontrolling interests
|
$
|
(
|
)
|
$
|
(
|
)
|
$
|
(
|
)
|
$
|
(
|
)
|
||||||
Common Stock Dividends
— The Parent Company paid dividends of
$
0.13
per outstanding share to its common stockholders during the
first
, second and third quarters of
2018
for dividends declared in
December 2017
, February and July 2018, respectively.
11
.
SEGMENTS
19
Corporate and Other
— The results of the Fluence and Simple Energy equity affiliates are included in “Corporate and Other.” Also included are the results of the AES self-insurance company and corporate overhead costs which are not directly associated with the operations of our
four
reportable segments, and certain intercompany charges such as self-insurance premiums which are fully eliminated in consolidation.
The Company uses Adjusted PTC as its primary segment performance measure. Adjusted PTC, a non-GAAP measure, is defined by the Company as
pre-tax income from continuing operations attributable to The AES Corporation excluding gains or losses of the consolidated entity due to (a) unrealized gains or losses related to derivative transactions and equity securities; (b) unrealized foreign currency gains or losses; (c) gains, losses, benefits and costs associated with dispositions and acquisitions of business interests, including early plant closures; (d) losses due to impairments; (e) gains, losses and costs due to the early retirement of debt; and (f) costs directly associated with a major restructuring program, including, but not limited to, workforce reduction efforts, relocations, and office consolidation.
Adjusted PTC also includes net equity in earnings of affiliates on an after-tax basis adjusted for the same gains or losses excluded from consolidated entities.
The Company has concluded that Adjusted PTC better reflects the underlying business performance of the Company and is the most relevant measure considered in the Company’s internal evaluation of the financial performance of its segments. Additionally, given its large number of businesses and complexity, the Company concluded that Adjusted PTC is a more transparent measure that better assists investors in determining which businesses have the greatest impact on the Company’s results.
Revenue and Adjusted PTC are presented before inter-segment eliminations, which includes the effect of intercompany transactions with other segments except for interest, charges for certain management fees, and the write-off of intercompany balances, as applicable. All intra-segment activity has been eliminated within the segment. Inter-segment activity has been eliminated within the total consolidated results.
|
Three Months Ended September 30,
|
Nine Months Ended September 30,
|
||||||||||||||
|
Total Revenue
|
2018
|
2017
|
2018
|
2017
|
|||||||||||
|
US and Utilities SBU
|
$
|
|
|
$
|
|
|
$
|
|
|
$
|
|
|
|||
|
South America SBU
|
|
|
|
|
|
|
|
|
|||||||
|
MCAC SBU
|
|
|
|
|
|
|
|
|
|||||||
|
Eurasia SBU
|
|
|
|
|
|
|
|
|
|||||||
|
Corporate and Other
|
|
|
|
|
|
|
|
|
|||||||
|
Eliminations
|
(
|
)
|
(
|
)
|
(
|
)
|
(
|
)
|
|||||||
|
Total Revenue
|
$
|
|
|
$
|
|
|
$
|
|
|
$
|
|
|
|||
|
|
Three Months Ended September 30,
|
Nine Months Ended September 30,
|
|||||||||||||
|
Total Adjusted PTC
|
2018
|
2017
|
2018
|
2017
|
|||||||||||
|
Income from continuing operations before taxes and equity in earnings of affiliates
|
$
|
|
|
$
|
|
|
$
|
|
|
$
|
|
|
|||
|
Add: Net equity in earnings of affiliates
|
|
|
|
|
|
|
|
|
|||||||
|
Less: Income from continuing operations before taxes, attributable to noncontrolling interests
|
(
|
)
|
(
|
)
|
(
|
)
|
(
|
)
|
|||||||
|
Pre-tax contribution
|
|
|
|
|
|
|
|
|
|||||||
|
Unrealized derivative and equity securities losses (gains)
|
|
|
(
|
)
|
|
|
(
|
)
|
|||||||
|
Unrealized foreign currency losses (gains)
|
(
|
)
|
(
|
)
|
|
|
(
|
)
|
|||||||
|
Disposition/acquisition losses (gains)
|
|
|
|
|
(
|
)
|
|
|
|||||||
|
Impairment expense
|
|
|
|
|
|
|
|
|
|||||||
|
Losses (gains) on extinguishment of debt
|
(
|
)
|
|
|
|
|
|
|
|||||||
|
Restructuring costs
|
|
|
|
|
|
|
|
|
|||||||
|
Total Adjusted PTC
|
$
|
|
|
$
|
|
|
$
|
|
|
$
|
|
|
|||
|
Three Months Ended September 30,
|
Nine Months Ended September 30,
|
||||||||||||||
|
Total Adjusted PTC
|
2018
|
2017
|
2018
|
2017
|
|||||||||||
|
US and Utilities SBU
|
$
|
|
|
$
|
|
|
$
|
|
|
$
|
|
|
|||
|
South America SBU
|
|
|
|
|
|
|
|
|
|||||||
|
MCAC SBU
|
|
|
|
|
|
|
|
|
|||||||
|
Eurasia SBU
|
|
|
|
|
|
|
|
|
|||||||
|
Corporate, Other and Eliminations
|
(
|
)
|
(
|
)
|
(
|
)
|
(
|
)
|
|||||||
|
Total Adjusted PTC
|
$
|
|
|
$
|
|
|
$
|
|
|
$
|
|
|
|||
20
|
Total Assets
|
September 30, 2018
|
December 31, 2017
|
|||||
|
US and Utilities SBU
|
$
|
|
|
$
|
|
|
|
|
South America SBU
|
|
|
|
|
|||
|
MCAC SBU
|
|
|
|
|
|||
|
Eurasia SBU
|
|
|
|
|
|||
|
Assets held-for-sale
|
|
|
|
|
|||
|
Corporate and Other
|
|
|
|
|
|||
|
Total Assets
|
$
|
|
|
$
|
|
|
|
12
.
REVENUE
Revenue is earned from the sale of electricity from our utilities and the production and sale of electricity and capacity from our generation facilities. Revenue is recognized upon the transfer of control of promised goods or services to customers in an amount that reflects the consideration to which we expect to be entitled in exchange for those goods or services. Revenue is recorded net of any taxes assessed on and collected from customers, which are remitted to the governmental authorities.
Utilities
—
Our utilities sell electricity directly to end-users, such as homes and businesses, and bill customers directly. The majority of our utility contracts have a single performance obligation, as the promises to transfer energy, capacity, and other distribution and/or transmission services are not distinct. Additionally, as the performance obligation is satisfied over time as energy is delivered, and the same method is used to measure progress, the performance obligation meets the criteria to be considered a series. Utility revenue is classified as regulated on the Condensed Consolidated Statements of Operations.
In exchange for the right to sell or distribute electricity in a service territory, our utility businesses are subject to government regulation. This regulation sets the framework for the prices (“tariffs”) that our utilities are allowed to charge customers for electricity. Since tariffs are determined by the regulator, the price that our utilities have the right to bill corresponds directly with the value to the customer of the utility's performance completed in each period. The Company also has some month-to-month contracts. Revenue under these contracts is recognized using an output method measured by the MWh delivered each month, which best depicts the transfer of goods or services to the customer, at the approved tariff.
The Company has businesses where it sells and purchases power to and from ISOs and RTOs. Our utility businesses generally purchase power to satisfy the demand of customers that is not contracted through separate PPAs. In these instances, the Company accounts for these transactions on a net hourly basis because the transactions are settled on a net hourly basis. In limited situations, a utility customer may choose to receive generation services from a third-party provider, in which case the Company may serve as a billing agent for the provider and recognize revenue on a net basis.
Generation —
Most of our generation fleet sells electricity under contracts to customers such as utilities, industrial users, and other intermediaries. Our generation contracts, based on specific facts and circumstances, can have one or more performance obligations as the promise to transfer energy, capacity, and other services may or may not be distinct depending on the nature of the market and terms of the contract. Similar to our utilities businesses, as the performance obligations are generally satisfied over time and use the same method to measure progress, the performance obligations meet the criteria to be considered a series. In measuring progress toward satisfaction of a performance obligation, the Company applies the "right to invoice" practical expedient when available, and recognizes revenue in the amount to which the Company has a right to consideration from a customer that corresponds directly with the value of the performance completed to date. Revenue from generation businesses is classified as non-regulated on the Condensed Consolidated Statements of Operations.
For contracts determined to have multiple performance obligations, we allocate revenue to each performance obligation based on its relative standalone selling price using a market or expected cost plus margin approach. Additionally, the Company allocates variable consideration to one or more, but not all, distinct goods or services that form part of a single performance obligation when (1) the variable consideration relates specifically to the efforts to transfer the distinct good or service and (2) the variable consideration depicts the amount to which the Company expects to be entitled in exchange for transferring the promised good or service to the customer.
Revenue from generation contracts is recognized using an output method, as energy and capacity delivered best depicts the transfer of goods or services to the customer. Performance obligations including energy or ancillary services (such as operations and maintenance and dispatch services) are generally measured by the MWh delivered. Capacity, which is a stand-ready obligation to deliver energy when required by the customer, is measured using MWs. In certain contracts, if plant availability exceeds a contractual target, the Company may receive a performance bonus payment, or if the plant availability falls below a guaranteed minimum target, we may incur a
21
non-availability penalty. Such bonuses or penalties represent a form of variable consideration and are estimated and recognized when it is probable that there will not be a significant reversal.
In assessing whether variable quantities are considered variable consideration or an option to acquire additional goods and services, the Company evaluates the nature of the promise and the legally enforceable rights in the contract. In some contracts, such as requirement contracts, the legally enforceable rights merely give the customer a right to purchase additional goods and services which are distinct. In these contracts, the customer's action results in a new obligation, and the variable quantities are considered an option.
When energy or capacity is sold or purchased in the spot market or to ISOs, the Company assesses the facts and circumstances to determine gross versus net presentation of spot revenues and purchases. Generally, the nature of the performance obligation is to sell surplus energy or capacity above contractual commitments, or to purchase energy or capacity to satisfy deficits. Generally, on an hourly basis, a generator is either a net seller or a net buyer in terms of the amount of energy or capacity transacted with the ISO. In these situations, the Company recognizes revenue for the hours where the generator is a net seller and cost of sales for the hours where the generator is a net buyer.
Certain generation contracts contain operating leases where capacity payments are generally considered the lease elements. In such cases, the allocation between the lease and non-lease elements is made at the inception of the lease following the guidance in ASC 840. Minimum lease payments from such contracts are recognized as revenue on a straight-line basis over the lease term whereas contingent rentals are recognized when earned. Lease revenue is presented separately from revenue from contracts with customers below.
|
Three Months Ended September 30, 2018
|
|||||||||||||||||||||||
|
US and Utilities SBU
|
South America SBU
|
MCAC SBU
|
Eurasia SBU
|
Corporate and Other/ Eliminations
|
Total
|
||||||||||||||||||
|
Regulated Revenue
|
|||||||||||||||||||||||
|
Revenue from contracts with customers
|
$
|
|
|
$
|
|
|
$
|
|
|
$
|
|
|
$
|
|
|
$
|
|
|
|||||
|
Other regulated revenue
|
|
|
|
|
|
|
|
|
|
|
|
|
|||||||||||
|
Total regulated revenue
|
$
|
|
|
$
|
|
|
$
|
|
|
$
|
|
|
$
|
|
|
$
|
|
|
|||||
|
Non-Regulated Revenue
|
|||||||||||||||||||||||
|
Revenue from contracts with customers
|
$
|
|
|
$
|
|
|
$
|
|
|
$
|
|
|
$
|
(
|
)
|
$
|
|
|
|||||
|
Other non-regulated revenue
(1)
|
|
|
|
|
|
|
|
|
|
|
|
|
|||||||||||
|
Total non-regulated revenue
|
$
|
|
|
$
|
|
|
$
|
|
|
$
|
|
|
$
|
(
|
)
|
$
|
|
|
|||||
|
Total revenue
|
$
|
|
|
$
|
|
|
$
|
|
|
$
|
|
|
$
|
(
|
)
|
$
|
|
|
|||||
|
Nine Months Ended September 30, 2018
|
|||||||||||||||||||||||
|
US and Utilities SBU
|
South America SBU
|
MCAC SBU
|
Eurasia SBU
|
Corporate and Other/ Eliminations
|
Total
|
||||||||||||||||||
|
Regulated Revenue
|
|||||||||||||||||||||||
|
Revenue from contracts with customers
|
$
|
|
|
$
|
|
|
$
|
|
|
$
|
|
|
$
|
|
|
$
|
|
|
|||||
|
Other regulated revenue
|
|
|
|
|
|
|
|
|
|
|
|
|
|||||||||||
|
Total regulated revenue
|
$
|
|
|
$
|
|
|
$
|
|
|
$
|
|
|
$
|
|
|
$
|
|
|
|||||
|
Non-Regulated Revenue
|
|||||||||||||||||||||||
|
Revenue from contracts with customers
|
$
|
|
|
$
|
|
|
$
|
|
|
$
|
|
|
$
|
(
|
)
|
$
|
|
|
|||||
|
Other non-regulated revenue
(1)
|
|
|
|
|
|
|
|
|
(
|
)
|
|
|
|||||||||||
|
Total non-regulated revenue
|
$
|
|
|
$
|
|
|
$
|
|
|
$
|
|
|
$
|
(
|
)
|
$
|
|
|
|||||
|
Total revenue
|
$
|
|
|
$
|
|
|
$
|
|
|
$
|
|
|
$
|
(
|
)
|
$
|
|
|
|||||
_____________________________
|
(1)
|
Other non-regulated revenue primarily includes lease and derivative revenue not accounted for under ASC 606.
|
Contract Balances —
The timing of revenue recognition, billings, and cash collections results in accounts receivable and contract liabilities. Accounts receivable represent unconditional rights to consideration and consist of both billed amounts and unbilled amounts typically resulting from sales under long-term contracts when revenue recognized exceeds the amount billed to the customer. We bill both generation and utilities customers on a contractually agreed-upon schedule, typically at periodic intervals (e.g., monthly). The calculation of revenue earned but not yet billed is based on the number of days not billed in the month, the estimated amount of energy delivered during those days and the estimated average price per customer class for that month.
22
Our contract liabilities consist of deferred revenue which is classified as current or noncurrent based on the timing of when we expect to recognize revenue. The current portion of our contract liabilities is reported in
Accrued and other liabilities
and the noncurrent portion is reported in
Other noncurrent liabilities
on the Condensed Consolidated Balance Sheets. The contract liabilities from contracts with customers were
$
116
million
and
$
131
million
as of
September 30, 2018
and January 1, 2018, respectively.
Of the
$
131
million
of contract liabilities reported at January 1, 2018,
$
33
million
was recognized as revenue during the
nine months ended September 30, 2018
.
A significant financing arrangement exists for our Mong Duong plant in Vietnam. The plant was constructed under a build, operate, and transfer contract and will be transferred to the Vietnamese government after the completion of a 25 year PPA. The performance obligation to construct the facility was substantially completed in 2015. Approximately
$1.4 billion
of contract consideration related to the construction, but not yet collected through the 25 year PPA, was reflected as a loan receivable as of
September 30, 2018
.
13
.
OTHER INCOME AND EXPENSE
|
Three Months Ended September 30,
|
Nine Months Ended September 30,
|
|||||||||||||||
|
2018
|
2017
|
2018
|
2017
|
|||||||||||||
|
Other Income
|
Legal settlements
(1)
|
$
|
|
|
$
|
|
|
$
|
|
|
$
|
|
|
|||
|
Allowance for funds used during construction (US Utilities)
|
|
|
|
|
|
|
|
|
||||||||
|
Other
|
|
|
|
|
|
|
|
|
||||||||
|
Total other income
|
$
|
|
|
$
|
|
|
$
|
|
|
$
|
|
|
||||
|
Other Expense
|
Loss on sale and disposal of assets
(2)
|
$
|
|
|
$
|
|
|
$
|
|
|
$
|
|
|
|||
|
Water rights write-off
|
|
|
|
|
|
|
|
|
||||||||
|
Allowance for other receivables
|
|
|
|
|
|
|
|
|
||||||||
|
Other
|
|
|
|
|
|
|
|
|
||||||||
|
Total other expense
|
$
|
|
|
$
|
|
|
$
|
|
|
$
|
|
|
||||
_____________________________
|
|
|
|
(2)
|
|
23
14
.
ASSET IMPAIRMENT EXPENSE
The following table presents our asset impairment expense by asset group for the periods indicated (in millions):
|
Three Months Ended September 30,
|
Nine Months Ended September 30,
|
||||||||||||||
|
2018
|
2017
|
2018
|
2017
|
||||||||||||
|
U.S. generation facility
|
$
|
|
|
$
|
|
|
$
|
|
|
$
|
|
|
|||
|
Kazakhstan hydroelectric
|
|
|
|
|
|
|
|
|
|||||||
|
Kazakhstan CHPs
|
|
|
|
|
|
|
|
|
|||||||
|
DPL
|
|
|
|
|
|
|
|
|
|||||||
|
Other
|
|
|
|
|
|
|
|
|
|||||||
|
Total
|
$
|
|
|
$
|
|
|
$
|
|
|
$
|
|
|
|||
U.S. generation facility
— In June 2018, the Company tested the recoverability of its long-lived assets at a generation facility in the U.S. due to an unfavorable economic outlook resulting in uncertainty around future cash flows. The Company determined that the carrying amount of the asset group, including long-lived assets, was not recoverable. The asset group was determined to have a fair value of
$
127
million
as of June 30, 2018 using a combination of the income and market approaches. As a result, the Company recognized an asset impairment expense of
$
83
million
. The generation facility is reported in the US and Utilities SBU reportable segment.
In the third quarter of 2018, as a result of updated assumptions regarding the future use of the assets, management’s expectations of future cash flows for the facility decreased. Given updated inputs, the asset group was determined to have a fair value of
$
55
million
as of September 30, 2018 and additional impairment expense of
$
73
million
was recognized. Given the uncertainty regarding the future use of the asset group, the Company will continue to monitor the economic outlook for the facility on an ongoing basis.
DPL
— In March 2017, the Board of Directors of DPL approved the retirement of the DPL operated and co-owned Stuart coal-fired and diesel-fired generating units, and the Killen coal-fired generating unit and combustion turbine on or before June 1, 2018. The Company performed an impairment analysis and determined that the carrying amounts of the facilities were not recoverable. The Stuart and Killen asset groups were determined to have fair values of
$
3
million
and
$
8
million
, respectively, using the income approach. As a result, the Company recognized total asset impairment expense of
$
66
million
. The Stuart and Killen units were retired in May 2018. Prior to their retirement, Stuart and Killen were reported in the US and Utilities SBU reportable segment. See Note
17
—Held-for-Sale and Dispositions
for further information.
Kazakhstan hydroelectric
— In April 2017, the Government of Kazakhstan stated the concession agreements would not be extended for Shulbinsk HPP and Ust-Kamenogorsk HPP, two hydroelectric plants in Kazakhstan, and initiated the process to transfer these plants back to the government. The Company performed an impairment analysis and determined that the carrying value of the asset group of
$
190
million
, which included cumulative translation losses of
$
100
million
, was greater than its fair value less costs to sell of
$
92
million
. As a result, the Company recognized asset impairment expense of
$
92
million
limited to the carrying value of the long-lived assets. The Company completed the transfer of the plants in October 2017. Prior to their transfer, the Kazakhstan hydroelectric plants were reported in the Eurasia SBU reportable segment.
15
.
INCOME TAXES
The Company’s provision for income taxes is based on the estimated annual effective tax rate, plus discrete items. The effective tax rates for the three and nine month periods ended
September 30, 2018
were
44
%
and
30
%
, respectively. The effective tax rates for the three and nine month periods ended September 30, 2017 were
31
%
and
36
%
, respectively. The difference between the Company’s effective tax rates for the 2018 and
2017
periods and the U.S. statutory tax rates of
21
%
and
35
%
, respectively, related primarily to U.S. taxes on foreign earnings, foreign tax
24
rate differentials, the impacts of foreign currency fluctuations at certain foreign subsidiaries, and nondeductible expenses.
The Tax Cuts and Jobs Act (“The TCJA”) was enacted on December 22, 2017. The TCJA reduced the U.S. federal corporate income tax rate from
35
%
to
21
%
, required companies to pay a one-time transition tax on earnings of certain foreign subsidiaries that were previously tax deferred, and created new taxes on certain foreign sourced earnings. We are applying the guidance in Staff Accounting Bulletin No. 118 (“SAB 118”) when accounting for the enactment date effect of the TCJA. We recognized a reasonable estimate of the tax effects of the TCJA as of December 31, 2017. In the third quarter of 2018, the Company recorded
$
33
million
of discrete tax expense, increasing the provisional adjustment to the U.S. one-time transition tax to
$
708
million
. However, as of
September 30, 2018
, our accounting is not complete. Our estimates may also be affected as we gain a more thorough understanding of the TCJA, including proposed regulations released by the U.S. Treasury Department on August 1 related to the one-time transition tax. We expect to complete our analysis of the final impacts of the TCJA in the fourth quarter. For further discussion on the TCJA, see Note 20—
Income Taxes
in Item 8.—
Financial Statements and Supplementary Data
of our
2017
Form 10-K.
In the first quarter of 2018, the Company completed the sale of its entire
51
%
equity interest in Masinloc, resulting in pre-tax gain of approximately
$
773
million
. The sale resulted in approximately
$
155
million
of discrete tax expense in the U.S. under the new GILTI provision, which subjects the earnings of foreign subsidiaries to current U.S. taxation to the extent those earnings exceed an allowable return. See Note
17
—Held-for-Sale and Dispositions
for details of the sale.
In the second quarter of 2018, the Company completed the sale of Electrica Santiago for total proceeds of
$
287
million
, resulting in a pre-tax gain on sale of
$
69
million
after post-closing adjustments. The sale resulted in approximately
$
25
million
of discrete tax expense. See Note
17
—Held-for-Sale and Dispositions
for details of the sale.
16
.
DISCONTINUED OPERATIONS
Due to a portfolio evaluation in the first half of 2016, management decided to pursue a strategic shift of its distribution companies in Brazil, Sul and Eletropaulo, to reduce the Company's exposure to the Brazilian distribution market. The disposals of Sul and Eletropaulo were completed in October 2016 and June 2018, respectively.
In November 2017, Eletropaulo converted its preferred shares into ordinary shares and transitioned the listing of those shares to the Novo Mercado, which is a listing segment of the Brazilian stock exchange with the highest standards of corporate governance. Upon conversion of the preferred shares into ordinary shares, AES no longer controlled Eletropaulo, but maintained significant influence over the business. As a result, the Company deconsolidated Eletropaulo. After deconsolidation, the Company's
17
%
ownership interest was reflected as an equity method investment. The Company recorded an after-tax loss on deconsolidation of
$
611
million
, which primarily consisted of
$
455
million
related to cumulative translation losses and
$
243
million
related to pension losses reclassified from AOCL.
In December 2017, all the remaining criteria were met for Eletropaulo to qualify as a discontinued operation. Therefore, its results of operations and financial position were reported as such in the consolidated financial statements for all periods presented.
In June 2018, the Company completed the sale of its entire
17
%
ownership interest in Eletropaulo through a bidding process hosted by the Brazilian securities regulator, CVM. Gross proceeds of
$
340
million
were received at our subsidiary in Brazil, subject to the payment of taxes. Upon disposal of Eletropaulo, the Company recorded a pre-tax gain on sale of
$
243
million
(after-tax
$
199
million
). Prior to its classification as discontinued operations, Eletropaulo was reported in the South America SBU reportable segment.
25
The following table summarizes the carrying amounts of the major classes of assets and liabilities of discontinued operations at
December 31, 2017
(in millions):
|
December 31, 2017
|
|||
|
Assets of discontinued operations and held-for-sale businesses:
|
|||
|
Investments in and advances to affiliates
(1)
|
$
|
|
|
|
Total assets of discontinued operations
|
$
|
|
|
|
Other assets of businesses classified as held-for-sale
(2)
|
|
|
|
|
Total assets of discontinued operations and held-for-sale businesses
|
$
|
|
|
|
Liabilities of discontinued operations and held-for-sale businesses:
|
|||
|
Other liabilities of businesses classified as held-for-sale
(2)
|
|
|
|
|
Total liabilities of discontinued operations and held-for-sale businesses
|
$
|
|
|
_____________________________
|
(1)
|
Represents the Company's
|
|
(2)
|
Electrica Santiago, the DPL Peaker Assets and Masinloc were classified as held-for-sale as of
December 31, 2017
. See Note
17
—
Held-for-Sale and Dispositions
for further information.
|
Excluding the gain on sale, income from discontinued operations and cash flows from operating and investing activities of discontinued operations were immaterial for the three and
nine months ended September 30, 2018
.
|
Income from discontinued operations, net of tax:
|
Three Months Ended September 30, 2017
|
Nine Months Ended September 30, 2017
|
|||||
|
Revenue — regulated
|
$
|
|
|
$
|
|
|
|
|
Cost of sales
|
(
|
)
|
(
|
)
|
|||
|
Other income and expense items that are not major
|
(
|
)
|
(
|
)
|
|||
|
Income from discontinued operations
|
$
|
|
|
$
|
|
|
|
|
Less: Net income attributable to noncontrolling interests
|
(
|
)
|
(
|
)
|
|||
|
Income from discontinued operations attributable to The AES Corporation
|
$
|
|
|
$
|
|
|
|
|
Income tax expense
|
(
|
)
|
(
|
)
|
|||
|
Income from discontinued operations, net of tax
|
$
|
|
|
$
|
|
|
|
The following table summarizes the operating and investing cash flows from discontinued operations for the three and
nine months ended September 30, 2017
(in millions):
|
Three Months Ended September 30, 2017
|
Nine Months Ended September 30, 2017
|
||||||
|
Cash flows provided by operating activities of discontinued operations
|
$
|
|
|
$
|
|
|
|
|
Cash flows used in investing activities of discontinued operations
|
(
|
)
|
(
|
)
|
|||
17
.
HELD-FOR-SALE AND DISPOSITIONS
Dispositions
Electrica Santiago —
In May 2018, AES Gener completed the sale of Electrica Santiago for total consideration of
$
287
million
, including a contingent liability of
$
9
million
, resulting in a pre-tax gain on sale of
$
69
million
after post-closing adjustments. Electrica Santiago consisted of four gas and diesel-fired generation plants in Chile. The sale did not meet the criteria to be reported as discontinued operations. Prior to its sale, Electrica Santiago was reported in the South America SBU reportable segment.
Stuart and Killen —
In May 2018, DPL retired the co-owned Stuart coal-fired and diesel-fired generating units, and the Killen coal-fired generating unit and combustion turbine. Prior to their retirement, Stuart and Killen were reported in the US and Utilities SBU reportable segment. See Note
14
—Asset Impairment Expense
for further information.
26
Masinloc —
In March 2018, the Company completed the sale of its entire
51
%
equity interest in Masinloc for cash proceeds of
$
1.05
billion
, resulting in a pre-tax gain on sale of
$
773
million
after post-closing adjustments and U.S. tax expense of
$
155
million
. Masinloc consisted of a coal-fired generation plant in operation, a coal-fired generation plant under construction, and an energy storage facility all located in the Philippines. The sale did not meet the criteria to be reported as discontinued operations. Prior to its sale, Masinloc was reported in the Eurasia SBU reportable segment.
DPL peaker assets —
In March 2018, DPL completed the sale of six of its combustion turbine and diesel-fired generation facilities and related assets ("DPL peaker assets") for total proceeds of
$
239
million
, inclusive of estimated working capital and subject to customary post-closing adjustments, resulting in a loss on sale of
$
2
million
. The sale did not meet the criteria to be reported as discontinued operations. Prior to their sale, the DPL peaker assets were reported in the US and Utilities SBU reportable segment.
Beckjord facility —
In February 2018, DPL transferred its interest in Beckjord, a coal-fired generation facility retired in 2014, including its obligations to remediate the facility and its site. The transfer resulted in cash expenditures of
$
15
million
, inclusive of disposal charges, and a loss on disposal of
$
12
million
. Prior to the transfer, Beckjord was reported in the US and Utilities SBU reportable segment.
Advancion Energy Storage —
In January 2018, the Company deconsolidated the AES Advancion energy storage development business and contributed it to the Fluence joint venture, resulting in a gain on sale of
$
23
million
. See Note
6
—Investments in and Advances to Affiliates
for further discussion. Prior to the transfer, the AES Advancion energy storage development business was reported as part of Corporate and Other.
Kazakhstan CHPs
—
In April 2017, the Company completed the sale of Ust-Kamenogorsk CHP and Sogrinsk CHP, its combined heating and power coal plants in Kazakhstan, for net proceeds of
$
24
million
. The Company recognized a pre-tax loss on sale of
$
48
million
, primarily related to cumulative translation losses. The sale did not meet the criteria to be reported as discontinued operations. Prior to their sale, the Kazakhstan CHP plants were reported in the Eurasia SBU reportable segment. See Note
14
—Asset Impairment Expense
for further information.
|
Three Months Ended September 30,
|
Nine Months Ended September 30,
|
||||||||||||||
|
(in millions)
|
2018
|
2017
|
2018
|
2017
|
|||||||||||
|
Masinloc
|
$
|
|
|
$
|
|
|
$
|
|
|
$
|
|
|
|||
|
Stuart and Killen
(1)
|
|
|
|
|
|
|
|
|
|||||||
|
DPL peaker assets
|
|
|
|
|
|
|
|
|
|||||||
|
Other
|
|
|
|
|
|
|
|
|
|||||||
|
Total
|
$
|
|
|
$
|
|
|
$
|
|
|
$
|
|
|
|||
_____________________________
|
(1)
|
|
18
.
ACQUISITIONS
Guaimbê Solar Complex —
In September 2018, AES Tietê completed the acquisition of the Guaimbê Solar Complex (“Guaimbê”) from Cobra do Brasil for
$
152
million
, subject to post-closing adjustments, comprised of the exchange of
$
119
million
of non-convertible debentures in project financing and additional cash consideration of
$
33
million
. The transaction was accounted for as an asset acquisition, therefore the consideration transferred, plus transaction costs, were allocated to the individual assets acquired and liabilities assumed based on their relative fair values. Any differences arising from post-closing adjustments will be allocated accordingly. Guaimbê is reported in the South America SBU reportable segment.
Alto Sertão II —
In August 2017, the Company completed the acquisition of the Alto Sertão II Wind Complex (“Alto Sertão II”) from Renova Energia S.A for
$
179
million
, plus the assumption of
$
346
million
of non-recourse debt. At closing, the Company made a cash payment of
$
143
million
, which excluded holdbacks related to indemnifications. In September 2018, an additional
$
12
million
was paid to settle a portion of the remaining indemnification liability. In the first quarter of 2018, the Company finalized the purchase price allocation related to the acquisition of Alto Sertão II. There were no significant adjustments made to the preliminary purchase price allocation recorded in the third quarter of 2017 when the acquisition was completed. The assets acquired and liabilities assumed at the acquisition date were recorded at fair value, including a contingent liability for earn-out payments of
$
18
million
, based on the final purchase price allocation at March 31, 2018. Subsequent changes to the fair value of the earn-out payments will be reflected in earnings. Alto Sertão II is reported in the South America
27
19
.
EARNINGS PER SHARE
|
Three Months Ended September 30,
|
2018
|
2017
|
|||||||||||||||||||
|
(in millions, except per share data)
|
Income
|
Shares
|
$ per Share
|
Income
|
Shares
|
$ per Share
|
|||||||||||||||
|
BASIC EARNINGS PER SHARE
|
|||||||||||||||||||||
|
Income from continuing operations attributable to The AES Corporation common stockholders
|
$
|
|
|
|
|
$
|
|
|
$
|
|
|
|
|
$
|
|
|
|||||
|
EFFECT OF DILUTIVE SECURITIES
|
|
||||||||||||||||||||
|
Restricted stock units
|
|
|
|
|
|
|
|
|
|
|
|
|
|||||||||
|
DILUTED EARNINGS PER SHARE
|
$
|
|
|
|
|
$
|
|
|
$
|
|
|
|
|
$
|
|
|
|||||
|
Nine Months Ended September 30,
|
2018
|
2017
|
|||||||||||||||||||
|
(in millions, except per share data)
|
Income
|
Shares
|
$ per Share
|
Income
|
Shares
|
$ per Share
|
|||||||||||||||
|
BASIC EARNINGS PER SHARE
|
|||||||||||||||||||||
|
Income from continuing operations attributable to The AES Corporation common stockholders
|
$
|
|
|
|
|
$
|
|
|
$
|
|
|
|
|
$
|
|
|
|||||
|
EFFECT OF DILUTIVE SECURITIES
|
|||||||||||||||||||||
|
Restricted stock units
|
|
|
|
|
|
|
|
|
|
|
|
|
|||||||||
|
DILUTED EARNINGS PER SHARE
|
$
|
|
|
|
|
$
|
|
|
$
|
|
|
|
|
$
|
|
|
|||||
The condensed consolidated financial statements included in Item 1.—
Financial Statements
of this Form 10-Q and the discussions contained herein should be read in conjunction with our
2017
Form 10-K.
FORWARD-LOOKING INFORMATION
The following discussion may contain forward-looking statements regarding us, our business, prospects and our results of operations that are subject to certain risks and uncertainties posed by many factors and events that could cause our actual business, prospects and results of operations to differ materially from those that may be anticipated by such forward-looking statements. Factors that could cause or contribute to such differences include, but are not limited to, those described in Item 1A.—
Risk Factors
and Item 7.—
Management’s Discussion and Analysis of Financial Condition and Results of Operations
of our
2017
Form 10-K and subsequent filings with the SEC. Readers are cautioned not to place undue reliance on these forward-looking statements which speak only as of the date of this report. We undertake no obligation to revise any forward-looking statements in order to reflect events or circumstances that may subsequently arise. If we do update one or more forward-looking statements, no inference should be drawn that we will make additional updates with respect to those or other forward-looking statements. Readers are urged to carefully review and consider the various disclosures made by us in this report and in our other reports filed with the SEC that advise of the risks and factors that may affect our business.
Overview of Our Business
—
We are a diversified power generation and utility company organized into the following
four
market-oriented SBUs:
US and Utilities
(United States, Puerto Rico and El Salvador);
South America
(Chile, Colombia, Argentina and Brazil);
MCAC
(Mexico, Central America and the Caribbean); and
Eurasia
(Europe and Asia).
During the first quarter of 2018, the Andes and Brazil SBUs were merged in order to leverage scale and are now reported together as part of the South America SBU. Further, Puerto Rico and El Salvador businesses, formerly part of the MCAC SBU, were combined with the US SBU, which is now reported as
28
the US and Utilities SBU.
For additional information regarding our business, see Item 1.—
Business
of our
2017
Form 10-K.
We have two lines of business. The first business line is generation, where we own and/or operate power plants to generate and sell power to customers such as utilities, industrial users and other intermediaries. The second business line is utilities, where we own and/or operate utilities to generate or purchase, distribute, transmit and sell electricity to end-user customers in the residential, commercial, industrial and governmental sectors within a defined service area. In certain circumstances, our utilities also generate and sell electricity on the wholesale market. The generation lines of business are reported within all
four
of our SBUs and the utilities lines of business are reported within our US and Utilities SBU.
29
Executive Summary
Compared with last year, the results for the
three months ended September 30, 2018
reflect increased margins primarily due to higher tariffs in Argentina, new contracts and lower fixed costs in Chile, higher contract sales and prices in Colombia, and higher regulated rates and higher dispatch at the US and Utilities SBU partially offset by the sale of the Masinloc power plant in March of 2018.
Margins increased for the
nine months ended September 30, 2018
compared to the prior year primarily due to higher tariffs in Argentina, new contracts in Chile, higher contracted energy sales in the Dominican Republic, higher contract sales and prices in Colombia, and higher regulated rates and energy sales at the US and Utilities SBU partially offset by the sale of the Masinloc power plant in March of 2018.
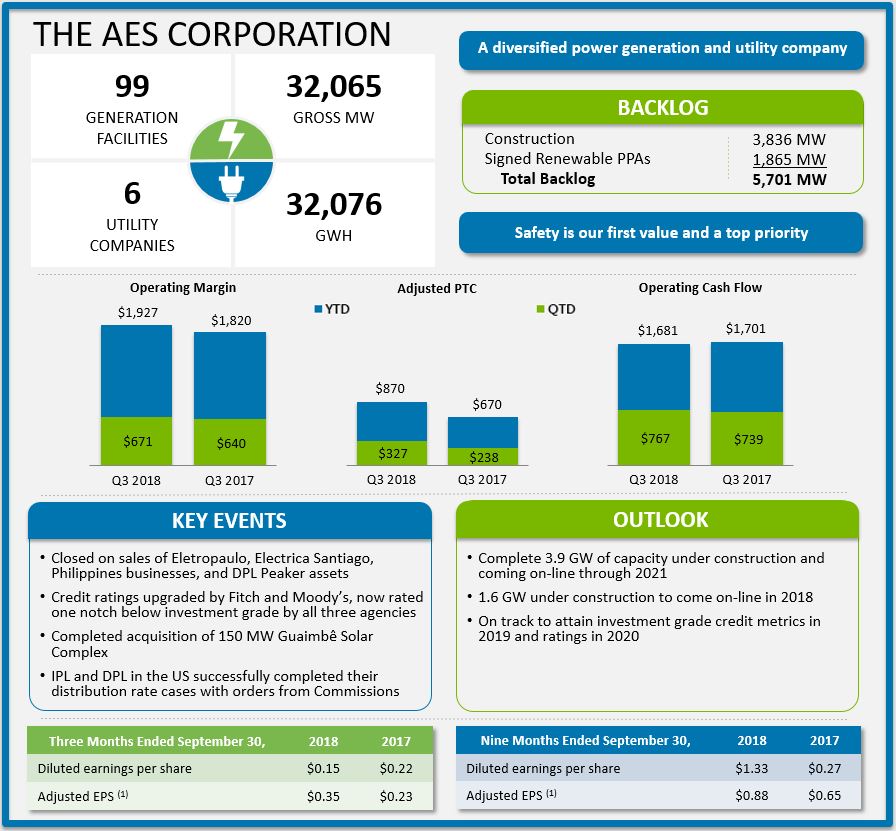
_____________________________
|
(1)
|
See Item 2.—
SBU Performance Analysis
—
Non-GAAP Measures
for reconciliation and definition.
|
30
Three Months Ended September 30, 2018
Compared with the third quarter of the prior year, diluted earnings per share
decreased
$0.07
to
$0.15
, primarily due to a current year impairment in the U.S. and a charge to true-up the provisional estimate of U.S. tax reform. These decreases were partially offset by a prior year loss on extinguishment of debt, lower interest on Parent Company debt, and higher margins discussed above.
Adjusted EPS, a non-GAAP measure,
increased
$0.12
, or
52%
, to
$0.35
, primarily driven by higher margins discussed above, lower interest on Parent Company debt, and a lower effective tax rate.
Nine Months Ended September 30, 2018
Compared with the first nine months of the prior year, diluted earnings per share
increased
$1.06
to
$1.33
primarily due to the current year gains on sales of Masinloc and Electrica Santiago, prior year loss on sale of the Kazakhstan CHPs, impairments at DP&L and in Kazakhstan, lower interest on Parent Company debt, and higher margins discussed above. These increases were partially offset by a current year impairment in the U.S., unrealized FX losses, a charge to true-up the provisional estimate of U.S. tax reform, current year losses on extinguishment of debt, and a favorable legal settlement at Uruguaiana in the prior year.
Adjusted EPS, a non-GAAP measure,
increased
$0.23
, or
35%
, to
$0.88
, primarily driven by higher margins discussed above, lower interest on Parent Company debt, and a lower effective tax rate, which was partially offset by the prior year favorable impact of a legal settlement at Uruguaiana.
Overview of
Q3 2018
Results and Strategic Performance
Strategic Priorities
— We continue to improve the returns from our existing portfolio and position AES for long-term, sustainable growth. Our growth pipeline continues to increase, driven by our focus on select markets and taking advantage of our cost competitiveness, scale, existing businesses and relationships.
|
Improving Risk Profile
|
|||||||
|
●
|
Closed sales of Philippines businesses in March 2018 and Eletropaulo in Brazil in June 2018 and signed an agreement to sell-down 24% of our interest in sPower’s operating portfolio in October 2018, at attractive valuations
|
||||||
|
●
|
Allocated $1 billion to prepay Parent debt and strengthen credit ratings
|
||||||
|
○
|
Upgraded by S&P to BB+ in March 2018, by Fitch to BB+ in May 2018 and by Moody’s to Ba1 in June 2018
|
||||||
|
●
|
AES Gener restructured the 531 MW Alto Maipo hydroelectric project under construction in Chile in May 2018
|
||||||
|
●
|
DPL successfully completed its distribution rate case with an order from the Ohio Commission and began collecting new rates on October 1, 2018
|
||||||
|
●
|
In October, IPL received an order from the Indiana Utility Regulatory Commission, authorizing new rates to become effective on December 5, 2018
|
||||||
|
Efficiency
|
|||||||
|
●
|
On track to achieve $100 million cost savings program
|
||||||
|
Profitable Growth
|
|||||||
|
●
|
5,701 MW backlog, including 3,836 MW under construction and 1,865 MW of renewables signed to long-term PPAs
|
||||||
|
○
|
Completed 671 MW Eagle Valley CCGT in Indiana in April 2018 and 381 MW Colon CCGT in Panama in September 2018
|
||||||
|
●
|
Year-to-date, Fluence energy storage joint venture awarded more than 250 MW of new projects
|
||||||
31
Review of Consolidated Results of Operations (unaudited)
|
Three Months Ended September 30,
|
Nine Months Ended September 30,
|
||||||||||||||||||||||||||||
|
(in millions, except per share amounts)
|
2018
|
2017
|
$ change
|
% change
|
2018
|
2017
|
$ change
|
% change
|
|||||||||||||||||||||
|
Revenue:
|
|||||||||||||||||||||||||||||
|
US and Utilities SBU
|
$
|
1,230
|
|
$
|
1,086
|
|
$
|
144
|
|
13
|
%
|
$
|
3,252
|
|
$
|
3,179
|
|
$
|
73
|
|
2
|
%
|
|||||||
|
South America SBU
|
923
|
|
834
|
|
89
|
|
11
|
%
|
2,664
|
|
2,377
|
|
287
|
|
12
|
%
|
|||||||||||||
|
MCAC SBU
|
462
|
|
397
|
|
65
|
|
16
|
%
|
1,276
|
|
1,120
|
|
156
|
|
14
|
%
|
|||||||||||||
|
Eurasia SBU
|
224
|
|
380
|
|
(156
|
)
|
-41
|
%
|
935
|
|
1,204
|
|
(269
|
)
|
-22
|
%
|
|||||||||||||
|
Corporate and Other
|
7
|
|
9
|
|
(2
|
)
|
-22
|
%
|
21
|
|
29
|
|
(8
|
)
|
-28
|
%
|
|||||||||||||
|
Eliminations
|
(9
|
)
|
(13
|
)
|
4
|
|
31
|
%
|
(34
|
)
|
(22
|
)
|
(12
|
)
|
-55
|
%
|
|||||||||||||
|
Total Revenue
|
2,837
|
|
2,693
|
|
144
|
|
5
|
%
|
8,114
|
|
7,887
|
|
227
|
|
3
|
%
|
|||||||||||||
|
Operating Margin:
|
|
|
|
|
|||||||||||||||||||||||||
|
US and Utilities SBU
|
225
|
|
205
|
|
20
|
|
10
|
%
|
570
|
|
514
|
|
56
|
|
11
|
%
|
|||||||||||||
|
South America SBU
|
250
|
|
190
|
|
60
|
|
32
|
%
|
754
|
|
612
|
|
142
|
|
23
|
%
|
|||||||||||||
|
MCAC SBU
|
144
|
|
142
|
|
2
|
|
1
|
%
|
379
|
|
336
|
|
43
|
|
13
|
%
|
|||||||||||||
|
Eurasia SBU
|
34
|
|
101
|
|
(67
|
)
|
-66
|
%
|
175
|
|
342
|
|
(167
|
)
|
-49
|
%
|
|||||||||||||
|
Corporate and Other
|
(4
|
)
|
1
|
|
(5
|
)
|
NM
|
|
32
|
|
16
|
|
16
|
|
100
|
%
|
|||||||||||||
|
Eliminations
|
22
|
|
1
|
|
21
|
|
NM
|
|
17
|
|
—
|
|
17
|
|
NM
|
|
|||||||||||||
|
Total Operating Margin
|
671
|
|
640
|
|
31
|
|
5
|
%
|
1,927
|
|
1,820
|
|
107
|
|
6
|
%
|
|||||||||||||
|
General and administrative expenses
|
(43
|
)
|
(52
|
)
|
9
|
|
-17
|
%
|
(134
|
)
|
(155
|
)
|
21
|
|
-14
|
%
|
|||||||||||||
|
Interest expense
|
(255
|
)
|
(297
|
)
|
42
|
|
-14
|
%
|
(799
|
)
|
(860
|
)
|
61
|
|
-7
|
%
|
|||||||||||||
|
Interest income
|
79
|
|
63
|
|
16
|
|
25
|
%
|
231
|
|
185
|
|
46
|
|
25
|
%
|
|||||||||||||
|
Loss on extinguishment of debt
|
(11
|
)
|
(49
|
)
|
38
|
|
-78
|
%
|
(187
|
)
|
(44
|
)
|
(143
|
)
|
NM
|
|
|||||||||||||
|
Other expense
|
(29
|
)
|
(36
|
)
|
7
|
|
-19
|
%
|
(42
|
)
|
(67
|
)
|
25
|
|
-37
|
%
|
|||||||||||||
|
Other income
|
10
|
|
16
|
|
(6
|
)
|
-38
|
%
|
30
|
|
103
|
|
(73
|
)
|
-71
|
%
|
|||||||||||||
|
Gain (loss) on disposal and sale of businesses
|
(21
|
)
|
(1
|
)
|
(20
|
)
|
NM
|
|
856
|
|
(49
|
)
|
905
|
|
NM
|
|
|||||||||||||
|
Asset impairment expense
|
(74
|
)
|
(2
|
)
|
(72
|
)
|
NM
|
|
(166
|
)
|
(260
|
)
|
94
|
|
-36
|
%
|
|||||||||||||
|
Foreign currency transaction gains (losses)
|
5
|
|
22
|
|
(17
|
)
|
-77
|
%
|
(44
|
)
|
14
|
|
(58
|
)
|
NM
|
|
|||||||||||||
|
Income tax expense
|
(146
|
)
|
(93
|
)
|
(53
|
)
|
57
|
%
|
(509
|
)
|
(246
|
)
|
(263
|
)
|
NM
|
|
|||||||||||||
|
Net equity in earnings of affiliates
|
6
|
|
24
|
|
(18
|
)
|
-75
|
%
|
31
|
|
33
|
|
(2
|
)
|
-6
|
%
|
|||||||||||||
|
INCOME FROM CONTINUING OPERATIONS
|
192
|
|
235
|
|
(43
|
)
|
-18
|
%
|
1,194
|
|
474
|
|
720
|
|
NM
|
|
|||||||||||||
|
Income (loss) from operations of discontinued businesses, net of income tax expense of $0, $17, $2 and $24, respectively
|
(4
|
)
|
26
|
|
(30
|
)
|
NM
|
|
(9
|
)
|
35
|
|
(44
|
)
|
NM
|
|
|||||||||||||
|
Gain from disposal of discontinued businesses, net of income tax expense of $2, $0, $44 and $0, respectively
|
3
|
|
—
|
|
3
|
|
NM
|
|
199
|
|
—
|
|
199
|
|
NM
|
|
|||||||||||||
|
NET INCOME
|
191
|
|
261
|
|
(70
|
)
|
-27
|
%
|
1,384
|
|
509
|
|
875
|
|
NM
|
|
|||||||||||||
|
Less: Net income attributable to noncontrolling interests and redeemable stock of subsidiaries
|
(90
|
)
|
(109
|
)
|
19
|
|
-17
|
%
|
(309
|
)
|
(328
|
)
|
19
|
|
-6
|
%
|
|||||||||||||
|
NET INCOME ATTRIBUTABLE TO THE AES CORPORATION
|
$
|
101
|
|
$
|
152
|
|
$
|
(51
|
)
|
-34
|
%
|
$
|
1,075
|
|
$
|
181
|
|
$
|
894
|
|
NM
|
|
|||||||
|
AMOUNTS ATTRIBUTABLE TO THE AES CORPORATION COMMON STOCKHOLDERS:
|
|
|
|
|
|||||||||||||||||||||||||
|
Income from continuing operations, net of tax
|
$
|
102
|
|
$
|
147
|
|
$
|
(45
|
)
|
-31
|
%
|
$
|
883
|
|
$
|
176
|
|
$
|
707
|
|
NM
|
|
|||||||
|
Income (loss) from discontinued operations, net of tax
|
(1
|
)
|
5
|
|
(6
|
)
|
NM
|
|
192
|
|
5
|
|
187
|
|
NM
|
|
|||||||||||||
|
NET INCOME ATTRIBUTABLE TO THE AES CORPORATION
|
$
|
101
|
|
$
|
152
|
|
$
|
(51
|
)
|
-34
|
%
|
$
|
1,075
|
|
$
|
181
|
|
$
|
894
|
|
NM
|
|
|||||||
|
Net cash provided by operating activities
|
$
|
767
|
|
$
|
739
|
|
$
|
28
|
|
4
|
%
|
$
|
1,681
|
|
$
|
1,701
|
|
$
|
(20
|
)
|
-1
|
%
|
|||||||
|
DIVIDENDS DECLARED PER COMMON SHARE
|
$
|
0.13
|
|
$
|
0.12
|
|
$
|
0.01
|
|
8
|
%
|
$
|
0.26
|
|
$
|
0.24
|
|
$
|
0.02
|
|
8
|
%
|
|||||||
Components of Revenue, Cost of Sales, and Operating Margin —
Revenue includes revenue earned from the sale of energy from our utilities and the production and sale of energy from our generation plants, which are classified as regulated and non-regulated
,
respectively, on the Condensed Consolidated Statements of Operations. Revenue also includes the gains or losses on derivatives associated with the sale of electricity.
Cost of sales includes costs incurred directly by the businesses in the ordinary course of business. Examples include electricity and fuel purchases, operations and maintenance costs, depreciation and amortization expenses, bad debt expense and recoveries, and general administrative and support costs (including employee-related costs directly associated with the operations of the business). Cost of sales also includes the gains or losses on derivatives (including embedded derivatives other than foreign currency embedded derivatives) associated with the purchase of electricity or fuel.
Operating margin is defined as revenue less cost of sales.
32
Consolidated Revenue and Operating Margin
Three months ended September 30, 2018
Revenue
(in millions)
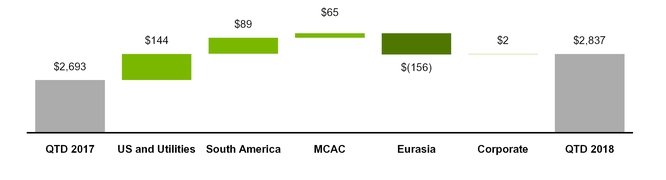
Consolidated Revenue
— Revenue
increased
$144 million
, or
5%
, for the
three months ended
September 30, 2018
, compared to the
three months ended
September 30, 2017
. Excluding the
unfavorable
FX impact of
$41 million
, primarily in South America, this
increase
was driven by:
|
•
|
$144 million in US and Utilities driven primarily by higher market energy sales at Southland as well as higher wholesale and retail volumes at IPL, partially offset by the sale and closure of several generation facilities at DPL; and
|
|
•
|
$125 million in South America mainly due to higher contract and spot sales in Colombia and Chile, higher generation at Gener due to planned maintenance in 2017 and
higher capacity prices in Argentina resulting from the 2017 market reforms; and
|
|
•
|
$69 million in MCAC driven primarily by higher availability due to improved hydrology in Panama and the commencement of operations of the Colon combined cycle facility in September 2018.
|
These favorable impacts were partially offset by $155 million decrease in Eurasia primarily due to the sale of the Masinloc power plant in March 2018, as well as the sale of the Kazakhstan CHPs and expiration of the Kazakhstan HPP concession agreement in 2017.
Operating Margin
(in millions)

Consolidated Operating Margin
— Operating margin
increased
$31 million
, or
5%
, for the
three months ended
September 30, 2018
, compared to the
three months ended
September 30, 2017
. Excluding the
unfavorable
impact of FX of
$1 million
, this
increase
was driven by:
•
$60 million in South America mostly due to the drivers discussed above; and
|
•
|
$20 million in US & Utilities due to the drivers discussed above, partially offset by higher costs related to early plant closures at DPL.
|
These favorable impacts were partially offset by a decrease of $67 million in Eurasia mostly due to the sale of businesses discussed above.
33
Nine months ended September 30, 2018
Revenue
(in millions)
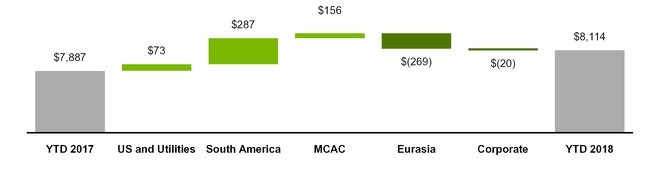
Consolidated Revenue
— Revenue
increased
$227 million
, or
3%
, for the
nine months ended
September 30, 2018
, compared to the
nine months ended
September 30, 2017
. Excluding the
unfavorable
FX impact of
$14 million
, primarily in South America partially offset by Eurasia, this
increase
was driven by:
|
•
|
$336 million in South America primarily due to higher capacity prices in Argentina resulting from market reforms enacted in 2017 as well as higher contract sales and prices in Colombia and Chile;
|
|
•
|
$159 million in MCAC primarily due to higher pass-through fuel prices in Mexico, increased availability driven by improved hydrology in Panama, and higher contracted energy sales in Dominican Republic due to commencement of the combined cycle operations at Los Mina in June 2017; and
|
|
•
|
$73 million in US and Utilities driven primarily by higher regulated rates approved in November 2017 and favorable weather at DPL and higher market energy sales at Southland, partially offset at DPL due to the sale and closure of several generation facilities.
|
These favorable impacts were partially offset by decreases of $308 million in Eurasia due to the sale of the Masinloc power plant in March 2018, as well as the sale of the Kazakhstan CHPs and expiration of the Kazakhstan HPP concession agreement in 2017.
Operating Margin
(in millions)

Consolidated Operating Margin
— Operating margin
increased
$107 million
, or
6%
, for the
nine months ended
September 30, 2018
, compared to the
nine months ended
September 30, 2017
. Excluding the
favorable
impact of FX of
$12 million
, primarily driven by Eurasia, this
increase
was driven by increases of:
|
•
|
$139 million in South America due to the drivers discussed above;
|
|
•
|
$56 million in US and Utilities mostly due to the drivers discussed above; and
|
|
•
|
$43 million in MCAC mostly due to the drivers discussed above.
|
These favorable impacts were partially offset by a decrease of $178 million in Eurasia due to the drivers discussed above, and the unfavorable impact of MTM derivative adjustments at Kilroot.
34
See Item 2.—
SBU Performance Analysis
of this Form 10-Q for additional discussion and analysis of operating results for each SBU.
Consolidated Results of Operations — Other
General and administrative expenses
General and administrative expenses
decreased
$9 million
, or
17%
, to
$43 million
for the three months ended
September 30, 2018
, compared to
$52 million
for the three months ended
September 30, 2017
, primarily due to reduced people costs, professional fees and business development.
General and administrative expenses
decreased
$21 million
, or
14%
, to
$134 million
for the
nine months ended
September 30, 2018
, compared to
$155 million
for the
nine months ended
September 30, 2017
, primarily due to reduced people costs and professional fees.
Interest expense
Interest expense
decreased
$42 million
, or
14%
, to
$255 million
for the
three months ended
September 30, 2018
, compared to
$297 million
for the three months ended
September 30, 2017
, and
decreased
$61 million
, or
7%
, to
$799 million
for the
nine months ended
September 30, 2018
, compared to
$860 million
for the
nine months ended
September 30, 2017
. These decreases were primarily due to the reduction of debt at the Parent Company, IPL, and DPL, favorable impacts from interest rate swaps and increased capitalized interest at Alto Maipo, and the sale of Masinloc in March 2018, partially offset by an increase in debt at Tietê related to the construction of solar plants and the acquisition of Alto Sertão in August 2017.
Interest income
Interest income
increased
$16 million
, or
25%
, to
$79 million
for the
three months ended
September 30, 2018
, compared to
$63 million
for the three months ended
September 30, 2017
, and
increased
$46 million
, or
25%
, to
$231 million
for the
nine months ended
September 30, 2018
, compared to
$185 million
for the
nine months ended
September 30, 2017
. These increases were primarily due to the higher financing component of contract consideration as a result of the adoption of the new revenue recognition standard.
Loss on extinguishment of debt
Loss on extinguishment of debt
decreased
$38 million
, or
78%
, to
$11 million
for the
three months ended
September 30, 2018
, compared to
$49 million
for the three months ended
September 30, 2017
. This
decrease
was primarily due to losses of $38 million and $9 million at the Parent Company and IPALCO, respectively, in 2017 compared to a $7 million loss at Gener in 2018.
Loss on extinguishment of debt
increased
$143 million
to
$187 million
for the
nine months ended
September 30, 2018
, compared to
$44 million
for the
nine months ended
September 30, 2017
. This
increase
was primarily due to an increase in losses at the Parent Company of $77 million from the redemption of senior notes in 2018 compared to a gain on early retirement of debt at AES Argentina of
$65 million
in 2017.
See Note
7
—
Debt
included in Item 1.—
Financial Statements
of this Form 10-Q for further information.
Other income and expense
Other income
decreased
$6 million
, or
38%
, to
$10 million
for the
three months ended
September 30, 2018
, compared to
$16 million
for the three months ended
September 30, 2017
. This decrease was primarily due to a decrease in the allowance for equity funds used during construction at IPALCO as a result of decreased construction activity.
Other income
decreased
$73 million
, or
71%
, to
$30 million
for the
nine months ended
September 30, 2018
, compared to
$103 million
for the
nine months ended
September 30, 2017
. This decrease was primarily due to the 2017 favorable settlement of legal proceedings at Uruguaiana related to YPF's breach of the parties’ gas supply agreement.
Other expense
decreased
$7 million
, or
19%
, to
$29 million
for the
three months ended
September 30, 2018
, compared to
$36 million
for the three months ended
September 30, 2017
. This decrease was primarily due to the write-off of water rights for projects that were no longer being pursued and the recognition of a full allowance on a non-trade receivable in the South America SBU in 2017, partially offset by a loss resulting from damage associated with a lightning incident at the Andres facility in the Dominican Republic in 2018.
Other expense
decreased
$25 million
, or
37%
, to
$42 million
for the
nine months ended
September 30, 2018
, compared to
$67 million
for the
nine months ended
September 30, 2017
. This decrease was primarily due to the
35
loss on disposal of assets at DPL as a result of the decision made in 2017 to close the coal-fired and diesel-fired generating units at Stuart and Killen on or before June 1, 2018, the write-off of water rights for projects that were no longer being pursued, and the recognition of a full allowance on a non-trade receivable in the South America SBU in 2017, partially offset by a loss resulting from damage associated with a lightning incident at the Andres facility in the Dominican Republic in 2018.
See Note
13
—
Other Income and Expense
included in Item 1.—
Financial Statements
of this Form 10-Q for further information.
Gain (loss) on disposal and sale of businesses
Loss on disposal and sale of businesses increased
$20 million
to
$21 million
for the
three months ended
September 30, 2018
as compared to
$1 million
for the
three months ended
September 30, 2017
primarily due to post-closing adjustments to the gain on sale of Electrica Santiago in 2018.
Gain (loss) on disposal and sale of businesses increased
$905 million
to a gain of
$856 million
for the
nine months ended
September 30, 2018
, as compared to a loss of
$49 million
for the
nine months ended
September 30, 2017
. This increase was primarily due to the gain on sale of
$773 million
for the sale of Masinloc and
$69 million
for the sale of Electrica Santiago in 2018 compared to a loss on sale of
$48 million
for the sale of the Kazakhstan CHPs in 2017.
See Note
17
—
Held-for-Sale and Dispositions
included in Item 1.—
Financial Statements
of this Form 10-Q for further information.
Asset impairment expense
Asset impairment expense
increased
$72 million
to
$74 million
for the
three months ended September 30, 2018
, compared to
$2 million
for the
three months ended September 30, 2017
, due to a current period impairment in the U.S. due to an updated unfavorable economic outlook resulting in additional decreased future cash flows at a generation facility.
Asset impairment expense
decreased
$94 million
, or
36%
, to
$166 million
for the
nine months ended September 30, 2018
, compared to
$260 million
for the
nine months ended September 30, 2017
, primarily due to prior year impairment of
$186 million
recognized in Kazakhstan due to the classification of the CHPs and HPPs as held-for-sale and at DPL as a result of the decision to close the coal-fired and diesel-fired generating units at Stuart and Killen, partially offset by impairments in the current year in the U.S. due to an unfavorable economic outlook resulting in decreased future cash flows at a generation facility.
See Note
14
—
Asset Impairment Expense
included in Item 1.—
Financial Statements
of this Form 10-Q for further information.
Foreign currency transaction gains (losses)
|
Three Months Ended September 30,
|
Nine Months Ended September 30,
|
|||||||||||||||
|
(in millions)
|
2018
|
2017
|
2018
|
2017
|
||||||||||||
|
Corporate
|
$
|
(2
|
)
|
$
|
4
|
|
$
|
17
|
|
$
|
(1
|
)
|
||||
|
Argentina
|
(2
|
)
|
9
|
|
(47
|
)
|
4
|
|
||||||||
|
Colombia
|
—
|
|
(15
|
)
|
(1
|
)
|
(26
|
)
|
||||||||
|
Chile
|
4
|
|
9
|
|
(11
|
)
|
4
|
|
||||||||
|
Bulgaria
|
(1
|
)
|
—
|
|
5
|
|
(4
|
)
|
12
|
|
||||||
|
Philippines
|
—
|
|
4
|
|
(1
|
)
|
10
|
|
||||||||
|
Other
|
6
|
|
6
|
|
3
|
|
11
|
|
||||||||
|
Total
(1)
|
$
|
5
|
|
$
|
22
|
|
$
|
(44
|
)
|
$
|
14
|
|
||||
___________________________________________
|
(1)
|
Includes
$6 million
of
gains
on foreign currency derivative contracts for the
three months ended
September 30, 2018
, and
$37 million
of
gains
and
$37 million
of
losses
for the
nine months ended
September 30, 2018
and
2017
, respectively.
|
The Company recognized net foreign currency transaction
gains
of
$5 million
for the three months ended September 30, 2018
, primarily due to unrealized gains associated with the devaluation of payables denominated in Chilean pesos at Angamos and Cochrane, partially offset by the devaluation of long-term receivables denominated in Argentine pesos.
The Company recognized net foreign currency transaction
losses
of
$44 million
for the nine months ended September 30, 2018
, primarily due to the devaluation of long-term receivables denominated in Argentine pesos, partially offset by gains at the Parent Company related to foreign currency derivatives.
36
The Company recognized net foreign currency transaction
gains
of
$22 million
for the three months ended September 30, 2017
, primarily due to the appreciation of the Chilean peso, and foreign currency derivatives related to government receivables at Argentina, partially offset by losses on foreign currency derivatives at Colombia due to a change in functional currency.
The Company recognized net foreign currency transaction
gains
of
$14 million
for the
nine months ended September 30, 2017
, primarily due to the amortization of frozen embedded derivatives at the Philippines, and appreciation of the euro at Bulgaria, partially offset by losses on foreign currency derivatives at Colombia due to a change in functional currency.
Income tax expense
Income tax expense
increased
$
53 million
, or
57%
, to
$146 million
for the
three months ended
September 30, 2018
, compared to
$93 million
for the three months ended
September 30, 2017
. The Company’s effective tax rates were
44%
and
31%
for the three months ended
September 30, 2018
and
2017
, respectively. This net
increase
was primarily due to a 2018 adjustment to the provisional U.S. one-time transition tax recorded in the fourth quarter of 2017, as well as unfavorable foreign currency effects at certain of our Argentine subsidiaries during the third quarter of 2018. See Note
15
—Inc
ome Taxes
included in Item 1.—
Financial Statements
of this Form 10-Q for details on the adjustment to the one-time transition tax.
Income tax expense
increased
$
263 million
to
$509 million
for the
nine months ended
September 30, 2018
, compared to $
246 million
for the
nine months ended September 30, 2017
. The Company’s effective tax rates were
30%
and
36%
for the
nine months ended September 30, 2018
and
2017
, respectively. This net
decrease
in the effective tax rate was primarily due to the impact of the sale of the Company’s entire
51%
equity interest in Masinloc. See Note
17
—
Held-for-Sale and Dispositions
included in Item 1.—
Financial Statements
of this Form 10-Q for further information. This impact was partially offset by the aforementioned 2018 adjustment to the provisional U.S. one-time transition tax and unfavorable foreign currency effects at certain of our Argentine subsidiaries.
Our effective tax rate reflects the tax effect of significant operations outside the U.S. which are generally taxed at rates different than the U.S. statutory rate of 21%. Furthermore, a greater proportion of our foreign earnings may be subject to current U.S. taxation under the new tax rules enacted in the fourth quarter of 2017. The regulations governing those rules have not yet been finalized. A future proportionate change in the composition of income before income taxes from foreign and domestic tax jurisdictions could impact our periodic effective tax rate.
Net equity in earnings of affiliates
Net equity in earnings of affiliates
decreased
$18 million
to
$6 million
for the
three months ended
September 30, 2018
, compared to
$24 million
for the three months ended
September 30, 2017
. This decrease was primarily due to more projects achieving commercial operations in 2017 compared to 2018 at sPower, which was purchased in the third quarter of 2017; losses at Fluence, which was formed in the first quarter of 2018; and decreased income at Guacolda.
Net equity in earnings of affiliates decreased
$2 million
to
$31 million
for the
nine months ended
September 30, 2018
, compared to
$33 million
for the
nine months ended
September 30, 2017
. This decrease was primarily due to losses at Fluence and decreased income at Guacolda, partially offset by increased income at OPGC and earnings at sPower.
Net income from discontinued operations
Net income from discontinued operations
decreased
$27 million
to a net loss of
$1 million
for the three months ended September 30, 2018
, compared to net income from discontinued operations of
$26 million
for the three months ended September 30, 2017
, due to the sale of Eletropaulo in the second quarter of 2018.
Net income from discontinued operations
increased
$155 million
to
$190 million
for the nine months ended September 30, 2018
, compared to
$35 million
for the nine months ended September 30, 2017
, primarily due to the after-tax gain on sale of Eletropaulo of
$199 million
, partially offset by the income from operations of Eletropaulo prior to its deconsolidation in November 2017.
See Note
16
—
Discontinued Operations
included in Item 1.—
Financial Statements
of this Form 10-Q for further information regarding the Eletropaulo discontinued operations.
Net income attributable to noncontrolling interests and redeemable stock of subsidiaries
Net income attributable to noncontrolling interests and redeemable stock of subsidiaries
decreased
$19 million
, or
17%
, to
$90 million
for the
three months ended
September 30, 2018
, compared to
$109 million
for the
three months ended
September 30, 2017
. This
decrease
was primarily due to:
37
|
•
|
Lower earnings due to the deconsolidation of Eletropaulo in November 2017 and the sale of Masinloc in March 2018.
|
These decreases were partially offset by:
|
•
|
Higher earnings due to project completions in Panama; and
|
|
•
|
Higher earnings in Colombia primarily due to higher contract sales and prices.
|
Net income attributable to noncontrolling interests and redeemable stock of subsidiaries
decreased
$19 million
, or
6%
, to
$309 million
for the
nine months ended
September 30, 2018
, compared to
$328 million
for the
nine months ended
September 30, 2017
. This
decrease
was primarily due to:
|
•
|
Lower earnings at Tietê primarily due to higher interest expense due to non-recourse debt issued in 2018 and the assumption of debt for the acquisition of Alto Sertão in August 2017;
|
|
•
|
Prior year favorable impact of a legal settlement at Uruguaiana; and
|
|
•
|
Lower earnings due to the deconsolidation of Eletropaulo in November 2017 and the sale of Masinloc in March 2018.
|
These decreases were partially offset by:
|
•
|
Current year gain on sale of Electrica Santiago;
|
|
•
|
Higher earnings in Colombia primarily due to higher contract sales and prices; and
|
|
•
|
Higher earnings in Vietnam due to the adoption of the new revenue recognition standard (See Note
1
—
Financial Statement Presentation
included in Item 1.—
Financial Statements
of this Form 10-Q for further information).
|
Net income attributable to The AES Corporation
Net income attributable to The AES Corporation
decreased
$51 million
, or
34%
, to
$101 million
for the
three months ended
September 30, 2018
, compared to
$152 million
for the three months ended
September 30, 2017
. This
decrease
was primarily due to:
|
•
|
Current year impairment in the U.S.;
|
|
•
|
Charge to true-up the provisional estimate of U.S. tax reform;
|
|
•
|
Post-closing adjustments to the gain on sale of Electrica Santiago; and
|
|
•
|
Lower margins in the current year at our Eurasia SBU as a result of the sales of Masinloc and Kazakhstan.
|
These decreases were partially offset by:
|
•
|
Prior year loss on extinguishment of debt;
|
|
•
|
Lower interest on Parent Company debt; and
|
|
•
|
Higher margins at our South America and US and Utilities SBUs in the current year.
|
Net income attributable to The AES Corporation
increased
$894 million
to
$1,075 million
for the
nine months ended
September 30, 2018
, compared to
$181 million
for the
nine months ended
September 30, 2017
. This
increase
was primarily due to:
|
•
|
Current year gains on the sales of Masinloc, Eletropaulo (reflected within discontinued operations), and Electrica Santiago, net of tax;
|
|
•
|
Prior year loss on sale of Kazakhstan CHPs;
|
|
•
|
Prior year asset impairments in Kazakhstan and DP&L;
|
|
•
|
Lower interest on Parent Company debt; and
|
|
•
|
Higher margins at our US and Utilities, South America and MCAC SBUs in the current year.
|
These increases were partially offset by:
|
•
|
Current year impairment in the U.S.;
|
|
•
|
Current year loss and prior year gain on extinguishment of debt;
|
|
•
|
Current year unrealized foreign exchange losses primarily due to the devaluation of the Argentine peso;
|
|
•
|
Prior year favorable impact of a legal settlement at Uruguaiana; and
|
|
•
|
Lower margins in the current year at our Eurasia SBU as a result of the sales of Masinloc and Kazakhstan.
|
38
SBU Performance Analysis
Non-GAAP Measures
Adjusted Operating Margin, Adjusted PTC, and Adjusted EPS are non-GAAP supplemental measures that are used by management and external users of our condensed consolidated financial statements such as investors, industry analysts and lenders. The Adjusted Operating Margin and Adjusted PTC by SBU for the three and
nine months ended September 30, 2018
and
September 30, 2017
are shown below.
Effective January 1, 2018, the Company changed the definition of Adjusted PTC and Adjusted EPS to exclude unrealized gains or losses from equity securities resulting from a newly effective accounting standard. We believe excluding these gains or losses provides a more accurate picture of continuing operations. Factors in this determination include the variability due to unrealized gains or losses related to equity securities remeasurement.
In addition, effective for the year beginning January 1, 2018, the Company no longer discloses Consolidated Free Cash Flow, as the Company believes this metric does not accurately reflect the Company's ownership interests in the underlying businesses given the high level of cash flow attributable to noncontrolling interests.
Adjusted Operating Margin
We define Adjusted Operating Margin as Operating Margin, adjusted for the impact of NCI, excluding (a) unrealized gains or losses related to derivative transactions; (b) benefits and costs associated with dispositions and acquisitions of business interests, including early plant closures; and (c) costs directly associated with a major restructuring program, including, but not limited to, workforce reduction efforts, relocations, and office consolidation.
The GAAP measure most comparable to Adjusted Operating Margin is Operating Margin. We believe that Adjusted Operating Margin better reflects the underlying business performance of the Company. Factors in this determination include the impact of NCI, where AES consolidates the results of a subsidiary that is not wholly owned by the Company, as well as the variability due to unrealized gains or losses related to derivative transactions and strategic decisions to dispose of or acquire business interests. Adjusted Operating Margin should not be construed as an alternative to Operating Margin, which is determined in accordance with GAAP.
|
Reconciliation of Adjusted Operating Margin (in millions)
|
Three Months Ended September 30,
|
Nine Months Ended September 30,
|
|||||||||||||
|
2018
|
2017
|
2018
|
2017
|
||||||||||||
|
Operating Margin
|
$
|
671
|
|
$
|
640
|
|
$
|
1,927
|
|
$
|
1,820
|
|
|||
|
Noncontrolling interests adjustment
|
(160
|
)
|
(165
|
)
|
(502
|
)
|
(503
|
)
|
|||||||
|
Unrealized derivative losses (gains)
|
4
|
|
(6
|
)
|
11
|
|
(16
|
)
|
|||||||
|
Disposition/acquisition losses
|
7
|
|
3
|
|
20
|
|
12
|
|
|||||||
|
Restructuring costs
|
—
|
|
—
|
|
3
|
|
—
|
|
|||||||
|
Total Adjusted Operating Margin
|
$
|
522
|
|
$
|
472
|
|
$
|
1,459
|
|
$
|
1,313
|
|
|||

39
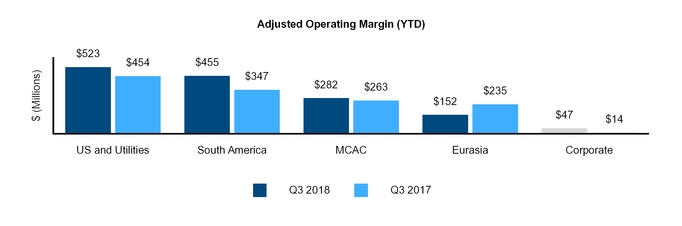
Adjusted PTC
We define Adjusted PTC as
pre-tax income from continuing operations attributable to The AES Corporation excluding gains or losses of the consolidated entity due to (a) unrealized gains or losses related to derivative transactions and equity securities; (b) unrealized foreign currency gains or losses; (c) gains, losses, benefits and costs associated with dispositions and acquisitions of business interests, including early plant closures; (d) losses due to impairments; (e) gains, losses and costs due to the early retirement of debt; and (f) costs directly associated with a major restructuring program, including, but not limited to, workforce reduction efforts, relocations, and office consolidation.
Adjusted PTC also includes net equity in earnings of affiliates on an after-tax basis adjusted for the same gains or losses excluded from consolidated entities.
Adjusted PTC reflects the impact of NCI and excludes the items specified in the definition above. In addition to the revenue and cost of sales reflected in Operating Margin, Adjusted PTC includes the other components of our income statement, such as
general and administrative expenses
in the corporate segment, as well as business development costs,
interest expense
and
interest income,
other expense
and
other income,
realized foreign currency transaction gains and losses,
and
net equity in earnings of affiliates
.
The GAAP measure most comparable to Adjusted PTC is
income from continuing operations attributable to The AES Corporation
. We believe that Adjusted PTC better reflects the underlying business performance of the Company and is the most relevant measure considered in the Company’s internal evaluation of the financial performance of its segments. Factors in this determination include the variability due to unrealized gains or losses related to derivative transactions or equity securities, unrealized foreign currency gains or losses, losses due to impairments and strategic decisions to dispose of or acquire business interests, retire debt or implement restructuring initiatives, which affect results in a given period or periods. In addition, earnings before tax represents the business performance of the Company before the application of statutory income tax rates and tax adjustments, including the effects of tax planning, corresponding to the various jurisdictions in which the Company operates. Additionally, given its large number of businesses and complexity, the Company concluded that Adjusted PTC is a more transparent measure that better assists investors in determining which businesses have the greatest impact on the Company’s results.
Adjusted PTC should not be construed as an alternative to
income from continuing operations attributable to The AES Corporation
, which is determined in accordance with GAAP.
|
Reconciliation of Adjusted PTC (in millions)
|
Three Months Ended September 30,
|
Nine Months Ended September 30,
|
|||||||||||||
|
2018
|
2017
|
2018
|
2017
|
||||||||||||
|
Income from continuing operations, net of tax, attributable to The AES Corporation
|
$
|
102
|
|
$
|
147
|
|
$
|
883
|
|
$
|
176
|
|
|||
|
Income tax expense attributable to The AES Corporation
|
120
|
|
69
|
|
411
|
|
139
|
|
|||||||
|
Pretax contribution
|
222
|
|
216
|
|
1,294
|
|
315
|
|
|||||||
|
Unrealized derivative and equity securities losses (gains)
|
16
|
|
(8
|
)
|
4
|
|
(7
|
)
|
|||||||
|
Unrealized foreign currency losses (gains)
|
(7
|
)
|
(21
|
)
|
42
|
|
(54
|
)
|
|||||||
|
Disposition/acquisition losses (gains)
|
17
|
|
1
|
|
(822
|
)
|
109
|
|
|||||||
|
Impairment expense
|
80
|
|
2
|
|
172
|
|
264
|
|
|||||||
|
Losses (gains) on extinguishment of debt
|
(1
|
)
|
48
|
|
177
|
|
43
|
|
|||||||
|
Restructuring costs
(1)
|
—
|
|
—
|
|
3
|
|
—
|
|
|||||||
|
Total Adjusted PTC
|
$
|
327
|
|
$
|
238
|
|
$
|
870
|
|
$
|
670
|
|
|||
_____________________________
40
|
(1)
|
In February 2018, the Company announced a reorganization as a part of its ongoing strategy to simplify its portfolio, optimize its cost structure and reduce its carbon intensity.
|
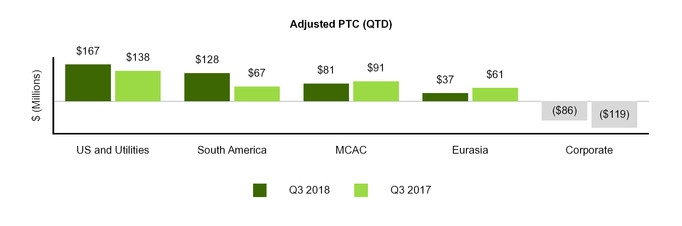
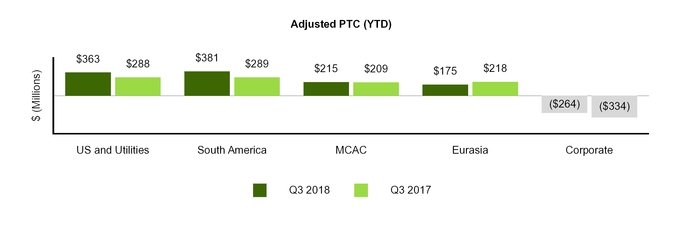
Adjusted EPS
We define Adjusted EPS as
diluted earnings per share from continuing operations excluding gains or losses of both consolidated entities and entities accounted for under the equity method due to (a) unrealized gains or losses related to derivative transactions and equity securities; (b) unrealized foreign currency gains or losses; (c) gains, losses, benefits and costs associated with dispositions and acquisitions of business interests, including early plant closures, and the tax impact from the repatriation of sales proceeds; (d) losses due to impairments; (e) gains, losses and costs due to the early retirement of debt; (f) costs directly associated with a major restructuring program, including, but not limited to, workforce reduction efforts, relocations, and office consolidation; and (g) tax benefit or expense related to the enactment effects of 2017 U.S. tax law reform.
The GAAP measure most comparable to Adjusted EPS is diluted earnings per share from continuing operations. We believe that Adjusted EPS better reflects the underlying business performance of the Company and is considered in the Company’s internal evaluation of financial performance. Factors in this determination include the variability due to unrealized gains or losses related to derivative transactions or equity securities, unrealized foreign currency gains or losses, losses due to impairments and strategic decisions to dispose of or acquire business interests, retire debt or implement restructuring activities, which affect results in a given period or periods. Adjusted EPS should not be construed as an alternative to diluted earnings per share from continuing operations, which is determined in accordance with GAAP.
41
|
Reconciliation of Adjusted EPS
|
Three Months Ended September 30,
|
Nine Months Ended September 30,
|
||||||||||||||
|
2018
|
2017
|
2018
|
2017
|
|||||||||||||
|
Diluted earnings per share from continuing operations
|
$
|
0.15
|
|
$
|
0.22
|
|
$
|
1.33
|
|
$
|
0.27
|
|
||||
|
Unrealized derivative and equity securities losses (gains)
|
0.02
|
|
(0.01
|
)
|
0.01
|
|
(0.01
|
)
|
||||||||
|
Unrealized foreign currency losses (gains)
|
—
|
|
(0.03
|
)
|
0.06
|
|
(1)
|
(0.08
|
)
|
|||||||
|
Disposition/acquisition losses (gains)
|
0.02
|
|
—
|
|
(1.24
|
)
|
(2)
|
0.16
|
|
(3)
|
||||||
|
Impairment expense
|
0.12
|
|
(4)
|
—
|
|
0.26
|
|
(5)
|
0.40
|
|
(6)
|
|||||
|
Losses (gains) on extinguishment of debt
|
—
|
|
0.07
|
|
(7)
|
0.27
|
|
(8)
|
0.06
|
|
(9)
|
|||||
|
U.S. Tax Law Reform Impact
|
0.05
|
|
(10)
|
—
|
|
0.05
|
|
(10)
|
—
|
|
||||||
|
Less: Net income tax expense (benefit)
|
(0.01
|
)
|
(0.02
|
)
|
0.14
|
|
(11)
|
(0.15
|
)
|
(12)
|
||||||
|
Adjusted EPS
|
$
|
0.35
|
|
$
|
0.23
|
|
$
|
0.88
|
|
$
|
0.65
|
|
||||
_____________________________
|
(1)
|
Amount primarily relates to unrealized FX losses of $20 million, or $0.03 per share, associated with the devaluation of long-term receivables denominated in Argentine pesos, and unrealized FX losses of $9 million, or $0.01 per share, on intercompany receivables denominated in Euros at the Parent Company.
|
|
(2)
|
Amount primarily relates to gain on sale of Masinloc of $773 million, or $1.16 per share, gain on sale of Electrica Santiago of $36 million, or $0.05 per share, and realized derivative gains associated with the sale of Eletropaulo of $21 million, or $0.03 per share.
|
|
(3)
|
Amount primarily relates to loss on sale of Kazakhstan CHPs of $48 million, or $0.07 per share, realized derivative losses associated with the sale of Sul of $38 million, or $0.06 per share, and costs associated with early plant closures at DPL of $20 million, or $0.03 per share.
|
|
(4)
|
Amount primarily relates to the asset impairment at a U.S. generation facility of $73 million, or $0.11 per share.
|
|
(5)
|
Amount primarily relates to the asset impairment at a U.S. generation facility of $156 million, or $0.23 per share.
|
|
(6)
|
Amount primarily relates to asset impairments at Kazakhstan HPPs of $92 million, or $0.14 per share, Kazakhstan CHPs of $94 million, or $0.14 per share, and DPL of $66 million, or $0.10 per share.
|
|
(7)
|
Amount primarily relates to loss on early retirement of debt at the Parent Company of $38 million, or $0.06 per share.
|
|
(8)
|
Amount primarily relates to loss on early retirement of debt at the Parent Company of $169 million, or $0.25 per share.
|
|
(9)
|
Amount primarily relates to losses on early retirement of debt at the Parent Company of $92 million, or $0.14 per share, partially offset by the gain on early retirement of debt at AES Argentina of $65 million, or $0.10 per share.
|
|
(10)
|
Amount relates to a charge to true-up the provisional estimate of U.S. tax reform of $33 million, or $0.05 per share.
|
|
(11)
|
Amount primarily relates to the income tax expense under the GILTI provision associated with gain on sale of Masinloc of $155 million, or $0.23 per share, and income tax expense associated with the gain on sale of Electrica Santiago of $19 million, or $0.03 per share; partially offset by income tax benefits associated with the loss on early retirement of debt at the Parent Company of $52 million, or $0.08 per share, and income tax benefits associated with the impairment at a U.S. generation facility of $35 million, or $0.05 per share.
|
|
(12)
|
Amount primarily relates to the income tax benefit associated with asset impairments of $82 million, or $0.12 per share.
|
US AND UTILITIES SBU
The following table summarizes Operating Margin, Adjusted Operating Margin and Adjusted PTC (in millions) for the periods indicated:
|
Three Months Ended September 30,
|
Nine Months Ended September 30,
|
||||||||||||||||||||||||||||
|
2018
|
2017
|
$ Change
|
% Change
|
2018
|
2017
|
$ Change
|
% Change
|
||||||||||||||||||||||
|
Operating Margin
|
$
|
225
|
|
$
|
205
|
|
$
|
20
|
|
10
|
%
|
$
|
570
|
|
$
|
514
|
|
$
|
56
|
|
11
|
%
|
|||||||
|
Adjusted Operating Margin
(1)
|
209
|
|
177
|
|
32
|
|
18
|
%
|
523
|
|
454
|
|
69
|
|
15
|
%
|
|||||||||||||
|
Adjusted PTC
(1)
|
167
|
|
138
|
|
29
|
|
21
|
%
|
363
|
|
288
|
|
75
|
|
26
|
%
|
|||||||||||||
_____________________________
|
(1)
|
A non-GAAP financial measure, adjusted for the impact of NCI. See
SBU Performance Analysis—Non-GAAP Measures
for definition and Item 1.
—Business
included in our 2017 Form 10-K for the respective ownership interest for key businesses.
|
Operating Margin for the three months ended
September 30, 2018
increased
$20 million
, or
10%
, which was driven primarily by the following (in millions):
|
Increase at Southland driven by higher market energy sales, partially offset by a decrease in capacity sales and lower ancillary services due to the expiration of long-term agreements
|
$
|
22
|
|
|
Increase at DPL primarily due to higher regulated rates following the approval of the 2017 ESP and favorable weather
|
15
|
|
|
|
Impact of the sale and closure of generation plants at DPL
|
(18
|
)
|
|
|
Other
|
1
|
|
|
|
Total US and Utilities SBU Operating Margin Increase
|
$
|
20
|
|
Adjusted Operating Margin
increased
$32 million
primarily due to the drivers above, adjusted for a $10 million unrealized loss on coal derivatives in Hawaii.
Adjusted PTC
increased
$29 million
, primarily driven by the
increase
in Adjusted Operating Margin described above.
42
Operating Margin for the
nine months ended
September 30, 2018
increased
$56 million
, or
11%
, which was driven primarily by the following (in millions):
|
Increase at DPL primarily due to higher regulated rates following the approval of the 2017 ESP and favorable weather
|
$
|
37
|
|
|
Increase at Southland driven by higher market energy sales, partially offset by a decrease in capacity sales and lower ancillary services due to the expiration of long-term agreements
|
20
|
|
|
|
Increase at El Salvador primarily due to a new tariff regime effective in 2018
|
10
|
|
|
|
Impact of the sale and closure of generation plants at DPL
|
(5
|
)
|
|
|
Other
|
(6
|
)
|
|
|
Total US and Utilities SBU Operating Margin Increase
|
$
|
56
|
|
Adjusted Operating Margin
increased
$69 million
primarily due to the drivers above, adjusted for a $10 million unrealized loss on coal derivatives in Hawaii.
Adjusted PTC
increased
$75 million
, primarily driven by the
increase
in Adjusted Operating Margin described above.
SOUTH AMERICA SBU
The following table summarizes Operating Margin, Adjusted Operating Margin and Adjusted PTC (in millions) for the periods indicated:
|
Three Months Ended September 30,
|
Nine Months Ended September 30,
|
||||||||||||||||||||||||||||
|
2018
|
2017
|
$ Change
|
% Change
|
2018
|
2017
|
$ Change
|
% Change
|
||||||||||||||||||||||
|
Operating Margin
|
$
|
250
|
|
$
|
190
|
|
$
|
60
|
|
32
|
%
|
$
|
754
|
|
$
|
612
|
|
$
|
142
|
|
23
|
%
|
|||||||
|
Adjusted Operating Margin
(1)
|
156
|
|
116
|
|
40
|
|
34
|
%
|
455
|
|
347
|
|
108
|
|
31
|
%
|
|||||||||||||
|
Adjusted PTC
(1)
|
128
|
|
67
|
|
61
|
|
91
|
%
|
381
|
|
289
|
|
92
|
|
32
|
%
|
|||||||||||||
_____________________________
|
(1)
|
A non-GAAP financial measure, adjusted for the impact of NCI. See
SBU Performance Analysis—Non-GAAP Measures
for definition and Item 1.
—Business
included in our 2017 Form 10-K for the respective ownership interest for key businesses.
|
Operating Margin for the three months ended
September 30, 2018
increased
$60 million
, or
32%
, which was driven primarily by the following (in millions):
|
Increase in Colombia mainly related to higher contract prices and higher contract and spot sales
|
$
|
21
|
|
|
Lower fixed costs at Gener primarily associated with planned maintenance performed in Q3 2017
|
21
|
|
|
|
Increase in Argentina primarily due to higher regulated tariffs resulting from market reforms enacted in 2017 and lower fixed costs primarily due to the devaluation of the Argentine peso
|
18
|
|
|
|
Increase mainly associated with the commencement of new PPAs in Chile
|
18
|
|
|
|
Impact of the sale of Electrica Santiago
|
(15
|
)
|
|
|
Other
|
(3
|
)
|
|
|
Total South America SBU Operating Margin Increase
|
$
|
60
|
|
Adjusted Operating Margin
increased
$40 million
due to the drivers above, adjusted for NCI.
Adjusted PTC
increased
$61 million
, mainly driven by the increase in Adjusted Operating Margin described above and lower interest and other expenses in Chile driven by the full allowance of a non-trade receivable in Argentina due to collection uncertainties recognized in the prior year and the write-off of water rights at Gener resulting from a business development project no longer pursued in the prior year, partially offset by higher foreign currency losses in Argentina.
Operating Margin for the
nine months ended
September 30, 2018
increased
$142 million
, or
23%
, which was driven primarily by the following (in millions):
|
Increase in Argentina primarily due to higher regulated tariffs resulting from market reforms enacted in 2017 and lower fixed costs primarily due to the devaluation of the Argentine peso
|
$
|
62
|
|
|
Increase in Colombia mainly related to higher contract prices
|
48
|
|
|
|
Increase in Chile due to the commencement of new PPAs
|
40
|
|
|
|
Lower fixed costs at Gener primarily associated with planned maintenance performed in 2017
|
16
|
|
|
|
Impact of the sale of Electrica Santiago
|
(28
|
)
|
|
|
Other
|
4
|
|
|
|
Total South America SBU Operating Margin Increase
|
$
|
142
|
|
Adjusted Operating Margin
increased
$108 million
due to the drivers above, adjusted for NCI and excluding restructuring charges.
Adjusted PTC
increased
$92 million
, mainly due to the increase in Adjusted Operating Margin described above and lower interest and other expenses in Chile, partially offset by a $28 million decrease associated with a gain recognized in the prior year from the settlement of a legal dispute with YPF at Uruguaiana, higher interest expense
43
in Brazil, and higher realized foreign currency losses in Argentina.
MCAC SBU
The following table summarizes Operating Margin, Adjusted Operating Margin and Adjusted PTC (in millions) for the periods indicated:
|
Three Months Ended September 30,
|
Nine Months Ended September 30,
|
||||||||||||||||||||||||||||
|
2018
|
2017
|
$ Change
|
% Change
|
2018
|
2017
|
$ Change
|
% Change
|
||||||||||||||||||||||
|
Operating Margin
|
$
|
144
|
|
$
|
142
|
|
$
|
2
|
|
1
|
%
|
$
|
379
|
|
$
|
336
|
|
$
|
43
|
|
13
|
%
|
|||||||
|
Adjusted Operating Margin
(1)
|
106
|
|
109
|
|
(3
|
)
|
-3
|
%
|
282
|
|
263
|
|
19
|
|
7
|
%
|
|||||||||||||
|
Adjusted PTC
(1)
|
81
|
|
91
|
|
(10
|
)
|
-11
|
%
|
215
|
|
209
|
|
6
|
|
3
|
%
|
|||||||||||||
_____________________________
|
(1)
|
A non-GAAP financial measure, adjusted for the impact of NCI. See
SBU Performance Analysis—Non-GAAP Measures
for definition and Item 1.
—Business
included in our 2017 Form 10-K for the respective ownership interest for key businesses.
|
Operating Margin for the three months ended
September 30, 2018
increased
$2 million
, or
1%
, which was driven primarily by the following (in millions):
|
Higher availability driven by improved hydrology in Panama
|
$
|
6
|
|
|
Higher energy costs in Dominican Republic due to the lightning incident at the Andres facility
|
(6
|
)
|
|
|
Other
|
2
|
|
|
|
Total MCAC SBU Operating Margin Increase
|
$
|
2
|
|
Adjusted Operating Margin
decreased
$3 million
due to the drivers above, adjusted for NCI.
Adjusted PTC
decreased
$10 million
, mainly driven by the
decrease
in Adjusted Operating Margin as described above, and by lower capitalized interest due to project completions in Panama.
Operating Margin for the
nine months ended
September 30, 2018
increased
by
$43 million
, or
13%
, which was driven primarily by the following (in millions):
|
Higher contracted energy sales in Dominican Republic mainly driven by the commencement of operations at the Los Mina combined cycle facility in June 2017 and lower forced maintenance outages
|
$
|
30
|
|
|
Higher availability driven by improved hydrology in Panama
|
23
|
|
|
|
Higher energy costs in Dominican Republic due to the lightning incident at the Andres facility
|
(6
|
)
|
|
|
Other
|
(4
|
)
|
|
|
Total MCAC SBU Operating Margin Increase
|
$
|
43
|
|
Adjusted Operating Margin
increased
$19 million
due to the drivers above, adjusted for NCI.
Adjusted PTC
increased
$6 million
, mainly driven by the
increase
in Adjusted Operating Margin as described above, partially offset by lower capitalized interest due to project completions in Panama and Dominican Republic, and lower foreign currency gains in Mexico.
EURASIA SBU
The following table summarizes Operating Margin, Adjusted Operating Margin and Adjusted PTC (in millions) for the periods indicated:
|
Three Months Ended September 30,
|
Nine Months Ended September 30,
|
||||||||||||||||||||||||||||
|
2018
|
2017
|
$ Change
|
% Change
|
2018
|
2017
|
$ Change
|
% Change
|
||||||||||||||||||||||
|
Operating Margin
|
$
|
34
|
|
$
|
101
|
|
$
|
(67
|
)
|
-66
|
%
|
$
|
175
|
|
$
|
342
|
|
$
|
(167
|
)
|
-49
|
%
|
|||||||
|
Adjusted Operating Margin
(1)
|
31
|
|
67
|
|
(36
|
)
|
-54
|
%
|
152
|
|
235
|
|
(83
|
)
|
-35
|
%
|
|||||||||||||
|
Adjusted PTC
(1)
|
37
|
|
61
|
|
(24
|
)
|
-39
|
%
|
175
|
|
218
|
|
(43
|
)
|
-20
|
%
|
|||||||||||||
_____________________________
|
(1)
|
A non-GAAP financial measure, adjusted for the impact of NCI. See
SBU Performance Analysis—Non-GAAP Measures
for definition and
Item 1.
—Business
included in our 2017 Form 10-K for the respective ownership interest for key businesses.
|
Including
neutral
FX impact, Operating Margin for the three months ended
September 30, 2018
decreased
$67 million
, or
66%
, which was driven primarily by the following (in millions):
|
Impact of the sale of Masinloc power plant in March 2018
|
$
|
(39
|
)
|
|
Decrease in Vietnam due to adoption of the new revenue recognition standard in 2018 and higher maintenance expense
|
(12
|
)
|
|
|
Impact of the sale of the Kazakhstan CHPs and the expiration of HPP concession in 2017
|
(8
|
)
|
|
|
Other
|
(8
|
)
|
|
|
Total Eurasia SBU Operating Margin Decrease
|
$
|
(67
|
)
|
Adjusted Operating Margin
decreased
$36 million
due to the drivers above, adjusted for NCI and excluding unrealized gains and losses on derivatives.
44
Adjusted PTC
decreased
$24 million
, driven by the decrease in the Adjusted Operating Margin discussed above, partially offset by positive impact in Vietnam due to increased interest income from the higher financing component of contract consideration as a result of adoption of the new revenue recognition standard in 2018.
Including
favorable
FX impacts of
$10 million
, Operating Margin for the
nine months ended
September 30, 2018
decreased
$167 million
, or
49%
, which was driven primarily by the following (in millions):
|
Impact of the sale of Masinloc power plant in March 2018
|
$
|
(87
|
)
|
|
Impact of the sale of the Kazakhstan CHPs and the expiration of HPP concession in 2017
|
(36
|
)
|
|
|
Decrease in Vietnam due to adoption of the new revenue recognition standard in 2018 and higher maintenance costs
|
(26
|
)
|
|
|
Unfavorable MTM valuation of commodity swaps in Kilroot
|
(18
|
)
|
|
|
Total Eurasia SBU Operating Margin Decrease
|
$
|
(167
|
)
|
Adjusted Operating Margin
decreased
$83 million
due to the drivers above, adjusted for NCI and excluding unrealized gains and losses on derivatives and costs due to early plant closures.
Adjusted PTC
decreased
$43 million
, driven by the decrease in Adjusted Operating Margin discussed above, partially offset by the positive impact in Vietnam due to increased interest income from the higher financing component of contract consideration as a result of adoption of the new revenue recognition standard in 2018.
Key Trends and Uncertainties
During the remainder of
2018
and beyond, we expect to face the following challenges at certain of our businesses. Management expects that improved operating performance at certain businesses, growth from new businesses and global cost reduction initiatives may lessen or offset their impact. If these favorable effects do not occur, or if the challenges described below and elsewhere in this section impact us more significantly than we currently anticipate, or if volatile foreign currencies and commodities move more unfavorably, then these adverse factors (or other adverse factors unknown to us) may have a material impact on our operating margin, net income attributable to The AES Corporation, and cash flows. We continue to monitor our operations and address challenges as they arise.
Alto Maipo
As discussed in Item 7—
Management’s Discussion and Analysis of Financial Condition and Results of Operations
—
Key Trends and Uncertainties
of the 2017 Form 10-K, Alto Maipo has experienced construction difficulties which have resulted in increased projected costs over the original $2 billion budget. Construction at the project is continuing, and the project is 70% complete.
In February 2018, Alto Maipo entered into a new construction contract with Strabag. The new contract is fixed-price and lump sum, transfers geological and construction risk to Strabag and provides a date certain for completion with strong performance and completion guarantees.
In May 2018, Alto Maipo and the project’s senior lenders executed the financial restructuring of the project. The restructuring, among other things, includes additional funding commitments of up to $400 million by AES Gener, of which $200 million will be contributed and matched by an equal contribution of debt by the project lenders and another $200 million will be contributed by AES Gener towards the completion of the project, once the lenders have disbursed $688 million of their commitments and only to the extent needed to fund project costs. Any unused portion of AES Gener’s commitment will be used to prepay project debt.
If Alto Maipo is unable to meet certain construction milestones, there could be a material impact to the financing and value of the project which could have a material impact on the Company. The carrying value of long-lived assets and deferred tax assets of Alto Maipo as of September 30, 2018 was approximately $1.9 billion and $50 million, respectively. Management believes the carrying value of the long-lived asset group is recoverable as of September 30, 2018. In addition, management believes it is more likely than not the deferred tax assets will be realized; however, they could be reduced if estimates of future taxable income are decreased.
Andres
On September 3, 2018, lightning affected the Andres 319 MW combined cycle natural gas facility in the Dominican Republic (“the Plant”) resulting in significant damage to its steam turbine and generator. As a result of this event, a loss of $20 million was recorded during the third quarter 2018. The Company has business interruption and property damage insurance coverage, subject to pre-defined deductibles, under its existing programs.
On September 25, 2018, the Plant restarted operations running the gas turbine in simple cycle at partial load of approximately 120 MW. Management estimates that the Plant will operate the gas turbine in simple cycle at full
45
load of approximately 185 MW starting in the first quarter of 2019, and in combined cycle at full capacity by the fourth quarter of 2019.
To mitigate the impact of the reduced capacity in the local energy market, the Company is installing 120 MW of rental power (gas turbines) until the combined cycle facility is at full load. The rental units will be in operation in November of 2018.
Considering the information available as of the filing date, Management believes the carrying amount of our assets in Andres of $526 million is recoverable as of September 30, 2018.
Macroeconomic and Political
During the past few years, economic conditions in some countries where our subsidiaries conduct business have destabilized. Changes in global economic conditions could have an adverse impact on our businesses in the event these recent trends continue.
Puerto Rico
— As discussed in Item 7—
Management’s Discussion and Analysis of Financial Condition and Results of Operations
—
Key Trends and Uncertainties
of the 2017 Form 10-K, our subsidiaries in Puerto Rico have long-term PPAs with state-owned PREPA, which has been facing economic challenges that could result in a material adverse effect on our business in Puerto Rico.
AES Puerto Rico and AES Ilumina’s non-recourse debt of
$322 million
and
$35 million
, respectively, continue to be in default and are classified as current as of September 30, 2018 as a result of PREPA´s bankruptcy filing in July 2017. The Company is in compliance with its debt payment obligations as of September 30, 2018.
Regarding the impacts of Hurricanes Irma and Maria in September 2017, as discussed in Item 7—
Management’s Discussion and Analysis of Financial Condition and Results of Operations
—
Key Trends and Uncertainties
of the 2017 Form 10-K, AES Puerto Rico has resumed generation during the first quarter of 2018 and continues to be the lowest cost and EPA compliant energy provider in Puerto Rico and a critical supplier to PREPA.
The Company's receivable balances in Puerto Rico as of September 30, 2018 totaled $66 million, of which $17 million was overdue. Despite the disruption caused by the hurricanes and the Title III protection, PREPA has been making payments to the generators in line with historical payment patterns.
Considering the information available as of the filing date, Management believes the carrying amount of our assets in Puerto Rico of $605 million is recoverable as of September 30, 2018.
Argentina
— During the second quarter of 2018, all of the three-year cumulative inflation rates commonly used to evaluate Argentina’s inflation exceeded 100%. Therefore, Argentina’s economy was determined to be highly inflationary. Since the tariffs and debt at our primary businesses in Argentina are denominated in USD, the functional currency of those businesses is USD. As such, the determination that the Argentina economy is highly inflationary is not expected to have a material impact on the Company’s financial statements.
Chilean Energy Market
— The Company is in the preliminary stages of performing its annual goodwill impairment test, and has no reporting units considered to be "at risk" as of September 30, 2018. A reporting unit is considered "at risk" for the coming year when its fair value at the October 1
st
measurement date is not higher than its carrying amount by 10%. Sustained downward pressure on long-term power prices in Chile could potentially put Gener’s goodwill balance at risk or could potentially be an indicator of other than temporary impairment of certain equity-method investments in future periods. The Gener goodwill balance was $868 million as of September 30, 2018. Impairments would negatively impact our consolidated results of operations and net worth. See Item 1A.—
Risk Factors
of the 2017 Form 10-K for further information.
Regulatory
IPL Rate Case
— On October 31, 2018, IPL received an order from the IURC approving an uncontested settlement agreement to increase annual revenues by $44 million, or 3%, primarily to recover costs associated with the CCGT at Eagle Valley, completed in the first half of 2018, and other construction projects. New base rates and charges are expected to be effective on December 5, 2018. The order also provides customers with approximately $50 million in benefits, including tax reform benefits associated with the TCJA, over a two-year period via a rate adjustment mechanism beginning in March 2019. The benefits accrued to date are recorded in
long-term regulatory liabilities as of
September 30, 2018.
DP&L Rate Case
— In September 2018, DP&L received an order from the PUCO establishing new base distribution rates for DP&L (“the order”), which became effective October 1, 2018. The order approved, without modification, a stipulation and recommendation previously filed by DP&L, along with various intervening parties,
46
and the PUCO staff. The order established a revenue requirement of $248 million for DP&L's electric service base distribution rates, which reflects an increase to distribution revenues of $30 million per year. In addition, the order authorizes DP&L to collect from customers costs related to qualified investments through a Distribution Investment Rider, changes the Decoupling Rider to reduce variability from the impact of weather and demand, partially resolves regulatory issues related to the TCJA, and authorizes DP&L to defer certain vegetation management costs for future collection.
Maritza PPA Review
— The DG Comp continues to review whether Maritza’s PPA with NEK is compliant with the European Commission’s state aid rules. Although no formal investigation has been launched by DG Comp to date, Maritza has engaged in discussions with the DG Comp case team and representatives of Bulgaria to discuss the agency’s review. In the near term, Maritza expects that it will engage in discussions with Bulgaria to attempt to reach a negotiated resolution concerning DG Comp’s review. The anticipated discussions could involve a range of potential outcomes, including but not limited to termination of the PPA and payment of some level of compensation to Maritza. Any negotiated resolution would be subject to mutually acceptable terms, lender consent, and DG Comp approval. At this time, we cannot predict the outcome of the anticipated discussions between Maritza and Bulgaria, nor can we predict how DG Comp might resolve its review if the discussions fail to result in an agreement concerning the review. Maritza believes that its PPA is legal and in compliance with all applicable laws, and it will take all actions necessary to protect its interests, whether through negotiated agreement or otherwise. However, there can be no assurances that this matter will be resolved favorably; if it is not, there could be a material adverse impact on Maritza’s and the Company’s respective financial statements.
Considering the information available as of the filing date, Management believes the carrying value of our long-lived assets at Maritza of approximately $1.2 billion is recoverable as of September 30, 2018.
Foreign Exchange Rates
We operate in multiple countries and as such, are subject to volatility in exchange rates at the subsidiary level between our functional currency, USD, and currencies of the countries in which we operate. In 2018, the Argentine peso devalued significantly against the USD. Continued material devaluation of the Argentine peso against the USD could have an impact on our full year 2018 results. For additional information, refer to Item 3.—
Quantitative and Qualitative Disclosures About Market Risk
.
Impairments
Long-lived Assets
— During the
nine months ended September 30, 2018
, the Company recognized asset impairment expense of
$166 million
. See Note
14
—Asset Impairment Expense included in Item 1.—
Financial Statements
of this Form 10-Q for further information. After recognizing this asset impairment expense, the carrying value of the asset groups, including long-lived assets, and those asset groups that were assessed and not impaired, totaled $55 million at September 30, 2018.
Events or changes in circumstances that may necessitate recoverability tests and potential impairments of long-lived assets may include, but are not limited to, adverse changes in the regulatory environment, unfavorable changes in power prices or fuel costs, increased competition due to additional capacity in the grid, technological advancements, declining trends in demand, or an expectation it is more likely than not the asset will be disposed of before the end of its estimated useful life.
Environmental
The Company is subject to numerous environmental laws and regulations in the jurisdictions in which it operates. The Company faces certain risks and uncertainties related to these environmental laws and regulations, including existing and potential GHG legislation or regulations and actual or potential laws and regulations pertaining to water discharges, waste management (including disposal of coal combustion byproducts) and certain air emissions, such as SO
2
, NO
x
, particulate matter and mercury. Such risks and uncertainties could result in increased capital expenditures or other compliance costs which could have a material adverse effect on certain of our U.S. or international subsidiaries and our consolidated results of operations. For further information about these risks, see Item 1A.—
Risk Factors—Our businesses are subject to stringent environmental laws and regulations; Our businesses are subject to enforcement initiatives from environmental regulatory agencies; and Regulators, politicians, non-governmental organizations and other private parties have expressed concern about greenhouse gas, or GHG, emissions and the potential risks associated with climate change and are taking actions which could have a material adverse impact on our consolidated results of operations, financial condition and cash flows
included in the 2017 Form 10-K.
Waste Management
— In the course of operations, the Company's facilities generate solid and liquid waste materials requiring eventual disposal or processing. The Company endeavors to ensure that all of its solid and
47
liquid wastes are managed in accordance with applicable national, regional, state and local regulations. In October 2015, an EPA rule became effective that regulates coal combustion residuals (“CCR”), which are produced by our coal-fired facilities. Some of those facilities dispose CCR on site in engineered, permitted landfills. The EPA rule established criteria for the beneficial use of CCR within the US, as well as nationally applicable minimum criteria for the disposal of CCR as nonhazardous solid waste in new and currently operating landfills and surface impoundments, and may impose closure and/or corrective action requirements for existing CCR landfills and impoundments under certain specified conditions. The EPA has indicated that they will implement a phased approach to amending the CCR rule with Phase One being finalized no later than June 2019, and Phase Two no later than December 2019. While the EPA published final CCR Rule Amendments (Phase One, Part One) in the Federal Register on July 30, 2018, the U.S. Court of Appeals for the District of Columbia issued a decision on August 21, 2018 on certain CCR related matters that may result in revisions to the current and proposed CCR amendments. The CCR rule, current or proposed amendments to the CCR rule, and the results of groundwater monitoring data could have a material impact on our business, financial condition or results of operations.
Climate Change Regulation
— On August 31, 2018, EPA issued proposed emission guidelines for greenhouse gas emissions from existing electric utility generating units, known as the Affordable Clean Energy (ACE) Rule. In addition, the EPA proposed associated revisions to implementing regulations and the New Source Review program. The proposed ACE Rule would replace the EPA’s 2015 Clean Power Plan and proposes, in addition to other matters, to determine that heat rate improvement measures are the best system of emission reduction for existing coal-fired electric generating units. We are still reviewing the proposed ACE Rule and the proposed revisions and it is too early to determine the potential impact, but any impact could be material.
Capital Resources and Liquidity
Overview
—
As of
September 30, 2018
, the Company had unrestricted cash and cash equivalents of
$1.2 billion
, of which
$43 million
was held at the Parent Company and qualified holding companies. The Company also had
$401 million
in short-term investments, held primarily at subsidiaries. In addition, we had restricted cash and debt service reserves of
$935 million
. The Company also had non-recourse and recourse aggregate principal amounts of debt outstanding of
$15.6 billion
and
$3.8 billion
, respectively.
We expect current maturities of non-recourse debt to be repaid from net cash provided by operating activities of the subsidiary to which the debt relates, through opportunistic refinancing activity, or some combination thereof. We have
$5 million
of recourse debt which matures within the next twelve months. From time to time, we may elect to repurchase our outstanding debt through cash purchases, privately negotiated transactions or otherwise when management believes that such securities are attractively priced. Such repurchases, if any, will depend on prevailing market conditions, our liquidity requirements and other factors. The amounts involved in any such repurchases may be material.
We rely mainly on long-term debt obligations to fund our construction activities. We have, to the extent available at acceptable terms, utilized non-recourse debt to fund a significant portion of the capital expenditures and investments required to construct and acquire our electric power plants, distribution companies and related assets. Our non-recourse financing is designed to limit cross-default risk to the Parent Company or other subsidiaries and affiliates. Our non-recourse long-term debt is a combination of fixed and variable interest rate instruments. Debt is typically denominated in the currency that matches the currency of the revenue expected to be generated from the benefiting project, thereby reducing currency risk. In certain cases, the currency is matched through the use of derivative instruments. The majority of our non-recourse debt is funded by international commercial banks, with debt capacity supplemented by multilaterals and local regional banks.
Given our long-term debt obligations, the Company is subject to interest rate risk on debt balances that accrue interest at variable rates. When possible, the Company will borrow funds at fixed interest rates or hedge its variable rate debt to fix its interest costs on such obligations. In addition, the Company has historically tried to maintain at least 70% of its consolidated long-term obligations at fixed interest rates, including fixing the interest rate through the use of interest rate swaps. These efforts apply to the notional amount of the swaps compared to the amount of related underlying debt. On a consolidated basis, of the Company’s
$19.8 billion
of total gross debt outstanding as of
September 30, 2018
, approximately
$3.1 billion
bore interest at variable rates that were not subject to a derivative instrument which fixed the interest rate. Brazil holds
$660 million
of our floating rate non-recourse exposure as we have no ability to fix local debt interest rates efficiently.
In addition to utilizing non-recourse debt at a subsidiary level when available, the Parent Company provides a portion, or in certain instances all, of the remaining long-term financing or credit required to fund development, construction or acquisition of a particular project. These investments have generally taken the form of equity investments or intercompany loans, which are subordinated to the project’s non-recourse loans. We generally
48
obtain the funds for these investments from our cash flows from operations, proceeds from the sales of assets and/or the proceeds from our issuances of debt, common stock and other securities. Similarly, in certain of our businesses, the Parent Company may provide financial guarantees or other credit support for the benefit of counterparties who have entered into contracts for the purchase or sale of electricity, equipment, or other services with our subsidiaries or lenders. In such circumstances, if a business defaults on its payment or supply obligation, the Parent Company will be responsible for the business’ obligations up to the amount provided for in the relevant guarantee or other credit support. At
September 30, 2018
, the Parent Company had provided outstanding financial and performance-related guarantees or other credit support commitments to or for the benefit of our businesses, which were limited by the terms of the agreements, of approximately
$462 million
in aggregate (excluding those collateralized by letters of credit and other obligations discussed below).
As a result of the Parent Company’s below investment grade rating, counterparties may be unwilling to accept our general unsecured commitments to provide credit support. Accordingly, with respect to both new and existing commitments, the Parent Company may be required to provide some other form of assurance, such as a letter of credit, to backstop or replace our credit support. The Parent Company may not be able to provide adequate assurances to such counterparties. To the extent we are required and able to provide letters of credit or other collateral to such counterparties, this will reduce the amount of credit available to us to meet our other liquidity needs. At
September 30, 2018
, we had
$348 million
in letters of credit outstanding provided under our unsecured credit facility and
$43 million
in letters of credit outstanding provided under our senior secured credit facility. These letters of credit operate to guarantee performance relating to certain project development and construction activities and business operations. During the quarter ended
September 30, 2018
, the Company paid letter of credit fees ranging from
1%
to
3%
per annum on the outstanding amounts.
We expect to continue to seek, where possible, non-recourse debt financing in connection with the assets or businesses that we or our affiliates may develop, construct or acquire. However, depending on local and global market conditions and the unique characteristics of individual businesses, non-recourse debt may not be available on economically attractive terms or at all. If we decide not to provide any additional funding or credit support to a subsidiary project that is under construction or has near-term debt payment obligations and that subsidiary is unable to obtain additional non-recourse debt, such subsidiary may become insolvent, and we may lose our investment in that subsidiary. Additionally, if any of our subsidiaries lose a significant customer, the subsidiary may need to withdraw from a project or restructure the non-recourse debt financing. If we or the subsidiary choose not to proceed with a project or are unable to successfully complete a restructuring of the non-recourse debt, we may lose our investment in that subsidiary.
Many of our subsidiaries depend on timely and continued access to capital markets to manage their liquidity needs. The inability to raise capital on favorable terms, to refinance existing indebtedness or to fund operations and other commitments during times of political or economic uncertainty may have material adverse effects on the financial condition and results of operations of those subsidiaries. In addition, changes in the timing of tariff increases or delays in the regulatory determinations under the relevant concessions could affect the cash flows and results of operations of our businesses.
Long-Term Receivables
— As of
September 30, 2018
, the Company had approximately
$119 million
of accounts receivable classified as
Noncurrent assets—other
, primarily related to certain of its generation businesses in Argentina and Panama. These noncurrent receivables mostly consist of accounts receivable in Argentina that, pursuant to amended agreements or government resolutions, have collection periods that extend beyond
September 30,
2019
, or one year from the latest balance sheet date. The majority of Argentinian receivables have been converted into long-term financing for the construction of power plants. See Note
5
—Financing Receivables
in Item 1.—
Financial Statements
of this Form 10-Q and Item 1.—
Business—Argentina—Regulatory Framework
included in our
2017
Form 10-K for further information.
As of
September 30, 2018
, the Company had approximately
$1.4 billion
of loans receivable primarily related to a facility constructed under a build, operate, and transfer contract in Vietnam. This loan receivable represents contract consideration related to the construction of the facility, which was substantially completed in 2015, and will be collected over the 25 year term of the plant’s PPA. See Note
12
—Revenue
in Item 1.—
Financial Statements
of this Form 10-Q for further information.
Cash Sources and Uses
The primary sources of cash for the Company in the
nine months ended September 30, 2018
were proceeds from the sales of businesses, debt financings, and net income, adjusted for non-cash items. The primary uses of
49
cash in the
nine months ended September 30, 2018
were repayments of debt, capital expenditures, and purchases of short-term investments.
The primary sources of cash for the Company in the
nine months ended September 30, 2017
were debt financings, sales of short-term investments, and net income, adjusted for non-cash items. The primary uses of cash in the
nine months ended September 30, 2017
were repayments of debt, purchases of short-term investments, and capital expenditures.
A summary of cash-based activities are as follows (in millions):
|
Nine Months Ended September 30,
|
||||||||
|
Cash Sources:
|
2018
|
2017
|
||||||
|
Net income, adjusted for non-cash items
(1)
|
$
|
1,865
|
|
$
|
1,880
|
|
||
|
Proceeds from the sales of businesses, net of cash & restricted cash sold
|
1,796
|
|
39
|
|
||||
|
Issuance of non-recourse debt
|
1,509
|
|
2,703
|
|
||||
|
Borrowings under revolving credit facilities
|
1,434
|
|
1,489
|
|
||||
|
Sale of short-term investments
|
1,010
|
|
2,942
|
|
||||
|
Issuance of recourse debt
|
1,000
|
|
1,025
|
|
||||
|
Other
|
155
|
|
140
|
|
||||
|
Total Cash Sources
|
$
|
8,769
|
|
$
|
10,218
|
|
||
|
Cash Uses:
|
||||||||
|
Repayments of recourse debt
|
$
|
(1,781
|
)
|
$
|
(1,353
|
)
|
||
|
Capital expenditures
|
(1,592
|
)
|
(1,587
|
)
|
||||
|
Repayments under revolving credit facilities
|
(1,595
|
)
|
(851
|
)
|
||||
|
Purchase of short-term investments
|
(1,215
|
)
|
(2,673
|
)
|
||||
|
Repayments of non-recourse debt
|
(1,139
|
)
|
(1,731
|
)
|
||||
|
Dividends paid on AES common stock
|
(258
|
)
|
(238
|
)
|
||||
|
Distributions to noncontrolling interests
|
(199
|
)
|
(263
|
)
|
||||
|
Increase in working capital
(2)
|
(184
|
)
|
(179
|
)
|
||||
|
Payments for financed capital expenditures
|
(186
|
)
|
(100
|
)
|
||||
|
Contributions to equity affiliates
|
(101
|
)
|
(49
|
)
|
||||
|
Acquisitions of businesses, net of cash acquired, and equity method investments
|
(66
|
)
|
(590
|
)
|
||||
|
Payments for financing fees
|
(32
|
)
|
(96
|
)
|
||||
|
Other
|
(87
|
)
|
(170
|
)
|
||||
|
Total Cash Uses
|
$
|
(8,435
|
)
|
$
|
(9,880
|
)
|
||
|
Net Increase in Cash, Cash Equivalents, and Restricted Cash
|
$
|
334
|
|
$
|
338
|
|
||
_____________________________
|
(1)
|
Refer to the table within the
Operating Activities
section below for a reconciliation of non-cash items affecting net income during the applicable period.
|
|
(2)
|
Refer to the table within the
Operating Activities
section below for explanations of the variance in working capital requirements.
|
Consolidated Cash Flows
The following table reflects the changes in operating, investing, and financing cash flows for the comparative
nine
month period (in millions):
|
Nine Months Ended September 30,
|
||||||||||||
|
Cash flows provided by (used in):
|
2018
|
2017
|
$ Change
|
|||||||||
|
Operating activities
|
$
|
1,681
|
|
$
|
1,701
|
|
$
|
(20
|
)
|
|||
|
Investing activities
|
(190
|
)
|
(1,955
|
)
|
1,765
|
|
||||||
|
Financing activities
|
(1,163
|
)
|
678
|
|
(1,841
|
)
|
||||||
50
Operating Activities
The following table summarizes the key components of our consolidated operating cash flows (in millions):
|
Nine Months Ended September 30,
|
||||||||||||
|
2018
|
2017
|
$ Change
|
||||||||||
|
Net income
|
$
|
1,384
|
|
$
|
509
|
|
$
|
875
|
|
|||
|
Depreciation and amortization
|
770
|
|
884
|
|
(114
|
)
|
||||||
|
Loss (gain) on disposal and sale of businesses
|
(856
|
)
|
49
|
|
(905
|
)
|
||||||
|
Impairment expenses
|
172
|
|
260
|
|
(88
|
)
|
||||||
|
Deferred income taxes
|
221
|
|
(3
|
)
|
224
|
|
||||||
|
Loss on extinguishment of debt
|
187
|
|
44
|
|
143
|
|
||||||
|
Gain on sale of discontinued operations
|
(243
|
)
|
—
|
|
(243
|
)
|
||||||
|
Other adjustments to net income
|
230
|
|
137
|
|
93
|
|
||||||
|
Non-cash adjustments to net income
|
481
|
|
1,371
|
|
(890
|
)
|
||||||
|
Net income, adjusted for non-cash items
|
$
|
1,865
|
|
$
|
1,880
|
|
$
|
(15
|
)
|
|||
|
Changes in working capital
(1)
|
$
|
(184
|
)
|
$
|
(179
|
)
|
$
|
(5
|
)
|
|||
|
Net cash provided by operating activities
(2)
|
$
|
1,681
|
|
$
|
1,701
|
|
$
|
(20
|
)
|
|||
_____________________________
|
(1)
|
Refer to the table below for explanations of the variance in working capital requirements, which are defined as c
hanges in operating assets and liabilities
on the Condensed Consolidated Statements of Cash Flows.
|
|
(2)
|
Amounts included in the table above include the results of discontinued operations, where applicable.
|
Cash provided by operating activities
decreased
by
$20 million
for the
nine months ended September 30, 2018
, compared to the
nine months ended September 30, 2017
, primarily driven by a
$15 million
decrease in
Net income
, adjusted for non-cash items, and a
$5 million
increase in working capital requirements.
The increase in working capital requirements of
$5 million
for the
nine months ended September 30, 2018
, compared to the
nine months ended September 30, 2017
, was primarily driven by:
|
Increases in cash resulting from changes in:
|
|||
|
Other assets, primarily related to the deconsolidation of Eletropaulo in Q4 2017 and collections from the offtaker at Vietnam related to the loan receivable recorded upon adoption of ASC 606
|
$
|
244
|
|
|
Accounts receivable, primarily due to the deconsolidation of Eletropaulo in Q4 2017 and higher collections at Gener, Argentina, and Maritza
|
154
|
|
|
|
Decreases in cash resulting from changes in:
|
|||
|
Accounts payable and other current liabilities, primarily due to the deconsolidation of Eletropaulo in Q4 2017 and the timing of payments on coal purchases at Gener, partially offset by the timing of payments on coal purchases at Puerto Rico
|
(191
|
)
|
|
|
Prepaid expenses and other current assets, primarily due to prior year collections of net regulatory assets at Eletropaulo, which was deconsolidated in Q4 2017, and advance payments to gas suppliers at Colon
|
(125
|
)
|
|
|
Other liabilities, primarily due to the deconsolidation of Eletropaulo in Q4 2017
|
(83
|
)
|
|
|
Other
|
(4
|
)
|
|
|
Total decrease in operating cash flow from higher working capital requirements
|
$
|
(5
|
)
|
Investing Activities
Net cash provided by investing activities
increased
by
$1.8 billion
for the
nine months ended September 30, 2018
, compared to the
nine months ended September 30, 2017
, which was primarily driven by (in millions):
|
Increases in:
|
|||
|
Proceeds from the sales of businesses, net of cash and restricted cash sold, primarily due to the current year sales of Masinloc, Eletropaulo, Electrica Santiago and the DPL Peaker assets, partially offset by the sale of the Kazakhstan CHPs in 2017 and transaction costs incurred for the Beckjord sale
|
$
|
1,757
|
|
|
Capital expenditures
(1)
|
(5
|
)
|
|
|
Decreases In:
|
|||
|
Acquisitions of businesses, net of cash acquired, and equity method investees, primarily due to the acquisitions of sPower and Alto Sertão II in 2017
|
524
|
|
|
|
Cash resulting from net purchases and sales of short-term investments
|
(474
|
)
|
|
|
Other investing activities
|
(37
|
)
|
|
|
Total increase in net cash provided by investing activities
|
$
|
1,765
|
|
_____________________________
|
(1)
|
Refer to the tables below for a breakout of capital expenditures by type and primary business driver.
|
51
Capital Expenditures
The following table summarizes the Company's capital expenditures for growth investments, maintenance, and environmental reported in investing cash activities (in millions):
|
Nine Months Ended September 30,
|
||||||||||||
|
2018
|
2017
|
$ Change
|
||||||||||
|
Growth Investments
|
$
|
1,266
|
|
$
|
1,109
|
|
$
|
157
|
|
|||
|
Maintenance
|
296
|
|
423
|
|
(127
|
)
|
||||||
|
Environmental
|
30
|
|
55
|
|
(25
|
)
|
||||||
|
Total capital expenditures
|
$
|
1,592
|
|
$
|
1,587
|
|
$
|
5
|
|
|||
Cash used for capital expenditures
increased
by
$5 million
for the
nine months ended September 30, 2018
, compared to the
nine months ended September 30, 2017
, which was primarily driven by (in millions):
|
Increases in:
|
|||
|
Growth expenditures at the US and Utilities SBU, primarily due to increased spending for the Southland re-powering project
|
$
|
408
|
|
|
Decreases in:
|
|||
|
Growth expenditures at the MCAC SBU, primarily related to the Colon project, and lower spending at Los Mina due to the completion of the Combined Cycle project
|
(191
|
)
|
|
|
Maintenance and environmental expenditures at the South America SBU, primarily due to the deconsolidation of Eletropaulo in Q4 2017
|
(138
|
)
|
|
|
Growth expenditures at the South America SBU, primarily due to the deconsolidation of Eletropaulo in Q4 2017, partially offset by increased spending at Alto Maipo resulting from the Strabag agreement, and increased spending for the construction of the Boa Hora solar plant in Brazil
|
(31
|
)
|
|
|
Other capital expenditures
|
(43
|
)
|
|
|
Total increase in capital expenditures
|
$
|
5
|
|
Financing Activities
Net cash used in financing activities
increased
$1.8 billion
for the
nine months ended September 30, 2018
, compared to the
nine months ended September 30, 2017
, which was primarily driven by (in millions):
|
Increases in:
|
|||
|
Net repayments on revolving credit facilities at the Parent Company, IPALCO and DPL
|
$
|
(922
|
)
|
|
Net repayments of recourse debt at the Parent Company
|
(452
|
)
|
|
|
Net repayments of non-recourse debt at Angamos
(1)
|
(132
|
)
|
|
|
Net issuance of non-recourse debt at Southland
(1)
|
227
|
|
|
|
Net borrowing on revolving credit facilities at Gener
|
73
|
|
|
|
Decreases in:
|
|||
|
Net issuance of non-recourse debt at AES Argentina, Tietê, DPL, Alto Maipo and Colon
(1)
|
(584
|
)
|
|
|
Net repayments on revolving credit facilities at Los Mina and AES Andres
|
50
|
|
|
|
Other financing activities
|
(64
|
)
|
|
|
Total increase in net cash used in financing activities
|
$
|
(1,841
|
)
|
_____________________________
|
(1)
|
See Note
7
—
Debt
in Item 1—
Financial Statements
of this Form 10-Q for more information regarding significant non-recourse debt transactions.
|
Parent Company Liquidity
The following discussion is included as a useful measure of the liquidity available to The AES Corporation, or the Parent Company, given the non-recourse nature of most of our indebtedness. Parent Company Liquidity as outlined below is a non-GAAP measure and should not be construed as an alternative to
cash and cash equivalents,
which is determined in accordance with GAAP as a measure of liquidity. Cash and cash equivalents is disclosed in the Condensed Consolidated Statements of Cash Flows. Parent Company Liquidity may differ from similarly titled measures used by other companies. The principal sources of liquidity at the Parent Company level are dividends and other distributions from our subsidiaries, including refinancing proceeds, proceeds from debt and equity financings at the Parent Company level, including availability under our credit facility, and proceeds from asset sales. Cash requirements at the Parent Company level are primarily to fund interest, principal repayments of debt, construction commitments, other equity commitments, common stock repurchases, acquisitions, taxes, Parent Company overhead and development costs, and dividends on common stock.
The Company defines Parent Company Liquidity as cash available to the Parent Company plus available borrowings under existing credit facility plus cash at qualified holding companies. The cash held at qualified holding companies represents cash sent to subsidiaries of the Company domiciled outside of the U.S. Such subsidiaries have no contractual restrictions on their ability to send cash to the Parent Company. Parent Company Liquidity is reconciled to its most directly comparable GAAP financial measure,
cash and cash equivalents
, at the periods indicated as follows (in millions):
52
|
September 30, 2018
|
December 31, 2017
|
||||||
|
Consolidated cash and cash equivalents
|
$
|
1,187
|
|
$
|
949
|
|
|
|
Less: Cash and cash equivalents at subsidiaries
|
(1,144
|
)
|
(938
|
)
|
|||
|
Parent Company and qualified holding companies’ cash and cash equivalents
|
43
|
|
11
|
|
|||
|
Commitments under Parent Company credit facility
|
1,100
|
|
1,100
|
|
|||
|
Less: Letters of credit under the credit facility
|
(43
|
)
|
(35
|
)
|
|||
|
Less: Borrowings under the credit facility
|
(15
|
)
|
(207
|
)
|
|||
|
Borrowings available under Parent Company credit facility
|
1,042
|
|
858
|
|
|||
|
Total Parent Company Liquidity
|
$
|
1,085
|
|
$
|
869
|
|
|
The Company utilizes its Parent Company credit facility for short term cash needs to bridge timing of distributions from its subsidiaries throughout the year. The Company is expecting that the Parent Company credit facilities’ borrowings will be repaid by the end of year, but can make no assurances this will occur as currently forecasted.
The Company paid dividends of
$0.13
per share to its common stockholders during each of the
first
, second, and third quarters of
2018
for dividends declared in
December 2017
, February 2018, and July 2018, respectively. While we intend to continue payment of dividends, and believe we will have sufficient liquidity to do so, we can provide no assurance that we will continue to pay dividends, or if continued, the amount of such dividends.
Recourse Debt
Our total recourse debt was
$3.8 billion
and
$4.6 billion
as of
September 30, 2018
and
December 31, 2017
, respectively. See Note
7
—
Debt
in Item 1.—
Financial Statements
of this Form 10-Q and Note 11—
Debt
in Item 8.—
Financial Statements and Supplementary Data
of our
2017
Form 10-K for additional detail.
While we believe that our sources of liquidity will be adequate to meet our needs for the foreseeable future, this belief is based on a number of material assumptions, including, without limitation, assumptions about our ability to access the capital markets, the operating and financial performance of our subsidiaries, currency exchange rates, power market pool prices, and the ability of our subsidiaries to pay dividends. In addition, our subsidiaries’ ability to declare and pay cash dividends to us (at the Parent Company level) is subject to certain limitations contained in loans, governmental provisions and other agreements. We can provide no assurance that these sources will be available when needed or that the actual cash requirements will not be greater than anticipated. We have met our interim needs for shorter-term and working capital financing at the Parent Company level with our senior secured credit facility. See Item 1A.—
Risk Factors
—
The AES Corporation is a holding company and its ability to make payments on its outstanding indebtedness, including its public debt securities, is dependent upon the receipt of funds from its subsidiaries by way of dividends, fees, interest, loans or otherwise
of the Company’s
2017
Form 10-K for additional information.
Various debt instruments at the Parent Company level, including our senior secured credit facility, contain certain restrictive covenants. The covenants provide for — among other items — limitations on other indebtedness; liens, investments and guarantees; limitations on dividends, stock repurchases and other equity transactions; restrictions and limitations on mergers and acquisitions, sales of assets, leases, transactions with affiliates and off-balance sheet and derivative arrangements; maintenance of certain financial ratios; and financial and other reporting requirements. As of
September 30, 2018
, we were in compliance with these covenants at the Parent Company level.
Non-Recourse Debt
While the lenders under our non-recourse debt financings generally do not have direct recourse to the Parent Company, defaults thereunder can still have important consequences for our results of operations and liquidity, including, without limitation:
|
•
|
reducing our cash flows as the subsidiary will typically be prohibited from distributing cash to the Parent Company during the time period of any default;
|
|
•
|
triggering our obligation to make payments under any financial guarantee, letter of credit or other credit support we have provided to or on behalf of such subsidiary;
|
|
•
|
causing us to record a loss in the event the lender forecloses on the assets; and
|
|
•
|
triggering defaults in our outstanding debt at the Parent Company.
|
For example, our senior secured credit facility and outstanding debt securities at the Parent Company include events of default for certain bankruptcy-related events involving material subsidiaries. In addition, our revolving credit agreement at the Parent Company includes events of default related to payment defaults and accelerations of outstanding debt of material subsidiaries.
53
Some of our subsidiaries are currently in default with respect to all or a portion of their outstanding indebtedness. The total non-recourse debt classified as current in the accompanying Condensed Consolidated Balance Sheets amounts to
$1.3 billion
. The portion of current debt related to such defaults was
$357 million
at
September 30, 2018
, all of which was non-recourse debt related to two subsidiaries — AES Puerto Rico and AES Ilumina. See Note
7
—
Debt
in Item 1.—
Financial Statements
of this Form 10-Q for additional detail.
None of the subsidiaries that are currently in default are subsidiaries that met the applicable definition of materiality under AES’ corporate debt agreements as of
September 30, 2018
, in order for such defaults to trigger an event of default or permit acceleration under AES’ indebtedness. However, as a result of additional dispositions of assets, other significant reductions in asset carrying values or other matters in the future that may impact our financial position and results of operations or the financial position of the individual subsidiary, it is possible that one or more of these subsidiaries could fall within the definition of a “material subsidiary” and thereby upon an acceleration trigger an event of default and possible acceleration of the indebtedness under the Parent Company’s outstanding debt securities. A material subsidiary is defined in the Company’s senior secured credit facility as any business that contributed 20% or more of the Parent Company’s total cash distributions from businesses for the four most recently ended fiscal quarters. As of
September 30, 2018
, none of the defaults listed above individually or in the aggregate results in or is at risk of triggering a cross-default under the recourse debt of the Company.
Critical Accounting Policies and Estimates
The condensed consolidated financial statements of AES are prepared in conformity with U.S. GAAP, which requires the use of estimates, judgments and assumptions that affect the reported amounts of assets and liabilities at the date of the financial statements and the reported amounts of revenue and expenses during the periods presented.
Revenue Recognition
— We recognize revenue to depict the transfer of energy, capacity, and other services to customers in an amount that reflects the consideration to which we expect to be entitled. In applying the revenue model, we determine whether the sale of energy, capacity, and other services represent a single performance obligation based on the individual market and terms of the contract. Generally, the promise to transfer energy and capacity represent a performance obligation that is satisfied over time and meets the criteria to be accounted for as a series of distinct goods or services. Progress toward satisfaction of a performance obligation is measured using output methods, such as MWhs delivered or MWs made available, and when we are entitled to consideration in an amount that corresponds directly to the value of our performance completed to date, we recognize revenue in the amount to which we have the right to invoice. For further information regarding the nature of our revenue streams and our critical accounting policies affecting revenue recognition, see Note
12
—
Revenue
included in Item 1.—
Financial Statements
of this Form 10-Q.
The Company’s other significant accounting policies are described in Note 1—
General and Summary of Significant Accounting Policies
of our
2017
Form 10-K. The Company’s critical accounting estimates are described in Item 7.—
Management’s Discussion and Analysis of Financial Condition and Results of Operations
in the
2017
Form 10-K. An accounting estimate is considered critical if the estimate requires management to make an assumption about matters that were highly uncertain at the time the estimate was made, different estimates reasonably could have been used, or if changes in the estimate that would have a material impact on the Company’s financial condition or results of operations are reasonably likely to occur from period to period. Management believes that the accounting estimates employed are appropriate and resulting balances are reasonable; however, actual results could differ from the original estimates, requiring adjustments to these balances in future periods. The Company has reviewed and determined that these remain as critical accounting policies as of and for the
nine months ended September 30, 2018
.
Overview Regarding Market Risks
— Our businesses are exposed to and proactively manage market risk. Our primary market risk exposure is to the price of commodities, particularly electricity, oil, natural gas, coal and environmental credits. In addition, our businesses are exposed to lower electricity prices due to increased competition, including from renewable sources such as wind and solar, as a result of lower costs of entry and lower variable costs. We operate in multiple countries and as such, are subject to volatility in exchange rates at varying degrees at the subsidiary level and between our functional currency, USD, and currencies of the countries in which we operate. We are also exposed to interest rate fluctuations due to our issuance of debt and related financial instruments.
The disclosures presented in this Item 3 are based upon a number of assumptions; actual effects may differ. The safe harbor provided in Section 27A of the Securities Act of 1933 and Section 21E of the Securities Exchange Act of 1934 shall apply to the disclosures contained in this Item 3. For further information regarding market risk, see
54
Item 1A.—
Risk Factors
,
Our financial position and results of operations may fluctuate significantly due to fluctuations in currency exchange rates experienced at our foreign operations;
Our businesses may incur substantial costs and liabilities and be exposed to price volatility as a result of risks associated with the electricity markets, which could have a material adverse effect on our financial performance
; and
We may not be adequately hedged against our exposure to changes in commodity prices or interest rates
of the
2017
Form 10-K.
Commodity Price Risk
— Although we prefer to hedge our exposure to the impact of market fluctuations in the price of electricity, fuels and environmental credits, some of our generation businesses operate under short-term sales or under contract sales that leave an unhedged exposure on some of our capacity or through imperfect fuel pass-throughs. In our utility businesses, we may be exposed to commodity price movements depending on our excess or shortfall of generation relative to load obligations and sharing or pass-through mechanisms. These businesses subject our operational results to the volatility of prices for electricity, fuels and environmental credits in competitive markets. We employ risk management strategies to hedge our financial performance against the effects of fluctuations in energy commodity prices. The implementation of these strategies can involve the use of physical and financial commodity contracts, futures, swaps and options.
The portion of our sales and purchases that are not subject to such agreements or contracted businesses where indexation is not perfectly matched to business drivers will be exposed to commodity price risk. When hedging the output of our generation assets, we utilize contract sales that lock in the spread per MWh between variable costs and the price at which the electricity can be sold.
AES businesses will see changes in variable margin performance as global commodity prices shift. For
2018
, we project pre-tax earnings exposure on a 10% move in commodity prices would be less than $5 million for natural gas, oil, and coal. Our estimates exclude correlation of oil with coal or natural gas. For example, a decline in oil or natural gas prices can be accompanied by a decline in coal price if commodity prices are correlated. In aggregate, the Company’s downside exposure occurs with lower oil, lower natural gas, and higher coal prices. Exposures at individual businesses will change as new contracts or financial hedges are executed, and our sensitivity to changes in commodity prices generally increases in later years with reduced hedge levels at some of our businesses.
Commodity prices affect our businesses differently depending on the local market characteristics and risk management strategies. Spot power prices, contract indexation provisions and generation costs can be directly or indirectly affected by movements in the price of natural gas, oil and coal. We have some natural offsets across our businesses such that low commodity prices may benefit certain businesses and be a cost to others. Exposures are not perfectly linear or symmetric. The sensitivities are affected by a number of local or indirect market factors. Examples of these factors include hydrology, local energy market supply/demand balances, regional fuel supply issues, regional competition, bidding strategies and regulatory interventions such as price caps. Operational flexibility changes the shape of our sensitivities. For instance, certain power plants may limit downside exposure by reducing dispatch in low market environments. Volume variation also affects our commodity exposure. The volume sold under contracts or retail concessions can vary based on weather and economic conditions resulting in a higher or lower volume of sales in spot markets. Thermal unit availability and hydrology can affect the generation output available for sale and can affect the marginal unit setting power prices.
In the US and Utilities SBU, the generation businesses are largely contracted, but may have residual risk to the extent contracts are not perfectly indexed to the business drivers. IPL primarily generates energy to meet its retail customer demand however it opportunistically sells surplus economic energy into wholesale markets at market prices. Our non-contracted generation margins are impacted by many factors, including the growth in natural gas-fired generation plants, new energy supply from renewable sources, and increasing energy efficiency
.
In the South America SBU, our business in Chile owns assets in the central and northern regions of the country and has a portfolio of contract sales in both. In the central region, the contract sales generally cover the efficient generation from our coal-fired and hydroelectric assets. Any residual spot price risk will primarily be driven by the amount of hydrological inflows. In the case of low hydroelectric generation, spot price exposure is capped by the ability of the system to dispatch natural gas/diesel assets the price of which depends on fuel pricing at the time required. There is a small amount of coal generation in the northern region that is not covered by the portfolio of contract sales and therefore subject to spot price risk. In both regions, under normal hydrology conditions, coal-firing generation sets the price. However, when there are spikes in price due to lower hydrology and higher demand, gas or oil-linked fuels generally set power prices. In Colombia, we operate under a short-term sales strategy and have commodity exposure to unhedged volumes. Because we own hydroelectric assets there, contracts are not indexed to fuel.
In Brazil, the hydroelectric generating facility is covered by contract sales. Under normal hydrological volatility, spot price risk is mitigated through a regulated sharing mechanism across all hydroelectric generators in the
55
country. Under drier conditions, the sharing mechanism may not be sufficient to cover the business' contract position, and therefore it may have to purchase power at spot prices driven by the cost of thermal generation.
In the MCAC SBU, our businesses have commodity exposure on unhedged volumes. Panama is highly contracted under financial PPAs, exposing the Company to hydrology variance. To the extent hydrological inflows are greater than or less than the contract committed volume, the business will be sensitive to changes in spot power prices which may be driven by oil or natural gas prices in some time periods. In the Dominican Republic, we own natural gas-fired assets contracted under a portfolio of contract sales and a coal-fired asset contracted with a single contract, and both contract and spot prices may move with commodity prices. Additionally, the contract levels do not always match our generation availability and our assets may be sellers of spot prices in excess of contract levels or a net buyer in the spot market to satisfy contract obligations.
In the Eurasia SBU, our Kilroot facility operates on a short-term sales strategy
.
To the extent that sales are unhedged, the commodity risk at our Kilroot business is to the clean dark spread, which is the difference between electricity price and our coal-based variable dispatch cost, including emissions. Natural gas-fired generators set power prices for many periods, so higher natural gas prices generally expand margins and higher coal or emissions prices reduce them. Similarly, increased wind generation displaces higher cost generation, reducing Kilroot's margins, and vice versa. One coal-fired generating unit in Northern Ireland is expected to close in the fourth quarter of 2018 as a result of unfavorable capacity market conditions. Our Mong Duong business has minimal exposure to commodity price risk as it has no merchant exposure and fuel is subject to a pass-through mechanism.
Foreign Exchange Rate Risk
— In the normal course of business, we are exposed to foreign currency risk and other foreign operations risks that arise from investments in foreign subsidiaries and affiliates. A key component of these risks stems from the fact that some of our foreign subsidiaries and affiliates utilize currencies other than our consolidated reporting currency, the USD. Additionally, certain of our foreign subsidiaries and affiliates have entered into monetary obligations in the USD or currencies other than their own functional currencies. Certain of our foreign subsidiaries calculate and pay taxes in currencies other than their own functional currency.
We have varying degrees of exposure to changes in the exchange rate between the USD and the following currencies: Argentine peso, British pound, Brazilian real, Chilean peso, Colombian peso, Dominican peso, Euro, Indian rupee, and Mexican peso. These subsidiaries and affiliates have attempted to limit potential foreign exchange exposure by entering into revenue contracts that adjust to changes in foreign exchange rates. We also use foreign currency forwards, swaps and options, where possible, to manage our risk related to certain foreign currency fluctuations.
AES enters into cash flow hedges to protect the economic value of the business and minimize the impact of foreign exchange rate fluctuations to AES’ portfolio. While protecting cash flows, the hedging strategy is also designed to reduce forward looking earnings foreign exchange volatility. Due to variation of timing and amount between cash distribution and earnings exposure, the hedge impact may not fully cover the earnings exposure on a realized basis which could result in greater volatility in earnings. The largest foreign exchange risks over the remaining period of 2018 stem from the following currencies: Argentine peso, Brazilian real, Colombian peso, and Euro. As of
September 30, 2018
, assuming a 10% USD appreciation, cash distributions attributable to foreign subsidiaries exposed to movement in the exchange rate of the Argentine peso and Euro each are projected to be reduced by $5 million, and the Colombian peso and Brazilian real each are projected to be reduced by less than $5 million for the remainder of
2018
. These numbers have been produced by applying a one-time 10% USD appreciation to forecasted exposed cash distributions for
2018
coming from the respective subsidiaries exposed to the currencies listed above, net of the impact of outstanding hedges and holding all other variables constant. The numbers presented above are net of any transactional gains/losses. These sensitivities may change in the future as new hedges are executed or existing hedges are unwound. Additionally, updates to the forecasted cash distributions exposed to foreign exchange risk may result in further modification. The sensitivities presented do not capture the impacts of any administrative market restrictions or currency inconvertibility.
Interest Rate Risk
— We are exposed to risk resulting from changes in interest rates as a result of our issuance of variable and fixed-rate debt, as well as interest rate swap, cap, floor and option agreements.
Decisions on the fixed-floating debt mix are made to be consistent with the risk factors faced by individual businesses or plants. Depending on whether a plant’s capacity payments or revenue stream is fixed or varies with inflation, we partially hedge against interest rate fluctuations by arranging fixed-rate or variable-rate financing. In certain cases, particularly for non-recourse financing, we execute interest rate swap, cap and floor agreements to effectively fix or limit the interest rate exposure on the underlying financing. Most of our interest rate risk is related to non-recourse financings at our businesses.
As of
September 30, 2018
, the portfolio’s pre-tax earnings exposure for
2018
to a one-time 100-basis-point increase in interest rates for our Argentine peso, Brazilian real, Chilean peso, Colombian peso, Euro, and USD
56
denominated debt would be approximately $5 million on interest expense for the debt denominated in these currencies. These amounts do not take into account the historical correlation between these interest rates.
Evaluation of Disclosure Controls and Procedures
— The Company, under the supervision and with the participation of its management, including the Company’s Chief Executive Officer (“CEO”) and Chief Financial Officer (“CFO”), evaluated the effectiveness of its “disclosure controls and procedures,” as such term is defined in Rule 13a-15(e) under the Securities Act of 1934, as amended (the “Exchange Act”), as of the end of the period covered by this Quarterly Report on Form 10-Q. Based on that evaluation, our CEO and CFO have concluded that our disclosure controls and procedures were effective as of
September 30, 2018
, to ensure that information required to be disclosed by the Company in reports that we file or submit under the Exchange Act is recorded, processed, summarized and reported within the time periods specified in SEC rules and forms, and include controls and procedures designed to ensure that information required to be disclosed by us in such reports is accumulated and communicated to our management, including our CEO and CFO, as appropriate, to allow timely decisions regarding required disclosures.
Changes in Internal Controls over Financial Reporting
—
There were no changes that occurred during the fiscal quarter covered by this Quarterly Report on Form 10-Q that have materially affected, or are reasonably likely to materially affect, our internal control over financial reporting.
57
The Company is involved in certain claims, suits and legal proceedings in the normal course of business. The Company has accrued for litigation and claims where it is probable that a liability has been incurred and the amount of loss can be reasonably estimated. The Company believes, based upon information it currently possesses and taking into account established reserves for estimated liabilities and its insurance coverage, that the ultimate outcome of these proceedings and actions is unlikely to have a material adverse effect on the Company's condensed consolidated financial statements. It is reasonably possible, however, that some matters could be decided unfavorably to the Company and could require the Company to pay damages or make expenditures in amounts that could be material but cannot be estimated as of September 30, 2018.
In December 2001, Grid Corporation of Odisha (“GRIDCO”) served a notice to arbitrate pursuant to the Indian Arbitration and Conciliation Act of 1996 on the Company, AES Orissa Distribution Private Limited (“AES ODPL”), and Jyoti Structures (“Jyoti”) pursuant to the terms of the shareholders agreement between GRIDCO, the Company, AES ODPL, Jyoti and the Central Electricity Supply Company of Orissa Ltd. (“CESCO”), an affiliate of the Company. In the arbitration, GRIDCO asserted that a comfort letter issued by the Company in connection with the Company's indirect investment in CESCO obligates the Company to provide additional financial support to cover all of CESCO's financial obligations to GRIDCO. GRIDCO appeared to be seeking approximately $189 million in damages, plus undisclosed penalties and interest, but a detailed alleged damage analysis was not filed by GRIDCO. The Company counterclaimed against GRIDCO for damages. In June 2007, a 2-to-1 majority of the arbitral tribunal rendered its award rejecting GRIDCO's claims and holding that none of the respondents, the Company, AES ODPL, or Jyoti, had any liability to GRIDCO. The respondents' counterclaims were also rejected. A majority of the tribunal later awarded the respondents, including the Company, some of their costs relating to the arbitration. GRIDCO filed challenges of the tribunal's awards with the local Indian court. GRIDCO's challenge of the costs award has been dismissed by the court, but its challenge of the liability award remains pending. A hearing on the liability award has not taken place to date. The Company believes that it has meritorious defenses to the claims asserted against it and will defend itself vigorously in these proceedings; however, there can be no assurances that it will be successful in its efforts.
Pursuant to their environmental audit, AES Sul and AES Florestal discovered 200 barrels of solid creosote waste and other contaminants at a pole factory that AES Florestal had been operating. The conclusion of the audit was that a prior operator of the pole factory, Companhia Estadual de Energia (“CEEE”), had been using those contaminants to treat the poles that were manufactured at the factory. On their initiative, AES Sul and AES Florestal communicated with Brazilian authorities and CEEE about the adoption of containment and remediation measures. In March 2008, the State Attorney of the state of Rio Grande do Sul, Brazil filed a public civil action against AES Sul, AES Florestal and CEEE seeking an order requiring the companies to recover the contaminated area located on the grounds of the pole factory and an indemnity payment of approximately R
$6 million
(
$2 million
) to the state's Environmental Fund. In October 2011, the State Attorney Office filed a request for an injunction ordering the defendant companies to contain and remove the contamination immediately. The court granted injunctive relief on October 18, 2011, but determined only that defendant CEEE was required to proceed with the removal work. In May 2012, CEEE began the removal work in compliance with the injunction. The removal costs are estimated to be approximately R
$60 million
(
$15 million
) and the work was completed in February 2014. In parallel with the removal activities, a court-appointed expert investigation took place, which was concluded in May 2014. The court-appointed expert final report was presented to the State Attorneys in October 2014, and in January 2015 to the defendant companies. In March 2015, AES Sul and AES Florestal submitted comments and supplementary questions regarding the expert report. In June 2016 the Company sold AES Sul to CPFL Energia S.A. and as part of the sale AES Guaiba, a holding Company of AES Sul, retained the liability. The Company believes that it has meritorious defenses to the claims asserted against it and will defend itself vigorously in these proceedings; however, there can be no assurances that it will be successful in its efforts.
In January 2012, the Brazil Federal Tax Authority issued an assessment alleging that AES Tietê had paid PIS and COFINS taxes from 2007 to 2010 at a lower rate than the tax authority believed was applicable. AES Tietê challenged the assessment on the grounds that the tax rate was set in the applicable legislation. In April 2013, the FIAC determined that AES Tietê should have calculated the taxes at the higher rate and that AES Tietê was liable for unpaid taxes, interest, and penalties totaling approximately R
$1.19 billion
(
$298 million
) as estimated by AES Tietê. AES Tietê appealed to the SIAC. In January 2015, the SIAC issued a decision in AES Tietê's favor, finding that AES Tietê was not liable for unpaid taxes. The public prosecutor subsequently filed an appeal, which was denied as untimely. The Tax Authority thereafter filed a motion for clarification of the SIAC's decision, which was denied in September 2016. The Tax Authority later filed a special appeal (“Special Appeal”), which was rejected as untimely in October 2016. The Tax Authority thereafter filed an interlocutory appeal with the Superior Administrative
58
Court (“SAC”). In March 2017, the President of the SAC determined that the SAC would analyze the Special Appeal. AES Tietê challenged the Special Appeal. In May 2018, the SAC rejected the Special Appeal on the merits. In August 2018, the Tax Authority filed a motion for clarification
.
AES Tietê believes it has meritorious defenses to the claim and will defend itself vigorously in these proceedings; however, there can be no assurances that it will be successful in its efforts.
In January 2015, DPL received NOVs from the EPA alleging violations of opacity at Stuart and Killen Stations, and in October 2015, IPL received a similar NOV alleging violations at Petersburg Station. In February 2017, the EPA issued a second NOV for DPL Stuart Station, alleging violations of opacity in 2016. Moreover, in February 2016, IPL received an NOV from the EPA alleging violations of NSR and other CAA regulations, the Indiana SIP, and the Title V operating permit at Petersburg Station. It is too early to determine whether the NOVs could have a material impact on our business, financial condition or results of our operations. IPL would seek recovery of any operating or capital expenditures, but not fines or penalties, related to air pollution control technology to reduce regulated air emissions; however, there can be no assurances that we would be successful in this regard.
In September 2015, AES Southland Development, LLC and AES Redondo Beach, LLC filed a lawsuit against the California Coastal Commission (the “CCC”) over the CCC's determination that the site of AES Redondo Beach included approximately 5.93 acres of CCC-jurisdictional wetlands. The CCC has asserted that AES Redondo Beach has improperly installed and operated water pumps affecting the alleged wetlands in violation of the California Coastal Act and Redondo Beach Local Coastal Program and has ordered AES Redondo Beach to restore the site. Additional potential outcomes of the CCC determination could include an order requiring AES Redondo Beach to fund a wetland mitigation project and/or pay fines or penalties. AES Redondo Beach believes that it has meritorious arguments and intends to vigorously prosecute such lawsuit, but there can be no assurances that it will be successful.
In October 2015, Ganadera Guerra, S.A. (“GG”) and Constructora Tymsa, S.A. (“CT”) filed separate lawsuits against AES Panama in the local courts of Panama. The claimants allege that AES Panama profited from a hydropower facility (La Estrella) being partially located on land owned initially by GG and currently by CT, and that AES Panama must pay compensation for its use of the land. The damages sought from AES Panama are approximately $685 million (GG) and $100 million (CT). In October 2016, the court dismissed GG's claim because of GG's failure to comply with a court order requiring GG to disclose certain information. GG has refiled its lawsuit. Also, there are ongoing administrative proceedings concerning whether AES Panama is entitled to acquire an easement over the land and whether AES Panama can continue to occupy the land. AES Panama believes it has meritorious defenses and claims and will assert them vigorously; however, there can be no assurances that it will be successful in its efforts.
In January 2017, the Superintendencia del Medio Ambiente (“SMA”) issued a Formulation of Charges asserting that Alto Maipo is in violation of certain conditions of the Environmental Approval Resolution (“RCA”) governing the construction of Alto Maipo’s hydropower project, for, among other things, operating vehicles at unauthorized times and failing to mitigate the impact of water infiltration during tunnel construction (“Infiltration Water”). In February 2017, Alto Maipo submitted a compliance plan (“Compliance Plan”) to the SMA which, if approved by the agency, would resolve the matter without materially impacting construction of the project. Thereafter, the SMA made three separate requests for information about the Compliance Plan, to which Alto Maipo duly responded. In April 2018, the SMA approved the Compliance Plan (“April 2018 Approval”). Pursuant to the Compliance Plan as approved by the SMA, Alto Maipo must obtain from the Environmental Evaluation Service (“SEA”) an acceptable interpretation of the RCA’s provisions concerning the authorized times to operate certain vehicles. In addition, Alto Maipo must obtain the SEA’s approval concerning the control, discharge, and treatment of Infiltration Water. Furthermore, in May 2018, three lawsuits were filed with the Environmental Court of Santiago (“ECS”) challenging the April 2018 Approval. Alto Maipo does not believe that there are grounds to challenge the April 2018 Approval. The ECS has not decided the lawsuits to date. If Alto Maipo complies with the requirements of the Compliance Plan, and if the above-referenced lawsuits are dismissed, the Formulation of Charges will be discharged without penalty. Otherwise, Alto Maipo could be subject to penalties, and the construction of the project could be negatively impacted. Alto Maipo will pursue its interests vigorously in these matters; however, there can be no assurances that it will be successful in its efforts.
In June 2017, Alto Maipo terminated one of its contractors, Constructora Nuevo Maipo S.A. (“CNM”), given CNM’s stoppage of tunneling works, its failure to produce a completion plan, and its other breaches of contract. Also, Alto Maipo drew $73 million under letters of credit (“LC Funds”) in connection with its termination of CNM. Alto Maipo is pursuing arbitration against CNM to recover excess completion costs and other damages totaling approximately $220 million (net of the LC Funds) relating to CNM’s breaches (“First Arbitration”). CNM denies liability and seeks a declaration that its termination was wrongful, damages, and other relief. Recently, CNM made
59
submissions alleging that it is entitled to damages ranging from $90 million to $150 million (which include the LC Funds) plus interest and costs. Alto Maipo will contest these submissions. The evidentiary hearing is scheduled for May 20-31, 2019. Also, in August 2018, CNM purported to initiate a separate arbitration against AES Gener and the Company (“Second Arbitration”). In the Second Arbitration, CNM seeks to pierce Alto Maipo’s corporate veil and appears to seek an award requiring AES Gener and the Company to pay any amounts that are found to be due to CNM in the First Arbitration or otherwise. Alto Maipo has requested in the First Arbitration an interim order restraining CNM from proceeding with the Second Arbitration until the conclusion of the First Arbitration. That request is pending. Separately, AES Gener and the Company requested that the relevant arbitral institution decide that the Second Arbitration shall not proceed, given that (among other reasons) there is no arbitration agreement between AES Gener and the Company and CNM. That request was not granted. Each of the above-referenced AES companies believes it has meritorious claims and/or defenses and will pursue its interests vigorously; however, there can be no assurances that each of the AES companies will be successful in its efforts.
In February 2018, Tau Power B.V. and Altai Power LLP (collectively, “AES Claimants”) initiated arbitration against the Republic of Kazakhstan (“ROK”) for the ROK’s failure to pay approximately $75 million for the return of two hydropower plants (“HPPs”) pursuant to a concession agreement. In April 2018, the ROK responded by denying liability and asserting purported counterclaims concerning the annual payment provisions in the concession agreement, a bonus allegedly due for the 1997 takeover of the HPPs, and dividends paid by the HPPs
.
The ROK has not fully quantified its counterclaims to date. The AES Claimants believe that the counterclaims are without merit. An arbitrator has been appointed to decide the case. The final evidentiary hearing is scheduled for July 22-26, 2019. The AES Claimants will pursue their case and assert their defenses vigorously; however, there can be no assurances that they will be successful in their efforts.
There have been no material changes to the risk factors disclosed in Part I
—
Item 1A.
—Risk Factors
of our
2017
Form 10-K.
The Board has authorized the Company to repurchase stock through a variety of methods, including open market repurchases, purchases by contract (including, without limitation, accelerated stock repurchase programs or 10b5-1 plans) and/or privately negotiated transactions. There can be no assurances as to the amount, timing or prices of repurchases, which may vary based on market conditions and other factors. The Program does not have an expiration date and can be modified or terminated by the Board of Directors at any time. As of
September 30, 2018
,
$264 million
remained available for repurchase under the Program. No repurchases were made by the AES Corporation of its common stock during the third quarter of 2018.
None.
Not applicable.
None.
|
10.1
|
||
|
31.1
|
||
|
31.2
|
||
|
32.1
|
||
|
32.2
|
||
|
101.INS
|
XBRL Instance Document - the instance document does not appear in the Interactive Data File because its XBRL tags are embedded within the Inline XBRL document.
|
|
|
101.SCH
|
XBRL Taxonomy Extension Schema Document (filed herewith).
|
|
|
101.CAL
|
XBRL Taxonomy Extension Calculation Linkbase Document (filed herewith).
|
|
|
101.DEF
|
XBRL Taxonomy Extension Definition Linkbase Document (filed herewith).
|
|
|
101.LAB
|
XBRL Taxonomy Extension Label Linkbase Document (filed herewith).
|
|
|
101.PRE
|
XBRL Taxonomy Extension Presentation Linkbase Document (filed herewith).
|
|
60
SIGNATURES
Pursuant to the requirements of the Securities Exchange Act of 1934, the registrant has duly caused this report to be signed on its behalf by the undersigned thereunto duly authorized.
|
THE AES CORPORATION
(Registrant)
|
|||||
|
Date:
|
November 5, 2018
|
By:
|
/s/ T
HOMAS
M. O’F
LYNN
|
||
|
Name:
|
Thomas M. O’Flynn
|
||||
|
Title:
|
Executive Vice President and Chief Financial Officer (Principal Financial Officer)
|
||||
|
By:
|
/s/ SARAH R. BLAKE
|
||||
|
Name:
|
Sarah R. Blake
|
||||
|
Title:
|
Vice President and Controller (Principal Accounting Officer)
|
||||
61
TABLE OF CONTENTS
Part I: Financial InformationItem 1. Financial StatementsItem 2. Management S Discussion and Analysis Of Financial Condition and Results Of OperationsItem 3. Quantitative and Qualitative Disclosures About Market RiskItem 4. Controls and ProceduresPart Ii: Other InformationItem 1. Legal ProceedingsItem 1A. Risk FactorsItem 2. Unregistered Sales Of Equity Securities and Use Of ProceedsItem 3. Defaults Upon Senior SecuritiesItem 4. Mine Safety DisclosuresItem 5. Other InformationItem 6. Exhibits