FEDERAL AGRICULTURAL MORTGAGE CORP
10-Ks and 10-Qs
|
|
|
|
|
|
|
|
|
|
|
|
|
|
|
|
|
|
|
|
|
|
|
|
|
|
|
|
|
|
|
|
|
|
|
|
|
|
|
|
|
|
|
|
|
|
|
|
|
|
As filed with the Securities and Exchange Commission on
March 18, 2013
UNITED STATES
SECURITIES AND EXCHANGE COMMISSION
WASHINGTON, D.C. 20549
FORM 10-K
(Mark One)
|
x
|
ANNUAL REPORT PURSUANT TO SECTION 13 OR 15(d) OF THE SECURITIES EXCHANGE ACT OF 1934
|
For the fiscal year ended
December 31, 2012
.
or
|
o
|
TRANSITION REPORT PURSUANT TO SECTION 13 OR 15(d) OF THE SECURITIES EXCHANGE ACT OF 1934
|
For the transition period from _____ to _____.
Commission File Number 001-14951
____________________________________________________________
|
FEDERAL AGRICULTURAL MORTGAGE CORPORATION
|
|
(Exact name of registrant as specified in its charter)
|
|
Federally chartered instrumentality
of the United States
|
|
52-1578738
|
|
(State or other jurisdiction of
incorporation or organization)
|
|
(I.R.S. employer identification number)
|
|
|
|
|
|
1999 K Street, N.W., 4th Floor,
Washington, D.C.
|
|
20006
|
|
(Address of principal executive offices)
|
|
(Zip code)
|
|
(202) 872-7700
|
|
(Registrant's telephone number, including area code)
|
Securities registered pursuant to Section 12(b) of the Act:
|
Title of each class
|
|
Exchange on which registered
|
|
Class A voting common stock
|
|
New York Stock Exchange
|
|
Class C non-voting common stock
|
|
New York Stock Exchange
|
|
5.875% Non-Cumulative Preferred Stock, Series A
|
New York Stock Exchange
|
|
Securities registered pursuant to Section 12(g) of the Act: Class B voting common stock
Indicate by check mark if the registrant is a well-known seasoned issuer, as defined in Rule 405 of the Securities Act.
Yes
o
No
x
Indicate by check mark if the registrant is not required to file reports pursuant to Section 13 or Section 15(d) of the Act.
Yes
o
No
x
Indicate by check mark whether the registrant (1) has filed all reports required to be filed by Section 13 or 15(d) of the Securities Exchange Act of 1934 during the preceding 12 months (or for such shorter period that the registrant was required to file such reports), and (2) has been subject to such filing requirements for the past 90 days.
Yes
x
No
o
Indicate by check mark whether the registrant has submitted electronically and posted on its corporate Web site, if any, every Interactive Data File required to be submitted and posted pursuant to Rule 405 of Regulation S-T (§ 232.405 of this chapter) during the preceding 12 months (or for such shorter period that the registrant was required to submit and post such files).
Yes
x
No
o
Indicate by check mark if disclosure of delinquent filers pursuant to Item 405 of Regulation S-K (17 C.F.R. §229.405) is not contained herein, and will not be contained, to the best of the registrant's knowledge, in definitive proxy or information statements incorporated by reference in Part III of this Form 10-K or any amendment to this Form 10-K.
o
Indicate by check mark whether the registrant is a large accelerated filer, an accelerated filer, a non-accelerated filer, or a smaller reporting company. See the definitions of "large accelerated filer," "accelerated filer" and "smaller reporting company" in Rule 12b-2 of the Exchange Act. (Check one):
|
Large accelerated filer
|
o
|
Accelerated filer
|
x
|
|
Non-accelerated filer
|
o
|
Smaller reporting company
|
o
|
Indicate by check mark whether the registrant is a shell company (as defined in Rule 12b-2 of the Exchange Act).
Yes
o
No
x
The aggregate market value of the Class A voting common stock and Class C non-voting common stock held by non-affiliates of the registrant was
$255,643,942
as of
June 29, 2012
, based upon the closing prices for the respective classes on
June 29, 2012
reported by the New York Stock Exchange. For purposes of this information, the outstanding shares of Class C non-voting common stock owned by directors and executive officers of the registrant were deemed to be held by affiliates. The aggregate market value of the Class B voting common stock is not ascertainable due to the absence of publicly available quotations or prices for the Class B voting common stock as a result of the limited market for, and infrequency of trades in, Class B voting common stock and the fact that any such trades are privately negotiated transactions.
As of
March 1, 2013
, the registrant had outstanding
1,030,780
shares of Class A voting common stock,
500,301
shares of Class B voting common stock and
9,223,342
shares of Class C non-voting common stock.
DOCUMENTS INCORPORATED BY REFERENCE
The definitive proxy statement relating to the registrant's
2013
Annual Meeting of Stockholders (portions of which are incorporated by reference into Part II and Part III of this Annual Report on Form 10-K).
Table of Contents
|
|
||
|
|
||
|
|
||
|
|
||
|
|
||
|
|
||
|
|
||
|
|
||
|
|
||
|
|
||
|
|
||
2
3
|
Item 1.
|
Business
|
GENERAL
The Federal Agricultural Mortgage Corporation ("Farmer Mac" or the "Corporation") is a stockholder-owned, federally chartered corporation that combines private capital and public sponsorship to serve a public purpose. Congress has charged Farmer Mac with the mission of providing a secondary market for a variety of loans made to borrowers in rural America. A secondary market is an economic arrangement in which the owners of financial assets, such as the originators of loans, may sell all or part of those assets or pay a fee to otherwise offset some or all of the inherent risks of holding the assets. Farmer Mac's main secondary market activities are:
|
•
|
purchasing eligible loans directly from lenders;
|
|
•
|
providing advances against eligible loans by purchasing obligations secured by those loans;
|
|
•
|
securitizing assets and guaranteeing the payment of principal and interest on the resulting securities that represent interests in, or obligations secured by, pools of eligible loans; and
|
|
•
|
issuing long-term standby purchase commitments ("LTSPCs") for eligible loans.
|
Securities guaranteed by Farmer Mac may be retained by the seller of the underlying eligible loans, retained by Farmer Mac, or sold to third party investors.
Farmer Mac was established under federal legislation first enacted in 1988 and amended as recently as 2008 – Title VIII of the Farm Credit Act of 1971 (12 U.S.C. §§ 2279aa et seq.), which is sometimes referred to as Farmer Mac's charter. Farmer Mac is known as a government-sponsored enterprise ("GSE") by virtue of the status conferred by its charter. The charter provides that Farmer Mac has the power to establish, acquire, and maintain affiliates (as defined in the charter) under applicable state law to carry out any activities that otherwise would be performed directly by the Corporation. Farmer Mac established its two existing subsidiaries, Farmer Mac II LLC and Farmer Mac Mortgage Securities Corporation, under that power.
Farmer Mac is an institution of the Farm Credit System (the "FCS"), which is composed of the banks, associations, and related entities, including Farmer Mac and its subsidiaries, regulated by the Farm Credit Administration ("FCA"), an independent agency in the executive branch of the United States government. Although Farmer Mac (including its subsidiaries) is an institution of the FCS, it is not liable for any debt or obligation of any other institution of the FCS. None of FCA, the FCS, or any other individual institution of the FCS is liable for any debt or obligation of Farmer Mac or its subsidiaries, nor are Farmer Mac's or its subsidiaries' debts or obligations guaranteed by the full faith and credit of the United States.
Farmer Mac's two principal sources of revenue are:
|
•
|
interest income earned on assets held on balance sheet, net of related funding costs and interest payments and receipts on financial derivatives (i.e., net effective spread); and
|
|
•
|
guarantee and commitment fees received in connection with outstanding guaranteed securities and LTSPCs.
|
4
Farmer Mac funds its purchases of eligible loans (including participation interests in eligible loans) and guaranteed securities primarily by issuing debt obligations of various maturities in the public capital markets. The proceeds of debt issuance are also used to fund liquidity investments that must comply with policies adopted by Farmer Mac's board of directors and with FCA regulations, which establish limitations on dollar amount, issuer concentration, and credit quality. Those regulations can be found at 12 C.F.R. §§ 652.1-652.45 (the "Liquidity and Investment Regulations"). Farmer Mac's regular debt issuance supports its access to the capital markets, and Farmer Mac's liquidity investment assets provide an alternative source of funds should market conditions be unfavorable. As of
December 31, 2012
, Farmer Mac had
$5.0 billion
of discount notes and
$6.6 billion
of medium-term notes outstanding. For more information about Farmer Mac's eligible loan assets and liquidity investment assets, as well as its financial performance and sources of capital and liquidity, see "Management's Discussion and Analysis of Financial Condition and Results of Operations."
Secondary Market
Farmer Mac's activities are intended to provide lenders with an efficient and competitive secondary market that enhances these lenders' ability to offer competitively-priced financing to rural borrowers. This secondary market is designed to increase the availability of long-term credit at stable interest rates to America's rural communities and to provide those borrowers with the benefits of capital markets pricing and product innovation. The Farmer Mac secondary market functions as a bridge between the national capital markets and the agricultural and rural credit markets by attracting new capital for financing rural borrowers. Farmer Mac's purchases of eligible loans and obligations secured by eligible loans, as well as Farmer Mac's guaranteed securities sold to third party investors, increase lenders' liquidity and lending capacity, and provide a continuous source of funding for lenders that extend credit to agricultural borrowers, rural borrowers, and rural utilities cooperatives.
Farmer Mac's LTSPCs for eligible loans, as well as Farmer Mac's guaranteed securities that are retained by the lender for loans that are securitized, result in lower regulatory capital requirements for the lender, as well as reduced borrower or commodity concentration exposure for some lenders, thereby expanding their lending capacity. By increasing the efficiency and competitiveness of rural finance, the Farmer Mac secondary market has the potential to lower the interest rates paid on loans by rural borrowers.
The current economic and regulatory environment presents Farmer Mac with opportunities to market a mix of products to rural lenders in need of capital, liquidity, long-term fixed rate products, and portfolio diversification. As part of its outreach strategy, Farmer Mac listens to current and prospective rural lenders to identify their specific needs, with an emphasis on face-to-face contact at state and national banking conferences, lender road shows, and individual lender meetings. Farmer Mac seeks to maximize the use of technology to support these business development efforts.
Lines of Business
Farmer Mac conducts its secondary market activities through three lines of business – Farm & Ranch (Farmer Mac I), USDA Guarantees (Farmer Mac II), and Rural Utilities. The loans eligible for the Farmer Mac secondary market include:
|
•
|
mortgage loans secured by first liens on agricultural real estate and rural housing (encompassing the Farm & Ranch line of business);
|
5
|
•
|
agricultural and rural development loans guaranteed by the United States Department of Agriculture ("USDA") (encompassing the USDA Guarantees line of business); and
|
|
•
|
loans made by cooperative lenders to finance electrification and telecommunications systems in rural areas (encompassing the Rural Utilities line of business).
|
As of
December 31, 2012
, the total outstanding amount of the eligible loans included in all of Farmer Mac's lines of business was
$13.0 billion
.
Farm & Ranch (Farmer Mac I)
Under the Farm & Ranch line of business, Farmer Mac purchases or commits to purchase eligible mortgage loans secured by first liens on agricultural real estate. Farmer Mac also guarantees securities representing interests in, or obligations secured by, pools of eligible mortgage loans secured by first liens on agricultural real estate. To be eligible, loans must meet Farmer Mac's credit underwriting, collateral valuation, documentation, and other specified standards that are discussed in "Business—Farmer Mac Lines of Business—Farm & Ranch." The securities guaranteed by Farmer Mac under this line of business are referred to as "Farmer Mac I Guaranteed Securities." As of
December 31, 2012
, outstanding loans held by Farmer Mac and loans that either backed Farmer Mac I Guaranteed Securities or were subject to LTSPCs totaled
$9.1 billion
in the Farm & Ranch line of business.
USDA Guarantees (Farmer Mac II)
Under the USDA Guarantees line of business, Farmer Mac II LLC, a subsidiary of Farmer Mac, purchases the portions of certain agricultural, rural development, business and industry, and community facilities loans guaranteed by the USDA under the Consolidated Farm and Rural Development Act (7 U.S.C. §§ 1921 et seq.). Farmer Mac refers to these USDA-guaranteed portions of loans as "USDA Guaranteed Securities." Farmer Mac II LLC also purchases USDA Guaranteed Securities in exchange for issuing securities to third parties backed by those USDA Guaranteed Securities, which are then also guaranteed by Farmer Mac ("Farmer Mac II Guaranteed Securities"). As of
December 31, 2012
, outstanding USDA Guaranteed Securities and Farmer Mac II Guaranteed Securities totaled
$1.6 billion
, of which
$55.9 million
were Farmer Mac II Guaranteed Securities.
Rural Utilities
Farmer Mac initiated the Rural Utilities line of business in 2008 after Congress expanded Farmer Mac's authorized secondary market activities to include rural utilities loans. Farmer Mac's authorized activities under this line of business are similar to those conducted under the Farm & Ranch line of business – purchases of, and guarantees of securities ("Farmer Mac Guaranteed Securities – Rural Utilities") backed by, eligible rural utilities loans. To be eligible, loans must meet Farmer Mac's credit underwriting, and other specified standards that are discussed in "Business—Farmer Mac Lines of Business—Rural Utilities." Although Farmer Mac has the ability to provide LTSPCs in the Rural Utilities line of business, none have been issued to date. As of
December 31, 2012
, the aggregate outstanding principal balance of rural utilities loans held and Farmer Mac Guaranteed Securities – Rural Utilities was
$2.3 billion
.
6
Farmer Mac Guaranteed Securities
Farmer Mac I Guaranteed Securities, Farmer Mac II Guaranteed Securities, and Farmer Mac Guaranteed Securities – Rural Utilities are sometimes collectively referred to as "Farmer Mac Guaranteed Securities." The assets underlying Farmer Mac Guaranteed Securities include (1) loans, loan participation interests, or USDA Guaranteed Securities eligible under one of Farmer Mac's lines of business and (2) general obligations of lenders secured by pools of eligible loans. Farmer Mac guarantees the timely payment of principal and interest on the resulting Farmer Mac Guaranteed Securities. Farmer Mac may retain Farmer Mac Guaranteed Securities in its portfolio or sell them to third parties. AgVantage
®
is a registered trademark of Farmer Mac used to designate Farmer Mac's guarantees of securities related to general obligations of lenders that are secured by pools of eligible loans. AgVantage securities are currently issued under the Farm & Ranch and Rural Utilities lines of business.
Competition
Farmer Mac is the only Congressionally-chartered corporation established to provide a secondary market for agricultural mortgage loans, rural utilities loans, and USDA Guaranteed Securities. However, Farmer Mac does face indirect competition from a variety of sources. Historically, these sources have included other financial institutions that purchase, retain, or securitize the types of loans eligible for Farmer Mac's secondary market activities, including commercial and investment banks, insurance companies, and other FCS institutions. Farmer Mac also competes indirectly with originators of eligible loans who would prefer to retain the loans they originate rather than sell them into the secondary market. Farmer Mac is able to compete to acquire eligible loans due to the variety of products it offers and its ability to offer low-cost funding to its customers. This enables Farmer Mac to offer flexible financing options and products designed to meet the variety of needs faced by lending institutions related to capital requirements, liquidity, credit risk, and management of sector and geographic concentrations and borrower exposures. However, the relative competitiveness of Farmer Mac's loan rates is affected by other lending institutions that are able to subsidize their rates on the loan products with which Farmer Mac competes by price averaging with other types of loans or by low-return use of equity. Farmer Mac's ability to develop business with lending institutions is also affected by changes in the levels of available capital and liquidity of those institutions, the existence of alternative sources of funding and credit enhancement for those institutions, the rate of growth in the market for eligible loans, and demand for Farmer Mac's products.
Farmer Mac's competitive position is also affected by the willingness of originators to offer eligible loans for sale in the secondary market, as well as the types and variety of products offered by Farmer Mac's competitors to meet the needs of Farmer Mac's customer base. Farmer Mac's limits on borrower exposure and loan size, as well as the types of loans that Farmer Mac is authorized to purchase, also affect Farmer Mac's competitive position. Farmer Mac's ability to obtain low-cost funding in the debt markets is essential to its ability to maintain its competitive position with its customers. As a result, competition for debt investors with other debt-issuing institutions, such as the FCS, Federal Home Loan Banks, Fannie Mae, Freddie Mac, and highly-rated financial institutions, can impact the price and volume at which Farmer Mac issues debt and, consequently, its ability to offer savings to its customers in the form of competitive products.
7
Capital and Corporate Governance
Farmer Mac's basic capital and corporate governance structure is prescribed in its charter. The charter authorizes Farmer Mac to issue two classes of voting common stock that each elects one-third of Farmer Mac's 15-person board of directors, as well as non-voting common stock. The classes of Farmer Mac's common stock that are currently outstanding and their relation to Farmer Mac's board of directors are described below.
|
•
|
Class A voting common stock
. The charter restricts ownership of Farmer Mac's Class A voting common stock to banks, insurance companies, and other financial institutions or similar entities that are not institutions of the FCS. The charter also provides that five members of Farmer Mac's 15-member board of directors are elected by a plurality of the votes of the Class A stockholders each year. The charter limits the amount of Class A voting common stock that may be owned by one holder to no more than 33 percent of the outstanding shares of Class A voting common stock. Farmer Mac is not aware of any regulation applicable to non-FCS financial institutions that requires a minimum investment in Farmer Mac Class A voting common stock or that prescribes a maximum amount lower than the 33 percent limit set forth in the charter. Farmer Mac's Class A voting common stock is listed on the New York Stock Exchange under the symbol AGM.A.
|
|
•
|
Class B voting common stock
. The charter restricts ownership of Farmer Mac's Class B voting common stock to FCS institutions and also provides that five members of Farmer Mac's 15-member board of directors are elected by a plurality of the votes of the Class B stockholders each year. The charter does not contain any restrictions on the maximum number or percentage of outstanding shares of Class B voting common stock that may be held by an eligible stockholder, and Farmer Mac is not aware of any regulation applicable to FCS institutions that requires a minimum investment in Farmer Mac Class B voting common stock or that prescribes a maximum amount. Farmer Mac's Class B voting common stock, which has a limited market and trades infrequently, is not listed or quoted on any exchange or other quotation system, and Farmer Mac is not aware of any publicly available quotations or prices for this class of common stock.
|
|
•
|
Class C non-voting common stock
. The charter does not impose any ownership restrictions on Class C non-voting common stock, and shares of this class are freely transferable. Holders of the Class C common stock do not vote on the election of directors or any other matter. Farmer Mac's Class C non-voting common stock is listed on the New York Stock Exchange under the symbol AGM.
|
|
•
|
Presidential director appointments
. The remaining five members of Farmer Mac's board of directors are individuals who meet the qualifications specified in the charter and are appointed by the President of the United States with the advice and consent of the United States Senate. These appointed directors serve at the pleasure of the President of the United States.
|
The ownership of Farmer Mac's two classes of voting common stock is currently concentrated in a small number of institutions. Approximately 45 percent of the Class A voting common stock is held by three financial institutions, with 31 percent held by one institution. Approximately 97 percent of the Class B voting common stock is held by five FCS institutions (two of which are related to each other through a parent-subsidiary relationship). Farmer Mac believes that the concentration in the Class A voting common stock is a by-product of trading activity in the stock over time and is not by design under the charter or any regulatory mandate. Farmer Mac believes that the concentration in such a small number of holders of
8
Class B voting common stock is a by-product of the limited number of eligible holders of that stock and the structure of the FCS, the number of institutions of which has decreased over time as a result of mergers.
The dividend and liquidation rights of all three classes of the Corporation's common stock are the same. Dividends may be paid on Farmer Mac's common stock only when, as, and if declared by the Corporation's board of directors in its sole discretion, subject to the payment of dividends on any outstanding preferred stock issued by Farmer Mac. Upon liquidation, dissolution, or winding up of the business of Farmer Mac, after payment and provision for payment of outstanding debt of the Corporation, the holders of shares of Farmer Mac's currently outstanding series of preferred stock would be paid at par value out of assets available for distribution, plus all declared and unpaid dividends, before the holders of shares of common stock received any payment. The assets of Farmer Mac II LLC are not directly available to satisfy the claims of Farmer Mac's creditors or stockholders. Those assets will only be available to the creditors and stockholders of Farmer Mac after all obligations owed to creditors of and equity holders in Farmer Mac II LLC have been satisfied. Farmer Mac II LLC's preferred stock is permanent equity of Farmer Mac II LLC and presented as "Non-controlling interest - preferred stock" within total equity on Farmer Mac's consolidated balance sheets. See "Market for Registrant's Common Equity, Related Stockholder Matters, and Issuer Purchases of Equity Securities" for more information regarding Farmer Mac's common stock. See "Business—Farmer Mac Lines of Business—Financing—Equity Issuance" for information regarding Farmer Mac's preferred stock.
Unlike some other GSEs, specifically other FCS institutions and the Federal Home Loan Banks, Farmer Mac is not structured as a cooperative owned exclusively by member institutions and established to provide services exclusively to its members. Rather, Farmer Mac, as a publicly-traded corporation, has a broader base of stockholders, including those who do not directly participate in Farmer Mac's secondary market, and therefore, Farmer Mac seeks to fulfill its mission of serving the financing needs of agriculture and rural America in a manner that is consistent with providing a return on the investment of its stockholders.
Farmer Mac's policy is to require financial institutions to own a requisite amount of Farmer Mac common stock, based on the size and type of institution, to participate in the Farm & Ranch line of business. As a result of this requirement, coupled with the ability of holders of Class A and Class B voting common stock to elect two-thirds of Farmer Mac's board of directors, Farmer Mac regularly conducts business with "related parties," including institutions affiliated with members of Farmer Mac's board of directors and institutions that own large amounts of Farmer Mac's voting common stock. Farmer Mac has adopted a Code of Business Conduct and Ethics that governs any conflicts of interest that may arise in these transactions, and Farmer Mac's policy is to require that any transactions with related parties be conducted in the ordinary course of business, with terms and conditions comparable to those available to any other counterparty not related to Farmer Mac. For more information about related party transactions, see "Management's Discussion and Analysis of Financial Condition and Results of Operations—Results of Operations—Related Party Transactions" and Note 3 to the consolidated financial statements.
9
Regulatory Oversight
Farmer Mac's charter assigns to FCA, acting through the separate Office of Secondary Market Oversight ("OSMO") within FCA, the responsibility for the examination and the general supervision of the safe and sound performance of the powers, functions, and duties vested in Farmer Mac by the charter. The charter also authorizes FCA, acting through OSMO, to apply its general enforcement powers to Farmer Mac. Farmer Mac (including its subsidiaries) is the only entity regulated by OSMO, which was created as a separate office in recognition of the different role that Farmer Mac plays in providing a secondary market, as compared to the roles of other FCS institutions as primary lenders. The Director of OSMO is selected by, and reports to, the FCA board. The FCA board approves the policies, regulations, charters, and enforcement activities applicable to other FCS institutions, which are the only eligible holders of Farmer Mac's Class B voting common stock. FCA has no regulatory authority over the financial institutions that are the eligible holders of Farmer Mac's Class A voting common stock.
Farmer Mac's charter requires an annual examination of the financial transactions of Farmer Mac and authorizes FCA to assess Farmer Mac for the cost of FCA's regulatory activities, including the cost of any examination. Each year, OSMO conducts an examination of Farmer Mac to evaluate its safety and soundness, compliance with applicable laws and regulations, and mission achievement. The examination includes a review of Farmer Mac's capital adequacy, asset quality, management performance, earnings, liquidity, and sensitivity to interest rate risk. Farmer Mac is also required to file quarterly reports of condition with OSMO. In addition, as a publicly-traded corporation, Farmer Mac is required to comply with the periodic reporting requirements of the U.S. Securities and Exchange Commission (the "SEC"). For a more detailed discussion of Farmer Mac's regulatory and governmental relationships, see "—Government Regulation of Farmer Mac."
Regulatory Capital
Farmer Mac's charter establishes three capital standards for the Corporation – minimum capital, critical capital, and risk-based capital. Farmer Mac is required to comply with the higher of the minimum capital requirement and the risk-based capital requirement. For a discussion of Farmer Mac's capital requirements and its actual capital levels, and particularly FCA's role in the establishment and maintenance of those requirements and levels, see "—Government Regulation of Farmer Mac—Regulation—Capital Standards," "Management's Discussion and Analysis of Financial Condition and Results of Operations—Balance Sheet Review—Equity," "Management's Discussion and Analysis of Financial Condition and Results of Operations—Liquidity and Capital Resources—Capital Requirements" and "Management's Discussion and Analysis of Financial Condition and Results of Operations—Regulatory Matters."
Employees and Property
As of December 31, 2012, Farmer Mac employed 64 people, located primarily at its principal executive offices at 1999 K Street, N.W., 4th Floor, Washington, D.C. 20006. Farmer Mac also maintains an office at 5408 NW 88
th
Street, Suite 120, Johnston, Iowa 50131. Farmer Mac's main telephone number is (202) 872-7700.
10
Available Information
Farmer Mac makes available free of charge, through the "Investors" section of its internet website at www.farmermac.com, copies of materials it files with, or furnishes to, the SEC, including its Annual Reports on Form 10-K, Quarterly Reports on Form 10-Q, Current Reports on Form 8-K, proxy statements, and amendments, if any, to those filings, as soon as reasonably practicable after electronically filing those materials with, or furnishing those materials to, the SEC. Please note that all references to www.farmermac.com in this Annual Report on Form 10-K are inactive textual references only. The information contained on Farmer Mac's website is not incorporated by reference into this Annual Report on Form 10-K.
11
FARMER MAC LINES OF BUSINESS
The following tables present the outstanding balances and new business volume under Farmer Mac's three lines of business – Farm & Ranch (Farmer Mac I), USDA Guarantees (Farmer Mac II), and Rural Utilities:
|
Outstanding Balance of Loans, Loans Underlying Farmer Mac
|
|||||||
|
Guaranteed Securities and LTSPCs, and USDA Guaranteed Securities
|
|||||||
|
As of December 31,
|
|||||||
|
|
2012
|
2011
|
|||||
|
|
(in thousands)
|
||||||
|
On-balance sheet:
|
|
|
|||||
|
Farm & Ranch:
|
|
|
|||||
|
Loans
|
$
|
1,519,415
|
|
$
|
1,251,370
|
|
|
|
Loans held in trusts:
|
|||||||
|
Beneficial interests owned by Farmer Mac
|
39
|
|
181
|
|
|||
|
Beneficial interests owned by third party investors
|
160,397
|
|
696,554
|
|
|||
|
Farmer Mac Guaranteed Securities - AgVantage
|
3,339,200
|
|
2,741,000
|
|
|||
|
USDA Guarantees:
|
|||||||
|
USDA Guaranteed Securities
|
1,559,683
|
|
1,435,679
|
|
|||
|
Farmer Mac Guaranteed Securities
|
26,238
|
|
35,410
|
|
|||
|
Rural Utilities:
|
|||||||
|
Loans
|
663,097
|
|
529,227
|
|
|||
|
Loans held in trusts:
|
|||||||
|
Beneficial interests owned by Farmer Mac
|
368,848
|
|
386,800
|
|
|||
|
Farmer Mac Guaranteed Securities - AgVantage
|
1,298,506
|
|
1,410,800
|
|
|||
|
Total on-balance sheet
|
$
|
8,935,423
|
|
$
|
8,487,021
|
|
|
|
Off-balance sheet:
|
|
|
|
|
|||
|
Farm & Ranch:
|
|
|
|
|
|||
|
Farmer Mac Guaranteed Securities - AgVantage
|
$
|
970,000
|
|
$
|
970,000
|
|
|
|
LTSPCs
|
2,156,068
|
|
1,776,051
|
|
|||
|
Farmer Mac Guaranteed Securities
|
911,370
|
|
621,871
|
|
|||
|
USDA Guarantees:
|
|||||||
|
Farmer Mac Guaranteed Securities
|
29,658
|
|
42,088
|
|
|||
|
Rural Utilities:
|
|||||||
|
Farmer Mac Guaranteed Securities - AgVantage
|
12,669
|
|
16,271
|
|
|||
|
Total off-balance sheet
|
$
|
4,079,765
|
|
$
|
3,426,281
|
|
|
|
Total
|
$
|
13,015,188
|
|
$
|
11,913,302
|
|
|
12
|
Farmer Mac Loan Purchases, Guarantees, and LTSPCs
|
|||||||||||
|
|
For the Year Ended December 31,
|
||||||||||
|
|
2012
|
2011
|
2010
|
||||||||
|
|
(in thousands)
|
||||||||||
|
Farm & Ranch:
|
|
|
|||||||||
|
Loans
|
$
|
570,346
|
|
$
|
495,455
|
|
$
|
382,669
|
|
||
|
LTSPCs
|
744,110
|
|
471,994
|
|
263,741
|
|
|||||
|
Farmer Mac Guaranteed Securities - AgVantage
|
601,000
|
|
1,801,500
|
|
900,000
|
|
|||||
|
USDA Guarantees:
|
|||||||||||
|
USDA Guaranteed Securities
|
479,324
|
|
404,445
|
|
437,751
|
|
|||||
|
Farmer Mac Guaranteed Securities
|
5,327
|
|
3,268
|
|
20,124
|
|
|||||
|
Rural Utilities:
|
|||||||||||
|
Loans
|
166,117
|
|
203,789
|
|
313,028
|
|
|||||
|
Farmer Mac Guaranteed Securities - AgVantage
|
383,406
|
|
2,796
|
|
652,924
|
|
|||||
|
Total purchases, guarantees, and commitments
|
$
|
2,949,630
|
|
$
|
3,383,247
|
|
$
|
2,970,237
|
|
||
For additional financial information about Farmer Mac's lines of business, each of which is a reportable operating segment of Farmer Mac, see Note 14 to the consolidated financial statements. The following sections describe Farmer Mac's activities under each line of business.
Farm & Ranch (Farmer Mac I)
Under the Farm & Ranch line of business, Farmer Mac assumes the credit risk on agricultural real estate and rural housing mortgage loans by (1) purchasing and retaining eligible mortgage loans, (2) guaranteeing the timely payment of principal and interest on securities representing interests in, or obligations secured by, pools of eligible mortgage loans, or (3) providing LTSPCs to acquire designated eligible mortgage loans. Farmer Mac is compensated for these activities through net effective spread on loans and Farmer Mac Guaranteed Securities held on balance sheet, guarantee fees earned on Farmer Mac Guaranteed Securities, and commitment fees earned on loans in LTSPCs.
Loan Eligibility
To be eligible for the Farm & Ranch line of business, a loan is required to:
|
•
|
be secured by a fee simple mortgage or a long-term leasehold mortgage, with status as a first lien on agricultural real estate or rural housing (as defined below) located within the United States;
|
|
•
|
be an obligation of a citizen or national of the United States, an alien lawfully admitted for permanent residence in the United States, or a private corporation or partnership that is majority-owned by U.S. citizens, nationals, or legal resident aliens;
|
|
•
|
be an obligation of a person, corporation, or partnership having training or farming experience that is sufficient to ensure a reasonable likelihood that the loan will be repaid according to its terms; and
|
|
•
|
meet the credit underwriting, collateral valuation, documentation, and other specified standards for the Farm & Ranch line of business. See "—Underwriting and Collateral Valuation (Appraisal) Standards" and "—Approved Lenders" for a description of these standards.
|
13
Eligible agricultural real estate consists of one or more parcels of land, which may be improved by permanently affixed buildings or other structures, that:
|
•
|
is used for the production of one or more agricultural commodities or products; and
|
|
•
|
either consists of a minimum of five acres or generates minimum annual receipts of $5,000.
|
Farmer Mac's charter authorizes a maximum loan size (adjusted annually for inflation) for an eligible Farm & Ranch loan secured by more than 1,000 acres of agricultural real estate. That maximum loan size was $10.1 million as of December 31, 2012 and increased to $11.0 million as of January 1, 2013. Although the charter does not prescribe a maximum loan size or a total borrower exposure for an eligible Farm & Ranch loan secured by 1,000 acres or less of agricultural real estate, Farmer Mac currently limits the size of those loans to:
|
•
|
$30.0 million for transactions involving direct exposure to credit risk on loans (e.g., loan purchases, LTSPC transactions, and non-AgVantage Farmer Mac I Guaranteed Securities, which are not backed by a general obligation of a lender); and
|
|
•
|
$75.0 million in AgVantage transactions, which involve the general obligation of a lender that is in turn secured by eligible loans, resulting in indirect exposure to credit risk on those loans.
|
Farmer Mac includes the rural housing loans in its portfolio in its Farm & Ranch line of business. For the rural housing portion of this line of business, an eligible loan must be secured by a mortgage on a one- to four-family, owner-occupied, moderately priced principal residence located in a community with a population of 2,500 or fewer. The current maximum purchase price or current appraised value for a dwelling, excluding the land to which the dwelling is affixed, that secures a rural housing loan is $269,807. That limit is adjusted annually based on changes in home values during the previous year. In addition to the dwelling itself, an eligible rural housing loan can be secured by land associated with the dwelling having an appraised value of no more than 50 percent of the total appraised value of the combined property. Rural housing loans do not represent a significant part of Farmer Mac's business, with a total of $3.8 million of those loans in Farmer Mac's portfolio as of December 31, 2012.
Summary of Farm & Ranch Transactions
During the year ended
December 31, 2012
, Farmer Mac purchased or placed under guarantees or LTSPCs
$1.9 billion
of newly originated or current seasoned loans under the Farm & Ranch line of business. As of
December 31, 2012
, loans held and loans underlying Farmer Mac I Guaranteed Securities and LTSPCs in this line of business totaled
$9.1 billion
.
During
2012
, Farmer Mac purchased eligible loans from
159
entities (the top ten institutions generated
53.9 percent
of the purchase volume) and placed loans under LTSPCs with
33
entities. During
2011
, Farmer Mac purchased eligible loans from
111
entities (the top ten institutions generated
66.4 percent
of the purchase volume) and placed loans under LTSPCs with
22
entities. During
2010
, Farmer Mac purchased eligible loans from
72
entities (the top ten institutions generated
77.5 percent
of the purchase volume) and placed loans under LTSPCs with
16
entities.
14
The following table summarizes loans purchased or newly placed under guarantees or LTSPCs under the Farm & Ranch line of business for each of the years ended
December 31, 2012
,
2011
, and
2010
:
|
|
For the Year Ended December 31,
|
||||||||||
|
|
2012
|
2011
|
2010
|
||||||||
|
|
(in thousands)
|
||||||||||
|
Loans
|
$
|
570,346
|
|
$
|
495,455
|
|
$
|
382,669
|
|
||
|
LTSPCs
|
744,110
|
|
471,994
|
|
263,741
|
|
|||||
|
Farmer Mac Guaranteed Securities - AgVantage
|
601,000
|
|
1,801,500
|
|
900,000
|
|
|||||
|
Total
|
$
|
1,915,456
|
|
$
|
2,768,949
|
|
$
|
1,546,410
|
|
||
The following table presents the outstanding balances of Farm & Ranch loans held, loans held in trusts, and loans underlying Farmer Mac I Guaranteed Securities and LTSPCs as of the dates indicated:
|
|
As of December 31,
|
||||||
|
|
2012
|
2011
|
|||||
|
|
(in thousands)
|
||||||
|
On-balance sheet:
|
|
|
|||||
|
Loans
|
$
|
1,519,415
|
|
$
|
1,251,370
|
|
|
|
Loans held in trusts:
|
|||||||
|
Beneficial interests owned by Farmer Mac
|
39
|
|
181
|
|
|||
|
Beneficial interests owned by third party investors
|
160,397
|
|
696,554
|
|
|||
|
Farmer Mac Guaranteed Securities - AgVantage
|
3,339,200
|
|
2,741,000
|
|
|||
|
Total on-balance sheet
|
$
|
5,019,051
|
|
$
|
4,689,105
|
|
|
|
Off-balance sheet:
|
|
|
|
|
|||
|
Farmer Mac Guaranteed Securities - AgVantage
|
$
|
970,000
|
|
$
|
970,000
|
|
|
|
LTSPCs
|
2,156,068
|
|
1,776,051
|
|
|||
|
Farmer Mac Guaranteed Securities
|
911,370
|
|
621,871
|
|
|||
|
Total off-balance sheet
|
$
|
4,037,438
|
|
$
|
3,367,922
|
|
|
|
Total
|
$
|
9,056,489
|
|
$
|
8,057,027
|
|
|
Loan Purchases
Farmer Mac offers loan products designed to increase the secondary market liquidity of agricultural real estate mortgage loans and the lending capacity of financial institutions that originate those loans. Farmer Mac enters into mandatory delivery commitments to purchase loans and offers rates for those commitments daily. Farmer Mac also purchases portfolios of newly originated and seasoned loans that are current in payment on a negotiated basis. Farmer Mac purchases both fixed and adjustable rate loans that have a variety of maturities and often include balloon payments. Loans purchased may include provisions that require a yield maintenance payment or some other form of prepayment penalty in the event a borrower prepays a loan (depending upon the level of interest rates at the time of prepayment). Of the
$570.3 million
of loans purchased in the Farm & Ranch line of business during
2012
,
57 percent
included balloon payments and
none
included yield maintenance prepayment protection. By comparison, of the
$495.5 million
of loans purchased in the Farm & Ranch line of business during
2011
,
61 percent
included balloon payments and less than
1 percent
included yield maintenance prepayment protection.
15
Guarantees and Commitments
Farmer Mac offers two credit enhancement alternatives to direct loan purchases through the Farm & Ranch line of business that allow approved lenders the ability to retain the cash flow benefits of their loans and increase their liquidity and lending capacity: (1) LTSPCs and (2) Farmer Mac I Guaranteed Securities. Prior to the adoption of accounting guidance on consolidation on January 1, 2010, both types of transactions resulted in the creation of off-balance sheet obligations for Farmer Mac in the ordinary course of its business. Effective January 1, 2010, securitization trusts where Farmer Mac is the primary beneficiary, as described in Note 2(q) to the consolidated financial statements, are consolidated on-balance sheet and the Farmer Mac I Guaranteed Securities are presented as "Loans held for investment in consolidated trusts." LTSPCs and securitization trusts where Farmer Mac is not the primary beneficiary still result in the creation of off-balance sheet obligations for Farmer Mac. Historically, the only securitization trusts where Farmer Mac has not determined itself to be the primary beneficiary have been trusts containing 100 percent participation interests in loans that comprised an LTSPC pool prior to securitization, and in which the participating institution is not a related party to Farmer Mac. In performing its purchase and guarantee obligations related to LTSPCs and Farmer Mac I Guaranteed Securities, payments made on the underlying loans or participation interests, and in the event of default under the terms of those assets, liquidation of the related collateral, are intended to protect Farmer Mac against losses.
Both types of transactions permit a lender to nominate from its portfolio an identified pool of loans, subject to review by Farmer Mac for conformance with its standards for farm and ranch loans. In both types of transactions, the lender effectively transfers the credit risk on those loans upon Farmer Mac's approval of the eligible loans because, through its guarantee or commitment to purchase, Farmer Mac assumes the ultimate credit risk of borrower defaults on the underlying loans and, in the case of AgVantage securities, issuer default on the underlying obligations that are backed by eligible loans. That transfer of risk reduces the lender's credit and concentration risk exposures and, consequently, its regulatory capital requirements and its loss reserve requirements. The loans and participation interests underlying LTSPCs and Farmer Mac I Guaranteed Securities may include some with payment, maturity, and interest rate characteristics that differ from the loan products that Farmer Mac offers for purchase on a daily basis, but all are subject to the applicable standards described in "—Underwriting and Collateral Valuation (Appraisal) Standards." See also "Management's Discussion and Analysis of Financial Condition and Results of Operations—Risk Management—Credit Risk – Loans."
LTSPCs
. An LTSPC commits Farmer Mac to a future purchase of one or more loans from an identified pool of eligible loans that met Farmer Mac's standards at the time the transaction was entered into and Farmer Mac assumed the credit risk on the loans. The LTSPC structure, which is not a guarantee of loans or securities, permits the lender to retain the loan pool in its portfolio until such time, if ever, as the lender elects to deliver some or all of the loans in the pool to Farmer Mac for purchase under the LTSPC. As consideration for its assumption of the credit risk on loans underlying an LTSPC, Farmer Mac receives commitment fees payable monthly in arrears in an amount approximating what would have been the guarantee fees if the transaction were structured as Farmer Mac I Guaranteed Securities. Farmer Mac offers different options under LTSPC arrangements to meet the credit and liquidity needs of its counterparties. Some LTSPCs provide that the underlying loans can be converted into Farmer Mac I Guaranteed Securities at the option of the seller with no conversion fee paid to Farmer Mac. Some LTSPCs contain risk sharing arrangements that provide for the lender to absorb up to a specified amount (typically between one and three percent of the original principal balance of the loan pool) of any losses incurred on the loans in the pool. As of December 31, 2012 and 2011, approximately 3.0 percent and 2.6
16
percent, respectively, of total Farmer Mac I Guaranteed Securities and LTSPCs contained risk sharing arrangements.
Farmer Mac purchases loans subject to an LTSPC at:
|
•
|
par if the loans become delinquent for either 90 days or 120 days (depending on the agreement) or are in material non-monetary default, with accrued and unpaid interest on the defaulted loans payable out of any future loan payments or liquidation proceeds; or
|
|
•
|
a mark-to-market price or in exchange for Farmer Mac I Guaranteed Securities (if the loans are not delinquent), in accordance with the terms of the applicable agreement.
|
In
2012
, Farmer Mac entered into
$744.1 million
of LTSPCs, compared to
$472.0 million
in
2011
. In 2012, LTSPCs remained the preferred credit enhancement alternative for new off-balance sheet transactions, and they continue to be a significant portion of the Farm & Ranch line of business. During 2011 and 2012, there were no conversions of LTSPCs into Farmer Mac I Guaranteed Securities. As of
December 31, 2012
, Farmer Mac's outstanding LTSPCs covered 4,365 mortgage loans with an aggregate principal balance of
$2.2 billion
. See "Management's Discussion and Analysis of Financial Condition and Results of Operations—Results of Operations—Business Volume."
Farmer Mac I Guaranteed Securities
. In Farmer Mac I Guaranteed Securities transactions, Farmer Mac guarantees securities representing interests in, or obligations secured by, eligible farm and ranch loans or participation interests in those loans held by a trust or other entity. Farmer Mac guarantees the timely payment of interest and principal on the securities, which are either retained by Farmer Mac or sold to third parties. For those securities sold to third parties, the eligible loans or participation interests are often acquired from lenders in exchange for the Farmer Mac I Guaranteed Securities backed by those assets. As consideration for its assumption of the credit risk on the assets underlying the Farmer Mac I Guaranteed Securities, Farmer Mac receives guarantee fees based on the outstanding principal balance of the related securities. The Farmer Mac I Guaranteed Securities representing the general obligations of issuers secured by eligible loans are referred to as AgVantage securities. See "—AgVantage Securities."
Farmer Mac is obligated under its guarantee on the securities to make timely payments to investors of principal (including balloon payments) and interest based on the scheduled payments on the underlying loans or obligations, regardless of whether Farmer Mac or the related trust has actually received those scheduled payments. Farmer Mac's guarantee fees typically are collected out of installment payments made on the underlying loans or obligations until those loans or obligations have been repaid, purchased out of the trust, or otherwise liquidated (generally as a result of default). The aggregate amount of guarantee fees received on Farmer Mac I Guaranteed Securities depends upon the amount of those securities outstanding and on the applicable guarantee fee rate, which Farmer Mac's charter caps at 50 basis points (0.50 percent) per year. The amount of non-AgVantage Farmer Mac I Guaranteed Securities outstanding is influenced by the repayment rates on the underlying loans and by the rate at which Farmer Mac issues new Farmer Mac I Guaranteed Securities, including as a result of conversions from LTSPCs. In general, when the level of interest rates declines significantly below the interest rates on loans underlying Farmer Mac I Guaranteed Securities, the rate of prepayments is likely to increase. Conversely, when interest rates rise above the interest rates on the loans underlying Farmer Mac I Guaranteed Securities, the rate of prepayments is likely to decrease. In addition to changes in interest rates, the timing of principal payments on Farmer Mac I Guaranteed Securities also is influenced by a variety of economic, demographic, and other considerations, such as yield maintenance provisions that may be associated with
17
the underlying loans. For more information about yield maintenance provisions, see "Management's Discussion and Analysis of Financial Condition and Results of Operations—Risk Management—Interest Rate Risk."
Of the $13.0 billion outstanding principal balance of program assets included in Farmer Mac's three lines of business as of December 31, 2012, $5.4 billion were in the form of Farmer Mac I Guaranteed Securities. As of December 31, 2012, the outstanding Farmer Mac I Guaranteed Securities consisted of:
|
•
|
$4.3 billion of Farmer Mac I Guaranteed Securities structured as AgVantage securities, which represent a general obligation of the issuing institution secured by a pledge of eligible loan assets in excess of the principal amount of the securities but do not represent a direct interest in the cash flows of the pledged collateral. See "—AgVantage Securities."
|
|
•
|
$1.1 billion of Farmer Mac I Guaranteed Securities created from the deposit of eligible loan assets into securitization trusts that issue "pass-through" certificates representing interests in the underlying assets. This type of securitization structure may involve the deposit of either whole loans or loan participation interests into the trust.
|
As of December 31, 2012, Farmer Mac had outstanding non-AgVantage Farmer Mac I Guaranteed Securities of $160.4 million that represent interests in whole loans and $911.4 million that represent interests in loan participations as a result of conversions from LTSPCs. Both types of transactions involve the deposit of eligible assets into securitization trusts along with all of the rights under related agreements that provide for, among other things, remedies for any breaches of representations and warranties made by the lender and the servicing of the underlying assets. In each of these transactions, the related trust has issued securities that represent interests in the assets of the trust and that Farmer Mac guarantees as to the timely payment of principal and interest.
For Farmer Mac I Guaranteed Securities that result from the conversion of LTSPCs, a 100 percent participation in the cash flows associated with each loan formerly subject to the LTSPC, rather than the whole loan, is deposited into the securitization trust. These transactions involve loan participations for reasons unique to the counterparties that have elected these conversions, all of whom are members of the FCS. Loans made by FCS institutions to farmers and ranchers have, by statute, specified loan and collateral actions to which borrowers are entitled, known as "borrower rights." Farmer Mac does not have the ability to offer all of the prescribed borrower rights without the involvement of another FCS counterparty. In recognition of this and Farmer Mac's desire not to disrupt the borrower's relationship with the originating FCS lender and expectations about how the loan will be serviced, Farmer Mac developed the participation interest securitization structure for FCS loans with borrower rights. The deposit of participation interests into securitization trusts permits the legal ownership of the related loan to remain with the FCS counterparty, together with the servicing and borrower rights related to the loan. Farmer Mac, in its role as trustee, generally has the right to give or withhold consent to the exercise of remedies as to each related loan. The FCS servicers in these transactions are also the holders of the related Farmer Mac I Guaranteed Securities, which have the same economic benefit to the holder from a cash flow perspective as a securitization of whole loans. See "—Servicing" for more information about the servicing of loans underlying Farmer Mac I Guaranteed Securities.
For the years ended
December 31, 2012
and
2011
, Farmer Mac sold non-AgVantage Farmer Mac I Guaranteed Securities in the amounts of
$38.1 million
and
$25.7 million
, respectively. No gains or losses resulted from these sales in either 2012 or 2011. During 2011 and 2012, there were no conversions of
18
LTSPCs into Farmer Mac I Guaranteed Securities. As of December 31, 2012, Farmer Mac's outstanding non-AgVantage Farmer Mac I Guaranteed Securities, which may or may not be consolidated on-balance sheet depending on the primary beneficiary determination described above, were backed by 4,821
mortgage loans with an aggregate principal balance of $1.1 billion. See "Management's Discussion and Analysis of Financial Condition and Results of Operations—Results of Operations—Business Volume." See "—AgVantage Securities" for information about Farmer Mac's AgVantage transactions, which are a form of Farmer Mac Guaranteed Securities.
AgVantage Securities
Each AgVantage security is a general obligation of an institution approved by Farmer Mac, and that obligation is also secured by a pool of eligible loans under one of Farmer Mac's lines of business. Farmer Mac guarantees those securities as to the timely payment of principal and interest and may retain AgVantage securities in its portfolio or sell them to third parties in the capital markets as Farmer Mac Guaranteed Securities. For information on AgVantage Securities secured by rural utilities loans, see "—Rural Utilities—Summary of Rural Utilities Transactions."
Before approving an institution as an issuer in a Farmer Mac I AgVantage transaction in the Farm & Ranch line of business, Farmer Mac assesses the institution's agricultural real estate mortgage loan performance as well as the institution's creditworthiness. Farmer Mac continues to monitor the counterparty risk assessment on an ongoing basis after the AgVantage security is issued.
In addition to being a general obligation of the issuing institution, each Farmer Mac I AgVantage security must be secured by eligible agricultural real estate mortgage loans in an amount at least equal to the outstanding principal amount of the security. In the Farm & Ranch line of business, Farmer Mac currently requires the general obligation to be overcollateralized, either by more eligible loans or any of the following types of assets:
|
•
|
cash;
|
|
•
|
securities issued by the U.S. Treasury or guaranteed by an agency or instrumentality of the United States; or
|
|
•
|
other highly-rated securities.
|
The required collateralization level for a Farmer Mac I AgVantage security currently ranges from 103 percent to 120 percent, with higher collateralization levels generally required for securities issued by institutions without long-term debt ratings from a nationally recognized statistical rating organization ("NRSRO"). The required collateralization level is established at the time of issuance and does not change during the life of the AgVantage security. See "Management's Discussion and Analysis of Financial Condition and Results of Operations—Risk Management—Credit Risk – Institutional."
In all AgVantage transactions, Farmer Mac can require the issuer to remove from the pool of pledged collateral any loan that becomes more than 30 days delinquent in the payment of principal or interest and to substitute an eligible loan that is current in payment to maintain the minimum required collateralization level. As of December 31, 2012, Farmer Mac had not experienced any credit losses, nor had it been called upon to make a guarantee payment to third parties, on any of its AgVantage securities.
As of
December 31, 2012
and
2011
, the outstanding principal amount of Farmer Mac I AgVantage securities held by Farmer Mac was
$3.3 billion
and
$2.7 billion
, respectively. As of both
December 31,
19
2012
and
2011
, the aggregate outstanding principal amount of off-balance sheet AgVantage securities in the Farm & Ranch line of business totaled
$970.0 million
. See "Management's Discussion and Analysis of Financial Condition and Results of Operations—Results of Operations—Business Volume" and "—Risk Management—Credit Risk – Institutional."
Underwriting and Collateral Valuation (Appraisal) Standards
As required by Farmer Mac's charter, Farmer Mac has established underwriting, security appraisal, and repayment standards for eligible loans taking into account the nature, risk profile, and other differences between different categories of qualified loans. The charter prescribes that the following minimum standards must be applied to agricultural real estate mortgage loans in the Farm & Ranch line of business:
|
•
|
provide that no loan with a loan-to-value ratio ("LTV") in excess of 80 percent may be eligible;
|
|
•
|
require each borrower to demonstrate sufficient cash flow to adequately service the loan;
|
|
•
|
require sufficient documentation standards;
|
|
•
|
protect the integrity of the appraisal process for any loan; and
|
|
•
|
confirm that the borrower is or will be actively engaged in agricultural production.
|
In addition, agricultural mortgage loans on which Farmer Mac assumes direct credit exposure, such as loans purchased, subject to an LTSPC, or underlying non-AgVantage Farmer Mac I Guaranteed Securities, are also typically required to meet the underwriting standards established by Farmer Mac and set forth below. Agricultural mortgage loans on which Farmer Mac assumes indirect credit risk, such as loans that secure AgVantage securities, are required to meet the minimum standards set forth in the charter.
Farmer Mac uses experienced internal agricultural credit underwriters, independent contractors, and loan servicers along with external agricultural loan servicing and collateral valuation contractors to perform those respective functions on farm and ranch loans. Farmer Mac believes that the combined expertise of its own internal staff and those third-party service providers with which the Corporation has contracted, provides the Corporation with adequate resources for performing the necessary underwriting, collateral valuation, and servicing functions.
Underwriting
. To manage its credit risk and to provide guidance for the management, administration, and conduct of underwriting to all participating and potential Farm & Ranch lenders, Farmer Mac has adopted credit underwriting standards that vary by loan type and loan product. Farmer Mac developed these standards based on industry norms for similar mortgage loans and designed them to assess the creditworthiness of the borrower, as well as the risk to Farmer Mac for having assumed the credit risk on those loans. Furthermore, Farmer Mac requires Farm & Ranch lenders to make representations and warranties regarding the conformity of eligible mortgage loans to these standards and any other requirements that Farmer Mac may impose from time to time. Farmer Mac has the ability to require repurchase of the loan upon a material breach of these representations and warranties.
Farmer Mac's credit underwriting standards for non-AgVantage farm and ranch loans require that the original LTV of any loan not exceed 70 percent (or 60 percent in the case of certain Midwestern states in which property values have experienced recent escalation), with the exception that a loan secured by a livestock facility and supported by a contract with an integrator may have an original LTV of up to 80 percent. Rural housing loans and agricultural real estate mortgage loans secured primarily by owner-occupied residences may also have original LTVs of up to 75 percent. The original LTV of a loan is calculated by dividing the loan's principal balance at the time of guarantee, purchase, or commitment by
20
the lower of the appraised value or the purchase price at the date of loan origination or, when available, updated appraised value at the time of guarantee, purchase, or commitment.
In the case of newly-originated farm and ranch loans, Farmer Mac's credit underwriting standards include:
|
•
|
total debt service coverage ratio, including farm and non-farm income, of not less than 1.25;
|
|
•
|
debt-to-asset ratio of 50 percent or less; and
|
|
•
|
ratio of current assets to current liabilities of not less than 1.25.
|
Farmer Mac evaluates and adjusts these standards on an ongoing basis based on current and anticipated market conditions, while adhering closely to its core underwriting standards for repayment capacity, working capital (current ratio), and leverage (debt-to-asset ratio). Farmer Mac also implements interest rate shock tests for adjustable rate farm and ranch loans with initial reset periods of less than five years, Prior to and during the first half of 2012, one of Farmer Mac's underwriting standards for farm and ranch loans was a cash flow debt service coverage ratio on the property securing the loan (property debt coverage ratio) of not less than 1. Based on recent increases in agricultural land values and the fact that many borrowers have income sources and/or income-generating properties other than the property securing the loan in Farmer Mac's portfolio, Farmer Mac believes that a borrower's total debt service coverage ratio and level of working capital are both better indicators of the borrower's ultimate repayment capacity than the borrower's property debt coverage ratio. As a result, in 2012 Farmer Mac eliminated property debt coverage ratio as a separate underwriting standard, and increased the current assets to current liabilities ratio requirement from 1 to 1.25.
Farmer Mac includes its facility loans, such as dairy and ethanol facilities, in its Farm & Ranch line of business. Farmer Mac defines a facility loan as a loan secured by agricultural real estate with building improvements (other than a residence) that contribute more than 60 percent of the appraised value of the property. The credit underwriting standards for facility loans are the same as for farm and ranch loans but more stringent for the total debt service coverage ratio, including farm and non-farm income, of not less than 1.35.
Loans not exceeding $1 million that are secured by eligible collateral with original LTVs not greater than 55 percent made to borrowers with high credit scores and adequate financial resources may be accepted without further underwriting tests being applied.
In addition, Farmer Mac's underwriting standards provide for the acceptance of a loan that, in the judgment of the Farmer Mac underwriter, is a sound loan with a high probability of repayment in accordance with its terms even though the loan does not meet one or more of the underwriting ratios usually required for loans of that type. In those cases, Farmer Mac permits approval of a loan if it:
|
•
|
has compensating strengths, which means it exceeds minimum requirements for one or more of the underwriting standards to a degree that compensates for noncompliance with one or more other standards; and
|
|
•
|
is made to a producer of particular agricultural commodities or products in a segment of agriculture in which such compensating strengths are typical of the financial condition of sound borrowers in that segment.
|
Despite these underwriting approvals based on compensating strengths, no loan will be approved if it does not at least meet all of the minimum standards prescribed by Farmer Mac's charter.
21
Farmer Mac's use of compensating strengths is not intended to provide a basis for waiving or lessening the requirement that eligible mortgage loans under the Farm & Ranch line of business be of consistently high quality. In fact, loans approved on the basis of compensating strengths are fully underwritten and have not demonstrated a significantly different rate of default, or loss following default, than loans that were approved on the basis of conformance with all applicable underwriting ratios. During
2012
, $670.7 million (52.1 percent) of the loans purchased or loans added under LTSPCs were approved based upon compensating strengths ($3.7 million of which had original LTVs of greater than 70 percent). As of
December 31, 2012
, a total of $2.4 billion (50.0 percent) of the outstanding balance of loans held and loans underlying LTSPCs and Farmer Mac I Guaranteed Securities (excluding AgVantage securities) were approved based upon compensating strengths ($141.4 million of which had original LTVs of greater than 70 percent).
In the case of a seasoned loan, Farmer Mac considers sustained historical performance to be a reliable alternative indicator of a borrower's ability to pay the loan according to its terms. In the Farm & Ranch line of business, a seasoned loan generally will be deemed an eligible loan if:
|
•
|
it has been outstanding for at least five years and has an LTV of 60 percent or less;
|
|
•
|
there have been no payments more than 30 days past due during the previous three years; and
|
|
•
|
there have been no material restructurings or modifications for credit reasons during the previous five years.
|
A seasoned loan that has been outstanding for more than one year but less than five years must substantially comply with the applicable underwriting standards for newly originated loans as of the date the loan was originated by the lender. The loan must also have a payment history that shows no payment more than 30 days past due during the three-year period immediately before the date the loan is either purchased by Farmer Mac or made subject to an LTSPC. Farmer Mac does not require that each loan's compliance with the underwriting standards be re-evaluated after Farmer Mac purchases the loan or approves it for inclusion in a pool that backs a guaranteed security or an LTSPC pool.
Farmer Mac performs due diligence before purchasing, guaranteeing securities backed by, or committing to purchase seasoned loans, including:
|
•
|
evaluating loan database information to determine conformity to the criteria set forth in the preceding paragraphs;
|
|
•
|
confirming that loan file data conform to database information;
|
|
•
|
validating supporting credit information in the loan files; and
|
|
•
|
reviewing loan documentation and collateral valuations.
|
Farmer Mac performs these and other due diligence procedures using methods that consider the size, age, leverage, industry sector, and nature of the collateral for the loans.
Agricultural real estate mortgage loans secured primarily by owner-occupied residences and rural housing loans are underwritten to industry norms for conforming loans secured by primary residences, with fully verified repayment capacity and assets and liabilities. Applicants' credit scores are obtained and used in the underwriting process.
22
Required documentation for all loans in the Farm & Ranch line of business includes a first lien mortgage or deed of trust, a written promissory note, and assurance of Farmer Mac's lien position through either a title insurance policy or title opinion from an experienced real estate attorney in geographic areas where title insurance is not the industry practice.
As Farmer Mac develops new credit products, it establishes underwriting guidelines for them. Those guidelines result in industry-specific measures that meet or exceed the statutory underwriting standards and provide Farmer Mac the flexibility to deliver the benefits of a secondary market to farmers, ranchers, and rural homeowners in diverse sectors of the rural economy.
Collateral Valuation Standards
. Farmer Mac has adopted collateral valuation standards for newly originated loans purchased or underlying Farmer Mac I Guaranteed Securities or LTSPCs. Those standards require, among other things, that a current valuation be performed, or has been performed within the preceding 12 months, independently of the credit decision-making process. Farmer Mac generally requires appraisals to conform to the Uniform Standards of Professional Appraisal Practice ("USPAP") promulgated by the Appraisal Standards Board. For AgVantage securities in the Farm & Ranch line of business, Farmer Mac requires either appraisals that conform to the USPAP or similar collateral valuation methods based upon Farmer Mac's evaluation of the lender's collateral valuation protocols and history.
Farmer Mac's collateral valuation standards require that the valuation function be conducted or administered by an individual, meeting specific qualification and competence criteria, who:
|
•
|
is not associated, except by the engagement for the collateral valuation, with the credit underwriters making the loan decision, though the appraiser or evaluator and the credit underwriter may be directly or indirectly employed by a common employer;
|
|
•
|
receives no financial or professional benefit of any kind by virtue of the report content, valuation, or credit decision made, or based on the valuation report; and
|
|
•
|
has no present or contemplated future direct or indirect interest in the property serving or to serve as collateral.
|
Farmer Mac's collateral valuation standards require uniform reporting of reliable and credible opinions of the market value based on analyses of comparable property sales, including consideration of the property's income-producing capacity and, if relevant, the market's response to the cost of improvements, as well as information regarding market trends. For seasoned loans, Farmer Mac obtains collateral valuation updates as considered necessary in its assessment of collateral risk determined in the due diligence process. If a current or updated collateral valuation is required for a seasoned loan, the collateral valuation standards described above would apply.
Portfolio Diversification
It is Farmer Mac's policy to diversify its portfolio of loans held and loans underlying Farmer Mac I Guaranteed Securities and LTSPCs, both geographically and by agricultural commodity/product. Farmer Mac directs its marketing efforts toward agricultural lenders throughout the nation to achieve commodity/product and geographic diversification in its exposure to credit risk. Farmer Mac evaluates its credit exposure in particular geographic regions and commodities/products relative to the total principal amount of all outstanding loans held and loans underlying Farmer Mac I Guaranteed Securities and LTSPCs.
23
Farmer Mac is not obligated to assume credit risk on every loan that meets its underwriting and collateral valuation standards submitted by an eligible participant. Farmer Mac may consider other factors, such as its overall portfolio diversification, commodity and farming forecasts, and risk management objectives, in deciding whether or not to accept a loan as part of the Farm & Ranch line of business. For example, if industry forecasts indicate possible weakness in a geographic area or agricultural commodity or product, Farmer Mac may decide not to purchase or commit to purchase an affected loan as part of managing its overall portfolio exposure to areas of possible heightened risk exposure. Because Farmer Mac effectively assumes the credit risk on all loans under an LTSPC, Farmer Mac's commodity/product and geographic diversification disclosures reflect all loans under LTSPCs and any loans that have been purchased out of LTSPC pools. For information about the diversification of Farmer Mac's existing portfolio, see "Management's Discussion and Analysis of Financial Condition and Results of Operations—Risk Management—Credit Risk – Loans" and Note 8 to the consolidated financial statements.
Approved Lenders
As of December 31, 2012, Farmer Mac had 536 approved lenders eligible to participate in Farmer Mac's Farm & Ranch line of business, ranging from single-office to multi-branch institutions, spanning community banks, FCS institutions, mortgage companies, commercial banks, and insurance companies, compared to 415 eligible approved lenders as of December 31, 2011. In addition to participating directly in the Farm & Ranch line of business, some of the approved lenders facilitate indirect participation by other lenders by managing correspondent networks of lenders from which the approved lenders purchase loans to sell to Farmer Mac. As of December 31, 2012, of the 536 approved lenders eligible to participate, 182 lenders had been active participants in the Farm & Ranch line of business during the previous 12 months by either selling or pooling for purchase commitment at least one loan to Farmer Mac.
To be considered for approval as a participant in the Farm & Ranch line of business, a lender must meet criteria that Farmer Mac establishes. Those criteria include the following requirements:
|
•
|
own a requisite amount of Farmer Mac common stock according to a schedule prescribed for the size and type of institution;
|
|
•
|
have, in the judgment of Farmer Mac, the ability and experience to make or purchase and sell eligible farm and ranch loans and service those loans in accordance with Farmer Mac's requirements either through its own staff or through contractors and originators;
|
|
•
|
maintain a minimum adjusted net worth; and
|
|
•
|
enter into a Seller/Servicer Agreement, which requires compliance with the terms of the Farmer Mac Seller/Servicer Guide, including providing representations and warranties regarding the eligibility of the loans and accuracy of loan data provided to Farmer Mac.
|
Servicing
Farmer Mac generally does not directly service the loans included in the Farm & Ranch line of business, although in some cases Farmer Mac may assume direct servicing for defaulted loans. Farmer Mac serves in the role of master servicer for farm and ranch loans held by Farmer Mac and for whole loans underlying Farmer Mac I Guaranteed Securities (other than AgVantage securities). In that capacity, Farmer Mac contracts with other institutions, known as a central servicers, to undertake the majority of the servicing responsibilities for the loans in accordance with Farmer Mac's specified servicing requirements. For these loans, the central servicer is typically not the same entity as the lender that sold the loans to Farmer Mac,
24
and the originating lenders may retain some direct borrower contacts, referred to as field servicing functions. Field servicers may enter into contracts with Farmer Mac's central servicers that specify the retained servicing functions.
Loans related to the participation interests underlying Farmer Mac I Guaranteed Securities that result from the conversion of LTSPCs are serviced for the benefit of Farmer Mac, as trustee and guarantor, by the FCS institution that participated the loans to Farmer Mac. The servicer of those loans is usually also the holder of the related Farmer Mac I Guaranteed Securities. In those transactions, the FCS servicer is required to service the loans related to the securitized participation interests in a commercially reasonable manner and in substantial compliance with Farmer Mac's servicing requirements for farm and ranch loans. Those servicers are also required to give effect to all statutory borrower rights applicable to the loans and have shared power with Farmer Mac for some servicing actions to ensure this. The loans related to the Farmer Mac I Guaranteed Securities that result from the conversion loans formerly subject to an LTSPC are the only loans included in the Farm & Ranch line of business that are subject to a shared power servicing provision.
Loans underlying LTSPCs and AgVantage securities are serviced by the holders of those loans in accordance with those lenders' servicing procedures, which are reviewed and approved by Farmer Mac before entering into those transactions.
In summary, the substance of all servicing for loans in the Farm & Ranch line of business is performed in a manner consistent with Farmer Mac's servicing requirements, with some special servicing
requirements for the assets underlying Farmer Mac I Guaranteed Securities resulting from LTSPC conversions to accommodate the borrower rights regime unique to loans originated by FCS institutions.
USDA Guarantees (Farmer Mac II)
General
Farmer Mac initiated its USDA Guarantees line of business in 1991 after Congress revised Farmer Mac's charter to provide that:
|
•
|
USDA-guaranteed portions of loans (which Farmer Mac refers to as "USDA Guaranteed Securities") guaranteed under the Consolidated Farm and Rural Development Act (7 U.S.C. § 1921 et seq.) are statutorily included in the definition of loans eligible for Farmer Mac's secondary market programs;
|
|
•
|
USDA Guaranteed Securities are exempted from the credit underwriting, collateral valuation, documentation, and other standards that other loans must meet to be eligible for Farmer Mac's secondary market, and are exempted from any diversification and internal credit enhancement that may be required of pools of other eligible loans; and
|
|
•
|
Farmer Mac is authorized to pool and issue Farmer Mac Guaranteed Securities backed by USDA Guaranteed Securities.
|
Prior to January 2010, all USDA Guaranteed Securities held by Farmer Mac were held in the form of Farmer Mac II Guaranteed Securities. Since January 2010, nearly all purchases of USDA Guaranteed Securities have been made by Farmer Mac II LLC, a subsidiary of Farmer Mac, which operates substantially all of the business related to the USDA Guarantees line of business. Farmer Mac operates only that part of the business that involves the issuance of Farmer Mac II Guaranteed Securities to
25
investors other than Farmer Mac or Farmer Mac II LLC. Although Farmer Mac II LLC may issue securities in these transactions, Farmer Mac II LLC does not guarantee any USDA Securities it holds or any Farmer Mac II Guaranteed Securities issued by Farmer Mac or Farmer Mac II LLC.
Summary of USDA Guarantees Transactions
Farmer Mac guarantees the timely payment of principal and interest on Farmer Mac II Guaranteed Securities backed by USDA Guaranteed Securities. Farmer Mac does not guarantee the repayment of the USDA Guaranteed Securities themselves. In January 2010, Farmer Mac contributed substantially all of the assets comprising the USDA Guarantees line of business, in excess of $1.1 billion, to Farmer Mac's subsidiary, Farmer Mac II LLC. The assets that Farmer Mac contributed to Farmer Mac II LLC consisted primarily of USDA Guaranteed Securities and also included $35.0 million of Farmer Mac II Guaranteed Securities. Farmer Mac did not and will not guarantee the timely payment of principal and interest on the $1.1 billion of contributed USDA Guaranteed Securities. The contributed USDA Guaranteed Securities had previously been presented as "Farmer Mac Guaranteed Securities" on the consolidated balance sheets of Farmer Mac and are now presented as "USDA Guaranteed Securities" on the consolidated balance sheets. The assets of Farmer Mac II LLC will only be available to creditors of Farmer Mac after all obligations owed to creditors of and equity holders in Farmer Mac II LLC have been satisfied.
During the years ended
December 31, 2012
and
2011
, Farmer Mac II LLC purchased approximately
$479.3 million
and
$404.4 million
, respectively, of USDA Guaranteed Securities, all of which were retained on-balance sheet and are presented as "USDA Guaranteed Securities" in the consolidated financial statements. During the years ended
December 31, 2012
,
2011
, and
2010
, Farmer Mac purchased
$5.3 million
,
$3.3 million
and
$22.1 million
, respectively, of USDA Guaranteed Securities. All of the USDA Guaranteed Securities purchased by Farmer Mac in 2012, 2011, and 2010 (which exclude those purchased directly by Farmer Mac II LLC) were securitized and sold to lenders or other investors in the form of Farmer Mac II Guaranteed Securities. During 2012, 2011, and 2010, Farmer Mac and Farmer Mac II LLC conducted USDA Guarantees transactions with 225, 193, and 197 entities, respectively.
As of
December 31, 2012
and
2011
,
$1.6 billion
and
$1.5 billion
, respectively, of Farmer Mac II Guaranteed Securities and USDA Guaranteed Securities were outstanding. The following table presents activity in the USDA Guarantees line of business for each of the years indicated:
|
|
For the Year Ended December 31,
|
||||||||||
|
|
2012
|
2011
|
2010
|
||||||||
|
|
(in thousands)
|
||||||||||
|
Purchased and retained
|
$
|
479,324
|
|
$
|
404,445
|
|
$
|
435,744
|
|
||
|
Purchased and sold
|
5,327
|
|
3,268
|
|
22,131
|
|
|||||
|
Total
|
$
|
484,651
|
|
$
|
407,713
|
|
$
|
457,875
|
|
||
26
The following table presents the outstanding balance of USDA Guaranteed Securities and Farmer Mac II Guaranteed Securities as of the dates indicated:
|
As of December 31,
|
|||||||
|
|
2012
|
2011
|
|||||
|
|
(in thousands)
|
||||||
|
On-balance sheet:
|
|
|
|||||
|
USDA Guaranteed Securities
|
$
|
1,559,683
|
|
$
|
1,435,679
|
|
|
|
Farmer Mac Guaranteed Securities
|
26,238
|
|
35,410
|
|
|||
|
Off-balance sheet:
|
|||||||
|
Farmer Mac Guaranteed Securities
|
29,658
|
|
42,088
|
|
|||
|
Total
|
$
|
1,615,579
|
|
$
|
1,513,177
|
|
|
As of December 31, 2012, Farmer Mac had experienced no credit losses on any of its Farmer Mac II Guaranteed Securities or USDA Guaranteed Securities.
United States Department of Agriculture Guaranteed Loan Programs
The USDA, acting through its various agencies, currently administers the federal rural credit programs first developed in the mid-1930s. The USDA makes direct loans and guarantees portions of loans made and serviced by USDA-qualified lenders for various purposes. The USDA's guarantee is supported by the full faith and credit of the United States. The USDA guarantees up to 95 percent of the principal amount of guaranteed loans. Through its USDA Guarantees line of business, Farmer Mac is one of several competing purchasers of USDA Guaranteed Securities representing the USDA-guaranteed portions of farm ownership loans, farm operating loans, business and industry loans, community facilities loans, and other loans. The guaranteed portions of these loans are fully guaranteed as to principal and interest by the USDA.
USDA Guarantees
. Each USDA guarantee is a full faith and credit obligation of the United States and becomes enforceable if a lender fails to repurchase the portion of the loan that is guaranteed by the USDA from its owner within 30 days after written demand from the owner when:
|
•
|
the borrower under the guaranteed loan is in default not less than 60 days in the payment of any principal or interest due on the USDA-guaranteed portion of the loan; or
|
|
•
|
the lender has failed to remit to the owner the payment made by the borrower on the USDA-guaranteed portion of the loan or any related loan subsidy within 30 days after the lender's receipt of the payment.
|
If the lender does not repurchase the USDA-guaranteed portion as provided above, the USDA is required to purchase the unpaid principal balance of the USDA-guaranteed portion together with accrued interest (including any loan subsidy) to the date of purchase, less the servicing fee, within 30 days after written demand upon the USDA by the owner. While the USDA guarantee will not cover the note interest to the owner on USDA-guaranteed portions accruing after 90 days from the date of the original demand letter of the owner to the lender requesting repurchase, Farmer Mac has established procedures to require prompt demand on the USDA to purchase USDA-guaranteed portions that have not been repurchased by the lender.
27
If, in the opinion of the lender (with the concurrence of the USDA) or in the opinion of the USDA, repurchase of the USDA-guaranteed portion is necessary to service the related guaranteed loan adequately, the owner is required to sell the USDA-guaranteed portion to the lender or USDA for an amount equal to the unpaid principal balance and accrued interest (including any loan subsidy) on such USDA-guaranteed portion less the lender's servicing fee. Federal regulations prohibit the lender from repurchasing USDA-guaranteed portions for arbitrage purposes.
Lenders
. Any lender authorized by the USDA to obtain a USDA guarantee on a loan may participate in Farmer Mac's USDA Guarantees line of business. During 2012, 225 lenders, consisting mostly of community and regional banks, sold USDA Guaranteed Securities to Farmer Mac, compared to 193 lenders that did so during 2011.
Loan Servicing
. The lender on each guaranteed loan is required by regulation to retain the unguaranteed portion of the guaranteed loan, to service the entire underlying guaranteed loan, including the USDA-guaranteed portion, and to remain mortgagee and/or secured party of record. The USDA-guaranteed portion and the unguaranteed portion of the loan are to be secured by the same security with equal lien priority. The USDA-guaranteed portion of a loan cannot be paid later than, or in any way be subordinated to, the related unguaranteed portion.
Rural Utilities
General
In May 2008, Congress expanded Farmer Mac's authority to permit purchases of, and guarantees of securities backed by, rural electric and telephone loans made by cooperative lenders to borrowers who have received or are eligible to receive loans under the Rural Electrification Act of 1936 ("REA"). The REA is administered by the Rural Utilities Service ("RUS"), an agency of the USDA. None of Farmer Mac's business to date under the Rural Utilities line of business has involved telecommunications loans. Farmer Mac's Rural Utilities line of business encompasses purchases of eligible rural utilities loans and guarantees of Farmer Mac Guaranteed Securities – Rural Utilities backed by such loans. Although Farmer Mac could issue LTSPCs for pools of eligible rural utilities loans, no LTSPCs have been issued to date under the Rural Utilities line of business.
Summary of Rural Utilities Transactions
During the year ended
December 31, 2012
, Farmer Mac added
$0.5 billion
of new Rural Utilities business, compared to
$0.2 billion
and
$1.0 billion
for the years ended
December 31, 2011
and
2010
, respectively. As of
December 31, 2012
and
2011
, the aggregate outstanding principal balance of rural utilities loans held and of Farmer Mac Guaranteed Securities – Rural Utilities was
$2.3 billion
.
28
The following table summarizes new Rural Utilities business activity for each of the years ended
December 31, 2012
,
2011
, and
2010
:
|
|
For the Year Ended December 31,
|
||||||||||
|
|
2012
|
2011
|
2010
|
||||||||
|
|
(in thousands)
|
||||||||||
|
On-balance sheet:
|
|
|
|
||||||||
|
Loans
|
$
|
166,117
|
|
$
|
203,789
|
|
$
|
313,028
|
|
||
|
Farmer Mac Guaranteed Securities - AgVantage
|
383,406
|
|
—
|
|
650,000
|
|
|||||
|
Off-balance sheet:
|
|
|
|||||||||
|
Farmer Mac Guaranteed Securities - AgVantage
|
—
|
|
2,796
|
|
2,924
|
|
|||||
|
Total
|
$
|
549,523
|
|
$
|
206,585
|
|
$
|
965,952
|
|
||
The following table presents the outstanding balances of rural utilities loans held and of Farmer Mac Guaranteed Securities – Rural Utilities as of the dates indicated:
|
|
As of December 31,
|
||||||
|
|
2012
|
2011
|
|||||
|
|
(in thousands)
|
||||||
|
On-balance sheet:
|
|||||||
|
Loans
|
$
|
663,097
|
|
$
|
529,227
|
|
|
|
Loans held in trusts:
|
|||||||
|
Beneficial interests owned by Farmer Mac
|
368,848
|
|
386,800
|
|
|||
|
Farmer Mac Guaranteed Securities - AgVantage
|
1,298,506
|
|
1,410,800
|
|
|||
|
Total on-balance sheet
|
$
|
2,330,451
|
|
$
|
2,326,827
|
|
|
|
Off-balance sheet:
|
|
|
|
|
|||
|
Farmer Mac Guaranteed Securities - AgVantage
|
12,669
|
|
16,271
|
|
|||
|
Total
|
$
|
2,343,120
|
|
$
|
2,343,098
|
|
|
As of December 31, 2012, all of the Farmer Mac Guaranteed Securities – Rural Utilities consisted of securities representing either (1) direct interests in eligible rural electric loans or (2) general obligations of the National Rural Utilities Cooperative Finance Corporation ("CFC") secured by eligible rural electric loans. As of December 31, 2012, CFC held 8 percent of Farmer Mac's outstanding Class A voting common stock (5 percent of total voting shares) and 100 percent of Farmer Mac's outstanding Series C Non-Voting Cumulative Preferred Stock ("Series C Preferred Stock"), which was redeemed in its entirety in January 2013 with the proceeds of Farmer Mac's issuance of 2.4 million shares of non-cumulative preferred stock, of which CFC purchased at issuance 1.2 million shares.
Loan Eligibility
To be eligible for Farmer Mac's Rural Utilities line of business, a rural utilities loan (or an interest in such a loan) is required to:
|
•
|
be for an electric or telephone facility by a cooperative lender to a borrower that has received or is eligible to receive a loan under the REA;
|
|
•
|
be performing and not more than 30 days delinquent; and
|
|
•
|
meet Farmer Mac's underwriting standards described in more detail below.
|
29
Underwriting
Farmer Mac's charter does not specify minimum underwriting criteria for eligible rural utilities loans under the Rural Utilities line of business. To manage its credit risk, to mitigate the risk of loss from borrower defaults, and to provide guidance for the management, administration, and conduct of underwriting to participants in the Rural Utilities line of business, Farmer Mac has adopted credit underwriting standards that vary by loan type, based on whether loans are made to electric distribution cooperatives or electric generation and transmission ("G&T") cooperatives, and by loan product. These standards are based on industry norms for similar rural utilities loans and are designed to assess the creditworthiness of the borrower, as well as the risk to Farmer Mac depending on whether direct or indirect credit exposure is assumed on the loan. Farmer Mac reviews lenders' credit submissions and analyzes borrowers' audited financial statements and financial and operating reports filed with RUS and the Federal Energy Regulatory Commission to confirm that loans meet Farmer Mac's underwriting standards for rural utilities loans. Furthermore, Farmer Mac requires sellers of rural utilities loans to make representations and warranties regarding the conformity of eligible loans to these standards and any other requirements that Farmer Mac may impose from time to time. Farmer Mac has the ability to require repurchase of the loan upon a material breach of these representations and warranties.
Farmer Mac has developed different underwriting standards for rural utilities loans that depend on whether direct or indirect credit exposure is assumed on a loan and whether the borrower is an electric distribution cooperative or a G&T cooperative. Farmer Mac's credit underwriting standards for all rural utilities loans on which it assumes direct credit exposure (i.e., with no general obligation of a lender involved in the transaction) require:
|
•
|
each electric or telephone cooperative to have received or be eligible to receive a loan under the REA;
|
|
•
|
each borrower to demonstrate sufficient cash flow to adequately service the loan; and
|
|
•
|
each borrower's leverage position to be adequate based on industry standards.
|
In the case of a newly-originated loan to a distribution cooperative on which Farmer Mac assumes direct credit exposure, the borrower typically must, among other criteria set forth in Farmer Mac's credit underwriting standards, meet the following ratios (based on the average of the most recent three years):
|
•
|
the ratio of long-term debt to "net utility plant" does not exceed 90 percent;
|
|
•
|
the modified debt service coverage ratio equals or exceeds 1.35; and
|
|
•
|
the ratio of equity to total assets equals or exceeds 20 percent.
|
The "net utility plant" means the real and tangible personal property of a rural utilities borrower constituting the long-term assets of property, plant, and equipment (PPE), less depreciation, computed in accordance with applicable accounting requirements.
In the case of a newly-originated loan to a G&T cooperative on which Farmer Mac assumes direct credit exposure, the borrower typically must, among other criteria set forth in Farmer Mac's credit underwriting standards, meet the following ratios (based on the average of the most recent three years):
|
•
|
the equity to total assets ratio equals or exceeds 10 percent;
|
|
•
|
the modified debt service coverage ratio equals or exceeds 1.15;
|
30
|
•
|
the debt to EBITDA (earnings before income taxes, depreciation and amortization) ratio does not exceed 12; and
|
|
•
|
the aggregate members' equity to total capitalization ratio equals or exceeds 25 percent.
|
Farmer Mac's credit underwriting standards for all AgVantage transactions under the Rural Utilities line of business, in which Farmer Mac has indirect credit exposure on loans securing the general obligation of a lender, require:
|
•
|
the credit rating of the counterparty issuing the general obligation to be at least investment grade as determined by an NRSRO, or equivalent as determined by Farmer Mac analysis;
|
|
•
|
the collateral to be comprised of loans, or interests in loans, for electric or telephone facilities by a cooperative lender to a borrower that has received or is eligible to receive a loan under the REA;
|
|
•
|
the collateral to be performing and not more than 30 days delinquent; and
|
|
•
|
the collateralization (consisting of current, performing loans) to be maintained at the contractually prescribed level, in an amount at least equal to the outstanding principal amount of the security.
|
In addition, the same underwriting standards that apply to loans made to distribution cooperatives on which Farmer Mac assumes direct credit exposure also apply to loans made to distribution cooperatives that secure the general obligation of the lender in AgVantage transactions (based on the average of the most recent three years):
|
•
|
the ratio of long-term debt to net utility plant does not exceed 90 percent;
|
|
•
|
the modified debt service coverage ratio equals or exceeds 1.35; and
|
|
•
|
the ratio of equity to total assets equals or exceeds 20 percent.
|
For loans made to G&T cooperatives that secure the general obligation of the lender in AgVantage transactions, the G&T cooperative must either (1) have a rating from an NRSRO of BBB- (or equivalent) or better or (2) meet the following underwriting standards (based on the average of the most recent three years):
|
•
|
the aggregate members' equity to total capitalization ratio equals or exceeds 25 percent;
|
|
•
|
the modified debt service coverage ratio equals or exceeds 1.10; and
|
|
•
|
the equity to total assets ratio equals or exceeds 10 percent.
|
The due diligence Farmer Mac performs before purchasing, or guaranteeing securities backed by rural utilities loans includes:
|
•
|
evaluating loan database information to determine conformity to Farmer Mac's underwriting standards;
|
|
•
|
confirming that loan file data conforms to database information;
|
|
•
|
validating supporting credit information in the loan files; and
|
|
•
|
reviewing loan documentation.
|
Farmer Mac is not obligated to assume credit risk on every rural utilities loan that meets it underwriting and collateral valuation standards submitted to Farmer Mac. Farmer Mac may consider other factors, such as portfolio diversification, in deciding whether or not to accept the loans.
31
Collateral
It is customary in loans to distribution cooperatives and G&T cooperatives for the lender to take a security interest in substantially all of the borrower's assets. In cases in which Farmer Mac purchases a rural utilities loan with a pledge of all assets and a lender also has a lien on all assets, Farmer Mac verifies that a lien accommodation results in either a shared first lien or a first lien in favor of Farmer Mac. In cases where debt indentures are utilized, Farmer Mac determines if available collateral is adequate to support the loan program and Farmer Mac's investment. As of December 31, 2012, all of the rural utilities loans held by Farmer Mac consisted of loans with a pledge of all assets. Farmer Mac also has indirect credit exposure on rural utilities loans that are pledged to secure AgVantage securities. Some of those loans are unsecured or secured by less than all of the borrower's assets. The agreements governing Farmer Mac's Rural Utilities AgVantage securities provide that these loans may not comprise more than 20 percent of the aggregate rural utilities loans securing these AgVantage securities.
Servicing
Farmer Mac generally does not directly service the rural utilities loans held in its portfolio or the loans underlying Farmer Mac Guaranteed Securities – Rural Utilities. Those loans are serviced by a servicer designated by Farmer Mac. Rural utilities loans pledged to secure AgVantage securities are serviced by the issuer of the AgVantage securities in accordance with the institution's servicing procedures, which are reviewed and approved by Farmer Mac before entering into those transactions. CFC, a related party to Farmer Mac by virtue of CFC's stock ownership in Farmer Mac, and sole issuer of AgVantage securities secured by rural utilities loans, currently services all of the rural utilities loans in Farmer Mac's portfolio.
Approved Lenders
The statutory authorities that authorize Farmer Mac to create a secondary market for rural utilities loans require eligible loans be made by a lender organized as a cooperative. Currently, the only two rural utilities lenders that are cooperatives are CFC and CoBank, ACB ("CoBank"), an institution of the FCS. As of December 31, 2012, these cooperatives had approximately $19.0 billion in loans outstanding to distribution cooperatives and $7.0 billion in loans outstanding to G&T cooperatives. To date, CFC is the only lender to have participated in Farmer Mac's Rural Utilities line of business.
Portfolio Diversification
CFC and CoBank each lends throughout the entire United States. Farmer Mac analyzes the geographic distribution of loans to cooperatives and considers regional concentration levels in connection with its business activities under the Rural Utilities program. As of
December 31, 2012
, Farmer Mac had direct credit exposure on 796 loans to electric cooperatives constituting
$1.0 billion
across 37 states.
Farmer Mac's charter does not prescribe a maximum loan size for an eligible rural utilities loan, but Farmer Mac currently has a $30.0 million limit in place for cumulative direct credit exposure on those loans (e.g., purchases of loans or securities representing interests in loans) to any one borrower or related borrowers. For indirect credit exposures on rural utilities loans (e.g., AgVantage transactions), Farmer Mac's current limit is $75.0 million for cumulative loan exposure to any one borrower or related borrowers, with the amount of any direct exposure to a borrower also counting toward the $75.0 million
32
limit. As of
December 31, 2012
, Farmer Mac's direct credit exposure to rural utilities loans consisted of
$1.0 billion
in loans to distribution cooperatives and
$24.9 million
in loans to G&T cooperatives.
Funding of Guarantee and LTSPC Obligations
The principal sources of funding for the payment of Farmer Mac's obligations under its guarantees and LTSPCs are the fees for its guarantees and commitments, net effective spread, proceeds of debt issuances, loan repayments, and maturities of AgVantage securities. Farmer Mac satisfies its obligations under LTSPCs and its guarantees by purchasing defaulted loans out of LTSPCs and from the related trusts for Farmer Mac Guaranteed Securities. Farmer Mac typically recovers a significant portion of the value of defaulted loans purchased either through borrower payments, loan payoffs, payments by third parties, or foreclosure and sale of the property securing the loans. Ultimate credit losses arising from Farmer Mac's guarantees and commitments are reflected in the Corporation's charge-offs against its allowance for losses, gains and losses on the sale of real estate owned ("REO"), which consists of real estate acquired through foreclosure, and fair value adjustments of REOs held. During
2012
, Farmer Mac had net credit losses of
$1.7 million
, compared to
$0.2 million
during
2011
, primarily due to an increase in the level of charge-offs in 2012.
Farmer Mac's charter requires Farmer Mac to maintain in its accounts a portion of the guarantee fees it receives from its guarantee activities. That amount must be exhausted before Farmer Mac may issue obligations to the U.S. Treasury against the $1.5 billion that Farmer Mac is statutorily authorized to borrow from the U.S. Treasury to fulfill its guarantee obligations. That borrowing authority is not intended to be a routine funding source and has never been used. As of December 31, 2012, the amount maintained as a reserve against losses arising from Farmer Mac's guarantee activities was
$98.6 million
. Farmer Mac's total outstanding guarantees and LTSPCs exceed the cumulative amount (1) held as an allowance for losses, (2) the amount maintained as a reserve against losses, and (3) the amount Farmer Mac may borrow from the U.S. Treasury; however, Farmer Mac does not expect its future payment obligations under its guarantees and LTSPCs to exceed amounts available to satisfy those obligations, including access to the underlying collateral in the event of default. For information about Farmer Mac's allowance for losses, see "Management's Discussion and Analysis of Financial Condition and Results of Operations—Risk Management—Credit Risk – Loans" and Note 2(j) and Note 8 to the consolidated financial statements. For a more detailed discussion of Farmer Mac's borrowing authority from the U.S. Treasury, see "Business—Farmer Mac's Authority to Borrow from the U.S. Treasury."
Financing
Debt Issuance
Farmer Mac's statutory charter (12 U.S.C. § 2279aa-6(e)) authorizes Farmer Mac to issue debt obligations to purchase eligible loans, USDA Guaranteed Securities, and Farmer Mac Guaranteed Securities, and to maintain reasonable amounts for business operations, including adequate liquidity. Farmer Mac funds its purchases of eligible loan assets and liquidity investment assets primarily by issuing debt obligations of various maturities in the public capital markets. Farmer Mac also issues debt obligations to obtain funds to finance its transaction costs, guarantee payments, and LTSPC purchase obligations. Farmer Mac's debt obligations include discount notes and fixed and floating rate medium-term notes, including callable notes.
The interest and principal on Farmer Mac's debt obligations are not guaranteed by, and do not constitute debts or obligations of, FCA or the United States or any agency or instrumentality of the United States
33
other than Farmer Mac. Farmer Mac is an institution of the FCS, but is not liable for any debt or obligation of any other institution of the FCS. Likewise, neither the FCS nor any other individual institution of the FCS is liable for any debt or obligation of Farmer Mac. Income to the purchaser of a Farmer Mac discount note or medium-term note is not exempt under federal law from federal, state, or local taxation. Farmer Mac's discount notes and medium-term notes are not currently rated by an NRSRO.
Farmer Mac's board of directors has authorized the issuance of up to $15.0 billion of discount notes and medium-term notes (of which
$11.6 billion
was outstanding as of
December 31, 2012
), subject to periodic review of the adequacy of that level relative to Farmer Mac's borrowing needs. The board of directors increased that authorization from $12.0 billion to $15.0 billion in December 2012. Farmer Mac invests the proceeds of its debt issuances in loan purchases, Farmer Mac Guaranteed Securities, and liquidity investment assets in accordance with policies established by its board of directors that comply with FCA's Liquidity and Investment Regulations, which establish limitations on dollar amount, issuer concentration, and credit quality. Farmer Mac's regular debt issuance supports its access to the capital markets, and Farmer Mac's liquidity investment assets provide an alternative source of funds should market conditions be unfavorable. Farmer Mac's current policies authorize liquidity investments in:
|
•
|
obligations of or guaranteed by the United States;
|
|
•
|
obligations of GSEs;
|
|
•
|
municipal securities;
|
|
•
|
international and multilateral development bank obligations;
|
|
•
|
money market instruments;
|
|
•
|
diversified investment funds;
|
|
•
|
asset-backed securities;
|
|
•
|
corporate debt securities; and
|
|
•
|
mortgage securities.
|
For more information about Farmer Mac's outstanding investments and indebtedness, see "Management's Discussion and Analysis of Financial Condition and Results of Operations—Balance Sheet Review" and Note 4 and Note 7 to the consolidated financial statements.
Equity Issuance
Farmer Mac's charter authorizes the Corporation to issue voting common stock, non-voting common stock, and non-voting preferred stock. Only banks, other financial entities, insurance companies, and institutions of the FCS eligible to participate in one or more of Farmer Mac's lines of business may hold voting common stock. No holder of Class A voting common stock may directly or indirectly be a beneficial owner of more than 33 percent of the outstanding shares of Class A voting common stock. There are no restrictions on the maximum number or percentage of outstanding shares of Class B voting common stock that may be held by an eligible stockholder. No ownership restrictions apply to Class C non-voting common stock or preferred stock, and they are freely transferable.
The dividend rights of all three classes of Farmer Mac's common stock are the same, and dividends may be paid on common stock only when, as, and if declared by Farmer Mac's board of directors in its sole discretion, subject to the payment of dividends on outstanding preferred stock. Upon liquidation, dissolution, or winding up of the business of Farmer Mac, after payment and provision for payment of outstanding debt of the Corporation, the holders of shares of preferred stock would be paid at par value out
34
of assets available for distribution, plus all declared and unpaid dividends, before the holders of shares of common stock received any payment. The assets of Farmer Mac II LLC are not directly available to satisfy the claims of Farmer Mac's creditors or stockholders. Those assets will only be available to the creditors and stockholders of Farmer Mac after all obligations owed to creditors of and equity holders in Farmer Mac II LLC have been satisfied.
Common Stock
As of
December 31, 2012
, the following shares of Farmer Mac common stock were outstanding:
|
•
|
1,030,780
shares of Class A voting common stock;
|
|
•
|
500,301
shares of Class B voting common stock; and
|
|
•
|
9,171,343
shares of Class C non-voting common stock.
|
Farmer Mac may obtain additional capital from future issuances of voting and non-voting common stock and non-voting preferred stock. Farmer Mac did not repurchase any common stock during 2012 or 2011.
The following table presents the dividends declared on Farmer Mac's common stock during and subsequent to
2012
:
|
Date
Dividend Declared |
Per
Share Amount |
For
Holders Of Record As Of |
Date
Paid |
|||||
|
February 2, 2012
|
$
|
0.10
|
|
March 15, 2012
|
March 30, 2012
|
|||
|
June 7, 2012
|
0.10
|
|
June 18, 2012
|
June 29, 2012
|
||||
|
August 6, 2012
|
0.10
|
|
September 14, 2012
|
September 28, 2012
|
||||
|
December 6, 2012
|
0.10
|
|
December 17, 2012
|
December 31, 2012
|
||||
|
February 6, 2013
|
0.12
|
|
March 15, 2013
|
*
|
||||
* The dividend declared on
February 6, 2013
is scheduled to be paid on
March 29, 2013
.
Farmer Mac's ability to declare and pay common stock dividends could be restricted if it were to fail to comply with its regulatory capital requirements. See Note 9 to the consolidated financial statements and "Business—Government Regulation of Farmer Mac—Regulation—Capital Standards—Enforcement Levels."
Preferred Stock
As of December 31, 2012 and 2011, Farmer Mac had 57,578 outstanding shares of Series C Preferred Stock. On January 17, 2013, Farmer Mac redeemed and retired all of the outstanding Series C Preferred Stock from the proceeds received from the issuance of a new series of non-cumulative preferred stock on the same date (as described below). Prior to its redemption, dividends on Series C Preferred Stock compounded quarterly at an annual rate of 5.0 percent of the then-applicable liquidation preference per share, with the annual rate scheduled to increase to (1) 7.0 percent on January 1 following the fifth anniversary of the applicable issue date and (2) 9.0 percent on January 1 following the tenth anniversary of the applicable issue date.
35
The following table presents the dividends declared on Series C Preferred Stock during and subsequent to
2012
:
|
Date
Dividend Declared |
Per
Share Amount |
For
Period Beginning |
For
Period Ending |
Date
Paid |
||||||
|
February 2, 2012
|
$
|
12.50
|
|
January 1, 2012
|
March 31, 2012
|
April 2, 2012
|
||||
|
June 7, 2012
|
12.50
|
|
April 1, 2012
|
June 30, 2012
|
July 2, 2012
|
|||||
|
August 6, 2012
|
12.50
|
|
July 1, 2012
|
September 30, 2012
|
October 1, 2012
|
|||||
|
December 6, 2012
|
12.50
|
|
October 1, 2012
|
December 31, 2012
|
December 31, 2012
|
|||||
|
December 6, 2012 *
|
2.36
|
|
January 1, 2013
|
January 17, 2013
|
January 17, 2013
|
|||||
* Series C Preferred Stock was redeemed and retired on January 17, 2013.
During 2012 and 2011, there were no sales of Series C Preferred Stock by Farmer Mac. Farmer Mac had authorized the issuance of up to 100,000 shares of Series C Preferred Stock with a par value of $1,000 per share and an initial liquidation preference of $1,000 per share. As of December 31, 2012, outstanding Series C Preferred Stock ranked senior to Farmer Mac's outstanding Class A voting common stock, Class B voting common stock, Class C non-voting common stock, and any other common stock of Farmer Mac issued in the future. CFC, a related party, owned all of the outstanding Series C Preferred Stock at December 31, 2012, and held at issuance 1.2 million shares of the Series A Preferred Stock (as defined and described below), the proceeds of which were used to redeem the Series C Preferred Stock.
On January 17, 2013, Farmer Mac issued 2.4 million shares of 5.875% Non-Cumulative Preferred Stock, Series A ("Series A Preferred Stock") with a par value of $25 per share and an initial liquidation preference of $25 per share. Series A Preferred Stock ranks senior to Farmer Mac's outstanding Class A voting common stock, Class B voting common stock, Class C non-voting common stock, and any other common stock of Farmer Mac issued in the future. The annual dividend rate will remain at a fixed rate of 5.875 percent for as long as the Series A Preferred Stock remains outstanding. Dividends on Series A Preferred Stock are non-cumulative, which means that if the Board of Directors has not declared a dividend before the applicable dividend payment date for any dividend period, such dividend will not be paid or cumulate, and Farmer Mac will have no obligation to pay dividends for such dividend period, whether or not dividends on the Series A Preferred Stock are declared for any future dividend period. Farmer Mac may pay dividends on Series A Preferred Stock without paying dividends on any outstanding class or series of stock that ranks junior to Series A Preferred Stock. On February 6, 2013, Farmer Mac's board of directors declared a dividend of $0.3672 per share of Series A Preferred Stock for the period from but not including January 17, 2013 to and including April 17, 2013, payable on April 17, 2013 to holders of record as of April 2, 2013. Farmer Mac has the right, but not the obligation, to redeem some or all of the issued and outstanding shares of Series A Preferred Stock at a price equal to the then-applicable liquidation preference beginning on January 17, 2018 and anytime thereafter.
Non-Controlling Interest in Farmer Mac II LLC
On January 25, 2010, Farmer Mac completed a private offering of $250.0 million aggregate face amount of securities issued by a newly formed Delaware statutory trust. The trust securities represent undivided beneficial ownership interests in 250,000 shares of Farmer Mac II LLC Preferred Stock. The Farmer Mac II LLC Preferred Stock has a liquidation preference of $1,000 per share.
36
Dividends on the Farmer Mac II LLC Preferred Stock are payable if, when, and as declared by Farmer Mac II LLC's board of directors, quarterly, on a non-cumulative basis, on March 30, June 30, September 30, and December 30 of each year. For each quarterly period from the date of issuance to but excluding the payment date occurring on March 30, 2015, the dividend rate on the Farmer Mac II LLC Preferred Stock is 8.875 percent per annum. For each quarterly period from March 30, 2015 to but excluding the payment date occurring on March 30, 2020, the dividend rate on the Farmer Mac II LLC Preferred Stock will be 10.875 percent per annum. For each quarterly period beginning on March 30, 2020, the dividend rate on the Farmer Mac II LLC Preferred Stock will be an annual rate equal to three-month LIBOR plus 8.211 percent. Dividends on the Farmer Mac II LLC Preferred Stock are non-cumulative, so dividends that are not declared for a payment date will not accrue. The Farmer Mac II LLC Preferred Stock is permanent equity of Farmer Mac II LLC and presented as "Non-controlling interest – preferred stock" within total equity on the consolidated balance sheets of Farmer Mac. Farmer Mac II LLC incurred $8.1 million of direct costs related to the issuance of the Farmer Mac II LLC Preferred Stock, which reduced the amount of non-controlling interest – preferred stock. The accrual of declared dividends is presented as "Net income attributable to non-controlling interest – preferred stock dividends" on the consolidated statements of operations on a pre-tax basis. The consolidated tax benefit is included in "income tax expense" on the consolidated statements of operations. Farmer Mac II LLC may redeem the preferred stock on March 30 of 2015, 2016, 2017, 2018, and 2019 and on any quarterly payment date on or after March 30, 2020, in whole or in part, at a cash redemption price equal to the liquidation preference.
The following table presents the dividends declared on Farmer Mac II LLC Preferred Stock during and subsequent to
2012
:
|
Date
Dividend Declared |
Per
Share Amount |
For
Period Beginning |
For
Period Ending |
Date
Paid |
||||
|
February 2, 2012
|
$22.19
|
December 30, 2011
|
March 29, 2012
|
March 30, 2012
|
||||
|
June 7, 2012
|
22.19
|
March 30, 2012
|
June 29, 2012
|
June 30, 2012
|
||||
|
August 3, 2012
|
22.19
|
June 30, 2012
|
September 29, 2012
|
October 1, 2012
|
||||
|
December 6, 2012
|
22.19
|
September 30, 2012
|
December 29, 2012
|
December 31, 2012
|
||||
|
February 6, 2013
|
22.19
|
December 30, 2012
|
March 29, 2013
|
*
|
||||
* The dividend declared on
February 6, 2013
is scheduled to be paid on
April 1, 2013
.
Farmer Mac used part of the proceeds from the sale of $250.0 million of the Farmer Mac II LLC Preferred Stock to repurchase and retire all $150.0 million of the outstanding Series B Preferred Stock issued in 2008. After consideration of the consolidated tax benefits to Farmer Mac, the net effective cost of the $250.0 million of preferred stock was 5.77 percent per year until it was redeemed and retired on January 17, 2013. That cost was $3.6 million less per year than the cost of the $150 million of Series B Preferred Stock that was redeemed in 2010 based on its 2010 dividend rate of 12 percent, which was scheduled to increase to 14 percent at the end of 2010 and to 16 percent at the end of 2011.
37
FARMER MAC'S AUTHORITY TO BORROW FROM THE U.S. TREASURY
Farmer Mac is authorized to borrow up to $1.5 billion from the U.S. Treasury through the issuance of debt obligations to the U.S. Treasury.Any funds borrowed from the U.S. Treasury may be used solely for the purpose of fulfilling Farmer Mac's guarantee obligations. Farmer Mac's charter provides that the U.S. Treasury is required to purchase Farmer Mac's debt obligations up to the authorized limit if Farmer Mac certifies that:
|
•
|
a portion of the guarantee fees assessed by Farmer Mac has been set aside as a reserve against losses arising out of Farmer Mac's guarantee activities in an amount determined by Farmer Mac's board of directors to be necessary and such reserve has been exhausted (that amount was
|
$98.6 million
as of December 31, 2012); and
|
•
|
the proceeds of such obligations are needed to fulfill Farmer Mac's guarantee obligations.
|
Any debt obligations issued by Farmer Mac under this authority would bear interest at a rate determined by the U.S. Treasury, taking into consideration the average rate on outstanding marketable obligations of the United States as of the last day of the last calendar month ending before the date of the purchase of the obligations from Farmer Mac. Farmer Mac would be required to repurchase any of its debt obligations held by the U.S. Treasury within a "reasonable time." As of December 31, 2012, Farmer Mac had not utilized this borrowing authority and does not expect to utilize this borrowing authority in the future.
The United States government does not guarantee payments due on Farmer Mac Guaranteed Securities, funds invested in the equity or debt securities of Farmer Mac, any dividend payments on shares of Farmer Mac stock, or the profitability of Farmer Mac.
GOVERNMENT REGULATION OF FARMER MAC
General
In 1987, Congress created Farmer Mac in the aftermath of the collapse of the agricultural credit delivery system. Farmer Mac's primary committees of jurisdiction in Congress – the Committee on Agriculture of the U.S. House of Representatives and the U.S. Senate Committee on Agriculture, Nutrition and Forestry – added requirements for Farmer Mac that had not been included in any of the other statutes establishing other GSEs.
Unlike the other existing GSEs at the time, Farmer Mac's initial 1987 legislation required the Corporation to be regulated by an independent regulator, the Farm Credit Administration, which has the authority to regulate Farmer Mac's safety and soundness. The statute creating Farmer Mac expressly requires that qualified loans meet minimum credit and appraisal standards that represent sound loans to profitable businesses. The enabling legislation also required Farmer Mac to comply with the periodic reporting requirements of the SEC, including filing quarterly reports on the financial status of the Corporation and interim reports when there are significant developments. Farmer Mac's statutory charter also requires offerings of Farmer Mac Guaranteed Securities to be registered under the Securities Act of 1933 and related regulations (collectively, the "Securities Act"), unless an exemption for an offering is available.
38
Since Farmer Mac's creation, Congress has amended Farmer Mac's charter four times:
|
•
|
in 1990 to create the USDA Guarantees line of business;
|
|
•
|
in 1991 to clarify Farmer Mac's authority to purchase its guaranteed securities, establish OSMO as Farmer Mac's financial regulator, and set minimum regulatory capital requirements for Farmer Mac;
|
|
•
|
in 1996 to remove certain barriers to and restrictions on Farmer Mac's operations to be more competitive (e.g., allowing Farmer Mac to buy loans directly from lenders and issue guaranteed securities representing 100 percent of the principal of the purchased loans and modifying capital requirements); and
|
|
•
|
in 2008 to authorize Farmer Mac to purchase, and guarantee securities backed by, loans made by cooperative lenders to borrowers to finance electrification and telecommunications systems in rural areas.
|
Farmer Mac's authorities and regulatory structure were not revised by subsequent legislation adopted in 2008 to regulate other GSEs.
Regulation
Office of Secondary Market Oversight (OSMO)
As an institution of the FCS, Farmer Mac (including its subsidiaries) is subject to the regulatory authority of FCA. FCA, acting through OSMO, has general regulatory and enforcement authority over Farmer Mac, including the authority to promulgate rules and regulations governing the activities of Farmer Mac and to apply its general enforcement powers to Farmer Mac and its activities. The Director of OSMO, who is selected by and reports to the FCA board, is responsible for the examination of Farmer Mac and the general supervision of the safe and sound performance by Farmer Mac of the powers and duties vested in it by Farmer Mac's charter. Farmer Mac's charter requires an annual examination of the financial transactions of Farmer Mac and authorizes FCA to assess Farmer Mac for the cost of its regulatory activities, including the cost of any examination. Farmer Mac is required to file quarterly reports of condition with FCA.
Capital Standards
General
. Farmer Mac's charter establishes three capital standards for Farmer Mac:
|
•
|
Statutory minimum capital requirement
. Farmer Mac's minimum capital level is an amount of core capital (stockholders' equity less accumulated other comprehensive income plus non-controlling interest - preferred stock) equal to the sum of 2.75 percent of Farmer Mac's aggregate on-balance sheet assets, as calculated for regulatory purposes, plus 0.75 percent of Farmer Mac's aggregate off-balance sheet obligations, specifically including:
|
|
◦
|
the unpaid principal balance of outstanding Farmer Mac Guaranteed Securities;
|
|
◦
|
instruments issued or guaranteed by Farmer Mac that are substantially equivalent to Farmer Mac Guaranteed Securities, including LTSPCs; and
|
|
◦
|
other off-balance sheet obligations of Farmer Mac.
|
39
|
•
|
Statutory critical capital requirement
. Farmer Mac's critical capital level is an amount of core capital equal to 50 percent of the total minimum capital requirement at that time.
|
|
•
|
Risk-based capital
. The charter directs FCA to establish a risk-based capital stress test for Farmer Mac, using specified stress-test parameters.
|
Farmer Mac is required to comply with the higher of the minimum capital requirement and the risk-based capital requirement.
The risk-based capital stress test promulgated by FCA is intended to determine the amount of regulatory capital (core capital plus the allowance for losses) that Farmer Mac would need to maintain positive capital during a ten-year period in which:
|
•
|
annual losses occur at a rate of default and severity "reasonably related" to the rates of the highest sequential two years in a limited U.S. geographic area; and
|
|
•
|
interest rates increase to a level equal to the lesser of 600 basis points or 50 percent of the ten-year U.S. Treasury rate, and interest rates remain at such level for the remainder of the period.
|
The risk-based capital stress test then adds an additional 30 percent to the resulting capital requirement for management and operational risk.
As of December 31,
2012
, Farmer Mac's statutory minimum and critical capital requirements were
$374.0 million
and
$187.0 million
, respectively, and its actual core capital level was
$519.0 million
,
$145.0 million
above the statutory minimum capital requirement and
$332.0 million
above the statutory critical capital requirement. Based on the risk-based capital stress test, Farmer Mac's risk-based capital requirement as of December 31,
2012
was
$58.1 million
and Farmer Mac's regulatory capital of
$535.9 million
exceeded that amount by approximately
$477.8 million
. See "Management's Discussion and Analysis of Financial Condition and Results of Operations—Liquidity and Capital Resources—Capital Requirements" for a presentation of Farmer Mac's current regulatory capital position.
Enforcement Levels
. Farmer Mac's charter directs FCA to classify Farmer Mac within one of four enforcement levels for purposes of determining compliance with capital standards. As of December 31,
2012
, Farmer Mac was classified as within level I – the highest compliance level.
Failure to comply with the applicable required capital level in the charter would result in Farmer Mac being classified as within level II (below the applicable risk-based capital level, but above the minimum capital level), level III (below the minimum capital level, but above the critical capital level) or level IV (below the critical capital level). In the event that Farmer Mac were classified as within level II, III or IV, the charter requires the Director of OSMO to take a number of mandatory supervisory measures and provides the Director with discretionary authority to take various optional supervisory measures depending on the level in which Farmer Mac is classified. The mandatory measures applicable to levels II and III include:
|
•
|
requiring Farmer Mac to submit and comply with a capital restoration plan;
|
|
•
|
prohibiting the payment of dividends if such payment would result in Farmer Mac being reclassified as within a lower level and requiring the pre-approval of any dividend payment even if such payment would not result in reclassification as within level IV; and
|
40
|
•
|
reclassifying Farmer Mac as within one level lower if it does not submit a capital restoration plan that is approved by the Director, or the Director determines that Farmer Mac has failed to make, in good faith, reasonable efforts to comply with such a plan and fulfill the schedule for the plan approved by the Director.
|
If Farmer Mac were classified as within level III, then, in addition to the foregoing mandatory supervisory measures, the Director of OSMO could take any of the following discretionary supervisory measures:
|
•
|
imposing limits on any increase in, or ordering the reduction of, any obligations of Farmer Mac, including off-balance sheet obligations;
|
|
•
|
limiting or prohibiting asset growth or requiring the reduction of assets;
|
|
•
|
requiring the acquisition of new capital in an amount sufficient to provide for reclassification as within a higher level;
|
|
•
|
terminating, reducing, or modifying any activity the Director determines creates excessive risk to Farmer Mac; or
|
|
•
|
appointing a conservator or a receiver for Farmer Mac.
|
Farmer Mac's charter does not specify any supervisory measures, either mandatory or discretionary, to be taken by the Director in the event Farmer Mac were classified as within level IV.
The Director of OSMO has the discretionary authority to reclassify Farmer Mac to a level that is one level below its then current level (for example, from level I to level II) if the Director determines that Farmer Mac is engaging in any action not approved by the Director that could result in a rapid depletion of core capital or if the value of property subject to mortgages backing Farmer Mac Guaranteed Securities has decreased significantly.
|
Item 1A.
|
Risk Factors
|
Farmer Mac's business activities, financial performance, and results of operations are, by their nature, subject to a number of risks and uncertainties, including those related to the agricultural sector, the rural utilities industry, access to the capital markets, the regulatory environment, and the level of prevailing interest rates and overall market conditions. The following risk factors could materially affect Farmer Mac's financial condition and operating results and should be considered in conjunction with "Management's Discussion and Analysis of Financial Condition and Results of Operations" in Item 7 of this Annual Report on Form 10-K, including the risks and uncertainties described in the "Forward-Looking Statements" section. Furthermore, because new risk factors likely will emerge from time to time, management can neither predict all such risk factors nor assess the effects of such factors on Farmer Mac's business, operating results, and financial condition or the extent to which any factor, or combination of factors, may affect the Corporation's actual results and financial condition. If any of the following risks materialize, Farmer Mac's business, financial condition, or results of operations could be materially and adversely affected. Farmer Mac undertakes no obligation to update or revise this risk factor discussion, except as required by law.
41
An inability to access the debt capital markets could have a material adverse effect on Farmer Mac's business, operating results, financial condition, and capital levels.
Farmer Mac's ability to operate its business, meet its obligations, grow its assets, and fulfill its statutory mission depends on the Corporation's ability to issue substantial amounts of debt frequently and at favorable rates. The issuance of short-term and long-term debt securities in the U.S. financial markets is the primary source of funding for Farmer Mac's purchases of eligible loan assets and liquidity investment assets and for repaying or refinancing existing debt. Moreover, one of the primary sources of the Corporation's revenue is the net interest income earned from the difference, or "spread," between the return received on assets held and the related borrowing costs. Farmer Mac's ability to obtain funds through the issuance of debt, at favorable rates and terms, depends on many factors, including:
|
•
|
Farmer Mac's corporate and regulatory structure, including its status as a government-sponsored enterprise, or GSE, and perceptions about the viability of stockholder-owned GSEs in general;
|
|
•
|
compliance with regulatory capital requirements and any measures imposed by Farmer Mac's regulator if the Corporation were to fail to comply with those requirements;
|
|
•
|
Farmer Mac's financial results and changes in its financial condition;
|
|
•
|
the public's perception of the risks to and financial prospects of Farmer Mac's business;
|
|
•
|
prevailing conditions in the capital markets;
|
|
•
|
competition from other issuers of GSE debt; and
|
|
•
|
legislative or regulatory actions relating to Farmer Mac's business, including any actions that would affect the Corporation's GSE status or that could increase its costs for hedging interest rate risks or restrict or reduce its ability to issue debt.
|
Factors affecting the agricultural sector or the rural utilities industry may negatively affect borrowers' profitability and, as a consequence, their ability to repay their loans on which Farmer Mac has assumed credit risk.
External factors beyond Farmer Mac's control that could negatively affect borrowers' profitability could cause Farmer Mac to experience increased delinquency and default rates within its loan portfolio, including, but not limited to:
|
•
|
severe protracted or sudden adverse weather conditions, animal and plant disease outbreaks, restrictions on water supply, or other conditions affecting particular geographic regions or industries;
|
|
•
|
increases in production expenses, including increases in commodity or fuel prices or labor costs within any particular industry;
|
|
•
|
fluctuations in currency exchange markets that would reduce export demand for U.S. agricultural products;
|
|
•
|
slow or negative economic growth, which could reduce demand for U.S. agricultural products;
|
|
•
|
adverse changes in interest rates, agricultural land values, or other factors that may affect delinquency levels and credit losses on agricultural real estate mortgage loans;
|
|
•
|
the effects of any changes in federal assistance for ethanol producers, such as the elimination of the tax credit previously available to blenders and the elimination of the import tariff previously applicable to foreign producers, which may affect the level of income of ethanol producers and consequently their repayment capacity on affected loans in Farmer Mac's programs;
|
|
•
|
the effects of any changes in federal assistance for agricultural producers in the current Farm Bill (the Food, Conservation, and Energy Act of 2008), which is scheduled to expire in September
|
42
2013, such as reduced support for crop insurance or other disaster recovery programs, which may affect the level of income of grain, livestock, or other affected producers and consequently their repayment capacity on affected loans owned or guaranteed by Farmer Mac;
|
•
|
budget issues in Congress that limit the services made available by USDA in connection with agricultural production;
|
|
•
|
changes in the general economy that can affect the availability of off-farm sources of income and prices of real estate for borrowers; and
|
|
•
|
negative economic conditions that may strain the ability of members of rural electric cooperatives to pay the costs of providing electricity or cause regulators of rural electric cooperatives to restrict the cooperatives' ability to raise rates to achieve profitable levels.
|
Farmer Mac's business, operating results, financial condition, and capital levels may be materially and adversely affected by external factors that may affect the price or marketability of Farmer Mac's products or Farmer Mac's ability to offer its products and services.
Farmer Mac's business, operating results, financial condition, and capital levels may be materially and adversely affected by external factors, including adverse changes in the capital markets or changes in public policy, that may affect the price or marketability of Farmer Mac's products and services or Farmer Mac's ability to offer its products and services, including, but not limited to:
|
•
|
disruptions in the capital markets, which could adversely affect the value and performance of Farmer Mac's eligible loan assets and investment securities, the Corporation's liquidity position, and Farmer Mac's ability to access funding at favorable levels or to raise capital;
|
|
•
|
competitive pressures in the purchase of loans eligible for Farmer Mac's programs and the sale of Farmer Mac Guaranteed Securities and debt securities;
|
|
•
|
changes in interest rates that may increase the basis risk of Farmer Mac's hedging instruments, thereby increasing its funding costs; and
|
|
•
|
legislative or regulatory developments or interpretations of Farmer Mac's statutory charter that could adversely affect Farmer Mac, its ability to offer new products, the ability or motivation of certain lenders to participate in its programs or the terms of any such participation, or increase the cost of related corporate activities.
|
Farmer Mac's business development, profitability, and capital depend on the continued growth of the secondary market for agricultural real estate mortgage loans and for rural utilities loans, the future for both of which remains uncertain.
Continued growth in Farmer Mac's business and future profitability may be constrained by conditions that limit the need or ability for lenders to obtain the benefits of Farmer Mac's secondary market, including, but not limited to:
|
•
|
reduced growth rates in the agricultural mortgage market caused by prevailing conditions in the overall economy;
|
|
•
|
the increase in capital levels or the availability of other sources of capital for customers of Farmer Mac;
|
|
•
|
decreased demand for mortgage lending due to borrower liquidity;
|
|
•
|
the acceptance by Federal Home Loan Banks of agricultural real estate mortgage loans as collateral;
|
43
|
•
|
the historical preference of many agricultural lending institutions to retain loans in their portfolios rather than to sell them into the secondary market;
|
|
•
|
the small number of business partners that currently provide a significant portion of Farmer Mac's business volume, resulting in vulnerability as existing business volume pays down or matures and the status of these business partners evolves;
|
|
•
|
budget issues in Congress that limit the ability of agricultural producers to obtain USDA-guaranteed loans; and
|
|
•
|
expanded funding alternatives available to rural utilities.
|
The loss of business from key business partners or customers could adversely affect Farmer Mac's business and result in a decrease in its revenues and profits.
Farmer Mac's business and ability to generate revenues and profits largely depends on its ability to purchase eligible loans or place eligible loans under guarantees or purchase commitments. Farmer Mac conducts a significant portion of its business with a small number of business partners. This results in vulnerability as existing receivables pay down or mature and the status and needs of Farmer Mac's business partners evolve. In
2012
, ten institutions generated approximately
53.9 percent
of loan purchase volume in the Farm & Ranch line of business. As of
December 31, 2012
, approximately
99.8 percent
of the
$5.6 billion
outstanding principal amount of AgVantage securities were issued by four institutions. Transactions with CFC has represented 100 percent of business volume under the Farmer Mac Rural Utilities line of business since its inception in 2008. Farmer Mac's ability to maintain the current relationships with its business partners or customers and the business generated by those business partners or customers is significant to Farmer Mac's business. Consequently, the loss of business from any one of Farmer Mac's key business partners could negatively impact Farmer Mac's revenues and profitability. Furthermore, Farmer Mac may not be able to replace the loss of business of a key business partner or customer with alternate sources of business due to limitations on the types of assets eligible for Farmer Mac's secondary market pursuant to its charter, which could adversely affect Farmer Mac's business and result in a decrease in its revenues and profits.
The failure of an issuer to pay the outstanding principal amount or to issue new AgVantage securities upon the maturity of outstanding AgVantage securities could negatively affect Farmer Mac's liquidity position and income.
As of December 31,
2012
, Farmer Mac had
$5.6 billion
of AgVantage securities outstanding, of which
$0.7 billion
and
$1.1 billion
will be maturing in
2013
and 2014, respectively. AgVantage securities are guaranteed by Farmer Mac as to the timely payment of interest and principal. Most do not pay down principal based on amortization schedules and instead have fixed maturity dates when the secured general obligation is due. Thus, if the issuer of a maturing AgVantage security defaults and does not pay the outstanding principal amount due upon maturity, then Farmer Mac's liquidity position could be negatively affected because Farmer Mac will be required to obtain funds to pay the holder of the AgVantage security or, for AgVantage securities owned by Farmer Mac, to pay off the debt securities used to fund the purchase of the AgVantage securities. Farmer Mac's income could also be adversely affected if the issuer of a maturing AgVantage security does not issue new AgVantage securities to replace the maturing securities and Farmer Mac does not find alternate sources of business, or if the net interest margin earned by Farmer Mac on new AgVantage securities that replace maturing AgVantage securities is lower than the margin earned on the maturing AgVantage securities.
44
Farmer Mac is a GSE that may be materially and adversely affected by legislative or political developments that may affect the ongoing operations or continued existence of GSEs.
Farmer Mac is a GSE that is governed by a statutory charter controlled by the U.S. Congress and regulated by government agencies. Although Farmer Mac is not aware of any pending legislative proposals that would adversely affect either the manner in which Farmer Mac conducts its business or the status of Farmer Mac as a GSE at this time, Farmer Mac's ability to effectively conduct its business is subject to risks and uncertainties related to legislative or political developments that may affect the status or operations of GSEs generally. From time to time, legislative initiatives may be commenced that, if successful, could result in the enactment of legislation or the promulgation of regulations that could negatively affect the status of Farmer Mac as a GSE or the manner in which Farmer Mac operates. Farmer Mac cannot predict whether any legislative proposals related to the housing GSEs would also address the continued GSE status of Farmer Mac or modify the current operating structure or authorities of Farmer Mac in any material way. Implementation of any such proposal could have a material and adverse effect on Farmer Mac's business, operating results, financial condition, and capital levels. See "Government Regulation of Farmer Mac" in Item 1 of this Annual Report on Form 10-K for additional discussion on the rules and regulations governing Farmer Mac's activities.
Farmer Mac is subject to statutory and regulatory capital requirements that are subject to change, and failure to meet those requirements could result in supervisory measures or otherwise materially and adversely affect Farmer Mac's business, operating results, or financial condition.
Farmer Mac is required by statute and regulation to maintain certain capital levels. Any inability by Farmer Mac to meet these capital requirements could result in supervisory measures by FCA or could otherwise materially and adversely affect Farmer Mac's business, operating results, or financial condition. Factors that could adversely affect the adequacy of Farmer Mac's capital levels in the future, and which may be beyond Farmer Mac's control, include:
|
•
|
the potential for any other-than-temporary impairment charges;
|
|
•
|
adverse changes in interest rates or credit spreads;
|
|
•
|
the potential need to increase the level of the allowance for losses on eligible loan assets in the future;
|
|
•
|
legislative or regulatory actions that increase Farmer Mac's applicable capital requirements; and
|
|
•
|
changes in U.S. generally accepted accounting principles ("GAAP").
|
Farmer Mac is exposed to credit risk on its eligible loan assets, the repayment of which may depend on factors outside of Farmer Mac's or the borrower's control.
Farmer Mac assumes the ultimate credit risk of borrower defaults on the loans it holds as well as the loans underlying Farmer Mac Guaranteed Securities and LTSPCs. In the Farm & Ranch line of business, repayment of eligible loans typically depends on the success of the related farming operation, which, in turn, depends on many variables and factors over which farmers may have little or no control, such as weather conditions, animal and plant disease outbreaks, economic conditions (both domestic and international), and political conditions.
In the Rural Utilities line of business, eligible utilities operations include the distribution of electricity, the generation and transmission of electricity, and telecommunications. Each type of utility operation has different inherent risks associated with it, but all share a common risk posed by potential changes in public
45
and regulatory policies. Business cash flows can be disrupted as a result of storms, though distribution cooperatives have in place cost-sharing arrangements with providers in other regions that mitigate this exposure. Historically, natural disasters have often resulted in disaster area declarations and financial aid to utilities providers through the Federal Emergency Management Agency and other conduits, although there can be no assurance that any such aid would be available in the event of any future natural disaster. The electrical distribution and generation sectors can be adversely affected by changes in fuel costs and prices received from consumers, as well as by contractual power obligations that do not match up with supply or demand. The depth and pace of technological change in the telecommunications industry can also provide significant challenges, as the industry requires heavy capital investment and correct judgments about the sustainability of new technologies in an area with many competitors.
Widespread repayment shortfalls on loans in the Farm & Ranch line of business or Rural Utilities line of business could require Farmer Mac to pay under its guarantees and LTSPCs and could have a material adverse effect on the Corporation's financial condition, results of operations, and liquidity.
Farmer Mac Guaranteed Securities and LTSPCs expose Farmer Mac to significant contingent liabilities, and Farmer Mac's ability to fulfill its obligations under its guarantees and LTSPCs may be limited.
Farmer Mac's guarantee and purchase commitment obligations to third parties, including Farmer Mac Guaranteed Securities and LTSPCs, are obligations of Farmer Mac only and are not backed by the full faith and credit of the United States, FCA, or any other agency or instrumentality of the United States other than Farmer Mac. As of
December 31, 2012
, Farmer Mac had
$4.1 billion
of contingent liabilities related to Farmer Mac Guaranteed Securities and LTSPCs issued to third parties, which represents Farmer Mac's exposure if all loans underlying these guarantees and purchase commitments defaulted and Farmer Mac recovered no value from the related collateral. Farmer Mac's principal sources of funds for payments on all of its liabilities, including claims that may arise under its guarantees and purchase commitments, are the liquid assets held by Farmer Mac (including cash and cash equivalents), guarantee and commitment fees, interest payments on assets held by Farmer Mac, loan repayments, repayment of principal amounts due upon maturity of AgVantage securities, and proceeds from the issuance of debt securities. If all of the loans underlying Farmer Mac's guarantees and purchase commitments defaulted, and Farmer Mac recovered no value from the related collateral, the sources of funds for payment on these guarantees and purchase commitments could be substantially less than the aggregate amount of the corresponding liabilities. It is difficult to quantify at any particular point in time the funds that would be available from interest payments, loan repayments, and maturing AgVantage securities for payment on Farmer Mac's guarantees and purchase commitments, and Farmer Mac's ability to issue debt as a source of repayment would be subject to its ability to access the debt markets and market conditions at that time. As of
December 31, 2012
, Farmer Mac held at fair value cash, cash equivalents, and other investment securities of
$3.3 billion
that could be used as a source of funds for payment on its obligations. Although Farmer Mac believes that it remains well-collateralized on the assets underlying its guarantee and purchase commitment obligations to third parties and that the estimated probable losses for these obligations remain low relative to the amount available for payment of claims on these obligations, Farmer Mac's total contingent liabilities for these obligations exceed the amount it may have available for payment of claims on these obligations. See "Management's Discussion and Analysis—Risk Management—Credit Risk – Loans" for more information on Farmer Mac's management of credit risk.
46
Farmer Mac is exposed to credit risk on its eligible loan assets that could materially and adversely affect its business, operating results, and financial condition.
Farmer Mac's earnings depend significantly on the performance of its eligible loan assets and the spread between the interest, guarantee fees, and commitment fees earned on such assets and interest paid on Farmer Mac's obligations and liabilities. Farmer Mac's earnings may be adversely affected by its exposure to credit risk associated with the agricultural mortgage and rural utilities loans that Farmer Mac purchases or commits to purchase or that back Farmer Mac Guaranteed Securities. This risk may increase in the case of loans that have a balloon payment at maturity, if the borrower seeks to refinance but is unable to do so. As of
December 31, 2012
,
23.0 percent
of the loans in the Farm & Ranch line of business included balloon payments. In addition, loans to borrowers in industries which have had historically higher delinquency rates relative to Farmer Mac's portfolio may present a higher risk of delinquency in future periods. For example, as of
December 31, 2012
, loans to borrowers in the permanent plantings and part-time farm categories comprised a combined
22.8 percent
of the Farm & Ranch portfolio (excluding AgVantage securities), but delinquencies in these combined categories comprised
50.9 percent
of the aggregate delinquencies for all commodity categories. As of
December 31, 2012
, loans to borrowers in the agstorage and processing (including ethanol facilities) category comprised
4.0 percent
of the Farm & Ranch portfolio (excluding AgVantage securities), but cumulative net credit losses for this category comprised
34.4 percent
of the cumulative net credit losses for all categories.
Farmer Mac is exposed to swap counterparty credit risk that could materially and adversely affect its business, operating results, and financial condition.
Farmer Mac relies on interest rate swap contracts and hedging arrangements to effectively manage its interest rate risk. Failure to perform under a derivatives contract by one or more of Farmer Mac's counterparties could disrupt Farmer Mac's hedging operations, particularly if Farmer Mac were entitled to a termination payment under the terms of the contract that it did not receive, or if Farmer Mac were unable to reposition the swap with a new counterparty. Farmer Mac has mitigated its swap counterparty credit risk by contracting only with counterparties that have investment grade credit ratings, establishing and maintaining collateral requirements that are scaled based upon credit ratings, and entering into netting agreements. As of
December 31, 2012
, Farmer Mac's credit exposure to interest rate swap counterparties was
$37.1 million
excluding netting arrangements and
$2.4 million
including netting arrangements.
Farmer Mac is exposed to AgVantage counterparty credit risk that could materially and adversely affect its business, operating results, and financial condition.
Farmer Mac is exposed to credit risk from issuers of AgVantage securities. Each AgVantage security is a general obligation of an issuing institution secured by eligible loans in an amount at least equal to the outstanding principal amount of the security and guaranteed by Farmer Mac. However, most of Farmer Mac's AgVantage exposure is concentrated in a small number of issuers. Farmer Mac mitigates its risk to AgVantage counterparties by reviewing each institution for which Farmer Mac has AgVantage exposure and requiring those institutions to meet Farmer Mac's standards for creditworthiness. In addition, Farmer Mac requires some level of overcollateralization (between 103 percent and 120 percent of the principal amount of the securities issued) for AgVantage securities in the Farm & Ranch line of business. As of
December 31, 2012
, nearly all of the AgVantage securities outstanding had been issued by four counterparties. A default by any of these counterparties could have a significant adverse effect on Farmer Mac's financial condition.
47
Farmer Mac is exposed to counterparty credit risk on its investment securities that could materially and adversely affect its business, operating results, and financial condition.
Farmer Mac maintains a liquidity investment portfolio that can be drawn upon for liquidity needs. In addition to cash and cash equivalents (such as U.S. Treasury securities and short-term money market instruments), this portfolio consists of investment securities, including securities guaranteed by U.S. Government agencies and GSEs, GSE-issued preferred stock, and corporate debt obligations. While Farmer Mac regularly reviews concentration limits to ensure that its liquidity investments are appropriately diversified and comply with applicable FCA regulations, Farmer Mac is exposed to credit risk from issuers of the investment securities it holds. For example, as of
December 31, 2012
, Farmer Mac held at fair value, as part of its liquidity investment portfolio,
$129.2 million
of corporate debt securities,
$149.5 million
of asset-backed securities principally backed by U.S. Government-guaranteed student loans (including
$63.2 million
of auction-rate certificates),
$756.0 million
of investment securities guaranteed by GSEs, and
$87.1 million
of preferred stock issued by a single GSE. A default by multiple issuers of investment securities held by Farmer Mac, or by a single issuer of investment securities in which Farmer Mac is more heavily concentrated, could have an adverse effect on Farmer Mac's financial condition and capital position.
Farmer Mac is exposed to interest rate risk that could materially and adversely affect its business, operating results, and financial condition.
Farmer Mac is subject to interest rate risk due to the possible timing differences in the cash flows of the assets it holds and related liabilities. The ability of borrowers to prepay their loans prior to the scheduled maturities increases the risk of asset and liability cash flow mismatches. In a changing interest rate environment, these cash flow mismatches could reduce Farmer Mac's earnings if assets repay sooner than expected and the resulting cash flows must be reinvested in lower-yielding investments, particularly if Farmer Mac's related funding costs cannot be correspondingly reduced. In addition, if assets repay more slowly than anticipated and the associated debt issued to fund the assets must be reissued at a higher yield, Farmer Mac's earnings could be adversely affected. As of
December 31, 2012
, of all the eligible loan assets held on Farmer Mac's balance sheet,
$4.5 billion
had a fixed interest rate and
$4.5 billion
had an adjustable interest rate.
Changes in interest rates or Farmer Mac's ability to manage interest rate risk successfully may cause volatility in financial results and capital levels and adversely affect net interest income.
Farmer Mac enters into financial derivatives transactions to hedge interest rate risks inherent in its business and applies fair value accounting to its financial derivatives transactions. Although Farmer Mac's financial derivatives provide effective economic hedges of interest rate risk, accounting guidance requires changes in the fair values of financial derivatives to be reflected in net income. As interest rates increase or decrease, the fair value of Farmer Mac's derivatives changes based on the position Farmer Mac holds relative to the specific characteristics of the derivative. Application of the accounting guidance on financial derivatives has historically contributed to significant volatility in Farmer Mac's earnings under GAAP when the financial derivative is not designated in a hedging relationship. For example, Farmer Mac recorded unrealized losses of
$47.6 million
and unrealized gains of
$20.1 million
in 2011 and 2010, respectively, for fair value changes on its financial derivatives not designated in a hedging relationship as a result of movements in interest rates during those years. Another consequence of the changes in the fair values of financial derivatives being accounted for in earnings is the resulting effect on Farmer Mac's regulatory core capital that is available to meet the Corporation's statutory minimum capital requirement.
48
Adverse changes in the fair values of Farmer Mac's financial derivatives would reduce the amount of core capital available to meet this requirement, which could result in regulatory enforcement action against Farmer Mac if it were unable to meet the requirement.
Effective July 1, 2012, Farmer Mac designated $950.0 million notional amount of interest rate swaps in fair value hedging relationships. Beginning in third quarter 2012, Farmer Mac recorded in earnings offsetting fair value adjustments on the hedged items attributable to the risk being hedged. In 2012, Farmer Mac recorded unrealized gains of
$0.7 million
for fair value changes on its financial derivatives not designated in a hedging relationship as a result of movements in interest rates during the year. Although derivative instruments designated in fair value hedging relationships may lessen exposure to changes in the fair value of assets or liabilities, any differences arising from fair value changes that are not offset could result in hedge ineffectiveness and adversely affect Farm Mac's earnings under GAAP.
Changes in interest rates as well as certain credit events may trigger collateralization requirements for Farmer Mac under its derivatives contracts, which could adversely affect Farmer Mac's liquidity position and operating results.
Farmer Mac uses derivatives contracts to help manage its interest rate risk. Changes in interest rates have required, and in the future may require, Farmer Mac to post cash or investment securities to its derivative counterparties to reflect the changes in fair market values of Farmer Mac's derivatives as a result of the changes in interest rates. For example, as of December 31, 2012, Farmer Mac posted
$60.3 million
of cash and
no
investment securities as collateral for its derivatives in net liability positions. Farmer Mac's derivatives contracts contain provisions establishing minimum threshold collateral amounts below which Farmer Mac is not required to post collateral. These threshold collateral amounts range between $15 million and $25 million, but may be reduced to zero upon the occurrence of specified credit events such as insolvency, receivership, failure to make a payment under the contract when due, or failure to continue as an instrumentality of the United States. If changes in interest rates were to result in a significant decrease in the fair value of Farmer Mac's derivatives, Farmer Mac would be required to post a significant amount of cash, cash equivalents, or investment securities, possibly within a short period of time, to satisfy its obligations under its derivatives contracts. The amount required to be posted would expand if Farmer Mac also experienced a credit event triggering full collateralization of its derivatives positions without any minimum threshold. As of December 31, 2012, the amount that would have been required for full collateralization of Farmer Mac's derivatives positions given the fair value of Farmer Mac's derivatives at that time was
$75.5 million
. If Farmer Mac were required to fully collateralize its derivatives position in an adverse interest rate environment, it could have a negative effect on Farmer Mac's liquidity position and operating results.
49
Incorrect estimates and assumptions by management in preparing financial statements could adversely affect the Corporation's business, operating results, reported assets and liabilities, financial condition, and capital levels.
Incorrect estimates and assumptions by management in connection with the preparation of Farmer Mac's consolidated financial statements could adversely affect the reported amounts of assets and liabilities and the reported amounts of income and expenses. The preparation of Farmer Mac's consolidated financial statements requires management to make certain critical accounting estimates and assumptions that could affect the reported amounts of assets and liabilities and the reported amounts of income and expense during the reporting periods. For example, as of
December 31, 2012
, Farmer Mac's assets and liabilities recorded at fair value included financial instruments valued at
$7.1 billion
whose fair values were estimated by management in the absence of readily determinable fair values (in other words, level 3). These financial instruments measured as level 3 represented
56 percent
of total assets and
73 percent
of financial instruments measured at fair value as of
December 31, 2012
. Further information regarding fair value measurement is included in "Management's Discussion and Analysis—Critical Accounting Policies—Fair Value Measurement." If management makes incorrect assumptions or estimates, Farmer Mac may under- or overstate reported financial results, which could materially and adversely affect the Corporation's business, operating results, reported assets and liabilities, financial condition, and capital levels.
Changes in the value or composition of Farmer Mac's investment securities could adversely affect the Corporation's business, operating results, financial condition, and capital levels.
Deterioration in financial or credit market conditions could reduce the fair value of Farmer Mac's investment securities, particularly those securities that are less liquid and more subject to market variability. Some securities owned by Farmer Mac, including auction-rate certificates and GSE subordinated debt, do not have well-established secondary trading markets, which make it more difficult to estimate current fair values for those securities. Adverse financial market conditions may further compound the challenges of estimating fair values for Farmer Mac's securities, as was the case in 2008 after widespread failure of the auction mechanism that had been established to provide liquidity for the auction-rate certificates that Farmer Mac currently holds.
Farmer Mac relies on market observations to determine the fair value of its investment securities, although the market data Farmer Mac relies upon may not reflect the actual sale conditions that Farmer Mac would face when selling its investment securities. For example, the market value of auction-rate certificates held by Farmer Mac materially depends on the amounts and timing of the expected cash flows on these securities, which may be highly uncertain. Therefore, a change in the amounts or timing of cash flows could materially alter the market price of those securities. Subsequent valuations of these and other investment securities, in light of factors then prevailing, may result in significant changes in the value of the Corporation's investment securities. For example, the current market values for the auction-rate certificates and GSE subordinated debt are significantly below their amortized cost due to widening credit spreads after purchase. As of
December 31, 2012
, the fair values of Farmer Mac's auction-rate certificates and GSE subordinated debt were
$63.2 million
and
$57.4 million
, respectively, compared to Farmer Mac's amortized cost of
$74.1 million
and
$70.0 million
, respectively, for each of these classes of investment securities.
Farmer Mac also relies on internal models to estimate the fair values of its investment securities and to determine whether credit losses exist, which requires Farmer Mac to exercise judgment about estimates
50
and assumptions used in the models. If Farmer Mac uses incorrect estimates or assumptions in the internal models it develops to estimate the fair value of its investment securities, those models could adversely affect reported income during the reporting period.
If Farmer Mac decides to sell securities in its investment portfolio, the price ultimately realized will depend on the demand and liquidity in the market at the time of sale. Farmer Mac's inability to sell the securities in its investment portfolio at or above their estimated fair values could adversely affect the Corporation's business, operating results, financial condition, and capital levels.
Farmer Mac's ability to attract and retain qualified employees is critical to the success of its business, and failure to do so may materially adversely affect Farmer Mac's performance or financial condition.
Farmer Mac relies on its employees' breadth and depth of knowledge of agricultural and rural utilities lending, financial products, and other areas of expertise to run its business operations successfully. A significant disruption in the continuity of Farmer Mac's employees would require Farmer Mac to expend resources to replace personnel and could result in a loss of productivity in the interim. If Farmer Mac is unable to continue to retain and attract qualified employees, Farmer Mac's performance or financial condition could be materially adversely affected.
Any failure, interruption, or breach in Farmer Mac's information systems or technology, including the occurrence of cyber incidents or a deficiency in Farmer Mac's cyber security, could result in a loss of business, damage to Farmer Mac's reputation, the disclosure or misuse of confidential or proprietary information, or increased costs or liability to Farmer Mac, which could adversely affect Farmer Mac's business, operating results, or financial condition.
Farmer Mac relies heavily on information systems and other technology, including from third parties, to conduct and manage its business operations. As Farmer Mac's reliance on technology has increased, so have the risks posed to its systems, including the effect of events that would threaten the confidentiality, integrity, or availability of Farmer Mac's information resources, known as cyber incidents. Farmer Mac has undertaken remedial measures and devotes significant resources to regularly implement, maintain, and upgrade its information systems and network with backup systems and various other safeguards to mitigate these risks, including a business continuity plan. However, Farmer Mac may not be able to prevent, address on a timely and adequate basis, or fully mitigate the negative effects of any failure or interruption of Farmer Mac's information systems or network, including these backup systems and safeguards, on Farmer Mac's business, operating results, or financial condition. A failure or interruption in any of Farmer Mac's information systems, backup infrastructure, or other technology could result in a disruption or malfunction of its operations, which could adversely affect Farmer Mac's ability to do business with its approved lenders or other counterparties, result in financial loss, or cause damage to Farmer Mac's reputation.
Farmer Mac's operations largely rely on the secure transmission, processing, and storage of its approved lenders' and other counterparties' confidential, proprietary, and other information through its online and network systems and applications. Any action resulting in unauthorized access to Farmer Mac's information systems and networks by third parties, including through computer viruses, malicious code, cyber-attacks or other information security breaches, could disrupt Farmer Mac's operations, corrupt its data, or result in the misappropriation, unauthorized release, loss, or destruction of the confidential, proprietary, or other information of its approved lenders and other counterparties. If such an event were to occur, Farmer Mac could consequently experience operational interruption, damage to its reputation, loss
51
of business, legal liability, or increased costs from private data exposure, which could adversely affect Farmer Mac's business, operating results, or financial condition.
If Farmer Mac's management of risk associated with its eligible loan assets and investment securities is not effective, its business, operating results, financial condition, and capital levels could be materially adversely affected.
Events in the financial markets during the last five years leading to heightened volatility and tightened liquidity and credit have challenged financial institutions, including Farmer Mac, to adapt and further develop profitability and risk management models adequate to address a wider range of possible market developments. Farmer Mac's techniques and strategies may not be effective in mitigating its risk exposure in all economic market environments or against all types of risk, including risks that Farmer Mac fails to identify or anticipate. Some of Farmer Mac's qualitative tools and metrics for managing risk are based upon its use of observed historical market behavior. Farmer Mac applies statistical and other tools to these observations to quantify its risks. These tools and metrics may fail to predict future or unanticipated risk. Such failures could, for example, arise from factors Farmer Mac did not anticipate or correctly evaluate in its models. In addition, Farmer Mac's quantified modeling does not take into account all risks. Farmer Mac's more qualitative approach to managing those risks could prove insufficient, exposing it to material unanticipated losses. The inability of Farmer Mac to effectively identify and manage the risks inherent in its business could have a material adverse effect on its business, operating results, financial condition, and capital levels.
Farmer Mac's ability to repay its obligations and/or raise capital through issuances of debt or equity may be adversely affected by the sale of certain assets to, and the operating results of, its subsidiary Farmer Mac II LLC
.
In January 2010, Farmer Mac contributed substantially all of its USDA Guarantees line of business to Farmer Mac II LLC, including USDA Guaranteed Securities in an aggregate principal amount of $1.1 billion and the primary intangible assets related to the operation of that line of business. As a result, the assets of Farmer Mac II LLC are no longer directly available to satisfy the claims of Farmer Mac's creditors or stockholders. In the event of an insolvency, bankruptcy, liquidation, reorganization, dissolution, or winding-up of Farmer Mac II LLC, Farmer Mac, as the holder of the common equity interest, may lose all or some of its investment in Farmer Mac II LLC, which event likely would adversely affect Farmer Mac's ability to raise capital, issue new debt, and repay outstanding debt as it comes due. Because Farmer Mac is also a creditor to Farmer Mac II LLC, the value of Farmer Mac II LLC's assets may be insufficient to repay amounts due to Farmer Mac, which also could adversely affect Farmer Mac's ability to raise capital, issue new debt, and repay outstanding debt as it comes due. In addition, the ability of Farmer Mac II LLC to successfully operate the USDA Guarantees line of business will impact its ability to pay dividends on the common equity interest owned by Farmer Mac. If Farmer Mac II LLC cannot pay dividends to Farmer Mac or repay or refinance obligations owed to Farmer Mac, Farmer Mac's liquidity and ability to raise additional capital also may be adversely affected, which could adversely affect the Corporation's operating results and financial condition.
The trading price for Farmer Mac's Class C non-voting common stock may be volatile due to market influences, trading volume, or the effects of equity awards for the Corporation's officers, directors, and employees.
The trading price of Farmer Mac's Class C non-voting common stock has at times experienced substantial price volatility and may continue to be volatile. For example, from January 2012 to December 2012, the
52
price of the stock ranged from
$18.01
per share to
$34.58
per share. The trading price may fluctuate in response to various factors, including short sales, low trading volume, hedging, or stock market influences in general that are unrelated to the Corporation's operating performance. In addition, as a component of compensation for its officers, directors, and employees, Farmer Mac typically grants equity awards each year that are based on the Class C non-voting common stock, including stock appreciation rights and restricted stock that vest over time or upon the achievement of specified performance goals. Sales of stock acquired upon vesting or exercise of equity awards by Farmer Mac's officers, directors, or employees, whether pursuant to an established trading plan or otherwise, could adversely affect the trading price of Farmer Mac's Class C non-voting common stock. These factors may be exacerbated during periods of low trading volume for the Corporation's Class C non-voting common stock, and may have a prolonged negative effect on its trading price.
Farmer Mac's efforts to pursue its Congressional mission of providing a secondary market for loans made to borrowers in rural America may adversely affect its business, operating results, and financial condition.
Congress created Farmer Mac to provide for a secondary market for agricultural mortgage loans, loans to rural utilities cooperatives, and the guaranteed portions of USDA-guaranteed loans. In pursuing this mission, Farmer Mac's secondary market activities are designed to:
|
•
|
increase the availability of long-term credit to rural borrowers at stable interest rates;
|
|
•
|
provide greater liquidity and lending capacity in extending credit to rural borrowers; and
|
|
•
|
provide an arrangement for new lending by facilitating capital market investments in long-term funding for rural borrowers, including funds at fixed rates of interest.
|
Although Farmer Mac strives to undertake its mission-related activities in a manner consistent with providing a positive return to Farmer Mac's stockholders, it is possible that these activities may contribute to a lower return to stockholders than if Farmer Mac's sole purpose were to maximize stockholder value. In addition, it is possible that the entities that regulate Farmer Mac could seek to alter Farmer Mac's mission-related activities in the future or place limits on its liquidity investments that provide liquidity for Farmer Mac's mission-related activities. If this were to happen, and Farmer Mac were required to undertake activities involving greater risk to satisfy its Congressional mission, Farmer Mac's business, operating results, and financial condition could be adversely affected.
A few significant stockholders may seek to influence Farmer Mac's business, strategy, or board composition, and the interests of these stockholders may differ from the interests of Farmer Mac or other holders of Farmer Mac's common stock.
The ownership of Farmer Mac's two classes of voting common stock is currently concentrated in a small number of institutions. Approximately 45 percent of Farmer Mac's Class A voting common stock is held by three financial institutions, with 31 percent held by one institution. Approximately 97 percent of Farmer Mac's Class B voting common stock is held by five FCS institutions (two of which are related to each other through a parent-subsidiary relationship). Three of those five FCS institutions may be deemed to have entered into a voting arrangement regarding the election of directors to Farmer Mac's board of directors.
Many holders of Farmer Mac's voting common stock are rural lenders that may compete directly with each other. At times, some of these voting stockholders may also view Farmer Mac as an indirect competitor in that Farmer Mac's secondary market activities often provide attractive funding and effective risk management tools that help many lenders compete in the origination of eligible rural loans. So long as Farmer Mac's
53
Class A and Class B voting common stock is highly concentrated in a small number of institutions, there is the potential that these institutions will seek to influence Farmer Mac's business, strategy, or board composition in a way that may not be in the best interests of either Farmer Mac or all other stockholders. Furthermore, the interests of the holders of Farmer Mac's Class A and Class B voting common stock may not be fully aligned with each other or the interests of Farmer Mac's Class C non-voting common stockholders, and this could lead to a strategy that is not in the best interests of Farmer Mac or all stockholders. The holders of Farmer Mac's Class A voting common stock and the holders of Farmer Mac's Class B voting common stock each have the right to elect one third of the membership of Farmer Mac's Board. Accordingly, each of these stockholder classes has the potential to significantly influence Farmer Mac's business and strategy in a manner that may not be in the best interests of all stockholders.
Any of the risks described in this section could materially and adversely affect Farmer Mac's business, operating results, financial condition, capital levels, and future earnings. For additional discussion about Farmer Mac's's risk management, see "Management's Discussion and Analysis of Financial Condition and Results of Operations—Risk Management" in Item 7 of this Annual Report on Form 10-K.
54
|
Item 1B.
|
Unresolved Staff Comments
|
None.
|
Item 2.
|
Properties
|
Farmer Mac currently occupies its principal offices, which are located at 1999 K Street, N.W., 4th Floor, Washington, D.C. 20006 under a Sublease that commenced on October 1, 2011 and expires on August 30, 2024. Farmer Mac also maintains an office located at 5408 NW 88
th
Street, Suite 120, Johnston, Iowa 50131, under the terms of a lease that commenced on November 1, 2010 and expires on October 31, 2015. Farmer Mac's offices are suitable and adequate for its current and currently anticipated needs.
|
Item 3.
|
Legal Proceedings
|
None.
|
Item 4.
|
Mine Safety Disclosures
|
Not applicable.
55
Item 5.
Market for Registrant's Common Equity, Related Stockholder Matters, and Issuer Purchases of Equity Securities
(a)
Farmer Mac has three classes of common stock outstanding. Ownership of Class A voting common stock is restricted to banks, insurance companies, and other financial institutions or similar entities that are not institutions of the FCS. Ownership of Class B voting common stock is restricted to institutions of the FCS. There are no ownership restrictions on the Class C non-voting common stock. Under the terms of the original public offering of the Class A and Class B voting common stock, Farmer Mac reserved the right to redeem at book value any shares of either class held by an ineligible holder.
Farmer Mac's Class A voting common stock and Class C non-voting common stock are listed on the New York Stock Exchange under the symbols AGM.A and AGM, respectively. The Class B voting common stock, which has a limited market and trades infrequently, is not listed or quoted on any exchange or other quotation system, and Farmer Mac is unaware of any publicly available quotations or prices for that class of common stock.
The information below represents the high and low closing sales prices for the Class A and Class C common stocks for the periods indicated as reported by the New York Stock Exchange:
|
|
Sales Prices
|
||||||||||||||
|
|
Class A Stock
|
Class C Stock
|
|||||||||||||
|
|
High
|
Low
|
High
|
Low
|
|||||||||||
|
|
(per share)
|
||||||||||||||
|
2013
|
|
|
|
|
|||||||||||
|
First quarter (through March 1, 2013)
|
$
|
29.50
|
|
$
|
23.36
|
|
$
|
37.72
|
|
$
|
32.96
|
|
|||
|
2012
|
|
|
|
|
|
|
|
|
|||||||
|
Fourth quarter
|
$
|
28.88
|
|
$
|
19.75
|
|
$
|
34.58
|
|
$
|
25.76
|
|
|||
|
Third quarter
|
21.47
|
|
17.52
|
|
27.36
|
|
23.71
|
|
|||||||
|
Second quarter
|
20.51
|
|
17.28
|
|
26.51
|
|
20.55
|
|
|||||||
|
First quarter
|
18.33
|
|
11.35
|
|
22.70
|
|
18.01
|
|
|||||||
|
2011
|
|
|
|
|
|
|
|
|
|||||||
|
Fourth quarter
|
$
|
13.66
|
|
$
|
11.34
|
|
$
|
20.38
|
|
$
|
15.69
|
|
|||
|
Third quarter
|
15.93
|
|
12.22
|
|
22.59
|
|
16.91
|
|
|||||||
|
Second quarter
|
14.88
|
|
11.97
|
|
22.12
|
|
17.24
|
|
|||||||
|
First quarter
|
15.25
|
|
12.08
|
|
20.27
|
|
14.82
|
|
|||||||
As of March 4, 2013, Farmer Mac estimates that there were 1,113 registered owners of the Class A voting common stock, 84 registered owners of the Class B voting common stock and 1,036 registered owners of the Class C non-voting common stock.
The dividend rights of all three classes of the Corporation's common stock are the same, and dividends may be paid on common stock only when, as, and if declared by Farmer Mac's board of directors in its sole discretion. From first quarter 2009 through fourth quarter 2011, Farmer Mac paid a quarterly dividend of $0.05 per share on all classes of the Corporation's common stock. On February 2, 2012, Farmer Mac's board of directors declared a quarterly dividend of $0.10 per share on the Corporation's common stock payable on March 30, 2012, which increased the quarterly dividend rate to the level paid
56
prior to 2009, and was paid quarterly through fourth quarter 2012. On February 6, 2013, Farmer Mac's board of directors declared a quarterly dividend of $0.12 per share on the Corporation's common stock payable on March 29, 2013. Farmer Mac expects to continue to pay comparable quarterly cash dividends for the foreseeable future, subject to the outlook and indicated capital needs of the Corporation and the determination of the board of directors. Farmer Mac's ability to pay dividends on its common stock is subject to the payment of dividends on its outstanding preferred stock. Farmer Mac's ability to declare and pay dividends could also be restricted if it were to fail to comply with regulatory capital requirements. See "Business—Government Regulation of Farmer Mac—Regulation—Capital Standards—Enforcement Levels." In addition, the FCA has recently proposed a rule that would require advance notice reporting of certain capital distributions to the FCA. If enacted, Farmer Mac would be required to provide the FCA with 15 business days' advance notice of any capital distribution, including dividends, if there is any change in the dividend from the prior dividend distribution period. See "Management's Discussion and Analysis—Regulatory Matters."
Information about securities authorized for issuance under Farmer Mac's equity compensation plans appears under "Equity Compensation Plans" in the Corporation's definitive proxy statement to be filed on or about April 26, 2013. That portion of the definitive proxy statement is incorporated by reference into this Annual Report on Form 10-K.
Farmer Mac is a federally chartered instrumentality of the United States, and its common stock is exempt from registration under Section 3(a)(2) of the Securities Act. Two types of transactions related to Farmer Mac common stock occurred during fourth quarter 2012 that were not registered under the Securities Act and not otherwise reported on a Current Report on Form 8-K:
|
•
|
On December 6, 2012, Farmer Mac granted stock appreciation rights under its 2008 Omnibus Incentive Plan with respect to 8,983 shares of Class C non-voting common stock, at an exercise price of $32.85 per share, to the newly appointed CEO as incentive compensation. This grant was contemplated under the newly appointed CEO's employment agreement, which was entered into effective December 6, 2012 and was previously reported on a Current Report on Form 8-K that was filed with the SEC on December 10, 2012.
|
|
•
|
On October 16, 2012, pursuant to Farmer Mac's policy that permits directors of Farmer Mac to elect to receive shares of Class C non-voting common stock in lieu of their cash retainers, Farmer Mac issued an aggregate of 136 shares of its Class C non-voting common stock to the four directors who elected to receive such stock in lieu of a portion of their cash retainers. The number of shares issued to the directors was calculated based on a price of $25.74 per share, which was the closing price of the Class C non-voting common stock on September 28, 2012, the last business day of the third quarter, as reported by the New York Stock Exchange.
|
57
Performance Graph
. The following graph compares the performance of Farmer Mac's Class A voting common stock and Class C non-voting common stock with the performance of the New York Stock Exchange Composite Index (the "NYSE Comp") and the Standard & Poor's 500 Diversified Financials Index (the "S&P 500 Div Fin") over the period from December 31, 2007 to December 31, 2012. The graph assumes that $100 was invested on December 31, 2007 in each of: Farmer Mac's Class A voting common stock; Farmer Mac's Class C non-voting common Stock; the NYSE Comp; and the S&P 500 Div Fin. The graph also assumes that all dividends were reinvested into the same securities throughout the past five years. Farmer Mac obtained the information contained in the performance graph from SNL Financial.
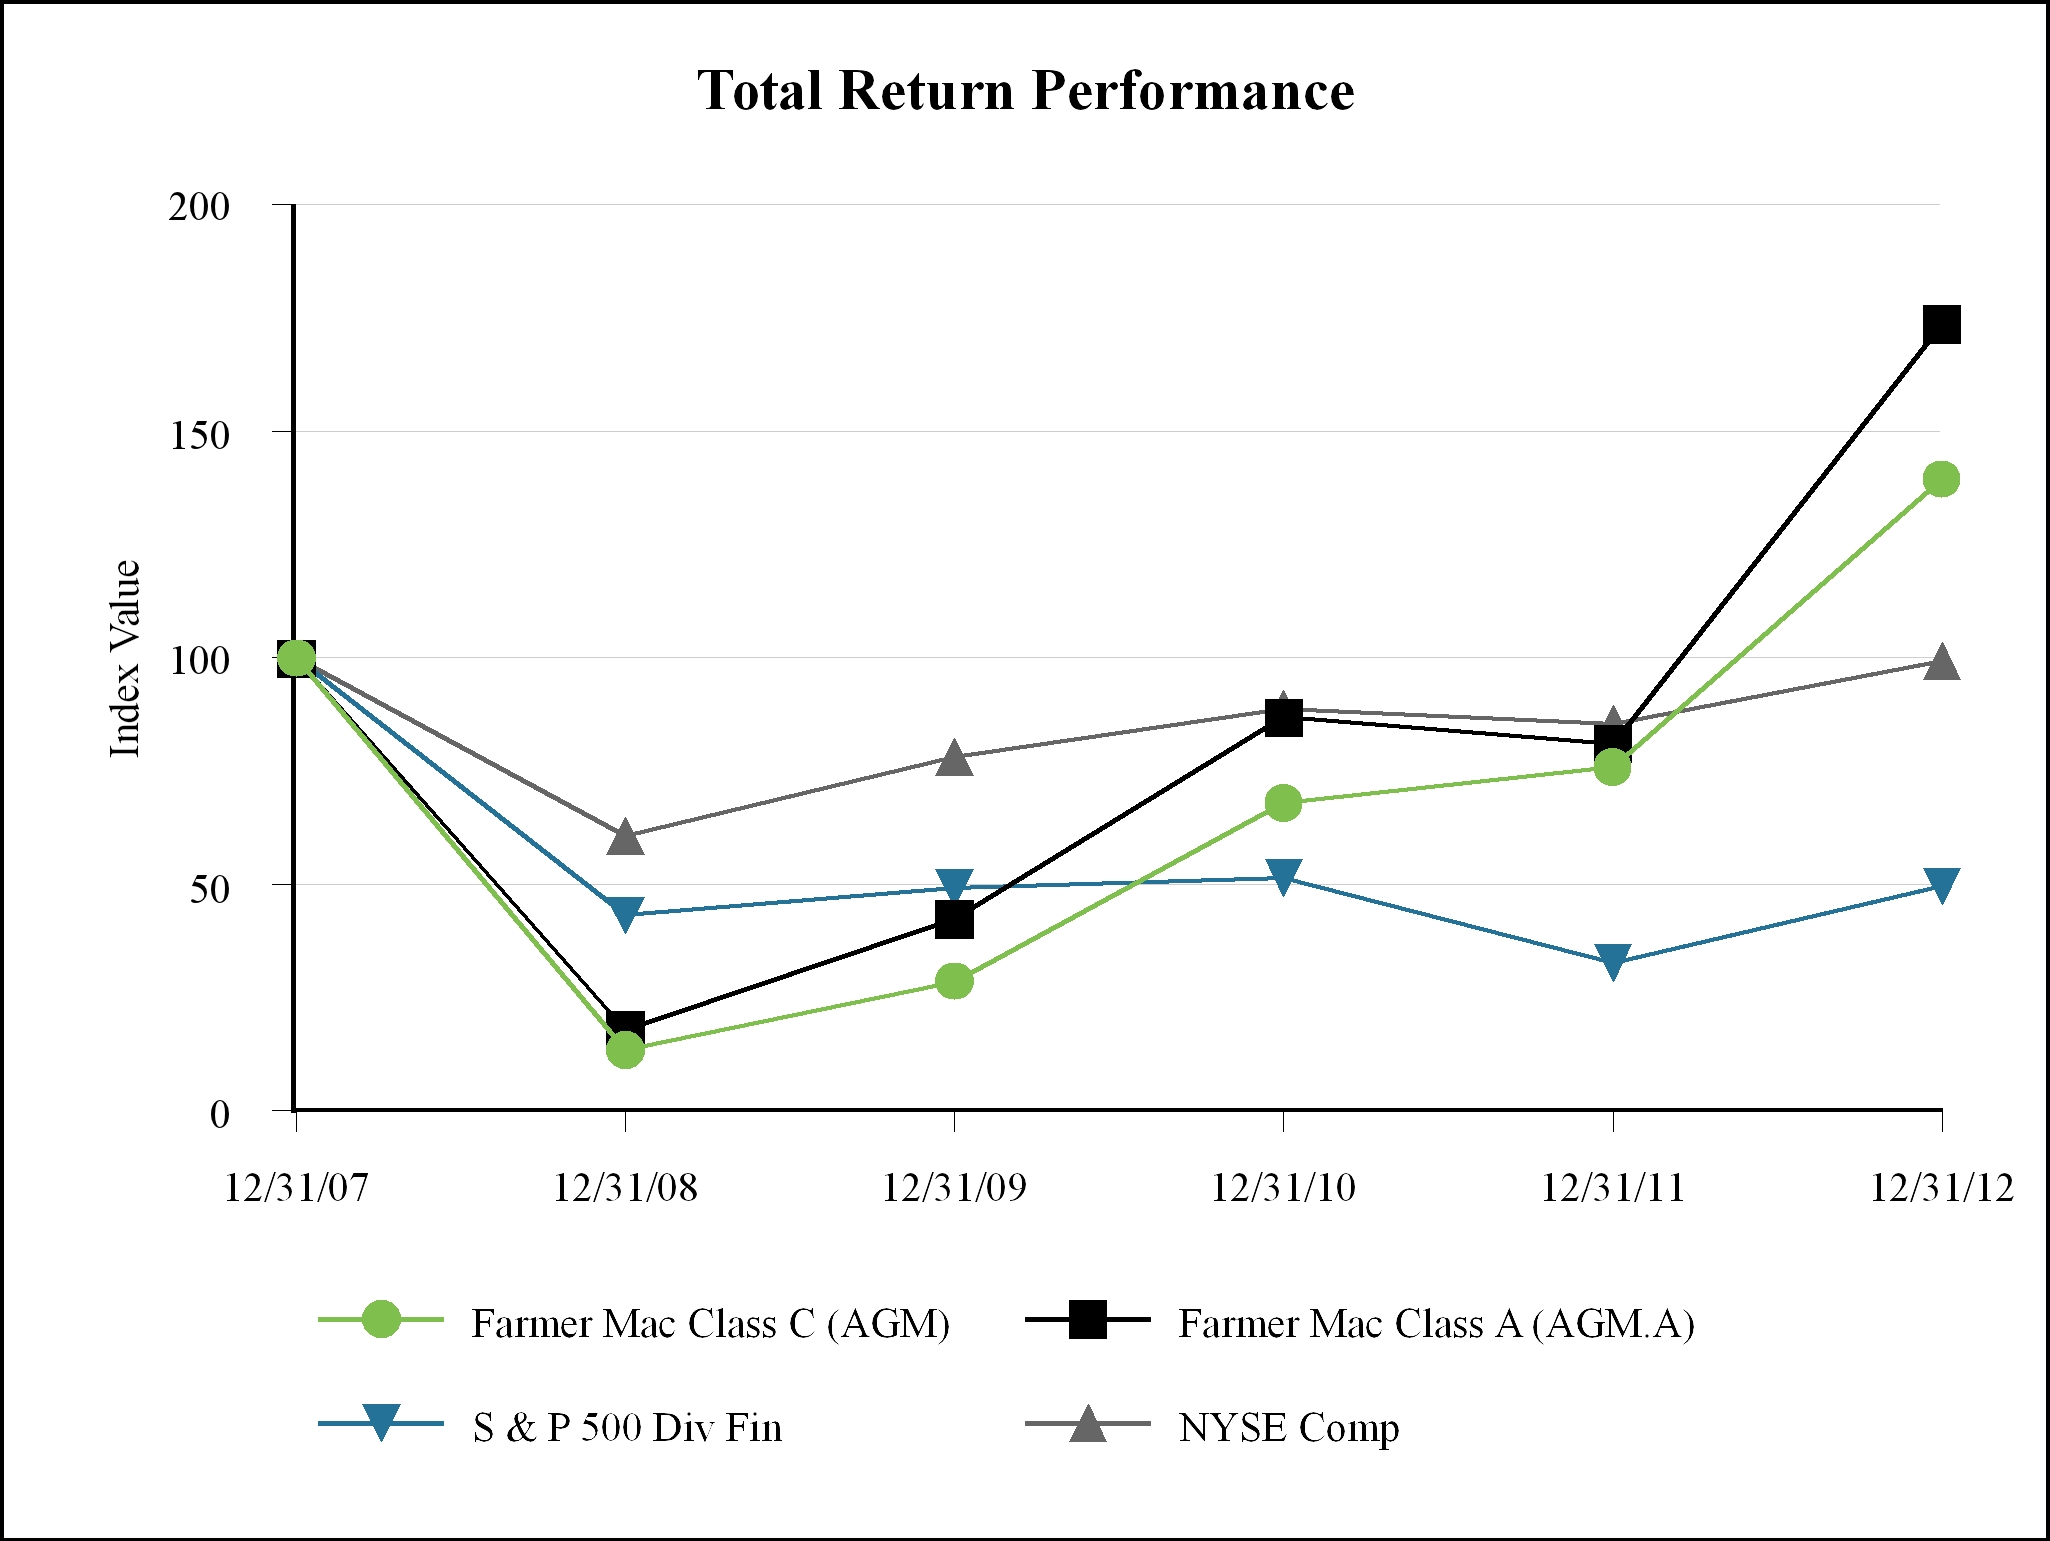
This performance graph shall not be deemed to be "soliciting material" or to be "filed" with the SEC, and this performance graph shall not be incorporated by reference into any of Farmer Mac's filings under the Securities Act or the Securities Exchange Act of 1934 and related regulations (collectively, the "Exchange Act"), or any other document, whether made before or after the date of this report and irrespective of any general incorporation language contained in a filing or document (except to the extent Farmer Mac specifically incorporates this section by reference into a filing or document).
|
(b)
|
Not applicable.
|
Farmer Mac did not repurchase any shares of its common stock during 2012, 2011, or 2010.
58
|
Item 6.
|
Selected Financial Data
|
The selected consolidated financial data presented below is summarized from Farmer Mac's consolidated balance sheet data as of December 31, 2012 and the five-year period then ended, as well as selected results of operations data for the five-year period then ended. This data should be reviewed in conjunction with the audited consolidated financial statements and related notes and with "Item 7—Management's Discussion and Analysis of Financial Condition and Results of Operations" included in this Annual Report on Form 10-K.
|
|
As of December 31,
|
||||||||||||||||||
|
Summary of Financial Condition:
|
2012
|
2011
|
2010
|
2009
|
2008
|
||||||||||||||
|
|
(dollars in thousands)
|
||||||||||||||||||
|
Cash and cash equivalents
|
$
|
785,564
|
|
$
|
817,046
|
|
$
|
729,920
|
|
$
|
654,794
|
|
$
|
278,412
|
|
||||
|
Investment securities
|
2,499,629
|
|
2,184,490
|
|
1,763,329
|
|
1,131,895
|
|
1,235,859
|
|
|||||||||
|
Farmer Mac Guaranteed Securities
|
4,766,258
|
|
4,289,272
|
|
2,907,264
|
|
3,398,996
|
|
2,451,244
|
|
|||||||||
|
USDA Guaranteed Securities
|
1,590,783
|
|
1,491,905
|
|
1,317,444
|
|
—
|
|
—
|
|
|||||||||
|
Loans, net
|
2,729,774
|
|
2,894,156
|
|
2,558,599
|
|
753,720
|
|
774,596
|
|
|||||||||
|
Total assets
|
12,622,201
|
|
11,883,508
|
|
9,479,914
|
|
6,138,813
|
|
5,107,307
|
|
|||||||||
|
Notes payable:
|
|
|
|
|
|
|
|
|
|||||||||||
|
Due within one year
|
6,567,366
|
|
6,087,879
|
|
4,509,419
|
|
3,662,898
|
|
3,757,099
|
|
|||||||||
|
Due after one year
|
5,034,739
|
|
4,104,882
|
|
3,430,656
|
|
1,908,713
|
|
887,999
|
|
|||||||||
|
Total liabilities
|
12,029,239
|
|
11,328,975
|
|
9,001,037
|
|
5,798,406
|
|
4,947,743
|
|
|||||||||
|
Mezzanine equity
|
—
|
|
—
|
|
—
|
|
144,216
|
|
144,216
|
|
|||||||||
|
Stockholders' equity
|
351,109
|
|
312,680
|
|
237,024
|
|
196,191
|
|
15,348
|
|
|||||||||
|
Non-controlling interest - preferred stock
|
241,853
|
|
241,853
|
|
241,853
|
|
—
|
|
—
|
|
|||||||||
|
Selected Financial Ratios:
|
|
|
|
|
|
|
|
|
|||||||||||
|
Return on average assets (1)
|
0.36
|
%
|
0.13
|
%
|
0.28
|
%
|
1.46
|
%
|
(3.06
|
)%
|
|||||||||
|
Return on average common equity (2)
|
16.00
|
%
|
6.34
|
%
|
13.88
|
%
|
113.70
|
%
|
(158.24
|
)%
|
|||||||||
|
Average equity to assets (3)
|
2.71
|
%
|
2.57
|
%
|
2.77
|
%
|
1.88
|
%
|
2.37
|
%
|
|||||||||
|
Average total equity to assets (4)
|
4.68
|
%
|
4.84
|
%
|
5.25
|
%
|
4.45
|
%
|
3.80
|
%
|
|||||||||
|
(1)
|
Calculated as net income/(loss) attributable to common stockholders divided by the simple average of beginning and ending total assets.
|
|
(2)
|
Calculated as net income/(loss) attributable to common stockholders divided by the simple average of beginning and ending stockholders' equity, net of preferred stock, at redemption value.
|
|
(3)
|
Calculated as the simple average of beginning and ending stockholders' equity divided by the simple average of beginning and ending total assets.
|
|
(4)
|
Calculated as the simple average of beginning and ending mezzanine equity, stockholders' equity and non-controlling interest - preferred stock divided by the simple average of beginning and ending total assets.
|
59
|
|
For the Year Ended December 31,
|
||||||||||||||||||
|
Summary of Operations:
|
2012
|
2011
|
2010
|
2009
|
2008
|
||||||||||||||
|
|
(in thousands, except per share amounts)
|
||||||||||||||||||
|
Interest Income:
|
|
|
|
|
|
|
|
|
|
|
|||||||||
|
Net interest income after provision for loan losses
|
$
|
118,289
|
|
$
|
120,695
|
|
$
|
94,150
|
|
$
|
83,055
|
|
$
|
74,184
|
|
||||
|
Non-interest income/(loss):
|
|
|
|
|
|
|
|||||||||||||
|
Guarantee and commitment fees
|
24,963
|
|
24,821
|
|
24,091
|
|
31,805
|
|
28,381
|
|
|||||||||
|
(Losses)/gains on financial derivatives, hedging activities and trading assets
|
(19,522
|
)
|
(89,190
|
)
|
(11,889
|
)
|
64,570
|
|
(141,042
|
)
|
|||||||||
|
Other-than-temporary impairment losses
|
—
|
|
—
|
|
—
|
|
(3,994
|
)
|
(106,240
|
)
|
|||||||||
|
Gains on asset sales and debt repurchases
|
18
|
|
269
|
|
266
|
|
4,934
|
|
2,689
|
|
|||||||||
|
Gains on the sale of real estate owned
|
878
|
|
974
|
|
10
|
|
—
|
|
—
|
|
|||||||||
|
Lower of cost or fair value adjustment on loans held for sale
|
(5,943
|
)
|
8,887
|
|
(8,748
|
)
|
(139
|
)
|
—
|
|
|||||||||
|
Other income
|
3,341
|
|
6,850
|
|
1,244
|
|
1,578
|
|
1,413
|
|
|||||||||
|
Non-interest income/(loss)
|
3,735
|
|
(47,389
|
)
|
4,974
|
|
98,754
|
|
(214,799
|
)
|
|||||||||
|
Non-interest expense
|
30,908
|
|
28,659
|
|
32,627
|
|
29,692
|
|
32,612
|
|
|||||||||
|
Income/(loss) before income taxes
|
91,116
|
|
44,647
|
|
66,497
|
|
152,117
|
|
(173,227
|
)
|
|||||||||
|
Income tax expense/(benefit)
|
22,156
|
|
5,797
|
|
13,797
|
|
52,517
|
|
(22,864
|
)
|
|||||||||
|
Net income/(loss)
|
68,960
|
|
38,850
|
|
52,700
|
|
99,600
|
|
(150,363
|
)
|
|||||||||
|
Less: Net income attributable to non-controlling interest - preferred stock dividends
|
(22,187
|
)
|
(22,187
|
)
|
(20,707
|
)
|
—
|
|
—
|
|
|||||||||
|
Preferred stock dividends
|
(2,879
|
)
|
(2,879
|
)
|
(4,129
|
)
|
(17,302
|
)
|
(3,717
|
)
|
|||||||||
|
Loss on retirement of preferred stock
|
—
|
|
—
|
|
(5,784
|
)
|
—
|
|
—
|
|
|||||||||
|
Net income/(loss) attributable to common stockholders
|
$
|
43,894
|
|
$
|
13,784
|
|
$
|
22,080
|
|
$
|
82,298
|
|
$
|
(154,080
|
)
|
||||
|
Allowance for Losses Activity:
|
|
|
|
|
|
|
|||||||||||||
|
Provision for/(release of) losses
|
$
|
1,875
|
|
$
|
(2,347
|
)
|
$
|
4,310
|
|
$
|
5,242
|
|
$
|
17,840
|
|
||||
|
Net charge-offs/(recoveries)
|
2,501
|
|
252
|
|
(1,618
|
)
|
7,490
|
|
5,292
|
|
|||||||||
|
Ending balance
|
16,890
|
|
17,516
|
|
20,115
|
|
14,187
|
|
16,435
|
|
|||||||||
|
Earnings Per Common Share and Dividends:
|
|
|
|
|
|
|
|||||||||||||
|
Basic earnings/(loss) per common share
|
$
|
4.19
|
|
$
|
1.32
|
|
$
|
2.16
|
|
$
|
8.12
|
|
$
|
(15.40
|
)
|
||||
|
Diluted earnings/(loss) per common share
|
3.98
|
|
1.28
|
|
2.08
|
|
8.04
|
|
(15.40
|
)
|
|||||||||
|
Common stock dividends per common share
|
0.40
|
|
0.20
|
|
0.20
|
|
0.20
|
|
0.40
|
|
|||||||||
|
Regulatory Capital:
|
|
|
|
|
|
|
|||||||||||||
|
Statutory minimum capital requirement
|
$
|
374,037
|
|
$
|
348,649
|
|
$
|
300,996
|
|
$
|
216,959
|
|
$
|
193,476
|
|
||||
|
Core capital
|
518,993
|
|
475,163
|
|
460,602
|
|
337,153
|
|
206,976
|
|
|||||||||
|
Minimum capital surplus
|
144,956
|
|
126,514
|
|
159,606
|
|
120,194
|
|
13,500
|
|
|||||||||
60
|
Item 7.
|
Management's Discussion and Analysis of Financial Condition and Results of Operations
|
Financial information included in this report is consolidated to include the accounts of Farmer Mac and its subsidiaries, Farmer Mac Mortgage Securities Corporation and Farmer Mac II LLC. Farmer Mac II LLC was formed as a Delaware limited liability company in December 2009 to operate substantially all of Farmer Mac's USDA Guarantees line of business – primarily the acquisition of USDA Guaranteed Securities. The business operations of Farmer Mac II LLC began in January 2010. Since then, Farmer Mac has operated only that part of the USDA Guarantees line of business that involves the issuance of Farmer Mac II Guaranteed Securities backed by USDA Guaranteed Securities to investors other than Farmer Mac or Farmer Mac II LLC. Although Farmer Mac II LLC may issue securities in these transactions, Farmer Mac II LLC does not guarantee any USDA Securities it holds or any Farmer Mac II Guaranteed Securities issued by Farmer Mac or Farmer Mac II LLC.
This discussion and analysis of financial condition and results of operations should be read together with Farmer Mac's consolidated financial statements and the related notes to the consolidated financial statements for the fiscal years ended
December 31, 2012
,
2011
, and
2010
.
The discussion below is not necessarily indicative of future results.
Forward-Looking Statements
Some statements made in this report are "forward-looking statements" within the meaning of the Private Securities Litigation Reform Act of 1995 pertaining to management's current expectations as to Farmer Mac's future financial results, business prospects, and business developments. Forward-looking statements include, without limitation, any statement that may predict, forecast, indicate, or imply future results, performance, or achievements, and typically are accompanied by, and identified with, such terms as "anticipates," "believes," "expects," "intends," "should," and similar phrases. The following management's discussion and analysis includes forward-looking statements addressing Farmer Mac's:
|
•
|
prospects for earnings;
|
|
•
|
prospects for growth in loan purchase, guarantee, securitization, and LTSPC volume;
|
|
•
|
trends in net interest income and net effective spread;
|
|
•
|
trends in portfolio credit quality, delinquencies, and provisions for losses;
|
|
•
|
trends in expenses;
|
|
•
|
trends in investment securities;
|
|
•
|
prospects for asset impairments and allowance for losses;
|
|
•
|
changes in capital position; and
|
|
•
|
other business and financial matters.
|
Management's expectations for Farmer Mac's future necessarily involve a number of assumptions and estimates and the evaluation of risks and uncertainties. Various factors or events could cause Farmer Mac's actual results to differ materially from the expectations as expressed or implied by the forward-looking statements, including the factors discussed under "Risk Factors" in Part I, Item 1A of this Annual Report on Form 10-K and uncertainties regarding:
|
•
|
the availability to Farmer Mac and Farmer Mac II LLC of debt financing and, if available, the reasonableness of rates and terms;
|
61
|
•
|
legislative or regulatory developments that could affect Farmer Mac or its sources of business, including but not limited to developments in relation to agricultural policies and programs contained in the current Farm Bill (the Food, Conservation and Energy Act of 2008), which is currently scheduled to expire in September 2013, or reduced funding for agricultural policies and programs as a result of federal budget cuts;
|
|
•
|
fluctuations in the fair value of assets held by Farmer Mac and Farmer Mac II LLC;
|
|
•
|
the rate and direction of development of the secondary market for agricultural mortgage and rural utilities loans, including lender interest in Farmer Mac credit products and the Farmer Mac secondary market;
|
|
•
|
the general rate of growth in agricultural mortgage and rural utilities indebtedness;
|
|
•
|
the impact of economic conditions, including the effects of drought and other weather-related conditions and fluctuations in agricultural real estate values, on agricultural mortgage lending and borrower repayment capacity;
|
|
•
|
developments in the financial markets, including possible investor, analyst, and rating agency reactions to events involving GSEs, including Farmer Mac;
|
|
•
|
financial market volatility;
|
|
•
|
changes in the level and direction of interest rates, which could among other things affect the value of collateral securing Farmer Mac's agricultural mortgage loan assets; and
|
|
•
|
volatility in commodity prices and/or export demand for U.S. agricultural products.
|
In light of these potential risks and uncertainties, no undue reliance should be placed on any forward-looking statements expressed in this report. Furthermore, Farmer Mac undertakes no obligation to release publicly the results of revisions to any forward-looking statements that may be made to reflect new information or any future events or circumstances, except as otherwise mandated by the SEC.
Overview
At the end of 2012, Farmer Mac's outstanding program volume and core earnings reached record levels, and asset quality continued to improve. Farmer Mac is prepared to build on these positive results while remaining committed to delivering stockholder value and fulfilling its mission and believes that its financial condition and earnings outlook remain strong. Consistent with this outlook, two developments that have already occurred in 2013 are noteworthy:
|
•
|
In January 2013, Farmer Mac replaced $57.6 million of cumulative preferred stock with $60.0 million of non-cumulative preferred stock. That transaction strengthened Farmer Mac’s overall capital position, lowered its projected long-term dividends, and broadened its investor base by tapping the retail investor market.
|
|
•
|
In February 2013, Farmer Mac announced that it would increase the quarterly dividend paid on all three classes of the Corporation’s common stock by 20 percent from the previous quarter. That dividend increase underscored Farmer Mac's confidence in its future financial performance and capital position.
|
Farmer Mac' outstanding program volume rose to an all-time high by the end of 2012. Farmer Mac's total outstanding loans, guarantees, and commitments exceeded
$13.0 billion
as of
December 31, 2012
, compared to
$11.9 billion
as of
December 31, 2011
, and
$12.2 billion
as of December 31,
2010
. Farmer Mac's overall outstanding program volume increased during
2012
because new business volume more
62
than offset paydowns and maturities during the year. Also, for the first time in its history, Farmer Mac purchased more than $1.0 billion of agricultural mortgage loans and USDA Guaranteed Securities in a single calendar year, reaching
$1.1 billion
in purchases during 2012. This purchase volume is more than double the level of the Corporation's purchase volume of agricultural mortgage loans and USDA Guaranteed Securities only five years ago, when Farmer Mac purchased $501 million of agricultural mortgage loans and USDA Guaranteed Securities during 2008.
Farmer Mac's GAAP net income attributable to common stockholders for
2012
was
$43.9 million
, compared to
$13.8 million
for
2011
, and
$22.1 million
for
2010
. The increase in Farmer Mac's GAAP net income compared to the prior years was almost entirely attributable to the effects of fair value changes on financial derivatives. Because Farmer Mac's financial derivatives were not designated in hedge relationships for accounting purposes prior to third quarter 2012, changes in the fair values of these instruments were recorded in earnings, without offsetting fair value adjustments on the corresponding hedged items. As a result, movements in long-term interest rates have historically created significant volatility in Farmer Mac's periodic GAAP earnings due to changes in the fair values of financial derivatives.
Beginning in third quarter 2012, Farmer Mac designated
$950.0 million
notional amount of interest rate swaps in fair value hedge relationships. Accordingly, Farmer Mac records in earnings offsetting fair value adjustments on the hedged items attributable to the risk being hedged. For the year ended
December 31, 2012
, Farmer Mac recorded unrealized fair value gains of
$6.7 million
on its financial derivatives and hedging activities. This compares to unrealized fair value losses on financial derivatives of
$47.6 million
for
2011
and gains of
$20.1 million
for
2010
. Because Farmer Mac expects its fair value hedge relationships to remain highly effective through maturity, a substantial portion of the volatility caused from changes in the fair values of financial derivatives is expected to be eliminated in future periods.
Farmer Mac's non-GAAP core earnings for
2012
were a record
$49.6 million
, continuing the upward trend from
$42.9 million
in
2011
, and
$25.4 million
in
2010
. Core earnings for
2012
benefited from higher net effective spread of
$106.6 million
(
95
basis points), compared to
$89.4 million
(
96
basis points) in
2011
, and
$66.5 million
(
106
basis points) in
2010
. This higher net effective spread was partially offset by net provisions to the allowance for losses of $1.9 million in 2012, compared to net releases from the allowance for losses of $2.3 million in 2011, and net provisions to the allowance for losses of $4.3 million in 2010. In addition, both GAAP net income and core earnings for 2012 were negatively affected by the severance payment made to Farmer Mac's former President and Chief Executive Officer in connection with the termination of his employment in October 2012. The severance payment made to the former executive resulted in a net after-tax expense of $1.0 million during fourth quarter 2012.
Farmer Mac uses core earnings to measure corporate economic performance and develop financial plans because, in management's view, core earnings is a useful alternative measure in understanding Farmer Mac's economic performance, transaction economics, and business trends. Core earnings differs from GAAP net income by excluding the effects of fair value accounting guidance, which are not expected to have a permanent effect on capital. Core earnings also differs from GAAP net income by excluding specified infrequent or unusual transactions that Farmer Mac believes are not indicative of future operating results and that may not reflect the trends and economic financial performance of the Corporation's core business. This non-GAAP financial measure may not be comparable to similarly labeled non-GAAP financial measures disclosed by other companies. Farmer Mac's disclosure of this non-GAAP measure is not intended to replace GAAP information but, rather, to supplement it. Further
63
discussion of Farmer Mac's financial results and a reconciliation of Farmer Mac's GAAP net income attributable to common stockholders to core earnings is presented in "—Results of Operations."
The loans included in the Farm & Ranch and Rural Utilities lines of business continued to perform well during
2012
. As of
December 31, 2012
, Farmer Mac's 90-day delinquencies in the Farm & Ranch line of business were
$33.3 million
(
0.70
percent of the non-AgVantage Farm & Ranch portfolio), down from
$40.8 million
(
0.93 percent
) as of September 30, 2012, and
$40.6 million
(
0.93
percent) as of
December 31, 2011
. The drought conditions experienced in the Midwest and Great Plains during 2012 caused significant deterioration in the yields of feed grains, although the higher prices for these commodities during the past year as well as the availability of crop insurance has significantly mitigated any negative effects that the drought may otherwise have had on feed grains producers. Although Farmer Mac continues to monitor the drought's effects, as of
December 31, 2012
, the drought has had no measurable impact on the credit quality of Farmer Mac's portfolio. Farmer Mac believes that it generally remains well-collateralized on its exposures in drought areas and that there are no additional probable losses inherent in the portfolio as of
December 31, 2012
due to the drought conditions.
When analyzing the overall risk profile of its eligible loan lines of business, Farmer Mac takes into account more than the loan delinquency percentages in its Farm & Ranch line of business. The total eligible loan lines of business includes AgVantage securities and rural utilities loans, neither of which had any delinquencies as of
December 31, 2012
, and USDA Guaranteed Securities, which are backed by the full faith and credit of the United States. Across Farmer Mac's entire eligible loan lines of business, 90-day delinquencies represented
0.26 percent
of total eligible loan lines of business as of
December 31, 2012
, compared to
0.33 percent
as of September 30, 2012, and
0.34 percent
as of
December 31, 2011
.
As of
December 31, 2012
, Farmer Mac's core capital of
$519.0 million
exceeded its minimum capital requirement of
$374.0 million
by
$145.0 million
. As noted, Farmer Mac issued $60.0 million of non-cumulative perpetual preferred stock in January 2013, and used the proceeds to redeem and retire all $57.6 million of its issued and outstanding Series C Preferred Stock. This transaction furthers Farmer Mac's ability to meet the financing needs of rural America as opportunities arise during 2013 and in the future. See "—Outlook" for further discussion about the opportunities that Farmer Mac foresees for future business growth.
Critical Accounting Policies and Estimates
The preparation of Farmer Mac's consolidated financial statements in conformity with GAAP requires the use of estimates and assumptions that affect the amounts reported in the consolidated financial statements and related notes for the periods presented. Actual results could differ from those estimates. The critical accounting policies that are both important to the portrayal of Farmer Mac's financial condition and results of operations and require complex, subjective judgments are the accounting policies for: (1) the allowance for losses, (2) fair value measurement, and (3) other-than-temporary impairment.
Allowance for Losses
Farmer Mac maintains an allowance for losses to cover estimated probable losses incurred as of the balance sheet date on loans held ("allowance for loan losses") and loans underlying LTSPCs and Farmer Mac Guaranteed Securities ("reserve for losses") based on available information. Farmer Mac's methodology for determining the allowance for losses separately considers its portfolio segments – Farm
64
& Ranch, USDA Guarantees, and Rural Utilities, and disaggregates its analysis, where relevant, into classes of financing receivables, which currently include loans and AgVantage securities. Further disaggregation by commodity type is performed, where appropriate, in analyzing the need for an allowance for losses.
The allowance for losses is increased through periodic provisions for loan losses that are charged against net interest income and provisions for losses that are charged to non-interest expense and is reduced by charge-offs for actual losses, net of recoveries. Charge-offs represent losses on the outstanding principal balance, any interest payments previously accrued or advanced and expected costs of liquidation. Negative provisions, or releases of allowance for losses, are recorded in the event that the estimate of probable losses as of the end of a period is lower than the estimate at the beginning of the period.
The total allowance for losses consists of a general allowance for losses and a specific allowance for impaired loans.
General Allowance for Losses
Farm & Ranch
Farmer Mac's methodology for determining its general allowance for losses incorporates the Corporation's automated loan classification system. That system scores loans based on criteria such as historical repayment performance, indicators of current financial condition, loan seasoning, loan size and loan-to-value ratio. For the purposes of the loss allowance methodology, the loans in Farmer Mac's portfolio of loans and loans underlying Farmer Mac I Guaranteed Securities and LTSPCs have been scored and classified for each calendar quarter since first quarter 2000. The allowance methodology captures the migration of loan scores across concurrent and overlapping three-year time horizons and calculates loss rates separately within each loan classification for (1) loans underlying LTSPCs and (2) loans held and loans underlying Farmer Mac I Guaranteed Securities. The calculated loss rates are applied to the current classification distribution of unimpaired loans in Farmer Mac's portfolio to estimate inherent losses, on the assumption that the historical credit losses and trends used to calculate loss rates will continue in the future. Management evaluates this assumption by taking into consideration various factors, including:
|
•
|
economic conditions;
|
|
•
|
geographic and agricultural commodity/product concentrations in the portfolio;
|
|
•
|
the credit profile of the portfolio;
|
|
•
|
delinquency trends of the portfolio;
|
|
•
|
historical charge-off and recovery activities of the portfolio; and
|
|
•
|
other factors to capture current portfolio trends and characteristics that differ from historical experience.
|
Management believes that its use of this methodology produces a reasonable estimate of probable losses, as of the balance sheet date, for all loans included in the Farm & Ranch portfolio, including loans held and loans underlying Farmer Mac I Guaranteed Securities and LTSPCs.
Farmer Mac has not provided an allowance for losses for loans underlying Farmer Mac I AgVantage securities. Each AgVantage security is a general obligation of an issuing institution approved by Farmer Mac and is secured by eligible loans in an amount at least equal to the outstanding principal amount of the security, with some level of overcollateralization also required for Farmer Mac I AgVantage
65
securities. Farmer Mac excludes the loans that secure AgVantage securities from the credit risk metrics it discloses because of the credit quality of the issuing institutions, the collateralization level for the securities, and because delinquent loans are required to be removed from the pool of pledged loans and replaced with current eligible loans.
USDA Guarantees
No allowance for losses has been provided for USDA Guaranteed Securities or Farmer Mac II Guaranteed Securities. The USDA Guaranteed Securities on the consolidated balance sheets, as well as those that collateralize Farmer Mac II Guaranteed Securities, are guaranteed by the USDA. Each USDA guarantee is an obligation backed by the full faith and credit of the United States. Farmer Mac excludes these guaranteed portions from the credit risk metrics it discloses because of the USDA guarantee.
Rural Utilities
Farmer Mac separately evaluates the rural utilities loans it owns, as well as the lender obligations and loans underlying or securing its Farmer Mac Guaranteed Securities – Rural Utilities, including AgVantage securities, to determine if there are any probable losses inherent in those assets. Each AgVantage security is a general obligation of an issuing institution approved by Farmer Mac and is secured by eligible loans in an amount at least equal to the outstanding principal amount of the security. Farmer Mac has not provided an allowance for losses for the portfolio segment related to the Rural Utilities program, based on the credit quality of the collateral supporting rural utilities assets and Farmer Mac's counterparty risk analysis.
Specific Allowance for Impaired Loans
Farmer Mac also analyzes certain loans in its portfolio for impairment in accordance with accounting guidance on measuring individual impairment of a loan. Farmer Mac's impaired loans generally include loans
90 days
or more past due, in foreclosure, restructured, in bankruptcy and certain performing loans that have previously been delinquent or are secured by real estate that produces agricultural commodities or products currently under stress.
For loans with an updated appraised value, other updated collateral valuation, or management's estimate of discounted collateral value, this analysis includes the measurement of the fair value of the underlying collateral for individual loans relative to the total recorded investment, including principal, interest, and advances and net of any charge-offs. In the event that the collateral value does not support the total recorded investment, Farmer Mac specifically provides an allowance for the loan for the difference between the recorded investment and its fair value, less estimated costs to liquidate the collateral. Estimated selling costs are based on historical selling costs incurred by Farmer Mac or management's best estimate of selling costs for a particular property. For the remaining impaired assets without updated valuations, this analysis is performed in the aggregate in consideration of the similar risk characteristics of the assets and historical statistics. Farmer Mac considers appraisals aged more than two years as of the reporting period end date to be outdated.
Farmer Mac uses a risk-based approach in determining the necessity of obtaining updated appraisals on impaired loans. For example, larger exposures associated with highly improved and specialized collateral will generally receive updated appraisals once the loans are identified as impaired. In addition, updated appraisals are always obtained during the foreclosure process. Depending on the risk factors associated with the loan and underlying collateral, which can vary widely depending on the circumstances of the loan
66
and collateral, this can occur early in the foreclosure process, while in other instances this may occur just prior to the transfer of title. As part of its routine credit review process, Farmer Mac often will exercise judgment in discounting an appraisal value due to local real estate trends or the condition of the property (e.g., following an inspection by Farmer Mac or the servicer). In addition, a property appraisal value may be discounted based on the market's reaction to Farmer Mac's asking price for sale of the property.
Further information regarding the allowance for losses is included in "—Risk Management—Credit Risk – Loans" and Note 2(j) to the consolidated financial statements.
Fair Value Measurement
A significant portion of Farmer Mac's assets consists of financial instruments that are measured at fair value in the consolidated balance sheets. For financial instruments that are complex in nature or for which observable inputs are not available, the measurement of fair value requires significant management
judgments and assumptions. These judgments and assumptions, as well as changes in market conditions, may have a material impact on the consolidated balance sheets and statements of operations.
Accounting guidance on fair value measurements defines fair value as the price that would be received to sell an asset or paid to transfer a liability in an orderly transaction between market participants at the measurement date (also referred to as an exit price) and establishes a hierarchy for ranking fair value measurements. In determining fair value, Farmer Mac uses various valuation approaches, including market and income approaches. The fair value hierarchy requires an entity to maximize the use of observable inputs and minimize the use of unobservable inputs when measuring fair value. When available, the fair value of Farmer Mac's financial instruments is based on quoted market prices, valuation techniques that use observable market-based inputs, or unobservable inputs that are corroborated by market data. Pricing information obtained from third parties is internally validated for reasonableness prior to use in the consolidated financial statements.
When observable market prices are not readily available, Farmer Mac estimates fair value using techniques that rely on alternate market data or internally developed models using significant inputs that are generally less readily observable. Market data includes prices of financial instruments with similar maturities and characteristics, interest rate yield curves, measures of volatility, and prepayment rates. If market data needed to estimate fair value is not available, Farmer Mac estimates fair value using internally-developed models that employ a discounted cash flow approach. Even when market assumptions are not readily available, Farmer Mac's assumptions reflect those that market participants would likely use in pricing the asset or liability at the measurement date.
Farmer Mac's assets and liabilities presented at fair value in the consolidated balance sheets on a recurring basis include investment securities, Farmer Mac Guaranteed Securities, USDA Guaranteed Securities, and financial derivatives. The changes in fair value from period to period are recorded either in the consolidated balance sheets to accumulated other comprehensive income or in the consolidated statements of operations as gains/(losses) on financial derivatives and hedging activities or gains/(losses) on trading assets.
The fair value hierarchy ranks the quality and reliability of the information used to determine fair values. The hierarchy gives highest priority to unadjusted quoted prices in active markets for identical assets or liabilities and the lowest priority to unobservable inputs. The accounting guidance describes the following three levels used to classify fair value measurements:
67
|
Level 1
|
Unadjusted quoted prices in active markets that are accessible at the measurement date for identical, unrestricted assets or liabilities.
|
|
Level 2
|
Quoted prices in markets that are not active or financial instruments for which all significant inputs are observable, either directly or indirectly.
|
|
Level 3
|
Prices or valuations that require unobservable inputs that are significant to the fair value measurement.
|
As of
December 31, 2012
, Farmer Mac's assets and liabilities recorded at fair value included financial instruments valued at
$7.1 billion
whose fair values were estimated by management in the absence of readily determinable fair values (i.e., level 3). These financial instruments measured as level 3 represented
56 percent
of total assets and
73 percent
of financial instruments measured at fair value as of
December 31, 2012
.
Assets underlying (or, in the case of USDA Guaranteed Securities, consisting of) these financial instruments measured as level 3 primarily include the following:
|
Type of Financial Instrument
|
|
Underlying Assets
|
|
Farmer Mac I Guaranteed Securities
|
|
General obligations of various issuers that are secured by agricultural real estate loans eligible under the standards for the Farm & Ranch line of business.
|
|
|
|
|
|
Farmer Mac II Guaranteed Securities
|
|
Portions of loans guaranteed by the USDA pursuant to the Consolidated Farm Rural Development Act.
|
|
|
|
|
|
USDA Guaranteed Securities
|
|
Portions of loans guaranteed by the USDA pursuant to the Consolidated Farm Rural Development Act.
|
|
|
|
|
|
Farmer Mac Guaranteed Securities – Rural Utilities
|
|
General obligations of currently only CFC that are secured by rural utilities loans.
|
|
|
|
|
|
Auction-rate certificates ("ARCs")
|
|
Guaranteed student loans that are backed by the full faith and credit of the United States.
|
Further information regarding fair value measurement is included in Note 13 to the consolidated financial statements.
Other-than-Temporary Impairment of Investment Securities
If the fair value of a security is less than its amortized cost basis as of the balance sheet date, Farmer Mac assesses whether the impairment is temporary or other-than-temporary. Other-than-temporary impairment occurs when the fair value of an available-for-sale security is below its amortized cost, and it is determined that management (1) has the intent to sell the security or (2) more likely than not will be required to sell the security before its anticipated recovery. In these cases, the entire difference between the amortized cost basis of the security and the fair value as of the balance sheet date is recognized as other-than-temporary impairment in earnings.
68
For debt securities, if management does not intend to sell the security and it is not more likely than not that it will be required to sell the security before anticipated recovery, Farmer Mac determines whether a credit loss exists. Many factors considered in this determination involve significant judgment, including recent events specific to the issuer or the related industry, changes in external credit ratings, the severity and duration of the impairment, recoveries or additional declines in fair value subsequent to the balance sheet date, and other relevant information related to the collectability of the security. If Farmer Mac determines that the present value of the cash flows likely to be collected from the security is greater than the amortized cost basis of the security, the impairment is deemed to be temporary. Conversely, if the present value of the cash flows likely to be collected is less than the amortized cost basis of the security, a credit loss has occurred and the security is deemed to be other-than-temporarily impaired and the amount of the total other-than-temporary impairment related to the credit loss is recognized in earnings. The amount of the total other-than-temporary impairment related to all other factors is recognized in other comprehensive income, net of applicable taxes.
Results of Operations
Farmer Mac's GAAP net income attributable to common stockholders for
2012
was
$43.9 million
or
$3.98
per diluted common share, compared to
$13.8 million
or
$1.28
per diluted common share for
2011
, and
$22.1 million
or
$2.08
per diluted common share for
2010
.
Farmer Mac's non-GAAP core earnings were
$49.6 million
or
$4.51
per diluted common share in
2012
, compared to
$42.9 million
or
$3.97
per diluted common share in
2011
, and
$25.4 million
or
$2.39
per diluted common share in
2010
.
The adjustments required to reconcile from GAAP net income attributable to common stockholders to Farmer Mac's core earnings are related principally to the effects of fair value accounting guidance that may cause volatility in periodic GAAP earnings but are not expected to have a cumulative net impact on GAAP earnings if the financial instruments are held to maturity, as is generally expected. Adjustments are also made to exclude specified infrequent or unusual transactions that Farmer Mac believes are not indicative of future operating results and that may not reflect the trends and economic financial performance of the Corporation's core business.
69
A reconciliation of Farmer Mac's GAAP net income attributable to common stockholders to core earnings is presented in the following table, and the adjustments are described in more detail below the table:
|
Reconciliation of GAAP Net Income Attributable to Common Stockholders to Core Earnings
|
|||||||||||
|
|
For the Year Ended December 31,
|
||||||||||
|
|
2012
|
2011
|
2010
|
||||||||
|
|
(in thousands, except per share amounts)
|
||||||||||
|
GAAP net income attributable to common stockholders
|
$
|
43,894
|
|
$
|
13,784
|
|
$
|
22,080
|
|
||
|
Less the after-tax effects of:
|
|
|
|
|
|
|
|||||
|
Unrealized gains/(losses) on financial derivatives and hedging activities
|
4,325
|
|
(30,930
|
)
|
13,046
|
|
|||||
|
Unrealized gains on trading assets
|
200
|
|
2,246
|
|
3,426
|
|
|||||
|
Amortization of premiums and deferred gains on assets consolidated at fair value
|
(7,266
|
)
|
(3,692
|
)
|
(7,617
|
)
|
|||||
|
Net effects of settlements on agency forward contracts
|
856
|
|
(2,523
|
)
|
(670
|
)
|
|||||
|
Lower of cost or fair value adjustment on loans held for sale
|
(3,863
|
)
|
5,776
|
|
(5,686
|
)
|
|||||
|
Issuance costs on the retirement of preferred stock
|
—
|
|
—
|
|
(5,784
|
)
|
|||||
|
Sub-total
|
(5,748
|
)
|
(29,123
|
)
|
(3,285
|
)
|
|||||
|
Core earnings
|
$
|
49,642
|
|
$
|
42,907
|
|
$
|
25,365
|
|
||
|
Core earnings per share:
|
|||||||||||
|
Basic
|
$
|
4.74
|
|
$
|
4.15
|
|
$
|
2.48
|
|
||
|
Diluted
|
4.51
|
|
3.97
|
|
2.39
|
|
|||||
|
Weighted-average shares:
|
|||||||||||
|
Basic
|
10,479
|
|
10,335
|
|
10,229
|
|
|||||
|
Diluted
|
11,019
|
|
10,802
|
|
10,615
|
|
|||||
Derivatives are required to be recognized as either assets or liabilities on the consolidated balance sheet and measured at fair value. Because Farmer Mac's financial derivatives were not designated in hedge relationships for accounting purposes prior to third quarter 2012, changes in the fair value of these instruments were recorded in earnings as they occurred, with no fair value adjustments on the corresponding hedged items. In an effort to mitigate volatility in GAAP earnings caused from these fair value changes, Farmer Mac previously elected the fair value option for certain investment securities and Farmer Mac Guaranteed Securities that were funded or hedged principally with financial derivatives. Farmer Mac classifies these assets as trading and measures them at fair value, with changes in fair value recorded in earnings as they occur.
Effective July 1, 2012, Farmer Mac designated $950.0 million notional amount of interest rate swaps in fair value hedge relationships. Beginning in third quarter 2012, Farmer Mac recorded in earnings offsetting fair value adjustments on the hedged items attributable to the risk being hedged. Any differences arising from fair value changes that are not offset result in hedge ineffectiveness and affect GAAP earnings. Farmer Mac excludes the after-tax effect of unrealized gains and losses resulting from changes in the fair values of financial derivatives and hedging activities from core earnings.
Farmer Mac recorded unrealized gains of
$6.7 million
(
$4.3 million
after-tax) for fair value changes on its financial derivatives and hedging activities for
2012
, compared to unrealized losses of
$47.6 million
(
$30.9 million
after-tax) in
2011
, and unrealized gains of
$20.1 million
(
$13.0 million
after-tax) in
2010
. Unrealized fair value gains on trading assets totaled
$0.3 million
(
$0.2 million
after-tax) for
2012
, compared to
$3.5 million
(
$2.2 million
after-tax) for
2011
, and
$5.3 million
(
$3.4 million
after-tax) for
2010
. Changes in the fair values of financial derivatives and trading assets have historically contributed
70
significant volatility to Farmer Mac's periodic GAAP earnings. Because Farmer Mac expects its fair value hedge relationships to remain highly effective through maturity, a substantial portion of the volatility caused from changes in the fair values of financial derivatives is expected to be eliminated in future periods. As of
December 31, 2012
, the cumulative fair value of after-tax losses recorded on financial derivatives was
$77.7 million
. Over time, Farmer Mac will realize in earnings the net effect of the cash settlements on its interest rate swap contracts, which will on its own produce either income or expense, but is expected to generate positive net effective spread when combined with the interest received and paid on the assets and liabilities Farmer Mac holds on its balance sheet. Any positive net effective spread would continue to build retained earnings and capital over time.
In 2010, Farmer Mac consolidated certain variable interest entities ("VIEs") where Farmer Mac held beneficial interests in trusts used as vehicles for securitization. Prior to consolidation, Farmer Mac classified these assets as trading Farmer Mac Guaranteed Securities because of a fair value option election made previously. As such, these assets were measured at fair value and the unrealized gains and losses resulting from changes in fair value were excluded from Farmer Mac's core earnings. Upon consolidation, these assets were transferred to loans held for investment in consolidated trusts at their fair value, which resulted in an unamortized premium of
$42.7 million
. This premium is being amortized into interest income over the contractual lives of the underlying assets.
Also in 2010, Farmer Mac contributed substantially all of the assets, in excess of
$1.1 billion
, comprising the USDA Guarantees line of business to a subsidiary, Farmer Mac II LLC. The contributed assets included Farmer Mac II Guaranteed Securities and USDA Guaranteed Securities that were designated as either available-for-sale or trading, depending on whether a fair value option election had been made previously. Farmer Mac transferred these assets at their fair value, which resulted in an unamortized premium of
$39.1 million
being recorded by Farmer Mac II LLC. This premium is being amortized into interest income over the estimated remaining lives of the USDA Guaranteed Securities that were transferred.
At the time of transfer, Farmer Mac had after-tax unrealized gains of
$7.0 million
recorded in accumulated other comprehensive income related to changes in the fair value of the contributed securities designated as available-for-sale. These gains are being amortized into other income based on the estimated remaining lives of the related USDA Guaranteed Securities. On a consolidated basis, the amortization of these gains will offset the premium amortization on the contributed securities designated as available-for-sale.
The after-tax net effect of the amortization of the premiums and deferred gains described above are shown as amortization of premiums and deferred gains on assets consolidated at fair value in the table above. Farmer Mac excludes these items from core earnings because they are not expected to have an economic effect on Farmer Mac's financial performance if the assets are held to maturity, as is generally expected. As of
December 31, 2012
,
$46.1 million
of these premiums were still outstanding and
$2.5 million
of after-tax gains remained deferred in accumulated other comprehensive income.
Farmer Mac routinely enters into forward sales contracts on the debt of other GSEs to reduce its interest rate exposure on forecasted future debt issuances. In its calculation of core earnings, Farmer Mac reverses the gains or losses resulting from the net settlement of these contracts in the period of settlement and amortizes them over the estimated lives of the associated debt issuances. The after-tax net effect of these items is shown as net effect of settlements on agency forward contracts in the table above. Changes in the fair values of these contracts prior to net settlement are excluded from Farmer Mac's core earnings and are captured in unrealized gains/(losses) on financial derivatives and hedging activities in the table above.
71
Farmer Mac's portfolio of loans held for sale is reported at the lower of cost or fair value and is subject to fair value adjustments in certain periods. These periodic unrealized gains and losses recorded to adjust the carrying value of loans held for sale to the lower of cost or fair value are excluded from Farmer Mac's core earnings. Farmer Mac recorded unrealized losses of
$5.9 million
(
$3.9 million
after-tax) in 2012, compared to unrealized gains of
$8.9 million
(
$5.8 million
after-tax) in 2011, and unrealized losses of $8.7 million ($5.7 million after-tax) in 2010. These amounts were recorded to adjust the carrying values of loans held for sale to their estimated fair value or to reverse previously recorded unrealized losses as the estimated fair values of these loans increased above their cost amounts.
The following sections provide more detail regarding specific components of Farmer Mac's results of operations.
Net Interest Income
. Net interest income was
$122.0 million
for
2012
,
$121.3 million
for
2011
, and
$96.0 million
for
2010
. The increase in net interest income in 2012 and 2011 was primarily attributable to purchases of AgVantange securities throughout 2012 and 2011 that Farmer Mac held on balance sheet. The overall net interest yield was
105
basis points for the year ended
December 31, 2012
, compared to
120
basis points and
130
basis points for the years ended
December 31, 2011
and
2010
, respectively.
The following table provides information regarding interest-earning assets and funding for the years ended
December 31, 2012
,
2011
, and
2010
. The average balance of non-accruing loans is included in the average balance of loans, Farmer Mac Guaranteed Securities and USDA Guaranteed Securities presented, though the related income is accounted for on a cash basis. Therefore, as the average balance of non-accruing loans and the income received increases or decreases, the net interest yield will fluctuate accordingly. The average balance of consolidated loans with beneficial interests owned by third parties is disclosed in the net effect of consolidated trusts and is not included in the average balances of interest-earning assets and interest-bearing liabilities. The interest income and expense associated with these trusts are shown in the net effect of consolidated trusts. The average rate earned on cash and investments reflects lower short-term market rates during 2012 compared to 2011 and 2010. The lower average rate on loans, Farmer Mac Guaranteed Securities and USDA Guaranteed Securities during 2012 reflects the decline in market rates reflected in the rates on loans acquired or reset during the past year. The lower average rate on Farmer Mac's notes payable due within one year is consistent with general trends in average short-term rates during the periods presented. The downward trend in the average rate on notes payable due after one year reflects the retirement of older debt and the issuance of new debt at lower market rates.
72
|
|
For the Year Ended December 31,
|
|||||||||||||||||||||||||||||||
|
|
2012
|
2011
|
2010
|
|||||||||||||||||||||||||||||
|
Average
Balance |
Income/
Expense |
Average
Rate |
Average
Balance |
Income/
Expense |
Average
Rate |
Average
Balance |
Income/
Expense |
Average
Rate |
||||||||||||||||||||||||
|
|
(dollars in thousands)
|
|||||||||||||||||||||||||||||||
|
Interest-earning assets:
|
|
|
|
|
|
|
|
|
||||||||||||||||||||||||
|
Cash and investments
|
$
|
3,020,264
|
|
$
|
24,729
|
|
0.82
|
%
|
$
|
2,503,513
|
|
$
|
28,117
|
|
1.12
|
%
|
$
|
1,654,998
|
|
$
|
27,497
|
|
1.66
|
%
|
||||||||
|
Loans, Farmer Mac Guaranteed Securities and USDA Guaranteed Securities (1)
|
8,225,582
|
|
221,949
|
|
2.70
|
%
|
6,858,866
|
|
209,611
|
|
3.06
|
%
|
4,630,430
|
|
155,001
|
|
3.35
|
%
|
||||||||||||||
|
Total interest-earning assets
|
11,245,846
|
|
246,678
|
|
2.19
|
%
|
9,362,379
|
|
237,728
|
|
2.54
|
%
|
6,285,428
|
|
182,498
|
|
2.90
|
%
|
||||||||||||||
|
Funding:
|
|
|
|
|
|
|
|
|
|
|
|
|
||||||||||||||||||||
|
Notes payable due within one year
|
5,266,520
|
|
9,707
|
|
0.18
|
%
|
4,232,118
|
|
9,218
|
|
0.22
|
%
|
3,111,464
|
|
9,752
|
|
0.31
|
%
|
||||||||||||||
|
Notes payable due after one year (2)
|
5,516,953
|
|
116,649
|
|
2.11
|
%
|
4,658,829
|
|
110,474
|
|
2.37
|
%
|
2,748,805
|
|
81,330
|
|
2.96
|
%
|
||||||||||||||
|
Total interest-bearing liabilities (3)
|
10,783,473
|
|
126,356
|
|
1.17
|
%
|
8,890,947
|
|
119,692
|
|
1.35
|
%
|
5,860,269
|
|
91,082
|
|
1.55
|
%
|
||||||||||||||
|
Net non-interest-bearing funding
|
462,373
|
|
—
|
|
|
|
471,432
|
|
—
|
|
|
|
425,159
|
|
—
|
|
|
|
||||||||||||||
|
Total funding
|
11,245,846
|
|
126,356
|
|
1.12
|
%
|
9,362,379
|
|
119,692
|
|
1.28
|
%
|
6,285,428
|
|
91,082
|
|
1.45
|
%
|
||||||||||||||
|
Net interest income/yield prior to consolidation of certain trusts
|
11,245,846
|
|
120,322
|
|
1.07
|
%
|
9,362,379
|
|
118,036
|
|
1.26
|
%
|
6,285,428
|
|
91,416
|
|
1.45
|
%
|
||||||||||||||
|
Net effect of consolidated trusts (4)
|
392,046
|
|
1,658
|
|
0.42
|
%
|
747,577
|
|
3,269
|
|
0.44
|
%
|
1,078,027
|
|
4,627
|
|
0.43
|
%
|
||||||||||||||
|
Adjusted net interest income/yield
|
$
|
11,637,892
|
|
$
|
121,980
|
|
1.05
|
%
|
$
|
10,109,956
|
|
$
|
121,305
|
|
1.20
|
%
|
$
|
7,363,455
|
|
$
|
96,043
|
|
1.30
|
%
|
||||||||
|
(1)
|
Excludes interest income of
$18.0 million
,
$37.0 million
, and
$56.2 million
in
2012
,
2011
, and
2010
, respectively, related to consolidated trusts with beneficial interests owned by third parties.
|
|
(2)
|
Includes current portion of long-term notes.
|
|
(3)
|
Excludes interest expense of
$16.3 million
,
$33.7 million
,and
$51.6 million
in
2012
,
2011
, and
2010
, respectively, related to consolidated trusts with beneficial interests owned by third parties.
|
|
(4)
|
Includes the effect of consolidated trusts with beneficial interests owned by third parties.
|
73
The following table sets forth information regarding changes in the components of Farmer Mac's net interest income for the periods indicated. For each category, information is provided on changes attributable to changes in volume (change in volume multiplied by old rate) and changes in rate (change in rate multiplied by old volume). Combined rate/volume variances, the third element of the calculation, are allocated based on their relative size. The decreases in income due to changes in rate reflect the reset of variable rate investments and adjustable rate mortgages to lower rates and the acquisition of new lower-yielding investments, loans, Farmer Mac Guaranteed Securities, and USDA Guaranteed Securities, as described above. The decreases in expense reflect the decreased cost of funding due to lower interest rates in the debt markets. The increases due to changes in volume reflect the increase in on-balance sheet assets during 2012 and 2011.
|
|
2012 vs. 2011
|
2011 vs. 2010
|
|||||||||||||||||||||
|
|
Increase/(Decrease) Due to
|
Increase/(Decrease) Due to
|
|||||||||||||||||||||
|
|
Rate
|
Volume
|
Total
|
Rate
|
Volume
|
Total
|
|||||||||||||||||
|
|
(in thousands)
|
||||||||||||||||||||||
|
Income from interest-earning assets:
|
|
|
|
|
|
|
|||||||||||||||||
|
Cash and investments
|
$
|
(8,510
|
)
|
$
|
5,122
|
|
$
|
(3,388
|
)
|
$
|
(10,680
|
)
|
$
|
11,300
|
|
$
|
620
|
|
|||||
|
Loans, Farmer Mac Guaranteed Securities and USDA Guaranteed Securities
|
(26,351
|
)
|
38,689
|
|
12,338
|
|
(14,486
|
)
|
69,097
|
|
54,611
|
|
|||||||||||
|
Total
|
(34,861
|
)
|
43,811
|
|
8,950
|
|
(25,166
|
)
|
80,397
|
|
55,231
|
|
|||||||||||
|
Expense from interest-bearing liabilities
|
(16,761
|
)
|
23,425
|
|
6,664
|
|
(13,486
|
)
|
42,096
|
|
28,610
|
|
|||||||||||
|
Change in net interest income prior to consolidation of certain trusts (1)
|
$
|
(18,100
|
)
|
$
|
20,386
|
|
$
|
2,286
|
|
$
|
(11,680
|
)
|
$
|
38,301
|
|
$
|
26,621
|
|
|||||
|
(1)
|
Excludes the effect of consolidated trusts with beneficial interests owned by third parties.
|
The net interest yield includes yield maintenance payments received upon the early payoff of certain borrowers' loans, the amortization of premiums on assets consolidated at fair value, and the amortization of discounts on certain prepaid loans and excludes the accrual of income and expense related to the contractual amounts due on financial derivatives that are not designated in hedging relationships. The following paragraphs describe the effects of these items on the net interest yield and the table below presents them as adjustments to reconcile to the net effective spread Farmer Mac earns on the difference between its interest-earning assets and its net funding costs, including payments for income and expense related to undesignated financial derivatives.
Farmer Mac uses interest rate swaps to manage its interest rate risk exposure by modifying the interest rate reset or maturity characteristics of certain assets and liabilities. Farmer Mac historically accounted for its financial derivatives as undesignated financial derivatives, however, beginning in third quarter 2012, Farmer Mac designated
$950.0 million
notional amount of interest rate swaps in fair value hedge relationships. The accrual of the contractual amounts due on these interest rate swaps is included as an adjustment to the yield of the hedged item and is included in interest income. Farmer Mac presents the income or expense related to the accrual of the contractual amounts due on undesignated financial derivatives in "Losses on financial derivatives and hedging activities" on the consolidated statements of operations. Farmer Mac includes the accrual of the contractual amounts due for undesignated financial derivatives in its calculation of net effective spread. For the years ended
December 31, 2012
,
2011
, and
2010
, expenses related to undesignated financial derivatives were
$25.6 million
(
23
basis points),
$38.7 million
(
41
basis points), and
$34.1 million
(
54
basis points), respectively.
74
Net interest income and net interest yields for
2012
,
2011
, and
2010
include the benefits of yield maintenance payments of
$1.2 million
(
1
basis point),
$0.8 million
(
1
basis point), and
$1.1 million
(
2
basis points), respectively. Yield maintenance payments represent the present value of expected future interest income streams and accelerate the recognition of interest income from the related loans. Because the timing and size of these payments vary greatly, variations do not necessarily indicate positive or negative trends to gauge future financial results.
Farmer Mac's net interest income and net interest yield for the years ended
December 31, 2012
,
2011
, and
2010
also include expenses of
$13.0 million
(
12
basis points),
$10.9 million
(
12
basis points), and
$11.7 million
(
19
basis points), respectively, related to the amortization of premiums on assets consolidated at fair value. During 2010, Farmer Mac consolidated certain assets at fair value as a result of adopting new consolidation guidance and contributing substantially all of the assets, in excess of $1.1 billion, comprising the USDA Guarantees line of business to Farmer Mac's subsidiary, Farmer Mac II LLC. Farmer Mac had been reporting these assets at their fair values, with changes in fair value recorded in earnings, based on its election of the fair value option in 2008. These premiums are being amortized into net interest income over the contractual or estimated remaining lives of the underlying assets.
During 2009, Farmer Mac sold four ethanol plants for which Farmer Mac, as part of a lender group, provided a significant portion of the financing, with little or no initial net investment from the purchasers. Farmer Mac presented its outstanding loans resulting from the sale of the ethanol plants as "Loans held for investment" on the consolidated balance sheets and recorded its investment at $40.2 million, which included $43.4 million of unpaid principal loan balances, net of a $3.2 million deferred gain resulting from the sale of the ethanol plants. These gains are being recognized into net interest income over time as the purchasers make principal payments on the loans. During 2010, one of the loans secured by an ethanol plant paid off in its entirety, resulting in net interest income of $1.4 million, or 2 basis points on the net interest yield, for the year ended December 31, 2010.
75
The following table presents the net effective spread between Farmer Mac's interest-earning assets and its net funding costs. This spread is measured by including income or expense related to undesignated financial derivatives and excluding yield maintenance payments, the amortization of premiums on assets consolidated at fair value, and the amortization of discounts on certain prepaid loans. New on-balance sheet program volume added in 2012, 2011, and 2010 increased Farmer Mac's net effective spread to
$106.6 million
in
2012
, compared to
$89.4 million
in
2011
, and
$66.5 million
in 2010. The net effective spread has remained relatively stable at
0.95 percent
in
2012
, compared to
0.96 percent
in
2011
. The decline in the net effective spread from
1.06 percent
in 2010 to
0.96 percent
in 2011 was mainly attributable to the addition of (1) lower yielding assets in Farmer Mac's liquidity investment portfolio, such as U.S. Treasuries, which have a negative net yield but offer a source of contingent liquidity, and (2) on-balance sheet AgVantage securities at lower net yields than the average net yield on Farmer Mac's existing portfolio. See Note 14 to the consolidated financial statements for more information regarding net effective spread for Farmer Mac's individual business segments.
|
|
For the Year Ended December 31,
|
|||||||||||||||||||
|
|
2012
|
2011
|
2010
|
|||||||||||||||||
|
|
Dollars
|
Yield
|
Dollars
|
Yield
|
Dollars
|
Yield
|
||||||||||||||
|
|
(dollars in thousands)
|
|||||||||||||||||||
|
Net interest income/yield prior to consolidation of certain trusts
|
$
|
120,322
|
|
1.07
|
%
|
$
|
118,036
|
|
1.26
|
%
|
$
|
91,416
|
|
1.45
|
%
|
|||||
|
Expense related to undesignated financial derivatives
|
(25,596
|
)
|
(0.23
|
)%
|
(38,663
|
)
|
(0.41
|
)%
|
(34,146
|
)
|
(0.54
|
)%
|
||||||||
|
Yield maintenance payments
|
(1,187
|
)
|
(0.01
|
)%
|
(816
|
)
|
(0.01
|
)%
|
(1,090
|
)
|
(0.02
|
)%
|
||||||||
|
Amortization of premiums on assets consolidated at fair value
|
13,018
|
|
0.12
|
%
|
10,862
|
|
0.12
|
%
|
11,719
|
|
0.19
|
%
|
||||||||
|
Amortization of discounts on certain prepaid loans (1)
|
—
|
|
—
|
%
|
—
|
|
—
|
%
|
(1,421
|
)
|
(0.02
|
)%
|
||||||||
|
Net effective spread
|
$
|
106,557
|
|
0.95
|
%
|
$
|
89,419
|
|
0.96
|
%
|
$
|
66,478
|
|
1.06
|
%
|
|||||
|
(1)
|
Includes income recognition as a result of an early payoff of a loan secured by an ethanol plant.
|
Provision for Loan Losses
. During
2012
, Farmer Mac recorded provisions to its allowance for loan losses of
$3.7 million
and charge-offs of
$2.5 million
, respectively, compared to provisions of
$0.6 million
and charge-offs of
$0.3 million
, respectively, for the same period in
2011
.
T
he provisions recorded during 2012 resulted primarily from the reclassification of a specific allowance of $3.2 million from the reserve for losses to the allowance for loan losses upon the purchase of one defaulted ethanol loan pursuant to the terms of an LTSPC agreement during fourth quarter 2012. During 2011, Farmer Mac purchased two defaulted loans pursuant to the terms of an LTSPC agreement that resulted in a reclassification of $1.8 million of specific allowance from the reserve for losses to the allowance for loan losses. This reclassification was partially offset by a decline in estimated probable losses related to Farmer Mac's exposure to the ethanol and dairy industries. During 2010, Farmer Mac recorded provisions to its allowance for loan losses of
$1.9 million
, charge-offs of
$0.6 million
, and recoveries of
$2.2 million
. The provision for loan losses in 2010 included a reclassification of $2.0 million from the reserve for losses to the allowance for loan losses upon adoption of consolidation guidance and recoveries of $2.2 million on a loan secured by an ethanol plant. As of
December 31, 2012
, Farmer Mac's total allowance for loan losses was
$11.4 million
, compared to
$10.2 million
as of December 31, 2011. See "—Risk Management—Credit Risk – Loans."
Release of and Provision for Losses
.
During
2012
, Farmer Mac recorded releases from its reserve for losses of
$1.8 million
, compared to releases of
$3.0 million
for 2011, and provisions of
$2.4 million
for 2010. The releases recorded during 2012 primarily resulted from the reclassification of the $3.2 million specific allowance described above, offset partially by increases to the reserve for losses during 2012. The releases recorded in 2011 primarily resulted from the reclassification of the $1.8 million specific
76
allowance described above combined with a decline in estimated probable losses related to Farmer Mac's exposure to the ethanol and dairy industries. The provisions recorded during 2010 primarily related to Farmer Mac's exposure to the ethanol and timber industries on loans underlying LTSPCs. These provisions were partially offset by the reclassification of $2.0 million from the reserve for losses to the allowance for loan losses described above. As of
December 31, 2012
, Farmer Mac's reserve for losses was
$5.5 million
, compared to
$7.4 million
as of
December 31, 2011
. See "—Risk Management—Credit Risk – Loans."
Guarantee and Commitment Fees
. Guarantee and commitment fees, which compensate Farmer Mac for assuming the credit risk on loans underlying Farmer Mac Guaranteed Securities and LTSPCs, were
$25.0 million
for
2012
, compared to
$24.8 million
for
2011
, and
$24.1 million
for
2010
.
Losses on Financial Derivatives and Hedging Activities
. Effective July 1, 2012, Farmer Mac designated
$950.0 million
notional amount of interest rate swaps in fair value hedge relationships. Prior to third quarter 2012, Farmer Mac did not designate its financial derivatives in hedging relationships for accounting purposes. The net effect of unrealized and realized gains and losses on Farmer Mac's financial derivatives and hedging activities was net losses of
$19.8 million
for
2012
, compared to net losses of
$92.6 million
for
2011
, and
$17.2 million
for
2010
.
The components of losses on financial derivatives and hedging activities for the years ended
December 31, 2012
,
2011
, and
2010
are summarized in the following table:
|
|
For the Year Ended December 31,
|
||||||||||
|
|
2012
|
2011
|
2010
|
||||||||
|
|
(in thousands)
|
||||||||||
|
Fair value hedges:
|
|||||||||||
|
Unrealized (losses)/gains due to fair value changes:
|
|||||||||||
|
Financial derivatives
|
$
|
(404
|
)
|
$
|
—
|
|
$
|
—
|
|
||
|
Hedged items
|
6,388
|
|
—
|
|
—
|
|
|||||
|
Gains on hedging activities
|
5,984
|
|
—
|
|
—
|
|
|||||
|
No hedge designation:
|
|||||||||||
|
Unrealized gains/(losses) due to fair value changes
|
669
|
|
(47,578
|
)
|
20,131
|
|
|||||
|
Amortization of financial derivatives transition adjustment
|
—
|
|
—
|
|
(70
|
)
|
|||||
|
Realized:
|
|
|
|
||||||||
|
Expense related to financial derivatives
|
(25,596
|
)
|
(38,663
|
)
|
(34,146
|
)
|
|||||
|
Losses due to terminations or net settlements
|
(886
|
)
|
(6,404
|
)
|
(3,074
|
)
|
|||||
|
Losses on financial derivatives not designated in hedging relationships
|
(25,813
|
)
|
(92,645
|
)
|
(17,159
|
)
|
|||||
|
Losses on financial derivatives and hedging activities
|
$
|
(19,829
|
)
|
$
|
(92,645
|
)
|
$
|
(17,159
|
)
|
||
Changes in the fair values of Farmer Mac's open derivative positions for both designated and undesignated hedges are captured in the table above in unrealized gains/(losses) due to fair value changes and are primarily the result of fluctuations in long-term interest rates. For financial derivatives designated as fair value hedges, changes in the fair values of the hedged items attributable to the hedged risk are also included in the table above in unrealized (losses)/gains due to fair value changes. The accrual of periodic cash settlements for interest paid or received from Farmer Mac's interest rate swaps that are not designated in hedging relationships is shown as expense related to financial derivatives. Payments or receipts to terminate derivative positions or net cash settle forward sales contracts on the debt of other GSEs and U.S.
77
Treasury futures that are not designated in hedging relationships are included in losses due to terminations or net settlements.
For the years ended
December 31, 2012
,
2011
, and
2010
, Farmer Mac was a party to interest rate swaps with one related party, Zions First National Bank. Farmer Mac realized expenses of
$1.0 million
,
$1.9 million
, and $2.9 million during
2012
,
2011
, and
2010
, respectively, related to these interest rate swaps with Zions. Farmer Mac recognized unrealized gains of
$0.6 million
, $2.1 million, and $0.3 million during
2012
,
2011
, and
2010
, respectively, due to changes in the fair values of these interest rate swaps with Zions. See Note 3 to the consolidated financial statements for more information on related party transactions.
Gains on Trading Assets
. During
2012
, Farmer Mac recorded unrealized gains on trading assets of
$0.3 million
, compared to unrealized gains of
$3.5 million
and
$5.3 million
for
2011
and
2010
, respectively. Of the total unrealized gains recognized on trading assets during
2012
,
2011
, and
2010
,
$45,000
,
$2.2 million
, and
$4.9 million
, respectively, related to assets selected for the fair value option during 2008. Farmer Mac has not made any fair value option elections since 2008.
The trading gains recorded in 2012 were primarily the result of an increase in the fair value of asset-backed securities in Farmer Mac's trading investment portfolio. The trading gains recorded in 2011 were primarily the result of an increase in the fair value of the USDA Guaranteed Securities contributed to Farmer Mac II LLC due to a decline in long-term interest rates during 2011. During 2010, Farmer Mac recorded trading gains of $2.6 million and $2.4 million, respectively, related to changes in the fair values of the USDA Guaranteed Securities contributed to Farmer Mac II LLC and its investment in GSE preferred stock.
Gains on Sale of Available-for-Sale Investment Securities
. During
2012
,
2011
, and
2010
, Farmer Mac realized net gains of
$18,000
,
$0.3 million
, and
$0.3 million
, respectively. The gains on sale of available-for-sale securities in 2012 were the result of sales of corporate bonds from Farmer Mac's available-for-sale investment portfolio. The gains in 2011 and 2010 primarily resulted from sales of GSE guaranteed mortgage-backed securities from Farmer Mac's available for-sale investment portfolio.
Gains on Sale of Real Estate Owned
. During
2012
, Farmer Mac realized gains of
$0.9 million
from the sale of real estate owned properties, compared to realized gains of
$1.0 million
and
$10,000
in
2011
and
2010
, respectively.
Lower of Cost or Fair Value Adjustment on Loans Held for Sale
.
During
2012
, Farmer Mac recorded unrealized losses of
$5.9 million
, compared to unrealized gains of
$8.9 million
for
2011
and unrealized losses of
$8.7 million
for
2010
. The unrealized losses recorded in 2012 primarily resulted from a decline in the fair value of certain loans held for sale as mortgage spreads widened and long-term interest rates increased at the end of fourth quarter 2012. The unrealized gains recorded during 2011 resulted from the reversal of previously recognized unrealized losses as the fair value of these loans increased above their cost amounts. The unrealized losses during 2010 were primarily the result of a larger portfolio of loans held for sale, wider mortgage spreads and higher interest rates compared to 2009.
Other Income
. Other income totaled
$3.3 million
in
2012
, compared to
$6.9 million
and
$1.2 million
in
2011
and
2010
, respectively. Other income during 2012 and 2011 included the recognition of $1.8 million and $5.2 million, respectively, of gains previously deferred in accumulated other comprehensive income
78
related to fair value changes of certain Farmer Mac II Guaranteed Securities and USDA Guaranteed Securities contributed to Farmer Mac II LLC in 2010.
Compensation and Employee Benefits
.
Compensation and employee benefits were
$19.2 million
in
2012
, compared to
$17.9 million
and
$17.2 million
in
2011
and
2010
, respectively. The increase in compensation and employee benefits during 2012 compared to 2011 was due primarily to a severance payment in fourth quarter 2012 to the former President and Chief Executive Officer, offset partially by lower employee health insurance costs resulting from a change in the type of health insurance plan offered to employees in 2012. Farmer Mac expects employee health insurance costs to increase in 2013.
General and Administrative Expenses
.
General and administrative expenses, including legal, audit, and consulting fees, were
$11.1 million
,
$9.7 million
, and
$8.6 million
in 2012, 2011, and 2010, respectively. The increase in general and administrative expenses in 2012 compared to 2011 was primarily attributable to higher costs for consulting, information technology, and legal services associated with general corporate activities. The higher expenses in 2011 compared to 2010 were primarily attributable to higher rent expense beginning with the construction phase of Farmer Mac's new office space and increased costs associated with information technology initiatives. These increases were partially offset by lower legal fees and consulting fees.
Regulatory Fees
.
Regulatory fees were
$2.3 million
for both
2012
and
2011
, and
$2.2 million
in
2010
, respectively. FCA has advised Farmer Mac that its estimated fees for the federal fiscal year ending September 30, 2013 will be $2.4 million, compared to $2.3 million for the federal fiscal year ended September 30, 2012. After the end of a federal government fiscal year, FCA may revise its prior year estimated assessments to reflect actual costs incurred, and has issued both additional assessments and refunds in the past.
REO Operating Costs
.
During
2012
, Farmer Mac recorded REO operating costs of
$0.1 million
, compared to
$0.8 million
and
$2.2 million
in
2011
and
2010
, respectively. The decreased REO operating costs in 2012 were due mainly to lower write-downs of REO properties to their fair value (less estimated costs to sell) compared to 2011 and 2010.
Other Expense
. During 2011, Farmer Mac recorded $0.9 million of expense related to the termination of an agreement with a third party that previously provided services related to loan and security administration for certain Farm & Ranch assets. Farmer Mac is currently performing those services internally and expects to continue to do so in the future. Since then, Farmer Mac incurred no comparable termination charges.
Income Tax Expense
. Income tax expense totaled
$22.2 million
in
2012
, compared to
$5.8 million
and
$13.8 million
in
2011
and
2010
, respectively. Income tax expense increased in 2012 from 2011 primarily due to the increase in pre-tax book income. The consolidated tax benefit of the dividends declared on Farmer Mac II LLC Preferred Stock, which is presented as "Net income attributable to non-controlling interest - preferred stock dividends" on the consolidated statements of operations on a pre-tax basis, was the primary reason Farmer Mac's effective tax rate was lower than the statutory federal rate of 35 percent.
Farmer Mac recorded a valuation allowance of $40.6 million as of December 31, 2012 and 2011 and $40.9 million as of December 31, 2010 against the deferred tax assets arising primarily from capital loss carryforwards related to tax losses incurred in 2009 on Farmer Mac's investments in Fannie Mae preferred stock, Lehman Brothers Holdings Inc. senior debt securities and other GSE preferred stock. Because
79
these losses were capital in nature, tax benefits can only be realized to the extent Farmer Mac would have offsetting capital gains. Farmer Mac does not currently expect to produce sufficient capital gains within the five year carryforward period to recognize any material tax benefits related to these losses. For more information about income taxes, see Note 10 to the consolidated financial statements.
Business Volume
. During
2012
, Farmer Mac added
$2.9 billion
of new program volume, compared to
$3.4 billion
in
2011
, and
$3.0 billion
in
2010
. Farmer Mac's outstanding program volume as of
December 31, 2012
was
$13.0 billion
, compared to
$11.9 billion
and
$12.2 billion
as of
December 31, 2011
and
2010
, respectively. During
2012
, Farmer Mac:
|
•
|
purchased
$570.3 million
of newly originated farm and ranch eligible loans;
|
|
•
|
added
$744.1 million
of farm and ranch eligible loans under LTSPCs;
|
|
•
|
purchased
$601.0 million
of Farmer Mac I AgVantage securities;
|
|
•
|
purchased
$166.1 million
of loans under the Rural Utilities line of business;
|
|
•
|
purchased
$383.4 million
of Rural Utilities AgVantage securities; and
|
|
•
|
purchased
$484.7 million
of USDA Guaranteed Securities.
|
Farmer Mac's outstanding program volume was
$13.0 billion
as of
December 31, 2012
, which represents an
increase
of
$1.1 billion
from
December 31, 2011
, as new volume exceeded maturities and principal paydowns on existing program assets during the year. The new program volume in 2012 included $600.0 million of Farmer Mac I AgVantage securities purchased from Rabo Agrifinance Inc., and $383.4 million of Rural Utilities AgVantage securities purchased from CFC. Principal paydowns and maturities in 2012 included $495.7 million related to Rural Utilities AgVantage securities.
The following table sets forth Farm & Ranch, USDA Guarantees, and Rural Utilities loan purchase, LTSPC, and guarantee activities for newly originated and current seasoned loans during the periods indicated:
|
Farmer Mac Loan Purchases, Guarantees, and LTSPCs
|
|||||||||||
|
|
For the Year Ended December 31,
|
||||||||||
|
|
2012
|
2011
|
2010
|
||||||||
|
|
(in thousands)
|
||||||||||
|
Farm & Ranch:
|
|
|
|||||||||
|
Loans
|
$
|
570,346
|
|
$
|
495,455
|
|
$
|
382,669
|
|
||
|
LTSPCs
|
744,110
|
|
471,994
|
|
263,741
|
|
|||||
|
Farmer Mac Guaranteed Securities - AgVantage
|
601,000
|
|
1,801,500
|
|
900,000
|
|
|||||
|
USDA Guarantees:
|
|||||||||||
|
USDA Guaranteed Securities
|
479,324
|
|
404,445
|
|
437,751
|
|
|||||
|
Farmer Mac Guaranteed Securities
|
5,327
|
|
3,268
|
|
20,124
|
|
|||||
|
Rural Utilities:
|
|||||||||||
|
Loans
|
166,117
|
|
203,789
|
|
313,028
|
|
|||||
|
Farmer Mac Guaranteed Securities - AgVantage
|
383,406
|
|
2,796
|
|
652,924
|
|
|||||
|
Total purchases, guarantees, and commitments
|
$
|
2,949,630
|
|
$
|
3,383,247
|
|
$
|
2,970,237
|
|
||
The decrease in new business volume under the Farm & Ranch line of business during 2012 compared to 2011 was attributable to the aggregate purchase of $600.0 million of Farmer Mac I AgVantage securities issued by Rabo Agrifinance, Inc., compared to purchases of $1.8 billion of Farmer Mac I AgVantage securities in 2011. This decrease was partially offset by increased LTSPC activity of
$744.1 million
,
80
including the completion of a $180.6 million LTSPC transaction, the largest since first quarter 2007, and an increase in loan purchase activity in the Farm & Ranch line of business. The overall decrease in new business volume in the Farm & Ranch line of business was partially offset by increases in USDA Guarantees activity and Rural Utilities activity, due primarily to the purchase of $383.4 million of Rural Utilities AgVantage securities issued by CFC. The increase in new business volume under the Farm & Ranch line of business during 2011 compared to 2010 was mainly attributable to purchases of $1.5 billion of AgVantage securities issued by MetLife and $300.0 million of AgVantage securities issued by Rabo Agrifinance, Inc., as well as increased loan purchase activity and increased LTSPC activity due primarily to the completion of a $159.9 million LTSPC transaction. The increases in Farm & Ranch business volume activity during 2011 compared to 2010 were partially offset by decreases in USDA Guarantees and Rural Utilities activity.
The purchase price of newly originated and seasoned eligible loans and portfolios, none of which are delinquent at the time of purchase, is the fair value based on current market interest rates and Farmer Mac's target net yield. The purchase price includes an amount to compensate Farmer Mac for credit risk that is similar to the guarantee or commitment fee it receives for assuming credit risk on loans underlying Farmer Mac Guaranteed Securities and LTSPCs. Based on market conditions, Farmer Mac either retains the loans it purchases or securitizes them and sells Farmer Mac Guaranteed Securities backed by those loans. Farmer Mac's decision to retain loans it purchases is based on an analysis of the underlying funding costs and resulting net interest income achievable over the lives of the loans. The weighted-average age of the Farm & Ranch newly originated and current seasoned loans purchased and retained (excluding the purchases of defaulted loans) during 2012 and 2011 was less than one year and one year, respectively. Of those loans, 57 percent and 61 percent, respectively, had principal amortization periods longer than the maturity date, resulting in balloon payments at maturity, with a weighted-average remaining term to maturity of 16.8 years and 16.0 years, respectively.
During
2012
,
2011
, and
2010
, Farmer Mac securitized loans it purchased and sold the resulting Farmer Mac Guaranteed Securities in the amount of
$38.1 million
,
$25.7 million
, and
$30.7 million
, respectively. In 2012 and 2011,
$32.7 million
and
$22.4 million
, respectively, of securities were sold to AgStar Financial Services, ACA ("AgStar"), which was a related party to Farmer Mac until June 2010, and in 2012,
$5.3 million
of securities were sold to Zions First National Bank ("Zions"), which is a related party to Farmer Mac. Of the 2010 transactions, $5.7 million were sold to Zions, and $2.9 million were sold to AgStar. See Note 3 to the consolidated financial statements for more information about related party transactions.
81
The following table sets forth information regarding the Farmer Mac Guaranteed Securities issued during the periods indicated:
|
|
For the Year Ended December 31,
|
||||||||||
|
|
2012
|
2011
|
2010
|
||||||||
|
|
(in thousands)
|
||||||||||
|
Loans securitized and sold as Farmer Mac I Guaranteed Securities
|
$
|
38,063
|
|
$
|
25,674
|
|
$
|
30,725
|
|
||
|
Farmer Mac II Guaranteed Securities
|
5,327
|
|
3,268
|
|
22,131
|
|
|||||
|
Farmer Mac I Guaranteed Securities - AgVantage
|
601,000
|
|
1,801,500
|
|
900,000
|
|
|||||
|
Farmer Mac Guaranteed Securities - Rural Utilities AgVantage
|
383,406
|
|
2,796
|
|
652,924
|
|
|||||
|
Conversions of LTSPCs into Farmer Mac I Guaranteed Securities
|
—
|
|
—
|
|
351,847
|
|
|||||
|
Total Farmer Mac Guaranteed Securities Issuances
|
$
|
1,027,796
|
|
$
|
1,833,238
|
|
$
|
1,957,627
|
|
||
The following table sets forth information regarding outstanding volume in each of Farmer Mac's three lines of business as of the dates indicated:
|
Outstanding Balance of Loans, Loans Underlying Farmer Mac
|
|||||||||||
|
Guaranteed Securities and LTSPCs, and USDA Guaranteed Securities
|
|||||||||||
|
As of December 31,
|
|||||||||||
|
|
2012
|
2011
|
2010
|
||||||||
|
|
(in thousands)
|
||||||||||
|
Farm & Ranch:
|
|
|
|
||||||||
|
Loans
|
$
|
1,519,415
|
|
$
|
1,251,370
|
|
$
|
972,206
|
|
||
|
Loans held in trusts:
|
|||||||||||
|
Beneficial interests owned by Farmer Mac
|
39
|
|
181
|
|
3,697
|
|
|||||
|
Beneficial interests owned by third party investors
|
160,397
|
|
696,554
|
|
821,411
|
|
|||||
|
Farmer Mac Guaranteed Securities
|
911,370
|
|
621,871
|
|
750,217
|
|
|||||
|
Farmer Mac Guaranteed Securities - AgVantage
|
4,309,200
|
|
3,711,000
|
|
3,886,500
|
|
|||||
|
LTSPCs
|
2,156,068
|
|
1,776,051
|
|
1,754,597
|
|
|||||
|
USDA Guarantees:
|
|||||||||||
|
USDA Guaranteed Securities
|
1,559,683
|
|
1,435,679
|
|
1,297,439
|
|
|||||
|
Farmer Mac Guaranteed Securities
|
55,896
|
|
77,498
|
|
87,959
|
|
|||||
|
Rural Utilities:
|
|||||||||||
|
Loans
|
663,097
|
|
529,227
|
|
339,963
|
|
|||||
|
Loans held in trusts:
|
|||||||||||
|
Beneficial interests owned by Farmer Mac
|
368,848
|
|
386,800
|
|
400,228
|
|
|||||
|
Farmer Mac Guaranteed Securities - AgVantage
|
1,311,175
|
|
1,427,071
|
|
1,902,492
|
|
|||||
|
Total
|
$
|
13,015,188
|
|
$
|
11,913,302
|
|
$
|
12,216,709
|
|
||
Of the
$13.0 billion
outstanding principal balance of volume included in Farmer Mac's three lines of business as of
December 31, 2012
,
$5.6 billion
were Farmer Mac Guaranteed Securities structured as AgVantage securities. Each AgVantage security is a general obligation of an issuing institution approved by Farmer Mac and is secured by eligible loans in an amount at least equal to the outstanding principal amount of the security. Unlike business volume in the form of purchased loans, USDA Guaranteed Securities, and loans underlying LTSPCs and non-AgVantage Farmer Mac Guaranteed Securities, the Farmer Mac Guaranteed Securities structured as AgVantage securities generally do not pay down principal
82
based on amortization schedules and instead typically have fixed maturity dates when the secured general obligation is due.
The following table summarizes by maturity date the scheduled principal amortization of loans held, loans underlying non-AgVantage Farmer Mac Guaranteed Securities and LTSPCs, and USDA Guaranteed Securities as of
December 31, 2012
:
|
Schedule of Principal Amortization of Loans Held, Loans Underlying
|
||||||||||||
|
Non-AgVantage Farmer Mac Guaranteed Securities and LTSPCs, and USDA Guaranteed Securities
|
||||||||||||
|
Loans Held
|
Loans Underlying Farmer Mac I Guaranteed Securities and LTSPCs
|
Loans Underlying Farmer Mac II and USDA Guaranteed Securities
|
Total
|
|||||||||
|
(in thousands)
|
||||||||||||
|
2013
|
$
|
184,488
|
|
$
|
281,007
|
|
$
|
224,232
|
|
$
|
689,727
|
|
|
2014
|
463,850
|
|
262,477
|
|
117,628
|
|
843,955
|
|
||||
|
2015
|
129,233
|
|
223,548
|
|
145,433
|
|
498,214
|
|
||||
|
2016
|
127,694
|
|
205,092
|
|
104,381
|
|
437,167
|
|
||||
|
2017
|
135,144
|
|
211,000
|
|
74,104
|
|
420,248
|
|
||||
|
Thereafter
|
1,671,387
|
|
1,884,314
|
|
949,801
|
|
4,505,502
|
|
||||
|
Total
|
$
|
2,711,796
|
|
$
|
3,067,438
|
|
$
|
1,615,579
|
|
$
|
7,394,813
|
|
The following table summarizes by maturity date the outstanding principal amount of both on- and off-balance sheet AgVantage securities as of
December 31, 2012
:
|
AgVantage Balances by Year of Maturity
|
|||
|
|
As of
|
||
|
|
December 31, 2012
|
||
|
|
(in thousands)
|
||
|
2013
|
$
|
669,029
|
|
|
2014
|
1,070,148
|
|
|
|
2015
|
659,709
|
|
|
|
2016
|
1,261,674
|
|
|
|
2017
|
1,260,393
|
|
|
|
Thereafter (1)
|
699,422
|
|
|
|
Total
|
$
|
5,620,375
|
|
(1) Includes various maturities ranging from 2018 to 2025.
The weighted-average remaining maturity of the outstanding
$5.6 billion
of AgVantage securities shown in the table above was
3.3
years as of
December 31, 2012
. As a general matter, if the issuer of a maturing AgVantage security does not issue new AgVantage securities to replace the maturing securities, and Farmer Mac does not find alternate sources of business volume, the Corporation's income could be adversely affected. However, the income effect of future maturing AgVantage securities, particularly off-balance sheet transactions, may not be material and will likely not be proportional to the amount of any resulting decrease in business volume. The Corporation's income could also be adversely affected if the net interest margin earned by Farmer Mac on new AgVantage securities that replace maturing AgVantage
83
securities is lower than the margin earned on the maturing securities, as was the case in the CFC transactions completed in 2012.
As part of fulfilling its guarantee obligations for Farmer Mac I Guaranteed Securities and commitments to purchase eligible loans underlying LTSPCs, Farmer Mac purchases defaulted loans, all of which are at least 90 days delinquent or in material non-monetary default at the time of purchase, out of the loan pools underlying those securities and LTSPCs, and records the purchased loans as such on its balance sheet. The purchase price for defaulted loans purchased out of Farmer Mac I Guaranteed Securities is the current outstanding principal balance of the loan plus accrued and unpaid interest. The purchase price for defaulted loans purchased under an LTSPC is the then-current outstanding principal balance of the loan, with accrued and unpaid interest on the defaulted loans payable out of any future loan payments or liquidation proceeds as received. The purchase price of a defaulted loan is not an indicator of the expected loss on that loan; many other factors affect expected loss, if any, on loans so purchased. The weighted-average age of delinquent loans purchased out of securitized pools and LTSPCs during
2012
,
2011
, and
2010
was
5 years
. See "Management's Discussion and Analysis of Financial Condition and Results of Operations—Risk Management—Credit Risk – Loans."
The following table presents Farmer Mac's purchases of newly originated and current seasoned loans under the Farm & Ranch line of business and purchases of defaulted loans underlying Farmer Mac I Guaranteed Securities and LTSPCs for the periods indicated:
|
|
For the Year Ended December 31,
|
||||||||||
|
|
2012
|
2011
|
2010
|
||||||||
|
|
(in thousands)
|
||||||||||
|
Farm & Ranch newly originated and current seasoned loan purchases
|
$
|
570,346
|
|
$
|
495,455
|
|
$
|
382,669
|
|
||
|
Defaulted loans purchased underlying Farmer Mac I Guaranteed Securities owned by third party investors
|
8,933
|
|
7,471
|
|
3,456
|
|
|||||
|
Defaulted loans purchased underlying LTSPCs
|
8,091
|
|
14,192
|
|
2,626
|
|
|||||
|
Total loan purchases
|
$
|
587,370
|
|
$
|
517,118
|
|
$
|
388,751
|
|
||
For information regarding eligible participants in the Farm & Ranch and USDA Guarantees lines of business, see "Business—Farmer Mac Lines of Business—Farm & Ranch—Approved Lenders" and "Business—Farmer Mac Lines of Business—USDA Guarantees—United States Department of Agriculture Guaranteed Loan Programs."
Farmer Mac II LLC
.
In January 2010, Farmer Mac contributed substantially all of the assets comprising the USDA Guarantees line of business (in excess of
$1.1 billion
) to Farmer Mac's subsidiary, Farmer Mac II LLC. The assets that Farmer Mac contributed to Farmer Mac II LLC consisted primarily of USDA Guaranteed Securities that had not been securitized by Farmer Mac but also included
$35.0 million
of Farmer Mac II Guaranteed Securities. Farmer Mac did not and will not guarantee the timely payment of principal and interest on the
$1.1 billion
of contributed USDA Guaranteed Securities. The financial information presented in this report reflects the accounts of Farmer Mac and its subsidiaries on a consolidated basis. Accordingly, Farmer Mac's reportable operating segments presented in this report will differ from the stand-alone financial statements of Farmer Mac II LLC. Those separate financial statements are available on the website of Farmer Mac II LLC and are not incorporated in this report by reference.
84
The assets of Farmer Mac II LLC will only be available to creditors of Farmer Mac after all obligations owed to creditors of and equity holders in Farmer Mac II LLC have been satisfied. As of
December 31, 2012
, Farmer Mac II LLC held assets with a fair value of
$1.7 billion
, had debt outstanding to Farmer Mac of
$328.0 million
, had preferred stock outstanding with a liquidation preference of
$250.0 million
, and had
$1.0 billion
of common stock outstanding held by Farmer Mac. For more information about the formation and operations of Farmer Mac II LLC and the features of the preferred stock issued by Farmer Mac II LLC in January 2010, see Notes 9 and 14 to the consolidated financial statements.
Related Party Transactions
. As provided by Farmer Mac's statutory charter, only banks, insurance companies, and other financial institutions or similar entities may hold Farmer Mac's Class A voting common stock, and only institutions of the FCS may hold Farmer Mac's Class B voting common stock. Farmer Mac's charter also provides that holders of Class A voting common stock elect five members of Farmer Mac's 15-member board of directors and that holders of Class B voting common stock elect five members of the board of directors. The ownership of Farmer Mac's two classes of voting common stock is currently concentrated in a small number of institutions. Approximately 45 percent of the Class A voting common stock is held by three financial institutions, with 31 percent held by one institution. Approximately 97 percent of the Class B voting common stock is held by five FCS institutions (two of which are related to each other through a parent-subsidiary relationship).
Unlike some other GSEs, specifically other FCS institutions and the Federal Home Loan Banks, Farmer Mac is not structured as a cooperative owned exclusively by member institutions and established to provide services exclusively to its members. Farmer Mac, as a stockholder-owned, publicly-traded corporation, seeks to fulfill its mission of serving the financing needs of agriculture and rural America in a manner that is consistent with providing a return on the investment of its stockholders, including those who do not directly participate in the Farmer Mac secondary market. Farmer Mac's policy is to require financial institutions to own a requisite amount of common stock, based on the size and type of institution, to participate in the Farm & Ranch line of business. As a result of this requirement, coupled with the ability of holders of Class A and Class B voting common stock to elect two-thirds of Farmer Mac's board of directors, Farmer Mac regularly conducts business with "related parties," including institutions affiliated with members of Farmer Mac's board of directors and institutions that own large amounts of Farmer Mac's voting common stock. Farmer Mac has adopted a Code of Business Conduct and Ethics that governs any conflicts of interest that may arise in these transactions, and Farmer Mac's policy is to require that any transactions with related parties be conducted in the ordinary course of business, with terms and conditions comparable to those available to any other counterparty not related to Farmer Mac.
The following table summarizes the material relationships between Farmer Mac and certain related parties. The related parties listed in the table consist of (1) all holders of at least five percent of a class of Farmer Mac voting common stock and (2) other institutions that are considered "related parties" through an affiliation with a Farmer Mac director and conduct material business with Farmer Mac. The table below does not specify any relationships based on the ownership of non-voting common or preferred stock, such as Farmer Mac's investments in preferred stock issued by CoBank or the investments of related parties in Farmer Mac's Class C non-voting common stock or Farmer Mac's series of preferred stock.
85
|
Name of Institution
|
|
Ownership of
Farmer Mac Voting Common Stock
|
|
Affiliation with Any
Farmer Mac Directors
|
|
Primary Aspects of Institution's
Business Relationship with Farmer Mac
|
|
AgFirst Farm Credit Bank
|
|
84,024 shares of Class B voting common stock
(16.79% of outstanding Class B stock and 5.49% of total voting common stock outstanding)
|
|
None
|
|
In 2012 and 2011, Farmer Mac earned approximately $1.3 million and $1.4 million, respectively, in fees attributable to transactions with AgFirst, primarily commitment fees for LTSPCs.
|
|
AgriBank, FCB
|
|
201,621 shares of Class B voting common stock
(40.30% of outstanding Class B stock and 13.17% of total voting common stock outstanding)
|
|
Farmer Mac directors Richard H. Davidson and James B. McElroy are directors of AgriBank. Brian O'Keane, who served on Farmer Mac's board of directors from June 2008 to June 2012, is the Executive Vice President, Banking and Finance, and Chief Financial Officer of AgriBank.
|
|
No Farmer Mac business through any of its lines of business was conducted between the parties.
|
|
CoBank, ACB
|
|
163,253 shares of Class B voting common stock
(32.63% of outstanding Class B stock and 10.66% of total voting common stock outstanding)
|
|
Farmer Mac director Douglas E. Wilhelm served as an executive officer of CoBank until June 30, 2012. Mr. Wilhelm is also currently a party to a services agreement with CoBank, under which he serves as an employee of CoBank.
|
|
No Farmer Mac business through any of its lines of business was conducted between the parties.
|
|
Farm Credit Bank of Texas (FCBT)
|
|
38,503 shares of Class B voting common stock
(7.70% of outstanding Class B stock and 2.52% of total voting common stock outstanding)
|
Farmer Mac director Thomas W. Hill served as an executive officer of FCBT until November 2010. Mr. Hill is also currently a party to a services agreement with FCBT, under which he serves as an employee of FCBT.
|
|
In 2012 and 2011, Farmer Mac earned approximately $0.3 million in fees attributable to transactions with FCBT, primarily commitment fees for LTSPCs.
|
|
|
In 2012 and 2011, Farmer Mac paid FCBT approximately $0.6 million and $0.8 million, respectively, in servicing fees for its work as a Farmer Mac central servicer.
|
||||||
|
Farm Credit West, ACA (FCW)
|
750 shares of Class B voting common stock
(0.15% of outstanding Class B stock and 0.05% of total voting common stock outstanding)
|
Ernest M. Hodges, who served on Farmer Mac's board of directors from June 2005 to June 2012, is an Executive Vice President of Farm Credit West.
|
In 2012 and 2011, Farmer Mac received approximately $2.2 million and $2.6 million, respectively, in fees attributable to transactions with FCW, primarily guarantee fees for Farmer Mac I Guaranteed Securities and commitment fees for LTSPCs.
|
|||
|
In 2012 and 2011, FCW retained approximately $0.9 million and $1.0 million, respectively, in servicing fees for its work as a Farmer Mac central servicer.
|
||||||
86
|
Name of Institution
|
|
Ownership of
Farmer Mac Voting Common Stock
|
|
Affiliation with Any
Farmer Mac Directors
|
|
Primary Aspects of Institutions
Business Relationship with Farmer Mac
|
|
National Rural Utilities Cooperative Finance Corporation (CFC)
|
|
81,500 shares of Class A voting common stock
(7.91% of outstanding Class A stock and 5.32% of total voting common stock outstanding)
|
|
None
|
|
Transactions with CFC represent 100 percent of business volume under the Rural Utilities line of business since its inception in 2008.
|
|
Transactions with CFC during 2012 and 2011 represented 18.6 percent and 6.1 percent, respectively, of Farmer Mac's total new eligible loan volume for those years. Transactions with CFC represented 18.0 percent and 19.7 percent, respectively, of Farmer Mac's total outstanding eligible loan assets as of December 31, 2012 and 2011.
|
||||||
|
In 2012 and 2011, Farmer Mac earned guarantee fees of approximately $4.4 million and $5.4 million, respectively, attributable to transactions with CFC.
|
||||||
|
In 2012 and 2011, Farmer Mac earned interest income of $28.0 million and $30.9 million, respectively, attributable to AgVantage transactions with CFC.
|
||||||
|
CFC is currently the only servicer of rural utilities loans in the Rural Utilities line of business.
|
||||||
|
The Vanguard Group, Inc.
|
|
56,295 shares of Class A voting common stock
(5.46% of outstanding Class A stock and 3.68% of total voting common stock outstanding)
|
None
|
|
No Farmer Mac business through any of its lines of business was conducted between the parties.
|
|
|
Zions First National Bank
|
322,100 shares of Class A voting common stock
(31.25% of outstanding Class A stock and 21.04% of total voting common stock outstanding)
|
|
None
|
|
In 2012 and 2011, Farmer Mac's purchases of loans from Zions under the Farm & Ranch line of business represented approximately 29.6 percent and 25.2 percent, respectively, of Farm & Ranch loan purchase volume for those years. Those purchases represented 8.8 percent and 4.5 percent, respectively, of total Farm & Ranch business volume for those years. The purchases of USDA Guarantees from Zions under the USDA Guarantees line of business represented approximately 3.0 percent and 1.3 percent of that program's purchases for the year ended December 31, 2012 and 2011 Transactions with Zions represented 4.7 percent of Farmer Mac's total outstanding eligible loan assets as of December 31, 2012 and 2011.
|
|
|
In 2012 and 2011, Farmer Mac received approximately $0.6 million and $0.9 million, respectively, in guarantee fees attributable to transactions with Zions.
|
||||||
|
In 2012 and 2011, Zions retained approximately $2.0 million and $1.9 million, respectively, in servicing fees for its work as a Farmer Mac central servicer.
|
||||||
For more information about related party transactions, see Note 3 to the consolidated financial statements.
87
Outlook
Farmer Mac continues to provide a stable source of liquidity, capital, and risk management tools to help rural lenders meet the financing needs of their customers, and expects to continue to be able to meet future business opportunities as they arise. While the pace of Farmer Mac's growth will be dictated by the capital and liquidity needs of lenders, as well as Farmer Mac's ability to continue to increase its lender network, Farmer Mac foresees opportunities for continued growth in eligible loan assets. More specifically, Farmer Mac believes that its Farm & Ranch and Rural Utilities lines of business have opportunities for growth over the next several years, driven by several key factors:
|
•
|
As agricultural lenders face increased equity capital requirements under new regulatory frameworks, Farmer Mac can provide capital relief for those institutions through loan purchases, guarantees, or LTSPCs.
|
|
•
|
As borrowers expect interest rates to increase in the future and seek longer-term, fixed rate loans, Farmer Mac can assist lenders in managing their interest rate risk for those longer-term assets, which may not match well with the lenders' shorter-term deposit funding.
|
|
•
|
As the overall economy recovers, rural utilities generally experience an increase in demand for power, which can lead to more investment and borrowing needs in that industry.
|
Farmer Mac believes that these growth opportunities will be important in replacing income earned on the eligible loan and investment portfolio assets that are scheduled to mature or pay down over the next several years. Maturing AgVantage securities and the scheduled principal amortization of other eligible loan assets are discussed in "—Results of Operations—Business Volume." Farmer Mac also currently owns in its liquidity investment portfolio $78.5 million par amount of preferred stock issued by CoBank that currently pays an 11 percent annual dividend, from which Farmer Mac earns approximately $7.7 million annually in after-tax dividend income. CoBank has the option to call these securities beginning in October 2014, and Farmer Mac believes it is likely that CoBank will do so. The strategies that Farmer Mac develops to address the expected call of the CoBank preferred stock may result in the sale of some or all of these securities before the call date to balance the mix of dividend and capital gain income earned from these investments.
Agricultural Sector.
The agricultural sector includes many diverse industries that respond in different ways to changes in economic conditions. Those individual industries often are affected differently, sometimes positively and sometimes negatively, by prevailing economic and weather conditions. This results in cycles where one or more industries may be under stress at the same time that others are not. In addition, producers that rely on non-farm sources of income as a significant percentage of overall income may experience stress associated with weakness in the general economy.
These industries are also affected by commodity inventories and their associated market prices, which can vary largely as a result of weather patterns and harvest conditions. The agricultural sector remained profitable across a variety of industries throughout 2012, but the extremely high temperatures and drought that areas of the Midwest and Great Plains experienced during the year resulted in substantial yield reductions in the grain crop. However, as of December 31, 2012, the drought has had no measurable impact on the credit quality of Farmer Mac's portfolio. In general, Farmer Mac does not expect the drought to have a significant negative effect on grain producers because of the widespread use of crop insurance and the increased grain prices that helped to offset reduced yields, although grain producers may experience increased costs in the future from possible higher premiums for crop insurance. At the same time, these increased grain prices, together with the diminished quality and availability of adequate
88
grazing land, may adversely affect the profitability of producers in many other agricultural industries that depend on feed grains as an input commodity to production, including livestock, dairy, and ethanol producers, which have already experienced prolonged periods of economic stress. Farmer Mac continues to monitor closely the effects of drought on all segments of its portfolio.
Agricultural land values that have increased over the past several years remain elevated, although economic indicators suggest that the escalation in land values may be slowing. Agricultural land whose value is closely tied to the price of commodities it produces, such as corn, may see cyclical volatility in future periods as prices of those commodities fluctuates. Increases in interest rates also could put downward pressure on the discounted cash flow values of farmland, which could negatively affect the appraised values of the farmland. Farmer Mac continues to closely monitor sector profitability, economic conditions, and agricultural land value trends to tailor underwriting practices to changing conditions. For example, in response to the recent increases in land values, during 2012 Farmer Mac adopted more conservative underwriting standards for loans in designated states in the upper Midwest by decreasing the maximum loan-to-value ratio ("LTV") from 70 percent to 60 percent for those loans. Furthermore, although Farmer Mac underwrites loans with an emphasis on the borrower's repayment capacity, it is noteworthy that the weighted average original LTV (based on original appraised value that has not been indexed to provide a current market value) for non-AgVantage Farmer Mac I loans was approximately
52 percent
as of both
December 31, 2012
and
December 31, 2011
.
Farmer Mac also continues to monitor the establishment and evolution of legislation and regulations that affect farmers, ranchers, and rural lenders. Many existing federal agricultural policies contained in the Farm Bill, including policies affecting crop subsidies, availability of crop insurance
,
and other aspects of agricultural production are scheduled to expire on September 30, 2013. All of these existing policies continue to be the subject of political debate within the context of proposals to replace the Farm Bill. Although various legislative initiatives have been introduced in the 113th Congress to modify or extend beyond September 2013 the policies contained in the Farm Bill, Congress has not yet passed any such legislation. Also, budget issues in Congress may affect both the availability of USDA-guaranteed loans for agricultural producers and the ability of USDA to offer services that support agricultural production, such as food safety inspections, during 2013. Farmer Mac will continue to closely monitor these developments.
Farmer Mac's marketing efforts directed towards the Farm & Ranch line of business focus on lenders that have demonstrated a commitment to agricultural lending based on their lending history. Farmer Mac directs its outreach efforts to these lenders through direct personal contact, which is facilitated through Farmer Mac's frequent participation in state and national banking conferences and through partnerships with the American Bankers Association and the Independent Community Bankers of America. Farmer Mac continues to observe increased demand for its longer-term fixed rate loan products in its Farm & Ranch line of business. Farmer Mac believes that the trend toward longer-term mortgage financing by farmland owners will continue as borrowers consider the possibility of rising interest rates and that demand for Farmer Mac's secondary market tools could also increase as rural lenders make more loans and adapt to the changing regulatory environment, which could require lenders to obtain more liquidity and capital.
Renewable Energy Sector.
Farmer Mac's support of the renewable energy sector is centered in ethanol production, an industry that continues to experience narrow or uneven profit margins in many cases due to a variety of factors. The elimination of government tax and tariff support for the industry, as well as oversupply of ethanol combined with reduced demand for gasoline, resulted in narrow margins for the ethanol industry in 2012. The escalation in corn prices from the drought has placed and is expected to
89
continue to place additional pressure on profit margins as operators experience increased input costs. As a result of these factors, many ethanol plants have curtailed production or shut down to minimize operating losses. On the other hand, many producers have begun installing and utilizing corn oil extraction technologies in their plants in an effort to increase profitability. Nonetheless, profit margins at the ethanol production level will likely remain narrow for the foreseeable future, and it is likely that the trend of ethanol plants operating at less than full capacity will continue. The ethanol loans in Farmer Mac's portfolio have decreased in recent years both in dollar amount (
$144.9 million
as of
December 31, 2012
) and as a percentage of its overall portfolio volume (
3.1 percent
of the non-AgVantage Farmer Mac I portfolio as of
December 31, 2012
). As of December 31, 2011 and 2010, the dollar amount of Farmer Mac's ethanol portfolio was
$161.4 million
(
3.7 percent
) and
$233.8 million
(
5.4 percent
), respectively, compared to
$280.4 million
(
5.6 percent
) as of December 31, 2008 when Farmer Mac's exposure to the ethanol industry was at its highest. Farmer Mac continues to monitor developments in the ethanol industry and evaluate their potential impact on the overall performance of Farmer Mac's portfolio. Other than
$16.9 million
of undisbursed commitments on existing ethanol loans, Farmer Mac does not expect to add additional ethanol loans to its portfolio.
Rural Utilities Industry.
Historically, the demand of the rural utilities industry for capital and financing tends to follow the state of the general economy. Recent continued weakness in the general economy has reduced the demand for rural electric power and, consequently, the need for rural utilities cooperatives to expand. This lower demand within the industry is the primary reason for the lack of growth in Farmer Mac's rural utilities portfolio over the past few years. However, many domestic economic indicators have improved recently, and Farmer Mac and industry sources expect that demand for rural utilities loans will increase as the economy strengthens.
Farmer Mac believes that the rural utilities industry will have significant needs for financing over the course of the next decade, as capital will be needed for growth and modernization such as transmission and distribution system improvements and demand-side management. In addition, the industry will also require capital to comply with any future public policy initiatives such as environmental regulations and clean energy initiatives. For example, in response to low natural gas fuel costs, many power generators are building environmentally cleaner natural gas-fired generating projects to replace their aging coal-fired plants. Any increase in rural utilities cooperatives' demand for loans could result in increased business volume for Farmer Mac in that segment of its portfolio.
Assets
. Total assets as of
December 31, 2012
were
$12.6 billion
, compared to
$11.9 billion
as of
December 31, 2011
. The increase in total assets was driven primarily by purchases of Farmer Mac I AgVantage Securities that were retained on balance sheet and higher levels of investment assets held for liquidity purposes. On-balance sheet program asset purchases of
$2.2 billion
during 2012 were offset partially by paydowns and maturities and by the deconsolidation of $460.3 million unpaid principal balance of Farmer Mac Guaranteed Securities held by a third party, previously reported as loans held for investment in consolidated trusts, that was no longer a related party during second quarter 2012.
As of
December 31, 2012
, Farmer Mac had
$785.6 million
of cash and cash equivalents and
$2.5 billion
of investment securities, compared to
$817.0 million
of cash and cash equivalents and
$2.2 billion
of investment securities as of
December 31, 2011
. As of
December 31, 2012
, Farmer Mac had
$4.8 billion
of Farmer Mac Guaranteed Securities,
$1.6 billion
of USDA Guaranteed Securities, and
$2.7 billion
of
90
loans, net of allowance. This compares to
$4.3 billion
of Farmer Mac Guaranteed Securities,
$1.5 billion
of USDA Guaranteed Securities, and
$2.9 billion
of loans, net of allowance, as of
December 31, 2011
.
Liabilities
. Total liabilities
increased
to
$12.0 billion
as of
December 31, 2012
from
$11.3 billion
as of
December 31, 2011
. The
increase
in liabilities was due to an increase in notes payable used to purchase eligible loan assets and liquidity investment assets, offset partially by a decrease in debt securities of consolidated trusts held by a third party of $460.3 million that were deconsolidated in second quarter 2012 because the third party was no longer a related party.
Equity
. As of
December 31, 2012
, Farmer Mac had total equity of
$593.0 million
comprised of stockholders' equity of
$351.1 million
and non-controlling interest – preferred stock of
$241.9 million
. As of
December 31, 2011
Farmer Mac had total equity of
$554.5 million
comprised of stockholders' equity of
$312.6 million
and non-controlling interest – preferred stock of
$241.9 million
. The
increase
in total equity during
2012
was driven by higher GAAP net income which increased retained earnings.
Regulatory Capital Compliance
. Farmer Mac was in compliance with its statutory minimum capital requirement and its risk-based capital standard as of
December 31, 2012
. Farmer Mac is required to hold capital at the higher of its statutory minimum capital requirement and the amount required by its risk-based capital stress test. As of
December 31, 2012
, Farmer Mac's core capital totaled
$519.0 million
and exceeded its statutory minimum capital requirement of
$374.0 million
by
$145.0 million
. As of
December 31, 2011
, Farmer Mac's core capital totaled
$475.2 million
and exceeded its statutory minimum capital requirement of
$348.7 million
by
$126.5 million
. As of
December 31, 2012
, Farmer Mac's risk-based capital stress test generated a risk-based capital requirement of
$58.1 million
. Farmer Mac's regulatory capital of
$535.9 million
exceeded that amount by approximately
$477.8 million
. Accumulated other comprehensive income is not a component of Farmer Mac's core capital or regulatory capital. For more information, see "—Liquidity and Capital Resources—Capital Requirements" and "—Regulatory Matters."
Risk Management
Credit Risk – Loans
.
Farmer Mac is exposed to credit risk resulting from the inability of borrowers to repay their loans in conjunction with a deficiency in the value of the collateral relative to the outstanding balance of the loan and the costs of liquidation. Farmer Mac is exposed to credit risk on:
|
•
|
loans held;
|
|
•
|
loans underlying Farmer Mac Guaranteed Securities; and
|
|
•
|
loans underlying LTSPCs.
|
Farmer Mac generally assumes 100 percent of the credit risk on loans held and loans underlying Farmer Mac I Guaranteed Securities, LTSPCs, and Farmer Mac Guaranteed Securities – Rural Utilities. Farmer Mac has direct credit exposure to loans in non-AgVantage transactions and indirect credit exposure to loans that secure AgVantage transactions, which involve a general obligation of a lender secured by qualified loans. The credit exposure of Farmer Mac and Farmer Mac II LLC on USDA Guaranteed Securities is covered by the full faith and credit of the United States. Farmer Mac believes that the Corporation and Farmer Mac II LLC have little or no credit risk exposure to USDA Guaranteed Securities because of the USDA guarantee. As of
December 31, 2012
, neither Farmer Mac nor Farmer Mac II LLC had experienced any credit losses on any business under the USDA Guarantees line of
91
business and does not expect that Farmer Mac or Farmer Mac II LLC will incur any such losses in the future.
Farmer Mac has established underwriting, collateral valuation, and documentation standards for agricultural real estate mortgage loans and rural utilities loans. Farmer Mac believes that these standards mitigate the risk of loss from borrower defaults and provide guidance about the management, administration, and conduct of underwriting and appraisals to all participating and potential Farm & Ranch lenders. These standards were developed on the basis of industry norms for agricultural real estate mortgage loans and rural utilities loans and are designed to assess the creditworthiness of the borrower, as well as the value of the collateral securing the loan. Farmer Mac evaluates and adjusts these standards on an ongoing basis based on current and anticipated market conditions. For example, in mid-August 2012 Farmer Mac refined its non-AgVantage Farm & Ranch loan underwriting standards to:
|
•
|
increase the minimum ratio of current assets to current liabilities (current ratio) from 1.0 to 1.25;
|
|
•
|
decrease the maximum LTV from 70 percent to 60 percent for loans secured by agricultural real estate located in designated states in the upper Midwest; and
|
|
•
|
focus on a borrower's total debt coverage ratio for purposes of analyzing loan repayment capacity (rather than considering total debt coverage ratio in conjunction with property debt coverage ratio).
|
These changes were in response to economic conditions affecting agricultural producers, including volatility in revenues and concern over the sustainability of current land values in certain areas, that Farmer Mac believes may have an effect on overall borrower repayment capability. Farmer Mac believes that these refinements to its underwriting standards are consistent with practices undertaken within the agricultural credit industry in general, and does not expect these changes to have a significant impact on Farmer Mac's business volume. For additional information on Farmer Mac's underwriting standards for the Farm & Ranch line of business, see "Business—Farmer Mac Lines of Business—Farm & Ranch—Underwriting and Collateral Valuation (Appraisal) Standards."
Farmer Mac requires approved lenders to make representations and warranties regarding the conformity of eligible agricultural mortgage and rural utilities loans to these standards, the accuracy of loan data provided to Farmer Mac, and other requirements related to the loans. Sellers are responsible to Farmer Mac for breaches of those representations and warranties, and Farmer Mac has the ability to require a seller to cure, replace, or repurchase a loan sold or transferred to Farmer Mac if any breach of a representation or warranty is discovered that was material to Farmer Mac's decision to purchase the loan or that directly or indirectly causes a default or potential loss on a loan sold or transferred by the seller to Farmer Mac. Farmer Mac has not required a seller to cure or repurchase a loan purchased by Farmer Mac for breach of a representation or warranty in the last three years. Farmer Mac also underwrites all of the agricultural mortgage and rural utilities loans that it holds in its portfolio.
Under contracts with Farmer Mac and in consideration for servicing fees, Farmer Mac-approved central servicers service mortgage loans in accordance with Farmer Mac's requirements. Central servicers are responsible to Farmer Mac for serious errors in the servicing of those mortgage loans. If a central servicer materially breaches the terms of its servicing agreement with Farmer Mac, such as failing to forward payments received or releasing collateral without Farmer Mac's consent, or experiences insolvency or bankruptcy, Farmer Mac has the right to terminate the servicing relationship for a particular loan or the entire portfolio serviced by the central servicer. In addition, Farmer Mac can proceed against the central servicer in arbitration or exercise any remedies available to it under law. In the last three years, Farmer Mac has not exercised any remedies or taken any formal action against any central servicers. Additional information regarding Farmer Mac's underwriting and collateral valuation standards and lender eligibility
92
requirements are presented in "Business—Farmer Mac Lines of Business—Farm & Ranch—Underwriting and Collateral Valuation (Appraisal) Standards," "Business—Farmer Mac Lines of Business—Farm & Ranch—Approved Lenders" and "Business—Farmer Mac Lines of Business—Rural Utilities."
Farmer Mac AgVantage securities are general obligations of institutions approved by Farmer Mac and are secured by eligible loans in an amount at least equal to the outstanding principal amount of the security. Farmer Mac excludes the loans that secure AgVantage securities from the credit risk metrics it discloses because of the credit quality of the issuing institutions, the collateralization level for the securities, and because delinquent loans are required to be removed from the pool of pledged loans and replaced with current eligible loans. As such, all AgVantage securities are secured by current loans representing at least 100 percent of the outstanding amount of the security. As of
December 31, 2012
, Farmer Mac had not experienced any credit losses on any AgVantage securities and does not expect to incur any such losses in the future. See "—Credit Risk – Institutional" for more information about Farmer Mac's credit risk on AgVantage securities.
Farmer Mac has developed different underwriting standards for rural utilities loans that depend on whether direct or indirect credit exposure is assumed on a loan and whether the borrower is an electric distribution cooperative or a generation and transmission ("G&T") cooperative. As of
December 31, 2012
, there were no delinquencies in Farmer Mac's portfolio of rural utilities loans, which includes rural utilities loans held and rural utilities loans underlying or securing Farmer Mac Guaranteed Securities – Rural Utilities. Farmer Mac's direct credit exposure to rural utilities loans as of
December 31, 2012
was
$1.0 billion
, of which
$1.0 billion
were loans to electric distribution cooperatives and
$24.9 million
were loans to G&T cooperatives. Farmer Mac also had indirect credit exposure to the rural utilities loans securing Farmer Mac Guaranteed Securities - Rural Utilities structured as AgVantage securities, some of which were secured by loans to G&T cooperatives. For more information, see "—Credit Risk – Institutional."
Farmer Mac maintains an allowance for losses to cover estimated probable losses on loans held and loans underlying LTSPCs and Farmer Mac Guaranteed Securities. The methodology that Farmer Mac uses to determine the level of its allowance for losses is described in "Management's Discussion and Analysis of Financial Condition and Results of Operations—Critical Accounting Policies and Estimates—Allowance for Losses." Management believes that this methodology produces a reasonable estimate of probable losses, as of the balance sheet date, for all loans held and loans underlying Farmer Mac Guaranteed Securities and LTSPCs, in accordance with accounting guidance related to contingencies and measuring impairment of individual loans.
The following table summarizes the components of Farmer Mac's allowance for losses as of
December 31, 2012
and
2011
:
|
|
December 31, 2012
|
December 31, 2011
|
|||||
|
|
(in thousands)
|
||||||
|
Allowance for loan losses
|
$
|
11,351
|
|
$
|
10,161
|
|
|
|
Reserve for losses:
|
|
|
|
|
|||
|
Off-balance sheet Farmer Mac I Guaranteed Securities
|
556
|
|
364
|
|
|||
|
LTSPCs
|
4,983
|
|
6,991
|
|
|||
|
Total allowance for losses
|
$
|
16,890
|
|
$
|
17,516
|
|
|
93
The following table summarizes the changes in the components of Farmer Mac's allowance for losses for each year in the five-year period ended
December 31, 2012
:
|
Allowance
for Loan Losses |
Reserve
for Losses |
Total
Allowance for Losses |
|||||||||
|
|
(in thousands)
|
||||||||||
|
Balance as of January 1, 2008
|
$
|
1,690
|
|
$
|
2,197
|
|
$
|
3,887
|
|
||
|
Provision for losses
|
14,531
|
|
3,309
|
|
17,840
|
|
|||||
|
Charge-offs
|
(5,308
|
)
|
—
|
|
(5,308
|
)
|
|||||
|
Recoveries
|
16
|
|
—
|
|
16
|
|
|||||
|
Balance as of December 31, 2008
|
$
|
10,929
|
|
$
|
5,506
|
|
$
|
16,435
|
|
||
|
Provision for losses
|
2,853
|
|
2,389
|
|
5,242
|
|
|||||
|
Charge-offs
|
(8,491
|
)
|
—
|
|
(8,491
|
)
|
|||||
|
Recoveries
|
1,001
|
|
—
|
|
1,001
|
|
|||||
|
Balance as of December 31, 2009
|
$
|
6,292
|
|
$
|
7,895
|
|
$
|
14,187
|
|
||
|
Provision for losses
|
1,893
|
|
2,417
|
|
4,310
|
|
|||||
|
Charge-offs
|
(605
|
)
|
—
|
|
(605
|
)
|
|||||
|
Recoveries
|
2,223
|
|
—
|
|
2,223
|
|
|||||
|
Balance as of December 31, 2010
|
$
|
9,803
|
|
$
|
10,312
|
|
$
|
20,115
|
|
||
|
Provision for/(releases of) losses
|
610
|
|
(2,957
|
)
|
(2,347
|
)
|
|||||
|
Charge-offs
|
(252
|
)
|
—
|
|
(252
|
)
|
|||||
|
Balance as of December 31, 2011
|
$
|
10,161
|
|
$
|
7,355
|
|
$
|
17,516
|
|
||
|
Provision for/(releases of) losses
|
3,691
|
|
(1,816
|
)
|
1,875
|
|
|||||
|
Charge-offs
|
(2,501
|
)
|
—
|
|
(2,501
|
)
|
|||||
|
Balance as of December 31, 2012
|
$
|
11,351
|
|
$
|
5,539
|
|
$
|
16,890
|
|
||
Farmer Mac recorded net provisions of
$1.9 million
to the allowance for losses during
2012
, compared to releases of
$2.3 million
in 2011. During
2012
and
2011
, Farmer Mac charged off
$2.5 million
and
$0.3 million
, respectively, in losses against the allowance for losses. Farmer Mac had no recoveries in
2012
or
2011
.
As of
December 31, 2012
, Farmer Mac's allowance for losses totaled
$16.9 million
, or
36
basis points of the outstanding principal balance of loans held and loans underlying LTSPCs and Farmer Mac I Guaranteed Securities (excluding AgVantage securities), compared to
$17.5 million
, or
40
basis points, as of
December 31, 2011
.
As of
December 31, 2012
, Farmer Mac's 90-day delinquencies were
$33.3 million
(
0.70 percent
of the non-AgVantage Farm & Ranch portfolio), compared to
$40.6 million
(
0.93 percent
of the non-AgVantage Farm & Ranch portfolio) as of
December 31, 2011
.
Loans that have been restructured were insignificant and are included within the reported 90-day delinquency disclosure. From quarter to quarter, Farmer Mac anticipates that 90-day delinquencies will fluctuate, both in dollars and as a percentage of the outstanding portfolio, with typically higher levels likely at the end of the first and third quarters of each year corresponding to the semi-annual (January 1 and July 1) payment characteristics of most Farm & Ranch loans.
When analyzing the overall risk profile of its program business, Farmer Mac takes into account more than the Farm & Ranch loan delinquency percentages provided above. The total program business includes
94
AgVantage securities and rural utilities loans, neither of which have any delinquencies, and USDA Guaranteed Securities, which are backed by the full faith and credit of the United States. Across all of Farmer Mac's lines of business, 90-day delinquencies represented
0.26 percent
of total program business as of
December 31, 2012
, compared to
0.34 percent
as of
December 31, 2011
.
As of
December 31, 2012
, Farmer Mac's ethanol exposure, which includes loans held and loans subject to LTSPCs, was
$144.9 million
(
3.1 percent
of the non-AgVantage Farm & Ranch portfolio) on
27
different plants, with an additional
$16.9 million
of undisbursed commitments. Other than the undisbursed commitments, Farmer Mac does not expect to add additional ethanol loans to its portfolio. Some participants within the ethanol industry continue to experience stress, which has been exacerbated by rising corn prices due to the drought, as well as the elimination of tax and tariff support in 2012. As of
December 31, 2012
, Farmer Mac had in its portfolio one ethanol facility loan that was more than 90 days delinquent and for which Farmer Mac has recorded a specific allowance.
The following table presents historical information regarding Farmer Mac's 90-day delinquencies in the Farm & Ranch line of business compared to the principal balance of all Farm & Ranch loans held and loans underlying Farmer Mac I Guaranteed Securities (excluding AgVantage securities) and LTSPCs:
|
Outstanding Loans, Guarantees, and LTSPCs (1)
|
90-day
Delinquencies |
Percentage
|
||||||||
|
|
(dollars in thousands)
|
|||||||||
|
As of:
|
|
|
|
|||||||
|
December 31, 2012
|
$
|
4,747,289
|
|
$
|
33,263
|
|
0.70
|
%
|
||
|
September 30, 2012
|
4,402,957
|
|
40,797
|
|
0.93
|
%
|
||||
|
June 30, 2012
|
4,403,212
|
|
47,026
|
|
1.07
|
%
|
||||
|
March 31, 2012
|
4,372,483
|
|
53,119
|
|
1.21
|
%
|
||||
|
December 31, 2011
|
4,349,163
|
|
40,622
|
|
0.93
|
%
|
||||
|
September 30, 2011
|
4,381,264
|
|
44,848
|
|
1.02
|
%
|
||||
|
June 30, 2011
|
4,315,987
|
|
54,633
|
|
1.27
|
%
|
||||
|
March 31, 2011
|
4,314,328
|
|
57,324
|
|
1.33
|
%
|
||||
|
December 31, 2010
|
4,304,120
|
|
70,248
|
|
1.63
|
%
|
||||
|
(1)
|
Excludes loans pledged to secure AgVantage securities.
|
Prior to 2012, Farmer Mac disclosed measures for both 90-day delinquencies and non-performing assets. The 90-day delinquency measure includes loans 90 days or more past due as well as loans in foreclosure, loans restructured after delinquency, and non-performing loans where the borrower is in bankruptcy. The non-performing assets measure included all loans included in the 90-day delinquency measure plus REO properties and performing loans where the borrower is in bankruptcy. Beginning with first quarter 2012, Farmer Mac discontinued the disclosure of the non-performing assets measure because Farmer Mac believes that 90-day delinquency information is the best measure of borrower credit quality deterioration when evaluating credit risk exposure on loans in its portfolio. Management observed that the difference between the 90-day delinquency measure and the non-performing assets measure historically has not been material and concluded that the disclosure of the non-performing assets measure added unnecessary redundancy and complication to Farmer Mac's disclosures without adding meaningful insight into the asset quality of its portfolio. In addition to REO properties, the 90-day delinquency measure, and related statistics, Farmer Mac will continue to disclose information about impaired loans, nonaccrual loans, and loans identified as substandard in its portfolio of eligible loan assets. Any loan performing in bankruptcy
95
will continue to be reported to the extent it falls within one of these categories relevant to Farmer Mac's asset quality.
As of
December 31, 2012
, Farmer Mac individually analyzed
$44.3 million
of the
$100.4 million
of recorded investment in impaired loans for collateral shortfalls against updated appraised values, other updated collateral valuations or discounted values. For the remaining
$56.0 million
of impaired assets for which updated valuations were not available, Farmer Mac evaluated them in the aggregate in consideration of their similar risk characteristics and historical statistics. Farmer Mac recorded specific allowances of
$6.7 million
for undercollateralized assets as of
December 31, 2012
. Farmer Mac's non-specific or general allowances were
$10.2 million
as of
December 31, 2012
.
Loans in the Farm & Ranch line of business are all first mortgage agricultural real estate loans. Accordingly, Farmer Mac's exposure on a loan is limited to the difference between (1) the total of the accrued interest, advances, and the principal balance of a loan and (2) the value of the property less the cost to sell. Measurement of that excess or shortfall is the best predictor and determinant of loss, compared to other measures that evaluate the efficiency of a particular farm operator. Debt service ratios depend upon farm operator efficiency and leverage, which can vary widely within a geographic region, commodity type, or an operator's business and farming skills. Original LTVs (calculated by dividing the loan principal balance at the time of guarantee, purchase or commitment by the appraised value at the date of loan origination or, when available, updated appraised value at the time of guarantee, purchase or commitment) are one of many factors Farmer Mac considers in evaluating loss severity. Other factors include, but are not limited to, other underwriting standards, commodity and farming forecasts, and regional economic and agricultural conditions.
LTVs depend upon the market value of a property, as determined in accordance with Farmer Mac's collateral valuation standards. As of
December 31, 2012
, the weighted-average original LTV for Farm & Ranch loans held and loans underlying LTSPCs and Farmer Mac I Guaranteed Securities (excluding AgVantage securities) was
52 percent
, and the weighted-average original LTV for all 90-day delinquencies was
59 percent
.
The following table presents outstanding Farm & Ranch loans held and loans underlying LTSPCs and Farmer Mac I Guaranteed Securities (excluding AgVantage securities) and 90-day delinquencies as of
December 31, 2012
by year of origination, geographic region, commodity/collateral type, and original LTV:
96
|
Farm & Ranch 90-Day Delinquencies as of December 31, 2012
|
|||||||||||||
|
|
Distribution of Outstanding Loans, Guarantees, and LTSPCs
|
Outstanding Loans, Guarantees, and LTSPCs (1)
|
90-Day Delinquencies (2)
|
Percentage
|
|||||||||
|
|
(dollars in thousands)
|
||||||||||||
|
By year of origination:
|
|
|
|
|
|||||||||
|
Before 2001
|
10
|
%
|
$
|
468,162
|
|
$
|
1,734
|
|
0.37
|
%
|
|||
|
2001
|
3
|
%
|
144,947
|
|
1,380
|
|
0.95
|
%
|
|||||
|
2002
|
4
|
%
|
192,336
|
|
5,508
|
|
2.86
|
%
|
|||||
|
2003
|
5
|
%
|
226,572
|
|
1,124
|
|
0.50
|
%
|
|||||
|
2004
|
5
|
%
|
264,254
|
|
678
|
|
0.26
|
%
|
|||||
|
2005
|
7
|
%
|
319,885
|
|
568
|
|
0.18
|
%
|
|||||
|
2006
|
7
|
%
|
361,892
|
|
9,602
|
|
2.65
|
%
|
|||||
|
2007
|
7
|
%
|
315,855
|
|
10,782
|
|
3.41
|
%
|
|||||
|
2008
|
8
|
%
|
385,915
|
|
716
|
|
0.19
|
%
|
|||||
|
2009
|
6
|
%
|
290,126
|
|
469
|
|
0.16
|
%
|
|||||
|
2010
|
9
|
%
|
430,730
|
|
702
|
|
0.16
|
%
|
|||||
|
2011
|
12
|
%
|
547,460
|
|
—
|
|
—
|
%
|
|||||
|
2012
|
17
|
%
|
799,155
|
|
—
|
|
—
|
%
|
|||||
|
Total
|
100
|
%
|
$
|
4,747,289
|
|
$
|
33,263
|
|
0.70
|
%
|
|||
|
By geographic region (3):
|
|
|
|
|
|
|
|
|
|||||
|
Northwest
|
18
|
%
|
$
|
840,693
|
|
$
|
6,560
|
|
0.78
|
%
|
|||
|
Southwest
|
37
|
%
|
1,781,822
|
|
6,597
|
|
0.37
|
%
|
|||||
|
Mid-North
|
21
|
%
|
989,903
|
|
2,979
|
|
0.30
|
%
|
|||||
|
Mid-South
|
10
|
%
|
504,914
|
|
3,112
|
|
0.62
|
%
|
|||||
|
Northeast
|
6
|
%
|
261,756
|
|
1,630
|
|
0.62
|
%
|
|||||
|
Southeast
|
8
|
%
|
368,201
|
|
12,385
|
|
3.36
|
%
|
|||||
|
Total
|
100
|
%
|
$
|
4,747,289
|
|
$
|
33,263
|
|
0.70
|
%
|
|||
|
By commodity/collateral type:
|
|
|
|
|
|
|
|||||||
|
Crops
|
46
|
%
|
$
|
2,171,349
|
|
$
|
4,668
|
|
0.21
|
%
|
|||
|
Permanent plantings
|
19
|
%
|
882,532
|
|
10,801
|
|
1.22
|
%
|
|||||
|
Livestock
|
27
|
%
|
1,287,741
|
|
7,222
|
|
0.56
|
%
|
|||||
|
Part-time farm
|
4
|
%
|
201,865
|
|
6,118
|
|
3.03
|
%
|
|||||
|
Ag. Storage and processing (including ethanol facilities)
|
4
|
%
|
191,786
|
|
4,337
|
|
2.26
|
%
|
|||||
|
Other
|
—
|
|
12,016
|
|
117
|
|
0.97
|
%
|
|||||
|
Total
|
100
|
%
|
$
|
4,747,289
|
|
$
|
33,263
|
|
0.70
|
%
|
|||
|
By original loan-to-value ratio:
|
|||||||||||||
|
0.00% to 40.00%
|
28
|
%
|
$
|
1,338,715
|
|
$
|
13,530
|
|
1.01
|
%
|
|||
|
40.01% to 50.00%
|
18
|
%
|
851,980
|
|
8,287
|
|
0.97
|
%
|
|||||
|
50.01% to 60.00%
|
27
|
%
|
1,296,225
|
|
5,115
|
|
0.39
|
%
|
|||||
|
60.01% to 70.00%
|
23
|
%
|
1,091,427
|
|
4,605
|
|
0.42
|
%
|
|||||
|
70.01% to 80.00%
|
3
|
%
|
122,259
|
|
1,411
|
|
1.15
|
%
|
|||||
|
80.01% to 90.00%
|
1
|
%
|
46,683
|
|
315
|
|
0.67
|
%
|
|||||
|
Total
|
100
|
%
|
$
|
4,747,289
|
|
$
|
33,263
|
|
0.70
|
%
|
|||
|
(1)
|
Excludes loans pledged to secure AgVantage securities.
|
|
(2)
|
Includes loans and loans underlying Farmer Mac I Guaranteed Securities and LTSPCs that are 90 days or more past due, in foreclosure, restructured after delinquency, and in bankruptcy, excluding loans performing under either their original loan terms or a court-approved bankruptcy plan.
|
|
(3)
|
Geographic regions - Northwest (AK, ID, MT, ND, NE, OR, SD, WA, WY); Southwest (AZ, CA, CO, HI, NM, NV, UT); Mid-North (IA, IL, IN, MI, MN, MO, WI); Mid-South (KS, OK, TX); Northeast (CT, DE, KY, MA, MD, ME, NC, NH, NJ, NY, OH, PA, RI, TN, VA, VT, WV); and Southeast (AL, AR, FL, GA, LA, MS, SC).
|
97
The following table presents Farmer Mac's cumulative net credit losses relative to the cumulative original balance for all Farm & Ranch loans purchased and loans underlying LTSPCs and Farmer Mac I Guaranteed Securities (excluding AgVantage securities) as of
December 31, 2012
by year of origination, geographic region, and commodity/collateral type. The purpose of this information is to present information regarding losses relative to original Farm & Ranch purchases, guarantees, and commitments.
|
Farm & Ranch Credit Losses Relative to all Cumulative
|
||||||||||
|
Original Loans, Guarantees, and LTSPCs as of December 31, 2012
|
||||||||||
|
Cumulative Original Loans, Guarantees and LTSPCs (1)
|
Cumulative Net Credit Losses
|
Cumulative Loss Rate
|
||||||||
|
|
(dollars in thousands)
|
|||||||||
|
By year of origination:
|
|
|
|
|||||||
|
Before 2001
|
$
|
7,361,053
|
|
$
|
11,032
|
|
0.15
|
%
|
||
|
2001
|
1,153,684
|
|
177
|
|
0.02
|
%
|
||||
|
2002
|
1,188,928
|
|
73
|
|
0.01
|
%
|
||||
|
2003
|
1,011,984
|
|
410
|
|
0.04
|
%
|
||||
|
2004
|
742,037
|
|
180
|
|
0.02
|
%
|
||||
|
2005
|
895,088
|
|
(188
|
)
|
(0.02
|
)%
|
||||
|
2006
|
925,770
|
|
9,422
|
|
1.02
|
%
|
||||
|
2007
|
700,039
|
|
1,747
|
|
0.25
|
%
|
||||
|
2008
|
778,412
|
|
3,236
|
|
0.42
|
%
|
||||
|
2009
|
507,960
|
|
1,517
|
|
0.30
|
%
|
||||
|
2010
|
609,533
|
|
—
|
|
—
|
%
|
||||
|
2011
|
669,032
|
|
—
|
|
—
|
%
|
||||
|
2012
|
858,162
|
|
—
|
|
—
|
%
|
||||
|
Total
|
$
|
17,401,682
|
|
$
|
27,606
|
|
0.16
|
%
|
||
|
By geographic region (2):
|
|
|
|
|
|
|
||||
|
Northwest
|
$
|
3,255,820
|
|
$
|
11,060
|
|
0.34
|
%
|
||
|
Southwest
|
6,472,172
|
|
9,015
|
|
0.14
|
%
|
||||
|
Mid-North
|
3,061,827
|
|
6,708
|
|
0.22
|
%
|
||||
|
Mid-South
|
1,594,559
|
|
(321
|
)
|
(0.02
|
)%
|
||||
|
Northeast
|
1,471,956
|
|
83
|
|
0.01
|
%
|
||||
|
Southeast
|
1,545,348
|
|
1,061
|
|
0.07
|
%
|
||||
|
Total
|
$
|
17,401,682
|
|
$
|
27,606
|
|
0.16
|
%
|
||
|
By commodity/collateral type:
|
|
|
|
|
|
|
||||
|
Crops
|
$
|
7,311,725
|
|
$
|
4,334
|
|
0.06
|
%
|
||
|
Permanent plantings
|
3,718,498
|
|
9,383
|
|
0.25
|
%
|
||||
|
Livestock
|
4,574,993
|
|
3,798
|
|
0.08
|
%
|
||||
|
Part-time farm
|
1,046,861
|
|
589
|
|
0.06
|
%
|
||||
|
Ag. Storage and processing (including ethanol facilities) (3)
|
603,323
|
|
9,502
|
|
1.57
|
%
|
||||
|
Other
|
146,282
|
|
—
|
|
—
|
%
|
||||
|
Total
|
$
|
17,401,682
|
|
$
|
27,606
|
|
0.16
|
%
|
||
|
(1)
|
Excludes loans pledged to secure AgVantage securities.
|
|
(2)
|
Geographic regions - Northwest (AK, ID, MT, ND, NE, OR, SD, WA, WY); Southwest (AZ, CA, CO, HI, NM, NV, UT); Mid-North (IA, IL, IN, MI, MN, MO, WI); Mid-South (KS, OK, TX); Northeast (CT, DE, KY, MA, MD, ME, NC, NH, NJ, NY, OH, PA, RI, TN, VA, VT, WV); and Southeast (AL, AR, FL, GA, LA, MS, SC).
|
|
(3)
|
Several of the loans underlying agricultural storage and processing LTSPCs are for facilities under construction and, as of
December 31, 2012
, approximately
$16.9 million
of the loans were not yet disbursed by the lender.
|
98
In Farmer Mac's experience, the degree to which the collateral is specialized or highly improved, such as permanent plantings and facilities, is a more significant determinant of ultimate losses on a given loan than the geographic location of a particular borrower or in many cases the particular commodity type. In Farmer Mac's experience, the versatility of a borrower's operation (and in the case of persisting adverse economic conditions, the borrower's ability to switch commodity groups) will more likely result in profitability for the borrower and, consequently, a lower risk of decreased value for the underlying collateral. However, producers of agricultural commodities that require specialized or highly improved property are less able to adapt their operations when faced with adverse economic conditions. If such adverse economic conditions persist for these commodities, not only might the borrower face a higher risk of default, but also the prospective sale value of the collateral is more likely to decrease and the related loan may become undercollateralized. This analysis is consistent with corresponding commodity analyses, which indicate that Farmer Mac has experienced higher loss and collateral deficiency rates in its loans classified as permanent plantings as well as agstorage and processing loans, including Farmer Mac's exposure to loans on ethanol plants, for which the collateral is typically highly improved and specialized. See "Management's Discussion and Analysis of Financial Condition and Results of Operations—Outlook."
Analysis of portfolio performance by geographic distribution indicates that, while commodities are the primary determinant of exposure to loss, within most commodity groups certain geographic areas allow greater economies of scale or proximity to markets than others and, consequently, result in more successful operations within the commodity group. Likewise, certain geographic areas offer better growing conditions than others and, consequently, result in more versatile and more successful operators within a given commodity group – and the ability to switch crops among commodity groups. As of December 31, 2012, the properties that secure Farmer Mac's 90-day delinquencies were not concentrated in any region of the country, and many of these borrowers have experienced reduced profit margins caused by rapidly rising operating expenses or expanding business segments followed by a decline in demand for their products. Starting with its disclosures for first quarter 2013, Farmer Mac will revise its geographic distribution parameters to more closely align them with the geographic areas in which commonalities among borrower, commodity, and production characteristics exist. Farmer Mac does not expect its geographic concentration measure to deviate materially from prior periods as a result of this change.
Farmer Mac's methodologies for pricing its guarantee and commitment fees, managing credit risks, and providing adequate allowances for losses consider all of the foregoing factors and information.
Credit Risk – Institutional
. Farmer Mac is exposed to credit risk arising from its business relationships with other institutions including:
|
•
|
issuers of AgVantage securities and other investments held or guaranteed by Farmer Mac;
|
|
•
|
approved lenders and servicers; and
|
|
•
|
interest rate swap counterparties.
|
Each AgVantage security is a general obligation of an issuing institution that is secured by eligible loans in an amount at least equal to the outstanding principal amount of the security, with some level of overcollateralization also required for Farmer Mac I AgVantage securities. Farmer Mac approves AgVantage counterparties and manages institutional credit risk related to such AgVantage counterparties by requiring them to meet Farmer Mac's standards for creditworthiness. The required collateralization level is established at the time of issuance and does not change during the life of the security. In AgVantage transactions, the corporate obligor is required to remove from the pool of pledged collateral any loan that becomes more than 30 days delinquent in the payment of principal or interest and to
99
substitute an eligible loan that is current in payment to maintain the minimum required collateralization level. In the event of a default on the general obligation, Farmer Mac would have recourse to the pledged collateral and have rights to the ongoing borrower payments of principal and interest. For a more detailed description of AgVantage securities, see "Business—Farmer Mac Lines of Business—Farm & Ranch—AgVantage Securities."
Outstanding AgVantage on-balance sheet Farmer Mac I Guaranteed Securities totaled
$3.3 billion
as of
December 31, 2012
and
$2.7 billion
as of
December 31, 2011
. Farmer Mac Guaranteed Securities – Rural Utilities structured as AgVantage transactions issued by CFC and held by Farmer Mac totaled
$1.3 billion
as of
December 31, 2012
and
$1.4 billion
as of
December 31, 2011
. In addition, outstanding off-balance sheet AgVantage transactions totaled
$1.0 billion
as of both
December 31, 2012
and
December 31, 2011
.
The following table provides information about the issuers of AgVantage securities, as well as the required collateralization levels for those transactions as of
December 31, 2012
and
December 31, 2011
:
|
|
December 31, 2012
|
December 31, 2011
|
||||||||||||||
|
Counterparty
|
Balance
|
Credit Rating
|
Required Collateralization
|
Balance
|
Credit Rating
|
Required Collateralization
|
||||||||||
|
|
(dollars in thousands)
|
|||||||||||||||
|
MetLife (1)
|
$
|
2,750,000
|
|
AA-
|
103%
|
$
|
2,750,000
|
|
AA-
|
103%
|
||||||
|
CFC
|
1,311,175
|
|
A
|
100%
|
1,427,071
|
|
A
|
100%
|
||||||||
|
Rabo Agrifinance, Inc.
|
1,500,000
|
|
N/A
|
106%
|
900,000
|
|
N/A
|
106%
|
||||||||
|
Rabobank N.A.
|
50,000
|
|
N/A
|
106%
|
50,000
|
|
N/A
|
106%
|
||||||||
|
Other (2)
|
9,200
|
|
N/A
|
111% to 120%
|
11,000
|
|
N/A
|
111% to 120%
|
||||||||
|
Total outstanding
|
$
|
5,620,375
|
|
|
|
$
|
5,138,071
|
|
|
|
||||||
|
(1)
|
Includes securities issued by Metropolitan Life Insurance Company and MetLife Insurance Company of Connecticut.
|
|
(2)
|
Consists of AgVantage securities issued by
4
different issuers as of both
December 31, 2012
and
December 31, 2011
.
|
Farmer Mac manages institutional credit risk related to lenders and servicers by requiring those institutions to meet Farmer Mac's standards for creditworthiness. Farmer Mac monitors the financial condition of those institutions by evaluating financial statements and bank credit rating agency reports. For more information on Farmer Mac's approval of lenders, see "Business—Farmer Mac Lines of Business—Farm & Ranch—Approved Lenders." Credit risk related to interest rate swap contracts is discussed in "—Risk Management—Interest Rate Risk" and Note 6 to the consolidated financial statements.
Farmer Mac manages institutional credit risk related to its interest rate swap counterparties through collateralization provisions contained in each of its swap agreements that varies based on the market value of its swaps portfolio with each counterparty. In addition, Farmer Mac transacts interest rate swaps with multiple counterparties to ensure a more even distribution of institutional credit risk related to its swap transactions.
Credit Risk
–
Other Investments
. As of
December 31, 2012
, Farmer Mac had
$785.6 million
of cash and cash equivalents and
$2.5 billion
of investment securities. The management of the credit risk inherent in these investments is governed by Farmer Mac's own policies and FCA regulations, which establish limitations on dollar amount, issuer concentration, and credit quality. Those regulations can be found at 12 C.F.R. §§ 652.1-652.45 (the "Liquidity and Investment Regulations"). In addition to establishing a portfolio of highly liquid investments as an available source of cash, the goals of Farmer Mac's investment
100
policies are designed to minimize the Corporation's exposure to financial market volatility, preserve capital, and support the Corporation's access to the debt markets.
FCA's current Liquidity and Investment Regulations and Farmer Mac's policies generally require each investment or issuer of an investment to be highly rated by an NRSRO. Investments in mortgage securities and asset-backed securities are required to have a rating in the highest NRSRO category. Corporate debt securities with maturities of no more than five years but more than three years are required to be rated in one of the two highest categories; corporate debt securities with maturities of three years or less are required to be rated in one of the three highest categories. Some investments do not require a rating, such as Treasury Securities and other obligations fully insured by the United States Government or a Government Agency or diversified investment funds regulated under the Investment Company Act of 1940. Investments in diversified investment funds are further limited to those funds that are holding only instruments approved for direct investment by Farmer Mac. FCA has sought public comment regarding its use of credit ratings in its Liquidity and Investment Regulations for purposes of a final rule to be published at a later date.
FCA's Liquidity and Investment Regulations and Farmer Mac's policies also establish concentration limits, which are intended to limit exposure to any one counterparty. FCA's Liquidity and Investment Regulations limit Farmer Mac's total credit exposure to any single issuer of securities and uncollateralized financial derivatives to 25 percent of the Corporation's regulatory capital (as of
December 31, 2012
,
25 percent of Farmer Mac's regulatory capital was
$134.0 million
). This limitation is not applied to the obligations of the United States or to qualified investment funds. The limitation applied to the obligations of any GSE is 100 percent of Farmer Mac's regulatory capital. Since June 2010, Farmer Mac's policy applicable to new investments limits the Corporation's total exposure to any single issuer of securities (other than GSEs and Government Agencies) and uncollateralized financial derivatives to 5 percent of the Corporation's regulatory capital. For more information on recent and proposed changes to the Liquidity and Investment Regulations, see "—Regulatory Matters."
Interest Rate Risk
. Farmer Mac is subject to interest rate risk on all assets retained on balance sheet for investment purposes because of possible timing differences in the cash flows of the assets and related liabilities. This risk is primarily related to loans held and Farmer Mac Guaranteed Securities and USDA Guaranteed Securities due to the ability of borrowers to prepay their mortgages before the scheduled maturities, thereby increasing the risk of asset and liability cash flow mismatches. Cash flow mismatches in a changing interest rate environment can reduce the earnings of the Corporation if assets repay sooner than expected and the resulting cash flows must be reinvested in lower-yielding investments when Farmer Mac's funding costs cannot be correspondingly reduced, or if assets repay more slowly than expected and the associated debt must be replaced by higher-cost debt.
Yield maintenance provisions and other prepayment penalties contained in many agricultural mortgage and rural utilities loans reduce, but do not eliminate, prepayment risk, particularly in the case of a defaulted loan where yield maintenance may not be collected. Those provisions require borrowers to make an additional payment when they prepay their loans so that, when reinvested with the prepaid principal, yield maintenance payments generate substantially the same cash flows that would have been generated had the loan not prepaid. Those provisions create a disincentive to prepayment and compensate the Corporation for some of its interest rate risks. As of
December 31, 2012
,
5 percent
of the total outstanding balance of loans in the Farm & Ranch line of business where Farmer Mac either owned the loan or the beneficial interest in the underlying loan had yield maintenance provisions and
4 percent
had other forms of prepayment protection (together covering
13 percent
of all loans with fixed interest rates). Of the Farm & Ranch loans purchased in
2012
,
0.2 percent
had yield maintenance or another form
101
of prepayment protection. As of
December 31, 2012
,
none
of the USDA Guaranteed Securities had yield maintenance provisions; however,
8 percent
contained prepayment penalties. Of the USDA Guaranteed Securities purchased in
2012
,
7 percent
contained various forms of prepayment penalties. As of
December 31, 2012
,
65 percent
of the rural utilities loans owned by Farmer Mac had yield maintenance provisions. Of the rural utilities loans purchased in
2012
,
50 percent
had yield maintenance provisions. As of
December 31, 2012
, substantially all of the rural utilities loans held in trusts where Farmer Mac owned the beneficial interest in the underlying loan had yield maintenance provisions.
Taking into consideration the prepayment provisions and the default probabilities associated with its mortgage assets, Farmer Mac uses prepayment models to project and value cash flows associated with these assets. Because borrowers' behaviors in various interest rate environments may change over time, Farmer Mac periodically evaluates the effectiveness of these models compared to actual prepayment experience and adjusts and refines the models as necessary to improve the precision of subsequent prepayment forecasts.
The following table presents the unpaid principal balance of Farmer Mac's on-balance sheet program assets based on their interest rate characteristics:
|
|
As of December 31,
|
||||||
|
|
2012
|
2011
|
|||||
|
|
(in thousands)
|
||||||
|
Fixed rate (10-yr. wtd. avg. term)
|
$
|
4,483,453
|
|
$
|
5,288,687
|
|
|
|
5- to 10-year ARMs and resets
|
2,648,103
|
|
1,230,374
|
|
|||
|
1-Month to 3-Year ARMs
|
1,803,867
|
|
1,967,960
|
|
|||
|
Total held in portfolio
|
$
|
8,935,423
|
|
$
|
8,487,021
|
|
|
The goal of interest rate risk management at Farmer Mac is to create and maintain a portfolio that generates stable earnings and value across a variety of interest rate environments. Farmer Mac's primary strategy for managing interest rate risk is to fund asset purchases with liabilities that have similar duration and cash flow characteristics so that they will perform similarly as interest rates change. To match these characteristics, Farmer Mac issues discount notes and both callable and non-callable medium-term notes across a spectrum of maturities. Farmer Mac issues callable debt to offset the prepayment risk associated with some loans. By using a blend of liabilities that includes callable debt, the interest rate sensitivities of the liabilities tend to increase or decrease as interest rates change in a manner similar to changes in the interest rate sensitivities of the assets. Farmer Mac also uses financial derivatives to better match the durations of the Corporation's assets and liabilities, thereby reducing overall interest rate sensitivity.
Farmer Mac's
$785.6 million
of cash and cash equivalents mature within three months and are funded with discount notes having similar maturities. As of
December 31, 2012
,
$1.7 billion
of the
$2.5 billion
of investment securities (
68 percent
) were floating rate securities with rates that adjust within one year or fixed rate securities with original maturities between three months and one year. See Note 4 to the consolidated financial statements for more information on investment securities. These investment securities are funded using:
|
•
|
a series of discount note issuances in which each successive discount note is issued and matures on or about the corresponding interest rate reset date of the related investment;
|
|
•
|
floating rate medium-term notes having similar interest rate reset provisions as the related investment; or
|
102
|
•
|
fixed rate medium-term notes swapped to floating rates having similar interest rate reset provisions as the related investment.
|
Farmer Mac's purchase of eligible loan assets expose the Corporation to interest rate risk arising primarily from uncertainty as to when the borrowers will repay the outstanding principal balance on the related loans. Generally, the values of Farmer Mac's eligible loan assets, and the debt issued to fund these assets, increase when interest rates decline, and their values decrease as interest rates rise. Furthermore, changes in interest rates may affect loan prepayment rates which may, in turn, affect durations and values of the loans. Declining interest rates generally increase prepayment rates, which shortens the duration of these assets, while rising interest rates tend to slow loan prepayments, thereby extending the duration of the loans.
Farmer Mac is also subject to interest rate risk on loans that Farmer Mac has committed to acquire (other than delinquent loans through LTSPCs) but has not yet purchased. When Farmer Mac commits to purchase those loans, it is exposed to interest rate risk between the time it commits to purchase the loans and the time it either:
|
•
|
sells Farmer Mac Guaranteed Securities backed by the loans; or
|
|
•
|
issues debt to retain the loans in its portfolio.
|
Farmer Mac manages the interest rate risk related to such loans, and any related Farmer Mac Guaranteed Securities or debt issuance, through the use of forward sale contracts on the debt of other GSEs and futures contracts involving U.S. Treasury securities. Farmer Mac uses forward sale contracts on GSE securities to reduce its interest rate exposure to changes in both Treasury rates and spreads on Farmer Mac debt and certain Farmer Mac Guaranteed Securities. Issuing debt to fund the loans as investments does not fully eliminate interest rate risk due to the possible timing differences in the cash flows of the assets and related liabilities, as discussed above.
Recognizing that interest rate sensitivity may change with the passage of time and as interest rates change, Farmer Mac assesses this exposure on a regular basis and, if necessary, readjusts its portfolio of assets and liabilities by:
|
•
|
purchasing mortgage assets in the ordinary course of business;
|
|
•
|
refunding existing liabilities; or
|
|
•
|
using financial derivatives to alter the characteristics of existing assets or liabilities.
|
Farmer Mac uses a variety of metrics to quantify and manage its interest rate risk. These metrics include sensitivity to interest rate movements of market value of equity ("MVE") and net interest income ("NII") as well as duration gap analysis. MVE represents management's estimate of the present value of all future cash flows from on- and off-balance sheet assets, liabilities and financial derivatives, discounted at current interest rates and appropriate spreads. However, MVE is not indicative of the market value of Farmer Mac as a going concern because these market values are theoretical and do not reflect future business activities. MVE sensitivity analysis is used to measure the degree to which the market values of the Corporation's assets and liabilities change for a given change in interest rates. Because this analysis evaluates the impact of interest rate movements on the value of all future cash flows, this measure provides an evaluation of Farmer Mac's long-term interest rate risk.
103
Farmer Mac's NII is the difference between the yield on its interest-earning assets and its funding costs. The Corporation's NII may be affected by changes in market interest rates resulting from timing differences between maturities and repricing characteristics of assets and liabilities. The direction and magnitude of any such effect depends on the direction and magnitude of the change in interest rates as well as the composition of Farmer Mac's book of business. The NII forecast represents an estimate of the net interest income that the Corporation's current book of business is expected to produce over a twelve month horizon. As a result, NII sensitivity statistics provide a shorter-term view of Farmer Mac's interest rate sensitivity.
Duration is a measure of a financial instrument's sensitivity to small changes in interest rates. Duration gap is the difference between the estimated durations of Farmer Mac's assets and liabilities. Because duration is a measure of market value sensitivity, duration gap summarizes the extent to which estimated market value sensitivities for assets and liabilities are matched. Duration gap provides a relatively concise measure of the interest rate risk inherent in the Corporation's outstanding book of business.
A positive duration gap denotes that the duration of Farmer Mac's assets is greater than the duration of its liabilities. A positive duration gap indicates that the market value of the Corporation's assets is more sensitive to small interest rate movements than is the market value of its liabilities. Conversely, a negative duration gap indicates that Farmer Mac's assets are less sensitive to small interest rate movements than are the liabilities.
Each of the metrics is produced using asset/liability models and is derived on the basis of management's best estimates of such factors as projected interest rates, interest rate volatility, and prepayment speeds. Accordingly, these data should be understood as estimates rather than precise measurements. In addition, actual results may differ to the extent there are material changes to Farmer Mac's book of business or changes in strategies undertaken to mitigate unfavorable sensitivities to interest rate changes.
The following schedule summarizes the results of Farmer Mac's MVE and NII sensitivity analysis as of
December 31, 2012
and
December 31, 2011
to an immediate and instantaneous uniform or "parallel" shift in the yield curve:
|
|
Percentage Change in MVE from Base Case
|
|||||
|
Interest Rate Scenario
|
December 31, 2012
|
December 31, 2011
|
||||
|
+100 basis points
|
4.8
|
%
|
2.9
|
%
|
||
|
-25 basis points
|
(2.2
|
)%
|
(1.7
|
)%
|
||
|
|
Percentage Change in NII from Base Case
|
|||||
|
Interest Rate Scenario
|
December 31, 2012
|
December 31, 2011
|
||||
|
+100 basis points
|
(0.4
|
)%
|
(6.4
|
)%
|
||
|
-25 basis points
|
(6.2
|
)%
|
(7.3
|
)%
|
||
Farmer Mac's policies and procedures prescribe the measurement of MVE and NII sensitivity to more severe decreasing interest rate scenarios that are consistent in magnitude with the increasing interest rate scenarios. However, given the persistent low interest rate environment, such rate scenarios produce negative interest rates, and, as a result, do not produce results that are meaningful. Consequently, Farmer Mac measures and reports MVE and NII sensitivity to a down 25 basis point interest rate shock.
104
As of
December 31, 2012
, Farmer Mac's effective duration gap was
minus 2.4 months
, compared to
minus 1.5 months
as of
December 31, 2011
. The Corporation's MVE sensitivity and duration gap increased somewhat during 2012. This increase resulted from the significant decline in interest rates that occurred during the year which shortened the duration of Farmer Mac's assets relative to that of its liabilities. The early retirement of callable debt, however, has offset much of this impact. Overall interest rate sensitivity remains relatively low and at manageable levels.
The economic effects of financial derivatives are included in the Corporation's MVE, NII, and duration gap analyses. Farmer Mac enters into the following financial derivative transactions principally to protect against risk from the effects of market price or interest rate movements on the value of assets, future cash flows, credit exposure, and debt issuance, not for trading or speculative purposes:
|
•
|
"pay-fixed" interest rate swaps, in which Farmer Mac pays fixed rates of interest to, and receives floating rates of interest from, counterparties;
|
|
•
|
"receive-fixed" interest rate swaps, in which Farmer Mac receives fixed rates of interest from, and pays floating rates of interest to, counterparties; and
|
|
•
|
"basis swaps," in which Farmer Mac pays variable rates of interest based on one index to, and receives variable rates of interest based on another index from, counterparties.
|
As of
December 31, 2012
, Farmer Mac had
$6.7 billion
combined notional amount of interest rate swaps, with terms ranging from less than one year to twenty-five years, of which
$1.8 billion
were pay-fixed interest rate swaps,
$4.4 billion
were receive-fixed interest rate swaps, and
$0.6 billion
were basis swaps.
Farmer Mac enters into interest rate swap contracts to adjust the characteristics of its short-term debt to match more closely the cash flow and duration characteristics of its longer-term loans and other assets, and also to adjust the characteristics of its long-term debt to match more closely the cash flow and duration characteristics of its short-term assets, thereby reducing interest rate risk and often times deriving an overall lower effective cost of borrowing than would otherwise be available to Farmer Mac in the conventional debt market. Specifically, interest rate swaps convert the variable cash flows related to the forecasted issuance of short-term debt into effectively fixed rate medium-term notes that match the anticipated duration and interest rate characteristics of the corresponding assets. Farmer Mac evaluates the overall cost of using the swap market as a funding alternative and uses interest rate swaps to manage specific interest rate risks for specific transactions. Certain financial derivatives are designated as fair value hedges of fixed rate assets classified as available-for-sale to protect against fair value changes in the assets related to a benchmark interest rate (i.e., LIBOR).
Farmer Mac has used callable interest rate swaps (in conjunction with the issuance of short-term debt) as an alternative to callable medium-term notes with equivalently structured maturities and call options. The call options on the swaps are designed to match the prepayment options on those mortgage assets without prepayment protection. The blended durations of the swaps are also designed to match the duration of the related mortgages over their estimated lives. If the mortgages prepay, the swaps can be called and the short-term debt repaid; if the mortgages do not prepay, the swaps remain outstanding and the short-term debt is rolled over, effectively providing fixed rate callable funding over the lives of the related mortgages. Thus, the economics of the assets are closely matched to the economics of the interest rate swap and funding combination.
As discussed in Note 6 to the consolidated financial statements, all financial derivatives are recorded on the balance sheet at fair value as a freestanding asset or liability. Changes in the fair values of financial
105
derivatives are reported in "
Losses on financial derivatives and hedging activities
" in the
consolidated statements of operations
. For financial derivatives designated in fair value hedging relationships, changes in the fair values of the hedged items related to the risk being hedged are also reported in "
Losses on financial derivatives and hedging activities
" in the
consolidated statements of operations
. Farmer Mac currently has no financial derivatives designated in cash flow hedging relationships. All of Farmer Mac's financial derivative transactions are conducted under standard collateralized agreements that limit Farmer Mac's potential credit exposure to any counterparty. As of December 31, 2012, Farmer Mac had uncollateralized net exposures of
$0.8 million
to
three
counterparties.
Liquidity and Capital Resources
Farmer Mac regularly accesses the capital markets for liquidity, and Farmer Mac maintained access to the capital markets at favorable rates throughout 2012. Assuming continued access to the capital markets, Farmer Mac believes it has sufficient liquidity and capital resources to support its operations for the next 12 months and for the foreseeable future. Farmer Mac also has a liquidity contingency plan to manage unanticipated disruptions in its access to the capital markets. That plan involves borrowing through repurchase agreement arrangements and the sale of liquid assets. In accordance with the calculation prescribed by FCA regulations, Farmer Mac is required to maintain a minimum of 60 days of liquidity and targets 90 days of liquidity. In accordance with the methodology prescribed by those regulations, Farmer Mac maintained an average of
147
days of liquidity during
2012
and had
164
days of liquidity as of
December 31, 2012
.
Debt Issuance
. Farmer Mac funds its purchases of eligible loan assets and liquidity investment assets primarily by issuing debt obligations of various maturities in the public capital markets. Debt obligations issued by Farmer Mac include discount notes and fixed and floating rate medium-term notes, including callable notes. Farmer Mac also issues discount notes and medium-term notes to obtain funds to finance investment activities, transaction costs, guarantee payments, and LTSPC purchase obligations.
Farmer Mac's board of directors has authorized the issuance of up to $15.0 billion of discount notes and medium-term notes (of which
$11.6 billion
was outstanding as of
December 31, 2012
), subject to periodic review of the adequacy of that level relative to Farmer Mac's borrowing requirements. The board of directors increased that authorization from $12.0 billion to $15.0 billion in December 2012. Farmer Mac invests the proceeds of its debt issuances in loans, Farmer Mac Guaranteed Securities, and liquidity investment assets in accordance with policies established by its board of directors and subject to regulations established by FCA.
Liquidity
. The funding and liquidity needs of Farmer Mac's lines of business are driven by the purchase and retention of eligible loans, USDA Guaranteed Securities, and Farmer Mac Guaranteed Securities; the maturities of Farmer Mac's discount notes and medium-term notes; and payment of principal and interest on Farmer Mac Guaranteed Securities. Farmer Mac's primary sources of funds to meet these needs are the fees for its guarantees and commitments, net effective spread, proceeds of debt issuances, loan repayments, and maturities of AgVantage securities.
Farmer Mac's borrowing costs remained at favorable levels throughout 2012. Farmer Mac may use a combination of pay-fixed interest rate swaps and receive-fixed interest rate swaps to mitigate its exposure to interest rate risk and monitors the effects of actual and potential fair value changes on its regulatory capital surplus. From time to time, Farmer Mac uses pay-fixed interest rate swaps, combined with a planned series of discount note issuances, as an alternative source of effectively fixed rate funding. While
106
the swap market may provide favorable effectively fixed rates, interest rate swap transactions expose Farmer Mac to the risk of future variability of its own issuance spreads versus corresponding LIBOR rates. If the spreads on the Farmer Mac discount notes were to deteriorate relative to LIBOR, Farmer Mac would be exposed to a commensurate reduction on its net interest yield on the notional amount of its pay-fixed interest rate swaps and its LIBOR-based floating rate assets. Conversely, if the rates on the Farmer Mac discount notes were to improve relative to LIBOR, Farmer Mac would benefit from a commensurate increase on its net interest yield on the notional amount of its pay-fixed interest rate swaps and its LIBOR-based floating rate assets. Further, the use of interest rate swaps that are not designated in hedge relationships for accounting purposes subject the Corporation's regulatory capital surplus to the potential adverse effects of a reduction in the fair values of those interest rate swaps.
Farmer Mac maintains cash, cash equivalents (including U.S. Treasury securities and other short-term money market instruments), and other investment securities that can be drawn upon for liquidity needs. The following table presents these assets as of
December 31, 2012
and
2011
:
|
|
December 31,
2012 |
December 31,
2011 |
|||||
|
|
(in thousands)
|
||||||
|
Cash and cash equivalents
|
$
|
785,564
|
|
$
|
817,046
|
|
|
|
Investment securities:
|
|
|
|
|
|||
|
Guaranteed by U.S. Government and its agencies
|
1,377,870
|
|
1,125,823
|
|
|||
|
Guaranteed by GSEs
|
755,991
|
|
700,442
|
|
|||
|
Preferred stock issued by GSEs
|
87,086
|
|
84,878
|
|
|||
|
Corporate debt securities
|
129,179
|
|
122,532
|
|
|||
|
Asset-backed securities principally backed by Government-guaranteed student loans
|
149,503
|
|
150,815
|
|
|||
|
Total
|
$
|
3,285,193
|
|
$
|
3,001,536
|
|
|
Farmer Mac's asset-backed investment securities include callable, highly rated auction-rate certificates ("ARCs"), the interest rates on which are reset through an auction process, most commonly at intervals of 28 days, or at formula-based floating rates as set forth in the related transaction documents in the event of a failed auction. These formula-based floating rates, which may at times reset to zero, are intended to preserve the underlying principal balance of the securities and avoid overall cash shortfalls. Accordingly, payments of accrued interest may be delayed and are ultimately subject to cash availability. Beginning in mid-February 2008, there were widespread failures of the auction mechanism designed to provide regular liquidity to these types of securities. Consequently, Farmer Mac has not sold any of its ARCs into the auctions since that time. All ARCs held by Farmer Mac are collateralized entirely by pools of Federal Family Education Loan Program ("FFELP") guaranteed student loans that are backed by the full faith and credit of the United States. Farmer Mac continues to believe that the credit quality of these securities is high, based on the underlying collateralization and the securities' ratings. To date, Farmer Mac has received all interest due on ARCs it holds and expects to continue to do so. Farmer Mac does not believe that the auction failures will affect the Corporation's liquidity or its ability to fund its operations or make dividend payments. All ARCs held by Farmer Mac are callable by the issuers at par at any time.
Farmer Mac held
$63.2 million
of ARCs as of
December 31, 2012
, compared to
$60.2 million
as of
December 31, 2011
. As of
December 31, 2012
, Farmer Mac's carrying value of its ARCs was
85.2 percent
of par. The discounted carrying value reflects uncertainty regarding the ability to obtain par in the absence of any active market trading. See Note 13 for more information on the carrying value of ARCs.
107
Excluding $1.2 billion of holdings in U.S. Treasury securities, the following table presents Farmer Mac's largest holdings as of
December 31, 2012
. These holdings are presented as either "Cash and cash equivalents" or "Investment securities" on the consolidated balance sheets.
|
Investment
|
Issuer
|
Credit Rating
|
Outstanding Amount
|
Fair Value
|
||||||||
|
(in thousands)
|
||||||||||||
|
GSE Guaranteed Mortgage-backed Securities
|
Federal National Mortgage Association
|
AA+
|
$
|
310,167
|
|
$
|
310,813
|
|
||||
|
Government Guaranteed Securities
|
National Credit Union Administration
|
AA+
|
224,123
|
|
225,048
|
|
||||||
|
Senior Agency Debt
|
Federal Home Loan Bank
|
AA+
|
213,700
|
|
213,783
|
|
||||||
|
Government Guaranteed Securities
|
Small Business Administration
|
(1)
|
199,272
|
|
211,982
|
|
||||||
|
Senior Agency Debt
|
Federal National Mortgage Association
|
AA+
|
95,000
|
|
95,000
|
|
||||||
|
GSE Preferred Stock
|
CoBank, ACB (2)
|
A-
|
78,500
|
|
87,086
|
|
||||||
|
GSE Subordinated Debt
|
CoBank, ACB (2)
|
A-
|
70,000
|
|
57,431
|
|
||||||
|
(1)
|
No rating available, backed by the full faith and credit of the United States.
|
|
(2)
|
CoBank, ACB is an institution of the Farm Credit System, a government-sponsored enterprise.
|
Capital Requirements
. Farmer Mac's charter establishes three capital standards for the Corporation – minimum, critical, and risk-based. The minimum capital requirement is expressed as a percentage of on-balance sheet assets and off-balance sheet obligations. The critical capital requirement is equal to one-half of the minimum capital amount. The charter does not specify the required level of risk-based capital but directs FCA to establish a risk-based capital stress test for Farmer Mac, using specified stress-test parameters. For a discussion of the risk-based capital stress test, see "Business—Government Regulation of Farmer Mac—Regulation—Capital Standards—General" and "—Regulatory Matters." Certain enforcement powers are given to FCA depending upon Farmer Mac's compliance with the capital standards. See "Business—Government Regulation of Farmer Mac—Regulation—Capital Standards—Enforcement Levels." See also "—Regulatory Matters" for a discussion of the FCA's proposed rule on Farmer Mac's capital planning.
As of
December 31, 2012
and
2011
, Farmer Mac was classified as within "level I" (the highest compliance level). The following table sets forth Farmer Mac's minimum capital requirements and surpluses as of
December 31, 2012
and
2011
:
|
|
As of December 31,
|
||||||||||||||||||
|
|
2012
|
2011
|
|||||||||||||||||
|
|
Amount
|
Ratio
|
Capital
Required |
Amount
|
Ratio
|
Capital
Required |
|||||||||||||
|
|
(dollars in thousands)
|
||||||||||||||||||
|
On-balance sheet assets (1)
|
$
|
12,478,534
|
|
2.75%
|
$
|
343,160
|
|
$
|
11,730,989
|
|
2.75%
|
$
|
322,602
|
|
|||||
|
Outstanding balance of off-balance sheet program assets
|
4,079,765
|
|
0.75%
|
30,598
|
|
3,426,281
|
|
0.75%
|
25,697
|
|
|||||||||
|
Financial derivatives (1)
|
37,234
|
|
0.75%
|
279
|
|
46,632
|
|
0.75%
|
350
|
|
|||||||||
|
Minimum capital requirement
|
|
|
|
374,037
|
|
|
|
|
348,649
|
|
|||||||||
|
Core capital
|
|
|
|
518,993
|
|
|
|
|
475,163
|
|
|||||||||
|
Capital surplus
|
|
|
|
$
|
144,956
|
|
|
|
|
$
|
126,514
|
|
|||||||
|
(1)
|
As defined for determining statutory minimum capital.
|
108
Based on the risk-based capital stress test, Farmer Mac's risk-based capital requirement as of
December 31, 2012
was
$58.1 million
and Farmer Mac's regulatory capital of
$535.9 million
exceeded that amount by approximately
$477.8 million
. Farmer Mac's risk-based capital requirement as of
December 31, 2011
was
$52.9 million
and Farmer Mac's regulatory capital of
$492.7 million
exceeded that amount by approximately
$439.8 million
.
Contractual Obligations
. The following table presents the amount and timing of Farmer Mac's known fixed and determinable contractual obligations by payment date as of
December 31, 2012
. The payment amounts represent those amounts contractually due to the recipient (including return of discount and interest on debt) and do not include unamortized premiums or discounts or other similar carrying value adjustments.
|
One Year
or Less |
One to
Three Years |
Three to
Five Years |
Over Five
Years |
Total
|
|||||||||||||||
|
|
(in thousands)
|
||||||||||||||||||
|
Discount notes (1)
|
$
|
4,969,724
|
|
$
|
—
|
|
$
|
—
|
|
$
|
—
|
|
$
|
4,969,724
|
|
||||
|
Medium-term notes (1)
|
1,602,000
|
|
2,811,000
|
|
1,485,000
|
|
749,000
|
|
6,647,000
|
|
|||||||||
|
Interest payments on fixed rate medium-term notes (2)
|
107,911
|
|
146,306
|
|
70,963
|
|
134,063
|
|
459,243
|
|
|||||||||
|
Interest payments on floating rate medium-term notes (3)
|
1,712
|
|
1,238
|
|
—
|
|
—
|
|
2,950
|
|
|||||||||
|
Operating lease obligations (4)
|
1,246
|
|
2,545
|
|
2,611
|
|
9,694
|
|
16,096
|
|
|||||||||
|
Purchase obligations (5)
|
630
|
|
100
|
|
—
|
|
—
|
|
730
|
|
|||||||||
|
(1)
|
Future events, including additional issuance of discount notes and medium-term notes and refinancing of those notes, could cause actual payments to differ significantly from these amounts. For more information regarding discount notes and medium-term notes, see Note 7 to the consolidated financial statements.
|
|
(2)
|
Interest payments on callable medium-term notes are calculated based on contractual maturity. Future calls of these notes could cause actual interest payments to differ significantly from the amounts presented.
|
|
(3)
|
Calculated using the effective interest rates as of
December 31, 2012
. As a result, these amounts do not reflect the effects of changes in the contractual interest rates effective on future interest rate reset dates.
|
|
(4)
|
Includes amounts due under non-cancelable operating leases for office space and office equipment. See Note 12 to the consolidated financial statements for more information regarding Farmer Mac's minimum lease payments for office space.
|
|
(5)
|
Includes minimum amounts due under non-cancelable agreements to purchase goods or services that are enforceable and legally binding and specify all significant terms. These agreements include agreements for the provision of consulting services, information technology support, equipment maintenance, and financial analysis software and services. The amounts actually paid under these agreements will likely be higher due to the variable components of some of these agreements under which the ultimate obligation owed is determined by reference to actual usage or hours worked. The table does not include amounts due under agreements that are cancelable without penalty or further payment as of
December 31, 2012
and therefore do not represent enforceable and legally binding obligations. The table also does not include amounts due under the terms of employment agreements with members of senior management; nor does it include payments that are based on a varying outstanding loan volume (such as servicing fees), as those payments are not known, fixed, and determinable contractual obligations.
|
Farmer Mac enters into financial derivative contracts under which it either receives cash from counterparties, or is required to pay cash to them, depending on changes in interest rates. Financial derivatives are carried on the consolidated balance sheets at fair value, representing the net present value of expected future cash payments or receipts based on market interest rates as of the balance sheet date adjusted for the consideration of credit risk of Farmer Mac and its counterparties. The fair values of the contracts change daily as market interest rates change. Because the financial derivative liabilities recorded on the consolidated balance sheet as of
December 31, 2012
do not represent the amounts that may ultimately be paid under the financial derivative contracts, those liabilities are not included in the table of contractual obligations presented above. Further information regarding financial derivatives is included in Note 2(h) and Note 6 to the consolidated financial statements.
109
Contingent Liabilities
. In conducting its loan purchase activities, Farmer Mac enters into mandatory delivery commitments to purchase agricultural real estate mortgage loans and USDA Guaranteed Securities. In conducting its LTSPC activities, Farmer Mac enters into arrangements whereby it commits to buy eligible loans under certain conditions at an undetermined future date. The following table presents these significant commitments:
|
|
As of December 31,
|
||||||
|
|
2012
|
2011
|
|||||
|
|
(in thousands)
|
||||||
|
LTSPCs
|
$
|
2,156,068
|
|
$
|
1,776,051
|
|
|
|
Mandatory commitments to purchase loans and USDA Guaranteed Securities
|
76,679
|
|
66,125
|
|
|||
Further information regarding Farmer Mac's commitments to purchase loans is included in Note 12 to the consolidated financial statements.
Off-Balance Sheet Arrangements
. Farmer Mac offers two credit enhancement alternatives to direct loan purchases through the Farm & Ranch line of business that allow approved lenders the ability to retain the cash flow benefits of their loans and increase their liquidity and lending capacity: (1) LTSPCs and (2) Farmer Mac I Guaranteed Securities. Prior to the adoption of new accounting guidance on January 1, 2010 related to the consolidation of off-balance sheet assets, both types of transactions resulted in the creation of off-balance sheet obligations for Farmer Mac in the ordinary course of its business. Effective January 1, 2010, securitization trusts where Farmer Mac is the primary beneficiary, as described in Note 2(q) to the consolidated financial statements, are consolidated on-balance sheet and the Farmer Mac I Guaranteed Securities are presented as "Loans held for investment in consolidated trusts." LTSPCs and securitization trusts where Farmer Mac is not the primary beneficiary still result in the creation of off-balance sheet obligations for Farmer Mac. In performing its purchase and guarantee obligations under LTSPCs and Farmer Mac Guaranteed Securities, Farmer Mac would have the right to enforce the underlying loans, and in the event of a default under the terms of those loans, would have access to the underlying collateral.
As of
December 31, 2012
and
2011
, outstanding off-balance sheet LTSPCs and Farmer Mac Guaranteed Securities totaled
$4.1 billion
and
$3.4 billion
, respectively. The following table presents the balance of outstanding LTSPCs and off-balance sheet Farmer Mac Guaranteed Securities as of
December 31, 2012
and
2011
:
|
Outstanding Balance of LTSPCs and
Off-Balance Sheet Farmer Mac Guaranteed Securities |
|||||||
|
|
As of December 31,
|
||||||
|
|
2012
|
2011
|
|||||
|
|
(in thousands)
|
||||||
|
Farm & Ranch obligations:
|
|
|
|||||
|
Farmer Mac I Guaranteed Securities
|
$
|
1,881,370
|
|
$
|
1,591,871
|
|
|
|
LTSPCs
|
2,156,068
|
|
1,776,051
|
|
|||
|
Total Farmer Mac I obligations
|
4,037,438
|
|
3,367,922
|
|
|||
|
Farmer Mac II Guaranteed Securities
|
29,658
|
|
42,088
|
|
|||
|
Farmer Mac Guaranteed Securities - Rural Utilities
|
12,669
|
|
16,271
|
|
|||
|
Total off-balance sheet
|
$
|
4,079,765
|
|
$
|
3,426,281
|
|
|
110
See "—Risk Management—Credit Risk – Loans" and Notes 2(c), 2(e), 5 and 12 to the consolidated financial statements for more information on Farmer Mac Guaranteed Securities and Notes 2(o) and 12 to the consolidated financial statements for more information on LTSPCs.
Regulatory Matters
The Dodd-Frank Wall Street Reform and Consumer Protection Act (the "Dodd-Frank Act") contains a variety of provisions designed to regulate financial markets. Certain provisions of the Dodd-Frank Act, including those regarding reporting, margin requirements, and clearing of derivatives, corporate governance, and executive compensation, apply to Farmer Mac. Farmer Mac does not expect that any of the final rules that have been passed or that are anticipated to be passed under the Dodd-Frank Act, including those mandating clearing of interest rate derivatives transactions, will have a material effect on the Corporation's business activities and operations or financial condition. Farmer Mac will continue to monitor all applicable developments in the implementation of the Dodd-Frank Act and expects to be able to adapt successfully to any new applicable legislative and regulatory requirements.
On November 5, 2012, the FCA published in the Federal Register a final rule addressing investment management changes to the Liquidity and Investment Regulations, including requirements for due diligence and stress testing of liquidity investment assets and interest rate risk management. The final rule also streamlines the process for handling investments that fail to meet eligibility criteria after purchase and modifies the permissible purposes of Farmer Mac’s liquidity investments to include FCA-approved investments that would complement Farmer Mac’s program activities. The final rule was effective December 31, 2012. Farmer Mac does not expect its compliance with the final rule to have a material effect on its liquidity or operations.
The FCA has indicated that it intends to issue additional final rules addressing changes to the Liquidity and Investment Regulations relating to liquidity management and investment eligibility that had also been included in a proposed rule published in the Federal Register on November 18, 2011. The proposed rule also included suggested approaches for substituting the use of credit ratings in the Liquidity and Investment Regulations, as mandated by the Dodd-Frank Act. Based on the FCA's published regulatory projects plan, Farmer Mac expects the FCA to publish a final rule regarding these proposed changes before the end of second quarter 2013. Farmer Mac does not currently have enough information to fully assess potential impacts to its liquidity or operations but will continue to monitor these regulatory developments and expects to be able to adapt successfully to them.
On June 16, 2011, the FCA published in the Federal Register an advance notice of proposed rulemaking (the "ANPRM") that sought public comment on revising Farmer Mac's risk-based capital stress test to (1) eliminate reliance on credit ratings from NRSROs as a measure of the creditworthiness of Farmer Mac's assets, as mandated under the Dodd-Frank Act and (2) include a capital charge for counterparty risk related to derivatives transactions. In addition, the ANPRM solicited comment on ways to revise Farmer Mac's operational and strategic business planning requirements to place greater emphasis on diversity and inclusion in both Farmer Mac's personnel as well as the borrowers and lenders who benefit from Farmer Mac's secondary market activities. Farmer Mac submitted a comment letter on the ANPRM on August 15, 2011. The FCA has not yet published a proposed rule to address the items discussed in the ANPRM and has not indicated when further action regarding these items (including any proposed rule) will be forthcoming.
111
On January 25, 2013, the FCA published a proposed rule in the Federal Register to address capital planning for Farmer Mac. The proposed rule outlines proposed requirements for Farmer Mac's annual capital planning process, including assessing adequacy of capital, performing capital stress testing, and reporting any proposed capital distributions to the FCA. The comment period for the proposed rule closes March 26, 2013, and Farmer Mac expects to provide comments to the FCA on the proposed rule on or before that date.
Other Matters
The expected effects of recently issued accounting pronouncements on the consolidated financial statements are presented in Note 2(r) to the consolidated financial statements.
Change in Management
.
On February 6, 2013, Farmer Mac's Board of Directors appointed R. Dale Lynch as Senior Vice President – Chief Financial Officer and Treasurer of Farmer Mac, effective February 15, 2013. This change in Farmer Mac's Senior Vice President – Chief Financial Officer and Treasurer is reported in Item 5.02 of the Current Report on Form 8-K filed with the SEC on February 11, 2013. That section of the referenced report is hereby incorporated by reference in this report.
Farmer Mac is exposed to market risk from changes in interest rates. Farmer Mac manages this market risk by entering into various financial transactions, including financial derivatives, and by monitoring and measuring its exposure to changes in interest rates. See "Management's Discussion and Analysis of Financial Condition and Results of Operations—Risk Management—Interest Rate Risk" for more information about Farmer Mac's exposure to interest rate risk and its strategies to manage such risk. For information regarding Farmer Mac's use of financial derivatives and related accounting policies, see Note 2(h) and Note 6 to the consolidated financial statements.
112
Management's Report on Internal Control over Financial Reporting
The management of Farmer Mac is responsible for establishing and maintaining adequate internal control over financial reporting, as defined in Exchange Act Rule 13a-15(f). Internal control over financial reporting is a process designed under the supervision of Farmer Mac's Chief Executive Officer and Chief Financial Officer to provide reasonable assurance regarding the reliability of financial reporting and the preparation of the Corporation's financial statements for external purposes in accordance with accounting principles generally accepted in the United States of America.
Farmer Mac's internal control over financial reporting includes those policies and procedures that: (1) pertain to the maintenance of records that, in reasonable detail, accurately and fairly reflect the transactions and dispositions of the assets of the Corporation; (2) provide reasonable assurance that transactions are recorded as necessary to permit preparation of financial statements in accordance with generally accepted accounting principles, and that receipts and expenditures of the Corporation are being made only in accordance with authorizations of management and directors of the Corporation; and (3) provide reasonable assurance regarding prevention or timely detection of unauthorized acquisition, use or disposition of the Corporation's assets that could have a material effect on the consolidated financial statements.
Because of its inherent limitations, internal control over financial reporting may not prevent or detect misstatements. Also, projections of any evaluation of effectiveness to future periods are subject to the risk that controls may become inadequate because of changes in conditions, or that the degree of compliance with the policies or procedures may deteriorate.
Under the supervision and with the participation of the Corporation's Chief Executive Officer and Chief Financial Officer, Farmer Mac's management assessed the effectiveness of the Corporation's internal control over financial reporting as of
December 31, 2012
. In making this assessment, the Corporation's management used the criteria set forth by the Committee of Sponsoring Organizations of the Treadway Commission (COSO) in
Internal Control - Integrated Framework
. Based on its evaluation under the COSO criteria, management concluded that the Corporation's internal control over financial reporting as of
December 31, 2012
was effective.
Farmer Mac's independent registered public accounting firm, PricewaterhouseCoopers LLP, has audited the effectiveness of the Corporation's internal control over financial reporting as of
December 31, 2012
, as stated in their report appearing below.
113
Report of Independent Registered Public Accounting Firm
To the Board of Directors and Shareholders
of the Federal Agricultural Mortgage Corporation:
In our opinion, the accompanying consolidated balance sheets and the related consolidated statements of operations, of comprehensive income, of equity, and of cash flows present fairly, in all material respects, the financial position of the Federal Agricultural Mortgage Corporation and its subsidiaries ("Farmer Mac") at December 31, 2012 and 2011, and the results of their operations and their cash flows for each of the three years in the period ended December 31, 2012 in conformity with accounting principles generally accepted in the United States of America. Also in our opinion, Farmer Mac maintained, in all material respects, effective internal control over financial reporting as of December 31, 2012, based on criteria established in
Internal Control - Integrated Framework
issued by the Committee of Sponsoring Organizations of the Treadway Commission (COSO). Farmer Mac's management is responsible for these financial statements, for maintaining effective internal control over financial reporting and for its assessment of the effectiveness of internal control over financial reporting, included in the accompanying
Management's Report on Internal Control Over Financial Reporting
. Our responsibility is to express opinions on these financial statements and on Farmer Mac's internal control over financial reporting based on our integrated audits. We conducted our audits in accordance with the standards of the Public Company Accounting Oversight Board (United States). Those standards require that we plan and perform the audits to obtain reasonable assurance about whether the financial statements are free of material misstatement and whether effective internal control over financial reporting was maintained in all material respects. Our audits of the financial statements included examining, on a test basis, evidence supporting the amounts and disclosures in the financial statements, assessing the accounting principles used and significant estimates made by management, and evaluating the overall financial statement presentation. Our audit of internal control over financial reporting included obtaining an understanding of internal control over financial reporting, assessing the risk that a material weakness exists, and testing and evaluating the design and operating effectiveness of internal control based on the assessed risk. Our audits also included performing such other procedures as we considered necessary in the circumstances. We believe that our audits provide a reasonable basis for our opinions.
As discussed in Note 2 to the consolidated financial statements, Farmer Mac changed the manner in which it accounts for transfers of financial assets and consolidation of variable interest entities in 2010.
A company's internal control over financial reporting is a process designed to provide reasonable assurance regarding the reliability of financial reporting and the preparation of financial statements for external purposes in accordance with generally accepted accounting principles. A company's internal control over financial reporting includes those policies and procedures that (i) pertain to the maintenance of records that, in reasonable detail, accurately and fairly reflect the transactions and dispositions of the assets of the company; (ii) provide reasonable assurance that transactions are recorded as necessary to permit preparation of financial statements in accordance with generally accepted accounting principles, and that receipts and expenditures of the company are being made only in accordance with authorizations of management and directors of the company; and (iii) provide reasonable assurance regarding prevention or timely detection of unauthorized acquisition, use, or disposition of the company's assets that could have a material effect on the financial statements.
Because of its inherent limitations, internal control over financial reporting may not prevent or detect misstatements. Also, projections of any evaluation of effectiveness to future periods are subject to the risk
114
that controls may become inadequate because of changes in conditions, or that the degree of compliance with the policies or procedures may deteriorate.
/s/PricewaterhouseCoopers LLP
McLean, Virginia
March 18, 2013
115
FEDERAL AGRICULTURAL MORTGAGE CORPORATION AND SUBSIDIARIES
CONSOLIDATED BALANCE SHEETS
|
|
December 31,
2012 |
December 31,
2011 |
|||||
|
|
(in thousands)
|
||||||
|
Assets:
|
|
|
|||||
|
Cash and cash equivalents
|
$
|
785,564
|
|
$
|
817,046
|
|
|
|
Investment securities:
|
|
|
|
|
|||
|
Available-for-sale, at fair value
|
2,498,382
|
|
2,182,694
|
|
|||
|
Trading, at fair value
|
1,247
|
|
1,796
|
|
|||
|
Total investment securities
|
2,499,629
|
|
2,184,490
|
|
|||
|
Farmer Mac Guaranteed Securities:
|
|
|
|
|
|||
|
Available-for-sale, at fair value
|
4,766,258
|
|
4,289,272
|
|
|||
|
USDA Guaranteed Securities:
|
|
|
|
|
|||
|
Available-for-sale, at fair value
|
1,486,595
|
|
1,279,546
|
|
|||
|
Trading, at fair value
|
104,188
|
|
212,359
|
|
|||
|
Total USDA Guaranteed Securities
|
1,590,783
|
|
1,491,905
|
|
|||
|
Loans:
|
|
|
|
|
|||
|
Loans held for sale, at lower of cost or fair value
|
673,991
|
|
541,447
|
|
|||
|
Loans held for investment, at amortized cost
|
1,503,559
|
|
1,241,311
|
|
|||
|
Loans held for investment in consolidated trusts, at amortized cost
|
563,575
|
|
1,121,559
|
|
|||
|
Allowance for loan losses
|
(11,351
|
)
|
(10,161
|
)
|
|||
|
Total loans, net of allowance
|
2,729,774
|
|
2,894,156
|
|
|||
|
Real estate owned, at lower of cost or fair value
|
3,985
|
|
3,136
|
|
|||
|
Financial derivatives, at fair value
|
31,173
|
|
40,250
|
|
|||
|
Interest receivable (includes $9,676 and $15,578, respectively, related to consolidated trusts)
|
103,414
|
|
110,339
|
|
|||
|
Guarantee and commitment fees receivable
|
41,789
|
|
31,384
|
|
|||
|
Deferred tax asset, net
|
3,123
|
|
—
|
|
|||
|
Prepaid expenses and other assets
|
66,709
|
|
21,530
|
|
|||
|
Total Assets
|
$
|
12,622,201
|
|
$
|
11,883,508
|
|
|
|
|
|||||||
|
Liabilities and Equity:
|
|
|
|
|
|||
|
Liabilities:
|
|
|
|
|
|||
|
Notes payable:
|
|
|
|
|
|||
|
Due within one year
|
$
|
6,567,366
|
|
$
|
6,087,879
|
|
|
|
Due after one year
|
5,034,739
|
|
4,104,882
|
|
|||
|
Total notes payable
|
11,602,105
|
|
10,192,761
|
|
|||
|
Debt securities of consolidated trusts held by third parties
|
167,621
|
|
701,583
|
|
|||
|
Financial derivatives, at fair value
|
150,682
|
|
160,024
|
|
|||
|
Accrued interest payable (includes $2,534 and $7,659, respectively, related to consolidated trusts)
|
51,779
|
|
60,854
|
|
|||
|
Guarantee and commitment obligation
|
37,803
|
|
27,440
|
|
|||
|
Accounts payable and accrued expenses
|
13,710
|
|
178,708
|
|
|||
|
Deferred tax liability, net
|
—
|
|
250
|
|
|||
|
Reserve for losses
|
5,539
|
|
7,355
|
|
|||
|
Total Liabilities
|
12,029,239
|
|
11,328,975
|
|
|||
|
Commitments and Contingencies (Note 12)
|
|
|
|
|
|||
|
Equity:
|
|
|
|
|
|||
|
Preferred stock:
|
|
|
|
|
|||
|
Series C, par value $1,000 per share, 100,000 shares authorized, 57,578 shares issued and outstanding
|
57,578
|
|
57,578
|
|
|||
|
Common stock:
|
|
|
|
|
|||
|
Class A Voting, $1 par value, no maximum authorization, 1,030,780 shares outstanding
|
1,031
|
|
1,031
|
|
|||
|
Class B Voting, $1 par value, no maximum authorization, 500,301 shares outstanding
|
500
|
|
500
|
|
|||
|
Class C Non-Voting, $1 par value, no maximum authorization, 9,171,343 shares and 8,825,794 shares outstanding, respectively
|
9,171
|
|
8,826
|
|
|||
|
Additional paid-in capital
|
106,617
|
|
102,821
|
|
|||
|
Accumulated other comprehensive income, net of tax, related to available-for-sale securities
|
73,969
|
|
79,370
|
|
|||
|
Retained earnings
|
102,243
|
|
62,554
|
|
|||
|
Total Stockholders' Equity
|
351,109
|
|
312,680
|
|
|||
|
Non-controlling interest - preferred stock
|
241,853
|
|
241,853
|
|
|||
|
Total Equity
|
592,962
|
|
554,533
|
|
|||
|
Total Liabilities and Equity
|
$
|
12,622,201
|
|
$
|
11,883,508
|
|
|
See accompanying notes to consolidated financial statements.
116
FEDERAL AGRICULTURAL MORTGAGE CORPORATION AND SUBSIDIARIES
|
For the Year Ended December 31,
|
|||||||||||
|
|
2012
|
2011
|
2010
|
||||||||
|
|
(in thousands, except per share amounts)
|
||||||||||
|
Interest income:
|
|
|
|||||||||
|
Investments and cash equivalents
|
$
|
24,729
|
|
$
|
28,117
|
|
$
|
27,497
|
|
||
|
Farmer Mac Guaranteed Securities and USDA Guaranteed Securities
|
136,297
|
|
127,394
|
|
86,742
|
|
|||||
|
Loans
|
103,644
|
|
119,176
|
|
124,472
|
|
|||||
|
Total interest income
|
264,670
|
|
274,687
|
|
238,711
|
|
|||||
|
Total interest expense
|
142,690
|
|
153,382
|
|
142,668
|
|
|||||
|
Net interest income
|
121,980
|
|
121,305
|
|
96,043
|
|
|||||
|
Provision for loan losses
|
(3,691
|
)
|
(610
|
)
|
(1,893
|
)
|
|||||
|
Net interest income after provision for loan losses
|
118,289
|
|
120,695
|
|
94,150
|
|
|||||
|
Non-interest income/(loss):
|
|
|
|
|
|
|
|||||
|
Guarantee and commitment fees
|
24,963
|
|
24,821
|
|
24,091
|
|
|||||
|
Losses on financial derivatives and hedging activities
|
(19,829
|
)
|
(92,645
|
)
|
(17,159
|
)
|
|||||
|
Gains on trading assets
|
307
|
|
3,455
|
|
5,270
|
|
|||||
|
Gains on sale of available-for-sale investment securities
|
18
|
|
269
|
|
266
|
|
|||||
|
Gains on sale of real estate owned
|
878
|
|
974
|
|
10
|
|
|||||
|
Lower of cost or fair value adjustment on loans held for sale
|
(5,943
|
)
|
8,887
|
|
(8,748
|
)
|
|||||
|
Other income
|
3,341
|
|
6,850
|
|
1,244
|
|
|||||
|
Non-interest income/(loss)
|
3,735
|
|
(47,389
|
)
|
4,974
|
|
|||||
|
Non-interest expense:
|
|
|
|
|
|
|
|||||
|
Compensation and employee benefits
|
19,186
|
|
17,884
|
|
17,232
|
|
|||||
|
General and administrative
|
11,123
|
|
9,732
|
|
8,564
|
|
|||||
|
Regulatory fees
|
2,281
|
|
2,277
|
|
2,243
|
|
|||||
|
Real estate owned operating costs, net
|
134
|
|
823
|
|
2,171
|
|
|||||
|
(Release of)/provision for losses
|
(1,816
|
)
|
(2,957
|
)
|
2,417
|
|
|||||
|
Other expense
|
—
|
|
900
|
|
—
|
|
|||||
|
Non-interest expense
|
30,908
|
|
28,659
|
|
32,627
|
|
|||||
|
Income before income taxes
|
91,116
|
|
44,647
|
|
66,497
|
|
|||||
|
Income tax expense
|
22,156
|
|
5,797
|
|
13,797
|
|
|||||
|
Net income
|
68,960
|
|
38,850
|
|
52,700
|
|
|||||
|
Less: Net income attributable to non-controlling interest - preferred stock dividends
|
(22,187
|
)
|
(22,187
|
)
|
(20,707
|
)
|
|||||
|
Net income attributable to Farmer Mac
|
46,773
|
|
16,663
|
|
31,993
|
|
|||||
|
Preferred stock dividends
|
(2,879
|
)
|
(2,879
|
)
|
(4,129
|
)
|
|||||
|
Loss on retirement of preferred stock
|
—
|
|
—
|
|
(5,784
|
)
|
|||||
|
Net income attributable to common stockholders
|
$
|
43,894
|
|
$
|
13,784
|
|
$
|
22,080
|
|
||
|
Earnings per common share and dividends:
|
|
|
|
|
|||||||
|
Basic earnings per common share
|
$
|
4.19
|
|
$
|
1.33
|
|
$
|
2.16
|
|
||
|
Diluted earnings per common share
|
$
|
3.98
|
|
$
|
1.28
|
|
$
|
2.08
|
|
||
|
Common stock dividends per common share
|
$
|
0.40
|
|
$
|
0.20
|
|
$
|
0.20
|
|
||
See accompanying notes to consolidated financial statements.
117
FEDERAL AGRICULTURAL MORTGAGE CORPORATION AND SUBSIDIARIES
CONSOLIDATED STATEMENTS OF COMPREHENSIVE INCOME
|
For the Year Ended December 31,
|
||||||||||||
|
|
2012
|
2011
|
2010
|
|||||||||
|
|
(in thousands)
|
|||||||||||
|
Net income
|
$
|
68,960
|
|
$
|
38,850
|
|
$
|
52,700
|
|
|||
|
Other comprehensive (loss)/income, net of tax:
|
||||||||||||
|
Available-for-sale securities, net of tax:
|
||||||||||||
|
Unrealized holding gains on securities (1)
|
2,165
|
|
64,637
|
|
15,182
|
|
||||||
|
Less: Reclassification adjustment for gains included in net income (2)
|
(7,566
|
)
|
(3,542
|
)
|
(207
|
)
|
||||||
|
Net change from available-for-sale securities
|
(5,401
|
)
|
61,095
|
|
14,975
|
|
||||||
|
Financial derivatives, net of tax:
|
||||||||||||
|
Reclassification for amortization of financial derivatives transition adjustment (3)
|
—
|
|
—
|
|
46
|
|
||||||
|
Other comprehensive (loss)/income
|
(5,401
|
)
|
61,095
|
|
15,021
|
|
||||||
|
Comprehensive income
|
63,559
|
|
99,945
|
|
67,721
|
|
||||||
|
Less: Comprehensive income attributable to noncontrolling interest - preferred stock dividends
|
(22,187
|
)
|
(22,187
|
)
|
(20,707
|
)
|
||||||
|
Comprehensive income attributable to Farmer Mac
|
$
|
41,372
|
|
$
|
77,758
|
|
$
|
47,014
|
|
|||
|
(1)
|
Presented net of income tax
expense
of
$1.2 million
,
$34.8 million
, and
$8.2 million
for the
years
ended
December 31, 2012
,
2011
, and
2010
, respectively.
|
|
(2)
|
Presented net of income tax benefit of
$4.1 million
,
$1.9 million
, and
$0.1 million
for the
years
ended
December 31, 2012
,
2011
, and
2010
, respectively.
|
|
(3)
|
Presented net of income tax expense of
$24,000
for the year ended
December 31, 2010
.
|
See accompanying notes to consolidated financial statements.
118
FEDERAL AGRICULTURAL MORTGAGE CORPORATION AND SUBSIDIARIES
CONSOLIDATED STATEMENTS OF EQUITY
|
|
For the Year Ended December 31,
|
|||||||||||||||||||
|
|
2012
|
2011
|
2010
|
|||||||||||||||||
|
|
Shares
|
Amount
|
Shares
|
Amount
|
Shares
|
Amount
|
||||||||||||||
|
|
(in thousands)
|
|||||||||||||||||||
|
Preferred stock:
|
|
|
|
|
|
|
||||||||||||||
|
Balance, beginning of period
|
58
|
|
$
|
57,578
|
|
58
|
|
$
|
57,578
|
|
58
|
|
$
|
57,578
|
|
|||||
|
Issuance of Series C preferred stock
|
—
|
|
—
|
|
—
|
|
—
|
|
—
|
|
—
|
|
||||||||
|
Balance, end of period
|
58
|
|
$
|
57,578
|
|
58
|
|
$
|
57,578
|
|
58
|
|
$
|
57,578
|
|
|||||
|
Common stock:
|
|
|
|
|
|
|
|
|
|
|
|
|
||||||||
|
Balance, beginning of period
|
10,357
|
|
$
|
10,357
|
|
10,284
|
|
$
|
10,284
|
|
10,142
|
|
$
|
10,142
|
|
|||||
|
Issuance of Class C common stock
|
345
|
|
345
|
|
73
|
|
73
|
|
142
|
|
142
|
|
||||||||
|
Balance, end of period
|
10,702
|
|
$
|
10,702
|
|
10,357
|
|
$
|
10,357
|
|
10,284
|
|
$
|
10,284
|
|
|||||
|
Additional paid-in capital:
|
|
|
|
|
|
|
|
|
|
|
|
|
||||||||
|
Balance, beginning of period
|
|
|
$
|
102,821
|
|
|
|
$
|
100,050
|
|
|
|
$
|
97,090
|
|
|||||
|
Stock-based compensation expense
|
|
|
2,428
|
|
|
|
2,929
|
|
|
|
2,774
|
|
||||||||
|
Issuance of Class C common stock
|
|
|
14
|
|
|
|
22
|
|
|
|
40
|
|
||||||||
|
Tax effect of stock-based awards
|
|
|
1,354
|
|
|
|
(180
|
)
|
|
|
146
|
|
||||||||
|
Balance, end of period
|
|
|
$
|
106,617
|
|
|
|
$
|
102,821
|
|
|
|
$
|
100,050
|
|
|||||
|
Retained earnings:
|
|
|
|
|
|
|
|
|
|
|
|
|
||||||||
|
Balance, beginning of period
|
|
|
$
|
62,554
|
|
|
|
$
|
50,837
|
|
|
|
$
|
28,127
|
|
|||||
|
Net income attributable to Farmer Mac
|
|
|
46,773
|
|
|
|
16,663
|
|
|
|
31,993
|
|
||||||||
|
Cash dividends:
|
|
|
|
|
|
|
|
|
|
|
|
|
||||||||
|
Preferred stock, Series B ($8.33 per share)
|
—
|
|
—
|
|
(1,250
|
)
|
||||||||||||||
|
Preferred stock, Series C ($50.00 per share)
|
|
|
(2,879
|
)
|
|
|
(2,879
|
)
|
|
|
(2,879
|
)
|
||||||||
|
Common stock ($0.40 per share in 2012 and $0.20 per share in 2011 and 2010)
|
|
|
(4,205
|
)
|
|
|
(2,067
|
)
|
|
|
(2,049
|
)
|
||||||||
|
Loss on retirement of preferred stock
|
—
|
|
|
|
—
|
|
|
|
(5,784
|
)
|
||||||||||
|
Cumulative effect of adoption of new accounting standard, net of tax
|
—
|
|
|
|
—
|
|
|
|
2,679
|
|
||||||||||
|
Balance, end of period
|
|
|
$
|
102,243
|
|
|
|
$
|
62,554
|
|
$
|
50,837
|
|
|||||||
|
Accumulated other comprehensive income:
|
|
|
|
|
|
|
|
|
||||||||||||
|
Balance, beginning of period
|
|
|
$
|
79,370
|
|
|
|
$
|
18,275
|
|
$
|
3,254
|
|
|||||||
|
Other comprehensive (loss)/income, net of tax
|
|
|
(5,401
|
)
|
|
|
61,095
|
|
15,021
|
|
||||||||||
|
Balance, end of period
|
|
|
$
|
73,969
|
|
|
|
$
|
79,370
|
|
$
|
18,275
|
|
|||||||
|
Total Stockholders' Equity
|
|
|
$
|
351,109
|
|
|
|
$
|
312,680
|
|
$
|
237,024
|
|
|||||||
|
Non-controlling interest - preferred stock:
|
|
|
|
|
|
|
|
|
|
|
||||||||||
|
Balance, beginning of period
|
|
|
$
|
241,853
|
|
|
|
$
|
241,853
|
|
$
|
—
|
|
|||||||
|
Issuance of Preferred stock - Farmer Mac II LLC
|
|
|
—
|
|
|
|
—
|
|
241,853
|
|
||||||||||
|
Balance, end of period
|
|
|
$
|
241,853
|
|
|
|
$
|
241,853
|
|
$
|
241,853
|
|
|||||||
|
Total Equity
|
$
|
592,962
|
|
|
|
$
|
554,533
|
|
$
|
478,877
|
|
|||||||||
See accompanying notes to consolidated financial statements.
119
FEDERAL AGRICULTURAL MORTGAGE CORPORATION AND SUBSIDIARIES
|
For the Year Ended December 31,
|
|||||||||||
|
|
2012
|
2011
|
2010
|
||||||||
|
|
(in thousands)
|
||||||||||
|
Cash flows from operating activities:
|
|
|
|||||||||
|
Net income
|
$
|
68,960
|
|
$
|
38,850
|
|
$
|
52,700
|
|
||
|
Adjustments to reconcile net income to net cash provided by/(used in) operating activities:
|
|
|
|||||||||
|
Net amortization of deferred gains, premiums and discounts on loans, investments, Farmer Mac Guaranteed Securities and USDA Guaranteed Securities
|
19,643
|
|
14,326
|
|
11,845
|
|
|||||
|
Amortization of debt premiums, discounts and issuance costs
|
14,658
|
|
12,800
|
|
7,982
|
|
|||||
|
Net change in fair value of trading securities, hedged assets, financial derivatives and loans held for sale
|
(1,017
|
)
|
44,124
|
|
(16,653
|
)
|
|||||
|
Gains on the sale of available-for-sale investment securities
|
(18
|
)
|
(269
|
)
|
(266
|
)
|
|||||
|
Gains on the sale of real estate owned
|
(878
|
)
|
(974
|
)
|
(10
|
)
|
|||||
|
Total provision for/(release of) losses
|
1,875
|
|
(2,347
|
)
|
4,310
|
|
|||||
|
Deferred income taxes
|
(1,982
|
)
|
(18,939
|
)
|
(524
|
)
|
|||||
|
Stock-based compensation expense
|
2,428
|
|
2,929
|
|
2,774
|
|
|||||
|
Proceeds from repayment and sale of trading investment securities
|
810
|
|
83,858
|
|
747
|
|
|||||
|
Purchases of loans held for sale
|
(171,925
|
)
|
(214,116
|
)
|
(661,310
|
)
|
|||||
|
Proceeds from repayment of loans purchased as held for sale
|
151,473
|
|
95,991
|
|
43,820
|
|
|||||
|
Net change in:
|
|
|
|||||||||
|
Interest receivable
|
6,938
|
|
(19,982
|
)
|
(23,117
|
)
|
|||||
|
Guarantee and commitment fees receivable
|
(10,405
|
)
|
3,368
|
|
20,264
|
|
|||||
|
Other assets
|
(43,200
|
)
|
(9,623
|
)
|
19,299
|
|
|||||
|
Accrued interest payable
|
(9,075
|
)
|
3,723
|
|
17,569
|
|
|||||
|
Other liabilities
|
5,018
|
|
(6,899
|
)
|
(18,243
|
)
|
|||||
|
Net cash provided by/(used in) operating activities
|
33,303
|
|
26,820
|
|
(538,813
|
)
|
|||||
|
Cash flows from investing activities:
|
|
|
|
|
|||||||
|
Purchases of available-for-sale investment securities
|
(1,888,352
|
)
|
(1,694,794
|
)
|
(1,075,852
|
)
|
|||||
|
Purchases of Farmer Mac Guaranteed Securities and USDA Guaranteed Securities
|
(1,469,057
|
)
|
(2,209,604
|
)
|
(2,010,991
|
)
|
|||||
|
Purchases of loans held for investment
|
(564,251
|
)
|
(489,483
|
)
|
(34,387
|
)
|
|||||
|
Purchases of defaulted loans
|
(17,024
|
)
|
(21,663
|
)
|
(6,082
|
)
|
|||||
|
Proceeds from repayment of available-for-sale investment securities
|
1,410,427
|
|
891,108
|
|
350,197
|
|
|||||
|
Proceeds from repayment of Farmer Mac Guaranteed Securities and USDA Guaranteed Securities
|
862,992
|
|
749,399
|
|
711,462
|
|
|||||
|
Proceeds from repayment of loans purchased as held for investment
|
289,318
|
|
292,484
|
|
291,778
|
|
|||||
|
Proceeds from sale of available-for-sale investment securities
|
7,018
|
|
447,864
|
|
100,833
|
|
|||||
|
Proceeds from the sale of trading securities - fair value option
|
—
|
|
—
|
|
5,013
|
|
|||||
|
Proceeds from sale of Farmer Mac Guaranteed Securities
|
38,063
|
|
25,674
|
|
30,725
|
|
|||||
|
Proceeds from sale of real estate owned
|
2,056
|
|
4,201
|
|
1,055
|
|
|||||
|
Net cash used in investing activities
|
(1,328,810
|
)
|
(2,004,814
|
)
|
(1,636,249
|
)
|
|||||
|
Cash flows from financing activities:
|
|
|
|
|
|||||||
|
Proceeds from issuance of discount notes
|
67,404,261
|
|
68,770,286
|
|
66,804,224
|
|
|||||
|
Proceeds from issuance of medium-term notes
|
3,358,188
|
|
2,295,579
|
|
2,729,530
|
|
|||||
|
Payments to redeem discount notes
|
(67,577,763
|
)
|
(67,459,368
|
)
|
(65,300,682
|
)
|
|||||
|
Payments to redeem medium-term notes
|
(1,790,000
|
)
|
(1,366,275
|
)
|
(1,872,590
|
)
|
|||||
|
Excess tax benefits related to stock-based awards
|
2,113
|
|
243
|
|
763
|
|
|||||
|
Payments to third parties on debt securities of consolidated trusts
|
(106,438
|
)
|
(148,234
|
)
|
(176,260
|
)
|
|||||
|
Proceeds from common stock issuance
|
2,935
|
|
22
|
|
172
|
|
|||||
|
Issuance costs on retirement of preferred stock
|
—
|
|
—
|
|
(5,784
|
)
|
|||||
|
Proceeds from preferred stock issuance - Farmer Mac II LLC
|
—
|
|
—
|
|
241,853
|
|
|||||
|
Retirement of Series B Preferred stock
|
—
|
|
—
|
|
(144,216
|
)
|
|||||
|
Dividends paid - Non-controlling interest - preferred stock
|
(22,187
|
)
|
(22,187
|
)
|
(20,644
|
)
|
|||||
|
Dividends paid on common and preferred stock
|
(7,084
|
)
|
(4,946
|
)
|
(6,178
|
)
|
|||||
|
Net cash provided by financing activities
|
1,264,025
|
|
2,065,120
|
|
2,250,188
|
|
|||||
|
Net (decrease)/increase in cash and cash equivalents
|
(31,482
|
)
|
87,126
|
|
75,126
|
|
|||||
|
Cash and cash equivalents at beginning of period
|
817,046
|
|
729,920
|
|
654,794
|
|
|||||
|
Cash and cash equivalents at end of period
|
$
|
785,564
|
|
$
|
817,046
|
|
$
|
729,920
|
|
||
See accompanying notes to consolidated financial statements.
120
FEDERAL AGRICULTURAL MORTGAGE CORPORATION AND SUBSIDIARIES
NOTES TO CONSOLIDATED FINANCIAL STATEMENTS
YEARS ENDED DECEMBER 31, 2012, 2011, and 2010
|
1.
|
ORGANIZATION
|
The Federal Agricultural Mortgage Corporation ("Farmer Mac" or the "Corporation") is a stockholder-owned, federally chartered instrumentality of the United States established under Title VIII of the Farm Credit Act of 1971, as amended (12 U.S.C. §§ 2279aa et seq.), which is sometimes referred to as Farmer Mac's charter. Farmer Mac was originally created by the United States Congress to provide a secondary market for a variety of loans made to borrowers in rural America. This secondary market is designed to increase the availability of long-term credit at stable interest rates to America's rural communities and to provide those borrowers with the benefits of capital markets pricing and product innovation. Since Farmer Mac's inception, Congress has expanded Farmer Mac's charter to authorize the Corporation to create the USDA Guarantees line of business and to purchase, and guarantee securities backed by, loans made by cooperative lenders to finance electrification and telecommunications systems in rural areas.
Farmer Mac's main secondary activities are:
|
•
|
purchasing eligible loans directly from lenders;
|
|
•
|
providing advances against eligible loans by purchasing obligations secured by those loans;
|
|
•
|
securitizing assets and guaranteeing the payment of principal and interest on the resulting securities that represent interests in, or obligations secured by, pools of eligible loans; and
|
|
•
|
issuing long-term standby purchase commitments ("LTSPCs") for eligible loans.
|
Farmer Mac conducts these activities through three lines of business – Farm & Ranch (Farmer Mac I), USDA Guarantees (Farmer Mac II), and Rural Utilities. As of
December 31, 2012
, the total outstanding balance in all of Farmer Mac's lines of business was
$13.0 billion
.
Under the Farm & Ranch line of business, Farmer Mac purchases or commits to purchase mortgage loans secured by first liens on agricultural real estate. Farmer Mac also guarantees securities representing interests in, or obligations secured by, pools of eligible mortgage loans secured by first liens on agricultural real estate. The securities guaranteed by Farmer Mac under this line of business are referred to as "Farmer Mac I Guaranteed Securities." To be eligible, loans must meet Farmer Mac's credit underwriting, collateral valuation, documentation, and other specified standards. As of
December 31, 2012
, outstanding farm and ranch loans held by Farmer Mac and loans that either backed Farmer Mac I Guaranteed Securities or were subject to LTSPCs in the Farmer Mac I line of business totaled
$9.1 billion
.
Under the USDA Guarantees line of business, Farmer Mac II LLC, a subsidiary of Farmer Mac, purchases the portions of certain agricultural, rural development, business and industry, and community facilities loans guaranteed by the United States Department of Agriculture under the Consolidated Farm and Rural Development Act (7 U.S.C. §§ 1921 et seq.). USDA-guaranteed portions are referred to and presented on the consolidated balance sheets as "USDA Guaranteed Securities." Farmer Mac II LLC also purchases USDA Guaranteed Securities in exchange for issuing securities to third parties backed by those USDA Guaranteed Securities, which are then also guaranteed by Farmer Mac. These issued securities are referred to and presented on the consolidated balance sheets as Farmer Mac II Guaranteed Securities. As of
December 31, 2012
, outstanding Farmer Mac II Guaranteed Securities and USDA Guaranteed Securities totaled
$1.6 billion
. Since January 2010, nearly all purchases of USDA Guaranteed Securities
121
under the USDA Guarantees line of business have been made by Farmer Mac II LLC, which operates substantially all of the business related to the USDA Guarantees line of business. Farmer Mac operates only that part of the business that involves the issuance of Farmer Mac II Guaranteed Securities to investors other than Farmer Mac or Farmer Mac II LLC.
Farmer Mac initiated the Rural Utilities line of business in 2008 after Congress expanded Farmer Mac's authorized secondary market activities to include rural utilities loans. Farmer Mac's authorized activities under this line of business are similar to those conducted under the Farm & Ranch line of business – purchases of, and guarantees of securities ("Farmer Mac Guaranteed Securities – Rural Utilities") backed by, eligible rural utilities loans. To be eligible, loans must meet Farmer Mac's credit underwriting and other specified standards. Farmer Mac has retained in its portfolio all of the rural utilities loans and Farmer Mac Guaranteed Securities – Rural Utilities under this line of business since its inception, with the exception of AgVantage securities that were sold to third parties and had an outstanding balance of
$12.7 million
as of
December 31, 2012
. To date, Farmer Mac has not issued any LTSPCs with respect to rural utilities loans. As of
December 31, 2012
, the aggregate outstanding principal balance of rural utilities loans held and Farmer Mac Guaranteed Securities – Rural Utilities was
$2.3 billion
.
Farmer Mac I Guaranteed Securities, Farmer Mac II Guaranteed Securities, and Farmer Mac Guaranteed Securities – Rural Utilities are collectively referred to as "Farmer Mac Guaranteed Securities." The assets underlying Farmer Mac Guaranteed Securities include (1) loans, loan participation interests, or USDA Guaranteed Securities eligible under one of Farmer Mac's lines of business and (2) general obligations of lenders secured by pools of eligible loans. The Corporation guarantees the timely payment of principal and interest on the resulting Farmer Mac Guaranteed Securities. Farmer Mac may retain Farmer Mac Guaranteed Securities in its portfolio or sell them to third parties.
Farmer Mac's two principal sources of revenue are:
|
•
|
interest income earned on assets held on balance sheet, net of related funding costs and interest payments and receipts on financial derivatives (i.e., net effective spread); and
|
|
•
|
guarantee and commitment fees received in connection with outstanding Farmer Mac Guaranteed Securities and LTSPCs.
|
Farmer Mac funds its purchases of eligible loan assets and liquidity investment assets primarily by issuing debt obligations of various maturities in the public capital markets. As of
December 31, 2012
, Farmer Mac had
$5.0 billion
of discount notes and
$6.6 billion
of medium-term notes outstanding. The proceeds of debt issuance are invested in loan purchases, Farmer Mac Guaranteed Securities, and liquidity investment assets in accordance with policies established by Farmer Mac's board of directors that comply with regulations promulgated by the Farm Credit Administration ("FCA"), which establish limitations on dollar amount, issuer concentration, and credit quality. Those regulations can be found at 12 C.F.R. §§ 652.1-652.45.
122
|
2.
|
SUMMARY OF SIGNIFICANT ACCOUNTING POLICIES
|
The accounting and reporting policies of Farmer Mac conform with accounting principles generally accepted in the United States of America ("generally accepted accounting principles" or "GAAP"). The preparation of consolidated financial statements in conformity with generally accepted accounting principles requires management to make certain estimates and assumptions that affect the reported amounts of assets and liabilities and disclosures of contingent assets and liabilities (including, but not limited to, the allowance for loan losses, reserve for losses, other-than-temporary impairment of investment securities and fair value measurements) as of the date of the consolidated financial statements and the reported amounts of income and expenses during the reporting period. Actual results could differ from those estimates. The following are the significant accounting policies that Farmer Mac follows in preparing and presenting its consolidated financial statements:
(a) Principles of Consolidation
The consolidated financial statements include the accounts of Farmer Mac and its
two
subsidiaries: (1) Farmer Mac Mortgage Securities Corporation ("FMMSC"), whose principal activities are to facilitate the purchase and issuance of Farmer Mac Guaranteed Securities and (2) Farmer Mac II LLC, whose principal activity is the operation of substantially all of the business related to the Farmer Mac II or USDA Guarantees line of business – primarily the acquisition of USDA-guaranteed portions. The consolidated financial statements also include the accounts of variable interest entities ("VIEs") in which Farmer Mac determined itself to be the primary beneficiary. See Note
2(q)
for more information on consolidated VIEs.
A Farmer Mac guarantee of timely payment of principal and interest is an explicit element of the terms of all Farmer Mac Guaranteed Securities. When Farmer Mac retains such securities in its portfolio, that guarantee is not extinguished. For Farmer Mac Guaranteed Securities in the Corporation's portfolio, Farmer Mac has entered into guarantee arrangements with FMMSC. The guarantee fee rate established between Farmer Mac and FMMSC is an element in determining the fair value of these Farmer Mac Guaranteed Securities, and guarantee fees related to these securities are reflected in guarantee and commitment fees in the
consolidated statements of operations
. These guarantee fees totaled
$10.3 million
in
2012
,
$9.0 million
in
2011
, and
$6.5 million
in 2010. The corresponding expense of FMMSC has been eliminated against interest income in consolidation. All other inter-company balances and transactions have been eliminated in consolidation.
|
(b)
|
Cash and Cash Equivalents and Statements of Cash Flows
|
Farmer Mac considers highly liquid investment securities with maturities at the time of purchase of
three months
or less to be cash equivalents. The carrying value of cash and cash equivalents is a reasonable estimate of their approximate fair value. Changes in the balance of cash and cash equivalents are reported in the consolidated statements of cash flows.
123
The following table sets forth information regarding certain cash and non-cash transactions for the years ended
December 31, 2012
,
2011
, and
2010
:
|
|
For the Year Ended December 31,
|
||||||||||
|
|
2012
|
2011
|
2010
|
||||||||
|
|
(in thousands)
|
||||||||||
|
Cash paid during the period for:
|
|||||||||||
|
Interest
|
$
|
112,663
|
|
$
|
101,288
|
|
$
|
78,245
|
|
||
|
Income taxes
|
21,500
|
|
26,568
|
|
15,174
|
|
|||||
|
Non-cash activity:
|
|
|
|
|
|||||||
|
Real estate owned acquired through loan liquidation
|
2,280
|
|
4,605
|
|
5,001
|
|
|||||
|
Loans acquired and securitized as Farmer Mac Guaranteed Securities
|
32,736
|
|
22,406
|
|
8,594
|
|
|||||
|
Purchases of investment securities traded, not yet settled
|
—
|
|
162,674
|
|
—
|
|
|||||
|
Consolidation of Farmer Mac I Guaranteed Securities from off-balance sheet to loans held for investment in consolidated trusts and to debt securities of consolidated trusts held by third parties
|
32,736
|
|
22,406
|
|
1,408,965
|
|
|||||
|
Transfers of available-for-sale Farmer Mac I Guaranteed Securities to loans held for investment in consolidated trusts, upon the adoption of new consolidation guidance
|
—
|
|
—
|
|
5,385
|
|
|||||
|
Transfers of trading Farmer Mac Guaranteed Securities - Rural Utilities to loans held for investment in consolidated trusts, upon the adoption of new consolidation guidance
|
—
|
|
—
|
|
451,448
|
|
|||||
|
Deconsolidation of loans held for investment in consolidated trusts and debt securities of consolidated trusts held by third parties - transferred to off-balance sheet Farmer Mac I Guaranteed Securities
|
460,261
|
|
—
|
|
414,462
|
|
|||||
|
Transfers of loans held for sale to loans held for investment
|
—
|
|
878,798
|
|
—
|
|
|||||
During 2012, Farmer Mac deconsolidated
$460.3 million
of Farmer Mac I Guaranteed Securities owned by Farm Credit West ("FCW") from loans held for investment in consolidated trusts and debt securities of consolidated trusts held by third parties to off-balance sheet Farmer Mac I Guaranteed Securities because FCW was no longer a related party as of June 30, 2012.
Effective January 1, 2011, Farmer Mac transferred
$878.8 million
of loans in the Farmer Mac I line of business from held for sale to held for investment because Farmer Mac no longer has the intent to securitize or sell these loans in the foreseeable future. Farmer Mac transferred these loans at their cost, which was lower than the estimated fair value at the time of transfer. At the time of purchase, loans are classified as either held for sale or held for investment depending upon management's intent and ability to hold the loans for the foreseeable future. Cash receipts from the repayment of loans are classified within the statements of cash flows based on management's intent upon purchase of the loan, as prescribed by accounting guidance related to the statement of cash flows.
During 2010, Farmer Mac adopted new accounting guidance on consolidation of VIEs, which resulted in the consolidation of certain securitization trust assets and liabilities onto Farmer Mac's balance sheet. The items noted above reflect the impact upon adoption of the new consolidation guidance and Farmer Mac's on-going assessment of its interests in VIEs. See Note
2(q)
for further information related to the consolidation of VIEs.
|
(c)
|
Investment Securities, Farmer Mac Guaranteed Securities and USDA Guaranteed Securities
|
Securities for which Farmer Mac does not have the positive intent and ability to hold to maturity are classified as available-for-sale and are carried at estimated fair value. Unrealized gains and losses on available-for-sale securities are reported as a component of accumulated other comprehensive income in stockholders' equity. Securities classified as trading securities are reported at their fair value, with
124
unrealized gains and losses included in earnings. Gains and losses on the sale of available-for-sale and trading securities are determined using the specific identification cost method. Farmer Mac does not currently classify any securities as held-to-maturity.
Farmer Mac determines the fair value of investment securities using quoted market prices, when available, and evaluates the securities for other-than-temporary impairment. Farmer Mac determines the fair values of certain investment securities for which quoted market prices are not available, Farmer Mac Guaranteed Securities and USDA Guaranteed Securities based on the present value of the associated expected future cash flows. In estimating the present value of the expected future cash flows, management is required to make estimates and assumptions. The key estimates and assumptions include discount rates and collateral repayment rates. Premiums, discounts and other deferred costs are amortized to interest income over the estimated life of the security using the effective interest method. Interest income on investments, Farmer Mac Guaranteed Securities and USDA Guaranteed Securities is recorded on an accrual basis unless the collection of interest is considered doubtful.
Farmer Mac generally receives compensation when loans with yield maintenance provisions underlying Farmer Mac Guaranteed Securities prepay. These yield maintenance payments mitigate Farmer Mac's exposure to reinvestment risk and are calculated such that, when reinvested with the prepaid principal, they should generate substantially the same cash flows that would have been generated had the loans not prepaid. Yield maintenance payments are recognized as interest income in the consolidated statements of operations upon receipt.
|
(d)
|
Loans
|
Loans for which Farmer Mac has the positive intent and ability to hold for the foreseeable future are classified as held for investment and reported at their unpaid principal balance, net of unamortized purchase discounts or premiums. When Farmer Mac consolidates a trust, it recognizes the loans underlying the trust in the consolidated balance sheets as "Loans held for investment in consolidated trusts, at amortized cost." See Note
2(q)
for more information on accounting guidance related to consolidation. Loans that Farmer Mac does not intend to hold for the foreseeable future are classified as held for sale and reported at the lower of cost or fair value determined on a pooled basis. For loans held for investment and loans held for sale, the net unamortized purchase premium as of
December 31, 2012
was
$35.1 million
, compared to
$39.5 million
as of
December 31, 2011
. Farmer Mac does not amortize premiums and discounts related to loans held for sale.
Effective January 1, 2013, Farmer Mac transferred
$674.0 million
of loans from held for sale to held for investment because Farmer Mac either (1) no longer intends to sell these loans in the foreseeable future or (2) generally securitizes these loans using VIEs that are ultimately consolidated on Farmer Mac's balance sheet and reported as "Loans held for investment in consolidated trusts, at amortized cost." Farmer Mac transferred these loans at the lower of cost or fair value.
|
(e)
|
Securitization of Loans
|
Asset securitization involves the transfer of financial assets to another entity in exchange for cash and/or beneficial interests in the assets transferred. Farmer Mac or third parties transfer agricultural real estate mortgage loans or rural utilities loans into trusts that are used as vehicles for the securitization of the transferred loans. The trusts issue Farmer Mac Guaranteed Securities that are beneficial interests in the assets of the trusts, to either Farmer Mac or third party investors. Farmer Mac guarantees the timely payment of principal and interest on the securities issued by the trusts and receives guarantee fees as
125
compensation for its guarantee. Farmer Mac recognizes guarantee fees on an accrual basis over the terms of the Farmer Mac Guaranteed Securities, which generally coincide with the terms of the underlying loans. As such, no guarantee fees are unearned at the end of any reporting period. If Farmer Mac purchases a delinquent loan underlying a Farmer Mac Guaranteed Security, Farmer Mac stops accruing the guarantee fee upon loan purchase.
|
(f)
|
Non-accrual Loans
|
Non-accrual loans are loans for which it is probable that Farmer Mac will be unable to collect all amounts due according to the contractual terms of the loan agreement and include all loans
90 days
or more past due. When a loan becomes
90 days
past due, interest accrual on the loan is discontinued and interest previously accrued is reversed against interest income in the current period. The interest on such loans is accounted for on the cash basis until a loan qualifies for return to accrual status. Loans are returned to accrual status when all the principal and interest payments contractually due are collected and certain performance criteria are met.
|
(g)
|
Real Estate Owned
|
Real estate owned ("REO") consists of real estate acquired through loan liquidation and is recorded at fair value less estimated selling cost at acquisition. Fair value is determined by appraisal or other appropriate valuation method. Any excess of the recorded investment in the loan over the fair value less estimated selling cost is charged to the allowance for loan losses. Subsequent to the acquisition, management continues to perform periodic valuations for real estate owned. Declines in the net realizable value (fair value less estimated selling costs) are charged through income and presented as "Real estate owned operating costs, net" on the consolidated statements of operations.
Farmer Mac contracts with third parties to operate or preserve real estate owned and offered for sale when appropriate to maintain property value. Non-recoverable costs are expensed as incurred and those related to the production of saleable goods or crops are capitalized to the extent they are realizable. As revenues from the sale of goods or crops are received, they are applied first to any capitalized costs and any remaining revenues offset non-recoverable expenses incurred. Farmer Mac had
no
capitalized costs as of December 31,
2012
and
2011
.
|
(h)
|
Financial Derivatives
|
Farmer Mac enters into financial derivative transactions principally to protect against risk from the effects of market price or interest rate movements on the value of certain assets, future cash flows or debt
issuance, not for trading or speculative purposes. Farmer Mac enters into interest rate swap contracts
principally to adjust the characteristics of its short-term debt to match more closely the cash flow and
duration characteristics of its longer-term loans and other assets, and also to adjust the characteristics of its
long-term debt to match more closely the cash flow and duration characteristics of its short-term assets,
thereby reducing interest rate risk and often times deriving an overall lower effective cost of borrowing
than would otherwise be available to Farmer Mac in the conventional debt market. Farmer Mac is
required to recognize certain contracts and commitments as derivatives when the characteristics of those
contracts and commitments meet the definition of a derivative.
Accounting for financial derivatives differs significantly depending on whether a derivative is designated in a fair value or cash flow hedging relationship. Derivative instruments designated in hedging relationships that mitigate exposure to changes in the fair value of assets or liabilities are considered fair
126
value hedges. Derivative instruments designated in hedging relationships that mitigate exposure to the variability in expected future cash flows or other forecasted transactions are considered cash flow hedges. In order to qualify for hedge accounting treatment, documentation must indicate the intention to designate the derivative as a hedge of a specific asset or liability or a future cash flow. Effectiveness of the hedge must be monitored over the life of the hedging relationship.
Financial derivatives are recorded on the consolidated balance sheets at fair value as a freestanding asset or liability. Fair value hedges are accounted for by recording the fair value of the financial derivative and the change in fair value of the hedged item attributable to the risk being hedged on the consolidated balance sheets with the net difference reported in gains/(losses) on financial derivatives and hedging activities in the consolidated statements of operations. The accrual of the contractual amounts due on the financial derivative is included as an adjustment to the yield of the hedged item and is reported in net interest income. Cash flow hedges which are deemed effective under GAAP are accounted for by recording the fair value of the financial derivative as either a freestanding asset or a freestanding liability on the consolidated balance sheets, with the effective portion of the change in fair value of the financial derivative recorded in accumulated other comprehensive income within stockholders' equity, net of tax. Amounts are reclassified from accumulated other comprehensive income to interest income or expense in the consolidated statements of operations in the period the hedged transaction affects earnings. Any ineffective portion of the change in fair value of the financial derivative is reported in gains/(losses) on financial derivatives and hedging activities in the consolidated statements of operations. If it becomes probable that a hedged forecasted transaction will not occur, any amounts included in accumulated other comprehensive income related to the specific hedging relationship are reclassified from accumulated other comprehensive income to the consolidated statements of operations and reported in gains/(losses) on financial derivatives and hedging activities.
Through second quarter 2012, Farmer Mac did not designate its financial derivatives as fair value hedges or cash flow hedges; therefore, the changes in the fair values of financial derivatives were reported as gains/(losses) on financial derivatives and hedging activities in the
consolidated statements of operations
, without offsetting fair value adjustments on the hedged items. Effective July 1, 2012, Farmer Mac designated
$950.0 million
notional amount of interest rate swaps in fair value hedge relationships. These interest rate swaps are used to hedge against the risk of changes in fair values of certain fixed rate AgVantage securities due to changes in the designated benchmark interest rate (i.e., LIBOR). Beginning in third quarter 2012, Farmer Mac recorded in earnings offsetting fair value adjustments on the hedged items attributable to the risk being hedged. Any differences arising from fair value changes that are not offset will result in hedge ineffectiveness and affect GAAP earnings.
In accordance with applicable fair value measurement guidance, Farmer Mac made an accounting policy election to measure the credit risk of its derivative financial instruments that are subject to master netting agreements on a net basis by counterparty portfolio, consistent with how the Corporation previously has been measuring credit risk for these instruments. See Notes 6 and 13 for more information on financial derivatives.
|
(i)
|
Notes Payable
|
Notes payable are classified as due within one year or due after one year based on their contractual maturities. Debt issuance costs and premiums and discounts are deferred and amortized to interest expense using the effective interest method over the contractual life of the related debt.
127
|
(j)
|
Allowance for Losses
|
Farmer Mac maintains an allowance for losses to cover estimated probable losses incurred as of the balance sheet date on loans held ("allowance for loan losses") and loans underlying LTSPCs and Farmer Mac Guaranteed Securities ("reserve for losses") based on available information. Farmer Mac's methodology for determining the allowance for losses separately considers its portfolio segments – Farm & Ranch, USDA Guarantees, and Rural Utilities, and disaggregates its analysis, where relevant, into classes of financing receivables, which currently include loans and AgVantage securities. Further disaggregation by commodity type is performed, where appropriate, in analyzing the need for an allowance for losses.
The allowance for losses is increased through periodic provisions for loan losses that are charged against net interest income and provisions for losses that are charged to non-interest expense, and is reduced by charge-offs for actual losses, net of recoveries. Negative provisions, or releases of allowance for losses, generally are recorded in the event that the estimate of probable losses as of the end of a period is lower than the estimate at the beginning of the period. In certain circumstances, for example, when a defaulted loan is purchased out of a guaranteed security or pursuant to an LTSPC, the related reserve for losses is reclassified as allowance for loan losses and there is a corresponding release from the provision for losses and a charge to the provision for loan losses.
The total allowance for losses consists of a general allowance for losses and a specific allowance for impaired loans.
Charge-offs
Farmer Mac records a charge-off against the allowance for losses principally when a loss has been confirmed through the receipt of assets, generally the underlying collateral, in full satisfaction of the loan. The loss equals the excess of the recorded investment in the loan over the fair value of the collateral less estimated selling costs.
General Allowance for Losses
Farm & Ranch
Farmer Mac's methodology for determining its allowance for losses incorporates the Corporation's automated loan classification system. That system scores loans based on criteria such as historical repayment performance, indicators of current financial condition, loan seasoning, loan size and loan-to-value ratio. For purposes of the loss allowance methodology, the loans in Farmer Mac's portfolio of loans and loans underlying Farmer Mac I Guaranteed Securities and LTSPCs have been scored and classified for each calendar quarter since first quarter 2000. The allowance methodology captures the migration of loan scores across concurrent and overlapping
3
-year time horizons and calculates loss rates separately within each loan classification for (1) loans underlying LTSPCs and (2) loans held and loans underlying Farmer Mac I Guaranteed Securities. The calculated loss rates are applied to the current classification distribution of unimpaired loans in Farmer Mac's portfolio to estimate inherent losses, on the assumption that the historical credit losses and trends used to calculate loss rates will continue in the future.
128
Management evaluates this assumption by taking into consideration several factors, including:
|
•
|
economic conditions;
|
|
•
|
geographic and agricultural commodity/product concentrations in the portfolio;
|
|
•
|
the credit profile of the portfolio;
|
|
•
|
delinquency trends of the portfolio;
|
|
•
|
historical charge-off and recovery activities of the portfolio; and
|
|
•
|
other factors to capture current portfolio trends and characteristics that differ from historical experience.
|
Management believes that its use of this methodology produces a reasonable estimate of probable losses, as of the balance sheet date, for all loans held in the Farmer Mac I portfolio and loans underlying Farmer Mac I Guaranteed Securities and LTSPCs. There were no purchases or sales during 2012 that materially affected the credit profile of the Farmer Mac I portfolio.
Farmer Mac has not provided an allowance for losses for loans underlying Farmer Mac I AgVantage securities. Each AgVantage security is a general obligation of an issuing institution approved by Farmer Mac and is secured by eligible loans in an amount at least equal to the outstanding principal amount of the security, with some level of overcollateralization required for Farmer Mac I AgVantage securities. Farmer Mac excludes the loans that secure AgVantage securities from the credit risk metrics it discloses because of the credit quality of the issuing institutions, the collateralization level for the securities, and because delinquent loans are required to be removed from the pool of pledged loans and replaced with current eligible loans.
USDA Guarantees
No allowance for losses has been provided for USDA Guaranteed Securities or Farmer Mac II Guaranteed Securities. The USDA-guaranteed portions presented as "USDA Guaranteed Securities" on the consolidated balance sheets, as well as those that collateralize Farmer Mac II Guaranteed Securities, are guaranteed by the United States Department of Agriculture. Each USDA guarantee is an obligation backed by the full faith and credit of the United States. Farmer Mac excludes these guaranteed portions from the credit risk metrics it discloses because of the USDA guarantee.
Rural Utilities
Farmer Mac separately evaluates the rural utilities loans it owns, as well as the lender obligations and loans underlying or securing its Farmer Mac Guaranteed Securities – Rural Utilities, including AgVantage securities, to determine if there are any probable losses inherent in those assets. Each AgVantage security is a general obligation of an issuing institution approved by Farmer Mac and is secured by eligible loans in an amount at least equal to the outstanding principal amount of the security. No allowance for losses has been provided for this portfolio segment based on the credit quality of the collateral supporting rural utilities assets and Farmer Mac's counterparty risk analysis. As of
December 31, 2012
, there were no delinquencies and no probable losses inherent in Farmer Mac's rural utilities loans held or in any Farmer Mac Guaranteed Securities – Rural Utilities.
129
Specific Allowance for Impaired Loans
Farmer Mac also analyzes certain loans in its portfolio for impairment in accordance with accounting guidance on measuring individual impairment of a loan. Farmer Mac's impaired loans generally include loans
90 days
or more past due, in foreclosure, restructured, in bankruptcy and certain performing loans that have previously been delinquent or are secured by real estate that produces agricultural commodities or products currently under stress.
For loans with an updated appraised value, other updated collateral valuation or management's estimate of discounted collateral value, this analysis includes the measurement of the fair value of the underlying collateral for individual loans relative to the total recorded investment, including principal, interest and advances and net of any charge-offs. In the event that the collateral value does not support the total recorded investment, Farmer Mac specifically provides an allowance for the loan for the difference between the recorded investment and its fair value, less estimated costs to liquidate the collateral. Estimated selling costs are based on historical selling costs incurred by Farmer Mac or management's best estimate of selling costs for a particular property. For the remaining impaired assets without updated valuations, this analysis is performed in the aggregate in consideration of the similar risk characteristics of the assets and historical statistics. Farmer Mac considers appraisals aged more than two years as of the reporting period end date to be outdated.
Farmer Mac believes this methodology that utilizes loan classification scores and historical loss experience is a better indication of impairment for these collateral-dependent loans than other valuation methods. Impairment analysis was performed in the aggregate in consideration of similar risk characteristics of the assets and historical statistics on
$56.0 million
(
55.8 percent
) of impaired loans as of
December 31, 2012
, which resulted in a specific reserve of
$1.1 million
. As of
December 31, 2011
, the impairment analysis was performed in the aggregate in consideration of similar risk characteristics of the assets and historical statistics on
$42.0 million
(
47.6 percent
) of impaired loans, which resulted in a specific reserve of
$0.9 million
.
Farmer Mac uses a risk-based approach in determining the necessity of obtaining updated appraisals on impaired loans. For example, larger exposures associated with highly improved and specialized collateral will generally receive updated appraisals once the loans are identified as impaired. In addition, updated appraisals are always obtained during the foreclosure process. Depending on the risk factors associated with the loan and underlying collateral, which can vary widely depending on the circumstances of the loan and collateral, this can occur early in the foreclosure process, while in other instances this may occur just prior to the transfer of title. As part of its routine credit review process, Farmer Mac often will exercise judgment in discounting an appraisal value due to local real estate trends or the condition of the property (e.g., following an inspection by Farmer Mac or the servicer). In addition, a property appraisal value may be discounted based on the market's reaction to Farmer Mac's asking price for sale of the property.
A modification to the contractual terms of a loan that results in granting a concession to a borrower experiencing financial difficulties is considered a troubled debt restructuring ("TDR"). Farmer Mac has granted a concession when, as a result of the restructuring, it does not expect to collect all amounts due in a timely manner, including interest accrued at the original contract rate. In making its determination of whether a borrower is experiencing financial difficulties, Farmer Mac considers several factors, including whether (1) the borrower has declared or is in the process of declaring bankruptcy, (2) there is substantial doubt as to whether the borrower will continue to be a going concern, and (3) the borrower can obtain funds from other sources at an effective interest rate at or near a current market interest rate for debt with similar risk characteristics. Farmer Mac evaluates TDRs similarly to other impaired loans for purposes of
130
the allowance for losses. For the year ended
December 31, 2012
, the recorded investment of loans determined to be TDRs was
$2.6 million
before restructuring and
$2.8 million
after restructuring. For the year ended
December 31, 2011
, the recorded investment of loans determined to be TDRs was
$0.6 million
, both before and after restructuring. As of
December 31, 2012
, there was
one
TDR identified during the previous 12 months that was in default, under the modified terms, with a recorded investment of
$0.2 million
. During 2012 and 2011, Farmer Mac recorded partial
releases
from its allowance for loan losses of
$0.3 million
and
$0.1 million
, respectively, related to TDRs. See Note 8 for more information related to the allowance for losses.
|
(k)
|
Earnings Per Common Share
|
Basic earnings per common share ("EPS") is based on the weighted-average number of shares of common stock outstanding. Diluted earnings per common share is based on the weighted-average number of shares of common stock outstanding adjusted to include all potentially dilutive common stock options, stock appreciation rights ("SARs") and non-vested restricted stock awards. The following schedule reconciles basic and diluted EPS for the years ended
December 31, 2012
,
2011
, and
2010
:
|
|
For the Year Ended December 31,
|
|||||||||||||||||||||||||||||||
|
|
2012
|
2011
|
2010
|
|||||||||||||||||||||||||||||
|
Net
Income |
Weighted-Average Shares
|
$ per
Share |
Net
Income |
Weighted-Average Shares
|
$ per
Share |
Net
Income |
Weighted-Average Shares
|
$ per
Share |
||||||||||||||||||||||||
|
|
(in thousands, except per share amounts)
|
|||||||||||||||||||||||||||||||
|
Basic EPS
|
|
|
|
|
|
|
||||||||||||||||||||||||||
|
Net income attributable to common stockholders
|
$
|
43,894
|
|
10,479
|
|
$
|
4.19
|
|
$
|
13,784
|
|
10,335
|
|
$
|
1.33
|
|
$
|
22,080
|
|
10,229
|
|
$
|
2.16
|
|
||||||||
|
Effect of dilutive securities (1):
|
|
|
|
|
|
|
|
|
|
|
|
|
|
|
|
|
|
|
||||||||||||||
|
Stock options, SARs and restricted stock
|
540
|
|
(0.21
|
)
|
|
|
467
|
|
(0.05
|
)
|
386
|
|
(0.08
|
)
|
||||||||||||||||||
|
Diluted EPS
|
$
|
43,894
|
|
11,019
|
|
$
|
3.98
|
|
$
|
13,784
|
|
10,802
|
|
$
|
1.28
|
|
$
|
22,080
|
|
10,615
|
|
$
|
2.08
|
|
||||||||
|
(1)
|
For the years ended
December 31, 2012
,
2011
, and
2010
, stock options and SARs of
317,253
,
703,624
, and
1,485,404
, respectively, were outstanding but not included in the computation of diluted earnings per share of common stock because they were anti-dilutive. For the years ended
December 31, 2012
,
2011
, and
2010
, contingent shares of non-vested restricted stock of
79,300
,
76,340
, and
115,125
, respectively, were outstanding but not included in the computation of diluted earnings per share of common stock because performance conditions were not met.
|
|
(l)
|
Income Taxes
|
Deferred federal income tax assets and liabilities are established for temporary differences between financial and taxable income and are measured using the current enacted statutory tax rate. Income tax expense is equal to the income taxes payable in the current year plus the net change in the deferred tax asset or liability balance.
Farmer Mac evaluates its tax positions at least quarterly to identify and recognize any liabilities related to uncertain tax positions in its federal income tax returns. Farmer Mac, in accordance with accounting guidance on uncertainty in income taxes, uses a two-step approach in which income tax benefits are recognized if, based on the technical merits of a tax position, it is more likely than not (a probability of greater than
50 percent
) that the tax position would be sustained upon examination by the taxing authority, which includes all related appeals and litigation process. The amount of tax benefit recognized is then measured at the largest amount of tax benefit that is greater than
50 percent
likely to be realized upon
131
settlement with the taxing authority, considering all information available at the reporting date. Farmer Mac's policy for recording interest and penalties associated with uncertain tax positions is to record them as a component of income tax expense. Farmer Mac establishes a valuation allowance for deferred tax assets if it is more likely than not that some portion or all of the deferred tax assets will not be realized.
|
(m)
|
Stock-Based Compensation
|
Farmer Mac accounts for its stock-based employee compensation plans using the grant date fair value method of accounting. Farmer Mac measures the cost of employee services received in exchange for an award of equity instruments based on the grant-date fair value of the award determined using the Black-Scholes option pricing model. The cost is recognized over the period during which an employee is required to provide service in exchange for the award. For performance based grants, Farmer Mac recognizes the grant-date fair value over the vesting period as long as it remains probable that the performance conditions will be met. If the service or performance conditions are not met, Farmer Mac reverses previously recognized compensation expense upon forfeiture.
Farmer Mac recognized
$2.5 million
,
$3.0 million
, and
$2.8 million
of compensation expense related to stock options, SARs and non-vested restricted stock awards for
2012
,
2011
, and
2010
, respectively.
|
(n)
|
Comprehensive Income
|
Comprehensive income represents all changes in stockholders' equity except those resulting from investments by or distributions to stockholders, and is comprised primarily of net income and unrealized gains and losses on securities available-for-sale, net of related taxes.
|
(o)
|
Long-Term Standby Purchase Commitments
|
Farmer Mac accounts for its LTSPCs in accordance with accounting guidance on guarantees. Commitment fee income represents a reduction of the commitment obligation based on amortization using the actual prepayment experience on the underlying loans. See Note 2(j) for Farmer Mac's policy for estimating probable losses for LTSPCs and Note 12 for more information on the accounting for LTSPCs.
|
(p)
|
Fair Value Measurement
|
Farmer Mac follows accounting guidance for fair value measurements that defines fair value as the price that would be received to sell an asset or paid to transfer a liability in an orderly transaction between market participants at the measurement date and establishes a fair value hierarchy that ranks the quality and reliability of the inputs to valuation techniques used to measure fair value. The hierarchy gives highest rank to unadjusted quoted prices in active markets for identical assets or liabilities (level 1 measurements) and the lowest rank to unobservable inputs (level 3 measurements).
Farmer Mac's assessment of the significance of the input to the fair value measurement requires judgment and considers factors specific to the financial instrument. Both observable and unobservable inputs may be used to determine the fair value of financial instruments that Farmer Mac has classified within the level 3 category. As a result, the unrealized gains and losses for assets and liabilities within the level 3 category may include changes in fair value that were attributable to both observable (e.g., changes in market interest rates) and unobservable (e.g., changes in projected prepayment rates) inputs. See Note 13 for more information regarding fair value measurement.
132
|
(q)
|
Consolidation of Variable Interest Entities
|
Farmer Mac has interests in various entities that are considered to be VIEs. These interests include investments in securities issued by VIEs, such as Farmer Mac agricultural mortgage-backed securities created pursuant to Farmer Mac's securitization transactions and mortgage and asset-backed trusts that Farmer Mac did not create. The consolidation model uses a qualitative evaluation that requires consolidation of an entity when the reporting enterprise both (1) has the power to direct matters which significantly impact the activities and success of the entity, and (2) has exposure to benefits and/or losses that could potentially be significant to the entity. The reporting enterprise that meets both these conditions is deemed the primary beneficiary of the VIE.
The accounting guidance on the consolidation of VIEs required the incremental assets and liabilities consolidated upon adoption to initially be reported at their carrying amounts. Carrying amount refers to the amount at which the assets and liabilities would have been carried in the consolidated financial statements if the new guidance had been effective when Farmer Mac first met the conditions to be the primary beneficiary of the VIE. For the outstanding trusts consolidated effective January 1, 2010, Farmer Mac initially recorded the assets and liabilities on the consolidated balance sheets at their carrying amounts, adjusted, where applicable, for fair value option elections that had been made previously. Accrued interest and allowance for losses also were recognized as appropriate.
The VIEs in which Farmer Mac has a variable interest are limited to securitization trusts. The major factor in determining if Farmer Mac is the primary beneficiary is whether Farmer Mac has the power to direct the activities of the trust that potentially have the most significant impact on the economic performance of the trust. Generally, the ability to make decisions regarding default mitigation is evidence of that power. Farmer Mac determined that it is the primary beneficiary for the securitization trusts related to most Farmer Mac I and all Rural Utilities securitization transactions because of its rights as guarantor under both programs to control the default mitigation activities of the trusts. For certain securitization trusts created when loans subject to LTSPCs were converted to Farmer Mac I Guaranteed Securities, Farmer Mac determined that it was not the primary beneficiary since the power to make decisions regarding default mitigation was shared among unrelated parties. For these trusts, the shared power provisions are substantive with respect to decision-making power and relate to the same activity (i.e., default mitigation). For similar securitization transactions where the power to make decisions regarding default mitigation was shared with a related party, Farmer Mac determined that it was the primary beneficiary because the applicable accounting guidance does not permit parties within a related party group to conclude that the power is shared. In the event that a related party status changes, consolidation or deconsolidation of these securitization trusts could occur.
For those trusts that Farmer Mac is the primary beneficiary, the assets and liabilities are presented on the consolidated balance sheets as "Loans held for investment in consolidated trusts, at amortized cost" and "Debt securities of consolidated trusts held by third parties," respectively. These assets can only be used to satisfy the obligations of the related trust.
For those trusts where Farmer Mac has a variable interest but has not been determined to be the primary beneficiary, Farmer Mac's interests are presented as either "Farmer Mac Guaranteed Securities" or "Investment securities" on the consolidated balance sheets. Farmer Mac's involvement in VIEs classified as Farmer Mac Guaranteed Securities include securitization trusts under the USDA Guarantees line of business and certain trusts related to Farmer Mac I AgVantage securities. In the case of Farmer Mac II trusts, Farmer Mac is not determined to be the primary beneficiary because it does not have the decision-
133
making power over default mitigation activities. Based on the USDA's program authority over the servicing and default mitigation activities of the USDA guaranteed portions of loans, Farmer Mac believes that the USDA has the power to direct the activities that most significantly impact the trust's economic performance. Farmer Mac does not have exposure to losses that could be significant to the trust and there are no triggers that would result in Farmer Mac superseding the USDA's authority with regard to directing the activities of the trust. For the AgVantage trusts, Farmer Mac currently does not have the power to direct the activities that have the most significant economic impact to the trust unless, as guarantor, there is a default by the issuer of the trust securities. Should there be a default, Farmer Mac would reassess whether it is the primary beneficiary of those trusts. The amounts disclosed in the tables below represent Farmer Mac's holdings of a portion of the beneficial interests issued by these AgVantage Trusts. For VIEs classified as investment securities, which include auction-rate certificates, asset-backed securities and government-sponsored enterprise ("GSE")-guaranteed mortgage-backed securities, Farmer Mac is determined not to be the primary beneficiary because of the lack of voting rights or other powers to direct the activities of the trust. The following tables present, by line of business, details about the consolidation of VIEs:
|
Consolidation of Variable Interest Entities
|
|||||||||||||||||||
|
December 31, 2012
|
|||||||||||||||||||
|
Farm & Ranch
|
USDA Guarantees
|
Rural Utilities
|
Investments
|
Total
|
|||||||||||||||
|
(in thousands)
|
|||||||||||||||||||
|
On-Balance Sheet:
|
|||||||||||||||||||
|
Consolidated VIEs:
|
|||||||||||||||||||
|
Loans held for investment in consolidated trusts, at amortized cost (1)
|
$
|
160,436
|
|
$
|
—
|
|
$
|
403,139
|
|
$
|
—
|
|
$
|
563,575
|
|
||||
|
Debt securities of consolidated trusts held by third parties (2)
|
167,621
|
|
—
|
|
—
|
|
—
|
|
167,621
|
|
|||||||||
|
Unconsolidated VIEs:
|
|||||||||||||||||||
|
Farmer Mac Guaranteed Securities:
|
|||||||||||||||||||
|
Carrying value (3)
|
31,370
|
|
26,681
|
|
—
|
|
—
|
|
58,051
|
|
|||||||||
|
Maximum exposure to loss (4)
|
30,000
|
|
26,238
|
|
—
|
|
—
|
|
56,238
|
|
|||||||||
|
Investment securities:
|
|||||||||||||||||||
|
Carrying value
|
—
|
|
—
|
|
—
|
|
724,893
|
|
724,893
|
|
|||||||||
|
Maximum exposure to loss (4)
|
—
|
|
—
|
|
—
|
|
737,148
|
|
737,148
|
|
|||||||||
|
Off-Balance Sheet:
|
|||||||||||||||||||
|
Unconsolidated VIEs:
|
|||||||||||||||||||
|
Farmer Mac Guaranteed Securities:
|
|||||||||||||||||||
|
Maximum exposure to loss (4) (5)
|
1,881,370
|
|
29,658
|
|
—
|
|
—
|
|
1,911,028
|
|
|||||||||
(1) Includes unamortized premiums related to Rural Utilities of
$34.3 million
.
(2) Includes borrower remittances of
$7.2 million
, which have not been passed through to third party investors as of December 31, 2012.
(3) Includes unamortized premiums and discounts and fair value adjustments related to Farm & Ranch and USDA Guarantees of
$1.4 million
and
$0.4 million
, respectively.
(4) Farmer Mac uses unpaid principal balance and outstanding face amount of investment securities to represent maximum exposure to loss.
(5) Of the Farm & Ranch amount,
$911.4 million
relates to unconsolidated trusts where Farmer Mac determined it was not the primary beneficiary due to shared power with an unrelated party.
134
|
Consolidation of Variable Interest Entities
|
|||||||||||||||||||
|
December 31, 2011
|
|||||||||||||||||||
|
Farm & Ranch
|
USDA Guarantees
|
Rural Utilities
|
Investments
|
Total
|
|||||||||||||||
|
(in thousands)
|
|||||||||||||||||||
|
On-Balance Sheet:
|
|||||||||||||||||||
|
Consolidated VIEs:
|
|||||||||||||||||||
|
Loans held for investment in consolidated trusts, at amortized cost (1)
|
$
|
696,735
|
|
$
|
—
|
|
$
|
424,824
|
|
$
|
—
|
|
$
|
1,121,559
|
|
||||
|
Debt securities of consolidated trusts held by third parties (2)
|
701,583
|
|
—
|
|
—
|
|
—
|
|
701,583
|
|
|||||||||
|
Unconsolidated VIEs:
|
|||||||||||||||||||
|
Farmer Mac Guaranteed Securities:
|
|||||||||||||||||||
|
Carrying value (3)
|
30,964
|
|
35,599
|
|
—
|
|
—
|
|
66,563
|
|
|||||||||
|
Maximum exposure to loss (4)
|
30,000
|
|
35,410
|
|
—
|
|
—
|
|
65,410
|
|
|||||||||
|
Investment securities:
|
|||||||||||||||||||
|
Carrying value
|
—
|
|
—
|
|
—
|
|
771,162
|
|
771,162
|
|
|||||||||
|
Maximum exposure to loss (4)
|
—
|
|
—
|
|
—
|
|
788,381
|
|
788,381
|
|
|||||||||
|
Off-Balance Sheet:
|
|||||||||||||||||||
|
Unconsolidated VIEs:
|
|||||||||||||||||||
|
Farmer Mac Guaranteed Securities:
|
|||||||||||||||||||
|
Maximum exposure to loss (4) (5)
|
1,591,871
|
|
42,088
|
|
—
|
|
—
|
|
1,633,959
|
|
|||||||||
(1) Includes unamortized premiums related to Rural Utilities of
$38.0 million
.
(2) Includes borrower remittances of
$4.8 million
, which have not been passed through to third party investors as of December 31, 2011.
(3) Includes unamortized premiums and discounts and fair value adjustments related to Farm & Ranch and USDA Guarantees of
$1.0 million
and
$0.2 million
, respectively.
(4) Farmer Mac uses unpaid principal balance and the outstanding face amount of investment securities to represent maximum exposure to loss.
(5) Of the Farm & Ranch amount,
$621.9 million
relates to unconsolidated trusts where Farmer Mac determined it was not the primary beneficiary due to shared power with an unrelated party.
|
(r)
|
New Accounting Standards
|
Offsetting Assets and Liabilities
On December 16, 2011, the Financial Accounting Standards Board ("FASB") issued Accounting Standards Update ("ASU") 2011-11,
Disclosures about Offsetting Assets and Liabilities
, which creates new disclosure requirements designed to make financial statements prepared under GAAP more comparable to those prepared under International Financial Reporting Standards. The new guidance requires entities to disclose net and gross information for certain derivative instruments and financial instruments and information about the impact of collateral on offsetting arrangements and other amounts subject to a master netting agreement that are not offset on the balance sheet.
On January 31, 2013, the FASB issued ASU 2013-01,
Clarifying the Scope of Disclosures about Offsetting Assets and Liabilities,
addressing the implementation of ASU 2011-11
.
The amendment clarifies that the scope of ASU 2011-11 applies to recognized derivative instruments, including bifurcated embedded derivatives, repurchase agreements and reverse repurchase agreements, and securities borrowing and securities lending transactions that are offset in the financial statements or are subject to enforceable master netting arrangements or similar agreements. ASU 2013-01 was effective concurrently with ASU 2011-11, which applies for interim and annual periods beginning on or after January 1, 2013. Because these standards only require additional disclosure, the adoption of ASU 2011-11 and ASU 2013-01 does not have a material effect on Farmer Mac's financial position, results of operations or cash flows.
135
Comprehensive Income
On February 5, 2013, the FASB issued ASU 2013-02,
Reporting of Amounts Reclassified Out of Accumulated Other Comprehensive Income
("AOCI"). The new guidance requires entities to disclose additional information about reclassification adjustments, including changes in AOCI balances by component and significant items reclassified out of AOCI. An entity would disaggregate the total change of each component of other comprehensive income and separately present reclassification adjustments and current period other comprehensive income. ASU 2013‑02 also requires significant items reclassified out of AOCI to be presented either on the face of the statement where net income is presented or as a separate disclosure in the notes to the financial statements. The income tax benefit or expense attributed to each component of other comprehensive income and reclassification adjustments must be presented in the financial statement or notes to the financial statements. The amendments in ASU 2013-02 do not change the current requirement for reporting net income or other comprehensive income in the financial statements. ASU 2013-02 was effective for all reporting periods beginning after December 15, 2012. The adoption of this new guidance does not have a material effect on Farmer Mac's financial position, results of operations or cash flows because it only requires additional disclosure.
|
(s)
|
Reclassifications
|
Certain reclassifications of prior period information were made to conform to the current period presentation.
|
3.
|
RELATED PARTY TRANSACTIONS
|
Farmer Mac considers an entity to be a related party if (1) the entity holds at least
five percent
of a class of Farmer Mac voting common stock or (2) the institution has an affiliation with a Farmer Mac director and conducts material business with Farmer Mac. As provided by Farmer Mac's statutory charter, only banks, insurance companies and other financial institutions or similar entities may hold Farmer Mac's Class A voting common stock and only institutions of the FCS may hold Farmer Mac's Class B voting common stock. Farmer Mac's statutory charter also provides that Class A stockholders elect
five
members of Farmer Mac's
15
-member board of directors and that Class B stockholders elect
five
members of the board of directors. Additionally, in order to participate in the Farmer Mac I program, a financial institution must own a requisite amount of the Corporation's common stock, based on the size and type of institution. As a result of these requirements, Farmer Mac conducts business with related parties in the normal course of Farmer Mac's business. All related party transactions were conducted with terms and conditions comparable to those available to any other program participant not related to Farmer Mac.
136
Zions First National Bank
:
The following transactions occurred between Farmer Mac and Zions First National Bank or its affiliates ("Zions"), which is the largest holder of Farmer Mac Class A voting common stock and a major holder of Class C non-voting common stock during
2012
,
2011
, and
2010
:
|
|
For the Year Ended December 31,
|
||||||||||
|
|
2012
|
2011
|
2010
|
||||||||
|
|
(in thousands)
|
||||||||||
|
Unpaid Principal Balance:
|
|||||||||||
|
Purchases:
|
|
|
|
||||||||
|
Loans
|
$
|
168,826
|
|
$
|
125,088
|
|
$
|
176,288
|
|
||
|
USDA-guaranteed portions
|
14,415
|
|
5,218
|
|
5,775
|
|
|||||
|
Sales of Farmer Mac Guaranteed Securities
|
5,327
|
|
—
|
|
5,695
|
|
|||||
The purchases of loans from Zions under the Farm & Ranch line of business represented approximately
29.6 percent
,
25.2 percent
, and
46.1 percent
of Farm & Ranch loan purchase volume for the years ended
December 31, 2012
,
2011
, and
2010
, respectively, and
8.8 percent
,
4.5 percent
, and
11.4 percent
, respectively, of total Farm & Ranch purchases. The purchases of USDA-guaranteed portions from Zions under the USDA Guarantees line of business represented approximately
3.0 percent
of that program's purchases for the year ended
December 31, 2012
and
1.3 percent
for the years ended
December 31, 2011
and
2010
. Zions represented
4.7 percent
of Farmer Mac's outstanding book of business at
December 31, 2012
and
2011
.
Farmer Mac or Zions received the applicable amounts shown below with respect to transactions between the two parties in
2012
,
2011
, and
2010
:
|
|
For the Year Ended December 31,
|
||||||||||
|
|
2012
|
2011
|
2010
|
||||||||
|
|
(in thousands)
|
||||||||||
|
Guarantee fees received by Farmer Mac
|
$
|
633
|
|
$
|
940
|
|
$
|
1,210
|
|
||
|
Servicing fees retained by Zions
|
1,980
|
|
1,870
|
|
1,678
|
|
|||||
Farmer Mac and Zions were parties to interest rate swap contracts having an aggregate outstanding notional amount of approximately
$49.3 million
and
$72.7 million
as of
December 31, 2012
and
2011
, respectively. As of
December 31, 2012
and
2011
, Farmer Mac had net interest payable to Zions under those contracts of approximately
$0.5 million
and
$1.0 million
, respectively. Zions acted as dealer with respect to approximately
$37.0 million
and
$220.9 million
par value of Farmer Mac discount notes during
2011
and
2010
, respectively, and
none
in
2012
. The related commissions Farmer Mac paid to Zions for these services were immaterial.
AgFirst Farm Credit Bank
:
Farmer Mac has a related party relationship with AgFirst Farm Credit Bank ("AgFirst"), resulting from AgFirst being a holder of approximately
16.8 percent
of Farmer Mac Class B voting common stock.
137
AgFirst entered into
$16.8 million
,
$8.6 million
, and
$116.2 million
of LTSPC transactions in
2012
,
2011
, and
2010
, respectively, and the aggregate balance of LTSPCs outstanding as of
December 31, 2012
,
2011
, and
2010
was
$186.5 million
,
$225.0 million
, and
$387.9 million
, respectively. Farmer Mac received from AgFirst
$0.8 million
,
$1.0 million
, and
$1.5 million
in commitment fees in
2012
,
2011
, and
2010
, respectively, and had
$0.1 million
of commitment fees receivable as of
December 31, 2012
and
2011
.
AgFirst owns certain securities backed by rural housing loans for which Farmer Mac is the second-loss guarantor for the last ten percent. As of
December 31, 2012
,
2011
, and
2010
, the outstanding balance of those securities owned by AgFirst was
$168.1 million
,
$231.4 million
, and
$299.0 million
, respectively. Farmer Mac received guarantee fees of
$0.5 million
in
2012
and
$0.4 million
in 2011 and 2010, with respect to those securities.
Servicing fees retained by AgFirst for its work as a Farmer Mac central servicer and guarantee fees Farmer Mac earned on Farmer Mac I Guaranteed Securities held by AgFirst were immaterial in
2012
,
2011
, and
2010
.
AgStar Financial Services, ACA
:
Farmer Mac had a related party relationship with AgStar Financial Services, ACA ("AgStar") during 2010 resulting from a former member of Farmer Mac's board of directors being the President and Chief Executive Officer of AgStar. Effective in June 2010, AgStar was no longer a related party because the President and Chief Executive Officer of AgStar was no longer a member of Farmer Mac's board of directors. Amounts, where presented for 2010, represent activity for the entire year.
In
2010
, AgStar retained
$1.4 million
in servicing fees for its work as a Farmer Mac central servicer. Farmer Mac purchased from AgStar
$0.1 million
of defaulted loans pursuant to the terms of an LTSPC agreement in
2010
, and sold Farmer Mac I Guaranteed Securities to AgStar in the amount of
$2.9 million
. Those sales did not result in a gain or loss to Farmer Mac.
During
2010
, AgStar entered into
$30.3 million
of new LTSPCs. Farmer Mac received commitment fees of
$1.1 million
for the year ended
December 31, 2010
. During 2010, no existing LTSPCs were converted to Farmer Mac I Guaranteed Securities. The outstanding principal balance of previously converted securities as of December 31, 2009 was
$449.2 million
. Farmer Mac received
$1.7 million
in guarantee fees on those securities during 2010.
138
The National Rural Utilities Cooperative Financial Corporation
:
Farmer Mac considers the National Rural Utilities Cooperative Financial Corporation ("CFC") a related party due to its ownership of approximately
7.9 percent
of Class A voting common stock. The following transactions occurred between Farmer Mac and CFC during
2012
,
2011
, and
2010
:
|
Farmer Mac Loan Purchases and Guarantees
|
|||||||||||
|
|
For the Year Ended December 31,
|
||||||||||
|
|
2012
|
2011
|
2010
|
||||||||
|
|
(in thousands)
|
||||||||||
|
Rural Utilities:
|
|
|
|||||||||
|
Loans
|
$
|
166,117
|
|
$
|
203,789
|
|
$
|
313,028
|
|
||
|
On-balance sheet Farmer Mac Guaranteed Securities
|
383,406
|
|
—
|
|
650,000
|
|
|||||
|
Off-balance sheet Farmer Mac Guaranteed Securities
|
—
|
|
2,796
|
|
2,924
|
|
|||||
|
Total purchases and guarantees
|
$
|
549,523
|
|
$
|
206,585
|
|
$
|
965,952
|
|
||
Those transactions with CFC represented
100 percent
of Farmer Mac's loan purchase and guarantee volume under the Rural Utilities program for
2012
,
2011
, and
2010
and represented
18.6 percent
,
6.1 percent
, and
32.5 percent
of total purchases for
2012
,
2011
, and
2010
, respectively. Of Farmer Mac's total outstanding book of business at
December 31, 2012
and
2011
, CFC represented
18.0 percent
and
19.7 percent
, respectively. As of
December 31, 2012
and for the year then ended, Farmer Mac had guarantee fees receivable of
$0.7 million
from CFC and earned guarantee fees of
$4.4 million
. As of
December 31, 2011
and for the year then ended, Farmer Mac had guarantee fees receivable of
$1.1 million
from CFC and earned guarantee fees of
$5.4 million
. As of
December 31, 2010
and for the year then ended, Farmer Mac had guarantee fees receivable of
$1.2 million
from CFC and earned guarantee fees of
$6.0 million
.
Farmer Mac also had interest receivable of
$5.7 million
and
$8.2 million
as of
December 31, 2012
and
2011
, respectively, and earned interest income of
$28.0 million
,
$30.9 million
, and
$32.7 million
during
2012
,
2011
, and
2010
, respectively, related to its AgVantage transactions with CFC.
Farm Credit Bank of Texas
:
Farmer Mac has a related party relationship with Farm Credit Bank of Texas resulting from the bank being a holder of approximately
7.7 percent
of Farmer Mac Class B voting common stock. During 2012 and 2011, Farmer Mac did not enter into any new LTSPCs with Farm Credit Bank of Texas. During
2010
, Farm Credit Bank of Texas entered into
$26.4 million
of new LTSPCs. Farmer Mac received from Farm Credit Bank of Texas commitment fees of
$0.3 million
,
$0.3 million
, and
$1.7 million
, respectively, for the years ended
December 31, 2012
,
2011
, and
2010
. Commitment fees receivable were immaterial at December 31, 2012 and 2011. The aggregate amount of LTSPCs outstanding as of
December 31, 2012
and
2011
was
$75.1 million
and
$96.7 million
, respectively. In
2012
,
2011
, and
2010
, Farm Credit Bank of Texas retained
$0.6 million
,
$0.8 million
, and
$0.9 million
, respectively, in servicing fees for its work as a Farmer Mac central servicer.
139
Farm Credit West:
Farmer Mac had a related party relationship with Farm Credit West, ACA during 2012, 2011, and 2010 resulting from a member of Farmer Mac's board of directors being the Executive Vice President of Farm Credit West. Effective in June 2012, Farm Credit West was no longer a related party because the Executive Vice President of Farm Credit West was no longer a member of Farmer Mac's board of directors. Amounts, where presented for 2012, represent activity for the entire year.
During
2012
,
2011
, and
2010
, Farm Credit West entered into
$8.1 million
,
$2.1 million
, and
$0.5 million
, respectively, of new LTSPCs. Farmer Mac received from Farm Credit West commitment fees of
$0.3 million
for each of the years ended December 31, 2012, 2011, and 2010. Commitment fees receivable were immaterial at December 31, 2012 and 2011. During 2003 and 2006, Farm Credit West, ACA converted
$722.3 million
and
$129.0 million
, respectively, of existing LTSPCs to Farmer Mac I Guaranteed Securities. The aggregate amount of LTSPCs outstanding as of
December 31, 2012
and
2011
was
$95.4 million
and
$98.3 million
, respectively. The outstanding principal balance of the converted securities as of
December 31, 2012
and
2011
was
$420.9 million
and
$498.1 million
, respectively. Farmer Mac understands that the current owner of some of those Farmer Mac Guaranteed Securities is CoBank, FCB. Farmer Mac received
$1.9 million
,
$2.3 million
, and
$2.6 million
in guarantee fees on those securities during
2012
,
2011
, and
2010
, respectively. In
2012
,
2011
, and
2010
, Farm Credit West retained
$0.9 million
,
$1.0 million
, and
$1.9 million
, respectively, in servicing fees for its work as a Farmer Mac central servicer.
Other Related Party Transactions
:
Farmer Mac purchased
$37.1 million
,
$29.7 million
, and
$27.0 million
in loans from First Dakota Bank in
2012
,
2011
, and
2010
, respectively, and
$4.4 million
,
$10.6 million
, and
$4.6 million
in USDA-guaranteed securities from Bath State Bank in
2012
,
2011
, and
2010
, respectively. Farmer Mac received immaterial guarantee fees from First Dakota Bank in the years ended December 31, 2012 and 2011, compared to
$0.2 million
in the year ended December 31, 2010. Farmer Mac received immaterial guarantee fees from Bath State Bank in the years ended December 31, 2012 and 2011, compared to
$0.1 million
for the year ended December 31, 2010. AgGeorgia Farm Credit, ACA ("AgGeorgia") is a related party for
2012
. Farmer Mac entered into
$51.5 million
of new LTSPCs with AgGeorgia and received
$0.1 million
of commitment fees during
2012
. These institutions had a related party relationship with Farmer Mac resulting from a member of Farmer Mac's board of directors being affiliated with the entity in some respect.
Farmer Mac owned
$78.5 million
par value of preferred stock and
$70.0 million
of subordinated debt issued by CoBank as of December 31, 2012 and 2011, respectively. Farmer Mac has a related party relationship with CoBank because CoBank is a major holder of Farmer Mac Class B voting common stock.
140
|
4.
|
INVESTMENT SECURITIES
|
The following tables present the amount outstanding, amortized cost, and fair values of Farmer Mac's investment securities as of
December 31, 2012
and
2011
:
|
|
December 31, 2012
|
||||||||||||||||||||||
|
Amount Outstanding
|
Unamortized Premium/(Discount)
|
Amortized
Cost |
Unrealized
Gains |
Unrealized
Losses |
Fair Value
|
||||||||||||||||||
|
|
(in thousands)
|
||||||||||||||||||||||
|
Available-for-sale:
|
|
|
|
|
|||||||||||||||||||
|
Floating rate auction-rate certificates backed by Government guaranteed student loans
|
$
|
74,100
|
|
$
|
—
|
|
$
|
74,100
|
|
$
|
—
|
|
$
|
(10,941
|
)
|
$
|
63,159
|
|
|||||
|
Floating rate asset-backed securities
|
150,519
|
|
(372
|
)
|
150,147
|
|
933
|
|
(36
|
)
|
151,044
|
|
|||||||||||
|
Fixed rate asset-backed securities
|
6,501
|
|
—
|
|
6,501
|
|
—
|
|
—
|
|
6,501
|
|
|||||||||||
|
Floating rate corporate debt securities
|
76,345
|
|
(32
|
)
|
76,313
|
|
450
|
|
—
|
|
76,763
|
|
|||||||||||
|
Fixed rate corporate debt securities
|
51,969
|
|
243
|
|
52,212
|
|
204
|
|
—
|
|
52,416
|
|
|||||||||||
|
Floating rate Government/GSE guaranteed mortgage-backed securities
|
699,062
|
|
5,973
|
|
705,035
|
|
8,035
|
|
(211
|
)
|
712,859
|
|
|||||||||||
|
Fixed rate GSE guaranteed mortgage-backed securities
|
1,910
|
|
1
|
|
1,911
|
|
154
|
|
—
|
|
2,065
|
|
|||||||||||
|
Floating rate GSE subordinated debt
|
70,000
|
|
—
|
|
70,000
|
|
—
|
|
(12,569
|
)
|
57,431
|
|
|||||||||||
|
Fixed rate GSE preferred stock
|
78,500
|
|
784
|
|
79,284
|
|
7,802
|
|
—
|
|
87,086
|
|
|||||||||||
|
Floating rate senior agency debt
|
50,000
|
|
(6
|
)
|
49,994
|
|
61
|
|
—
|
|
50,055
|
|
|||||||||||
|
Fixed rate senior agency debt
|
72,700
|
|
287
|
|
72,987
|
|
128
|
|
(1
|
)
|
73,114
|
|
|||||||||||
|
Fixed rate U.S. Treasuries
|
1,163,400
|
|
2,240
|
|
1,165,640
|
|
258
|
|
(9
|
)
|
1,165,889
|
|
|||||||||||
|
Total available-for-sale
|
2,495,006
|
|
9,118
|
|
2,504,124
|
|
18,025
|
|
(23,767
|
)
|
2,498,382
|
|
|||||||||||
|
Trading:
|
|
|
|
|
|
|
|
|
|||||||||||||||
|
Floating rate asset-backed securities
|
4,327
|
|
—
|
|
4,327
|
|
—
|
|
(3,080
|
)
|
1,247
|
|
|||||||||||
|
Total investment securities
|
$
|
2,499,333
|
|
$
|
9,118
|
|
$
|
2,508,451
|
|
$
|
18,025
|
|
$
|
(26,847
|
)
|
$
|
2,499,629
|
|
|||||
141
|
|
December 31, 2011
|
||||||||||||||||||||||
|
Amount Outstanding
|
Unamortized Premium/(Discount)
|
Amortized
Cost |
Unrealized
Gains |
Unrealized
Losses |
Fair Value
|
||||||||||||||||||
|
|
(in thousands)
|
||||||||||||||||||||||
|
Available-for-sale:
|
|
|
|
|
|||||||||||||||||||
|
Floating rate auction-rate certificates backed by Government guaranteed student loans
|
$
|
74,100
|
|
$
|
—
|
|
$
|
74,100
|
|
$
|
—
|
|
$
|
(13,887
|
)
|
$
|
60,213
|
|
|||||
|
Floating rate asset-backed securities
|
178,985
|
|
(542
|
)
|
178,443
|
|
219
|
|
(102
|
)
|
178,560
|
|
|||||||||||
|
Floating rate corporate debt securities
|
74,345
|
|
(193
|
)
|
74,152
|
|
69
|
|
(388
|
)
|
73,833
|
|
|||||||||||
|
Fixed rate corporate debt securities
|
38,068
|
|
610
|
|
38,678
|
|
27
|
|
(6
|
)
|
38,699
|
|
|||||||||||
|
Floating rate Government/GSE guaranteed mortgage-backed securities
|
752,533
|
|
7,034
|
|
759,567
|
|
4,852
|
|
(381
|
)
|
764,038
|
|
|||||||||||
|
Fixed rate GSE guaranteed mortgage-backed securities
|
3,108
|
|
(2
|
)
|
3,106
|
|
254
|
|
—
|
|
3,360
|
|
|||||||||||
|
Floating rate GSE subordinated debt
|
70,000
|
|
—
|
|
70,000
|
|
—
|
|
(17,438
|
)
|
52,562
|
|
|||||||||||
|
Fixed rate commercial paper
|
10,000
|
|
(1
|
)
|
9,999
|
|
1
|
|
—
|
|
10,000
|
|
|||||||||||
|
Fixed rate GSE preferred stock
|
78,500
|
|
1,162
|
|
79,662
|
|
5,216
|
|
—
|
|
84,878
|
|
|||||||||||
|
Floating rate senior agency debt
|
38,000
|
|
—
|
|
38,000
|
|
32
|
|
—
|
|
38,032
|
|
|||||||||||
|
Fixed rate senior agency debt
|
79,000
|
|
255
|
|
79,255
|
|
19
|
|
(21
|
)
|
79,253
|
|
|||||||||||
|
Fixed rate U.S. Treasuries
|
797,082
|
|
1,884
|
|
798,966
|
|
304
|
|
(4
|
)
|
799,266
|
|
|||||||||||
|
Total available-for-sale
|
2,193,721
|
|
10,207
|
|
2,203,928
|
|
10,993
|
|
(32,227
|
)
|
2,182,694
|
|
|||||||||||
|
Trading:
|
|
|
|
|
|
|
|
|
|||||||||||||||
|
Floating rate asset-backed securities
|
5,138
|
|
—
|
|
5,138
|
|
—
|
|
(3,342
|
)
|
1,796
|
|
|||||||||||
|
Total investment securities
|
$
|
2,198,859
|
|
$
|
10,207
|
|
$
|
2,209,066
|
|
$
|
10,993
|
|
$
|
(35,569
|
)
|
$
|
2,184,490
|
|
|||||
During
2012
, Farmer Mac received proceeds of
$7.0 million
from the sale of securities from its available-for-sale investment portfolio, resulting in gross realized gains of
$28,000
and gross realized losses of
$10,000
. During
2011
, Farmer Mac received proceeds of
$447.9 million
from the sale of securities from its available-for-sale investment portfolio, resulting in gross realized gains of
$0.3 million
and gross realized losses of
$10,000
. During
2010
, Farmer Mac received proceeds of
$106.3 million
from the sale of securities from its available-for-sale investment portfolio, resulting in gross realized gains of
$0.5 million
and gross realized losses of
$0.2 million
.
As of
December 31, 2012
and
2011
, unrealized losses on available-for-sale investment securities were as follows:
|
|
December 31, 2012
|
||||||||||||||
|
|
Available-for-Sale Securities
|
||||||||||||||
|
Unrealized loss position for
less than 12 months |
Unrealized loss position for
more than 12 months |
||||||||||||||
|
Fair Value
|
Unrealized
Loss |
Fair Value
|
Unrealized
Loss |
||||||||||||
|
|
(in thousands)
|
||||||||||||||
|
Floating rate auction-rate certificates backed by Government guaranteed student loans
|
$
|
—
|
|
$
|
—
|
|
$
|
63,159
|
|
$
|
(10,941
|
)
|
|||
|
Floating rate asset-backed securities
|
21,648
|
|
(27
|
)
|
3,619
|
|
(9
|
)
|
|||||||
|
Floating rate Government/GSE guaranteed mortgage-backed securities
|
174,352
|
|
(209
|
)
|
829
|
|
(2
|
)
|
|||||||
|
Floating rate GSE subordinated debt
|
—
|
|
—
|
|
57,431
|
|
(12,569
|
)
|
|||||||
|
Fixed rate senior agency debt
|
50,088
|
|
(1
|
)
|
—
|
|
—
|
|
|||||||
|
Fixed rate U.S. Treasuries
|
136,194
|
|
(9
|
)
|
—
|
|
—
|
|
|||||||
|
Total
|
$
|
382,282
|
|
$
|
(246
|
)
|
$
|
125,038
|
|
$
|
(23,521
|
)
|
|||
142
|
|
December 31, 2011
|
||||||||||||||
|
|
Available-for-Sale Securities
|
||||||||||||||
|
Unrealized loss position for
less than 12 months |
Unrealized loss position for
more than 12 months |
||||||||||||||
|
Fair Value
|
Unrealized
Loss |
Fair Value
|
Unrealized
Loss |
||||||||||||
|
|
(in thousands)
|
||||||||||||||
|
Floating rate auction-rate certificates backed by Government guaranteed student loans
|
$
|
—
|
|
$
|
—
|
|
$
|
60,213
|
|
$
|
(13,887
|
)
|
|||
|
Floating rate asset-backed securities
|
63,496
|
|
(102
|
)
|
—
|
|
—
|
|
|||||||
|
Floating rate corporate debt securities
|
41,061
|
|
(388
|
)
|
—
|
|
—
|
|
|||||||
|
Fixed rate corporate debt securities
|
18,189
|
|
(6
|
)
|
—
|
|
—
|
|
|||||||
|
Floating rate Government/GSE guaranteed mortgage-backed securities
|
235,454
|
|
(359
|
)
|
17,409
|
|
(22
|
)
|
|||||||
|
Floating rate GSE subordinated debt
|
—
|
|
—
|
|
52,562
|
|
(17,438
|
)
|
|||||||
|
Fixed rate senior agency debt
|
44,976
|
|
(21
|
)
|
—
|
|
—
|
|
|||||||
|
Fixed rate U.S. Treasuries
|
50,160
|
|
(4
|
)
|
—
|
|
—
|
|
|||||||
|
Total
|
$
|
453,336
|
|
$
|
(880
|
)
|
$
|
130,184
|
|
$
|
(31,347
|
)
|
|||
The unrealized losses presented above are principally due to a general widening of credit spreads from the dates of acquisition to
December 31, 2012
and
2011
, as applicable. As of
December 31, 2012
, all of the investment securities in an unrealized loss position had credit ratings of at least "AA+" except
one
that was rated "
A-
". As of
December 31, 2011
, all of the investment securities in an unrealized loss position had credit ratings of at least "A" except
one
that was rated "
A-
" and
two
that were rated "
BBB+
". The unrealized losses were on
17
and
44
individual investment securities, as of
December 31, 2012
and
2011
, respectively.
As of
December 31, 2012
,
9
of the securities in loss positions had been in loss positions for more than 12 months and had a total unrealized loss of
$23.5 million
. As of
December 31, 2011
,
10
of the securities in loss positions had been in loss positions for more than 12 months and had a total unrealized loss of
$31.3 million
. The unrealized losses on those securities are principally due to a general widening of credit spreads from the dates of acquisition. Securities in unrealized loss positions 12 months or more have a fair value as of
December 31, 2012
that is, on average, approximately
84.2 percent
of their amortized cost basis. Farmer Mac believes that all of these unrealized losses are recoverable within a reasonable period of time by way of changes in credit spreads or maturity. Accordingly, Farmer Mac has concluded that none of the unrealized losses on these available-for-sale investment securities represent other-than-temporary impairment as of
December 31, 2012
and
December 31, 2011
. Farmer Mac does not intend to sell these securities and it is not more likely than not that Farmer Mac will be required to sell the securities before recovery of the amortized cost basis.
Farmer Mac did not own any held-to-maturity investment securities as of
December 31, 2012
and
2011
. As of
December 31, 2012
, Farmer Mac owned trading investment securities with an amortized cost of
$4.3 million
, a fair value of
$1.2 million
, and a weighted average yield of
4.29 percent
. As of
December 31, 2011
, Farmer Mac owned trading investment securities with an amortized cost of
$5.1 million
, a fair value of
$1.8 million
, and a weighted average yield of
4.36 percent
.
143
The amortized cost, fair value and weighted average yield of available-for-sale investment securities by remaining contractual maturity as of
December 31, 2012
are set forth below. Asset-backed and mortgage-backed securities are included based on their final maturities, although the actual maturities may differ due to prepayments of the underlying assets.
|
Investment Securities Available-for-Sale as of
|
|||||||||
|
December 31, 2012
|
|||||||||
|
Amortized
Cost |
Fair Value
|
Weighted-
Average Yield |
|||||||
|
|
(dollars in thousands)
|
||||||||
|
Due within one year
|
$
|
1,209,076
|
|
$
|
1,209,406
|
|
0.64%
|
||
|
Due after one year through five years
|
241,788
|
|
242,617
|
|
1.06%
|
||||
|
Due after five years through ten years
|
416,087
|
|
406,333
|
|
1.06%
|
||||
|
Due after ten years
|
637,173
|
|
640,026
|
|
2.59%
|
||||
|
Total
|
$
|
2,504,124
|
|
$
|
2,498,382
|
|
1.24%
|
||
144
|
5.
|
FARMER MAC GUARANTEED SECURITIES AND USDA GUARANTEED SECURITIES
|
The following tables set forth information about on-balance sheet Farmer Mac Guaranteed Securities and USDA Guaranteed Securities as of
December 31, 2012
and
2011
:
|
|
December 31, 2012
|
||||||||||||||||||||||
|
Unpaid Principal Balance
|
Unamortized Premium/(Discount)
|
Amortized
Cost |
Unrealized
Gains |
Unrealized
Losses |
Fair Value
|
||||||||||||||||||
|
|
(in thousands)
|
||||||||||||||||||||||
|
Available-for-sale:
|
|
|
|
|
|||||||||||||||||||
|
Farmer Mac I
|
$
|
3,339,200
|
|
$
|
160
|
|
$
|
3,339,360
|
|
$
|
92,223
|
|
$
|
(5,094
|
)
|
$
|
3,426,489
|
|
|||||
|
Farmer Mac II
|
26,238
|
|
(452
|
)
|
25,786
|
|
909
|
|
(14
|
)
|
26,681
|
|
|||||||||||
|
Rural Utilities
|
1,298,506
|
|
—
|
|
1,298,506
|
|
18,530
|
|
(3,948
|
)
|
1,313,088
|
|
|||||||||||
|
USDA Guaranteed Securities
|
1,461,184
|
|
5,975
|
|
1,467,159
|
|
19,605
|
|
(169
|
)
|
1,486,595
|
|
|||||||||||
|
Total available-for-sale
|
6,125,128
|
|
5,683
|
|
6,130,811
|
|
131,267
|
|
(9,225
|
)
|
6,252,853
|
|
|||||||||||
|
Trading:
|
|
|
|
|
|
|
|
|
|||||||||||||||
|
USDA Guaranteed Securities
|
98,499
|
|
6,415
|
|
104,914
|
|
624
|
|
(1,350
|
)
|
104,188
|
|
|||||||||||
|
Total Farmer Mac Guaranteed Securities and USDA Guaranteed Securities
|
$
|
6,223,627
|
|
$
|
12,098
|
|
$
|
6,235,725
|
|
$
|
131,891
|
|
$
|
(10,575
|
)
|
$
|
6,357,041
|
|
|||||
|
|
December 31, 2011
|
||||||||||||||||||||||
|
Unpaid Principal Balance
|
Unamortized Premium/(Discount)
|
Amortized
Cost |
Unrealized
Gains |
Unrealized
Losses |
Fair Value
|
||||||||||||||||||
|
|
(in thousands)
|
||||||||||||||||||||||
|
Available-for-sale:
|
|
|
|
|
|||||||||||||||||||
|
Farmer Mac I
|
$
|
2,730,000
|
|
$
|
11,192
|
|
$
|
2,741,192
|
|
$
|
67,895
|
|
$
|
(1,460
|
)
|
$
|
2,807,627
|
|
|||||
|
Farmer Mac II
|
35,410
|
|
(718
|
)
|
34,692
|
|
924
|
|
(17
|
)
|
35,599
|
|
|||||||||||
|
Rural Utilities
|
1,410,800
|
|
—
|
|
1,410,800
|
|
35,246
|
|
—
|
|
1,446,046
|
|
|||||||||||
|
USDA Guaranteed Securities
|
1,235,486
|
|
9,033
|
|
1,244,519
|
|
35,149
|
|
(122
|
)
|
1,279,546
|
|
|||||||||||
|
Total available-for-sale
|
5,411,696
|
|
19,507
|
|
5,431,203
|
|
139,214
|
|
(1,599
|
)
|
5,568,818
|
|
|||||||||||
|
Trading:
|
|
|
|
|
|
|
|
|
|||||||||||||||
|
USDA Guaranteed Securities
|
200,193
|
|
12,937
|
|
213,130
|
|
1,804
|
|
(2,575
|
)
|
212,359
|
|
|||||||||||
|
Total Farmer Mac Guaranteed Securities and USDA Guaranteed Securities
|
$
|
5,611,889
|
|
$
|
32,444
|
|
$
|
5,644,333
|
|
$
|
141,018
|
|
$
|
(4,174
|
)
|
$
|
5,781,177
|
|
|||||
The unrealized losses presented above are principally due to higher interest rates and wider spreads on mortgage securities from the date of acquisition to
December 31, 2012
and
2011
, as applicable. The unrealized losses presented above related to Farmer Mac II Guaranteed Securities, are USDA-guaranteed portions of loans backed by the full faith and credit of the United States. None of the Farmer Mac I or Rural Utilities Guaranteed Securities has been in an unrealized loss position for greater than 12 months. Farmer Mac has concluded that none of the unrealized losses on its available-for-sale Farmer Mac Guaranteed Securities and USDA Guaranteed Securities represents an other-than-temporary impairment as of
December 31, 2012
and
2011
. Farmer Mac does not intend to sell these securities and it is not more likely than not that Farmer Mac will be required to sell the securities before recovery of the amortized cost basis.
During
2012
,
2011
, and 2010, Farmer Mac realized no gains or losses from the sale of Farmer Mac Guaranteed Securities and USDA Guaranteed Securities.
145
The amortized cost, fair value and weighted average yield of available-for-sale Farmer Mac Guaranteed Securities and USDA Guaranteed Securities by remaining contractual maturity as of
December 31, 2012
are set forth below. The balances presented are based on their final maturities, although the actual maturities may differ due to prepayments of the underlying assets.
|
Farmer Mac Guaranteed Securities and USDA Guaranteed Securities Available-for-Sale as of December 31, 2012
|
||||||||||
|
Amortized
Cost |
Fair Value
|
Weighted-
Average Yield |
||||||||
|
|
(dollars in thousands)
|
|||||||||
|
Due within one year
|
$
|
667,361
|
|
$
|
672,873
|
|
1.55
|
%
|
||
|
Due after one year through five years
|
3,324,755
|
|
3,413,898
|
|
2.42
|
%
|
||||
|
Due after five years through ten years
|
716,633
|
|
730,175
|
|
2.71
|
%
|
||||
|
Due after ten years
|
1,422,062
|
|
1,435,907
|
|
3.18
|
%
|
||||
|
Total
|
$
|
6,130,811
|
|
$
|
6,252,853
|
|
2.54
|
%
|
||
Farmer Mac did not own any held-to-maturity Farmer Mac Guaranteed and USDA Guaranteed Securities as of
December 31, 2012
and
2011
. As of
December 31, 2012
, Farmer Mac owned trading USDA Guaranteed Securities with an amortized cost of
$104.9 million
, a fair value of
$104.2 million
, and a weighted average yield of
5.77 percent
. As of
December 31, 2011
, Farmer Mac owned trading USDA Guaranteed Securities with an amortized cost of
$213.1 million
, a fair value of
$212.4 million
, and a weighted average yield of
5.83 percent
.
|
6.
|
FINANCIAL DERIVATIVES
|
Farmer Mac enters into financial derivative transactions principally to protect against risk from the effects of market price or interest rate movements on the value of certain assets, future cash flows or debt issuance, not for trading or speculative purposes. Farmer Mac enters into interest rate swap contracts to adjust the characteristics of its short-term debt to match more closely the cash flow and duration characteristics of its longer-term loans and other assets, and also to adjust the characteristics of its long-term debt to match more closely the cash flow and duration characteristics of its short-term assets, thereby reducing interest rate risk and often times deriving an overall lower effective cost of borrowing than would otherwise be available to Farmer Mac in the conventional debt market. Certain financial derivatives are designated as fair value hedges of fixed rate assets classified as available-for-sale to protect against fair value changes in the assets related to a benchmark interest rate (i.e., LIBOR).
Farmer Mac manages the interest rate risk related to loans it has committed to acquire, but has not yet purchased and permanently funded, through the use of forward sale contracts on the debt of other GSEs and futures contracts involving U.S. Treasury securities. Farmer Mac uses forward sale contracts on GSE securities to reduce its interest rate exposure to changes in both U.S. Treasury rates and spreads on Farmer Mac debt. The notional amounts of these contracts are determined based on a duration-matched hedge ratio between the hedged item and the hedge instrument. Gains or losses generated by these hedge transactions are expected to offset changes in funding costs.
All financial derivatives are recorded on the balance sheet at fair value as a freestanding asset or liability. Changes in the fair values of financial derivatives are reported in "
Losses on financial derivatives and
146
hedging activities
" in the
consolidated statements of operations
. For financial derivatives designated in fair value hedging relationships, changes in the fair values of the hedged items related to the risk being hedged are also reported in "
Losses on financial derivatives and hedging activities
" in the
consolidated statements of operations
. Farmer Mac currently has no financial derivatives designated in cash flow hedging relationships.
Market Risk
:
Market risk is the risk of an adverse effect resulting from changes in interest rates or spreads on the value of a financial instrument. Farmer Mac manages market risk associated with financial derivatives by establishing and monitoring limits as to the degree of risk that may be undertaken. This risk is periodically measured as part of Farmer Mac's overall risk monitoring processes, which include market value of equity measurements, net interest income modeling and other measures.
Credit Risk
:
Credit risk is the risk that a counterparty will fail to perform according to the terms of a financial contract in which Farmer Mac has an unrealized gain. Credit losses could occur in the event of non-performance by counterparties to the financial derivative contracts. Farmer Mac mitigates this counterparty credit risk by contracting only with counterparties that have investment grade credit ratings (i.e., at least BBB), establishing and maintaining collateral requirements based upon credit ratings and entering into netting agreements. Netting agreements provide for the calculation of the net amount of all receivables and payables under all transactions covered by the netting agreement between Farmer Mac and a single counterparty. Farmer Mac's exposure to credit risk related to its financial derivatives is represented by those counterparties for which Farmer Mac has a net receivable, including the effect of any netting arrangements. As of
December 31, 2012
and
2011
, Farmer Mac's credit exposure to interest rate swap counterparties, excluding netting arrangements, was
$37.1 million
and
$46.6 million
, respectively; however, including netting arrangements, Farmer Mac's credit exposure was
$2.4 million
and
$4.6 million
as of
December 31, 2012
and
2011
, respectively. As of December 31, 2012 and 2011, there were no financial derivatives in a net payable position where Farmer Mac was required to pledge collateral which the counterparty had the right to sell or repledge the collateral.
In the normal course of business, collateral requirements contained in Farmer Mac's derivative contracts are enforced by Farmer Mac and its counterparties. Upon enforcement of the collateral requirements, the amount of collateral posted is typically based on the net fair value of all derivative contracts with the counterparty, i.e., derivative assets net of derivative liabilities at the counterparty level. If an event of default were to occur with respect to Farmer Mac under the derivative contracts, such as the failure to pay amounts when due, any other material breach of the agreements that remains unremedied, a material default under another of Farmer Mac's credit agreements, or bankruptcy, insolvency or receivership, the related counterparty could request payment or full collateralization on the derivative contracts. In addition, if Farmer Mac ceases to be a federally chartered instrumentality of the United States, the related counterparty could request full collateralization on the derivative contracts. As of
December 31, 2012
, the fair value of Farmer Mac's derivatives in a net liability position at the counterparty level, which includes accrued interest but excludes any adjustment for nonperformance risk, was
$135.8 million
. As of
December 31, 2012
, Farmer Mac posted cash of
$60.3 million
as collateral for its derivatives in net liability positions. Farmer Mac records posted cash as a reduction in the outstanding balance of cash and cash equivalents and an increase in the balance of prepaid expenses and other assets. If Farmer Mac had
147
breached certain provisions of the derivative contracts as of
December 31, 2012
, it could have been required to settle its obligations under the agreements or post additional collateral of
$75.5 million
.
Interest Rate Risk
:
Farmer Mac uses financial derivatives to manage its interest rate risk exposure by effectively modifying the interest rate reset or maturity characteristics of certain assets and liabilities and by locking in the rates for certain forecasted issuances of liabilities. The primary financial derivatives Farmer Mac uses include interest rate swaps and forward sale contracts. Farmer Mac uses interest rate swaps to assume fixed rate interest payments in exchange for floating rate interest payments and vice versa. Depending on the economic hedging relationship, the effects of these agreements are (a) the conversion of variable rate liabilities to longer-term fixed rate liabilities, (b) the conversion of long-term fixed rate assets to shorter-term floating rate assets, or (c) the reduction of the variability of future changes in interest rates on forecasted issuances of liabilities. The accrual of the contractual amounts due on these agreements that are not designated in hedging relationships is recorded as "
Losses on financial derivatives and hedging activities
" in the consolidated statements of operations.
148
The following tables summarize information related to Farmer Mac's financial derivatives as of
December 31, 2012
and
2011
and the effects of financial derivatives on the
consolidated statements of operations
for the years ended
December 31, 2012
,
2011
, and
2010
:
|
|
December 31, 2012
|
||||||||||||||||||||
|
|
|
Fair Value
|
Weighted-
Average Pay Rate |
Weighted-
Average Receive Rate |
Weighted-
Average Forward Price |
Weighted-
Average Remaining Life (in years) |
|||||||||||||||
|
|
Notional Amount
|
Asset
|
(Liability)
|
||||||||||||||||||
|
|
(dollars in thousands)
|
||||||||||||||||||||
|
Fair value hedges:
|
|||||||||||||||||||||
|
Interest rate swaps:
|
|||||||||||||||||||||
|
Pay fixed non-callable
|
$
|
950,000
|
|
$
|
—
|
|
$
|
(58,758
|
)
|
2.20%
|
0.31%
|
4.07
|
|
||||||||
|
No hedge designation:
|
|||||||||||||||||||||
|
Interest rate swaps:
|
|||||||||||||||||||||
|
Pay fixed non-callable
|
805,622
|
|
357
|
|
(91,205
|
)
|
4.83%
|
0.32%
|
4.14
|
|
|||||||||||
|
Receive fixed non-callable
|
4,135,149
|
|
30,338
|
|
(211
|
)
|
0.33%
|
0.85%
|
0.74
|
|
|||||||||||
|
Receive fixed callable
|
245,000
|
|
6
|
|
(238
|
)
|
0.15%
|
0.55%
|
3.89
|
|
|||||||||||
|
Basis swaps
|
609,262
|
|
499
|
|
(784
|
)
|
0.43%
|
0.36%
|
1.29
|
|
|||||||||||
|
Agency forwards
|
59,035
|
|
—
|
|
(58
|
)
|
101.22
|
|
|||||||||||||
|
Treasury futures
|
11,200
|
|
—
|
|
(12
|
)
|
129.77
|
|
|||||||||||||
|
Credit valuation adjustment
|
(27
|
)
|
584
|
|
|
|
|
|
|||||||||||||
|
Total financial derivatives
|
$
|
6,815,268
|
|
$
|
31,173
|
|
$
|
(150,682
|
)
|
|
|
|
|
||||||||
|
|
December 31, 2011
|
||||||||||||||||||
|
|
Fair Value
|
Weighted-
Average Pay Rate |
Weighted-
Average Receive Rate |
Weighted-
Average Remaining Life (in years) |
|||||||||||||||
|
|
Notional Amount
|
Asset
|
(Liability)
|
||||||||||||||||
|
|
(dollars in thousands)
|
||||||||||||||||||
|
No hedge designation:
|
|||||||||||||||||||
|
Interest rate swaps:
|
|
|
|
|
|
|
|||||||||||||
|
Pay fixed non-callable
|
$
|
1,906,123
|
|
$
|
—
|
|
$
|
(157,520
|
)
|
3.65
|
%
|
0.46
|
%
|
4.48
|
|||||
|
Receive fixed non-callable
|
4,212,713
|
|
41,006
|
|
(1,302
|
)
|
0.41
|
%
|
0.96
|
%
|
0.97
|
||||||||
|
Basis swaps
|
457,694
|
|
—
|
|
(2,137
|
)
|
0.80
|
%
|
0.38
|
%
|
1.30
|
||||||||
|
Credit default swaps
|
10,000
|
|
17
|
|
—
|
|
1.00
|
%
|
—
|
|
0.72
|
||||||||
|
Credit valuation adjustment
|
(773
|
)
|
935
|
|
|
|
|
|
|
||||||||||
|
Total financial derivatives
|
$
|
6,586,530
|
|
$
|
40,250
|
|
$
|
(160,024
|
)
|
|
|
|
|
|
|||||
149
|
|
Losses on Financial Derivatives and Hedging Activities
|
||||||||||
|
|
For the Year Ended December 31,
|
||||||||||
|
|
2012
|
2011
|
2010
|
||||||||
|
|
(in thousands)
|
||||||||||
|
Fair value hedges:
|
|||||||||||
|
Interest rate swaps
|
$
|
(404
|
)
|
$
|
—
|
|
$
|
—
|
|
||
|
Hedged items
|
6,388
|
|
—
|
|
—
|
|
|||||
|
Gains on hedging activities (1)
|
5,984
|
|
—
|
|
—
|
|
|||||
|
No hedge designation:
|
|||||||||||
|
Interest rate swaps
|
(24,763
|
)
|
(86,402
|
)
|
(13,071
|
)
|
|||||
|
Agency forwards
|
(828
|
)
|
(5,710
|
)
|
(3,246
|
)
|
|||||
|
Treasury futures
|
(129
|
)
|
(513
|
)
|
(465
|
)
|
|||||
|
Credit default swaps
|
(93
|
)
|
(20
|
)
|
(307
|
)
|
|||||
|
Losses on financial derivatives not designated in hedging relationships
|
(25,813
|
)
|
(92,645
|
)
|
(17,089
|
)
|
|||||
|
Amortization of derivatives transition adjustment
|
—
|
|
—
|
|
(70
|
)
|
|||||
|
Losses on financial derivatives and hedging activities
|
$
|
(19,829
|
)
|
$
|
(92,645
|
)
|
$
|
(17,159
|
)
|
||
(1) Includes gains of
$5.9 million
that are excluded from the assessment of hedge effectiveness as they relate to the amortization of the fair value of the hedged items prior to hedge inception, and gains of
$0.1 million
due to hedge ineffectiveness for the year ended
December 31, 2012
.
As of December 31, 2010, Farmer Mac had reclassified all of the net after-tax unrealized gains and losses on financial derivatives included in accumulated other comprehensive income related to the financial derivatives transition adjustment into earnings.
As of
December 31, 2012
, Farmer Mac had outstanding basis swaps with Zions First National Bank, a related party, with a total notional amount of
$49.3 million
and a fair value of
$(0.7) million
, compared to
$72.7 million
and
$(1.3) million
, respectively, as of
December 31, 2011
. Under the terms of those basis swaps, Farmer Mac pays Constant Maturity Treasury-based rates and receives LIBOR. Those swaps hedge most of the interest rate basis risk related to loans Farmer Mac purchases that pay a Constant Maturity Treasury based-rate and the discount notes Farmer Mac issues to fund the loan purchases. The pricing of discount notes is closely correlated to LIBOR rates. Farmer Mac recorded unrealized gains on those outstanding basis swaps for the years ended
December 31, 2012
, 2011, and 2010 of
$0.6 million
,
$2.1 million
, and
$0.3 million
, respectively.
150
|
7.
|
NOTES PAYABLE
|
Farmer Mac's borrowings consist of discount notes and medium-term notes, both of which are unsecured general obligations of the Corporation. Discount notes generally have original maturities of
one
year or less, whereas medium-term notes generally have maturities of
six
months to
15
years.
The following tables set forth information related to Farmer Mac's borrowings as of
December 31, 2012
and
2011
:
|
|
December 31, 2012
|
||||||||||||
|
Outstanding as of December 31
|
Average Outstanding During the Year
|
||||||||||||
|
|
Amount
|
Rate
|
Amount
|
Rate
|
|||||||||
|
|
(dollars in thousands)
|
||||||||||||
|
Due within one year:
|
|
|
|
|
|||||||||
|
Discount notes
|
$
|
4,966,010
|
|
0.16
|
%
|
$
|
5,181,559
|
|
0.18
|
%
|
|||
|
Medium-term notes
|
194,989
|
|
0.15
|
%
|
84,961
|
|
0.20
|
%
|
|||||
|
Current portion of long-term notes
|
1,406,367
|
|
0.80
|
%
|
|
|
|
|
|||||
|
Total due within one year
|
$
|
6,567,366
|
|
0.30
|
%
|
|
|
|
|
||||
|
Due after one year:
|
|
|
|
|
|
|
|
|
|||||
|
Medium-term notes due in:
|
|
|
|
|
|
|
|
|
|||||
|
2014
|
$
|
1,679,364
|
|
2.36
|
%
|
|
|
|
|
||||
|
2015
|
1,128,413
|
|
1.40
|
%
|
|
|
|
|
|||||
|
2016
|
863,799
|
|
1.74
|
%
|
|
|
|
|
|||||
|
2017
|
616,187
|
|
1.19
|
%
|
|||||||||
|
Thereafter
|
746,976
|
|
2.97
|
%
|
|
|
|
|
|||||
|
Total due after one year
|
5,034,739
|
|
1.99
|
%
|
|
|
|
|
|||||
|
Total
|
$
|
11,602,105
|
|
1.03
|
%
|
|
|
|
|
||||
|
|
December 31, 2011
|
||||||||||||
|
Outstanding as of December 31
|
Average Outstanding During the Year
|
||||||||||||
|
|
Amount
|
Rate
|
Amount
|
Rate
|
|||||||||
|
|
(dollars in thousands)
|
||||||||||||
|
Due within one year:
|
|
|
|
|
|||||||||
|
Discount notes
|
$
|
5,129,978
|
|
0.14
|
%
|
$
|
4,102,109
|
|
0.22
|
%
|
|||
|
Medium-term notes
|
45,000
|
|
0.17
|
%
|
130,009
|
|
0.30
|
%
|
|||||
|
Current portion of long-term notes
|
912,901
|
|
1.40
|
%
|
|
|
|
|
|||||
|
|
$
|
6,087,879
|
|
0.33
|
%
|
|
|
|
|
||||
|
Due after one year:
|
|
|
|
|
|
|
|
|
|||||
|
Medium-term notes due in:
|
|
|
|
|
|
|
|
|
|||||
|
2013
|
$
|
937,690
|
|
1.11
|
%
|
|
|
|
|
||||
|
2014
|
1,277,938
|
|
3.09
|
%
|
|
|
|
|
|||||
|
2015
|
632,905
|
|
2.21
|
%
|
|
|
|
|
|||||
|
2016
|
760,772
|
|
2.10
|
%
|
|
|
|
|
|||||
|
Thereafter
|
495,577
|
|
3.84
|
%
|
|
|
|
|
|||||
|
Total due after one year
|
4,104,882
|
|
2.41
|
%
|
|
|
|
|
|||||
|
Total
|
$
|
10,192,761
|
|
1.17
|
%
|
|
|
|
|
||||
151
The maximum amount of Farmer Mac's discount notes outstanding at any month end during each of the years ended
December 31, 2012
and
2011
was
$5.7 billion
and
$5.1 billion
, respectively.
Callable medium-term notes give Farmer Mac the option to redeem the debt at par value on a specified call date or at any time on or after a specified call date. The following table summarizes by maturity date, the amounts and costs for Farmer Mac debt callable in
2013
as of
December 31, 2012
:
|
Debt Callable in 2013 as of December 31, 2012
|
|||||||
|
Maturity
|
Amount
|
Rate
|
|||||
|
(dollars in thousands)
|
|||||||
|
2014
|
$
|
63,977
|
|
0.29
|
%
|
||
|
2015
|
206,820
|
|
0.48
|
%
|
|||
|
2016
|
33,970
|
|
0.59
|
%
|
|||
|
2017
|
256,798
|
|
0.91
|
%
|
|||
|
Thereafter
|
169,533
|
|
2.46
|
%
|
|||
|
|
$
|
731,098
|
|
1.08
|
%
|
||
The following schedule summarizes the earliest interest rate reset date of total borrowings outstanding as of
December 31, 2012
, including callable and non-callable medium-term notes, assuming callable notes are redeemed at the initial call date:
|
Earliest Interest Rate Reset Date of Borrowings Outstanding
|
|||||
|
Amount
|
Weighted-Average Rate
|
||||
|
|
(dollars in thousands)
|
||||
|
Debt with interest rate resets in:
|
|
|
|||
|
2013
|
$
|
7,568,453
|
|
0.38%
|
|
|
2014
|
1,520,397
|
|
2.58%
|
||
|
2015
|
746,592
|
|
1.90%
|
||
|
2016
|
829,829
|
|
1.78%
|
||
|
2017
|
359,389
|
|
1.40%
|
||
|
Thereafter
|
577,445
|
|
3.11%
|
||
|
Total
|
$
|
11,602,105
|
|
1.03%
|
|
During
2012
and
2011
, Farmer Mac called
$0.8 billion
and
$0.7 billion
of callable medium-term notes, respectively.
Authority to Borrow from the U.S. Treasury
Farmer Mac's statutory charter authorizes it to borrow up to
$1.5 billion
from the U.S. Treasury through the issuance of debt obligations to the U.S. Treasury. Any funds borrowed from the U.S. Treasury may be used solely for the purpose of fulfilling Farmer Mac's guarantee obligations. Any debt obligations issued by Farmer Mac under this authority would bear interest at a rate determined by the U.S. Treasury, taking into consideration the average rate on outstanding marketable obligations of the United States as of the last day of the last calendar month ending before the date of the purchase of the obligations from Farmer Mac. The charter requires Farmer Mac to repurchase any of its debt obligations held by the U.S. Treasury within a reasonable time. As of
December 31, 2012
, Farmer Mac had not utilized this borrowing authority and does not expect to utilize this borrowing authority in the future.
152
Gains and Losses on the Repurchase of Outstanding Debt
Farmer Mac did not repurchase any of its outstanding debt in 2012, 2011, or 2010.
|
8.
|
LOANS AND ALLOWANCE FOR LOSSES
|
Loans
Farmer Mac classifies loans as either held for investment or held for sale. Loans held for investment are recorded at the unpaid principal balance, net of unamortized premium or discount and other cost adjustments. Loans held for sale are reported at the lower of cost or fair value determined on a pooled basis. The following table displays the composition of the loan balances as of December 31, 2012 and 2011:
|
As of December 31,
|
|||||||||||||||||||||||
|
2012
|
2011
|
||||||||||||||||||||||
|
Unsecuritized
|
In Consolidated Trusts
|
Total
|
Unsecuritized
|
In Consolidated Trusts
|
Total
|
||||||||||||||||||
|
(in thousands)
|
|||||||||||||||||||||||
|
Farm & Ranch
|
$
|
1,519,415
|
|
$
|
160,436
|
|
$
|
1,679,851
|
|
$
|
1,251,370
|
|
$
|
696,735
|
|
$
|
1,948,105
|
|
|||||
|
Rural Utilities
|
663,097
|
|
368,848
|
|
1,031,945
|
|
529,227
|
|
386,800
|
|
916,027
|
|
|||||||||||
|
Total unpaid principal balance (1)
|
2,182,512
|
|
529,284
|
|
2,711,796
|
|
1,780,597
|
|
1,083,535
|
|
2,864,132
|
|
|||||||||||
|
Unamortized premiums, discounts and other cost basis adjustments
|
981
|
|
34,291
|
|
35,272
|
|
2,161
|
|
38,024
|
|
40,185
|
|
|||||||||||
|
Lower of cost or fair value adjustment on loans held for sale
|
(5,943
|
)
|
—
|
|
(5,943
|
)
|
—
|
|
—
|
|
—
|
|
|||||||||||
|
Total loans
|
$
|
2,177,550
|
|
$
|
563,575
|
|
$
|
2,741,125
|
|
$
|
1,782,758
|
|
$
|
1,121,559
|
|
$
|
2,904,317
|
|
|||||
|
Loans held for investment, at amortized cost
|
$
|
1,503,559
|
|
$
|
563,575
|
|
$
|
2,067,134
|
|
$
|
1,241,311
|
|
$
|
1,121,559
|
|
$
|
2,362,870
|
|
|||||
|
Loans held for sale, at lower of cost or fair value
|
673,991
|
|
—
|
|
673,991
|
|
541,447
|
|
—
|
|
541,447
|
|
|||||||||||
|
Total loans
|
2,177,550
|
|
563,575
|
|
2,741,125
|
|
1,782,758
|
|
1,121,559
|
|
2,904,317
|
|
|||||||||||
|
Allowance for loan losses
|
(10,986
|
)
|
(365
|
)
|
(11,351
|
)
|
(9,421
|
)
|
(740
|
)
|
(10,161
|
)
|
|||||||||||
|
Total loans, net of allowance
|
$
|
2,166,564
|
|
$
|
563,210
|
|
$
|
2,729,774
|
|
$
|
1,773,337
|
|
$
|
1,120,819
|
|
$
|
2,894,156
|
|
|||||
(1) Unpaid principal balance is the basis of presentation in disclosures of outstanding balances for Farmer Mac's lines of business. See "Business—Farmer Mac Lines of Business"
Allowance for Losses
Farmer Mac maintains an allowance for losses to cover estimated probable losses on loans held and loans underlying LTSPCs and Farmer Mac Guaranteed Securities. As of
December 31, 2012
and
December 31, 2011
, Farmer Mac recorded allowances for losses of
$16.9 million
and
$17.5 million
, respectively. No allowance for losses has been provided for the USDA Guarantees and Rural Utilities programs and Farmer Mac I AgVantage securities as of
December 31, 2012
or
December 31, 2011
. See Note 2(j), Note 5 and Note 12 for more information about Farmer Mac Guaranteed Securities. Farmer Mac's allowance for losses is presented in two components on its consolidated balance sheets:
153
|
•
|
an "Allowance for loan losses" on loans held; and
|
|
•
|
a "Reserve for losses" on loans underlying LTSPCs and Farmer Mac Guaranteed Securities.
|
The following is a summary of the changes in the allowance for losses for each year in the three-year period ended
December 31, 2012
:
|
Allowance
for Loan Losses |
Reserve
for Losses |
Total
Allowance for Losses |
|||||||||
|
|
(in thousands)
|
||||||||||
|
Balance as of January 1, 2010
|
$
|
6,292
|
|
$
|
7,895
|
|
$
|
14,187
|
|
||
|
Provision for losses
|
1,893
|
|
2,417
|
|
4,310
|
|
|||||
|
Charge-offs
|
(605
|
)
|
—
|
|
(605
|
)
|
|||||
|
Recoveries
|
2,223
|
|
—
|
|
2,223
|
|
|||||
|
Balance as of December 31, 2010
|
$
|
9,803
|
|
$
|
10,312
|
|
$
|
20,115
|
|
||
|
Provision for/(release of) losses
|
610
|
|
(2,957
|
)
|
(2,347
|
)
|
|||||
|
Charge-offs
|
(252
|
)
|
—
|
|
(252
|
)
|
|||||
|
Balance as of December 31, 2011
|
$
|
10,161
|
|
$
|
7,355
|
|
$
|
17,516
|
|
||
|
Provision for/(release of) losses
|
3,691
|
|
(1,816
|
)
|
1,875
|
|
|||||
|
Charge-offs
|
(2,501
|
)
|
—
|
|
(2,501
|
)
|
|||||
|
Balance as of December 31, 2012
|
$
|
11,351
|
|
$
|
5,539
|
|
$
|
16,890
|
|
||
During 2012, Farmer Mac recorded provisions to its allowance for loan losses of
$3.7 million
and releases from its reserve for losses of
$1.8 million
. In fourth quarter 2012, Farmer Mac purchased one defaulted ethanol loan pursuant to the terms of an LTSPC agreement. This resulted in the reclassification of a specific allowance of $3.2 million from the reserve for losses to the allowance for loan losses. The provision for/(release of) losses for 2012 reflects this reclassification as well as an increase in the specific allowance for this loan during 2012 prior to purchase. Farmer Mac also recorded charge-offs of
$2.5 million
to its allowance for loan losses during 2012.
During 2011, Farmer Mac recorded provisions to its allowance for loan losses of
$0.6 million
and releases from its reserve for losses of
$3.0 million
. In 2011, Farmer Mac purchased two defaulted loans pursuant to the terms of an LTSPC agreement. This resulted in the reclassification of
$1.8 million
of specific allowance, which had been recorded in 2010, from the reserve for losses to allowance for loan losses. The provision for/(release of) losses for 2011 reflects this reclassification as well as the decline in the estimated probable losses related to Farmer Mac's exposure to the ethanol and dairy industries. Farmer Mac also recorded charge-offs of
$0.3 million
to its allowance for loan losses during 2011.
During 2010, Farmer Mac recorded provisions to its allowance for loan losses and its reserve for losses of
$1.9 million
and
$2.4 million
, respectively. These amounts include the reclassification of
$2.0 million
from the reserve for losses to the allowance for loan losses upon adoption of new consolidation guidance in first quarter 2010. Farmer Mac also recorded charge-offs of
$0.6 million
and recoveries of
$2.2 million
to its allowance for loan losses during 2010.
154
The following tables present the changes in the allowance for losses for the year ended
December 31, 2012
and 2011 by commodity type:
|
For the Year Ended December 31, 2012
|
|||||||||||||||||||||||||||
|
Crops
|
Permanent
Plantings |
Livestock
|
Part-time
Farm |
Ag. Storage and
Processing (including ethanol facilities) |
Other
|
Total
|
|||||||||||||||||||||
|
(in thousands)
|
|||||||||||||||||||||||||||
|
Beginning Balance
|
$
|
4,133
|
|
$
|
3,099
|
|
$
|
1,697
|
|
$
|
477
|
|
$
|
8,106
|
|
$
|
4
|
|
$
|
17,516
|
|
||||||
|
Provision for/(release of) losses
|
509
|
|
(408
|
)
|
(163
|
)
|
380
|
|
1,555
|
|
2
|
|
1,875
|
|
|||||||||||||
|
Charge-offs
|
(2,053
|
)
|
(375
|
)
|
—
|
|
(73
|
)
|
—
|
|
—
|
|
(2,501
|
)
|
|||||||||||||
|
Ending Balance
|
$
|
2,589
|
|
$
|
2,316
|
|
$
|
1,534
|
|
$
|
784
|
|
$
|
9,661
|
|
$
|
6
|
|
$
|
16,890
|
|
||||||
|
For the Year Ended December 31, 2011
|
|||||||||||||||||||||||||||
|
Crops
|
Permanent
Plantings |
Livestock
|
Part-time
Farm |
Ag. Storage and
Processing (including ethanol facilities) |
Other
|
Total
|
|||||||||||||||||||||
|
(in thousands)
|
|||||||||||||||||||||||||||
|
Beginning Balance
|
$
|
3,572
|
|
$
|
3,537
|
|
$
|
2,749
|
|
$
|
445
|
|
$
|
9,797
|
|
$
|
15
|
|
$
|
20,115
|
|
||||||
|
Provision for/(release of) losses
|
737
|
|
(431
|
)
|
(988
|
)
|
37
|
|
(1,691
|
)
|
(11
|
)
|
(2,347
|
)
|
|||||||||||||
|
Charge-offs
|
(176
|
)
|
(7
|
)
|
(64
|
)
|
(5
|
)
|
—
|
|
—
|
|
(252
|
)
|
|||||||||||||
|
Ending Balance
|
$
|
4,133
|
|
$
|
3,099
|
|
$
|
1,697
|
|
$
|
477
|
|
$
|
8,106
|
|
$
|
4
|
|
$
|
17,516
|
|
||||||
155
The following tables present the ending balances of loans held and loans underlying LTSPCs and Farmer Mac Guaranteed Securities and the related allowance for losses by impairment method and commodity type as of
December 31, 2012
and
2011
:
|
|
As of December 31, 2012
|
||||||||||||||||||||||||||
|
Crops
|
Permanent
Plantings |
Livestock
|
Part-time
Farm |
Ag. Storage and
Processing (including ethanol facilities) |
Other
|
Total
|
|||||||||||||||||||||
|
|
(in thousands)
|
||||||||||||||||||||||||||
|
Ending Balance:
|
|
|
|
|
|
|
|
||||||||||||||||||||
|
Collectively evaluated for impairment:
|
|||||||||||||||||||||||||||
|
On-balance sheet
|
$
|
977,564
|
|
$
|
260,047
|
|
$
|
268,869
|
|
$
|
50,287
|
|
$
|
42,812
|
|
$
|
—
|
|
$
|
1,599,579
|
|
||||||
|
Off-balance sheet
|
1,169,710
|
|
584,880
|
|
1,002,164
|
|
136,482
|
|
144,637
|
|
11,000
|
|
3,048,873
|
|
|||||||||||||
|
Total
|
$
|
2,147,274
|
|
$
|
844,927
|
|
$
|
1,271,033
|
|
$
|
186,769
|
|
$
|
187,449
|
|
$
|
11,000
|
|
$
|
4,648,452
|
|
||||||
|
Individually evaluated for impairment:
|
|||||||||||||||||||||||||||
|
On-balance sheet
|
$
|
22,002
|
|
$
|
29,647
|
|
$
|
11,511
|
|
$
|
12,660
|
|
$
|
4,337
|
|
$
|
115
|
|
$
|
80,272
|
|
||||||
|
Off-balance sheet
|
2,073
|
|
7,958
|
|
5,197
|
|
2,436
|
|
—
|
|
901
|
|
18,565
|
|
|||||||||||||
|
Total
|
$
|
24,075
|
|
$
|
37,605
|
|
$
|
16,708
|
|
$
|
15,096
|
|
$
|
4,337
|
|
$
|
1,016
|
|
$
|
98,837
|
|
||||||
|
Total Farm & Ranch loans:
|
|||||||||||||||||||||||||||
|
On-balance sheet
|
$
|
999,566
|
|
$
|
289,694
|
|
$
|
280,380
|
|
$
|
62,947
|
|
$
|
47,149
|
|
$
|
115
|
|
$
|
1,679,851
|
|
||||||
|
Off-balance sheet
|
1,171,783
|
|
592,838
|
|
1,007,361
|
|
138,918
|
|
144,637
|
|
11,901
|
|
3,067,438
|
|
|||||||||||||
|
Total
|
$
|
2,171,349
|
|
$
|
882,532
|
|
$
|
1,287,741
|
|
$
|
201,865
|
|
$
|
191,786
|
|
$
|
12,016
|
|
$
|
4,747,289
|
|
||||||
|
Allowance for Losses:
|
|
|
|
|
|
|
|
|
|
|
|
|
|
|
|||||||||||||
|
Collectively evaluated for impairment:
|
|||||||||||||||||||||||||||
|
On-balance sheet
|
$
|
1,406
|
|
$
|
586
|
|
$
|
499
|
|
$
|
46
|
|
$
|
2,265
|
|
$
|
—
|
|
$
|
4,802
|
|
||||||
|
Off-balance sheet
|
476
|
|
215
|
|
680
|
|
57
|
|
3,996
|
|
5
|
|
5,429
|
|
|||||||||||||
|
Total
|
$
|
1,882
|
|
$
|
801
|
|
$
|
1,179
|
|
$
|
103
|
|
$
|
6,261
|
|
$
|
5
|
|
$
|
10,231
|
|
||||||
|
Individually evaluated for impairment:
|
|||||||||||||||||||||||||||
|
On-balance sheet
|
$
|
684
|
|
$
|
1,465
|
|
$
|
335
|
|
$
|
665
|
|
$
|
3,400
|
|
$
|
—
|
|
$
|
6,549
|
|
||||||
|
Off-balance sheet
|
23
|
|
50
|
|
20
|
|
16
|
|
—
|
|
1
|
|
110
|
|
|||||||||||||
|
Total
|
$
|
707
|
|
$
|
1,515
|
|
$
|
355
|
|
$
|
681
|
|
$
|
3,400
|
|
$
|
1
|
|
$
|
6,659
|
|
||||||
|
Total Farmer Mac I loans:
|
|||||||||||||||||||||||||||
|
On-balance sheet
|
$
|
2,090
|
|
$
|
2,051
|
|
$
|
834
|
|
$
|
711
|
|
$
|
5,665
|
|
$
|
—
|
|
$
|
11,351
|
|
||||||
|
Off-balance sheet
|
499
|
|
265
|
|
700
|
|
73
|
|
3,996
|
|
6
|
|
5,539
|
|
|||||||||||||
|
Total
|
$
|
2,589
|
|
$
|
2,316
|
|
$
|
1,534
|
|
$
|
784
|
|
$
|
9,661
|
|
$
|
6
|
|
$
|
16,890
|
|
||||||
156
|
|
As of December 31, 2011
|
||||||||||||||||||||||||||
|
Crops
|
Permanent
Plantings |
Livestock
|
Part-time
Farm |
Ag. Storage and
Processing (including ethanol facilities) |
Other
|
Total
|
|||||||||||||||||||||
|
|
(in thousands)
|
||||||||||||||||||||||||||
|
Ending Balance:
|
|
|
|
|
|
|
|
||||||||||||||||||||
|
Collectively evaluated for impairment:
|
|||||||||||||||||||||||||||
|
On-balance sheet
|
$
|
902,236
|
|
$
|
454,341
|
|
$
|
410,635
|
|
$
|
72,557
|
|
$
|
56,282
|
|
$
|
1,722
|
|
$
|
1,897,773
|
|
||||||
|
Off-balance sheet
|
933,203
|
|
341,759
|
|
802,592
|
|
160,050
|
|
111,568
|
|
14,192
|
|
2,363,364
|
|
|||||||||||||
|
Total
|
$
|
1,835,439
|
|
$
|
796,100
|
|
$
|
1,213,227
|
|
$
|
232,607
|
|
$
|
167,850
|
|
$
|
15,914
|
|
$
|
4,261,137
|
|
||||||
|
Individually evaluated for impairment:
|
|||||||||||||||||||||||||||
|
On-balance sheet
|
$
|
13,437
|
|
$
|
24,350
|
|
$
|
6,513
|
|
$
|
9,168
|
|
$
|
—
|
|
$
|
—
|
|
$
|
53,468
|
|
||||||
|
Off-balance sheet
|
16,083
|
|
3,895
|
|
4,371
|
|
3,345
|
|
5,842
|
|
1,022
|
|
34,558
|
|
|||||||||||||
|
Total
|
$
|
29,520
|
|
$
|
28,245
|
|
$
|
10,884
|
|
$
|
12,513
|
|
$
|
5,842
|
|
$
|
1,022
|
|
$
|
88,026
|
|
||||||
|
Total Farm & Ranch loans:
|
|||||||||||||||||||||||||||
|
On-balance sheet
|
$
|
915,673
|
|
$
|
478,691
|
|
$
|
417,148
|
|
$
|
81,725
|
|
$
|
56,282
|
|
$
|
1,722
|
|
$
|
1,951,241
|
|
||||||
|
Off-balance sheet
|
949,286
|
|
345,654
|
|
806,963
|
|
163,395
|
|
117,410
|
|
15,214
|
|
2,397,922
|
|
|||||||||||||
|
Total
|
$
|
1,864,959
|
|
$
|
824,345
|
|
$
|
1,224,111
|
|
$
|
245,120
|
|
$
|
173,692
|
|
$
|
16,936
|
|
$
|
4,349,163
|
|
||||||
|
Allowance for Losses:
|
|
|
|
|
|
|
|
|
|
|
|
|
|
|
|||||||||||||
|
Collectively evaluated for impairment:
|
|||||||||||||||||||||||||||
|
On-balance sheet
|
$
|
1,278
|
|
$
|
630
|
|
$
|
724
|
|
$
|
90
|
|
$
|
2,393
|
|
$
|
—
|
|
$
|
5,115
|
|
||||||
|
Off-balance sheet
|
445
|
|
145
|
|
566
|
|
82
|
|
3,863
|
|
4
|
|
5,105
|
|
|||||||||||||
|
Total
|
$
|
1,723
|
|
$
|
775
|
|
$
|
1,290
|
|
$
|
172
|
|
$
|
6,256
|
|
$
|
4
|
|
$
|
10,220
|
|
||||||
|
Individually evaluated for impairment:
|
|||||||||||||||||||||||||||
|
On-balance sheet
|
$
|
2,118
|
|
$
|
2,318
|
|
$
|
397
|
|
$
|
213
|
|
$
|
—
|
|
$
|
—
|
|
$
|
5,046
|
|
||||||
|
Off-balance sheet
|
292
|
|
6
|
|
10
|
|
92
|
|
1,850
|
|
—
|
|
2,250
|
|
|||||||||||||
|
Total
|
$
|
2,410
|
|
$
|
2,324
|
|
$
|
407
|
|
$
|
305
|
|
$
|
1,850
|
|
$
|
—
|
|
$
|
7,296
|
|
||||||
|
Total Farmer Mac I loans:
|
|||||||||||||||||||||||||||
|
On-balance sheet
|
$
|
3,396
|
|
$
|
2,948
|
|
$
|
1,121
|
|
$
|
303
|
|
$
|
2,393
|
|
$
|
—
|
|
$
|
10,161
|
|
||||||
|
Off-balance sheet
|
737
|
|
151
|
|
576
|
|
174
|
|
5,713
|
|
4
|
|
7,355
|
|
|||||||||||||
|
Total
|
$
|
4,133
|
|
$
|
3,099
|
|
$
|
1,697
|
|
$
|
477
|
|
$
|
8,106
|
|
$
|
4
|
|
$
|
17,516
|
|
||||||
157
The following tables present by commodity type the unpaid principal balances, recorded investment and specific allowance for losses related to impaired loans and the recorded investment in loans on nonaccrual status as of
December 31, 2012
and
2011
:
|
|
As of December 31, 2012
|
||||||||||||||||||||||||||
|
Crops
|
Permanent
Plantings |
Livestock
|
Part-time
Farm |
Ag. Storage and
Processing (including ethanol facilities) |
Other
|
Total
|
|||||||||||||||||||||
|
|
(in thousands)
|
||||||||||||||||||||||||||
|
Impaired Loans:
|
|
|
|
|
|
|
|
||||||||||||||||||||
|
With no specific allowance:
|
|
|
|
|
|
|
|
||||||||||||||||||||
|
Recorded investment
|
$
|
7,295
|
|
$
|
11,652
|
|
$
|
7,644
|
|
$
|
3,140
|
|
$
|
—
|
|
$
|
907
|
|
$
|
30,638
|
|
||||||
|
Unpaid principal balance
|
7,247
|
|
11,509
|
|
7,489
|
|
3,090
|
|
—
|
|
901
|
|
30,236
|
|
|||||||||||||
|
With a specific allowance:
|
|
|
|
|
|
|
|
|
|
|
|
|
|
|
|||||||||||||
|
Recorded investment
|
17,214
|
|
26,567
|
|
9,360
|
|
12,118
|
|
4,337
|
|
117
|
|
69,713
|
|
|||||||||||||
|
Unpaid principal balance
|
16,829
|
|
26,095
|
|
9,219
|
|
12,007
|
|
4,337
|
|
114
|
|
68,601
|
|
|||||||||||||
|
Associated allowance
|
706
|
|
1,515
|
|
355
|
|
682
|
|
3,400
|
|
1
|
|
6,659
|
|
|||||||||||||
|
Total:
|
|
|
|
|
|
|
|
|
|
|
|
|
|
|
|||||||||||||
|
Recorded investment
|
24,509
|
|
38,219
|
|
17,004
|
|
15,258
|
|
4,337
|
|
1,024
|
|
100,351
|
|
|||||||||||||
|
Unpaid principal balance
|
24,076
|
|
37,604
|
|
16,708
|
|
15,097
|
|
4,337
|
|
1,015
|
|
98,837
|
|
|||||||||||||
|
Associated allowance
|
706
|
|
1,515
|
|
355
|
|
682
|
|
3,400
|
|
1
|
|
6,659
|
|
|||||||||||||
|
Recorded investment of loans on nonaccrual status: (1)
|
$
|
11,888
|
|
$
|
15,789
|
|
$
|
5,141
|
|
$
|
8,180
|
|
$
|
4,337
|
|
$
|
—
|
|
$
|
45,335
|
|
||||||
(1) Includes
$15.7 million
of loans that are less than 90 days delinquent but which have not met Farmer Mac's performance criteria for returning to accrual status.
158
|
|
As of December 31, 2011
|
||||||||||||||||||||||||||
|
Crops
|
Permanent
Plantings |
Livestock
|
Part-time
Farm |
Ag. Storage and
Processing (including ethanol facilities) |
Other
|
Total
|
|||||||||||||||||||||
|
|
(in thousands)
|
||||||||||||||||||||||||||
|
Impaired Loans:
|
|
|
|
|
|
|
|
||||||||||||||||||||
|
With no specific allowance:
|
|
|
|
|
|
|
|
||||||||||||||||||||
|
Recorded investment
|
$
|
6,809
|
|
$
|
10,083
|
|
$
|
3,248
|
|
$
|
3,241
|
|
$
|
—
|
|
$
|
914
|
|
$
|
24,295
|
|
||||||
|
Unpaid principal balance
|
7,446
|
|
9,957
|
|
4,088
|
|
3,298
|
|
—
|
|
902
|
|
25,691
|
|
|||||||||||||
|
With a specific allowance:
|
|
|
|
|
|
|
|
|
|
|
|
|
|
|
|||||||||||||
|
Recorded investment
|
23,009
|
|
18,668
|
|
7,036
|
|
9,392
|
|
5,842
|
|
121
|
|
64,068
|
|
|||||||||||||
|
Unpaid principal balance
|
22,074
|
|
18,288
|
|
6,796
|
|
9,215
|
|
5,842
|
|
120
|
|
62,335
|
|
|||||||||||||
|
Associated allowance
|
2,410
|
|
2,324
|
|
407
|
|
305
|
|
1,850
|
|
—
|
|
7,296
|
|
|||||||||||||
|
Total:
|
|
|
|
|
|
|
|
|
|
|
|
|
|
|
|||||||||||||
|
Recorded investment
|
29,818
|
|
28,751
|
|
10,284
|
|
12,633
|
|
5,842
|
|
1,035
|
|
88,363
|
|
|||||||||||||
|
Unpaid principal balance
|
29,520
|
|
28,245
|
|
10,884
|
|
12,513
|
|
5,842
|
|
1,022
|
|
88,026
|
|
|||||||||||||
|
Associated allowance
|
2,410
|
|
2,324
|
|
407
|
|
305
|
|
1,850
|
|
—
|
|
7,296
|
|
|||||||||||||
|
Recorded investment of loans on nonaccrual status: (1)
|
$
|
9,214
|
|
$
|
25,710
|
|
$
|
3,483
|
|
$
|
6,931
|
|
$
|
—
|
|
$
|
—
|
|
$
|
45,338
|
|
||||||
(
1) Includes
$12.1 million
of loans that are less than 90 days delinquent but which have not met Farmer Mac's performance criteria for returning to accrual status.
The following table presents by commodity type the average recorded investment and interest income recognized on impaired loans for the years ended
December 31, 2012
and
2011
:
|
For the Year Ended December 31, 2012
|
|||||||||||||||||||||||||||
|
Crops
|
Permanent
Plantings |
Livestock
|
Part-time
Farm |
Ag. Storage and
Processing (including ethanol facilities) |
Other
|
Total
|
|||||||||||||||||||||
|
|
(in thousands)
|
||||||||||||||||||||||||||
|
Average recorded investment in impaired loans
|
$
|
28,568
|
|
$
|
35,071
|
|
$
|
15,379
|
|
$
|
15,953
|
|
$
|
4,695
|
|
$
|
1,033
|
|
$
|
100,699
|
|
||||||
|
Income recognized on impaired loans
|
293
|
|
1,823
|
|
263
|
|
315
|
|
—
|
|
—
|
|
2,694
|
|
|||||||||||||
|
For the Year Ended December 31, 2011
|
|||||||||||||||||||||||||||
|
Crops
|
Permanent
Plantings |
Livestock
|
Part-time
Farm |
Ag. Storage and
Processing (including ethanol facilities) |
Other
|
Total
|
|||||||||||||||||||||
|
|
(in thousands)
|
||||||||||||||||||||||||||
|
Average recorded investment in impaired loans
|
$
|
30,400
|
|
$
|
29,806
|
|
$
|
12,732
|
|
$
|
10,329
|
|
$
|
6,319
|
|
$
|
824
|
|
$
|
90,410
|
|
||||||
|
Income recognized on impaired loans
|
549
|
|
1,009
|
|
426
|
|
185
|
|
377
|
|
—
|
|
2,546
|
|
|||||||||||||
When particular criteria are met, such as the default of the borrower, Farmer Mac becomes entitled to purchase the defaulted loans underlying Farmer Mac Guaranteed Securities (commonly referred to as "removal-of-account" provisions). Farmer Mac records all such defaulted loans at their unpaid principal
159
balance during the period in which Farmer Mac becomes entitled to purchase the loans and therefore regains effective control over the transferred loans. In accordance with the terms of all LTSPCs, Farmer Mac acquires loans that are either
90 days
or
120 days
(depending on the provisions of the applicable agreement) delinquent upon the request of the counterparty. Subsequent to the purchase, such defaulted loans are treated as nonaccrual loans and, therefore, interest is accounted for on the cash basis. Any decreases in expected cash flows are recognized as impairment.
During
2012
, Farmer Mac purchased
15
defaulted loans having an unpaid principal balance of
$17.0 million
from pools underlying Farmer Mac I Guaranteed Securities and LTSPCs. During
2011
, Farmer Mac purchased
20
defaulted loans having an unpaid principal balance of
$21.7 million
from pools underlying Farmer Mac I Guaranteed Securities and LTSPCs. During
2010
, Farmer Mac purchased
22
defaulted loans having an unpaid principal balance of
$6.1 million
from pools underlying Farmer Mac I Guaranteed Securities and LTSPCs.
The following tables present information related to Farmer Mac's acquisition of defaulted loans for years ended
December 31, 2012
,
2011
, and
2010
and the outstanding balances and carrying amounts of all such loans as of
December 31, 2012
,
2011
, and
2010
:
|
|
For the Year Ended December 31,
|
||||||||||
|
|
2012
|
2011
|
2010
|
||||||||
|
(in thousands)
|
|||||||||||
|
Unpaid principal balance at acquisition date:
|
|||||||||||
|
Loans underlying LTSPCs
|
$
|
8,091
|
|
$
|
14,192
|
|
$
|
2,626
|
|
||
|
Loans underlying Farmer Mac Guaranteed Securities
|
8,933
|
|
7,471
|
|
3,456
|
|
|||||
|
Total unpaid principal balance at acquisition date
|
17,024
|
|
21,663
|
|
6,082
|
|
|||||
|
Contractually required payments receivable
|
17,432
|
|
21,715
|
|
6,200
|
|
|||||
|
Impairment recognized subsequent to acquisition
|
4,774
|
|
3,845
|
|
1,736
|
|
|||||
|
Recovery/release of allowance for defaulted loans
|
997
|
|
714
|
|
3,005
|
|
|||||
|
As of December 31,
|
|||||||||||
|
|
2012
|
2011
|
2010
|
||||||||
|
|
(in thousands)
|
||||||||||
|
Outstanding balance
|
$
|
41,737
|
|
$
|
35,773
|
|
$
|
34,473
|
|
||
|
Carrying amount
|
33,798
|
|
29,461
|
|
30,365
|
|
|||||
160
Net credit losses and
90 days
delinquencies as of and for the periods indicated for loans held and loans underlying Farmer Mac I Guaranteed Securities and LTSPCs are presented in the table below. Information is not presented for loans underlying AgVantage securities, USDA Guaranteed Securities, Farmer Mac II Guaranteed Securities, or rural utilities loans or underlying Farmer Mac Guaranteed Securities – Rural Utilities. Each AgVantage security is a general obligation of an issuing institution approved by Farmer Mac and is secured by eligible loans in an amount at least equal to the outstanding principal amount of the security. Farmer Mac excludes the loans that secure AgVantage securities from the credit risk metrics it discloses because of the credit quality of the issuing institutions, the collateralization level for the securities, and because delinquent loans are required to be removed from the pool of pledged loans and replaced with current eligible loans. As of
December 31, 2012
, there were no probable losses inherent in Farmer Mac's AgVantage securities due to the credit quality of the obligors, as well as the underlying collateral. To date, Farmer Mac has not experienced any credit losses on any Farmer Mac I AgVantage securities. The USDA-guaranteed portions presented as USDA Guaranteed Securities, as well as those that collateralize Farmer Mac II Guaranteed Securities, are guaranteed by the USDA. Each USDA guarantee is an obligation backed by the full faith and credit of the United States. As of
December 31, 2012
, neither Farmer Mac nor Farmer Mac II LLC had experienced any credit losses on any USDA Guaranteed Securities or Farmer Mac II Guaranteed Securities. As of
December 31, 2012
, there were no delinquencies and no probable losses inherent in the Farmer Mac's rural utilities loans held or in any Farmer Mac Guaranteed Securities – Rural Utilities. As of
December 31, 2012
, Farmer Mac has not experienced any credit losses on any of those loans or securities.
|
90-Day Delinquencies (1)
|
Net Credit Losses
|
||||||||||||||||||
|
|
As of December 31,
|
For the Year Ended December 31,
|
|||||||||||||||||
|
|
2012
|
2011
|
2012
|
2011
|
2010
|
||||||||||||||
|
|
(in thousands)
|
||||||||||||||||||
|
On-balance sheet assets:
|
|
|
|
||||||||||||||||
|
Farm & Ranch:
|
|
|
|
||||||||||||||||
|
Loans
|
$
|
29,592
|
|
$
|
33,243
|
|
$
|
1,673
|
|
$
|
200
|
|
$
|
555
|
|
||||
|
Total on-balance sheet
|
$
|
29,592
|
|
$
|
33,243
|
|
$
|
1,673
|
|
$
|
200
|
|
$
|
555
|
|
||||
|
Off-balance sheet assets:
|
|
|
|
|
|
|
|||||||||||||
|
Farm & Ranch:
|
|
|
|
|
|
|
|||||||||||||
|
LTSPCs
|
$
|
3,671
|
|
$
|
7,379
|
|
$
|
—
|
|
$
|
—
|
|
$
|
—
|
|
||||
|
Total off-balance sheet
|
$
|
3,671
|
|
$
|
7,379
|
|
$
|
—
|
|
$
|
—
|
|
$
|
—
|
|
||||
|
Total
|
$
|
33,263
|
|
$
|
40,622
|
|
$
|
1,673
|
|
$
|
200
|
|
$
|
555
|
|
||||
|
(1)
|
Includes loans and loans underlying Farmer Mac I Guaranteed Securities and LTSPCs that are
90 days
or more past due, in foreclosure, restructured after delinquency, and in bankruptcy, excluding loans performing under either their original loan terms or a court-approved bankruptcy plan.
|
Of the
$29.6 million
and
$33.2 million
of on-balance sheet loans reported as
90 days
delinquent as of
December 31, 2012
and
December 31, 2011
, respectively,
$4.6 million
and
$5.6 million
, respectively, are loans subject to "removal-of-account" provisions.
Credit Quality Indicators
Farmer Mac analyzes credit risk related to loans held and loans underlying LTSPCs and Farmer Mac I Guaranteed Securities (excluding AgVantage securities) based on internally assigned loan scores (i.e., risk ratings) that are derived by taking into consideration such factors as historical repayment performance, indicators of current financial condition, loan seasoning, loan size and loan-to-value ratio. Loans are then
161
classified into one of the following asset categories based on their underlying risk rating: acceptable; other assets especially mentioned; and substandard. Farmer Mac believes this analysis provides meaningful information regarding the credit risk profile of its Farmer Mac I portfolio as of each quarterly reporting period end date.
Farmer Mac also uses
90 days
delinquency information to evaluate its credit risk exposure on these program assets because historically it has been the best measure of borrower credit quality deterioration. Most of the loans held and underlying LTSPCs and Farmer Mac I Guaranteed Securities have annual (January 1) or semi-annual (January 1 and July 1) payment dates and are supported by less frequent and less predictable revenue sources, such as the cash flows generated from the maturation of crops, sales of livestock, and government farm support programs. Taking into account the reduced frequency of payment due dates and revenue sources, Farmer Mac considers
90 days
delinquency to be the most significant observation point when evaluating delinquency information.
162
The following tables present credit quality indicators related to loans held and loans underlying LTSPCs and Farmer Mac I Guaranteed Securities (excluding AgVantage securities) as of
December 31, 2012
and
2011
:
|
|
As of December 31, 2012
|
||||||||||||||||||||||||||
|
Crops
|
Permanent
Plantings |
Livestock
|
Part-time
Farm |
Ag. Storage and
Processing (including ethanol facilities) |
Other
|
Total
|
|||||||||||||||||||||
|
|
(in thousands)
|
||||||||||||||||||||||||||
|
Credit risk profile by internally assigned grade (1)
|
|
|
|
|
|
|
|
||||||||||||||||||||
|
On-balance sheet:
|
|||||||||||||||||||||||||||
|
Acceptable
|
$
|
947,097
|
|
$
|
226,253
|
|
$
|
252,525
|
|
$
|
48,156
|
|
$
|
11,972
|
|
$
|
—
|
|
$
|
1,486,003
|
|
||||||
|
Other assets especially mentioned ("OAEM") (2)
|
30,466
|
|
33,794
|
|
16,344
|
|
2,131
|
|
19,981
|
|
—
|
|
102,716
|
|
|||||||||||||
|
Substandard (2)
|
22,003
|
|
29,647
|
|
11,511
|
|
12,660
|
|
15,196
|
|
115
|
|
91,132
|
|
|||||||||||||
|
Total on-balance sheet
|
$
|
999,566
|
|
$
|
289,694
|
|
$
|
280,380
|
|
$
|
62,947
|
|
$
|
47,149
|
|
$
|
115
|
|
$
|
1,679,851
|
|
||||||
|
Off-Balance Sheet:
|
|||||||||||||||||||||||||||
|
Acceptable
|
$
|
1,143,790
|
|
$
|
567,064
|
|
$
|
922,254
|
|
$
|
130,557
|
|
$
|
114,983
|
|
$
|
10,287
|
|
$
|
2,888,935
|
|
||||||
|
Other assets especially mentioned ("OAEM") (2)
|
10,459
|
|
5,068
|
|
40,410
|
|
3,220
|
|
23,372
|
|
592
|
|
83,121
|
|
|||||||||||||
|
Substandard (2)
|
17,534
|
|
20,706
|
|
44,697
|
|
5,141
|
|
6,282
|
|
1,022
|
|
95,382
|
|
|||||||||||||
|
Total off-balance sheet
|
$
|
1,171,783
|
|
$
|
592,838
|
|
$
|
1,007,361
|
|
$
|
138,918
|
|
$
|
144,637
|
|
$
|
11,901
|
|
$
|
3,067,438
|
|
||||||
|
Total Ending Balance:
|
|||||||||||||||||||||||||||
|
Acceptable
|
$
|
2,090,887
|
|
$
|
793,317
|
|
$
|
1,174,779
|
|
$
|
178,713
|
|
$
|
126,955
|
|
$
|
10,287
|
|
$
|
4,374,938
|
|
||||||
|
Other assets especially mentioned ("OAEM") (2)
|
40,925
|
|
38,862
|
|
56,754
|
|
5,351
|
|
43,353
|
|
592
|
|
185,837
|
|
|||||||||||||
|
Substandard (2)
|
39,537
|
|
50,353
|
|
56,208
|
|
17,801
|
|
21,478
|
|
1,137
|
|
186,514
|
|
|||||||||||||
|
Total
|
$
|
2,171,349
|
|
$
|
882,532
|
|
$
|
1,287,741
|
|
$
|
201,865
|
|
$
|
191,786
|
|
$
|
12,016
|
|
$
|
4,747,289
|
|
||||||
|
Commodity analysis of past due loans (1)
|
|
|
|
|
|
|
|
|
|
|
|
|
|
|
|||||||||||||
|
On-balance sheet
|
$
|
3,971
|
|
$
|
10,756
|
|
$
|
4,389
|
|
$
|
6,022
|
|
$
|
4,337
|
|
$
|
117
|
|
$
|
29,592
|
|
||||||
|
Off-balance sheet
|
697
|
|
45
|
|
2,833
|
|
96
|
|
—
|
|
—
|
|
3,671
|
|
|||||||||||||
|
90 days or more past due
|
$
|
4,668
|
|
$
|
10,801
|
|
$
|
7,222
|
|
$
|
6,118
|
|
$
|
4,337
|
|
$
|
117
|
|
$
|
33,263
|
|
||||||
|
(1)
|
Amounts represent unpaid principal balance of risk-rated loans, which is the basis Farmer Mac uses to analyze its portfolio, and recorded investment of past due loans.
|
|
(2)
|
Assets in the OAEM category generally have potential weaknesses due to performance issues but are currently considered to be adequately secured. Substandard assets have a well-defined weakness or weaknesses and there is a distinct possibility that some loss will be sustained if deficiencies are not corrected.
|
163
|
|
As of December 31, 2011
|
||||||||||||||||||||||||||
|
Crops
|
Permanent
Plantings |
Livestock
|
Part-time
Farm |
Ag. Storage and
Processing (including ethanol facilities) |
Other
|
Total
|
|||||||||||||||||||||
|
|
(in thousands)
|
||||||||||||||||||||||||||
|
Credit risk profile by internally assigned grade (1)
|
|
|
|
|
|
|
|
||||||||||||||||||||
|
On-balance sheet:
|
|||||||||||||||||||||||||||
|
Acceptable
|
$
|
861,159
|
|
$
|
423,067
|
|
$
|
363,200
|
|
$
|
67,702
|
|
$
|
24,133
|
|
$
|
1,722
|
|
$
|
1,740,983
|
|
||||||
|
Other assets especially mentioned ("OAEM") (2)
|
34,951
|
|
17,926
|
|
31,304
|
|
2,531
|
|
21,278
|
|
—
|
|
107,990
|
|
|||||||||||||
|
Substandard (2)
|
19,563
|
|
37,698
|
|
22,644
|
|
11,492
|
|
10,871
|
|
—
|
|
102,268
|
|
|||||||||||||
|
Total on-balance sheet
|
$
|
915,673
|
|
$
|
478,691
|
|
$
|
417,148
|
|
$
|
81,725
|
|
$
|
56,282
|
|
$
|
1,722
|
|
$
|
1,951,241
|
|
||||||
|
Off-Balance Sheet
|
|||||||||||||||||||||||||||
|
Acceptable
|
$
|
908,609
|
|
$
|
325,491
|
|
$
|
733,984
|
|
$
|
147,823
|
|
$
|
72,399
|
|
$
|
13,436
|
|
$
|
2,201,742
|
|
||||||
|
Other assets especially mentioned ("OAEM") (2)
|
25,125
|
|
2,516
|
|
43,655
|
|
4,572
|
|
24,395
|
|
641
|
|
100,904
|
|
|||||||||||||
|
Substandard (2)
|
15,552
|
|
17,647
|
|
29,324
|
|
11,000
|
|
20,616
|
|
1,137
|
|
95,276
|
|
|||||||||||||
|
Total off-balance sheet
|
$
|
949,286
|
|
$
|
345,654
|
|
$
|
806,963
|
|
$
|
163,395
|
|
$
|
117,410
|
|
$
|
15,214
|
|
$
|
2,397,922
|
|
||||||
|
Total Ending Balance:
|
|||||||||||||||||||||||||||
|
Acceptable
|
$
|
1,769,768
|
|
$
|
748,558
|
|
$
|
1,097,184
|
|
$
|
215,525
|
|
$
|
96,532
|
|
$
|
15,158
|
|
$
|
3,942,725
|
|
||||||
|
Other assets especially mentioned ("OAEM") (2)
|
60,076
|
|
20,442
|
|
74,959
|
|
7,103
|
|
45,673
|
|
641
|
|
208,894
|
|
|||||||||||||
|
Substandard (2)
|
35,115
|
|
55,345
|
|
51,968
|
|
22,492
|
|
31,487
|
|
1,137
|
|
197,544
|
|
|||||||||||||
|
Total
|
$
|
1,864,959
|
|
$
|
824,345
|
|
$
|
1,224,111
|
|
$
|
245,120
|
|
$
|
173,692
|
|
$
|
16,936
|
|
$
|
4,349,163
|
|
||||||
|
Commodity analysis of past due loans (1)
|
|
|
|
|
|
|
|
|
|
|
|
|
|
|
|||||||||||||
|
On-balance sheet
|
$
|
7,125
|
|
$
|
18,456
|
|
$
|
2,474
|
|
$
|
5,188
|
|
$
|
—
|
|
$
|
—
|
|
$
|
33,243
|
|
||||||
|
Off-balance sheet
|
4,480
|
|
771
|
|
1
|
|
2,127
|
|
—
|
|
—
|
|
7,379
|
|
|||||||||||||
|
90 days or more past due
|
$
|
11,605
|
|
$
|
19,227
|
|
$
|
2,475
|
|
$
|
7,315
|
|
$
|
—
|
|
$
|
—
|
|
$
|
40,622
|
|
||||||
|
(1)
|
Amounts represent unpaid principal balance of risk-rated loans, which is the basis Farmer Mac uses to analyze its portfolio, and recorded investment of past due loans.
|
|
(2)
|
Assets in the OAEM category generally have potential weaknesses due to performance issues but are currently considered to be adequately secured. Substandard assets have a well-defined weakness or weaknesses and there is a distinct possibility that some loss will be sustained if deficiencies are not corrected.
|
164
Concentrations of Credit Risk
The following table sets forth the geographic and commodity/collateral diversification, as well as the range of original loan-to-value ratios, for all loans held and loans underlying Farmer Mac I Guaranteed Securities (excluding AgVantage securities) and LTSPCs as of
December 31, 2012
and
2011
:
|
|
December 31, 2012
|
December 31, 2011
|
|||||
|
|
(in thousands)
|
||||||
|
By commodity/collateral type:
|
|
|
|||||
|
Crops
|
$
|
2,171,349
|
|
$
|
1,864,959
|
|
|
|
Permanent plantings
|
882,532
|
|
824,345
|
|
|||
|
Livestock
|
1,287,741
|
|
1,224,111
|
|
|||
|
Part-time farm
|
201,865
|
|
245,120
|
|
|||
|
Ag. Storage and processing (including ethanol facilities)
|
191,786
|
|
173,692
|
|
|||
|
Other
|
12,016
|
|
16,936
|
|
|||
|
Total
|
$
|
4,747,289
|
|
$
|
4,349,163
|
|
|
|
By geographic region (1):
|
|
|
|
|
|||
|
Northwest
|
$
|
840,693
|
|
$
|
761,078
|
|
|
|
Southwest
|
1,781,822
|
|
1,597,369
|
|
|||
|
Mid-North
|
989,903
|
|
857,659
|
|
|||
|
Mid-South
|
504,914
|
|
484,176
|
|
|||
|
Northeast
|
261,756
|
|
294,854
|
|
|||
|
Southeast
|
368,201
|
|
354,027
|
|
|||
|
Total
|
$
|
4,747,289
|
|
$
|
4,349,163
|
|
|
|
By original loan-to-value ratio:
|
|
|
|
|
|||
|
0.00% to 40.00%
|
$
|
1,338,715
|
|
$
|
1,104,617
|
|
|
|
40.01% to 50.00%
|
851,980
|
|
769,618
|
|
|||
|
50.01% to 60.00%
|
1,296,225
|
|
1,225,939
|
|
|||
|
60.01% to 70.00%
|
1,091,427
|
|
1,062,061
|
|
|||
|
70.01% to 80.00%
|
122,259
|
|
135,985
|
|
|||
|
80.01% to 90.00%
|
46,683
|
|
50,943
|
|
|||
|
Total
|
$
|
4,747,289
|
|
$
|
4,349,163
|
|
|
|
(1)
|
Geographic regions: Northwest (AK, ID, MT, ND, NE, OR, SD, WA, WY); Southwest (AZ, CA, CO, HI, NM, NV, UT); Mid-North (IA, IL, IN, MI, MN, MO, WI); Mid-South (KS, OK, TX); Northeast (CT, DE, KY, MA, MD, ME, NC, NH, NJ, NY, OH, PA, RI, TN, VA, VT, WV); Southeast (AL, AR, FL, GA, LA, MS, SC).
|
The original loan-to-value ratio is calculated by dividing the loan principal balance at the time of guarantee, purchase or commitment by the appraised value at the date of loan origination or, when available, the updated appraised value at the time of guarantee, purchase or commitment. Current loan-to-value ratios may be higher or lower than the original loan-to-value ratios.
165
|
9.
|
EQUITY
|
Common Stock
Farmer Mac has
three
classes of common stock outstanding:
|
•
|
Class A voting common stock, which may be held only by banks, insurance companies and other financial institutions or similar entities that are not institutions of the FCS. By federal statute, no holder of Class A voting common stock may directly or indirectly be a beneficial owner of more than
33 percent
of the outstanding shares of Class A voting common stock;
|
|
•
|
Class B voting common stock, which may be held only by institutions of the FCS. There are no restrictions on the maximum holdings of Class B voting common stock; and
|
|
•
|
Class C non-voting common stock, which has no ownership restrictions.
|
During
2012
, Farmer Mac paid a quarterly dividend of
$0.10
per share on all classes of the Corporation's common stock. During 2011 and
2010
, Farmer Mac paid quarterly dividends of
$0.05
per share on the Corporation's common stock. On
February 6, 2013
, Farmer Mac's board of directors declared a quarterly dividend of
$0.12
per share on the Corporation's common stock payable on
March 29, 2013
. Farmer Mac's ability to declare and pay a dividend could be restricted if it failed to comply with regulatory capital requirements.
Preferred Stock
As of
December 31, 2012
and
2011
, Farmer Mac had
57,578
shares of Series C Preferred Stock outstanding. On January 17, 2013, Farmer Mac redeemed and retired all of the outstanding Series C Preferred Stock from the proceeds received from the issuance of a new series of non-cumulative preferred stock on the same date. Prior to its redemption, dividends on Series C Preferred Stock compounded quarterly at an annual rate of
5.0 percent
of the then-applicable liquidation preference per share, with the annual rate scheduled to increase to (1)
7.0 percent
on January 1 following the fifth anniversary of the applicable issue date and (2)
9.0 percent
on January 1 following the tenth anniversary of the applicable issue date.
Series C Preferred Stock had a par value of
$1,000
per share and an initial liquidation preference of
$1,000
per share. Series C preferred stock was a component of Stockholder's Equity on the consolidated balance sheets and all outstanding shares were held by National Rural Utilities Cooperative Finance Corporation ("CFC"), a related party. The Series C Preferred Stock ranked senior to Farmer Mac's outstanding Class A voting common stock, Class B voting common stock, and Class C non-voting common stock. There were no sales of Series C Preferred Stock during 2012 and 2011.
Series B Preferred Stock was repurchased and retired on
January 25, 2010
. Farmer Mac recognized a loss on the retirement of that preferred stock of
$5.8 million
in 2010.
On January 17, 2013, Farmer Mac issued
2.4 million
shares of
5.875%
Non-Cumulative Preferred Stock, Series A (the "Series A Preferred Stock"). The Series A Preferred Stock has a par value of
$25.00
per share, a liquidation preference of
$25.00
per share and a dividend rate of
5.875%
. Farmer Mac used the proceeds from the sale of the preferred stock to redeem and retire the outstanding shares of Series C Preferred Stock.
166
Farmer Mac's ability to declare and pay dividends on outstanding preferred stock could be restricted if it failed to comply with regulatory capital requirements. Farmer Mac's preferred stock is included as a component of core capital for regulatory and statutory capital compliance measurements.
Non-Controlling Interest in Farmer Mac II LLC
On
January 25, 2010
, Farmer Mac completed a private offering of
$250.0 million
of securities issued by a newly formed Delaware statutory trust. The trust securities represent undivided beneficial ownership interests in
250,000
shares of non-cumulative perpetual preferred stock (the "Farmer Mac II LLC Preferred Stock") of Farmer Mac's subsidiary, Farmer Mac II LLC, a Delaware limited liability company. The Farmer Mac II LLC Preferred Stock has a liquidation preference of
$1,000
per share.
Dividends on the Farmer Mac II LLC Preferred Stock will be payable if, when and as declared by Farmer Mac II LLC's board of directors, quarterly, on a non-cumulative basis, on March 30, June 30, September 30, and December 30 of each year. For each quarterly period from the date of issuance to but excluding the payment date occurring on March 30, 2015, the dividend rate on the Farmer Mac II LLC Preferred Stock will be
8.875 percent
per annum. For each quarterly period from March 30, 2015 to but excluding the payment date occurring on March 30, 2020, the dividend rate on the Farmer Mac II LLC Preferred Stock will be
10.875 percent
per annum. For each quarterly period beginning on March 30, 2020, the dividend rate on the Farmer Mac II LLC Preferred Stock will be an annual rate equal to three-month LIBOR plus
8.211 percent
. Dividends on the Farmer Mac II LLC Preferred Stock are non-cumulative, so dividends that are not declared for a payment date will not accrue. The Farmer Mac II LLC Preferred Stock is permanent equity of Farmer Mac II LLC and is presented as "Non-controlling interest – preferred stock" within permanent equity on the consolidated balance sheets of Farmer Mac. Farmer Mac II LLC incurred
$8.1 million
of direct costs related to the issuance of the Farmer Mac II LLC Preferred Stock, which reduced the amount of non-controlling interest – preferred stock. The accrual of declared dividends is presented as "Net income attributable to non-controlling interest – preferred stock dividends" on the
consolidated statements of operations
on a pre-tax basis. The consolidated tax benefit is included in income tax expense. Farmer Mac II LLC may redeem the preferred stock on March 30, of 2015, 2016, 2017, 2018, and 2019 and on any payment date on or after March 30, 2020, in whole or in part, at a cash redemption price equal to the liquidation preference.
Equity-based Incentive Compensation Plans
Farmer Mac's 2008 Omnibus Incentive Compensation Plan authorizes the grants of restricted stock, stock options and SARs, among other alternative forms of equity-based compensation, to directors, officers and other employees. SARs awarded to officers and employees vest annually in thirds and SARs awarded to directors vest fully after approximately one year. If not exercised or terminated earlier due to the termination of employment or service on the Board, SARs granted to officers or employees expire after
10 years
and those granted to directors expire after
7 years
. For all SARs granted, the exercise price is equal to the closing price of the Class C non-voting common stock on the date of grant. SARs granted during
2012
have exercise prices ranging from
$21.69
to
$32.85
per share, SARs granted during
2011
have exercise prices ranging from
$18.14
to
$18.17
per share, and SARS granted during
2010
have exercise prices ranging from
$10.43
to
$12.20
per share. During
2012
,
2011
, and
2010
, restricted stock awards were granted to directors with a vesting period of one year, and restricted stock awards were granted to officers vesting in three years provided certain performance targets are met.
167
The following tables summarize stock options, SARs and non-vested restricted stock activity for the years ended December 31,
2012
,
2011
, and
2010
:
|
|
For the Year Ended December 31,
|
|||||||||||||||||||
|
|
2012
|
2011
|
2010
|
|||||||||||||||||
|
Stock
Options and SARs |
Weighted-
Average Exercise Price |
Stock
Options and SARs |
Weighted-
Average Exercise Price |
Stock
Options and SARs |
Weighted-
Average Exercise Price |
|||||||||||||||
|
Outstanding, beginning of year
|
1,327,066
|
|
$
|
18.72
|
|
1,924,133
|
|
$
|
21.16
|
|
1,799,465
|
|
$
|
22.68
|
|
|||||
|
Granted
|
157,983
|
|
22.32
|
|
146,000
|
|
18.63
|
|
302,000
|
|
11.88
|
|
||||||||
|
Exercised
|
(427,348
|
)
|
13.18
|
|
(32,001
|
)
|
6.99
|
|
(26,998
|
)
|
11.96
|
|
||||||||
|
Canceled
|
(268,953
|
)
|
23.29
|
|
(711,066
|
)
|
25.83
|
|
(150,334
|
)
|
22.34
|
|
||||||||
|
Outstanding, end of year
|
788,748
|
|
$
|
20.89
|
|
1,327,066
|
|
$
|
18.72
|
|
1,924,133
|
|
$
|
21.16
|
|
|||||
|
Exercisable at end of year
|
574,439
|
|
$
|
21.76
|
|
914,743
|
|
$
|
21.12
|
|
1,434,544
|
|
$
|
24.59
|
|
|||||
|
|
For the Year Ended December 31,
|
|||||||||||||||||||
|
|
2012
|
2011
|
2010
|
|||||||||||||||||
|
|
Non-vested
Restricted Stock |
Weighted-
Average Grant Date Fair Value |
Non-vested
Restricted Stock |
Weighted-
Average Grant Date Fair Value |
Non-vested
Restricted Stock |
Weighted-
Average Grant Date Fair Value |
||||||||||||||
|
Outstanding, beginning of year
|
196,076
|
|
$
|
12.15
|
|
182,609
|
|
$
|
9.63
|
|
200,548
|
|
$
|
5.93
|
|
|||||
|
Granted
|
72,637
|
|
21.92
|
|
73,060
|
|
18.77
|
|
115,807
|
|
12.21
|
|
||||||||
|
Canceled
|
(59,624
|
)
|
16.98
|
|
(2,003
|
)
|
18.77
|
|
(11,599
|
)
|
8.15
|
|
||||||||
|
Vested and issued
|
(117,778
|
)
|
10.62
|
|
(57,590
|
)
|
12.33
|
|
(122,147
|
)
|
6.14
|
|
||||||||
|
Outstanding, end of year
|
91,311
|
|
$
|
18.75
|
|
196,076
|
|
$
|
12.15
|
|
182,609
|
|
$
|
9.63
|
|
|||||
The cancellations of stock options, SARs, and non-vested restricted stock during
2012
,
2011
, and
2010
were due either to unvested awards terminating in accordance with the provisions of the applicable stock option plans upon directors' or employees' departures from Farmer Mac, by voluntary forfeiture, or vested awards terminating unexercised on their expiration date.
Farmer Mac receives cash when stock options are exercised. Cash is not received from exercises of SARs or the vesting and issuance of restricted stock. Farmer Mac received
$2.9 million
from the exercise of stock options during
2012
and
$0.2 million
during
2010
. There were
no
exercises of stock options in
2011
. During
2012
,
2011
, and
2010
, the reduction of income taxes payable as a result of the deduction for the exercise of stock options and SARs and the vesting or accelerated tax elections of restricted stock was
$3.4 million
,
$0.5 million
, and
$0.8 million
, respectively.
During
2012
, Farmer Mac recorded a net increase to additional paid-in capital of
$1.4 million
, compared to a net reduction of
$0.2 million
in
2011
, and a net increase of
$0.2 million
in
2010
, related to stock-based compensation awards.
Farmer Mac has a policy that permits directors of Farmer Mac to elect to receive shares of Class C non-voting common stock in lieu of cash retainers. During
2012
, Farmer Mac issued
649
shares of Class C non-voting common stock with a fair value of
$15,000
to the
four
directors who made that election. During
2011
, Farmer Mac issued
1,283
shares of Class C non-voting common stock with a fair value of
168
$24,000
to the
four
directors who made that election. During
2010
, Farmer Mac issued
4,417
shares of Class C non-voting common stock with a fair value of
$44,000
to the
seven
directors who made that election. Fair values are determined based on the closing price of the Class C non-voting common stock as of the last business day of each quarter.
The following tables summarize information regarding stock options, SARs, and non-vested restricted stock outstanding as of December 31,
2012
:
|
|
Outstanding
|
|
Exercisable
|
Vested or Expected to Vest
|
|||||||||||
|
Range of
Exercise Prices |
Stock Options and SARs
|
Weighted-
Average Remaining Contractual Life |
Stock Options and SARs
|
Weighted-
Average Remaining Contractual Life |
Stock Options and SARs
|
Weighted-
Average Remaining Contractual Life |
|||||||||
|
$5.00 - $ 9.99
|
64,999
|
|
|
6.3 years
|
|
64,999
|
|
6.3 years
|
64,999
|
|
6.3 years
|
||||
|
10.00 - 14.99
|
160,997
|
|
|
7.4 years
|
|
102,004
|
|
7.4 years
|
151,431
|
|
7.3 years
|
||||
|
15.00 - 19.99
|
95,916
|
|
|
7.5 years
|
|
38,583
|
|
6.1 years
|
88,821
|
|
7.4 years
|
||||
|
20.00 - 24.99
|
174,821
|
|
|
6.0 years
|
|
85,821
|
|
2.5 years
|
166,430
|
|
5.8 years
|
||||
|
25.00 - 29.99
|
259,032
|
|
|
4.4 years
|
|
259,032
|
|
4.4 years
|
259,031
|
|
4.4 years
|
||||
|
30.00 - 34.99
|
32,983
|
|
|
6.2 years
|
|
24,000
|
|
4.8 years
|
32,354
|
|
6.1 years
|
||||
|
|
788,748
|
|
|
|
|
574,439
|
|
|
763,066
|
|
|
||||
|
|
Outstanding
|
|
Expected to Vest
|
|
|
|
|||||||||
|
Weighted-
Average Grant-Date Fair Value |
Non-vested Restricted Stock
|
|
Weighted-Average Remaining Contractual
Life |
|
Non-vested Restricted Stock
|
Weighted-Average Remaining Contractual
Life |
|
|
|
||||||
|
$10.00 - $14.99
|
26,000
|
|
|
0.2 years
|
|
23,400
|
|
0.2 years
|
|
|
|
||||
|
15.00 - 19.99
|
13,300
|
|
|
1.2 years
|
|
12,370
|
|
1.2 years
|
|
|
|
||||
|
20.00 - 24.99
|
52,011
|
|
|
0.7 years
|
|
43,973
|
|
0.8 years
|
|
|
|
||||
|
|
91,311
|
|
|
|
|
79,743
|
|
|
|
|
|
||||
The weighted average exercise price of the
763,066
options and SARs vested or expected to vest as of December 31,
2012
was
$21.01
.
As of December 31,
2012
and
2011
, the intrinsic value of options, SARs, and non-vested restricted stock outstanding, exercisable, and vested or expected to vest was
$11.4 million
and
$7.4 million
, respectively. During
2012
,
2011
, and
2010
, the total intrinsic value of options and SARs exercised was
$7.4 million
,
$0.5 million
, and
$0.2 million
, respectively. As of December 31,
2012
, there was
$2.1 million
of total unrecognized compensation cost related to non-vested stock options, SARS and restricted stock awards. This cost is expected to be recognized over a weighted-average period of
1.3 years
.
The weighted-average grant date fair values of options, SARs, and restricted stock awards granted in
2012
,
2011
, and
2010
were
$16.73
,
$15.35
, and
$9.24
per share, respectively. Under the fair value-based method of accounting for stock-based compensation cost, Farmer Mac recognized compensation expense of
$2.5 million
,
$3.0 million
, and
$2.8 million
during
2012
,
2011
, and
2010
, respectively.
The fair values of stock options and SARs were estimated using the Black-Scholes option pricing model based on the following assumptions:
169
|
|
For the Year Ended December 31,
|
||||
|
|
2012
|
2011
|
2010
|
||
|
Risk-free interest rate
|
1.1%
|
2.2%
|
2.9%
|
||
|
Expected years until exercise
|
5 years
|
6 years
|
7 years
|
||
|
Expected stock volatility
|
94.6%
|
102.5%
|
91.5%
|
||
|
Dividend yield
|
1.8%
|
1.1%
|
1.8%
|
||
The risk-free interest rates used in the model were based on the U.S. Treasury yield curve in effect at the grant date. Farmer Mac used historical data to estimate the timing of option exercises and stock option cancellation rates used in the model. Expected volatilities were based on historical volatility of Farmer Mac's Class C common stock. The dividend yields were based on the expected dividends as a percentage of the value of Farmer Mac's Class C common stock on the grant date.
Because restricted stock awards will be issued upon vesting regardless of the stock price, expected stock volatility is not considered in determining grant date fair value. Restricted stock awards also accrue dividends which are paid at vesting. The weighted-average grant date fair value of the restricted stock awarded in
2012
,
2011
, and
2010
was
$21.92
,
$18.77
, and
$12.21
per share, respectively, which was the closing price of the stock on the date granted.
Statutory and Regulatory Capital Requirements
Farmer Mac is subject to
three
statutory and regulatory capital requirements:
|
•
|
Statutory minimum capital requirement – Farmer Mac's statutory minimum capital level is an amount of core capital (stockholders' equity less accumulated other comprehensive income plus non-controlling interest - preferred stock) equal to the sum of
2.75 percent
of Farmer Mac's aggregate on-balance sheet assets, as calculated for regulatory purposes, plus
0.75 percent
of the aggregate off-balance sheet obligations of Farmer Mac, specifically including:
|
|
◦
|
the unpaid principal balance of outstanding Farmer Mac Guaranteed Securities;
|
|
◦
|
instruments issued or guaranteed by Farmer Mac that are substantially equivalent to Farmer Mac Guaranteed Securities, including LTSPCs; and
|
|
◦
|
other off-balance sheet obligations of Farmer Mac.
|
|
•
|
Statutory critical capital requirement – Farmer Mac's critical capital level is an amount of core capital equal to
50 percent
of the total minimum capital requirement at that time.
|
|
•
|
Risk-based capital requirement – Farmer Mac's charter directs the Farm Credit Administration ("FCA") to establish a risk-based capital stress test for Farmer Mac, using specified stress-test parameters.
|
Farmer Mac is required to comply with the higher of the minimum capital requirement and the risk-based capital requirement.
As of
December 31, 2012
, Farmer Mac's minimum and critical capital requirements were
$374.0 million
and
$187.0 million
, respectively, and its actual core capital level was
$519.0 million
, which was
$145.0 million
above the minimum capital requirement and
$332.0 million
above the critical capital
170
requirement as of that date. As of
December 31, 2011
, Farmer Mac's minimum and critical capital requirements were
$348.7 million
and
$174.3 million
, respectively, and its actual core capital level was
$475.2 million
, which was
$126.5 million
above the minimum capital requirement and
$300.9 million
above the critical capital requirement as of that date.
Based on the risk-based capital stress test, Farmer Mac's risk-based capital requirement as of
December 31, 2012
was
$58.1 million
, and Farmer Mac's regulatory capital (core capital plus the allowance for losses) of
$535.9 million
exceeded that amount by approximately
$477.8 million
. As of
December 31, 2011
, Farmer Mac's risk-based capital requirement was
$52.9 million
, and Farmer Mac's regulatory capital of
$492.7 million
exceeded that amount by approximately
$439.8 million
.
|
10.
|
INCOME TAXES
|
Farmer Mac is subject to federal income taxes but is exempt from state and local income taxes. The components of the federal income tax expense for the years ended
December 31, 2012
,
2011
, and
2010
were as follows:
|
|
For the Year Ended December 31,
|
||||||||||
|
|
2012
|
2011
|
2010
|
||||||||
|
|
(in thousands)
|
||||||||||
|
Current income tax expense
|
$
|
24,138
|
|
$
|
24,736
|
|
$
|
14,321
|
|
||
|
Deferred income tax (benefit)/expense
|
(1,982
|
)
|
(18,939
|
)
|
(524
|
)
|
|||||
|
Income tax expense
|
$
|
22,156
|
|
$
|
5,797
|
|
$
|
13,797
|
|
||
A reconciliation of tax at the statutory federal tax rate to the income tax expense for the years ended
December 31, 2012
,
2011
, and
2010
is as follows:
|
|
For the Year Ended December 31,
|
||||||||||
|
|
2012
|
2011
|
2010
|
||||||||
|
|
(dollars in thousands)
|
||||||||||
|
Tax expense at statutory rate
|
$
|
31,891
|
|
$
|
15,627
|
|
$
|
23,274
|
|
||
|
Non-taxable dividend income
|
(2,116
|
)
|
(2,116
|
)
|
(2,183
|
)
|
|||||
|
Income from non-controlling interest
|
(7,766
|
)
|
(7,766
|
)
|
(7,248
|
)
|
|||||
|
Valuation allowance
|
6
|
|
(254
|
)
|
(235
|
)
|
|||||
|
Other
|
141
|
|
306
|
|
189
|
|
|||||
|
Income tax expense
|
$
|
22,156
|
|
$
|
5,797
|
|
$
|
13,797
|
|
||
|
Statutory tax rate
|
35.0
|
%
|
35.0
|
%
|
35.0
|
%
|
|||||
171
The components of the deferred tax assets and liabilities as of
December 31, 2012
and
2011
were as follows:
|
|
As of December 31,
|
||||||
|
|
2012
|
2011
|
|||||
|
|
(in thousands)
|
||||||
|
Deferred tax assets:
|
|
|
|||||
|
Basis differences related to financial derivatives
|
$
|
44,963
|
|
$
|
45,517
|
|
|
|
Allowance for losses
|
5,911
|
|
6,131
|
|
|||
|
Stock-based compensation
|
2,111
|
|
2,941
|
|
|||
|
Capital loss carryforwards
|
39,272
|
|
39,399
|
|
|||
|
Valuation allowance
|
(39,272
|
)
|
(39,399
|
)
|
|||
|
Lower of cost or fair value adjustment on loans held for sale
|
2,080
|
|
—
|
|
|||
|
Amortization of premiums on capital investments
|
1,352
|
|
1,220
|
|
|||
|
Valuation allowance
|
(1,352
|
)
|
(1,220
|
)
|
|||
|
Other
|
2,333
|
|
3,057
|
|
|||
|
Total deferred tax assets
|
57,398
|
|
57,646
|
|
|||
|
Deferred tax liability:
|
|
|
|
|
|||
|
Basis differences related to securities
|
13,160
|
|
12,139
|
|
|||
|
Unrealized gains on available-for-sale securities
|
39,829
|
|
42,738
|
|
|||
|
Basis difference in subsidiary
|
1,118
|
|
2,916
|
|
|||
|
Other
|
168
|
|
103
|
|
|||
|
Total deferred tax liability
|
54,275
|
|
57,896
|
|
|||
|
Net deferred tax asset/(liability)
|
$
|
3,123
|
|
$
|
(250
|
)
|
|
A valuation allowance is required to reduce a deferred tax asset to an amount that is more likely than not to be realized. Future realization of the tax benefit from a deferred tax asset depends on the existence of sufficient taxable income of the appropriate character. After the evaluation of both positive and negative objective evidence regarding the likelihood that its deferred tax assets will be realized, Farmer Mac established a valuation allowance of
$40.6 million
and as of
December 31, 2012
and
2011
, which was attributable to non-deductible capital losses on investment securities. Farmer Mac did not establish a valuation allowance for the remainder of its deferred tax assets because it believes it is more likely than not that those deferred tax assets will be realized. In determining its deferred tax asset valuation allowance, Farmer Mac considered its taxable income of the appropriate character (for example, ordinary income or capital gain) within the carryback and carryforward periods available under the tax law. As of
December 31, 2012
, the amount of capital loss carryforwards was
$112.2 million
. Of these capital loss carryforwards,
$106.2 million
will expire in
2014
,
$0.1 million
in
2015
, and
$5.9 million
in
2016
.
As of
December 31, 2012
both the recorded liability for uncertain tax positions and the corresponding deferred tax asset were
$1.0 million
. As of December 31,
2011
both the recorded liability for uncertain tax positions and the corresponding deferred tax asset were
$1.2 million
.
172
The following table presents the changes in unrecognized tax benefits for the years ended
December 31, 2012
,
2011
, and
2010
:
|
|
For the Year Ended December 31,
|
||||||||||
|
|
2012
|
2011
|
2010
|
||||||||
|
|
(in thousands)
|
||||||||||
|
Beginning balance
|
$
|
1,175
|
|
$
|
1,454
|
|
$
|
1,392
|
|
||
|
(Decreases)/increases based on tax positions related to current year
|
(129
|
)
|
(279
|
)
|
62
|
|
|||||
|
Ending balance
|
$
|
1,046
|
|
$
|
1,175
|
|
$
|
1,454
|
|
||
The resolution of the unrecognized tax benefits presented above represents temporary differences and, therefore, would not result in a change to the Corporation's effective tax rate. As of December 31, 2012 and 2011, accrued interest payable and the associated interest expense related to unrecognized tax benefits was immaterial and is presented as a component of income taxes. Farmer Mac does not expect to be subject to, and has not recorded tax penalties. In addition, Farmer Mac does not expect any significant changes to occur in its unrecognized tax benefits within the next 12 months. Tax years 2009 through 2012 remain subject to examination.
|
11.
|
EMPLOYEE BENEFITS
|
Farmer Mac makes contributions to a defined contribution retirement plan for all of its employees. Farmer Mac contributed
13.2 percent
of the lesser of an employee's gross salary or the maximum compensation permitted under the Economic Growth and Tax Relief Reconciliation Act of 2001 ("EGTRRA") (
$250,000
for 2012,
$245,000
for 2011, and
$245,000
for 2010), plus
5.7 percent
of the difference between: (1) the lesser of the gross salary or the amount established under EGTRRA; and (2) the Social Security Taxable Wage Base. Employees are fully vested after having been employed for approximately
3 years
. Expense for this plan for the years ended
December 31, 2012
,
2011
, and
2010
was
$0.9 million
,
$1.0 million
, and
$0.9 million
, respectively.
|
12.
|
OFF-BALANCE SHEET GUARANTEES AND LONG TERM STANDBY PURCHASE COMMITMENTS
|
Farmer Mac offers two credit enhancement alternatives to direct loan purchases that allow approved lenders the ability to retain the cash flow benefits of their loans and increase their liquidity and lending capacity: (1) Farmer Mac Guaranteed Securities, which are available through the Farm & Ranch, the USDA Guarantees, or the Rural Utilities lines of business, and (2) LTSPCs, which are available through the Farm & Ranch or the USDA Guarantees lines of business. For securitization trusts where Farmer Mac is the primary beneficiary, as described in Note 2(q), the trust assets and liabilities are included on Farmer Mac's consolidated balance sheet. Upon consolidation, Farmer Mac eliminates the portion of the guarantee and commitment fees receivable and guarantee and commitment obligations related to the consolidated trusts. For the remainder of these transactions, or in the event of deconsolidation, both of these alternatives result in the creation of off-balance sheet obligations for Farmer Mac. Farmer Mac accounts for these transactions and other financial guarantees in accordance with accounting guidance on accounting for guarantees. Farmer Mac records, at the inception of a guarantee, a liability for the fair value of its obligation to stand ready to perform under the terms of each guarantee and an asset that is equal to the fair value of the fees that will be received over the life of each guarantee. The fair values of the guarantee obligation and asset at inception are based on the present value of expected cash flows using
173
management's best estimate of certain key assumptions, which include prepayment speeds, forward yield curves and discount rates commensurate with the risks involved. Because the cash flows of these instruments may be interest rate path dependent, these values and projected discount rates are derived using a Monte Carlo simulation model. The guarantee obligation and corresponding asset are subsequently amortized into guarantee and commitment fee income in relation to the decline in the unpaid principal balance on the underlying agricultural real estate mortgage and rural utilities loans.
The contractual terms of Farmer Mac's guarantees range from less than
one
year to
30
years. However, the actual term of each guarantee may be significantly less than the contractual term based on the prepayment characteristics of the related agricultural real estate mortgage loans. Farmer Mac's maximum potential exposure under these guarantees is comprised of the unpaid principal balance of the underlying agricultural real estate mortgage loans. Guarantees issued or modified on or after January 1, 2003 are recorded in the consolidated balance sheets. Farmer Mac's maximum potential exposure was
$3.6 billion
and
$3.2 billion
as of
December 31, 2012
and
2011
, respectively. Farmer Mac's maximum potential exposure for guarantees issued prior to January 1, 2003, which are not recorded on the consolidated balance sheets, was
$474.7 million
and
$188.0 million
as of
December 31, 2012
and
2011
, respectively. The maximum exposure from these guarantees is not representative of the actual loss Farmer Mac is likely to incur, based on historical loss experience. In the event Farmer Mac was required to make payments under its guarantees, Farmer Mac would have the right to enforce the terms of the loans, and in the event of default, would have access to the underlying collateral. For information on Farmer Mac's methodology for determining the reserve for losses for its financial guarantees, see Note 2(j) and Note 8. The following table presents changes in Farmer Mac's guarantee and commitment obligations in the consolidated balance sheets for the years ended
December 31, 2012
,
2011
, and
2010
:
|
|
For the Year Ended December 31,
|
||||||||||
|
|
2012
|
2011
|
2010
|
||||||||
|
|
(in thousands)
|
||||||||||
|
Beginning balance, January 1
|
$
|
27,440
|
|
$
|
30,308
|
|
$
|
48,526
|
|
||
|
Additions to the guarantee and commitment obligation (1)
|
15,134
|
|
5,097
|
|
4,539
|
|
|||||
|
Adjustments related to new consolidation guidance
|
—
|
|
—
|
|
(12,812
|
)
|
|||||
|
Amortization of the guarantee and commitment obligation
|
(4,771
|
)
|
(7,965
|
)
|
(9,945
|
)
|
|||||
|
Ending balance, December 31
|
$
|
37,803
|
|
$
|
27,440
|
|
$
|
30,308
|
|
||
(1) Represents the fair value of the guarantee and commitment obligation at inception.
Off-Balance Sheet Farmer Mac Guaranteed Securities
Agricultural real estate mortgage loans, rural utilities loans and other related assets may be placed into trusts that are used as vehicles for the securitization of the transferred assets and the Farmer Mac-guaranteed beneficial interests in the trusts are sold to investors. Farmer Mac is obligated under its guarantee to ensure that the securities make timely payments to investors of principal and interest based on the underlying loans, regardless of whether the trust has actually received such scheduled loan payments. As consideration for Farmer Mac's assumption of the credit risk on these securities, Farmer Mac receives guarantee fees that are recognized as earned on an accrual basis over the life of the loan and based upon the outstanding balance of the Farmer Mac Guaranteed Security.
Farmer Mac is required to perform under its obligation when the underlying loans for the off-balance sheet Farmer Mac Guaranteed Securities do not make their scheduled installment payments. When a loan
174
underlying a Farmer Mac I Guaranteed Security becomes
90
days or more past due, Farmer Mac may, in its sole discretion, repurchase the loan from the trust and generally does repurchase such loans, thereby reducing the principal balance of the outstanding Farmer Mac I Guaranteed Security.
The following table presents the maximum principal amount of potential undiscounted future payments that Farmer Mac could be required to make under all off-balance sheet Farmer Mac Guaranteed Securities as of
December 31, 2012
and
2011
, not including offsets provided by any recourse provisions, recoveries from third parties or collateral for the underlying loans:
|
Outstanding Balance of Off-Balance Sheet Farmer Mac Guaranteed Securities
|
|||||||
|
As of December 31,
|
|||||||
|
|
2012
|
2011
|
|||||
|
|
(in thousands)
|
||||||
|
Farm & Ranch:
|
|
|
|||||
|
Farmer Mac Guaranteed Securities - AgVantage
|
$
|
970,000
|
|
$
|
970,000
|
|
|
|
Farmer Mac Guaranteed Securities
|
911,370
|
|
621,871
|
|
|||
|
USDA Guarantees (Farmer Mac II):
|
|
|
|
|
|||
|
Farmer Mac Guaranteed Securities
|
29,658
|
|
42,088
|
|
|||
|
Rural Utilities:
|
|
|
|
|
|||
|
Farmer Mac Guaranteed Securities - AgVantage
|
12,669
|
|
16,271
|
|
|||
|
Total off-balance sheet Farmer Mac Guaranteed Securities
|
$
|
1,923,697
|
|
$
|
1,650,230
|
|
|
If Farmer Mac repurchases a loan that is collateral for a Farmer Mac Guaranteed Security, Farmer Mac would have the right to enforce the terms of the loan, and in the event of a default, would have access to the underlying collateral. Farmer Mac typically recovers its investment in the defaulted loans purchased either through borrower payments, loan payoffs, payments by third parties or foreclosure and sale of the property securing the loans.
Farmer Mac has recourse to the USDA for any amounts advanced for the timely payment of principal and interest on Farmer Mac II Guaranteed Securities. That recourse is the USDA guarantee, a full faith and credit obligation of the United States that becomes enforceable if a lender fails to repurchase the USDA-guaranteed portion from its owner within
30
days after written demand from the owner when (a) the borrower under the guaranteed loan is in default not less than
60
days in the payment of any principal or interest due on the USDA-guaranteed portion, or (b) the lender has failed to remit to the owner the payment made by the borrower on the USDA-guaranteed portion or any related loan subsidy within
30
days after the lender's receipt of the payment.
Eligible loans and other eligible assets may be placed into trusts that are used as vehicles for the securitization of the transferred assets and the Farmer Mac-guaranteed beneficial interests in the trusts are sold to investors. The following table summarizes the significant cash flows received from and paid to trusts used for Farmer Mac securitizations:
|
|
For the Year Ended December 31,
|
||||||||||
|
|
2012
|
2011
|
2010
|
||||||||
|
|
(in thousands)
|
||||||||||
|
Proceeds from new securitizations
|
$
|
38,063
|
|
$
|
25,674
|
|
$
|
30,725
|
|
||
|
Guarantee fees received
|
5,197
|
|
7,520
|
|
7,592
|
|
|||||
|
Purchases of assets from the trusts
|
(8,933
|
)
|
(7,471
|
)
|
(3,456
|
)
|
|||||
175
Farmer Mac has recorded a liability for its obligation to stand ready under the guarantee in the guarantee and commitment obligation on the consolidated balance sheets. This liability approximated
$15.8 million
as of
December 31, 2012
and
$12.3 million
as of
December 31, 2011
. During
second quarter
2012
, Farmer Mac deconsolidated
$460.3 million
of certain securitization trusts created when loans subject to LTSPCs were converted to Farmer Mac I Guaranteed Securities because Farmer Mac was no longer determined to be the primary beneficiary when the counterparty to the transaction ceased being a related party as a result of changes to the membership of Farmer Mac's board of directors. This deconsolidation resulted in an increase to the guarantee and commitment obligation of
$5.9 million
as of
June 30, 2012
. See Note 2(q) for more information. As of
December 31, 2012
and
2011
, the weighted-average remaining maturity of all loans underlying off-balance sheet Farmer Mac Guaranteed Securities, excluding AgVantage securities, was
13.4 years
and
13.3 years
, respectively. As of
December 31, 2012
and
2011
, the weighted-average remaining maturity of the off-balance sheet AgVantage securities was
4.7 years
and
5.3 years
.
Long-Term Standby Purchase Commitments
An LTSPC is a commitment by Farmer Mac to purchase eligible loans from an identified pool of loans under enumerated circumstances, either for cash or in exchange for Farmer Mac I Guaranteed Securities, on one or more undetermined future dates. As consideration for its assumption of the credit risk on loans underlying an LTSPC, Farmer Mac receives a commitment fee payable monthly in arrears in an amount approximating what would have been the guarantee fee if the transaction were structured as a swap for Farmer Mac Guaranteed Securities.
An LTSPC permits a seller to nominate from its portfolio an identified pool of loans for participation in the Farmer Mac I program, which are retained in the seller's portfolio and serviced by the seller. Farmer Mac reviews the loan pool to confirm that it conforms to Farmer Mac's underwriting standards. Upon Farmer Mac's approval of the eligible loans, the seller effectively transfers the credit risk on those loans to Farmer Mac, thereby reducing the seller's credit and concentration risk exposures and, consequently, its regulatory capital requirements and its loss reserve requirements. Credit risk is transferred through Farmer Mac's commitment to purchase the identified loans from the counterparty based on Farmer Mac's original credit review and acceptance of the credit risk on the loans.
The specific events or circumstances that would require Farmer Mac to purchase some or all of the loans subject to LTSPCs include: (1) the failure of the borrower under any loan to make installment payments under that loan for a period of either
90
days or
120
days (depending on the provisions of the applicable agreement); or (2) the determination by the holder of the LTSPC to sell or exchange some or all of the loans under the LTSPC to Farmer Mac.
Farmer Mac purchases loans subject to an LTSPC at:
|
•
|
par if the loans become delinquent for either
90
days or
120
days (depending on the agreement) or are in material non-monetary default, with accrued and unpaid interest on the defaulted loans payable out of any future loan payments or liquidation proceeds; or
|
|
•
|
a mark-to-market price or in exchange for Farmer Mac I Guaranteed Securities (if the loans are not delinquent), in accordance with the terms of the applicable agreement.
|
176
The maximum principal amount of potential undiscounted future payments that Farmer Mac could be requested to make under all LTSPCs, not including offsets provided by any recourse provisions, recoveries from third parties or collateral for the underlying loans, was
$2.2 billion
as of
December 31, 2012
and
$1.8 billion
as of
December 31, 2011
.
In the event of loan default, Farmer Mac would have the right to enforce the terms of the loans including the right to foreclose upon the collateral underlying such loans. Farmer Mac believes that it will typically recover its investment in the defaulted loans purchased either through borrower payments, loan payoffs, payments by third parties or foreclosure and sale of the collateral.
As of
December 31, 2012
and
2011
, the weighted-average remaining maturity of all loans underlying LTSPCs was
13.6 years
and
13.8 years
, respectively. For those LTSPCs issued or modified on or after January 1, 2003, Farmer Mac has recorded a liability for its obligation to stand ready under the commitment in the guarantee and commitment obligation on the consolidated balance sheet. This liability approximated
$22.0 million
as of
December 31, 2012
and
$15.1 million
as of
December 31, 2011
.
Commitments
Farmer Mac enters into mandatory and optional delivery commitments to purchase loans. Most loan purchase commitments entered into by Farmer Mac are mandatory commitments, in which Farmer Mac charges a fee to extend or cancel the commitment. As of
December 31, 2012
and
2011
, commitments to purchase Farm & Ranch loans and USDA Guarantees totaled
$71.4 million
and
$48.4 million
, respectively, all of which were mandatory commitments. As of
December 31, 2012
and
2011
, commitments to purchase rural utilities loans totaled
$5.3 million
and
$17.7 million
, respectively. Any optional loan purchase commitments are sold forward under optional commitments to deliver Farmer Mac Guaranteed Securities that may be canceled by Farmer Mac without penalty.
Farmer Mac is exposed to interest rate risk from the time it commits to purchase a loan to the time it either: (a) sells Farmer Mac Guaranteed Securities backed by the loan or (b) issues debt to retain the loan in its portfolio. There were no commitments to sell Farmer Mac Guaranteed Securities as of December 31, 2012 and 2011. Farmer Mac manages the interest rate risk related to loans not yet sold or funded as a retained investment through the use of forward sale contracts on the debt of other GSEs and futures contracts involving U.S. Treasury securities. For more information on financial derivatives see Note 2(h) and Note 6.
177
Rental expense for Farmer Mac's office space for each of the years ended
December 31, 2012
,
2011
and
2010
was
$1.3 million
,
$1.6 million
and
$0.7 million
, respectively. The future minimum lease payments under Farmer Mac's non-cancelable leases for its office space and other contractual obligations are as follows:
|
Future Minimum Lease Payments
|
Other Contractual Obligations
|
||||||
|
|
(in thousands)
|
||||||
|
2013
|
$
|
1,246
|
|
$
|
630
|
|
|
|
2014
|
1,264
|
|
94
|
|
|||
|
2015
|
1,281
|
|
6
|
|
|||
|
2016
|
1,289
|
|
—
|
|
|||
|
2017
|
1,322
|
|
—
|
|
|||
|
Thereafter
|
9,694
|
|
—
|
|
|||
|
Total
|
$
|
16,096
|
|
$
|
730
|
|
|
Other contractual obligations in the table above include minimum amounts due under non-cancelable agreements to purchase goods or services that are enforceable and legally binding and specify all significant terms. These agreements include agreements for the provision of consulting services, information technology support, equipment maintenance, and financial analysis software and services. The amounts actually paid under these agreements will likely be higher due to the variable components of some of these agreements under which the ultimate obligation owed is determined by reference to actual usage or hours worked.
|
13.
|
FAIR VALUE DISCLOSURES
|
Fair Value Measurement
Fair value is defined as the price that would be received to sell an asset or paid to transfer a liability in an orderly transaction between market participants at the measurement date (also referred to as an exit price).
In determining fair value, Farmer Mac uses various valuation approaches, including market and income approaches. The fair value hierarchy requires an entity to maximize the use of observable inputs and minimize the use of unobservable inputs when measuring fair value. When available, the fair value of Farmer Mac's financial instruments is based on quoted market prices, valuation techniques that use observable market-based inputs or unobservable inputs that are corroborated by market data. Pricing information obtained from third parties is internally validated for reasonableness prior to use in the consolidated financial statements.
When observable market prices are not readily available, Farmer Mac estimates fair value using techniques that rely on alternate market data or internally-developed models using significant inputs that are generally less readily observable. Market data includes prices of financial instruments with similar maturities and characteristics, interest rate yield curves, measures of volatility and prepayment rates. If market data needed to estimate fair value is not available, Farmer Mac estimates fair value using internally-developed models that employ a discounted cash flow approach. Even when market assumptions are not readily available, Farmer Mac's assumptions reflect those that market participants would likely use in pricing the asset or liability at the measurement date.
178
The fair value hierarchy ranks the quality and reliability of the information used to determine fair values. The hierarchy gives highest priority to unadjusted quoted prices in active markets for identical assets or liabilities and the lowest priority to unobservable inputs. The standard describes the following three levels used to classify fair value measurements:
|
Level 1
|
Unadjusted quoted prices in active markets that are accessible at the measurement date for identical, unrestricted assets or liabilities.
|
|
Level 2
|
Quoted prices in markets that are not active or financial instruments for which all significant inputs are observable, either directly or indirectly.
|
|
Level 3
|
Prices or valuations that require unobservable inputs that are significant to the fair value measurement.
|
Farmer Mac performs a detailed analysis of the assets and liabilities carried at fair value to determine the appropriate level based on the transparency of the inputs used in the valuation techniques. In certain cases, the inputs used to measure fair value may fall into different levels of the fair value hierarchy. In such cases, an instrument's level within the fair value hierarchy is based on the lowest level of input that is significant to the fair value measurement. Farmer Mac's assessment of the significance of a particular input to the fair value measurement of an instrument requires judgment and consideration of factors specific to the instrument. While Farmer Mac believes its valuation methods are appropriate and consistent with those of other market participants, using different methodologies or assumptions to determine fair value could result in a materially different estimate of fair value for some financial instruments.
The following is a description of the fair value techniques used for instruments measured at fair value as well as the general classification of such instruments pursuant to the valuation hierarchy described above. Fair value measurements related to financial instruments that are reported at fair value in the consolidated financial statements each period are referred to as recurring fair value measurements. Fair value measurements related to financial instruments that are not reported at fair value each period but are subject to fair value adjustments in certain circumstances are referred to as nonrecurring fair value measurements.
Recurring Fair Value Measurements and Classification
Available-for-Sale and Trading Investment Securities
The fair value of investments in U.S. Treasuries is based on unadjusted quoted prices in active markets. Farmer Mac classifies these fair value measurements as level 1.
For a significant portion of Farmer Mac's investment portfolio, including most asset-backed securities, corporate debt securities, senior agency debt securities, Government/GSE guaranteed mortgage-backed securities, commercial paper and preferred stock issued by GSEs, fair value is primarily determined using a reputable and nationally recognized third party pricing service. The prices obtained are non-binding and generally representative of recent market trades. The fair value of certain asset-backed and Government guaranteed mortgage-backed securities are estimated based on quotations from brokers or dealers. Farmer Mac corroborates its primary valuation source by obtaining a secondary price from another independent third party pricing service. Farmer Mac classifies these fair value measurements as level 2.
179
For certain investment securities that are thinly traded or not quoted, Farmer Mac estimates fair value using internally-developed models that employ a discounted cash flow approach. Farmer Mac maximizes the use of observable market data, including prices of financial instruments with similar maturities and characteristics, interest rate yield curves, measures of volatility and prepayment rates. Farmer Mac generally considers a market to be thinly traded or not quoted if the following conditions exist: (1) there are few transactions for the financial instruments; (2) the prices in the market are not current; (3) the price quotes vary significantly either over time or among independent pricing services or dealers; or (4) there is limited availability of public market information. Farmer Mac classifies these fair value measurements as level 3.
Farmer Mac's investment securities include callable, highly rated auction-rate certificates ("ARCs"), the interest rates on which are reset through an auction process, most commonly at intervals of
28 days
, or at formula-based floating rates as set forth in the related transaction documents in the event of a failed auction. These formula-based floating rates, which may at times reset to zero, are intended to preserve the underlying principal balance of the securities and avoid overall cash shortfalls. Accordingly, payments of accrued interest may also be delayed and are ultimately subject to cash availability. Beginning in mid-February 2008, there were widespread failures of the auction mechanism designed to provide regular liquidity to these types of securities. Consequently, Farmer Mac has not sold any of its ARCs into the auctions since that time. All ARCs held by Farmer Mac are collateralized entirely by pools of Federal Family Education Loan Program ("FFELP") guaranteed student loans that are backed by the full faith and credit of the United States. Farmer Mac continues to believe that the credit quality of these securities is high, based on the underlying collateralization and the securities' ratings. To date, Farmer Mac has received all interest due on ARCs it holds and expects to continue to do so.
Farmer Mac classifies its estimates of fair value for ARCs as level 3 measurements. During 2012 and 2011, Farmer Mac used unadjusted quotes from a broker specializing in these types of securities to determine the estimated fair value of these investments as of each quarter end. Through discussions with the broker, Farmer Mac gained an understanding of the assumptions underlying the broker quotes and independently benchmarked those quotes against other dealer price indications. Farmer Mac believes the broker quotes are the best indication of fair value as of the measurement date although there is uncertainty regarding the ability to transact at such levels. Considering there is no active secondary market for these securities, although limited observable transactions do occasionally occur, price quotes vary significantly among dealers or independent pricing services, if provided at all, and there is little transparency in the price determination, Farmer Mac believes these measurements are appropriately classified as level 3.
Net transfers in and/or out of the different levels within the fair value hierarchy are based on the fair values of the assets and liabilities as of the beginning of the reporting period. There were no transfers within the fair value hierarchy for fair value measurements of Farmer Mac's investment securities during 2012 and 2011.
During 2010, Farmer Mac transferred its investments in the subordinated debt and preferred stock of CoBank, ACB and its investment in the preferred stock of AgFirst Farm Credit Bank, with par values of
$70.0 million
,
$88.5 million
, and
$88.0 million
, respectively, as of December 31, 2009, from level 3 measurements to level 2 measurements. Taking into consideration its own recently executed trades during first quarter 2010, along with an increase in observable trading activity for these securities, Farmer Mac determined that the best estimates of fair value for these securities as of March 31, 2010, and continuing throughout 2011, were the fair values provided by an independent third party pricing service.
180
Available-for-Sale and Trading Farmer Mac Guaranteed Securities and USDA Guaranteed Securities
Farmer Mac estimates the fair value of its Farmer Mac Guaranteed Securities and USDA Guaranteed Securities by discounting the projected cash flows of these instruments at projected interest rates. The fair values are based on the present value of expected cash flows using management's best estimate of certain key assumptions, which include prepayment speeds, forward yield curves, and discount rates commensurate with the risks involved. Farmer Mac classifies these fair value measurements as level 3 because there is limited market activity and therefore little or no price transparency. On a sample basis, Farmer Mac corroborates the fair value of its Farmer Mac Guaranteed Securities and USDA Guaranteed Securities by obtaining a secondary valuation from an independent third party service.
Farmer Mac made no transfers within the fair value hierarchy for fair value measurements of Farmer Mac Guaranteed Securities and USDA Guaranteed Securities during 2012 and 2011. Transfers out of level 3 during 2010 resulted from the consolidation of certain trusts whereby the underlying assets were no longer reported at fair value on a recurring basis. Transfers out of level 3 are based on the fair values of the assets as of the beginning of the reporting period and are described in more detail below.
Upon the adoption of the new consolidation guidance on January 1, 2010, Farmer Mac was deemed to be the primary beneficiary of certain VIEs where Farmer Mac held beneficial interests in trusts used as vehicles for the securitization of agricultural real estate mortgage loans or rural utilities loans. Prior to 2010, Farmer Mac presented these beneficial interests as "Farmer Mac Guaranteed Securities" on the consolidated balance sheets and reported them at their fair value. Upon consolidation, Farmer Mac transferred these assets from "Farmer Mac Guaranteed Securities" to "Loans held for investment in consolidated trusts." These loans are reported at their amortized cost and are no longer included in recurring fair value measurements. Farmer Mac transferred these securities out of level 3 based on their fair values as of the beginning of first quarter 2010.
Financial Derivatives
The fair value of exchange-traded U.S. Treasury futures is based on unadjusted quoted prices for identical financial instruments. Farmer Mac classifies these fair value measurements as level 1.
Farmer Mac's derivative portfolio consists primarily of interest rate swaps, credit default swaps, and forward sales contracts on the debt of other GSEs. Farmer Mac estimates the fair value of these financial instruments primarily based upon the counterparty valuations. Farmer Mac internally values its derivative portfolio using a discounted cash flow valuation technique and obtains a secondary valuation for certain interest rate swaps to corroborate the counterparty valuations. Farmer Mac also regularly reviews the counterparty valuations as part of the collateral exchange process. Farmer Mac classifies these fair value measurements as level 2.
Certain basis swaps are nonstandard interest rate swap structures and are therefore internally modeled using significant assumptions and unobservable inputs, resulting in level 3 classification. Farmer Mac uses a discounted cash flow valuation technique, using management's best estimate of certain key assumptions, which include prepayment speeds, forward yield curves, and discount rates commensurate with the risks involved.
As of
December 31, 2012
, the consideration of credit risk, Farmer Mac's and the counterparties, resulted in an adjustment of
$0.6 million
to the valuations of Farmer Mac's derivative portfolio. As of
181
December 31, 2011
, the consideration of credit risk, Farmer Mac's and the counterparties, resulted in an adjustment of
$0.2 million
to the valuations of Farmer Mac's derivative portfolio. See Note 2(h) and Note 6 for further information regarding Farmer Mac's derivative portfolio.
Nonrecurring Fair Value Measurements and Classification
Loans Held-for-Sale
Loans held for sale are reported at the lower of cost or fair value in the consolidated balance sheets. Farmer Mac internally models the fair value of loans by discounting the projected cash flows of these instruments at projected interest rates. The fair values are based on the present value of expected cash flows using management's best estimate of certain key assumptions, which include prepayment speeds, forward yield curves and discount rates commensurate with the risks involved. The fair values of these instruments are classified as level 3 measurements. As of
December 31, 2012
, Farmer Mac recorded an adjustment of
$5.9 million
to report loans held for sale at the lower of cost or fair value. As of
December 31, 2011
, the fair values of loans held for sale exceeded their cost amounts. Accordingly, Farmer Mac recorded no adjustment to report these loans at the lower of cost or fair value.
Loans Held for Investment
Certain loans in Farmer Mac's held for investment loan portfolio are measured at fair value when they are determined to be impaired. For these impaired loans, the fair value of the loan generally is based on the fair value of the underlying property, which is determined by recent third-party appraisals. Farmer Mac reports these loans at their estimated net realizable value (fair value less estimated costs to sell) and classifies the fair values as level 3 measurements. Farmer Mac uses net realizable value as a reasonable estimate of fair value in the tables below.
When recent third-party appraisals are not available, Farmer Mac measures loan impairment in the aggregate in consideration of the similar risk characteristics of the assets and historical statistics, and does not include these impaired loans in the tables below.
Real Estate Owned
Farmer Mac initially records REO properties at net realizable value and subsequently records them at the lower of carrying value or net realizable value. The fair value of the REO generally is based on third-party appraisals. Farmer Mac classifies the REO fair values as level 3 measurements. Farmer Mac uses net realizable value as a reasonable estimate of fair value in the tables below.
182
Fair Value Classification and Transfers
As of
December 31, 2012
, Farmer Mac's assets and liabilities recorded at fair value included financial instruments valued at
$7.1 billion
whose fair values were estimated by management in the absence of readily determinable fair values (i.e., level 3). These financial instruments measured as level 3 represented
56 percent
of total assets and
73 percent
of financial instruments measured at fair value as of
December 31, 2012
. As of
December 31, 2011
, Farmer Mac's assets and liabilities recorded at fair value included financial instruments valued at
$5.9 billion
whose fair values were estimated by management in the absence of readily determinable fair values. These financial instruments measured as level 3
represented
49 percent
of total assets and
72 percent
of financial instruments measured at fair value as of
December 31, 2011
.
183
The following tables present information about Farmer Mac's assets and liabilities measured at fair value on a recurring and nonrecurring basis as of
December 31, 2012
and
December 31, 2011
, respectively, and indicate the fair value hierarchy of the valuation techniques used by Farmer Mac to determine such fair value:
|
Assets and Liabilities Measured at Fair Value as of December 31, 2012
|
|||||||||||||||
|
|
Level 1
|
Level 2
|
Level 3
|
Total
|
|||||||||||
|
|
(in thousands)
|
||||||||||||||
|
Recurring:
|
|
||||||||||||||
|
Assets:
|
|
|
|
|
|||||||||||
|
Investment Securities:
|
|
|
|
|
|||||||||||
|
Available-for-sale:
|
|
|
|
|
|||||||||||
|
Floating rate auction-rate certificates backed by Government guaranteed student loans
|
$
|
—
|
|
$
|
—
|
|
$
|
63,159
|
|
$
|
63,159
|
|
|||
|
Floating rate asset-backed securities
|
—
|
|
151,044
|
|
—
|
|
151,044
|
|
|||||||
|
Fixed rate asset-backed securities
|
—
|
|
6,501
|
|
—
|
|
6,501
|
|
|||||||
|
Floating rate corporate debt securities
|
—
|
|
76,763
|
|
—
|
|
76,763
|
|
|||||||
|
Fixed rate corporate debt
|
—
|
|
52,416
|
|
—
|
|
52,416
|
|
|||||||
|
Floating rate Government/GSE guaranteed mortgage-backed securities
|
—
|
|
712,859
|
|
—
|
|
712,859
|
|
|||||||
|
Fixed rate GSE guaranteed mortgage-backed securities
|
—
|
|
2,065
|
|
—
|
|
2,065
|
|
|||||||
|
Floating rate GSE subordinated debt
|
—
|
|
57,431
|
|
—
|
|
57,431
|
|
|||||||
|
Fixed rate commercial paper
|
—
|
|
—
|
|
—
|
|
—
|
|
|||||||
|
Fixed rate GSE preferred stock
|
—
|
|
87,086
|
|
—
|
|
87,086
|
|
|||||||
|
Floating rate senior agency debt
|
—
|
|
50,055
|
|
—
|
|
50,055
|
|
|||||||
|
Fixed rate senior agency debt
|
—
|
|
73,114
|
|
—
|
|
73,114
|
|
|||||||
|
Fixed rate U.S. Treasuries
|
1,165,889
|
|
—
|
|
—
|
|
1,165,889
|
|
|||||||
|
Total available-for-sale
|
1,165,889
|
|
1,269,334
|
|
63,159
|
|
2,498,382
|
|
|||||||
|
Trading:
|
|
|
|
|
|
|
|
|
|||||||
|
Floating rate asset-backed securities
|
—
|
|
—
|
|
1,247
|
|
1,247
|
|
|||||||
|
Total trading
|
—
|
|
—
|
|
1,247
|
|
1,247
|
|
|||||||
|
Total Investment Securities
|
1,165,889
|
|
1,269,334
|
|
64,406
|
|
2,499,629
|
|
|||||||
|
Farmer Mac Guaranteed Securities:
|
|
|
|
|
|
|
|
|
|||||||
|
Available-for-sale:
|
|
|
|
|
|
|
|
|
|||||||
|
Farmer Mac I
|
—
|
|
—
|
|
3,426,489
|
|
3,426,489
|
|
|||||||
|
Farmer Mac II
|
—
|
|
—
|
|
26,681
|
|
26,681
|
|
|||||||
|
Rural Utilities
|
—
|
|
—
|
|
1,313,088
|
|
1,313,088
|
|
|||||||
|
Total Farmer Mac Guaranteed Securities
|
—
|
|
—
|
|
4,766,258
|
|
4,766,258
|
|
|||||||
|
USDA Guaranteed Securities:
|
|
|
|
|
|
|
|
|
|||||||
|
Available-for-sale
|
—
|
|
—
|
|
1,486,595
|
|
1,486,595
|
|
|||||||
|
Trading
|
—
|
|
—
|
|
104,188
|
|
104,188
|
|
|||||||
|
Total USDA Guaranteed Securities
|
—
|
|
—
|
|
1,590,783
|
|
1,590,783
|
|
|||||||
|
Financial derivatives
|
—
|
|
31,173
|
|
—
|
|
31,173
|
|
|||||||
|
Total Assets at fair value
|
$
|
1,165,889
|
|
$
|
1,300,507
|
|
$
|
6,421,447
|
|
$
|
8,887,843
|
|
|||
|
Liabilities:
|
|
|
|
|
|
|
|
|
|||||||
|
Financial derivatives
|
$
|
12
|
|
$
|
149,979
|
|
$
|
691
|
|
$
|
150,682
|
|
|||
|
Total Liabilities at fair value
|
$
|
12
|
|
$
|
149,979
|
|
$
|
691
|
|
$
|
150,682
|
|
|||
|
Nonrecurring:
|
|
|
|
|
|
|
|
|
|||||||
|
Assets:
|
|
|
|
|
|
|
|
|
|||||||
|
Loans held for sale
|
$
|
—
|
|
$
|
—
|
|
$
|
657,154
|
|
$
|
657,154
|
|
|||
|
Loans held for investment
|
—
|
|
—
|
|
8,130
|
|
8,130
|
|
|||||||
|
REO
|
—
|
|
—
|
|
1,704
|
|
1,704
|
|
|||||||
|
Total Nonrecurring Assets at fair value
|
$
|
—
|
|
$
|
—
|
|
$
|
666,988
|
|
$
|
666,988
|
|
|||
184
|
Assets and Liabilities Measured at Fair Value as of December 31, 2011
|
|||||||||||||||
|
|
Level 1
|
Level 2
|
Level 3
|
Total
|
|||||||||||
|
|
(in thousands)
|
||||||||||||||
|
Recurring:
|
|
||||||||||||||
|
Assets:
|
|
|
|
|
|||||||||||
|
Investment Securities:
|
|
|
|
|
|||||||||||
|
Available-for-sale:
|
|
|
|
|
|||||||||||
|
Floating rate auction-rate certificates backed by Government guaranteed student loans
|
$
|
—
|
|
$
|
—
|
|
$
|
60,213
|
|
$
|
60,213
|
|
|||
|
Floating rate asset-backed securities
|
—
|
|
178,560
|
|
—
|
|
178,560
|
|
|||||||
|
Floating rate corporate debt securities
|
—
|
|
73,833
|
|
—
|
|
73,833
|
|
|||||||
|
Floating rate Government/GSE guaranteed mortgage-backed securities
|
—
|
|
764,038
|
|
—
|
|
764,038
|
|
|||||||
|
Fixed rate GSE guaranteed mortgage-backed securities
|
—
|
|
3,360
|
|
—
|
|
3,360
|
|
|||||||
|
Floating rate GSE subordinated debt
|
—
|
|
52,562
|
|
—
|
|
52,562
|
|
|||||||
|
Fixed rate GSE preferred stock
|
—
|
|
84,878
|
|
—
|
|
84,878
|
|
|||||||
|
Fixed rate corporate debt
|
—
|
|
38,699
|
|
—
|
|
38,699
|
|
|||||||
|
Fixed rate commercial paper
|
—
|
|
10,000
|
|
—
|
|
10,000
|
|
|||||||
|
Fixed rate U.S. Treasuries
|
799,266
|
|
—
|
|
—
|
|
799,266
|
|
|||||||
|
Senior agency debt
|
—
|
|
117,285
|
|
—
|
|
117,285
|
|
|||||||
|
Total available-for-sale
|
799,266
|
|
1,323,215
|
|
60,213
|
|
2,182,694
|
|
|||||||
|
Trading:
|
|
|
|
|
|
|
|
|
|||||||
|
Floating rate asset-backed securities
|
—
|
|
—
|
|
1,796
|
|
1,796
|
|
|||||||
|
Total trading
|
—
|
|
—
|
|
1,796
|
|
1,796
|
|
|||||||
|
Total Investment Securities
|
799,266
|
|
1,323,215
|
|
62,009
|
|
2,184,490
|
|
|||||||
|
Farmer Mac Guaranteed Securities:
|
|
|
|
|
|
|
|
|
|||||||
|
Available-for-sale:
|
|
|
|
|
|
|
|
|
|||||||
|
Farmer Mac I
|
—
|
|
—
|
|
2,807,627
|
|
2,807,627
|
|
|||||||
|
Farmer Mac II
|
—
|
|
—
|
|
35,599
|
|
35,599
|
|
|||||||
|
Rural Utilities
|
—
|
|
—
|
|
1,446,046
|
|
1,446,046
|
|
|||||||
|
Total Farmer Mac Guaranteed Securities
|
—
|
|
—
|
|
4,289,272
|
|
4,289,272
|
|
|||||||
|
USDA Guaranteed Securities:
|
|
|
|
|
|
|
|
|
|||||||
|
Available-for-sale
|
—
|
|
—
|
|
1,279,546
|
|
1,279,546
|
|
|||||||
|
Trading
|
—
|
|
—
|
|
212,359
|
|
212,359
|
|
|||||||
|
Total USDA Guaranteed Securities
|
—
|
|
—
|
|
1,491,905
|
|
1,491,905
|
|
|||||||
|
Financial derivatives
|
—
|
|
40,250
|
|
—
|
|
40,250
|
|
|||||||
|
Total Assets at fair value
|
$
|
799,266
|
|
$
|
1,363,465
|
|
$
|
5,843,186
|
|
$
|
8,005,917
|
|
|||
|
Liabilities:
|
|
|
|
|
|
|
|
|
|||||||
|
Financial derivatives
|
$
|
—
|
|
$
|
158,689
|
|
$
|
1,335
|
|
$
|
160,024
|
|
|||
|
Total Liabilities at fair value
|
$
|
—
|
|
$
|
158,689
|
|
$
|
1,335
|
|
$
|
160,024
|
|
|||
|
Nonrecurring:
|
|
|
|
|
|
|
|
|
|||||||
|
Assets:
|
|
|
|
|
|
|
|
|
|||||||
|
Loans Held for sale
|
$
|
—
|
|
$
|
—
|
|
$
|
—
|
|
$
|
—
|
|
|||
|
Loans held for investment
|
—
|
|
—
|
|
10,118
|
|
10,118
|
|
|||||||
|
REO
|
—
|
|
—
|
|
1,296
|
|
1,296
|
|
|||||||
|
Total Nonrecurring Assets at fair value
|
$
|
—
|
|
$
|
—
|
|
$
|
11,414
|
|
$
|
11,414
|
|
|||
185
The following tables present additional information about assets and liabilities measured at fair value on a recurring basis for which Farmer Mac has used significant unobservable inputs to determine fair value. Net transfers in and/or out of level 3 are based on the fair values of the assets and liabilities as of the beginning of the reporting period.
|
Level 3 Assets and Liabilities Measured at Fair Value for the Year Ended December 31, 2012
|
|||||||||||||||||||||||||||
|
|
Beginning
Balance |
Purchases
|
Sales
|
Settlements
|
Realized and
Unrealized Gains/ (Losses) included in Income |
Unrealized
Gains/(Losses) included in Other Comprehen-sive Income |
Ending
Balance |
||||||||||||||||||||
|
|
(in thousands)
|
||||||||||||||||||||||||||
|
Recurring:
|
|
||||||||||||||||||||||||||
|
Assets:
|
|
|
|
|
|
||||||||||||||||||||||
|
Investment Securities:
|
|
|
|
|
|
||||||||||||||||||||||
|
Available-for-sale:
|
|
|
|
|
|
||||||||||||||||||||||
|
Floating rate auction-rate certificates backed by Government guaranteed student loans
|
$
|
60,213
|
|
$
|
—
|
|
$
|
—
|
|
$
|
—
|
|
$
|
—
|
|
$
|
2,946
|
|
$
|
63,159
|
|
||||||
|
Total available-for-sale
|
60,213
|
|
—
|
|
—
|
|
—
|
|
—
|
|
2,946
|
|
63,159
|
|
|||||||||||||
|
Trading:
|
|
|
|
|
|
|
|
|
|
|
|||||||||||||||||
|
Floating rate asset-backed securities(1)
|
1,796
|
|
—
|
|
—
|
|
(812
|
)
|
263
|
|
—
|
|
1,247
|
|
|||||||||||||
|
Total trading
|
1,796
|
|
—
|
|
—
|
|
(812
|
)
|
263
|
|
—
|
|
1,247
|
|
|||||||||||||
|
Total Investment Securities
|
62,009
|
|
—
|
|
—
|
|
(812
|
)
|
263
|
|
2,946
|
|
64,406
|
|
|||||||||||||
|
Farmer Mac Guaranteed Securities:
|
|
|
|
|
|
|
|
|
|
|
|||||||||||||||||
|
Available-for-sale:
|
|
|
|
|
|
|
|
|
|
|
|||||||||||||||||
|
Farmer Mac I
|
2,807,627
|
|
601,000
|
|
—
|
|
(2,832
|
)
|
6,388
|
|
14,306
|
|
3,426,489
|
|
|||||||||||||
|
Farmer Mac II
|
35,599
|
|
5,327
|
|
(5,327
|
)
|
(8,907
|
)
|
—
|
|
(11
|
)
|
26,681
|
|
|||||||||||||
|
Rural Utilities
|
1,446,046
|
|
383,406
|
|
—
|
|
(495,701
|
)
|
—
|
|
(20,663
|
)
|
1,313,088
|
|
|||||||||||||
|
Total Farmer Mac Guaranteed Securities
|
4,289,272
|
|
989,733
|
|
(5,327
|
)
|
(507,440
|
)
|
6,388
|
|
(6,368
|
)
|
4,766,258
|
|
|||||||||||||
|
USDA Guaranteed Securities:
|
|
|
|
|
|
|
|
|
|
|
|||||||||||||||||
|
Available-for-sale
|
1,279,546
|
|
479,324
|
|
—
|
|
(256,685
|
)
|
—
|
|
(15,590
|
)
|
1,486,595
|
|
|||||||||||||
|
Trading(2)
|
212,359
|
|
—
|
|
—
|
|
(108,215
|
)
|
44
|
|
—
|
|
104,188
|
|
|||||||||||||
|
Total USDA Guaranteed Securities
|
1,491,905
|
|
479,324
|
|
—
|
|
(364,900
|
)
|
44
|
|
(15,590
|
)
|
1,590,783
|
|
|||||||||||||
|
Total Assets at fair value
|
$
|
5,843,186
|
|
$
|
1,469,057
|
|
$
|
(5,327
|
)
|
$
|
(873,152
|
)
|
$
|
6,695
|
|
$
|
(19,012
|
)
|
$
|
6,421,447
|
|
||||||
|
Liabilities:
|
|
|
|
|
|
|
|
|
|
|
|||||||||||||||||
|
Financial derivatives(3)
|
$
|
(1,335
|
)
|
$
|
—
|
|
$
|
—
|
|
$
|
—
|
|
$
|
644
|
|
$
|
—
|
|
$
|
(691
|
)
|
||||||
|
Total Liabilities at fair value
|
$
|
(1,335
|
)
|
$
|
—
|
|
$
|
—
|
|
$
|
—
|
|
$
|
644
|
|
$
|
—
|
|
$
|
(691
|
)
|
||||||
|
(1)
|
Unrealized gains are attributable to assets still held as of
December 31, 2012
and are recorded in
Gains on trading assets
.
|
|
(2)
|
Includes unrealized
gains
of
$0.3 million
attributable to assets still held as of
December 31, 2012
that are recorded in
Gains on trading assets
.
|
|
(3)
|
Unrealized gains are attributable to liabilities still held as of
December 31, 2012
and are recorded in
Losses on financial derivatives and hedging activities
.
|
186
|
Level 3 Assets and Liabilities Measured at Fair Value for the Year Ended December 31, 2011
|
|||||||||||||||||||||||||||
|
|
Beginning
Balance |
Purchases
|
Sales
|
Settlements
|
Realized and
Unrealized Gains/ (Losses) included in Income |
Unrealized
Gains/(Losses) included in Other Comprehen-sive Income |
Ending
Balance |
||||||||||||||||||||
|
|
(in thousands)
|
||||||||||||||||||||||||||
|
Recurring:
|
|
||||||||||||||||||||||||||
|
Assets:
|
|
|
|
|
|
||||||||||||||||||||||
|
Investment Securities:
|
|
|
|
|
|
||||||||||||||||||||||
|
Available-for-sale:
|
|
|
|
|
|
||||||||||||||||||||||
|
Floating rate auction-rate certificates backed by Government guaranteed student loans
|
$
|
64,335
|
|
$
|
—
|
|
$
|
—
|
|
$
|
—
|
|
$
|
—
|
|
$
|
(4,122
|
)
|
$
|
60,213
|
|
||||||
|
Total available-for-sale
|
64,335
|
|
—
|
|
—
|
|
—
|
|
—
|
|
(4,122
|
)
|
60,213
|
|
|||||||||||||
|
Trading:
|
|
|
|
|
|
|
|
|
|
|
|||||||||||||||||
|
Floating rate asset-backed securities(1)
|
1,400
|
|
—
|
|
—
|
|
(822
|
)
|
1,218
|
|
—
|
|
1,796
|
|
|||||||||||||
|
Total Trading
|
1,400
|
|
—
|
|
—
|
|
(822
|
)
|
1,218
|
|
—
|
|
1,796
|
|
|||||||||||||
|
Total Investment Securities
|
65,735
|
|
—
|
|
|
—
|
|
|
(822
|
)
|
|
1,218
|
|
|
(4,122
|
)
|
|
62,009
|
|
||||||||
|
Farmer Mac Guaranteed Securities:
|
|
|
|
|
|
|
|
|
|
|
|||||||||||||||||
|
Available-for-sale:
|
|
|
|
|
|
|
|
|
|
|
|||||||||||||||||
|
Farmer Mac I
|
942,809
|
|
1,801,500
|
|
—
|
|
(2,031
|
)
|
—
|
|
65,349
|
|
2,807,627
|
|
|||||||||||||
|
Farmer Mac II
|
37,637
|
|
3,268
|
|
(3,268
|
)
|
(4,334
|
)
|
—
|
|
2,296
|
|
35,599
|
|
|||||||||||||
|
Rural Utilities
|
1,926,818
|
|
—
|
|
—
|
|
(476,400
|
)
|
—
|
|
(4,372
|
)
|
1,446,046
|
|
|||||||||||||
|
Total Farmer Mac Guaranteed Securities
|
2,907,264
|
|
1,804,768
|
|
(3,268
|
)
|
(482,765
|
)
|
—
|
|
63,273
|
|
4,289,272
|
|
|||||||||||||
|
USDA Guaranteed Securities:
|
|
|
|
|
|
|
|
|
|
|
|||||||||||||||||
|
Available-for-sale
|
1,005,679
|
|
404,836
|
|
—
|
|
(172,785
|
)
|
—
|
|
41,816
|
|
1,279,546
|
|
|||||||||||||
|
Trading(2)
|
311,765
|
|
—
|
|
—
|
|
(102,525
|
)
|
3,119
|
|
—
|
|
212,359
|
|
|||||||||||||
|
Total USDA Guaranteed Securities
|
1,317,444
|
|
404,836
|
|
—
|
|
(275,310
|
)
|
3,119
|
|
41,816
|
|
1,491,905
|
|
|||||||||||||
|
Total Assets at fair value
|
$
|
4,290,443
|
|
$
|
2,209,604
|
|
$
|
(3,268
|
)
|
$
|
(758,897
|
)
|
$
|
4,337
|
|
$
|
100,967
|
|
$
|
5,843,186
|
|
||||||
|
Liabilities:
|
|
|
|
|
|
|
|
|
|
|
|||||||||||||||||
|
Financial derivatives(3)
|
$
|
(3,390
|
)
|
$
|
—
|
|
$
|
—
|
|
$
|
—
|
|
$
|
2,055
|
|
$
|
—
|
|
$
|
(1,335
|
)
|
||||||
|
Total Liabilities at fair value
|
$
|
(3,390
|
)
|
$
|
—
|
|
$
|
—
|
|
$
|
—
|
|
$
|
2,055
|
|
$
|
—
|
|
$
|
(1,335
|
)
|
||||||
|
(1)
|
Unrealized gains are attributable to assets still held as of
December 31, 2011
and are recorded in
Gains on trading assets
.
|
|
(2)
|
Includes unrealized
losses
of
$1.8 million
attributable to assets still held as of
December 31, 2011
that are recorded in
Gains on trading assets
.
|
|
(3)
|
Unrealized gains are attributable to liabilities still held as of
December 31, 2011
and are recorded in
Losses on financial derivatives and hedging activities
.
|
187
|
Level 3 Assets and Liabilities Measured at Fair Value for the Year Ended December 31, 2010
|
|||||||||||||||||||||||
|
|
Beginning
Balance |
Purchases, Sales, Issuances and Settlements, net
|
Realized and
Unrealized Gains/ (Losses) included in Income |
Realized and
Unrealized Gains/ (Losses) included in Other Comprehen-sive Income |
Net Transfers In and/or Out
|
Ending
Balance |
|||||||||||||||||
|
|
(in thousands)
|
||||||||||||||||||||||
|
Recurring:
|
|
||||||||||||||||||||||
|
Assets:
|
|
|
|
|
|||||||||||||||||||
|
Investment Securities:
|
|
|
|
|
|||||||||||||||||||
|
Available-for-sale:
|
|
|
|
|
|||||||||||||||||||
|
Floating rate auction-rate certificates backed by Government guaranteed student loans
|
$
|
72,884
|
|
$
|
—
|
|
$
|
—
|
|
$
|
(8,549
|
)
|
$
|
—
|
|
$
|
64,335
|
|
|||||
|
Floating rate GSE subordinated debt
|
47,562
|
|
—
|
|
—
|
|
—
|
|
(47,562
|
)
|
—
|
|
|||||||||||
|
Fixed rate GSE preferred stock
|
89,211
|
|
—
|
|
—
|
|
—
|
|
(89,211
|
)
|
—
|
|
|||||||||||
|
Total available-for-sale
|
209,657
|
|
—
|
|
—
|
|
(8,549
|
)
|
(136,773
|
)
|
64,335
|
|
|||||||||||
|
Trading:
|
|
|
|
|
|
|
|
|
|||||||||||||||
|
Floating rate asset-backed securities(1)
|
1,824
|
|
(748
|
)
|
324
|
|
—
|
|
—
|
|
1,400
|
|
|||||||||||
|
Fixed rate GSE preferred stock
|
88,148
|
|
—
|
|
—
|
|
—
|
|
(88,148
|
)
|
—
|
|
|||||||||||
|
Total trading
|
89,972
|
|
(748
|
)
|
324
|
|
—
|
|
(88,148
|
)
|
1,400
|
|
|||||||||||
|
Total Investment Securities
|
299,629
|
|
(748
|
)
|
324
|
|
(8,549
|
)
|
(224,921
|
)
|
65,735
|
|
|||||||||||
|
Farmer Mac Guaranteed Securities:
|
|
|
|
|
|
|
|
|
|||||||||||||||
|
Available-for-sale:
|
|
|
|
|
|
|
|
|
|||||||||||||||
|
Farmer Mac I
|
56,864
|
|
892,670
|
|
—
|
|
(1,340
|
)
|
(5,385
|
)
|
942,809
|
|
|||||||||||
|
Farmer Mac II
|
764,792
|
|
(1,607
|
)
|
—
|
|
(2,364
|
)
|
(723,184
|
)
|
37,637
|
|
|||||||||||
|
Rural Utilities
|
1,703,211
|
|
212,202
|
|
—
|
|
11,405
|
|
—
|
|
1,926,818
|
|
|||||||||||
|
Total available-for-sale
|
2,524,867
|
|
1,103,265
|
|
—
|
|
7,701
|
|
(728,569
|
)
|
2,907,264
|
|
|||||||||||
|
Trading:
|
|||||||||||||||||||||||
|
Farmer Mac II
|
422,681
|
|
—
|
|
—
|
|
—
|
|
(422,681
|
)
|
—
|
|
|||||||||||
|
Rural Utilities
|
451,448
|
|
—
|
|
—
|
|
—
|
|
(451,448
|
)
|
—
|
|
|||||||||||
|
Total trading
|
874,129
|
|
—
|
|
—
|
|
—
|
|
(874,129
|
)
|
—
|
|
|||||||||||
|
Total Farmer Guaranteed Securities
|
3,398,996
|
|
1,103,265
|
|
—
|
|
7,701
|
|
(1,602,698
|
)
|
2,907,264
|
|
|||||||||||
|
USDA Guaranteed Securities:
|
|
|
|
|
|
|
|
|
|||||||||||||||
|
Available-for-sale
|
—
|
|
277,987
|
|
—
|
|
4,508
|
|
723,184
|
|
1,005,679
|
|
|||||||||||
|
Trading(2)
|
—
|
|
(113,491
|
)
|
2,575
|
|
—
|
|
422,681
|
|
311,765
|
|
|||||||||||
|
Total USDA Guaranteed Securities
|
—
|
|
164,496
|
|
2,575
|
|
4,508
|
|
1,145,865
|
|
1,317,444
|
|
|||||||||||
|
Total Assets at fair value
|
$
|
3,698,625
|
|
$
|
1,267,013
|
|
$
|
2,899
|
|
$
|
3,660
|
|
$
|
(681,754
|
)
|
$
|
4,290,443
|
|
|||||
|
Liabilities:
|
|
|
|
|
|
|
|
|
|||||||||||||||
|
Financial derivatives(3)
|
$
|
(3,653
|
)
|
$
|
—
|
|
$
|
263
|
|
$
|
—
|
|
$
|
—
|
|
$
|
(3,390
|
)
|
|||||
|
Total Liabilities at fair value
|
$
|
(3,653
|
)
|
$
|
—
|
|
$
|
263
|
|
$
|
—
|
|
$
|
—
|
|
$
|
(3,390
|
)
|
|||||
|
(1)
|
Unrealized losses are attributable to assets still held as of
December 31, 2010
and are recorded in
Gains on trading assets
.
|
|
(2)
|
Includes unrealized
losses
of
$2.0 million
attributable to assets still held as of
December 31, 2010
that are recorded in
Gains on trading assets
.
|
|
(3)
|
Unrealized losses are attributable to liabilities still held as of
December 31, 2010
and are recorded in
Losses on financial derivatives and hedging activities
.
|
188
The following table presents additional information about the significant unobservable inputs used in the fair value measurements categorized in level 3 of the fair value hierarchy:
|
Fair Value as of
|
Unobservable
|
Range
|
||||||||
|
Financial Instruments
|
December 31, 2012
|
Valuation Technique
|
Input
|
(Weighted-Average)
|
||||||
|
(in thousands)
|
||||||||||
|
Assets:
|
||||||||||
|
Investment securities:
|
||||||||||
|
Floating rate auction-rate certificates backed by Government guaranteed student loans
|
$
|
63,159
|
|
Indicative bids
|
Range of broker quotes
|
82.0% - 90.0% (85.0%)
|
||||
|
Floating rate asset-backed securities
|
$
|
1,247
|
|
Discounted cash flow
|
Discount rate
|
12.4% - 19.7% (16.2%)
|
||||
|
Constant prepayment rate
|
10%
|
|||||||||
|
Farmer Mac Guaranteed Securities:
|
||||||||||
|
Farmer Mac I
|
$
|
3,426,489
|
|
Discounted cash flow
|
Discount rate
|
1.1% - 3.4% (1.6%)
|
||||
|
Farmer Mac II
|
$
|
26,681
|
|
Discounted cash flow
|
Discount rate
|
1.0% - 3.4% (2.1%)
|
||||
|
Constant prepayment rate
|
8% - 17% (14%)
|
|||||||||
|
Rural Utilities
|
$
|
1,313,088
|
|
Discounted cash flow
|
Discount rate
|
0.8% - 2.9% (1.6%)
|
||||
|
USDA Guaranteed Securities
|
$
|
1,590,783
|
|
Discounted cash flow
|
Discount rate
|
1.4% - 5.3% (3.4%)
|
||||
|
Constant prepayment rate
|
0% - 26% (10%)
|
|||||||||
|
Liabilities:
|
||||||||||
|
Financial Derivatives:
|
||||||||||
|
Basis swaps
|
$
|
691
|
|
Discounted cash flow
|
Discount rate
|
1.0% - 3.0% (1.7%)
|
||||
|
Constant prepayment rate
|
11% - 19% (16%)
|
|||||||||
The significant unobservable inputs used in the fair value measurements of Farmer Mac Guaranteed Securities and USDA Guaranteed Securities are prepayment rates and discount rates commensurate with the risks involved. Typically, significant increases (decreases) in any of these inputs in isolation may result in materially lower (higher) fair value measurements. Generally, in a rising interest rate environment, Farmer Mac would expect average discount rates to increase and would likely expect a corresponding decrease in forecasted prepayment rates. Conversely, in a declining interest rate environment, Farmer Mac would expect average discount rates to decrease and would likely expect a corresponding increase in forecasted prepayment rates. Prepayment rates are not presented in the table above for the Farmer Mac I and Rural Utilities securities structured as AgVantage securities because they generally do not pay down principal based on amortization schedules but instead typically have fixed maturity dates when the secured general obligations are due.
Fair Value Option
Accounting guidance on the fair value option for financial instruments permits entities to make a one-time irrevocable election to report financial instruments at fair value with changes in fair value recorded in earnings as they occur. This guidance provides entities with the opportunity to mitigate volatility in
189
reported earnings caused by measuring related assets and liabilities differently without having to apply complex hedge accounting provisions.
Farmer Mac made no fair value option elections for 2012, 2011, and 2010. For the years ended
December 31, 2012
,
2011
, and
2010
, Farmer Mac recorded net losses of
$45,000
,
$2.2 million
and
$4.9 million
, respectively, for changes in fair value of assets previously selected for the fair value option. These changes in fair value are presented in "
Gains on trading assets
" in the
consolidated statements of operations
.
Disclosures on Fair Value of Financial Instruments
The following table sets forth the estimated fair values and carrying values for financial assets, liabilities and guarantees and commitments as of
December 31, 2012
and
December 31, 2011
:
|
|
December 31, 2012
|
December 31, 2011
|
|||||||||||||
|
|
Fair Value
|
Carrying
Amount |
Fair Value
|
Carrying
Amount |
|||||||||||
|
|
(in thousands)
|
||||||||||||||
|
Financial assets:
|
|
|
|
|
|||||||||||
|
Cash and cash equivalents
|
$
|
785,564
|
|
$
|
785,564
|
|
$
|
817,046
|
|
$
|
817,046
|
|
|||
|
Investment securities
|
2,499,629
|
|
2,499,629
|
|
2,184,490
|
|
2,184,490
|
|
|||||||
|
Farmer Mac Guaranteed Securities
|
4,766,258
|
|
4,766,258
|
|
4,289,272
|
|
4,289,272
|
|
|||||||
|
USDA Guaranteed Securities
|
1,590,783
|
|
1,590,783
|
|
1,491,905
|
|
1,491,905
|
|
|||||||
|
Loans
|
2,746,742
|
|
2,729,774
|
|
2,971,187
|
|
2,894,156
|
|
|||||||
|
Financial derivatives
|
31,173
|
|
31,173
|
|
40,250
|
|
40,250
|
|
|||||||
|
Guarantee and commitment fees receivable:
|
|||||||||||||||
|
LTSPCs
|
27,805
|
|
22,863
|
|
22,802
|
|
15,886
|
|
|||||||
|
Farmer Mac Guaranteed Securities
|
20,432
|
|
18,926
|
|
17,960
|
|
15,498
|
|
|||||||
|
Financial liabilities:
|
|||||||||||||||
|
Notes payable:
|
|||||||||||||||
|
Due within one year
|
6,573,013
|
|
6,567,366
|
|
6,091,573
|
|
6,087,879
|
|
|||||||
|
Due after one year
|
5,202,751
|
|
5,034,739
|
|
4,288,670
|
|
4,104,882
|
|
|||||||
|
Debt securities of consolidated trusts held by third parties
|
164,910
|
|
167,621
|
|
726,826
|
|
701,583
|
|
|||||||
|
Financial derivatives
|
150,682
|
|
150,682
|
|
160,024
|
|
160,024
|
|
|||||||
|
Guarantee and commitment obligations:
|
|||||||||||||||
|
LTSPCs
|
26,896
|
|
21,954
|
|
22,047
|
|
15,131
|
|
|||||||
|
Farmer Mac Guaranteed Securities
|
17,354
|
|
15,849
|
|
14,771
|
|
12,309
|
|
|||||||
The carrying value of cash and cash equivalents is a reasonable estimate of their approximate fair value and is classified as Level 1 within the fair value hierarchy. The fair value techniques and classification within the fair value hierarchy for investment securities, Farmer Mac Guaranteed Securities, USDA Guaranteed Securities and financial derivatives are described above under "Recurring Fair Value Measurements and Classification." For purposes of the table above, Farmer Mac internally models the fair value of its loan portfolio, including loans held for sale, loans held for investment and loans held for investment in consolidated trusts, by discounting the projected cash flows of these instruments at projected interest rates. The fair values are based on the present value of expected cash flows using management's best estimate of certain key assumptions, which include prepayment speeds, forward yield curves and discount rates commensurate with the risks involved. These fair value measurements do not take into consideration the fair value of the underlying property and are classified as Level 3 within the fair value
190
hierarchy. The fair value of the guarantee fees receivable/obligation and debt securities of consolidated trusts are estimated based on the present value of expected future cash flows of the underlying mortgage assets using management's best estimate of certain key assumptions, which include prepayments speeds, forward yield curves, and discount rates commensurate with the risks involved and are classified as Level 3 within the fair value hierarchy. Notes payable are valued by discounting the expected cash flows of these instruments using a yield curve derived from market prices observed for similar agency securities and are also classified as Level 3 within the fair value hierarchy. Because the cash flows of Farmer Mac's financial instruments may be interest rate path dependent, estimated fair values and projected discount rates are derived using a Monte Carlo simulation model. Different market assumptions and estimation methodologies could significantly affect estimated fair value amounts.
|
14.
|
BUSINESS SEGMENT REPORTING
|
Management has determined that the Corporation's operations consist of
three
reportable segments – Farm & Ranch, USDA Guarantees and Rural Utilities. Farmer Mac uses these
three
segments to generate revenue and manage business risk, and each segment is based on distinct products and distinct business activities. In addition to these
three
operating segments, a corporate segment is presented. That segment represents activity in Farmer Mac's liquidity investment portfolio and other corporate activities. The segment financial results include directly attributable revenues and expenses. Corporate charges for administrative expenses that are not directly attributable to an operating segment are allocated based on headcount.
Farmer Mac uses core earnings to measure corporate economic performance and develop financial plans because, in management's view, core earnings is a useful alternative measure in understanding Farmer Mac's economic performance, transaction economics and business trends. Core earnings differs from GAAP net income by excluding the effects of fair value accounting guidance, which are not expected to have a permanent effect on capital. Core earnings also differs from GAAP net income by excluding specified infrequent or unusual transactions that Farmer Mac believes are not indicative of future operating results and that may not reflect the trends and economic financial performance of the Corporation's core business. This non-GAAP financial measure may not be comparable to similarly labeled non-GAAP financial measures disclosed by other companies.
The financial information presented below reflects the accounts of Farmer Mac and its subsidiaries on a consolidated basis. Accordingly, the core earnings for Farmer Mac's reportable operating segments will differ from the stand-alone financial statements of Farmer Mac's subsidiaries. These differences will be due to various factors, including the reversal of unrealized gains and losses related to fair value changes of trading assets and financial derivatives, as well as the allocation of certain expenses such as dividends and interest expense related to the issuance of capital and the incurrence of indebtedness managed at the corporate level. The allocation of general and administrative expenses that are not directly attributable to an operating segment may also result in differences. The assets of Farmer Mac's subsidiary, Farmer Mac II LLC, will only be available to creditors of Farmer Mac after all obligations owed to creditors of and equity holders in Farmer Mac II LLC have been satisfied. As of
December 31, 2012
, Farmer Mac II LLC held assets with a fair value of
$1.7 billion
, had debt outstanding of
$328.0 million
, had preferred stock outstanding with a liquidation preference of
$250.0 million
, and had
$1.0 billion
of common stock outstanding held by Farmer Mac.
191
The following tables present core earnings for Farmer Mac's reportable operating segments and a reconciliation to GAAP net income for the years ended
December 31, 2012
,
2011
, and
2010
:
|
Core Earnings by Business Segment
|
|||||||||||||||||||||||
|
For the Year Ended December 31, 2012
|
|||||||||||||||||||||||
|
Farm & Ranch
|
USDA Guarantees
|
Rural Utilities
|
Corporate
|
Reconciling
Adjustments |
GAAP
Amounts |
||||||||||||||||||
|
|
(in thousands)
|
||||||||||||||||||||||
|
Interest income (1)
|
$
|
131,714
|
|
$
|
56,815
|
|
$
|
63,243
|
|
$
|
24,729
|
|
$
|
(11,831
|
)
|
$
|
264,670
|
|
|||||
|
Interest income related to consolidated trusts owned by third parties reclassified to guarantee fee income
|
(1,659
|
)
|
—
|
|
—
|
|
—
|
|
1,659
|
|
|
—
|
|
||||||||||
|
Interest expense (2)
|
(65,460
|
)
|
(45,560
|
)
|
(50,796
|
)
|
(6,469
|
)
|
25,595
|
|
|
(142,690
|
)
|
||||||||||
|
Net effective spread
|
64,595
|
|
11,255
|
|
12,447
|
|
18,260
|
|
15,423
|
|
|
121,980
|
|
||||||||||
|
Guarantee and commitment fees
|
22,095
|
|
163
|
|
4,364
|
|
—
|
|
(1,659
|
)
|
24,963
|
|
|||||||||||
|
Other income/(expense) (3)
|
2,427
|
|
599
|
|
466
|
|
(2,113
|
)
|
(22,607
|
)
|
(21,228
|
)
|
|||||||||||
|
Non-interest income/(loss)
|
24,522
|
|
762
|
|
4,830
|
|
(2,113
|
)
|
(24,266
|
)
|
3,735
|
|
|||||||||||
|
Provision for loan losses
|
(3,691
|
)
|
—
|
|
—
|
|
—
|
|
—
|
|
|
(3,691
|
)
|
||||||||||
|
Release of losses
|
1,816
|
|
—
|
|
—
|
|
—
|
|
—
|
|
|
1,816
|
|
||||||||||
|
Other non-interest expense
|
(15,066
|
)
|
(3,065
|
)
|
(5,809
|
)
|
(8,784
|
)
|
—
|
|
|
(32,724
|
)
|
||||||||||
|
Non-interest expense (4)
|
(13,250
|
)
|
(3,065
|
)
|
(5,809
|
)
|
(8,784
|
)
|
—
|
|
|
(30,908
|
)
|
||||||||||
|
Core earnings before income taxes
|
72,176
|
|
8,952
|
|
11,468
|
|
7,363
|
|
(8,843
|
)
|
(5)
|
91,116
|
|
||||||||||
|
Income tax (expense)/benefit
|
(25,261
|
)
|
(3,134
|
)
|
(4,013
|
)
|
7,157
|
|
3,095
|
|
(22,156
|
)
|
|||||||||||
|
Core earnings before preferred stock dividends and attribution of income to non-controlling interest - preferred stock dividends
|
46,915
|
|
5,818
|
|
7,455
|
|
14,520
|
|
(5,748
|
)
|
(5)
|
68,960
|
|
||||||||||
|
Preferred stock dividends
|
—
|
|
—
|
|
—
|
|
(2,879
|
)
|
—
|
|
|
(2,879
|
)
|
||||||||||
|
Non-controlling interest - preferred stock dividends
|
—
|
|
—
|
|
—
|
|
(22,187
|
)
|
—
|
|
|
(22,187
|
)
|
||||||||||
|
Segment core earnings
|
$
|
46,915
|
|
$
|
5,818
|
|
$
|
7,455
|
|
$
|
(10,546
|
)
|
$
|
(5,748
|
)
|
(5)
|
$
|
43,894
|
|
||||
|
Total assets at carrying value
|
$
|
5,190,136
|
|
$
|
1,641,030
|
|
$
|
2,398,809
|
|
$
|
3,392,226
|
|
$
|
—
|
|
|
$
|
12,622,201
|
|
||||
|
Total on- and off-balance sheet program assets at principal balance
|
9,056,489
|
|
1,615,579
|
|
2,343,120
|
|
—
|
|
—
|
|
|
13,015,188
|
|
||||||||||
|
(1)
|
Includes reconciling adjustments for yield maintenance income and amortization of premiums on assets consolidated at fair value to reflect core earnings amounts.
|
|
(2)
|
Based on effective funding cost determined for each operating segment, including expenses related to interest rate swaps not designated as hedges, which are included in "
Losses on financial derivatives and hedging activities
" on the GAAP financial statements.
|
|
(3)
|
Includes reconciling adjustments for the reclassification of yield maintenance income and expenses related to interest rate swaps not designated as hedges and fair value adjustments on financial derivatives and trading assets. Also includes a reconciling adjustment related to the recognition of deferred gains over the estimated lives of certain Farmer Mac II Guaranteed Securities and USDA Guaranteed Securities.
|
|
(4)
|
Includes directly attributable costs and an allocation of indirectly attributable costs based on headcount.
|
|
(5)
|
Net adjustments to reconcile core earnings before income taxes; core earnings before preferred stock dividends and attribution of income to non-controlling interest - preferred stock dividends; and segment core earnings to corresponding GAAP measures: income before income taxes, net income, and net income attributable to common stockholders, respectively.
|
192
|
Core Earnings by Business Segment
|
|||||||||||||||||||||||
|
For the Year Ended December 31, 2011
|
|||||||||||||||||||||||
|
Farm & Ranch
|
USDA Guarantees
|
Rural Utilities
|
Corporate
|
Reconciling
Adjustments |
GAAP
Amounts |
||||||||||||||||||
|
|
(in thousands)
|
||||||||||||||||||||||
|
Interest income (1)
|
$
|
146,653
|
|
$
|
56,726
|
|
$
|
53,237
|
|
$
|
28,117
|
|
$
|
(10,046
|
)
|
$
|
274,687
|
|
|||||
|
Interest income related to consolidated trusts owned by third parties reclassified to guarantee fee income
|
(3,269
|
)
|
—
|
|
—
|
|
—
|
|
3,269
|
|
|
—
|
|
||||||||||
|
Interest expense (2)
|
(92,155
|
)
|
(45,937
|
)
|
(40,950
|
)
|
(13,003
|
)
|
38,663
|
|
|
(153,382
|
)
|
||||||||||
|
Net effective spread
|
51,229
|
|
10,789
|
|
12,287
|
|
15,114
|
|
31,886
|
|
|
121,305
|
|
||||||||||
|
Guarantee and commitment fees
|
22,525
|
|
204
|
|
5,361
|
|
—
|
|
(3,269
|
)
|
24,821
|
|
|||||||||||
|
Other income/(expense) (3)
|
3,201
|
|
283
|
|
—
|
|
(2,272
|
)
|
(73,422
|
)
|
(72,210
|
)
|
|||||||||||
|
Non-interest income/(loss)
|
25,726
|
|
487
|
|
5,361
|
|
(2,272
|
)
|
(76,691
|
)
|
(47,389
|
)
|
|||||||||||
|
Provision for loan losses
|
(610
|
)
|
—
|
|
—
|
|
—
|
|
—
|
|
|
(610
|
)
|
||||||||||
|
Release of losses
|
2,957
|
|
—
|
|
—
|
|
—
|
|
—
|
|
|
2,957
|
|
||||||||||
|
Other non-interest expense
|
(15,768
|
)
|
(2,752
|
)
|
(4,923
|
)
|
(8,173
|
)
|
—
|
|
|
(31,616
|
)
|
||||||||||
|
Non-interest expense (4)
|
(12,811
|
)
|
(2,752
|
)
|
(4,923
|
)
|
(8,173
|
)
|
—
|
|
|
(28,659
|
)
|
||||||||||
|
Core earnings before income taxes
|
63,534
|
|
8,524
|
|
12,725
|
|
4,669
|
|
(44,805
|
)
|
(5)
|
44,647
|
|
||||||||||
|
Income tax (expense)/benefit
|
(22,237
|
)
|
(2,983
|
)
|
(4,454
|
)
|
8,195
|
|
15,682
|
|
(5,797
|
)
|
|||||||||||
|
Core earnings before preferred stock dividends and attribution of income to non-controlling interest - preferred stock dividends
|
41,297
|
|
5,541
|
|
8,271
|
|
12,864
|
|
(29,123
|
)
|
(5)
|
38,850
|
|
||||||||||
|
Preferred stock dividends
|
—
|
|
—
|
|
—
|
|
(2,879
|
)
|
—
|
|
|
(2,879
|
)
|
||||||||||
|
Non-controlling interest - preferred stock dividends
|
—
|
|
—
|
|
—
|
|
(22,187
|
)
|
—
|
|
|
(22,187
|
)
|
||||||||||
|
Segment core earnings
|
$
|
41,297
|
|
$
|
5,541
|
|
$
|
8,271
|
|
$
|
(12,202
|
)
|
$
|
(29,123
|
)
|
(5)
|
$
|
13,784
|
|
||||
|
Total assets at carrying value
|
$
|
4,840,519
|
|
$
|
1,552,105
|
|
$
|
2,421,904
|
|
$
|
3,068,980
|
|
$
|
—
|
|
|
$
|
11,883,508
|
|
||||
|
Total on- and off-balance sheet program assets at principal balance
|
8,057,027
|
|
1,513,177
|
|
2,343,098
|
|
—
|
|
—
|
|
|
11,913,302
|
|
||||||||||
|
(1)
|
Includes reconciling adjustments for yield maintenance income and amortization of premiums on assets consolidated at fair value to reflect core earnings amounts.
|
|
(2)
|
Based on effective funding cost determined for each operating segment, including expenses related to interest rate swaps, which are included in "
Losses on financial derivatives and hedging activities
" on the GAAP financial statements.
|
|
(3)
|
Includes reconciling adjustments for the reclassification of yield maintenance income, expenses related to interest rate swaps and fair value adjustments on loans held for sale, financial derivatives and trading assets. Also includes a reconciling adjustment related to the recognition of deferred gains over the estimated lives of certain Farmer Mac II Guaranteed Securities and USDA Guaranteed Securities.
|
|
(4)
|
Includes directly attributable costs and an allocation of indirectly attributable costs based on headcount.
|
|
(5)
|
Net adjustments to reconcile core earnings before income taxes; core earnings before preferred stock dividends and attribution of income to non-controlling interest - preferred stock dividends; and segment core earnings to corresponding GAAP measures: income before income taxes, net income, and net income attributable to common stockholders, respectively.
|
193
|
Core Earnings by Business Segment
|
|||||||||||||||||||||||
|
For the Year Ended December 31, 2010
|
|||||||||||||||||||||||
|
Farm & Ranch
|
USDA Guarantees
|
Rural Utilities
|
Corporate
|
Reconciling
Adjustments |
GAAP
Amounts |
||||||||||||||||||
|
|
(in thousands)
|
||||||||||||||||||||||
|
Interest income (1)
|
$
|
109,220
|
|
$
|
55,129
|
|
$
|
56,072
|
|
$
|
27,497
|
|
$
|
(9,207
|
)
|
$
|
238,711
|
|
|||||
|
Interest income related to consolidated trusts owned by third parties reclassified to guarantee fee income
|
(4,627
|
)
|
—
|
|
—
|
|
—
|
|
4,627
|
|
|
—
|
|
||||||||||
|
Interest expense (2)
|
(71,147
|
)
|
(45,076
|
)
|
(44,207
|
)
|
(16,384
|
)
|
34,146
|
|
|
(142,668
|
)
|
||||||||||
|
Net effective spread
|
33,446
|
|
10,053
|
|
11,865
|
|
11,113
|
|
29,566
|
|
|
96,043
|
|
||||||||||
|
Guarantee and commitment fees
|
22,270
|
|
458
|
|
5,990
|
|
—
|
|
(4,627
|
)
|
24,091
|
|
|||||||||||
|
Other income/(expense) (3)
|
3,389
|
|
299
|
|
1
|
|
(1,711
|
)
|
(21,095
|
)
|
(19,117
|
)
|
|||||||||||
|
Non-interest income/(loss)
|
25,659
|
|
757
|
|
5,991
|
|
(1,711
|
)
|
(25,722
|
)
|
4,974
|
|
|||||||||||
|
Provision for loan losses
|
(1,893
|
)
|
—
|
|
—
|
|
—
|
|
—
|
|
|
(1,893
|
)
|
||||||||||
|
Provision for losses
|
(2,417
|
)
|
—
|
|
—
|
|
—
|
|
—
|
|
|
(2,417
|
)
|
||||||||||
|
Other non-interest expense
|
(15,430
|
)
|
(2,796
|
)
|
(4,335
|
)
|
(7,649
|
)
|
—
|
|
|
(30,210
|
)
|
||||||||||
|
Non-interest expense (4)
|
(17,847
|
)
|
(2,796
|
)
|
(4,335
|
)
|
(7,649
|
)
|
—
|
|
|
(32,627
|
)
|
||||||||||
|
Core earnings before income taxes
|
39,365
|
|
8,014
|
|
13,521
|
|
1,753
|
|
3,844
|
|
(5)
|
66,497
|
|
||||||||||
|
Income tax (expense)/benefit
|
(13,778
|
)
|
(2,805
|
)
|
(4,733
|
)
|
8,864
|
|
(1,345
|
)
|
(13,797
|
)
|
|||||||||||
|
Core earnings before preferred stock dividends and attribution of income to non-controlling interest - preferred stock dividends
|
25,587
|
|
5,209
|
|
8,788
|
|
10,617
|
|
2,499
|
|
(5)
|
52,700
|
|
||||||||||
|
Preferred stock dividends
|
—
|
|
—
|
|
—
|
|
(4,129
|
)
|
—
|
|
|
(4,129
|
)
|
||||||||||
|
Non-controlling interest - preferred stock dividends
|
—
|
|
—
|
|
—
|
|
(20,707
|
)
|
—
|
|
|
(20,707
|
)
|
||||||||||
|
Loss on retirement of preferred stock
|
—
|
|
—
|
|
—
|
|
—
|
|
(5,784
|
)
|
$
|
(5,784
|
)
|
||||||||||
|
Segment core earnings
|
$
|
25,587
|
|
$
|
5,209
|
|
$
|
8,788
|
|
$
|
(14,219
|
)
|
$
|
(3,285
|
)
|
(5)
|
$
|
22,080
|
|
||||
|
Total assets at carrying value
|
$
|
2,800,367
|
|
$
|
1,378,265
|
|
$
|
2,727,332
|
|
$
|
2,573,950
|
|
$
|
—
|
|
|
$
|
9,479,914
|
|
||||
|
Total on- and off-balance sheet program assets at principal balance
|
8,188,628
|
|
1,385,398
|
|
2,642,683
|
|
—
|
|
—
|
|
|
12,216,709
|
|
||||||||||
|
(1)
|
Includes reconciling adjustments for yield maintenance income and amortization of premiums on assets consolidated at fair value to reflect core earnings amounts.
|
|
(2)
|
Based on effective funding cost determined for each operating segment, including expenses related to interest rate swaps, which are included in "
Losses on financial derivatives and hedging activities
" on the GAAP financial statements.
|
|
(3)
|
Includes reconciling adjustments for the reclassification of yield maintenance income, expenses related to interest rate swaps and fair value adjustments on loans held for sale, financial derivatives and trading assets. Also includes a reconciling adjustment related to the recognition of deferred gains over the estimated lives of certain Farmer Mac II Guaranteed Securities and USDA Guaranteed Securities.
|
|
(4)
|
Includes directly attributable costs and an allocation of indirectly attributable costs based on headcount.
|
|
(5)
|
Net adjustments to reconcile core earnings before income taxes; core earnings before preferred stock dividends and attribution of income to non-controlling interest - preferred stock dividends; and segment core earnings to corresponding GAAP measures: income before income taxes, net income, and net income attributable to common stockholders, respectively.
|
194
15. QUARTERLY FINANCIAL INFORMATION (Unaudited)
|
|
2012 Quarter Ended
|
||||||||||||||
|
|
Dec. 31
|
Sept. 30
|
June 30
|
Mar. 31
|
|||||||||||
|
|
(in thousands, except per share amounts)
|
||||||||||||||
|
Interest income:
|
|
|
|
|
|||||||||||
|
Interest income
|
$
|
56,151
|
|
$
|
63,810
|
|
$
|
71,578
|
|
$
|
73,131
|
|
|||
|
Interest expense
|
33,358
|
|
33,448
|
|
36,961
|
|
38,923
|
|
|||||||
|
Net interest income
|
22,793
|
|
30,362
|
|
34,617
|
|
34,208
|
|
|||||||
|
(Provision for)/release of loan losses
|
(4,354
|
)
|
(137
|
)
|
1,220
|
|
(420
|
)
|
|||||||
|
Net interest income after (provision for)/release of loan losses
|
18,439
|
|
30,225
|
|
35,837
|
|
33,788
|
|
|||||||
|
Non-interest income/(loss):
|
|
|
|
|
|
|
|
|
|||||||
|
Guarantee and commitment fees
|
6,568
|
|
6,401
|
|
6,064
|
|
5,930
|
|
|||||||
|
Gains/(losses) on financial derivatives and hedging activities
|
3,505
|
|
1,558
|
|
(31,292
|
)
|
6,400
|
|
|||||||
|
Gains/(losses) on trading assets
|
2,735
|
|
(441
|
)
|
(3,086
|
)
|
1,099
|
|
|||||||
|
(Losses)/gains on sale of available-for-sale investment securities
|
(10
|
)
|
—
|
|
—
|
|
28
|
|
|||||||
|
Gains/(losses) on sale of real estate owned
|
629
|
|
(13
|
)
|
262
|
|
—
|
|
|||||||
|
Lower of cost or fair value adjustment on loans held for sale
|
(5,943
|
)
|
—
|
|
—
|
|
—
|
|
|||||||
|
Other income
|
890
|
|
959
|
|
771
|
|
721
|
|
|||||||
|
Non-interest income/(loss)
|
8,374
|
|
8,464
|
|
(27,281
|
)
|
14,178
|
|
|||||||
|
Non-interest expense
|
6,109
|
|
7,748
|
|
9,209
|
|
7,842
|
|
|||||||
|
Income/(loss) before income taxes
|
20,704
|
|
30,941
|
|
(653
|
)
|
40,124
|
|
|||||||
|
Income tax expense/(benefit)
|
4,837
|
|
8,294
|
|
(2,629
|
)
|
11,654
|
|
|||||||
|
Net income
|
15,867
|
|
22,647
|
|
1,976
|
|
28,470
|
|
|||||||
|
Less: Net income attributable to non-controlling
interest - preferred stock dividends |
(5,546
|
)
|
(5,547
|
)
|
(5,547
|
)
|
(5,547
|
)
|
|||||||
|
Net income/(loss) attributable to Farmer Mac
|
10,321
|
|
17,100
|
|
(3,571
|
)
|
22,923
|
|
|||||||
|
Preferred stock dividends
|
(720
|
)
|
(719
|
)
|
(720
|
)
|
(720
|
)
|
|||||||
|
Net income/(loss) attributable to common stockholders
|
$
|
9,601
|
|
$
|
16,381
|
|
$
|
(4,291
|
)
|
$
|
22,203
|
|
|||
|
Earnings/(loss) per common share:
|
|
|
|
|
|
|
|
|
|||||||
|
Basic earnings/(loss) per common share
|
$
|
0.91
|
|
$
|
1.56
|
|
$
|
(0.41
|
)
|
$
|
2.14
|
|
|||
|
Diluted earnings/(loss) per common share
|
$
|
0.87
|
|
$
|
1.49
|
|
$
|
(0.41
|
)
|
$
|
2.04
|
|
|||
|
Common stock dividends per common share
|
$
|
0.10
|
|
$
|
0.10
|
|
$
|
0.10
|
|
$
|
0.10
|
|
|||
195
|
|
2011 Quarter Ended
|
||||||||||||||
|
|
Dec. 31
|
Sept. 30
|
June 30
|
Mar. 31
|
|||||||||||
|
|
(in thousands, except per share amounts)
|
||||||||||||||
|
Interest income:
|
|
|
|
|
|||||||||||
|
Interest income
|
$
|
72,642
|
|
$
|
71,121
|
|
$
|
66,852
|
|
$
|
64,072
|
|
|||
|
Interest expense
|
39,277
|
|
39,412
|
|
37,640
|
|
37,053
|
|
|||||||
|
Net interest income
|
33,365
|
|
31,709
|
|
29,212
|
|
27,019
|
|
|||||||
|
Release of/(provision for) loan losses
|
482
|
|
349
|
|
(160
|
)
|
(1,281
|
)
|
|||||||
|
Net interest income after release of/(provision for) loan losses
|
33,847
|
|
32,058
|
|
29,052
|
|
25,738
|
|
|||||||
|
Non-interest income/(loss):
|
|
|
|
|
|
|
|
|
|||||||
|
Guarantee and commitment fees
|
5,966
|
|
6,148
|
|
6,320
|
|
6,387
|
|
|||||||
|
(Losses)/gains on financial derivatives
|
(10,277
|
)
|
(68,567
|
)
|
(17,806
|
)
|
4,005
|
|
|||||||
|
Gains/(losses) on trading assets
|
3,809
|
|
(3,633
|
)
|
1,968
|
|
1,311
|
|
|||||||
|
Gains on sale of available-for-sale investment securities
|
—
|
|
74
|
|
38
|
|
157
|
|
|||||||
|
Gains/(losses) on sale of real estate owned
|
254
|
|
(4
|
)
|
627
|
|
97
|
|
|||||||
|
Lower of cost or fair value adjustment on loans held for sale
|
—
|
|
9,851
|
|
(156
|
)
|
(808
|
)
|
|||||||
|
Other income
|
1,102
|
|
726
|
|
1,124
|
|
3,898
|
|
|||||||
|
Non-interest income/(loss)
|
854
|
|
(55,405
|
)
|
(7,885
|
)
|
15,047
|
|
|||||||
|
Non-interest expense
|
7,240
|
|
7,550
|
|
7,191
|
|
6,678
|
|
|||||||
|
Income/(loss) before income taxes
|
27,461
|
|
(30,897
|
)
|
13,976
|
|
34,107
|
|
|||||||
|
Income tax expense/(benefit)
|
7,872
|
|
(14,131
|
)
|
2,539
|
|
9,517
|
|
|||||||
|
Net income/(loss)
|
19,589
|
|
(16,766
|
)
|
11,437
|
|
24,590
|
|
|||||||
|
Less: Net income attributable to non-controlling
interest - preferred stock dividends |
(5,546
|
)
|
(5,547
|
)
|
(5,547
|
)
|
(5,547
|
)
|
|||||||
|
Net income/(loss) attributable to Farmer Mac
|
14,043
|
|
(22,313
|
)
|
5,890
|
|
19,043
|
|
|||||||
|
Preferred stock dividends
|
(720
|
)
|
(719
|
)
|
(720
|
)
|
(720
|
)
|
|||||||
|
Net income/(loss) attributable to common stockholders
|
$
|
13,323
|
|
$
|
(23,032
|
)
|
$
|
5,170
|
|
$
|
18,323
|
|
|||
|
Earnings/(loss) per common share:
|
|||||||||||||||
|
Basic earnings/(loss) per common share
|
$
|
1.29
|
|
$
|
(2.22
|
)
|
$
|
0.50
|
|
$
|
1.78
|
|
|||
|
Diluted earnings/(loss) per common share
|
$
|
1.23
|
|
$
|
(2.22
|
)
|
$
|
0.48
|
|
$
|
1.72
|
|
|||
|
Common stock dividends per common share
|
$
|
0.05
|
|
$
|
0.05
|
|
$
|
0.05
|
|
$
|
0.05
|
|
|||
196
|
Item 9.
|
Changes in and Disagreements with Accountants on Accounting and Financial Disclosure
|
None.
(a)
Management's Evaluation of Disclosure Controls and Procedures
. Farmer Mac maintains disclosure controls and procedures designed to ensure that information required to be disclosed in the Corporation's periodic filings under the Securities Exchange Act of 1934 (the “Exchange Act”), including this Annual Report on Form 10-K, is recorded, processed, summarized and reported on a timely basis. These disclosure controls and procedures include controls and procedures designed to ensure that information required to be disclosed under the Exchange Act is accumulated and communicated to the Corporation's management on a timely basis to allow decisions regarding required disclosure. Management, including Farmer Mac's Chief Executive Officer and Chief Financial Officer, has evaluated the effectiveness of the design and operation of the Corporation's disclosure controls and procedures (as defined under Rules 13a‑15(e) and 15d‑15(e) of the Exchange Act) as of
December 31, 2012
. Based on management's assessment, the Chief Executive Officer and Chief Financial Officer have concluded that the Corporation's disclosure controls and procedures were effective as of
December 31, 2012
.
See Item 8. above for management's report on internal control over financial reporting and the accompanying reports of independent registered public accounting firms.
(b)
Changes in Internal Control Over Financial Reporting
. There were no changes in Farmer Mac's internal control over financial reporting during the three months ended
December 31, 2012
that have materially affected, or are reasonably likely to materially affect, Farmer Mac's internal control over financial reporting.
None.
197
Farmer Mac has adopted a Code of Business Conduct and Ethics (the "Code") that applies to all directors, officers, employees, and agents of Farmer Mac, including Farmer Mac's principal executive officer, principal financial and accounting officer and other senior financial officers. A copy of the Code is available in the "Investors—Corporate Governance" section of Farmer Mac's internet website (www.farmermac.com). Farmer Mac will post any amendment to, or waiver from, a provision of the Code in that same section of its internet website. The Code was most recently amended in December 2012. A print copy of the Code is available free of charge upon written request to Farmer Mac's Secretary.
Additional information required by this item is incorporated by reference to the Corporation's definitive proxy statement to be filed on or about April 26, 2013.
|
Item 11.
|
Executive Compensation
|
The information required by this item is incorporated by reference to the Corporation's definitive proxy statement to be filed on or about April 26, 2013.
|
Item 12.
|
Security Ownership of Certain Beneficial Owners and Management and Related Stockholder Matters
|
The information required by this item is incorporated by reference to the Corporation's definitive proxy statement to be filed on or about April 26, 2013.
|
Item 13.
|
Certain Relationships and Related Transactions, and Director Independence
|
The information required by this item is incorporated by reference to the Corporation's definitive proxy statement to be filed on or about April 26, 2013.
|
Item 14.
|
Principal Accountant Fees and Services
|
The information required by this item is incorporated by reference to the Corporation's definitive proxy statement to be filed on or about April 26, 2013.
198
|
(a)
|
(1) Financial Statements.
|
Refer to Item 8 above.
(2) Financial Statement Schedules.
All schedules are omitted since they are not applicable, not required or the information required to be set forth therein is included in the consolidated financial statements or in notes thereto.
199
(3) Exhibits.
|
*
|
3.1
|
—
|
Title VIII of the Farm Credit Act of 1971, as most recently amended by the Food, Conservation and Energy Act of 2008 (Previously filed as Exhibit to Form 10-Q filed August 12, 2008).
|
|||
|
*
|
3.2
|
—
|
Amended and Restated By-Laws of the Registrant (Previously filed as Exhibit 3.1 to Form 8-K filed December 12, 2012).
|
|||
|
*
|
4.1
|
—
|
Specimen Certificate for Farmer Mac Class A Voting Common Stock (Previously filed as Exhibit 4.1 to Form 10-Q filed May 15, 2003).
|
|||
|
*
|
4.2
|
—
|
Specimen Certificate for Farmer Mac Class B Voting Common Stock (Previously filed as Exhibit 4.2 to Form 10-Q filed
May 15, 2003).
|
|||
|
*
|
4.3
|
—
|
Specimen Certificate for Farmer Mac Class C Non-Voting Common Stock (Previously filed as Exhibit 4.3 to Form 10-Q filed May 15, 2003).
|
|||
|
*
|
4.4
|
—
|
Amended and Restated Certificate of Designation of Terms and Conditions of Non-Voting Cumulative Preferred Stock, Series C (Previously filed as Exhibit 4.7 to Form 10-Q filed November 9, 2009).
|
|||
|
*
|
4.5
|
—
|
Certificate of Designation of Terms and Conditions of 5.875% Non-Cumulative Preferred Stock, Series A (Previously filed as Exhibit 4.1 to Form 8-A filed January 17, 2013).
|
|||
|
†*
|
10.1
|
—
|
Amended and Restated 1997 Incentive Plan (Previously filed as Exhibit 10.1.3 to Form 10-Q filed November 14, 2003).
|
|||
|
†*
|
10.1.1
|
—
|
Form of stock option award agreement under 1997 Incentive Plan (Previously filed as Exhibit 10.1.4 to Form 10-K filed March 16, 2005).
|
|||
|
†*
|
10.2
|
—
|
2008 Omnibus Incentive Plan (Previously filed as Exhibit 10.1.2 to Form 10-Q filed August 12, 2008).
|
|||
|
†*
|
10.2.1
|
—
|
Form of SAR Agreement under the 2008 Omnibus Incentive Plan for grants made prior to
April 1, 2012 (Previously filed as Exhibit 10 to Form 8-K filed June 11, 2008).
|
|||
|
†*
|
10.2.2
|
—
|
Form of SAR Agreement under the 2008 Omnibus Incentive Plan for grants made on and after April 1, 2012 (Previously filed as Exhibit 10.1 to Form 8-K filed April 6, 2012).
|
|||
|
†*
|
10.2.3
|
—
|
Form of Restricted Stock Agreement (Officers) under the 2008 Omnibus Incentive Plan for grants made prior to April 1, 2012 (Previously filed as Exhibit 10.1 to Form 8-K filed June 10, 2009).
|
|||
|
†*
|
10.2.4
|
—
|
Form of Restricted Stock Agreement (Officers) under the 2008 Omnibus Incentive Plan for grants made on and after April 1, 2012 (Previously filed as Exhibit 10.2 to Form 8-K filed
April 6, 2012).
|
|||
|
†*
|
10.2.5
|
—
|
Form of Restricted Stock Agreement (Directors) under the 2008 Omnibus Incentive Plan (Previously filed as Exhibit 10.3 to Form 8-K filed April 6, 2012).
|
|||
|
†*
|
10.3
|
—
|
Federal Agricultural Mortgage Corporation Executive Officer Severance Plan (Previously filed as Exhibit 10.1 to Form 8-K filed June 13, 2012).
|
|||
|
†*
|
10.4
|
—
|
Form of Participation Agreement to the Federal Agricultural Mortgage Corporation Executive Officer Severance Plan (Previously filed as Exhibit 10.2 to Form 8-K filed June 13, 2012).
|
|||
|
†*
|
10.5
|
—
|
Amended and Restated Employment Agreement dated as of April 1, 2011 between Michael A. Gerber and the Registrant (Previously filed as Exhibit 10.2 to Form 10-Q filed May 10, 2011).
|
|||
|
†*
|
10.6
|
—
|
Separation Agreement, Waiver and Release effective October 18, 2012 between the Registrant and Michael A. Gerber (Previously filed as Exhibit 10.1 to Form 8-K filed October 30, 2012).
|
|||
|
*
|
Incorporated by reference to the indicated prior filing.
|
|
**
|
Filed with this report.
|
|
†
|
Management contract or compensatory plan.
|
|
#
|
Portions of this exhibit have been omitted pursuant to a request for confidential treatment.
|
200
|
†*
|
10.7
|
—
|
Employment Agreement dated December 6, 2012 between Timothy L. Buzby and the Registrant (Previously filed as Exhibit 10.1 to Form 8-K filed December 10, 2012).
|
|||
|
†*
|
10.8
|
—
|
Form of Indemnification Agreement for Directors (Previously filed as Exhibit 10.1 to Form 8-K filed April 9, 2008).
|
|||
|
†*
|
10.9
|
Description of compensation agreement between the Registrant and its directors (Previously filed as Exhibit 10.6 to Form 10-K filed March 16, 2011).
|
||||
|
*
|
10.10
|
—
|
Farmer Mac I Seller/Servicer Agreement dated as of August 7, 1996 between Zions First National Bank and the Registrant (Previously filed as Exhibit 10.7 to Form 10-Q filed November 14, 2002).
|
|||
|
*
|
10.11
|
—
|
Medium-Term Notes U.S. Selling Agency Agreement dated as of October 1, 1998 between Zions First National Bank and the Registrant (Previously filed as Exhibit 10.8 to Form 10-Q filed November 14, 2002).
|
|||
|
*
|
10.12
|
—
|
Discount Note Dealer Agreement dated as of September 18, 1996 between Zions First National Bank and the Registrant (Previously filed as Exhibit 10.9 to Form 10-Q filed November 14, 2002).
|
|||
|
*#
|
10.13
|
—
|
ISDA Master Agreement and Credit Support Annex dated as of June 26, 1997 between Zions First National Bank and the Registrant (Previously filed as Exhibit 10.10 to Form 10-Q filed November 14, 2002).
|
|||
|
*#
|
10.14
|
—
|
Amended and Restated Master Central Servicing Agreement dated as of May 1, 2004 between Zions First National Bank and the Registrant (Previously filed as Exhibit 10.11.2 to Form 10-Q filed August 9, 2004).
|
|||
|
*#
|
10.14.1
|
—
|
Amendment No. 1 to Amended and Restated Master Central Servicing Agreement between Zions First National Bank and the Registrant, dated as of June 1, 2009 (Previously filed as Exhibit 10.11.1 to Form 10-Q filed August 10, 2009).
|
|||
|
*#
|
10.14.2
|
—
|
Amendment No. 2 to Amended and Restated Master Central Servicing Agreement between Zions First National Bank and the Registrant, dated as of August 25, 2010 (Previously filed as Exhibit 10.11.2 to Form 10-Q filed November 9, 2010).
|
|||
|
*#
|
10.15
|
—
|
Loan Closing File Review Agreement dated as of August 2, 2005 between Zions First National Bank and the Registrant (Previously filed as Exhibit 10.12 to Form 10-Q filed November 9, 2005).
|
|||
|
*#
|
10.16
|
—
|
Long Term Standby Commitment to Purchase dated as of August 1, 1998 between AgFirst Farm Credit Bank and the Registrant (Previously filed as Exhibit 10.13 to Form 10-Q filed November 14, 2002).
|
|||
|
*#
|
10.16.1
|
—
|
Amendment No. 1 dated as of January 1, 2000 to Long Term Standby Commitment to Purchase dated as of August 1, 1998 between AgFirst Farm Credit Bank and the Registrant (Previously filed as Exhibit 10.13.1 to Form 10-Q filed November 14, 2002).
|
|||
|
*
|
10.16.2
|
—
|
Amendment No. 2 dated as of September 1, 2002 to Long Term Standby Commitment to Purchase dated as of August 1, 1998, as amended by Amendment No. 1 dated as of
January 1, 2000, between AgFirst Farm Credit Bank and the Registrant (Previously filed as Exhibit 10.13.2 to Form 10-Q filed November 14, 2002).
|
|||
|
*
|
10.17
|
—
|
Sublease Agreement dated as of December 6, 2010 between Mayer Brown LLP and the Registrant (Previously filed as Exhibit 10.43 to Form 10-K/A filed June 1, 2011).
|
|||
|
*
|
Incorporated by reference to the indicated prior filing.
|
|
**
|
Filed with this report.
|
|
†
|
Management contract or compensatory plan.
|
|
#
|
Portions of this exhibit have been omitted pursuant to a request for confidential treatment.
|
201
|
*#
|
10.18
|
—
|
Long Term Standby Commitment to Purchase dated as of August 1, 2007 between Farm Credit Bank of Texas and the Registrant (Previously filed as Exhibit 10.20 to Form 10-Q filed November 8, 2007).
|
|||
|
*#
|
10.19
|
—
|
Long Term Standby Commitment to Purchase dated as of June 1, 2003 between Farm Credit Bank of Texas and the Registrant (Previously filed as Exhibit 10.16 to Form 10-Q filed November 9, 2004).
|
|||
|
*#
|
10.19.1
|
—
|
Amendment No. 1 dated as of December 8, 2006 to Long Term Standby Commitment to Purchase dated as of June 1, 2003 between Farm Credit Bank of Texas and the Registrant (Previously filed as Exhibit 10.16.1 to Form 10-K filed March 15, 2007).
|
|||
|
*#
|
10.20
|
—
|
Central Servicer Delinquent Loan Servicing Transfer Agreement dated as of July 1, 2004 between AgFirst Farm Credit Bank and the Registrant (Previously filed as Exhibit 10.17 to Form 10-Q filed November 9, 2004).
|
|||
|
*
|
10.21
|
—
|
Master Trust, Sale and Servicing Agreement dated as of October 20, 2006 between CFC Advantage, LLC, National Rural Utilities Cooperative Finance Corporation, U.S. Bank National Association, and the Registrant (Previously filed as Exhibit 10.22 to Form 10-Q filed
August 9, 2010).
|
|||
|
*
|
10.22
|
—
|
Registration Rights Agreement Series 2007-1 dated as of February 15, 2007 between CFC Advantage, LLC, National Rural Utilities Cooperative Finance Corporation, and the Registrant (Previously filed as Exhibit 10.23 to Form 10-Q filed August 9, 2010).
|
|||
|
*
|
10.23
|
—
|
Registration Rights Agreement Series 2007-2 dated as of August 10, 2007 between CFC Advantage, LLC, National Rural Utilities Cooperative Finance Corporation and the Registrant (Previously filed as Exhibit 10.24 to Form 10-Q filed August 9, 2010).
|
|||
|
*
|
10.24
|
—
|
Amended and Restated Note Purchase Agreement dated as of March 24, 2011 between Farmer Mac Mortgage Securities Corporation, National Rural Utilities Cooperative Finance Corporation, and the Registrant (Previously filed as Exhibit 10.22 to Form 10-Q filed May 10, 2011).
|
|||
|
*
|
10.24.1
|
First Supplemental Note Purchase Agreement dated as of March 24, 2011 between Farmer Mac Mortgage Securities Corporation, National Rural Utilities Cooperative Finance Corporation, and the Registrant (Previously filed as Exhibit 10.25 to Form 10-Q filed May 10, 2011).
|
||||
|
*
|
10.25
|
—
|
Amended, Restated and Consolidated Pledge Agreement dated as of March 24, 2011 between Farmer Mac Mortgage Securities Corporation, National Rural Utilities Cooperative Finance Corporation, U.S. Bank National Association, and the Registrant (Previously filed as Exhibit 10.23 to Form 10-Q filed May 10, 2011).
|
|||
|
*
|
10.26
|
—
|
Setoff Rights Letter Agreement dated as of March 24, 2011 between National Rural Utilities Cooperative Finance Corporation, Farmer Mac Mortgage Securities Corporation, and the Registrant (Previously filed as Exhibit 10.24 to Form 10-Q filed May 10, 2011).
|
|||
|
*
|
10.27
|
—
|
Amended and Restated Master Sale and Servicing Agreement dated as of August 12, 2011 between National Rural Utilities Cooperative Finance Corporation and the Registrant (Previously filed as Exhibit 10.26 to Form 10-Q filed November 9, 2011).
|
|||
|
*#
|
10.28
|
—
|
Credit Support Agreement dated as of September 1, 2009 between National Rural Utilities Cooperative Finance Corporation and the Registrant (Previously filed as Exhibit 10.38 to Form 10-Q filed August 9, 2010).
|
|||
|
*
|
Incorporated by reference to the indicated prior filing.
|
|
**
|
Filed with this report.
|
|
†
|
Management contract or compensatory plan.
|
|
#
|
Portions of this exhibit have been omitted pursuant to a request for confidential treatment.
|
202
|
*
|
10.29
|
—
|
Indenture dated as of September 1, 2009 between National Rural Utilities Cooperative Finance Corporation, U.S. Bank National Association and the Registrant (Previously filed as Exhibit 10.39 to Form 10-Q filed August 9, 2010).
|
|||
|
*
|
21
|
—
|
List of the Registrant's subsidiaries (Previously filed as Exhibit 21 to Form 10-K filed March 16, 2010).
|
|||
|
**
|
31.1
|
—
|
Certification of Registrant's principal executive officer relating to the Registrant's Annual Report on Form 10-K for the year ended December 31, 2012, pursuant to Rule 13a-14(a), as adopted pursuant to Section 302 of the Sarbanes-Oxley Act of 2002.
|
|||
|
**
|
31.2
|
—
|
Certification of Registrant's principal financial officer relating to the Registrant's Annual Report on Form 10-K for the year ended December 31, 2012, pursuant to Rule 13a-14(a), as adopted pursuant to Section 302 of the Sarbanes-Oxley Act of 2002.
|
|||
|
**
|
32
|
—
|
Certification of Registrant's principal executive officer and principal financial officer relating to the Registrant's Annual Report on Form 10-K for the year ended December 31, 2012, pursuant to 18 U.S.C. § 1350, as adopted pursuant to Section 906 of the Sarbanes-Oxley Act of 2002.
|
|||
|
*
|
Incorporated by reference to the indicated prior filing.
|
|
**
|
Filed with this report.
|
|
†
|
Management contract or compensatory plan.
|
|
#
|
Portions of this exhibit have been omitted pursuant to a request for confidential treatment.
|
203
SIGNATURES
Pursuant to the requirements of Section 13 or 15(d) of the Securities Exchange Act of 1934, the Registrant has duly caused this report to be signed on its behalf by the undersigned, thereunto duly authorized.
FEDERAL AGRICULTURAL MORTGAGE CORPORATION
|
/s/ Timothy L. Buzby
|
|
March 18, 2013
|
|
|
By:
|
Timothy L. Buzby
|
|
Date
|
|
|
President and
|
|
|
|
|
Chief Executive Officer
|
|
|
Pursuant to the requirements of the Securities Exchange Act of 1934, this report has been signed below by the following persons on behalf of the Registrant and in the capacities and on the dates indicated.
|
Name
|
|
Title
|
|
Date
|
|
/s/ Lowell L. Junkins
|
|
Chairman of the Board and Director
|
|
March 18, 2013
|
|
Lowell L. Junkins
|
|
|
|
|
|
|
|
|
|
|
|
/s/ Timothy L. Buzby
|
|
President and Chief Executive Officer
|
|
March 18, 2013
|
|
Timothy L. Buzby
|
|
(Principal Executive Officer)
|
|
|
|
|
|
|
|
|
|
/s/ R. Dale Lynch
|
|
Senior Vice President – Chief Financial
|
|
March 18, 2013
|
|
R. Dale Lynch
|
|
Officer and Treasurer
(Principal Financial Officer)
|
|
|
|
/s/ Carla A. Leibold
|
|
Vice President – Controller
|
|
March 18, 2013
|
|
Carla A. Leibold
|
|
(Principal Accounting Officer)
|
|
|
204
|
Name
|
|
Title
|
|
Date
|
|
|
|
|
|
|
|
/s/ Dennis L. Brack
|
|
Director
|
|
March 18, 2013
|
|
Dennis L. Brack
|
|
|
|
|
|
|
|
|
|
|
|
/s/ Chester J. Culver
|
|
Director
|
|
March 18, 2013
|
|
Chester J. Culver
|
|
|
|
|
|
|
|
|
|
|
|
/s/ Richard H. Davidson
|
|
Director
|
|
March 18, 2013
|
|
Richard H. Davidson
|
|
|
|
|
|
|
|
|
|
|
|
/s/ James R. Engebretsen
|
|
Director
|
|
March 18, 2013
|
|
James R. Engebretsen
|
|
|
|
|
|
|
|
|
|
|
|
/s/ Dennis A. Everson
|
|
Director
|
|
March 18, 2013
|
|
Dennis A. Everson
|
|
|
|
|
|
|
|
|
|
|
|
/s/ Sara L. Faivre-Davis
|
|
Director
|
|
March 18, 2013
|
|
Sara L. Faivre-Davis
|
|
|
|
|
|
|
|
|
|
|
|
/s/ Thomas W. Hill
|
|
Director
|
|
March 18, 2013
|
|
Thomas W. Hill
|
|
|
|
|
|
|
|
|
|
|
|
/s/ Mitchell A. Johnson
|
|
Director
|
|
March 18, 2013
|
|
Mitchell A. Johnson
|
|
|
|
|
|
|
|
|
|
|
|
/s/ Clark B. Maxwell
|
|
Director
|
|
March 18, 2013
|
|
Clark B. Maxwell
|
|
|
|
|
|
|
|
|
|
|
|
/s/ James B. McElroy
|
|
Director
|
|
March 18, 2013
|
|
James B. McElroy
|
|
|
|
|
|
|
|
|
|
|
|
/s/ John Dan Raines, Jr.
|
|
Director
|
|
March 18, 2013
|
|
John Dan Raines, Jr.
|
|
|
|
|
|
|
|
|
|
|
|
/s/ Bruce J. Sherrick
|
|
Director
|
|
March 18, 2013
|
|
Bruce J. Sherrick
|
|
|
|
|
|
|
|
|
|
|
|
/s/ Myles J. Watts
|
|
Director
|
|
March 18, 2013
|
|
Myles J. Watts
|
|
|
|
|
|
/s/ Douglas E. Wilhelm
|
Director
|
March 18, 2013
|
||
|
Douglas E. Wilhelm
|
||||
205
TABLE OF CONTENTS
Part IItem 1. BusinessItem 1A. Risk FactorsItem 1B. Unresolved Staff CommentsItem 2. PropertiesItem 3. Legal ProceedingsItem 4. Mine Safety DisclosuresPart IIItem 5. Market For Registrant's Common Equity, Related Stockholder Matters, and Issuer Purchases Of Equity SecuritiesItem 6. Selected Financial DataItem 7. Management's Discussion and Analysis Of Financial Condition and Results Of OperationsItem 7A. Quantitative and Qualitative Disclosures About Market RiskItem 8. Financial StatementsItem 9. Changes in and Disagreements with Accountants on Accounting and Financial DisclosureItem 9A. Controls and ProceduresItem 9B Other InformationPart IIIItem 10. Directors, Executive Officers and Corporate GovernanceItem 11. Executive CompensationItem 12. Security Ownership Of Certain Beneficial Owners and Management and Related Stockholder MattersItem 13. Certain Relationships and Related Transactions, and Director IndependenceItem 14. Principal Accountant Fees and ServicesPart IVItem 15. Exhibits and Financial Statement Schedules