ASSURED GUARANTY LTD
10-Ks and 10-Qs
|
|
|
|
|
|
|
|
|
|
|
|
|
|
|
|
|
|
|
|
|
|
|
|
|
|
|
|
|
|
|
|
|
|
|
|
|
|
|
|
|
|
|
|
|
|
|
|
|
|
|
|
|
|
|
|
UNITED STATES
SECURITIES AND EXCHANGE COMMISSION
Washington, D.C. 20549
____________________________________________________________________________
FORM 10-K
|
ý
|
|
ANNUAL REPORT UNDER SECTION 13 OR 15(d) OF THE SECURITIES EXCHANGE ACT OF 1934
|
For the fiscal year ended
December 31, 2016
Or
|
o
|
|
TRANSITION REPORT PURSUANT TO SECTION 13 OR 15(d) OF THE SECURITIES EXCHANGE ACT OF 1934
|
For the transition period from to
Commission File Number 001-32141
ASSURED GUARANTY LTD.
(Exact name of Registrant as specified in its charter)
|
Bermuda
(State or other jurisdiction of
incorporation or organization)
|
98-0429991
(I.R.S. Employer Identification No.)
|
|
30 Woodbourne Avenue
Hamilton HM 08 Bermuda
(441) 279-5700
(Address, including zip code, and telephone number,
including area code, of Registrant's principal executive office)
None
(Former name, former address and former fiscal year, if changed since last report)
Securities registered pursuant to Section 12(b) of the Act:
|
Title of each class
|
Name of each exchange on which registered
|
|
|
Common Shares, $0.01 per share
|
New York Stock Exchange, Inc.
|
|
Securities registered pursuant to Section 12(g) of the Act:
None
Indicate by check mark if the registrant is a well-known seasoned issuer, as defined in Rule 405 of the Securities Act. Yes
ý
No
o
Indicate by check mark if the registrant is not required to file reports pursuant to Section 13 or Section 15(d) of the Act. Yes
o
No
ý
Indicate by check mark whether the registrant: (1) has filed all reports required to be filed by Section 13 or 15(d) of the Securities Exchange Act of 1934 during the preceding 12 months (or for such shorter period that the Registrant was required to file such reports), and (2) has been subject to such filing requirements for the past 90 days. Yes
ý
No
o
Indicate by check mark whether the registrant has submitted electronically and posted on its corporate Web site, if any, every Interactive Data File required to be submitted and posted pursuant to Rule 405 of Regulation S-T during the preceding 12 months (or for such shorter period that the registrant was required to submit and post such files). Yes
ý
No
o
Indicate by check mark if disclosure of delinquent filers pursuant to Item 405 of Regulation S-K is not contained herein, and will not be contained, to the best of registrant's knowledge, in definitive proxy or information statements incorporated by reference in Part III of this Form 10-K or any amendment to this Form 10-K.
o
Indicate by check mark whether the registrant is a large accelerated filer, an accelerated filer, a non-accelerated filer, or a smaller reporting company. See the definitions of "large accelerated filer," "accelerated filer," and "smaller reporting company" in Rule 12b-2 of the Exchange Act.
|
Large accelerated filer
ý
|
|
Accelerated filer
o
|
|
Non-accelerated filer
o
(Do not check if a
smaller reporting company)
|
|
Smaller reporting company
o
|
Indicate by check mark whether the registrant is a shell company (as defined in Rule 12b-2 of the Exchange Act). Yes
o
No
ý
The aggregate market value of Common Shares held by non-affiliates of the Registrant as of the close of business on June 30, 2016 was $3,310,230,030 (based upon the closing price of the Registrant's shares on the New York Stock Exchange on that date, which was $25.37). For purposes of this information, the outstanding Common Shares which were owned by all directors and executive officers of the Registrant were deemed to be the only shares of Common Stock held by affiliates.
As of February 21, 2017,
125,017,614
Common Shares, par value $0.01 per share, were outstanding (including
58,858
unvested restricted shares).
DOCUMENTS INCORPORATED BY REFERENCE
Certain portions of Registrant's definitive proxy statement relating to its 2016 Annual General Meeting of Shareholders are incorporated by reference to Part III of this report.
Forward Looking Statements
This Form 10-K contains information that includes or is based upon forward looking statements within the meaning of the Private Securities Litigation Reform Act of 1995. Forward looking statements give the expectations or forecasts of future events of Assured Guaranty Ltd. (AGL) and its subsidiaries (collectively with AGL, Assured Guaranty or the Company). These statements can be identified by the fact that they do not relate strictly to historical or current facts and relate to future operating or financial performance.
Any or all of Assured Guaranty’s forward looking statements herein are based on current expectations and the current economic environment and may turn out to be incorrect. Assured Guaranty’s actual results may vary materially. Among factors that could cause actual results to differ adversely are:
|
•
|
reduction in the amount of available insurance opportunities and/or in the demand for Assured Guaranty's insurance;
|
|
•
|
rating agency action, including a ratings downgrade, a change in outlook, the placement of ratings on watch for downgrade, or a change in rating criteria, at any time, of AGL or any of its subsidiaries, and/or of any securities AGL or any of its subsidiaries have issued, and/or of transactions that AGL’s subsidiaries have insured;
|
|
•
|
developments in the world’s financial and capital markets that adversely affect obligors’ payment rates, Assured Guaranty’s loss experience, or its exposure to refinancing risk in transactions (which could result in substantial liquidity claims on its guarantees);
|
|
•
|
the possibility that budget or pension shortfalls or other factors will result in credit losses or impairments on obligations of state, territorial and local governments and their related authorities and public corporations that Assured Guaranty insures or reinsures;
|
|
•
|
the failure of Assured Guaranty to realize loss recoveries that are assumed in its expected loss estimates;
|
|
•
|
increased competition, including from new entrants into the financial guaranty industry;
|
|
•
|
rating agency action on obligors, including sovereign debtors, resulting in a reduction in the value of securities in Assured Guaranty's investment portfolio and in collateral posted by and to Assured Guaranty;
|
|
•
|
the inability of Assured Guaranty to access external sources of capital on acceptable terms;
|
|
•
|
changes in the world’s credit markets, segments thereof, interest rates or general economic conditions;
|
|
•
|
the impact of market volatility on the mark-to-market of Assured Guaranty’s contracts written in credit default swap form;
|
|
•
|
changes in applicable accounting policies or practices;
|
|
•
|
changes in applicable laws or regulations, including insurance, bankruptcy and tax laws, or other governmental actions;
|
|
•
|
the impact of changes in the world’s economy and credit and currency markets and in applicable laws or regulations relating to the decision of the United Kingdom to exit the European Union;
|
|
•
|
the possibility that acquisitions or alternative investments made by Assured Guaranty do not result in the benefits anticipated or subject Assured Guaranty to unanticipated consequences;
|
|
•
|
deterioration in the financial condition of Assured Guaranty’s reinsurers, the amount and timing of reinsurance recoverables actually received and the risk that reinsurers may dispute amounts owed to Assured Guaranty under its reinsurance agreements;
|
|
•
|
difficulties with the execution of Assured Guaranty’s business strategy;
|
|
•
|
loss of key personnel;
|
|
•
|
the effects of mergers, acquisitions and divestitures;
|
|
•
|
natural or man-made catastrophes;
|
|
•
|
other risk factors identified in AGL’s filings with the U.S. Securities and Exchange Commission (the SEC);
|
|
•
|
other risks and uncertainties that have not been identified at this time; and
|
|
•
|
management’s response to these factors.
|
The foregoing review of important factors should not be construed as exhaustive, and should be read in conjunction with the other cautionary statements that are included in this Form 10-K. The Company undertakes no obligation to update publicly or review any forward looking statement, whether as a result of new information, future developments or otherwise, except as required by law. Investors are advised, however, to consult any further disclosures the Company makes on related subjects in the Company’s reports filed with the SEC.
If one or more of these or other risks or uncertainties materialize, or if the Company’s underlying assumptions prove to be incorrect, actual results may vary materially from what the Company projected. Any forward looking statements in this Form 10-K reflect the Company’s current views with respect to future events and are subject to these and other risks, uncertainties and assumptions relating to its operations, results of operations, growth strategy and liquidity.
For these statements, the Company claims the protection of the safe harbor for forward looking statements contained in Section 27A of the Securities Act of 1933, as amended (the Securities Act), and Section 21E of the Securities Exchange Act of 1934, as amended (the Exchange Act).
Convention
Unless otherwise noted, ratings on Assured Guaranty's insured portfolio and on bonds or notes purchased pursuant to loss mitigation strategies or other risk management strategies (loss mitigation securities) are Assured Guaranty’s internal ratings. Internal credit ratings are expressed on a rating scale similar to that used by the rating agencies and generally reflect an approach similar to that employed by the rating agencies, except that Assured Guaranty's internal credit ratings focus on future performance, rather than lifetime performance.
In addition, unless otherwise noted, the Company excludes amounts from par and debt service outstanding as a result of loss mitigation strategies, including loss mitigation securities held in the investment portfolio. The Company manages the loss mitigation securities as investments and not insurance exposure.
ASSURED GUARANTY LTD.
FORM 10-K
TABLE OF CONTENTS
|
|
|
Page
|
|
|
||
|
|
||
|
|
||
|
|
||
|
|
||
|
|
||
|
|
||
|
|
||
|
|
||
|
|
||
|
|
||
|
|
||
|
|
||
|
|
||
|
|
||
|
|
||
|
|
||
|
|
||
|
|
||
|
|
||
|
|
||
|
|
||
|
|
||
|
|
||
|
|
||
|
|
||
|
|
||
|
|
||
|
ITEM 1.
|
BUSINESS
|
Overview
Assured Guaranty Ltd. (AGL and, together with its subsidiaries, Assured Guaranty or the Company) is a Bermuda-based holding company incorporated in 2003 that provides, through its operating subsidiaries, credit protection products to the United States (U.S.) and international public finance (including infrastructure) and structured finance markets. The Company applies its credit underwriting judgment, risk management skills and capital markets experience primarily to offer financial guaranty insurance that protects holders of debt instruments and other monetary obligations from defaults in scheduled payments. If an obligor defaults on a scheduled payment due on an obligation, including a scheduled principal or interest payment (Debt Service), the Company is required under its unconditional and irrevocable financial guaranty to pay the amount of the shortfall to the holder of the obligation. The Company markets its financial guaranty insurance directly to issuers and underwriters of public finance and structured finance securities as well as to investors in such obligations. The Company guarantees obligations issued principally in the U.S. and the United Kingdom (U.K.), and also guarantees obligations issued in other countries and regions, including Australia and Western Europe. The Company also provides other forms of insurance that are in line with its risk profile and benefit from its underwriting experience.
The Company conducts its financial guaranty business on a direct basis from the following companies: Assured Guaranty Municipal Corp. (AGM), Municipal Assurance Corp. (MAC), Assured Guaranty Corp. (AGC), and Assured Guaranty (Europe) Ltd. (AGE). It also conducts business through Assured Guaranty Re Ltd. (AG Re) and Assured Guaranty Re Overseas Ltd. (AGRO), Bermuda-based reinsurers. The following is a description of AGL's principal operating subsidiaries:
|
•
|
Assured Guaranty Municipal Corp.
AGM is located and domiciled in New York, was organized in 1984 and commenced operations in 1985. Since mid-2008, AGM has provided financial guaranty insurance only on debt obligations issued in the U.S. public finance and global infrastructure markets, including bonds issued by U.S. state or governmental authorities or notes issued to finance infrastructure projects. Previously, AGM also offered insurance and reinsurance in the global structured finance market, including asset-backed securities issued by special purpose entities. AGM formerly was named Financial Security Assurance Inc. Assured Guaranty acquired AGM, together with its holding company Financial Security Assurance Holdings Ltd. (renamed Assured Guaranty Municipal Holdings Inc., AGMH) and the subsidiaries owned by that holding company, on July 1, 2009.
|
|
•
|
Municipal Assurance Corp.
MAC is located and domiciled in New York and was organized in 2008. Assured Guaranty acquired MAC on May 31, 2012. On July 16, 2013, Assured Guaranty completed a series of transactions that increased the capitalization of MAC and resulted in MAC assuming a portfolio of geographically diversified U.S. public finance exposure from AGM and AGC. MAC offers insurance and reinsurance on bonds issued by U.S. state or municipal governmental authorities, focusing on investment grade obligations in select sectors of the municipal market.
|
|
•
|
Assured Guaranty Corp.
AGC is located in New York and domiciled in Maryland, was organized in 1985 and commenced operations in 1988. It provides insurance and reinsurance on debt obligations in the global structured finance market and also offers guarantees on obligations in the U.S. public finance and international infrastructure markets.
|
On July 1, 2016, AGC acquired all of the issued and outstanding capital stock of CIFG Holding Inc. (together with its subsidiaries, CIFGH) (the CIFG Acquisition). AGC merged CIFG Assurance North America, Inc. (CIFGNA), a financial guaranty insurer subsidiary of CIFGH, with and into AGC, with AGC as the surviving company, on July 5, 2016. The CIFG Acquisition added $4.2 billion of net par insured on July 1, 2016.
On April 1, 2015 (Radian Acquisition Date), AGC completed the acquisition of all of the issued and outstanding capital stock of financial guaranty insurer Radian Asset Assurance Inc. (Radian Asset) (Radian Asset Acquisition). Radian Asset was merged with and into AGC, with AGC as the surviving company of the merger. The Radian Asset Acquisition added
$13.6 billion
to the Company's net par outstanding on April 1, 2015.
On January 10, 2017, AGC completed its acquisition of MBIA UK Insurance Limited (MBIA UK) (MBIA UK Acquisition), the European operating subsidiary of MBIA Insurance Corporation (MBIA). As of December 31, 2016, MBIA UK had an insured portfolio of approximately
$12 billion
of net par. MBIA UK has changed its name to Assured Guaranty (London) Ltd. (AGLN). Assured Guaranty currently maintains AGLN as a stand-alone
6
entity. Assured Guaranty is actively working to combine AGLN with its other affiliated European insurance companies. Any such combination will be subject to regulatory and court approvals; as a result, Assured Guaranty cannot predict when, or if, such a combination will be completed.
|
•
|
Assured Guaranty (Europe) Ltd.
AGE is a U.K. incorporated company licensed as a U.K. insurance company and authorized to operate in various countries throughout the European Economic Area (EEA). It was organized in 1990 and issued its first financial guarantee in 1994. AGE offers financial guarantees in both the international public finance and structured finance markets and is the primary entity from which the Company writes business in the EEA. As discussed further under "Business" below, AGE has agreed with its regulator that new business it writes would be guaranteed using a co-insurance structure pursuant to which AGE would co-insure municipal and infrastructure transactions with AGM, and structured finance transactions with AGC. AGE must obtain the approval of the Prudential Regulation Authority (PRA) before it can guarantee any new structured finance transaction.
|
|
•
|
Assured Guaranty Re Ltd. and Assured Guaranty Re Overseas Ltd.
AG Re is incorporated under the laws of Bermuda and is licensed as a Class 3B insurer under the Insurance Act 1978 and related regulations of Bermuda. AG Re owns, indirectly, AGRO, which is a Bermuda Class 3A and Class C insurer. AG Re and AGRO underwrite financial guaranty reinsurance, and AGRO also underwrites other reinsurance that is in line with the Company's risk profile and benefits from its underwriting experience. AG Re and AGRO write business as reinsurers of third-party primary insurers and of certain affiliated companies.
|
Assured Guaranty is the market leader in the financial guaranty industry. The Company's position in the market has benefited from its acquisition of AGMH in 2009 as well as subsequent acquisitions of financial guarantors, its ability to maintain strong financial strength ratings, its strong claims-paying resources, its proven willingness to make claim payments to policyholders after obligors have defaulted, and its ability to achieve recoveries in respect of the claims that it has paid on insured residential mortgage-backed and other securities and to resolve troubled municipal credits to which it had exposure.
The Company faces competition in the U.S. public finance financial guaranty market. The Company estimates, based on third party industry compilations, that of the insured U.S. public finance bonds issued in the primary market in
2016
, the Company insured approximately
56%
of the par, while Build America Mutual Assurance Company (BAM), insured
40%
of the par. National Public Finance Guarantee Corporation (National), an affiliate of MBIA, insured the remaining
4%
of the balance. The continued presence in the market of BAM affects the Company's insured volume as well as the amount of premium the Company is able to charge.
The sustained low interest rate environment in the U.S. also presents the Company with challenges. Over the last several years, interest rates generally have been lower than historical norms. Average municipal interest rates were extremely low during 2016, with the benchmark AAA 30-year Municipal Market Data index published by Thomson Reuters (MMD Index), at times below 2%, a threshold not previously crossed in the modern era. As a result, the difference in yield (or the credit spread) between a bond insured by Assured Guaranty and an uninsured bond has provided comparatively little room for issuer savings and insurance premium, and Assured Guaranty has seen a lower demand for its financial guaranty insurance from issuers over the past several years than it saw historically.
In addition, the Company's business continues to be affected by negative perceptions of the value of the financial guaranty insurance sold by other companies that had been active in the industry. The losses suffered by such other insurers resulted in those companies being downgraded to below-investment-grade (BIG) levels by the rating agencies and/or subject to intervention by their state insurance regulators. In a number of cases, the state insurance regulators prevented the distressed financial guaranty insurers from paying claims or paying such claims in full; also, such financial guaranty insurers were perceived by market participants not to be actively conducting surveillance on transactions or fully exercising rights and remedies to mitigate losses.
The Company believes that issuers and investors in securities will continue to purchase financial guaranty insurance, especially if interest rates rise and credit spreads widen. U.S. municipalities have budgetary requirements that are best met through financings in the fixed income capital markets. In particular, smaller municipal issuers frequently use financial guaranties in order to access the capital markets with new debt offerings at a lower all-in interest rate than on an unguaranteed basis. In addition, the Company expects long-term debt financings for infrastructure projects will grow throughout the world, as will the financing needs associated with privatization initiatives or refinancing of infrastructure projects in developed countries.
7
During 2016, the Company established an alternative investments group to focus on deploying a portion of the Company's excess capital to pursue acquisitions and develop new business opportunities that complement the Company's financial guaranty business, are in line with its risk profile and benefit from its core competencies. The alternative investments group has been investigating a number of such opportunities, including, among others, both controlling and non-controlling investments in investment managers. In February 2017, the Company agreed to purchase up to $100 million of limited partnership interests in a fund that invests in the equity of private equity managers. The Company also considers opportunities to acquire financial guaranty portfolios, whether by acquiring financial guarantors who are no longer actively writing new business or their insured portfolios, or by commuting business that it had previously ceded. The Company continues to investigate additional opportunities.
Financial Guaranty Portfolio
Financial guaranty insurance generally provides an unconditional and irrevocable guaranty that protects the holder of a debt instrument or other monetary obligation against non-payment of scheduled principal and interest payments when due. Upon an obligor's default on scheduled principal or interest payments due on the debt obligation, whether due to its insolvency or otherwise, the Company is generally required under the financial guaranty contract to pay the investor the principal or interest shortfall then due.
Financial guaranty insurance may be issued to all of the investors of the guaranteed series or tranche of a municipal bond or structured finance security at the time of issuance of those obligations or it may be issued in the secondary market to only specific individual holders of such obligations who purchase the Company's credit protection.
Both issuers of and investors in financial instruments may benefit from financial guaranty insurance. Issuers benefit when they purchase financial guaranty insurance for their new issue debt transaction because the insurance may have the effect of lowering an issuer's interest cost over the life of the debt transaction to the extent that the insurance premium charged by the Company is less than the net present value of the difference between the yield on the obligation insured by Assured Guaranty (which carries the credit rating of the specific subsidiary that guarantees the debt obligation) and the yield on the debt obligation if sold on the basis of its uninsured credit rating. The principal benefit to investors is that the Company's guaranty provides certainty that scheduled payments will be received when due. The guaranty may also improve the marketability of obligations issued by infrequent or unknown issuers, as well as obligations with complex structures or backed by asset classes new to the market. This benefit to market liquidity, which we call a liquidity benefit, results from the increase in secondary market trading values for Assured Guaranty-insured obligations as compared with uninsured obligations by the same issuer. In general, the liquidity benefit of financial guaranties is that investors are able to sell insured bonds more quickly and, depending on the financial strength rating of the insurer, at a higher secondary market price than for uninsured debt obligations.
As an alternative to traditional financial guaranty insurance, in the past the Company also provided credit protection relating to a particular security or obligor through a credit derivative contract, such as a credit default swap (CDS). Under the terms of a CDS, the seller of credit protection agreed to make a specified payment to the buyer of credit protection if one or more specified credit events occurs with respect to a reference obligation or entity. In general, the credit events specified in the Company's CDS are for interest and principal defaults on the reference obligation. One difference between CDS and traditional primary financial guaranty insurance is that credit default protection was typically provided to a particular buyer of credit protection, who is not always required to own the reference obligation, rather than to all investors in the reference obligation. As a result, the Company's rights and remedies under a CDS may be different and more limited than on a financial guaranty of an entire issuance. Credit derivatives were preferred by some investors, however, because they generally offered the investor ease of execution and standardized terms as well as more favorable accounting or capital treatment. Due to changes in the regulatory environment, the Company has not provided credit protection in the U.S. through a CDS since March 2009, other than in connection with loss mitigation and other remediation efforts relating to its existing book of business. See the Risk Factor captioned "Changes in or inability to comply with applicable law could adversely affect the Company's ability to do business" under Risks Related to GAAP and Applicable Law in "Item 1A. Risk Factors" for additional detail about the regulatory environment.
The Company also offers credit protection through reinsurance, and in the past has provided reinsurance to other financial guaranty insurers with respect to their guaranty of public finance, infrastructure and structured finance obligations. The Company believes that the opportunities currently available to it in the reinsurance market consist primarily of potentially assuming portfolios of transactions from inactive primary insurers and recapturing portfolios that it has previously ceded to third party reinsurers.
The Company's financial guaranty direct and assumed businesses provide credit protection on public finance, infrastructure and structured finance obligations. For information on the geographic breakdown of the Company's financial guaranty portfolio and on its income and revenue by jurisdiction, see Part II, Item 8, Financial Statements and Supplementary
8
Data, Note 4, Outstanding Exposure, Geographic Distribution of Net Par Outstanding and Note 12, Income Taxes, Provision for Income Taxes.
U.S. Public Finance Obligations
The Company insures and reinsures a number of different types of U.S. public finance obligations, including the following:
General Obligation Bonds
are full faith and credit bonds that are issued by states, their political subdivisions and other municipal issuers, and are supported by the general obligation of the issuer to pay from available funds and by a pledge of the issuer to levy ad valorem taxes in an amount sufficient to provide for the full payment of the bonds.
Tax-Backed Bonds
are obligations that are supported by the issuer from specific and discrete sources of taxation. They include tax-backed revenue bonds, general fund obligations and lease revenue bonds. Tax-backed obligations may be secured by a lien on specific pledged tax revenues, such as a gasoline or excise tax, or incrementally from growth in property tax revenue associated with growth in property values. These obligations also include obligations secured by special assessments levied against property owners and often benefit from issuer covenants to enforce collections of such assessments and to foreclose on delinquent properties. Lease revenue bonds typically are general fund obligations of a municipality or other governmental authority that are subject to annual appropriation or abatement; projects financed and subject to such lease payments ordinarily include real estate or equipment serving an essential public purpose. Bonds in this category also include moral obligations of municipalities or governmental authorities.
Municipal Utility Bonds
are obligations of all forms of municipal utilities, including electric, water and sewer utilities and resource recovery revenue bonds. These utilities may be organized in various forms, including municipal enterprise systems, authorities or joint action agencies.
Transportation Bonds
include a wide variety of revenue-supported bonds, such as bonds for airports, ports, tunnels, municipal parking facilities, toll roads and toll bridges.
Healthcare Bonds
are obligations of healthcare facilities, including community based hospitals and systems, as well as of health maintenance organizations and long-term care facilities.
Higher Education Bonds
are obligations secured by revenue collected by either public or private secondary schools, colleges and universities. Such revenue can encompass all of an institution's revenue, including tuition and fees, or in other cases, can be specifically restricted to certain auxiliary sources of revenue.
Infrastructure Bonds
include obligations issued by a variety of entities engaged in the financing of infrastructure projects, such as roads, airports, ports, social infrastructure and other physical assets delivering essential services supported by long-term concession arrangements with a public sector entity.
Housing Revenue Bonds
are obligations relating to both single and multi-family housing, issued by states and localities, supported by cash flow and, in some cases, insurance from entities such as the Federal Housing Administration.
Investor-Owned Utility Bonds
are obligations primarily backed by investor-owned utilities, first mortgage bond obligations of for-profit electric or water utilities providing retail, industrial and commercial service, and also include sale-leaseback obligation bonds supported by such entities.
Other Public Finance Bonds
include other debt issued, guaranteed or otherwise supported by U.S. national or local governmental authorities, as well as student loans, revenue bonds, and obligations of some not-for-profit organizations.
A portion of the Company's exposure to tax-backed bonds, municipal utility bonds and transportation bonds constitutes "special revenue" bonds under the U.S. Bankruptcy Code. Even if an obligor under a special revenue bond were to seek protection from creditors under Chapter 9 of the U.S. Bankruptcy Code, holders of the special revenue bond should continue to receive timely payments of principal and interest during the bankruptcy proceeding, subject to the special revenues being sufficient to pay debt service and the lien on the special revenues being subordinate to the necessary operating expenses of the project or system from which the revenues are derived. While "special revenues" acquired by the obligor after bankruptcy remain subject to the pre-petition pledge, special revenue bonds may be adjusted if their claim is determined to be "undersecured."
9
Non-U.S. Public Finance Obligations
The Company insures and reinsures a number of different types of non-U.S. public finance obligations, which consist of both infrastructure projects and other projects essential for municipal function such as regulated utilities. Credit support for the exposures written by the Company may come from a variety of sources, including some combination of subordinated tranches, over-collateralization or cash reserves. Additional support also may be provided by transaction provisions intended to benefit noteholders or credit enhancers. The types of non-U.S. public finance securities the Company insures and reinsures include the following:
Infrastructure Finance Obligations
are obligations issued by a variety of entities engaged in the financing of international infrastructure projects, such as roads, airports, ports, social infrastructure, and other physical assets delivering essential services supported either by long-term concession arrangements with a public sector entity or a regulatory regime. The majority of the Company's international infrastructure business is conducted in the U.K.
Regulated Utilities Obligations
are issued by government-regulated providers of essential services and commodities, including electric, water and gas utilities. The majority of the Company's international regulated utility business is conducted in the U.K.
Pooled Infrastructure Obligations
are synthetic asset-backed obligations that take the form of CDS obligations or credit-linked notes that reference either infrastructure finance obligations or a pool of such obligations, with a defined deductible to cover credit risks associated with the referenced obligations.
Other Public Finance Obligations
include obligations of local, municipal, regional or national governmental authorities or agencies.
U.S. and Non-U.S. Structured Finance Obligations
The Company insures and reinsures a number of different types of U.S. and non-U.S. structured finance obligations. Credit support for the exposures written by the Company may come from a variety of sources, including some combination of subordinated tranches, excess spread, over-collateralization or cash reserves. Additional support also may be provided by transaction provisions intended to benefit noteholders or credit enhancers. The types of U.S. and Non-U.S. Structured Finance obligations the Company insures and reinsures include the following:
Pooled Corporate Obligations
are securities primarily backed by various types of corporate debt obligations, such as secured or unsecured bonds, bank loans or loan participations and trust preferred securities (TruPS). These securities are often issued in "tranches," with subordinated tranches providing credit support to the more senior tranches. The Company's financial guaranty exposures generally are to the more senior tranches of these issues.
Residential Mortgage-Backed Securities (RMBS)
are obligations backed by closed-end and open-end first and second lien mortgage loans on one-to-four family residential properties, including condominiums and cooperative apartments. First lien mortgage loan products in these transactions include fixed rate, adjustable rate and option adjustable-rate mortgages. The credit quality of borrowers covers a broad range, including "prime", "subprime" and "Alt-A". A prime borrower is generally defined as one with strong risk characteristics as measured by factors such as payment history, credit score, and debt-to-income ratio. A subprime borrower is a borrower with higher risk characteristics, usually as determined by credit score and/or credit history. An Alt-A borrower is generally defined as a prime quality borrower that lacks certain ancillary characteristics, such as fully documented income. The Company has not insured a RMBS transaction since January 2008.
Insurance Securitization Obligations
are obligations secured by the future earnings from pools of various types of insurance/reinsurance policies and income produced by invested assets.
Consumer Receivables Securities
are obligations backed by non-mortgage consumer receivables, such as student loans, automobile loans and leases, manufactured home loans and other consumer receivables.
"Financial Products Business"
is how the Company refers to the guaranteed investment contracts (GICs) portion of a line of business previously conducted by AGMH that the Company did not acquire when it purchased AGMH in 2009 from Dexia SA and that is being run off. That line of business was comprised of AGMH's guaranteed investment contracts business, its medium term notes business and the equity payment agreements associated with AGMH's leveraged lease business. Assured Guaranty is indemnified by Dexia SA and certain of its affiliates (Dexia) against loss from the former Financial Products Business.
10
Commercial Receivables Securities
are obligations backed by equipment loans or leases, aircraft and aircraft engine financings, business loans and trade receivables. Credit support is derived from the cash flows generated by the underlying obligations, as well as property or equipment values as applicable.
Commercial Mortgage-Backed Securities (CMBS)
are obligations backed by pools of commercial mortgages on office, multi-family, retail, hotel, industrial and other specialized or mixed-use properties.
Other Structured Finance Obligations
are obligations backed by assets not generally described in any of the other described categories. One such type of asset is a tax benefit to be realized by an investor in one of the Federal or state programs that permit such investor to receive a credit against taxes (such as Federal corporate income tax or state insurance premium tax) for making qualified investments in specified enterprises, typically located in designated low-income areas.
Credit Policy and Underwriting Procedure
Credit Policy
The Company establishes exposure limits and underwriting criteria for obligors, sectors and countries, and in the case of structured finance and infrastructure exposures, for individual transactions. Risk exposure limits for single obligors are based on the Company's assessment of potential frequency and severity of loss as well as other factors, such as historical and stressed collateral performance. Sector limits are based on the Company’s view of stress losses for the sector and on its assessment of intra-sector correlation. Country limits are based on the size and stability of the relevant economy, and the Company’s view of the political environment and legal system. All of the foregoing limits are established in relation to the Company's capital base.
For U.S. public finance transactions, the Company focuses principally on the credit quality of the obligor based on population size and trends, wealth factors, and strength of the economy. The Company evaluates the obligor’s liquidity position; its fiscal management policies and track record; its ability to raise revenues and control expenses; and its exposure to derivative contracts and to debt subject to acceleration. The Company assesses the obligor’s pension and other post-employment benefits obligations and funding policies and evaluates the obligor’s ability to adequately fund such obligations in the future. The Company analyzes other critical risk factors including the type of issue; the repayment source; pledged security, if any; the presence of restrictive covenants and the tenor of the risk. The Company also considers the ability of obligors to file for bankruptcy or receivership under applicable statutes (and on related statutes that provide for state oversight or fiscal control over financially troubled obligors). In addition, the Company weighs the risk of a rating agency downgrade of an obligation's underlying uninsured rating.
For certain transactions, underwriting considerations may also include: the importance of the proposed project to the community; the financial management of a specific project; the potential refinancing risk; and legal or administrative risks.
In cases of not-for-profit institutions, such as healthcare issuers and private higher education issuers, the Company emphasizes the financial stability of the institution, its competitive position and its management experience.
For U.S. infrastructure transactions, the Company's due diligence is generally the same as it is for international infrastructure transactions, as described below.
U.S. structured finance obligations generally present three distinct forms of risk: asset risk, pertaining to the amount and quality of assets underlying an issue; structural risk, pertaining to the extent to which an issue's legal structure provides protection from loss; and execution risk, which is the risk that poor performance by a servicer or collateral manager contributes to a decline in the cash flow available to the transaction. Each of these risks is addressed through the Company's underwriting process.
Generally, the amount and quality of asset coverage required with respect to a structured finance exposure is dependent upon both the historic performance of the asset class, as well as the Company’s view of the future performance of the subject assets. Future performance expectations are developed from historical loss experience, taking into account economic, social and political factors affecting that asset class as well as, to the extent feasible, the subject assets themselves. Conclusions are then drawn about the amount of over-collateralization or other credit enhancement necessary in a particular transaction in order to protect investors (and therefore the insurer or reinsurer) against poor asset performance. In addition, structured securities usually are designed to protect investors (and therefore the insurer or reinsurer) from the bankruptcy or
11
insolvency of the entity that originated the underlying assets, as well as the bankruptcy or insolvency of the servicer or manager of those assets.
The Company conducts extensive due diligence on the collateral that supports its insured transactions. The principal focus of the due diligence is to confirm the underlying collateral was originated in accordance with the stated underwriting criteria of the asset originator. To this end, such collateral is reviewed, either internally by the Company or by outside consultants that the Company engages. The Company also conducts audits of servicing or other management procedures, reviewing critical aspects of these procedures such as cash management and collections. The Company may, for certain transactions, obtain background checks on key managers of the originator, servicer or manager of the obligations underlying that transaction.
In general, non-U.S. transactions are comprised of structured finance transactions, transactions with regulated utilities, or infrastructure transactions. For these transactions, the Company undertakes an analysis of the country or countries in which the risk resides, which includes political risk as well as economic and demographic characteristics. For each transaction, the Company also performs an assessment of the legal framework governing the transaction and the laws affecting the underlying assets supporting the obligations to be insured.
The underwriting of structured finance and regulated utilities is generally the same as for U.S. transactions, but for considerations related to the specific country as described in the previous paragraph. For infrastructure transactions, the Company reviews the type of project (e.g., hospital, road, social housing, transportation or student accommodation) and the source of repayment of the debt. For certain transactions, debt service and operational expenses are covered by availability payments made by either a governmental entity or a not-for-profit entity. The availability payments are due if the project is available for use, regardless of whether the project actually is in use. The principal risks for such transactions are construction risk and operational risk. The project must be completed on time and must be available for use during the life of the concession. For other transactions, notably transactions secured by toll-roads, revenues derived from the project must be sufficient to make debt service payments as well as cover operating expenses during the concession period. The Company undertakes due diligence to assess demand risks in such projects and often uses consultants to help assess future demand and revenue and expense projections.
The Company’s due diligence for infrastructure projects also includes: a financial review of the entity seeking the development of the project (usually a governmental entity or university); a financial and operational review of the developer, the construction companies, and the project operator; and a financial review of the various providers of operational financial protection for the bondholders (and therefore the insurer), including construction surety providers, letter-of-credit providers, liquidity banks or account banks. The Company uses outside consultants to review the construction program and to assess whether the project can be completed on time and on budget. The Company projects the cost of replacing the construction company, including delays in construction, in the event that a construction company is unable to complete the construction for any reason. Construction security packages are sized appropriately to cover these risks and the Company requires such coverage from credit-worthy institutions.
Underwriting Procedure
Each transaction underwritten by the Company involves persons with different expertise across various departments within the Company. The Company's transaction underwriting teams include both underwriting and legal personnel, who analyze the structure of a potential transaction and the credit and legal issues pertinent to the particular line of business or asset class, and accounting and finance personnel, who review the more complex transactions for compliance with applicable accounting standards and investment guidelines.
In the public finance portion of the Company's financial guaranty direct business, underwriters generally analyze the issuer's historical financial statements and, where warranted, develop stress case projections to test the issuers' ability to make timely debt service payments under stressful economic conditions. In the structured and infrastructure finance portions of the Company's financial guaranty direct business, underwriters generally use computer-based financial models in order to evaluate the ability of the transaction to generate adequate cash flow to service the debt under a variety of scenarios. The models include economically stressed scenarios that the underwriters use for their assessment of the potential credit risk inherent in a particular transaction. Stress models developed internally by the Company's underwriters reflect both empirical research and information gathered from third parties, such as rating agencies or investment banks. The Company may also engage advisors such as consultants and external counsel to assist in analyzing a transaction's financial or legal risks. The Company may also conduct a due diligence review that includes, among other things, a site visit to the project or facility, meetings with issuer management, review of underwriting and operational procedures, file reviews, and review of financial procedures and computer systems.
12
Upon completion of the underwriting analysis, the underwriter prepares a formal credit report that is submitted to a credit committee for review. An oral presentation is usually made to the committee, followed by questions from committee members and discussion among the committee members and the underwriters. In some cases, additional information may be presented at the meeting or required to be submitted prior to approval. Each credit committee decision is documented and any further requirements, such as specific terms or evidence of due diligence, are noted. The Company's credit committees are composed of senior officers of the Company. The committees are organized by asset class, such as for public finance or structured finance, or along regulatory lines, to assess the various potential exposures.
Risk Management Procedures
Organizational Structure
The Company's policies and procedures relating to risk assessment and risk management are overseen by its Board of Directors (the Board). The Board takes an enterprise-wide approach to risk management that is designed to support the Company's business plans at a reasonable level of risk. A fundamental part of risk assessment and risk management is not only understanding the risks a company faces and what steps management is taking to manage those risks, but also understanding what level of risk is appropriate for the Company. The Board annually approves the Company's business plan, factoring risk management into account. It also approves the Company's risk appetite statement, which articulates the Company's tolerance for risk and describes the general types of risk that the Company accepts or attempts to avoid. The involvement of the Board in setting the Company's business strategy is a key part of its assessment of management's risk tolerance and also a determination of what constitutes an appropriate level of risk for the Company.
While the Board has the ultimate oversight responsibility for the risk management process, various committees of the Board also have responsibility for risk assessment and risk management. The Risk Oversight Committee of the Board oversees the standards, controls, limits, underwriting guidelines and policies that the Company establishes and implements in respect of credit underwriting and risk management. It focuses on management's assessment and management of both (i) credit risks and (ii) other risks, including, but not limited to, financial, legal and operational risks, and risks relating to the Company's reputation and ethical standards. In addition, the Audit Committee of the Board is responsible for, among other matters, reviewing policies and processes related to the evaluation of risk assessment and risk management, including the Company's major financial risk exposures and the steps management has taken to monitor and control such exposures. It also reviews compliance with legal and regulatory requirements. The Compensation Committee of the Board reviews compensation-related risks to the Company. The Finance Committee of the Board oversees the investment of the Company's investment portfolio and the Company's capital structure, liquidity, financing arrangements, rating agency matters, and any corporate development activities in support of the Company's financial plan. The Nominating and Governance Committee of the Board oversees risk at the Company by developing appropriate corporate governance guidelines and identifying qualified individuals to become board members.
The Company has established a number of management committees to develop underwriting and risk management guidelines, policies and procedures for the Company's insurance and reinsurance subsidiaries that are tailored to their respective businesses, providing multiple levels of credit review and analysis.
|
•
|
Portfolio Risk Management Committee
—This committee establishes company-wide credit policy for the Company's direct and assumed business. It implements specific underwriting procedures and limits for the Company and allocates underwriting capacity among the Company's subsidiaries. The Portfolio Risk Management Committee focuses on measuring and managing credit, market and liquidity risk for the overall company. All transactions in new asset classes or new jurisdictions must be approved by this committee.
|
|
•
|
U.S. Management Committee
—This committee establishes strategic policy and reviews the implementation of strategic initiatives and general business progress in the U.S. The U.S. Management Committee approves risk policy at the U.S. operating company level.
|
|
•
|
Risk Management Committees
—The U.S., U.K. and AG Re risk management committees conduct an in-depth review of the insured portfolios of the relevant subsidiaries, focusing on varying portions of the portfolio at each meeting. They assign internal ratings of the insured transactions and review sector reports, monthly product line surveillance reports and compliance reports.
|
|
•
|
Workout Committee
—This committee receives reports from surveillance and workout personnel on transactions that might benefit from active loss mitigation or risk reduction, and approves loss mitigation or risk reduction strategies for such transactions.
|
13
|
•
|
Reserve Committees
—Oversight of reserving risk is vested in the U.S. Reserve Committee, the AG Re Reserve Committee and the U.K. Reserve Committee. The committees review the reserve methodology and assumptions for each major asset class or significant BIG transaction, as well as the loss projection scenarios used and the probability weights assigned to those scenarios. The reserve committees establish reserves for the relevant subsidiaries, taking into consideration supporting information provided by surveillance personnel.
|
The Company's surveillance personnel are responsible for monitoring and reporting on all transactions in the insured portfolio, including exposures in both the financial guaranty direct and assumed businesses. The primary objective of the surveillance process is to monitor trends and changes in transaction credit quality, detect any deterioration in credit quality, and recommend remedial actions to management. All transactions in the insured portfolio are assigned internal credit ratings, and surveillance personnel recommend adjustments to those ratings to reflect changes in transaction credit quality.
The Company's workout personnel are responsible for managing workout, loss mitigation and risk reduction situations. They work together with the Company's surveillance personnel to develop and implement strategies on transactions that are experiencing loss or could possibly experience loss. They develop strategies designed to enhance the ability of the Company to enforce its contractual rights and remedies and mitigate potential losses. The Company's workout personnel also engage in negotiation discussions with transaction participants and, when necessary, manage (along with legal personnel) the Company's litigation proceedings. They may also make open market or negotiated purchases of securities that the Company has insured, or negotiate or otherwise implement consensual terminations of insurance coverage prior to contractual maturity. The Company's workout personnel work with servicers of RMBS transactions to enhance their performance.
Direct Business
The Company monitors the performance of each risk in its portfolio and tracks aggregation of risk. The review cycle and scope vary based upon transaction type and credit quality. In general, the review process includes the collection and analysis of information from various sources, including trustee and servicer reports, financial statements, general industry or sector news and analyses, and rating agency reports. For public finance risks, the surveillance process includes monitoring general economic trends, developments with respect to state and municipal finances, and the financial situation of the issuers. For structured finance transactions, the surveillance process can include monitoring transaction performance data and cash flows, compliance with transaction terms and conditions, and evaluation of servicer or collateral manager performance and financial condition. Additionally, the Company uses various quantitative tools and models to assess transaction performance and identify situations where there may have been a change in credit quality. For all transactions, surveillance activities may include discussions with or site visits to issuers, servicers or other parties to a transaction.
Assumed Business
For transactions that the Company has assumed, the ceding insurers are responsible for conducting ongoing surveillance of the exposures that have been ceded to the Company. The Company's surveillance personnel monitor the ceding insurer's surveillance activities on exposures ceded to the Company through a variety of means, including reviews of surveillance reports provided by the ceding insurers, and meetings and discussions with their analysts. The Company's surveillance personnel also monitor general news and information, industry trends and rating agency reports to help focus surveillance activities on sectors or credits of particular concern. For certain exposures, the Company also will undertake an independent analysis and remodeling of the exposure. In the event of credit deterioration of a particular exposure, more frequent reviews of the ceding company's risk mitigation activities are conducted. The Company's surveillance personnel also take steps to ensure that the ceding insurer is managing the risk pursuant to the terms of the applicable reinsurance agreement. To this end, the Company conducts periodic reviews of ceding companies' surveillance activities and capabilities. That process may include the review of the insurer's underwriting, surveillance and claim files for certain transactions.
Ceded Business
As part of its risk management strategy prior to the financial crisis, the Company obtained third party reinsurance or retrocessions to reduce its exposure to risk concentrations, such as for single risk limits, portfolio credit rating or exposure limits, geographic limits or other factors, to increase its underwriting capacity, both on an aggregate-risk and a single-risk basis, to meet internal, rating agency and regulatory risk limits, diversify risks, reduce the need for additional capital, and strengthen financial ratios. The Company receives capital credit for ceded reinsurance in the capital models used by the rating agencies to evaluate the Company's capital position for its financial strength ratings and in its own internal capital models. The amount of the credit depends on the reinsurer's rating and any collateral it may post. During and after the financial crisis, most of the Company's reinsurers were downgraded by one or more rating agencies, and the effect of such downgrades, in general, was to
14
decrease the financial benefits of using reinsurance. Over the past several years the Company has entered into commutation agreements reassuming portions of the previously ceded business from certain reinsurers; as of
December 31, 2016
, approximately
4%
, or $11.2 billion, of its principal amount outstanding was still ceded to third party reinsurers, down from 12%, or $86.5 billion, as of December 31, 2009.
More recently the Company has obtained excess-of-loss reinsurance in part to augment its capital in the capital model used by S&P Global Ratings, a division of Standard & Poor's Financial Services LLC (S&P) to evaluate its financial strength ratings. Specifically, AGC, AGM and MAC entered into a
$360 million
aggregate excess of loss reinsurance facility with a number of reinsurers, effective as of January 1, 2016. At its inception effective as of January 1, 2016, the facility covered losses occurring from January 1, 2016 through December 31, 2022, or from January 1, 2017 through December 31, 2023, at the option of AGC, AGM and MAC. AGC, AGM and MAC did not elect coverage under the new facility for the seven year period commencing January 1, 2016, but they retain an option, which must be exercised prior to January 1, 2018, and which requires the payment of additional premium, to elect coverage for the seven year period commencing January 1, 2017. See Part II, Item 8, Financial Statements and Supplementary Data, Note 13, Reinsurance and Other Monoline Exposures, for more information.
The Company may in the future enter into new third party reinsurance or retrocessions or other arrangements to reduce its exposure to risk concentrations, such as for single risk limits, portfolio credit rating or exposure limits, geographic limits or other factors, to increase its underwriting capacity, both on an aggregate-risk and a single-risk basis, to meet internal, rating agency and regulatory risk limits, diversify risks, reduce the need for additional capital, or strengthen financial ratios. The Company may also in the future enter into new commutation agreements reassuming portions of its remaining previously ceded business.
Importance of Financial Strength Ratings
Low financial strength ratings or uncertainty over the Company's ability to maintain its financial strength ratings would have a negative impact on issuers' and investors' perceptions of the value of the Company's insurance product. Therefore, the Company manages its business with the goal of achieving high financial strength ratings, preferably the highest that an agency will assign to a financial guarantor. However, the models used by rating agencies differ, presenting conflicting goals that may make it inefficient or impractical to reach the highest rating level. In addition, the models are not fully transparent, contain subjective factors and may change.
Historically, insurance financial strength ratings reflect an insurer's ability to pay under its insurance policies and contracts in accordance with their terms. The rating is not specific to any particular policy or contract. It does not refer to an insurer's ability to meet non-insurance obligations and is not a recommendation to purchase any policy or contract issued by an insurer or to buy, hold, or sell any security insured by an insurer. The insurance financial strength ratings assigned by the rating agencies are based upon factors that the rating agencies believe are relevant to policyholders and are not directed toward the protection of investors in AGL's common shares. Ratings reflect only the views of the respective rating agencies assigning them and are subject to continuous review and revision or withdrawal at any time.
Following the financial crisis, the rating process has been challenging for the Company due to a number of factors, including:
|
•
|
Instability of Rating Criteria and Methodologies.
Rating agencies purport to issue ratings pursuant to published rating criteria and methodologies. In recent years, the rating agencies have made material changes to their rating criteria and methodologies applicable to financial guaranty insurers, sometimes through formal changes and other times through
ad hoc
adjustments to the conclusions reached by existing criteria. Furthermore, these criteria and methodology changes were typically implemented without any transition period, making it difficult for an insurer to comply quickly with new standards.
|
|
•
|
Instability of Severe Stress Case Loss Assumptions.
A major component in arriving at a financial guaranty insurer's rating has been the rating agency’s assessment of the insurer’s capital adequacy, with each rating agency employing its own proprietary model. These capital adequacy approaches include “stress case” loss assumptions for various risks or risk categories. Since the financial crisis, the rating agencies have at various times materially increased stress case loss assumptions for various risks or risk categories, in some cases later reducing such stress case losses. This approach has made predicting the amount of capital required to maintain or attain a certain rating more difficult.
|
|
•
|
More Reliance on Qualitative Rating Criteria.
In prior years, the financial strength ratings of the Company’s insurance company subsidiaries were largely consistent with the rating agency’s assessment of the insurers’ capital adequacy, such that a rating downgrade could generally be avoided by raising additional capital or otherwise
|
15
improving capital adequacy under the rating agency’s model. In recent years, however, both S&P and Moody’s have applied other factors, some of which are subjective, such as the insurer's business strategy and franchise value or the anticipated future demand for its product, to justify ratings for the Company’s insurance company subsidiaries significantly below the ratings implied by their own capital adequacy models. Currently, for example, S&P has concluded that AGM has “AAA” capital adequacy under the S&P model (but subject to a downward adjustment due to a “large obligor test”) and Moody’s has concluded that AGM has “Aa” capital adequacy under the Moody’s model (offset by other factors including the rating agency’s assessment of competitive profile, future profitability and market share).
Despite the difficult rating agency process following the financial crisis, the Company has been able to maintain strong financial strength ratings. However, if a substantial downgrade of the financial strength ratings of the Company's insurance subsidiaries were to occur in the future, such downgrade would adversely affect its business and prospects and, consequently, its results of operations and financial condition. The Company believes that if the financial strength ratings of AGM, AGC and/or MAC were downgraded from their current levels, such downgrade could result in downward pressure on the premium that such insurance subsidiary would be able to charge for its insurance. Currently, AGM, AGC and MAC all have AA (Stable Outlook) financial strength ratings from S&P. Each of AGM and MAC also has a AA+ (Stable Outlook) financial strength rating from Kroll Bond Rating Agency (KBRA), while AGC has a AA (Stable Outlook) financial strength rating from KBRA. AGM and AGC have financial strength ratings in the single-A category from Moody's (A2 (Stable Outlook) and A3 (Stable Outlook), respectively), although AGC announced on January 13, 2017 that it had requested that Moody's withdraw its financial strength rating of AGC. In addition, AGRO has been assigned a rating of A+ (Stable) from A.M. Best Company, Inc. (Best), which is Best's second highest rating. The Company periodically assesses the value of each rating assigned to each of its companies, and may as a result of such assessment request that a rating agency add or drop a rating from certain of its companies. For example, the KBRA ratings were first assigned to MAC in 2013 and to AGM in 2014 and the Best rating was first assigned to AGRO in 2015, while a Moody's rating was never requested for MAC, was dropped from AG Re and AGRO in 2015, and, as noted above, is the subject of a rating withdrawal request in the case of AGC.
The Company believes that so long as AGM, AGC and/or MAC continue to have financial strength ratings in the double-A category from at least one of the legacy rating agencies (S&P or Moody’s), they are likely to be able to continue writing financial guaranty business with a credit quality similar to that historically written. However, if neither legacy rating agency maintained financial strength ratings of AGM, AGC and/or MAC in the double-A category, or if either legacy rating agency were to downgrade AGM, AGC and/or MAC below the single-A level, it could be difficult for the Company to originate the current volume of new business with comparable credit characteristics. See "Item 1A. Risk Factors", Risk Factor captioned "Risks Related to the Company's Financial Strength and Financial Enhancement Ratings" and Part II, Item 7, Management's Discussion and Analysis of Financial Condition, Results of Operations, for more information about the Company's ratings.
Investments
Investment income from the Company's investment portfolio is one of the primary sources of cash flow supporting its operations and claim payments. The Company's total investment portfolio was
$11.0 billion
and
$11.2 billion
as of
December 31, 2016
and
2015
, respectively, and generated net investment income of
$408 million
,
$423 million
and
$403 million
in
2016
,
2015
and
2014
, respectively.
The Company's principal objectives in managing its investment portfolio are to support the highest possible ratings for each operating company; maintain sufficient liquidity to cover unexpected stress in the insurance portfolio; and maximize total after-tax net investment income. If the Company's calculations with respect to its policy liabilities are incorrect or other unanticipated payment obligations arise, or if the Company improperly structures its investments to meet these liabilities, it could have unexpected losses, including losses resulting from forced liquidation of investments before their maturity. The investment policies of the Company's insurance subsidiaries are subject to insurance law requirements, and may change depending upon regulatory, economic and market conditions and the existing or anticipated financial condition and operating requirements, including the tax position, of the businesses.
Approximately 83% of the Company's investment portfolio is externally managed by its investment managers: BlackRock Financial Management, Inc., Goldman Sachs Asset Management, L.P., General Re-New England Asset Management, Inc. and Wellington Management Company, LLP. The performance of the Company's invested assets is subject to the ability of the investment managers to select and manage appropriate investments. The Company's investment managers have discretionary authority over the Company's investment portfolio within the limits of the Company's investment guidelines approved by the Company's Board. The Company's portfolio is allocated approximately equally among the four investment managers and each manager is compensated based upon a fixed percentage of the market value of the portion of the portfolio
16
being managed by such manager. During the years ended
December 31, 2016
,
2015
and
2014
, the Company recorded investment management fee expenses of
$9 million
,
$10 million
, and
$9 million
, respectively.
As of December 31, 2016, the Company internally managed 17% of the investment portfolio, either in connection with its loss mitigation or risk management strategy, or because the Company believes a particular security or asset presents an attractive investment opportunity. During 2016, the Company established an alternative investments group to focus on deploying a portion of the Company's excess capital to pursue acquisitions and develop new business opportunities that complement the Company's financial guaranty business, are in line with its risk profile and benefit from its core competencies. The alternative investments group has been investigating a number of such opportunities, including both controlling and non-controlling investments in investment managers.
The largest component of the Company’s internally managed portfolio consists of obligations that the Company purchases in connection with its loss mitigation or risk management strategy for its insured exposure. Purchasing such obligations enables the Company to exercise rights available to holders of the obligations. The Company also holds other invested assets that were obtained or purchased as part of negotiated settlements with insured counterparties or under the terms of its financial guaranties. The Company held approximately $1,600 million and $1,440 million of securities based on their fair value, after elimination of the benefit of any insurance provided by the Company, that were obtained for loss mitigation or risk management purposes in its internally managed investment accounts as of
December 31, 2016
and
December 31, 2015
, respectively.
Competition
Assured Guaranty is the market leader in the financial guaranty industry. Assured Guaranty believes its financial strength, protection against defaults, credit selection policies, underwriting standards, history of making claim payments and surveillance procedures make it an attractive provider of financial guaranties.
Assured Guaranty's principal competition is in the form of obligations that issuers decide to issue on an uninsured basis. In the U.S. public finance market, when interest rates are low, investors may prefer greater yield over insurance protection, and issuers may find the cost savings from insurance less compelling. Over the last several years, interest rates generally have been lower than historical norms. Average municipal interest rates were extremely low during 2016, with the benchmark AAA 30-year Municipal Market Data index published by Thomson Reuters (MMD Index), at times below 2%, a threshold not previously crossed in the modern era. As a result, the difference in yield (or the credit spread) between a bond insured by Assured Guaranty and an uninsured bond has provided comparatively little room for issuer savings and insurance premium. In the U.S. public finance market in
2016
, market penetration of municipal bond insurance decreased to approximately 6.0% of the par amount of new issues sold, compared with approximately 6.7% in
2015
. The Company believes this decrease was due in large part to the extremely low interest rates prevailing during most of 2016.
In the international infrastructure finance market, the uninsured execution serving as the Company’s principal competition occurs primarily in privately funded transactions where no bonds are sold in the public markets. In the structured finance market, the uninsured execution occurs in both public and primary transactions primarily where bonds are sold with sufficient credit or structural enhancement embedded in transactions, such as through overcollateralization, first loss insurance, excess spread or other terms, to make the bonds attractive to investors without bond insurance.
Assured Guaranty is the only financial guaranty company active before the global financial crisis of 2008 that has maintained sufficient financial strength to write new business continuously since the crisis began. As a result of rating agency downgrades of the financial strength ratings of financial guaranty competitors active before the crisis, Assured Guaranty has only two direct competitors for financial guaranty, the most significant of which was BAM, a mutual insurance company that commenced business in 2012.
Based on industry statistics, the Company estimates that, of the new U.S. public finance bonds sold with insurance in
2016
, the Company insured approximately
56%
of the par, while BAM insured approximately
40%
. BAM is effective in competing with the Company for small to medium sized U.S. public finance transactions in certain sectors. BAM sometimes prices its guarantees for such transactions at levels the Company does not believe produces an adequate rate of return and so does not match, but BAM's pricing and underwriting strategies may have a negative impact on the amount of premium the Company is able to charge for its insurance for such transactions. However, the Company believes it has competitive advantages over BAM due to: AGM's and MAC's larger capital base; AGM's ability to insure larger transactions and issuances in more diverse U.S. bond sectors; BAM's inability to date to generate profits and to increase its statutory capital meaningfully, its higher leverage ratios than those of AGM and MAC, and its increasing unpaid debt obligations; and AGM's and MAC's strong financial strength ratings from multiple rating agencies (in the case of AGM, AA+ from KBRA, AA from S&P and A2
17
from Moody's, and in the case of MAC, AA+ from KBRA and AA from S&P, compared with BAM's AA solely from S&P). Additionally, as a public company with access to both the equity and debt capital markets, Assured Guaranty may have greater flexibility to raise capital, if needed.
Another competitor to the Company on U.S. public finance transactions is National, which the Company estimates insured approximately
4%
of the par of public finance bonds sold with insurance in
2016
. In 2009, MBIA, one of the legacy insurers that is not writing new business, transferred its U.S. public finance exposures to its affiliate National. The transfer was challenged in litigation that was not settled until May 2013. Subsequently, S&P has raised National’s financial strength rating from BBB to AA-, noting that S&P no longer viewed MBIA’s rating as a limitation on National’s rating, and Moody’s has upgraded National's financial strength rating from Baa2 to A3.
In the global structured finance and infrastructure markets, Assured Guaranty is the only financial guaranty insurance company currently writing new guarantees. Management considers the Company’s greater diversification to be a competitive advantage in the long run because it means the Company is not wholly dependent on conditions in any one market.
In the future, additional new entrants into the financial guaranty industry could reduce the Company's new business prospects, including by furthering price competition or offering financial guaranty insurance on transactions with structural and security features that are more favorable to the issuers than those required by Assured Guaranty. However, the Company believes that the presence of multiple guarantors might also increase the overall visibility and acceptance of the product by a broadening group of investors, and the fact that investors are willing to commit fresh capital to the industry may promote market confidence in the product.
In addition to monoline insurance companies, Assured Guaranty competes with other forms of credit enhancement, such as letters of credit or credit derivatives provided by banks and other financial institutions, some of which are governmental enterprises, or direct guaranties of municipal, structured finance or other debt by federal or state governments or government sponsored or affiliated agencies. Alternative credit enhancement structures, and in particular federal government credit enhancement or other programs, can interfere with the Company's new business prospects, particularly if they provide direct governmental-level guaranties, restrict the use of third-party financial guaranties or reduce the amount of transactions that might qualify for financial guaranties.
Regulation
General
The business of insurance and reinsurance is regulated in most countries, although the degree and type of regulation varies significantly from one jurisdiction to another. Reinsurers are generally subject to less direct regulation than primary insurers. The Company is subject to regulation under applicable statutes in the U.S., the U.K. and Bermuda, as well as applicable statutes in Australia.
United States
AGL has three operating insurance subsidiaries domiciled in the U.S., which the Company refers to collectively as the Assured Guaranty U.S. Subsidiaries.
|
•
|
AGM is a New York domiciled insurance company licensed to write financial guaranty insurance and reinsurance in 50 U.S. states, the District of Columbia, Guam, Puerto Rico and the U.S. Virgin Islands.
|
|
•
|
MAC is a New York domiciled insurance company licensed to write financial guaranty insurance and reinsurance in 50 U.S. states and the District of Columbia. MAC will only insure U.S. public finance debt obligations, focusing on investment grade bonds in select sectors of that market.
|
|
•
|
AGC is a Maryland domiciled insurance company licensed to write financial guaranty insurance and reinsurance in 50 U.S. states, the District of Columbia and Puerto Rico.
|
Insurance Holding Company Regulation
AGL and the Assured Guaranty U.S. Subsidiaries are subject to the insurance holding company laws of their jurisdiction of domicile, as well as other jurisdictions where these insurers are licensed to do insurance business. These laws
18
generally require each of the Assured Guaranty U.S. Subsidiaries to register with its respective domestic state insurance department and annually to furnish financial and other information about the operations of companies within their holding company system. Generally, all transactions among companies in the holding company system to which any of the Assured Guaranty U.S. Subsidiaries is a party (including sales, loans, reinsurance agreements and service agreements) must be fair and, if material or of a specified category, such as reinsurance or service agreements, require prior notice and approval or non-disapproval by the insurance department where the applicable subsidiary is domiciled.
Change of Control
Before a person can acquire control of a U.S. domestic insurance company, prior written approval must be obtained from the insurance commissioner of the state where the domestic insurer is domiciled. Generally, state statutes provide that control over a domestic insurer is presumed to exist if any person, directly or indirectly, owns, controls, holds with the power to vote, or holds proxies representing, 10% or more of the voting securities of the domestic insurer. Prior to granting approval of an application to acquire control of a domestic insurer, the state insurance commissioner will consider such factors as the financial strength of the applicant, the integrity and management of the applicant's board of directors and executive officers, the acquirer's plans for the management of the applicant's board of directors and executive officers, the acquirer's plans for the future operations of the domestic insurer and any anti-competitive results that may arise from the consummation of the acquisition of control. These laws may discourage potential acquisition proposals and may delay, deter or prevent a change of control involving AGL that some or all of AGL's stockholders might consider to be desirable, including in particular unsolicited transactions.
State Insurance Regulation
State insurance authorities have broad regulatory powers with respect to various aspects of the business of U.S. insurance companies, including licensing these companies to transact business, accreditation of reinsurers, admittance of assets to statutory surplus, regulating unfair trade and claims practices, establishing reserve requirements and solvency standards, regulating investments and dividends and, in certain instances, approving policy forms and related materials and approving premium rates. State insurance laws and regulations require the Assured Guaranty U.S. Subsidiaries to file financial statements with insurance departments everywhere they are licensed, authorized or accredited to conduct insurance business, and their operations are subject to examination by those departments at any time. The Assured Guaranty U.S. Subsidiaries prepare statutory financial statements in accordance with Statutory Accounting Practices, or SAP, and procedures prescribed or permitted by these departments. State insurance departments also conduct periodic examinations of the books and records, financial reporting, policy filings and market conduct of insurance companies domiciled in their states, generally once every three to five years. Market conduct examinations by regulators other than the domestic regulator are generally carried out in cooperation with the insurance departments of other states under guidelines promulgated by the National Association of Insurance Commissioners.
The New York State Department of Financial Services (the NYDFS), the regulatory authority of the domiciliary jurisdiction of AGM and MAC, conducts a periodic examination of insurance companies domiciled in New York, usually at five-year intervals. In 2012, the NYDFS commenced examinations of AGM and MAC in order for its examinations of these companies to coincide with the Maryland Insurance Administration (the MIA's) examination of AGC. In 2013, the NYDFS completed its examinations and issued Reports on Examination of AGM for the four-year period ending December 31, 2011 and MAC for the period September 26, 2008 through June 30, 2012. The reports did not note any significant regulatory issues concerning those companies.
The MIA, the regulatory authority of the domiciliary jurisdiction of AGC, conducts a periodic examination of insurance companies domiciled in Maryland every five years. In 2013, the MIA issued an Examination Report with respect to AGC for the five year period ending December 31, 2011; no significant regulatory issues were noted in such report.
Assured Guaranty has been notified that the NYDFS and MIA will formally commence an examination, respectively, of AGM and MAC, and AGC, in 2017 for the period covering the end of the last applicable examination period for each company through December 31, 2016.
State Dividend Limitations
New York.
One of the primary sources of cash for repurchases of shares and the payment of debt service and dividends by the Company is the receipt of dividends from AGM. Under the New York Insurance Law, AGM and MAC may only pay dividends out of "earned surplus," which is the portion of the company's surplus that represents the net earnings, gains or profits (after deduction of all losses) that have not been distributed to shareholders as dividends, transferred to stated capital
19
or capital surplus, or applied to other purposes permitted by law, but does not include unrealized appreciation of assets. AGM and MAC may each pay dividends without the prior approval of the New York Superintendent of Financial Services (New York Superintendent) that, together with all dividends declared or distributed by it during the preceding 12 months, do not exceed the lesser of
10%
of its policyholders' surplus (as of its last annual or quarterly statement filed with the New York Superintendent) or
100%
of its adjusted net investment income during that period. The maximum amount available during 2017 for AGM to pay dividends to its parent AGMH without regulatory approval is estimated to be approximately
$232 million
, of which approximately
$81 million
is available for distribution in the first quarter of 2017. AGM paid dividends of
$247 million
,
$215 million
and
$160 million
during 2016, 2015 and 2014, respectively, to AGMH. The maximum amount available during 2017 for MAC to distribute as dividends to its shareholders (AGM and AGC) without regulatory approval is estimated to be approximately
$49 million
; MAC currently intends to allocate the distribution of such amount quarterly in 2017.
Maryland.
Another primary source of cash for the repurchases of shares and payment of debt service and dividends by the Company is the receipt of dividends from AGC. Under Maryland's insurance law, AGC may, with prior notice to the MIA, pay an ordinary dividend that, together with all dividends paid in the prior 12 months, does not exceed the lesser of
10%
of its policyholders' surplus (as of the prior December 31) or
100%
of its adjusted net investment income during that period. The maximum amount available during 2017 for AGC to pay ordinary dividends to its parent Assured Guaranty U.S. Holdings Inc. (AGUS) will be approximately
$107 million
, of which approximately
$29 million
is available for distribution in the first quarter of 2017. A dividend or distribution to a stockholder in excess of this limitation would constitute an "extraordinary dividend," which must be paid out of "earned surplus" and reported to, and approved by, the MIA prior to payment. "Earned surplus" is that portion of the company's surplus that represents the net earnings, gains or profits (after deduction of all losses) that have not been distributed to shareholders as dividends or transferred to stated capital or capital surplus, or applied to other purposes permitted by law, but does not include unrealized capital gains and appreciation of assets. AGC may not pay any dividend or make any distribution, including ordinary dividends, unless it notifies the MIA of the proposed payment within five business days following declaration and at least ten days before payment. The MIA may declare that such dividend not be paid if it finds that AGC's policyholders' surplus would be inadequate after payment of the dividend or the dividend could lead AGC to a hazardous financial condition. AGC paid dividends of
$79 million
,
$90 million
and
$69 million
during 2016, 2015 and 2014, respectively, to AGUS.
Contingency Reserves
Under the New York Insurance Law, each of AGM and MAC must establish a contingency reserve to protect policyholders. New York Insurance Law determines the calculation of the contingency reserve and the period of time over which it must be established and, subsequently, can be taken down.
Likewise, in accordance with Maryland insurance law and regulations, AGC also maintains a statutory contingency reserve for the protection of policyholders. Maryland insurance law determines the calculation of the contingency reserve and the period of time over which it must be established, and subsequently, can be taken down.
In both New York and Maryland, when considering the principal amount guaranteed, the insurer is permitted to take into account amounts that it has ceded to reinsurers. In addition, releases from the insurer's contingency reserve may be permitted under specified circumstances in the event that actual loss experience exceeds certain thresholds or if the reserve accumulated is deemed excessive in relation to the insurer's outstanding insured obligations.
From time to time, AGM and AGC have obtained the approval of their regulators to release contingency reserves based on losses or because the accumulated reserve is deemed excessive in relation to the insurer's outstanding insured obligations. In 2016, on the latter basis, AGM obtained the NYDFS's approval for a contingency reserve release of approximately
$175 million
and AGC obtained the MIA's approval for a contingency reserve release of approximately
$152 million
. In addition, MAC also released approximately
$53 million
of contingency reserves, which consisted of the assumed contingency reserves maintained by MAC, as reinsurer of AGM, in respect of the same obligations that were the subject of AGM's
$175 million
release.
Applicable Maryland and New York laws and regulations require regular, quarterly contributions to contingency reserves while they are being established, but such laws and regulations permit the discontinuation of such quarterly contributions to an insurer's contingency reserves when such insurer's aggregate contingency reserves for a particular line of business (i.e., municipal or non-municipal) exceed the sum of the insurer's outstanding principal for each specified category of obligations within the particular line of business multiplied by the specified contingency reserve factor for each such category. In accordance with such laws and regulations, and with the approval of the MIA and the NYDFS, respectively, AGC ceased making quarterly contributions to its contingency reserves for both municipal and non-municipal business and AGM ceased making quarterly contributions to its contingency reserves for non-municipal business, in each case beginning in the fourth
20
quarter of 2014. Such cessations are expected to continue for as long as AGC and AGM satisfy the foregoing condition for their applicable line(s) of business.
In July 2013, AGM and AGC were notified that the NYDFS and MIA did not object to AGM, AGE and AGC reassuming all of the outstanding contingency reserves that they had ceded to AG Re and electing to cease ceding future contingency reserves to AG Re. The insurance regulators permitted AGM, AGE and AGC to reassume the contingency reserves in increments over
three years
. As of December 31, 2015, AGM, AGE and AGC had collectively reassumed an aggregate of approximately
$522 million
.
Financial guaranty insurers are also required to maintain a loss and loss adjustment expense (LAE) reserve (on a case-by-case basis) and unearned premium reserve.
Single and Aggregate Risk Limits
The New York Insurance Law and the Code of Maryland Regulations establish single risk limits for financial guaranty insurers applicable to all obligations issued by a single entity and backed by a single revenue source. For example, under the limit applicable to qualifying asset-backed securities, the lesser of:
|
•
|
the insured average annual debt service for a single risk, net of qualifying reinsurance and collateral, or
|
|
•
|
the insured unpaid principal (reduced by the extent to which the unpaid principal of the supporting assets exceeds the insured unpaid principal) divided by nine, net of qualifying reinsurance and collateral,
|
may not exceed 10% of the sum of the insurer's policyholders' surplus and contingency reserves, subject to certain conditions.
Under the limit applicable to municipal obligations, the insured average annual debt service for a single risk, net of qualifying reinsurance and collateral, may not exceed 10% of the sum of the insurer's policyholders' surplus and contingency reserves. In addition, insured principal of municipal obligations attributable to any single risk, net of qualifying reinsurance and collateral, is limited to 75% of the insurer's policyholders' surplus and contingency reserves. Single-risk limits are also specified for other categories of insured obligations, and generally are more restrictive than those listed for asset-backed or municipal obligations. Obligations not qualifying for an enhanced single-risk limit are generally subject to the "corporate" limit (applicable to insurance of unsecured corporate obligations) equal to 10% of the sum of the insurer's policyholders' surplus and contingency reserves. For example, "triple-X" and "future flow" securitizations, as well as unsecured investor-owned utility obligations, are generally subject to these "corporate" single-risk limits.
The New York Insurance Law and the Code of Maryland Regulations also establish aggregate risk limits on the basis of aggregate net liability insured as compared with statutory capital. "Aggregate net liability" is defined as outstanding principal and interest of guaranteed obligations insured, net of qualifying reinsurance and collateral. Under these limits, policyholders' surplus and contingency reserves must not be less than the sum of various percentages of aggregate net liability for various categories of specified obligations. The percentage varies from 0.33% for certain municipal obligations to 4% for certain non-investment-grade obligations. As of
December 31, 2016
, the aggregate net liability of each of AGM, MAC and AGC utilized approximately 23.7%, 27.6% and 10.7% of their respective policyholders' surplus and contingency reserves.
The New York Superintendent has broad discretion to order a financial guaranty insurer to cease new business originations if the insurer fails to comply with single or aggregate risk limits. In practice, the New York Superintendent has shown a willingness to work with insurers to address these concerns.
Group Regulation
In connection with AGL’s establishment of tax residence in the U.K., as discussed in greater detail under "Tax Matters" below, the NYDFS has assumed responsibility for regulation of the Assured Guaranty group. Group supervision by the NYDFS results in additional regulatory oversight over Assured Guaranty, and may subject Assured Guaranty to new regulatory requirements and constraints.
21
Investments
The Assured Guaranty U.S. Subsidiaries are subject to laws and regulations that require diversification of their investment portfolio and limit the amount of investments in certain asset categories, such as BIG fixed-maturity securities, equity real estate, other equity investments, and derivatives. Failure to comply with these laws and regulations would cause investments exceeding regulatory limitations to be treated as non-admitted assets for purposes of measuring surplus, and, in some instances, would require divestiture of such non-qualifying investments. The Company believes that the investments made by the Assured Guaranty U.S. Subsidiaries complied with such regulations as of
December 31, 2016
. In addition, any investment must be approved by the insurance company's board of directors or a committee thereof that is responsible for supervising or making such investment.
Operations of the Company's Non-U.S. Insurance Subsidiaries
In addition to the regulatory requirements imposed by the jurisdictions in which they are licensed, the business operations of the Company's reinsurance subsidiaries are affected by regulatory requirements in various states of the United States governing "credit for reinsurance", which are imposed on the ceding companies of the reinsurers. The Nonadmitted and Reinsurance Reform Act (NRRA) of the Dodd-Frank Wall Street Reform and Consumer Protection Act (the Dodd-Frank Act) streamlined the regulation of reinsurance by applying single state regulation for credit for reinsurance. Under the NRRA, credit for reinsurance determinations are controlled by the ceding company’s state of domicile and non-domiciliary states are prohibited from applying their reinsurance laws extraterritorially. In general, a ceding company which obtains reinsurance from a reinsurer that is licensed, accredited or approved by the ceding company's state of domicile is permitted to reflect in its statutory financial statements a credit in an aggregate amount equal to the ceding company's liability for unearned premiums (which are that portion of premiums written which applies to the unexpired portion of the policy period), loss and loss expense reserves ceded to the reinsurer. The great majority of states, however, permit a credit on the statutory financial statements of a ceding insurer for reinsurance obtained from a non-licensed or non-accredited reinsurer to the extent that the reinsurer secures its reinsurance obligations to the ceding insurer by providing a letter of credit, trust fund or other acceptable security arrangement. A few states do not allow credit for reinsurance ceded to non-licensed reinsurers except in certain limited circumstances and others impose additional requirements that make it difficult to become accredited. The Company's reinsurance subsidiaries AG Re and AGRO are not licensed, accredited or approved in any state and have established trusts to secure their reinsurance obligations.
U.S. Federal Regulation
The Company’s businesses are subject to direct and indirect regulation under U.S. federal law. In particular, the Company’s derivatives activities are directly and indirectly subject to a variety of regulatory requirements under the Dodd-Frank Act. Based on the size of its subsidiaries' remaining legacy derivatives portfolios, AGL does not believe any of its subsidiaries is required to register with the Commodity Futures Trading Commission (CFTC) as a “major swap participant” or with the SEC as a "major securities-based swap participant". Certain of the Company's subsidiaries may be subject to Dodd-Frank Act requirements to post margin or to clear on a regulated execution facility future swap transactions or with respect to certain amendments to legacy swap transactions, if they enter into such transactions.
Bermuda
AG Re and AGRO are each an insurance company currently registered and licensed under the Insurance Act 1978 of Bermuda, amendments thereto and related regulations (collectively, the Insurance Act). AG Re is registered and licensed as a Class 3B insurer and AGRO is registered and licensed as a Class 3A insurer and a Class C long-term insurer.
Bermuda Insurance Regulation
The Insurance Act imposes on insurance companies solvency and liquidity standards; restrictions on the declaration and payment of dividends and distributions; restrictions on the reduction of statutory capital; restrictions on the winding up of long-term insurers; and auditing and reporting requirements; and the need to have a principal representative and a principal office (as understood under the Insurance Act) in Bermuda. The Insurance Act grants to the Bermuda Monetary Authority (the Authority) the power to cancel insurance licenses, supervise, investigate and intervene in the affairs of insurance companies and in certain circumstances share information with foreign regulators. Class 3A and Class 3B insurers are authorized to carry on general insurance business (as understood under the Insurance Act), subject to conditions attached to the license and to compliance with minimum capital and surplus requirements, solvency margin, liquidity ratio and other requirements imposed by the Insurance Act. Class C long-term insurers are permitted to carry on long-term business (as understood under the
22
Insurance Act) subject to conditions attached to the license and to similar compliance requirements and the requirement to maintain its long-term business fund (a segregated fund).
Each of AG Re and AGRO is required annually to file statutorily mandated financial statements and returns, audited by an auditor approved by the Authority (no approved auditor of an insurer may have an interest in that insurer, other than as an insured, and no officer, servant or agent of an insurer shall be eligible for appointment as an insurer's approved auditor), together with an annual loss reserve opinion of the loss reserve specialist, who is approved by the Authority, and in respect of AGRO, the required actuary's certificate with respect to the long-term business. When each of AG Re and AGRO files its statutory financial statements, it is also required to deliver to the Authority a declaration of compliance, declaring whether or not the insurer has, with respect to the preceding financial year complied with all requirements of the minimum criteria applicable to it; complied with the minimum margin of solvency as at its financial year end; complied with the applicable enhanced capital requirements as at its financial year end; complied with the minimum liquidity ratio for general business as at its financial year end; and complied with applicable conditions, directions and restrictions imposed on, or approvals granted to the insurer. AG Re and AGRO are also required to file annual financial statements prepared in conformity with accounting principles generally accepted in the United States of America (GAAP), which must be available to the public.
In addition, AG Re and AGRO are required to file a capital and solvency return that includes its Bermuda Solvency Capital Requirement (BSCR) model (or an approved internal capital model in lieu thereof), a schedule of fixed income investments by BSCR rating, a schedule of funds held by ceding reinsurers in segregated accounts/trusts by BSCR rating, a schedule of net reserves for losses and loss expense provisions by line of business, a schedule of premiums written by line of business, a schedule of geographic diversification of net premiums written by line of business, a schedule of risk management, a schedule of fixed income securities, a schedule of commercial insurer's solvency self-assessment (CISSA), a schedule of catastrophe risk return, a schedule of loss triangles or reconciliation of net loss reserves, a schedule of eligible capital, a statutory economic balance sheet, the loss reserve specialist's opinion, a schedule of regulated non-insurance financial operating entities and a schedule of solvency. AGRO’s capital and solvency return must also include, among other details, a schedule of long-term premiums written by line of business, a schedule of long-term business data, a schedule of long-term variable annuity guarantees data and reconciliation, a schedule of long-term variable annuity guarantees - internal capital model and the approved actuary’s opinion.
Each of AG Re and AGRO are also required to prepare and file with the Authority, and publish on its website, a financial condition report. The Authority has discretion to approve modifications and exemptions to the public disclosure rules, on application by the insurer if, among other things, the Authority is satisfied that the disclosure of certain information will result in a competitive disadvantage or compromise confidentiality obligations of the insurer.
Finally, AG Re is required to file with the Authority, on a quarterly basis, financial returns consisting of (i) quarterly unaudited financial statements for each financial quarter (which must minimally include a balance sheet and income statement and must also be recent and not reflect a financial position that exceeds two months), and (ii) a list and details of material intra‑group transactions and risk concentrations that have materialized since the most recent quarterly or annual financial returns, which would also include, among other things, details surrounding all intra group reinsurance and retrocession arrangements and other intra group risk transfer insurance business arrangements that have materialized since the most recent quarterly or annual financial returns and (iii) details of the ten largest exposures to unaffiliated counterparties and any other counterparty exposures exceeding 10% of the insurer’s statutory capital and surplus.
Shareholder Controllers
Pursuant to provisions in the Insurance Act, any person who becomes a holder of 10% or more, 20% or more, 33% or more or 50% or more of the Company's common shares must notify the Authority in writing within 45 days of becoming such a holder. The Authority has the power to object to such a person if it appears to the Authority that the person is not fit and proper to be such a holder. In such a case, the Authority may require the holder to reduce their shareholding in the Company and may direct, among other things, that the voting rights attached to their common shares are not exercisable. A person that does not comply with such a notice or direction from the Authority will be guilty of an offense.
Notification of Material Changes
All registered insurers are required to give notice to the Authority of their intention to effect a material change within the meaning of the Insurance Act. For the purposes of the Insurance Act, the following changes are material: (i) the transfer or acquisition of insurance business being part of a scheme falling within, or any transaction relating to a scheme of arrangement under section 25 of the Insurance Act or section 99 of the Companies Act 1981 of Bermuda (the Companies Act), (ii) the
23
amalgamation or merger with or acquisition of another firm, (iii) engaging in unrelated business that is retail business, (iv) the acquisition of a controlling interest in an undertaking that is engaged in non-insurance business which offers services or products to non-affiliated persons, (v) outsourcing all or substantially all of the functions of actuarial, risk management, compliance and internal audit functions, (vi) outsourcing all or a material part of an insurer's underwriting activity, (vii) transferring other than by way of reinsurance all or substantially all of a line of business (viii) expanding into a material new line of business, (ix) the sale of an insurer, and (x) outsourcing an officer role (in this context meaning a chief executive or senior executive performing the roles of underwriting, actuarial, risk management, compliance, internal audit, finance or investment matters).
Registered insurers are not permitted to take any steps to give effect to a material change listed above unless it has first served notice on the Authority that it intends to effect such material change and, before the end of 30 days, either the Authority has notified such company in writing that it has no objection to such change or that period has lapsed without the Authority having issued a notice of objection. A person who fails to give the required notice or who effects a material change, or allows such material change to be effected, before the prescribed period has elapsed or after having received a notice of objection is guilty of an offence.
Minimum Solvency Margin and Enhanced Capital Requirements
Under the Insurance Act, AG Re and AGRO must each ensure that the value of its general business statutory assets exceeds the amount of its general business statutory liabilities by an amount greater than the prescribed minimum solvency margin and each company's applicable enhanced capital requirement.
The minimum solvency margin for Class 3A and Class 3B insurers is the greater of (i) $1 million, or (ii) 20% of the first $6 million of net premiums written; if in excess of $6 million, the figure is $1.2 million plus 15% of net premiums written in excess of $6 million, or (iii) 15% of net discounted aggregate loss and loss expense provisions and other insurance reserves, or (iv) 25% of that insurer's applicable enhanced capital requirement reported at the end of its relevant year.
In addition, as a Class C long-term insurer, AGRO is required, with respect to its long-term business, to maintain a minimum solvency margin equal to the greater of (i) $500,000, (ii) 1.5% of its assets or (iii) 25% its enhanced captial requirement reported at the end of the relevant year. For the purpose of this calculation, assets are defined as the total assets pertaining to its long-term business reported on the balance sheet in the relevant year less the amounts held in a segregated account. AGRO is also required to keep its accounts in respect of its long-term business separate from any accounts kept in respect of any other business and all receipts of its long-term business form part of its long-term business fund.
Each of AG Re and AGRO is required to maintain available statutory capital and surplus at a level equal to or in excess of its applicable enhanced capital requirement, which is established by reference to either its BSCR model or an approved internal capital model. The BSCR model is a risk-based capital model which provides a method for determining an insurer's capital requirements (statutory economic capital and surplus) by taking into account the risk characteristics of different aspects of the insurer's business. The BSCR formula establishes capital requirements for ten categories of risk: fixed income investment risk, equity investment risk, interest rate/liquidity risk, currency risk, concentration risk, premium risk, reserve risk, credit risk, catastrophe risk and operational risk. For each category, the capital requirement is determined by applying factors to asset, premium, reserve, creditor, probable maximum loss and operation items, with higher factors applied to items with greater underlying risk and lower factors for less risky items.
While not specifically referred to in the Insurance Act, the Authority has also established a target capital level (TCL) for each insurer subject to an enhanced capital requirement equal to 120% of its enhanced capital requirement. While such an insurer is not currently required to maintain its statutory capital and surplus at this level, the TCL serves as an early warning tool for the Authority and failure to maintain statutory capital at least equal to the TCL will likely result in increased regulatory oversight.
For each insurer subject to an enhanced capital requirement, there is a three-tiered capital system designed to assess the quality of capital resources that a company has available to meet its capital requirements. Under this system, all of an insurer's capital instruments will be classified as either basic or ancillary capital which in turn will be classified into one of three tiers based on their “loss absorbency” characteristics. Highest quality capital is classified as Tier 1 Capital; lesser quality capital is classified as either Tier 2 Capital or Tier 3 Capital. Under this regime, up to certain specified percentages of Tier 1, Tier 2 and Tier 3 Capital (determined by registration classification) may be used to support the company's minimum solvency margin, enhanced capital requirement and TCL.
24
Restrictions on Dividends and Distributions
The Insurance Act limits the declaration and payment of dividends and other distributions by AG Re and AGRO.
Under the Insurance Act:
|
•
|
The minimum share capital must be always issued and outstanding and cannot be reduced. For AG Re, which is registered as a Class 3B insurer, the minimum share capital is $120,000. For AGRO, which is registered both as a Class 3A and a Class C long-term insurer, the minimum share capital is $370,000.
|
|
•
|
With respect to the distribution (including repurchase of shares) of any share capital, contributed surplus or other statutory capital:
|
|
(a)
|
any such distribution that would reduce AG Re's or AGRO's total statutory capital by 15% or more of their respective total statutory capital as set out in their previous year's financial statements requires the prior approval of the Authority. Any application for such approval must include an affidavit stating that the company will continue to meet the required margins and such other information as the Authority may require; and
|
|
(b)
|
as a Class C long-term insurer, AGRO may not use the funds allocated to its long-term business fund, directly or indirectly, for any purpose other than a purpose of its long-term business except in so far as such payment can be made out of any surplus certified by AGRO's approved actuary to be available for distribution otherwise than to policyholders;
|
|
•
|
With respect to the declaration and payment of dividends:
|
|
(a)
|
each of AG Re and AGRO is prohibited from declaring or paying any dividends during any financial year if it is in breach of its solvency margin, minimum liquidity ratio or enhanced capital requirement, or if the declaration or payment of such dividends would cause such a breach (if it has failed to meet its minimum solvency margin or minimum liquidity ratio on the last day of any financial year, the insurer will be prohibited, without the approval of the Authority, from declaring or paying any dividends during the next financial year). Dividends, are paid out of each insurer's statutory surplus and, therefore, dividends cannot exceed such surplus. See "—Minimum Solvency Margin and Enhanced Capital Requirements" above and "—Minimum Liquidity Ratio" below;
|
|
(b)
|
an insurer which at any time fails to meet its minimum solvency margin or comply with the enhanced capital requirement may not declare or pay any dividend until the failure is rectified, and also in such circumstances the insurer must report, within 14 days after becoming aware of its failure or having reason to believe that such failure has occurred, to the Authority in writing giving particulars of the circumstances leading to the failure and giving a plan detailing the manner, specific actions to be taken and time frame in which the insurer intends to rectify the failure. A failure to comply with the enhanced capital requirement will also result in the insurer furnishing certain other information to the Authority within 45 days after becoming aware of its failure or having reason to believe that such failure has occurred;
|
|
(c)
|
each of AG Re and AGRO is prohibited from declaring or paying in any financial year dividends of more than 25% of its total statutory capital and surplus (as shown on its previous financial year's statutory balance sheet) unless it files (at least seven days before payments of such dividends) with the Authority an affidavit signed by at least two directors (one of whom must be a Bermuda resident director if any of the insurer's directors are resident in Bermuda) and the principal representative stating that it will continue to meet its solvency margin and minimum liquidity ratio. Where such an affidavit is filed, it shall be available for public inspection at the offices of the Authority; and
|
|
(d)
|
as a Class C long-term insurer, AGRO may not declare or pay a dividend to any person other than a policyholder unless the value of the assets of its long-term business fund, as certified by AGRO's approved actuary, exceeds the extent (as so certified) of the liabilities of AGRO's long-term business, and the amount of any such dividend shall not exceed the aggregate of (1) that excess; and (2) any other funds properly available for the payment of dividends being funds arising out of AGRO's business other than its long-term business.
|
25
The Companies Act also limits the declaration and payment of dividends and other distributions by Bermuda companies such as AGL and its Bermuda subsidiaries (including AG Re and AGRO). Such companies may only declare and pay a dividend or make a distribution out of contributed surplus (as understood under the Companies Act) if there are reasonable grounds for believing that the company is and after the payment will be able to meet and pay its liabilities as they become due and the realizable value of the company's assets will not be less than its liabilities. The Companies Act also regulates and restricts the reduction and return of capital and paid in share premium, including the repurchase of shares.
Based on the limitations above, in 2017 AG Re has the capacity to (i) make capital distributions in an aggregate amount up to
$128 million
without the prior approval of the Authority and (ii) declare and pay dividends in an aggregate amount up to the limit of its outstanding statutory surplus, which is
$314 million
. Such dividend capacity may be further limited by the actual amount of AG Re’s unencumbered assets, which amount changes from time to time due in part to collateral posting requirements. As of
December 31, 2016
, AG Re had unencumbered assets of approximately
$596 million
. AG Re declared and paid dividends of $
100 million
, $
150 million
and $
82 million
during 2016, 2015 and 2014, respectively, to AGL. The Company does not expect AGRO to declare or pay any dividends or other distributions at this time.
Minimum Liquidity Ratio
The Insurance Act provides a minimum liquidity ratio for general business. An insurer engaged in general business is required to maintain the value of its relevant assets at not less than 75% of the amount of its relevant liabilities. Relevant assets include cash and time deposits, quoted investments, unquoted bonds and debentures, first liens on real estate, investment income due and accrued, accounts and premiums receivable, reinsurance balances receivable, funds held by ceding reinsurers and any other assets which the Authority on application in any particular case made to it with reasons, accepts in that case. There are certain categories of assets which, unless specifically permitted by the Authority, do not automatically qualify as relevant assets, such as unquoted equity securities, investments in and advances to affiliates and real estate and collateral loans.
The relevant liabilities are total general business insurance reserves and total other liabilities less deferred income tax and sundry liabilities (by interpretation, those not specifically defined) and letters of credit, corporate guarantees and other instruments.
Insurance Code of Conduct
Each of AG Re and AGRO is subject to the Insurance Code of Conduct, which establishes duties, standards, procedures and sound business principles which must be complied with to ensure sound corporate governance, risk management and internal controls are implemented by all insurers registered under the Insurance Act. The Authority will assess an insurer's compliance with the Code of Conduct in a proportionate manner relative to the nature, scale and complexity of its business. Failure to comply with the requirements under the Insurance Code of Conduct will be a factor taken into account by the Authority in determining whether an insurer is conducting its business in a sound and prudent manner as prescribed by the Insurance Act. Such failure to comply with the requirements of the Insurance Code of Conduct could result in the Authority exercising its powers of intervention and investigation and will be a factor in calculating the operational risk charge applicable in accordance with the insurer's BSCR model or approved internal model.
Certain Other Bermuda Law Considerations
Although AGL is incorporated in Bermuda, it is classified as a non-resident of Bermuda for exchange control purposes by the Authority. Pursuant to its non-resident status, AGL may engage in transactions in currencies other than Bermuda dollars and there are no restrictions on its ability to transfer funds (other than funds denominated in Bermuda dollars) in and out of Bermuda or to pay dividends to U.S. residents who are holders of its common shares.
Under Bermuda law, "exempted" companies are companies formed for the purpose of conducting business outside Bermuda from a principal place of business in Bermuda. As an "exempted" company, AGL (as well as each of AG Re and AGRO) may not, without the express authorization of the Bermuda legislature or under a license or consent granted by the Minister of Finance (the Minister), participate in certain business and other transactions, including: (1) the acquisition or holding of land in Bermuda (except that held by way of lease or tenancy agreement which is required for its business and held for a term not exceeding 50 years, or which is used to provide accommodation or recreational facilities for its officers and employees and held with the consent of the Minister, for a term not exceeding 21 years), (2) the taking of mortgages on land in Bermuda to secure a principal amount in excess of $50,000 unless the Minister consents to a higher amount, and (3) the carrying on of business of any kind or type for which it is not duly licensed in Bermuda, except in certain limited circumstances, such as doing business with another exempted undertaking in furtherance of AGL's business carried on outside Bermuda.
26
The Bermuda government actively encourages foreign investment in "exempted" entities like AGL that are based in Bermuda, but which do not operate in competition with local businesses. AGL is not currently subject to taxes computed on profits or income or computed on any capital asset, gain or appreciation. Bermuda companies pay, as applicable, annual government fees, business fees, payroll tax and other taxes and duties. See "—Tax Matters—Taxation of AGL and Subsidiaries—Bermuda."
Special considerations apply to the Company's Bermuda operations. Under Bermuda law, non-Bermudians, other than spouses of Bermudians and individuals holding permanent resident certificates or working resident certificates, are not permitted to engage in any gainful occupation in Bermuda without a work permit issued by the Bermuda government. A work permit is only granted or extended if the employer can show that, after a proper public advertisement, no Bermudian, spouse of a Bermudian or individual holding a permanent resident certificate or working resident certificate is available who meets the minimum standards for the position. A waiver from advertising is automatically granted in respect of any chief executive officer position and other chief officer positions. The employer can also make a request for a waiver from the requirement to advertise in certain other cases, as expressed in the Bermuda government's work permit policies. Currently, all of the Company's Bermuda based professional employees who require work permits have been granted work permits by the Bermuda government.
United Kingdom
This section concerns AGE and its affiliates Assured Guaranty (U.K.) Ltd. (AGUK), Assured Guaranty (London) Ltd. (AGLN) and Assured Guaranty Finance Overseas Ltd (AGFOL), each of which is regulated in the U.K., as well as Assured Guaranty Credit Protection Ltd. (AGCPL), which is an authorized representative of AGE. AGE, AGUK and AGLN are regulated by the PRA as insurers. AGUK has been placed into runoff.
AGLN (formerly MBIA UK Insurance Limited and renamed on January 13, 2017) was acquired as an authorized insurer in run-off by AGC on January 10, 2017. The Company is actively working to combine AGE, AGUK, AGLN and its affiliate CIFG Europe S.A. (CIFGE). Any such combination will be subject to regulatory and court approvals. As a result, the Company cannot predict when, or if, such combination will be completed.
General
Each of AGE, AGUK, AGLN and AGFOL are subject to the U.K.'s Financial Services and Markets Act 2000 (FSMA), which covers financial services relating to deposits, insurance, investments and certain other financial products.
Under FSMA, effecting or carrying out contracts of insurance by way of business in the U.K. each constitutes a “regulated activity” requiring authorization by the appropriate regulator. An authorized insurance company must have permission for each class of insurance business it intends to write.
Insurance companies in the U.K. are authorized and regulated by the PRA and the Financial Conduct Authority (FCA). The PRA and the FCA were established on April 1, 2013 and are the main regulatory authorities responsible for financial regulation in the U.K. These two regulatory bodies cover the following areas:
|
•
|
the PRA, a part of the Bank of England, is responsible for prudential regulation of key systemically important firms (which includes insurance companies, among others), and
|
|
•
|
the FCA is responsible for the conduct of business regulation of all firms and the regulation of market conduct and the prudential regulation of all non-PRA firms.
|
While the two regulators coordinate and cooperate in some areas, they have separate and independent mandates and separate rule-making and enforcement powers. AGE, AGUK and AGLN are regulated by both the PRA and the FCA. AGFOL is regulated by the FCA.
The PRA carries out the prudential supervision of insurance companies through a variety of methods, including the collection of information from statistical returns, the review of accountants' reports and insurers' annual reports and disclosures, visits to insurance companies and regular formal interviews. The PRA takes a risk-based approach to the supervision of insurance companies.
The primary source of rules relating to the prudential supervision of AGE, AGUK and AGLN is the Solvency II Directive (Directive 2009/138/EC) as amended by the Omnibus II Directive (Directive 2014/51/EU) (together, Solvency II),
27
which came into force and effect on January 1, 2016. The PRA remains the prudential regulator for U.K. insurers such as AGE, AGUK and AGLN under Solvency II. Solvency II provides rules on capital adequacy, governance and risk management and regulatory reporting and public disclosure. It is intended to align capital requirements with the risk profile of each EEA insurance company and to ensure adequate diversification of an insurer's or reinsurer's exposures to any credit risks of its reinsurers. Each of AGE, AGUK and AGLN has calculated its minimum required capital according to the Solvency II criteria and is in compliance.
The PRA applies threshold conditions, which insurers must meet, and against which the PRA assesses them on a continuous basis. At a high level, these conditions are that:
|
•
|
an insurer's head office, and in particular its mind and management, must be in the U.K. if it is incorporated in the U.K.;
|
|
•
|
an insurer's business must be conducted in a prudent manner — in particular, the insurer must maintain appropriate financial and non-financial resources;
|
|
•
|
the insurer must be fit and proper, and be appropriately staffed; and
|
|
•
|
the insurer and its group must be capable of being effectively supervised.
|
The PRA assesses, on an ongoing basis, whether insurers are acting in a manner consistent with safety and soundness and appropriate policyholder protection, and so whether they meet, and are likely to continue to meet, the threshold conditions. It weights its supervision towards those issues and those insurers that, in its judgment, pose the greatest risk to its objectives. It is forward-looking, assessing its objectives not just against current risks, but also against those that could plausibly arise further ahead and will rely significantly on judgments based on evidence and analysis. Its risk assessment framework looks at the potential impact of failure of the insurer, its risk context and mitigating factors.
AGFOL’s Markets in Financial Instruments Directive (MiFID) activities are limited to receiving and transmitting orders and giving investment advice and it cannot hold client money. Accordingly, although it is subject to MiFID, AGFOL is exempt from the Capital Requirements Directive and Capital Requirements Regulations (CRD III and CRD IV), which are the EU regulations on capital for certain MiFID firms. AGFOL has therefore calculated its minimum required capital according to the FCA’s rules for non-CRD firms, and is in compliance.
The regulatory regime in the U.K. must be consistent with relevant European Union (EU) legislation, which is either directly applicable in, or must be implemented into national law by, all EU member states. The key EU legislation that is relevant to AGE, AGUK and AGLN is Solvency II, which provides the framework for a new solvency and supervisory regime for insurers in the EEA. The key EU legislation that is relevant to AGFOL is MiFID, which harmonizes the regulatory regime for investment services and activities across the EEA and the Insurance Mediation Directive.
Position of U.K. Regulated Entities within the AGL Group
AGE is authorized by the PRA to effect and carry out certain classes of general insurance, specifically: classes 14 (credit), 15 (suretyship) and 16 (miscellaneous financial loss) for eligible counterparties and professional clients only (i.e., not retail clients). This scope of permission is sufficient to enable AGE to effect and carry out financial guaranty insurance and reinsurance. The insurance and reinsurance businesses of AGE are subject to close supervision by the PRA. AGE also has permission to arrange and advise on transactions it guarantees, and to take deposits in the context of its insurance business.
Following the Company's decision in 2010 to place AGUK into run-off, the Company has been utilizing AGE as the entity from which to write business in the EEA. It was agreed between management and AGE's then regulator, the Financial Services Authority (now the PRA), that any new business written by AGE would be guaranteed using a co-insurance structure pursuant to which AGE would co-insure municipal and infrastructure transactions with AGM, and structured finance transactions with AGC. AGE must obtain the approval of the PRA before it can guarantee any new structured finance transaction. AGE's financial guaranty for each transaction covers a proportionate share (expected to be approximately 3 to 10%) of the total exposure, and AGM or AGC, as the case may be, guarantees the remaining exposure under the transaction (subject to compliance with EEA licensing requirements). AGM or AGC, as the case may be, will also provide a second-to-pay guaranty to cover AGE's financial guaranty.
28
AGE also is the principal of AGCPL. AGCPL is not PRA or FCA authorized, but is an appointed representative of AGE. This means AGCPL can carry on insurance mediation activities without a license, because AGE has regulatory responsibility for it.
AGCPL is subject to the requirements of Regulation (EU) No 648/2012 of the European Parliament and of the Council of July 4, 2012 on OTC derivatives, central counterparties and trade repositories (EMIR) which, as a European regulation, is directly applicable in all the member states of the EU. AGCPL is the only European entity within the AGL group which has entered into derivative contracts and as such it is the only entity in the group which is directly subject to EMIR. AGCPL has notified the European Securities and Markets Authority (ESMA) and the FCA of its status under EMIR as a non-financial counterparty which has exceeded the clearing threshold (an NFC+) as described in Article 10 of EMIR. AGCPL is subject to certain requirements under EMIR with respect to its portfolio of derivative contracts including: (i) the requirement to centrally clear standardized OTC derivatives (although AGCPL does not currently enter into such derivatives, and so this requirement is not currently relevant) (ii) an obligation to employ certain risk mitigation techniques relating to derivatives that cannot be centrally cleared; and (iii) a requirement to report derivative transactions to a trade depository. The Company is aware that circumstances exist in which EMIR may apply directly to non-European entities when transacting derivatives, but has determined that these circumstances do not apply to the non-European entities in AGL’s group.
AGFOL, a subsidiary of AGL, is authorized by the FCA to carry out designated investment business activities (including insurance mediation) in that it may “advise on investments (except on pension transfers and pension opt outs)” relating to most investment instruments. In addition, it may arrange or bring about transactions in investments and make “arrangements with a view to transactions in investments.” In all cases, it may deal only with clients who are eligible counterparties or professional customers (i.e., not retail clients), or, when arranging in relation to insurance contracts, commercial customers. AGFOL is not authorized as an insurer and does not itself take risk in the transactions it arranges or places, and may not hold funds on behalf of its customers. AGFOL's permissions also allow it to introduce business to AGC and AGM, so that AGFOL can arrange financial guaranties underwritten by AGC and AGM.
Solvency II and Solvency Requirements
In the U.K., Solvency II has been transposed into national law through changes to existing provisions in the FCA and the PRA’s respective handbooks and rulebook and through amendments to primary legislation. The Solvency II “Delegated Acts”, which set out more detailed rules underlying Solvency II have direct effect in all EEA member states, including the U.K. Among other things, Solvency II introduces a revised risk-based prudential regime which includes the following "Pillar 1" regulatory capital rules:
|
•
|
assets and liabilities are generally to be valued at their market value;
|
|
•
|
the amount of required economic capital is intended to ensure, with a probability of 99.5%, that regulated firms are able to meet their obligations to policyholders and beneficiaries over the following 12 months; and
|
|
•
|
reinsurance recoveries will be treated as a separate asset (rather than being netted against the underlying insurance liabilities).
|
In many instances, Solvency II is expected to require insurers to maintain a somewhat increased amount of capital to satisfy the new solvency capital requirements. AGE and AGUK have agreed with the PRA that they will use the "Standard Formula" prescribed by Solvency II for calculation of their capital requirements. AGLN is still using a bespoke internal model for calculation of its capital requirements, which was approved by the PRA prior to the acquisition of AGLN (then MBIA UK Insurance Limited) by AGC.
In addition to new regulatory capital rules, Solvency II also contains a number of “Pillar 2” qualitative requirements, obliging firms to develop and embed systems to identify, measure and proactively manage the risks they are, or may be, exposed to. Among other things, firms must:
|
•
|
have in place an effective system of governance that provides for the sound and prudent management of its business;
|
|
•
|
establish effective risk-management systems; and
|
|
•
|
take a comprehensive approach to considering their risks through an Own Risk and Solvency Assessment (ORSA) as proportionate to the nature, scale and complexity of the risks inherent in their business.
|
“Pillar 3” reporting and disclosure requirements also exist, including a requirement to publish a public Solvency and Financial Condition Report (SFCR) and a private Regular Supervisory Report (RSR). For more information on reporting requirements and the ORSA, see “Reporting Requirements” below.
29
Solvency II contains a new regime for the supervision of groups, including groups in which the parent undertaking has its head office in a country that is outside the EEA. The treatment of such groups in part depends on whether the jurisdiction in which the non-EEA parent has its head office is determined to have a supervisory regime which is equivalent to the Solvency II regime. In the absence of such a determination, the Solvency II rules on supervision apply to the group on a worldwide basis, unless the PRA elects to apply “other methods” which ensure appropriate supervision. Both AGE and AGUK are subsidiaries of U.S. parent companies.
The PRA has issued a Direction to AGE and AGUK which confirms the “other methods” that the PRA will apply to ensure appropriate supervision. These include, among other things, requirements for AGE and AGUK to notify the PRA in advance of any material changes in their intra-group arrangements and any payments of dividends or capital extractions to a group undertaking outside the EEA. AGE and AGUK must also provide the PRA with certain other information, such as internal and external solvency, capital adequacy and risk assessment reports. The Direction applies from January 1, 2016 until January 1, 2019, unless it is revoked earlier or no longer applicable.
Restrictions on Dividend Payments
U.K. company law prohibits each of AGE, AGUK, AGLN and AGFOL from declaring a dividend to its shareholders unless it has “profits available for distribution.” The determination of whether a company has profits available for distribution is based on its accumulated realized profits less its accumulated realized losses. While the U.K. insurance regulatory laws impose no statutory restrictions on a general insurer's ability to declare a dividend, the PRA's capital requirements may in practice act as a restriction on dividends for AGE, AGUK and AGLN.
Reporting Requirements
U.K. insurance companies must prepare their financial statements under the Companies Act 2006, which requires the filing with Companies House of audited financial statements and related reports. In addition, as from January 1, 2016, the reporting requirements for U.K. insurance companies were modified by Solvency II. AGE, AGUK and AGLN are required to produce certain key reports including an annual SFCR, RSR and an ORSA, the latter as part of the so-called “Pillar 2” individual capital assessment requirements. Although the SFCR will take the place of a number of existing regulatory returns, Solvency II is likely to result in an overall increase in the quantity and quality of disclosures that firms make.
The PRA will review each firm’s ORSA and then consider whether in its view the firm needs to hold capital in excess of its Pillar 1 capital (see “Solvency II and Solvency Requirements” above) and, if so, will impose a “capital add-on”. The prescribed information to be contained in the ORSA, as well as the frequency with which the assessment must be carried out, is subject to guidance issued by the European Insurance and Occupational Pensions Authority (EIOPA) in September 2015 and a supervisory statement issued by the PRA in October 2015. The PRA has advised AGE, AGUK and AGLN that it is not imposing a capital add-on for those companies at this time. The PRA may determine to impose a capital add-on in relation to AGE, AGUK and AGLN in the future.
Supervision of Management
AGE, AGUK and AGLN are subject to the rules contained in the Senior Insurance Managers Regime (SIMR). This requires that individuals undertaking particular roles need to be registered with the PRA as undertaking a “Senior Insurance Manager Function”. This broadly includes individuals undertaking the executive functions and the oversight functions of each entity. Directors of those entities not serving in the roles specified in the SIMR will be required to become “approved persons” with the FCA (as detailed further in respect of AGFOL below).
In respect of AGFOL, individuals who perform one or more “controlled functions” such as significant influence functions (which includes all board members and other senior managers) or the customer function within authorized firms must be approved the FCA to carry out that function. Individuals performing these functions are “Approved Persons” for the purpose of Part V of FSMA and staff performing these specified “controlled functions” within an authorized firm must be approved by the FCA.
30
Change of Control
Under FSMA, when a person decides to acquire or increase “control” of a U.K. authorized firm (including an insurance company) they must give the PRA notice in writing before making the acquisition. The PRA has up to 60 working days (without including any period of interruption) in which to assess a change of control case. Any person (a company or individual) that directly or indirectly acquires 10% or 20% (depending on the type of firm, the “Control Percentage Threshold”) or more of the shares, or is entitled to exercise or control the exercise of the Control Percentage Threshold or more of the voting power, in a U.K. authorized firm or its parent undertaking is considered to “acquire control” of the authorized firm. Broadly speaking, the 10% threshold applies to banks, insurers and reinsurers (but not brokers) and MiFID investment firms, and the 20% threshold to insurance brokers and certain other firms that are non-directive firms.
Intervention and Enforcement
The PRA has extensive powers to intervene in the affairs of an authorized firm, culminating in the sanction of the suspension of authorization to carry on a regulated activity. The PRA can also vary or cancel a firm's permissions under its own initiative if it considers that the firm is failing, or is likely to fail, to satisfy the Threshold Conditions. FSMA gives the PRA significant investigation and enforcement powers. It also gives the PRA a rule-making power, under which it makes the various rules that constitute its Handbook of Rules.
The PRA also has the power to prosecute criminal offenses arising under FSMA. The FCA has the power to prosecute offenses under FSMA and to prosecute insider dealing under Part V of the Criminal Justice Act of 1993, and breaches by authorized firms of money laundering and terrorist financing regulations.
“Passporting”
EU directives allow AGE, AGUK, AGLN and AGFOL to conduct business in EU states other than the U.K. where they are authorized by the PRA or FCA under a single market directive. This right extends to the EEA. A firm taking advantage of a right under a single market directive to conduct business in another EEA state can rely on its "home state" authorization. This ability to operate in other jurisdictions of the EEA on the basis of home state authorization and supervision is sometimes referred to as “passporting.” Each of AGE, AGUK, AGLN and AGFOL is passported to conduct business in EEA states other than the U.K. Passporting is not applicable to firms not authorized in the EEA, such as AGM and AGC. Accordingly, the co-insurance model described above cannot be “passported” throughout the EEA. Instead, it is a question of local law in each EEA member state as to whether AGM's or AGC’s participation in a co-insurance structure, protecting insureds or risks located in that jurisdiction, would amount to the conduct of insurance business in that jurisdiction. (See also “U.K. referendum vote to leave the EU” below.)
Fees and Levies
Each of AGE, AGUK, AGLN and AGFOL is subject to regulatory fees and levies based on its gross premium income and gross technical liabilities. These fees are collected by the FCA (though they relate to regulation by both the PRA and the FCA). The PRA also requires authorized firms, including authorized insurers, to participate in an investors' protection fund, known as the Financial Services Compensation Scheme. The Financial Services Compensation Scheme was established to compensate consumers of financial services firms, including the buyers of insurance, against failures in the financial services industry. Eligible claimants (identified in the Compensation Sourcebook of the PRA Handbook) may be compensated by the Financial Services Compensation Scheme when an authorized insurer is unable, or likely to be unable, to satisfy policyholder claims. General insurance in class 14 (credit) is not protected by the Financial Services Compensation Scheme, nor is reinsurance in any class; however, other direct insurance classes written by AGUK and AGE are covered (namely, classes 15 (suretyship) and 16 (miscellaneous financial loss)).
Material Contracts
AGE’s New York affiliate, AGM, currently provides support to AGE, through a quota share and excess of loss reinsurance agreement (the Reinsurance Agreement) and a net worth maintenance agreement (the AGE Net Worth Agreement). For transactions closed prior to 2011, AGE typically guaranteed all of the guaranteed obligations directly and AGM reinsured under the quota share cover of the Reinsurance Agreement approximately 92% of AGE's retention after cessions to other reinsurers. In 2011, AGE and AGM implemented a co-guarantee structure pursuant to which (i) AGE directly guarantees a portion of the guaranteed obligations in an amount equal to what would have been AGE's pro rata retention percentage under the quota share cover, (ii) AGM directly guarantees the balance of the guaranteed obligations, and (iii) AGM also provides a
31
second-to-pay guarantee for AGE's portion of the guaranteed obligations. AGM's ability to provide such direct guaranties outside of the U.K. is uncertain. See "Passporting" above.
Under the excess of loss cover of the Reinsurance Agreement, AGM pays AGE quarterly the amount by which (i) the sum of (a) AGE’s incurred losses calculated in accordance with U.K. GAAP as reported by AGE in its financial returns filed with the PRA and (b) AGE’s paid losses and loss adjustment expenses (LAE), in both cases net of all other performing reinsurance, including the reinsurance provided by the Company under the quota share cover of the Reinsurance Agreement, exceeds (ii) an amount equal to (a) AGE’s capital resources under U.K. law minus (b) 110% of the greatest of the amounts as may be required by the PRA as a condition for AGE to maintain its authorization to carry on a financial guarantee business in the U.K. The Reinsurance Agreement permits AGE to terminate the Reinsurance Agreement upon the following events: a downgrade of AGM’s ratings by Moody’s below Aa3 or by S&P below AA- if AGM fails to restore its rating(s) to the required level within a prescribed period of time; AGM's insolvency; failure by AGM to maintain the minimum capital required by its domiciliary jurisdiction; or AGM filing a petition in bankruptcy, going into liquidation or rehabilitation or having a receiver appointed.
The quota share and excess loss covers each exclude transactions guaranteed by AGE on or after July 1, 2009 that are not municipal, utility, project finance or infrastructure risks or similar types of risks.
The Reinsurance Agreement also contemplates the establishment of collateral by AGM to support AGM’s reinsurance obligations to AGE. In December 2014, to satisfy the PRA’s collateral requirements, AGM and AGE entered into a trust agreement pursuant to which AGM established and deposited assets into a reinsurance trust account for the benefit of AGE. AGM’s collateral requirement was measured during 2015, as of the end of each calendar quarter, by (i) using the PRA’s FG Benchmark Model to calculate at the 99.5% confidence interval the losses expected to be borne collectively by AGE’s three affiliated reinsurers, AGM, AG Re and AGRO; (ii) deducting from such calculation AGE’s capital resources under such model; and (iii) requiring AGM, AG Re and AGRO collectively to maintain collateral equal to fifty percent (50%) of such difference, i.e., the excess of AGM’s, AG Re’s and AGRO’s assumed modeled losses over AGE’s capital resources. As of January 1, 2016, the PRA agreed to allow AGM’s collateral requirement to be determined using AGE’s internal capital requirement model instead of the FG Benchmark Model under the same formula described above. This change in the calculation of AGM's required collateral was reflected in an amendment to the Reinsurance Agreement approved by the NYDFS and made effective in April 2016.
Pursuant to the AGE Net Worth Agreement, AGM is obligated to cause AGE to maintain capital resources equal to 110% of the greatest of the amounts as may be required by the PRA as a condition for AGE to maintain its authorization to carry on a financial guarantee business in the U.K., provided that AGM's contributions (a) do not exceed 35% of AGM's policyholders' surplus on an accumulated basis as determined by the laws of the State of New York, and (b) are in compliance with Section 1505 of the New York Insurance Law. AGM has never been required to make any contributions to AGE's capital under the AGE Net Worth Agreement or the prior net worth maintenance agreement. With the approval of the NYDFS, AGE and AGM amended the AGE Net Worth Agreement effective in April 2016 to provide for use of the internal capital requirement model.
AGUK’s parent company, AGC, currently provides support to AGUK through a further amended and restated quota share reinsurance agreement (the Quota Share Agreement), a further amended and restated excess of loss reinsurance agreement (the XOL Agreement), and a further amended and restated net worth maintenance agreement (the "AGUK Net Worth Agreement"). Pursuant to the Quota Share Agreement, AGUK cedes 90% of its financial guaranty insurance and reinsurance exposure to AGC. Pursuant to the XOL Agreement, AGC indemnifies AGUK for 100% of losses (net of the quota share reinsurance agreement discussed above) incurred by AGUK in excess of an amount equal to (a) AGUK’s capital resources minus (b) 110% of the greatest of the amounts as may be required by the PRA as a condition for AGUK maintaining its authorization to carry on a financial guarantee business in the U.K. Pursuant to the AGUK Net Worth Agreement,
if AGUK's net worth falls below 110% of the minimum level of capital required by the PRA, AGC must invest additional funds in order to bring the capital of AGUK back into compliance with the required amount.
In 2016, AGC and AGUK reached an agreement with the PRA that, in order for AGC to secure its outstanding reinsurance of AGUK under the Quota Share Agreement and XOL Agreement, AGC shall post as collateral its share of AGUK-guaranteed triple-X insurance bonds that have been purchased by AGC for loss mitigation and an additional amount to be determined by (i) using AGUK’s internal capital requirement model to calculate at the 99.5% confidence interval the losses expected to be borne by AGC for the exposures it has assumed from AGUK that do not have loss reserves (non-reserve exposures); (ii) adding the amount of loss reserves ceded by AGUK to AGC under U.K. GAAP; (iii) subtracting from such sum AGUK’s capital resources under its internal capital requirement model (the result of clauses (i) through (iii) being referred to as the resulting amount); and then (iv) reducing the resulting amount by 50% of the portion of the resulting amount that was contributed by the non-reserve exposures. Accordingly, AGC and AGUK entered into a trust agreement pursuant to which AGC established a reinsurance trust account for the benefit of AGUK and deposits therein sufficient assets to satisfy the above-
32
described collateral requirement agreed with the PRA. This new collateral requirement is reflected in the Quota Share Agreement and XOL Agreement, which were approved by the MIA and made effective in July 2016.
U.K. referendum vote to leave the European Union
On June 23, 2016, the U.K. voted in a national referendum to withdraw from the EU. The result of the referendum does not legally oblige the U.K. to exit the European Union (a so-called Brexit). However, the U.K. government has indicated that it intends to formally serve notice to the European Council of its desire to withdraw in accordance with Article 50 of the Treaty on European Union (Article 50) by the end of March 2017.
Article 50 envisages a negotiation period leading to an exit on a mutually agreed date. However, in the absence of such mutual agreement, the default date for exit is two years after the member state serves the Article 50 notice. EU treaties will therefore cease to apply to the U.K. on the earlier of (i) the entry into force of any withdrawal agreement or (ii) two years after the giving of notice (unless the U.K. and all remaining Member States unanimously agree to extend the negotiation period), currently contemplated to be March 2019.
Until the U.K. formally withdraws from the EU, EU legislation will remain in force and the role of EU institutions will be unchanged. On withdrawal of the U.K. from the EU, in the absence of any agreement to the contrary, all treaty obligations would lapse, directives, directly effective decisions and regulations (as well as rulings of the Court of Justice of the EU) would cease to apply and the competencies of EU institutions would fall away.
The U.K. Government has announced its intention to bring all aspects of European law into U.K. law prior to the U.K. exiting the EU. It seems most likely, given the relatively short timescales available, that initially Solvency II will be brought into U.K. law in its current form. Retaining Solvency II in its current form would also make it easier for the U.K. to obtain a ruling of “equivalence” from the European Commission under Solvency II, which would accord insurers certain advantages when it comes to the Solvency II rules on reinsurance, the calculation of group capital and group supervision.
The U.K. Government could take time to review whether there might be any changes which are desired on a national level. The Treasury Select Committee of the House of Commons is currently reviewing Solvency II and has indicated that it will do so against the backdrop of Brexit, taking into account certain features which are regarded as unsuitable by the U.K. industry. The results of the Treasury Select Committee’s work may feed in to future discussions about potential changes to the Solvency II regime.
Any changes to Solvency II following Brexit could reduce the chances of the U.K. obtaining (or subsequently preserving) a ruling of equivalence.
A further question arising from Brexit is whether U.K. authorised financial services firms such as AGE and AGUK will continue to enjoy passporting rights to the other 27 EEA states after Brexit. In the event that passporting rights are not retained, Assured Guaranty is assessing a number of options in order to continue with the ability to write new business, and to run off existing business, in those EEA states.
France
In connection with the CIFG Acquisition in July 2016, the Company acquired a French insurer called CIFG Europe S.A. which is now in run off. CIFGNA had reinsured all of CIFGE’s outstanding financial guaranty business and also had issued a “second-to-pay policy” pursuant to which CIFGNA guaranteed the full and complete payment of any shortfall in amounts due from CIFGE on its insured portfolio. AGC assumed these obligations as part of the CIFGNA merger with and into AGC. CIFGE remains a separate subsidiary in run off, now owned by AGC. Prior to the CIFG Acquisition, CIFGE had prepared a run off plan which was approved by its French regulator, the
Autorité de contrôle prudentiel et de résolution (ACPR). CIFGE has been in run off for more than two years, and therefore has surrendered its licence under French law to write new insurance business. The withdrawal of the licence has no practical impact on the level of supervision exercised by the ACPR over CIFGE as an insurer.
33
Tax Matters
Taxation of AGL and Subsidiaries
Bermuda
Under current Bermuda law, there is no Bermuda income, corporate or profits tax or withholding tax, capital gains tax or capital transfer tax payable by AGL or its Bermuda subsidiaries. AGL, AG Re and AGRO have each obtained from the Minister of Finance under the Exempted Undertakings Tax Protection Act 1966, as amended, an assurance that, in the event that Bermuda enacts legislation imposing tax computed on profits, income, any capital asset, gain or appreciation, or any tax in the nature of estate duty or inheritance, then the imposition of any such tax shall not be applicable to AGL, AG Re or AGRO or to any of their operations or their shares, debentures or other obligations, until March 31, 2035. This assurance is subject to the proviso that it is not to be construed so as to prevent the application of any tax or duty to such persons as are ordinarily resident in Bermuda, or to prevent the application of any tax payable in accordance with the provisions of the Land Tax Act 1967 or otherwise payable in relation to any land leased to AGL, AG Re or AGRO. AGL, AG Re and AGRO each pays annual Bermuda government fees, and AG Re and AGRO pay annual insurance license fees. In addition, all entities employing individuals in Bermuda are required to pay a payroll tax and there are other sundry taxes payable, directly or indirectly, to the Bermuda government.
United States
AGL has conducted and intends to continue to conduct substantially all of its operations outside the U.S. and to limit the U.S. contacts of AGL and its foreign subsidiaries (except AGRO and AGE, which have elected to be taxed as U.S. corporations) so that they should not be engaged in a trade or business in the U.S. A foreign corporation, such as AG Re, that is deemed to be engaged in a trade or business in the United States would be subject to U.S. income tax at regular corporate rates, as well as the branch profits tax, on its income which is treated as effectively connected with the conduct of that trade or business, unless the corporation is entitled to relief under the permanent establishment provision of an applicable tax treaty, as discussed below. Such income tax, if imposed, would be based on effectively connected income computed in a manner generally analogous to that applied to the income of a U.S. corporation, except that a foreign corporation would generally be entitled to deductions and credits only if it timely files a U.S. federal income tax return. AGL, AG Re and certain of the other foreign subsidiaries have and will continue to file protective U.S. federal income tax returns on a timely basis in order to preserve the right to claim income tax deductions and credits if it is ever determined that they are subject to U.S. federal income tax. The highest marginal federal income tax rates currently are 35% for a corporation's effectively connected income and 30% for the "branch profits" tax.
Under the income tax treaty between Bermuda and the U.S. (the Bermuda Treaty), a Bermuda insurance company would not be subject to U.S. income tax on income found to be effectively connected with a U.S. trade or business unless that trade or business is conducted through a permanent establishment in the U.S. AG Re currently intends to conduct its activities so that it does not have a permanent establishment in the U.S.
An insurance enterprise resident in Bermuda generally will be entitled to the benefits of the Bermuda Treaty if (i) more than 50% of its shares are owned beneficially, directly or indirectly, by individual residents of the U.S. or Bermuda or U.S. citizens and (ii) its income is not used in substantial part, directly or indirectly, to make disproportionate distributions to, or to meet certain liabilities of, persons who are neither residents of either the U.S. or Bermuda nor U.S. citizens.
Foreign insurance companies carrying on an insurance business within the U.S. have a certain minimum amount of effectively connected net investment income, determined in accordance with a formula that depends, in part, on the amount of U.S. risk insured or reinsured by such companies. If AG Re or another of the Company's Bermuda subsidiaries is considered to be engaged in the conduct of an insurance business in the U.S. and is not entitled to the benefits of the Bermuda Treaty in general (because it fails to satisfy one of the limitations on treaty benefits discussed above), the Internal Revenue Code of 1986, as amended (the Code), could subject a significant portion of AG Re's or another of the Company's Bermuda subsidiary's investment income to U.S. income tax.
AGL, as a U.K. tax resident, would not be subject to U.S. income tax on any income found to be effectively connected with a U.S. trade or business under the income tax treaty between the U.S. and the U.K. (the U.K. Treaty), unless that trade or business is conducted through a permanent establishment in the United States. AGL intends to conduct its activities so that it does not have a permanent establishment in the United States.
34
Foreign corporations not engaged in a trade or business in the U.S., and those that are engaged in a U.S. trade or business with respect to their non-effectively connected income are nonetheless subject to U.S. withholding tax on certain "fixed or determinable annual or periodic gains, profits and income" derived from sources within the U.S. (such as dividends and certain interest on investments), subject to exemption under the Code or reduction by applicable treaties. The standard non-treaty rate of U.S. withholding tax is currently 30%. The Bermuda Treaty does not reduce the U.S. withholding rate on U.S.-sourced investment income. The U.K. Treaty reduces or eliminates U.S. withholding tax on certain U.S. sourced investment income, including dividends from U.S. companies to U.K. resident persons entitled to the benefit of the U.K. Treaty.
The U.S. also imposes an excise tax on insurance and reinsurance premiums paid to foreign insurers with respect to risk of a U.S. person located wholly or partly within the U.S. or risks of a foreign person engaged in a trade or business in the U.S. which are located within the U.S. The rates of tax applicable to premiums paid are 4% for direct casualty insurance premiums and 1% for reinsurance premiums.
AGRO and AGE have elected to be treated as U.S. corporations for all U.S. federal tax purposes and, as such, each of AGRO and AGE, together with AGL's U.S. subsidiaries, is subject to taxation in the U.S. at regular corporate rates.
If AGRO were to pay dividends to its U.S. holding company parent and that U.S. holding company were to pay dividends to its Bermudian parent AG Re, such dividends would be subject to U.S. withholding tax at a rate of 30%.
United Kingdom
In November 2013, AGL became tax resident in the U.K. AGL remains a Bermuda-based company and its administrative and head office functions continue to be carried on in Bermuda. The AGL common shares have not changed and continue to be listed on the New York Stock Exchange (NYSE).
As a company that is not incorporated in the U.K., AGL will be considered tax resident in the U.K. only if it is “centrally managed and controlled” in the U.K. Central management and control constitutes the highest level of control of a company’s affairs. Effective November 6, 2013, the AGL Board intends to manage the affairs of AGL in such a way as to maintain its status as a company that is tax resident in the U.K.
As a U.K. tax resident company, AGL is subject to the tax rules applicable to companies resident in the U.K., including the benefits afforded by the U.K.’s tax treaties.
As a U.K. tax resident, AGL is required to file a corporation tax return with Her Majesty’s Revenue & Customs (HMRC). AGL will be subject to U.K. corporation tax in respect of its worldwide profits (both income and capital gains), subject to any applicable exemptions. The main rate of corporation tax is currently
20%
. It will be further reduced to
19%
with effect from April 1, 2017 and
17%
with effect from April 1, 2020. AGL has also registered in the U.K. to report its value added tax (VAT) liability. The current rate of VAT is
20%
.
The dividends AGL receives from its direct subsidiaries should be exempt from U.K. corporation tax due to the exemption in section 931D of the U.K. Corporation Tax Act 2009. In addition, any dividends paid by AGL to its shareholders should not be subject to any withholding tax in the U.K. The non-U.K. resident subsidiaries intend to operate in such a manner that their profits are outside the scope of the charge under the "controlled foreign companies" (CFC) regime. Accordingly, Assured Guaranty does not expect any profits of non-U.K. resident members of the group to be attributed to AGL and taxed in the U.K. under the CFC regime and has obtained clearance from HMRC confirming this on the basis of current facts and intentions.
Taxation of Shareholders
Bermuda Taxation
Currently, there is no Bermuda capital gains tax, or withholding or other tax payable on principal, interest or dividends paid to the holders of the AGL common shares.
United States Taxation
This discussion is based upon the Code, the regulations promulgated thereunder and any relevant administrative rulings or pronouncements or judicial decisions, all as in effect on the date hereof and as currently interpreted, and does not
35
take into account possible changes in such tax laws or interpretations thereof, which may apply retroactively. This discussion does not include any description of the tax laws of any state or local governments within the U.S. or any foreign government.
The following summary sets forth the material U.S. federal income tax considerations related to the purchase, ownership and disposition of AGL's shares. Unless otherwise stated, this summary deals only with holders that are U.S. Persons (as defined below) who purchase and hold their shares and who hold their shares as capital assets within the meaning of section 1221 of the Code. The following discussion is only a discussion of the material U.S. federal income tax matters as described herein and does not purport to address all of the U.S. federal income tax consequences that may be relevant to a particular shareholder in light of such shareholder's specific circumstances. For example, special rules apply to certain shareholders, such as partnerships, insurance companies, regulated investment companies, real estate investment trusts, dealers or traders in securities, tax exempt organizations, expatriates, persons that do not hold their securities in the U.S. dollar, persons who are considered with respect to AGL or any of its foreign subsidiaries as "United States shareholders" for purposes of the controlled foreign corporation (CFC) rules of the Code (generally, a U.S. Person, as defined below, who owns or is deemed to own 10% or more of the total combined voting power of all classes of AGL or the stock of any of AGL's foreign subsidiaries entitled to vote (i.e., 10% U.S. Shareholders)), or persons who hold the common shares as part of a hedging or conversion transaction or as part of a short-sale or straddle. Any such shareholder should consult their tax advisor.
If a partnership holds AGL's shares, the tax treatment of the partners will generally depend on the status of the partner and the activities of the partnership. Partners of a partnership owning AGL's shares should consult their tax advisers.
For purposes of this discussion, the term "U.S. Person" means: (i) a citizen or resident of the U.S., (ii) a partnership or corporation, created or organized in or under the laws of the U.S., or organized under any political subdivision thereof, (iii) an estate the income of which is subject to U.S. federal income taxation regardless of its source, (iv) a trust if either (x) a court within the U.S. is able to exercise primary supervision over the administration of such trust and one or more U.S. Persons have the authority to control all substantial decisions of such trust or (y) the trust has a valid election in effect to be treated as a U.S. Person for U.S. federal income tax purposes or (v) any other person or entity that is treated for U.S. federal income tax purposes as if it were one of the foregoing.
Taxation of Distributions.
Subject to the discussions below relating to the potential application of the CFC, related person insurance income (RPII) and passive foreign investment company (PFIC) rules, cash distributions, if any, made with respect to AGL's shares will constitute dividends for U.S. federal income tax purposes to the extent paid out of current or accumulated earnings and profits of AGL (as computed using U.S. tax principles). Dividends paid by AGL to corporate shareholders will not be eligible for the dividends received deduction. To the extent such distributions exceed AGL's earnings and profits, they will be treated first as a return of the shareholder's basis in the common shares to the extent thereof, and then as gain from the sale of a capital asset.
AGL believes dividends paid by AGL on its common shares to non-corporate holders will be eligible for reduced rates of tax at the rates applicable to long-term capital gains as "qualified dividend income," provided that AGL is not a PFIC and certain other requirements, including stock holding period requirements, are satisfied.
Classification of AGL or its Foreign Subsidiaries as a Controlled Foreign Corporation.
Each 10% U.S. Shareholder (as defined below) of a foreign corporation that is a CFC for an uninterrupted period of 30 days or more during a taxable year, and who owns shares in the foreign corporation, directly or indirectly through foreign entities, on the last day of the foreign corporation's taxable year in which it is a CFC, must include in its gross income for U.S. federal income tax purposes its pro rata share of the CFC's "subpart F income," even if the subpart F income is not distributed. "Subpart F income" of a foreign insurance corporation typically includes foreign personal holding company income (such as interest, dividends and other types of passive income), as well as insurance and reinsurance income (including underwriting and investment income). A foreign corporation is considered a CFC if 10% U.S. Shareholders own (directly, indirectly through foreign entities or by attribution by application of the constructive ownership rules of section 958(b) of the Code (i.e., constructively)) more than 50% of the total combined voting power of all classes of voting stock of such foreign corporation, or more than 50% of the total value of all stock of such corporation on any day during the taxable year of such corporation. For purposes of taking into account insurance income, a CFC also includes a foreign insurance company in which more than 25% of the total combined voting power of all classes of stock (or more than 25% of the total value of the stock) is owned by 10% U.S. Shareholders, on any day during the taxable year of such corporation. A "10% U.S. Shareholder" is a U.S. Person who owns (directly, indirectly through foreign entities or constructively) at least 10% of the total combined voting power of all classes of stock entitled to vote of the foreign corporation. AGL believes that because of the dispersion of AGL's share ownership, provisions in AGL's organizational documents that limit voting power (these provisions are described in "Description of Share Capital") and other factors, no U.S. Person who owns shares of AGL directly or indirectly through one or more foreign entities should be treated as owning (directly, indirectly through foreign entities, or constructively), 10% or more of the total voting power of all classes of shares of
36
AGL or any of its foreign subsidiaries. It is possible, however, that the Internal Revenue Service (IRS) could challenge the effectiveness of these provisions and that a court could sustain such a challenge. In addition, the direct and indirect subsidiaries of AGUS are characterized as CFCs and any subpart F income generated will be included in the gross income of the applicable domestic subsidiaries in the AGL group.
The RPII CFC Provisions.
The following discussion generally is applicable only if the RPII of AG Re or any other foreign insurance subsidiary that has not made an election under section 953(d) of the Code to be treated as a U.S. corporation for all U.S. federal tax purposes or are CFCs owned directly or indirectly by AGUS (each a "Foreign Insurance Subsidiary" or collectively, with AG Re, the "Foreign Insurance Subsidiaries") determined on a gross basis, is 20% or more of the Foreign Insurance Subsidiary's gross insurance income for the taxable year and the 20% Ownership Exception (as defined below) is not met. The following discussion generally would not apply for any taxable year in which the Foreign Insurance Subsidiary's gross RPII falls below the 20% threshold or the 20% Ownership Exception is met. Although the Company cannot be certain, it believes that each Foreign Insurance Subsidiary has been, in prior years of operations, and will be, for the foreseeable future, either below the 20% threshold or in compliance with the requirements of 20% Ownership Exception for each tax year.
RPII is any "insurance income" (as defined below) attributable to policies of insurance or reinsurance with respect to which the person (directly or indirectly) insured is a "RPII shareholder" (as defined below) or a "related person" (as defined below) to such RPII shareholder. In general, and subject to certain limitations, "insurance income" is income (including premium and investment income) attributable to the issuing of any insurance or reinsurance contract which would be taxed under the portions of the Code relating to insurance companies if the income were the income of a domestic insurance company. For purposes of inclusion of the RPII of a Foreign Insurance Subsidiary in the income of RPII shareholders, unless an exception applies, the term "RPII shareholder" means any U.S. Person who owns (directly or indirectly through foreign entities) any amount of AGL's common shares. Generally, the term "related person" for this purpose means someone who controls or is controlled by the RPII shareholder or someone who is controlled by the same person or persons which control the RPII shareholder. Control is measured by either more than 50% in value or more than 50% in voting power of stock applying certain constructive ownership principles. A Foreign Insurance Subsidiary will be treated as a CFC under the RPII provisions if RPII shareholders are treated as owning (directly, indirectly through foreign entities or constructively) 25% or more of the shares of AGL by vote or value.
RPII Exceptions.
The special RPII rules do not apply if (i) at all times during the taxable year less than 20% of the voting power and less than 20% of the value of the stock of AGL (the 20% Ownership Exception) is owned (directly or indirectly through entities) by persons who are (directly or indirectly) insured under any policy of insurance or reinsurance issued by a Foreign Insurance Subsidiary or related persons to any such person, (ii) RPII, determined on a gross basis, is less than 20% of a Foreign Insurance Subsidiary's gross insurance income for the taxable year (the 20% Gross Income Exception), (iii) a Foreign Insurance Subsidiary elects to be taxed on its RPII as if the RPII were effectively connected with the conduct of a U.S. trade or business, and to waive all treaty benefits with respect to RPII and meet certain other requirements or (iv) a Foreign Insurance Subsidiary elects to be treated as a U.S. corporation and waive all treaty benefits and meet certain other requirements. The Foreign Insurance Subsidiaries do not intend to make either of these elections. Where none of these exceptions applies, each U.S. Person owning or treated as owning any shares in AGL (and therefore, indirectly, in a Foreign Insurance Subsidiary) on the last day of AGL's taxable year will be required to include in its gross income for U.S. federal income tax purposes its share of the RPII for the portion of the taxable year during which a Foreign Insurance Subsidiary was a CFC under the RPII provisions, determined as if all such RPII were distributed proportionately only to such U.S. Persons at that date, but limited by each such U.S. Person's share of a Foreign Insurance Subsidiary's current-year earnings and profits as reduced by the U.S. Person's share, if any, of certain prior-year deficits in earnings and profits. The Foreign Insurance Subsidiaries intend to operate in a manner that is intended to ensure that each qualifies for either the 20% Gross Income Exception or 20% Ownership Exception.
Computation of RPII.
For any year in which a Foreign Insurance Subsidiary does not meet the 20% Ownership Exception or the 20% Gross Income Exception, AGL may also seek information from its shareholders as to whether beneficial owners of shares at the end of the year are U.S. Persons so that the RPII may be determined and apportioned among such persons; to the extent AGL is unable to determine whether a beneficial owner of shares is a U.S. Person, AGL may assume that such owner is not a U.S. Person, thereby increasing the per share RPII amount for all known RPII shareholders. The amount of RPII includable in the income of a RPII shareholder is based upon the net RPII income for the year after deducting related expenses such as losses, loss reserves and operating expenses. If a Foreign Insurance Subsidiary meets the 20% Ownership Exception or the 20% Gross Income Exception, RPII shareholders will not be required to include RPII in their taxable income.
Apportionment of RPII to U.S. Holders.
Every RPII shareholder who owns shares on the last day of any taxable year of AGL in which a Foreign Insurance Subsidiary does not meet the 20% Ownership Exception or the 20% Gross Income Exception should expect that for such year it will be required to include in gross income its share of a Foreign Insurance
37
Subsidiary's RPII for the portion of the taxable year during which the Foreign Insurance Subsidiary was a CFC under the RPII provisions, whether or not distributed, even though it may not have owned the shares throughout such period. A RPII shareholder who owns shares during such taxable year but not on the last day of the taxable year is not required to include in gross income any part of the Foreign Insurance Subsidiary's RPII.
Basis Adjustments.
An RPII shareholder's tax basis in its common shares will be increased by the amount of any RPII the shareholder includes in income. The RPII shareholder may exclude from income the amount of any distributions by AGL out of previously taxed RPII income. The RPII shareholder's tax basis in its common shares will be reduced by the amount of such distributions that are excluded from income.
Uncertainty as to Application of RPII.
The RPII provisions are complex and have never been interpreted by the courts or the Treasury Department in final regulations; regulations interpreting the RPII provisions of the Code exist only in proposed form. It is not certain whether these regulations will be adopted in their proposed form or what changes or clarifications might ultimately be made thereto or whether any such changes, as well as any interpretation or application of RPII by the IRS, the courts or otherwise, might have retroactive effect. These provisions include the grant of authority to the Treasury Department to prescribe "such regulations as may be necessary to carry out the purpose of this subsection including regulations preventing the avoidance of this subsection through cross insurance arrangements or otherwise." Accordingly, the meaning of the RPII provisions and the application thereof to the Foreign Insurance Subsidiaries is uncertain. In addition, the Company cannot be certain that the amount of RPII or the amounts of the RPII inclusions for any particular RPII shareholder, if any, will not be subject to adjustment based upon subsequent IRS examination. Any prospective investor which does business with a Foreign Insurance Subsidiary and is considering an investment in common shares should consult his tax advisor as to the effects of these uncertainties.
Information Reporting.
Under certain circumstances, U.S. Persons owning shares (directly, indirectly or constructively) in a foreign corporation are required to file IRS Form 5471 with their U.S. federal income tax returns. Generally, information reporting on IRS Form 5471 is required by (i) a person who is treated as a RPII shareholder, (ii) a 10% U.S. Shareholder of a foreign corporation that is a CFC for an uninterrupted period of 30 days or more during any tax year of the foreign corporation and who owned the stock on the last day of that year; and (iii) under certain circumstances, a U.S. Person who acquires stock in a foreign corporation and as a result thereof owns 10% or more of the voting power or value of such foreign corporation, whether or not such foreign corporation is a CFC. For any taxable year in which AGL determines that the 20% Gross Income Exception and the 20% Ownership Exception does not apply, AGL will provide to all U.S. Persons registered as shareholders of its shares a completed IRS Form 5471 or the relevant information necessary to complete the form. Failure to file IRS Form 5471 may result in penalties. In addition, U.S. shareholders should consult their tax advisors with respect to other information reporting requirements that may be applicable to them.
U.S. Persons holding our shares should consider their possible obligation to file FINCEN Form 114,
Foreign Bank and Financial Accounts Report
, with respect to their shares. Additionally, such U.S. and non-U.S. persons should consider their possible obligations to annually report certain information with respect to us with their U.S. federal income tax returns. Shareholders should consult their tax advisors with respect to these or any other reporting requirement which may apply with respect to their ownership of our shares.
Tax-Exempt Shareholders.
Tax-exempt entities will be required to treat certain subpart F insurance income, including RPII, that is includable in income by the tax-exempt entity as unrelated business taxable income. Prospective investors that are tax exempt entities are urged to consult their tax advisors as to the potential impact of the unrelated business taxable income provisions of the Code. A tax-exempt organization that is treated as a 10% U.S. Shareholder or a RPII Shareholder also must file IRS Form 5471 in certain circumstances.
Dispositions of AGL's Shares.
Subject to the discussions below relating to the potential application of the Code section 1248 and PFIC rules, holders of shares generally should recognize capital gain or loss for U.S. federal income tax purposes on the sale, exchange or other disposition of shares in the same manner as on the sale, exchange or other disposition of any other shares held as capital assets. If the holding period for these shares exceeds one year, any gain will be subject to tax at a current maximum marginal tax rate of 20% for individuals and 35% for corporations. Moreover, gain, if any, generally will be a U.S. source gain and generally will constitute "passive income" for foreign tax credit limitation purposes.
Code section 1248 provides that if a U.S. Person sells or exchanges stock in a foreign corporation and such person owned, directly, indirectly through foreign entities or constructively, 10% or more of the voting power of the corporation at any time during the five-year period ending on the date of disposition when the corporation was a CFC, any gain from the sale or exchange of the shares will be treated as a dividend to the extent of the CFC's earnings and profits (determined under U.S. federal income tax principles) during the period that the shareholder held the shares and while the corporation was a CFC (with
38
certain adjustments). The Company believes that because of the dispersion of AGL's share ownership, provisions in AGL's organizational documents that limit voting power and other factors that no U.S. shareholder of AGL should be treated as owning (directly, indirectly through foreign entities or constructively) 10% of more of the total voting power of AGL; to the extent this is the case this application of Code Section 1248 under the regular CFC rules should not apply to dispositions of AGL's shares. It is possible, however, that the IRS could challenge the effectiveness of these provisions and that a court could sustain such a challenge. A 10% U.S. Shareholder may in certain circumstances be required to report a disposition of shares of a CFC by attaching IRS Form 5471 to the U.S. federal income tax or information return that it would normally file for the taxable year in which the disposition occurs. In the event this is determined necessary, AGL will provide a completed IRS Form 5471 or the relevant information necessary to complete the Form. Code section 1248 in conjunction with the RPII rules also applies to the sale or exchange of shares in a foreign corporation if the foreign corporation would be treated as a CFC for RPII purposes regardless of whether the shareholder is a 10% U.S. Shareholder or whether the 20% Ownership Exception or 20% Gross Income Exception applies. Existing proposed regulations do not address whether Code section 1248 would apply if a foreign corporation is not a CFC but the foreign corporation has a subsidiary that is a CFC and that would be taxed as an insurance company if it were a domestic corporation. The Company believes, however, that this application of Code section 1248 under the RPII rules should not apply to dispositions of AGL's shares because AGL will not be directly engaged in the insurance business. The Company cannot be certain, however, that the IRS will not interpret the proposed regulations in a contrary manner or that the Treasury Department will not amend the proposed regulations to provide that these rules will apply to dispositions of common shares. Prospective investors should consult their tax advisors regarding the effects of these rules on a disposition of common shares.
Passive Foreign Investment Companies.
In general, a foreign corporation will be a PFIC during a given year if (i) 75% or more of its gross income constitutes "passive income" (the 75% test) or (ii) 50% or more of its assets produce passive income (the 50% test).
If AGL were characterized as a PFIC during a given year, each U.S. Person holding AGL's shares would be subject to a penalty tax at the time of the sale at a gain of, or receipt of an "excess distribution" with respect to, their shares, unless such person (i) is a 10% U.S. Shareholder and AGL is a CFC or (ii) made a "qualified electing fund election" or "mark-to-market" election. It is uncertain that AGL would be able to provide its shareholders with the information necessary for a U.S. Person to make a qualified electing fund election. In addition, if AGL were considered a PFIC, upon the death of any U.S. individual owning common shares, such individual's heirs or estate would not be entitled to a "step-up" in the basis of the common shares that might otherwise be available under U.S. federal income tax laws. In general, a shareholder receives an "excess distribution" if the amount of the distribution is more than 125% of the average distribution with respect to the common shares during the three preceding taxable years (or shorter period during which the taxpayer held common shares). In general, the penalty tax is equivalent to an interest charge on taxes that are deemed due during the period the shareholder owned the common shares, computed by assuming that the excess distribution or gain (in the case of a sale) with respect to the common shares was taken in equal portion at the highest applicable tax rate on ordinary income throughout the shareholder's period of ownership. The interest charge is equal to the applicable rate imposed on underpayments of U.S. federal income tax for such period. In addition, a distribution paid by AGL to U.S. shareholders that is characterized as a dividend and is not characterized as an excess distribution would not be eligible for reduced rates of tax as qualified dividend income. A U.S. Person that is a shareholder in a PFIC may also be subject to additional information reporting requirements, including the annual filing of IRS Form 8621.
For the above purposes, passive income generally includes interest, dividends, annuities and other investment income. The PFIC rules provide that income "derived in the active conduct of an insurance business by a corporation which is predominantly engaged in an insurance business... is not treated as passive income." The PFIC provisions also contain a look-through rule under which a foreign corporation shall be treated as if it "received directly its proportionate share of the income..." and as if it "held its proportionate share of the assets..." of any other corporation in which it owns at least 25% of the value of the stock.
The insurance income exception is intended to ensure that income derived by a bona fide insurance company is not treated as passive income, except to the extent such income is attributable to financial reserves in excess of the reasonable needs of the insurance business. The Company expects, for purposes of the PFIC rules, that each of AGL's insurance subsidiaries will be predominantly engaged in an insurance business and is unlikely to have financial reserves in excess of the reasonable needs of its insurance business in each year of operations. Accordingly, none of the income or assets of AGL's insurance subsidiaries should be treated as passive. Additionally, the Company expects that in each year of operations the passive income and assets of AGL's non-insurance subsidiaries will not exceed the 75% test or 50% test amounts in each year of operations with respect to the overall income and assets of AGL and its subsidiaries. Under the look-through rule AGL should be deemed to own its proportionate share of the assets and to have received its proportionate share of the income of its direct and indirect subsidiaries for purposes of the 75% test and the 50% test. As a result, the Company believes that AGL was
39
not and should not be treated as a PFIC. The Company cannot be certain that the IRS will not successfully challenge this position, however, as there are currently no final or temporary regulations regarding the application of the PFIC provisions to an insurance company. The IRS recently issued proposed regulations intended to clarify the application of the PFIC provisions to an insurance company. These proposed regulations provide that a non-U.S. insurance company may only qualify for an exception to the PFIC rules if, among other things, the non-U.S. insurance company’s officers and employees perform its substantial managerial and operational activities. This proposed regulation will not be effective until adopted in final form. Because of the legal uncertainties relating to how the proposed regulations will be interpreted and the form in which such regulations may be finalized, or whether any legislation will be proposed to limit the insurance company exception, the Company cannot predict what impact, if any, such guidance or legislation would have on an investor that is subject to U.S. federal income tax. Prospective investors should consult their tax advisor as to the effects of the PFIC rules.
Foreign tax credit.
If U.S. Persons own a majority of AGL's common shares, only a portion of the current income inclusions, if any, under the CFC, RPII and PFIC rules and of dividends paid by AGL (including any gain from the sale of common shares that is treated as a dividend under section 1248 of the Code) will be treated as foreign source income for purposes of computing a shareholder's U.S. foreign tax credit limitations. The Company will consider providing shareholders with information regarding the portion of such amounts constituting foreign source income to the extent such information is reasonably available. It is also likely that substantially all of the "subpart F income," RPII and dividends that are foreign source income will constitute either "passive" or "general" income. Thus, it may not be possible for most shareholders to utilize excess foreign tax credits to reduce U.S. tax on such income.
Information Reporting and Backup Withholding on Distributions and Disposition Proceeds.
Information returns may be filed with the IRS in connection with distributions on AGL's common shares and the proceeds from a sale or other disposition of AGL's common shares unless the holder of AGL's common shares establishes an exemption from the information reporting rules. A holder of common shares that does not establish such an exemption may be subject to U.S. backup withholding tax on these payments if the holder is not a corporation or non-U.S. Person or fails to provide its taxpayer identification number or otherwise comply with the backup withholding rules. The amount of any backup withholding from a payment to a U.S. Person will be allowed as a credit against the U.S. Person's U.S. federal income tax liability and may entitle the U.S. Person to a refund, provided that the required information is furnished to the IRS.
Changes in U.S. Federal Income Tax Law Could Materially Adversely Affect AGL or AGL's Shareholders.
Legislation has been introduced from time to time in the U.S. Congress intended to eliminate certain perceived tax advantages of companies (including insurance companies) that have legal domiciles outside the U.S. but have certain U.S. connections. It is possible that legislation could be introduced in and enacted by the current Congress or future Congress that could have an adverse impact on AGL or AGL's shareholders. For example, legislation has been introduced in Congress to limit the deductibility of reinsurance premiums paid by U.S. companies to foreign affiliates. Further, legislation based on the Tax Reform Task-Force Blueprint dated June 24, 2016, which recommends moving to a cash flow consumption-based tax system and provides for border adjustments taxing imports may be introduced and enacted and its impact on the insurance industry may adversely impact the results of our operations.
Additionally, tax laws and interpretations regarding whether a company is engaged in a U.S. trade or business or whether a company is a CFC or a PFIC or has RPII are subject to change, possibly on a retroactive basis. There are currently only recently proposed regulations regarding the application of the PFIC rules to an insurance company. Additionally, the regulations regarding RPII have been in proposed form since 1991. New regulations or pronouncements interpreting or clarifying such rules may be forthcoming. The Company cannot be certain if, when or in what form such regulations or pronouncements may be provided and whether such guidance will have a retroactive effect.
United Kingdom
The following discussion is intended to be only a general guide to certain U.K. tax consequences of holding AGL common shares, under current law and the current practice of HMRC, either of which is subject to change at any time, possibly with retrospective effect. Except where otherwise stated, this discussion applies only to shareholders who are not (and have not recently been) resident or (in the case of individuals) domiciled for tax purposes in the U.K., who hold their AGL common shares as an investment and who are the absolute beneficial owners of their common shares. This discussion may not apply to certain shareholders, such as dealers in securities, life insurance companies, collective investment schemes, shareholders who are exempt from tax and shareholders who have (or are deemed to have) acquired their shares by virtue of an office or employment. Such shareholders may be subject to special rules.
40
The following statements do not purport to be a comprehensive description of all the U.K. considerations that may be relevant to any particular shareholder. Any person who is in any doubt as to their tax position should consult an appropriate professional tax adviser.
AGL's Tax Residency.
AGL is not incorporated in the U.K., but effective November 6, 2013, the AGL Board manages its affairs with the intent to maintain its status as a company that is tax resident in the U.K.
Dividends.
Under current U.K. tax law, AGL is not required to withhold tax at source from dividends paid to the holders of the AGL common shares.
Capital gains.
U.K. tax is not normally charged on any capital gains realized by non-U.K. shareholders in AGL unless, in the case of a corporate shareholder, at or before the time the gain accrues, the shareholding is used in or for the purposes of a trade carried on by the non-resident shareholder through a permanent establishment in the U.K. or for the purposes of that permanent establishment. Similarly, an individual shareholder who carries on a trade, profession or vocation in the U.K. through a branch or agency may be liable for U.K. tax on the gain if such shareholder disposes of shares that are, or have been, used, held or acquired for the purposes of such trade, profession or vocation or for the purposes of such branch or agency. This treatment applies regardless of the U.K. tax residence status of AGL.
Stamp Taxes.
On the basis that AGL does not currently intend to maintain a share register in the U.K., there should be no U.K. stamp duty reserve tax on a purchase of common shares in AGL. A conveyance or transfer on sale of common shares in AGL will not be subject to U.K. stamp duty, provided that the instrument of transfer is not executed in the U.K. and does not relate to any property situated, or any matter or thing done, or to be done, in the U.K.
Description of Share Capital
The following summary of AGL's share capital is qualified in its entirety by the provisions of Bermuda law, AGL's memorandum of association and its Bye-Laws, copies of which are incorporated by reference as exhibits to this Annual Report on Form 10-K.
AGL's authorized share capital of $5,000,000 is divided into 500,000,000 shares, par value U.S. $0.01 per share, of which
124,958,756
common shares were issued and outstanding as of February 21, 2017. Except as described below, AGL's common shares have no pre-emptive rights or other rights to subscribe for additional common shares, no rights of redemption, conversion or exchange and no sinking fund rights. In the event of liquidation, dissolution or winding-up, the holders of AGL's common shares are entitled to share equally, in proportion to the number of common shares held by such holder, in AGL's assets, if any remain after the payment of all AGL's debts and liabilities and the liquidation preference of any outstanding preferred shares. Under certain circumstances, AGL has the right to purchase all or a portion of the shares held by a shareholder. See "—Acquisition of Common Shares by AGL" below.
Voting Rights and Adjustments
In general, and except as provided below, shareholders have one vote for each common share held by them and are entitled to vote with respect to their fully paid shares at all meetings of shareholders. However, if, and so long as, the common shares (and other of AGL's shares) of a shareholder are treated as "controlled shares" (as determined pursuant to section 958 of the Code) of any U.S. Person and such controlled shares constitute 9.5% or more of the votes conferred by AGL's issued and outstanding shares, the voting rights with respect to the controlled shares owned by such U.S. Person shall be limited, in the aggregate, to a voting power of less than 9.5% of the voting power of all issued and outstanding shares, under a formula specified in AGL's Bye-laws. The formula is applied repeatedly until there is no U.S. Person whose controlled shares constitute 9.5% or more of the voting power of all issued and outstanding shares and who generally would be required to recognize income with respect to AGL under the Code if AGL were a CFC as defined in the Code and if the ownership threshold under the Code were 9.5% (as defined in AGL's Bye-Laws as a 9.5% U.S. Shareholder). In addition, AGL's Board may determine that shares held carry different voting rights when it deems it appropriate to do so to (i) avoid the existence of any 9.5% U.S. Shareholder; and (ii) avoid adverse tax, legal or regulatory consequences to AGL or any of its subsidiaries or any direct or indirect holder of shares or its affiliates. "Controlled shares" includes, among other things, all shares of AGL that such U.S. Person is deemed to own directly, indirectly or constructively (within the meaning of section 958 of the Code). Further, these provisions do not apply in the event one shareholder owns greater than 75% of the voting power of all issued and outstanding shares.
Under these provisions, certain shareholders may have their voting rights limited to less than one vote per share, while other shareholders may have voting rights in excess of one vote per share. Moreover, these provisions could have the effect of
41
reducing the votes of certain shareholders who would not otherwise be subject to the 9.5% limitation by virtue of their direct share ownership. AGL's Bye-laws provide that it will use its best efforts to notify shareholders of their voting interests prior to any vote to be taken by them.
AGL's Board is authorized to require any shareholder to provide information for purposes of determining whether any holder's voting rights are to be adjusted, which may be information on beneficial share ownership, the names of persons having beneficial ownership of the shareholder's shares, relationships with other shareholders or any other facts AGL's Board may deem relevant. If any holder fails to respond to this request or submits incomplete or inaccurate information, AGL's Board may eliminate the shareholder's voting rights. All information provided by the shareholder will be treated by AGL as confidential information and shall be used by AGL solely for the purpose of establishing whether any 9.5% U.S. Shareholder exists and applying the adjustments to voting power (except as otherwise required by applicable law or regulation).
Restrictions on Transfer of Common Shares
AGL's Board may decline to register a transfer of any common shares under certain circumstances, including if they have reason to believe that any adverse tax, regulatory or legal consequences to the Company, any of its subsidiaries or any of its shareholders or indirect holders of shares or its Affiliates may occur as a result of such transfer (other than such as AGL's Board considers
de minimis
). Transfers must be by instrument unless otherwise permitted by the Companies Act.
The restrictions on transfer and voting restrictions described above may have the effect of delaying, deferring or preventing a change in control of Assured Guaranty.
Acquisition of Common Shares by AGL
Under AGL's Bye-Laws and subject to Bermuda law, if AGL's Board determines that any ownership of AGL's shares may result in adverse tax, legal or regulatory consequences to AGL, any of AGL's subsidiaries or any of AGL's shareholders or indirect holders of shares or its Affiliates (other than such as AGL's Board considers
de minimis
), AGL has the option, but not the obligation, to require such shareholder to sell to AGL or to a third party to whom AGL assigns the repurchase right the minimum number of common shares necessary to avoid or cure any such adverse consequences at a price determined in the discretion of the Board to represent the shares' fair market value (as defined in AGL's Bye-Laws).
Other Provisions of AGL's Bye-Laws
AGL's Board and Corporate Action
AGL's Bye-Laws provide that AGL's Board shall consist of not less than three and not more than 21 directors, the exact number as determined by the Board. AGL's Board consists of ten persons who are elected for annual terms.
Shareholders may only remove a director for cause (as defined in AGL's Bye-Laws) at a general meeting, provided that the notice of any such meeting convened for the purpose of removing a director shall contain a statement of the intention to do so and shall be provided to that director at least two weeks before the meeting. Vacancies on the Board can be filled by the Board if the vacancy occurs in those events set out in AGL's Bye-Laws as a result of death, disability, disqualification or resignation of a director, or from an increase in the size of the Board.
Generally under AGL's Bye-Laws, the affirmative votes of a majority of the votes cast at any meeting at which a quorum is present is required to authorize a resolution put to vote at a meeting of the Board, including one relating to a merger, acquisition or business combination. Corporate action may also be taken by a unanimous written resolution of the Board without a meeting. A quorum shall be at least one-half of directors then in office present in person or represented by a duly authorized representative, provided that at least two directors are present in person.
Shareholder Action
At the commencement of any general meeting, two or more persons present in person and representing, in person or by proxy, more than 50% of the issued and outstanding shares entitled to vote at the meeting shall constitute a quorum for the transaction of business. In general, any questions proposed for the consideration of the shareholders at any general meeting shall be decided by the affirmative votes of a majority of the votes cast in accordance with the Bye-Laws.
The Bye-Laws contain advance notice requirements for shareholder proposals and nominations for directors, including when proposals and nominations must be received and the information to be included.
42
Amendment
The Bye-Laws may be amended only by a resolution adopted by the Board and by resolution of the shareholders.
Voting of Non-U.S. Subsidiary Shares
If AGL is required or entitled to vote at a general meeting of any of AG Re, AGFOL or any other of its directly held non-U.S. subsidiaries, AGL's Board shall refer the subject matter of the vote to AGL's shareholders and seek direction from such shareholders as to how they should vote on the resolution proposed by the non-U.S. subsidiary. AGL's Board in its discretion shall require substantially similar provisions are or will be contained in the bye-laws (or equivalent governing documents) of any direct or indirect non-U.S. subsidiaries other than U.K. and AGRO.
Employees
As of
December 31, 2016
, the Company had approximately 300 employees. None of the Company's employees are subject to collective bargaining agreements. The Company believes that employee relations are satisfactory.
Available Information
The Company maintains an Internet web site at
www.assuredguaranty.com
. The Company makes available, free of charge, on its web site (under
assuredguaranty.com/sec-filings
) the Company's annual report on Form 10-K, quarterly reports on Form 10-Q, current reports on Form 8-K, and amendments to those reports filed or furnished pursuant to Section 13 (a) or 15 (d) of the Exchange Act as soon as reasonably practicable after the Company files such material with, or furnishes it to, the SEC. The Company also makes available, free of charge, through its web site (under
assuredguaranty.com/governance
) links to the Company's Corporate Governance Guidelines, its Code of Conduct, AGL's Bye-Laws and the charters for its Board committees.
The Company routinely posts important information for investors on its web site (under
assuredguaranty.com/company-statements
and, more generally, under the Investor Information and Businesses pages). The Company uses this web site as a means of disclosing material information and for complying with its disclosure obligations under SEC Regulation FD (Fair Disclosure). Accordingly, investors should monitor the Company Statements, Investor Information and Businesses portions of the Company's web site, in addition to following the Company's press releases, SEC filings, public conference calls, presentations and webcasts.
The information contained on, or that may be accessed through, the Company's web site is not incorporated by reference into, and is not a part of, this report.
43
|
ITEM 1A.
|
RISK FACTORS
|
You should carefully consider the following information, together with the information contained in AGL's other filings with the SEC. The risks and uncertainties discussed below are not the only ones the Company faces. However, these are the risks that the Company's management believes are material. The Company may face additional risks or uncertainties that are not presently known to the Company or that management currently deems immaterial, and such risks or uncertainties also may impair its business or results of operations. The risks discussed below could result in a significant or material adverse effect on the Company's financial condition, results of operations, liquidity or business prospects.
Risks Related to the Company's Expected Losses
Estimates of expected losses are subject to uncertainties and may not be adequate to cover potential paid claims.
The financial guaranties issued by the Company's insurance subsidiaries insure the credit performance of the guaranteed obligations over an extended period of time, in some cases over 30 years, and in most circumstances, the Company has no right to cancel such financial guaranties. As a result, the Company's estimate of ultimate losses on a policy is subject to significant uncertainty over the life of the insured transaction. Credit performance can be adversely affected by economic, fiscal and financial market variability over the long duration of most contracts. If the Company's actual losses exceed its current estimate, this may result in adverse effects on the Company's financial condition, results of operations, liquidity, business prospects, financial strength ratings and ability to raise additional capital.
The determination of expected loss is an inherently subjective process involving numerous estimates, assumptions and judgments by management, using both internal and external data sources with regard to frequency, severity of loss, economic projections, governmental actions, negotiations and other factors that affect credit performance. The Company does not use traditional actuarial approaches to determine its estimates of expected losses. Actual losses will ultimately depend on future events or transaction performance. As a result, the Company's current estimates of probable and estimable losses may not reflect the Company's future ultimate claims paid.
Certain sectors and large risks within the Company's insured portfolio have experienced credit deterioration in excess of the Company’s initial expectations, which has led or may lead to losses in excess of the Company’s initial expectations. The Company's expected loss models take into account current and expected future trends, which contemplate the impact of current and probable developments in the performance of the credit. These factors, which are integral elements of the Company's reserve estimation methodology, are updated on a quarterly basis based on current information. Because such information changes, sometimes materially, from quarter to quarter, the Company’s projection of losses may also change materially. Since the financial crisis, much of the development in the Company’s loss projections was with respect to insured U.S. RMBS securities. While the Company's net par outstanding of U.S. RMBS rated BIG under the Company's rating methodology as of
December 31, 2016
and
December 31, 2015
was still
$3.2 billion
and
$4.0 billion
, respectively, and may still be a source of loss development, the Company believes the performance of this portfolio has stabilized. More recently, there has been credit deterioration with respect to certain insured Puerto Rico credits. The Company had net par outstanding to general obligation bonds of the Commonwealth of Puerto Rico and various obligations of its related authorities and public corporations aggregating to
$4.8 billion
and
$5.1 billion
, respectively, as of
December 31, 2016
and
December 31, 2015
, all of which was rated BIG under the Company’s rating methodology as of December 31, 2016. For a discussion of the Company's Puerto Rico risks and RMBS transactions, see Part II, Item 8, Financial Statements and Supplementary Data, Note 4, Outstanding Exposure.
Risks Related to the Company's Financial Strength and Financial Enhancement Ratings
A downgrade of the financial strength or financial enhancement ratings of any of the Company's insurance and reinsurance subsidiaries would adversely affect its business and prospects and, consequently, its results of operations and financial condition.
The financial strength and financial enhancement ratings assigned by S&P, Moody's, KBRA and Best to AGL's insurance and reinsurance subsidiaries represent the rating agencies' opinions of the insurer's financial strength and ability to meet ongoing obligations to policyholders and cedants in accordance with the terms of the financial guaranties it has issued or the reinsurance agreements it has executed. The ratings also reflect qualitative factors, such as the rating agencies' opinion of an insurer's business strategy and franchise value, the anticipated future demand for its product, the composition of its insured portfolio, and its capital adequacy, profitability and financial flexibility. Issuers, investors, underwriters, ceding companies and others consider the Company's financial strength or financial enhancement ratings an important factor when deciding whether or not to utilize a financial guaranty or purchase reinsurance from one of the insurance or reinsurance subsidiaries. A downgrade by a rating agency of the financial strength or financial enhancement ratings of one or more of AGL's subsidiaries
44
could impair the Company's financial condition, results of operation, liquidity, business prospects or other aspects of the Company's business.
The ratings assigned by the rating agencies that publish financial strength or financial enhancement ratings on AGL's insurance subsidiaries are subject to frequent review and may be lowered by a rating agency as a result of a number of factors, including, but not limited to, the rating agency's revised stress loss estimates for the Company's insurance portfolio, adverse developments in the Company's or the subsidiary's financial conditions or results of operations due to underwriting or investment losses or other factors, changes in the rating agency's outlook for the financial guaranty industry or in the markets in which the Company operates, or a revision in the rating agency's capital model or ratings methodology. Their reviews can occur at any time and without notice to the Company and could result in a decision to downgrade, revise or withdraw the financial strength or financial enhancement ratings of AGL's insurance and reinsurance subsidiaries. For example, while all of the rating agencies that rate AGL subsidiaries with exposure to Puerto Rico have indicated that their evaluations of such AGL subsidiaries already take into account stress scenarios related to developments in Puerto Rico, actual developments in Puerto Rico beyond what a rating agency considered could cause that rating agency to review its ratings of such AGL subsidiaries.
Since 2008, each of S&P and Moody's has reviewed and downgraded the financial strength ratings of AGL's insurance and reinsurance subsidiaries, including AGC, AGM and AG Re. In addition, S&P and Moody's have from time to time changed the ratings outlook for certain of the Company's subsidiaries to "negative" from "stable" or have placed such ratings on watch for possible downgrade. Currently, AGM, AGC, MAC and AG Re all have AA (Stable Outlook) financial strength ratings from S&P, with the most recent change by S&P being an upgrade of AGC, AGM and AG Re from AA- (Stable Outlook) in November 2011. Each of AGM and MAC also has a AA+ (Stable Outlook) and AGC also has a AA (Stable Outlook) financial strength rating from KBRA, while AGM and AGC have financial strength ratings in the single-A category from Moody's (A2 (Stable Outlook) and A3 (Stable Outlook), respectively), with the most recent ratings change by Moody's being a change in the outlook of AGC to Stable in August 2016. In addition, AGRO has been assigned a rating of A+ (Stable) from Best, which is Best's second highest rating. The Company periodically assesses the value of each rating assigned to each of its companies, and may as a result of such assessment request that a rating agency add or drop a rating from certain of its companies. For example, the KBRA ratings were first assigned to MAC in 2013 and to AGM in 2014 and the Best rating was first assigned to AGRO in 2015, while a Moody's rating was never requested for MAC and was dropped from AG Re and AGRO in 2015. On January 13, 2017, AGC announced that it had requested that Moody's withdraw its financial strength rating of AGC.
The Company believes that the uncertainty introduced by S&P and Moody's various actions and proposals have reduced the Company's new business opportunities and have also affected the value of the Company's product to issuers and investors. The insurance subsidiaries' financial strength ratings are an important competitive factor in the financial guaranty insurance and reinsurance markets. If the financial strength or financial enhancement ratings of one or more of the Company's insurance subsidiaries were reduced below current levels, the Company expects that would reduce the number of transactions that would benefit from the Company's insurance; consequently, a downgrade by rating agencies could harm the Company's new business production, results of operations and financial condition.
In addition, a downgrade may have a negative impact on the Company in respect of transactions that it has insured or reinsurance that it has assumed. For example, a downgrade of one of the Company's insurance subsidiaries may result in increased claims under financial guaranties such subsidiary has issued. Under variable rate demand obligations insured by AGM, further downgrades past rating levels specified in the transaction documents could result in the municipal obligor paying a higher rate of interest and in such obligations amortizing on a more accelerated basis than expected when the obligations originally were issued; if the municipal obligor is unable to make such interest or principal payments, AGM may receive a claim under its financial guaranty. Under interest rate swaps insured by AGM, further downgrades past specified rating levels could entitle the municipal obligor's swap counterparty to terminate the swap; if the municipal obligor owed a termination payment as a result and were unable to make such payment, AGM may receive a claim if its financial guaranty guaranteed such termination payment. For more information about increased claim payments the Company may potentially make, see Part II, Item 8, Financial Statements and Supplementary Data, Note 6, Contracts Accounted for as Insurance, Ratings Impact on Financial Guaranty Business. In certain other transactions, beneficiaries of financial guaranties issued by the Company's insurance subsidiaries may have the right to cancel the credit protection offered by the Company, which would result in the loss of future premium earnings and the reversal of any fair value gains recorded by the Company. In addition, a downgrade of AG Re or AGC could result in certain ceding companies recapturing business that they had ceded to these reinsurers. See "The downgrade of the financial strength ratings of AG Re or of AGC gives certain reinsurance counterparties the right to recapture ceded business, which would lead to a reduction in the Company's unearned premium reserve and related earnings on such reserve" below.
If AGM's financial strength or financial enhancement ratings were downgraded, AGM-insured GICs issued by the former AGMH subsidiaries that conducted AGMH's Financial Products Business (the Financial Products Companies) may
45
come due or may come due absent the posting of collateral by the GIC issuers. The Company relies on agreements pursuant to which Dexia has agreed to guarantee or lend certain amounts, or to post liquid collateral, in regards to AGMH's former financial products business. See "Risks Related to the Company's Business, Acquisitions may subject the Company to non-monetary consequences."
Furthermore, if the financial strength ratings of AGE or AGUK were downgraded, AGM or AGC may be required to contribute additional capital to their respective subsidiary pursuant to the terms of the support arrangements for such subsidiaries, including those described in "Item 1. Business, Regulation, United Kingdom, Material Contracts."
The downgrade of the financial strength ratings of AG Re or of AGC gives certain reinsurance counterparties the right to recapture ceded business, which would lead to a reduction in the Company's unearned premium reserve and related earnings on such reserve.
The downgrade of the financial strength ratings of AG Re or of AGC gives certain reinsurance counterparties the right to recapture ceded business, which would lead to a reduction in the Company's unearned premium reserve and related earnings on such reserve. With respect to a significant portion of the Company's in-force financial guaranty assumed business, based on AG Re's and AGC's current ratings and subject to the terms of each reinsurance agreement, the third party ceding company may have the right to recapture assumed business ceded to AG Re and/or AGC, and in connection therewith, to receive payment from the assuming reinsurer of an amount equal to the reinsurer’s statutory unearned premium (net of ceding commissions) and statutory loss reserves (if any) associated with that business, plus, in certain cases, an additional ceding commission. As of
December 31, 2016
, if each third party company ceding business to AG Re and/or AGC had a right to recapture such business, and chose to exercise such right, the aggregate amounts that AG Re and AGC could be required to pay to all such companies would be approximately
$45 million
and
$18 million
, respectively.
Actions taken by the rating agencies with respect to capital models and rating methodology of the Company's business or changes in capital charges or downgrades of transactions within its insured portfolio may adversely affect its ratings, business prospects, results of operations and financial condition.
The rating agencies from time to time have evaluated the Company's capital adequacy under a variety of scenarios and assumptions. The rating agencies do not always supply clear guidance on their approach to assessing the Company's capital adequacy and the Company may disagree with the rating agencies' approach and assumptions. For example, S&P assesses each individual credit (including potential new credits) insured by the Company based on a variety of factors, including the nature of the credit, the nature of the support or credit enhancement for the credit, its tenor, and its expected and actual performance. This assessment determines the amount of capital the Company is required to maintain against that credit to maintain its financial strength ratings under S&P's capital adequacy model. Sometimes the rating agencies consider the amount of additional capital that could be required for certain risks or sectors under certain stress scenarios based on their views of developments in the market, as each have done recently with respect to the Company's exposures to Puerto Rico. Factors influencing the rating agencies are beyond management's control and not always known to the Company. In the event of an actual or perceived deterioration in creditworthiness, or a change in a rating agency's capital model or rating methodology, that rating agency may require the Company to increase the amount of capital allocated to support the affected credits, regardless of whether losses actually occur, or against potential new business. Significant reductions in the rating agencies' assessments of credits in the Company's insured portfolio can produce significant increases in the amount of capital required for the Company to maintain its financial strength ratings under the rating agencies' capital adequacy models, which may require the Company to seek additional capital. The amount of such capital required may be substantial, and may not be available to the Company on favorable terms and conditions or at all. Accordingly, the Company cannot ensure that it will seek to, or be able to, raise additional capital. The failure to raise additional required capital could result in a downgrade of the Company's ratings and thus have an adverse impact on its business, results of operations and financial condition. See "Risks Related to the Company's Capital and Liquidity Requirements—The Company may require additional capital from time to time, including from soft capital and liquidity credit facilities, which may not be available or may be available only on unfavorable terms."
Risks Related to the Financial, Credit and Financial Guaranty Markets
The Company's business, liquidity, financial condition and stock price may be adversely affected by developments in the U.S. and world-wide financial markets.
The Company's loss reserves, profitability, financial position, insured portfolio, investment portfolio, cash flow, statutory capital and stock price could be materially affected by the U.S. and global financial markets. Upheavals in the financial markets affect economic activity and employment and therefore can affect the Company's business. The global economic outlook remains uncertain, including the overall growth rate of the U.S. economy, the fragile economic recovery in
46
Europe and the impact of recent political trends on the global economic order. These and other risks could materially and negatively affect the Company’s ability to access the capital markets, the cost of the Company's debt, the demand for its products, the amount of losses incurred on transactions it guarantees, the value of its investment portfolio (including its alternative investments), its financial ratings and the price of its common shares.
Some of the state and local governments and entities that issue obligations the Company insures are experiencing significant budget deficits and pension funding and revenue shortfalls that could result in increased credit losses or impairments and capital charges on those obligations.
Some of the state and local governments that issue the obligations the Company insures have experienced significant budget deficits and pension funding and revenue collection shortfalls that required them to significantly raise taxes and/or cut spending in order to satisfy their obligations. While the U.S. government has provided some financial support and although overall state revenues have increased in recent years, significant budgetary pressures remain, especially at the local government level and in relation to retirement obligations. Certain local governments, including ones that have issued obligations insured by the Company, have sought protection from creditors under chapter 9 of the U.S. Bankruptcy Code as a means of restructuring their outstanding debt. In some recent instances where local governments were seeking to restructure their outstanding debt, and partially in response to concerns that materially reducing pension payments would lead to employee flight and, therefore, an inadequate level of local government services, pension and other obligations owed to workers were treated more favorably than senior bond debt owed to the capital markets. If the issuers of the obligations in the Company's public finance portfolio do not have sufficient funds to cover their expenses and are unable or unwilling to raise taxes, decrease spending or receive federal assistance, the Company may experience increased levels of losses or impairments on its public finance obligations, which could materially and adversely affect its business, financial condition and results of operations. If such issuers succeed in restructuring pension and other obligations owed to workers so that they are treated more favorably than obligations insured by the Company, such losses or impairments could be greater than the Company otherwise anticipated when the insurance was written.
The Company's risk of loss on and capital charges for municipal credits could also be exacerbated by rating agency downgrades of municipal credit ratings. A downgraded municipal issuer may be unable to refinance maturing obligations or issue new debt, which could reduce the municipality's ability to service its debt. Downgrades could also affect the interest rate that the municipality must pay on its variable rate debt or for new debt issuance. Municipal credit downgrades, as with other downgrades, result in an increase in the capital charges the rating agencies assess when evaluating the Company's capital adequacy in their rating models. Significant municipal downgrades could result in higher capital requirements for the Company in order to maintain its financial strength ratings.
The Company has an aggregate
$4.8 billion
net par exposure as of
December 31, 2016
to the Commonwealth of Puerto Rico (Puerto Rico or the Commonwealth) and various obligations of its related authorities and public corporations, and claim payments on such insured exposures in excess of that expected by the Company could have a negative effect on the Company's liquidity and results of operations. On January 1, 2016, Puerto Rico Infrastructure Finance Authority (PRIFA) defaulted on payment of a portion of the interest due on its bonds on that date. There have been additional payment defaults by Puerto Rico issuers since then, and the Company has made claim payments with respect to several Puerto Rico credits. On April 6, 2016, Governor García Padilla of Puerto Rico (the Former Governor) signed into law the Puerto Rico Emergency Moratorium & Financial Rehabilitation Act (the Moratorium Act). The Moratorium Act purportedly empowers the governor to declare, entity by entity, states of emergencies and moratoriums on debt service payments on obligations of the Commonwealth and its related authorities and public corporations, as well as instituting a stay against related litigation, among other things. The Former Governor used the authority of the Moratorium Act to take a number of actions related to issuers of obligations the Company insures. On June 30, 2016, the Puerto Rico Oversight, Management, and Economic Stability Act (PROMESA) was signed into law by the President of the United States. PROMESA establishes a seven-member federal financial oversight board (Oversight Board) with authority to require that balanced budgets and fiscal plans be adopted and implemented by Puerto Rico. PROMESA provides a legal framework under which the debt of the Commonwealth and its related authorities and public corporations may be voluntarily restructured, and grants the Oversight Board the sole authority to file restructuring petitions in a federal court to restructure the debt of the Commonwealth and its related authorities and public corporations if voluntary negotiations fail, provided that any such restructuring must be in accordance with an Oversight Board approved fiscal plan that respects the liens and priorities provided under Puerto Rico law.
The Oversight Board has begun meeting and has hired Ramón Ruiz-Comas as interim executive director. On January 2, 2017, Ricardo Antonio Rosselló Nevares (the Governor) took office, replacing the Former Governor. On January 29, 2017, the Governor signed the Puerto Rico Emergency and Fiscal Responsibility Act (Emergency Act) that, among other things, repeals portions of the Moratorium Act, defines an emergency period until May 1, 2017, continues diversion of collateral away from bonds the Company insures, and defines the powers and duties of the Fiscal Agency and Financial Advisory Authority (FAFAA). The final shape, timing and validity of responses to Puerto Rico’s distress eventually enacted or implemented under the auspices of PROMESA and the Oversight Board or
47
otherwise, and the impact of any such responses on obligations insured by the Company, is uncertain.
Additional information about the Company's exposure to Puerto Rico may be found in Part II, Item 8, Financial Statements and Supplementary Data, Note 4, Outstanding Exposure, Exposure to Puerto Rico.
In addition, obligations supported by specified revenue streams, such as revenue bonds issued by toll road authorities, municipal utilities or airport authorities, may be adversely affected by revenue declines resulting from reduced demand, changing demographics or other factors associated with an economy in which unemployment remains high, housing prices have not yet stabilized and growth is slow. These obligations, which may not necessarily benefit from financial support from other tax revenues or governmental authorities, may also experience increased losses if the revenue streams are insufficient to pay scheduled interest and principal payments.
Persistently low interest rate levels and credit spreads could adversely affect demand for financial guaranty insurance as well as the Company's financial condition.
Demand for financial guaranty insurance generally fluctuates with changes in market credit spreads. Credit spreads, which are based on the difference between interest rates on high-quality or "risk free" securities versus those on lower-rated or uninsured securities, fluctuate due to a number of factors and are sensitive to the absolute level of interest rates, current credit experience and investors' risk appetite. Average municipal interest rates were extremely low during 2016, with the benchmark AAA 30-year Municipal Market Data index published by Thomson Reuters (MMD Index), at times below 2%, a threshold not previously crossed in the modern era. When interest rates are low, or when the market is relatively less risk averse, the credit spread between high-quality or insured obligations versus lower- rated or uninsured obligations typically narrows. As a result, financial guaranty insurance typically provides lower interest cost savings to issuers than it would during periods of relatively wider credit spreads. When issuers are less likely to use financial guaranties on their new issues when credit spreads are narrow, this results in decreased demand or premiums obtainable for financial guaranty insurance, and a resulting reduction in the Company's results of operations. The continued persistence of low interest rate levels and credit spreads could continue to dampen demand for financial guaranty insurance.
Conversely, in a deteriorating credit environment, credit spreads increase and become "wide", which increases the interest cost savings that financial guaranty insurance may provide and can result in increased demand for financial guaranties by issuers. However, if the weakening credit environment is associated with economic deterioration, the Company's insured portfolio could generate claims and loss payments in excess of normal or historical expectations. In addition, increases in market interest rate levels could reduce new capital markets issuances and, correspondingly, a decreased volume of insured transactions.
Competition in the Company's industry may adversely affect its revenues.
As described in greater detail under "Competition" in "Item 1. Business," the Company can face competition, either in the form of current or new providers of credit enhancement or in terms of alternative structures, including uninsured offerings, or pricing competition. Increased competition could have an adverse effect on the Company's insurance business.
The Company's financial position, results of operations and cash flows may be adversely affected by fluctuations in foreign exchange rates.
The Company's reporting currency is the U.S. dollar. The functional currencies of AGL's primary insurance and reinsurance subsidiaries are the U.S. dollar and pound sterling. Exchange rate fluctuations may materially impact the Company's financial position, results of operations and cash flows. The Company's non-U.S. subsidiaries maintain both assets and liabilities in currencies different from their functional currency, which exposes the Company to changes in currency exchange rates. In addition, locally-required capital levels are invested in local currencies in order to satisfy regulatory requirements and to support local insurance operations regardless of currency fluctuations.
The principal currencies creating foreign exchange risk are the British pound sterling and the European Union euro. The Company cannot accurately predict the nature or extent of future exchange rate variability between these currencies or relative to the U.S. dollar. Foreign exchange rates are sensitive to factors beyond the Company's control. The Company does not engage in active management, or hedging, of its foreign exchange rate risk. Therefore, fluctuation in exchange rates between these currencies and the U.S. dollar could adversely impact the Company's financial position, results of operations and cash flows.
48
The Company's international operations expose it to less predictable credit and legal risks.
The Company pursues new business opportunities in international markets. The underwriting of obligations of an issuer in a foreign country involves the same process as that for a domestic issuer, but additional risks must be addressed, such as the evaluation of foreign currency exchange rates, foreign business and legal issues, and the economic and political environment of the foreign country or countries in which an issuer does business. Changes in such factors could impede the Company's ability to insure, or increase the risk of loss from insuring, obligations in the countries in which it currently does business and limit its ability to pursue business opportunities in other countries.
The Company's investment portfolio may be adversely affected by credit, interest rate and other market changes.
The Company's operating results are affected, in part, by the performance of its investment portfolio which consists primarily of fixed-income securities and short-term investments. As of
December 31, 2016
, the fixed-maturity securities and short-term investments had a fair value of approximately
$10.8 billion
. Credit losses and changes in interest rates could have an adverse effect on its shareholders' equity and net income. Credit losses result in realized losses on the Company's investment portfolio, which reduce net income and shareholders' equity. Changes in interest rates can affect both shareholders' equity and investment income. For example, if interest rates decline, funds reinvested will earn less than expected, reducing the Company's future investment income compared to the amount it would earn if interest rates had not declined. However, the value of the Company's fixed-rate investments would generally increase if interest rates decreased, resulting in an unrealized gain on investments included in shareholders' equity. Conversely, if interest rates increase, the value of the investment portfolio will be reduced, resulting in unrealized losses that the Company is required to include in shareholders' equity as a change in accumulated other comprehensive income. Accordingly, interest rate increases could reduce the Company's shareholders' equity.
Interest rates are highly sensitive to many factors, including monetary policies, domestic and international economic and political conditions and other factors beyond the Company's control. The Company does not engage in active management, or hedging, of interest rate risk, and may not be able to mitigate interest rate sensitivity effectively.
The market value of the investment portfolio also may be adversely affected by general developments in the capital markets, including decreased market liquidity for investment assets, market perception of increased credit risk with respect to the types of securities held in the portfolio, downgrades of credit ratings of issuers of investment assets and/or foreign exchange movements impacting investment assets. In addition, the Company invests in securities insured by other financial guarantors, the market value of which may be affected by the rating instability of the relevant financial guarantor.
The Company also invests a portion of its excess capital in alternative investments, which also may be affected by credit, interest rate and other market changes as well as factors specific to those investments. See "Risks Related to the Company's Business - Alternative investments may not result in the benefits anticipated."
‘Brexit’ may adversely impact credits insured by the Company and may also adversely impact the Company through currency exchange rates.
On June 23, 2016, a referendum was held in the U.K. in which a majority voted to exit the EU, known as “Brexit”. The U.K. government has indicated that it intends to formally serve notice to the European Council by March 2017 of its desire to withdraw in accordance with Article 50 of the Treaty on European Union. Negotiations between the U.K. and the EU will determine the future terms of the U.K’s relationship with the EU, including the terms of trade between the U.K. and the EU. Any resulting political, social and economic uncertainty and changes arising from Brexit may have a negative impact on the economies of the U.K. as well as non-U.K. EU and EEA countries, which may increase the probability of losses on obligations insured by the Company that are exposed to risks in the U.K. and non-U.K. EU and EEA countries.
Brexit may also impact currency exchange rates. The Company reports its accounts in U.S. dollars, while some of its income, expenses and assets are denominated in other currencies, primarily the pound sterling and the euro. From December 31, 2015, to December 31, 2016, which period encompasses the Brexit vote, the value of pound sterling changed from
£0.68 per dollar
to
£0.81 per dollar
, while the euro changed from
€0.83 per dollar
to
€0.95 per dollar
. For the year ended 2016 the Company recognized losses of approximately
$21 million
in the consolidated statement of operations, net of tax, and approximately
$32 million
in OCI, net of tax, for foreign currency translation, that were primarily driven by the exchange rate fluctuations of the pound sterling. If the Company had owned AGLN during 2016, these impacts would have been greater.
49
Risks Related to the Company's Capital and Liquidity Requirements
Significant claim payments may reduce the Company's liquidity.
Claim payments reduce the Company's invested assets and result in reduced liquidity and net investment income, even if the Company is reimbursed in full over time and does not experience ultimate loss on a particular policy. Since the financial crisis, many of the claims paid by the Company were with respect to insured U.S. RMBS securities. More recently, there has been credit deterioration with respect to certain insured Puerto Rico credits. The Company had net par outstanding to general obligation bonds of the Commonwealth of Puerto Rico and various obligations of its related authorities and public corporations aggregating of
$4.8 billion
and
$5.1 billion
, respectively, as of
December 31, 2016
and
December 31, 2015
, all of which was rated BIG under the Company’s rating methodology as of December 31, 2016. For a discussion of the Company's Puerto Rico risks and RMBS transactions, see Part II, Item 8, Financial Statements and Supplementary Data, Note 4, Outstanding Exposure.
As of December 31, 2016, the Company had exposure of approximately $528 million to a long-term infrastructure project that was financed by bonds that mature prior to the expiration of the project concession. The Company expects the cash flows from the project to be sufficient to repay all of the debt over the life of the project concession, and also expects the debt to be refinanced in the market at or prior to its maturity. If the issuer is unable to refinance the debt due to market conditions, the Company may have to pay claims when the debt matures from 2018 to 2022, and then recover from cash flows produced by the project in the future. The Company generally projects that in most scenarios it will be fully reimbursed for such claim payments. However, the recovery of such amounts is uncertain and may take from 10 to 35 years, depending on the performance of the underlying collateral.
The Company plans for future claim payments. If the amount of future claim payments is significantly more than projected by the Company, however, the Company's ability to make other claim payments and its financial condition, financial strength ratings and business prospects could be adversely affected.
The Company may require additional capital from time to time, including from soft capital and liquidity credit facilities, which may not be available or may be available only on unfavorable terms.
The Company's capital requirements depend on many factors, primarily related to its in-force book of business and rating agency capital requirements. The Company needs liquid assets to make claim payments on its insured portfolio and to write new business. Failure to raise additional capital as needed may result in the Company being unable to write new business and may result in the ratings of the Company and its subsidiaries being downgraded by one or more ratings agency. The Company's access to external sources of financing, as well as the cost of such financing, is dependent on various factors, including the market supply of such financing, the Company's long-term debt ratings and insurance financial strength ratings and the perceptions of its financial strength and the financial strength of its insurance subsidiaries. The Company's debt ratings are in turn influenced by numerous factors, such as financial leverage, balance sheet strength, capital structure and earnings trends. If the Company's need for capital arises because of significant losses, the occurrence of these losses may make it more difficult for the Company to raise the necessary capital.
Future capital raises for equity or equity-linked securities could also result in dilution to the Company's shareholders. In addition, some securities that the Company could issue, such as preferred stock or securities issued by the Company's operating subsidiaries, may have rights, preferences and privileges that are senior to those of its common shares.
Financial guaranty insurers and reinsurers typically rely on providers of lines of credit, credit swap facilities and similar capital support mechanisms (often referred to as "soft capital") to supplement their existing capital base, or "hard capital." The ratings of soft capital providers directly affect the level of capital credit which the rating agencies give the Company when evaluating its financial strength. The Company currently maintains soft capital facilities with providers having ratings adequate to provide the Company's desired capital credit. For example, effective January 1, 2016, AGC, AGM and MAC entered into a $360 million aggregate excess of loss reinsurance facility with a number of reinsurers, that covers certain U.S. public finance credits insured or reinsured by those companies. (For additional information, see Part II, Item 8, Financial Statements and Supplementary Data, Note 13, Reinsurance and Other Monoline Exposures). However, no assurance can be given that the Company will be able to renew any existing soft capital facilities or that one or more of the rating agencies will not downgrade or withdraw the applicable ratings of such providers in the future. In addition, the Company may not be able to replace a downgraded soft capital provider with an acceptable replacement provider for a variety of reasons, including if an acceptable replacement provider is unwilling to provide the Company with soft capital commitments or if no adequately-rated institutions are actively providing soft capital facilities. Furthermore, the rating agencies may in the future change their methodology and no longer give credit for soft capital, which may necessitate the Company having to raise additional capital in order to maintain its ratings.
50
An increase in AGL's subsidiaries' leverage ratio may prevent them from writing new insurance.
Insurance regulatory authorities impose capital requirements on AGL's insurance subsidiaries. These capital requirements, which include leverage ratios and surplus requirements, may limit the amount of insurance that the subsidiaries may write. The insurance subsidiaries have several alternatives available to control their leverage ratios, including obtaining capital contributions from the Company, purchasing reinsurance or entering into other loss mitigation agreements, or reducing the amount of new business written. However, a material reduction in the statutory capital and surplus of a subsidiary, whether resulting from underwriting or investment losses, a change in regulatory capital requirements or otherwise, or a disproportionate increase in the amount of risk in force, could increase a subsidiary's leverage ratio. This in turn could require that subsidiary to obtain reinsurance for existing business (which may not be available, or may be available on terms that the Company considers unfavorable), or add to its capital base to maintain its financial strength ratings. Failure to maintain regulatory capital levels could limit that subsidiary's ability to write new business.
The Company's holding companies' ability to meet its obligations may be constrained.
Each of AGL, AGUS and AGMH is a holding company and, as such, has no direct operations of its own. None of the holding companies expects to have any significant operations or assets other than its ownership of the shares of its subsidiaries.
The insurance company subsidiaries’ ability to pay dividends and make other payments depends, among other things, upon their financial condition, results of operations, cash requirements, and compliance with rating agency requirements, and is also subject to restrictions contained in the insurance laws and related regulations of their states of domicile. Restrictions applicable to AGM, AGC and MAC, and to AG Re and AGRO, are described under the "Regulation, United States, State Dividend Limitations" and "Regulation, Bermuda, Restrictions on Dividends and Distributions" sections of “Item 1. Business.” Such dividends and permitted payments are expected to be the primary source of funds for the holding companies to meet ongoing cash requirements, including operating expenses, any future debt service payments and other expenses, and to pay dividends to their respective shareholders. Accordingly, if the insurance subsidiaries cannot pay sufficient dividends or make other permitted payments at the times or in the amounts that are required, that would have an adverse effect on the ability of AGL, AGUS and AGMH to satisfy their ongoing cash requirements and on their ability to pay dividends to shareholders.
If AGRO were to pay dividends to its U.S. holding company parent and that U.S. holding company were to pay dividends to its Bermudian parent AG Re, such dividends would be subject to U.S. withholding tax at a rate of 30%.
The ability of AGL and its subsidiaries to meet their liquidity needs may be limited.
Each of AGL, AGUS and AGMH requires liquidity, either in the form of cash or in the ability to easily sell investment assets for cash, in order to meet its payment obligations, including, without limitation, its operating expenses, interest on debt and dividends on common shares, and to make capital investments in operating subsidiaries. The Company's operating subsidiaries require substantial liquidity in order to meet their respective payment and/or collateral posting obligations, including under financial guaranty insurance policies, CDS contracts or reinsurance agreements. They also require liquidity to pay operating expenses, reinsurance premiums, dividends to AGUS or AGMH for debt service and dividends to the Company, as well as, where appropriate, to make capital investments in their own subsidiaries. The Company cannot give any assurance that the liquidity of AGL and its subsidiaries will not be adversely affected by adverse market conditions, changes in insurance regulatory law or changes in general economic conditions.
AGL anticipates that its liquidity needs will be met by the ability of its operating subsidiaries to pay dividends or to make other payments; external financings; investment income from its invested assets; and current cash and short-term investments. The Company expects that its subsidiaries' need for liquidity will be met by the operating cash flows of such subsidiaries; external financings; investment income from their invested assets; and proceeds derived from the sale of its investment portfolio, a significant portion of which is in the form of cash or short-term investments. All of these sources of liquidity are subject to market, regulatory or other factors that may impact the Company's liquidity position at any time. As discussed above, AGL's insurance subsidiaries are subject to regulatory and rating agency restrictions limiting their ability to declare and to pay dividends and make other payments to AGL. As further noted above, external financing may or may not be available to AGL or its subsidiaries in the future on satisfactory terms.
In addition, investment income at AGL and its subsidiaries may fluctuate based on interest rates, defaults by the issuers of the securities AGL or its subsidiaries hold in their respective investment portfolios, the performance of alternative investments, or other factors that the Company does not control. Also, the value of the Company's investments may be adversely affected by changes in interest rates, credit risk and capital market conditions and therefore may adversely affect the
51
Company's potential ability to sell investments quickly and the price which the Company might receive for those investments. Alternative investments may be particularly difficult to sell at adequate prices or at all.
Risks Related to the Company's Business
The Company's financial guaranty products may subject it to significant risks from individual or correlated credits.
The Company is exposed to the risk that issuers of debt that it insures or other counterparties may default in their financial obligations, whether as a result of insolvency, lack of liquidity, operational failure or other reasons. Similarly, the Company could be exposed to corporate credit risk if a corporation's securities are contained in a portfolio of collateralized debt obligations (CDOs) it insures, or if the corporation or financial institution is the originator or servicer of loans, mortgages or other assets backing structured securities that the Company has insured.
In addition, because the Company insures or reinsures municipal bonds, it can have significant exposures to single municipal risks; see Part II, Item 7, Management's Discussion and Analysis, Insured Portfolio, for a list of the Company's largest ten municipal risks by revenue source. While the Company's risk of a complete loss, where it would have to pay the entire principal amount of an issue of bonds and interest thereon with no recovery, is generally lower for municipal bonds than for corporate bonds as most municipal bonds are backed by tax or other revenues, there can be no assurance that a single default by a municipality would not have a material adverse effect on its results of operations or financial condition.
The Company's ultimate exposure to a single name may exceed its underwriting guidelines, and an event with respect to a single name may cause a significant loss. The Company seeks to reduce this risk by managing exposure to large single risks, as well as concentrations of correlated risks, through tracking its aggregate exposure to single names in its various lines of business and establishing underwriting criteria to manage risk aggregations. It has also in the past obtained third party reinsurance for such exposure. The Company may insure and has insured individual public finance and asset-backed risks well in excess of $1 billion. Should the Company's risk assessments prove inaccurate and should the applicable limits prove inadequate, the Company could be exposed to larger than anticipated losses, and could be required by the rating agencies to hold additional capital against insured exposures whether or not downgraded by the rating agencies.
The Company is exposed to correlation risk across the various assets the Company insures. During periods of strong macroeconomic performance, stress in an individual transaction generally occurs in a single asset class or for idiosyncratic reasons. During a broad economic downturn, a wider range of the Company's insured portfolio could be exposed to stress at the same time. This stress may manifest itself in ratings downgrades, which may require more capital, or in actual losses. In addition, while the Company has experienced catastrophic events in the past without material loss, unexpected catastrophic events may have a material adverse effect upon the Company's insured portfolio and/or its investment portfolios.
Some of the Company's direct financial guaranty products may be riskier than traditional financial guaranty insurance.
As of
December 31, 2016
and
2015
, 6% and 7%, respectively, of the Company's financial guaranty direct exposures were executed as credit derivatives. Traditional financial guaranty insurance provides an unconditional and irrevocable guaranty that protects the holder of a municipal finance or structured finance obligation against non-payment of principal and interest, while credit derivatives provide protection from the occurrence of specified credit events, including non-payment of principal and interest. In general, the Company structures credit derivative transactions such that circumstances giving rise to its obligation to make payments are similar to that for financial guaranty policies and generally occur when issuers fail to make payments on the underlying reference obligations. The tenor of credit derivatives exposures, like exposure under financial guaranty insurance policies, is also generally for as long as the reference obligation remains outstanding.
Nonetheless, credit derivative transactions are governed by International Swaps and Derivatives Association, Inc. (ISDA) documentation and operate differently from financial guaranty insurance policies. For example, the Company's control rights with respect to a reference obligation under a credit derivative may be more limited than when it issues a financial guaranty insurance policy on a direct primary basis. In addition, a credit derivative may be terminated for a breach of the ISDA documentation or other specific events, unlike financial guaranty insurance policies. In addition, under a limited number of credit derivative contracts, the Company may be required to post eligible securities as collateral, generally cash or U.S. government or agency securities, under specified circumstances. The need to post collateral under many of these transactions is subject to caps that the Company has negotiated with its counterparties, but there are some transactions as to which the Company could be required to post collateral without such a cap based on movements in the mark-to-market valuation of the underlying exposure in excess of contractual thresholds. See Part II, Item 8, Financial Statements and Supplementary Data, Note 8, Contracts Accounted for as Credit Derivatives, Rating Sensitivities of Credit Derivatives Contracts.
52
Further downgrades of one or more of the Company's reinsurers could reduce the Company's capital adequacy and return on equity. The impairment of other financial institutions also could adversely affect the Company.
At
December 31, 2016
, the Company had ceded approximately
4%
of its principal amount of insurance outstanding to third party reinsurers. In evaluating the credits insured by the Company, securities rating agencies allow capital charge "credit" for reinsurance based on the reinsurers' ratings. In recent years, a number of the Company's reinsurers were downgraded by one or more rating agencies, resulting in decreases in the credit allowed for reinsurance and in the financial benefits of using reinsurance under existing rating agency capital adequacy models. Many of the Company's reinsurers have already been downgraded to single-A or below by one or more rating agencies. The Company could be required to raise additional capital to replace the lost reinsurance credit in order to satisfy rating agency and regulatory capital adequacy and single risk requirements. The rating agencies' reduction in credit for reinsurance could also ultimately reduce the Company's return on equity to the extent that ceding commissions paid to the Company by the reinsurers were not adequately increased to compensate for the effect of any additional capital required. In addition, downgraded reinsurers may default on amounts due to the Company and such reinsurer obligations may not be adequately collateralized, resulting in additional losses to the Company and a reduction in its shareholders' equity and net income.
The Company also has exposure to counterparties in various industries, including banks, hedge funds and other investment vehicles in its insured transactions. Many of these transactions expose the Company to credit risk in the event its counterparty fails to perform its obligations.
Acquisitions may not result in the benefits anticipated and may subject the Company to non-monetary consequences.
From time to time the Company evaluates financial guaranty portfolio and company acquisition opportunities and conducts diligence activities with respect to transactions with other financial guarantors and financial services companies. For example, during 2015 the Company acquired Radian Asset and in 2016 the Company acquired CIFG, and in each case merged it with and into AGC, with AGC as the surviving company of the merger. In January 2017, the Company acquired MBIA UK. Acquiring other financial guaranty portfolios or companies or other financial services companies may involve some or all of the various risks commonly associated with acquisitions, including, among other things: (a) failure to adequately identify and value potential exposures and liabilities of the target portfolio or entity; (b) difficulty in estimating the value of the target portfolio or entity; (c) potential diversion of management’s time and attention; (d) exposure to asset quality issues of the target entity; and (e) difficulty and expense of integrating the operations, systems and personnel of the target entity. Such acquisitions may also have unintended consequences on ratings assigned by the rating agencies to the Company or its subsidiaries (see “- Risks Related to the Company’s Ratings”) or on the applicability of laws and regulations to the Company’s existing businesses. These or other factors may cause any future acquisitions of financial guaranty portfolios or companies or other financial services companies not to result in the benefits to the Company anticipated when the acquisition was agreed.
Past or future acquisitions may also subject the Company to non-monetary consequences that may or may not have been anticipated or fully mitigated at the time of the acquisition. For example, in November 2006, AGMH received a subpoena from the Antitrust Division of the Department of Justice issued in connection with an ongoing criminal investigation of bid rigging of awards of municipal GICs and other municipal derivatives. AGMH responded to the subpoena and has had limited contact with the DOJ on the matter since late 2011. Although the subpoena related to AGMH's former Financial Products Business, which the Company did not acquire, it was issued to AGMH, which the Company did acquire.
Alternative investments may not result in the benefits anticipated.
From time to time in order to deploy a portion of the Company's excess capital the Company may invest in business opportunities that complement the Company's financial guaranty business, are in line with its risk profile and benefit from its core competencies. The alternative investments group has been investigating a number of such opportunities, including, among others, both controlling and non-controlling investments in investment managers. For example, in February 2017 the Company agreed to purchase up to $100 million of limited partnership interests in a fund that invests in the equity of private equity managers. The Company continues to investigate additional opportunities. Alternative investments may be riskier than many of the other investments the Company makes, and may not result in the benefits anticipated at the time of the investment. In addition, although the Company uses what it believes to be excess capital to make alternative investments, measures of required capital can fluctuate and such investments may not be given much, or any, value under the various rating agency, regulatory and internal capital models to which the Company is subject. Also, alternative investments may be less liquid than most of the Company's other investments and so may be difficult to convert to cash or investments that do receive credit under the capital models to which the Company is subject. See "Risks Related to the Company's Capital and Liquidity Requirements -- The ability of AGL and its subsidiaries to meet their liquidity needs may be limited."
53
The Company is dependent on key executives and the loss of any of these executives, or its inability to retain other key personnel, could adversely affect its business.
The Company's success substantially depends upon its ability to attract and retain qualified employees and upon the ability of its senior management and other key employees to implement its business strategy. The Company believes there are only a limited number of available qualified executives in the business lines in which the Company competes. The Company relies substantially upon the services of Dominic J. Frederico, President and Chief Executive Officer, and other executives. Although the Company has designed its executive compensation with the goal of retaining and creating incentives for its executive officers, the Company may not be successful in retaining their services. The loss of the services of any of these individuals or other key members of the Company's management team could adversely affect the implementation of its business strategy.
The Company is dependent on its information technology and that of certain third parties, and a cyber-attack, security breach or failure in such systems could adversely affect the Company’s business.
The Company relies upon information technology and systems, including technology and systems provided by or interfacing with those of third parties, to support a variety of its business processes and activities. In addition, the Company has collected and stored confidential information including, in connection with certain loss mitigation and due diligence activities related to its structured finance business, personally identifiable information. While the Company does not believe that the financial guaranty industry is as inherently prone to cyber-attacks as industries relating to, for example, payment card processing, banking, critical infrastructure or defense contracting, the Company’s data systems and those of third parties on which it relies are still vulnerable to security breaches due to cyber-attacks, viruses, malware, hackers and other external hazards, as well as inadvertent errors, equipment and system failures, and employee misconduct. Problems in or security breaches of these systems could, for example, result in lost business, reputational harm, the disclosure or misuse of confidential or proprietary information, incorrect reporting, inaccurate loss projections, legal costs and regulatory penalties.
The Company’s business operations rely on the continuous availability of its computer systems as well as those of certain third parties. In addition to disruptions caused by cyber-attacks or other data breaches, such systems may be adversely affected by natural and man-made catastrophes. The Company’s failure to maintain business continuity in the wake of such events, particularly if there were an interruption for an extended period, could prevent the timely completion of critical processes across its operations, including, for example, claims processing, treasury and investment operations and payroll. These failures could result in additional costs, loss of business, fines and litigation.
The Company and its subsidiaries are subject to numerous laws and regulations of a number of jurisdictions regarding its information systems, particularly with regard to personally identifiable information. The Company's failure to comply with these requirements, even absent a security breach, could result in penalties, reputational harm or difficulty in obtaining desired consents from regulatory authorities.
Risks Related to GAAP and Applicable Law
Changes in the fair value of the Company's insured credit derivatives portfolio may subject net income to volatility.
The Company is required to mark-to-market certain derivatives that it insures, including CDS that are considered derivatives under GAAP. Although there is no cash flow effect from this "marking-to-market," net changes in the fair value of the derivative are reported in the Company's consolidated statements of operations and therefore affect its reported earnings. As a result of such treatment, and given the large principal balance of the Company's CDS portfolio, small changes in the market pricing for insurance of CDS will generally result in the Company recognizing material gains or losses, with material market price increases generally resulting in large reported losses under GAAP. Accordingly, the Company's GAAP earnings will be more volatile than would be suggested by the actual performance of its business operations and insured portfolio.
The fair value of a credit derivative will be affected by any event causing changes in the credit spread (i.e., the difference in interest rates between comparable securities having different credit risk) on an underlying security referenced in the credit derivative. Common events that may cause credit spreads on an underlying municipal or corporate security referenced in a credit derivative to fluctuate include changes in the state of national or regional economic conditions, industry cyclicality, changes to a company's competitive position within an industry, management changes, changes in the ratings of the underlying security, movements in interest rates, default or failure to pay interest, or any other factor leading investors to revise expectations about the issuer's ability to pay principal and interest on its debt obligations. Similarly, common events that may cause credit spreads on an underlying structured security referenced in a credit derivative to fluctuate may include the occurrence and severity of collateral defaults, changes in demographic trends and their impact on the levels of credit
54
enhancement, rating changes, changes in interest rates or prepayment speeds, or any other factor leading investors to revise expectations about the risk of the collateral or the ability of the servicer to collect payments on the underlying assets sufficient to pay principal and interest. The fair value of credit derivative contracts also reflects the change in the Company's own credit cost, based on the price to purchase credit protection on AGC and AGM. For discussion of the Company's fair value methodology for credit derivatives, see Part II, Item 8, Financial Statements and Supplementary Data, Note 7, Fair Value Measurement.
If a credit derivative is held to maturity and no credit loss is incurred, any unrealized gains or losses previously reported would be offset as the transactions reach maturity. Due to the complexity of fair value accounting and the application of GAAP requirements, future amendments or interpretations of relevant accounting standards may cause the Company to modify its accounting methodology in a manner which may have an adverse impact on its financial results.
Change in industry and other accounting practices could impair the Company's reported financial results and impede its ability to do business.
Changes in or the issuance of new accounting standards, as well as any changes in the interpretation of current accounting guidance, may have an adverse effect on the Company's reported financial results, including future revenues, and may influence the types and/or volume of business that management may choose to pursue.
Changes in or inability to comply with applicable law could adversely affect the Company's ability to do business.
The Company’s businesses are subject to direct and indirect regulation under state insurance laws, federal securities, commodities and tax laws affecting public finance and asset backed obligations, and federal regulation of derivatives, as well as applicable laws in the other countries in which the Company operates. Future legislative, regulatory, judicial or other legal changes in the jurisdictions in which the Company does business may adversely affect its ability to pursue its current mix of business, thereby materially impacting its financial results by, among other things, limiting the types of risks it may insure, lowering applicable single or aggregate risk limits, increasing required reserves or capital, increasing the level of supervision or regulation to which the Company’s operations may be subject, imposing restrictions that make the Company’s products less attractive to potential buyers, lowering the profitability of the Company’s business activities, requiring the Company to change certain of its business practices and exposing it to additional costs (including increased compliance costs).
If the Company fails to comply with applicable insurance laws and regulations it could be exposed to fines, the loss of insurance licenses, limitations on the right to originate new business and restrictions on its ability to pay dividends, all of which could have an adverse impact on its business results and prospects. If an insurance company’s surplus declines below minimum required levels, the insurance regulator could impose additional restrictions on the insurer or initiate insolvency proceedings. AGM, AGC and MAC may increase surplus by various means, including obtaining capital contributions from the Company, purchasing reinsurance or entering into other loss mitigation arrangements, reducing the amount of new business written or obtaining regulatory approval to release contingency reserves. From time to time, AGM, MAC and AGC have obtained approval from their regulators to release contingency reserves based on losses and, in the case of AGM and MAC, also based on the expiration of their insured exposure.
AGL's ability to pay dividends may be constrained by certain insurance regulatory requirements and restrictions.
AGL is subject to Bermuda regulatory requirements that affect its ability to pay dividends on common shares and to make other payments. Under the Bermuda Companies Act 1981, as amended, AGL may declare or pay a dividend only if it has reasonable grounds for believing that it is, and after the payment would be, able to pay its liabilities as they become due, and if the realizable value of its assets would not be less than its liabilities. While AGL currently intends to pay dividends on its common shares, investors who require dividend income should carefully consider these risks before investing in AGL. In addition, if, pursuant to the insurance laws and related regulations of Bermuda, Maryland and New York, AGL's insurance subsidiaries cannot pay sufficient dividends to AGL at the times or in the amounts that it requires, it would have an adverse effect on AGL's ability to pay dividends to shareholders. See "Risks Related to the Company's Capital and Liquidity Requirements—The ability of AGL and its subsidiaries to meet their liquidity needs may be limited."
55
Applicable insurance laws may make it difficult to effect a change of control of AGL.
Before a person can acquire control of a U.S. or U.K. insurance company, prior written approval must be obtained from the insurance commissioner of the state or country where the insurer is domiciled. Because a person acquiring 10% or more of AGL's common shares would indirectly control the same percentage of the stock of its U.S. insurance company subsidiaries, the insurance change of control laws of Maryland, New York and the U.K. would likely apply to such a transaction. These laws may discourage potential acquisition proposals and may delay, deter or prevent a change of control of AGL, including through transactions, and in particular unsolicited transactions, that some or all of its shareholders might consider to be desirable. While AGL's Bye-Laws limit the voting power of any shareholder to less than 10%, we cannot assure you that the applicable regulatory body would agree that a shareholder who owned 10% or more of its common shares did not control the applicable insurance company subsidiary, notwithstanding the limitation on the voting power of such shares.
Changes in applicable laws and regulations resulting from Brexit may adversely affect the Company.
Brexit could lead to legal uncertainty and politically divergent national laws and regulations as the U.K. determines which EU laws to replace or replicate. Depending on the terms of Brexit, AGE may lose the ability to insure new transactions from London in non-U.K. EU and EEA countries without obtaining additional licenses, which may require a presence in another EU country. Brexit-related changes in laws and regulations may also adversely affect the Company’s surveillance and loss mitigation activities with respect to existing insured transactions in non-U.K. EU and EEA countries, especially to the extent Brexit inhibits the issuance of new guaranties in distressed situations. Brexit may also impact laws, rules and regulations applicable to U.K. entities with obligations insured by the Company and could adversely impact the ability of non-U.K. EU or EEA citizens to continue to be employed at AGE in London.
Risks Related to Taxation
Changes in U.S. tax laws could reduce the demand or profitability of financial guaranty insurance, or negatively impact the Company's investment portfolio.
Press reports indicate that the U.S. Congress is considering making major changes to the Internal Revenue Code in 2017. Any material change in the U.S. tax treatment of municipal securities, the imposition of a national sales tax or a flat tax in lieu of the current federal income tax structure in the U.S., or changes in the treatment of dividends, could adversely affect the market for municipal obligations and, consequently, reduce the demand for financial guaranty insurance and reinsurance of such obligations. Limiting or eliminating the Federal income tax exclusion for municipal bond interest would increase the cost of borrowing for state and local governments, and as a result, could cause a decrease in infrastructure spending by states and municipalities. Municipalities may issue a lower volume of bonds, and in particular may be less likely to refund existing debt, in which case, the amount of bonds that can benefit from insurance might also be reduced.
Changes in U.S. federal, state or local laws that materially adversely affect the tax treatment of municipal securities or the market for those securities, or other changes negatively affecting the municipal securities market, also may adversely impact the Company's investment portfolio, a significant portion of which is invested in tax-exempt instruments. These adverse changes may adversely affect the value of the Company's tax-exempt portfolio, or its liquidity.
Certain of the Company's foreign subsidiaries may be subject to U.S. tax.
The Company manages its business so that AGL and its foreign subsidiaries (other than AGRO and AGE) operate in such a manner that none of them should be subject to U.S. federal tax (other than U.S. excise tax on insurance and reinsurance premium income attributable to insuring or reinsuring U.S. risks, and U.S. withholding tax on certain U.S. source investment income). However, because there is considerable uncertainty as to the activities which constitute being engaged in a trade or business within the U.S., the Company cannot be certain that the IRS will not contend successfully that AGL or any of its foreign subsidiaries (other than AGRO and AGE) is/are engaged in a trade or business in the U.S. If AGL and its foreign subsidiaries (other than AGRO and AGE) were considered to be engaged in a trade or business in the U.S., each such company could be subject to U.S. corporate income and branch profits taxes on the portion of its earnings effectively connected to such U.S. business.
AGL, AG Re and AGRO may become subject to taxes in Bermuda after March 2035, which may have a material adverse effect on the Company's results of operations and on an investment in the Company.
The Bermuda Minister of Finance, under Bermuda's Exempted Undertakings Tax Protection Act 1966, as amended, has given AGL, AG Re and AGRO an assurance that if any legislation is enacted in Bermuda that would impose tax computed
56
on profits or income, or computed on any capital asset, gain or appreciation, or any tax in the nature of estate duty or inheritance tax, then subject to certain limitations the imposition of any such tax will not be applicable to AGL, AG Re or AGRO, or any of AGL's or its subsidiaries' operations, shares, debentures or other obligations until March 31, 2035. Given the limited duration of the Minister of Finance's assurance, the Company cannot be certain that it will not be subject to Bermuda tax after March 31, 2035.
U.S. Persons who hold 10% or more of AGL's shares directly or through foreign entities may be subject to taxation under the U.S. controlled foreign corporation rules.
Each 10% U.S. shareholder of a foreign corporation that is a CFC for an uninterrupted period of 30 days or more during a taxable year, and who owns shares in the foreign corporation directly or indirectly through foreign entities on the last day of the foreign corporation's taxable year on which it is a CFC, must include in its gross income for U.S. federal income tax purposes its pro rata share of the CFC's "subpart F income," even if the subpart F income is not distributed. In addition, upon a sale of shares of a CFC, 10% U.S. shareholders may be subject to U.S. federal income tax on a portion of their gain at ordinary income rates.
The Company believes that because of the dispersion of the share ownership in AGL, provisions in AGL's Bye-Laws that limit voting power, contractual limits on voting power and other factors, no U.S. Person who owns AGL's shares directly or indirectly through foreign entities should be treated as a 10% U.S. shareholder of AGL or of any of its foreign subsidiaries. It is possible, however, that the IRS could challenge the effectiveness of these provisions and that a court could sustain such a challenge, in which case such U.S. Person may be subject to taxation under U.S. tax rules.
U.S. Persons who hold shares may be subject to U.S. income taxation at ordinary income rates on their proportionate share of the Company's related person insurance income.
If the following conditions are true, then a U.S. Person who owns AGL's shares (directly or indirectly through foreign entities) on the last day of the taxable year would be required to include in its income for U.S. federal income tax purposes such person's pro rata share of the RPII of such Foreign Insurance Subsidiary (as defined below) for the entire taxable year, determined as if such RPII were distributed proportionately only to U.S. Persons at that date, regardless of whether such income is distributed:
|
•
|
the Company is 25% or more owned directly, indirectly through foreign entities or by attribution by U.S. Persons;
|
|
•
|
the gross RPII of AG Re or any other AGL foreign subsidiary engaged in the insurance business that has not made an election under section 953(d) of the Code to be treated as a U.S. corporation for all U.S. tax purposes or are CFCs owned directly or indirectly by AGUS (each, with AG Re, a Foreign Insurance Subsidiary) were to equal or exceed 20% of such Foreign Insurance Subsidiary's gross insurance income in any taxable year; and
|
|
•
|
direct or indirect insureds (and persons related to such insureds) own (or are treated as owning directly or indirectly through entities) 20% or more of the voting power or value of the Company's shares.
|
In addition, any RPII that is includible in the income of a U.S. tax-exempt organization may be treated as unrelated business taxable income.
The amount of RPII earned by a Foreign Insurance Subsidiary (generally, premium and related investment income from the direct or indirect insurance or reinsurance of any direct or indirect U.S. holder of shares or any person related to such holder) will depend on a number of factors, including the geographic distribution of a Foreign Insurance Subsidiary's business and the identity of persons directly or indirectly insured or reinsured by a Foreign Insurance Subsidiary. The Company believes that each of its Foreign Insurance Subsidiaries either should not in the foreseeable future have RPII income which equals or exceeds 20% of its gross insurance income or have direct or indirect insureds, as provided for by RPII rules, that directly or indirectly own 20% or more of either the voting power or value of AGL's shares. However, the Company cannot be certain that this will be the case because some of the factors which determine the extent of RPII may be beyond its control.
57
U.S. Persons who dispose of AGL's shares may be subject to U.S. income taxation at dividend tax rates on a portion of their gain, if any.
The meaning of the RPII provisions and the application thereof to AGL and its Foreign Insurance Subsidiaries is uncertain. The RPII rules in conjunction with section 1248 of the Code provide that if a U.S. Person disposes of shares in a foreign insurance corporation in which U.S. Persons own (directly, indirectly, through foreign entities or by attribution) 25% or more of the shares (even if the amount of gross RPII is less than 20% of the corporation's gross insurance income and the ownership of its shares by direct or indirect insureds and related persons is less than the 20% threshold), any gain from the disposition will generally be treated as dividend income to the extent of the holder's share of the corporation's undistributed earnings and profits that were accumulated during the period that the holder owned the shares. This provision applies whether or not such earnings and profits are attributable to RPII. In addition, such a holder will be required to comply with certain reporting requirements, regardless of the amount of shares owned by the holder.
In the case of AGL's shares, these RPII rules should not apply to dispositions of shares because AGL is not itself directly engaged in the insurance business. However, the RPII provisions have never been interpreted by the courts or the U.S. Treasury Department in final regulations, and regulations interpreting the RPII provisions of the Code exist only in proposed form. It is not certain whether these regulations will be adopted in their proposed form, what changes or clarifications might ultimately be made thereto, or whether any such changes, as well as any interpretation or application of the RPII rules by the IRS, the courts, or otherwise, might have retroactive effect. The U.S. Treasury Department has authority to impose, among other things, additional reporting requirements with respect to RPII.
U.S. Persons who hold common shares will be subject to adverse tax consequences if AGL is considered to be a "passive foreign investment company" for U.S. federal income tax purposes.
If AGL is considered a PFIC for U.S. federal income tax purposes, a U.S. Person who owns any shares of AGL will be subject to adverse tax consequences that could materially adversely affect its investment, including subjecting the investor to both a greater tax liability than might otherwise apply and an interest charge. The Company believes that AGL is not, and currently does not expect AGL to become, a PFIC for U.S. federal income tax purposes; however, there can be no assurance that AGL will not be deemed a PFIC by the IRS.
There are currently no final or temporary regulations regarding the application of the PFIC provisions to an insurance company. The IRS recently issued proposed regulations intended to clarify the application of the PFIC provisions to an insurance company. These proposed regulations provide that a non-U.S. insurance company may only qualify for an exception to the PFIC rules if, among other things, the non-U.S. insurance company’s officers and employees perform its substantial managerial and operational activities. This proposed regulation will not be effective until adopted in final form. Because of the legal uncertainties relating to how the proposed regulations will be interpreted and the form in which such regulations or any legislative proposal may be finalized, the Company cannot predict what impact, if any, such guidance or legislation would have on an investor that is subject to U.S. federal income tax.
Changes in U.S. federal income tax law could materially adversely affect an investment in AGL's common shares.
Legislation has been introduced in the U.S. Congress intended to eliminate certain perceived tax advantages of companies (including insurance companies) that have legal domiciles outside the U.S. but have certain U.S. connections. For example, legislation has been introduced in Congress to limit the deductibility of reinsurance premiums paid by U.S. insurance companies to foreign affiliates and impose additional limits on deductibility of interest of foreign owned U.S. corporations. Another legislative proposal would treat a foreign corporation that is primarily managed and controlled in the U.S. as a U.S. corporation for U.S federal income tax purposes. Further, legislation based on the Tax Reform Task-Force Blueprint dated June 24, 2016, which recommends moving to a cash flow consumption-based tax system and provides for border adjustments taxing imports, may be introduced and enacted and its impact on the insurance industry may adversely impact the results of our operations. Also, legislation has previously been introduced to override the reduction or elimination of the U.S. withholding tax on certain U.S. source investment income under a tax treaty in the case of a deductible related party payment made by a U.S. member of a foreign controlled group to a foreign member of the group organized in a tax treaty country to the extent that the ultimate foreign parent corporation would not enjoy the treaty benefits with respect to such payments. It is possible that this or similar legislation could be introduced in and enacted by the current Congress or future Congresses that could have an adverse impact on the Company or the Company's shareholders.
U.S. federal income tax laws and interpretations regarding whether a company is engaged in a trade or business within the U.S. is a PFIC, or whether U.S. Persons would be required to include in their gross income the "subpart F income" of a CFC or RPII are subject to change, possibly on a retroactive basis. There currently are only recently proposed regulations
58
regarding the application of the PFIC rules to insurance companies, and the regulations regarding RPII have been in proposed form since 1991. New regulations or pronouncements interpreting or clarifying such rules may be forthcoming. The Company cannot be certain if, when, or in what form such regulations or pronouncements may be implemented or made, or whether such guidance will have a retroactive effect.
Recharacterization by the Internal Revenue Service of the Company's U.S. federal tax treatment of losses on the Company's CDS portfolio can adversely affect the Company's financial position.
As part of the Company's financial guaranty business, the Company has sold credit protection by insuring CDS entered into with various financial institutions. Assured Guaranty's CDS portfolio has experienced significant cumulative fair value losses which are only deductible for U.S. federal income tax purposes upon realization and, consequently, generate a significant deferred tax asset based on the Company's intended treatment of such losses as ordinary insurance losses upon realization. The U.S. federal income tax treatment of CDS is an unsettled area of the tax law. As such, it is possible that the IRS may decide that the losses generated by the Company's CDS business should be characterized as capital rather than ordinary insurance losses, which could materially adversely affect the Company's financial condition.
An ownership change under Section 382 of the Code could have adverse U.S. federal tax consequences.
If AGL were to issue equity securities in the future, including in connection with any strategic transaction, or if previously issued securities of AGL were to be sold by the current holders, AGL may experience an "ownership change" within the meaning of Section 382 of the Code. In general terms, an ownership change would result from transactions increasing the aggregate ownership of certain stockholders in AGL's stock by more than 50 percentage points over a testing period (generally three years). If an ownership change occurred, the Company's ability to use certain tax attributes, including certain built-in losses, credits, deductions or tax basis and/or the Company's ability to continue to reflect the associated tax benefits as assets on AGL's balance sheet, may be limited. The Company cannot give any assurance that AGL will not undergo an ownership change at a time when these limitations could materially adversely affect the Company's financial condition.
AGMH likely experienced an ownership change under Section 382 of the Code.
In connection with the acquisition of AGMH, AGMH likely experienced an "ownership change" within the meaning of Section 382 of the Code. The Company has concluded that the Section 382 limitations as discussed in "An ownership change under Section 382 of the Code could have adverse U.S. federal tax consequences" are unlikely to have any material tax or accounting consequences. However, this conclusion is based on a variety of assumptions, including the Company's estimates regarding the amount and timing of certain deductions and future earnings, any of which could be incorrect. Accordingly, there can be no assurance that these limitations would not have an adverse effect on the Company's financial condition or that such adverse effects would not be material.
A change in AGL’s U.K. tax residence or its ability to otherwise qualify for the benefits of income tax treaties to which the U.K. is a party could adversely affect an investment in AGL’s common shares.
AGL is not incorporated in the U.K. and, accordingly, is only resident in the U.K. for U.K. tax purposes if it is “centrally managed and controlled” in the U.K. Central management and control constitutes the highest level of control of a company’s affairs. AGL believes it is entitled to take advantage of the benefits of income tax treaties to which the U.K. is a party on the basis that it is has established central management and control in the U.K. AGL has obtained confirmation that there is a low risk of challenge to its residency status from HMRC under the facts as they stand today. The Board intends to manage the affairs of AGL in such a way as to maintain its status as a company that is tax-resident in the U.K. for U.K. tax purposes and to qualify for the benefits of income tax treaties to which the U.K. is a party. However, the concept of central management and control is a case-law concept that is not comprehensively defined in U.K. statute. In addition, it is a question of fact. Moreover, tax treaties may be revised in a way that causes AGL to fail to qualify for benefits thereunder. Accordingly, a change in relevant U.K. tax law or in tax treaties to which the U.K. is a party, or in AGL’s central management and control as a factual matter, or other events, could adversely affect the ability of Assured Guaranty to manage its capital in the efficient manner that it contemplated in establishing U.K. tax residence.
Changes in U.K. tax law or in AGL’s ability to satisfy all the conditions for exemption from U.K. taxation on dividend income or capital gains in respect of its direct subsidiaries could affect an investment in AGL’s common shares.
As a U.K. tax resident, AGL is subject to U.K. corporation tax in respect of its worldwide profits (both income and capital gains), subject to applicable exemptions. The main rate of corporation tax is currently 20%.
59
|
•
|
With respect to income, the dividends that AGL receives from its subsidiaries should be exempt from U.K. corporation tax under the exemption contained in section 931D of the Corporation Tax Act 2009.
|
|
•
|
With respect to capital gains, if AGL were to dispose of shares in its direct subsidiaries or if it were deemed to have done so, it may realize a chargeable gain for U.K. tax purposes. Any tax charge would be based on AGL’s original acquisition cost. It is anticipated that any such future gain should qualify for exemption under the substantial shareholding exemption in Schedule 7AC to the Taxation of Chargeable Gains Act 1992. However, the availability of such exemption would depend on facts at the time of disposal, in particular the “trading” nature of the relevant subsidiary (and, in respect of disposal before April 1, 2017 only, the Assured Guaranty group). There is no statutory definition of what constitutes “trading” activities for this purpose and in practice reliance is placed on the published guidance of HMRC.
|
A change in U.K. tax law or its interpretation by HMRC, or any failure to meet all the qualifying conditions for relevant exemptions from U.K. corporation tax, could affect Assured Guaranty’s financial results of operations or its ability to provide returns to shareholders.
Assured Guaranty's financial results may be affected by measures taken in response to the OECD BEPS project.
The Organization for Economic Co-operation and Development published its final reports on Base Erosion and Profit Shifting (the BEPS Reports) in October 2015. The recommended actions include an examination of the definition of a “permanent establishment” and the rules for attributing profit to a permanent establishment. There are also recommended actions relating to the goal of ensuring that transfer pricing outcomes are in line with value creation, noting that the current rules may facilitate the transfer of risks or capital away from countries where the economic activity takes place. In response to this, the U.K. Government has already made or proposed draft legislation to implement changes to transfer pricing, hybrid financial instruments and the deductibility of interest. Any further changes in U.K. tax law or changes in U.S. tax law in response to the BEPS Reports could adversely affect Assured Guaranty’s tax liability.
A new U.K. tax, the diverted profits tax (DPT), which is levied at 25%, came into effect from April 1, 2015, and, in substance, effectively anticipated some of the recommendations emerging from the BEPS Reports. This is an anti-avoidance measure, aimed at protecting the U.K. tax base against the diversion of profits away from the U.K. tax charge. In particular, DPT may apply to profits generated by economic activities carried out in the U.K., that are not taxed in the U.K. by reason of arrangements between companies in the same multinational group and involving a low-tax jurisdiction, including co-insurance and reinsurance. It is currently unclear whether DPT would constitute a creditable tax for U.S. foreign tax credit purposes. If any member of the Assured Guaranty group is liable to DPT, this could adversely affect the Company's results of operations.
An adverse adjustment under U.K. legislation governing the taxation of U.K. tax resident holding companies on the profits of their foreign subsidiaries could adversely impact Assured Guaranty’s tax liability.
Under the U.K. “controlled foreign company” regime, the income profits of non-U.K. resident companies may, in certain circumstances, be attributed to controlling U.K. resident shareholders for U.K. corporation tax purposes. The non-U.K. resident members of the Assured Guaranty group intend to operate and manage their levels of capital in such a manner that their profits would not be taxed on AGL under the U.K. CFC regime. Assured Guaranty has obtained clearance from HMRC that none of the profits of the non-U.K. resident members of the Assured Guaranty group should be subject to U.K. tax as a result of attribution under the CFC regime on the facts as they currently stand. However, a change in the way in which Assured Guaranty operates or any further change in the CFC regime, resulting in an attribution to AGL of any of the income profits of any of AGL’s non-U.K. resident subsidiaries for U.K. corporation tax purposes, could adversely affect Assured Guaranty’s financial results of operations.
Risks Related to AGL's Common Shares
The market price of AGL's common shares may be volatile, which could cause the value of an investment in the Company to decline.
The market price of AGL's common shares has experienced, and may continue to experience, significant volatility. Numerous factors, including many over which the Company has no control, may have a significant impact on the market price of its common shares. These risks include those described or referred to in this "Risk Factors" section as well as, among other things:
60
|
•
|
investor perceptions of the Company, its prospects and that of the financial guaranty industry and the markets in which the Company operates;
|
|
•
|
the Company's operating and financial performance;
|
|
•
|
the Company's access to financial and capital markets to raise additional capital, refinance its debt or replace existing senior secured credit and receivables-backed facilities;
|
|
•
|
the Company's ability to repay debt;
|
|
•
|
the Company's dividend policy;
|
|
•
|
the amount of share repurchases authorized by the Company;
|
|
•
|
future sales of equity or equity-related securities;
|
|
•
|
changes in earnings estimates or buy/sell recommendations by analysts; and
|
|
•
|
general financial, economic and other market conditions.
|
In addition, the stock market in recent years has experienced extreme price and trading volume fluctuations that often have been unrelated or disproportionate to the operating performance of individual companies. These broad market fluctuations may adversely affect the price of AGL's common shares, regardless of its operating performance.
Furthermore, future sales or other issuances of AGL equity may adversely affect the market price of its common shares.
AGL's common shares are equity securities and are junior to existing and future indebtedness.
As equity interests, AGL's common shares rank junior to indebtedness and to other non-equity claims on AGL and its assets available to satisfy claims on AGL, including claims in a bankruptcy or similar proceeding. For example, upon liquidation, holders of AGL debt securities and shares of preferred stock and creditors would receive distributions of AGL's available assets prior to the holders of AGL common shares. Similarly, creditors, including holders of debt securities, of AGL's subsidiaries, have priority on the assets of those subsidiaries. Future indebtedness may restrict payment of dividends on the common shares.
Additionally, unlike indebtedness, where principal and interest customarily are payable on specified due dates, in the case of common shares, dividends are payable only when and if declared by AGL's Board or a duly authorized committee of the Board. Further, the common shares place no restrictions on its business or operations or on its ability to incur indebtedness or engage in any transactions, subject only to the voting rights available to stockholders generally.
Provisions in the Code and AGL's Bye-Laws may reduce or increase the voting rights of its common shares.
Under the Code, AGL's Bye-Laws and contractual arrangements, certain shareholders have their voting rights limited to less than one vote per share, resulting in other shareholders having voting rights in excess of one vote per share. Moreover, the relevant provisions of the Code may have the effect of reducing the votes of certain shareholders who would not otherwise be subject to the limitation by virtue of their direct share ownership.
More specifically, pursuant to the relevant provisions of the Code, if, and so long as, the common shares of a shareholder are treated as "controlled shares" (as determined under section 958 of the Code) of any U.S. Person (as defined below) and such controlled shares constitute 9.5% or more of the votes conferred by AGL's issued shares, the voting rights with respect to the controlled shares of such U.S. Person (a 9.5% U.S. Shareholder) are limited, in the aggregate, to a voting power of less than 9.5%, under a formula specified in AGL's Bye-Laws. The formula is applied repeatedly until the voting power of all 9.5% U.S. Shareholders has been reduced to less than 9.5%. For these purposes, "controlled shares" include, among other things, all shares of AGL that such U.S. Person is deemed to own directly, indirectly or constructively (within the meaning of section 958 of the Code).
In addition, the Board may limit a shareholder's voting rights where it deems appropriate to do so to (1) avoid the existence of any 9.5% U.S. Shareholders, and (2) avoid certain material adverse tax, legal or regulatory consequences to the
61
Company or any of the Company's subsidiaries or any shareholder or its affiliates. AGL's Bye-Laws provide that shareholders will be notified of their voting interests prior to any vote taken by them.
As a result of any such reallocation of votes, the voting rights of a holder of AGL common shares might increase above 5% of the aggregate voting power of the outstanding common shares, thereby possibly resulting in such holder becoming a reporting person subject to Schedule 13D or 13G filing requirements under the Securities Exchange Act of 1934. In addition, the reallocation of votes could result in such holder becoming subject to the short swing profit recovery and filing requirements under Section 16 of the Exchange Act.
AGL also has the authority under its Bye-Laws to request information from any shareholder for the purpose of determining whether a shareholder's voting rights are to be reallocated under the Bye-Laws. If a shareholder fails to respond to a request for information or submits incomplete or inaccurate information in response to a request, the Company may, in its sole discretion, eliminate such shareholder's voting rights.
Provisions in AGL's Bye-Laws may restrict the ability to transfer common shares, and may require shareholders to sell their common shares.
AGL's Board may decline to approve or register a transfer of any common shares (1) if it appears to the Board, after taking into account the limitations on voting rights contained in AGL's Bye-Laws, that any adverse tax, regulatory or legal consequences to AGL, any of its subsidiaries or any of its shareholders may occur as a result of such transfer (other than such as the Board considers to be de minimis), or (2) subject to any applicable requirements of or commitments to the NYSE, if a written opinion from counsel supporting the legality of the transaction under U.S. securities laws has not been provided or if any required governmental approvals have not been obtained.
AGL's Bye-Laws also provide that if the Board determines that share ownership by a person may result in adverse tax, legal or regulatory consequences to the Company, any of the subsidiaries or any of the shareholders (other than such as the Board considers to be de minimis), then AGL has the option, but not the obligation, to require that shareholder to sell to AGL or to third parties to whom AGL assigns the repurchase right for fair market value the minimum number of common shares held by such person which is necessary to eliminate such adverse tax, legal or regulatory consequences.
|
ITEM 1B.
|
UNRESOLVED STAFF COMMENTS
|
None.
|
ITEM 2.
|
PROPERTIES
|
The principal executive offices of AGL and AG Re consist of approximately 8,250 square feet of office space located in Hamilton, Bermuda; the lease for this space expires in April 2021 and is renewable at the option of the Company.
In addition, the Company had been occupying offices at 31 West 52nd Street in New York City. In September 2015, the Company entered into a lease for 88,000 square feet of office space at 1633 Broadway in New York City, and later an additional 15,500 square feet for a total of 103,500 square feet; the new lease expires in February 2032, with an option, subject to certain conditions, to renew for five years at a fair market rent. The Company agreed to terminate its existing lease in August 2016 and relocated its U.S. affiliates into the new office space in the summer of 2016.
Furthermore, the Company has offices in San Francisco and London. During 2016, the Company moved its London offices from 1 Finsbury Square to 6 Bevis Marks.
Management believes its office space is adequate for its current and anticipated needs.
|
ITEM 3.
|
LEGAL PROCEEDINGS
|
Lawsuits arise in the ordinary course of the Company's business. It is the opinion of the Company's management, based upon the information available, that the expected outcome of litigation against the Company, individually or in the aggregate, will not have a material adverse effect on the Company's financial position or liquidity, although an adverse resolution of litigation against the Company in a fiscal quarter or year could have a material adverse effect on the Company's results of operations in a particular quarter or year.
62
In addition, in the ordinary course of their respective businesses, certain of the Company's subsidiaries assert claims in legal proceedings against third parties to recover losses paid in prior periods or prevent losses in the future, including those described in Part II, Item 8, Financial Statements and Supplementary Data, Note 5, Expected Loss to be Paid, Recovery Litigation. For example, as described there, in January 2016 the Company commenced an action for declaratory judgment and injunctive relief in the U.S. District Court for the District of Puerto Rico to invalidate executive orders issued by the Governor of Puerto Rico directing the retention or transfer of certain taxes and revenues pledged to secure the payment of certain bonds insured by the Company, and in July 2016, the Company filed a motion and form of complaint in the U.S. District Court for the District of Puerto Rico seeking relief from the PROMESA stay in order to file a complaint to protect its interest in certain pledged PRHTA toll revenues. As another example, in December 2008, the Company filed a claim in the Supreme Court of the State of New York against an investment manager in a transaction it insured alleging breach of fiduciary duty, gross negligence and breach of contract. The amounts, if any, the Company will recover in these and other proceedings to recover losses are uncertain, and recoveries, or failure to obtain recoveries, in any one or more of these proceedings during any quarter or year could be material to the Company's results of operations in that particular quarter or year.
The Company establishes accruals for litigation and regulatory matters to the extent it is probable that a loss has been incurred and the amount of that loss can be reasonably estimated. For litigation and regulatory matters where a loss may be reasonably possible, but not probable, or is probable but not reasonably estimable, no accrual is established, but if the matter is material, it is disclosed, including matters discussed below. The Company reviews relevant information with respect to its litigation and regulatory matters on a quarterly, and annual basis and updates its accruals, disclosures and estimates of reasonably possible loss based on such reviews.
The Company receives subpoenas
duces tecum
and interrogatories from regulators from time to time.
On November 28, 2011, Lehman Brothers International (Europe) (in administration) (LBIE) sued AG Financial Products Inc. (AGFP), an affiliate of AGC which in the past had provided credit protection to counterparties under credit default swaps. AGC acts as the credit support provider of AGFP under these credit default swaps. LBIE's complaint, which was filed in the Supreme Court of the State of New York, alleged that AGFP improperly terminated
nine
credit derivative transactions between LBIE and AGFP and improperly calculated the termination payment in connection with the termination of
28
other credit derivative transactions between LBIE and AGFP. Following defaults by LBIE, AGFP properly terminated the transactions in question in compliance with the agreement between AGFP and LBIE, and calculated the termination payment properly. AGFP calculated that LBIE owes AGFP approximately
$29 million
in connection with the termination of the credit derivative transactions, whereas LBIE asserted in the complaint that AGFP owes LBIE a termination payment of approximately
$1.4 billion
. On February 3, 2012, AGFP filed a motion to dismiss certain of the counts in the complaint, and on March 15, 2013, the court granted AGFP's motion to dismiss the count relating to improper termination of the nine credit derivative transactions and denied AGFP's motion to dismiss the counts relating to the remaining transactions. On February 22, 2016, AGFP filed a motion for summary judgment on the remaining causes of action asserted by LBIE and on AGFP's counterclaims. LBIE’s administrators disclosed in an April 10, 2015 report to LBIE’s unsecured creditors that LBIE's valuation expert has calculated LBIE's damages in aggregate for the
28
transactions to range between a minimum of approximately
$200 million
and a maximum of approximately
$500 million
, depending on what adjustment, if any, is made for AGFP's credit risk and excluding any applicable interest.
On September 25, 2013, Wells Fargo Bank, N.A., as trust administrator of the MASTR Adjustable Rate Mortgages Trust 2007-3 (Wells Fargo), filed an interpleader complaint in the U.S. District Court for the Southern District of New York seeking adjudication of a dispute between Wales LLC (Wales) and AGM as to whether AGM is entitled to reimbursement from certain cashflows for principal claims paid in respect of insured certificates. On September 30, 2016, the court issued an opinion denying a motion for judgment on the pleadings filed by Wales. On January 3, 2017, the Court approved a Stipulation and Order of Dismissal of Wales from the action due to Wales having sold its interests in the MASTR Adjustable Rate Mortgages Trust 2007-3 certificates. On February 9, 2017, the remaining parties submitted a Stipulation and (Proposed) Order of Voluntary Dismissal, which the Court has not yet so-ordered. The Company estimates that an adverse outcome to the interpleader proceeding could increase losses on the transaction by approximately
$10
-
$20 million
, net of expected settlement payments and reinsurance in force.
On December 22, 2014, Deutsche Bank National Trust Company, as indenture trustee for the AAA Trust 2007-2 Re-REMIC (the Trustee), filed a “trust instructional proceeding” petition in the State of California Superior Court (Probate Division, Orange County), seeking the court’s instruction as to how it should allocate the losses resulting from its December 2014 sale of
four
RMBS owned by the AAA Trust 2007-2 Re-REMIC. This sale of approximately
$70 million
principal balance of RMBS was made pursuant to AGC’s liquidation direction in November 2014, and resulted in approximately
$27 million
of gross proceeds to the Re-REMIC. On December 22, 2014, AGC directed the indenture trustee to allocate to the uninsured Class A-3 Notes the losses realized from the sale. On May 4, 2015, the Superior Court rejected AGC’s allocation
63
direction, and ordered the Trustee to allocate to the Class A-3 noteholders a pro rata share of the
$27 million
of gross proceeds. AGC is appealing the Superior Court’s decision to the California Court of Appeal.
|
ITEM 4.
|
MINE SAFETY DISCLOSURES
|
Not applicable.
Executive Officers of the Company
The table below sets forth the names, ages, positions and business experience of the executive officers of Assured Guaranty Ltd.
|
Name
|
Age
|
Position(s)
|
|
|
Dominic J. Frederico
|
64
|
President and Chief Executive Officer; Deputy Chairman
|
|
|
James M. Michener
|
64
|
General Counsel and Secretary
|
|
|
Russell B. Brewer II
|
59
|
Chief Surveillance Officer
|
|
|
Robert A. Bailenson
|
50
|
Chief Financial Officer
|
|
|
Bruce E. Stern
|
62
|
Executive Officer
|
|
|
Howard W. Albert
|
57
|
Chief Risk Officer
|
|
Dominic J. Frederico
has been a director of AGL since the Company's 2004 initial public offering and the President and Chief Executive Officer of AGL since December 2003. Mr. Frederico served as Vice Chairman of ACE Limited from 2003 until 2004 and served as President and Chief Operating Officer of ACE Limited and Chairman of ACE INA Holdings, Inc. from 1999 to 2003. Mr. Frederico was a director of ACE Limited from 2001 through 2005. From 1995 to 1999 Mr. Frederico served in a number of executive positions with ACE Limited. Prior to joining ACE Limited, Mr. Frederico spent 13 years working for various subsidiaries of American International Group.
James M. Michener
has been General Counsel and Secretary of AGL since February 2004. Prior to joining Assured Guaranty, Mr. Michener was General Counsel and Secretary of Travelers Property Casualty Corp. from January 2002 to February 2004. From April 2001 to January 2002, Mr. Michener served as general counsel of Citigroup's Emerging Markets business. Prior to joining Citigroup's Emerging Markets business, Mr. Michener was General Counsel of Travelers Insurance from April 2000 to April 2001 and General Counsel of Travelers Property Casualty Corp. from May 1996 to April 2000.
Russell B. Brewer II
has been Chief Surveillance Officer of AGL since November 2009 and Chief Surveillance Officer of AGC and AGM since July 2009 and has also been responsible for information technology at Assured Guaranty since April 2015. Mr. Brewer has been with AGM since 1986. Mr. Brewer was Chief Risk Management Officer of AGM from September 2003 until July 2009 and Chief Underwriting Officer of AGM from September 1990 until September 2003. Mr. Brewer was also a member of the Executive Management Committee of AGM. He was a Managing Director of AGMH from May 1999 until July 2009. From March 1989 to August 1990, Mr. Brewer was Managing Director, Asset Finance Group, of AGM. Prior to joining AGM, Mr. Brewer was an Associate Director of Moody's Investors Service, Inc.
Robert A. Bailenson
has been Chief Financial Officer of AGL since June 2011. Mr. Bailenson has been with Assured Guaranty and its predecessor companies since 1990. Mr. Bailenson became Chief Accounting Officer of AGM in July 2009 and has been Chief Accounting Officer of AGL since May 2005 and Chief Accounting Officer of AGC since 2003. He was Chief Financial Officer and Treasurer of AG Re from 1999 until 2003 and was previously the Assistant Controller of Capital Re Corp., the Company's predecessor.
Bruce E. Stern
has been Executive Officer of AGC and AGM since July 2009. Mr. Stern was General Counsel, Managing Director, Secretary and Executive Management Committee member of AGM from 1987 until July 2009. Prior to joining AGM, Mr. Stern was an associate at the New York office of Cravath, Swaine & Moore. Mr. Stern has served as Chairman of the Association of Financial Guaranty Insurers since April 2010.
Howard W. Albert
has been Chief Risk Officer of AGL since May 2011. Prior to that, he was Chief Credit Officer of AGL from 2004 to April 2011. Mr. Albert joined Assured Guaranty in September 1999 as Chief Underwriting Officer of Capital Re Company, the predecessor to AGC. Before joining Assured Guaranty, he was a Senior Vice President with Rothschild Inc. from February 1997 to August 1999. Prior to that, he spent eight years at Financial Guaranty Insurance Company from May 1989 to February 1997, where he was responsible for underwriting guaranties of asset-backed securities
64
and international infrastructure transactions. Prior to that, he was employed by Prudential Capital, an investment arm of The Prudential Insurance Company of America, from September 1984 to April 1989, where he underwrote investments in asset-backed securities, corporate loans and project financings.
65
|
ITEM 5.
|
MARKET FOR REGISTRANT'S COMMON EQUITY, RELATED STOCKHOLDER MATTERS AND ISSUER PURCHASES OF EQUITY SECURITIES
|
AGL's common shares are listed on the NYSE under symbol "AGO." The table below sets forth, for the calendar quarters indicated, the reported high and low sales prices and amount of any cash dividends declared.
Common Stock Prices and Dividends
|
|
2016
|
2015
|
|||||||||||||||||||||
|
|
Sales Price
|
Cash
|
Sales Price
|
Cash
|
|||||||||||||||||||
|
|
High
|
Low
|
Dividends
|
High
|
Low
|
Dividends
|
|||||||||||||||||
|
First Quarter
|
$
|
26.82
|
|
$
|
21.79
|
|
$
|
0.13
|
|
$
|
26.96
|
|
$
|
24.21
|
|
$
|
0.12
|
|
|||||
|
Second Quarter
|
27.45
|
|
23.43
|
|
0.13
|
|
29.75
|
|
22.55
|
|
0.12
|
|
|||||||||||
|
Third Quarter
|
28.07
|
|
24.69
|
|
0.13
|
|
26.87
|
|
22.86
|
|
0.12
|
|
|||||||||||
|
Fourth Quarter
|
39.03
|
|
27.42
|
|
0.13
|
|
29.62
|
|
24.39
|
|
0.12
|
|
|||||||||||
On February 21, 2017, the closing price for AGL's common shares on the NYSE was $41.36, and the approximate number of shareholders of record at the close of business on that date was 76.
AGL is a holding company whose principal source of income is dividends from its operating subsidiaries. The ability of the operating subsidiaries to pay dividends to AGL and AGL's ability to pay dividends to its shareholders are each subject to legal and regulatory restrictions. The declaration and payment of future dividends will be at the discretion of AGL's Board and will be dependent upon the Company's profits and financial requirements and other factors, including legal restrictions on the payment of dividends and such other factors as the Board deems relevant. For more information concerning AGL's dividends, please refer to Part II, Item 7. Management's Discussion and Analysis of Financial Condition and Results of Operations, Liquidity and Capital Resources and Item 8, Financial Statements and Supplementary Data, Note 11, Insurance Company Regulatory Requirements.
2016 Share Purchases
In 2016, the Company repurchased a total of
10.7 million
common shares for approximately
$306 million
, at an average price of
$28.53
per share. From time to time, the Board authorizes the repurchase of common shares. Most recently, on February 22, 2017, the Board approved an incremental
$300 million
in share repurchases, which brings the current authorization, as of February 23, 2017, to
$407 million
. The Company expects future common share repurchases under the current authorization to be made from time to time in the open market or in privately negotiated transactions. The timing, form and amount of the share repurchases are at the discretion of management and will depend on a variety of factors, including availability of funds at the holding companies, market conditions, the Company's capital position, legal requirements and other factors. The repurchase authorization may be modified, extended or terminated by the Board at any time. It does not have an expiration date. See Part II, Item 8, Financial Statements and Supplementary Data, Note 18, Shareholders' Equity for additional information about share repurchases and authorizations.
66
Issuer’s Purchases of Equity Securities
The following table reflects purchases of AGL common shares made by the Company during Fourth Quarter 2016.
|
Period
|
Total
Number of
Shares
Purchased
|
Average
Price Paid
Per Share
|
Total Number of
Shares Purchased as
Part of Publicly
Announced Program (1)
|
Maximum Number (or Approximate Dollar Value)
of Shares that
May Yet Be
Purchased
Under the Program(2)
|
||||||||||
|
October 1 - October 31
|
692,002
|
|
$
|
28.90
|
|
692,002
|
|
$
|
95,000,101
|
|
||||
|
November 1 - November 30
|
703,510
|
|
$
|
33.21
|
|
703,510
|
|
$
|
321,635,067
|
|
||||
|
December 1 - December 31
|
1,905,105
|
|
$
|
38.03
|
|
1,905,105
|
|
$
|
249,175,822
|
|
||||
|
Total
|
3,300,617
|
|
$
|
35.09
|
|
3,300,617
|
|
|
|
|||||
____________________
|
(1)
|
After giving effect to repurchases since the beginning of 2013 through February 23, 2017, the Company has repurchased a total of
72.2 million
common shares for approximately
$1,857 million
, excluding commissions, at an average price of
$25.71
per share.
|
|
(2)
|
Excludes commissions.
|
67
Performance Graph
Set forth below are a line graph and a table comparing the dollar change in the cumulative total shareholder return on AGL's common shares from December 31, 2011 through December 31, 2016 as compared to the cumulative total return of the Standard & Poor's 500 Stock Index and the cumulative total return of the Standard & Poor's 500 Financials Index. The chart and table depict the value on December 31, 2011, December 31, 2012, December 31, 2013, December 31, 2014, December 31, 2015 and December 31, 2016 of a $100 investment made on December 31, 2011, with all dividends reinvested:
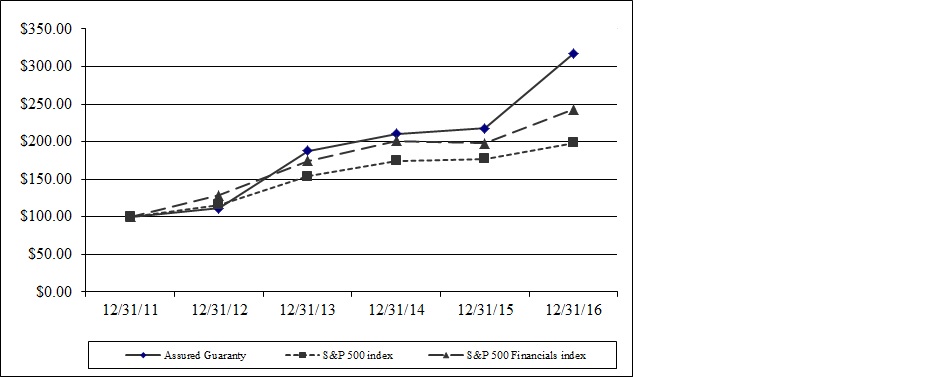
|
Assured Guaranty
|
S&P 500 Index
|
S&P 500
Financial Index
|
|||||||||
|
12/31/2011
|
$
|
100.00
|
|
$
|
100.00
|
|
$
|
100.00
|
|
||
|
12/31/2012
|
111.17
|
|
115.99
|
|
128.74
|
|
|||||
|
12/31/2013
|
187.70
|
|
153.54
|
|
174.56
|
|
|||||
|
12/31/2014
|
210.58
|
|
174.54
|
|
201.06
|
|
|||||
|
12/31/2015
|
217.95
|
|
176.93
|
|
197.92
|
|
|||||
|
12/31/2016
|
317.34
|
|
198.07
|
|
242.95
|
|
|||||
___________________
Source: Bloomberg
68
|
ITEM 6.
|
SELECTED FINANCIAL DATA
|
The following selected financial data should be read together with the other information contained in this Form 10-K, including "Management's Discussion and Analysis of Financial Condition and Results of Operations" and the consolidated financial statements and related notes included elsewhere in this Form 10-K.
|
|
Year Ended December 31,
|
||||||||||||||||||
|
|
2016
|
2015
|
2014
|
2013
|
2012
|
||||||||||||||
|
|
(dollars in millions, except per share amounts)
|
||||||||||||||||||
|
Statement of operations data:
|
|
|
|
|
|||||||||||||||
|
Revenues:
|
|
|
|
|
|||||||||||||||
|
Net earned premiums
|
$
|
864
|
|
$
|
766
|
|
$
|
570
|
|
$
|
752
|
|
$
|
853
|
|
||||
|
Net investment income
|
408
|
|
423
|
|
403
|
|
393
|
|
404
|
|
|||||||||
|
Net realized investment gains (losses)
|
(29
|
)
|
(26
|
)
|
(60
|
)
|
52
|
|
1
|
|
|||||||||
|
Realized gains and other settlements on credit derivatives
|
29
|
|
(18
|
)
|
23
|
|
(42
|
)
|
(108
|
)
|
|||||||||
|
Net unrealized gains (losses) on credit derivatives
|
69
|
|
746
|
|
800
|
|
107
|
|
(477
|
)
|
|||||||||
|
Fair value gains (losses) on committed capital securities
|
0
|
|
27
|
|
(11
|
)
|
10
|
|
(18
|
)
|
|||||||||
|
Fair value gains (losses) on financial guaranty variable interest entities
|
38
|
|
38
|
|
255
|
|
346
|
|
191
|
|
|||||||||
|
Bargain purchase gain and settlement of pre-existing relationships
|
259
|
|
214
|
|
—
|
|
—
|
|
—
|
|
|||||||||
|
Other income (loss)
|
39
|
|
37
|
|
14
|
|
(10
|
)
|
108
|
|
|||||||||
|
Total revenues
|
1,677
|
|
2,207
|
|
1,994
|
|
1,608
|
|
954
|
|
|||||||||
|
Expenses:
|
|
|
|
|
|||||||||||||||
|
Loss and loss adjustment expenses
|
295
|
|
424
|
|
126
|
|
154
|
|
504
|
|
|||||||||
|
Amortization of deferred acquisition costs
|
18
|
|
20
|
|
25
|
|
12
|
|
14
|
|
|||||||||
|
Interest expense
|
102
|
|
101
|
|
92
|
|
82
|
|
92
|
|
|||||||||
|
Other operating expenses
|
245
|
|
231
|
|
220
|
|
218
|
|
212
|
|
|||||||||
|
Total expenses
|
660
|
|
776
|
|
463
|
|
466
|
|
822
|
|
|||||||||
|
Income (loss) before (benefit) provision for income taxes
|
1,017
|
|
|
1,431
|
|
|
1,531
|
|
|
1,142
|
|
|
132
|
|
|||||
|
Provision (benefit) for income taxes
|
136
|
|
375
|
|
443
|
|
334
|
|
22
|
|
|||||||||
|
Net income (loss)
|
881
|
|
1,056
|
|
1,088
|
|
808
|
|
110
|
|
|||||||||
|
Earnings (loss) per share:
|
|
|
|
|
|||||||||||||||
|
Basic
|
$
|
6.61
|
|
$
|
7.12
|
|
$
|
6.30
|
|
$
|
4.32
|
|
$
|
0.58
|
|
||||
|
Diluted
|
$
|
6.56
|
|
$
|
7.08
|
|
$
|
6.26
|
|
$
|
4.30
|
|
$
|
0.57
|
|
||||
|
Dividends per share
|
$
|
0.52
|
|
$
|
0.48
|
|
$
|
0.44
|
|
$
|
0.40
|
|
$
|
0.36
|
|
||||
69
|
|
As of December 31,
|
||||||||||||||||||
|
|
2016
|
2015
|
2014
|
2013
|
2012
|
||||||||||||||
|
|
(dollars in millions, except per share amounts)
|
||||||||||||||||||
|
Balance sheet data (end of period):
|
|
|
|
|
|||||||||||||||
|
Assets:
|
|
|
|
|
|||||||||||||||
|
Investments and cash
|
$
|
11,103
|
|
$
|
11,358
|
|
$
|
11,459
|
|
$
|
10,969
|
|
$
|
11,223
|
|
||||
|
Premiums receivable, net of commissions payable
|
576
|
|
693
|
|
729
|
|
876
|
|
1,005
|
|
|||||||||
|
Ceded unearned premium reserve
|
206
|
|
232
|
|
381
|
|
452
|
|
561
|
|
|||||||||
|
Salvage and subrogation recoverable
|
365
|
|
126
|
|
151
|
|
174
|
|
456
|
|
|||||||||
|
Credit derivative assets
|
13
|
|
81
|
|
68
|
|
94
|
|
141
|
|
|||||||||
|
Total assets
|
14,151
|
|
14,544
|
|
14,919
|
|
16,285
|
|
17,240
|
|
|||||||||
|
Liabilities and shareholders' equity:
|
|
||||||||||||||||||
|
Unearned premium reserve
|
3,511
|
|
3,996
|
|
4,261
|
|
4,595
|
|
5,207
|
|
|||||||||
|
Loss and loss adjustment expense reserve
|
1,127
|
|
1,067
|
|
799
|
|
592
|
|
601
|
|
|||||||||
|
Reinsurance balances payable, net
|
64
|
|
51
|
|
107
|
|
148
|
|
219
|
|
|||||||||
|
Long-term debt
|
1,306
|
|
1,300
|
|
1,297
|
|
814
|
|
834
|
|
|||||||||
|
Credit derivative liabilities
|
402
|
|
446
|
|
963
|
|
1,787
|
|
1,934
|
|
|||||||||
|
Total liabilities
|
7,647
|
|
8,481
|
|
9,161
|
|
11,170
|
|
12,246
|
|
|||||||||
|
Accumulated other comprehensive income
|
149
|
|
237
|
|
370
|
|
160
|
|
515
|
|
|||||||||
|
Shareholders' equity
|
6,504
|
|
6,063
|
|
5,758
|
|
5,115
|
|
4,994
|
|
|||||||||
|
Book value per share
|
50.82
|
|
43.96
|
|
36.37
|
|
28.07
|
|
25.74
|
|
|||||||||
|
Consolidated statutory financial information:
|
|
||||||||||||||||||
|
Contingency reserve
|
$
|
2,008
|
|
$
|
2,263
|
|
$
|
2,330
|
|
$
|
2,934
|
|
$
|
2,364
|
|
||||
|
Policyholders' surplus
|
5,036
|
|
4,550
|
|
4,142
|
|
3,202
|
|
3,579
|
|
|||||||||
|
Claims-paying resources(1)
|
11,701
|
|
12,306
|
|
12,189
|
|
12,147
|
|
12,328
|
|
|||||||||
|
Outstanding Exposure:
|
|
||||||||||||||||||
|
Net debt service outstanding
|
$
|
437,535
|
|
$
|
536,341
|
|
$
|
609,622
|
|
$
|
690,535
|
|
$
|
780,356
|
|
||||
|
Net par outstanding
|
296,318
|
|
358,571
|
|
403,729
|
|
459,107
|
|
518,772
|
|
|||||||||
___________________
|
(1)
|
Based on accounting practices prescribed or permitted by U.S. insurance regulatory authorities, for all insurance subsidiaries. Claims-paying resources is calculated as the sum of statutory policyholders' surplus, statutory contingency reserve, statutory unearned premium reserves, statutory loss and LAE reserves, present value of installment premium on financial guaranty and credit derivatives, discounted at 6%, and standby lines of credit/stop loss. Total claims-paying resources is used by the Company to evaluate the adequacy of capital resources. Includes an aggregate excess-of-loss reinsurance facility for
$360 million
for December 31, 2016 and 2015, $450 million for December 31, 2014 and $435 million for December 31, 2013 and 2012. See Part II, Item 8, Financial Statements and Supplementary Data, Note 13, Reinsurance and Other Monoline Exposures.
|
70
|
ITEM 7.
|
MANAGEMENT'S DISCUSSION AND ANALYSIS OF FINANCIAL CONDITION AND RESULTS OF OPERATIONS
|
The following discussion and analysis of the Company’s financial condition and results of operations should be read in conjunction with the Company’s consolidated financial statements and accompanying notes which appear elsewhere in this Form 10-K. It contains forward looking statements that involve risks and uncertainties. Please see “Forward Looking Statements” for more information. The Company's actual results could differ materially from those anticipated in these forward looking statements as a result of various factors, including those discussed below and elsewhere in this Form 10-K, particularly under the headings “Risk Factors” and “Forward Looking Statements.”
Introduction
The Company provides credit protection products to the U.S. and international public finance (including infrastructure) and structured finance markets. The Company applies its credit underwriting judgment, risk management skills and capital markets experience primarily to offer financial guaranty insurance that protects holders of debt instruments and other monetary obligations from defaults in scheduled payments. If an obligor defaults on a scheduled payment due on an obligation, including a scheduled principal or interest payment, the Company is required under its unconditional and irrevocable financial guaranty to pay the amount of the shortfall to the holder of the obligation. The Company markets its financial guaranty insurance directly to issuers and underwriters of public finance and structured finance securities as well as to investors in such obligations. The Company guarantees obligations issued principally in the U.S. and the U.K., and also guarantees obligations issued in other countries and regions, including Australia and Western Europe. The Company also provides other forms of insurance that are in line with its risk profile and benefit from its underwriting experience.
Executive Summary
This executive summary of management’s discussion and analysis highlights selected information and may not contain all of the information that is important to readers of this Annual Report. For a more detailed description of events, trends and uncertainties, as well as the capital, liquidity, credit, operational and market risks and the critical accounting policies and estimates affecting the Company, this Annual Report should be read in its entirety.
Economic Environment
The amount and pricing of new business the Company originates, as well as the financial health of the issuers whose obligations it insures, depend in part on the economic environment in the markets it serves, including the level of interest rates and credit spreads in those markets.
The overall U.S. economic environment continued improving during 2016. The U.S. Department of Commerce Bureau of Economic Analysis reported an advanced estimate that real gross domestic product increased 1.6% during 2016. According to the U.S. Bureau of Labor Statistics (BLS), the U.S. economy added an estimated 2.2 million jobs during 2016, and the estimated monthly unemployment rate did not exceed 5.0% in any month of the year, falling in the fourth quarter to levels not seen since 2007. Federal Reserve Board Chairman Janet Yellen stated in January 2017 that labor utilization was close to a normal level and other measures of labor utilization had improved appreciably.
The U.S. stock market trended higher during 2016 in response to continuing signs of economic improvement, although investors experienced considerable volatility related to oil prices, global economic uncertainty, and political developments such as the British electorate's vote in favor of Britain exiting the European Union (Brexit) and the U.S. presidential election. Stock market indices rose to record levels in the fourth quarter.
U.S. home prices, as measured by the S&P CoreLogic Case-Shiller U.S. National Home Price Index, continued to rise at a 5.6% rate over the 12 months ended November 30, 2016.
From the beginning of the year, the Federal Open Market Committee (FOMC) supported further improvement in labor market conditions and a return to 2% inflation. It maintained the target range for the federal funds rate at 1/4 to 1/2 percent until mid-December, when it raised it a quarter point to 1/2 to 3/4 percent and projected three additional increases during 2017. Average municipal interest rates were extremely low during the year, with the 30-year AAA MMD Index falling at times below 2%, a threshold not previously crossed in the modern era. The low rates helped produce record issuance in the U.S. municipal bond market while constraining the opportunities for bond insurers to add financial value.
71
Financial Performance of Assured Guaranty
Financial Results
|
|
Year Ended December 31,
|
||||||||||
|
|
2016
|
2015
|
2014
|
||||||||
|
|
(in millions, except per share amounts)
|
||||||||||
|
Net income (loss)
|
$
|
881
|
|
$
|
1,056
|
|
$
|
1,088
|
|
||
|
Operating income (non-GAAP)(1)
|
895
|
|
710
|
|
647
|
|
|||||
|
Gain (loss) related to the effect of consolidating FG VIEs (FG VIE consolidation) included in operating income
|
12
|
|
11
|
|
156
|
|
|||||
|
Net income (loss) per diluted share
|
6.56
|
|
7.08
|
|
6.26
|
|
|||||
|
Operating income per share (non-GAAP)(1)
|
6.68
|
|
4.76
|
|
3.73
|
|
|||||
|
Gain (loss) related to FG VIE consolidation included in operating income per share
|
0.10
|
|
0.07
|
|
0.90
|
|
|||||
|
Diluted shares
|
134.1
|
|
149.0
|
|
173.6
|
|
|||||
|
Gross written premiums (GWP)
|
154
|
|
181
|
|
104
|
|
|||||
|
Present value of new business production (PVP)(1)
|
214
|
|
179
|
|
168
|
|
|||||
|
Gross par written
|
17,854
|
|
17,336
|
|
13,171
|
|
|||||
|
As of December 31, 2016
|
As of December 31, 2015
|
|||||||||||||||
|
Amount
|
Per Share
|
Amount
|
Per Share
|
|||||||||||||
|
(in millions, except per share amounts)
|
||||||||||||||||
|
Shareholders' equity
|
$
|
6,504
|
|
$
|
50.82
|
|
$
|
6,063
|
|
$
|
43.96
|
|
||||
|
Non-GAAP operating shareholders' equity(1)
|
6,386
|
|
49.89
|
|
5,925
|
|
42.96
|
|
||||||||
|
Non-GAAP adjusted book value(1)
|
8,506
|
|
66.46
|
|
8,396
|
|
60.87
|
|
||||||||
|
Gain (loss) related to FG VIE consolidation included in non-GAAP operating shareholders' equity
|
(7
|
)
|
(0.06
|
)
|
(21
|
)
|
(0.15
|
)
|
||||||||
|
Gain (loss) related to FG VIE consolidation included in non-GAAP adjusted book value
|
(24
|
)
|
(0.18
|
)
|
(43
|
)
|
(0.31
|
)
|
||||||||
|
Common shares outstanding (2)
|
128.0
|
|
137.9
|
|
||||||||||||
____________________
|
(1)
|
Please refer to “—Non-GAAP Financial Measures” for a definition of the financial measures that were not determined in accordance with GAAP and a reconciliation of the non-GAAP financial measure to the most directly comparable GAAP measure, if available. Please note that the Company changed its definition of Operating Income, Non-GAAP Operating Shareholders' Equity and Non-GAAP Adjusted Book Value starting in fourth quarter 2016 in response to new non-GAAP guidance issued by the SEC in 2016. Please refer to “—Non-GAAP Financial Measures” for additional details.
|
|
(2)
|
Please refer to "Key Business Strategies – Capital Management" below for information on common share repurchases.
|
Year Ended December 31, 2016
Several primary drivers of volatility in net income or loss are not necessarily indicative of credit impairment or improvement, or ultimate economic gains or losses: changes in credit spreads of insured credit derivative obligations; changes in fair value of assets and liabilities of financial guaranty variable interest entities (FG VIEs) and committed capital securities (CCS); changes in the Company's own credit spreads; and changes in risk-free rates used to discount expected losses. Changes in credit spreads generally have the most significant effect on the fair value of credit derivatives and FG VIE assets and liabilities. In addition to non-economic factors, other factors such as: changes in expected losses, the amount and timing of refunding transactions and terminations, realized gains and losses on the investment portfolio (including other-than-temporary impairments), the effects of large settlements and transactions, acquisitions, and the effects of the Company's various loss mitigation strategies, among others, may also have a significant effect on reported net income or loss in a given reporting period.
72
Net income for
2016
was
$881 million
compared with
$1,056 million
in
2015
. The decrease was due primarily to lower fair value gains on credit derivatives in 2016 compared with 2015. This was offset in part by lower loss and LAE and higher premium accelerations.
Under the revised calculation of non-GAAP measures explained in "Non-GAAP Financial Measures" below, the Company reported operating income of
$895 million
in
2016
, compared with
$710 million
in
2015
. The increase in operating income was primarily due to lower operating loss and LAE and higher premium accelerations.
Shareholders' equity increased since December 31, 2015 due primarily to positive net income (including the effect of the CIFG Acquisition), which was partially offset by share repurchases, lower net unrealized gains on available for sale investment securities recorded in AOCI, and dividends. Non-GAAP operating shareholders' equity and non-GAAP adjusted book value also increased since December 31, 2015 due to positive operating income (including the effect of the CIFG Acquisition), offset in part by share repurchases and dividends. Book value, non-GAAP operating shareholders' equity per share and non-GAAP adjusted book value per share also benefited from the repurchase of
10.7 million
common shares in 2016.
Key Business Strategies
The Company continually evaluates its business strategies. Currently, the Company is pursuing the following business strategies, each described in more detail below:
|
•
|
New business production
|
|
•
|
Capital management
|
|
•
|
Alternative strategies to create value, including through acquisitions, investments and commutations
|
|
•
|
Loss mitigation
|
New Business Production
The Company believes high-profile defaults by municipal obligors, such as the Commonwealth of Puerto Rico, Detroit, Michigan and Stockton, California have led to increased awareness of the value of bond insurance and stimulated demand for the product. The Company believes there will be continued demand for its insurance in this market because, for those exposures that the Company guarantees, it undertakes the tasks of credit selection, analysis, negotiation of terms, surveillance and, if necessary, loss mitigation. The Company believes that its insurance:
|
•
|
encourages retail investors, who typically have fewer resources than the Company for analyzing municipal bonds, to purchase such bonds;
|
|
•
|
enables institutional investors to operate more efficiently; and
|
|
•
|
allows smaller, less well-known issuers to gain market access on a more cost-effective basis.
|
On the other hand, the persistently low interest rate environment has dampened demand for bond insurance and, after a number of years in which the Company was essentially the only financial guarantor, there are now two other financial guarantors active in one of its markets.
73
U.S. Municipal Market Data and Penetration Rates (1)
Based on Sale Date
|
|
Year Ended December 31,
|
||||||||||
|
2016
|
2015
|
2014
|
|||||||||
|
(dollars in billions, except number of issues and percent)
|
|||||||||||
|
Par:
|
|||||||||||
|
New municipal bonds issued
|
$
|
423.7
|
|
$
|
377.6
|
|
$
|
314.9
|
|
||
|
Total insured
|
$
|
25.3
|
|
$
|
25.2
|
|
$
|
18.5
|
|
||
|
Insured by Assured Guaranty
|
$
|
14.2
|
|
$
|
15.1
|
|
$
|
10.7
|
|
||
|
Number of issues:
|
|||||||||||
|
New municipal bonds issued
|
12,271
|
|
12,076
|
|
10,162
|
|
|||||
|
Total insured
|
1,889
|
|
1,880
|
|
1,403
|
|
|||||
|
Insured by Assured Guaranty
|
904
|
|
1,009
|
|
697
|
|
|||||
|
Market penetration based on:
|
|||||||||||
|
Par
|
6.0
|
%
|
6.7
|
%
|
5.9
|
%
|
|||||
|
Number of issues
|
15.4
|
%
|
15.6
|
%
|
13.8
|
%
|
|||||
|
Single A par sold
|
22.6
|
%
|
22.1
|
%
|
19.7
|
%
|
|||||
|
Single A transactions sold
|
55.8
|
%
|
54.1
|
%
|
49.3
|
%
|
|||||
|
$25 million and under par sold
|
17.8
|
%
|
18.7
|
%
|
16.5
|
%
|
|||||
|
$25 million and under transactions sold
|
17.5
|
%
|
17.6
|
%
|
15.4
|
%
|
|||||
(1) Source: Thomson Reuters.
74
New Business Production
|
|
Year Ended December 31,
|
||||||||||
|
|
2016
|
2015
|
2014
|
||||||||
|
|
(in millions)
|
||||||||||
|
GWP
|
|||||||||||
|
Public Finance—U.S.
|
$
|
142
|
|
$
|
119
|
|
$
|
122
|
|
||
|
Public Finance—non-U.S.
|
15
|
|
41
|
|
6
|
|
|||||
|
Structured Finance—U.S.
|
(1
|
)
|
23
|
|
(32
|
)
|
|||||
|
Structured Finance—non-U.S.
|
(2
|
)
|
(2
|
)
|
8
|
|
|||||
|
Total GWP
|
$
|
154
|
|
$
|
181
|
|
$
|
104
|
|
||
|
PVP(1):
|
|||||||||||
|
Public Finance—U.S.
|
$
|
161
|
|
$
|
124
|
|
$
|
128
|
|
||
|
Public Finance—non-U.S.
|
25
|
|
27
|
|
7
|
|
|||||
|
Structured Finance—U.S. (2)
|
27
|
|
22
|
|
24
|
|
|||||
|
Structured Finance—non-U.S.
|
1
|
|
6
|
|
9
|
|
|||||
|
Total PVP
|
$
|
214
|
|
$
|
179
|
|
$
|
168
|
|
||
|
Gross Par Written:
|
|||||||||||
|
Public Finance—U.S.
|
$
|
16,039
|
|
$
|
16,377
|
|
$
|
12,275
|
|
||
|
Public Finance—non-U.S.
|
677
|
|
567
|
|
128
|
|
|||||
|
Structured Finance—U.S. (2)
|
1,114
|
|
327
|
|
418
|
|
|||||
|
Structured Finance—non-U.S.
|
24
|
|
65
|
|
350
|
|
|||||
|
Total gross par written
|
$
|
17,854
|
|
$
|
17,336
|
|
$
|
13,171
|
|
||
____________________
|
(1)
|
PVP and Gross Par Written in the table above are based on "close date," when the transaction settles. See “– Non-GAAP Financial Measures – PVP or Present Value of New Business Production.”
|
|
(2)
|
Includes a structured capital relief Triple-X excess of loss life reinsurance transaction written in 2016.
|
GWP include amounts collected in the current year on upfront new business written, the present value of contractual or expected premiums on new business written (discounted at risk free rates), and the effects of changes in the estimated lives of transactions in the inforce book of business. The decrease in GWP to
$154 million
in 2016 from
$181 million
in 2015, was due primarily to changes in estimated lives.
For the year ended December 31, 2016 compared with the year ended December 31, 2015, PVP increased by approximately 20% to $214 million, primarily due to an increase in secondary market U.S. public finance new business.
Outside the U.S., the Company generated $26 million of PVP in 2016 compared with $33 million of PVP in 2015. Non-U.S. public finance business generally represents European infrastructure transactions. The Company believes the U.K. currently presents the most new business opportunities for financial guarantees of infrastructure financings, which have typically required such guarantees for capital market access. These transactions typically have long lead times. The Company believes it is the only company in the private sector offering such financial guarantees outside the United States.
Structured finance transactions tend to have long lead times and may vary from period to period In general, the Company expects that structured finance opportunities will increase in the future as the global economy recovers, interest rates rise, more issuers return to the capital markets for financings and institutional investors again utilize financial guaranties. The Company considers its involvement in both structured finance and international infrastructure transactions to be beneficial because such transactions diversify both the Company's business opportunities and its risk profile beyond public finance. This category also includes a structured capital relief Triple-X excess of loss life reinsurance transaction.
The difference between GWP and PVP relates primarily to the difference in discount rates used in the calculation of PVP compared with GWP and the inclusion in GWP of the effects of changes in lives of the existing insured portfolio.
75
Capital Management
In recent years, the Company has developed strategies to manage capital within the Assured Guaranty group more efficiently.
In 2016, AGM sought and received approval from the NYDFS to repurchase $300 million of its common stock from its parent, Assured Guaranty Municipal Holdings Inc. (AGMH). The repurchase was effectuated on December 19, 2016. Subsequently, AGMH distributed the proceeds as dividends to its immediate parent, AGUS, and in 2017, AGUS began using these proceeds to pay dividends to AGL. AGL intends to use these funds predominantly to repurchase its publicly traded common shares. AGM and AGC have also been paying dividends to their parents, and MAC may also pay dividends to its parents. See Part II, Item 8, Financial Statements and Supplementary Data, Note 11, Insurance Company Regulatory Requirements for additional information about dividends the Company's insurance companies may and have paid.
In 2014, AGUS issued 5.0% Senior Notes for net proceeds of $495 million. The net proceeds from the sale of the notes were used for general corporate purposes, including the repurchase of common shares of AGL.
From 2013 through February 23, 2017, the Company has repurchased a total of 72.2 million common shares for approximately $1,857 million, excluding commissions. On February 22, 2017 the Board of Directors authorized an additional
$300 million
in share repurchases. As of February 23, 2017,
$407 million
of authority remains under the Company's share repurchase authorizations. The Company expects the repurchases to be made from time to time in the open market or in privately negotiated transactions. The timing, form and amount of the share repurchases under the program are at the discretion of management and will depend on a variety of factors, including free funds available at the parent company, market conditions, the Company's capital position, legal requirements and other factors. The repurchase program may be modified, extended or terminated by the Board at any time. It does not have an expiration date. See Part II, Item 8, Financial Statements and Supplementary Data, Note 18, Shareholders' Equity, for additional information about the Company's repurchases of its common shares.
Summary of Share Repurchases
|
Amount
|
Number of Shares
|
Average price per share
|
||||||||
|
(in millions, except per share data)
|
||||||||||
|
2013
|
$
|
264
|
|
12.5
|
|
$
|
21.12
|
|
||
|
2014
|
590
|
|
24.4
|
|
24.17
|
|
||||
|
2015
|
555
|
|
21.0
|
|
26.43
|
|
||||
|
2016
|
306
|
|
10.7
|
|
28.53
|
|
||||
|
2017 (through February 23, 2017)
|
142
|
|
3.6
|
|
39.65
|
|
||||
|
Cumulative repurchases since the beginning of 2013
|
$
|
1,857
|
|
72.2
|
|
$
|
25.71
|
|
||
Accretive Effect of Cumulative Repurchases(1)
|
Year Ended December 31,
|
||||||||||||||||
|
2016
|
2015
|
As of
December 31, 2016 |
As of
December 31, 2015 |
|||||||||||||
|
(per share)
|
||||||||||||||||
|
Net income
|
$
|
1.90
|
|
$
|
1.56
|
|
||||||||||
|
Operating income
|
1.94
|
|
1.00
|
|
||||||||||||
|
Shareholders' equity
|
$
|
8.92
|
|
$
|
5.75
|
|
||||||||||
|
Non-GAAP operating shareholders' equity
|
8.59
|
|
5.45
|
|
||||||||||||
|
Non-GAAP adjusted book value
|
14.38
|
|
10.74
|
|
||||||||||||
_________________
|
(1)
|
Cumulative repurchases since the beginning of 2013.
|
76
In order to reduce leverage, and possibly rating agency capital charges, the Company has mutually agreed with beneficiaries to terminate selected financial guaranty insurance and credit derivative contracts. In particular, the Company has targeted investment grade securities for which claims are not expected but which carry a disproportionately large rating agency capital charge. The Company terminated investment grade financial guaranty and CDS contracts with net par of $6.6 billion in 2016, $2.8 billion in 2015 and $3.1 billion in 2014.
Alternative Strategies
The Company considers alternative strategies in order to create long-term shareholder value. For example, the Company considers opportunities to acquire financial guaranty portfolios, whether by acquiring financial guarantors who are no longer actively writing new business or their insured portfolios, or by commuting business that it had previously ceded. These transactions enable the Company to improve its future earnings and deploy some of its excess capital. During 2016, the Company established an alternative investments group to focus on deploying a portion of the Company's excess capital to pursue acquisitions and develop new business opportunities that complement the Company's financial guaranty business, are in line with its risk profile and benefit from its core competencies.
CIFG Holding Inc.
On July 1, 2016, AGC acquired all of the issued and outstanding capital stock of CIFGH, for
$450.6 million
in cash. AGUS previously owned
1.6%
of the outstanding shares of CIFGH, for which it received
$7.1 million
in consideration from AGC, resulting in a net consolidated purchase price of
$443 million
. AGC merged CIFGNA with and into AGC, with AGC as the surviving company, on July 5, 2016. The CIFG Acquisition added
$4.2 billion
of net par insured on July 1, 2016. In 2016, the acquisition contributed net income and operating income of approximately
$2.41
per share and
$2.38
per share, respectively, including the bargain purchase gain, loss on settlement of pre-existing relationships and activity since the the date of the CIFG Acquisition (CIFG Acquisition Date). Shareholders' equity benefited by $2.23 per share, non-GAAP operating shareholders' equity benefited by $2.23 per share and non-GAAP adjusted book value benefited by $3.85 per share as of the CIFG Acquisition Date.
Radian Asset Assurance Inc.
On April 1, 2015 (the Radian Acquisition Date), AGC completed the acquisition of Radian Asset for a cash purchase price of $804.5 million. In connection with the acquisition, AGC acquired Radian Asset’s entire insured portfolio, which resulted in an increase in net par outstanding as of the Radian Acquisition Date of approximately $13.6 billion, consisting of $9.4 billion of public finance net par outstanding and $4.2 billion of structured finance net par outstanding. In 2015, the acquisition contributed net income of approximately $2.46 per share and operating income of approximately $2.13 per share, including the bargain purchase gain, settlement of pre-existing relationships and activity since the Radian Acquisition Date. Shareholders' equity benefited by $1.04 per share, non-GAAP operating shareholders' equity benefited by $1.26 per share and non-GAAP adjusted book value benefited by $3.73 per share as of the Radian Acquisition Date.
MBIA UK Insurance Limited
.
On January 10, 2017, AGC completed its acquisition of MBIA UK Insurance Limited (MBIA UK), the European operating subsidiary of MBIA. As consideration for the outstanding shares of MBIA UK plus
$23 million
in cash, AGC exchanged all its holdings of notes issued in the Zohar II 2005-1 transaction. AGC’s Zohar II 2005-1 notes had a total outstanding principal of approximately
$347 million
and fair value of
$334 million
as of the date of acquisition. MBIA insured all of the notes issued in the Zohar II 2005-1 transaction. As of December 31, 2016, MBIA UK had an insured portfolio of approximately
$12 billion
of net par. MBIA UK has changed its name to Assured Guaranty (London) Ltd. (AGLN). Assured Guaranty currently maintains AGLN as a stand-alone entity. Assured Guaranty is actively working to combine AGLN with its other affiliated European insurance companies. Any such combination will be subject to regulatory and court approvals; as a result, Assured Guaranty cannot predict when, or if, such a combination will be completed.
Alternative Investments.
The alternative investments group has been investigating a number of new business opportunities that complement the Company's financial guaranty business, are in line with its risk profile and benefit from its core competencies, including, among others, both controlling and non-controlling investments in investment managers. In February 2017 the Company agreed to purchase up to $100 million of limited partnership interests in a fund that invests in the equity of private equity managers. The Company continues to investigate additional opportunities.
Commutations.
The Company entered into various commutation agreements to reassume previously ceded business in 2016, 2015 and 2014 that resulted in gains of
$8 million
in 2016,
$28 million
in 2015 and
$23 million
in 2014 and additional net unearned premium reserve of
$0
in 2016,
$23 million
in 2015 and
$20 million
in 2014. The commutation gains were recorded in other income. The Company may also in the future enter into new commutation agreements reassuming portions of its remaining previously ceded business.
77
Loss Mitigation
In an effort to avoid or reduce potential losses in its insurance portfolios, the Company employs a number of strategies.
In the public finance area, the Company believes that its experience and the resources it is prepared to deploy, as well as its ability to provide bond insurance or other contributions as part of a solution, has resulted in more favorable outcomes in distressed public finance situations than would have been the case without its participation, as illustrated, for example, by the Company's role in the Detroit, Michigan; Stockton, California; and Jefferson County, Alabama financial crises. Currently, the Company is an active participant in discussions with the Commonwealth of Puerto Rico and its advisors with respect to a number of Puerto Rico credits. For example, on December 24, 2015, AGC and AGM entered into a Restructuring Support Agreement (RSA) with Puerto Rico Electric Power Authority (PREPA), an ad hoc group of uninsured bondholders and a group of fuel-line lenders that would, subject to certain conditions, result in, among other things, modernization of the utility and a restructuring of current debt. Legislation meeting the requirements of the RSA was enacted on February 16, 2016, and a transition charge to be paid by PREPA rate payers for debt service on the securitization bonds as contemplated by the RSA was approved by the Puerto Rico Energy Commission on June 20, 2016. The closing of the restructuring transaction and the issuance of the surety bonds are subject to certain conditions, including execution of acceptable documentation and legal opinions. There can be no assurance that the conditions in the RSA will be met or that, if the conditions are met, the RSA's other provisions, including those related to the restructuring of the insured PREPA revenue bonds, will be implemented as currently agreed. In addition, there also can be no assurance that the negotiations with respect to other Puerto Rico credits will result in agreements on a consensual recovery plans.
The Company is currently working with the servicers of some of the RMBS it insures to encourage the servicers to provide alternatives to distressed borrowers that will encourage them to continue making payments on their loans and so improve the performance of the related RMBS. Many of the home equity lines of credit (HELOC) loans underlying the HELOC RMBS have entered or are entering their amortization periods, which results in material increases to the size of the monthly payments the borrowers are required to make.
The Company also continues to purchase attractively priced obligations, including BIG obligations, that it has insured and for which it has expected losses to be paid, in order to mitigate the economic effect of insured losses (loss mitigation securities). The fair value of assets purchased for loss mitigation purposes as of
December 31, 2016
(excluding the value of the Company's insurance) was $1,299 million, with a par of $2,243 million (including bonds related to FG VIEs of $49 million in fair value and $236 million in par).
In some instances, the terms of the Company's policy gives it the option to pay principal on an accelerated basis on an obligation on which it has paid a claim, thereby reducing the amount of guaranteed interest due in the future. The Company has at times exercised this option, which uses cash but reduces projected future losses.
In an effort to recover losses the Company experienced in its insured U.S. RMBS portfolio, the Company also continues to pursue providers of representations and warranties (R&W) by enforcing R&W provisions in contracts, negotiating agreements with R&W providers relating to those provisions and, where appropriate, pursuing litigation against R&W providers. See Part II, Item 8, Financial Statements and Supplementary Data, Note 5, Expected Loss to be Paid.
Other Events
Brexit
The Company is evaluating the impact on its business of the referendum held in the U.K on June 23, 2016, in which a majority voted to exit the EU, known as “Brexit”. Negotiations are expected to commence soon to determine the future terms of the U.K’s relationship with the EU, including the terms of trade between the U.K. and the EU. The negotiations, once commenced, are likely to last for two years, or possibly more. Brexit may impact laws, rules and regulations applicable to the Company’s U.K. subsidiaries and U.K. operations.
The Company cannot predict the direction Brexit-related developments will take nor the impact of those developments on the economies of the markets the Company serves, which may materially adversely affect the Company’s business, results of operations and financial condition, but the Company has identified certain areas where Brexit may impact its business:
|
•
|
Currency Impact.
The Company reports its accounts in U.S. dollars, while some of its income, expenses, assets and liabilities are denominated in other currencies, primarily the pound sterling and the euro. From December 31,
|
78
2015 to December 31, 2016, the value of pound sterling dropped from
£0.68 per dollar
to
£0.81 per dollar
, while the euro dropped from
€0.83 per dollar
to
€0.95 per dollar
. For the year ended 2016 the Company recognized losses of approximately
$21 million
in the consolidated statement of operations, net of tax, and approximately
$32 million
in OCI, net of tax, for foreign currency translation, that were primarily driven by the exchange rate fluctuations of the pound sterling. If the Company had owned AGLN during 2016, these impacts would have been greater.
|
•
|
U.K. Business.
As of
December 31, 2016
, approximately $15.9 billion of the Company’s insured net par is to risks located in the U.K., and most of that exposure is to utilities, with much of the rest to hospital facilities, toll roads, government accommodation, housing associations, universities and other public purpose enterprises that the Company believes are not overly vulnerable to Brexit pressures. AGE is currently authorized by the PRA of the Bank of England with permissions sufficient to enable AGE to effect and carry out financial guaranty insurance and reinsurance in the U.K. Most of the new transactions insured by AGE since 2008 have been in the U.K. As of December 31, 2016, approximately $10.0 billion of insured net par of AGLN, which the Company acquired in January 2017, is to risks located in the U.K.
|
|
•
|
Business Elsewhere in the EU.
As of
December 31, 2016
, approximately $5.5 billion of the Company’s insured net par is to risks located in EU and EEA countries other than the U.K. As of December 31, 2016, approximately $1.5 billion of insured net par of AGLN, which the Company acquired in January 2017, is to risks located in EU and EEA countries other than the U.K. Currently, EU directives allow AGE to conduct business in other EU or EEA states based on its PRA permissions. This is sometimes called “passporting”. Depending on the terms of Brexit, AGE may, once Brexit is implemented, lose the ability to insure new transactions from London in non-U.K. EU and EEA countries without obtaining additional licenses, which may require a presence in another EU country. While pertinent laws and regulations have yet to be adopted or passed, the Company does not believe Brexit will adversely affect its surveillance and loss mitigation activities with respect to existing insured transactions in non-U.K. EU and EEA countries, except to the extent Brexit inhibits the issuance of new guaranties in distressed situations in non-U.K. EU or EEA countries. As noted above, most of the new transactions insured by AGE since 2008 have been in the U.K.
|
|
•
|
Employees.
While nearly one-third of the employees working in AGE’s London office are non-U.K. EU or EEA citizens, most of those employees currently qualify, and the Company expects the rest to qualify within the next two years, to become permanent residents under current U.K. law.
|
79
Results of Operations
Estimates and Assumptions
The Company’s consolidated financial statements include amounts that are determined using estimates and assumptions. The actual amounts realized could ultimately be materially different from the amounts currently provided for in the Company’s consolidated financial statements. Management believes the most significant items requiring inherently subjective and complex estimates are expected losses, fair value estimates, other-than-temporary impairment, deferred income taxes, and premium revenue recognition. The following discussion of the results of operations includes information regarding the estimates and assumptions used for these items and should be read in conjunction with the notes to the Company’s consolidated financial statements.
An understanding of the Company’s accounting policies is of critical importance to understanding its consolidated financial statements. See Part II, Item 8, Financial Statements and Supplementary Data, for a discussion of the significant accounting policies, the loss estimation process, and the fair value methodologies.
The Company carries a significant amount of its assets and a portion of its liabilities at fair value, the majority of which are measured at fair value on a recurring basis. Level 3 assets, consisting primarily of FG VIE’ assets, credit derivative assets and investments, represented approximately 19% and 20% of the total assets that are measured at fair value on a recurring basis as of
December 31, 2016
and
2015
, respectively. All of the Company's liabilities that are measured at fair value are Level 3. See Part II, Item 8, Financial Statements and Supplementary Data, Note 7, Fair Value Measurement, in for additional information about assets and liabilities classified as Level 3.
80
Consolidated Results of Operations
Consolidated Results of Operations
|
|
Year Ended December 31,
|
||||||||||
|
|
2016
|
2015
|
2014
|
||||||||
|
|
(in millions)
|
||||||||||
|
Revenues:
|
|||||||||||
|
Net earned premiums
|
$
|
864
|
|
$
|
766
|
|
$
|
570
|
|
||
|
Net investment income
|
408
|
|
423
|
|
403
|
|
|||||
|
Net realized investment gains (losses)
|
(29
|
)
|
(26
|
)
|
(60
|
)
|
|||||
|
Net change in fair value of credit derivatives:
|
|||||||||||
|
Realized gains (losses) and other settlements
|
29
|
|
(18
|
)
|
23
|
|
|||||
|
Net unrealized gains (losses)
|
69
|
|
746
|
|
800
|
|
|||||
|
Net change in fair value of credit derivatives
|
98
|
|
728
|
|
823
|
|
|||||
|
Fair value gains (losses) on CCS
|
0
|
|
27
|
|
(11
|
)
|
|||||
|
Fair value gains (losses) on FG VIEs
|
38
|
|
38
|
|
255
|
|
|||||
|
Bargain purchase gain and settlement of pre-existing relationships
|
259
|
|
214
|
|
—
|
|
|||||
|
Other income (loss)
|
39
|
|
37
|
|
14
|
|
|||||
|
Total revenues
|
1,677
|
|
2,207
|
|
1,994
|
|
|||||
|
Expenses:
|
|||||||||||
|
Loss and LAE
|
295
|
|
424
|
|
126
|
|
|||||
|
Amortization of deferred acquisition costs
|
18
|
|
20
|
|
25
|
|
|||||
|
Interest expense
|
102
|
|
101
|
|
92
|
|
|||||
|
Other operating expenses
|
245
|
|
231
|
|
220
|
|
|||||
|
Total expenses
|
660
|
|
776
|
|
463
|
|
|||||
|
Income (loss) before provision for income taxes
|
1,017
|
|
1,431
|
|
1,531
|
|
|||||
|
Provision (benefit) for income taxes
|
136
|
|
375
|
|
443
|
|
|||||
|
Net income (loss)
|
$
|
881
|
|
$
|
1,056
|
|
$
|
1,088
|
|
||
81
Net Earned Premiums
Net earned premiums are recognized over the contractual lives, or in the case of homogeneous pools of insured obligations, the remaining expected lives, of financial guaranty insurance contracts. The Company estimates remaining expected lives of its insured obligations and makes prospective adjustments for such changes in expected lives. Scheduled net earned premiums are expected to decrease each year unless replaced by a higher amount of new business, reassumptions of previously ceded business or books of business acquired in a business combination. See Part II, Item 8, Financial Statements and Supplementary Data, Note 6, Contracts Accounted for as Insurance, Financial Guaranty Insurance Premiums, for additional information and the expected timing of future premium earnings.
Net Earned Premiums
|
|
Year Ended December 31,
|
||||||||||
|
|
2016
|
2015
|
2014
|
||||||||
|
|
(in millions)
|
||||||||||
|
Financial guaranty insurance:
|
|||||||||||
|
Public finance
|
|||||||||||
|
Scheduled net earned premiums and accretion
|
$
|
299
|
|
$
|
308
|
|
$
|
279
|
|
||
|
Accelerations:
|
|||||||||||
|
Refundings
|
390
|
|
294
|
|
133
|
|
|||||
|
Terminations
|
34
|
|
23
|
|
2
|
|
|||||
|
Total accelerations
|
424
|
|
317
|
|
135
|
|
|||||
|
Total public finance
|
723
|
|
625
|
|
414
|
|
|||||
|
Structured finance(1)
|
|||||||||||
|
Scheduled net earned premiums and accretion
|
96
|
|
125
|
|
152
|
|
|||||
|
Terminations
|
45
|
|
14
|
|
1
|
|
|||||
|
Total structured finance
|
141
|
|
139
|
|
153
|
|
|||||
|
Other
|
0
|
|
2
|
|
3
|
|
|||||
|
Total net earned premiums
|
$
|
864
|
|
$
|
766
|
|
$
|
570
|
|
||
____________________
|
(1)
|
Excludes
$16 million
,
$21 million
and
$32 million
for
2016
,
2015
and
2014
, respectively, on consolidated FG VIEs.
|
2016 compared with 2015:
Net earned premiums increased in
2016
compared with
2015
due primarily to higher accelerations, partially offset by the lower earned premiums resulting from the scheduled decline in par outstanding. At
December 31, 2016
,
$3.3 billion
of net deferred premium revenue remained to be earned over the life of the insurance contracts. The CIFG Acquisition increased deferred premium revenue by $296 million at the date of the acquisition.
2015 compared with 2014:
Net earned premiums increased in
2015
compared with
2014
due primarily to higher accelerations and the addition of the Radian Asset book of business, offset in part by lower earned premiums resulting from the scheduled decline in par outstanding. The Radian Asset Acquisition on April 1, 2015 increased deferred premium revenue by $549 million at the date of acquisition.
The increase in net earned premiums due to accelerations is attributable to changes in the expected lives of insured obligations driven by (a) refundings of insured obligations or (b) terminations of insured obligations either through negotiated agreements or the exercise of our contractual rights to make claim payments on an accelerated basis.
Refundings occur in the public finance market and have been at historically high levels in recent years due primarily to the low interest rate environment, which has allowed many municipalities and other public finance issuers to refinance their debt obligations at lower rates. The premiums associated with the insured obligations of municipalities and other public finance issuers are generally received upfront when the obligations are issued and insured. When such issuers pay down insured obligations prior to their originally scheduled maturities, the Company is no longer on risk for payment defaults, and therefore accelerates the recognition of the nonrefundable unearned premiums remaining from the original upfront payment.
82
Terminations are generally negotiated agreements with issuers resulting in the extinguishment of the Company’s insurance obligation with respect to the insured obligations. Terminations are more common in the structured finance asset class, but may also occur in the public finance asset class. While each termination may have different terms, they all result in the expiration of the Company’s insurance risk, such that the Company accelerates the recognition of the associated unearned premiums.
Net Investment Income
Net investment income is a function of the yield that the Company earns on invested assets and the size of the portfolio. The investment yield is a function of market interest rates at the time of investment as well as the type, credit quality and maturity of the invested assets.
Net Investment Income (1)
|
|
Year Ended December 31,
|
||||||||||
|
|
2016
|
2015
|
2014
|
||||||||
|
|
(in millions)
|
||||||||||
|
Income from fixed-maturity securities managed by third parties
|
$
|
306
|
|
$
|
335
|
|
$
|
324
|
|
||
|
Income from internally managed securities:
|
|||||||||||
|
Fixed maturities
|
103
|
|
61
|
|
74
|
|
|||||
|
Other
|
7
|
|
37
|
|
14
|
|
|||||
|
Other
|
1
|
|
0
|
|
0
|
|
|||||
|
Gross investment income
|
417
|
|
433
|
|
412
|
|
|||||
|
Investment expenses
|
(9
|
)
|
(10
|
)
|
(9
|
)
|
|||||
|
Net investment income
|
$
|
408
|
|
$
|
423
|
|
$
|
403
|
|
||
____________________
|
(1)
|
Net investment income excludes
$10 million
for
2016
and
$32 million
for
2015
and
$11 million
in
2014
, related to securities in the investment portfolio owned by AGC and AGM that were issued by consolidated FG VIEs.
|
2016 compared with 2015:
Net investment income decreased due primarily to lower average investment balance and lower average investment yield. The overall pre-tax book yield was 3.80% as of December 31, 2016 and 4.56% as of December 31, 2015, respectively. Excluding the internally managed portfolio, pre-tax book yield was 3.30% as of December 31, 2016 compared with 3.58% as of December 31, 2015.
2015 compared with 2014:
Net investment income increased due primarily to additional income on the Radian Asset investment portfolio and loss mitigation strategies resulting in additional income on securities within the internally managed portfolio. The overall pre-tax book yield was 4.56% as of December 31, 2015 and 3.65% as of December 31, 2014, respectively. Excluding the internally managed portfolio, pre-tax book yield was 3.58% as of December 31, 2015 compared with 3.36% as of December 31, 2014.
83
Net Realized Investment Gains (Losses)
The table below presents the components of net realized investment gains (losses). See Part II, Item 8, Financial Statements and Supplementary Data, Note 10, Investments and Cash.
Net Realized Investment Gains (Losses)
|
|
Year Ended December 31,
|
||||||||||
|
|
2016
|
2015
|
2014
|
||||||||
|
|
(in millions)
|
||||||||||
|
Gross realized gains on available-for-sale securities
|
$
|
28
|
|
$
|
44
|
|
$
|
14
|
|
||
|
Gross realized losses on available-for-sale securities
|
(8
|
)
|
(15
|
)
|
(5
|
)
|
|||||
|
Net realized gains (losses) on other invested assets
|
2
|
|
(8
|
)
|
6
|
|
|||||
|
Other-than-temporary impairment
|
(51
|
)
|
(47
|
)
|
(75
|
)
|
|||||
|
Net realized investment gains (losses)
|
$
|
(29
|
)
|
$
|
(26
|
)
|
$
|
(60
|
)
|
||
Other-than-temporary-impairments in 2016 were primarily attributable to securities purchased for loss mitigation purposes and changes in foreign exchange rates. Realized gains in 2016 were due primarily to sales of securities in order to fund the purchase of CIFGH by AGC.
Net realized investment losses for 2015 include a loss on a forward contract. Other-than-temporary-impairments in 2015 were primarily attributable to securities purchased for loss mitigation purposes. The realized gains in 2015 were due primarily to sales of securities in order to fund the purchase of Radian Asset by AGC.
Net realized investment losses for 2014 included an other-than-temporary impairment that was primarily attributable to securities in the internally managed portfolio received as part of a restructuring of an insured transaction.
Bargain Purchase Gain and Settlement of Pre-existing Relationships
On July 1, 2016, AGC acquired all of the issued and outstanding capital stock of CIFGH, the parent of financial guaranty insurer CIFGNA, and merged CIFGNA with and into AGC, with AGC as the surviving company, on July 5, 2016. In connection with the acquisition, in 2016, the Company recognized a $357 million bargain purchase gain and a $98 million loss on settlement of pre-existing relationships.
On April 1, 2015, AGC completed the acquisition of Radian Asset and merged Radian Asset with and into AGC, with AGC as the surviving company of the merger. In connection with the acquisition, in 2015, the Company recognized a $55 million bargain purchase gain and a $159 million gain on settlement of pre-existing relationships.
See Part II, Item 8, Financial Statements and Supplementary Data, Note 2, Acquisitions, for additional information.
Other Income (Loss)
Other income (loss) comprises recurring items such as foreign exchange remeasurement gains and losses, ancillary fees on financial guaranty policies such as commitment and consent, and if applicable, other revenue items on financial guaranty insurance and reinsurance contracts such as commutation gains on re-assumptions of previously ceded business, loss mitigation recoveries and certain non-recurring items. In 2016, other income primarily comprised a benefit due to loss mitigation recoveries, offset in part by a loss on foreign exchange mainly due to the decline in the exchange rate of the pound sterling. In 2015 and 2014, other income primarily comprised a commutation gain on the reassumption of ceded books of business from certain reinsurers and benefits due to loss mitigation recoveries.
84
Other Income (Loss)
|
|
Year Ended December 31,
|
||||||||||
|
|
2016
|
2015
|
2014
|
||||||||
|
(in millions)
|
|||||||||||
|
Foreign exchange gain (loss) on remeasurement of premium receivable and loss reserves
|
$
|
(33
|
)
|
$
|
(15
|
)
|
$
|
(21
|
)
|
||
|
Commutation gains
|
8
|
|
28
|
|
23
|
|
|||||
|
Other
|
64
|
|
24
|
|
12
|
|
|||||
|
Total other income (loss)
|
$
|
39
|
|
$
|
37
|
|
$
|
14
|
|
||
Economic Loss Development
The insured portfolio includes policies accounted for under three separate accounting models depending on the characteristics of the contract and the Company’s control rights. Please refer to Part II, Item 8, Financial Statements and Supplementary Data, Note 5, Expected Loss to be Paid, for a discussion of the assumptions and methodologies used in calculating the expected loss to be paid for all contracts. For a discussion of the loss estimation process, approach to projecting losses and the measurement and recognition accounting policies under GAAP for each type of contract, see the following in Part II, Item 8, Financial Statements and Supplementary Data:
•
Note 5 for expected loss to be paid,
•
Note 6 for financial guaranty insurance,
•
Note 7 for fair value methodologies for credit derivatives and FG VIE assets and liabilities,
•
Note 8 for credit derivatives, and
•
Note 9 for consolidated FG VIEs.
The discussion of losses that follows encompasses losses on all contracts in the insured portfolio regardless of accounting model, unless otherwise specified. In order to effectively evaluate and manage the economics of the entire insured portfolio, management compiles and analyzes expected loss information for all policies on a consistent basis. That is, management monitors and assigns ratings and calculates expected losses in the same manner for all its exposures. Management also considers contract specific characteristics that affect the estimates of expected loss.
The surveillance process for identifying transactions with expected losses is described in Part II, Item 8, Financial Statements and Supplementary Data, Note 5, Expected Losses to be Paid. More extensive monitoring and intervention is employed for all BIG surveillance categories, with internal credit ratings reviewed quarterly.
Net expected loss to be paid consists primarily of the present value of future: expected claim and LAE payments, expected recoveries from excess spread and other collateral in the transaction structures, cessions to reinsurers, and expected recoveries for breaches of R&W and the effects of other loss mitigation strategies. Current risk free rates are used to discount expected losses at the end of each reporting period and therefore changes in such rates from period to period affect the expected loss estimates reported. Assumptions used in the determination of the net expected loss to be paid such as delinquency, severity, and discount rates and expected time frames to recovery in the mortgage market were consistent by sector regardless of the accounting model used. The primary drivers of economic loss development are discussed below. Changes in risk free rates used to discount losses affect economic loss development, loss and LAE, and operating loss and LAE; however, the effect of changes in discount rates are not indicative of actual credit impairment or improvement in the period.
The primary differences between net economic loss development and loss and LAE are that the amount reported in the Consolidated Statements of Operations:
|
•
|
considers deferred premium revenue in the calculation of loss reserves and loss and LAE for financial guaranty insurance contracts,
|
|
•
|
eliminates loss and LAE related to FG VIEs and
|
|
•
|
does not include estimated losses on credit derivatives.
|
85
Loss and LAE reported in operating income (i.e. operating loss and LAE) includes losses on financial guaranty insurance contracts, other than those eliminated due to consolidation of FG VIEs, and credit derivatives.
For financial guaranty insurance contracts, the loss and LAE reported in the Consolidated Statements of Operations is generally recorded only when expected losses exceed deferred premium revenue. Therefore, the timing of loss recognition in income does not necessarily coincide with the timing of the actual credit impairment or improvement reported in net economic loss development. Transactions acquired in a business combination generally have the largest deferred premium revenue balances because of the purchase accounting adjustments made at acquisition. Therefore the largest differences between net economic loss development and loss and LAE on financial guaranty insurance contracts generally relate to these policies. See "Loss and LAE (Financial Guaranty Insurance Contracts)" below.
Net Expected Loss to be Paid
|
|
As of
December 31, 2016 |
As of
December 31, 2015 |
|||||
|
|
(in millions)
|
||||||
|
Public finance
|
$
|
904
|
|
$
|
809
|
|
|
|
Structured finance
|
|||||||
|
U.S. RMBS before R&W payable (recoverable)
|
200
|
|
488
|
|
|||
|
R&W payable (recoverable) (1)
|
6
|
|
(79
|
)
|
|||
|
U.S. RMBS after R&W
|
206
|
|
409
|
|
|||
|
Other structured finance
|
88
|
|
173
|
|
|||
|
Structured finance
|
294
|
|
582
|
|
|||
|
Total
|
$
|
1,198
|
|
$
|
1,391
|
|
|
____________________
|
(1)
|
The Company’s agreements with R&W providers generally provide that, as the Company makes claim payments, the R&W providers reimburse it for those claims; if the Company later receives reimbursement through the transaction (for example, from excess spread), the Company repays the R&W providers.
When the Company projects receiving more reimbursements in the future than it projects paying in claims on transactions covered by R&W settlement agreements, the Company will have a net R&W payable.
|
Economic Loss Development (Benefit) (1)
|
Year Ended December 31,
|
|||||||||||
|
|
2016
|
2015
|
2014
|
||||||||
|
|
(in millions)
|
||||||||||
|
Public finance
|
$
|
269
|
|
$
|
405
|
|
$
|
171
|
|
||
|
Structured finance
|
|||||||||||
|
U.S. RMBS before R&W payable (recoverable)
|
(108
|
)
|
(149
|
)
|
0
|
|
|||||
|
R&W payable (recoverable)
|
17
|
|
67
|
|
(268
|
)
|
|||||
|
U.S. RMBS after R&W
|
(91
|
)
|
(82
|
)
|
(268
|
)
|
|||||
|
Other structured finance
|
(39
|
)
|
(4
|
)
|
67
|
|
|||||
|
Structured finance
|
(130
|
)
|
(86
|
)
|
(201
|
)
|
|||||
|
Total
|
$
|
139
|
|
$
|
319
|
|
$
|
(30
|
)
|
||
____________________
|
(1)
|
Economic loss development includes the effects of changes in assumptions based on observed market trends, changes in discount rates, accretion of discount and the economic effects of loss mitigation efforts.
|
86
2016 Net Economic Loss Development
The total economic loss development of
$139 million
in
2016
was primarily related to the public finance sector, offset in part by improvements in the structured finance sector. The risk-free rates used to discount expected losses ranged from
0.0%
to
3.23%
as of
December 31, 2016
and
0.0%
to
3.25%
as of
December 31, 2015
. The effect of changes in the risk-free rates used to discount expected losses was a benefit of
$15 million
in
2016
.
U.S. Public Finance Economic Loss Development:
The net par outstanding for U.S. public finance obligations rated BIG by the Company was
$7.4 billion
as of
December 31, 2016
compared with
$7.8 billion
as of
December 31, 2015
. The Company projects that its total net expected loss across its troubled U.S. public finance credits as of
December 31, 2016
will be
$871 million
, compared with
$771 million
as of
December 31, 2015
. Economic loss development in
2016
was
$276 million
, which was primarily attributable to Puerto Rico exposures. See "Insured Portfolio-Exposure to Puerto Rico" below for details about significant developments that have taken place in Puerto Rico.
U.S. RMBS Economic Loss Development:
The net benefit attributable to U.S. RMBS was
$91 million
and was due mainly to the acceleration of claim payments as a means of mitigating future losses on certain Alt-A transactions.
Other Structured Finance Economic Loss Development:
The net benefit attributable to structured finance (excluding U.S. RMBS) was $39 million, due primarily to a benefit from the purchase of a portion of an insured obligation as part of a loss mitigation strategy and and the commutation of certain assumed student loan exposures.
2015 Net Economic Loss Development
Total economic loss development was $319 million in 2015, due primarily to higher U.S. public finance losses on Puerto Rico exposures, partially offset by a net benefit in the U.S. RMBS sector. The risk-free rates used to discount expected losses ranged from 0.0% to 3.25% as of December 31, 2015 compared with 0.0% to 2.95% as of December 31, 2014. The change in the risk-free rates used to discount expected losses was a benefit of $23 million in 2015.
U.S. Public Finance Economic Loss Development:
The net par outstanding for U.S. public finance obligations rated BIG by the Company was $7.8 billion as of December 31, 2015 compared with $7.9 billion as of December 31, 2014. The Company projected that its total net expected loss across its troubled U.S. public finance credits as of December 31, 2015 would be $771 million, compared with $303 million as of December 31, 2014. Economic loss development in 2015 was approximately $416 million, which was primarily attributable to certain Puerto Rico exposures.
U.S. RMBS Economic Loss Development:
The net benefit attributable to U.S. RMBS of $82 million was primarily due to the R&W settlements during the year and a benefit due to the acceleration of claim payments as a means of mitigating future losses on certain Alt-A transactions, which was partially offset by losses in certain second lien U.S. RMBS transactions due to rising delinquencies and collateral deterioration associated with the increase in monthly payments when their loans reach their principal amortization period.
2014 Net Economic Loss Development
Total economic loss development was a favorable $30 million in 2014, due primarily to the various U.S. RMBS R&W settlements during the year and improvements in some of the Company's insured TruPS transactions. This was partially offset by U.S. public finance losses related to Puerto Rico and Detroit and structured finance losses that resulted primarily from changes in underlying assumptions on life insurance securitization transactions and the decrease in discount rates used. The risk-free rates used to discount expected losses ranged from 0.0% to 2.95% as of December 31, 2014 compared with 0.0% to 4.44% as of December 31, 2013.
U.S. Public Finance Economic Loss Development:
The net par outstanding for U.S. public finance obligations rated BIG by the Company was $7.9 billion as of December 31, 2014 compared with $9.1 billion as of December 31, 2013. The Company projected that its total net expected loss across its troubled U.S. public finance credits as of December 31, 2014 would be $303 million, compared with $264 million as of December 31, 2013. Economic loss development in 2014 was approximately $183 million, which was primarily attributable to Puerto Rico and Detroit exposures.
U.S. RMBS Economic Loss Development:
The net benefit attributable to U.S. RMBS of $268 million was primarily due to the R&W settlements during the year.
87
Loss and LAE (Financial Guaranty Insurance Contracts)
The amount of loss and LAE recognized in the consolidated statements of operations for financial guaranty contracts accounted for as insurance, is dependent on the amount of economic loss development discussed above and the deferred premium revenue amortization in a given period, on a contract-by-contract basis. For these transactions, each transaction’s expected loss to be expensed, net of estimated recoveries, is compared with the deferred premium revenue of that transaction. Generally, when the expected loss to be expensed exceeds the deferred premium revenue, a loss is recognized in the consolidated statements of operations for the amount of such excess.
While expected loss to be paid is an important liquidity measure that provides the present value of amounts that the Company expects to pay or recover in future periods on all contracts, expected loss to be expensed is important because it presents the Company’s projection of loss and LAE that will be recognized in future periods as deferred premium revenue amortizes into income in the Consolidated Statements of Operations for financial guaranty insurance policies. Expected loss to be paid for FG VIEs pursuant to AGC’s and AGM’s financial guaranty policies is calculated in a manner consistent with financial guaranty insurance contracts, but eliminated in consolidation under GAAP.
The following table presents the loss and LAE recorded in the consolidated statements of operations. Amounts presented are net of reinsurance.
Loss and LAE Reported
|
|
Year Ended December 31,
|
||||||||||
|
|
2016
|
2015
|
2014
|
||||||||
|
|
(in millions)
|
||||||||||
|
Public finance
|
$
|
304
|
|
$
|
393
|
|
$
|
191
|
|
||
|
Structured finance
|
|||||||||||
|
U.S. RMBS
|
37
|
|
54
|
|
(129
|
)
|
|||||
|
Other structured finance
|
(39
|
)
|
5
|
|
94
|
|
|||||
|
Structured finance
|
(2
|
)
|
59
|
|
(35
|
)
|
|||||
|
Total insurance contracts before FG VIE consolidation
|
302
|
|
452
|
|
156
|
|
|||||
|
Elimination of losses attributable to FG VIEs
|
(7
|
)
|
(28
|
)
|
(30
|
)
|
|||||
|
Total loss and LAE (1)
|
$
|
295
|
|
$
|
424
|
|
$
|
126
|
|
||
____________________
|
(1)
|
Excludes credit derivative benefit of $20 million for 2016, credit derivative loss expense of $22 million for 2015 and credit derivative benefit of $77 million for 2014.
|
Loss and LAE in 2016 was mainly driven by higher loss reserves on certain Puerto Rico exposures.
Loss and LAE in 2015 comprised mainly changes in loss estimates on Puerto Rico exposures, second lien U.S. RMBS transactions and Triple-X life insurance transactions. Some of the increases were partially offset by improvements in first lien U.S. RMBS and student loan transactions.
In 2014, losses and LAE primarily included higher U.S. public finance loss estimates on Puerto Rico and Detroit, and higher structured finance losses attributable to Triple-X life insurance transactions. In 2014, loss and LAE also included benefits in the U.S. RMBS portfolio due primarily to the settlement of several R&W claims. Changes in risk-free rates used to discount losses also adversely affected loss expense for long-dated transactions, however this component of loss expense does not reflect actual credit impairment or improvement in the period.
For financial guaranty contracts accounted for as insurance, the amounts reported in the GAAP financial statements may only reflect a portion of the current period’s economic loss development and may also include a portion of prior-period economic loss development. The difference between economic loss development on financial guaranty insurance contracts and loss and LAE recognized in the Consolidated Statements of Operations relates to the effect of taking deferred premium revenue into account for loss and LAE, which is not considered in economic loss development.
88
The following table provides a schedule of the expected timing of net expected losses to be expensed. The amount and timing of actual loss and LAE may differ from the estimates shown below due to factors such as accelerations, commutations, changes in expected lives and updates to loss estimates. This table excludes $64 million related to FG VIEs, which are eliminated in consolidation.
Net Expected Loss to be Expensed
Financial Guaranty Insurance Contracts
|
|
As of December 31, 2016
|
||
|
|
(in millions)
|
||
|
2017 (January 1 – March 31)
|
$
|
8
|
|
|
2017 (April 1 – June 30)
|
10
|
|
|
|
2017 (July 1 – September 30)
|
8
|
|
|
|
2017 (October 1 – December 31)
|
9
|
|
|
|
Subtotal 2017
|
35
|
|
|
|
2018
|
34
|
|
|
|
2019
|
32
|
|
|
|
2020
|
32
|
|
|
|
2021
|
28
|
|
|
|
2022-2026
|
117
|
|
|
|
2027-2031
|
82
|
|
|
|
2032-2036
|
44
|
|
|
|
After 2036
|
17
|
|
|
|
Net expected loss to be expensed
|
421
|
|
|
|
Future accretion
|
373
|
|
|
|
Total expected future loss and LAE
|
$
|
794
|
|
Net Change in Fair Value of Credit Derivatives
Changes in the fair value of credit derivatives occur primarily because of changes in interest rates, credit spreads, notional amounts, credit ratings of the referenced entities, expected terms, realized gains (losses) and other settlements, and the issuing company's own credit rating and credit spreads, and other market factors. With considerable volatility continuing in the market, unrealized gains (losses) on credit derivatives may fluctuate significantly in future periods.
Except for net estimated credit impairments (i.e., net expected payments), the unrealized gains and losses on credit derivatives are expected to reduce to zero as the exposure approaches its maturity date. Changes in the fair value of the Company’s credit derivatives that do not reflect actual or expected claims or credit losses have no impact on the Company’s statutory claims-paying resources, rating agency capital or regulatory capital positions. Expected losses to be paid in respect of contracts accounted for as credit derivatives are included in the discussion above “Economic Loss Development.”
The impact of changes in credit spreads will vary based upon the volume, tenor, interest rates, and other market conditions at the time these fair values are determined. In addition, since each transaction has unique collateral and structural terms, the underlying change in fair value of each transaction may vary considerably. The fair value of credit derivative contracts also reflects the change in the Company’s own credit cost based on the price to purchase credit protection on AGC and AGM. The Company determines its own credit risk based on quoted CDS prices traded on the Company at each balance sheet date. Generally, a widening of credit spreads of the underlying obligations results in unrealized losses and the tightening of credit spreads of the underlying obligations results in unrealized gains. A widening of the CDS prices traded on AGC and AGM has an effect of offsetting unrealized losses that result from widening general market credit spreads, while a narrowing of the CDS prices traded on AGC and AGM has an effect of offsetting unrealized gains that result from narrowing general market credit spreads.
The valuation of the Company’s credit derivative contracts requires the use of models that contain significant, unobservable inputs, and are classified as Level 3 in the fair value hierarchy. The models used to determine fair value are primarily developed internally based on market conventions for similar transactions that the Company observed in the past.
89
There has been very limited new issuance activity in this market over the past several years and as of
December 31, 2016
, market prices for the Company’s credit derivative contracts were generally not available. Inputs to the estimate of fair value include various market indices, credit spreads, the Company’s own credit spread, and estimated contractual payments. See Part II, Item 8, Financial Statements and Supplemental Data, Note 7, Fair Value Measurement, for additional information.
Net Change in Fair Value of Credit Derivatives
Gain (Loss)
|
Year Ended December 31,
|
|||||||||||
|
|
2016
|
2015
|
2014
|
||||||||
|
|
(in millions)
|
||||||||||
|
Realized gains on credit derivatives
|
$
|
56
|
|
$
|
63
|
|
$
|
73
|
|
||
|
Net credit derivative losses (paid and payable) recovered and recoverable and other settlements
|
(27
|
)
|
(81
|
)
|
(50
|
)
|
|||||
|
Realized gains (losses) and other settlements (1)
|
29
|
|
(18
|
)
|
23
|
|
|||||
|
Net unrealized gains (losses):
|
|||||||||||
|
Pooled corporate obligations
|
(16
|
)
|
147
|
|
(18
|
)
|
|||||
|
U.S. RMBS
|
22
|
|
396
|
|
814
|
|
|||||
|
Commercial mortgage-backed securities (CMBS)
|
0
|
|
42
|
|
2
|
|
|||||
|
Other
|
63
|
|
161
|
|
2
|
|
|||||
|
Net unrealized gains (losses)
|
69
|
|
746
|
|
800
|
|
|||||
|
Net change in fair value of credit derivatives
|
$
|
98
|
|
$
|
728
|
|
$
|
823
|
|
||
____________________
|
(1)
|
Includes realized gains and losses due to terminations and settlements of CDS contracts.
|
Net credit derivative premiums included in the realized gains on credit derivatives line in the table above, have declined in 2016, 2015 and 2014 due primarily to the decline in the net par outstanding to
$17.0 billion
at
December 31, 2016
from
$25.6 billion
at
December 31, 2015
and $35.0 billion at
December 31, 2014
. As part of its strategic initiative, the Company has been negotiating terminations of investment grade and BIG CDS contracts with its counterparties.The following table presents the effect of terminations on realized gains (losses) and other settlements on credit derivatives.
Terminations and Settlements
of Direct Credit Derivative Contracts
|
Year Ended December 31,
|
|||||||||||
|
|
2016
|
2015
|
2014
|
||||||||
|
|
(in millions)
|
||||||||||
|
Net par of terminated credit derivative contracts
|
$
|
3,811
|
|
$
|
2,777
|
|
$
|
3,591
|
|
||
|
Realized gains on credit derivatives
|
20
|
|
13
|
|
1
|
|
|||||
|
Net credit derivative losses (paid and payable) recovered and recoverable and other settlements
|
—
|
|
(116
|
)
|
(26
|
)
|
|||||
|
Net unrealized gains (losses) on credit derivatives
|
103
|
|
465
|
|
546
|
|
|||||
During 2016, unrealized fair value gains were generated primarily as a result of CDS terminations in the U.S. RMBS and other sectors, run-off of CDS par and price improvements on the underlying collateral of the Company’s CDS. The majority of the CDS transactions were terminated as a result of settlement agreements with several CDS counterparties. The unrealized fair value gains were partially offset by unrealized losses resulting from wider implied net spreads across all sectors. The wider implied net spreads were primarily a result of the decreased cost to buy protection in AGC’s and AGM’s name, as the market cost of AGC’s and AGM’s credit protection decreased significantly during the period. These transactions were pricing at or above their floor levels (or the minimum rate at which the Company would consider assuming these risks based on historical experience); therefore when the cost of purchasing CDS protection on AGC and AGM, which management refers to as the CDS spread on AGC and AGM, decreased the implied spreads that the Company would expect to receive on these transactions increased.
90
During 2015, unrealized fair value gains were generated primarily as a result of CDS terminations. The Company reached a settlement agreement with
one
CDS counterparty to terminate
five
Alt-A first lien CDS transactions resulting in unrealized fair value gains of
$213 million
and was the primary driver of the unrealized fair value gains in the U.S. RMBS sector. The Company also terminated a CMBS transaction, a Triple-X life insurance securitization transaction, and a distressed middle market CLO securitization during the period and recognized unrealized fair value gains of
$41 million
,
$99 million
and
$99 million
, respectively. These were the primary drivers of the unrealized fair value gains in the CMBS, Other, and pooled corporate collateralized loan obligation (CLO) sectors, respectively, during the period. The remainder of the fair value gains for the period were a result of tighter implied net spreads across all sectors. The tighter implied net spreads were primarily a result of the increased cost to buy protection in AGC’s and AGM’s name, particularly for the one year CDS spread. These transactions were pricing at or above their floor levels, therefore when the cost of purchasing CDS protection on AGC and AGM increased, the implied spreads that the Company would expect to receive on these transactions decreased. Finally, during 2015, there was a refinement in methodology to address an instance in a U.S. RMBS transaction where the Company now expects recoveries. This refinement resulted in approximately
$49 million
in fair value gains in 2015.
During 2014, unrealized fair value gains were generated primarily in the U.S. RMBS prime first lien, Option ARM and subprime sectors. This is primarily due to a significant unrealized fair value gain in the Option ARM and Alt-A first lien sector of approximately $
543 million
, as a result of the terminations of
three
large Alt-A first lien resecuritization transactions and
one
Option ARM first lien transaction during the period. In addition, there was an unrealized gain of approximately
$346 million
related to the change in index used to determine fair value during the fourth quarter of 2014. In the fourth quarter of 2014, new market indices were published on Option ARM and Alt-A first lien securitizations. As part of the Company’s normal review process the Company reviewed these indices and based upon the collateral make-up, collateral vintage, and collateral loss experience, determined it to be a better market indication for the Company’s Option ARM and Alt-A first lien securitizations. The unrealized fair value gains were partially offset by unrealized fair value losses generated by wider implied net spreads. The wider implied net spreads were primarily a result of the decreased cost to buy protection in AGC’s and AGM’s name, as the market cost of AGC's and AGM’s credit protection decreased during the period. These transactions were pricing at or above their floor levels; therefore when the cost of purchasing CDS protection on AGC and AGM decreased, the implied spreads that the Company would expect to receive on these transactions increased.
CDS Spread on AGC and AGM
Quoted price of CDS contract (in basis points)
|
|
As of
December 31, 2016 |
As of
December 31, 2015 |
As of
December 31, 2014 |
|||||
|
Five-year CDS spread:
|
||||||||
|
AGC
|
158
|
|
376
|
|
323
|
|
||
|
AGM
|
158
|
|
366
|
|
325
|
|
||
|
One-year CDS spread
|
||||||||
|
AGC
|
35
|
|
139
|
|
80
|
|
||
|
AGM
|
29
|
|
131
|
|
85
|
|
||
Effect of Changes in the Company’s Credit Spread on
Net Unrealized Gains (Losses) on Credit Derivatives
|
|
Year Ended December 31,
|
||||||||||
|
|
2016
|
2015
|
2014
|
||||||||
|
|
(in millions)
|
||||||||||
|
Change in unrealized gains (losses) of credit derivatives:
|
|||||||||||
|
Before considering implication of the Company’s credit spreads
|
$
|
183
|
|
$
|
663
|
|
$
|
1,396
|
|
||
|
Resulting from change in the Company’s credit spreads
|
(114
|
)
|
83
|
|
(596
|
)
|
|||||
|
After considering implication of the Company’s credit spreads
|
$
|
69
|
|
$
|
746
|
|
$
|
800
|
|
||
91
Management believes that the trading level of AGC’s and AGM’s credit spreads over the past several years has been due to the correlation between AGC’s and AGM’s risk profile and the current risk profile of the broader financial markets, as well as the overall lack of liquidity in the CDS market. Offsetting the benefit attributable to AGC’s and AGM’s credit spread were higher credit spreads in the fixed income security markets relative to pre-financial crisis levels. The higher credit spreads in the fixed income security market are due to the lack of liquidity in the high-yield CDO, TruPS CDOs, and CLO markets as well as continuing market concerns over the 2005-2007 vintages of RMBS.
Interest Expense
Changes in interest expense between 2015 and 2014 relate to the timing of debt issuance. In June 2014, the Company issued $500 million aggregate principal amount of
5
% Senior Notes due 2024. All other long term debt of the U.S. holding companies was outstanding throughout all three years presented. See Part II, Item 8, Financial Statements and Supplementary Data, Note 16, Long-Term Debt and Credit Facilities. The following table presents the components of interest expense.
Interest Expense
|
|
Year Ended December 31,
|
||||||||||
|
|
2016
|
2015
|
2014
|
||||||||
|
|
(in millions)
|
||||||||||
|
Debt issued by AGUS
|
$
|
48
|
|
$
|
49
|
|
$
|
36
|
|
||
|
Debt issued by AGMH
|
54
|
|
54
|
|
54
|
|
|||||
|
Notes payable by AGM
|
0
|
|
(2
|
)
|
2
|
|
|||||
|
Total
|
$
|
102
|
|
$
|
101
|
|
$
|
92
|
|
||
In December 2016, $150 million of debt became floating rate interest debt, that resets quarterly, at a rate equal to three month LIBOR plus a margin equal to 2.38%.
Other Operating Expenses and Amortization of Deferred Acquisition Costs
2016 compared with 2015:
Other operating expenses increased in 2016 compared to 2015 due primarily to higher compensation expense and accelerated amortization of leasehold improvements as a result of the Company's move of its New York offices.
2015 compared with 2014:
Other operating expenses increased in 2015 compared to 2014 due primarily to $12 million in expenses related to the Radian Asset Acquisition and expenses related to the relocation of the New York offices in the summer of 2016. The Radian Asset Acquisition expenses were comprised mainly of fees paid to financial and legal advisors and to the independent auditor. Relocation expenses include broker fees and accelerated depreciation of unamortized improvements in the current New York office.
Financial Guaranty Variable Interest Entities
As of
December 31, 2016
and
2015
, the Company consolidated
32
and
34
VIEs, respectively. The table below presents the effects on reported GAAP income resulting from consolidating these FG VIEs and eliminating their related insurance and investment amounts. The consolidation of FG VIEs has an effect on net income and shareholders' equity due to:
|
•
|
changes in fair value gains (losses) on FG VIE assets and liabilities,
|
|
•
|
the eliminations of premiums and losses related to the AGC and AGM FG VIE liabilities with recourse, and
|
|
•
|
the elimination of investment balances related to the Company’s purchase of AGC and AGM insured FG VIE debt.
|
Upon consolidation of a FG VIE, the related insurance and, if applicable, the related investment balances, are considered intercompany transactions and therefore eliminated. See Part II, Item 8, Financial Statements and Supplementary Data, Note 9, Consolidated Variable Interest Entities, for more details.
92
Effect of Consolidating FG VIEs on Net Income (Loss)
|
|
Year Ended December 31,
|
||||||||||
|
|
2016
|
2015
|
2014
|
||||||||
|
|
(in millions)
|
||||||||||
|
Net earned premiums
|
$
|
(16
|
)
|
$
|
(21
|
)
|
$
|
(32
|
)
|
||
|
Net investment income
|
(10
|
)
|
(32
|
)
|
(11
|
)
|
|||||
|
Net realized investment gains (losses)
|
1
|
|
10
|
|
(5
|
)
|
|||||
|
Fair value gains (losses) on FG VIEs
|
38
|
|
38
|
|
255
|
|
|||||
|
Bargain purchase gain
|
—
|
|
2
|
|
—
|
|
|||||
|
Loss and LAE
|
7
|
|
28
|
|
30
|
|
|||||
|
Other income (loss)
|
0
|
|
0
|
|
(2
|
)
|
|||||
|
Effect on income before tax
|
20
|
|
25
|
|
235
|
|
|||||
|
Less: tax provision (benefit)
|
7
|
|
8
|
|
82
|
|
|||||
|
Effect on net income (loss)
|
$
|
13
|
|
$
|
17
|
|
$
|
153
|
|
||
Fair value gains (losses) on FG VIEs represent the net change in fair value on the consolidated FG VIEs’ assets and liabilities. In 2016, the Company recorded a pre-tax net fair value gain on consolidated FG VIEs of
$38 million
.
The primary driver of the 2016 gain in fair value of FG VIE assets and liabilities was net mark-to-market gains due to price appreciation resulting from improvements in the underlying collateral of HELOC RMBS assets of the FG VIEs.
In 2015, the Company recorded a pre-tax net fair value gain on consolidated FG VIEs of
$38 million
which was primarily driven by price appreciation on the Company's FG VIE assets during the year that resulted from improvements in the underlying collateral, as well as large principal paydowns made on the Company's FG VIEs.
In 2014, the Company recorded a pre-tax net fair value gain on consolidated FG VIEs of
$255 million
. The primary driver of this gain,
$120 million
, was a result of the deconsolidation of
seven
VIEs. There was an additional gain of
$37 million
resulting from the Company exercising its option to accelerate
two
second lien RMBS VIEs. These
two
VIEs were treated as maturities during the period. The remainder of the gain for the period was driven by the price appreciation on the Company's FG VIE assets during the year resulting from improvements in the underlying collateral, as well as large principal paydowns made on the Company's FG VIEs.
Provision for Income Tax
Deferred income tax assets and liabilities are established for the temporary differences between the financial statement carrying amounts and tax bases of assets and liabilities using enacted rates in effect for the year in which the differences are expected to reverse. Such temporary differences relate principally to unrealized gains and losses on investments and credit derivatives, FG VIE fair value adjustments, loss and LAE reserve, unearned premium reserve and tax attributes for net operating losses, alternative minimum tax credits and foreign tax credits. As of
December 31, 2016
and
December 31, 2015
, the Company had a net deferred income tax asset of
$497 million
and
$276 million
, respectively. The increase in 2016 from 2015 is mainly attributable to CIFG Acquisition.
Provision for Income Taxes and Effective Tax Rates
|
|
Year Ended December 31,
|
||||||||||
|
|
2016
|
2015
|
2014
|
||||||||
|
|
(in millions)
|
||||||||||
|
Total provision (benefit) for income taxes
|
$
|
136
|
|
$
|
375
|
|
$
|
443
|
|
||
|
Effective tax rate
|
13.4
|
%
|
26.2
|
%
|
28.9
|
%
|
|||||
The Company’s effective tax rates reflect the proportion of income recognized by each of the Company’s operating subsidiaries, with U.S. subsidiaries taxed at the U.S. marginal corporate income tax rate of
35%
, U.K. subsidiaries taxed at the U.K. marginal corporate tax rate of
20%
unless subject to U.S. tax by election or as a U.S. CFC, and no taxes for the Company’s Bermuda subsidiaries unless subject to U.S tax by election or as a U.S. CFC. The Company’s overall corporate effective tax rate fluctuates based on the distribution of taxable income across these jurisdictions. In each of the periods
93
presented, the portion of taxable income from each jurisdiction varied. The non-taxable book-to-tax differences were mostly consistent as compared to the prior period with the exception of the benefit on bargain purchase gain from the CIFG Acquisition and Radian Asset Acquisition. See Part II, Item 8, Financial Statements and Supplementary Data, Note 12, Income Taxes, for more details.
Non-GAAP Financial Measures
To reflect the key financial measures that management analyzes in evaluating the Company’s operations and progress towards long-term goals, the Company discloses both financial measures determined in accordance with GAAP and financial measures not determined in accordance with GAAP (non-GAAP financial measures).
Financial measures identified as non-GAAP should not be considered substitutes for GAAP financial measures. The primary limitation of non-GAAP financial measures is the potential lack of comparability to financial measures of other companies, whose definitions of non-GAAP financial measures may differ from those of Assured Guaranty. Beginning in fourth quarter 2016, the Company’s publicly disclosed non-GAAP financial measures are different from the financial measures used by management in its decision making process and in its calculation of certain components of management compensation (core financial measures). The Company had previously excluded the effect of consolidating FG VIEs (FG VIE consolidation) in its calculation of its non-GAAP financial measures of operating income,
non-GAAP operating shareholders’ equity and non-GAAP adjusted book value.
Starting in fourth quarter 2016, based on the SEC's May 17, 2016 release of updated Compliance and Disclosure Interpretations of the rules and regulations on the use of non-GAAP financial measures,
the Company will no longer adjust for FG VIE consolidation. However, wherever possible, the Company has separately disclosed the effect of FG VIE consolidation that is included in its non-GAAP financial measures. The prior-year non-GAAP financial measures have been updated to reflect the revised calculation.
Management and the Board use core financial measures, which are based on non-GAAP financial measures adjusted to remove FG VIE consolidation, as well as GAAP financial measures and other factors, to evaluate the Company’s results of operations, financial condition and progress towards long-term goals. The Company removes FG VIE consolidation in its core financial measures because, although GAAP requires the Company to consolidate certain VIEs that have issued debt obligations insured by the Company, the Company does not own such VIEs and its exposure is limited to its obligation under its financial guaranty insurance contract. By disclosing non-GAAP financial measures, along with FG VIE consolidation, the Company gives investors, analysts and financial news reporters access to information that management and the Board review internally. Assured Guaranty believes its presentation of non-GAAP financial measures and FG VIE consolidation provides information that is necessary for analysts to calculate their estimates of Assured Guaranty’s financial results in their research reports on Assured Guaranty and for investors, analysts and the financial news media to evaluate Assured Guaranty’s financial results.
Many investors, analysts and financial news reporters use non-GAAP operating shareholders’ equity, adjusted for FG VIE consolidation, as the principal financial measure for valuing AGL’s current share price or projected share price and also as the basis of their decision to recommend, buy or sell AGL’s common shares. Many of the Company’s fixed income investors also use this measure to evaluate the Company’s capital adequacy.
Many investors, analysts and financial news reporters also use non-GAAP adjusted book value, adjusted for FG VIE consolidation, to evaluate AGL’s share price and as the basis of their decision to recommend, buy or sell the AGL common shares. Operating income adjusted for the effect of FG VIE consolidation enables investors and analysts to evaluate the Company’s financial results as compared with the consensus analyst estimates distributed publicly by financial databases.
The core financial measures that are used to help determine compensation are: (1) operating income, adjusted for FG VIE consolidation, (2) non-GAAP operating shareholders' equity, adjusted for FG VIE consolidation, (3) growth in non-GAAP adjusted book value per share, adjusted for FG VIE consolidation, and (4) PVP.
The following paragraphs define each non-GAAP financial measure disclosed by the Company and describe why it is useful. A reconciliation of the non-GAAP financial measure and the most directly comparable GAAP financial measure is presented below.
Operating Income
Management believes that operating income is a useful measure because it clarifies the understanding of the underwriting results and financial conditions of the Company and presents the results of operations of the Company excluding the fair value adjustments on credit derivatives and CCS that are not expected to result in economic gain or loss, as well as
94
other adjustments described below. Management adjusts operating income further by removing FG VIE consolidation to arrive at its core operating income measure. Operating income is defined as net income (loss) attributable to AGL, as reported under GAAP, adjusted for the following:
|
1)
|
Elimination of realized gains (losses) on the Company’s investments, except for gains and losses on securities classified as trading. The timing of realized gains and losses, which depends largely on market credit cycles, can vary considerably across periods. The timing of sales is largely subject to the Company’s discretion and influenced by market opportunities, as well as the Company’s tax and capital profile.
|
|
2)
|
Elimination of non-credit-impairment unrealized fair value gains (losses) on credit derivatives, which is the amount of unrealized fair value gains (losses) in excess of the present value of the expected estimated economic credit losses, and non-economic payments. Such fair value adjustments are heavily affected by, and in part fluctuate with, changes in market interest rates, the Company's credit spreads, and other market factors and are not expected to result in an economic gain or loss.
|
|
3)
|
Elimination of fair value gains (losses) on the Company’s CCS. Such amounts are affected by changes in market interest rates, the Company's credit spreads, price indications on the Company's publicly traded debt, and other market factors and are not expected to result in an economic gain or loss.
|
|
4)
|
Elimination of foreign exchange gains (losses) on remeasurement of net premium receivables and loss and LAE reserves. Long-dated receivables and loss and LAE reserves represent the present value of future contractual or expected cash flows. Therefore, the current period’s foreign exchange remeasurement gains (losses) are not necessarily indicative of the total foreign exchange gains (losses) that the Company will ultimately recognize.
|
|
5)
|
Elimination of the tax effects related to the above adjustments, which are determined by applying the statutory tax rate in each of the jurisdictions that generate these adjustments.
|
Reconciliation of Net Income (Loss)
to Operating Income
|
|
Year Ended December 31,
|
||||||||||
|
|
2016
|
2015
|
2014
|
||||||||
|
|
(in millions)
|
||||||||||
|
Net income (loss)
|
$
|
881
|
|
$
|
1,056
|
|
$
|
1,088
|
|
||
|
Less pre-tax adjustments:
|
|||||||||||
|
Realized gains (losses) on investments
|
(30
|
)
|
(27
|
)
|
(56
|
)
|
|||||
|
Non-credit impairment unrealized fair value gains (losses) on credit derivatives
|
36
|
|
505
|
|
687
|
|
|||||
|
Fair value gains (losses) on CCS
|
0
|
|
27
|
|
(11
|
)
|
|||||
|
Foreign exchange gains (losses) on remeasurement of premiums receivable and loss and LAE reserves
|
(33
|
)
|
(15
|
)
|
(21
|
)
|
|||||
|
Total pre-tax adjustments
|
(27
|
)
|
490
|
|
599
|
|
|||||
|
Less tax effect on pre-tax adjustments
|
13
|
|
(144
|
)
|
(158
|
)
|
|||||
|
Operating income
|
$
|
895
|
|
$
|
710
|
|
$
|
647
|
|
||
|
Gain (loss) related to FG VIE consolidation (net of tax provision of $7, $4 and $84) included in operating income
|
$
|
12
|
|
$
|
11
|
|
$
|
156
|
|
||
Non-GAAP Operating Shareholders’ Equity and Non-GAAP Adjusted Book Value
Management believes that non-GAAP operating shareholders’ equity is a useful measure because it presents the equity of the Company excluding the fair value adjustments on investments, credit derivatives and CCS, that are not expected to result in economic gain or loss, along with other adjustments described below. Management adjusts non-GAAP operating shareholders’ equity further by removing FG VIE consolidation to arrive at its core operating shareholders' equity and core adjusted book value.
95
Non-GAAP operating shareholders’ equity is the basis of the calculation of non-GAAP adjusted book value (see below). Non-GAAP operating shareholders’ equity is defined as shareholders’ equity attributable to AGL, as reported under GAAP, adjusted for the following:
|
1)
|
Elimination of non-credit-impairment unrealized fair value gains (losses) on credit derivatives, which is the amount of unrealized fair value gains (losses) in excess of the present value of the expected estimated economic credit losses, and non-economic payments. Such fair value adjustments are heavily affected by, and in part fluctuate with, changes in market interest rates, credit spreads and other market factors and are not expected to result in an economic gain or loss.
|
|
2)
|
Elimination of fair value gains (losses) on the Company’s CCS. Such amounts are affected by changes in market interest rates, the Company's credit spreads, price indications on the Company's publicly traded debt, and other market factors and are not expected to result in an economic gain or loss.
|
|
3)
|
Elimination of unrealized gains (losses) on the Company’s investments that are recorded as a component of accumulated other comprehensive income (AOCI) (excluding foreign exchange remeasurement). The AOCI component of the fair value adjustment on the investment portfolio is not deemed economic because the Company generally holds these investments to maturity and therefore should not recognize an economic gain or loss.
|
4) Elimination of the tax asset or liability related to the above adjustments, which are determined by applying the statutory tax rate in each of the jurisdictions that generate these adjustments.
Management uses non-GAAP adjusted book value, adjusted for FG VIE consolidation, to measure the intrinsic value of the Company, excluding franchise value. Growth in non-GAAP adjusted book value per share adjusted for FG VIE consolidation (core adjusted book value) is one of the key financial measures used in determining the amount of certain long-term compensation elements to management and employees and used by rating agencies and investors. Management believes that this is a useful measure because it enables an evaluation of the net present value of the Company’s in-force premiums and revenues net of expected losses. Non-GAAP adjusted book value is non-GAAP operating shareholders’ equity, as defined above, further adjusted for the following:
|
1)
|
Elimination of deferred acquisition costs, net. These amounts represent net deferred expenses that have already been paid or accrued and will be expensed in future accounting periods.
|
|
2)
|
Addition of the net present value of estimated net future credit derivative revenue. See below.
|
|
3)
|
Addition of the deferred premium revenue on financial guaranty contracts in excess of expected loss to be expensed, net of reinsurance. This amount represents the expected future net earned premiums, net of expected losses to be expensed, which are not reflected in GAAP equity.
|
4) Elimination of the tax asset or liability related to the above adjustments, which are determined by applying the statutory tax rate in each of the jurisdictions that generate these adjustments.
The premiums and revenues included in non-GAAP adjusted book value will be earned in future periods, but actual earnings may differ materially from the estimated amounts used in determining current non-GAAP adjusted book value due to changes in foreign exchange rates, prepayment speeds, terminations, credit defaults and other factors.
96
Reconciliation of Shareholders’ Equity
to Non-GAAP Adjusted Book Value
|
|
As of December 31, 2016
|
As of December 31, 2015
|
|||||||||||||
|
|
Total
|
Per Share
|
Total
|
Per Share
|
|||||||||||
|
|
(dollars in millions, except
per share amounts)
|
||||||||||||||
|
Shareholders’ equity
|
$
|
6,504
|
|
$
|
50.82
|
|
$
|
6,063
|
|
$
|
43.96
|
|
|||
|
Less pre-tax adjustments:
|
|||||||||||||||
|
Non-credit impairment unrealized fair value gains (losses) on credit derivatives
|
(189
|
)
|
(1.48
|
)
|
(241
|
)
|
(1.75
|
)
|
|||||||
|
Fair value gains (losses) on CCS
|
62
|
|
0.48
|
|
62
|
|
0.45
|
|
|||||||
|
Unrealized gain (loss) on investment portfolio excluding foreign exchange effect
|
316
|
|
2.47
|
|
373
|
|
2.71
|
|
|||||||
|
Less taxes
|
(71
|
)
|
(0.54
|
)
|
(56
|
)
|
(0.41
|
)
|
|||||||
|
Non-GAAP operating shareholders’ equity
|
6,386
|
|
49.89
|
|
5,925
|
|
42.96
|
|
|||||||
|
Pre-tax adjustments:
|
|||||||||||||||
|
Less: Deferred acquisition costs
|
106
|
|
0.83
|
|
114
|
|
0.83
|
|
|||||||
|
Plus: Net present value of estimated net future credit derivative revenue
|
136
|
|
1.07
|
|
169
|
|
1.23
|
|
|||||||
|
Plus: Net unearned premium reserve on financial guaranty contracts in excess of expected loss to be expensed
|
2,922
|
|
22.83
|
|
3,384
|
|
24.53
|
|
|||||||
|
Plus taxes
|
(832
|
)
|
(6.50
|
)
|
(968
|
)
|
(7.02
|
)
|
|||||||
|
Non-GAAP adjusted book value
|
$
|
8,506
|
|
$
|
66.46
|
|
$
|
8,396
|
|
$
|
60.87
|
|
|||
|
Gain (loss) related to FG VIE consolidation included in non-GAAP operating shareholders' equity (net of tax benefit of $(4) and $(11))
|
$
|
(7
|
)
|
$
|
(0.06
|
)
|
$
|
(21
|
)
|
$
|
(0.15
|
)
|
|||
|
Gain (loss) related to FG VIE consolidation included in non-GAAP adjusted book value (net of tax benefit of $(12) and $(22))
|
$
|
(24
|
)
|
$
|
(0.18
|
)
|
$
|
(43
|
)
|
$
|
(0.31
|
)
|
|||
Net Present Value of Estimated Net Future Credit Derivative Revenue
Management believes that this amount is a useful measure because it enables an evaluation of the value of future estimated credit derivative revenue. There is no corresponding GAAP financial measure. This amount represents the present value of estimated future revenue from the Company’s credit derivative in-force book of business, net of reinsurance, ceding commissions and premium taxes, for contracts without expected economic losses, and is discounted at 6%. Estimated net future credit derivative revenue may change from period to period due to changes in foreign exchange rates, prepayment speeds, terminations, credit defaults or other factors that affect par outstanding or the ultimate maturity of an obligation.
PVP or Present Value of New Business Production
Management believes that PVP is a useful measure because it enables the evaluation of the value of new business production for the Company by taking into account the value of estimated future installment premiums on all new contracts underwritten in a reporting period as well as premium supplements and additional installment premium on existing contracts as to which the issuer has the right to call the insured obligation but has not exercised such right, whether in insurance or credit derivative contract form, which GAAP gross written premiums and the net credit derivative premiums received and receivable portion of net realized gains and other settlements on credit derivatives (Credit Derivative Realized Gains (Losses)) do not adequately measure. PVP in respect of financial guaranty contracts written in a specified period is defined as gross upfront and installment premiums received and the present value of gross estimated future installment premiums, discounted, in each case, at 6%. For purposes of the PVP calculation, management discounts estimated future installment premiums on insurance contracts at 6%, while under GAAP, these amounts are discounted at a risk free rate. Additionally, under GAAP, management records future installment premiums on financial guaranty insurance contracts covering non-homogeneous pools of assets
97
based on the contractual term of the transaction, whereas for PVP purposes, management records an estimate of the future installment premiums the Company expects to receive, which may be based upon a shorter period of time than the contractual term of the transaction. Actual future net earned or written premiums and Credit Derivative Realized Gains (Losses) may differ from PVP due to factors including, but not limited to, changes in foreign exchange rates, prepayment speeds, terminations, credit defaults, or other factors that affect par outstanding or the ultimate maturity of an obligation.
Reconciliation of GWP to PVP
|
Year Ended December 31, 2016
|
|||||||||||||||||||
|
Public Finance
|
Structured Finance
|
||||||||||||||||||
|
U.S.
|
Non - U.S.
|
U.S.
|
Non - U.S.
|
Total
|
|||||||||||||||
|
(in millions)
|
|||||||||||||||||||
|
GWP
|
$
|
142
|
|
$
|
15
|
|
$
|
(1
|
)
|
$
|
(2
|
)
|
$
|
154
|
|
||||
|
Less: Installment GWP and other GAAP adjustments(1)
|
(19
|
)
|
15
|
|
(4
|
)
|
(2
|
)
|
(10
|
)
|
|||||||||
|
Plus: Financial guaranty installment premium PVP
|
0
|
|
25
|
|
1
|
|
1
|
|
27
|
|
|||||||||
|
Plus: PVP of non-financial guaranty insurance
|
—
|
|
—
|
|
23
|
|
—
|
|
23
|
|
|||||||||
|
PVP
|
$
|
161
|
|
$
|
25
|
|
$
|
27
|
|
$
|
1
|
|
$
|
214
|
|
||||
|
Year Ended December 31, 2015
|
|||||||||||||||||||
|
Public Finance
|
Structured Finance
|
||||||||||||||||||
|
U.S.
|
Non - U.S.
|
U.S.
|
Non - U.S.
|
Total
|
|||||||||||||||
|
(in millions)
|
|||||||||||||||||||
|
GWP
|
$
|
119
|
|
$
|
41
|
|
$
|
23
|
|
$
|
(2
|
)
|
$
|
181
|
|
||||
|
Less: Installment GWP and other GAAP adjustments(1)
|
(5
|
)
|
41
|
|
21
|
|
(2
|
)
|
55
|
|
|||||||||
|
Plus: Financial guaranty installment premium PVP
|
0
|
|
27
|
|
18
|
|
1
|
|
46
|
|
|||||||||
|
Plus: PVP of non-financial guaranty insurance
|
—
|
|
—
|
|
2
|
|
5
|
|
7
|
|
|||||||||
|
PVP
|
$
|
124
|
|
$
|
27
|
|
$
|
22
|
|
$
|
6
|
|
$
|
179
|
|
||||
|
Year Ended December 31, 2014
|
|||||||||||||||||||
|
Public Finance
|
Structured Finance
|
||||||||||||||||||
|
U.S.
|
Non - U.S.
|
U.S.
|
Non - U.S.
|
Total
|
|||||||||||||||
|
(in millions)
|
|||||||||||||||||||
|
GWP
|
$
|
122
|
|
$
|
6
|
|
$
|
(32
|
)
|
$
|
8
|
|
$
|
104
|
|
||||
|
Less: Installment GWP and other GAAP adjustments(1)
|
(2
|
)
|
5
|
|
(33
|
)
|
8
|
|
(22
|
)
|
|||||||||
|
Plus: Financial guaranty installment premium PVP
|
4
|
|
6
|
|
23
|
|
9
|
|
42
|
|
|||||||||
|
Plus: PVP of non-financial guaranty insurance
|
—
|
|
—
|
|
0
|
|
—
|
|
0
|
|
|||||||||
|
PVP
|
$
|
128
|
|
$
|
7
|
|
$
|
24
|
|
$
|
9
|
|
$
|
168
|
|
||||
_____________
|
(1)
|
Includes present value of new business on installment policies discounted at the prescribed GAAP discount rates, GWP adjustments on existing installment policies due to changes in assumptions, any cancellations of assumed reinsurance contracts, and other GAAP adjustments.
|
98
Insured Portfolio
The following tables present the insured portfolio by asset class net of cessions to reinsurers. It includes all financial guaranty contracts outstanding as of the dates presented, regardless of the form written (i.e., credit derivative form or traditional financial guaranty insurance form) or the applicable accounting model (i.e., insurance, derivative or VIE consolidation). The Company excludes amounts attributable to loss mitigation securities (unless otherwise indicated) from par and principal and interest (debt service) outstanding because it manages such securities as investments, not insurance exposures. As of
December 31, 2016
and
December 31, 2015
, the Company excluded
$2.1 billion
and
$1.5 billion
, respectively, of net par as a result of loss mitigation strategies, including loss mitigation securities held in the investment portfolio, which are primarily BIG.
99
Net Par Outstanding and Average Internal Rating by Sector
|
|
As of December 31, 2016
|
As of December 31, 2015
|
||||||||||
|
Sector
|
Net Par
Outstanding
|
Avg.
Rating
|
Net Par
Outstanding
|
Avg.
Rating
|
||||||||
|
|
(dollars in millions)
|
|||||||||||
|
Public finance:
|
|
|
|
|||||||||
|
U.S.:
|
|
|
|
|||||||||
|
General obligation
|
$
|
107,717
|
|
A
|
$
|
126,255
|
|
A
|
||||
|
Tax backed
|
49,931
|
|
A-
|
58,062
|
|
A
|
||||||
|
Municipal utilities
|
37,603
|
|
A
|
45,936
|
|
A
|
||||||
|
Transportation
|
19,403
|
|
A-
|
23,454
|
|
A
|
||||||
|
Healthcare
|
11,238
|
|
A
|
15,006
|
|
A
|
||||||
|
Higher education
|
10,085
|
|
A
|
11,936
|
|
A
|
||||||
|
Infrastructure finance
|
3,769
|
|
BBB+
|
4,993
|
|
BBB
|
||||||
|
Housing
|
1,559
|
|
A-
|
2,037
|
|
A
|
||||||
|
Investor-owned utilities
|
697
|
|
BBB+
|
916
|
|
A-
|
||||||
|
Other public finance—U.S.
|
2,796
|
|
A
|
3,271
|
|
A
|
||||||
|
Total public finance—U.S.
|
244,798
|
|
A
|
291,866
|
|
A
|
||||||
|
Non-U.S.:
|
|
|
|
|||||||||
|
Infrastructure finance
|
10,731
|
|
BBB
|
12,728
|
|
BBB
|
||||||
|
Regulated utilities
|
9,263
|
|
BBB+
|
10,048
|
|
BBB+
|
||||||
|
Pooled infrastructure
|
1,513
|
|
AAA
|
1,879
|
|
AA
|
||||||
|
Other public finance
|
4,874
|
|
A
|
4,922
|
|
A
|
||||||
|
Total public finance—non-U.S.
|
26,381
|
|
BBB+
|
29,577
|
|
BBB+
|
||||||
|
Total public finance
|
271,179
|
|
A-
|
321,443
|
|
A
|
||||||
|
Structured finance:
|
|
|
|
|||||||||
|
U.S.:
|
|
|
|
|||||||||
|
Pooled corporate obligations
|
10,050
|
|
AAA
|
16,008
|
|
AAA
|
||||||
|
RMBS
|
5,637
|
|
BBB-
|
7,067
|
|
BBB-
|
||||||
|
Insurance securitizations
|
2,308
|
|
A+
|
3,000
|
|
A+
|
||||||
|
Consumer receivables
|
1,652
|
|
BBB+
|
2,099
|
|
A-
|
||||||
|
Financial products
|
1,540
|
|
AA-
|
1,906
|
|
AA-
|
||||||
|
Commercial receivables
|
230
|
|
BBB-
|
427
|
|
BBB+
|
||||||
|
CMBS and other commercial real estate related exposures
|
43
|
|
A
|
533
|
|
AAA
|
||||||
|
Other structured finance—U.S.
|
597
|
|
AA-
|
730
|
|
AA-
|
||||||
|
Total structured finance—U.S.
|
22,057
|
|
A+
|
31,770
|
|
AA-
|
||||||
|
Non-U.S.:
|
|
|
|
|||||||||
|
Pooled corporate obligations
|
1,535
|
|
AA
|
3,645
|
|
AA
|
||||||
|
RMBS
|
604
|
|
A-
|
492
|
|
BBB
|
||||||
|
Commercial receivables
|
356
|
|
BBB+
|
600
|
|
BBB+
|
||||||
|
Other structured finance
|
587
|
|
AA
|
621
|
|
AA-
|
||||||
|
Total structured finance—non-U.S.
|
3,082
|
|
AA-
|
5,358
|
|
AA-
|
||||||
|
Total structured finance
|
25,139
|
|
AA-
|
37,128
|
|
AA-
|
||||||
|
Total net par outstanding
|
$
|
296,318
|
|
A
|
$
|
358,571
|
|
A
|
||||
100
The following tables set forth the Company’s net financial guaranty portfolio by internal rating.
Financial Guaranty Portfolio by Internal Rating (1)
As of December 31, 2016
|
|
Public Finance
U.S. |
Public Finance
Non-U.S.
|
Structured Finance
U.S
|
Structured Finance
Non-U.S
|
Total
|
||||||||||||||||||||||||||||||
|
Rating
Category |
Net Par
Outstanding |
%
|
Net Par
Outstanding
|
%
|
Net Par
Outstanding
|
%
|
Net Par
Outstanding
|
%
|
Net Par
Outstanding
|
%
|
|||||||||||||||||||||||||
|
|
(dollars in millions)
|
||||||||||||||||||||||||||||||||||
|
AAA
|
$
|
2,066
|
|
0.8
|
%
|
$
|
2,221
|
|
8.4
|
%
|
$
|
9,757
|
|
44.2
|
%
|
$
|
1,447
|
|
47.0
|
%
|
$
|
15,491
|
|
5.2
|
%
|
||||||||||
|
AA
|
46,420
|
|
19.0
|
|
170
|
|
0.6
|
|
5,773
|
|
26.2
|
|
127
|
|
4.1
|
|
52,490
|
|
17.7
|
|
|||||||||||||||
|
A
|
133,829
|
|
54.7
|
|
6,270
|
|
23.8
|
|
1,589
|
|
7.2
|
|
456
|
|
14.8
|
|
142,144
|
|
48.0
|
|
|||||||||||||||
|
BBB
|
55,103
|
|
22.5
|
|
16,378
|
|
62.1
|
|
879
|
|
4.0
|
|
759
|
|
24.6
|
|
73,119
|
|
24.7
|
|
|||||||||||||||
|
BIG
|
7,380
|
|
3.0
|
|
1,342
|
|
5.1
|
|
4,059
|
|
18.4
|
|
293
|
|
9.5
|
|
13,074
|
|
4.4
|
|
|||||||||||||||
|
Total net par outstanding
|
$
|
244,798
|
|
100.0
|
%
|
$
|
26,381
|
|
100.0
|
%
|
$
|
22,057
|
|
100.0
|
%
|
$
|
3,082
|
|
100.0
|
%
|
$
|
296,318
|
|
100.0
|
%
|
||||||||||
_____________________
|
(1)
|
The
December 31, 2016
amounts include
$2.9 billion
of net par from the CIFG Acquisition.
|
Financial Guaranty Portfolio by Internal Rating (1)
As of December 31, 2015
|
|
Public Finance
U.S.
|
Public Finance
Non-U.S.
|
Structured Finance
U.S
|
Structured Finance
Non-U.S
|
Total
|
||||||||||||||||||||||||||||||
|
Rating
Category
|
Net Par
Outstanding
|
%
|
Net Par
Outstanding
|
%
|
Net Par
Outstanding
|
%
|
Net Par
Outstanding
|
%
|
Net Par
Outstanding
|
%
|
|||||||||||||||||||||||||
|
|
(dollars in millions)
|
||||||||||||||||||||||||||||||||||
|
AAA
|
$
|
3,053
|
|
1.1
|
%
|
$
|
709
|
|
2.4
|
%
|
$
|
14,366
|
|
45.2
|
%
|
$
|
2,709
|
|
50.6
|
%
|
$
|
20,837
|
|
5.8
|
%
|
||||||||||
|
AA
|
69,274
|
|
23.7
|
|
2,017
|
|
6.8
|
|
7,934
|
|
25.0
|
|
177
|
|
3.3
|
|
79,402
|
|
22.1
|
|
|||||||||||||||
|
A
|
157,440
|
|
53.9
|
|
6,765
|
|
22.9
|
|
2,486
|
|
7.8
|
|
555
|
|
10.3
|
|
167,246
|
|
46.7
|
|
|||||||||||||||
|
BBB
|
54,315
|
|
18.6
|
|
18,708
|
|
63.2
|
|
1,515
|
|
4.8
|
|
1,365
|
|
25.5
|
|
75,903
|
|
21.2
|
|
|||||||||||||||
|
BIG
|
7,784
|
|
2.7
|
|
1,378
|
|
4.7
|
|
5,469
|
|
17.2
|
|
552
|
|
10.3
|
|
15,183
|
|
4.2
|
|
|||||||||||||||
|
Total net par outstanding
|
$
|
291,866
|
|
100.0
|
%
|
$
|
29,577
|
|
100.0
|
%
|
$
|
31,770
|
|
100.0
|
%
|
$
|
5,358
|
|
100.0
|
%
|
$
|
358,571
|
|
100.0
|
%
|
||||||||||
_____________________
|
(1)
|
The
December 31, 2015
amounts include
$10.9 billion
of net par from the Radian Asset Acquisition.
|
101
The tables below show the Company's ten largest U.S. public finance, U.S. structured finance and non-U.S. exposures by revenue source, excluding related authorities and public corporations, as of
December 31, 2016
:
Ten Largest U.S. Public Finance Exposures
by Revenue Source
As of December 31, 2016
|
Net Par Outstanding
|
Percent of Total U.S. Public Finance Net Par Outstanding
|
Rating
|
||||||
|
(dollars in millions)
|
||||||||
|
New Jersey (State of)
|
$
|
4,468
|
|
1.8
|
%
|
BBB+
|
||
|
Illinois (State of)
|
2,269
|
|
0.9
|
|
BBB+
|
|||
|
California (State of)
|
1,849
|
|
0.8
|
|
A
|
|||
|
New York (City of) New York
|
1,804
|
|
0.7
|
|
A+
|
|||
|
Pennsylvania (Commonwealth of)
|
1,771
|
|
0.7
|
|
A-
|
|||
|
Chicago (City of) Illinois
|
1,699
|
|
0.7
|
|
BBB+
|
|||
|
New York (State of)
|
1,670
|
|
0.7
|
|
A+
|
|||
|
Puerto Rico, General Obligation, Appropriations and Guarantees of the Commonwealth
|
1,663
|
|
0.7
|
|
CCC-
|
|||
|
Massachusetts (Commonwealth of)
|
1,627
|
|
0.7
|
|
AA
|
|||
|
Port Authority of New York & New Jersey
|
1,337
|
|
0.5
|
|
BBB+
|
|||
|
Total of top ten U.S. public finance exposures
|
$
|
20,157
|
|
8.2
|
%
|
|||
Ten Largest U.S. Structured Finance Exposures
As of December 31, 2016
|
Net Par Outstanding
|
Percent of Total U.S. Structured Finance Net Par Outstanding
|
Rating
|
||||||
|
|
(dollars in millions)
|
|||||||
|
Private US Insurance Securitization
|
$
|
800
|
|
3.6
|
%
|
AA
|
||
|
Synthetic Investment Grade Pooled Corporate CDO
|
766
|
|
3.5
|
|
AAA
|
|||
|
Synthetic Investment Grade Pooled Corporate CDO
|
744
|
|
3.4
|
|
AAA
|
|||
|
Synthetic Investment Grade Pooled Corporate CDO
|
655
|
|
3.0
|
|
AAA
|
|||
|
Synthetic Investment Grade Pooled Corporate CDO
|
563
|
|
2.6
|
|
AAA
|
|||
|
Synthetic Investment Grade Pooled Corporate CDO
|
516
|
|
2.3
|
|
AAA
|
|||
|
Private US Insurance Securitization
|
500
|
|
2.3
|
|
AA
|
|||
|
Synthetic Investment Grade Pooled Corporate CDO
|
450
|
|
2.0
|
|
AAA
|
|||
|
SLM Private Credit Student Trust 2007-A
|
450
|
|
2.0
|
|
A-
|
|||
|
Synthetic Investment Grade Pooled Corporate CDO
|
440
|
|
2.0
|
|
AAA
|
|||
|
Total of top ten U.S. structured finance exposures
|
$
|
5,884
|
|
26.7
|
%
|
|||
102
Ten Largest Non-U.S. Exposures
As of December 31, 2016
|
Country
|
Net Par Outstanding
|
Percent of Total Non-U.S. Net Par Outstanding
|
Rating
|
|||||||
|
|
(dollars in millions)
|
|||||||||
|
Hydro-Quebec, Province of Quebec
|
Canada
|
$
|
1,985
|
|
6.7
|
%
|
A+
|
|||
|
Thames Water Utility Finance PLC
|
United Kingdom
|
1,146
|
|
3.9
|
|
A-
|
||||
|
Societe des Autoroutes du Nord et de l'Est de France S.A.
|
France
|
926
|
|
3.1
|
|
BBB+
|
||||
|
Channel Link Enterprises Finance PLC
|
France, United Kingdom
|
768
|
|
2.6
|
|
BBB
|
||||
|
Verbund - Lease and Sublease of Hydro-Electric Equipment
|
Austria
|
677
|
|
2.3
|
|
AAA
|
||||
|
Capital Hospitals (Barts)
|
United Kingdom
|
671
|
|
2.3
|
|
BBB-
|
||||
|
Sydney Airport Finance Company
|
Australia
|
631
|
|
2.1
|
|
BBB
|
||||
|
Southern Water Services Limited
|
United Kingdom
|
615
|
|
2.1
|
|
A-
|
||||
|
InspirED Education (South Lanarkshire) PLC
|
United Kingdom
|
608
|
|
2.1
|
|
BBB-
|
||||
|
Southern Gas Networks PLC
|
United Kingdom
|
556
|
|
1.9
|
|
BBB
|
||||
|
Total of top ten non-U.S. exposures
|
$
|
8,583
|
|
29.1
|
%
|
|||||
103
Financial Guaranty Portfolio by Geographic Area
The following table sets forth the geographic distribution of the Company's financial guaranty portfolio.
Geographic Distribution
of Financial Guaranty Portfolio
As of December 31, 2016
|
Number of Risks
|
Net Par Outstanding
|
Percent of Total Net Par Outstanding
|
|||||||
|
|
(dollars in millions)
|
||||||||
|
U.S.:
|
|||||||||
|
California
|
1,459
|
|
$
|
42,404
|
|
14.3
|
%
|
||
|
Texas
|
1,271
|
|
20,599
|
|
7.0
|
|
|||
|
Pennsylvania
|
852
|
|
20,232
|
|
6.8
|
|
|||
|
New York
|
935
|
|
19,637
|
|
6.6
|
|
|||
|
Illinois
|
776
|
|
17,967
|
|
6.1
|
|
|||
|
Florida
|
324
|
|
12,643
|
|
4.3
|
|
|||
|
New Jersey
|
495
|
|
12,560
|
|
4.2
|
|
|||
|
Michigan
|
506
|
|
7,985
|
|
2.7
|
|
|||
|
Georgia
|
172
|
|
6,372
|
|
2.2
|
|
|||
|
Ohio
|
409
|
|
5,554
|
|
1.9
|
|
|||
|
Other states and U.S. territories
|
3,475
|
|
78,845
|
|
26.6
|
|
|||
|
Total U.S. public finance
|
10,674
|
|
244,798
|
|
82.7
|
|
|||
|
U.S. Structured finance (multiple states)
|
610
|
|
22,057
|
|
7.4
|
|
|||
|
Total U.S.
|
11,284
|
|
266,855
|
|
90.1
|
|
|||
|
Non-U.S.:
|
|||||||||
|
United Kingdom
|
112
|
|
15,940
|
|
5.4
|
|
|||
|
Australia
|
18
|
|
3,036
|
|
1.0
|
|
|||
|
Canada
|
9
|
|
2,730
|
|
0.9
|
|
|||
|
France
|
14
|
|
1,809
|
|
0.6
|
|
|||
|
Italy
|
9
|
|
1,311
|
|
0.4
|
|
|||
|
Other
|
53
|
|
4,637
|
|
1.6
|
|
|||
|
Total non-U.S.
|
215
|
|
29,463
|
|
9.9
|
|
|||
|
Total
|
11,499
|
|
$
|
296,318
|
|
100.0
|
%
|
||
104
Financial Guaranty Portfolio by Issue Size
The Company seeks broad coverage of the market by insuring and reinsuring small and large issues alike. The following table sets forth the distribution of the Company's portfolio by original size of the Company's exposure.
Public Finance Portfolio by Issue Size
As of December 31, 2016
|
Original Par Amount Per Issue
|
Number of
Issues
|
Net Par
Outstanding
|
% of Public
Finance
Net Par
Outstanding
|
||||||
|
(dollars in millions)
|
|||||||||
|
Less than $10 million
|
15,018
|
$
|
40,484
|
|
14.9
|
%
|
|||
|
$10 through $50 million
|
5,198
|
86,376
|
|
31.9
|
|
||||
|
$50 through $100 million
|
937
|
48,058
|
|
17.7
|
|
||||
|
$100 million to $200 million
|
430
|
42,938
|
|
15.8
|
|
||||
|
$200 million or greater
|
238
|
53,323
|
|
19.7
|
|
||||
|
Total
|
21,821
|
$
|
271,179
|
|
100.0
|
%
|
|||
Structured Finance Portfolio by Issue Size
As of December 31, 2016
|
Original Par Amount Per Issue
|
Number of
Issues
|
Net Par
Outstanding
|
% of Structured
Finance
Net Par
Outstanding
|
||||||
|
(dollars in millions)
|
|||||||||
|
Less than $10 million
|
186
|
$
|
94
|
|
0.4
|
%
|
|||
|
$10 through $50 million
|
241
|
1,765
|
|
7.0
|
|
||||
|
$50 through $100 million
|
85
|
2,469
|
|
9.8
|
|
||||
|
$100 million to $200 million
|
127
|
4,805
|
|
19.1
|
|
||||
|
$200 million or greater
|
139
|
16,006
|
|
63.7
|
|
||||
|
Total
|
778
|
$
|
25,139
|
|
100.0
|
%
|
|||
Exposures by Reinsurer
Ceded par outstanding represents the portion of insured risk ceded to external reinsurers. Under these relationships, the Company cedes a portion of its insured risk in exchange for a premium paid to the reinsurer. The Company remains primarily liable for all risks it directly underwrites and is required to pay all gross claims. It then seeks reimbursement from the reinsurer for its proportionate share of claims. The Company may be exposed to risk for this exposure if it were required to pay the gross claims and not be able to collect ceded claims from an assuming company experiencing financial distress. A number of the financial guaranty insurers to which the Company has ceded par have experienced financial distress and as a result have been downgraded by the rating agencies. In addition, state insurance regulators have intervened with respect to some of these insurers.
In accordance with U.S. statutory accounting requirements and U.S. insurance laws and regulations, in order for the Company to receive credit for liabilities ceded to reinsurers domiciled outside of the U.S., such reinsurers must secure their liabilities to the Company. All of the unauthorized reinsurers in the table below are required to post collateral for the benefit of the Company in an amount at least equal to the sum of their ceded unearned premium reserve, loss reserves and contingency reserves, all calculated on a statutory basis of accounting. In addition, certain authorized reinsurers in the table below post collateral on terms negotiated with the Company. Collateral may be in the form of letters of credit or trust accounts. The total collateral posted by all non-affiliated reinsurers as of
December 31, 2016
was approximately
$387 million
.
Assumed par outstanding represents the amount of par assumed by the Company from third party insurers and reinsurers, including other monoline financial guaranty companies. Under these relationships, the Company assumes a portion
105
of the ceding company’s insured risk in exchange for a premium. The Company may be exposed to risk in this portfolio in that the Company may be required to pay losses without a corresponding premium in circumstances where the ceding company is experiencing financial distress and is unable to pay premiums.
In addition to assumed and ceded reinsurance arrangements, the Company may also have exposure to financial guaranty insurers in "second-to-pay" transactions, where the Company provides insurance on an obligation that is already insured by another financial guarantor. In that case, if the underlying obligor and the financial guarantor both fail to pay an amount scheduled to be paid, the Company would be obligated to pay. The Company underwrites these transactions based on the underlying obligation, without regard to the financial guarantor. See Part II, Item 8, Financial Statements and Supplementary Data, Note 13, Reinsurance and Other Monoline Exposures.
Monoline and Reinsurer Exposure
by Company
|
|
Par Outstanding
|
|||||||||||
|
As of December 31, 2016
|
||||||||||||
|
Reinsurer
|
Ceded Par
Outstanding (1) |
Second-to-
Pay Insured Par Outstanding (2) |
Assumed Par
Outstanding |
|||||||||
|
|
(in millions)
|
|||||||||||
|
Reinsurers rated investment grade:
|
||||||||||||
|
Tokio Marine & Nichido Fire Insurance Co., Ltd. (3) (4)
|
$
|
3,436
|
|
$
|
—
|
|
$
|
—
|
|
|||
|
Mitsui Sumitomo Insurance Co. Ltd. (3) (4)
|
1,273
|
|
—
|
|
—
|
|
||||||
|
National
|
—
|
|
4,420
|
|
4,364
|
|
||||||
|
Subtotal
|
4,709
|
|
4,420
|
|
4,364
|
|
||||||
|
Reinsurers rated BIG, with rating withdrawn or not rated:
|
||||||||||||
|
American Overseas Reinsurance Company Limited (3)
|
3,573
|
|
—
|
|
30
|
|
||||||
|
Syncora Guarantee Inc. (3)
|
2,062
|
|
1,098
|
|
655
|
|
||||||
|
ACA Financial Guaranty Corp.
|
637
|
|
20
|
|
—
|
|
||||||
|
Ambac Assurance Corporation
|
115
|
|
2,862
|
|
6,695
|
|
||||||
|
MBIA
|
—
|
|
1,024
|
|
165
|
|
||||||
|
MBIA UK (5)
|
—
|
|
319
|
|
211
|
|
||||||
|
FGIC (6)
|
—
|
|
1,194
|
|
410
|
|
||||||
|
Ambac Assurance Corp. Segregated Account
|
—
|
|
73
|
|
614
|
|
||||||
|
Other (3)
|
60
|
|
529
|
|
120
|
|
||||||
|
Subtotal
|
6,447
|
|
7,119
|
|
8,900
|
|
||||||
|
Total
|
$
|
11,156
|
|
$
|
11,539
|
|
$
|
13,264
|
|
|||
____________________
|
(1)
|
Of the total ceded par to reinsurers rated BIG, had rating withdrawn or not rated,
$384 million
is rated BIG.
|
|
(2)
|
The par on second-to-pay exposure where the primary insurer and underlying transaction rating are both BIG is
$788 million
.
|
|
(3)
|
The total collateral posted by all non-affiliated reinsurers required or had agreed to post collateral as of
December 31, 2016
was approximately
$387 million
.
|
(4) The Company benefits from trust arrangements that satisfy the triple-A credit requirement of S&P and/or Moody’s.
|
(5)
|
See Part II, Item 8, Financial Statements and Supplementary Data, Note 2, Acquisitions, for more information on MBIA UK.
|
|
(6)
|
FGIC includes subsidiaries Financial Guaranty Insurance Company and FGIC UK Limited.
|
106
Exposure to Puerto Rico
The Company has insured exposure to general obligation bonds of the Commonwealth of Puerto Rico (Puerto Rico or the Commonwealth) and various obligations of its related authorities and public corporations aggregating
$4.8 billion
net par as of
December 31, 2016
,
all of which are rated BIG.
Puerto Rico has experienced significant general fund budget deficits in recent years and a challenging economic environment. Beginning on January 1, 2016, a number of Puerto Rico credits have defaulted on bond payments, and the Company has now paid claims on several Puerto Rico credits as shown in the table "Puerto Rico Net Par Outstanding" below.
Additional information about recent developments in Puerto Rico and the individual credits insured by the Company may be found in Part II, Item 8, Financial Statements and Supplementary Data, Note 4, Outstanding Exposure.
The Company groups its Puerto Rico exposure into three categories:
|
•
|
Constitutionally Guaranteed.
The Company includes in this category public debt benefiting from Article VI of the Constitution of the Commonwealth, which expressly provides that interest and principal payments on the public debt are to be paid before other disbursements are made.
|
|
•
|
Public Corporations – Certain Revenues Potentially Subject to Clawback.
The Company includes in this category the debt of public corporations for which applicable law permits the Commonwealth to claw back, subject to certain conditions and for the payment of public debt, at least a portion of the revenues supporting the bonds the Company insures. As a Constitutional condition to clawback, available Commonwealth revenues for any fiscal year must be insufficient to pay Commonwealth debt service before the payment of any appropriations for that year. The Company believes that this condition has not been satisfied to date, and accordingly that the Commonwealth has not to date been entitled to clawback revenues supporting debt insured by the Company.
As described in Part II, Item 8, Financial Statements and Supplementary Data, Note 4, Outstanding Exposure, the Company sued various Puerto Rico governmental officials in the United States District Court, District of Puerto Rico asserting that Puerto Rico's recent attempt to claw back pledged taxes is unconstitutional, and demanding declaratory and injunctive relief.
|
|
•
|
Other Public Corporations.
The Company includes in this category the debt of public corporations that are supported by revenues it does not believe are subject to clawback.
|
107
Net Exposure to Puerto Rico
As of December 31, 2016
|
Net Par Outstanding
|
||||||||||||||||||||||||
|
|
AGM
|
AGC
|
AG Re
|
Eliminations (1)
|
Total Net Par Outstanding (2)
|
Gross Par Outstanding
|
||||||||||||||||||
|
|
(in millions)
|
|||||||||||||||||||||||
|
Commonwealth Constitutionally Guaranteed
|
||||||||||||||||||||||||
|
Commonwealth of Puerto Rico - General Obligation Bonds (3)
|
$
|
680
|
|
$
|
378
|
|
$
|
421
|
|
$
|
(3
|
)
|
$
|
1,476
|
|
$
|
1,577
|
|
||||||
|
Puerto Rico Public Buildings Authority (PBA) (3)
|
11
|
|
169
|
|
0
|
|
(11
|
)
|
169
|
|
174
|
|
||||||||||||
|
Public Corporations - Certain Revenues Potentially Subject to Clawback
|
|
|
||||||||||||||||||||||
|
Puerto Rico Highways and Transportation Authority (PRHTA) (Transportation revenue) (3) (4)
|
273
|
|
519
|
|
209
|
|
(83
|
)
|
918
|
|
949
|
|
||||||||||||
|
PRHTA (Highway revenue)
|
213
|
|
93
|
|
44
|
|
—
|
|
350
|
|
556
|
|
||||||||||||
|
Puerto Rico Convention Center District Authority (PRCCDA)
|
—
|
|
152
|
|
—
|
|
—
|
|
152
|
|
152
|
|
||||||||||||
|
Puerto Rico Infrastructure Financing Authority (PRIFA) (3)
|
—
|
|
17
|
|
1
|
|
—
|
|
18
|
|
18
|
|
||||||||||||
|
Other Public Corporations
|
|
|
||||||||||||||||||||||
|
PREPA
|
417
|
|
73
|
|
234
|
|
—
|
|
724
|
|
876
|
|
||||||||||||
|
Puerto Rico Aqueduct and Sewer Authority (PRASA)
|
—
|
|
285
|
|
88
|
|
—
|
|
373
|
|
373
|
|
||||||||||||
|
Municipal Finance Agency (MFA)
|
175
|
|
61
|
|
98
|
|
—
|
|
334
|
|
488
|
|
||||||||||||
|
Puerto Rico Sales Tax Financing Corporation (COFINA)
|
262
|
|
—
|
|
9
|
|
—
|
|
271
|
|
271
|
|
||||||||||||
|
University of Puerto Rico (U of PR)
|
—
|
|
1
|
|
—
|
|
—
|
|
1
|
|
1
|
|
||||||||||||
|
Total net exposure to Puerto Rico
|
$
|
2,031
|
|
$
|
1,748
|
|
$
|
1,104
|
|
$
|
(97
|
)
|
$
|
4,786
|
|
$
|
5,435
|
|
||||||
____________________
|
(1)
|
Net par outstanding eliminations relate to second-to-pay policies under which an Assured Guaranty insurance subsidiary guarantees an obligation already insured by another Assured Guaranty insurance subsidiary.
|
|
(2)
|
Includes exposure to capital appreciation bonds with a current aggregate net par outstanding of $31 million and a fully accreted net par at maturity of $63 million. Of these amounts, current net par of $19 million and fully accreted net par at maturity of $50 million relate to the COFINA, current net par of $7 million and fully accreted net par at maturity of $7 million relate to the PRHTA, and current net par of $5 million and fully accreted net par at maturity of $5 million relate to the Commonwealth General Obligation Bonds.
|
|
(3)
|
As of the date of this filing, the Company has paid claims on these credits.
|
|
(4)
|
The
December 31, 2016
amount includes
$46 million
of net par from CIFG Acquisition.
|
108
The following table shows the scheduled amortization of the general obligation bonds of Puerto Rico and various obligations of its related authorities and public corporations insured by the Company. The Company guarantees payments of interest and principal when those amounts are scheduled to be paid and cannot be required to pay on an accelerated basis. In the event that obligors default on their obligations, the Company would only pay the shortfall between the principal and interest due in any given period and the amount paid by the obligors.
Amortization Schedule
of Net Par Outstanding of Puerto Rico
As of December 31, 2016
|
Scheduled Net Par Amortization
|
||||||||||||||||||||||||||||||||||||||||||
|
|
2017 (1Q)
|
2017 (2Q)
|
2017 (3Q)
|
2017 (4Q)
|
2018
|
2019
|
2020
|
2021
|
2022 -2026
|
2027 -2031
|
2032 -2036
|
2037 -2041
|
2042 -2047
|
Total
|
||||||||||||||||||||||||||||
|
|
(in millions)
|
|||||||||||||||||||||||||||||||||||||||||
|
Commonwealth Constitutionally Guaranteed
|
||||||||||||||||||||||||||||||||||||||||||
|
Commonwealth of Puerto Rico - General Obligation Bonds
|
$
|
0
|
|
$
|
0
|
|
$
|
93
|
|
$
|
0
|
|
$
|
75
|
|
$
|
82
|
|
$
|
136
|
|
$
|
16
|
|
$
|
226
|
|
$
|
254
|
|
$
|
489
|
|
$
|
105
|
|
$
|
—
|
|
$
|
1,476
|
|
|
PBA
|
—
|
|
—
|
|
28
|
|
—
|
|
—
|
|
3
|
|
5
|
|
13
|
|
24
|
|
42
|
|
54
|
|
—
|
|
—
|
|
169
|
|
||||||||||||||
|
Public Corporations - Certain Revenues Potentially Subject to Clawback
|
||||||||||||||||||||||||||||||||||||||||||
|
PRHTA (Transportation revenue)
|
0
|
|
0
|
|
36
|
|
0
|
|
38
|
|
32
|
|
25
|
|
18
|
|
119
|
|
156
|
|
295
|
|
194
|
|
5
|
|
918
|
|
||||||||||||||
|
PRHTA (Highway revenue)
|
—
|
|
—
|
|
10
|
|
—
|
|
10
|
|
21
|
|
22
|
|
26
|
|
30
|
|
62
|
|
169
|
|
—
|
|
—
|
|
350
|
|
||||||||||||||
|
PRCCDA
|
—
|
|
—
|
|
—
|
|
—
|
|
—
|
|
—
|
|
—
|
|
—
|
|
—
|
|
19
|
|
133
|
|
—
|
|
—
|
|
152
|
|
||||||||||||||
|
PRIFA
|
—
|
|
—
|
|
—
|
|
—
|
|
2
|
|
—
|
|
—
|
|
—
|
|
2
|
|
—
|
|
—
|
|
14
|
|
—
|
|
18
|
|
||||||||||||||
|
Other Public Corporations
|
||||||||||||||||||||||||||||||||||||||||||
|
PREPA
|
0
|
|
0
|
|
5
|
|
—
|
|
4
|
|
25
|
|
42
|
|
21
|
|
322
|
|
279
|
|
26
|
|
0
|
|
—
|
|
724
|
|
||||||||||||||
|
PRASA
|
—
|
|
—
|
|
—
|
|
—
|
|
—
|
|
—
|
|
—
|
|
—
|
|
53
|
|
57
|
|
—
|
|
2
|
|
261
|
|
373
|
|
||||||||||||||
|
MFA
|
—
|
|
—
|
|
48
|
|
—
|
|
47
|
|
44
|
|
37
|
|
33
|
|
98
|
|
27
|
|
—
|
|
—
|
|
—
|
|
334
|
|
||||||||||||||
|
COFINA
|
0
|
|
0
|
|
0
|
|
0
|
|
(1
|
)
|
(1
|
)
|
(1
|
)
|
(2
|
)
|
(5
|
)
|
(7
|
)
|
34
|
|
102
|
|
152
|
|
271
|
|
||||||||||||||
|
U of PR
|
—
|
|
—
|
|
0
|
|
—
|
|
0
|
|
0
|
|
0
|
|
0
|
|
0
|
|
0
|
|
1
|
|
—
|
|
—
|
|
1
|
|
||||||||||||||
|
Total net par for Puerto Rico
|
$
|
0
|
|
$
|
0
|
|
$
|
220
|
|
$
|
0
|
|
$
|
175
|
|
$
|
206
|
|
$
|
266
|
|
$
|
125
|
|
$
|
869
|
|
$
|
889
|
|
$
|
1,201
|
|
$
|
417
|
|
$
|
418
|
|
$
|
4,786
|
|
109
Amortization Schedule
of Net Debt Service Outstanding of Puerto Rico
As of December 31, 2016
|
Scheduled Net Debt Service Amortization
|
||||||||||||||||||||||||||||||||||||||||||
|
|
2017 (1Q)
|
2017 (2Q)
|
2017 (3Q)
|
2017 (4Q)
|
2018
|
2019
|
2020
|
2021
|
2022 -2026
|
2027 -2031
|
2032 -2036
|
2037 -2041
|
2042 -2047
|
Total
|
||||||||||||||||||||||||||||
|
|
(in millions)
|
|||||||||||||||||||||||||||||||||||||||||
|
Commonwealth Constitutionally Guaranteed
|
||||||||||||||||||||||||||||||||||||||||||
|
Commonwealth of Puerto Rico - General Obligation Bonds
|
$
|
38
|
|
$
|
0
|
|
$
|
131
|
|
$
|
0
|
|
$
|
146
|
|
$
|
150
|
|
$
|
200
|
|
$
|
73
|
|
$
|
488
|
|
$
|
445
|
|
$
|
595
|
|
$
|
112
|
|
$
|
—
|
|
$
|
2,378
|
|
|
PBA
|
4
|
|
—
|
|
32
|
|
—
|
|
7
|
|
10
|
|
13
|
|
20
|
|
54
|
|
58
|
|
62
|
|
—
|
|
—
|
|
260
|
|
||||||||||||||
|
Public Corporations - Certain Revenues Potentially Subject to Clawback
|
||||||||||||||||||||||||||||||||||||||||||
|
PRHTA (Transportation revenue)
|
24
|
|
0
|
|
60
|
|
0
|
|
84
|
|
76
|
|
67
|
|
59
|
|
305
|
|
308
|
|
404
|
|
229
|
|
5
|
|
1,621
|
|
||||||||||||||
|
PRHTA (Highway revenue)
|
10
|
|
—
|
|
19
|
|
—
|
|
29
|
|
39
|
|
39
|
|
42
|
|
96
|
|
120
|
|
196
|
|
—
|
|
—
|
|
590
|
|
||||||||||||||
|
PRCCDA
|
3
|
|
—
|
|
4
|
|
—
|
|
7
|
|
7
|
|
7
|
|
7
|
|
35
|
|
50
|
|
151
|
|
—
|
|
—
|
|
271
|
|
||||||||||||||
|
PRIFA
|
0
|
|
—
|
|
0
|
|
—
|
|
3
|
|
1
|
|
1
|
|
1
|
|
7
|
|
4
|
|
3
|
|
15
|
|
—
|
|
35
|
|
||||||||||||||
|
Other Public Corporations
|
||||||||||||||||||||||||||||||||||||||||||
|
PREPA
|
15
|
|
2
|
|
20
|
|
2
|
|
37
|
|
58
|
|
74
|
|
52
|
|
440
|
|
322
|
|
29
|
|
0
|
|
—
|
|
1,051
|
|
||||||||||||||
|
PRASA
|
10
|
|
—
|
|
10
|
|
—
|
|
20
|
|
19
|
|
19
|
|
19
|
|
147
|
|
129
|
|
68
|
|
70
|
|
327
|
|
838
|
|
||||||||||||||
|
MFA
|
8
|
|
—
|
|
57
|
|
—
|
|
62
|
|
56
|
|
47
|
|
40
|
|
118
|
|
30
|
|
—
|
|
—
|
|
—
|
|
418
|
|
||||||||||||||
|
COFINA
|
6
|
|
0
|
|
6
|
|
0
|
|
13
|
|
13
|
|
13
|
|
13
|
|
69
|
|
68
|
|
103
|
|
162
|
|
160
|
|
626
|
|
||||||||||||||
|
U of PR
|
0
|
|
—
|
|
0
|
|
—
|
|
0
|
|
0
|
|
0
|
|
0
|
|
0
|
|
0
|
|
1
|
|
—
|
|
—
|
|
1
|
|
||||||||||||||
|
Total net par for Puerto Rico
|
$
|
118
|
|
$
|
2
|
|
$
|
339
|
|
$
|
2
|
|
$
|
408
|
|
$
|
429
|
|
$
|
480
|
|
$
|
326
|
|
$
|
1,759
|
|
$
|
1,534
|
|
$
|
1,612
|
|
$
|
588
|
|
$
|
492
|
|
$
|
8,089
|
|
Exposure to U.S. Residential Mortgage-Backed Securities
The tables below provide information on the risk ratings and certain other risk characteristics of the Company’s financial guaranty insurance, FG VIE and credit derivative U.S. RMBS exposures. As of
December 31, 2016
, U.S. RMBS exposures represent 2% of the total net par outstanding, and BIG U.S. RMBS represent 24% of total BIG net par outstanding. See Part II, Item 8, Financial Statements and Supplementary Data, Note 5, Expected Loss to be Paid, for a discussion of expected losses to be paid on U.S. RMBS exposures.
Distribution of U.S. RMBS by Rating and Type of Exposure as of
December 31, 2016
|
Ratings:
|
Prime
First Lien
|
Alt-A
First Lien
|
Option
ARMs
|
Subprime
First Lien
|
Second
Lien
|
Total Net Par Outstanding
|
||||||||||||||||||
|
(dollars in millions)
|
||||||||||||||||||||||||
|
AAA
|
$
|
2
|
|
$
|
174
|
|
$
|
28
|
|
$
|
1,471
|
|
$
|
0
|
|
$
|
1,675
|
|
||||||
|
AA
|
24
|
|
240
|
|
52
|
|
276
|
|
0
|
|
592
|
|
||||||||||||
|
A
|
14
|
|
11
|
|
0
|
|
85
|
|
0
|
|
111
|
|
||||||||||||
|
BBB
|
24
|
|
5
|
|
—
|
|
80
|
|
0
|
|
108
|
|
||||||||||||
|
BIG
|
141
|
|
570
|
|
81
|
|
1,134
|
|
1,225
|
|
3,151
|
|
||||||||||||
|
Total exposures
|
$
|
205
|
|
$
|
1,000
|
|
$
|
161
|
|
$
|
3,045
|
|
$
|
1,225
|
|
$
|
5,637
|
|
||||||
110
Distribution of U.S. RMBS by Year Insured and Type of Exposure as of
December 31, 2016
|
Year
insured:
|
Prime
First Lien
|
Alt-A
First Lien
|
Option
ARMs
|
Subprime
First Lien
|
Second
Lien
|
Total Net Par Outstanding
|
||||||||||||
|
|
(in millions)
|
|||||||||||||||||
|
2004 and prior
|
31
|
|
43
|
|
15
|
|
959
|
|
74
|
|
1,122
|
|
||||||
|
2005
|
102
|
|
376
|
|
30
|
|
164
|
|
264
|
|
936
|
|
||||||
|
2006
|
72
|
|
76
|
|
28
|
|
682
|
|
352
|
|
1,210
|
|
||||||
|
2007
|
—
|
|
504
|
|
89
|
|
1,176
|
|
536
|
|
2,305
|
|
||||||
|
2008
|
—
|
|
—
|
|
—
|
|
65
|
|
—
|
|
65
|
|
||||||
|
Total exposures
|
205
|
|
1,000
|
|
161
|
|
3,045
|
|
1,225
|
|
5,637
|
|
||||||
Exposure to Selected European Countries
The European countries where the Company has exposure and believes heightened uncertainties exist are: Hungary, Italy, Portugal, Spain and Turkey (collectively, the Selected European Countries). The Company added Turkey to its list of Selected European Countries in 2016, as a result of the recent political turmoil in the country. The Company’s direct economic exposure to the Selected European Countries (based on par for financial guaranty contracts and notional amount for financial guaranty contracts accounted for as derivatives) is shown in the following tables, both gross and net of ceded reinsurance.
Gross Direct Economic Exposure
to Selected European Countries(1)
As of December 31, 2016
|
|
Hungary
|
Italy
|
Portugal
|
Spain
|
Turkey
|
Total
|
|||||||||||||||||
|
|
(in millions)
|
||||||||||||||||||||||
|
Sub-sovereign exposure(2)
|
$
|
239
|
|
$
|
1,107
|
|
$
|
78
|
|
$
|
430
|
|
$
|
—
|
|
$
|
1,854
|
|
|||||
|
Non-sovereign exposure(3)
|
117
|
|
443
|
|
—
|
|
—
|
|
202
|
|
762
|
|
|||||||||||
|
Total
|
$
|
356
|
|
$
|
1,550
|
|
$
|
78
|
|
$
|
430
|
|
$
|
202
|
|
$
|
2,616
|
|
|||||
|
Total BIG
|
$
|
287
|
|
$
|
—
|
|
$
|
78
|
|
$
|
430
|
|
$
|
—
|
|
$
|
795
|
|
|||||
Net Direct Economic Exposure
to Selected European Countries(1)
As of December 31, 2016
|
|
Hungary
|
Italy
|
Portugal
|
Spain
|
Turkey
|
Total
|
|||||||||||||||||
|
|
(in millions)
|
||||||||||||||||||||||
|
Sub-sovereign exposure(2)
|
$
|
236
|
|
$
|
880
|
|
$
|
76
|
|
$
|
342
|
|
$
|
—
|
|
$
|
1,534
|
|
|||||
|
Non-sovereign exposure(3)
|
114
|
|
399
|
|
—
|
|
—
|
|
202
|
|
715
|
|
|||||||||||
|
Total
|
$
|
350
|
|
$
|
1,279
|
|
$
|
76
|
|
$
|
342
|
|
$
|
202
|
|
$
|
2,249
|
|
|||||
|
Total BIG
|
$
|
283
|
|
$
|
—
|
|
$
|
76
|
|
$
|
342
|
|
$
|
—
|
|
$
|
701
|
|
|||||
____________________
|
(1)
|
While exposures are shown in U.S. dollars, the obligations are in various currencies, primarily euros.
|
|
(2)
|
Sub-sovereign exposure in Selected European Countries includes transactions backed by receivables from, or supported by, sub-sovereigns, which are governmental or government-backed entities other than the ultimate governing body of the country.
|
|
(3)
|
Non-sovereign exposure in Selected European Countries includes debt of regulated utilities, RMBS and diversified payment rights (DPR) securitizations.
|
111
The tables above include the par amount of financial guaranty contracts accounted for as derivatives of $108 million with a fair value of $2 million, net of reinsurance. The Company’s credit derivative transactions are governed by ISDA documentation, and the Company is required to make a loss payment on them only upon the occurrence of one or more defined credit events with respect to the referenced securities or loans.
The Company rates $283 million of its direct net par exposure to the Republic of Hungary BIG. The sub-sovereign transaction it rates BIG is an infrastructure financing dependent on payments by government agencies, while the non-sovereign transactions it rates BIG are covered mortgage bonds issued by Hungarian banks. The Company rates one insured Hungarian covered bond transaction investment grade.
The Company does not rate any of its direct exposure to the Republic of Italy BIG. The Company’s sub-sovereign exposure to Italy depends on payments by Italian governmental entities, while its non-sovereign Italian exposure is comprised primarily of securities backed by Italian residential mortgages or in one case a government-sponsored water utility.
The Company rates all of its direct exposure to the Kingdom of Spain and the Republic of Portugal BIG. The Company’s direct sub-sovereign exposure to Spain and Portugal includes infrastructure financings dependent on payments by sub-sovereigns and government agencies and financings dependent on lease and other payments by sub-sovereigns and government agencies.
The
$202 million
net insured par exposure in Turkey is to DPR securitizations sponsored by a major Turkish bank. These DPR securitizations were established outside of Turkey and involve payment orders in U.S. dollars, pounds sterling and Euros from persons outside of Turkey to beneficiaries in Turkey who are customers of the sponsoring bank. The sponsoring bank's correspondent banks have agreed to remit all such payments to a trustee-controlled account outside Turkey, where debt service payments for the DPR securitization are given priority over payments to the sponsoring bank.
Indirect Exposure to Selected European Countries
The Company considers economic exposure to a Selected European Country to be indirect when that exposure relates to only a small portion of an insured transaction that otherwise is not related to that Selected European Country, and the Company has excluded its indirect exposure to the Selected European Countries from the exposure tables above. The Company has such indirect exposure to Selected European Countries through insurance it provides on pooled corporate and commercial receivables transactions.
The Company’s pooled corporate obligations with indirect exposure to Selected European Countries are highly diversified in terms of obligors and, except in the case of TruPS CDOs or transactions backed by perpetual preferred securities, highly diversified in terms of industry. Most pooled corporate obligations are structured to limit exposure to any given obligor and any given non-U.S. country or region and generally benefit from embedded credit enhancement which allows a transaction a certain level of losses in the underlying collateral without causing the Company to pay a claim. The Company’s commercial receivable transactions with indirect exposure to Selected European Countries are rail car lease transactions and aircraft lease transactions where some of the lessees have a nexus with the Selected European Countries. Like the pooled corporate transactions, the commercial receivable transactions generally benefit from embedded credit enhancement which allows a transaction a certain level of losses in the underlying collateral without causing the Company to pay a claim.
The Company has excluded from the exposure tables above its indirect economic exposure to the Selected European Countries through policies it provides on pooled corporate and commercial receivables transactions. The Company calculates indirect exposure to a country by multiplying the par amount of a transaction insured by the Company times the percent of the relevant collateral pool reported as having a nexus to the country.
On that basis, the Company has calculated exposure of
$115 million
to Selected European Countries (plus Greece) in transactions with
$2.8 billion
of net par outstanding. The indirect exposure to credits with a nexus to Greece is
$3 million
across several highly rated pooled corporate obligations with net par outstanding of
$129 million
.
Identifying Exposure to Selected European Countries
When the Company directly insures an obligation, it assigns the obligation to a geographic location or locations based on its view of the geographic location of the risk. For most exposures this can be a relatively straight-forward determination as, for example, a debt issue supported by availability payments for a toll road in a particular country. The Company may also assign portions of a risk to more than one geographic location as it has, for example, in a residential mortgage backed security backed by residential mortgage loans in both Germany and Italy. The Company may also have exposures to the Selected
112
European Countries in business assumed from third party insurers and reinsurers. In the case of assumed business, the Company depends upon geographic information provided by the primary insurer.
Liquidity and Capital Resources
Liquidity Requirements and Sources
AGL and its Holding Company Subsidiaries
The liquidity of AGL, AGUS and AGMH is largely dependent on dividends from their operating subsidiaries and their access to external financing. The liquidity requirements of these entities include the payment of operating expenses, interest on debt issued by AGUS and AGMH, and dividends on AGL's common shares. AGL and its holding company subsidiaries may also require liquidity to make periodic capital investments in their operating subsidiaries or, in the case of AGL, to repurchase its common shares pursuant to its share repurchase authorization. In the ordinary course of business, the Company evaluates its liquidity needs and capital resources in light of holding company expenses and dividend policy, as well as rating agency considerations. The Company also subjects its cash flow projections and its assets to a stress test, maintaining a liquid asset balance of one time its stressed operating company net cash flows. Management believes that AGL will have sufficient liquidity to satisfy its needs over the next twelve months. See “Insurance Company Regulatory Restrictions” below for a discussion of the dividend restrictions of its insurance company subsidiaries.
113
AGL and Holding Company Subsidiaries
Significant Cash Flow Items
|
|
Year Ended December 31,
|
||||||||||
|
|
2016
|
2015
|
2014
|
||||||||
|
|
(in millions)
|
||||||||||
|
Intercompany sources (uses):
|
|||||||||||
|
Dividends paid by AGC to AGUS
|
$
|
79
|
|
$
|
90
|
|
$
|
69
|
|
||
|
Dividends paid by AGM to AGMH
|
247
|
|
215
|
|
160
|
|
|||||
|
Dividends paid by AG Re to AGL
|
100
|
|
150
|
|
82
|
|
|||||
|
Dividends paid by other subsidiaries of AGMH
|
—
|
|
—
|
|
10
|
|
|||||
|
Repayment of surplus note by AGM to AGMH
|
—
|
|
25
|
|
50
|
|
|||||
|
Proceeds to AGMH from repurchase of common shares by AGM
|
300
|
|
—
|
|
—
|
|
|||||
|
Repayment of loan by AGUS to AGRO
|
(20
|
)
|
—
|
|
—
|
|
|||||
|
Issuance of note by AGUS to AGC(1)
|
—
|
|
(200
|
)
|
—
|
|
|||||
|
Repayment of note by AGC to AGUS(1)
|
—
|
|
200
|
|
—
|
|
|||||
|
External sources (uses):
|
|||||||||||
|
Dividends paid to AGL shareholders
|
(69
|
)
|
(72
|
)
|
(76
|
)
|
|||||
|
Repurchases of common shares by AGL(2)
|
(306
|
)
|
(555
|
)
|
(590
|
)
|
|||||
|
Interest paid by AGMH and AGUS
|
(95
|
)
|
(95
|
)
|
(83
|
)
|
|||||
|
Proceeds from issuance of long-term debt
|
—
|
|
—
|
|
495
|
|
|||||
____________________
|
(1)
|
On March 31, 2015, AGUS, as lender, provided $200 million to AGC, as borrower, from available funds to help fund the purchase of Radian Asset. AGC repaid that loan in full on April 14, 2015.
|
|
(2)
|
See Part II, Item 8, Financial Statements and Supplementary Data, Note 18, Shareholders' Equity, for additional information about share repurchases and authorizations.
|
Dividends From Subsidiaries
The Company anticipates that for the next twelve months, amounts paid by AGL’s direct and indirect insurance company subsidiaries as dividends or other distributions will be a major source of its liquidity. The insurance company subsidiaries’ ability to pay dividends depends upon their financial condition, results of operations, cash requirements, and compliance with rating agency requirements, and is also subject to restrictions contained in the insurance laws and related regulations of their states of domicile. Dividend restrictions applicable to AGC, AGM, MAC and to AG Re, are described in Part II, Item 8, Financial Statements and Supplementary Data, Note 11, Insurance Company Regulatory Requirements.
Dividend restrictions by insurance company subsidiary are as follows:
|
•
|
The maximum amount available during 2017 for AGM to distribute as dividends without regulatory approval is estimated to be approximately
$232 million
, of which approximately
$81 million
is estimated to be available for distribution in the first quarter of 2017.
|
|
•
|
The maximum amount available during 2017 for AGC to distribute as ordinary dividends is approximately $
107 million
, of which approximately
$29 million
is available for distribution in the first quarter of 2017.
|
|
•
|
The maximum amount available during 2017 for MAC to distribute as dividends without regulatory approval is estimated to be approximately
$49 million
. MAC currently intends to allocate the distribution of such amount quarterly in 2017.
|
|
•
|
Based on the applicable law and regulations, in 2017 AG Re has the capacity to (i) make capital distributions in an aggregate amount up to
$128 million
without the prior approval of the Authority and (ii) declare and pay dividends in an aggregate amount up to the limit of its outstanding statutory surplus, which is
$314 million
. Such dividend capacity is further limited by the actual amount of AG Re’s unencumbered assets, which amount changes
|
114
from time to time due in part to collateral posting requirements. As of
December 31, 2016
, AG Re had unencumbered assets of approximately
$596 million
.
Generally, dividends paid by a U.S. company to a Bermuda holding company are subject to a 30% withholding tax. After AGL became tax resident in the U.K., it became subject to the tax rules applicable to companies resident in the U.K., including the benefits afforded by the U.K.’s tax treaties. The income tax treaty between the U.K. and the U.S. reduces or eliminates the U.S. withholding tax on certain U.S. sourced investment income (to 5% or 0%), including dividends from U.S. subsidiaries to U.K. resident persons entitled to the benefits of the treaty.
External Financing
From time to time, AGL and its subsidiaries have sought external debt or equity financing in order to meet their obligations. External sources of financing may or may not be available to the Company, and if available, the cost of such financing may not be acceptable to the Company.
On June 20, 2014, AGUS issued $
500 million
of
5
% Senior Notes due 2014. The notes are guaranteed by AGL. The net proceeds of the notes were used for general corporate purposes, including the purchase of AGL common shares.
Intercompany Loans and Guarantees
On March 30, 2015, AGUS loaned $200 million to AGC to facilitate the acquisition of Radian Asset on April 1, 2015. AGC repaid the loan in full on April 14, 2015.
From time to time, AGL and its subsidiaries have entered into intercompany loan facilities. For example, on October 25, 2013, AGL, as borrower, and AGUS, as lender, entered into a revolving credit facility pursuant to which AGL may, from time to time, borrow for general corporate purposes. Under the credit facility, AGUS committed to lend a principal amount not exceeding
$225 million
in the aggregate. Such commitment terminates on October 25, 2018 (the loan termination date). The unpaid principal amount of each loan will bear interest at a fixed rate equal to
100%
of the then applicable Federal short-term or mid-term interest rate, as the case may be, as determined under Internal Revenue Code Sec. 1274(d), and interest on all loans will be computed for the actual number of days elapsed on the basis of a year consisting of 360 days. Accrued interest on all loans will be paid on the last day of each June and December, beginning on December 31, 2013, and at maturity. AGL must repay the then unpaid principal amounts of the loans by the third anniversary of the loan termination date. No amounts are currently outstanding under the credit facility.
In addition, in 2012 AGUS borrowed
$90 million
from its affiliate AGRO to fund the acquisition of MAC. During 2016, AGUS repaid
$20 million
in outstanding principal as well as accrued any unpaid interest, and the parties agreed to extend the maturity date of the loan from May 2017 to November 2019. As of
December 31, 2016
,
$70 million
remained outstanding.
Furthermore, AGL fully and unconditionally guarantees the payment of the principal of, and interest on, the $1,130 million aggregate principal amount of senior notes issued by AGUS and AGMH, and the $450 million aggregate principal amount of junior subordinated debentures issued by AGUS and AGMH, in each case, as described under "Commitments and Contingencies -- Long-Term Debt Obligations" below.
Cash and Investments
As of
December 31, 2016
, AGL had $36 million in cash and short-term investments. AGUS and AGMH had a total of $259 million in cash and short-term investments. In addition, the Company's U.S. holding companies have $147 million in fixed-maturity securities with weighted average duration of 0.2 years.
115
Insurance Company Subsidiaries
Liquidity of the insurance company subsidiaries is primarily used to pay for:
|
•
|
operating expenses,
|
|
•
|
claims on the insured portfolio,
|
|
•
|
posting of collateral in connection with credit derivatives and reinsurance transactions,
|
|
•
|
reinsurance premiums,
|
|
•
|
dividends to AGL, AGUS and/or AGMH, as applicable,
|
|
•
|
principal of and, where applicable, interest on surplus notes, and
|
|
•
|
capital investments in their own subsidiaries, where appropriate.
|
On June 30, 2016, MAC obtained approval from the NYDFS to repay its $300 million surplus note to Municipal Assurance Holdings Inc. (MAC Holdings) and its $100 million surplus note (plus accrued interest) to AGM. Accordingly, on June 30, 2016, MAC transferred cash and/or marketable securities to (i) MAC Holdings in an aggregate amount equal to $300 million, and (ii) AGM in an aggregate amount of $102.5 million. MAC Holdings, upon receipt of such $300 million from MAC, distributed cash and/or marketable securities in an aggregate amount of $300 million to its shareholders, AGM and AGC, in proportion to their respective 61% and 39% ownership interests such that AGM received $182 million and AGC received $118 million.
On November 25, 2016, the New York Superintendent approved AGM's request to repurchase
125
of its shares of common stock from its direct parent, AGMH, for approximately
$300 million
. AGM implemented the stock redemption plan in December 2016. Each share repurchased by AGM was retired and ceased to be an authorized share. Pursuant to AGM's Amended and Restated Charter, the par value of AGM's remaining shares of common stock issued and outstanding increased automatically in order to maintain AGM's total paid-in capital at
$15 million
and its authorized capital at
$20 million
.
Management believes that its subsidiaries’ liquidity needs for the next twelve months can be met from current cash, short-term investments and operating cash flow, including premium collections and coupon payments as well as scheduled maturities and paydowns from their respective investment portfolios. The Company targets a balance of its most liquid assets including cash and short-term securities, Treasuries, agency RMBS and pre-refunded municipal bonds equal to 1.5 times its projected operating company cash flow needs over the next four quarters. The Company intends to hold and has the ability to hold temporarily impaired debt securities until the date of anticipated recovery.
Beyond the next twelve months, the ability of the operating subsidiaries to declare and pay dividends may be influenced by a variety of factors, including market conditions, insurance regulations and rating agency capital requirements and general economic conditions.
Insurance policies issued provide, in general, that payments of principal, interest and other amounts insured may not be accelerated by the holder of the obligation. Amounts paid by the Company therefore are typically in accordance with the obligation’s original payment schedule, unless the Company accelerates such payment schedule, at its sole option.
116
Payments made in settlement of the Company’s obligations arising from its insured portfolio may, and often do, vary significantly from year-to-year, depending primarily on the frequency and severity of payment defaults and whether the Company chooses to accelerate its payment obligations in order to mitigate future losses.
Claims (Paid) Recovered
|
|
Year Ended December 31,
|
||||||||||
|
|
2016
|
2015
|
2014
|
||||||||
|
|
(in millions)
|
||||||||||
|
Public finance
|
$
|
(216
|
)
|
$
|
(29
|
)
|
$
|
(144
|
)
|
||
|
Structured finance:
|
|||||||||||
|
U.S. RMBS before benefit for recoveries for breaches of R&W
|
(179
|
)
|
(270
|
)
|
(304
|
)
|
|||||
|
Net benefit for recoveries for breaches of R&W
|
89
|
|
173
|
|
663
|
|
|||||
|
U.S. RMBS after benefit for recoveries for breaches of R&W
|
(90
|
)
|
(97
|
)
|
359
|
|
|||||
|
Other structured finance
|
(48
|
)
|
(161
|
)
|
2
|
|
|||||
|
Structured finance
|
(138
|
)
|
(258
|
)
|
361
|
|
|||||
|
Claims (paid) recovered, net of reinsurance(1)
|
$
|
(354
|
)
|
$
|
(287
|
)
|
$
|
217
|
|
||
____________________
|
(1)
|
Includes $11 million, $21 million and $20 million paid in 2016, 2015 and 2014, respectively, for consolidated FG VIEs.
|
As of December 31, 2016, the Company had exposure of approximately $528 million to a long-term infrastructure project that was financed by bonds that mature prior to the expiration of the project concession. The Company expects the cash flows from the project to be sufficient to repay all of the debt over the life of the project concession, and also expects the debt to be refinanced in the market at or prior to its maturity. If the issuer is unable to refinance the debt due to market conditions, the Company may have to pay claims when the debt matures from 2018 to 2022, and then recover from cash flows produced by the project in the future. The Company generally projects that in most scenarios it will be fully reimbursed for such claim payments. However, the recovery of such amounts is uncertain and may take from 10 to 35 years, depending on the performance of the underlying collateral.
In addition, the Company has net par exposure to the general obligation bonds of Puerto Rico and various obligations of its related authorities and public corporations aggregating
$4.8 billion
, all of which are BIG. Puerto Rico has experienced significant general fund budget deficits in recent years. Beginning in 2016, the Commonwealth has defaulted on obligations to make payments on its debt. In addition to high debt levels, Puerto Rico faces a challenging economic environment. Information regarding the Company's exposure to the Commonwealth of Puerto Rico and its related authorities and public corporations is set forth in Part II, Item 8, Financial Statements and Supplementary Data, Note 4, Outstanding Exposure.
The terms of the Company’s CDS contracts generally are modified from standard CDS contract forms approved by ISDA in order to provide for payments on a scheduled "pay-as-you-go" basis and to replicate the terms of a traditional financial guaranty insurance policy. Some contracts the Company entered into as the credit protection seller, however, utilize standard ISDA settlement mechanics of cash settlement (i.e., a process to value the loss of market value of a reference obligation) or physical settlement (i.e., delivery of the reference obligation against payment of principal by the protection seller) in the event of a “credit event,” as defined in the relevant contract. Cash settlement or physical settlement generally requires the payment of a larger amount, prior to the maturity of the reference obligation, than would settlement on a “pay-as-you-go” basis. As of
December 31, 2016
, the Company was posting approximately
$116 million
to secure its obligations under CDS. Of that amount, approximately $100 million related to
$516 million
in CDS gross par insured where the amount of required collateral is capped and the remaining
$16 million
related to
$174 million
in CDS gross par insured where the amount of required collateral is based on movements in the mark-to-market valuation of the underlying exposure. In February 2017, the Company terminated its remaining CDS contracts with
one
of its counterparties as to which it has a cap on its posting requirement and relating to approximately
$183 million
gross par and
$73 million
of collateral posted, as
December 31, 2016
, and the collateral is being returned to the Company.
117
Consolidated Cash Flows
Consolidated Cash Flow Summary
|
|
Year Ended December 31,
|
||||||||||
|
|
2016
|
2015
|
2014
|
||||||||
|
|
(in millions)
|
||||||||||
|
Net cash flows provided by (used in) operating activities before effects of FG VIE consolidation
|
$
|
(165
|
)
|
$
|
(95
|
)
|
$
|
509
|
|
||
|
Effect of FG VIE consolidation
|
24
|
|
43
|
|
68
|
|
|||||
|
Net cash flows provided by (used in) operating activities - reported
|
(141
|
)
|
(52
|
)
|
577
|
|
|||||
|
Net cash flows provided by (used in) investing activities before effects of FG VIE consolidation
|
489
|
|
823
|
|
(423
|
)
|
|||||
|
Effect of FG VIE consolidation
|
587
|
|
171
|
|
327
|
|
|||||
|
Net cash flows provided by (used in) investing activities - reported
|
1,076
|
|
994
|
|
(96
|
)
|
|||||
|
Net cash flows provided by (used in) financing activities before effects of FG VIE consolidation
|
(367
|
)
|
(633
|
)
|
(189
|
)
|
|||||
|
Effect of FG VIE consolidation
|
(611
|
)
|
(214
|
)
|
(396
|
)
|
|||||
|
Net cash flows provided by (used in) financing activities - reported (1)
|
(978
|
)
|
(847
|
)
|
(585
|
)
|
|||||
|
Effect of exchange rate changes
|
(5
|
)
|
(4
|
)
|
(5
|
)
|
|||||
|
Cash at beginning of period
|
166
|
|
75
|
|
184
|
|
|||||
|
Total cash at the end of the period
|
$
|
118
|
|
$
|
166
|
|
$
|
75
|
|
||
____________________
|
(1)
|
Claims paid on consolidated FG VIEs are presented in the consolidated cash flow statements as a component of paydowns on FG VIE liabilities in financing activities as opposed to operating activities.
|
Excluding net cash flows from FG VIE consolidation, cash outflows from operating activities increased in 2016 compared with 2015 due primarily to claim payments on Puerto Rico bonds, higher accelerated claim payments as a means of mitigating future losses and lower cash received from commutations.
Excluding net cash flows from FG VIE consolidation, cash inflows from operating activities decreased in 2015 compared with 2014 due primarily to lower R&W cash recoveries in 2015 than the comparable prior year period.
Investing activities were primarily net sales (purchases) of fixed-maturity and short-term investment securities. Investing cash flows in
2016
,
2015
and
2014
include inflows of
$629 million
,
$400 million
and
$408 million
from paydowns on FG VIE assets, respectively. The increase in inflows from FG VIEs in 2016 was due to the proceeds from a paydown of a large transaction. In 2016, the Company paid $435 million, net of cash acquired, to acquire CIFGH. In 2015, the Company sold securities to fund the acquisition of Radian Asset by AGC and paid $800 million, net of cash acquired, to acquire Radian Asset.
Financing activities consisted primarily of paydowns of FG VIE liabilities and share repurchases. Financing cash flows in
2016
,
2015
and
2014
include outflows of
$611 million
,
$214 million
and
$396 million
for FG VIEs, respectively. The increase in outflows from FG VIEs in 2016 was due to the paydown of a large transaction. In
2016
, the Company paid
$306 million
to repurchase
10.7 million
common shares; in
2015
, the Company paid
$555 million
to repurchase
21.0 million
common shares; and in
2014
, the Company paid
$590 million
to repurchase
24.4 million
common shares.
From January 1, 2017 thr
ough February 23, 2017, the Company repurchased an additional
3.6 million
common shares. As of February 23, 2017, the Company had remaining authorization to purchase common
shares of
$407 million
on a settlement basis. For more information about the Company's share repurchases and authorizations, see Part II, Item 8, Financial Statements and Supplementary Data, Note 18, Shareholders' Equity.
Commitments and Contingencies
Leases
AGL and its subsidiaries lease office space and certain other items.
118
The principal executive offices of AGL and AG Re consist of approximately 8,250 square feet of office space located in Hamilton, Bermuda; the lease for this space expires in April 2021. AGM entered into an operating lease as of September 30, 2015 for new office space originally comprising one full floor and one partial floor at 1633 Broadway in New York City. The Company moved the principal place of business of AGM, AGC, MAC and the Company's other U.S. based subsidiaries from 31 West 52
nd
Street in New York City to this new location in the third quarter of 2016. The new lease is for approximately
88,000
square feet and runs until 2032, with an option, subject to certain conditions, to renew for
five
years at a fair market rent. The fixed annual rent, which commences after an initial rent holiday, begins at
$6.2 million
, rising in
two
steps to
$7.3 million
for the last
five
years of the initial term. In connection with the move and in return for rent abatement and certain other concessions, AGM terminated its lease on its office space at 31 West 52
nd
Street, which had been scheduled to run until
2026
. On September 23, 2016, AGM entered into an amendment to its new lease to include the remaining portion of the partial floor for the remainder of the lease term. The fixed annual rent for the remaining portion of the partial floor, which commences after an initial rent holiday, begins at
$1.1 million
per annum, rising in two steps to
$1.3 million
for the last
five
years of the initial term. In addition, the Company leases office space in London and San Francisco, California. See “–Contractual Obligations” for lease payments due by period. Rent expense was
$13.4 million
in
2016
,
$10.5 million
in
2015
and
$10.1 million
in
2014
.
Long-Term Debt Obligations
The outstanding principal and interest paid on long-term debt were as follows:
Principal Outstanding
|
|
Principal Amount
|
Interest Paid
|
|||||||||||||||||
|
|
As of December 31,
|
Year Ended December 31,
|
|||||||||||||||||
|
2016
|
2015
|
2016
|
2015
|
2014
|
|||||||||||||||
|
|
(in millions)
|
||||||||||||||||||
|
AGUS:
|
|
|
|
|
|
|
|||||||||||||
|
7% Senior Notes(1)
|
$
|
200
|
|
$
|
200
|
|
$
|
14
|
|
$
|
14
|
|
$
|
14
|
|
||||
|
5% Senior Notes(1)
|
500
|
|
500
|
|
25
|
|
25
|
|
13
|
|
|||||||||
|
Series A Enhanced Junior Subordinated Debentures(2)
|
150
|
|
150
|
|
10
|
|
10
|
|
10
|
|
|||||||||
|
Total AGUS
|
850
|
|
850
|
|
49
|
|
49
|
|
37
|
|
|||||||||
|
AGMH(3):
|
|
|
|
|
|
|
|
|
|
|
|||||||||
|
6
7
/
8
% QUIBS(1)
|
100
|
|
100
|
|
7
|
|
7
|
|
7
|
|
|||||||||
|
6.25% Notes(1)
|
230
|
|
230
|
|
14
|
|
14
|
|
14
|
|
|||||||||
|
5.6% Notes(1)
|
100
|
|
100
|
|
6
|
|
6
|
|
6
|
|
|||||||||
|
Junior Subordinated Debentures(2)
|
300
|
|
300
|
|
19
|
|
19
|
|
19
|
|
|||||||||
|
Total AGMH
|
730
|
|
730
|
|
46
|
|
46
|
|
46
|
|
|||||||||
|
AGM(3):
|
|
|
|
|
|
|
|
|
|
|
|||||||||
|
AGM Notes Payable
|
9
|
|
12
|
|
0
|
|
0
|
|
3
|
|
|||||||||
|
Total AGM
|
9
|
|
12
|
|
0
|
|
0
|
|
3
|
|
|||||||||
|
Total
|
$
|
1,589
|
|
$
|
1,592
|
|
$
|
95
|
|
$
|
95
|
|
$
|
86
|
|
||||
____________________
|
(1)
|
AGL fully and unconditionally guarantees these obligations
|
|
(2)
|
Guaranteed by AGL on a junior subordinated basis.
|
(3)
Principal amounts vary from carrying amounts due primarily to acquisition method fair value adjustments at the AGMH acquisition date, which are accreted or amortized into interest expense over the remaining terms of these obligations.
7
% Senior Notes issued by AGUS.
On May 18, 2004, AGUS issued $
200 million
of
7
% Senior Notes due 2034 for net proceeds of $
197 million
. Although the coupon on the Senior Notes is
7
%, the effective rate is approximately
6.4%
, taking into account the effect of a cash flow hedge.
119
5
% Senior Notes issued by AGUS.
On June 20, 2014, AGUS issued $
500 million
of
5
% Senior Notes due 2024 for net proceeds of
$495 million
. The notes are guaranteed by AGL. The net proceeds from the sale of the notes were used for general corporate purposes, including the purchase of common shares of AGL.
Series A Enhanced Junior Subordinated Debentures issued by AGUS.
On December 20, 2006, AGUS issued $
150 million
of Debentures due 2066. The Debentures pay a fixed
6.4%
rate of interest until December 15, 2016, and thereafter pay a floating rate of interest, reset quarterly, at a rate equal to
three
month London Interbank Offered Rate (LIBOR) plus a margin equal to
2.38%
. AGUS may select at one or more times to defer payment of interest for one or more consecutive periods for up to
ten
years. Any unpaid interest bears interest at the then applicable rate. AGUS may not defer interest past the maturity date.
6 7/8
% QUIBS issued by AGMH.
On December 19, 2001, AGMH issued $
100 million
face amount of
6 7/8
% QUIBS due December 15, 2101, which are callable without premium or penalty.
6.25
% Notes issued by AGMH.
On November 26, 2002, AGMH issued $
230 million
face amount of
6.25
% Notes due November 1, 2102, which are callable without premium or penalty in whole or in part.
5.6
% Notes issued by AGMH.
On July 31, 2003, AGMH issued $
100 million
face amount of
5.6
% Notes due July 15, 2103, which are callable without premium or penalty in whole or in part.
Junior Subordinated Debentures issued by AGMH.
On November 22, 2006, AGMH issued $
300 million
face amount of Junior Subordinated Debentures with a scheduled maturity date of December 15, 2036 and a final repayment date of December 15, 2066. The final repayment date of December 15, 2066 may be automatically extended up to
four
times in
five
-year increments provided certain conditions are met. The debentures are redeemable, in whole or in part, at any time prior to December 15, 2036 at their principal amount plus accrued and unpaid interest to the date of redemption or, if greater, the make-whole redemption price. Interest on the debentures will accrue from November 22, 2006 to December 15, 2036 at the annual rate of
6.4%
. If any amount of the debentures remains outstanding after December 15, 2036, then the principal amount of the outstanding debentures will bear interest at a floating interest rate equal to
one
-month LIBOR plus
2.215%
until repaid. AGMH may elect at
one
or more times to defer payment of interest on the debentures for
one
or more consecutive interest periods that do not exceed
ten
years. In connection with the completion of this offering, AGMH entered into a replacement capital covenant for the benefit of persons that buy, hold or sell a specified series of AGMH long-term indebtedness ranking senior to the debentures. Under the covenant, the debentures will not be repaid, redeemed, repurchased or defeased by AGMH or any of its subsidiaries on or before the date that is
twenty
years prior to the final repayment date, except to the extent that AGMH has received proceeds from the sale of replacement capital securities. The proceeds from this offering were used to pay a dividend to the shareholders of AGMH.
Recourse Credit Facility
In connection with the acquisition of AGMH, AGM agreed to retain the risks relating to the debt and strip policy portions of the leveraged lease business. The liquidity risk to AGM related to the strip policy portion of the leveraged lease business was previously mitigated by the strip coverage facility described below.
In a leveraged lease transaction, a tax-exempt entity (such as a transit agency) transfers tax benefits to a tax-paying entity by transferring ownership of a depreciable asset, such as subway cars. The tax-exempt entity then leases the asset back from its new owner.
If the lease is terminated early, the tax-exempt entity must make an early termination payment to the lessor. A portion of this early termination payment is funded from monies that were pre-funded and invested at the closing of the leveraged lease transaction (along with earnings on those invested funds). The tax-exempt entity is obligated to pay the remaining, unfunded portion of this early termination payment (known as the strip coverage) from its own sources. AGM issued financial guaranty insurance policies (known as strip policies) that guaranteed the payment of these unfunded strip coverage amounts to the lessor, in the event that a tax-exempt entity defaulted on its obligation to pay this portion of its early termination payment. Following such events, AGM can then seek reimbursement of its strip policy payments from the tax-exempt entity, and can also sell the transferred depreciable asset and reimburse itself from the sale proceeds.
Currently, all the leveraged lease transactions in which AGM acts as strip coverage provider are breaching a rating trigger related to AGM and are subject to early termination. However, early termination of a lease does not result in a draw on the AGM policy if the tax-exempt entity makes the required termination payment. If all the leases were to terminate early and the tax-exempt entities do not make the required early termination payments, then AGM would be exposed to possible liquidity claims on gross exposure of approximately
$953 million
as of
December 31, 2016
.
To date, none of the leveraged lease
120
transactions that involve AGM has experienced an early termination due to a lease default and a claim on the AGM policy.
At
December 31, 2016
, approximately
$1.5 billion
of cumulative strip par exposure had been terminated since 2008 on a consensual basis. The consensual terminations have resulted in no claims on AGM.
On July 1, 2009, AGM and Dexia Crédit Local S.A., acting through its New York Branch (Dexia Crédit Local (NY)), entered into a credit facility (the Strip Coverage Facility). Under the Strip Coverage Facility, Dexia Crédit Local (NY) agreed to make loans to AGM to finance all draws made by lessors on AGM strip policies that were outstanding as of November 13, 2008, up to the commitment amount. There have never been any borrowings under the Strip Coverage Facility, the amount of the leveraged leases covered by the Strip Coverage Facility has declined since July 1, 2009 and, to date, none of the leveraged lease transactions in which AGM acts as the strip coverage provider has experienced an early termination due to a lease default. Consequently, and in view of the credit quality of the relevant tax-exempt entities and the cost of the Strip Coverage Facility, the Company determined that maintaining the Strip Coverage Facility was no longer warranted. On July 29, 2016, the parties terminated the Strip Coverage Facility.
Committed Capital Securities
Each of AGC and AGM have issued $200 million of CCS pursuant to transactions in which AGC CCS or AGM’s Committed Preferred Trust Securities (the AGM CPS), as applicable, were issued by custodial trusts created for the primary purpose of issuing such securities, investing the proceeds in high-quality assets and providing put options to AGC or AGM, as applicable. The put options allow AGC and AGM to issue non-cumulative redeemable perpetual preferred securities to the trusts in exchange for cash. For both AGC and AGM, four initial trusts were created, each with an initial aggregate face amount of $50 million. The Company does not consider itself to be the primary beneficiary of the trusts for either the AGC or AGM CCS and the trusts are not consolidated in Assured Guaranty's financial statements.
The trusts provide AGC and AGM access to new capital at their respective sole discretion through the exercise of the put options. Upon AGC's or AGM's exercise of its put option, the relevant trust will liquidate its portfolio of eligible assets and use the proceeds to purchase the AGC or AGM preferred stock, as applicable. AGC or AGM may use the proceeds from such sale of its preferred stock to the trusts for any purpose, including the payment of claims. The put agreements have no scheduled termination date or maturity. However, each put agreement will terminate if (subject to certain grace periods) specified events occur.
AGC Committed Capital Securities.
AGC entered into separate put agreements with four custodial trusts with respect to its CCS in April 2005. The AGC put options have not been exercised through the date of this filing. Initially, all of AGC CCS were issued to a special purpose pass-through trust (the Pass-Through Trust). The Pass-Through Trust was dissolved in April 2008 and the AGC CCS were distributed to the holders of the Pass-Through Trust's securities. Neither the Pass-Through Trust nor the custodial trusts are consolidated in the Company's financial statements. Income distributions on the Pass-Through Trust securities and CCS were equal to an annualized rate of one-month LIBOR plus 110 basis points for all periods ending on or prior to April 8, 2008. Following dissolution of the Pass-Through Trust, distributions on the AGC CCS are determined pursuant to an auction process. On April 7, 2008 this auction process failed, thereby increasing the annualized rate on the AGC CCS to one-month LIBOR plus 250 basis points. Distributions on the AGC preferred stock will be determined pursuant to the same process. AGC continues to have the ability to exercise its put option and cause the related trusts to purchase AGC Preferred Stock.
AGM Committed Capital Securities.
AGM entered into separate put agreements with four custodial trusts with respect to its CCS in June 2003. The AGM put options have not been exercised through the date of this filing. AGM pays a floating put premium to the trusts, which represents the difference between the commercial paper yield and the winning auction rate (plus all fees and expenses of the trust). If an auction does not attract sufficient clearing bids, however, the auction rate is subject to a maximum rate of one-month LIBOR plus 200 basis points for the next succeeding distribution period. Beginning in August 2007, the AGM CCS required the maximum rate for each of the relevant trusts. AGM continues to have the ability to exercise its put option and cause the related trusts to purchase AGM Preferred Stock.
121
Contractual Obligations
The following table summarizes the Company's obligations under its contracts, including debt and lease obligations, and also includes estimated claim payments, based on its loss estimation process, under financial guaranty policies it has issued.
|
As of December 31, 2016
|
|||||||||||||||||||
|
Less Than
1 Year
|
1-3
Years
|
3-5
Years
|
More Than
5 Years
|
Total
|
|||||||||||||||
|
(in millions)
|
|||||||||||||||||||
|
Long-term debt(1):
|
|
||||||||||||||||||
|
7% Senior Notes
|
$
|
14
|
|
$
|
28
|
|
$
|
28
|
|
$
|
373
|
|
$
|
443
|
|
||||
|
5% Senior Notes
|
25
|
|
50
|
|
50
|
|
563
|
|
688
|
|
|||||||||
|
Series A Enhanced Junior Subordinated Debentures
|
5
|
|
11
|
|
12
|
|
443
|
|
471
|
|
|||||||||
|
6
7
/
8
% QUIBS
|
7
|
|
14
|
|
14
|
|
650
|
|
685
|
|
|||||||||
|
6.25% Notes
|
14
|
|
29
|
|
29
|
|
1,393
|
|
1,465
|
|
|||||||||
|
5.6 Notes
|
6
|
|
11
|
|
11
|
|
557
|
|
585
|
|
|||||||||
|
Junior Subordinated Debentures
|
19
|
|
38
|
|
38
|
|
1,164
|
|
1,259
|
|
|||||||||
|
Notes Payable
|
4
|
|
3
|
|
1
|
|
1
|
|
9
|
|
|||||||||
|
Operating lease obligations(2)
|
6
|
|
17
|
|
17
|
|
88
|
|
128
|
|
|||||||||
|
Other compensation plans(3)
|
15
|
|
—
|
|
—
|
|
—
|
|
15
|
|
|||||||||
|
Estimated claim payments(4)
|
231
|
|
298
|
|
65
|
|
1,969
|
|
2,563
|
|
|||||||||
|
Other
|
15
|
|
—
|
|
—
|
|
—
|
|
15
|
|
|||||||||
|
Total
|
$
|
361
|
|
$
|
499
|
|
$
|
265
|
|
$
|
7,201
|
|
$
|
8,326
|
|
||||
____________________
|
(1)
|
Includes interest and principal payments. See Note 16, Long-Term Debt and Credit Facilities, in Part II, Item 8, Financial Statements and Supplementary Data for expected maturities of debt.
|
|
(2)
|
Operating lease obligations exclude escalations in building operating costs and real estate taxes.
|
|
(3)
|
Amount excludes approximately $56 million of liabilities under various supplemental retirement plans, which are fair valued and payable at the time of termination of employment by either employer or employee. Amount also excludes approximately $19 million of liabilities under Performance Retention Plan, which are payable at the time of vesting or termination of employment by either employer or employee. Given the nature of these awards, we are unable to determine the year in which they will be paid.
|
|
(4)
|
Claim payments represent estimated undiscounted expected cash outflows under direct and assumed financial guaranty contracts, whether accounted for as insurance or credit derivatives, including claim payments under contracts in consolidated FG VIEs. The amounts presented are not reduced for cessions under reinsurance contracts. Amounts include any benefit anticipated from excess spread or other recoveries within the contracts but do not reflect any benefit for recoveries under breaches of R&W.
|
Investment Portfolio
The Company’s principal objectives in managing its investment portfolio are to support the highest possible ratings for each operating company; to manage investment risk within the context of the underlying portfolio of insurance risk; to maintain sufficient liquidity to cover unexpected stress in the insurance portfolio; and to maximize after-tax net investment income.
122
The Company’s fixed-maturity securities and short-term investments had a duration of 5.3 years as of
December 31, 2016
and 5.4 years as of
December 31, 2015
. Generally, the Company’s fixed-maturity securities are designated as available-for-sale. For more information about the Investment Portfolio and a detailed description of the Company’s valuation of investments see Part II, Item 8, Financial Statements and Supplementary Data, Note 7, Fair Value Measurement and Note 10, Investments and Cash.
Fixed-Maturity Securities and Short-Term Investments
by Security Type
|
As of December 31, 2016
|
As of December 31, 2015
|
||||||||||||||
|
|
Amortized
Cost
|
Estimated
Fair Value
|
Amortized
Cost
|
Estimated
Fair Value
|
|||||||||||
|
|
(in millions)
|
||||||||||||||
|
Fixed-maturity securities:
|
|
|
|
|
|
|
|
|
|||||||
|
Obligations of state and political subdivisions
|
$
|
5,269
|
|
$
|
5,432
|
|
$
|
5,528
|
|
$
|
5,841
|
|
|||
|
U.S. government and agencies
|
424
|
|
440
|
|
377
|
|
400
|
|
|||||||
|
Corporate securities
|
1,612
|
|
1,613
|
|
1,505
|
|
1,520
|
|
|||||||
|
Mortgage-backed securities(1):
|
|
|
|||||||||||||
|
RMBS
|
998
|
|
987
|
|
1,238
|
|
1,245
|
|
|||||||
|
CMBS
|
575
|
|
583
|
|
506
|
|
513
|
|
|||||||
|
Asset-backed securities
|
835
|
|
945
|
|
831
|
|
825
|
|
|||||||
|
Foreign government securities
|
261
|
|
233
|
|
290
|
|
283
|
|
|||||||
|
Total fixed-maturity securities
|
9,974
|
|
10,233
|
|
10,275
|
|
10,627
|
|
|||||||
|
Short-term investments
|
590
|
|
590
|
|
396
|
|
396
|
|
|||||||
|
Total fixed-maturity and short-term investments
|
$
|
10,564
|
|
$
|
10,823
|
|
$
|
10,671
|
|
$
|
11,023
|
|
|||
____________________
|
(1)
|
Government-agency obligations were approximately
42%
of mortgage backed securities as of
December 31, 2016
and
54%
as of
December 31, 2015
, based on fair value.
|
123
The following tables summarize, for all fixed-maturity securities in an unrealized loss position as of
December 31, 2016
and
December 31, 2015
, the aggregate fair value and gross unrealized loss by length of time the amounts have continuously been in an unrealized loss position.
Fixed-Maturity Securities
Gross Unrealized Loss by Length of Time
As of
December 31, 2016
|
|
Less than 12 months
|
12 months or more
|
Total
|
||||||||||||||||||||
|
|
Fair
Value
|
Unrealized
Loss
|
Fair
Value
|
Unrealized
Loss
|
Fair
Value
|
Unrealized
Loss
|
|||||||||||||||||
|
|
(dollars in millions)
|
||||||||||||||||||||||
|
Obligations of state and political subdivisions
|
$
|
1,110
|
|
$
|
(38
|
)
|
$
|
6
|
|
$
|
(1
|
)
|
$
|
1,116
|
|
$
|
(39
|
)
|
|||||
|
U.S. government and agencies
|
87
|
|
(1
|
)
|
—
|
|
—
|
|
87
|
|
(1
|
)
|
|||||||||||
|
Corporate securities
|
492
|
|
(11
|
)
|
118
|
|
(20
|
)
|
610
|
|
(31
|
)
|
|||||||||||
|
Mortgage-backed securities:
|
|
|
|||||||||||||||||||||
|
RMBS
|
391
|
|
(23
|
)
|
94
|
|
(15
|
)
|
485
|
|
(38
|
)
|
|||||||||||
|
CMBS
|
165
|
|
(5
|
)
|
—
|
|
—
|
|
165
|
|
(5
|
)
|
|||||||||||
|
Asset-backed securities
|
36
|
|
0
|
|
0
|
|
0
|
|
36
|
|
0
|
|
|||||||||||
|
Foreign government securities
|
44
|
|
(5
|
)
|
114
|
|
(27
|
)
|
158
|
|
(32
|
)
|
|||||||||||
|
Total
|
$
|
2,325
|
|
$
|
(83
|
)
|
$
|
332
|
|
$
|
(63
|
)
|
$
|
2,657
|
|
$
|
(146
|
)
|
|||||
|
Number of securities(1)
|
|
|
622
|
|
|
|
60
|
|
|
|
676
|
|
|||||||||||
|
Number of securities with other-than-temporary impairment
|
|
|
8
|
|
|
|
9
|
|
|
|
17
|
|
|||||||||||
124
Fixed-Maturity Securities
Gross Unrealized Loss by Length of Time
As of
December 31, 2015
|
|
Less than 12 months
|
12 months or more
|
Total
|
||||||||||||||||||||
|
|
Fair
Value
|
Unrealized
Loss
|
Fair
Value
|
Unrealized
Loss
|
Fair
Value
|
Unrealized
Loss
|
|||||||||||||||||
|
|
(dollars in millions)
|
||||||||||||||||||||||
|
Obligations of state and political subdivisions
|
$
|
316
|
|
$
|
(10
|
)
|
$
|
7
|
|
$
|
0
|
|
$
|
323
|
|
$
|
(10
|
)
|
|||||
|
U.S. government and agencies
|
77
|
|
0
|
|
—
|
|
—
|
|
77
|
|
0
|
|
|||||||||||
|
Corporate securities
|
381
|
|
(8
|
)
|
95
|
|
(15
|
)
|
476
|
|
(23
|
)
|
|||||||||||
|
Mortgage-backed securities:
|
|
|
|
|
|
|
|
|
|||||||||||||||
|
RMBS
|
438
|
|
(8
|
)
|
90
|
|
(14
|
)
|
528
|
|
(22
|
)
|
|||||||||||
|
CMBS
|
140
|
|
(2
|
)
|
2
|
|
0
|
|
142
|
|
(2
|
)
|
|||||||||||
|
Asset-backed securities
|
517
|
|
(10
|
)
|
—
|
|
—
|
|
517
|
|
(10
|
)
|
|||||||||||
|
Foreign government securities
|
97
|
|
(4
|
)
|
82
|
|
(7
|
)
|
179
|
|
(11
|
)
|
|||||||||||
|
Total
|
$
|
1,966
|
|
$
|
(42
|
)
|
$
|
276
|
|
$
|
(36
|
)
|
$
|
2,242
|
|
$
|
(78
|
)
|
|||||
|
Number of securities(1)
|
|
|
335
|
|
|
|
71
|
|
|
|
396
|
|
|||||||||||
|
Number of securities with other-than-temporary impairment
|
|
|
9
|
|
|
|
4
|
|
|
|
13
|
|
|||||||||||
___________________
|
(1)
|
The number of securities does not add across because lots consisting of the same securities have been purchased at different times and appear in both categories above (i.e., less than 12 months and 12 months or more). If a security appears in both categories, it is counted only once in the total column.
|
Of the securities in an unrealized loss position for 12 months or more as of
December 31, 2016
,
41
securities had unrealized losses greater than
10%
of book value. The total unrealized loss for these securities as of
December 31, 2016
was
$59 million
. As of
December 31, 2015
, of the securities in an unrealized loss position for 12 months or more,
nine
securities had unrealized losses greater than
10%
of book value with an unrealized loss of
$26 million
. The Company has determined that the unrealized losses recorded as of
December 31, 2016
and
December 31, 2015
were yield related and not the result of other-than-temporary-impairment.
Changes in interest rates affect the value of the Company’s fixed-maturity portfolio. As interest rates fall, the fair value of fixed-maturity securities generally increases and as interest rates rise, the fair value of fixed-maturity securities generally decreases. The Company’s portfolio of fixed-maturity securities consists primarily of high-quality, liquid instruments.
125
The amortized cost and estimated fair value of the Company’s available-for-sale fixed-maturity securities, by contractual maturity, are shown below. Expected maturities will differ from contractual maturities because borrowers may have the right to call or prepay obligations with or without call or prepayment penalties.
Distribution of Fixed-Maturity Securities
by Contractual Maturity
As of
December 31, 2016
|
|
Amortized
Cost
|
Estimated
Fair Value
|
|||||
|
|
(in millions)
|
||||||
|
Due within one year
|
$
|
482
|
|
$
|
550
|
|
|
|
Due after one year through five years
|
1,725
|
|
1,727
|
|
|||
|
Due after five years through 10 years
|
2,112
|
|
2,155
|
|
|||
|
Due after 10 years
|
4,082
|
|
4,231
|
|
|||
|
Mortgage-backed securities:
|
|
|
|
|
|||
|
RMBS
|
998
|
|
987
|
|
|||
|
CMBS
|
575
|
|
583
|
|
|||
|
Total
|
$
|
9,974
|
|
$
|
10,233
|
|
|
The following table summarizes the ratings distributions of the Company’s investment portfolio as of
December 31, 2016
and
December 31, 2015
. Ratings reflect the lower of the Moody’s and S&P classifications, except for bonds purchased for loss mitigation or other risk management strategies, which use Assured Guaranty’s internal ratings classifications.
Distribution of
Fixed-Maturity Securities by Rating
|
Rating
|
As of
December 31, 2016 |
As of
December 31, 2015 |
||||
|
AAA
|
11.6
|
%
|
10.8
|
%
|
||
|
AA
|
54.8
|
|
59.0
|
|
||
|
A
|
17.9
|
|
17.6
|
|
||
|
BBB
|
1.9
|
|
0.9
|
|
||
|
BIG(1)
|
13.5
|
|
11.4
|
|
||
|
Not rated
|
0.3
|
|
0.3
|
|
||
|
Total
|
100.0
|
%
|
100.0
|
%
|
||
____________________
|
(1)
|
Comprised primarily of loss mitigation and other risk management assets. See Part II, Item 8, Financial Statements and Supplementary Data, Note 10, Investments and Cash.
|
The investment portfolio contains securities and cash that are either held in trust for the benefit of third party reinsurers in accordance with statutory requirements, invested in a guaranteed investment contract for future claims payments, placed on deposit to fulfill state licensing requirements, or otherwise restricted in the amount of
$285 million
and
$283 million
, based on fair value, as of
December 31, 2016
and
December 31, 2015
, respectively. The investment portfolio also contains securities that are held in trust by certain AGL subsidiaries for the benefit of other AGL subsidiaries in accordance with statutory and regulatory requirements in the amount of
$1,420 million
and
$1,411 million
, based on fair value, as of
December 31, 2016
and
December 31, 2015
, respectively.
The fair value of the Company’s pledged securities to secure its obligations under its CDS exposure totaled
$116 million
and
$305 million
as of
December 31, 2016
and
December 31, 2015
, respectively. In February 2017, the Company terminated substantially all of its remaining CDS contracts with
one
of its counterparties and all of the collateral that the Company had been posting to that counterparty is being returned to the Company. See Part II, Item 8, Financial Statements and Supplementary Data, Note 8, Contracts Accounted for as Credit Derivatives.
126
Liquidity Arrangements with respect to AGMH’s former Financial Products Business
AGMH’s former financial products segment had been in the business of borrowing funds through the issuance of GICs and medium term notes and reinvesting the proceeds in investments that met AGMH’s investment criteria. The financial products business also included the equity payment undertaking agreement portion of the leveraged lease business, as described further below in “—Leveraged Lease Business.”
The GIC Business
Until November 2008, AGMH, through its financial products business, offered GICs to municipalities and other market participants. The GICs were issued through certain non-insurance subsidiaries of AGMH. In return for an initial payment, each GIC entitles its holder to receive the return of the holder’s invested principal plus interest at a specified rate, and to withdraw principal from the GIC as permitted by its terms. AGM insures the payment obligations on all these GICs. The proceeds of GICs were loaned to AGMH’s former subsidiary FSA Asset Management LLC (FSAM). FSAM in turn invested these funds in fixed-income obligations (the FSAM assets). As of December 31, 2016, approximately 25% of the FSAM assets (measured by aggregate principal balance) were in cash or were obligations backed by the full faith and credit of the U.S. AGM’s insurance policies on the GICs remain in place, and must remain in place until each GIC is terminated, even though AGMH no longer holds any ownership interest in FSAM or the GIC issuers.
In June 2009, in connection with the Company's acquisition of AGMH from Dexia Holdings Inc., Dexia SA, the ultimate parent of Dexia Holdings Inc., and certain of its affiliates, entered into a number of agreements intended to mitigate the credit, interest rate and liquidity risks associated with the GIC business and the related AGM insurance policies. Some of those agreements have since terminated or expired, or been modified.
To support the primary payment obligations under the GICs, each of Dexia SA and Dexia Crédit Local S.A. are party to a put contract. Pursuant to the put contract, FSAM may put an amount of its FSAM assets to Dexia SA and Dexia Crédit Local S.A. in exchange for funds that FSAM would in turn make available to meet demands for payment under the GICs. To secure their obligations under this put contract, Dexia SA and Dexia Crédit Local S.A. are required to post eligible highly liquid collateral having an aggregate value (subject to agreed reductions and advance rates) equal to at least the excess of (i) the aggregate principal amount of all outstanding GICs over (ii) the aggregate mark-to-market value of FSAM’s assets.
As of
December 31, 2016
, the aggregate accreted GIC balance was approximately
$1.5 billion
, compared with approximately $10.2 billion as of December 31, 2009. As of
December 31, 2016
, the aggregate fair market value of the assets supporting the GIC business (disregarding the agreed upon reductions) plus cash and positive derivative value exceeded by nearly
$0.8 billion
the aggregate principal amount of all outstanding GICs and certain other business and hedging costs of the GIC business. Even after applying the agreed upon reductions to the fair market value of the assets, the aggregate value of the assets supporting the GIC business plus cash and positive derivative value exceeded the aggregate principal amount of all outstanding GICs and certain other business and hedging costs of the GIC business. Accordingly, no posting of collateral was required under the primary put contract.
To provide additional support, Dexia Crédit Local S.A. provides a liquidity commitment to FSAM to lend against FSAM assets under a revolving credit agreement. As of
December 31, 2016
, the commitment totaled $1.4 billion, of which approximately $0.8 billion was drawn. The agreement requires the commitment remain in place, generally until the GICs have been paid in full.
Despite the put contract and revolving credit agreement, and the significant portion of FSAM assets comprised of highly liquid securities backed by the full faith and credit of the United States, AGM remains subject to the risk that Dexia SA and its affiliates may not fulfill their contractual obligations. In that case, the GIC issuers may not have the financial ability to pay upon the withdrawal of GIC funds or post collateral or make other payments in respect of the GICs, thereby resulting in claims upon the AGM financial guaranty insurance policies.
A downgrade of the financial strength rating of AGM could trigger a payment obligation of AGM in respect to AGMH's former GIC business. Most GICs insured by AGM allow for the termination of the GIC contract and a withdrawal of GIC funds at the option of the GIC holder in the event of a downgrade of AGM below a specified threshold, generally below A- by S&P or A3 by Moody's. FSAM is expected to have sufficient eligible and liquid assets to satisfy any expected withdrawal and collateral posting obligations resulting from future rating actions affecting AGM.
127
The Medium Term Notes Business
In connection with the acquisition of AGMH, Dexia Crédit Local S.A. agreed to fund, on behalf of AGM, 100% of all policy claims made under financial guaranty insurance policies issued by AGM in relation to the medium term notes issuance program of FSA Global Funding Limited. As of
December 31, 2016
, FSA Global Funding Limited had approximately $560 million of medium term notes outstanding.
Leveraged Lease Business
Under the Strip Coverage Facility entered into in connection with the acquisition of AGMH, Dexia Credit Local (NY) agreed to make loans to AGM to finance all draws made by lessors on certain AGM strip policies issued in connection with the leveraged lease business. The leveraged lease business, the AGM strip policies and the Strip Coverage Facility are described further under "Commitments and Contingencies-Recourse Credit Facility" above. There have never been any borrowings under the Strip Coverage Facility, the amount of the leveraged leases covered by the Strip Coverage Facility has declined since July 1, 2009 and, to date, none of the leveraged lease transactions in which AGM acts as the strip coverage provider has experienced an early termination due to a lease default. Consequently, and in view of the credit quality of the relevant tax-exempt entities and the cost of the Strip Coverage Facility, the Company determined that maintaining the Strip Coverage Facility was no longer warranted. On July 29, 2016, the parties terminated the Strip Coverage Facility.
|
ITEM 7A.
|
QUANTITATIVE AND QUALITATIVE DISCLOSURES ABOUT MARKET RISK
|
Market risk is the risk of loss due to adverse changes in earnings, cash flow or fair value. The Company's primary market risk exposures in respect of market risk sensitive instruments include interest rate risk, foreign currency exchange rate risk and credit spread risk. The Company's primary exposure to market risk is summarized below:
|
•
|
The fair value of credit derivatives within the financial guaranty portfolio of insured obligations which fluctuate based on changes in credit spreads of the underlying obligations and the Company's own credit spreads.
|
|
•
|
The fair value of the investment portfolio is primarily driven by changes in interest rates and also affected by changes in credit spreads.
|
|
•
|
The fair value of the investment portfolio contains foreign denominated securities whose value fluctuates based on changes in foreign exchange rates.
|
|
•
|
The carrying value of premiums receivable include foreign denominated receivables whose value fluctuates based on changes in foreign exchange rates.
|
|
•
|
The fair value of the assets and liabilities of consolidated FG VIE's may fluctuate based on changes in prepayment spreads, default rates, interest rates, and house price depreciation/appreciation. The fair value of the FG VIE liabilities would also fluctuate based on changes in the Company's credit spread.
|
Sensitivity of Credit Derivatives to Credit Risk
Unrealized gains and losses on credit derivatives are a function of changes in the estimated fair value of the Company's credit derivative contracts. If credit spreads of the underlying obligations change, the fair value of the related credit derivative changes. Market liquidity could also impact valuations of the underlying obligations. The Company considers the impact of its own credit risk, together with credit spreads on the risk that it insured through CDS contracts, in determining their fair value. The Company determines its own credit risk based on quoted CDS prices traded on the Company at each balance sheet date. The quoted price of five-year CDS contracts traded on AGC at
December 31, 2016
and
December 31, 2015
was
158
bps and
376
bps, respectively. The quoted price of five-year CDS contracts traded on AGM at
December 31, 2016
and
December 31, 2015
was
158
bps and
366
bps, respectively. Historically, the price of CDS traded on AGC and AGM moves directionally the same as general market spreads, although this may not always be the case. An overall narrowing of spreads generally results in an unrealized gain on credit derivatives for the Company, and an overall widening of spreads generally results in an unrealized loss for the Company. In certain circumstances, due to the fact that spread movements are not perfectly correlated, the narrowing or widening of the price of CDS traded on AGC and AGM can have a more significant financial statement impact than the changes in underlying collateral prices.
The impact of changes in credit spreads will vary based upon the volume, tenor, interest rates, and other market conditions at the time these fair values are determined. In addition, since each transaction has unique collateral and structural
128
terms, the underlying change in fair value of each transaction may vary considerably. The fair value of credit derivative contracts also reflects the change in the Company's own credit cost, based on the price to purchase credit protection on AGC and AGM.
The Company generally holds these credit derivative contracts to maturity. The unrealized gains and losses on derivative financial instruments will reduce to zero as the exposure approaches its maturity date, unless there is a payment default on the exposure or early termination. Given these facts, the Company does not actively hedge these exposures.
The following table summarizes the estimated change in fair values on the net balance of the Company’s credit derivative positions assuming immediate parallel shifts in credit spreads on AGC and AGM and on the risks that they both assume.
Effect of Changes in Credit Spread
|
As of December 31, 2016
|
As of December 31, 2015
|
|||||||||||||||
|
Credit Spreads(1)
|
Estimated Net
Fair Value
(Pre-Tax)
|
Estimated Change
in Gain/(Loss)
(Pre-Tax)
|
Estimated Net
Fair Value (Pre-Tax) |
Estimated Change
in Gain/(Loss) (Pre-Tax) |
||||||||||||
|
(in millions)
|
||||||||||||||||
|
100% widening in spreads
|
$
|
(791
|
)
|
$
|
(402
|
)
|
$
|
(742
|
)
|
$
|
(377
|
)
|
||||
|
50% widening in spreads
|
(590
|
)
|
(201
|
)
|
(554
|
)
|
(189
|
)
|
||||||||
|
25% widening in spreads
|
(490
|
)
|
(101
|
)
|
(460
|
)
|
(95
|
)
|
||||||||
|
10% widening in spreads
|
(430
|
)
|
(41
|
)
|
(403
|
)
|
(38
|
)
|
||||||||
|
Base Scenario
|
(389
|
)
|
—
|
|
(365
|
)
|
—
|
|
||||||||
|
10% narrowing in spreads
|
(351
|
)
|
38
|
|
(330
|
)
|
35
|
|
||||||||
|
25% narrowing in spreads
|
(295
|
)
|
94
|
|
(277
|
)
|
88
|
|
||||||||
|
50% narrowing in spreads
|
(203
|
)
|
186
|
|
(190
|
)
|
175
|
|
||||||||
____________________
|
(1)
|
Includes the effects of spreads on both the underlying asset classes and the Company's own credit spread.
|
Sensitivity of Investment Portfolio to Interest Rate Risk
Interest rate risk is the risk that financial instruments' values will change due to changes in the level of interest rates, in the spread between two rates, in the shape of the yield curve or in any other interest rate relationship. The Company is exposed to interest rate risk primarily in its investment portfolio. As interest rates rise for an available-for-sale investment portfolio, the fair value of fixed‑income securities generally decreases; as interests rates fall for an available-for-sale portfolio, the fair value of fixed-income securities generally increases. The Company's policy is generally to hold assets in the investment portfolio to maturity. Therefore, barring credit deterioration, interest rate movements do not result in realized gains or losses unless assets are sold prior to maturity. The Company does not hedge interest rate risk, however, interest rate fluctuation risk is managed through the investment guidelines which limit duration and prevent investment in high volatility sectors.
Interest rate sensitivity in the investment portfolio can be estimated by projecting a hypothetical instantaneous increase or decrease in interest rates. The following table presents the estimated pre-tax change in fair value of the Company's fixed-maturity securities and short-term investments from instantaneous parallel shifts in interest rates.
Sensitivity to Change in Interest Rates on the Investment Portfolio
|
Increase (Decrease) in Fair Value from Changes in Interest Rates
|
|||||||||||||||||||||||
|
300 Basis
Point
Decrease
|
200 Basis
Point
Decrease
|
100 Basis
Point
Decrease
|
100 Basis
Point
Increase
|
200 Basis
Point
Increase
|
300 Basis
Point
Increase
|
||||||||||||||||||
|
(in millions)
|
|||||||||||||||||||||||
|
December 31, 2016
|
$
|
1,215
|
|
$
|
957
|
|
$
|
537
|
|
$
|
(528
|
)
|
$
|
(1,063
|
)
|
$
|
(1,578
|
)
|
|||||
|
December 31, 2015
|
1,561
|
|
1,107
|
|
568
|
|
(557
|
)
|
(1,094
|
)
|
(1,607
|
)
|
|||||||||||
129
Sensitivity of Other Areas to Interest Rate Risk
Insurance
Fluctuation in interest rates also affects the demand for the Company's product. When interest rates are lower or when the market is otherwise relatively less risk averse, the spread between insured and uninsured obligations typically narrows and, as a result, financial guaranty insurance typically provides lower cost savings to issuers than it would during periods of relatively wider spreads. These lower cost savings generally lead to a corresponding decrease in demand and premiums obtainable for financial guaranty insurance. Changes in interest rates also impact the amount of our losses and could impact the amount of infrastructure exposures that can be refinanced in the future. In addition, increases in prevailing interest rate levels can lead to a decreased volume of capital markets activity and, correspondingly, a decreased volume of insured transactions.
In addition, fluctuations in interest rates also impact the performance of insured transactions where there are differences between the interest rates on the underlying collateral and the interest rates on the insured securities. For example, a rise in interest rates could increase the amount of losses the Company projects for certain RMBS, Triple-X life insurance securitizations, student loan transactions and TruPS CDOs. The impact of fluctuations in interest rates on such transactions varies, depending on, among other things, the interest rates on the underlying collateral and insured securities, the relative amounts of underlying collateral and liabilities, the structure of the transaction, and the sensitivity to interest rates of the behavior of the underlying borrowers and the value of the underlying assets.
In the case of RMBS, fluctuations in interest rates impact the amount of periodic excess spread, which is created when a trust’s assets produce interest that exceeds the amount required to pay interest on the trust’s liabilities. There are several RMBS transactions in our insured portfolio which benefit from excess spread either by covering losses in a particular period, or reimbursing past claims under our policies. As of
December 31, 2016
, the Company projects approximately $225 million of excess spread for all of its RMBS transactions over their remaining lives.
Since RMBS excess spread is determined by the relationship between interest rates on the underlying collateral and the trust’s certificates, it can be affected by unmatched moves in either of these interest rates. Additionally, faster than expected prepayments can decrease the dollar amount of excess spread and therefore reduce the cash flow available to cover losses or reimburse past claims. Further, modifications to underlying mortgage rates (e.g. rate reductions for troubled borrowers) can reduce excess spread since there would be no equivalent decrease in the certificate interest rates of the trust's certificates. Similarly, an upswing in short-term rates that increases the trust’s certificate interest rate that is not met with equal increases to the interest rates on the underlying mortgages can decrease excess spread. These potential reductions in excess spread are mitigated by an interest rate cap, which goes into effect once the collateral rate falls below the stated certificate rate. Most of the RMBS securities we insure are capped at the collateral rate. The Company is not obligated to pay additional claims because the collateral interest rate drops below the trust's certificate stated interest rate, rather this just causes the Company to lose the benefit of potential positive excess spread.
Interest Expense
Beginning in the fourth quarter of 2016, fluctuation in interest rates also impacts the Company’s interest expense. On December 15, 2016, the series A enhanced junior subordinated debentures issued by AGUS began to accrue interest at a floating rate, reset quarterly, equal to three month London Interbank Offered Rate (3-month LIBOR) plus a margin equal to 2.38% (prior to December 15, 2016, the debentures paid a fixed 6.4% rate of interest). The 3-month LIBOR rate used for the December 15, 2016 interest rate reset is 0.96%. Increases to 3-month LIBOR will cause the Company’s interest expense to rise while decreases to 3-month LIBOR will lower the Company’s interest expense. If 3-month LIBOR increases by 70%, the Company’s interest expense will increase by approximately $1 million. Conversely, if 3-month LIBOR decreases by 70%, the Company’s interest expense will decrease by approximately $1 million.
Sensitivity of Investment Portfolio to Foreign Exchange Rate Risk
Foreign exchange risk is the risk that a financial instrument's value will change due to a change in the foreign currency exchange rates. The Company has foreign denominated securities in its investment portfolio. Securities denominated in currencies other than U.S. Dollar were 4.7% and 4.9% of the fixed-maturity securities and short-term investments as of
December 31, 2016
and
2015
, respectively. The Company's material exposure is to changes in the dollar/pound sterling exchange rate. Changes in fair value of available-for-sale investments attributable to changes in foreign exchange rates are recorded in OCI.
130
Sensitivity to Change in Foreign Exchange Rates on the Investment Portfolio
|
Increase (Decrease) in Fair Value from Changes in Foreign Exchange Rates
|
|||||||||||||||||||||||
|
30%
Decrease
|
20%
Decrease
|
10%
Decrease
|
10%
Increase
|
20%
Increase
|
30%
Increase
|
||||||||||||||||||
|
(in millions)
|
|||||||||||||||||||||||
|
December 31, 2016
|
$
|
(153
|
)
|
$
|
(102
|
)
|
$
|
(51
|
)
|
$
|
51
|
|
$
|
102
|
|
$
|
153
|
|
|||||
|
December 31, 2015
|
(163
|
)
|
(108
|
)
|
(54
|
)
|
54
|
|
108
|
|
163
|
|
|||||||||||
Sensitivity of Premiums Receivable to Foreign Exchange Rate Risk
The Company has foreign denominated premium receivables. The Company's material exposure is to changes in dollar/pound sterling and dollar/euro exchange rates.
Sensitivity to Change in Foreign Exchange Rates
on Premium Receivable, Net of Reinsurance
|
Increase (Decrease) in Premium Receivable from Changes in Foreign Exchange Rates
|
|||||||||||||||||||||||
|
30%
Decrease
|
20%
Decrease
|
10%
Decrease
|
10%
Increase
|
20%
Increase
|
30%
Increase
|
||||||||||||||||||
|
(in millions)
|
|||||||||||||||||||||||
|
December 31, 2016
|
$
|
(77
|
)
|
$
|
(52
|
)
|
$
|
(26
|
)
|
$
|
26
|
|
$
|
52
|
|
$
|
77
|
|
|||||
|
December 31, 2015
|
(96
|
)
|
(64
|
)
|
(32
|
)
|
32
|
|
64
|
|
96
|
|
|||||||||||
Sensitivity of FG VIE Assets and Liabilities to Market Risk
The fair value of the Company’s FG VIE assets is generally sensitive to changes related to estimated prepayment speeds; estimated default rates (determined on the basis of an analysis of collateral attributes such as: historical collateral performance, borrower profiles and other features relevant to the evaluation of collateral credit quality); discount rates implied by market prices for similar securities; and house price depreciation/appreciation rates based on macroeconomic forecasts. Significant changes to some of these inputs could materially change the market value of the FG VIE’s assets and the implied collateral losses within the transaction. In general, the fair value of the FG VIE asset is most sensitive to changes in the projected collateral losses, where an increase in collateral losses typically leads to a decrease in the fair value of FG VIE assets, while a decrease in collateral losses typically leads to an increase in the fair value of FG VIE assets. These factors also directly impact the fair value of the Company’s FG VIE liabilities.
The fair value of the Company’s FG VIE liabilities is generally sensitive to the various model inputs described above. In addition, the Company’s FG VIE liabilities with recourse are also sensitive to changes in the Company’s implied credit worthiness. Significant changes to any of these inputs could materially change the timing of expected losses within the insured transaction which is a significant factor in determining the implied benefit from the Company’s insurance policy guaranteeing the timely payment of principal and interest for the tranches of debt issued by the FG VIE that is insured by the Company. In general, extending the timing of expected loss payments by the Company into the future typically leads to a decrease in the value of the Company’s insurance and a decrease in the fair value of the Company’s FG VIE liabilities with recourse, while a shortening of the timing of expected loss payments by the Company typically leads to an increase in the value of the Company’s insurance and an increase in the fair value of the Company’s FG VIE liabilities with recourse.
131
132
Report of Independent Registered Public Accounting Firm
To
the Board of Directors and Shareholders of Assured Guaranty Ltd.:
In our opinion, the accompanying consolidated balance sheets and the related consolidated statements of operations, of comprehensive income, of shareholders’ equity and of cash flows present fairly, in all material respects, the financial position of Assured Guaranty Ltd. and its subsidiaries
at
December 31, 2016 and December 31, 2015, and the results of their
operations and their cash flows for each of the three years in the period ended
December 31, 2016
in conformity with accounting principles generally accepted in the United States of America. In addition, in our opinion, the Company maintained, in all material respects, effective internal control over financial reporting as of December 31, 2016, based on criteria established in the
2013 Internal Control - Integrated Framework
issued by the Committee of Sponsoring Organizations of the Treadway Commission (COSO). The Company's management is responsible for these financial statements, for maintaining effective internal control over financial reporting and for its assessment of the effectiveness of internal control over financial reporting, included in the accompanying Management's Report on Internal Control over Financial Reporting. Our responsibility is to express opinions on these financial statements and on the Company's internal control over financial reporting based on our integrated audits. We conducted our audits in accordance with the standards of the Public Company Accounting Oversight Board (United States). Those standards require that we plan and perform the audits to obtain reasonable assurance about whether the financial statements are free of material misstatement and whether effective internal control over financial reporting was maintained in all material respects. Our audits of the financial statements included examining, on a test basis, evidence supporting the amounts and disclosures in the financial statements, assessing the accounting principles used and significant estimates made by management, and evaluating the overall financial statement presentation. Our audit of internal control over financial reporting included obtaining an understanding of internal control over financial reporting, assessing the risk that a material weakness exists, and testing and evaluating the design and operating effectiveness of internal control based on the assessed risk. Our audits also included performing such other procedures as we considered necessary in the circumstances. We believe that our audits provide a reasonable basis for our opinions.
A company’s internal control over financial reporting is a process designed to provide reasonable assurance regarding the reliability of financial reporting and the preparation of financial statements for external purposes in accordance with generally accepted accounting principles. A company’s internal control over financial reporting includes those policies and procedures that (i) pertain to the maintenance of records that, in reasonable detail, accurately and fairly reflect the transactions and dispositions of the assets of the company; (ii) provide reasonable assurance that transactions are recorded as necessary to permit preparation of financial statements in accordance with generally accepted accounting principles, and that receipts and expenditures of the company are being made only in accordance with authorizations of management and directors of the company; and (iii) provide reasonable assurance regarding prevention or timely detection of unauthorized acquisition, use, or disposition of the company’s assets that could have a material effect on the financial statements.
Because of its inherent limitations, internal control over financial reporting may not prevent or detect misstatements. Also, projections of any evaluation of effectiveness to future periods are subject to the risk that controls may become inadequate because of changes in conditions, or that the degree of compliance with the policies or procedures may deteriorate.
/s/ PricewaterhouseCoopers LLP
New York, New York
February 24, 2017
133
Assured Guaranty Ltd.
(dollars in millions except per share and share amounts)
|
|
As of
December 31, 2016 |
As of
December 31, 2015 |
|||||
|
Assets
|
|
|
|
|
|||
|
Investment portfolio:
|
|
|
|
|
|||
|
Fixed-maturity securities, available-for-sale, at fair value (amortized cost of $9,974 and $10,275)
|
$
|
10,233
|
|
$
|
10,627
|
|
|
|
Short-term investments, at fair value
|
590
|
|
396
|
|
|||
|
Other invested assets
|
162
|
|
169
|
|
|||
|
Total investment portfolio
|
10,985
|
|
11,192
|
|
|||
|
Cash
|
118
|
|
166
|
|
|||
|
Premiums receivable, net of commissions payable
|
576
|
|
693
|
|
|||
|
Ceded unearned premium reserve
|
206
|
|
232
|
|
|||
|
Deferred acquisition costs
|
106
|
|
114
|
|
|||
|
Reinsurance recoverable on unpaid losses
|
80
|
|
69
|
|
|||
|
Salvage and subrogation recoverable
|
365
|
|
126
|
|
|||
|
Credit derivative assets
|
13
|
|
81
|
|
|||
|
Deferred tax asset, net
|
497
|
|
276
|
|
|||
|
Current income tax receivable
|
12
|
|
40
|
|
|||
|
Financial guaranty variable interest entities’ assets, at fair value
|
876
|
|
1,261
|
|
|||
|
Other assets
|
317
|
|
294
|
|
|||
|
Total assets
|
$
|
14,151
|
|
$
|
14,544
|
|
|
|
Liabilities and shareholders’ equity
|
|
|
|
|
|||
|
Unearned premium reserve
|
$
|
3,511
|
|
$
|
3,996
|
|
|
|
Loss and loss adjustment expense reserve
|
1,127
|
|
1,067
|
|
|||
|
Reinsurance balances payable, net
|
64
|
|
51
|
|
|||
|
Long-term debt
|
1,306
|
|
1,300
|
|
|||
|
Credit derivative liabilities
|
402
|
|
446
|
|
|||
|
Financial guaranty variable interest entities’ liabilities with recourse, at fair value
|
807
|
|
1,225
|
|
|||
|
Financial guaranty variable interest entities’ liabilities without recourse, at fair value
|
151
|
|
124
|
|
|||
|
Other liabilities
|
279
|
|
272
|
|
|||
|
Total liabilities
|
7,647
|
|
8,481
|
|
|||
|
Commitments and contingencies (See Note 15)
|
|
|
|||||
|
Common stock ($0.01 par value, 500,000,000 shares authorized; 127,988,230 and 137,928,552 shares issued and outstanding)
|
1
|
|
1
|
|
|||
|
Additional paid-in capital
|
1,060
|
|
1,342
|
|
|||
|
Retained earnings
|
5,289
|
|
4,478
|
|
|||
|
Accumulated other comprehensive income, net of tax of $70 and $104
|
149
|
|
237
|
|
|||
|
Deferred equity compensation (320,193 and 320,193 shares)
|
5
|
|
5
|
|
|||
|
Total shareholders’ equity
|
6,504
|
|
6,063
|
|
|||
|
Total liabilities and shareholders’ equity
|
$
|
14,151
|
|
$
|
14,544
|
|
|
The accompanying notes are an integral part of these consolidated financial statements.
134
Assured Guaranty Ltd.
Consolidated Statements of Operations
(dollars in millions except per share amounts)
|
|
Year Ended December 31,
|
||||||||||
|
|
2016
|
|
2015
|
|
2014
|
||||||
|
Revenues
|
|||||||||||
|
Net earned premiums
|
$
|
864
|
|
$
|
766
|
|
$
|
570
|
|
||
|
Net investment income
|
408
|
|
423
|
|
403
|
|
|||||
|
Net realized investment gains (losses):
|
|
|
|
|
|||||||
|
Other-than-temporary impairment losses
|
(47
|
)
|
(47
|
)
|
(76
|
)
|
|||||
|
Less: portion of other-than-temporary impairment loss recognized in other comprehensive income
|
4
|
|
0
|
|
(1
|
)
|
|||||
|
Net impairment loss
|
(51
|
)
|
(47
|
)
|
(75
|
)
|
|||||
|
Other net realized investment gains (losses)
|
22
|
|
21
|
|
15
|
|
|||||
|
Net realized investment gains (losses)
|
(29
|
)
|
(26
|
)
|
(60
|
)
|
|||||
|
Net change in fair value of credit derivatives:
|
|||||||||||
|
Realized gains (losses) and other settlements
|
29
|
|
(18
|
)
|
23
|
|
|||||
|
Net unrealized gains (losses)
|
69
|
|
746
|
|
800
|
|
|||||
|
Net change in fair value of credit derivatives
|
98
|
|
728
|
|
823
|
|
|||||
|
Fair value gains (losses) on committed capital securities
|
0
|
|
27
|
|
(11
|
)
|
|||||
|
Fair value gains (losses) on financial guaranty variable interest entities
|
38
|
|
38
|
|
255
|
|
|||||
|
Bargain purchase gain and settlement of pre-existing relationships
|
259
|
|
|
214
|
|
—
|
|
||||
|
Other income (loss)
|
39
|
|
37
|
|
14
|
|
|||||
|
Total revenues
|
1,677
|
|
2,207
|
|
1,994
|
|
|||||
|
Expenses
|
|
|
|
|
|||||||
|
Loss and loss adjustment expenses
|
295
|
|
424
|
|
126
|
|
|||||
|
Amortization of deferred acquisition costs
|
18
|
|
20
|
|
25
|
|
|||||
|
Interest expense
|
102
|
|
101
|
|
92
|
|
|||||
|
Other operating expenses
|
245
|
|
231
|
|
220
|
|
|||||
|
Total expenses
|
660
|
|
776
|
|
463
|
|
|||||
|
Income (loss) before income taxes
|
1,017
|
|
1,431
|
|
1,531
|
|
|||||
|
Provision (benefit) for income taxes
|
|
|
|
|
|||||||
|
Current
|
117
|
|
75
|
|
96
|
|
|||||
|
Deferred
|
19
|
|
300
|
|
347
|
|
|||||
|
Total provision (benefit) for income taxes
|
136
|
|
375
|
|
443
|
|
|||||
|
Net income (loss)
|
$
|
881
|
|
$
|
1,056
|
|
$
|
1,088
|
|
||
|
Earnings per share:
|
|||||||||||
|
Basic
|
$
|
6.61
|
|
$
|
7.12
|
|
$
|
6.30
|
|
||
|
Diluted
|
$
|
6.56
|
|
$
|
7.08
|
|
$
|
6.26
|
|
||
|
Dividends per share
|
$
|
0.52
|
|
$
|
0.48
|
|
$
|
0.44
|
|
||
The accompanying notes are an integral part of these consolidated financial statements.
135
Assured Guaranty Ltd.
Consolidated Statements of Comprehensive Income
(in millions)
|
|
Year Ended December 31,
|
||||||||||
|
|
2016
|
2015
|
2014
|
||||||||
|
Net income (loss)
|
$
|
881
|
|
$
|
1,056
|
|
$
|
1,088
|
|
||
|
Unrealized holding gains (losses) arising during the period on:
|
|
|
|
|
|||||||
|
Investments with no other-than-temporary impairment, net of tax provision (benefit) of $(34), $(36) and $80
|
(71
|
)
|
(93
|
)
|
196
|
|
|||||
|
Investments with other-than-temporary impairment, net of tax provision (benefit) of $(5), $(23) and $(9)
|
(9
|
)
|
(43
|
)
|
(20
|
)
|
|||||
|
Unrealized holding gains (losses) arising during the period, net of tax
|
(80
|
)
|
(136
|
)
|
176
|
|
|||||
|
Less: reclassification adjustment for gains (losses) included in net income (loss), net of tax provision (benefit) of $(10), $(7) and $(21)
|
(16
|
)
|
(10
|
)
|
(41
|
)
|
|||||
|
Change in net unrealized gains (losses) on investments
|
(64
|
)
|
(126
|
)
|
217
|
|
|||||
|
Other, net of tax provision
|
(24
|
)
|
(7
|
)
|
(7
|
)
|
|||||
|
Other comprehensive income (loss)
|
(88
|
)
|
(133
|
)
|
210
|
|
|||||
|
Comprehensive income (loss)
|
$
|
793
|
|
$
|
923
|
|
$
|
1,298
|
|
||
The accompanying notes are an integral part of these consolidated financial statements.
136
Assured Guaranty Ltd.
Consolidated Statements of Shareholders’ Equity
Years Ended December 31,
2016
,
2015
and
2014
(dollars in millions, except share data)
|
|
Common Shares Outstanding
|
Common Stock Par Value
|
Additional
Paid-in Capital |
Retained Earnings
|
Accumulated
Other Comprehensive Income |
Deferred
Equity Compensation |
Total
Shareholders’ Equity |
||||||||||||||||||||
|
Balance at December 31, 2013
|
182,177,866
|
|
$
|
2
|
|
$
|
2,466
|
|
$
|
2,482
|
|
$
|
160
|
|
$
|
5
|
|
$
|
5,115
|
|
|||||||
|
Net income
|
—
|
|
—
|
|
—
|
|
1,088
|
|
—
|
|
—
|
|
1,088
|
|
|||||||||||||
|
Dividends ($0.44 per share)
|
—
|
|
—
|
|
—
|
|
(76
|
)
|
—
|
|
—
|
|
(76
|
)
|
|||||||||||||
|
Common stock repurchases
|
(24,413,781
|
)
|
0
|
|
(590
|
)
|
—
|
|
—
|
|
—
|
|
(590
|
)
|
|||||||||||||
|
Share-based compensation and other
|
542,576
|
|
0
|
|
11
|
|
—
|
|
—
|
|
—
|
|
11
|
|
|||||||||||||
|
Other comprehensive income
|
—
|
|
—
|
|
—
|
|
—
|
|
210
|
|
—
|
|
210
|
|
|||||||||||||
|
Balance at December 31, 2014
|
158,306,661
|
|
2
|
|
1,887
|
|
3,494
|
|
370
|
|
5
|
|
5,758
|
|
|||||||||||||
|
Net income
|
—
|
|
—
|
|
—
|
|
1,056
|
|
—
|
|
—
|
|
1,056
|
|
|||||||||||||
|
Dividends ($0.48 per share)
|
—
|
|
—
|
|
—
|
|
(72
|
)
|
—
|
|
—
|
|
(72
|
)
|
|||||||||||||
|
Common stock repurchases
|
(20,995,419
|
)
|
(1
|
)
|
(554
|
)
|
—
|
|
—
|
|
—
|
|
(555
|
)
|
|||||||||||||
|
Share-based compensation and other
|
617,310
|
|
0
|
|
9
|
|
—
|
|
—
|
|
—
|
|
9
|
|
|||||||||||||
|
Other comprehensive loss
|
—
|
|
—
|
|
—
|
|
—
|
|
(133
|
)
|
—
|
|
(133
|
)
|
|||||||||||||
|
Balance at December 31, 2015
|
137,928,552
|
|
$
|
1
|
|
$
|
1,342
|
|
$
|
4,478
|
|
$
|
237
|
|
$
|
5
|
|
$
|
6,063
|
|
|||||||
|
Net income
|
—
|
|
—
|
|
—
|
|
881
|
|
—
|
|
—
|
|
881
|
|
|||||||||||||
|
Dividends ($0.52 per share)
|
—
|
|
—
|
|
—
|
|
(70
|
)
|
—
|
|
—
|
|
(70
|
)
|
|||||||||||||
|
Common stock repurchases
|
(10,721,248
|
)
|
0
|
|
(306
|
)
|
—
|
|
—
|
|
—
|
|
(306
|
)
|
|||||||||||||
|
Share-based compensation and other
|
780,926
|
|
0
|
|
24
|
|
—
|
|
—
|
|
—
|
|
24
|
|
|||||||||||||
|
Other comprehensive loss
|
—
|
|
—
|
|
—
|
|
—
|
|
(88
|
)
|
—
|
|
(88
|
)
|
|||||||||||||
|
Balance at December 31, 2016
|
127,988,230
|
|
$
|
1
|
|
$
|
1,060
|
|
$
|
5,289
|
|
$
|
149
|
|
$
|
5
|
|
$
|
6,504
|
|
|||||||
The accompanying notes are an integral part of these consolidated financial statements.
137
Assured Guaranty Ltd.
(in millions)
|
|
Year Ended December 31,
|
||||||||||
|
|
2016
|
2015
|
2014
|
||||||||
|
Operating Activities:
|
|||||||||||
|
Net Income
|
$
|
881
|
|
$
|
1,056
|
|
$
|
1,088
|
|
||
|
Adjustments to reconcile net income to net cash flows provided by operating activities:
|
|||||||||||
|
Non-cash interest and operating expenses
|
39
|
|
27
|
|
23
|
|
|||||
|
Net amortization of premium (discount) on investments
|
(34
|
)
|
(25
|
)
|
(16
|
)
|
|||||
|
Provision (benefit) for deferred income taxes
|
19
|
|
300
|
|
347
|
|
|||||
|
Net realized investment losses (gains)
|
29
|
|
17
|
|
60
|
|
|||||
|
Net unrealized losses (gains) on credit derivatives
|
(69
|
)
|
(746
|
)
|
(800
|
)
|
|||||
|
Fair value losses (gains) on committed capital securities
|
0
|
|
(27
|
)
|
11
|
|
|||||
|
Bargain purchase gain and settlement of pre-existing relationships
|
(259
|
)
|
(214
|
)
|
—
|
|
|||||
|
Change in deferred acquisition costs
|
9
|
|
9
|
|
3
|
|
|||||
|
Change in premiums receivable, net of premiums and commissions payable
|
128
|
|
(8
|
)
|
108
|
|
|||||
|
Change in ceded unearned premium reserve
|
22
|
|
79
|
|
69
|
|
|||||
|
Change in unearned premium reserve
|
(777
|
)
|
(744
|
)
|
(332
|
)
|
|||||
|
Change in loss and loss adjustment expense reserve, net
|
(105
|
)
|
244
|
|
182
|
|
|||||
|
Change in current income tax
|
27
|
|
(45
|
)
|
(45
|
)
|
|||||
|
Change in financial guaranty variable interest entities' assets and liabilities, net
|
(24
|
)
|
(6
|
)
|
(170
|
)
|
|||||
|
(Purchases) sales of trading securities, net
|
—
|
|
8
|
|
78
|
|
|||||
|
Other
|
(27
|
)
|
23
|
|
(29
|
)
|
|||||
|
Net cash flows provided by (used in) operating activities
|
(141
|
)
|
(52
|
)
|
577
|
|
|||||
|
Investing activities
|
|
|
|
|
|||||||
|
Fixed-maturity securities:
|
|
|
|
|
|||||||
|
Purchases
|
(1,646
|
)
|
(2,577
|
)
|
(2,801
|
)
|
|||||
|
Sales
|
1,365
|
|
2,107
|
|
1,251
|
|
|||||
|
Maturities
|
1,155
|
|
898
|
|
877
|
|
|||||
|
Net sales (purchases) of short-term investments
|
17
|
|
897
|
|
158
|
|
|||||
|
Net proceeds from paydowns on financial guaranty variable interest entities’ assets
|
629
|
|
400
|
|
408
|
|
|||||
|
Acquisition of CIFG, net of cash acquired
|
(435
|
)
|
—
|
|
—
|
|
|||||
|
Acquisition of Radian Asset, net of cash acquired
|
—
|
|
(800
|
)
|
—
|
|
|||||
|
Other
|
(9
|
)
|
69
|
|
11
|
|
|||||
|
Net cash flows provided by (used in) investing activities
|
1,076
|
|
994
|
|
(96
|
)
|
|||||
|
Financing activities
|
|
|
|
|
|||||||
|
Dividends paid
|
(69
|
)
|
(72
|
)
|
(76
|
)
|
|||||
|
Repurchases of common stock
|
(306
|
)
|
(555
|
)
|
(590
|
)
|
|||||
|
Share activity under option and incentive plans
|
10
|
|
(2
|
)
|
1
|
|
|||||
|
Net paydowns of financial guaranty variable interest entities’ liabilities
|
(611
|
)
|
(214
|
)
|
(396
|
)
|
|||||
|
Net proceeds from issuance of long-term debt
|
—
|
|
—
|
|
495
|
|
|||||
|
Repayment of long-term debt
|
(2
|
)
|
(4
|
)
|
(19
|
)
|
|||||
|
Net cash flows provided by (used in) financing activities
|
(978
|
)
|
(847
|
)
|
(585
|
)
|
|||||
|
Effect of foreign exchange rate changes
|
(5
|
)
|
(4
|
)
|
(5
|
)
|
|||||
|
Increase (decrease) in cash
|
(48
|
)
|
91
|
|
(109
|
)
|
|||||
|
Cash at beginning of period
|
166
|
|
75
|
|
184
|
|
|||||
|
Cash at end of period
|
$
|
118
|
|
$
|
166
|
|
$
|
75
|
|
||
|
Supplemental cash flow information
|
|
|
|
|
|||||||
|
Cash paid (received) during the period for:
|
|
|
|
|
|||||||
|
Income taxes
|
$
|
74
|
|
$
|
103
|
|
$
|
122
|
|
||
|
Interest
|
$
|
95
|
|
$
|
95
|
|
$
|
86
|
|
||
The accompanying notes are an integral part of these consolidated financial statements.
138
Assured Guaranty Ltd.
Notes to Consolidated Financial Statements
December 31, 2016
,
2015
and
2014
|
1.
|
Business and Basis of Presentation
|
Business
Assured Guaranty Ltd. (AGL and, together with its subsidiaries, Assured Guaranty or the Company) is a Bermuda-based holding company that provides, through its operating subsidiaries, credit protection products to the United States (U.S.) and international public finance (including infrastructure) and structured finance markets. The Company applies its credit underwriting judgment, risk management skills and capital markets experience primarily to offer financial guaranty insurance that protects holders of debt instruments and other monetary obligations from defaults in scheduled payments. If an obligor defaults on a scheduled payment due on an obligation, including a scheduled principal or interest payment (debt service), the Company is required under its unconditional and irrevocable financial guaranty to pay the amount of the shortfall to the holder of the obligation. The Company markets its financial guaranty insurance directly to issuers and underwriters of public finance and structured finance securities as well as to investors in such obligations. The Company guarantees obligations issued principally in the U.S. and the United Kingdom (U.K.), and also guarantees obligations issued in other countries and regions, including Australia and Western Europe. The Company also provides other forms of insurance that are in line with its risk profile and benefit from its underwriting experience.
In the past, the Company sold credit protection by issuing policies that guaranteed payment obligations under credit derivatives, primarily credit default swaps (CDS). Contracts accounted for as credit derivatives are generally structured such that the circumstances giving rise to the Company’s obligation to make loss payments are similar to those for financial guaranty insurance contracts. The Company’s credit derivative transactions are governed by International Swaps and Derivative Association, Inc. (ISDA) documentation. The Company has not entered into any new CDS in order to sell credit protection in the U.S. since the beginning of 2009, when regulatory guidelines were issued that limited the terms under which such protection could be sold. The capital and margin requirements applicable under the Dodd-Frank Wall Street Reform and Consumer Protection Act also contributed to the Company not entering into such new CDS in the U.S. since 2009. The Company actively pursues opportunities to terminate existing CDS, which have the effect of reducing future fair value volatility in income and/or reducing rating agency capital charges.
Basis of Presentation
The consolidated financial statements have been prepared in conformity with accounting principles generally accepted in the United States of America (GAAP) and, in the opinion of management, reflect all adjustments that are of a normal recurring nature, necessary for a fair statement of the financial condition, results of operations and cash flows of the Company and its consolidated variable interest entities (VIEs) for the periods presented. The preparation of financial statements in conformity with GAAP requires management to make estimates and assumptions that affect the reported amounts of assets and liabilities and disclosure of contingent assets and liabilities as of the date of the financial statements and the reported amounts of revenues and expenses during the reporting period. Actual results could differ from those estimates.
The consolidated financial statements include the accounts of AGL, its direct and indirect subsidiaries, (collectively, the Subsidiaries), and its consolidated VIEs. Intercompany accounts and transactions between and among all consolidated entities have been eliminated. Certain prior-year balances have been reclassified to conform to the current year's presentation.
The Company's principal insurance company subsidiaries are:
|
•
|
Assured Guaranty Municipal Corp. (AGM), domiciled in New York;
|
|
•
|
Municipal Assurance Corp. (MAC), domiciled in New York;
|
|
•
|
Assured Guaranty Corp. (AGC), domiciled in Maryland;
|
|
•
|
Assured Guaranty (Europe) Ltd. (AGE), organized in the U.K.; and
|
|
•
|
Assured Guaranty Re Ltd. (AG Re) and Assured Guaranty Re Overseas Ltd (AGRO), domiciled in Bermuda.
|
The Company’s organizational structure includes various holding companies,
two
of which—Assured Guaranty U.S. Holdings Inc. (AGUS) and Assured Guaranty Municipal Holdings Inc. (AGMH) – have public debt outstanding. See Note 16, Long-Term Debt and Credit Facilities and Note 21, Subsidiary Information.
139
Significant Accounting Policies
The Company revalues assets, liabilities, revenue and expenses denominated in non-U.S. currencies into U.S. dollars using applicable exchange rates. Gains and losses relating to translating foreign functional currency financial statements for U.S. GAAP reporting are recorded in other comprehensive income (loss) (OCI). Gains and losses relating to transactions in foreign denominations in subsidiaries where the functional currency is the U.S. dollar, are reported in the consolidated statement of operations.
The chief operating decision maker manages the operations of the Company at a consolidated level. Therefore, all results of operations are reported as
one
segment.
Other significant accounting policies are included in the following notes.
Significant Accounting Policies
|
Acquisitions
|
Note 2
|
|
Expected loss to be paid (insurance, credit derivatives and FG VIE contracts)
|
Note 5
|
|
Contracts accounted for as insurance (premium revenue recognition, loss and loss adjustment expense and policy acquisition cost)
|
Note 6
|
|
Fair value measurement
|
Note 7
|
|
Credit derivatives (at fair value)
|
Note 8
|
|
Variable interest entities (at fair value)
|
Note 9
|
|
Investments and cash
|
Note 10
|
|
Income taxes
|
Note 12
|
|
Earnings per share
|
Note 17
|
|
Stock based compensation
|
Note 19
|
Future Application of Accounting Standards
Income Taxes
In October 2016, the Financial Accounting Standards Board (FASB) issued Accounting Standards Update (ASU) 2016-16, Income Taxes (Topic 740) - Intra-Entity Transfers of Assets Other Than Inventory, which removes the current prohibition against immediate recognition of the current and deferred income tax effects of intra-entity transfers of assets other than inventory. Under the ASU, the selling (transferring) entity is required to recognize a current income tax expense or benefit upon transfer of the asset. Similarly, the purchasing (receiving) entity is required to recognize a deferred tax asset or deferred tax liability, as well as the related deferred tax benefit or expense, upon receipt of the asset. The ASU is effective for annual periods beginning after December 15, 2017, including interim periods within those annual periods, and early adoption is permitted. The ASU’s amendments are to be applied on a modified retrospective basis recognizing the effects in retained earnings as of the beginning of the year of adoption. The Company is currently evaluating the effect on its Consolidated Financial Statements of adopting this ASU.
Statement of Cash Flows
In November 2016, the FASB issued ASU 2016-18,
Statement of Cash Flows (Topic 230): Restricted Cash
(a consensus of the Emerging Issues Task Force), which addresses the presentation of changes in restricted cash and restricted cash equivalents in the statement of cash flows with the objective of reducing the existing diversity in practice. Under the ASU, entities are required to show the changes in the total of cash, cash equivalents, restricted cash and restricted cash equivalents in the statement of cash flows. As a result, entities will no longer present transfers between cash and cash equivalents and restricted cash and restricted cash equivalents in the statement of cash flows. When cash, cash equivalents, restricted cash and restricted cash equivalents are presented in more than one line item on the balance sheet, the ASU requires a reconciliation be presented either on the face of the statement of cash flows or in the notes to the financial statements showing the totals in the statement of cash flows to the related captions in the balance sheet. The ASU is effective for public business entities for fiscal years beginning after December 15, 2017, and interim periods within those fiscal years. Early adoption is permitted, including
140
adoption in an interim period. If the ASU is adopted in an interim period, any adjustments should be reflected as of the beginning of the fiscal year that includes that interim period. This ASU will not have a material impact on the Company’s Consolidated Statements of Cash Flows.
In August 2016, the FASB issued ASU 2016-15,
Statement of Cash Flows (Topic 230): Classification of Certain Cash Receipts and Cash Payments
(a consensus of the Emerging Issues Task Force), which addresses eight specific cash flow issues with the objective of reducing the existing diversity in practice. The issues addressed in the new guidance include debt prepayment or debt extinguishment costs, settlement of zero-coupon debt instruments, contingent consideration payments made after a business combination, proceeds from the settlement of insurance claims, proceeds from the settlement of corporate-owned life insurance policies, including bank-owned life insurance policies, distributions received from equity method investments, beneficial interests in securitization transactions and separately identifiable cash flows and application of the predominance principle. The amendments in this ASU are effective for public business entities for fiscal years beginning after December 15, 2017, and interim periods within those fiscal years. Early adoption is permitted, including adoption in an interim period. If an entity early adopts the amendments in an interim period, any adjustments should be reflected as of the beginning of the fiscal year that includes that interim period. An entity that elects early adoption must adopt all of the amendments in the same period. This ASU will not have a material impact on the Company’s Consolidated Statements of Cash Flows.
Credit Losses on Financial Instruments
In June 2016, the FASB issued ASU 2016-13,
Financial Instruments - Credit Losses (Topic 326): Measurement of Credit Losses on Financial Instruments
. The amendments in this ASU are intended to improve financial reporting by requiring timelier recording of credit losses on loans and other financial instruments held by financial institutions and other organizations. The ASU requires the measurement of all expected credit losses for financial assets held at the reporting date based on historical experience, current conditions, and reasonable and supportable forecasts. Financial institutions will use forward-looking information to better inform their credit loss estimates as a result of the ASU. While many of the loss estimation techniques applied today will still be permitted, the inputs to those techniques will change to reflect the full amount of expected credit losses. The ASU requires enhanced disclosures to help investors and other financial statement users to better understand significant estimates and judgments used in estimating credit losses, as well as credit quality and underwriting standards of an organization’s portfolio.
In addition, the ASU amends the accounting for credit losses on available-for-sale securities and purchased financial assets with credit deterioration. The ASU also eliminates the concept of “other than temporary” from the impairment model for certain available-for-sale securities. Accordingly, the ASU states that an entity must use an allowance approach, must limit the allowance to an amount at which the security’s fair value is less than its amortized cost basis, may not consider the length of time fair value has been less than amortized cost, and may not consider recoveries in fair value after the balance sheet date when assessing whether a credit loss exists. For purchased financial assets with credit deterioration, the ASU requires an entity’s method for measuring credit losses to be consistent with its method for measuring expected losses for originated and purchased non-credit-deteriorated assets.
The ASU is effective for fiscal years beginning after December 15, 2019, including interim periods within those fiscal years. For most debt instruments, entities will be required to record a cumulative-effect adjustment to the statement of financial position as of the beginning of the first reporting period in which the guidance is adopted. The changes to the impairment model for available-for-sale securities and changes to purchased financial assets with credit deterioration are to be applied prospectively. For the Company, this would be as of January 1, 2020. Early adoption is permitted for fiscal years, and interim periods with those fiscal years, beginning after December 15, 2018. The Company is currently evaluating the effect on its Consolidated Financial Statements of adopting this ASU.
Share-Based Payments
In March 2016, the FASB issued ASU 2016-09,
Compensation - Stock Compensation (Topic 718) - Improvements to Employee Share-Based Payment
, which simplifies several aspects of the accounting for employee share-based payment transactions, including the accounting for income taxes, forfeitures, and statutory tax withholding requirements, as well as classification in the statement of cash flows. The new guidance will require all income tax effects of awards to be recognized in the income statement when the awards vest or are settled. It also will allow an employer to repurchase more of an employee’s shares than it can today for tax withholding purposes without triggering liability accounting and to make a policy election to account for forfeitures as they occur. The ASU is effective for fiscal years beginning after December 15, 2016, including interim periods within those fiscal years, and early adoption is permitted. The Company does not expect that the ASU will have a material effect on its Consolidated Financial Statements.
141
Leases
In February 2016, the FASB issued ASU 2016-02,
Leases (Topic 842)
. This ASU requires lessees to present right-of-use assets and lease liabilities on the balance sheet. ASU 2016-02 is to be applied using a modified retrospective approach at the beginning of the earliest comparative period in the financial statements. The ASU is effective for fiscal years beginning after December 15, 2018, including interim periods within those fiscal years. Early adoption is permitted. The Company is evaluating the impact that this ASU will have on its Consolidated Financial Statements.
Financial Instruments
In January 2016, the FASB issued ASU 2016-01,
Financial Instruments - Overall (Subtopic 825-10) - Recognition and Measurement of Financial Assets and Financial Liabilities
. The amendments in this ASU are intended to make targeted improvements to GAAP by addressing certain aspects of recognition, measurement, presentation, and disclosure of financial instruments. Under the ASU, certain equity securities will need to be accounted for at fair value with changes in fair value recognized through net income. Currently, the Company recognizes unrealized gains and losses for these securities in OCI. Another amendment pertains to liabilities that an entity has elected to measure at fair value in accordance with the fair value option for financial instruments. For these liabilities, the portion of fair value change related to credit risk will be separately presented in OCI. Currently, the entire change in the fair value of these liabilities is reflected in the income statement. The Company elected the fair value option to account for its consolidated FG VIEs. FG VIE financial liabilities with recourse are sensitive to changes in the Company’s implied credit worthiness and will be impacted by the ASU.
The ASU is effective for fiscal years beginning after December 15, 2017, including interim periods within those fiscal years. Entities will be required to record a cumulative-effect adjustment to the statement of financial position as of the beginning of the fiscal year in which the guidance is adopted. For the Company, this would be as of January 1, 2018. Early adoption is permitted only for the amendment related to the change in presentation of financial liabilities that are fair valued using the fair value option. The Company does not expect that the amendment related to certain equity securities will have a material effect on its Consolidated Financial Statements. Upon the adoption date, the Company will present the total change in credit risk for FG VIEs’ financial liabilities with recourse separately in OCI.
|
2.
|
Acquisitions
|
Consistent with one of its key business strategies of supplementing its book of business through acquisitions, the Company has acquired
three
financial guaranty companies since January 1, 2015, as described below.
CIFG Holding Inc.
On July 1, 2016, AGC acquired all of the issued and outstanding capital stock of CIFG Holding Inc. (together with its subsidiaries CIFGH), the parent of financial guaranty insurer CIFG Assurance North America, Inc. (CIFGNA), (the CIFG Acquisition), for
$450.6 million
in cash. AGUS previously owned
1.6%
of the outstanding shares of CIFGH, for which it received
$7.1 million
in consideration from AGC, resulting in a net consolidated purchase price of
$443 million
. AGC merged CIFGNA with and into AGC, with AGC as the surviving company, on July 5, 2016. The CIFG Acquisition added
$4.2 billion
of net par insured on July 1, 2016.
At the time of the CIFG Acquisition, CIFGNA had a subsidiary financial guaranty company domiciled in France, CIFG Europe S.A. (CIFGE), which had been put into run-off and surrendered its licenses. CIFGNA had reinsured all of CIFGE’s outstanding financial guaranty business and also had issued a “second-to-pay policy” pursuant to which CIFGNA guaranteed the full and complete payment of any shortfall in amounts due from CIFGE on its insured portfolio; AGC assumed these obligations as part of the CIFGNA merger with and into AGC. CIFGE remains a separate subsidiary in runoff, now owned by AGC. As of
December 31, 2016
, CIFGE had investment assets of
$41 million
and gross par exposure of
$694 million
, and is not currently expected to pay dividends.
The CIFG Acquisition was accounted for under the acquisition method of accounting which requires that the assets and liabilities acquired be recorded at fair value. The Company exercised significant judgment to determine the fair value of the assets it acquired and liabilities it assumed in the CIFG Acquisition. The most significant of these determinations related to the valuation of CIFGH's financial guaranty insurance and credit derivative contracts. On an aggregate basis, CIFGH's contractual premiums for financial guaranty contracts were less than the premiums a market participant of similar credit quality would demand to acquire those contracts at the date of the CIFG Acquisition (the CIFG Acquisition Date), particularly for below-investment-grade transactions, resulting in a significant amount of the purchase price being allocated to these contracts. For information on the methodology the Company used to measure the fair value of assets it acquired and liabilities it assumed in
142
the CIFG Acquisition, including financial guaranty insurance and credit derivative contracts, please refer to Note 7, Fair Value Measurement.
The fair value of the Company's stand-ready obligation on the CIFG Acquisition Date is recorded in unearned premium reserve. After the CIFG Acquisition Date, loss reserves and loss and loss adjustment expenses (LAE) will be recorded when the expected losses for each contract exceeds the remaining unearned premium reserve, in accordance with the Company's accounting policy described in Note 6, Contracts Accounted for as Insurance. The expected losses acquired by the Company as part of the CIFG Acquisition are included in the description of expected losses to be paid under Note 5, Expected Losses to be Paid.
The excess of the fair value of net assets acquired over the consideration transferred was recorded as a bargain purchase gain in "bargain purchase gain and settlement of pre-existing relationships" in net income. In addition, the Company and CIFGH had pre-existing reinsurance relationships, which were also effectively settled at fair value on the CIFG Acquisition Date. The loss on settlement of these pre-existing reinsurance relationships represents the net difference between the historical assumed balances that were recorded by AGC and the fair value of ceded balances acquired from CIFGH. The Company believes the bargain purchase gain resulted from the nature of the financial guaranty business and the desire of investors in CIFGH to monetize their investments in CIFGH. The bargain purchase gain reflects the fair value of CIFGH’s assets and liabilities, as well as tax attributes that were recorded in deferred taxes comprising net operating losses (after Internal Revenue Code change in control provisions) and other temporary book-to-tax differences for which CIFGH had recorded a full valuation allowance.
143
The following table shows the net effect of the CIFG Acquisition, including the effects of the settlement of pre-existing relationships.
|
Fair Value of Net Assets Acquired, before Settlement of Pre-existing Relationships
|
Net effect of Settlement of Pre-existing Relationships
|
Net Effect of CIFG Acquisition
|
|||||||||
|
(in millions)
|
|||||||||||
|
Cash Purchase Price (1)
|
$
|
443
|
|
$
|
—
|
|
$
|
443
|
|
||
|
Identifiable assets acquired:
|
|
||||||||||
|
Investments
|
770
|
|
—
|
|
770
|
|
|||||
|
Cash
|
8
|
|
—
|
|
8
|
|
|||||
|
Premiums receivable, net of commissions payable
|
18
|
|
—
|
|
18
|
|
|||||
|
Ceded unearned premium reserve
|
173
|
|
(173
|
)
|
—
|
|
|||||
|
Deferred acquisition costs
|
1
|
|
(1
|
)
|
—
|
|
|||||
|
Salvage and subrogation recoverable
|
23
|
|
—
|
|
23
|
|
|||||
|
Credit derivative assets
|
1
|
|
—
|
|
1
|
|
|||||
|
Deferred tax asset, net
|
194
|
|
34
|
|
228
|
|
|||||
|
Other assets
|
4
|
|
—
|
|
4
|
|
|||||
|
Total assets
|
1,192
|
|
(140
|
)
|
1,052
|
|
|||||
|
|
|
||||||||||
|
Liabilities assumed:
|
|
||||||||||
|
Unearned premium reserves
|
306
|
|
(10
|
)
|
296
|
|
|||||
|
Loss and loss adjustment expense reserve
|
1
|
|
(66
|
)
|
(65
|
)
|
|||||
|
Credit derivative liabilities
|
68
|
|
0
|
|
68
|
|
|||||
|
Other liabilities
|
17
|
|
—
|
|
17
|
|
|||||
|
Total liabilities
|
392
|
|
(76
|
)
|
316
|
|
|||||
|
Net asset effect of CIFG Acquisition
|
800
|
|
(64
|
)
|
736
|
|
|||||
|
Bargain purchase gain and settlement of pre-existing relationships resulting from CIFG Acquisition, after-tax
|
357
|
|
(64
|
)
|
293
|
|
|||||
|
Deferred tax
|
—
|
|
(34
|
)
|
(34
|
)
|
|||||
|
Bargain purchase gain and settlement of pre-existing relationships resulting from CIFG Acquisition, pre-tax
|
$
|
357
|
|
$
|
(98
|
)
|
$
|
259
|
|
||
_____________________
|
(1)
|
The cash purchase price of
$443 million
represents the cash transferred for the acquisition which was allocated as follows: (1)
$270 million
for the purchase of net assets of
$627 million
, and (2) the settlement of pre-existing relationships between CIFGH and Assured Guaranty at a fair value of
$173 million
.
|
Revenue and net income related to CIFGH from the CIFG Acquisition Date through
December 31, 2016
included in the consolidated statement of operations were approximately
$307 million
and
$323 million
, respectively. For 2016, the Company recognized transaction expenses related to the CIFG Acquisition. These expenses were primarily driven by the fees paid to the Company's legal and financial advisors and to the Company's independent auditor.
CIFG Acquisition-Related Expenses
|
Year Ended December 31, 2016
|
|||
|
|
(in millions)
|
||
|
Professional services
|
$
|
2
|
|
|
Financial advisory fees
|
4
|
|
|
|
Total
|
$
|
6
|
|
144
The Company has determined that the presentation of pro-forma information is impractical for the CIFG Acquisition as historical financial records are not available on a U.S. GAAP basis.
Radian Asset Assurance Inc.
On April 1, 2015 (Radian Acquisition Date), AGC completed the acquisition (Radian Asset Acquisition) of all of the issued and outstanding capital stock of financial guaranty insurer Radian Asset Assurance Inc. (Radian Asset) for
$804.5 million
; the cash consideration was paid from AGC's available funds and from the proceeds of a
$200 million
loan from AGC’s direct parent, AGUS. AGC repaid the loan in full to AGUS on April 14, 2015. Radian Asset was merged with and into AGC, with AGC as the surviving company of the merger. The Radian Asset Acquisition added
$13.6 billion
to the Company's net par outstanding on April 1, 2015.
The Radian Asset Acquisition was accounted for under the acquisition method of accounting which required that the assets and liabilities acquired be recorded at fair value. The Company was required to exercise significant judgment to determine the fair value of the assets it acquired and liabilities it assumed in the Radian Asset Acquisition. The most significant of these determinations related to the valuation of Radian Asset's financial guaranty insurance and credit derivative contracts. On an aggregate basis, Radian Asset’s contractual premiums for financial guaranty contracts were less than the premiums a market participant of similar credit quality would demand to acquire those contracts at the Radian Acquisition Date, particularly for below-investment-grade (BIG) transactions, resulting in a significant amount of the purchase price being allocated to these contracts. For information on the methodology the Company used to measure the fair value of assets it acquired and liabilities it assumed in the Radian Asset Acquisition, including financial guaranty insurance and credit derivative contracts, please refer to Note 7, Fair Value Measurement.
The fair value of the Company's stand-ready obligation for financial guaranty insurance contracts on the Radian Acquisition Date is recorded in unearned premium reserve (please refer to Note 6, Contracts Accounted for as Insurance for additional information on stand-ready obligation). At the Radian Acquisition Date, the fair value of each financial guaranty insurance contract acquired was in excess of the expected losses for each contract and therefore no explicit loss reserves were recorded on the Radian Acquisition Date. Loss reserves and loss and LAE are recorded when the expected losses for each contract exceeds the remaining unearned premium reserve, in accordance with the Company's accounting policy described in Note 6, Contracts Accounted for as Insurance. The expected losses assumed by the Company as part of the Radian Asset Acquisition are included in the description of expected losses to be paid under Note 5, Expected Loss to be Paid.
The excess of the fair value of net assets acquired over the consideration transferred was recorded as a bargain purchase gain in "bargain purchase gain and settlement of pre-existing relationships" in net income. In addition, the Company and Radian Asset had pre-existing reinsurance relationships, which were effectively settled at fair value on the Radian Acquisition Date. The gain on settlement of these pre-existing reinsurance relationships primarily represents the net difference between the historical ceded balances that were recorded by AGM and the fair value of assumed balances acquired from Radian Asset. The Company believes the bargain purchase resulted from the announced desire of Radian Guaranty Inc. to focus its business strategy on the mortgage and real estate markets and to monetize its investment in Radian Asset and thereby accelerate its ability to comply with the financial requirements of the final Private Mortgage Insurer Eligibility Requirements.
145
The following table shows the net effect of the Radian Asset Acquisition at the Radian Acquisition Date, including the effects of the settlement of pre-existing relationships.
|
Fair Value of Net Assets Acquired, before Settlement of Pre-existing Relationships
|
Net effect of Settlement of Pre-existing Relationships
|
Net Effect of Radian Asset Acquisition
|
|||||||||
|
(in millions)
|
|||||||||||
|
Cash purchase price(1)
|
$
|
804
|
|
$
|
—
|
|
$
|
804
|
|
||
|
Identifiable assets acquired:
|
|
||||||||||
|
Investments
|
1,473
|
|
—
|
|
1,473
|
|
|||||
|
Cash
|
4
|
|
—
|
|
4
|
|
|||||
|
Ceded unearned premium reserve
|
(3
|
)
|
(65
|
)
|
(68
|
)
|
|||||
|
Credit derivative assets
|
30
|
|
—
|
|
30
|
|
|||||
|
Deferred tax asset, net
|
263
|
|
(56
|
)
|
207
|
|
|||||
|
Financial guaranty variable interest entities’ assets
|
122
|
|
—
|
|
122
|
|
|||||
|
Other assets
|
86
|
|
(67
|
)
|
19
|
|
|||||
|
Total assets
|
1,975
|
|
(188
|
)
|
1,787
|
|
|||||
|
|
|
||||||||||
|
Liabilities assumed:
|
|
||||||||||
|
Unearned premium reserves
|
697
|
|
(216
|
)
|
481
|
|
|||||
|
Credit derivative liabilities
|
271
|
|
(26
|
)
|
245
|
|
|||||
|
Financial guaranty variable interest entities’ liabilities
|
118
|
|
—
|
|
118
|
|
|||||
|
Other liabilities
|
30
|
|
(49
|
)
|
(19
|
)
|
|||||
|
Total liabilities
|
1,116
|
|
(291
|
)
|
825
|
|
|||||
|
Net asset effect of Radian Asset Acquisition
|
859
|
|
103
|
|
962
|
|
|||||
|
Bargain purchase gain and settlement of pre-existing relationships resulting from Radian Asset Acquisition, after-tax
|
55
|
|
103
|
|
158
|
|
|||||
|
Deferred tax
|
—
|
|
56
|
|
56
|
|
|||||
|
Bargain purchase gain and settlement of pre-existing relationships resulting from Radian Asset Acquisition, pre-tax
|
$
|
55
|
|
$
|
159
|
|
$
|
214
|
|
||
_____________________
|
(1)
|
The cash purchase price of
$804 million
was the cash transferred for the acquisition which was allocated as follows: (1)
$987 million
for the purchase of net assets of
$1,042 million
, and (2) the settlement of pre-existing relationships between Radian Asset and Assured Guaranty at a fair value of $
(183) million
.
|
Revenue and net income related to Radian Asset from the Radian Acquisition Date through December 31, 2015 included in the consolidated statement of operations were approximately
$560 million
and
$366 million
, respectively. In 2015, the Company recorded transaction expenses related to the Radian Asset Acquisition in net income as part of other operating expenses. These expenses were primarily driven by the fees paid to the Company's legal and financial advisors and to the Company's independent auditor.
Radian Asset Acquisition-Related Expenses
|
Year Ended December 31, 2015
|
|||
|
|
(in millions)
|
||
|
Professional services
|
$
|
2
|
|
|
Financial advisory fees
|
10
|
|
|
|
Total
|
$
|
12
|
|
146
Unaudited Pro Forma Results of Operations
The following unaudited pro forma information presents the combined results of operations of Assured Guaranty and Radian Asset as if the acquisition had been completed on January 1, 2014, as required under GAAP. The pro forma accounts include the estimated historical results of the Company and Radian Asset and pro forma adjustments primarily comprising the earning of the unearned premium reserve and the expected losses that would be recognized in net income for each prior period presented, as well as the accounting for bargain purchase gain, settlement of pre-existing relationships and Radian Asset acquisition related expenses, all net of tax at the applicable statutory rate.
The unaudited pro forma combined financial information is presented for illustrative purposes only and does not indicate the financial results of the combined company had the companies actually been combined as of January 1, 2014, nor is it indicative of the results of operations in future periods.
Unaudited Pro Forma Results of Operations
|
Year Ended December 31, 2015
|
Year Ended December 31, 2014
|
||||||
|
(in millions, except per share amounts)
|
|||||||
|
Pro forma revenues
|
$
|
2,030
|
|
$
|
2,501
|
|
|
|
Pro forma net income
|
922
|
|
1,531
|
|
|||
|
Pro forma earnings per share (EPS):
|
|||||||
|
Basic
|
6.22
|
|
8.86
|
|
|||
|
Diluted
|
6.18
|
|
8.81
|
|
|||
MBIA UK Insurance Limited
On January 10, 2017, AGL announced that its subsidiary AGC completed its acquisition of MBIA UK Insurance Limited (MBIA UK), the European operating subsidiary of MBIA Insurance Corporation (MBIA), in accordance with the agreement announced on September 29, 2016. As consideration for the outstanding shares of MBIA UK plus
$23 million
in cash, AGC exchanged all its holdings of notes issued in the Zohar II 2005-1 transaction. AGC’s Zohar II 2005-1 notes had a total outstanding principal of approximately
$347 million
and fair value of
$334 million
as of the date of acquisition. MBIA insured all of the notes issued in the Zohar II 2005-1 transaction. As of December 31, 2016, MBIA UK had an insured portfolio of approximately
$12 billion
of net par.
MBIA UK has been renamed Assured Guaranty (London) Ltd. (AGLN). Assured Guaranty currently maintains AGLN as a stand-alone entity. Assured Guaranty is actively working to combine AGLN with its other affiliated European insurance companies. Any such combination will be subject to regulatory and court approvals; as a result, Assured Guaranty cannot predict when, or if, such a combination will be completed.
The Company is in the process of allocating the purchase price to the assets acquired and liabilities assumed and conforming accounting policies but has not yet completed the acquisition date balance sheet. The Company intends to include this information in its first quarter 2017 Form 10-Q.
|
3.
|
Rating Actions
|
When a rating agency assigns a public rating to a financial obligation guaranteed by one of AGL’s insurance company subsidiaries, it generally awards that obligation the same rating it has assigned to the financial strength of the AGL subsidiary that provides the guaranty. Investors in products insured by AGL’s insurance company subsidiaries frequently rely on ratings published by the rating agencies because such ratings influence the trading value of securities and form the basis for many institutions’ investment guidelines as well as individuals’ bond purchase decisions. Therefore, the Company manages its business with the goal of achieving strong financial strength ratings. However, the methodologies and models used by rating agencies differ, presenting conflicting goals that may make it inefficient or impractical to reach the highest rating level. The methodologies and models are not fully transparent, contain subjective elements and data (such as assumptions about future market demand for the Company’s products) and may change. Ratings are subject to continuous review and revision or withdrawal at any time. If the financial strength ratings of one (or more) of the Company’s insurance subsidiaries were reduced below current levels, the Company expects it could have adverse effects on the impacted subsidiary's future business opportunities as well as the premiums the impacted subsidiary could charge for its insurance policies.
147
The Company periodically assesses the value of each rating assigned to each of its companies, and as a result of such assessment may request that a rating agency add or drop a rating from certain of its companies. For example, the Kroll Bond Rating Agency (KBRA) ratings were first assigned to MAC in 2013, to AGM in 2014, and to AGC in 2016, while the A.M. Best Company, Inc. (Best) rating was first assigned to Assured Guaranty Re Overseas Ltd. (AGRO) in 2015, and a Moody's Investors Service, Inc. (Moody's) rating was never requested for MAC and was dropped from AG Re and AGRO in 2015. On January 13, 2017, AGC announced that it had requested that Moody's withdraw its financial strength rating of AGC.
In the last several years, S&P Global Ratings, a division of Standard & Poor's Financial Services LLC (S&P) and Moody's have changed, multiple times, their financial strength ratings of AGL's insurance subsidiaries, or changed the outlook on such ratings. More recently, KBRA and Best have assigned financial strength ratings to some of AGL's insurance subsidiaries. The rating agencies' most recent actions related to AGL's insurance subsidiaries are:
|
•
|
On September 20, 2016, KBRA assigned a financial strength rating of AA (stable outlook) to AGC. On December 14, 2016 and July 8, 2016, KBRA affirmed the AA+ (stable outlook) financial strength ratings of AGM and MAC, respectively.
|
|
•
|
On August 8, 2016, Moody's affirmed the A2 (stable outlook) on AGM and AGE and A3 insurance financial strength rating on AGC and AGC's subsidiary Assured Guaranty (U.K.) Ltd. (AGUK) raising the outlook to stable from negative, although AGC has requested that Moody's withdraw its financial strength rating of AGC and AGUK. Effective April 8, 2015, at the Company's request, Moody’s withdrew the financial strength ratings it had assigned to AG Re and AGRO.
|
|
•
|
On July 27, 2016, S&P affirmed the AA (stable) financial strength ratings of AGL's insurance subsidiaries.
|
|
•
|
On May 27, 2016, Best affirmed the A+ (stable) financial strength rating, which is their second highest rating, of AGRO.
|
There can be no assurance that any of the rating agencies will not take negative action on their financial strength ratings of AGL's insurance subsidiaries in the future.
For a discussion of the effects of rating actions on the Company, see the following:
|
•
|
|
|
•
|
|
|
•
|
|
|
4.
|
Outstanding Exposure
|
The Company’s financial guaranty contracts are written in either insurance or credit derivative form, but collectively are considered financial guaranty contracts. The Company seeks to limit its exposure to losses by underwriting obligations that it views as investment grade at inception, although, as part of its loss mitigation strategy for existing troubled credits, it may underwrite new issuances that it views as BIG. The Company diversifies its insured portfolio across asset classes and, in the structured finance portfolio, requires rigorous subordination or collateralization requirements. Reinsurance may be used in order to reduce net exposure to certain insured transactions.
Public finance obligations insured by the Company consist primarily of general obligation bonds supported by the taxing powers of U.S. state or municipal governmental authorities, as well as tax-supported bonds, revenue bonds and other obligations supported by covenants from state or municipal governmental authorities or other municipal obligors to impose and collect fees and charges for public services or specific infrastructure projects. The Company also includes within public finance obligations those obligations backed by the cash flow from leases or other revenues from projects serving substantial public purposes, including utilities, toll roads, health care facilities and government office buildings. The Company also includes within public finance similar obligations issued by territorial and non-U.S. sovereign and sub-sovereign issuers and governmental authorities.
Structured finance obligations insured by the Company are generally issued by special purpose entities, including VIEs, and backed by pools of assets having an ascertainable cash flow or market value or other specialized financial obligations. Some of these VIEs are consolidated as described in Note 9, Consolidated Variable Interest Entities. Unless
148
otherwise specified, the outstanding par and debt service amounts presented in this note include outstanding exposures on VIEs whether or not they are consolidated.
Significant Risk Management Activities
The Portfolio Risk Management Committee, which includes members of senior management and senior credit and surveillance officers, sets specific risk policies and limits and is responsible for enterprise risk management, establishing the Company's risk appetite, credit underwriting of new business, surveillance and work-out.
As part of the surveillance process, the Company monitors trends and changes in transaction credit quality, detects any deterioration in credit quality, and recommends such remedial actions as may be necessary or appropriate. All transactions in the insured portfolio are assigned internal credit ratings, which are updated based on changes in transaction credit quality. The Company also develops strategies to enforce its contractual rights and remedies and to mitigate its losses, engage in negotiation discussions with transaction participants and, when necessary, manage the Company's litigation proceedings.
Surveillance Categories
The Company segregates its insured portfolio into investment grade and BIG surveillance categories to facilitate the appropriate allocation of resources to monitoring and loss mitigation efforts and to aid in establishing the appropriate cycle for periodic review for each exposure. BIG exposures include all exposures with internal credit ratings below BBB-. The Company’s internal credit ratings are based on internal assessments of the likelihood of default and loss severity in the event of default. Internal credit ratings are expressed on a ratings scale similar to that used by the rating agencies and are generally reflective of an approach similar to that employed by the rating agencies, except that the Company's internal credit ratings focus on future performance rather than lifetime performance.
The Company monitors its investment grade credits to determine whether any need to be internally downgraded to BIG and refreshes its internal credit ratings on individual credits in quarterly, semi-annual or annual cycles based on the Company’s view of the credit’s quality, loss potential, volatility and sector. Ratings on credits in sectors identified as under the most stress or with the most potential volatility are reviewed every quarter. The Company’s credit ratings on assumed credits are based on the Company’s reviews of low-rated credits or credits in volatile sectors, unless such information is not available, in which case, the ceding company’s credit ratings of the transactions are used.
Credits identified as BIG are subjected to further review to determine the probability of a loss. See Note 5, Expected Loss to be Paid, for additional information. Surveillance personnel then assign each BIG transaction to the appropriate BIG surveillance category based upon whether a future loss is expected and whether a claim has been paid. For surveillance purposes, the Company calculates present value using a discount rate of
4%
or
5%
depending on the insurance subsidiary. (Risk-free rates are used for calculating the expected loss for financial statement measurement purposes.)
More extensive monitoring and intervention is employed for all BIG surveillance categories, with internal credit ratings reviewed quarterly. The Company expects “future losses” on a transaction when the Company believes there is at least a
50%
chance that, on a present value basis, it will pay more claims in the future of that transaction than it will have reimbursed. The three BIG categories are:
|
•
|
BIG Category 1: Below-investment-grade transactions showing sufficient deterioration to make future losses possible, but for which none are currently expected.
|
|
•
|
BIG Category 2: Below-investment-grade transactions for which future losses are expected but for which no claims (other than liquidity claims, which are claims that the Company expects to be reimbursed within
one
year) have yet been paid.
|
|
•
|
BIG Category 3: Below-investment-grade transactions for which future losses are expected and on which claims (other than liquidity claims) have been paid.
|
149
Components of Outstanding Exposure
Unless otherwise noted, ratings disclosed herein on the Company's insured portfolio reflect its internal ratings. The Company classifies those portions of risks benefiting from reimbursement obligations collateralized by eligible assets held in trust in acceptable reimbursement structures as the higher of 'AA' or their current internal rating.
The Company purchases securities that it has insured, and for which it has expected losses to be paid, in order to mitigate the economic effect of insured losses (loss mitigation securities). The Company excludes amounts attributable to loss mitigation securities (unless otherwise indicated) from par and debt service outstanding, because it manages such securities as investments and not insurance exposure. As of
December 31, 2016
and
December 31, 2015
, the Company excluded $
2.1 billion
and
$1.5 billion
, respectively, of net par as a result of loss mitigation strategies, including loss mitigation securities held in the investment portfolio, which are primarily BIG. The following table presents the gross and net debt service for financial guaranty contracts.
Financial Guaranty
Debt Service Outstanding
|
|
Gross Debt Service
Outstanding
|
Net Debt Service
Outstanding
|
|||||||||||||
|
|
December 31,
2016 |
December 31,
2015 |
December 31,
2016 |
December 31,
2015 |
|||||||||||
|
|
(in millions)
|
||||||||||||||
|
Public finance
|
$
|
425,849
|
|
$
|
515,494
|
|
$
|
409,447
|
|
$
|
494,426
|
|
|||
|
Structured finance
|
29,151
|
|
43,976
|
|
28,088
|
|
41,915
|
|
|||||||
|
Total financial guaranty
|
$
|
455,000
|
|
$
|
559,470
|
|
$
|
437,535
|
|
$
|
536,341
|
|
|||
In addition to the financial guaranty debt service shown in the table above, the Company provided structured capital relief Triple-X excess of loss life reinsurance on approximately
$390 million
of exposure as of
December 31, 2016
, which is expected to increase to approximately
$1 billion
prior to September 30, 2036. There was
no
exposure to structured capital relief Triple-X excess of loss life reinsurance as of
December 31, 2015
. The Company also has mortgage guaranty reinsurance related to loans originated in Ireland on debt service of approximately
$36 million
as of
December 31, 2016
and
$102 million
as of
December 31, 2015
. These transactions are all rated investment grade internally.
150
Financial Guaranty Portfolio by Internal Rating(1)
As of December 31, 2016
|
|
Public Finance
U.S. |
Public Finance
Non-U.S.
|
Structured Finance
U.S
|
Structured Finance
Non-U.S
|
Total
|
||||||||||||||||||||||||||||||
|
Rating
Category |
Net Par
Outstanding |
%
|
Net Par
Outstanding
|
%
|
Net Par
Outstanding
|
%
|
Net Par
Outstanding
|
%
|
Net Par
Outstanding
|
%
|
|||||||||||||||||||||||||
|
|
(dollars in millions)
|
||||||||||||||||||||||||||||||||||
|
AAA
|
$
|
2,066
|
|
0.8
|
%
|
$
|
2,221
|
|
8.4
|
%
|
$
|
9,757
|
|
44.2
|
%
|
$
|
1,447
|
|
47.0
|
%
|
$
|
15,491
|
|
5.2
|
%
|
||||||||||
|
AA
|
46,420
|
|
19.0
|
|
170
|
|
0.6
|
|
5,773
|
|
26.2
|
|
127
|
|
4.1
|
|
52,490
|
|
17.7
|
|
|||||||||||||||
|
A
|
133,829
|
|
54.7
|
|
6,270
|
|
23.8
|
|
1,589
|
|
7.2
|
|
456
|
|
14.8
|
|
142,144
|
|
48.0
|
|
|||||||||||||||
|
BBB
|
55,103
|
|
22.5
|
|
16,378
|
|
62.1
|
|
879
|
|
4.0
|
|
759
|
|
24.6
|
|
73,119
|
|
24.7
|
|
|||||||||||||||
|
BIG
|
7,380
|
|
3.0
|
|
1,342
|
|
5.1
|
|
4,059
|
|
18.4
|
|
293
|
|
9.5
|
|
13,074
|
|
4.4
|
|
|||||||||||||||
|
Total net par outstanding
|
$
|
244,798
|
|
100.0
|
%
|
$
|
26,381
|
|
100.0
|
%
|
$
|
22,057
|
|
100.0
|
%
|
$
|
3,082
|
|
100.0
|
%
|
$
|
296,318
|
|
100.0
|
%
|
||||||||||
(1)
The
December 31, 2016
amounts include
$2.9 billion
of net par from the CIFG Acquisition.
Financial Guaranty Portfolio by Internal Rating(1)
As of December 31, 2015
|
|
Public Finance
U.S.
|
Public Finance
Non-U.S.
|
Structured Finance
U.S
|
Structured Finance
Non-U.S
|
Total
|
||||||||||||||||||||||||||||||
|
Rating
Category
|
Net Par
Outstanding
|
%
|
Net Par
Outstanding
|
%
|
Net Par
Outstanding
|
%
|
Net Par
Outstanding
|
%
|
Net Par
Outstanding
|
%
|
|||||||||||||||||||||||||
|
|
(dollars in millions)
|
||||||||||||||||||||||||||||||||||
|
AAA
|
$
|
3,053
|
|
1.1
|
%
|
$
|
709
|
|
2.4
|
%
|
$
|
14,366
|
|
45.2
|
%
|
$
|
2,709
|
|
50.6
|
%
|
$
|
20,837
|
|
5.8
|
%
|
||||||||||
|
AA
|
69,274
|
|
23.7
|
|
2,017
|
|
6.8
|
|
7,934
|
|
25.0
|
|
177
|
|
3.3
|
|
79,402
|
|
22.1
|
|
|||||||||||||||
|
A
|
157,440
|
|
53.9
|
|
6,765
|
|
22.9
|
|
2,486
|
|
7.8
|
|
555
|
|
10.3
|
|
167,246
|
|
46.7
|
|
|||||||||||||||
|
BBB
|
54,315
|
|
18.6
|
|
18,708
|
|
63.2
|
|
1,515
|
|
4.8
|
|
1,365
|
|
25.5
|
|
75,903
|
|
21.2
|
|
|||||||||||||||
|
BIG
|
7,784
|
|
2.7
|
|
1,378
|
|
4.7
|
|
5,469
|
|
17.2
|
|
552
|
|
10.3
|
|
15,183
|
|
4.2
|
|
|||||||||||||||
|
Total net par outstanding
|
$
|
291,866
|
|
100.0
|
%
|
$
|
29,577
|
|
100.0
|
%
|
$
|
31,770
|
|
100.0
|
%
|
$
|
5,358
|
|
100.0
|
%
|
$
|
358,571
|
|
100.0
|
%
|
||||||||||
_____________________
|
(1)
|
The
December 31, 2015
amounts include
$10.9 billion
of net par from the Radian Asset Acquisition.
|
151
Financial Guaranty Portfolio
by Sector
|
|
Gross Par Outstanding
|
Ceded Par Outstanding
|
Net Par Outstanding
|
||||||||||||||||||||
|
Sector
|
As of December 31, 2016
|
As of December 31, 2015
|
As of December 31, 2016
|
As of December 31, 2015
|
As of December 31, 2016
|
As of December 31, 2015
|
|||||||||||||||||
|
|
(in millions)
|
||||||||||||||||||||||
|
Public finance:
|
|
|
|
|
|||||||||||||||||||
|
U.S.:
|
|
|
|
|
|||||||||||||||||||
|
General obligation
|
$
|
110,167
|
|
$
|
129,386
|
|
$
|
2,450
|
|
$
|
3,131
|
|
$
|
107,717
|
|
$
|
126,255
|
|
|||||
|
Tax backed
|
51,325
|
|
59,649
|
|
1,394
|
|
1,587
|
|
49,931
|
|
58,062
|
|
|||||||||||
|
Municipal utilities
|
38,442
|
|
46,951
|
|
839
|
|
1,015
|
|
37,603
|
|
45,936
|
|
|||||||||||
|
Transportation
|
19,915
|
|
24,351
|
|
512
|
|
897
|
|
19,403
|
|
23,454
|
|
|||||||||||
|
Healthcare
|
11,940
|
|
15,967
|
|
702
|
|
961
|
|
11,238
|
|
15,006
|
|
|||||||||||
|
Higher education
|
10,114
|
|
11,984
|
|
29
|
|
48
|
|
10,085
|
|
11,936
|
|
|||||||||||
|
Infrastructure finance
|
3,902
|
|
5,241
|
|
133
|
|
248
|
|
3,769
|
|
4,993
|
|
|||||||||||
|
Housing
|
1,593
|
|
2,075
|
|
34
|
|
38
|
|
1,559
|
|
2,037
|
|
|||||||||||
|
Investor-owned utilities
|
697
|
|
916
|
|
0
|
|
0
|
|
697
|
|
916
|
|
|||||||||||
|
Other public finance
|
2,810
|
|
3,288
|
|
14
|
|
17
|
|
2,796
|
|
3,271
|
|
|||||||||||
|
Total public finance—U.S.
|
250,905
|
|
299,808
|
|
6,107
|
|
7,942
|
|
244,798
|
|
291,866
|
|
|||||||||||
|
Non-U.S.:
|
|
|
|
|
|||||||||||||||||||
|
Infrastructure finance
|
11,818
|
|
14,040
|
|
1,087
|
|
1,312
|
|
10,731
|
|
12,728
|
|
|||||||||||
|
Regulated utilities
|
11,395
|
|
12,616
|
|
2,132
|
|
2,568
|
|
9,263
|
|
10,048
|
|
|||||||||||
|
Pooled infrastructure
|
1,621
|
|
2,013
|
|
108
|
|
134
|
|
1,513
|
|
1,879
|
|
|||||||||||
|
Other public finance
|
5,653
|
|
5,714
|
|
779
|
|
792
|
|
4,874
|
|
4,922
|
|
|||||||||||
|
Total public finance—non-U.S.
|
30,487
|
|
34,383
|
|
4,106
|
|
4,806
|
|
26,381
|
|
29,577
|
|
|||||||||||
|
Total public finance
|
281,392
|
|
334,191
|
|
10,213
|
|
12,748
|
|
271,179
|
|
321,443
|
|
|||||||||||
|
Structured finance:
|
|
|
|
|
|||||||||||||||||||
|
U.S.:
|
|
|
|
|
|||||||||||||||||||
|
Pooled corporate obligations
|
10,273
|
|
16,757
|
|
223
|
|
749
|
|
10,050
|
|
16,008
|
|
|||||||||||
|
Residential Mortgage-Backed Securities (RMBS)
|
5,933
|
|
7,441
|
|
296
|
|
374
|
|
5,637
|
|
7,067
|
|
|||||||||||
|
Insurance securitizations
|
2,355
|
|
3,047
|
|
47
|
|
47
|
|
2,308
|
|
3,000
|
|
|||||||||||
|
Consumer receivables
|
1,707
|
|
2,153
|
|
55
|
|
54
|
|
1,652
|
|
2,099
|
|
|||||||||||
|
Financial products
|
1,540
|
|
1,906
|
|
—
|
|
—
|
|
1,540
|
|
1,906
|
|
|||||||||||
|
Commercial receivables
|
234
|
|
432
|
|
4
|
|
5
|
|
230
|
|
427
|
|
|||||||||||
|
Commercial mortgage-backed securities (CMBS) and other commercial real estate related exposures
|
43
|
|
549
|
|
—
|
|
16
|
|
43
|
|
533
|
|
|||||||||||
|
Other structured finance
|
646
|
|
823
|
|
49
|
|
93
|
|
597
|
|
730
|
|
|||||||||||
|
Total structured finance—U.S.
|
22,731
|
|
33,108
|
|
674
|
|
1,338
|
|
22,057
|
|
31,770
|
|
|||||||||||
|
Non-U.S.:
|
|
|
|
|
|||||||||||||||||||
|
Pooled corporate obligations
|
1,716
|
|
4,087
|
|
181
|
|
442
|
|
1,535
|
|
3,645
|
|
|||||||||||
|
RMBS
|
661
|
|
552
|
|
57
|
|
60
|
|
604
|
|
492
|
|
|||||||||||
|
Commercial receivables
|
373
|
|
619
|
|
17
|
|
19
|
|
356
|
|
600
|
|
|||||||||||
|
Other structured finance
|
601
|
|
635
|
|
14
|
|
14
|
|
587
|
|
621
|
|
|||||||||||
|
Total structured finance—non-U.S.
|
3,351
|
|
5,893
|
|
269
|
|
535
|
|
3,082
|
|
5,358
|
|
|||||||||||
|
Total structured finance
|
26,082
|
|
39,001
|
|
943
|
|
1,873
|
|
25,139
|
|
37,128
|
|
|||||||||||
|
Total net par outstanding
|
$
|
307,474
|
|
$
|
373,192
|
|
$
|
11,156
|
|
$
|
14,621
|
|
$
|
296,318
|
|
$
|
358,571
|
|
|||||
152
In addition to amounts shown in the tables above, the Company had outstanding commitments to provide guaranties of
$123 million
for structured finance and $
394 million
for public finance obligations as of
December 31, 2016
. The expiration dates for the public finance commitments range between
January 1, 2017
and
March 12, 2017
, with $
380 million
expiring prior to the date of this filing. The commitments are contingent on the satisfaction of all conditions set forth in them and may expire unused or be canceled at the counterparty’s request. Therefore, the total commitment amount does not necessarily reflect actual future guaranteed amounts.
Actual maturities of insured obligations could differ from contractual maturities because borrowers have the right to call or prepay certain obligations with or without call or prepayment penalties. The expected maturities of structured finance obligations are, in general, considerably shorter than the contractual maturities for such obligations.
Expected Amortization of
Net Par Outstanding
As of December 31, 2016
|
|
Public Finance
|
Structured Finance
|
Total
|
||||||||
|
|
(in millions)
|
||||||||||
|
0 to 5 years
|
$
|
90,563
|
|
$
|
16,394
|
|
$
|
106,957
|
|
||
|
5 to 10 years
|
56,351
|
|
3,692
|
|
60,043
|
|
|||||
|
10 to 15 years
|
45,712
|
|
2,548
|
|
48,260
|
|
|||||
|
15 to 20 years
|
37,057
|
|
1,859
|
|
38,916
|
|
|||||
|
20 years and above
|
41,496
|
|
646
|
|
42,142
|
|
|||||
|
Total net par outstanding
|
$
|
271,179
|
|
$
|
25,139
|
|
$
|
296,318
|
|
||
Components of BIG Portfolio
Components of BIG Net Par Outstanding
(Insurance and Credit Derivative Form)
As of December 31, 2016
|
|
BIG Net Par Outstanding
|
Net Par
|
|||||||||||||||||
|
|
BIG 1
|
BIG 2
|
BIG 3
|
Total BIG
|
Outstanding
|
||||||||||||||
|
|
|
|
(in millions)
|
|
|
||||||||||||||
|
Public finance:
|
|||||||||||||||||||
|
U.S. public finance
|
$
|
2,402
|
|
$
|
3,123
|
|
$
|
1,855
|
|
$
|
7,380
|
|
$
|
244,798
|
|
||||
|
Non-U.S. public finance
|
1,288
|
|
54
|
|
—
|
|
1,342
|
|
26,381
|
|
|||||||||
|
Public finance
|
3,690
|
|
3,177
|
|
1,855
|
|
8,722
|
|
271,179
|
|
|||||||||
|
Structured finance:
|
|||||||||||||||||||
|
U.S. RMBS
|
197
|
|
493
|
|
2,461
|
|
3,151
|
|
5,637
|
|
|||||||||
|
Triple-X life insurance transactions
|
—
|
|
—
|
|
126
|
|
126
|
|
2,057
|
|
|||||||||
|
Trust preferred securities (TruPS)
|
304
|
|
126
|
|
—
|
|
430
|
|
1,892
|
|
|||||||||
|
Other structured finance
|
304
|
|
263
|
|
78
|
|
645
|
|
15,553
|
|
|||||||||
|
Structured finance
|
805
|
|
882
|
|
2,665
|
|
4,352
|
|
25,139
|
|
|||||||||
|
Total
|
$
|
4,495
|
|
$
|
4,059
|
|
$
|
4,520
|
|
$
|
13,074
|
|
$
|
296,318
|
|
||||
153
Components of BIG Net Par Outstanding
(Insurance and Credit Derivative Form)
As of December 31, 2015
|
|
BIG Net Par Outstanding
|
Net Par
|
|||||||||||||||||
|
|
BIG 1
|
BIG 2
|
BIG 3
|
Total BIG
|
Outstanding
|
||||||||||||||
|
|
|
|
(in millions)
|
|
|
||||||||||||||
|
Public finance:
|
|||||||||||||||||||
|
U.S. public finance
|
$
|
4,765
|
|
$
|
2,883
|
|
$
|
136
|
|
$
|
7,784
|
|
$
|
291,866
|
|
||||
|
Non-U.S. public finance
|
875
|
|
503
|
|
—
|
|
1,378
|
|
29,577
|
|
|||||||||
|
Public finance
|
5,640
|
|
3,386
|
|
136
|
|
9,162
|
|
321,443
|
|
|||||||||
|
Structured finance:
|
|||||||||||||||||||
|
U.S. RMBS
|
1,020
|
|
397
|
|
2,556
|
|
3,973
|
|
7,067
|
|
|||||||||
|
Triple-X life insurance transactions
|
—
|
|
—
|
|
216
|
|
216
|
|
2,750
|
|
|||||||||
|
TruPS
|
679
|
|
127
|
|
—
|
|
806
|
|
4,379
|
|
|||||||||
|
Other structured finance
|
684
|
|
219
|
|
123
|
|
1,026
|
|
22,932
|
|
|||||||||
|
Structured finance
|
2,383
|
|
743
|
|
2,895
|
|
6,021
|
|
37,128
|
|
|||||||||
|
Total
|
$
|
8,023
|
|
$
|
4,129
|
|
$
|
3,031
|
|
$
|
15,183
|
|
$
|
358,571
|
|
||||
BIG Net Par Outstanding
and Number of Risks
As of December 31, 2016
|
|
Net Par Outstanding
|
Number of Risks(2)
|
|||||||||||||||||||
|
Description
|
Financial
Guaranty
Insurance(1)
|
Credit
Derivative
|
Total
|
Financial
Guaranty
Insurance(1)
|
Credit
Derivative
|
Total
|
|||||||||||||||
|
|
(dollars in millions)
|
||||||||||||||||||||
|
BIG:
|
|
|
|
|
|
|
|
|
|
|
|
|
|||||||||
|
Category 1
|
$
|
3,861
|
|
$
|
634
|
|
$
|
4,495
|
|
165
|
|
10
|
|
175
|
|
||||||
|
Category 2
|
3,857
|
|
202
|
|
4,059
|
|
79
|
|
6
|
|
85
|
|
|||||||||
|
Category 3
|
4,383
|
|
137
|
|
4,520
|
|
148
|
|
9
|
|
157
|
|
|||||||||
|
Total BIG
|
$
|
12,101
|
|
$
|
973
|
|
$
|
13,074
|
|
392
|
|
25
|
|
417
|
|
||||||
154
BIG Net Par Outstanding
and Number of Risks
As of December 31, 2015
|
|
Net Par Outstanding
|
Number of Risks(2)
|
|||||||||||||||||||
|
Description
|
Financial
Guaranty
Insurance(1)
|
Credit
Derivative
|
Total
|
Financial
Guaranty
Insurance(1)
|
Credit
Derivative
|
Total
|
|||||||||||||||
|
|
(dollars in millions)
|
||||||||||||||||||||
|
BIG:
|
|
|
|
|
|
|
|
|
|
|
|
|
|||||||||
|
Category 1
|
$
|
7,019
|
|
$
|
1,004
|
|
$
|
8,023
|
|
202
|
|
12
|
|
214
|
|
||||||
|
Category 2
|
3,655
|
|
474
|
|
4,129
|
|
85
|
|
8
|
|
93
|
|
|||||||||
|
Category 3
|
2,900
|
|
131
|
|
3,031
|
|
132
|
|
12
|
|
144
|
|
|||||||||
|
Total BIG
|
$
|
13,574
|
|
$
|
1,609
|
|
$
|
15,183
|
|
419
|
|
32
|
|
451
|
|
||||||
(1)
Includes net par outstanding for VIEs.
|
(2)
|
A risk represents the aggregate of the financial guaranty policies that share the same revenue source for purposes of making debt service payments.
|
155
Geographic Distribution of Net Par Outstanding
The Company seeks to maintain a diversified portfolio of insured obligations designed to spread its risk across a number of geographic areas.
Geographic Distribution of
Net Par Outstanding
As of December 31, 2016
|
Number of Risks
|
Net Par Outstanding
|
Percent of Total Net Par Outstanding
|
|||||||
|
|
(dollars in millions)
|
||||||||
|
U.S.:
|
|||||||||
|
U.S. Public finance:
|
|||||||||
|
California
|
1,459
|
|
$
|
42,404
|
|
14.3
|
%
|
||
|
Texas
|
1,271
|
|
20,599
|
|
7.0
|
|
|||
|
Pennsylvania
|
852
|
|
20,232
|
|
6.8
|
|
|||
|
New York
|
935
|
|
19,637
|
|
6.6
|
|
|||
|
Illinois
|
776
|
|
17,967
|
|
6.1
|
|
|||
|
Florida
|
324
|
|
12,643
|
|
4.3
|
|
|||
|
New Jersey
|
495
|
|
12,560
|
|
4.2
|
|
|||
|
Michigan
|
506
|
|
7,985
|
|
2.7
|
|
|||
|
Georgia
|
172
|
|
6,372
|
|
2.2
|
|
|||
|
Ohio
|
409
|
|
5,554
|
|
1.9
|
|
|||
|
Other states and U.S. territories
|
3,475
|
|
78,845
|
|
26.6
|
|
|||
|
Total U.S. public finance
|
10,674
|
|
244,798
|
|
82.7
|
|
|||
|
U.S. Structured finance (multiple states)
|
610
|
|
22,057
|
|
7.4
|
|
|||
|
Total U.S.
|
11,284
|
|
266,855
|
|
90.1
|
|
|||
|
Non-U.S.:
|
|||||||||
|
United Kingdom
|
112
|
|
15,940
|
|
5.4
|
|
|||
|
Australia
|
18
|
|
3,036
|
|
1.0
|
|
|||
|
Canada
|
9
|
|
2,730
|
|
0.9
|
|
|||
|
France
|
14
|
|
1,809
|
|
0.6
|
|
|||
|
Italy
|
9
|
|
1,311
|
|
0.4
|
|
|||
|
Other
|
53
|
|
4,637
|
|
1.6
|
|
|||
|
Total non-U.S.
|
215
|
|
29,463
|
|
9.9
|
|
|||
|
Total
|
11,499
|
|
$
|
296,318
|
|
100.0
|
%
|
||
Exposure to Puerto Rico
The Company has insured exposure to general obligation bonds of the Commonwealth of Puerto Rico (Puerto Rico or the Commonwealth) and various obligations of its related authorities and public corporations aggregating
$4.8 billion
net par as of
December 31, 2016
,
all of which are rated BIG.
Puerto Rico has experienced significant general fund budget deficits in recent years and a challenging economic environment. Beginning on January 1, 2016, a number of Puerto Rico credits have defaulted on bond payments, and the Company has now paid claims on several Puerto Rico credits as shown in the table "Puerto Rico Net Par Outstanding" below.
On November 30, 2015 and December 8, 2015, Governor García Padilla of Puerto Rico (the Former Governor) issued executive orders (Clawback Orders) directing the Puerto Rico Department of Treasury and the Puerto Rico Tourism Company to retain or transfer certain taxes pledged to secure the payment of bonds issued by the Puerto Rico Highways and Transportation Authority (PRHTA), Puerto Rico Infrastructure Financing Authority (PRIFA), and Puerto Rico Convention
156
Center District Authority (PRCCDA). On January 7, 2016, the Company sued various Puerto Rico governmental officials in the United States District Court, District of Puerto Rico, asserting that this attempt to “claw back” pledged taxes is unconstitutional, and demanding declaratory and injunctive relief. The Puerto Rico credits insured by the Company subject to the Clawback Orders are shown in the table “Puerto Rico Net Par Outstanding” below.
On April 6, 2016, the Former Governor signed into law the Puerto Rico Emergency Moratorium & Financial Rehabilitation Act (the Moratorium Act). The Moratorium Act purportedly empowers the governor to declare, entity by entity, states of emergencies and moratoriums on debt service payments on obligations of the Commonwealth and its related authorities and public corporations, as well as instituting a stay against related litigation, among other things. The Former Governor used the authority of the Moratorium Act to take a number of actions related to issuers of obligations the Company insures. National Public Finance Guarantee Corporation (National) (another financial guarantor), holders of the Commonwealth general obligation bonds and certain Puerto Rico residents (the National Plaintiffs) have filed suits to invalidate the Moratorium Act, and after the passage of the Puerto Rico Oversight, Management, and Economic Stability Act (PROMESA), the National Plaintiffs sought a relief from the stay of litigation imposed by PROMESA to pursue the action. On July 21, 2016, the Company filed a motion and form of complaint in the U.S. District Court for the District of Puerto Rico seeking relief from the stay of litigation imposed by PROMESA to seek a declaration that the Moratorium Act is preempted by Federal bankruptcy law. In November 2016 that court denied both the Company's and the National Plaintiffs' motions for relief from stay in the respective actions. The PROMESA stay expires on May 1, 2017.
On June 30, 2016, PROMESA was signed into law by the President of the United States. PROMESA establishes a seven-member federal financial oversight board (Oversight Board) with authority to require that balanced budgets and fiscal plans be adopted and implemented by Puerto Rico. PROMESA provides a legal framework under which the debt of the Commonwealth and its related authorities and public corporations may be voluntarily restructured, and grants the Oversight Board the sole authority to file restructuring petitions in a federal court to restructure the debt of the Commonwealth and its related authorities and public corporations if voluntary negotiations fail, provided that any such restructuring must be in accordance with an Oversight Board approved fiscal plan that respects the liens and priorities provided under Puerto Rico law. PROMESA also appears to preempt at least portions of the Moratorium Act and to stay debt-related litigation, including the Company’s litigation regarding the Clawback Orders. On August 31, 2016, the President of the United States appointed the seven members of the Oversight Board.
The Oversight Board has begun meeting and has hired Ramón Ruiz-Comas as interim executive director. On January 2, 2017, Ricardo Antonio Rosselló Nevares (the Governor) took office, replacing the Former Governor. On January 29, 2017, the Governor signed the Puerto Rico Emergency and Fiscal Responsibility Act (Emergency Act) that, among other things, repeals portions of the Moratorium Act, defines an emergency period until May 1, 2017, continues diversion of collateral away from bonds the Company insures, and defines the powers and duties of the Fiscal Agency and Financial Advisory Authority (FAFAA). The final shape, timing and validity of responses to Puerto Rico’s distress eventually enacted or implemented under the auspices of PROMESA and the Oversight Board or otherwise, and the impact of any such responses on obligations insured by the Company, is uncertain.
The Company groups its Puerto Rico exposure into three categories:
|
•
|
Constitutionally Guaranteed.
The Company includes in this category public debt benefiting from Article VI of the Constitution of the Commonwealth, which expressly provides that interest and principal payments on the public debt are to be paid before other disbursements are made.
|
|
•
|
Public Corporations – Certain Revenues Potentially Subject to Clawback.
The Company includes in this category the debt of public corporations for which applicable law permits the Commonwealth to claw back, subject to certain conditions and for the payment of public debt, at least a portion of the revenues supporting the bonds the Company insures. As a Constitutional condition to clawback, available Commonwealth revenues for any fiscal year must be insufficient to pay Commonwealth debt service before the payment of any appropriations for that year. The Company believes that this condition has not been satisfied to date, and accordingly that the Commonwealth has not to date been entitled to clawback revenues supporting debt insured by the Company.
As noted above, the Company sued various Puerto Rico governmental officials in the United States District Court, District of Puerto Rico asserting that Puerto Rico's recent attempt to claw back pledged taxes is unconstitutional, and demanding declaratory and injunctive relief.
|
|
•
|
Other Public Corporations.
The Company includes in this category the debt of public corporations that are supported by revenues it does not believe are subject to clawback.
|
157
Constitutionally Guaranteed
General Obligation.
As of
December 31, 2016
, the Company had
$1,476 million
insured net par outstanding of the general obligations of Puerto Rico, which are supported by the good faith, credit and taxing power of the Commonwealth. On July 1, 2016, despite the requirements of Article VI of its Constitution but pursuant to an executive order issued by the Former Governor under the Moratorium Act, the Commonwealth defaulted on most of the debt service payment due that day, and the Company made its first claim payments on these bonds, and has continued to make claim payments on these bonds.
Puerto Rico Public Buildings Authority (PBA).
As of
December 31, 2016
, the Company had
$169 million
insured net par outstanding of PBA bonds, which are supported by a pledge of the rents due under leases of government facilities to departments, agencies, instrumentalities and municipalities of the Commonwealth, and that benefit from a Commonwealth guaranty supported by a pledge of the Commonwealth’s good faith, credit and taxing power. On July 1, 2016, despite the requirements of Article VI of its Constitution but pursuant to an executive order issued by the Former Governor under the Moratorium Act, the PBA defaulted on most of the debt service payment due that day, and the Company made its first claim payments on these bonds, and has continued to make claim payments on these bonds.
Public Corporations - Certain Revenues Potentially Subject to Clawback
PRHTA.
As of
December 31, 2016
, the Company had
$918 million
insured net par outstanding of PRHTA (Transportation revenue) bonds and
$350 million
insured net par of PRHTA (Highways revenue) bonds. The transportation revenue bonds are secured by a subordinate gross pledge of gasoline and gas oil and diesel oil taxes, motor vehicle license fees and certain tolls, plus a first lien on up to
$120 million
annually of taxes on crude oil, unfinished oil and derivative products. The highways revenue bonds are secured by a gross pledge of gasoline and gas oil and diesel oil taxes, motor vehicle license fees and certain tolls. The Clawback Orders cover Commonwealth-derived taxes that are allocated to PRHTA. The Company believes that such sources represented a substantial majority of PRHTA’s revenues in 2015. The PRHTA bonds are subject to executive orders issued pursuant to the Moratorium Act. As noted above, the Company filed a motion and form of complaint in the U.S. District Court for the District of Puerto Rico seeking relief from the PROMESA stay to seek a declaration that the Moratorium Act is preempted by Federal bankruptcy law and that certain gubernatorial executive orders diverting PRHTA pledged toll revenues (which are not subject to the Clawback Orders) are preempted by PROMESA and violate the U.S. Constitution, and also seeking damages and injunctive relief. That motion was denied on November 2, 2016, on procedural grounds. The PROMESA stay expires on May 1, 2017. There were sufficient funds in the PRHTA bond accounts to make the July 1, 2016 and January 1, 2017 PRHTA debt service payments guaranteed by the Company on a primary basis, and those payments were made in full.
PRCCDA.
As of
December 31, 2016
, the Company had
$152 million
insured net par outstanding of PRCCDA bonds, which are secured by certain hotel tax revenues. These revenues are sensitive to the level of economic activity in the area and are subject to the Clawback Orders, and the bonds are subject to an executive order issued pursuant to the Moratorium Act. There were sufficient funds in the PRCCDA bond accounts to make the July 1, 2016 and January 1, 2017 PRCCDA bond payments guaranteed by the Company, and those payments were made in full.
PRIFA.
As of
December 31, 2016
, the Company had
$18 million
insured net par outstanding of PRIFA bonds, which are secured primarily by the return to Puerto Rico of federal excise taxes paid on rum. These revenues are subject to the Clawback Orders and the bonds are subject to an executive order issued pursuant to the Moratorium Act. The Company made its first claim payment on PRIFA bonds in January 2016, and has continued to make claim payments on PRIFA bonds.
Other Public Corporations
Puerto Rico Electric Power Authority (PREPA).
As of
December 31, 2016
, the Company had
$724 million
insured net par outstanding of PREPA obligations, which are payable from a pledge of net revenues of the electric system.
On December 24, 2015, AGM and AGC entered into a Restructuring Support Agreement (RSA) with PREPA, an ad hoc group of uninsured bondholders and a group of fuel-line lenders that would, subject to certain conditions, result in, among other things, modernization of the utility and a restructuring of current debt. Upon finalization of the contemplated restructuring transaction, insured PREPA revenue bonds (with no reduction to par or stated interest rate or extension of maturity) will be supported by securitization bonds issued by a special purpose corporation and secured by a transition charge assessed on ratepayers. To facilitate the securitization transaction and in exchange for a market premium, Assured Guaranty will issue surety insurance policies in an aggregate amount not expected to exceed
$113 million
(
$14 million
for AGC and
$99 million
for AGM) to support a portion of the reserve fund for the securitization bonds. Certain of the creditors also agreed, subject to certain conditions, to participate in a bridge financing, which was closed in two tranches on May 19, 2016 and June 22, 2016.
158
AGM's and AGC's share of the bridge financing was approximately
$15 million
(
$2 million
for AGC and
$13 million
for AGM). Legislation meeting the requirements of the RSA was enacted on February 16, 2016, and a transition charge to be paid by PREPA rate payers for debt service on the securitization bonds as contemplated by the RSA was approved by the Puerto Rico Energy Commission on June 20, 2016. The closing of the restructuring transaction and the issuance of the surety bonds are subject to certain conditions, including execution of acceptable documentation and legal opinions. The RSA has been extended to March 31, 2017.
On July 1, 2016, PREPA made full payment of the
$41 million
of principal and interest due on PREPA revenue bonds insured by AGM and AGC. That payment was funded in part by AGM’s purchase of
$26 million
of PREPA bonds maturing in 2020. Upon finalization of the transactions contemplated by the RSA, these new PREPA revenue bonds will be supported by securitization bonds contemplated by the RSA. On January 1, 2017, PREPA made full payment of the
$18 million
of interest due on PREPA revenue bonds insured by AGM and AGC.
There can be no assurance that the conditions in the RSA will be met or that, if the conditions are met, the RSA's other provisions, including those related to the insured PREPA revenue bonds, will be implemented as currently agreed. In addition, the impact of PROMESA , the Moratorium Act and Emergency Act or any attempt to exercise the power purportedly granted by the Moratorium Act or the Emergency Act on the implementation of the RSA is uncertain. PREPA, during the pendency of the agreements, has suspended deposits into its debt service fund.
Puerto Rico Aqueduct and Sewer Authority (PRASA).
As of
December 31, 2016
, the Company had
$373 million
of insured net par outstanding to PRASA bonds, which are secured by the gross revenues of the water and sewer system. On September 15, 2015, PRASA entered into a settlement with the U.S.Department of Justice and the U.S. Environmental Protection Agency that requires it to spend
$1.6 billion
to upgrade and improve its sewer system island-wide. According to a material event notice PRASA filed on March 4, 2016, PRASA owed its contractors
$140 million
. The PRASA Revitalization Act, which establishes a securitization mechanism that could facilitate debt issuance, was signed into law on July 13, 2016. While certain bonds benefiting from a guarantee by the Commonwealth are subject to an executive order issued under the Moratorium Act, bonds insured by the Company are not subject to that order. There were sufficient funds in the PRASA bond accounts to make the July 1, 2016 and January 1, 2017 PRASA bond payments guaranteed by the Company, and those payments were made in full.
Municipal Finance Agency (MFA).
As of
December 31, 2016
, the Company had
$334 million
net par outstanding of bonds issued by MFA secured by a pledge of local property tax revenues. There were sufficient funds in the MFA bond accounts to make the July 1, 2016 and January 1, 2017 MFA bond payments guaranteed by the Company, and those payments were made in full.
Puerto Rico Sales Tax Financing Corporation (COFINA).
As of
December 31, 2016
, the Company had
$271 million
insured net par outstanding of junior COFINA bonds, which are secured primarily by a second lien on certain sales and use taxes. There were no debt service payments due on July 1, 2016, or January 1, 2017, on Company-insured COFINA bonds, and, as of the date of this filing, all payments on Company-insured COFINA bonds had been made.
University of Puerto Rico (U of PR).
As of
December 31, 2016
, the Company had
$1 million
insured net par outstanding of U of PR bonds, which are general obligations of the university and are secured by a subordinate lien on the proceeds, profits and other income of the University, subject to a senior pledge and lien for the benefit of outstanding university system revenue bonds. The U of PR bonds are subject to an executive order issued under the Moratorium Act. There were no debt service payments due on July 1, 2016, or January 1, 2017 on Company-insured U of PR bonds, and, as of the date of this filing, all payments on Company-insured U of PR bonds had been made.
159
All Puerto Rico exposures are internally rated BIG. The following tables show the Company’s insured exposure to general obligation bonds of Puerto Rico and various obligations of its related authorities and public corporations.
Puerto Rico
Gross Par and Gross Debt Service Outstanding
|
|
Gross Par Outstanding
|
Gross Debt Service Outstanding
|
|||||||||||||
|
December 31,
2016 |
December 31,
2015 |
December 31,
2016 |
December 31,
2015 |
||||||||||||
|
|
(in millions)
|
||||||||||||||
|
Exposure to Puerto Rico
|
$
|
5,435
|
|
$
|
5,755
|
|
$
|
9,038
|
|
$
|
9,632
|
|
|||
Puerto Rico
Net Par Outstanding
|
As of
December 31, 2016 |
As of
December 31, 2015 |
||||||
|
|
(in millions)
|
||||||
|
Commonwealth Constitutionally Guaranteed
|
|||||||
|
Commonwealth of Puerto Rico - General Obligation Bonds (1)
|
$
|
1,476
|
|
$
|
1,615
|
|
|
|
Puerto Rico Public Buildings Authority (1)
|
169
|
|
188
|
|
|||
|
Public Corporations - Certain Revenues Potentially Subject to Clawback
|
|||||||
|
PRHTA (Transportation revenue) (1) (2)
|
918
|
|
909
|
|
|||
|
PRHTA (Highways revenue)
|
350
|
|
370
|
|
|||
|
PRCCDA
|
152
|
|
164
|
|
|||
|
PRIFA (1)
|
18
|
|
18
|
|
|||
|
Other Public Corporations
|
|||||||
|
PREPA
|
724
|
|
744
|
|
|||
|
PRASA
|
373
|
|
388
|
|
|||
|
MFA
|
334
|
|
387
|
|
|||
|
COFINA
|
271
|
|
269
|
|
|||
|
U of PR
|
1
|
|
1
|
|
|||
|
Total net exposure to Puerto Rico
|
$
|
4,786
|
|
$
|
5,053
|
|
|
(1) As of the date of this filing, the Company has paid claims on these credits.
(2) The
December 31, 2016
amount includes
$46 million
of net par from the CIFG Acquisition.
160
The following table shows the scheduled amortization of the insured general obligation bonds of Puerto Rico and various obligations of its related authorities and public corporations. The Company guarantees payments of interest and principal when those amounts are scheduled to be paid and cannot be required to pay on an accelerated basis. In the event that obligors default on their obligations, the Company would only be required to pay the shortfall between the principal and interest due in any given period and the amount paid by the obligors.
Amortization Schedule of Puerto Rico Net Par Outstanding
and Net Debt Service Outstanding
As of
December 31, 2016
|
Scheduled Net Par Amortization
|
Scheduled Net Debt Service Amortization
|
||||||
|
(in millions)
|
|||||||
|
2017 (January 1 - March 31)
|
$
|
0
|
|
$
|
118
|
|
|
|
2017 (April 1 - June 30)
|
0
|
|
2
|
|
|||
|
2017 (July 1 - September 30)
|
220
|
|
339
|
|
|||
|
2017 (October 1 - December 31)
|
0
|
|
2
|
|
|||
|
Subtotal 2017
|
220
|
|
461
|
|
|||
|
2018
|
175
|
|
408
|
|
|||
|
2019
|
206
|
|
429
|
|
|||
|
2020
|
266
|
|
480
|
|
|||
|
2021
|
125
|
|
326
|
|
|||
|
2022-2026
|
869
|
|
1,759
|
|
|||
|
2027-2031
|
889
|
|
1,534
|
|
|||
|
2032-2036
|
1,201
|
|
1,612
|
|
|||
|
2037-2041
|
417
|
|
588
|
|
|||
|
2042-2047
|
418
|
|
492
|
|
|||
|
Total
|
$
|
4,786
|
|
$
|
8,089
|
|
|
Exposure to the Selected European Countries
The European countries where the Company has exposure and believes heightened uncertainties exist are: Hungary, Italy, Portugal, Spain and Turkey (collectively, the Selected European Countries). The Company added Turkey to its list of Selected European Countries in 2016, as a result of the recent political turmoil in the country. The Company’s direct economic exposure to the Selected European Countries (based on par for financial guaranty contracts and notional amount for financial guaranty contracts accounted for as derivatives) is shown in the following table, net of ceded reinsurance.
161
Net Direct Economic Exposure to Selected European Countries(1)
As of December 31, 2016
|
|
Hungary
|
Italy
|
Portugal
|
Spain
|
Turkey
|
Total
|
|||||||||||||||||
|
|
(in millions)
|
||||||||||||||||||||||
|
Sub-sovereign exposure(2)
|
$
|
236
|
|
$
|
880
|
|
$
|
76
|
|
$
|
342
|
|
$
|
—
|
|
$
|
1,534
|
|
|||||
|
Non-sovereign exposure(3)
|
114
|
|
399
|
|
—
|
|
—
|
|
202
|
|
715
|
|
|||||||||||
|
Total
|
$
|
350
|
|
$
|
1,279
|
|
$
|
76
|
|
$
|
342
|
|
$
|
202
|
|
$
|
2,249
|
|
|||||
|
Total BIG (See Note 5)
|
$
|
283
|
|
$
|
—
|
|
$
|
76
|
|
$
|
342
|
|
$
|
—
|
|
$
|
701
|
|
|||||
____________________
|
(1)
|
While exposures are shown in U.S. dollars, the obligations are in various currencies, primarily euros.
|
|
(2)
|
Sub-sovereign exposure in Selected European Countries includes transactions backed by receivables from, or supported by, sub-sovereigns, which are governmental or government-backed entities other than the ultimate governing body of the country.
|
|
(3)
|
Non-sovereign exposure in Selected European Countries includes debt of regulated utilities, RMBS and diversified payment rights (DPR) securitizations.
|
When the Company directly insures an obligation, it assigns the obligation to a geographic location or locations based on its view of the geographic location of the risk. The Company may also have direct exposures to the Selected European Countries in business assumed from unaffiliated monoline insurance companies, in which case the Company depends upon geographic information provided by the primary insurer.
The Company's
$202 million
net insured par exposure in Turkey is to DPR securitizations sponsored by a major Turkish bank. These DPR securitizations were established outside of Turkey and involve payment orders in U.S. dollars, pounds sterling and Euros from persons outside of Turkey to beneficiaries in Turkey who are customers of the sponsoring bank. The sponsoring bank's correspondent banks have agreed to remit all such payments to a trustee-controlled account outside Turkey, where debt service payments for the DPR securitization are given priority over payments to the sponsoring bank.
The Company has excluded from the exposure tables above its indirect economic exposure to the Selected European Countries through policies it provides on pooled corporate and commercial receivables transactions. The Company calculates indirect exposure to a country by multiplying the par amount of a transaction insured by the Company times the percent of the relevant collateral pool reported as having a nexus to the country.
On that basis, the Company has calculated exposure of
$115 million
to Selected European Countries (plus Greece) in transactions with
$2.8 billion
of net par outstanding. The indirect exposure to credits with a nexus to Greece is
$3 million
across several highly rated pooled corporate obligations with net par outstanding of
$129 million
.
|
5.
|
Expected Loss to be Paid
|
The insured portfolio includes policies accounted for under three separate accounting models depending on the characteristics of the contract and the Company's control rights. The Company has paid and expects to pay future losses on policies which fall under each of the three accounting models. The following provides a summarized description of the three accounting models prescribed by GAAP with a reference to the notes that describe the accounting policies and required disclosures throughout this report. The three models are: (1) insurance, (2) derivative and (3) VIE consolidation.
In order to effectively evaluate and manage the economics and liquidity of the entire insured portfolio, management compiles and analyzes loss information for all policies on a consistent basis. The Company monitors and assigns ratings and calculates expected losses in the same manner for all its exposures regardless of form or differing accounting models.
This note provides information regarding expected claim payments to be made under all contracts in the insured portfolio, regardless of the accounting model. Net expected loss to be paid in the tables below consists of the present value of future: expected claim and LAE payments, expected recoveries in the transaction structures, cessions to reinsurers, and expected recoveries for breaches of representations and warranties (R&W) and other loss mitigation strategies. Expected loss to be paid is important from a liquidity perspective in that it represents the present value of amounts that the Company expects to
162
pay or recover in future periods, regardless of the accounting model. Expected loss to be paid is an important measure used by management to analyze the net economic loss on all contracts.
Accounting Policy
Insurance Accounting
For contracts accounted for as financial guaranty insurance, loss and LAE reserve is recorded only to the extent and for the amount that expected losses to be paid, exceed unearned premium reserve. As a result, the Company has expected loss to be paid that have not yet been expensed. Such amounts will be recognized in future periods as deferred premium revenue amortizes into income. Expected loss to be expensed is important because it represents the Company's projection of incurred losses that will be recognized in future periods (excluding accretion of discount). See "Financial Guaranty Insurance Losses" in Note 6, Contracts Accounted for as Insurance.
Derivative Accounting, at Fair Value
For contracts that do not meet the financial guaranty scope exception in the derivative accounting guidance (primarily due to the fact that the insured is not required to be exposed to the insured risk throughout the life of the contract), the Company records such credit derivative contracts at fair value on the consolidated balance sheet with changes in fair value recorded in the consolidated statement of operations. The fair value recorded on the balance sheet represents an exit price in a hypothetical market because the Company does not trade its credit derivative contracts. The fair value is determined using significant Level 3 inputs in an internally developed model while the expected loss to be paid (which represents the net present value of expected cash outflows) uses methodologies and assumptions consistent with financial guaranty insurance expected losses to be paid. See Note 7, Fair Value Measurement and Note 8, Contracts Accounted for as Credit Derivatives.
VIE Consolidation, at Fair Value
For financial guaranty (FG) insurance contracts issued on the debt of variable interest entities over which the Company is deemed to be the primary beneficiary due to its control rights, as defined in GAAP, the Company consolidates the FG VIE. The Company carries the assets and liabilities of the FG VIEs at fair value under the fair value option. Management assesses the expected losses on the insured debt of the consolidated FG VIEs in the same manner as other financial guaranty insurance and credit derivative contracts. See Note 9, Consolidated Variable Interest Entities.
Expected Loss to be Paid
The expected loss to be paid is equal to the present value of expected future cash outflows for claim and LAE payments, net of inflows for expected salvage and subrogation (e.g., excess spread on the underlying collateral, and expected and contractual recoveries for breaches of R&W or other expected recoveries), using current risk-free rates. When the Company becomes entitled to the cash flow from the underlying collateral of an insured credit under salvage and subrogation rights as a result of a claim payment or estimated future claim payment, it reduces the expected loss to be paid on the contract. Net expected loss to be paid is defined as expected loss to be paid, net of amounts ceded to reinsurers.
The Company updates the discount rate each quarter and reflects the effect of such changes in economic loss development. Expected cash outflows and inflows are probability weighted cash flows that reflect the likelihood of all possible outcomes. The Company estimates the expected cash outflows and inflows using management's assumptions about the likelihood of all possible outcomes based on all information available to it. Those assumptions consider the relevant facts and circumstances and are consistent with the information tracked and monitored through the Company's risk-management activities.
Economic Loss Development
Economic loss development represents the change in net expected loss to be paid attributable to the effects of changes in assumptions based on observed market trends, changes in discount rates, accretion of discount and the economic effects of loss mitigation efforts.
Expected loss to be paid and economic loss development include the effects of loss mitigation strategies such as negotiated and estimated recoveries for breaches of R&W, and purchases of insured debt obligations. Additionally, in certain cases, issuers of insured obligations elected, or the Company and an issuer mutually agreed as part of a negotiation, to deliver the underlying collateral or insured obligation to the Company.
163
In circumstances where the Company has purchased its own insured obligations that have expected losses, expected loss to be paid is reduced by the proportionate share of the insured obligation that is held in the investment portfolio. The difference between the purchase price of the obligation and the fair value excluding the value of the Company's insurance is treated as a paid loss. Assets that are purchased by the Company are recorded in the investment portfolio, at fair value, excluding the value of the Company's insurance. See Note 10, Investments and Cash and Note 7, Fair Value Measurement.
Loss Estimation Process
The Company’s loss reserve committees estimate expected loss to be paid for all contracts by reviewing analyses that consider various scenarios with corresponding probabilities assigned to them. Depending upon the nature of the risk, the Company’s view of the potential size of any loss and the information available to the Company, that analysis may be based upon individually developed cash flow models, internal credit rating assessments and sector-driven loss severity assumptions or judgmental assessments. In the case of its assumed business, the Company may conduct its own analysis as just described or, depending on the Company’s view of the potential size of any loss and the information available to the Company, the Company may use loss estimates provided by ceding insurers. The Company monitors the performance of its transactions with expected losses and each quarter the Company’s loss reserve committees review and refresh their loss projection assumptions and scenarios and the probabilities they assign to those scenarios based on actual developments during the quarter and their view of future performance.
The financial guaranties issued by the Company insure the credit performance of the guaranteed obligations over an extended period of time, in some cases over
30 years
, and in most circumstances the Company has no right to cancel such financial guaranties. As a result, the Company's estimate of ultimate losses on a policy is subject to significant uncertainty over the life of the insured transaction. Credit performance can be adversely affected by economic, fiscal and financial market variability over the long life of most contracts.
The determination of expected loss to be paid is an inherently subjective process involving numerous estimates, assumptions and judgments by management, using both internal and external data sources with regard to frequency, severity of loss, economic projections, governmental actions, negotiations and other factors that affect credit performance. These estimates, assumptions and judgments, and the factors on which they are based, may change materially over a reporting period, and as a result the Company’s loss estimates may change materially over that same period.
Changes in the Company’s loss estimates for structured finance transactions generally will be influenced by factors impacting the performance of the assets supporting those transactions. For example, changes over a reporting period in the Company’s loss estimates for its RMBS transactions may be influenced by such factors as the level and timing of loan defaults experienced; changes in housing prices; results from the Company's loss mitigation activities; and other variables.
Similarly, changes over a reporting period in the Company’s loss estimates for municipal obligations supported by specified revenue streams, such as revenue bonds issued by toll road authorities, municipal utilities or airport authorities, generally will be influenced by factors impacting their revenue levels, such as changes in demand; changing demographics; and other economic factors, especially if the obligations do not benefit from financial support from other tax revenues or governmental authorities. Changes over a reporting period in the Company’s loss estimates for its tax-supported public finance transactions generally will be influenced by factors impacting the public issuer’s ability and willingness to pay, such as changes in the economy and population of the relevant area; changes in the issuer’s ability or willingness to raise taxes, decrease spending or receive federal assistance; new legislation; rating agency downgrades that reduce the issuer’s ability to refinance maturing obligations or issue new debt at a reasonable cost; changes in the priority or amount of pensions and other obligations owed to workers; developments in restructuring or settlement negotiations; and other political and economic factors.
The Company does not use traditional actuarial approaches to determine its estimates of expected losses. Actual losses will ultimately depend on future events or transaction performance and may be influenced by many interrelated factors that are difficult to predict. As a result, the Company's current projections of probable and estimable losses may be subject to considerable volatility and may not reflect the Company's ultimate claims paid.
In some instances, the terms of the Company's policy gives it the option to pay principal losses that have been recognized in the transaction but which it is not yet required to pay, thereby reducing the amount of guaranteed interest due in the future. The Company has sometimes exercised this option, which uses cash but reduces projected future losses.
164
The following tables present a roll forward of the present value of net expected loss to be paid for all contracts, whether accounted for as insurance, credit derivatives or FG VIEs, by sector, after the benefit for expected recoveries for breaches of R&W and other expected recoveries. The Company used risk-free rates for U.S. dollar denominated obligations, that ranged from
0.0%
to
3.23%
with a weighted average of
2.73%
as of
December 31, 2016
and
0.0%
to
3.25%
with a weighted average of
2.36%
as of
December 31, 2015
.
Net Expected Loss to be Paid
Roll Forward
|
Year Ended December 31,
|
|||||||
|
|
2016
|
2015
|
|||||
|
|
(in millions)
|
||||||
|
Net expected loss to be paid, beginning of period
|
$
|
1,391
|
|
$
|
1,169
|
|
|
|
Net expected loss to be paid on the CIFGH portfolio as of July 1, 2016
|
22
|
|
—
|
|
|||
|
Net expected loss to be paid on Radian Asset portfolio as of April 1, 2015
|
—
|
|
190
|
|
|||
|
Economic loss development due to:
|
|||||||
|
Accretion of discount
|
26
|
|
32
|
|
|||
|
Changes in discount rates
|
(15
|
)
|
(23
|
)
|
|||
|
Changes in timing and assumptions
|
128
|
|
310
|
|
|||
|
Total economic loss development
|
139
|
|
319
|
|
|||
|
Paid losses
|
(354
|
)
|
(287
|
)
|
|||
|
Net expected loss to be paid, end of period
|
$
|
1,198
|
|
$
|
1,391
|
|
|
Net Expected Loss to be Paid
Roll Forward by Sector
Year Ended December 31,
2016
|
|
Net Expected
Loss to be
Paid (Recovered) as of
December 31, 2015(2)
|
Net Expected
Loss to be Paid (Recovered) on CIFG as of July 1, 2016 |
Economic Loss
Development
|
(Paid)
Recovered
Losses (1)
|
Net Expected
Loss to be Paid (Recovered) as of December 31, 2016 (2) |
||||||||||||||
|
|
(in millions)
|
||||||||||||||||||
|
Public finance:
|
|||||||||||||||||||
|
U.S. public finance
|
$
|
771
|
|
$
|
40
|
|
$
|
276
|
|
$
|
(216
|
)
|
$
|
871
|
|
||||
|
Non-U.S. public finance
|
38
|
|
2
|
|
(7
|
)
|
—
|
|
33
|
|
|||||||||
|
Public finance
|
809
|
|
42
|
|
269
|
|
(216
|
)
|
904
|
|
|||||||||
|
Structured finance:
|
|||||||||||||||||||
|
U.S. RMBS
|
409
|
|
(22
|
)
|
(91
|
)
|
(90
|
)
|
206
|
|
|||||||||
|
Triple-X life insurance transactions
|
99
|
|
—
|
|
(22
|
)
|
(23
|
)
|
54
|
|
|||||||||
|
Other structured finance
|
74
|
|
2
|
|
(17
|
)
|
(25
|
)
|
34
|
|
|||||||||
|
Structured finance
|
582
|
|
(20
|
)
|
(130
|
)
|
(138
|
)
|
294
|
|
|||||||||
|
Total
|
$
|
1,391
|
|
$
|
22
|
|
$
|
139
|
|
$
|
(354
|
)
|
$
|
1,198
|
|
||||
165
Net Expected Loss to be Paid
Roll Forward by Sector
Year Ended December 31,
2015
|
|
Net Expected
Loss to be
Paid (Recovered) as of
December 31, 2014
|
Net Expected
Loss to be Paid (Recovered) on Radian Asset portfolio as of April 1, 2015 |
Economic Loss
Development
|
(Paid)
Recovered
Losses (1)
|
Net Expected
Loss to be Paid (Recovered) as of December 31, 2015 (2) |
||||||||||||||
|
|
(in millions)
|
||||||||||||||||||
|
Public finance:
|
|||||||||||||||||||
|
U.S. public finance
|
$
|
303
|
|
$
|
81
|
|
$
|
416
|
|
$
|
(29
|
)
|
$
|
771
|
|
||||
|
Non-U.S. public finance
|
45
|
|
4
|
|
(11
|
)
|
—
|
|
38
|
|
|||||||||
|
Public finance
|
348
|
|
85
|
|
405
|
|
(29
|
)
|
809
|
|
|||||||||
|
Structured finance:
|
|||||||||||||||||||
|
U.S. RMBS
|
584
|
|
4
|
|
(82
|
)
|
(97
|
)
|
409
|
|
|||||||||
|
Triple-X life insurance transactions
|
161
|
|
—
|
|
11
|
|
(73
|
)
|
99
|
|
|||||||||
|
Other structured finance
|
76
|
|
101
|
|
(15
|
)
|
(88
|
)
|
74
|
|
|||||||||
|
Structured finance
|
821
|
|
105
|
|
(86
|
)
|
(258
|
)
|
582
|
|
|||||||||
|
Total
|
$
|
1,169
|
|
$
|
190
|
|
$
|
319
|
|
$
|
(287
|
)
|
$
|
1,391
|
|
||||
____________________
|
(1)
|
Net of ceded paid losses, whether or not such amounts have been settled with reinsurers. Ceded paid losses are typically settled
45 days
after the end of the reporting period. Such amounts are recorded in reinsurance recoverable on paid losses included in other assets. The Company paid
$16 million
and
$25 million
in LAE for the years ended
December 31, 2016
and
2015
, respectively.
|
|
(2)
|
Includes expected LAE to be paid of
$12 million
as of
December 31, 2016
and
$12 million
as of
December 31, 2015
.
|
Future Net R&W Recoverable (Payable)(1)
|
|
Future Net
R&W Benefit as of December 31, 2016 |
Future Net
R&W Benefit as of December 31, 2015 |
Future Net
R&W Benefit as of December 31, 2014 |
||||||||
|
|
(in millions)
|
||||||||||
|
U.S. RMBS:
|
|||||||||||
|
First lien
|
$
|
(53
|
)
|
$
|
0
|
|
$
|
232
|
|
||
|
Second lien
|
47
|
|
79
|
|
85
|
|
|||||
|
Total
|
$
|
(6
|
)
|
$
|
79
|
|
$
|
317
|
|
||
____________________
|
(1)
|
The Company’s agreements with R&W providers generally provide that, as the Company makes claim payments, the R&W providers reimburse it for those claims; if the Company later receives reimbursement through the transaction (for example, from excess spread), the Company repays the R&W providers.
See the section “Breaches of Representations and Warranties” for information about the R&W agreements.
When the Company projects receiving more reimbursements in the future than it projects paying in claims on transactions covered by R&W settlement agreements, the Company will have a net R&W payable.
|
166
The following table presents the present value of net expected loss to be paid for all contracts by accounting model, by sector and after the benefit for expected recoveries for breaches of R&W.
Net Expected Loss to be Paid (Recovered)
By Accounting Model
|
As of December 31, 2016
|
As of December 31, 2015
|
||||||||||||||||||||||
|
|
Public Finance
|
Structured Finance
|
Total
|
Public Finance
|
Structured Finance
|
Total
|
|||||||||||||||||
|
|
(in millions)
|
||||||||||||||||||||||
|
Financial guaranty insurance
|
$
|
904
|
|
$
|
179
|
|
$
|
1,083
|
|
$
|
809
|
|
$
|
430
|
|
$
|
1,239
|
|
|||||
|
FG VIEs (1) and other
|
—
|
|
105
|
|
105
|
|
—
|
|
136
|
|
136
|
|
|||||||||||
|
Credit derivatives (2)
|
0
|
|
10
|
|
10
|
|
—
|
|
16
|
|
16
|
|
|||||||||||
|
Total
|
$
|
904
|
|
$
|
294
|
|
$
|
1,198
|
|
$
|
809
|
|
$
|
582
|
|
$
|
1,391
|
|
|||||
___________
(1) Refer to Note 9, Consolidated Variable Interest Entities.
(2) Refer to Note 8, Contracts Accounted for as Credit Derivatives.
The following table presents the net economic loss development for all contracts by accounting model, by sector and after the benefit for expected recoveries for breaches of R&W.
Net Economic Loss Development (Benefit)
By Accounting Model
|
Year Ended December 31, 2016
|
Year Ended December 31, 2015
|
||||||||||||||||||||||
|
|
Public Finance
|
Structured Finance
|
Total
|
Public Finance
|
Structured Finance
|
Total
|
|||||||||||||||||
|
|
(in millions)
|
||||||||||||||||||||||
|
Financial guaranty insurance
|
$
|
269
|
|
$
|
(105
|
)
|
$
|
164
|
|
$
|
410
|
|
$
|
(25
|
)
|
$
|
385
|
|
|||||
|
FG VIEs (1) and other
|
—
|
|
(8
|
)
|
(8
|
)
|
—
|
|
16
|
|
16
|
|
|||||||||||
|
Credit derivatives (2)
|
—
|
|
(17
|
)
|
(17
|
)
|
(5
|
)
|
(77
|
)
|
(82
|
)
|
|||||||||||
|
Total
|
$
|
269
|
|
$
|
(130
|
)
|
$
|
139
|
|
$
|
405
|
|
$
|
(86
|
)
|
$
|
319
|
|
|||||
__________
(1) Refer to Note 9, Consolidated Variable Interest Entities.
(2) Refer to Note 8, Contracts Accounted for as Credit Derivatives.
Selected U.S. Public Finance Transactions
The Company insures general obligation bonds of the Commonwealth of Puerto Rico and various obligations of its related authorities and public corporations aggregating
$4.8 billion
net par as of
December 31, 2016
, all of which are BIG. For additional information regarding the Company's exposure to general obligations of Commonwealth of Puerto Rico and various obligations of its related authorities and public corporations, please refer to "Exposure to Puerto Rico" in Note 4, Outstanding Exposure.
On February 25, 2015, a plan of adjustment resolving the bankruptcy filing of the City of Stockton, California under chapter 9 of the U.S. Bankruptcy Code became effective. As of
December 31, 2016
, the Company’s net par subject to the plan consists of
$113 million
of pension obligation bonds. As part of the plan settlement, the City will repay the pension obligation bonds from certain fixed payments and certain variable payments contingent on the City's revenue growth.
The Company projects that its total net expected loss across its troubled U.S. public finance credits as of
December 31, 2016
, including those mentioned above, which incorporated the likelihood of the various outcomes, will be
$871 million
,
167
compared with a net expected loss of
$771 million
as of
December 31, 2015
. On July 1, 2016, the CIFG Acquisition added
$40 million
in net economic losses to be paid for U.S. public finance credits. Economic loss development in
2016
was
$276 million
, which was primarily attributable to Puerto Rico exposures.
Certain Selected European Country Sub-Sovereign Transactions
The Company insures and reinsures credits with sub-sovereign exposure to various Spanish and Portuguese issuers where a Spanish and Portuguese sovereign default may cause the sub-sovereigns also to default. The Company's exposure net of reinsurance to these Spanish and Portuguese credits is
$342 million
and
$76 million
, respectively. The Company rates most of these issuers BIG due to the financial condition of Spain and Portugal and their dependence on the sovereign. The Company's Hungary exposure is to infrastructure bonds dependent on payments from Hungarian governmental entities. The Company's exposure net of reinsurance to these Hungarian credits is
$236 million
, all of which is rated BIG. The Company estimated net expected losses of
$29 million
related to these Spanish, Portuguese and Hungarian credits. The economic benefit of approximately
$7 million
during
2016
was primarily related to changes in the exchange rate between the euro and U.S. Dollar.
Approach to Projecting Losses in U.S. RMBS
The Company projects losses on its insured U.S. RMBS on a transaction-by-transaction basis by projecting the performance of the underlying pool of mortgages over time and then applying the structural features (i.e., payment priorities and tranching) of the RMBS and any R&W agreements to the projected performance of the collateral over time. The resulting projected claim payments or reimbursements are then discounted using risk-free rates.
The further behind a mortgage borrower falls in making payments, the more likely it is that he or she will default. The rate at which borrowers from a particular delinquency category (number of monthly payments behind) eventually default is referred to as the “liquidation rate.” The Company derives its liquidation rate assumptions from observed roll rates, which are the rates at which loans progress from one delinquency category to the next and eventually to default and liquidation. The Company applies liquidation rates to the mortgage loan collateral in each delinquency category and makes certain timing assumptions to project near-term mortgage collateral defaults from loans that are currently delinquent.
Mortgage borrowers that are not more than
one
payment behind (generally considered performing borrowers) have demonstrated an ability and willingness to pay throughout the recession and mortgage crisis, and as a result are viewed as less likely to default than delinquent borrowers. Performing borrowers that eventually default will also need to progress through delinquency categories before any defaults occur. The Company projects how many of the currently performing loans will default and when they will default, by first converting the projected near term defaults of delinquent borrowers derived from liquidation rates into a vector of conditional default rates (CDR), then projecting how the CDR will develop over time. Loans that are defaulted pursuant to the CDR after the near-term liquidation of currently delinquent loans represent defaults of currently performing loans and projected re-performing loans. A CDR is the outstanding principal amount of defaulted loans liquidated in the current month divided by the remaining outstanding amount of the whole pool of loans (or “collateral pool balance”). The collateral pool balance decreases over time as a result of scheduled principal payments, partial and whole principal prepayments, and defaults.
In order to derive collateral pool losses from the collateral pool defaults it has projected, the Company applies a loss severity. The loss severity is the amount of loss the transaction experiences on a defaulted loan after the application of net proceeds from the disposal of the underlying property. The Company projects loss severities by sector based on its experience to date. The Company continues to update its evaluation of these loss severities as new information becomes available.
The Company has been enforcing claims for breaches of R&W regarding the characteristics of the loans included in the collateral pools. The Company calculates a credit for R&W recoveries to include in its cash flow projections. Where the Company has an agreement with an R&W provider (such as its agreements with Bank of America and UBS, which are described in more detail under "Breaches of Representations and Warranties" below), that credit is based on the agreement. Where the Company does not have an agreement with the R&W provider but the Company believes the R&W provider to be economically viable, the Company estimates what portion of its past and projected future claims it believes will be reimbursed by that provider.
The Company projects the overall future cash flow from a collateral pool by adjusting the payment stream from the principal and interest contractually due on the underlying mortgages for the collateral losses it projects as described above; assumed voluntary prepayments; and servicer advances. The Company then applies an individual model of the structure of the transaction to the projected future cash flow from that transaction’s collateral pool to project the Company’s future claims and
168
claim reimbursements for that individual transaction. Finally, the projected claims and reimbursements are discounted using risk-free rates. The Company runs several sets of assumptions regarding mortgage collateral performance, or scenarios, and probability weights them.
The Company's RMBS loss projection methodology assumes that the housing and mortgage markets will continue improving. Each period the Company makes a judgment as to whether to change the assumptions it uses to make RMBS loss projections based on its observation during the period of the performance of its insured transactions (including early stage delinquencies, late stage delinquencies and loss severity) as well as the residential property market and economy in general, and, to the extent it observes changes, it makes a judgment as whether those changes are normal fluctuations or part of a trend.
Year-End 2016 Compared to Year-End 2015 U.S. RMBS Loss Projections
Based on its observation during the period of the performance of its insured transactions (including early stage delinquencies, late stage delinquencies and loss severity) as well as the residential property market and economy in general, the Company chose to use the same general assumptions to project RMBS losses as of December 31, 2016 as it used as of December 31, 2015, except it (1) increased severities for specific vintages of Alt-A first lien, Option ARM and subprime transactions, (2) decreased liquidation rates for specific non-performing categories of subprime transactions and Option ARM and (3) increased liquidation rates for specific non-performing categories of second lien transactions. In
2016
the economic benefit was
$68 million
for first lien U.S. RMBS and
$23 million
for second lien U.S. RMBS.
Year-End 2015 Compared to Year-End 2014 U.S. RMBS Loss Projections
Based on its observation during the period of the performance of its insured transactions (including early stage delinquencies, late stage delinquencies and loss severity) as well as the residential property market and economy in general, the Company chose to use the same general assumptions to project RMBS losses as of December 31, 2015 as it used as of December 31, 2014, except that, for its first lien RMBS loss projections for 2015, it shortened by
twelve
months the period it is projecting it will take in the base case to reach the final CDR as compared with December 31, 2014. The methodology and revised assumptions the Company used to project first lien RMBS losses and the scenarios it employed are described in more detail below under " - U.S. First Lien RMBS Loss Projections: Alt A First Lien, Option ARM, Subprime and Prime", and the methodology and assumptions the Company uses to project second lien RMBS losses and the scenarios it employs are described in more detail below under " - U.S. Second Lien RMBS Loss Projections." In
2015
the economic benefit was
$124 million
for first lien U.S. RMBS and loss development was
$42 million
for second lien U.S. RMBS.
U.S. First Lien RMBS Loss Projections: Alt-A First Lien, Option ARM, Subprime and Prime
The majority of projected losses in first lien RMBS transactions are expected to come from non-performing mortgage loans (those that are or in the past twelve months have been
two
or more payments behind, have been modified, are in foreclosure, or have been foreclosed upon). Changes in the amount of non-performing loans from the amount projected in the previous period are one of the primary drivers of loss development in this portfolio. In order to determine the number of defaults resulting from these delinquent and foreclosed loans, the Company applies a liquidation rate assumption to loans in each of various non-performing categories. The Company arrived at its liquidation rates based on data purchased from a third party provider and assumptions about how delays in the foreclosure process and loan modifications may ultimately affect the rate at which loans are liquidated. Each quarter the Company reviews the most recent
twelve
months of this data and (if necessary) adjusts its liquidation rates based on its observations. The following table shows liquidation assumptions for various non-performing categories.
169
First Lien Liquidation Rates
|
December 31, 2016
|
December 31, 2015
|
December 31, 2014
|
|||
|
Current Loans Modified in the Previous 12 Months
|
|||||
|
Alt-A and Prime
|
25%
|
25%
|
25%
|
||
|
Option ARM
|
25
|
25
|
25
|
||
|
Subprime
|
25
|
25
|
25
|
||
|
Current Loans Delinquent in the Previous 12 Months
|
|||||
|
Alt-A and Prime
|
25
|
25
|
25
|
||
|
Option ARM
|
25
|
25
|
25
|
||
|
Subprime
|
25
|
25
|
25
|
||
|
30 – 59 Days Delinquent
|
|
||||
|
Alt-A and Prime
|
35
|
35
|
35
|
||
|
Option ARM
|
35
|
40
|
40
|
||
|
Subprime
|
40
|
45
|
35
|
||
|
60 – 89 Days Delinquent
|
|||||
|
Alt-A and Prime
|
45
|
45
|
50
|
||
|
Option ARM
|
50
|
50
|
55
|
||
|
Subprime
|
50
|
55
|
40
|
||
|
90+ Days Delinquent
|
|||||
|
Alt-A and Prime
|
55
|
55
|
60
|
||
|
Option ARM
|
55
|
60
|
65
|
||
|
Subprime
|
55
|
60
|
55
|
||
|
Bankruptcy
|
|||||
|
Alt-A and Prime
|
45
|
45
|
45
|
||
|
Option ARM
|
50
|
50
|
50
|
||
|
Subprime
|
40
|
40
|
40
|
||
|
Foreclosure
|
|||||
|
Alt-A and Prime
|
65
|
65
|
75
|
||
|
Option ARM
|
65
|
70
|
80
|
||
|
Subprime
|
65
|
70
|
70
|
||
|
Real Estate Owned
|
|||||
|
All
|
100
|
100
|
100
|
||
While the Company uses liquidation rates as described above to project defaults of non-performing loans (including current loans modified or delinquent within the last 12 months), it projects defaults on presently current loans by applying a CDR trend. The start of that CDR trend is based on the defaults the Company projects will emerge from currently nonperforming, recently nonperforming and modified loans. The total amount of expected defaults from the non-performing loans is translated into a constant CDR (
i.e
., the CDR plateau), which, if applied for each of the next
36
months, would be sufficient to produce approximately the amount of defaults that were calculated to emerge from the various delinquency categories. The CDR thus calculated individually on the delinquent collateral pool for each RMBS is then used as the starting point for the CDR curve used to project defaults of the presently performing loans.
In the base case, after the initial
36
-month CDR plateau period, each transaction’s CDR is projected to improve over
12
months to an intermediate CDR (calculated as
20%
of its CDR plateau); that intermediate CDR is held constant for
36
months and then trails off in steps to a final CDR of
5%
of the CDR plateau. In the base case, the Company assumes the final CDR will be reached
6.5 years
after the initial
36
-month CDR plateau period. Under the Company’s methodology, defaults projected to occur in the first
36
months represent defaults that can be attributed to loans that were modified or delinquent in the last 12 months or that are currently delinquent or in foreclosure, while the defaults projected to occur using the projected CDR trend after the first
36
month period represent defaults attributable to borrowers that are currently performing or are projected to reperform.
170
Another important driver of loss projections is loss severity, which is the amount of loss the transaction incurs on a loan after the application of net proceeds from the disposal of the underlying property. Loss severities experienced in first lien transactions have reached historically high levels, and the Company is assuming in the base case that these high levels generally will continue for another
18
months. The Company determines its initial loss severity based on actual recent experience. As a result, the Company updated severities for specific asset classes and vintages based on observed data, as shown in the tables below. The Company then assumes that loss severities begin returning to levels consistent with underwriting assumptions beginning after the initial
18
month period, declining to
40%
in the base case over
2.5 years
.
The following table shows the range as well as the average, weighted by outstanding net insured par, for key assumptions used in the calculation of expected loss to be paid for individual transactions for direct vintage 2004 - 2008 first lien U.S. RMBS.
Key Assumptions in Base Case Expected Loss Estimates
First Lien RMBS(1)
|
|
As of
December 31, 2016 |
As of
December 31, 2015 |
As of
December 31, 2014 |
|||||||||||||||||
|
Range
|
Weighted Average
|
Range
|
Weighted Average
|
Range
|
Weighted Average
|
|||||||||||||||
|
Alt-A First Lien
|
|
|||||||||||||||||||
|
Plateau CDR
|
1.0
|
%
|
–
|
13.5%
|
5.7%
|
1.7
|
%
|
–
|
26.4%
|
6.4%
|
2.0
|
%
|
–
|
13.4%
|
7.3%
|
|||||
|
Final CDR
|
0.0
|
%
|
–
|
0.7%
|
0.3%
|
0.1
|
%
|
–
|
1.3%
|
0.3%
|
0.1
|
%
|
–
|
0.7%
|
0.3%
|
|||||
|
Initial loss severity:
|
||||||||||||||||||||
|
2005 and prior
|
60.0%
|
60.0%
|
60.0%
|
|||||||||||||||||
|
2006
|
80.0%
|
70.0%
|
70.0%
|
|||||||||||||||||
|
2007
|
70.0%
|
65.0%
|
65.0%
|
|||||||||||||||||
|
Option ARM
|
|
|
||||||||||||||||||
|
Plateau CDR
|
3.2
|
%
|
–
|
7.0%
|
5.6%
|
3.5
|
%
|
–
|
10.3%
|
7.8%
|
4.3
|
%
|
–
|
14.2%
|
10.6%
|
|||||
|
Final CDR
|
0.2
|
%
|
–
|
0.3%
|
0.3%
|
0.2
|
%
|
–
|
0.5%
|
0.4%
|
0.2
|
%
|
–
|
0.7%
|
0.5%
|
|||||
|
Initial loss severity:
|
||||||||||||||||||||
|
2005 and prior
|
60.0%
|
60.0%
|
60.0%
|
|||||||||||||||||
|
2006
|
70.0%
|
70.0%
|
70.0%
|
|||||||||||||||||
|
2007
|
75.0%
|
65.0%
|
65.0%
|
|||||||||||||||||
|
Subprime
|
|
|||||||||||||||||||
|
Plateau CDR
|
2.8
|
%
|
–
|
14.1%
|
8.1%
|
4.7
|
%
|
–
|
13.2%
|
9.5%
|
4.9
|
%
|
–
|
15.0%
|
10.6%
|
|||||
|
Final CDR
|
0.1
|
%
|
–
|
0.7%
|
0.4%
|
0.2
|
%
|
–
|
0.7%
|
0.4%
|
0.2
|
%
|
–
|
0.7%
|
0.4%
|
|||||
|
Initial loss severity:
|
||||||||||||||||||||
|
2005 and prior
|
80.0%
|
75.0%
|
75.0%
|
|||||||||||||||||
|
2006
|
90.0%
|
90.0%
|
90.0%
|
|||||||||||||||||
|
2007
|
90.0%
|
90.0%
|
90.0%
|
|||||||||||||||||
____________________
(1)
Represents variables for most heavily weighted scenario (the “base case”).
The rate at which the principal amount of loans is voluntarily prepaid may impact both the amount of losses projected (since that amount is a function of the CDR, the loss severity and the loan balance over time) as well as the amount of excess spread (the amount by which the interest paid by the borrowers on the underlying loan exceeds the amount of interest owed on the insured obligations). The assumption for the voluntary conditional prepayment rate (CPR) follows a similar pattern to that of the CDR. The current level of voluntary prepayments is assumed to continue for the plateau period before gradually increasing over
12
months to the final CPR, which is assumed to be
15%
in the base case. For transactions where the initial CPR is higher than the final CPR, the initial CPR is held constant and the final CPR is not used. These CPR assumptions are the same as those the Company used for
December 31, 2015
.
In estimating expected losses, the Company modeled and probability weighted sensitivities for first lien transactions by varying its assumptions of how fast a recovery is expected to occur. One of the variables used to model sensitivities was how
171
quickly the CDR returned to its modeled equilibrium, which was defined as
5%
of the initial CDR. The Company also stressed CPR and the speed of recovery of loss severity rates. The Company probability weighted a total of
five
scenarios as of
December 31, 2016
. The Company used a similar approach to establish its pessimistic and optimistic scenarios as of
December 31, 2016
as it used as of
December 31, 2015
, increasing and decreasing the periods of stress from those used in the base case.
In the Company's most stressful scenario where loss severities were assumed to rise and then recover over
nine
years and the initial ramp-down of the CDR was assumed to occur over
15
months and other assumptions were the same as the other stress scenario, expected loss to be paid would increase from current projections by approximately
$27 million
for Alt-A first liens, $
8 million
for Option ARM,
$46 million
for subprime and $
1 million
for prime transactions.
In the Company's least stressful scenario where the CDR plateau was
six
months shorter (
30
months, effectively assuming that liquidation rates would improve) and the CDR recovery was more pronounced, (including an initial ramp-down of the CDR over
nine
months), expected loss to be paid would decrease from current projections by approximately
$13 million
for Alt-A first liens, $
22 million
for Option ARM,
$25 million
for subprime and $
0.1 million
for prime transactions.
U.S. Second Lien RMBS Loss Projections
Second lien RMBS transactions include both home equity lines of credit (HELOC) and closed end second lien. The Company believes the primary variable affecting its expected losses in second lien RMBS transactions is the amount and timing of future losses in the collateral pool supporting the transactions. Expected losses are also a function of the structure of the transaction; the voluntary prepayment rate (typically also referred to as CPR of the collateral); the interest rate environment; and assumptions about the draw rate and loss severity.
In second lien transactions the projection of near-term defaults from currently delinquent loans is relatively straightforward because loans in second lien transactions are generally “charged off” (treated as defaulted) by the securitization’s servicer once the loan is
180
days past due. The Company estimates the amount of loans that will default over the next
six
months by calculating current representative liquidation rates. A liquidation rate is the percent of loans in a given cohort (in this instance, delinquency category) that ultimately default. Similar to first liens, the Company then calculates a CDR for
six
months, which is the period over which the currently delinquent collateral is expected to be liquidated. That CDR is then used as the basis for the plateau CDR period that follows the embedded
five
months of losses.
For the base case scenario, the CDR (the plateau CDR) was held constant for
six
months. Once the plateau period has ended, the CDR is assumed to gradually trend down in uniform increments to its final long-term steady state CDR. (The long-term steady state CDR is calculated as the constant CDR that would have yielded the amount of losses originally expected at underwriting.) In the base case scenario, the time over which the CDR trends down to its final CDR is
28
months. Therefore, the total stress period for second lien transactions is
34
months, comprising
six
months of delinquent data and
28
months of decrease to the steady state CDR, the same as of
December 31, 2015
.
HELOC loans generally permit the borrower to pay only interest for an initial period (often
ten
years) and, after that period, require the borrower to make both the monthly interest payment and a monthly principal payment, and so increase the borrower's aggregate monthly payment. Some of the HELOC loans underlying the Company's insured HELOC transactions have reached their principal amortization period. The Company has observed that the increase in monthly payments occurring when a loan reaches its principal amortization period, even if mitigated by borrower relief offered by the servicer, is associated with increased borrower defaults. Thus, most of the Company's HELOC projections incorporate an assumption that a percentage of loans reaching their amortization periods will default around the time of the payment increase. These projected defaults are in addition to those generated using the CDR curve as described above. This assumption is similar to the one used as of
December 31, 2015
.
When a second lien loan defaults, there is generally a very low recovery. The Company assumed as of
December 31, 2016
that it will generally recover only
2%
of the collateral defaulting in the future and declining additional amounts of post-default receipts on previously defaulted collateral. This is the same assumption used as of
December 31, 2015
.
The rate at which the principal amount of loans is prepaid may impact both the amount of losses projected as well as the amount of excess spread. In the base case, an average CPR (based on experience of the past year) is assumed to continue until the end of the plateau before gradually increasing to the final CPR over the same period the CDR decreases. The final CPR is assumed to be
15%
for second lien transactions, which is lower than the historical average but reflects the Company’s continued uncertainty about the projected performance of the borrowers in these transactions. For transactions where the initial CPR is higher than the final CPR, the initial CPR is held constant and the final CPR is not used. This pattern is generally
172
consistent with how the Company modeled the CPR as of
December 31, 2015
. To the extent that prepayments differ from projected levels it could materially change the Company’s projected excess spread and losses.
The Company uses a number of other variables in its second lien loss projections, including the spread between relevant interest rate indices. These variables have been relatively stable and in the relevant ranges have less impact on the projection results than the variables discussed above. However, in a number of HELOC transactions the servicers have been modifying poorly performing loans from floating to fixed rates, and, as a result, rising interest rates would negatively impact the excess spread available from these modified loans to support the transactions. The Company incorporated these modifications in its assumptions.
In estimating expected losses, the Company modeled and probability weighted
five
possible CDR curves applicable to the period preceding the return to the long-term steady state CDR. The Company used
five
scenarios at
December 31, 2016
and
December 31, 2015
. The Company believes that the level of the elevated CDR and the length of time it will persist, the ultimate prepayment rate, and the amount of additional defaults because of the expiry of the interest only period, are the primary drivers behind the likely amount of losses the collateral will suffer. The Company continues to evaluate the assumptions affecting its modeling results.
The Company believes the most important driver of its projected second lien RMBS losses is the performance of its HELOC transactions. The following table shows the range as well as the average, weighted by outstanding net insured par, for key assumptions for the calculation of expected loss to be paid for individual transactions for direct vintage 2004 - 2008 HELOCs.
Key Assumptions in Base Case Expected Loss Estimates
HELOCs(1)
|
As of
December 31, 2016 |
As of
December 31, 2015 |
As of
December 31, 2014 |
||||||||||||||||||
|
Range
|
Weighted Average
|
Range
|
Weighted Average
|
Range
|
Weighted Average
|
|||||||||||||||
|
Plateau CDR
|
3.5
|
%
|
–
|
24.8%
|
13.6%
|
4.9
|
%
|
–
|
23.5%
|
10.3%
|
2.8
|
%
|
–
|
6.8%
|
4.1%
|
|||||
|
Final CDR trended down to
|
0.5
|
%
|
–
|
3.2%
|
1.3%
|
0.5
|
%
|
–
|
3.2%
|
1.2%
|
0.5
|
%
|
–
|
3.2%
|
1.2%
|
|||||
|
Liquidation rates:
|
||||||||||||||||||||
|
Current Loans Modified in the Previous 12 Months
|
25%
|
25%
|
25%
|
|||||||||||||||||
|
Current Loans Delinquent in the Previous 12 Months
|
25
|
25
|
25
|
|||||||||||||||||
|
30 – 59 Days Delinquent
|
50
|
50
|
55
|
|||||||||||||||||
|
60 – 89 Days Delinquent
|
65
|
65
|
70
|
|||||||||||||||||
|
90+ Days Delinquent
|
80
|
75
|
80
|
|||||||||||||||||
|
Bankruptcy
|
55
|
55
|
55
|
|||||||||||||||||
|
Foreclosure
|
75
|
75
|
75
|
|||||||||||||||||
|
Real Estate Owned
|
100
|
100
|
100
|
|||||||||||||||||
|
Loss severity
|
98%
|
98%
|
90
|
%
|
–
|
98%
|
90.4%
|
|||||||||||||
____________________
|
(1)
|
Represents variables for most heavily weighted scenario (the base case).
|
The Company’s base case assumed a
six
month CDR plateau and a
28
month ramp-down (for a total stress period of
34
months). The Company also modeled a scenario with a longer period of elevated defaults and another with a shorter period of elevated defaults. Increasing the CDR plateau to
eight
months and increasing the ramp-down by
three
months to
31
months (for a total stress period of
39
months), and doubling the defaults relating to the end of the interest only period would increase the expected loss by approximately
$39 million
for HELOC transactions. On the other hand, reducing the CDR plateau to
four
months and decreasing the length of the CDR ramp-down to
25
months (for a total stress period of
29
months), and lowering the ultimate prepayment rate to
10%
would decrease the expected loss by approximately
$23 million
for HELOC transactions.
173
Breaches of Representations and Warranties
The Company entered into agreements with R&W providers under which those providers made payments to the Company, agreed to make payments to the Company in the future, and / or repurchased loans from the transactions, all in return for releases of related liability by the Company. As of December 31, 2016, the Company had two such agreements remaining. Under the Company's agreement with Bank of America Corporation and certain of its subsidiaries (Bank of America), Bank of America agreed to reimburse the Company for
80%
of claims on the first lien transactions covered by the agreement that the Company pays in the future, subject to a cap the Company currently projects it will not reach. Under the Company’s agreement with UBS Real Estate Securities Inc. and affiliates (UBS), UBS agreed to reimburse the Company for
85%
of future losses on
three
first lien RMBS transactions. Bank of America and UBS have posted collateral to secure their obligations under these agreements. The Company also had an R&W reimbursement agreement with Deutsche Bank AG and certain of its affiliates (collectively, Deutsche Bank), but Deutsche Bank's reimbursement obligations under that agreement were terminated in May 2016 in return for a cash payment to the Company. The Company uses the same RMBS projection scenarios and weightings to project its future R&W benefit or payable as it uses to project RMBS losses on its portfolio.
As of
December 31, 2016
, the Company had a net R&W payable of
$6 million
to R&W counterparties, compared to an R&W recoverable of
$79 million
as of
December 31, 2015
. The decrease represents improvements in underlying collateral performance and the termination of the Deutsche Bank agreement described above, partially offset by the addition of R&W recoverable related to a RMBS insured by CIFGNA and still being pursued by the Company. The Company’s agreements with providers of R&W generally provide for reimbursement to the Company as claim payments are made and, to the extent the Company later receives reimbursements of such claims from excess spread or other sources, for the Company to provide reimbursement to the R&W providers. When the Company projects receiving more reimbursements in the future than it projects to pay in claims on transactions covered by R&W settlement agreements, the Company will have a net R&W payable.
Triple-X Life Insurance Transactions
The Company had
$2.1 billion
of net par exposure to financial guaranty Triple-X life insurance transactions as of
December 31, 2016
.
Two
of these transactions, with
$126 million
of net par outstanding, are rated BIG. The Triple-X life insurance transactions are based on discrete blocks of individual life insurance business. In older vintage Triple-X life insurance transactions, which include the
two
BIG-rated transactions, the amounts raised by the sale of the notes insured by the Company were used to capitalize a special purpose vehicle that provides reinsurance to a life insurer or reinsurer. The amounts are invested at inception in accounts managed by third-party investment managers. In the case of the two BIG-rated transactions, material amounts of their assets were invested in U.S. RMBS. Based on its analysis of the information currently available, including estimates of future investment performance, and projected credit impairments on the invested assets and performance of the blocks of life insurance business at
December 31, 2016
, the Company’s projected net expected loss to be paid is
$54 million
. The economic benefit during
2016
was approximately
$22 million
, which was due primarily to a benefit resulting from a purchase of a portion of an insured obligation to mitigate loss.
Student Loan Transactions
The Company has insured or reinsured
$1.4 billion
net par of student loan securitizations issued by private issuers and that it classifies as structured finance. Of this amount,
$109 million
is rated BIG. The Company is projecting approximately
$32 million
of net expected loss to be paid on these transactions. In general, the losses are due to: (i) the poor credit performance of private student loan collateral and high loss severities, or (ii) high interest rates on auction rate securities with respect to which the auctions have failed. The economic benefit during
2016
was approximately
$14 million
, which was driven primarily by the commutation of certain assumed student loan exposures earlier in the year.
Other structured finance
The Company's other structured finance sector has BIG net par of
$966 million
, comprising primarily transactions backed by TruPS, perpetual preferred securities, commercial receivables and manufactured housing loans. The economic benefit during
2016
was
$3 million
, which was attributable primarily to improved performance of various credits.
174
Recovery Litigation
Public Finance Transactions
On January 7, 2016, AGM, AGC and Ambac Assurance Corporation (Ambac) commenced an action for declaratory judgment and injunctive relief in the U.S. District Court for the District of Puerto Rico to invalidate the executive orders issued by the Governor on November 30, 2015 and December 8, 2015 directing that the Secretary of the Treasury of the Commonwealth of Puerto Rico and the Puerto Rico Tourism Company retain or transfer (in other words, claw back) certain taxes and revenues pledged to secure the payment of bonds issued by the PRHTA, the PRCCDA and the PRIFA. The Commonwealth defendants filed a motion to dismiss the action for lack of subject matter jurisdiction, which the Court denied on October 4, 2016. On October 14, 2016, the Commonwealth defendants filed a notice of PROMESA automatic stay.
On July 21, 2016, AGC and AGM filed a motion and form of complaint in the U.S. District Court for the District of Puerto Rico seeking relief from the stay provided by PROMESA. Upon a grant of relief from the PROMESA stay, the lawsuit further seeks a declaration that the Moratorium Act is preempted by Federal bankruptcy law and that certain gubernatorial executive orders diverting PRHTA pledged toll revenues (which are not subject to the Clawback) are preempted by PROMESA and violate the U.S. Constitution. Additionally, it seeks damages for the value of the PRHTA toll revenues diverted and injunctive relief prohibiting the defendants from taking any further action under these executive orders. On October 28, 2016, the Oversight Board filed a motion seeking leave to intervene in the action, which motion was denied on November 1, 2016, without prejudice, on procedural grounds. On November 2, 2016, the Court denied AGC’s and AGM’s motion for relief from the PROMESA stay on procedural grounds. The PROMESA stay expires on May 1, 2017.
For a discussion of the Company's exposure to Puerto Rico related to the litigation described above, please see Note 4, Outstanding Exposure.
On November 1, 2013, Radian Asset commenced a declaratory judgment action in the U.S. District Court for the Southern District of Mississippi against Madison County, Mississippi and the Parkway East Public Improvement District to establish its rights under a contribution agreement from the County supporting certain special assessment bonds issued by the District and insured by Radian Asset (now AGC). As of
December 31, 2016
,
$20 million
of such bonds were outstanding. The County maintained that its payment obligation is limited to
two
years of annual debt service, while AGC contended the County’s obligations under the contribution agreement continue so long as the bonds remain outstanding. On April 27, 2016, the Court granted AGC's motion for summary judgment, agreeing with AGC's interpretation of the County's obligations. On May 11, 2016, the County filed a notice of appeal of that ruling to the United States Court of Appeals for the Fifth Circuit.
Triple-X Life Insurance Transactions
In December 2008 AGUK filed an action in the Supreme Court of the State of New York against J.P. Morgan Investment Management Inc. (JPMIM), the investment manager for a triple-X life insurance transaction, Orkney Re II plc (Orkney), involving securities guaranteed by AGUK. As of December 31, 2016, the Company insures
$423 million
net par of Orkney securities. The action alleges that JPMIM engaged in breaches of fiduciary duty, gross negligence and breaches of contract based upon its handling of the Orkney investments. After AGUK’s claims were dismissed with prejudice in January 2010, AGUK was successful in its subsequent motions and appeals and, as of December 2011, all of AGUK’s claims for breaches of fiduciary duty, gross negligence and contract were reinstated in full. On January 22, 2016, AGUK filed a motion for partial summary judgment with respect to one of its claims for breach of contract relating to a failure to invest in compliance with the Delaware Insurance Code. On February 21, 2017, the court issued a decision on the motion. While the court denied the motion on the ground that the gross negligence of JPMIM in breaching the contract was a fact issue to be decided at trial, the court did find as a matter of law that JPMIM breached the contract relating to a failure to invest in compliance with the Delaware Insurance Code. A trial date has been set for mid-March 2017.
RMBS Transactions
On February 5, 2009, U.S. Bank National Association, as indenture trustee (U.S. Bank), CIFGNA, as insurer of the Class Ac Notes, and Syncora Guarantee Inc. (Syncora), as insurer of the Class Ax Notes, filed a complaint in the Supreme Court of the State of New York against GreenPoint Mortgage Funding, Inc. (GreenPoint) alleging GreenPoint breached its R&W with respect to the underlying mortgage loans in the GreenPoint Mortgage Funding Trust 2006-HE1 transaction. On March 3, 2010, the court dismissed CIFGNA's and Syncora’s causes of action on standing grounds. On December 16, 2013, GreenPoint moved to dismiss the remaining claims of U.S. Bank on the grounds that it too lacked standing. U.S. Bank cross-moved for partial summary judgment striking GreenPoint’s defense that U.S. Bank lacked standing to directly pursue claims against GreenPoint. On January 28, 2016, the court denied GreenPoint’s motion for summary judgment and granted U.S.
175
Bank’s cross-motion for partial summary judgment, finding that as a matter of law U.S. Bank has standing to directly assert claims against GreenPoint. On November 28, 2016, GreenPoint filed an appeal. CIFGNA originally had
$500 million
insured net par exposure to this transaction;
$23 million
insured net par remains outstanding at December 31, 2016.
On November 26, 2012, CIFGNA filed a complaint in the Supreme Court of the State of New York against JP Morgan Securities LLC (JP Morgan) for material misrepresentation in the inducement of insurance and common law fraud, alleging that JP Morgan fraudulently induced CIFGNA to insure
$400 million
of securities issued by ACA ABS CDO 2006-2 Ltd. and
$325 million
of securities issued by Libertas Preferred Funding II, Ltd. On June 26, 2015, the Court dismissed with prejudice CIFGNA’s material misrepresentation in the inducement of insurance claim and dismissed without prejudice CIFGNA’s common law fraud claim. On September 24, 2015, the Court denied CIFGNA’s motion to amend but allowed CIFGNA to re-plead a cause of action for common law fraud. On November 20, 2015, CIFGNA filed a motion for leave to amend its complaint to re-plead common law fraud. On April 29, 2016, CIFGNA filed an appeal to reverse the Court’s decision dismissing CIFGNA’s material misrepresentation in the inducement of insurance claim. On November 29, 2016, the Appellate Division of the Supreme Court of the State of New York ruled that the Court’s decision dismissing with prejudice CIFGNA’s material misrepresentation in the inducement of insurance claim should be modified to grant CIFGNA leave to replead such claim.
On January 15, 2013, CIFGNA filed a complaint in the Supreme Court of the State of New York against Goldman, Sachs & Co. (Goldman) for material misrepresentation in the inducement of insurance and common law fraud, alleging that Goldman fraudulently induced CIFGNA to insure
$325 million
of Class A-1 Notes (the Class A-1 Notes) and to purchase
$10 million
of Class A-2 Notes (the Class A-2 Notes) issued by Fortius II Funding, Ltd. CDO. CIFGNA and Goldman agreed to separately arbitrate the issue of liability with respect to CIFG’s purchase of the Class A-2 Notes, and on February 4, 2015, an arbitration panel awarded CIFGNA
$2.5 million
in damages. On September 11, 2015, CIFGNA filed an amended complaint to allege that the arbitration award collaterally estopped Goldman from disputing its liability for fraudulent inducement in respect of the Class A-1 Notes. On October 20, 2016, AGC (as successor to CIFGNA) and Goldman reached a settlement of the action.
|
6.
|
Contracts Accounted for as Insurance
|
Financial Guaranty Insurance Premiums
The portfolio of outstanding exposures discussed in Note 4, Outstanding Exposure, includes financial guaranty contracts that meet the definition of insurance contracts as well as those that meet the definition of a derivative under GAAP, as well as those that are accounted for as consolidated FG VIEs. Amounts presented in this note relate to financial guaranty insurance contracts, unless otherwise noted. See Note 8, Contracts Accounted for as Credit Derivatives for amounts that relate to CDS and Note 9, Consolidated Variable Interest Entities for amounts that relate to FG VIEs.
Accounting Policies
Accounting for financial guaranty contracts that meet the scope exception under derivative accounting guidance are subject to industry specific guidance for financial guaranty insurance. The accounting for contracts that fall under the financial guaranty insurance definition are consistent whether the contract was written on a direct basis, assumed from another financial guarantor under a reinsurance treaty, ceded to another insurer under a reinsurance treaty, or acquired in a business combination.
Premiums receivable comprise the present value of contractual or expected future premium collections discounted using the risk-free rate. Unearned premium reserve represents deferred premium revenue, less claim payments made and recoveries received that have not yet been recognized in the statement of operations (contra-paid). The following discussion relates to the deferred premium revenue component of the unearned premium reserve, while the contra-paid is discussed below under "Financial Guaranty Insurance Losses."
The amount of deferred premium revenue at contract inception is determined as follows:
|
•
|
For premiums received upfront on financial guaranty insurance contracts that were originally underwritten by the Company, deferred premium revenue is equal to the amount of cash received. Upfront premiums typically relate to public finance transactions.
|
|
•
|
For premiums received in installments on financial guaranty insurance contracts that were originally underwritten by the Company, deferred premium revenue is the present value of either (1) contractual premiums due or (2) in cases where the underlying collateral is comprised of homogeneous pools of assets, the expected premiums to be
|
176
collected over the life of the contract. To be considered a homogeneous pool of assets, prepayments must be contractually prepayable, the amount of prepayments must be probable, and the timing and amount of prepayments must be reasonably estimable. When the Company adjusts prepayment assumptions or expected premium collections, an adjustment is recorded to the deferred premium revenue, with a corresponding adjustment to the premium receivable, and prospective changes are recognized in premium revenues. Premiums receivable are discounted at the risk-free rate at inception and such discount rate is updated only when changes to prepayment assumptions are made that change the expected date of final maturity. Installment premiums typically relate to structured finance transactions, where the insurance premium rate is determined at the inception of the contract but the insured par is subject to prepayment throughout the life of the transaction.
|
•
|
For financial guaranty insurance contracts acquired in a business combination, deferred premium revenue is equal to the fair value of the Company's stand-ready obligation portion of the insurance contract at the date of acquisition based on what a hypothetical similarly rated financial guaranty insurer would have charged for the contract at that date and not the actual cash flows under the insurance contract. The amount of deferred premium revenue may differ significantly from cash collections due primarily to fair value adjustments recorded in connection with a business combination.
|
The Company recognizes deferred premium revenue as earned premium over the contractual period or expected period of the contract in proportion to the amount of insurance protection provided. As premium revenue is recognized, a corresponding decrease to the deferred premium revenue is recorded. The amount of insurance protection provided is a function of the insured principal amount outstanding. Accordingly, the proportionate share of premium revenue recognized in a given reporting period is a constant rate calculated based on the relationship between the insured principal amounts outstanding in the reporting period compared with the sum of each of the insured principal amounts outstanding for all periods. When an insured financial obligation is retired before its maturity, the financial guaranty insurance contract is extinguished. Any nonrefundable deferred premium revenue related to that contract is accelerated and recognized as premium revenue. When a premium receivable balance is deemed uncollectible, it is written off to bad debt expense.
For reinsurance assumed contracts, earned premiums reported in the Company's consolidated statements of operations are calculated based upon data received from ceding companies, however, some ceding companies report premium data between 30 and 90 days after the end of the reporting period. The Company estimates earned premiums for the lag period. Differences between such estimates and actual amounts are recorded in the period in which the actual amounts are determined. When installment premiums are related to reinsurance assumed contracts, the Company assesses the credit quality and liquidity of the ceding companies and the impact of any potential regulatory constraints to determine the collectability of such amounts.
177
Deferred premium revenue ceded to reinsurers (ceded unearned premium reserve) is recorded as an asset. Direct, assumed and ceded earned premium revenue are presented together as net earned premiums in the statement of operations. Net earned premiums comprise the following:
Net Earned Premiums
|
|
Year Ended December 31,
|
||||||||||
|
|
2016
|
2015
|
2014
|
||||||||
|
|
(in millions)
|
||||||||||
|
Scheduled net earned premiums
|
$
|
381
|
|
$
|
416
|
|
$
|
415
|
|
||
|
Accelerations
|
|||||||||||
|
Refundings
|
390
|
|
294
|
|
133
|
|
|||||
|
Terminations
|
79
|
|
37
|
|
3
|
|
|||||
|
Total Accelerations
|
469
|
|
331
|
|
136
|
|
|||||
|
Accretion of discount on net premiums receivable
|
14
|
|
17
|
|
16
|
|
|||||
|
Financial guaranty insurance net earned premiums
|
864
|
|
764
|
|
567
|
|
|||||
|
Other
|
0
|
|
2
|
|
3
|
|
|||||
|
Net earned premiums (1)
|
$
|
864
|
|
$
|
766
|
|
$
|
570
|
|
||
___________________
|
(1)
|
Excludes
$16 million
,
$21 million
and
$32 million
for the year ended
December 31, 2016
,
2015
and
2014
, respectively, related to consolidated FG VIEs.
|
Components of
Unearned Premium Reserve
|
|
As of December 31, 2016
|
As of December 31, 2015
|
|||||||||||||||||||||
|
|
Gross
|
Ceded
|
Net(1)
|
Gross
|
Ceded
|
Net(1)
|
|||||||||||||||||
|
|
(in millions)
|
||||||||||||||||||||||
|
Deferred premium revenue
|
$
|
3,548
|
|
$
|
206
|
|
$
|
3,342
|
|
$
|
4,008
|
|
$
|
238
|
|
$
|
3,770
|
|
|||||
|
Contra-paid(2)
|
(37
|
)
|
0
|
|
(37
|
)
|
(12
|
)
|
(6
|
)
|
(6
|
)
|
|||||||||||
|
Unearned premium reserve
|
$
|
3,511
|
|
$
|
206
|
|
$
|
3,305
|
|
$
|
3,996
|
|
$
|
232
|
|
$
|
3,764
|
|
|||||
____________________
|
(1)
|
Excludes
$90 million
and $
110 million
of deferred premium revenue and
$25 million
and
$30 million
of contra-paid related to FG VIEs as of
December 31, 2016
and
December 31, 2015
, respectively.
|
|
(2)
|
See "Financial Guaranty Insurance Losses – Insurance Contracts' Loss Information" below for an explanation of "contra-paid".
|
178
Gross Premium Receivable,
Net of Commissions on Assumed Business
Roll Forward
|
|
Year Ended December 31,
|
||||||||||
|
|
2016
|
2015
|
2014
|
||||||||
|
|
(in millions)
|
||||||||||
|
Beginning of period, December 31
|
$
|
693
|
|
$
|
729
|
|
$
|
876
|
|
||
|
Premiums receivable from acquisitions (see Note 2)
|
18
|
|
2
|
|
—
|
|
|||||
|
Gross written premiums on new business, net of commissions on assumed business
|
193
|
|
198
|
|
171
|
|
|||||
|
Gross premiums received, net of commissions on assumed business
|
(258
|
)
|
(206
|
)
|
(230
|
)
|
|||||
|
Adjustments:
|
|||||||||||
|
Changes in the expected term
|
(38
|
)
|
(19
|
)
|
(66
|
)
|
|||||
|
Accretion of discount, net of commissions on assumed business
|
9
|
|
18
|
|
10
|
|
|||||
|
Foreign exchange translation
|
(41
|
)
|
(25
|
)
|
(31
|
)
|
|||||
|
Consolidation/deconsolidation of FG VIEs
|
0
|
|
(4
|
)
|
(1
|
)
|
|||||
|
End of period, December 31 (1)
|
$
|
576
|
|
$
|
693
|
|
$
|
729
|
|
||
____________________
|
(1)
|
Excludes
$11 million
,
$17 million
and
$19 million
as of
December 31, 2016
,
2015
and
2014
, respectively, related to consolidated FG VIEs.
|
Foreign exchange translation relates to installment premiums receivable denominated in currencies other than the U.S. dollar. Approximately
50%
and
52%
of installment premiums at
December 31, 2016
and
2015
, respectively, are denominated in currencies other than the U.S. dollar, primarily the euro and pound sterling.
The timing and cumulative amount of actual collections may differ from expected collections in the tables below due to factors such as foreign exchange rate fluctuations, counterparty collectability issues, accelerations, commutations and changes in expected lives.
Expected Collections of
Financial Guaranty Insurance Gross Premiums Receivable,
Net of Commissions on Assumed Business
(Undiscounted)
|
|
As of December 31, 2016
|
||
|
|
(in millions)
|
||
|
2017 (January 1 – March 31)
|
$
|
27
|
|
|
2017 (April 1 – June 30)
|
21
|
|
|
|
2017 (July 1 – September 30)
|
14
|
|
|
|
2017 (October 1 – December 31)
|
16
|
|
|
|
2018
|
58
|
|
|
|
2019
|
52
|
|
|
|
2020
|
50
|
|
|
|
2021
|
49
|
|
|
|
2022-2026
|
179
|
|
|
|
2027-2031
|
120
|
|
|
|
2032-2036
|
80
|
|
|
|
After 2036
|
65
|
|
|
|
Total(1)
|
$
|
731
|
|
____________________
|
(1)
|
Excludes expected cash collections on FG VIEs of
$13 million
.
|
179
Scheduled Financial Guaranty Insurance Net Earned Premiums
|
|
As of December 31, 2016
|
||
|
|
(in millions)
|
||
|
2017 (January 1 – March 31)
|
$
|
89
|
|
|
2017 (April 1 – June 30)
|
87
|
|
|
|
2017 (July 1 – September 30)
|
82
|
|
|
|
2017 (October 1 – December 31)
|
80
|
|
|
|
Subtotal 2017
|
338
|
|
|
|
2018
|
304
|
|
|
|
2019
|
268
|
|
|
|
2020
|
243
|
|
|
|
2021
|
223
|
|
|
|
2022-2026
|
856
|
|
|
|
2027-2031
|
545
|
|
|
|
2032-2036
|
315
|
|
|
|
After 2036
|
250
|
|
|
|
Net deferred premium revenue(1)
|
3,342
|
|
|
|
Future accretion
|
145
|
|
|
|
Total future net earned premiums
|
$
|
3,487
|
|
____________________
|
(1)
|
Excludes scheduled net earned premiums on consolidated FG VIEs of
$90 million
.
|
Selected Information for Financial Guaranty Insurance
Policies Paid in Installments
|
|
As of
December 31, 2016 |
As of
December 31, 2015 |
|||||
|
|
(dollars in millions)
|
||||||
|
Premiums receivable, net of commission payable
|
$
|
576
|
|
$
|
693
|
|
|
|
Gross deferred premium revenue
|
1,041
|
|
1,240
|
|
|||
|
Weighted-average risk-free rate used to discount premiums
|
3.0
|
%
|
3.1
|
%
|
|||
|
Weighted-average period of premiums receivable (in years)
|
9.1
|
|
9.4
|
|
|||
Financial Guaranty Insurance Acquisition Costs
Accounting Policy
Policy acquisition costs that are directly related and essential to successful insurance contract acquisition and ceding commission income on ceded reinsurance contracts are deferred for contracts accounted for as insurance, and reported net. Amortization of deferred policy acquisition costs includes the accretion of discount on ceding commission income and expense.
Capitalized policy acquisition costs include expenses such as ceding commissions expense on assumed reinsurance contracts and the cost of underwriting personnel attributable to successful underwriting efforts. Ceding commission expense on assumed reinsurance contracts and ceding commission income on ceded reinsurance contracts that are associated with premiums received in installments are calculated at their contractually defined commission rates, discounted consistent with premiums receivable for all future periods, and included in deferred acquisition costs (DAC), with a corresponding offset to net premiums receivable or reinsurance balances payable. Management uses its judgment in determining the type and amount of costs to be deferred. The Company conducts an annual study to determine which operating costs qualify for deferral. Costs
180
incurred for soliciting potential customers, market research, training, administration, unsuccessful acquisition efforts, and product development as well as all overhead type costs are charged to expense as incurred. DAC is amortized in proportion to net earned premiums. When an insured obligation is retired early, the remaining related DAC, net of ceding commission income is recognized at that time.
Expected losses and LAE, investment income, and the remaining costs of servicing the insured or reinsured business, are considered in determining the recoverability of DAC.
Rollforward of
Deferred Acquisition Costs
|
Year Ended December 31,
|
|||||||||||
|
2016
|
2015
|
2014
|
|||||||||
|
(in millions)
|
|||||||||||
|
Beginning of period
|
$
|
114
|
|
$
|
121
|
|
$
|
124
|
|
||
|
DAC adjustments from acquisitions (see Note 2)
|
0
|
|
1
|
|
—
|
|
|||||
|
Costs deferred during the period:
|
|||||||||||
|
Commissions on assumed and ceded business
|
(2
|
)
|
(1
|
)
|
7
|
|
|||||
|
Premium taxes
|
4
|
|
2
|
|
3
|
|
|||||
|
Compensation and other acquisition costs
|
9
|
|
11
|
|
10
|
|
|||||
|
Total
|
11
|
|
12
|
|
20
|
|
|||||
|
Costs amortized during the period
|
(19
|
)
|
(20
|
)
|
(23
|
)
|
|||||
|
End of period
|
$
|
106
|
|
$
|
114
|
|
$
|
121
|
|
||
Financial Guaranty Insurance Losses
Accounting Policies
Loss and LAE Reserve
Loss and LAE reserve reported on the balance sheet relates only to direct and assumed reinsurance contracts that are accounted for as insurance, substantially all of which are financial guaranty insurance contracts. The corresponding reserve ceded to reinsurers is reported as reinsurance recoverable on unpaid losses. As discussed in Note 7, Fair Value Measurement, contracts that meet the definition of a derivative, as well as consolidated FG VIE assets and liabilities, are recorded separately at fair value. Any expected losses related to consolidated FG VIEs are eliminated upon consolidation. Any expected losses on credit derivatives are not recorded as loss and LAE reserve on the consolidated balance sheet, rather, credit derivatives are recorded at fair value on the balance sheet.
Under financial guaranty insurance accounting, the sum of unearned premium reserve and loss and LAE reserve represents the Company's stand‑ready obligation. Unearned premium reserve is deferred premium revenue, less claim payments and recoveries received that have not yet been recognized in the statement of operations (contra-paid). At contract inception, the entire stand-ready obligation is represented by unearned premium reserve. A loss and LAE reserve for an insurance contract is recorded only to the extent, and for the amount, that expected loss to be paid net of contra-paid (“total losses”) exceed the deferred premium revenue, on a contract by contract basis. As a result, the Company has expected loss to be paid that has not yet been expensed. Such amounts will be recognized in future periods as deferred premium revenue amortizes into income.
When a claim or LAE payment is made on a contract, it first reduces any recorded loss and LAE reserve. To the extent there is no loss and LAE reserve on a contract, then such claim payment is recorded as “contra-paid,” which reduces the unearned premium reserve. The contra-paid is recognized in the line item “loss and LAE” in the consolidated statement of operations when and for the amount that total losses exceed the remaining deferred premium revenue on the insurance contract.
Loss and LAE in the consolidated statement of operations is presented net of cessions to reinsurers.
181
Salvage and Subrogation Recoverable
When the Company becomes entitled to the cash flow from the underlying collateral of an insured credit under salvage and subrogation rights as a result of a claim payment or estimated future claim payment, it reduces the expected loss to be paid on the contract. Such reduction in expected loss to be paid can result in one of the following:
|
•
|
a reduction in the corresponding loss and LAE reserve with a benefit to the income statement,
|
|
•
|
no entry recorded, if “total loss” is not in excess of deferred premium revenue, or
|
|
•
|
the recording of a salvage asset with a benefit to the income statement if the transaction is in a net recovery position at the reporting date.
|
The Company recognizes the expected recovery of claim payments (including recoveries from settlement with R&W providers) made by an acquired subsidiary prior to the date of acquisition, consistent with its policy for recognizing recoveries on all financial guaranty insurance contracts. To the extent that the estimated amount of recoveries increases or decreases due to changes in facts and circumstances the Company would recognize a benefit or expense consistent with how changes in the expected recovery of all other claim payments are recorded. The ceded component of salvage and subrogation recoverable is recorded in the line item reinsurance balances payable.
Expected Loss to be Expensed
Expected loss to be expensed represents past or expected future net claim payments that have not yet been expensed. Such amounts will be expensed in future periods as deferred premium revenue amortizes into income on financial guaranty insurance policies. Expected loss to be expensed is the Company's projection of incurred losses that will be recognized in future periods, excluding accretion of discount.
182
Insurance Contracts' Loss Information
The following table provides information on loss and LAE reserves and salvage and subrogation recoverable, net of reinsurance. The Company used risk-free rates for U.S. dollar denominated financial guaranty insurance obligations that ranged from
0.0%
to
3.23%
with a weighted average of
2.74%
as of
December 31, 2016
and
0.0%
to
3.25%
with a weighted average of
2.37%
as of
December 31, 2015
.
Loss and LAE Reserve and Salvage and Subrogation Recoverable
Net of Reinsurance
Insurance Contracts
|
|
As of December 31, 2016
|
As of December 31, 2015
|
|||||||||||||||||||||
|
|
Loss and
LAE
Reserve, net
|
Salvage and
Subrogation
Recoverable, net
|
Net Reserve (Recoverable)
|
Loss and
LAE
Reserve, net
|
Salvage and
Subrogation
Recoverable, net
|
Net Reserve (Recoverable)
|
|||||||||||||||||
|
|
(in millions)
|
||||||||||||||||||||||
|
Public finance:
|
|||||||||||||||||||||||
|
U.S. public finance
|
$
|
711
|
|
$
|
86
|
|
$
|
625
|
|
$
|
604
|
|
$
|
7
|
|
$
|
597
|
|
|||||
|
Non-U.S. public finance
|
21
|
|
—
|
|
21
|
|
25
|
|
—
|
|
25
|
|
|||||||||||
|
Public finance
|
732
|
|
86
|
|
646
|
|
629
|
|
7
|
|
622
|
|
|||||||||||
|
Structured finance:
|
|||||||||||||||||||||||
|
U.S. RMBS
|
283
|
|
262
|
|
21
|
|
262
|
|
116
|
|
146
|
|
|||||||||||
|
Triple-X life insurance transactions
|
36
|
|
—
|
|
36
|
|
82
|
|
—
|
|
82
|
|
|||||||||||
|
Other structured finance
|
60
|
|
—
|
|
60
|
|
99
|
|
—
|
|
99
|
|
|||||||||||
|
Structured finance
|
379
|
|
262
|
|
117
|
|
443
|
|
116
|
|
327
|
|
|||||||||||
|
Subtotal
|
1,111
|
|
348
|
|
763
|
|
1,072
|
|
123
|
|
949
|
|
|||||||||||
|
Other recoverable (payable)
|
—
|
|
(1
|
)
|
1
|
|
—
|
|
3
|
|
(3
|
)
|
|||||||||||
|
Subtotal
|
1,111
|
|
347
|
|
764
|
|
1,072
|
|
126
|
|
946
|
|
|||||||||||
|
Elimination of losses attributable to FG VIEs
|
(64
|
)
|
—
|
|
(64
|
)
|
(74
|
)
|
0
|
|
(74
|
)
|
|||||||||||
|
Total (1)
|
$
|
1,047
|
|
$
|
347
|
|
$
|
700
|
|
$
|
998
|
|
$
|
126
|
|
$
|
872
|
|
|||||
______________
(1)
See “Components of Net Reserves (Salvage)” table for loss and LAE reserve and salvage and subrogation recoverable components.
Components of Net Reserves (Salvage)
|
|
As of
December 31, 2016 |
As of
December 31, 2015 |
|||||
|
|
(in millions)
|
||||||
|
Loss and LAE reserve
|
$
|
1,127
|
|
$
|
1,067
|
|
|
|
Reinsurance recoverable on unpaid losses
|
(80
|
)
|
(69
|
)
|
|||
|
Loss and LAE reserve, net
|
1,047
|
|
998
|
|
|||
|
Salvage and subrogation recoverable
|
(365
|
)
|
(126
|
)
|
|||
|
Salvage and subrogation payable(1)
|
17
|
|
3
|
|
|||
|
Other payable (recoverable)
|
1
|
|
(3
|
)
|
|||
|
Salvage and subrogation recoverable, net, and other recoverable
|
(347
|
)
|
(126
|
)
|
|||
|
Net reserves (salvage)
|
$
|
700
|
|
$
|
872
|
|
|
(1) Recorded as a component of reinsurance balances payable.
183
The table below provides a reconciliation of net expected loss to be paid to net expected loss to be expensed. Expected loss to be paid differs from expected loss to be expensed due to: (i) the contra-paid which represent the claim payments made and recoveries received that have not yet been recognized in the statement of operations, (ii) salvage and subrogation recoverable for transactions that are in a net recovery position where the Company has not yet received recoveries on claims previously paid (having the effect of reducing net expected loss to be paid by the amount of the previously paid claim and the expected recovery), but will have no future income effect (because the previously paid claims and the corresponding recovery of those claims will offset in income in future periods), and (iii) loss reserves that have already been established (and therefore expensed but not yet paid).
Reconciliation of Net Expected Loss to be Paid and
Net Expected Loss to be Expensed
Financial Guaranty Insurance Contracts
|
As of December 31, 2016
|
|||
|
|
(in millions)
|
||
|
Net expected loss to be paid - financial guaranty insurance (1)
|
$
|
1,083
|
|
|
Contra-paid, net
|
37
|
|
|
|
Salvage and subrogation recoverable, net of reinsurance
|
348
|
|
|
|
Loss and LAE reserve - financial guaranty insurance contracts, net of reinsurance
|
(1,046
|
)
|
|
|
Other recoverable (payable)
|
(1
|
)
|
|
|
Net expected loss to be expensed (present value) (2)
|
$
|
421
|
|
____________________
|
(1)
|
See "Net Expected Loss to be Paid (Recovered) by Accounting Model" table in Note 5, Expected Loss to be Paid.
|
|
(2)
|
Excludes
$64 million
as of
December 31, 2016
related to consolidated FG VIEs.
|
184
The following table provides a schedule of the expected timing of net expected losses to be expensed. The amount and timing of actual loss and LAE may differ from the estimates shown below due to factors such as accelerations, commutations, changes in expected lives and updates to loss estimates. This table excludes amounts related to FG VIEs, which are eliminated in consolidation.
Net Expected Loss to be Expensed
Financial Guaranty Insurance Contracts
|
|
As of December 31, 2016
|
||
|
|
(in millions)
|
||
|
2017 (January 1 – March 31)
|
$
|
8
|
|
|
2017 (April 1 – June 30)
|
10
|
|
|
|
2017 (July 1 – September 30)
|
8
|
|
|
|
2017 (October 1 – December 31)
|
9
|
|
|
|
Subtotal 2017
|
35
|
|
|
|
2018
|
34
|
|
|
|
2019
|
32
|
|
|
|
2020
|
32
|
|
|
|
2021
|
28
|
|
|
|
2022-2026
|
117
|
|
|
|
2027-2031
|
82
|
|
|
|
2032-2036
|
44
|
|
|
|
After 2036
|
17
|
|
|
|
Net expected loss to be expensed
|
421
|
|
|
|
Future accretion
|
373
|
|
|
|
Total expected future loss and LAE
|
$
|
794
|
|
The following table presents the loss and LAE recorded in the consolidated statements of operations by sector for insurance contracts. Amounts presented are net of reinsurance.
Loss and LAE
Reported on the
Consolidated Statements of Operations
|
|
Year Ended December 31,
|
||||||||||
|
2016
|
2015
|
2014
|
|||||||||
|
(in millions)
|
|||||||||||
|
Public finance:
|
|||||||||||
|
U.S. public finance
|
$
|
307
|
|
$
|
392
|
|
$
|
192
|
|
||
|
Non-U.S. public finance
|
(3
|
)
|
1
|
|
(1
|
)
|
|||||
|
Public finance
|
304
|
|
393
|
|
191
|
|
|||||
|
Structured finance:
|
|||||||||||
|
U.S. RMBS
|
37
|
|
54
|
|
(129
|
)
|
|||||
|
Triple-X life insurance transactions
|
(22
|
)
|
16
|
|
85
|
|
|||||
|
Other structured finance
|
(17
|
)
|
(11
|
)
|
9
|
|
|||||
|
Structured finance
|
(2
|
)
|
59
|
|
(35
|
)
|
|||||
|
Loss and LAE on insurance contracts before FG VIE consolidation
|
302
|
|
452
|
|
156
|
|
|||||
|
Gain (loss) related to FG VIE consolidation
|
(7
|
)
|
(28
|
)
|
(30
|
)
|
|||||
|
Loss and LAE
|
$
|
295
|
|
$
|
424
|
|
$
|
126
|
|
||
185
The following table provides information on financial guaranty insurance contracts categorized as BIG.
Financial Guaranty Insurance
BIG Transaction Loss Summary
As of December 31, 2016
|
|
BIG Categories
|
||||||||||||||||||||||||||||||||||
|
|
BIG 1
|
BIG 2
|
BIG 3
|
Total
BIG, Net
|
Effect of
Consolidating
FG VIEs
|
Total
|
|||||||||||||||||||||||||||||
|
|
Gross
|
Ceded
|
Gross
|
Ceded
|
Gross
|
Ceded
|
|||||||||||||||||||||||||||||
|
(dollars in millions)
|
|||||||||||||||||||||||||||||||||||
|
Number of risks(1)
|
165
|
|
(35
|
)
|
79
|
|
(11
|
)
|
148
|
|
(49
|
)
|
392
|
|
—
|
|
392
|
|
|||||||||||||||||
|
Remaining weighted-average contract period (in years)
|
8.6
|
|
7.0
|
|
13.2
|
|
10.5
|
|
8.1
|
|
6.0
|
|
10.1
|
|
—
|
|
10.1
|
|
|||||||||||||||||
|
Outstanding exposure:
|
|
|
|
|
|
|
|
|
|
|
|
|
|
|
|
|
|
|
|||||||||||||||||
|
Principal
|
$
|
4,187
|
|
$
|
(326
|
)
|
$
|
4,273
|
|
$
|
(416
|
)
|
$
|
4,703
|
|
$
|
(320
|
)
|
$
|
12,101
|
|
$
|
—
|
|
$
|
12,101
|
|
||||||||
|
Interest
|
1,932
|
|
(140
|
)
|
2,926
|
|
(219
|
)
|
1,867
|
|
(87
|
)
|
6,279
|
|
—
|
|
6,279
|
|
|||||||||||||||||
|
Total(2)
|
$
|
6,119
|
|
$
|
(466
|
)
|
$
|
7,199
|
|
$
|
(635
|
)
|
$
|
6,570
|
|
$
|
(407
|
)
|
$
|
18,380
|
|
$
|
—
|
|
$
|
18,380
|
|
||||||||
|
Expected cash outflows (inflows)
|
$
|
172
|
|
$
|
(19
|
)
|
$
|
1,404
|
|
$
|
(86
|
)
|
$
|
1,435
|
|
$
|
(65
|
)
|
$
|
2,841
|
|
$
|
(326
|
)
|
$
|
2,515
|
|
||||||||
|
Potential recoveries
|
|||||||||||||||||||||||||||||||||||
|
Undiscounted R&W
|
120
|
|
(3
|
)
|
(2
|
)
|
—
|
|
(62
|
)
|
1
|
|
54
|
|
—
|
|
54
|
|
|||||||||||||||||
|
Other(3)
|
(560
|
)
|
26
|
|
(144
|
)
|
4
|
|
(681
|
)
|
44
|
|
(1,311
|
)
|
198
|
|
(1,113
|
)
|
|||||||||||||||||
|
Total potential recoveries
|
(440
|
)
|
23
|
|
(146
|
)
|
4
|
|
(743
|
)
|
45
|
|
(1,257
|
)
|
198
|
|
(1,059
|
)
|
|||||||||||||||||
|
Subtotal
|
(268
|
)
|
4
|
|
1,258
|
|
(82
|
)
|
692
|
|
(20
|
)
|
1,584
|
|
(128
|
)
|
1,456
|
|
|||||||||||||||||
|
Discount
|
61
|
|
(4
|
)
|
(355
|
)
|
19
|
|
(114
|
)
|
(4
|
)
|
(397
|
)
|
24
|
|
(373
|
)
|
|||||||||||||||||
|
Present value of expected cash flows
|
$
|
(207
|
)
|
$
|
0
|
|
$
|
903
|
|
$
|
(63
|
)
|
$
|
578
|
|
$
|
(24
|
)
|
$
|
1,187
|
|
$
|
(104
|
)
|
$
|
1,083
|
|
||||||||
|
Deferred premium revenue
|
$
|
131
|
|
$
|
(5
|
)
|
$
|
246
|
|
$
|
(6
|
)
|
$
|
476
|
|
$
|
(30
|
)
|
$
|
812
|
|
$
|
(86
|
)
|
$
|
726
|
|
||||||||
|
Reserves (salvage)
|
$
|
(255
|
)
|
$
|
5
|
|
$
|
738
|
|
$
|
(58
|
)
|
$
|
343
|
|
$
|
(10
|
)
|
$
|
763
|
|
$
|
(64
|
)
|
$
|
699
|
|
||||||||
186
Financial Guaranty Insurance
BIG Transaction Loss Summary
As of December 31, 2015
|
|
BIG Categories
|
||||||||||||||||||||||||||||||||||
|
|
BIG 1
|
BIG 2
|
BIG 3
|
Total
BIG, Net
|
Effect of
Consolidating
FG VIEs
|
Total
|
|||||||||||||||||||||||||||||
|
|
Gross
|
Ceded
|
Gross
|
Ceded
|
Gross
|
Ceded
|
|||||||||||||||||||||||||||||
|
|
(dollars in millions)
|
||||||||||||||||||||||||||||||||||
|
Number of risks(1)
|
202
|
|
(46
|
)
|
85
|
|
(13
|
)
|
132
|
|
(44
|
)
|
419
|
|
—
|
|
419
|
|
|||||||||||||||||
|
Remaining weighted-average contract period (in years)
|
10.0
|
|
8.7
|
|
13.8
|
|
9.5
|
|
7.7
|
|
5.9
|
|
10.7
|
|
—
|
|
10.7
|
|
|||||||||||||||||
|
Outstanding exposure:
|
|
|
|
|
|
|
|
|
|
|
|
|
|
|
|
|
|
|
|||||||||||||||||
|
Principal
|
$
|
7,751
|
|
$
|
(732
|
)
|
$
|
3,895
|
|
$
|
(240
|
)
|
$
|
3,087
|
|
$
|
(187
|
)
|
$
|
13,574
|
|
$
|
—
|
|
$
|
13,574
|
|
||||||||
|
Interest
|
4,109
|
|
(354
|
)
|
2,805
|
|
(110
|
)
|
1,011
|
|
(42
|
)
|
7,419
|
|
—
|
|
7,419
|
|
|||||||||||||||||
|
Total(2)
|
$
|
11,860
|
|
$
|
(1,086
|
)
|
$
|
6,700
|
|
$
|
(350
|
)
|
$
|
4,098
|
|
$
|
(229
|
)
|
$
|
20,993
|
|
$
|
—
|
|
$
|
20,993
|
|
||||||||
|
Expected cash outflows (inflows)
|
386
|
|
(42
|
)
|
1,158
|
|
(60
|
)
|
1,464
|
|
(53
|
)
|
2,853
|
|
(343
|
)
|
2,510
|
|
|||||||||||||||||
|
Potential recoveries
|
|||||||||||||||||||||||||||||||||||
|
Undiscounted R&W
|
69
|
|
(2
|
)
|
(49
|
)
|
1
|
|
(85
|
)
|
5
|
|
(61
|
)
|
7
|
|
(54
|
)
|
|||||||||||||||||
|
Other(3)
|
(372
|
)
|
12
|
|
(167
|
)
|
8
|
|
(672
|
)
|
24
|
|
(1,167
|
)
|
182
|
|
(985
|
)
|
|||||||||||||||||
|
Total potential recoveries
|
(303
|
)
|
10
|
|
(216
|
)
|
9
|
|
(757
|
)
|
29
|
|
(1,228
|
)
|
189
|
|
(1,039
|
)
|
|||||||||||||||||
|
Subtotal
|
83
|
|
(32
|
)
|
942
|
|
(51
|
)
|
707
|
|
(24
|
)
|
1,625
|
|
(154
|
)
|
1,471
|
|
|||||||||||||||||
|
Discount
|
22
|
|
5
|
|
(237
|
)
|
11
|
|
27
|
|
(94
|
)
|
(266
|
)
|
34
|
|
(232
|
)
|
|||||||||||||||||
|
Present value of expected cash flows
|
$
|
105
|
|
$
|
(27
|
)
|
$
|
705
|
|
$
|
(40
|
)
|
$
|
734
|
|
$
|
(118
|
)
|
$
|
1,359
|
|
$
|
(120
|
)
|
$
|
1,239
|
|
||||||||
|
Deferred premium revenue
|
$
|
371
|
|
$
|
(37
|
)
|
$
|
150
|
|
$
|
(4
|
)
|
$
|
386
|
|
$
|
(32
|
)
|
$
|
834
|
|
$
|
(100
|
)
|
$
|
734
|
|
||||||||
|
Reserves (salvage)
|
$
|
2
|
|
$
|
(19
|
)
|
$
|
591
|
|
$
|
(38
|
)
|
$
|
404
|
|
$
|
(9
|
)
|
$
|
931
|
|
$
|
(74
|
)
|
$
|
857
|
|
||||||||
____________________
|
(1)
|
A risk represents the aggregate of the financial guaranty policies that share the same revenue source for purposes of making debt service payments. The ceded number of risks represents the number of risks for which the Company ceded a portion of its exposure.
|
|
(2)
|
Includes BIG amounts related to FG VIEs.
|
|
(3)
|
Includes excess spread.
|
Ratings Impact on Financial Guaranty Business
A downgrade of one of AGL’s insurance subsidiaries may result in increased claims under financial guaranties issued by the Company, if the insured obligors were unable to pay.
For example, AGM has issued financial guaranty insurance policies in respect of the obligations of municipal obligors under interest rate swaps. AGM insures periodic payments owed by the municipal obligors to the bank counterparties. In certain cases, AGM also insures termination payments that may be owed by the municipal obligors to the bank counterparties. If (i) AGM has been downgraded below the rating trigger set forth in a swap under which it has insured the termination payment, which rating trigger varies on a transaction by transaction basis; (ii) the municipal obligor has the right to cure by, but has failed in, posting collateral, replacing AGM or otherwise curing the downgrade of AGM; (iii) the transaction documents include as a condition that an event of default or termination event with respect to the municipal obligor has occurred, such as the rating of the municipal obligor being downgraded past a specified level, and such condition has been met; (iv) the bank counterparty has elected to terminate the swap; (v) a termination payment is payable by the municipal obligor; and (vi) the municipal obligor has failed to make the termination payment payable by it, then AGM would be required to pay the termination payment due by the municipal obligor, in an amount not to exceed the policy limit set forth in the financial guaranty insurance policy. At AGM's current financial strength ratings, if the conditions giving rise to the obligation of AGM to make a termination payment under the swap termination policies were all satisfied, then AGM could pay claims in an amount
187
not exceeding approximately
$125 million
in respect of such termination payments. Taking into consideration whether the rating of the municipal obligor is below any applicable specified trigger, if the financial strength ratings of AGM were further downgraded below "A" by S&P or below "A2" by Moody's, and the conditions giving rise to the obligation of AGM to make a payment under the swap policies were all satisfied, then AGM could pay claims in an additional amount not exceeding approximately
$291 million
in respect of such termination payments.
As another example, with respect to variable rate demand obligations (VRDOs) for which a bank has agreed to provide a liquidity facility, a downgrade of AGM or AGC may provide the bank with the right to give notice to bondholders that the bank will terminate the liquidity facility, causing the bondholders to tender their bonds to the bank. Bonds held by the bank accrue interest at a “bank bond rate” that is higher than the rate otherwise borne by the bond (typically the
prime rate
plus
2.00%
—
3.00%
, and capped at the lesser of
25%
and the maximum legal limit). In the event the bank holds such bonds for longer than a specified period of time, usually
90
-
180 days
, the bank has the right to demand accelerated repayment of bond principal, usually through payment of equal installments over a period of not less than
five years
. In the event that a municipal obligor is unable to pay interest accruing at the bank bond rate or to pay principal during the shortened amortization period, a claim could be submitted to AGM or AGC under its financial guaranty policy. As of
December 31, 2016
, AGM and AGC had insured approximately
$4.9 billion
net par of VRDOs, of which approximately
$0.3 billion
of net par constituted VRDOs issued by municipal obligors rated BBB- or lower pursuant to the Company’s internal rating. The specific terms relating to the rating levels that trigger the bank’s termination right, and whether it is triggered by a downgrade by one rating agency or a downgrade by all rating agencies then rating the insurer, vary depending on the transaction.
In addition, AGM may be required to pay claims in respect of AGMH’s former financial products business if Dexia SA and its affiliates, from which the Company had purchased AGMH and its subsidiaries, do not comply with their obligations following a downgrade of the financial strength rating of AGM. A downgrade of the financial strength rating of AGM could trigger a payment obligation of AGM in respect to AGMH's former GIC business. Most GICs insured by AGM allow for the termination of the GIC contract and a withdrawal of GIC funds at the option of the GIC holder in the event of a downgrade of AGM below a specified threshold, generally below A- by S&P or A3 by Moody's. FSAM is expected to have sufficient eligible and liquid assets to satisfy any expected withdrawal and collateral posting obligations resulting from future rating actions affecting AGM.
|
7.
|
Fair Value Measurement
|
The Company carries a significant portion of its assets and liabilities at fair value. Fair value is defined as the price that would be received to sell an asset or paid to transfer a liability in an orderly transaction between market participants at the measurement date (i.e., exit price). The price represents the price available in the principal market for the asset or liability. If there is no principal market, then the price is based on a hypothetical market that maximizes the value received for an asset or minimizes the amount paid for a liability (i.e., the most advantageous market).
Fair value is based on quoted market prices, where available. If listed prices or quotes are not available, fair value is based on either internally developed models that primarily use, as inputs, market-based or independently sourced market parameters, including but not limited to yield curves, interest rates and debt prices or with the assistance of an independent third-party using a discounted cash flow approach and the third party’s proprietary pricing models. In addition to market information, models also incorporate transaction details, such as maturity of the instrument and contractual features designed to reduce the Company’s credit exposure, such as collateral rights as applicable.
Valuation adjustments may be made to ensure that financial instruments are recorded at fair value. These adjustments include amounts to reflect counterparty credit quality, the Company’s creditworthiness and constraints on liquidity. As markets and products develop and the pricing for certain products becomes more or less transparent, the Company may refine its methodologies and assumptions. During
2016
, no changes were made to the Company’s valuation models that had or are expected to have, a material impact on the Company’s consolidated balance sheets or statements of operations and comprehensive income.
The Company’s methods for calculating fair value produce a fair value that may not be indicative of net realizable value or reflective of future fair values. The use of different methodologies or assumptions to determine fair value of certain financial instruments could result in a different estimate of fair value at the reporting date.
The categorization within the fair value hierarchy is determined based on whether the inputs to valuation techniques used to measure fair value are observable or unobservable. Observable inputs reflect market data obtained from independent sources, while unobservable inputs reflect Company estimates of market assumptions. The fair value hierarchy prioritizes
188
model inputs into three broad levels as follows, with Level 1 being the highest and Level 3 the lowest. An asset or liability’s categorization is based on the lowest level of significant input to its valuation.
Level 1—Quoted prices for identical instruments in active markets. The Company generally defines an active market as a market in which trading occurs at significant volumes. Active markets generally are more liquid and have a lower bid-ask spread than an inactive market.
Level 2—Quoted prices for similar instruments in active markets; quoted prices for identical or similar instruments in markets that are not active; and observable inputs other than quoted prices, such as interest rates or yield curves and other inputs derived from or corroborated by observable market inputs.
Level 3—Model derived valuations in which one or more significant inputs or significant value drivers are unobservable. Financial instruments are considered Level 3 when their values are determined using pricing models, discounted cash flow methodologies or similar techniques and at least one significant model assumption or input is unobservable. Level 3 financial instruments also include those for which the determination of fair value requires significant management judgment or estimation.
Transfers between Levels 1, 2 and 3 are recognized at the end of the period when the transfer occurs. The Company reviews the classification between Levels 1, 2 and 3 quarterly to determine whether a transfer is necessary. During the periods
presented, there were no transfers between Level 1 and Level 2. There were transfers of fixed-maturity securities from Level 2 into Level 3 during 2016 because of a lack of observability relating to the valuation inputs and collateral pricing. There were no transfers into or out of Level 3 during 2015.
Measured and Carried at Fair Value
Fixed-Maturity Securities and Short-Term Investments
The fair value of bonds in the investment portfolio is generally based on prices received from third party pricing services or alternative pricing sources with reasonable levels of price transparency. The pricing services prepare estimates of fair value measurements using their pricing models, which include available relevant market information, benchmark curves, benchmarking of like securities, and sector groupings. Additional valuation factors that can be taken into account are nominal spreads and liquidity adjustments. The pricing services evaluate each asset class based on relevant market and credit information, perceived market movements, and sector news. The market inputs used in the pricing evaluation include: benchmark yields, reported trades, broker/dealer quotes, issuer spreads, two-sided markets, benchmark securities, bids, offers, reference data and industry and economic events. Benchmark yields have in many cases taken priority over reported trades for securities that trade less frequently or those that are distressed trades, and therefore may not be indicative of the market. The extent of the use of each input is dependent on the asset class and the market conditions. Given the asset class, the priority of the use of inputs may change or some market inputs may not be relevant. Additionally, the valuation of fixed-maturity investments is more subjective when markets are less liquid due to the lack of market based inputs, which may increase the potential that the estimated fair value of an investment is not reflective of the price at which an actual transaction would occur.
Short-term investments, that are traded in active markets, are classified within Level 1 in the fair value hierarchy and their value is based on quoted market prices. Securities such as discount notes are classified within Level 2 because these securities are typically not actively traded due to their approaching maturity and, as such, their cost approximates fair value. Short term securities that were obtained as part of loss mitigation efforts and whose prices were determined based on models, where at least one significant model assumption or input is unobservable, are considered to be Level 3 in the fair value hierarchy.
Annually, the Company reviews each pricing service’s procedures, controls and models used in the valuations of the Company’s investment portfolio, as well as the competency of the pricing service’s key personnel. In addition, on a quarterly basis, the Company holds a meeting of the internal valuation committee (comprised of individuals within the Company with market, valuation, accounting, and/or finance experience) that reviews and approves prices and assumptions used by the pricing services.
For Level 1 and 2 securities, the Company, on a quarterly basis, reviews internally developed analytic packages that highlight, at a CUSIP level, price changes from the previous quarter to the current quarter. Where unexpected price movements are noted for a specific CUSIP, the Company formally challenges the price provided, and reviews all key inputs utilized in the third party’s pricing model, and compares such information to management’s own market information.
189
For Level 3 securities, the Company, on a quarterly basis:
|
•
|
reviews methodologies, any model updates and inputs and compares such information to management’s own market information and, where applicable, the internal models,
|
|
•
|
reviews internally developed analytic packages that highlight, at a CUSIP level, price changes from the previous quarter to the current quarter, and evaluates, documents, and resolves any significant pricing differences with the assistance of the third party pricing source, and
|
|
•
|
compares prices received from different third party pricing sources, and evaluates, documents the rationale for, and resolves any significant pricing differences.
|
As of
December 31, 2016
, the Company used models to price
80
fixed-maturity securities (primarily securities that were purchased or obtained for loss mitigation or other risk management purposes), which were
11.7%
or
$1,269 million
of the Company’s fixed-maturity securities and short-term investments at fair value. Most Level 3 securities were priced with the assistance of an independent third-party. The pricing is based on a discounted cash flow approach using the third-party’s proprietary pricing models. The models use inputs such as projected prepayment speeds; severity assumptions; recovery lag assumptions; estimated default rates (determined on the basis of an analysis of collateral attributes, historical collateral performance, borrower profiles and other features relevant to the evaluation of collateral credit quality); home price appreciation/depreciation rates based on macroeconomic forecasts and recent trading activity. The yield used to discount the projected cash flows is determined by reviewing various attributes of the bond including collateral type, weighted average life, sensitivity to losses, vintage, and convexity, in conjunction with market data on comparable securities. Significant changes to any of these inputs could materially change the expected timing of cash flows within these securities which is a significant factor in determining the fair value of the securities.
Other Invested Assets
As of
December 31, 2016
and
December 31, 2015
, other invested assets include investments carried and measured at fair value on a recurring basis of
$52 million
and
$53 million
, respectively, and include primarily an investment in the global property catastrophe risk market and an investment in a fund that invests primarily in senior loans and bonds. Fair values for the majority of these investments are based on their respective net asset value (NAV) per share or equivalent.
Other Assets
Committed Capital Securities
The fair value of committed capital securities (CCS), which is recorded in “other assets” on the consolidated balance sheets, represents the difference between the present value of remaining expected put option premium payments under AGC’s CCS (the AGC CCS) and AGM’s Committed Preferred Trust Securities (the AGM CPS) agreements, and the estimated present value that the Company would hypothetically have to pay currently for a comparable security (see Note 16, Long Term Debt and Credit Facilities). The AGC CCS and AGM CPS are carried at fair value with changes in fair value recorded in the consolidated statement of operations. The estimated current cost of the Company’s CCS is based on several factors, including AGM and AGC CDS spreads, the U.S. dollar forward swap curve, London Interbank Offered Rate (LIBOR) curve projections, the Company's publicly traded debt and the term the securities are estimated to remain outstanding.
Supplemental Executive Retirement Plans
The Company classifies the fair value measurement of the assets of the Company's various supplemental executive retirement plans as either Level 1 or Level 2. The fair value of these assets is valued based on the observable published daily values of the underlying mutual fund included in the aforementioned plans (Level 1) or based upon the NAV of the funds if a published daily value is not available (Level 2). The NAV are based on observable information.
Contracts Accounted for as Credit Derivatives
The Company’s credit derivatives consist primarily of insured CDS contracts, and also include interest rate swaps and as of December 31, 2016, hedges on other financial guarantors that fall under derivative accounting standards requiring fair value accounting through the statement of operations. The following is a description of the fair value methodology applied to the Company's insured CDS that are accounted for as credit derivatives, which constitute the vast majority of the net credit derivative liability in the consolidated balance sheets. The Company did not enter into CDS with the intent to trade these
190
contracts and the Company may not unilaterally terminate a CDS contract absent an event of default or termination event that entitles the Company to terminate such contracts; however, the Company has mutually agreed with various counterparties to terminate certain CDS transactions. Such terminations generally are done for an amount that approximates the present value of future premiums or for a negotiated amount; not at fair value.
The terms of the Company’s CDS contracts differ from more standardized credit derivative contracts sold by companies outside the financial guaranty industry. The non-standard terms generally include the absence of collateral support agreements or immediate settlement provisions. In addition, the Company employs relatively high attachment points and does not exit derivatives it sells or purchases for credit protection purposes, except under specific circumstances such as mutual agreements with counterparties. Management considers the non-standard terms of its credit derivative contracts in determining the fair value of these contracts.
Due to the lack of quoted prices and other observable inputs for its instruments or for similar instruments, the Company determines the fair value of its credit derivative contracts primarily through internally developed, proprietary models that use both observable and unobservable market data inputs to derive an estimate of the fair value of the Company's contracts in its principal markets (see "Assumptions and Inputs"). There is no established market where financial guaranty insured credit derivatives are actively traded, therefore, management has determined that the exit market for the Company’s credit derivatives is a hypothetical one based on its entry market. Management has tracked the historical pricing of the Company’s deals to establish historical price points in the hypothetical market that are used in the fair value calculation. These contracts are classified as Level 3 in the fair value hierarchy since there is reliance on at least one unobservable input deemed significant to the valuation model, most importantly the Company’s estimate of the value of the non-standard terms and conditions of its credit derivative contracts and of the Company’s current credit standing.
The Company’s models and the related assumptions are continuously reevaluated by management and enhanced, as appropriate, based upon improvements in modeling techniques and availability of more timely and relevant market information.
The fair value of the Company’s credit derivative contracts represents the difference between the present value of remaining premiums the Company expects to receive or pay and the estimated present value of premiums that a financial guarantor of comparable credit-worthiness would hypothetically charge or pay at the reporting date for the same protection. The fair value of the Company’s credit derivatives depends on a number of factors, including notional amount of the contract, expected term, credit spreads, changes in interest rates, the credit ratings of referenced entities, the Company’s own credit risk and remaining contractual cash flows. The expected remaining contractual premium cash flows are the most readily observable inputs since they are based on the CDS contractual terms. Credit spreads capture the effect of recovery rates and performance of underlying assets of these contracts, among other factors. Consistent with previous years, market conditions at
December 31, 2016
were such that market prices of the Company’s CDS contracts were not available.
Management considers factors such as current prices charged for similar agreements, when available, performance of underlying assets, life of the instrument, and the nature and extent of activity in the financial guaranty credit derivative marketplace. The assumptions that management uses to determine the fair value may change in the future due to market conditions. Due to the inherent uncertainties of the assumptions used in the valuation models, actual experience may differ from the estimates reflected in the Company’s consolidated financial statements and the differences may be material.
Assumptions and Inputs
The various inputs and assumptions that are key to the establishment of the Company’s fair value for CDS contracts are as follows:
|
•
|
Gross spread.
|
|
•
|
The allocation of gross spread among:
|
|
◦
|
the profit the originator, usually an investment bank, realizes for putting the deal together and funding the transaction (bank profit);
|
|
◦
|
premiums paid to the Company for the Company’s credit protection provided (“net spread”); and
|
|
◦
|
the cost of CDS protection purchased by the originator to hedge their counterparty credit risk exposure to the Company (hedge cost).
|
191
|
•
|
The weighted average life which is based on debt service schedules.
|
The rates used to discount future expected premium cash flows ranged from
1.00%
to
2.55%
at
December 31, 2016
and
0.44%
to
2.51%
at
December 31, 2015
.
The Company obtains gross spreads on its outstanding contracts from market data sources published by third parties (e.g., dealer spread tables for the collateral similar to assets within the Company’s transactions), as well as collateral-specific spreads provided by trustees or obtained from market sources. If observable market credit spreads are not available or reliable for the underlying reference obligations, then market indices are used that most closely resemble the underlying reference obligations, considering asset class, credit quality rating and maturity of the underlying reference obligations. These indices are adjusted to reflect the non-standard terms of the Company’s CDS contracts. Market sources determine credit spreads by reviewing new issuance pricing for specific asset classes and receiving price quotes from their trading desks for the specific asset in question. Management validates these quotes by cross-referencing quotes received from one market source against quotes received from another market source to ensure reasonableness. In addition, the Company compares the relative change in price quotes received from one quarter to another, with the relative change experienced by published market indices for a specific asset class. Collateral specific spreads obtained from third-party, independent market sources are un-published spread quotes from market participants or market traders who are not trustees. Management obtains this information as the result of direct communication with these sources as part of the valuation process.
With respect to CDS transactions for which there is an expected claim payment within the next twelve months, the allocation of gross spread reflects a higher allocation to the cost of credit rather than the bank profit component. In the current market, it is assumed that a bank would be willing to accept a lower profit on distressed transactions in order to remove these transactions from its financial statements.
The following spread hierarchy is utilized in determining which source of gross spread to use, with the rule being to use CDS spreads where available. If not available, CDS spreads are either interpolated or extrapolated based on similar transactions or market indices.
|
•
|
Actual collateral specific credit spreads (if up-to-date and reliable market-based spreads are available).
|
|
•
|
Deals priced or closed during a specific quarter within a specific asset class and specific rating. No transactions closed during the periods presented.
|
|
•
|
Credit spreads interpolated based upon market indices.
|
|
•
|
Credit spreads provided by the counterparty of the CDS.
|
|
•
|
Credit spreads extrapolated based upon transactions of similar asset classes, similar ratings, and similar time to maturity.
|
Information by Credit Spread Type (1)
|
|
As of
December 31, 2016 |
As of
December 31, 2015 |
|||
|
Based on actual collateral specific spreads
|
7
|
%
|
13
|
%
|
|
|
Based on market indices
|
77
|
%
|
73
|
%
|
|
|
Provided by the CDS counterparty
|
16
|
%
|
14
|
%
|
|
|
Total
|
100
|
%
|
100
|
%
|
|
____________________
(1) Based on par.
Over time the data inputs can change as new sources become available or existing sources are discontinued or are no longer considered to be the most appropriate. It is the Company’s objective to move to higher levels on the hierarchy whenever possible, but it is sometimes necessary to move to lower priority inputs because of discontinued data sources or management’s assessment that the higher priority inputs are no longer considered to be representative of market spreads for a given type of collateral. This can happen, for example, if transaction volume changes such that a previously used spread index is no longer viewed as being reflective of current market levels.
192
The Company interpolates a curve based on the historical relationship between the premium the Company receives when a credit derivative is closed to the daily closing price of the market index related to the specific asset class and rating of the deal. This curve indicates expected credit spreads at each indicative level on the related market index. For transactions with unique terms or characteristics where no price quotes are available, management extrapolates credit spreads based on a similar transaction for which the Company has received a spread quote from one of the first
three
sources within the Company’s spread hierarchy. This alternative transaction will be within the same asset class, have similar underlying assets, similar credit ratings, and similar time to maturity. The Company then calculates the percentage of relative spread change quarter over quarter for the alternative transaction. This percentage change is then applied to the historical credit spread of the transaction for which no price quote was received in order to calculate the transactions’ current spread. Counterparties determine credit spreads by reviewing new issuance pricing for specific asset classes and receiving price quotes from their trading desks for the specific asset in question. These quotes are validated by cross-referencing quotes received from one market source with those quotes received from another market source to ensure reasonableness.
The premium the Company receives is referred to as the “net spread.” The Company’s pricing model takes into account not only how credit spreads on risks that it assumes affect pricing, but also how the Company’s own credit spread affects the pricing of its deals. The Company’s own credit risk is factored into the determination of net spread based on the impact of changes in the quoted market price for credit protection bought on the Company, as reflected by quoted market prices on CDS referencing AGC or AGM. For credit spreads on the Company’s name the Company obtains the quoted price of CDS contracts traded on AGC and AGM from market data sources published by third parties. The cost to acquire CDS protection referencing AGC or AGM affects the amount of spread on CDS deals that the Company retains and, hence, their fair value. As the cost to acquire CDS protection referencing AGC or AGM increases, the amount of premium the Company retains on a deal generally decreases. As the cost to acquire CDS protection referencing AGC or AGM decreases, the amount of premium the Company retains on a deal generally increases. In the Company’s valuation model, the premium the Company captures is not permitted to go below the minimum rate that the Company would currently charge to assume similar risks. This assumption can have the effect of mitigating the amount of unrealized gains that are recognized on certain CDS contracts. Given the current market conditions and the Company’s own credit spreads, approximately
26%
and
20%
, based on number of deals, of the Company's CDS contracts are fair valued using this minimum premium as of
December 31, 2016
and
December 31, 2015
, respectively. The percentage of deals that price using the minimum premiums fluctuates due to changes in AGM's and AGC's credit spreads. In general when AGM's and AGC's credit spreads narrow, the cost to hedge AGM's and AGC's name declines and more transactions price above previously established floor levels. Meanwhile, when AGM's and AGC's credit spreads widen, the cost to hedge AGM's and AGC's name increases causing more transactions to price at previously established floor levels. The Company corroborates the assumptions in its fair value model, including the portion of exposure to AGC and AGM hedged by its counterparties, with independent third parties each reporting period. The current level of AGC’s and AGM’s own credit spread has resulted in the bank or deal originator hedging a significant portion of its exposure to AGC and AGM. This reduces the amount of contractual cash flows AGC and AGM can capture as premium for selling its protection.
The amount of premium a financial guaranty insurance market participant can demand is inversely related to the cost of credit protection on the insurance company as measured by market credit spreads assuming all other assumptions remain constant. This is because the buyers of credit protection typically hedge a portion of their risk to the financial guarantor, due to the fact that the contractual terms of the Company's contracts typically do not require the posting of collateral by the guarantor. The extent of the hedge depends on the types of instruments insured and the current market conditions.
A fair value resulting in a credit derivative asset on protection sold is the result of contractual cash inflows on in-force deals in excess of what a hypothetical financial guarantor could receive if it sold protection on the same risk as of the reporting date. If the Company were able to freely exchange these contracts (i.e., assuming its contracts did not contain proscriptions on transfer and there was a viable exchange market), it would be able to realize a gain representing the difference between the higher contractual premiums to which it is entitled and the current market premiums for a similar contract. The Company determines the fair value of its CDS contracts by applying the difference between the current net spread and the contractual net spread for the remaining duration of each contract to the notional value of its CDS contracts and taking the present value of such amounts discounted at the corresponding LIBOR over the weighted average remaining life of the contract.
193
Example
The following is an example of how changes in gross spreads, the Company’s own credit spread and the cost to buy protection on the Company affect the amount of premium the Company can demand for its credit protection. The assumptions used in these examples are hypothetical amounts. Scenario 1 represents the market conditions in effect on the transaction date and Scenario 2 represents market conditions at a subsequent reporting date.
|
|
Scenario 1
|
Scenario 2
|
|||||||||
|
|
bps
|
% of Total
|
bps
|
% of Total
|
|||||||
|
Original gross spread/cash bond price (in bps)
|
185
|
|
|
|
500
|
|
|
|
|||
|
Bank profit (in bps)
|
115
|
|
62
|
%
|
50
|
|
10
|
%
|
|||
|
Hedge cost (in bps)
|
30
|
|
16
|
%
|
440
|
|
88
|
%
|
|||
|
The premium the Company receives per annum (in bps)
|
40
|
|
22
|
%
|
10
|
|
2
|
%
|
|||
In Scenario 1, the gross spread is
185
basis points. The bank or deal originator captures
115
basis points of the original gross spread and hedges
10%
of its exposure to AGC, when the CDS spread on AGC was
300
basis points (
300
basis points ×
10%
=
30
basis points). Under this scenario the Company receives premium of
40
basis points, or
22%
of the gross spread.
In Scenario 2, the gross spread is
500
basis points. The bank or deal originator captures
50
basis points of the original gross spread and hedges
25%
of its exposure to AGC, when the CDS spread on AGC was
1,760
basis points (
1,760
basis points ×
25%
=
440
basis points). Under this scenario the Company would receive premium of
10
basis points, or
2%
of the gross spread. Due to the increased cost to hedge AGC’s name, the amount of profit the bank would expect to receive, and the premium the Company would expect to receive decline significantly.
In this example, the contractual cash flows (the Company premium received per annum above) exceed the amount a market participant would require the Company to pay in today’s market to accept its obligations under the CDS contract, thus resulting in an asset.
Strengths and Weaknesses of Model
The Company’s credit derivative valuation model, like any financial model, has certain strengths and weaknesses.
The primary strengths of the Company’s CDS modeling techniques are:
|
•
|
The model takes into account the transaction structure and the key drivers of market value. The transaction structure includes par insured, weighted average life, level of subordination and composition of collateral.
|
|
•
|
The model maximizes the use of market-driven inputs whenever they are available. The key inputs to the model are market-based spreads for the collateral, and the credit rating of referenced entities. These are viewed by the Company to be the key parameters that affect fair value of the transaction.
|
|
•
|
The model is a consistent approach to valuing positions. The Company has developed a hierarchy for market-based spread inputs that helps mitigate the degree of subjectivity during periods of high illiquidity.
|
The primary weaknesses of the Company’s CDS modeling techniques are:
|
•
|
There is no exit market or actual exit transactions. Therefore the Company’s exit market is a hypothetical one based on the Company’s entry market.
|
|
•
|
There is a very limited market in which to validate the reasonableness of the fair values developed by the Company’s model.
|
|
•
|
The markets for the inputs to the model were highly illiquid, which impacts their reliability.
|
|
•
|
Due to the non-standard terms under which the Company enters into derivative contracts, the fair value of its credit derivatives may not reflect the same prices observed in an actively traded market of credit derivatives that do not contain terms and conditions similar to those observed in the financial guaranty market.
|
194
These contracts were classified as Level 3 in the fair value hierarchy because there is a reliance on at least one unobservable input deemed significant to the valuation model, most significantly the Company's estimate of the value of non-standard terms and conditions of its credit derivative contracts and amount of protection purchased on AGC or AGM's name.
Fair Value Option on FG VIEs’ Assets and Liabilities
The Company elected the fair value option for all the FG VIEs’ assets and liabilities. See Note 9, Consolidated Variable Interest Entities.
The FG VIEs issued securities collateralized by first lien and second lien RMBS as well as loans and receivables. The lowest level input that is significant to the fair value measurement of these assets and liabilities was a Level 3 input (i.e., unobservable), therefore management classified them as Level 3 in the fair value hierarchy. Prices are generally determined with the assistance of an independent third-party, based on a discounted cash flow approach. The models to price the FG VIEs’ liabilities used, where appropriate, inputs such as estimated prepayment speeds; market values of the assets that collateralize the securities; estimated default rates (determined on the basis of an analysis of collateral attributes, historical collateral performance, borrower profiles and other features relevant to the evaluation of collateral credit quality); yields implied by market prices for similar securities; house price depreciation/appreciation rates based on macroeconomic forecasts and, for those liabilities insured by the Company, the benefit from the Company’s insurance policy guaranteeing the timely payment of principal and interest, taking into account the timing of the potential default and the Company’s own credit rating. The third-party also utilizes an internal model to determine an appropriate yield at which to discount the cash flows of the security, by factoring in collateral types, weighted-average lives, and other structural attributes specific to the security being priced. The expected yield is further calibrated by utilizing algorithms designed to aggregate market color, received by the third-party, on comparable bonds.
The fair value of the Company’s FG VIE assets is generally sensitive to changes related to estimated prepayment speeds; estimated default rates (determined on the basis of an analysis of collateral attributes such as: historical collateral performance, borrower profiles and other features relevant to the evaluation of collateral credit quality); yields implied by market prices for similar securities; and house price depreciation/appreciation rates based on macroeconomic forecasts. Significant changes to some of these inputs could materially change the market value of the FG VIE’s assets and the implied collateral losses within the transaction. In general, the fair value of the FG VIE asset is most sensitive to changes in the projected collateral losses, where an increase in collateral losses typically leads to a decrease in the fair value of FG VIE assets, while a decrease in collateral losses typically leads to an increase in the fair value of FG VIE assets. These factors also directly impact the fair value of the Company’s FG VIE liabilities.
The fair value of the Company’s FG VIE liabilities is generally sensitive to the various model inputs described above. In addition, the Company’s FG VIE liabilities with recourse are also sensitive to changes in the Company’s implied credit worthiness. Significant changes to any of these inputs could materially change the timing of expected losses within the insured transaction which is a significant factor in determining the implied benefit from the Company’s insurance policy guaranteeing the timely payment of principal and interest for the tranches of debt issued by the FG VIE that is insured by the Company. In general, extending the timing of expected loss payments by the Company into the future typically leads to a decrease in the value of the Company’s insurance and a decrease in the fair value of the Company’s FG VIE liabilities with recourse, while a shortening of the timing of expected loss payments by the Company typically leads to an increase in the value of the Company’s insurance and an increase in the fair value of the Company’s FG VIE liabilities with recourse.
Not Carried at Fair Value
Financial Guaranty Insurance Contracts
For financial guaranty insurance contracts that are acquired in a business combination, the Company measures each contract at fair value on the date of acquisition, and then follows insurance accounting guidance on a recurring basis thereafter. On a quarterly basis, the Company also discloses the fair value of its outstanding financial guaranty insurance contracts. In both cases, fair value is based on management’s estimate of what a similarly rated financial guaranty insurance company would demand to acquire the Company’s in-force book of financial guaranty insurance business. It is based on a variety of factors that may include pricing assumptions management has observed for portfolio transfers, commutations, and acquisitions that have occurred in the financial guaranty market, as well as prices observed in the credit derivative market with an adjustment for illiquidity so that the terms would be similar to a financial guaranty insurance contract, and includes adjustments to the carrying value of unearned premium reserve for stressed losses, ceding commissions and return on capital. The significant inputs were not readily observable. The Company accordingly classified this fair value measurement as Level 3.
195
Long-Term Debt
The Company’s long-term debt, excluding notes payable, is valued by broker-dealers using third party independent pricing sources and standard market conventions. The market conventions utilize market quotations, market transactions for the Company’s comparable instruments, and to a lesser extent, similar instruments in the broader insurance industry. The fair value measurement was classified as Level 2 in the fair value hierarchy.
The fair value of the notes payable was determined by calculating the present value of the expected cash flows. The fair value measurement was classified as Level 3 in the fair value hierarchy.
Other Invested Assets
The other invested assets not carried at fair value consist primarily of investments in a guaranteed investment contract. The fair value of the investments in the guaranteed investment contract approximated their carrying value due to their short term nature. The fair value measurement of the guaranteed investment contract was classified as Level 2 in the fair value hierarchy.
Other Assets and Other Liabilities
The Company’s other assets and other liabilities consist predominantly of accrued interest, receivables for securities sold and payables for securities purchased, the carrying values of which approximate fair value.
196
Financial Instruments Carried at Fair Value
Amounts recorded at fair value in the Company’s financial statements are presented in the tables below.
Fair Value Hierarchy of Financial Instruments Carried at Fair Value
As of
December 31, 2016
|
|
|
Fair Value Hierarchy
|
|||||||||||||
|
|
Fair Value
|
Level 1
|
Level 2
|
Level 3
|
|||||||||||
|
|
(in millions)
|
||||||||||||||
|
Assets:
|
|
|
|
|
|
|
|
|
|||||||
|
Investment portfolio, available-for-sale:
|
|
|
|
|
|
|
|
|
|||||||
|
Fixed-maturity securities
|
|
|
|
|
|
|
|
|
|||||||
|
Obligations of state and political subdivisions
|
$
|
5,432
|
|
$
|
—
|
|
$
|
5,393
|
|
$
|
39
|
|
|||
|
U.S. government and agencies
|
440
|
|
—
|
|
440
|
|
—
|
|
|||||||
|
Corporate securities
|
1,613
|
|
—
|
|
1,553
|
|
60
|
|
|||||||
|
Mortgage-backed securities:
|
|
|
|||||||||||||
|
RMBS
|
987
|
|
—
|
|
622
|
|
365
|
|
|||||||
|
CMBS
|
583
|
|
—
|
|
583
|
|
—
|
|
|||||||
|
Asset-backed securities
|
945
|
|
—
|
|
140
|
|
805
|
|
|||||||
|
Foreign government securities
|
233
|
|
—
|
|
233
|
|
—
|
|
|||||||
|
Total fixed-maturity securities
|
10,233
|
|
|
—
|
|
8,964
|
|
1,269
|
|
||||||
|
Short-term investments
|
590
|
|
319
|
|
271
|
|
—
|
|
|||||||
|
Other invested assets (1)
|
8
|
|
—
|
|
0
|
|
8
|
|
|||||||
|
Credit derivative assets
|
13
|
|
—
|
|
—
|
|
13
|
|
|||||||
|
FG VIEs’ assets, at fair value
|
876
|
|
—
|
|
—
|
|
876
|
|
|||||||
|
Other assets
|
114
|
|
24
|
|
28
|
|
62
|
|
|||||||
|
Total assets carried at fair value
|
$
|
11,834
|
|
$
|
343
|
|
$
|
9,263
|
|
$
|
2,228
|
|
|||
|
Liabilities:
|
|
|
|
|
|
|
|
|
|||||||
|
Credit derivative liabilities
|
$
|
402
|
|
$
|
—
|
|
$
|
—
|
|
$
|
402
|
|
|||
|
FG VIEs’ liabilities with recourse, at fair value
|
807
|
|
—
|
|
—
|
|
807
|
|
|||||||
|
FG VIEs’ liabilities without recourse, at fair value
|
151
|
|
—
|
|
—
|
|
151
|
|
|||||||
|
Total liabilities carried at fair value
|
$
|
1,360
|
|
$
|
—
|
|
$
|
—
|
|
$
|
1,360
|
|
|||
197
Fair Value Hierarchy of Financial Instruments Carried at Fair Value
As of
December 31, 2015
|
|
|
Fair Value Hierarchy
|
|||||||||||||
|
|
Fair Value
|
Level 1
|
Level 2
|
Level 3
|
|||||||||||
|
|
(in millions)
|
||||||||||||||
|
Assets:
|
|
|
|
|
|
|
|
|
|||||||
|
Investment portfolio, available-for-sale:
|
|
|
|
|
|
|
|
|
|||||||
|
Fixed-maturity securities
|
|
|
|
|
|
|
|
|
|||||||
|
Obligations of state and political subdivisions
|
$
|
5,841
|
|
$
|
—
|
|
$
|
5,833
|
|
$
|
8
|
|
|||
|
U.S. government and agencies
|
400
|
|
—
|
|
400
|
|
—
|
|
|||||||
|
Corporate securities
|
1,520
|
|
—
|
|
1,449
|
|
71
|
|
|||||||
|
Mortgage-backed securities:
|
|
|
|
|
|
|
|
|
|||||||
|
RMBS
|
1,245
|
|
—
|
|
897
|
|
348
|
|
|||||||
|
CMBS
|
513
|
|
—
|
|
513
|
|
—
|
|
|||||||
|
Asset-backed securities
|
825
|
|
—
|
|
168
|
|
657
|
|
|||||||
|
Foreign government securities
|
283
|
|
—
|
|
283
|
|
—
|
|
|||||||
|
Total fixed-maturity securities
|
10,627
|
|
—
|
|
9,543
|
|
1,084
|
|
|||||||
|
Short-term investments
|
396
|
|
305
|
|
31
|
|
60
|
|
|||||||
|
Other invested assets(1)
|
12
|
|
—
|
|
5
|
|
7
|
|
|||||||
|
Credit derivative assets
|
81
|
|
—
|
|
—
|
|
81
|
|
|||||||
|
FG VIEs’ assets, at fair value
|
1,261
|
|
—
|
|
—
|
|
1,261
|
|
|||||||
|
Other assets
|
106
|
|
23
|
|
21
|
|
62
|
|
|||||||
|
Total assets carried at fair value
|
$
|
12,483
|
|
$
|
328
|
|
$
|
9,600
|
|
$
|
2,555
|
|
|||
|
Liabilities:
|
|
|
|
|
|
|
|
|
|||||||
|
Credit derivative liabilities
|
$
|
446
|
|
$
|
—
|
|
$
|
—
|
|
$
|
446
|
|
|||
|
FG VIEs’ liabilities with recourse, at fair value
|
1,225
|
|
—
|
|
—
|
|
1,225
|
|
|||||||
|
FG VIEs’ liabilities without recourse, at fair value
|
124
|
|
—
|
|
—
|
|
124
|
|
|||||||
|
Total liabilities carried at fair value
|
$
|
1,795
|
|
$
|
—
|
|
$
|
—
|
|
$
|
1,795
|
|
|||
____________________
|
(1)
|
Excluded from the table above are investments funds of
$48 million
and
$45 million
as of
December 31, 2016
and
December 31, 2015
, respectively, measured using NAV per share. Includes Level 3 mortgage loans that are recorded at fair value on a non-recurring basis.
|
198
Changes in Level 3 Fair Value Measurements
The table below presents a roll forward of the Company’s Level 3 financial instruments carried at fair value on a recurring basis during the years ended
December 31, 2016
and
2015
.
Fair Value Level 3 Rollforward
Recurring Basis
Year Ended December 31,
2016
|
Fixed-Maturity Securities
|
||||||||||||||||||||||||||||||||||||||||||||||||||
|
|
Obligations
of State and Political Subdivisions |
|
Corporate Securities
|
RMBS
|
|
Asset-
Backed Securities |
|
Short-Term Investments
|
FG VIEs’
Assets at Fair Value |
|
Other
Assets (8) |
|
Credit
Derivative Asset (Liability), net (5) |
|
FG VIEs' Liabilities with Recourse,
at Fair Value |
FG VIEs' Liabilities without Recourse,
at Fair Value |
||||||||||||||||||||||||||||||||||
|
|
(in millions)
|
|||||||||||||||||||||||||||||||||||||||||||||||||
|
Fair value as of December 31, 2015
|
$
|
8
|
|
$
|
71
|
|
$
|
348
|
|
$
|
657
|
|
|
|
$
|
60
|
|
$
|
1,261
|
|
|
|
$
|
65
|
|
|
|
$
|
(365
|
)
|
$
|
(1,225
|
)
|
$
|
(124
|
)
|
||||||||||||||
|
CIFG Acquisition
|
1
|
|
—
|
|
20
|
|
36
|
|
0
|
|
—
|
|
—
|
|
(67
|
)
|
—
|
|
—
|
|
||||||||||||||||||||||||||||||
|
Total pretax realized and unrealized gains/(losses) recorded in: (1)
|
|
|
|
|
|
|
|
|
|
|
|
|
|
|
|
|
|
|
||||||||||||||||||||||||||||||||
|
Net income (loss)
|
2
|
|
(2
|
)
|
(16
|
)
|
(2
|
)
|
10
|
|
(2
|
)
|
51
|
|
(2
|
)
|
0
|
|
(2
|
)
|
167
|
|
(3
|
)
|
0
|
|
(4
|
)
|
74
|
|
(6
|
)
|
(125
|
)
|
(3
|
)
|
(18
|
)
|
(3
|
)
|
||||||||||
|
Other comprehensive income (loss)
|
(4
|
)
|
5
|
|
(13
|
)
|
116
|
|
|
|
0
|
|
—
|
|
|
|
0
|
|
|
|
—
|
|
|
|
—
|
|
|
|
—
|
|
||||||||||||||||||||
|
Purchases
|
33
|
|
—
|
|
70
|
|
76
|
|
|
|
—
|
|
—
|
|
|
|
—
|
|
|
|
—
|
|
|
|
—
|
|
|
|
—
|
|
||||||||||||||||||||
|
Settlements
|
(1
|
)
|
—
|
|
(70
|
)
|
(139
|
)
|
(60
|
)
|
(629
|
)
|
—
|
|
|
|
(31
|
)
|
|
|
597
|
|
|
|
14
|
|
||||||||||||||||||||||||
|
FG VIE consolidations
|
—
|
|
—
|
|
—
|
|
—
|
|
|
|
—
|
|
97
|
|
|
|
—
|
|
|
|
—
|
|
|
|
(54
|
)
|
(43
|
)
|
||||||||||||||||||||||
|
FG VIE deconsolidations
|
—
|
|
—
|
|
0
|
|
—
|
|
—
|
|
(20
|
)
|
—
|
|
—
|
|
—
|
|
20
|
|
||||||||||||||||||||||||||||||
|
Transfers into Level 3
|
—
|
|
—
|
|
—
|
|
8
|
|
—
|
|
—
|
|
—
|
|
—
|
|
—
|
|
—
|
|
||||||||||||||||||||||||||||||
|
Fair value as of December 31, 2016
|
$
|
39
|
|
$
|
60
|
|
$
|
365
|
|
$
|
805
|
|
|
|
$
|
—
|
|
$
|
876
|
|
|
|
$
|
65
|
|
|
|
$
|
(389
|
)
|
$
|
(807
|
)
|
$
|
(151
|
)
|
||||||||||||||
|
Change in unrealized gains/(losses) related to financial instruments held as of December 31, 2016
|
$
|
(4
|
)
|
$
|
5
|
|
$
|
(15
|
)
|
$
|
116
|
|
$
|
—
|
|
$
|
93
|
|
$
|
0
|
|
$
|
(33
|
)
|
$
|
(12
|
)
|
$
|
(17
|
)
|
||||||||||||||||||||
199
Fair Value Level 3 Rollforward
Recurring Basis
Year Ended December 31,
2015
|
Fixed-Maturity Securities
|
||||||||||||||||||||||||||||||||||||||||||||||||||
|
Obligations
of State and Political Subdivisions |
|
Corporate Securities
|
RMBS
|
|
Asset-
Backed Securities |
|
Short-Term Investments
|
FG VIEs’
Assets at Fair Value |
|
Other
Assets (8) |
|
Credit
Derivative Asset (Liability), net (5) |
|
FG VIEs' Liabilities with Recourse,
at Fair Value |
FG VIEs' Liabilities without Recourse,
at Fair Value |
|||||||||||||||||||||||||||||||||||
|
(in millions)
|
||||||||||||||||||||||||||||||||||||||||||||||||||
|
Fair value as of December 31, 2014
|
$
|
38
|
|
$
|
79
|
|
$
|
425
|
|
$
|
228
|
|
$
|
—
|
|
$
|
1,398
|
|
|
|
$
|
37
|
|
$
|
(895
|
)
|
|
|
$
|
(1,277
|
)
|
$
|
(142
|
)
|
||||||||||||||||
|
Radian Asset Acquisition
|
—
|
|
—
|
|
4
|
|
—
|
|
—
|
|
122
|
|
2
|
|
(215
|
)
|
(114
|
)
|
(4
|
)
|
||||||||||||||||||||||||||||||
|
Total pretax realized and unrealized gains/(losses) recorded in: (1)
|
|
|
|
|
|
|
||||||||||||||||||||||||||||||||||||||||||||
|
Net income (loss)
|
3
|
|
(2
|
)
|
3
|
|
(2
|
)
|
18
|
|
(2
|
)
|
1
|
|
(2
|
)
|
24
|
|
(2
|
)
|
59
|
|
(3
|
)
|
26
|
|
(4
|
)
|
728
|
|
(6
|
)
|
111
|
|
(3
|
)
|
(28
|
)
|
(3
|
)
|
||||||||||
|
Other comprehensive income (loss)
|
(2
|
)
|
(11
|
)
|
(12
|
)
|
(9
|
)
|
0
|
|
—
|
|
|
|
0
|
|
—
|
|
|
|
—
|
|
|
|
—
|
|
||||||||||||||||||||||||
|
Purchases
|
—
|
|
—
|
|
48
|
|
471
|
|
52
|
|
(7
|
)
|
—
|
|
|
|
—
|
|
—
|
|
|
|
—
|
|
|
|
—
|
|
||||||||||||||||||||||
|
Settlements
|
(31
|
)
|
(7
|
)
|
—
|
|
(134
|
)
|
(34
|
)
|
(16
|
)
|
(400
|
)
|
—
|
|
17
|
|
|
|
186
|
|
|
|
28
|
|
||||||||||||||||||||||||
|
FG VIE consolidations
|
—
|
|
—
|
|
(1
|
)
|
—
|
|
—
|
|
104
|
|
|
|
—
|
|
—
|
|
|
|
(131
|
)
|
—
|
|
||||||||||||||||||||||||||
|
FG VIE deconsolidations
|
—
|
|
—
|
|
—
|
|
—
|
|
—
|
|
(22
|
)
|
—
|
|
—
|
|
—
|
|
22
|
|
||||||||||||||||||||||||||||||
|
Fair value as of December 31, 2015
|
$
|
8
|
|
$
|
71
|
|
$
|
348
|
|
$
|
657
|
|
$
|
60
|
|
$
|
1,261
|
|
|
|
$
|
65
|
|
$
|
(365
|
)
|
|
|
$
|
(1,225
|
)
|
$
|
(124
|
)
|
||||||||||||||||
|
Change in unrealized gains/(losses) related to financial instruments held as of December 31, 2015
|
$
|
0
|
|
$
|
(11
|
)
|
$
|
(9
|
)
|
$
|
(9
|
)
|
$
|
0
|
|
$
|
110
|
|
$
|
26
|
|
$
|
281
|
|
$
|
4
|
|
$
|
(22
|
)
|
||||||||||||||||||||
____________________
|
(1)
|
Realized and unrealized gains (losses) from changes in values of Level 3 financial instruments represent gains (losses) from changes in values of those financial instruments only for the periods in which the instruments were classified as Level 3.
|
|
(2)
|
Included in net realized investment gains (losses) and net investment income.
|
|
(3)
|
Included in fair value gains (losses) on FG VIEs.
|
|
(4)
|
Recorded in fair value gains (losses) on CCS, net realized investment gains (losses), net investment income and other income.
|
|
(5)
|
Represents net position of credit derivatives. The consolidated balance sheet presents gross assets and liabilities based on net counterparty exposure.
|
|
(6)
|
Reported in net change in fair value of credit derivatives and other income.
|
|
(7)
|
Primarily non-cash transaction.
|
|
(8)
|
Includes CCS and other invested assets.
|
200
Level 3 Fair Value Disclosures
Quantitative Information About Level 3 Fair Value Inputs
At
December 31, 2016
|
Financial Instrument Description(1)
|
Fair Value at December 31, 2016(in millions)
|
Significant Unobservable Inputs
|
Range
|
Weighted Average as a Percentage of Current Par Outstanding
|
|||||||||
|
Assets (2):
|
|
|
|
|
|||||||||
|
Fixed-maturity securities:
|
|
|
|
||||||||||
|
Obligations of state and political subdivisions
|
$
|
39
|
|
Yield
|
4.3
|
%
|
-
|
22.8%
|
11.1%
|
||||
|
Corporate securities
|
60
|
|
Yield
|
20.1%
|
|||||||||
|
RMBS
|
365
|
|
CPR
|
1.6
|
%
|
-
|
17.0%
|
4.6%
|
|||||
|
CDR
|
1.5
|
%
|
-
|
10.1%
|
6.7%
|
||||||||
|
Loss severity
|
30.0
|
%
|
-
|
100.0%
|
77.8%
|
||||||||
|
Yield
|
3.3
|
%
|
-
|
9.7%
|
6.0%
|
||||||||
|
Asset-backed securities:
|
|||||||||||||
|
Triple-X life insurance transactions
|
425
|
|
Yield
|
5.7
|
%
|
-
|
6.0%
|
5.8%
|
|||||
|
Collateralized debt obligations (CDO)
|
332
|
|
Yield
|
10.0%
|
|||||||||
|
CLO/TruPS
|
19
|
|
Yield
|
1.5
|
%
|
-
|
4.8%
|
3.1%
|
|||||
|
Others
|
29
|
|
Yield
|
7.2%
|
|||||||||
|
FG VIEs’ assets, at fair value
|
876
|
|
CPR
|
3.5
|
%
|
-
|
12.0%
|
7.8%
|
|||||
|
CDR
|
2.5
|
%
|
-
|
21.6%
|
5.7%
|
||||||||
|
Loss severity
|
35.0
|
%
|
-
|
100.0%
|
78.6%
|
||||||||
|
Yield
|
2.9
|
%
|
-
|
20.0%
|
6.5%
|
||||||||
|
Other assets
|
62
|
|
Implied Yield
|
4.5
|
%
|
-
|
5.1%
|
4.8%
|
|||||
|
Term (years)
|
10 years
|
||||||||||||
|
Liabilities:
|
|
|
|
|
|||||||||
|
Credit derivative liabilities, net
|
(389
|
)
|
Year 1 loss estimates
|
0.0
|
%
|
-
|
38.0%
|
1.3%
|
|||||
|
Hedge cost (in bps)
|
7.2
|
|
-
|
118.1
|
24.5
|
||||||||
|
Bank profit (in bps)
|
3.8
|
|
-
|
825.0
|
61.8
|
||||||||
|
Internal floor (in bps)
|
7.0
|
|
-
|
100.0
|
13.9
|
||||||||
|
Internal credit rating
|
AAA
|
|
-
|
CCC
|
AA+
|
||||||||
|
FG VIEs’ liabilities, at fair value
|
(958
|
)
|
CPR
|
3.5
|
%
|
-
|
12.0%
|
7.8%
|
|||||
|
CDR
|
2.5
|
%
|
-
|
21.6%
|
5.7%
|
||||||||
|
Loss severity
|
35.0
|
%
|
-
|
100.0%
|
78.6%
|
||||||||
|
Yield
|
2.4
|
%
|
-
|
20.0%
|
5.0%
|
||||||||
|
(1)
|
Discounted cash flow is used as valuation technique for all financial instruments.
|
|
(2)
|
Excludes several investments recorded in other invested assets with fair value of
$8 million
.
|
201
Quantitative Information About Level 3 Fair Value Inputs
At
December 31, 2015
|
Financial Instrument Description(1)
|
Fair Value at December 31, 2015(in millions)
|
Significant Unobservable Inputs
|
Range
|
Weighted Average as a Percentage of Current Par Outstanding
|
|||||||||
|
Assets (2):
|
|
|
|
|
|||||||||
|
Fixed-maturity securities (3):
|
|
|
|
||||||||||
|
Corporate securities
|
$
|
71
|
|
Yield
|
21.8%
|
||||||||
|
RMBS
|
348
|
|
CPR
|
0.3
|
%
|
-
|
9.0%
|
2.6%
|
|||||
|
CDR
|
2.7
|
%
|
-
|
9.3%
|
7.0%
|
||||||||
|
Loss severity
|
60.0
|
%
|
-
|
100.0%
|
74.0%
|
||||||||
|
Yield
|
4.7
|
%
|
-
|
8.2%
|
6.0%
|
||||||||
|
Asset-backed securities:
|
|||||||||||||
|
Investor owned utility
|
69
|
|
Cash flow receipts
|
100.0%
|
|||||||||
|
Collateral recovery period
|
2.9 years
|
||||||||||||
|
Discount factor
|
7.0%
|
||||||||||||
|
Triple-X life insurance transactions
|
329
|
|
Yield
|
3.5
|
%
|
-
|
7.5%
|
5.0%
|
|||||
|
CDO
|
259
|
|
Yield
|
20.0%
|
|||||||||
|
Short-term investments
|
60
|
|
Yield
|
17.0%
|
|||||||||
|
FG VIEs’ assets, at fair value
|
1,261
|
|
CPR
|
0.3
|
%
|
-
|
9.2%
|
3.9%
|
|||||
|
CDR
|
1.2
|
%
|
-
|
16.0%
|
4.7%
|
||||||||
|
Loss severity
|
40.0
|
%
|
-
|
100.0%
|
85.9%
|
||||||||
|
Yield
|
1.9
|
%
|
-
|
20.0%
|
6.4%
|
||||||||
|
Other assets
|
62
|
|
Implied Yield
|
5.5
|
%
|
-
|
6.4%
|
5.9%
|
|||||
|
Term (years)
|
5 years
|
||||||||||||
|
Liabilities:
|
|
|
|
|
|||||||||
|
Credit derivative liabilities, net
|
(365
|
)
|
Year 1 loss estimates
|
0.0
|
%
|
-
|
41.0%
|
0.6%
|
|||||
|
Hedge cost (in bps)
|
32.8
|
|
-
|
282.0
|
66.3
|
||||||||
|
Bank profit (in bps)
|
3.8
|
|
-
|
1,017.5
|
110.8
|
||||||||
|
Internal floor (in bps)
|
7.0
|
|
-
|
100.0
|
16.8
|
||||||||
|
Internal credit rating
|
AAA
|
|
-
|
CCC
|
AA+
|
||||||||
|
FG VIEs’ liabilities, at fair value
|
(1,349
|
)
|
CPR
|
0.3
|
%
|
-
|
9.2%
|
3.9%
|
|||||
|
CDR
|
1.2
|
%
|
-
|
16.0%
|
4.7%
|
||||||||
|
Loss severity
|
40.0
|
%
|
-
|
100.0%
|
85.9%
|
||||||||
|
Yield
|
1.9
|
%
|
-
|
20.0%
|
5.6%
|
||||||||
____________________
|
(1)
|
Discounted cash flow is used as valuation technique for all financial instruments.
|
|
(2)
|
Excludes several investments recorded in other invested assets with fair value of
$7 million
.
|
|
(3)
|
Excludes obligations of state and political subdivisions investments with fair value of
$8 million
.
|
202
The carrying amount and estimated fair value of the Company’s financial instruments are presented in the following table.
Fair Value of Financial Instruments
|
|
As of
December 31, 2016 |
As of
December 31, 2015 |
|||||||||||||
|
|
Carrying
Amount
|
Estimated
Fair Value
|
Carrying
Amount
|
Estimated
Fair Value
|
|||||||||||
|
|
(in millions)
|
||||||||||||||
|
Assets:
|
|
|
|
|
|
|
|
|
|||||||
|
Fixed-maturity securities
|
$
|
10,233
|
|
$
|
10,233
|
|
$
|
10,627
|
|
$
|
10,627
|
|
|||
|
Short-term investments
|
590
|
|
590
|
|
396
|
|
396
|
|
|||||||
|
Other invested assets(1)
|
146
|
|
147
|
|
150
|
|
152
|
|
|||||||
|
Credit derivative assets
|
13
|
|
13
|
|
81
|
|
81
|
|
|||||||
|
FG VIEs’ assets, at fair value
|
876
|
|
876
|
|
1,261
|
|
1,261
|
|
|||||||
|
Other assets
|
205
|
|
205
|
|
206
|
|
206
|
|
|||||||
|
Liabilities:
|
|
|
|
|
|
|
|
|
|||||||
|
Financial guaranty insurance contracts(2)
|
3,483
|
|
8,738
|
|
3,998
|
|
8,712
|
|
|||||||
|
Long-term debt
|
1,306
|
|
1,546
|
|
1,300
|
|
1,512
|
|
|||||||
|
Credit derivative liabilities
|
402
|
|
402
|
|
446
|
|
446
|
|
|||||||
|
FG VIEs’ liabilities with recourse, at fair value
|
807
|
|
807
|
|
1,225
|
|
1,225
|
|
|||||||
|
FG VIEs’ liabilities without recourse, at fair value
|
151
|
|
151
|
|
124
|
|
124
|
|
|||||||
|
Other liabilities
|
12
|
|
12
|
|
9
|
|
9
|
|
|||||||
____________________
|
(1)
|
Includes investments not carried at fair value with a carrying value of
$93 million
and
$93 million
as of
December 31, 2016
and
December 31, 2015
, respectively. Excludes investments carried under the equity method.
|
|
(2)
|
Carrying amount includes the assets and liabilities related to financial guaranty insurance contract premiums, losses, and salvage and subrogation and other recoverables net of reinsurance.
|
|
8.
|
Contracts Accounted for as Credit Derivatives
|
The Company has a portfolio of financial guaranty contracts that meet the definition of a derivative in accordance with GAAP (primarily CDS). The credit derivatives portfolio also includes interest rate swaps and hedges on other financial guarantors.
Accounting Policy
Credit derivatives are recorded at fair value. Changes in fair value are recorded in “net change in fair value of credit derivatives” on the consolidated statement of operations. Realized gains (losses) and other settlements on credit derivatives include credit derivative premiums received and receivable for credit protection the Company has sold under its insured CDS contracts, premiums paid and payable for credit protection the Company has purchased, claims paid and payable and received and receivable related to insured credit events under these contracts, ceding commission expense or income and realized gains or losses related to their early termination. Fair value of credit derivatives is reflected as either net assets or net liabilities determined on a contract by contract basis in the Company's consolidated balance sheets. See Note 7, Fair Value Measurement, for a discussion on the fair value methodology for credit derivatives.
Credit Derivative Net Par Outstanding by Sector
Credit derivative transactions are governed by ISDA documentation and have different characteristics from financial guaranty insurance contracts. For example, the Company’s control rights with respect to a reference obligation under a credit derivative may be more limited than when the Company issues a financial guaranty insurance contract. In addition, there are more circumstances under which the Company may be obligated to make payments. Similar to a financial guaranty insurance contract, the Company would be obligated to pay if the obligor failed to make a scheduled payment of principal or interest in
203
full. However, the Company may also be required to pay if the obligor becomes bankrupt or if the reference obligation were restructured if, after negotiation, those credit events are specified in the documentation for the credit derivative transactions. Furthermore, the Company may be required to make a payment due to an event that is unrelated to the performance of the obligation referenced in the credit derivative. If events of default or termination events specified in the credit derivative documentation were to occur, the non-defaulting or the non-affected party, which may be either the Company or the counterparty, depending upon the circumstances, may decide to terminate a credit derivative prior to maturity. In that case, the Company may be required to make a termination payment to its swap counterparty upon such termination. Absent such an event of default or termination event, the Company may not unilaterally terminate a CDS contract; however, the Company on occasion has mutually agreed with various counterparties to terminate certain CDS transactions.
The estimated remaining weighted average life of credit derivatives was
5.3
years at
December 31, 2016
and
5.4
years at
December 31, 2015
. The components of the Company’s credit derivative net par outstanding are presented below.
Credit Derivatives
|
|
As of December 31, 2016
|
As of December 31, 2015
|
||||||||||
|
Asset Type
|
Net Par
Outstanding
|
Weighted Average
Credit Rating
|
Net Par
Outstanding
|
Weighted Average
Credit Rating
|
||||||||
|
|
(dollars in millions)
|
|||||||||||
|
Pooled corporate obligations:
|
|
|
|
|
|
|
||||||
|
Collateralized loan obligations (CLO) /collateralized bond obligations
|
$
|
2,022
|
|
AAA
|
$
|
5,873
|
|
AAA
|
||||
|
Synthetic investment grade pooled corporate
|
7,224
|
|
AAA
|
7,108
|
|
AAA
|
||||||
|
TruPS CDOs
|
1,179
|
|
BBB+
|
3,429
|
|
A-
|
||||||
|
Market value CDOs of corporate obligations
|
—
|
|
--
|
1,113
|
|
AAA
|
||||||
|
Total pooled corporate obligations
|
10,425
|
|
AAA
|
17,523
|
|
AAA
|
||||||
|
U.S. RMBS
|
1,142
|
|
AA-
|
1,526
|
|
A+
|
||||||
|
CMBS
|
—
|
|
--
|
530
|
|
AAA
|
||||||
|
Other
|
5,430
|
|
A+
|
6,015
|
|
A
|
||||||
|
Total(1)
|
$
|
16,997
|
|
AA+
|
$
|
25,594
|
|
AA+
|
||||
____________________
|
(1)
|
The
December 31, 2016
total amount includes
$1.7 billion
net par outstanding of credit derivatives from CIFG Acquisition.
|
Except for TruPS CDOs, the Company’s exposure to pooled corporate obligations is highly diversified in terms of obligors and industries. Most pooled corporate transactions are structured to limit exposure to any given obligor and industry. The majority of the Company’s pooled corporate exposure consists of CLO or synthetic pooled corporate obligations. Most of these CLOs have an average obligor size of less than
1%
of the total transaction and typically restrict the maximum exposure to any one industry to approximately
10%
. The Company’s exposure also benefits from embedded credit enhancement in the transactions which allows a transaction to sustain a certain level of losses in the underlying collateral, further insulating the Company from industry specific concentrations of credit risk on these deals.
The Company’s TruPS CDO asset pools are generally less diversified by obligors and industries than the typical CLO asset pool. Also, the underlying collateral in TruPS CDOs consists primarily of subordinated debt instruments such as TruPS issued by bank holding companies and similar instruments issued by insurance companies, real estate investment trusts and other real estate related issuers while CLOs typically contain primarily senior secured obligations. However, to mitigate these risks TruPS CDOs were typically structured with higher levels of embedded credit enhancement than typical CLOs.
204
The Company’s exposure to “Other” CDS contracts is also highly diversified. It includes
$1.5 billion
of exposure to
one
pooled infrastructure transaction comprising diversified pools of international infrastructure project transactions and loans to regulated utilities. These pools were all structured with underlying credit enhancement sufficient for the Company to attach at AAA levels at origination. The remaining
$3.9 billion
of exposure in “Other” CDS contracts comprises numerous deals across various asset classes, such as commercial receivables, international RMBS, infrastructure, regulated utilities and consumer receivables.
Distribution of Credit Derivative Net Par Outstanding by Internal Rating
|
|
As of December 31, 2016
|
As of December 31, 2015
|
||||||||||||
|
Ratings
|
Net Par
Outstanding
|
% of Total
|
Net Par
Outstanding
|
% of Total
|
||||||||||
|
|
(dollars in millions)
|
|||||||||||||
|
AAA
|
$
|
10,967
|
|
64.6
|
%
|
$
|
14,808
|
|
57.9
|
%
|
||||
|
AA
|
2,167
|
|
12.7
|
|
4,821
|
|
18.8
|
|
||||||
|
A
|
1,499
|
|
8.8
|
|
2,144
|
|
8.4
|
|
||||||
|
BBB
|
1,391
|
|
8.2
|
|
2,212
|
|
8.6
|
|
||||||
|
BIG
|
973
|
|
5.7
|
|
1,609
|
|
6.3
|
|
||||||
|
Credit derivative net par outstanding
|
$
|
16,997
|
|
100.0
|
%
|
$
|
25,594
|
|
100.0
|
%
|
||||
Fair Value of Credit Derivatives
Net Change in Fair Value of Credit Derivatives Gain (Loss)
|
Year Ended December 31,
|
|||||||||||
|
|
2016
|
2015
|
2014
|
||||||||
|
|
(in millions)
|
||||||||||
|
Realized gains on credit derivatives
|
$
|
56
|
|
$
|
63
|
|
$
|
73
|
|
||
|
Net credit derivative losses (paid and payable) recovered and recoverable and other settlements
|
(27
|
)
|
(81
|
)
|
(50
|
)
|
|||||
|
Realized gains (losses) and other settlements
|
29
|
|
(18
|
)
|
23
|
|
|||||
|
Net unrealized gains (losses):
|
|||||||||||
|
Pooled corporate obligations
|
(16
|
)
|
147
|
|
(18
|
)
|
|||||
|
U.S. RMBS
|
22
|
|
396
|
|
814
|
|
|||||
|
CMBS
|
0
|
|
42
|
|
2
|
|
|||||
|
Other
|
63
|
|
161
|
|
2
|
|
|||||
|
Net unrealized gains (losses)
|
69
|
|
746
|
|
800
|
|
|||||
|
Net change in fair value of credit derivatives
|
$
|
98
|
|
$
|
728
|
|
$
|
823
|
|
||
Terminations and Settlements
of Direct Credit Derivative Contracts
|
Year Ended December 31,
|
|||||||||||
|
|
2016
|
2015
|
2014
|
||||||||
|
|
(in millions)
|
||||||||||
|
Net par of terminated credit derivative contracts
|
$
|
3,811
|
|
$
|
2,777
|
|
$
|
3,591
|
|
||
|
Realized gains on credit derivatives
|
20
|
|
13
|
|
1
|
|
|||||
|
Net credit derivative losses (paid and payable) recovered and recoverable and other settlements
|
—
|
|
(116
|
)
|
(26
|
)
|
|||||
|
Net unrealized gains (losses) on credit derivatives
|
103
|
|
465
|
|
546
|
|
|||||
205
During 2016, unrealized fair value gains were generated primarily as a result of CDS terminations in the U.S. RMBS and other sectors, run-off of CDS par and price improvements on the underlying collateral of the Company’s CDS. The majority of the CDS transactions were terminated as a result of settlement agreements with several CDS counterparties. The unrealized fair value gains were partially offset by unrealized losses resulting from wider implied net spreads across all sectors. The wider implied net spreads were primarily a result of the decreased cost to buy protection in AGC’s and AGM’s name, as the market cost of AGC’s and AGM’s credit protection decreased significantly during the period. These transactions were pricing at or above their floor levels (or the minimum rate at which the Company would consider assuming these risks based on historical experience); therefore when the cost of purchasing CDS protection on AGC and AGM, which management refers to as the CDS spread on AGC and AGM, decreased the implied spreads that the Company would expect to receive on these transactions increased.
During 2015, unrealized fair value gains were generated primarily as a result of CDS terminations. The Company reached a settlement agreement with
one
CDS counterparty to terminate
five
Alt-A first lien CDS transactions resulting in unrealized fair value gains of
$213 million
and was the primary driver of the unrealized fair value gains in the U.S. RMBS sector. The Company also terminated a CMBS transaction, a Triple-X life insurance securitization transaction, and a distressed middle market CLO securitization during the period and recognized unrealized fair value gains of
$41 million
,
$99 million
and
$99 million
, respectively. These were the primary drivers of the unrealized fair value gains in the CMBS, Other, and pooled corporate CLO sectors, respectively, during the period. The remainder of the fair value gains for the period were a result of tighter implied net spreads across all sectors. The tighter implied net spreads were primarily a result of the increased cost to buy protection in AGC’s and AGM’s name, particularly for the one year CDS spread. These transactions were pricing at or above their floor levels, therefore when the cost of purchasing CDS protection on AGC and AGM increased, the implied spreads that the Company would expect to receive on these transactions decreased. Finally, during 2015, there was a refinement in methodology to address an instance in a U.S. RMBS transaction where the Company now expects recoveries. This refinement resulted in approximately
$49 million
in fair value gains in 2015.
During 2014, unrealized fair value gains were generated primarily in the U.S. RMBS prime first lien, Option ARM and subprime sectors. This is primarily due to a significant unrealized fair value gain in the Option ARM and Alt-A first lien sector of approximately $
543 million
, as a result of the terminations of
three
large Alt-A first lien resecuritization transactions and
one
Option ARM first lien transaction during the period. In addition, there was an unrealized gain of approximately
$346 million
related to the change in index used to determine fair value during the fourth quarter of 2014. In the fourth quarter of 2014, new market indices were published on Option ARM and Alt-A first lien securitizations. As part of the Company’s normal review process the Company reviewed these indices and based upon the collateral make-up, collateral vintage, and collateral loss experience, determined it to be a better market indication for the Company’s Option ARM and Alt-A first lien securitizations. The unrealized fair value gains were partially offset by unrealized fair value losses generated by wider implied net spreads. The wider implied net spreads were primarily a result of the decreased cost to buy protection in AGC’s and AGM’s name, as the market cost of AGC's and AGM’s credit protection decreased during the period. These transactions were pricing at or above their floor levels (or the minimum rate at which the Company would consider assuming these risks based on historical experience); therefore when the cost of purchasing CDS protection on AGC and AGM decreased, the implied spreads that the Company would expect to receive on these transactions increased.
The impact of changes in credit spreads will vary based upon the volume, tenor, interest rates, and other market conditions at the time these fair values are determined. In addition, since each transaction has unique collateral and structural terms, the underlying change in fair value of each transaction may vary considerably. The fair value of credit derivative contracts also reflects the change in the Company’s own credit cost based on the price to purchase credit protection on AGC and AGM. The Company determines its own credit risk based on quoted CDS prices traded on the Company at each balance sheet date.
206
CDS Spread on AGC and AGM
Quoted price of CDS contract (in basis points)
|
|
As of
December 31, 2016 |
As of
December 31, 2015 |
As of
December 31, 2014 |
|||||
|
Five-year CDS spread:
|
||||||||
|
AGC
|
158
|
|
376
|
|
323
|
|
||
|
AGM
|
158
|
|
366
|
|
325
|
|
||
|
One-year CDS spread:
|
||||||||
|
AGC
|
35
|
|
139
|
|
80
|
|
||
|
AGM
|
29
|
|
131
|
|
85
|
|
||
Fair Value of Credit Derivatives Assets (Liabilities)
and Effect of AGC and AGM
Credit Spreads
|
|
As of
December 31, 2016 |
As of
December 31, 2015 |
|||||
|
|
(in millions)
|
||||||
|
Fair value of credit derivatives before effect of AGC and AGM credit spreads
|
$
|
(811
|
)
|
$
|
(1,448
|
)
|
|
|
Plus: Effect of AGC and AGM credit spreads
|
422
|
|
1,083
|
|
|||
|
Net fair value of credit derivatives
|
$
|
(389
|
)
|
$
|
(365
|
)
|
|
The fair value of CDS contracts at
December 31, 2016
, before considering the implications of AGC’s and AGM’s credit spreads, is a direct result of continued wide credit spreads in the fixed income security markets and ratings downgrades. The asset classes that remain most affected are TruPS and pooled corporate securities as well as 2005-2007 vintages of Alt-A, Option ARM and subprime RMBS deals. The mark to market benefit between
December 31, 2016
, and
December 31, 2015
, resulted primarily from several CDS terminations and a narrowing of credit spreads related to the Company's TruPS and U.S. RMBS obligations.
Management believes that the trading level of AGC’s and AGM’s credit spreads over the past several years has been due to the correlation between AGC’s and AGM’s risk profile and the current risk profile of the broader financial markets, as well as the overall lack of liquidity in the CDS market. Offsetting the benefit attributable to AGC’s and AGM’s credit spread were higher credit spreads in the fixed income security markets. The higher credit spreads in the fixed income security market are due to the lack of liquidity in the high yield CDO, TruPS CDO, and CLO markets as well as continuing market concerns over the 2005-2007 vintages of RMBS.
The following table presents the fair value and the present value of expected claim payments or recoveries (i.e., net expected loss to be paid as described in Note 5) for contracts accounted for as derivatives.
Net Fair Value and Expected Losses
of Credit Derivatives
|
As of
December 31, 2016 |
As of
December 31, 2015 |
||||||
|
|
(in millions)
|
||||||
|
Fair value of credit derivative asset (liability), net
|
$
|
(389
|
)
|
$
|
(365
|
)
|
|
|
Expected loss to be (paid) recovered
|
(10
|
)
|
(16
|
)
|
|||
207
Ratings Sensitivities of Credit Derivative Contracts
Within the Company’s insured CDS portfolio, the transaction documentation for approximately
$0.7 billion
in CDS gross par insured as of
December 31, 2016
requires AGC to post eligible collateral to secure its obligations to make payments under such contracts. This constitutes a reduction of approximately
$3.1 billion
from the
$3.8 billion
subject to such a requirement as of December 31, 2015, primarily due to an agreement reached in May 2016 with a CDS counterparty reducing the collateral posting requirement with respect to that counterparty to
zero
. Eligible collateral is generally cash or U.S. government or agency securities; eligible collateral other than cash is valued at a discount to the face amount.
|
•
|
For approximately
$516 million
gross par of such contracts, AGC has negotiated caps such that the posting requirement cannot exceed a certain fixed amount, regardless of the mark-to-market valuation of the exposure or the financial strength ratings of AGC. For such contracts, AGC need not post on a cash basis an aggregate of more than
$500 million
, although the value of the collateral posted may exceed such fixed amount depending on the advance rate agreed with the counterparty for the particular type of collateral posted.
|
|
•
|
For the remaining approximately
$174 million
gross par of such contracts, AGC could be required from time to time to post additional collateral without such cap based on movements in the mark-to-market valuation of the underlying exposure.
|
As of
December 31, 2016
, the Company was posting approximately
$116 million
to secure its obligations under CDS, of which approximately
$16 million
related to the
$174 million
of gross par described above, as to which the obligation to collateralize is not capped. As of
December 31, 2015
, the Company was posting approximately
$305 million
to secure its obligations under CDS, of which approximately
$23 million
related to
$221 million
of gross par as to which the obligation to collateralize was not capped. In February 2017, the Company terminated all of its remaining CDS contracts with
one
of its counterparties as to which it had a posting requirement (subject to a cap); the CDS contracts related to approximately
$183 million
gross par and
$73 million
of collateral posted, as
December 31, 2016
; and all the collateral is being returned to the Company.
Sensitivity to Changes in Credit Spread
The following table summarizes the estimated change in fair values on the net balance of the Company’s credit derivative positions assuming immediate parallel shifts in credit spreads on AGC and AGM and on the risks that they both assume.
Effect of Changes in Credit Spread
As of December 31, 2016
|
Credit Spreads(1)
|
Estimated Net
Fair Value
(Pre-Tax)
|
Estimated Change
in Gain/(Loss)
(Pre-Tax)
|
||||||
|
|
(in millions)
|
|||||||
|
100% widening in spreads
|
$
|
(791
|
)
|
$
|
(402
|
)
|
||
|
50% widening in spreads
|
(590
|
)
|
(201
|
)
|
||||
|
25% widening in spreads
|
(490
|
)
|
(101
|
)
|
||||
|
10% widening in spreads
|
(430
|
)
|
(41
|
)
|
||||
|
Base Scenario
|
(389
|
)
|
—
|
|
||||
|
10% narrowing in spreads
|
(351
|
)
|
38
|
|
||||
|
25% narrowing in spreads
|
(295
|
)
|
94
|
|
||||
|
50% narrowing in spreads
|
(203
|
)
|
186
|
|
||||
____________________
|
(1)
|
Includes the effects of spreads on both the underlying asset classes and the Company’s own credit spread.
|
208
|
9.
|
Consolidated Variable Interest Entities
|
Background
The Company provides financial guaranties with respect to debt obligations of special purpose entities, including VIEs. Assured Guaranty does not act as the servicer or collateral manager for any VIE obligations insured by its companies. The transaction structure generally provides certain financial protections to the Company. This financial protection can take several forms, the most common of which are overcollateralization, first loss protection (or subordination) and excess spread. In the case of overcollateralization (i.e., the principal amount of the securitized assets exceeds the principal amount of the structured finance obligations guaranteed by the Company), the structure allows defaults of the securitized assets before a default is experienced on the structured finance obligation guaranteed by the Company. In the case of first loss, the financial guaranty insurance policy only covers a senior layer of losses experienced by multiple obligations issued by special purpose entities, including VIEs. The first loss exposure with respect to the assets is either retained by the seller or sold off in the form of equity or mezzanine debt to other investors. In the case of excess spread, the financial assets contributed to special purpose entities, including VIEs, generate interest income that are in excess of the interest payments on the debt issued by the special purpose entity. Such excess spread is typically distributed through the transaction’s cash flow waterfall and may be used to create additional credit enhancement, applied to redeem debt issued by the special purpose entities, including VIEs (thereby, creating additional overcollateralization), or distributed to equity or other investors in the transaction.
Assured Guaranty is not primarily liable for the debt obligations issued by the VIEs it insures and would only be required to make payments on those insured debt obligations in the event that the issuer of such debt obligations defaults on any principal or interest due and only for the amount of the shortfall. AGL’s and its Subsidiaries’ creditors do not have any rights with regard to the collateral supporting the debt issued by the FG VIEs. Proceeds from sales, maturities, prepayments and interest from such underlying collateral may only be used to pay debt service on VIE liabilities. Net fair value gains and losses on FG VIEs are expected to reverse to
zero
at maturity of the VIE debt, except for net premiums received and net claims paid by Assured Guaranty under the financial guaranty insurance contract. The Company’s estimate of expected loss to be paid for FG VIEs is included in Note 5, Expected Loss to be Paid.
Accounting Policy
The Company evaluates whether it is the primary beneficiary of its VIEs. If the Company concludes that it is the primary beneficiary, it is required to consolidate the entire VIE in the Company's financial statements and eliminate the effects of the financial guaranty insurance contracts issued by AGM and AGC on the consolidated FG VIEs debt obligations.
The primary beneficiary of a VIE is the enterprise that has both 1) the power to direct the activities of a VIE that most significantly impact the entity's economic performance; and 2) the obligation to absorb losses of the entity that could potentially be significant to the VIE or the right to receive benefits from the entity that could potentially be significant to the VIE.
As part of the terms of its financial guaranty contracts, the Company obtains certain protective rights with respect to the VIE that are triggered by the occurrence of certain events, such as failure to be in compliance with a covenant due to poor deal performance or a deterioration in a servicer or collateral manager's financial condition. At deal inception, the Company typically is not deemed to control a VIE; however, once a trigger event occurs, the Company's control of the VIE typically increases. The Company continuously evaluates its power to direct the activities that most significantly impact the economic performance of VIEs that have debt obligations insured by the Company and, accordingly, where the Company is obligated to absorb VIE losses or receive benefits that could potentially be significant to the VIE. The Company obtains protective rights under its insurance contracts that give the Company additional controls over a VIE if there is either deterioration of deal performance or in the financial health of the deal servicer. The Company is deemed to be the control party for certain VIEs under GAAP, typically when its protective rights give it the power to both terminate and replace the deal servicer, which are characteristics specific to the Company's financial guaranty contracts. If the protective rights that could make the Company the control party have not been triggered, then the VIE is not consolidated. If the Company is deemed no longer to have those protective rights, the transaction is deconsolidated.
The FG VIEs' liabilities that are insured by the Company are considered to be with recourse, because the Company guarantees the payment of principal and interest regardless of the performance of the related FG VIEs' assets. FG VIEs' liabilities that are not insured by the Company are considered to be without recourse, because the payment of principal and interest of these liabilities is wholly dependent on the performance of the FG VIEs' assets.
209
The Company has limited contractual rights to obtain the financial records of its consolidated FG VIEs. The FG VIEs do not prepare separate GAAP financial statements; therefore, the Company compiles GAAP financial information for them based on trustee reports prepared by and received from third parties. Such trustee reports are not available to the Company until approximately
30 days
after the end of any given period. The time required to perform adequate reconciliations and analyses of the information in these trustee reports results in a one quarter lag in reporting the FG VIEs' activities. The Company records the fair value of FG VIE assets and liabilities based on modeled prices. The Company updates the model assumptions each reporting period for the most recent available information, which incorporates the impact of material events that may have occurred since the quarter lag date. The net change in the fair value of consolidated FG VIE assets and liabilities is recorded in "fair value gains (losses) on FG VIEs" in the consolidated statements of operations. Interest income and interest expense are derived from the trustee reports and also included in “fair value gains (losses) on FG VIEs.” The Company has elected the fair value option for assets and liabilities classified as FG VIEs' assets and liabilities because the carrying amount transition method was not practical.
The cash flows generated by the FG VIE assets, including R&W recoveries, are classified as cash flows from investing activities. Paydowns of FG liabilities are supported by the cash flows generated by FG VIE assets, and for liabilities with recourse, possibly claim payments made by AGM or AGC under its financial guaranty insurance contracts. Paydowns of FG liabilities both with and without recourse are classified as cash flows used in financing activities by the Company. Interest income, interest expense and other expenses of the FG VIE assets and liabilities are classified as operating cash flows. Claim payments made by AGC and AGM under the financial guaranty contracts issued to the FG VIEs are eliminated upon consolidation and therefore such claim payments are treated as paydowns of FG VIE liabilities as a financing activity as opposed to an operating activity of AGM and AGC.
Consolidated FG VIEs
Number of FG VIEs Consolidated
|
|
Year Ended December 31,
|
|||||||
|
|
2016
|
2015
|
2014
|
|||||
|
|
||||||||
|
Beginning of the period, December 31
|
34
|
|
32
|
|
40
|
|
||
|
Radian Asset Acquisition
|
—
|
|
4
|
|
—
|
|
||
|
Consolidated(1)
|
1
|
|
1
|
|
2
|
|
||
|
Deconsolidated(1)
|
(2
|
)
|
(1
|
)
|
(8
|
)
|
||
|
Matured
|
(1
|
)
|
(2
|
)
|
(2
|
)
|
||
|
End of the period, December 31
|
32
|
|
34
|
|
32
|
|
||
____________________
|
(1)
|
Net loss on consolidation and deconsolidation was de minimis in
2016
. Net loss on consolidation was
$26 million
in
2015
. Net gain on deconsolidation was
$120 million
and net loss on consolidation was
$26 million
in
2014
.
|
The total unpaid principal balance for the FG VIEs’ assets that were over
90
days or more past due was approximately
$137 million
at
December 31, 2016
and
$154 million
at
December 31, 2015
. The aggregate unpaid principal of the FG VIEs’ assets was approximately
$432 million
greater than the aggregate fair value at
December 31, 2016
. The aggregate unpaid principal of the FG VIEs’ assets was approximately
$804 million
greater than the aggregate fair value at
December 31, 2015
, excluding the effect of R&W settlements. The change in the instrument-specific credit risk of the FG VIEs’ assets held as of
December 31, 2016
that was recorded in the consolidated statements of operations for
2016
were gains of
$55 million
. The change in the instrument-specific credit risk of the FG VIEs’ assets held as of
December 31, 2015
that was recorded in the consolidated statements of operations for
2015
were gains of $
90 million
. The change in the instrument-specific credit risk of the FG VIEs’ assets for
2014
were gains of
$116 million
. To calculate the instrument specific credit risk, the changes in the fair value of the FG VIE assets are allocated between changes that are due to the instrument specific credit risk and changes due to other factors, including interest rates. The instrument specific credit risk amount is determined by using expected contractual cash flows versus current expected cash flows discounted at original contractual rate. The net present value is calculated by discounting the expected cash flows of the underlying security, at the relevant effective interest rate.
The unpaid principal for FG VIE liabilities with recourse, which represent obligations insured by AGC or AGM, was
$871 million
and
$1,436 million
as of
December 31, 2016
and
December 31, 2015
, respectively. FG VIE liabilities with recourse will mature at various dates ranging from
2025
to
2038
. The aggregate unpaid principal balance of the FG VIE
210
liabilities with and without recourse was approximately
$109 million
greater than the aggregate fair value of the FG VIEs’ liabilities as of
December 31, 2016
. The aggregate unpaid principal balance was approximately
$423 million
greater than the aggregate fair value of the FG VIEs’ liabilities as of
December 31, 2015
.
The table below shows the carrying value of the consolidated FG VIEs’ assets and liabilities in the consolidated financial statements, segregated by the types of assets that collateralize their respective debt obligations for FG VIE liabilities with recourse.
Consolidated FG VIEs
By Type of Collateral
|
|
As of December 31, 2016
|
As of December 31, 2015
|
|||||||||||||
|
|
Assets
|
Liabilities
|
Assets
|
Liabilities
|
|||||||||||
|
|
(in millions)
|
||||||||||||||
|
With recourse:
|
|
|
|
|
|
|
|
|
|||||||
|
U.S. RMBS first lien
|
$
|
473
|
|
$
|
509
|
|
$
|
506
|
|
$
|
521
|
|
|||
|
U.S. RMBS second lien
|
178
|
|
223
|
|
194
|
|
273
|
|
|||||||
|
Life insurance
|
—
|
|
—
|
|
347
|
|
347
|
|
|||||||
|
Manufactured housing
|
74
|
|
75
|
|
84
|
|
84
|
|
|||||||
|
Total with recourse
|
725
|
|
807
|
|
1,131
|
|
1,225
|
|
|||||||
|
Without recourse
|
151
|
|
151
|
|
130
|
|
124
|
|
|||||||
|
Total
|
$
|
876
|
|
$
|
958
|
|
$
|
1,261
|
|
$
|
1,349
|
|
|||
The consolidation of FG VIEs affects net income and shareholders' equity due to (i) changes in fair value gains (losses) on FG VIE assets and liabilities, (ii) the elimination of premiums and losses related to the AGC and AGM FG VIE liabilities with recourse and (iii) the elimination of investment balances related to the Company’s purchase of AGC and AGM insured FG VIE debt. Upon consolidation of a FG VIE, the related insurance and, if applicable, the related investment balances, are considered intercompany transactions and therefore eliminated. Such eliminations are included in the table below to present the full effect of consolidating FG VIEs.
211
Effect of Consolidating FG VIEs on Net Income,
Cash Flows From Operating Activities and Shareholders’ Equity
|
|
Year Ended December 31,
|
||||||||||
|
|
2016
|
2015
|
2014
|
||||||||
|
|
(in millions)
|
||||||||||
|
Net earned premiums
|
$
|
(16
|
)
|
$
|
(21
|
)
|
$
|
(32
|
)
|
||
|
Net investment income
|
(10
|
)
|
(32
|
)
|
(11
|
)
|
|||||
|
Net realized investment gains (losses)
|
1
|
|
10
|
|
(5
|
)
|
|||||
|
Fair value gains (losses) on FG VIEs
|
38
|
|
38
|
|
255
|
|
|||||
|
Bargain purchase gain
|
—
|
|
2
|
|
—
|
|
|||||
|
Loss and LAE
|
7
|
|
28
|
|
30
|
|
|||||
|
Other income (loss)
|
0
|
|
0
|
|
(2
|
)
|
|||||
|
Effect on income before tax
|
20
|
|
25
|
|
235
|
|
|||||
|
Less: tax provision (benefit)
|
7
|
|
8
|
|
82
|
|
|||||
|
Effect on net income (loss)
|
$
|
13
|
|
$
|
17
|
|
$
|
153
|
|
||
|
Effect on cash flows from operating activities
|
$
|
24
|
|
$
|
43
|
|
$
|
68
|
|
||
|
|
As of
December 31, 2016 |
As of
December 31, 2015 |
|||||
|
|
(in millions)
|
||||||
|
Effect on shareholders’ equity (decrease) increase
|
$
|
(9
|
)
|
$
|
(23
|
)
|
|
Fair value gains (losses) on FG VIEs represent the net change in fair value on the consolidated FG VIEs’ assets and liabilities. In 2016, the Company recorded a pre-tax net fair value gain on consolidated FG VIEs of
$38 million
.
The primary driver of the 2016 gain in fair value of FG VIE assets and liabilities was net mark-to-market gains due to price appreciation resulting from improvements in the underlying collateral of HELOC RMBS assets of the FG VIEs.
In 2015, the Company recorded a pre-tax net fair value gain on consolidated FG VIEs of
$38 million
which was primarily driven by price appreciation on the Company's FG VIE assets during the year that resulted from improvements in the underlying collateral, as well as large principal paydowns made on the Company's FG VIEs.
In 2014, the Company recorded a pre-tax net fair value gain on consolidated FG VIEs of
$255 million
. The primary driver of this gain,
$120 million
, was a result of the deconsolidation of
seven
VIEs. There was an additional gain of
$37 million
resulting from the Company exercising its option to accelerate
two
second lien RMBS VIEs. These
two
VIEs were treated as maturities during the period. The remainder of the gain for the period was driven by the price appreciation on the Company's FG VIE assets during the year resulting from improvements in the underlying collateral, as well as large principal paydowns made on the Company's FG VIEs.
Other Consolidated VIEs
In certain instances where the Company consolidates a VIE that was established as part of a loss mitigation negotiated settlement agreement that results in the termination of the original insured financial guaranty insurance or credit derivative contract the Company classifies the assets and liabilities of those VIEs in the line items that most accurately reflect the nature of the items, as opposed to within the FG VIE assets and FG VIE liabilities.
Non-Consolidated VIEs
As of
December 31, 2016
and
December 31, 2015
, the Company had financial guaranty contracts outstanding for approximately
600
and
750
VIEs, respectively, that it did not consolidate. To date, the Company’s analyses have indicated that it does not have indicated that it is not the primary beneficiary of any other VIEs and, as a result, they are not consolidated. The Company’s exposure provided through its financial guaranties with respect to debt obligations of special purpose entities is included within net par outstanding in Note 4, Outstanding Exposure.
212
|
10.
|
Investments and Cash
|
Accounting Policy
The vast majority of the Company's investment portfolio is composed of fixed-maturity and short-term investments, classified as available-for-sale at the time of purchase (approximately
98.5%
based on fair value as of
December 31, 2016
), and therefore carried at fair value. Changes in fair value for other-than-temporarily-impaired (OTTI) securities are bifurcated between credit losses and non-credit changes in fair value. The credit loss on OTTI securities is recorded in the statement of operations and the non-credit component of the change in fair value of securities, whether OTTI or not, is recorded in OCI. For securities in an unrealized loss position where the Company has the intent to sell or it is more-likely-than-not that it will be required to sell the security before recovery, the entire impairment loss (i.e., the difference between the security's fair value and its amortized cost) is recorded in the consolidated statements of operations.
Credit losses reduce the amortized cost of impaired securities. The amortized cost basis is adjusted for accretion and amortization (using the effective interest method) with a corresponding entry recorded in net investment income.
Realized gains and losses on sales of investments are determined using the specific identification method. Realized loss includes amounts recorded for other-than-temporary impairments on debt securities and the declines in fair value of securities for which the Company has the intent to sell the security or inability to hold until recovery of amortized cost.
For mortgage‑backed securities, and any other holdings for which there is prepayment risk, prepayment assumptions are evaluated and revised as necessary. Any necessary adjustments due to changes in effective yields and maturities are recognized in net investment income using the retrospective method.
Loss mitigation securities are generally purchased at a discount and are accounted for based on their underlying investment type, excluding the effects of the Company’s insurance. Interest income on loss mitigation securities is recognized on a level yield basis over the remaining life of the security.
Short-term investments, which are those investments with a maturity of less than one year at time of purchase, are carried at fair value and include amounts deposited in money market funds.
Other invested assets primarily include guaranteed investment contracts, which are carried at amortized cost plus accrued interest and preferred stocks, which are carried at fair value with changes in unrealized gains and losses recorded in OCI.
Cash consists of cash on hand and demand deposits. As a result of the lag in reporting FG VIEs, cash and short-term investments do not reflect cash outflow to the holders of the debt issued by the FG VIEs for claim payments made by the Company's insurance subsidiaries to the consolidated FG VIEs until the subsequent reporting period.
Assessment for Other-Than Temporary Impairments
If an entity does not intend to sell the security and it is not more-likely-than-not that the Company will be required to sell the security before recovery of its amortized cost basis, the other-than-temporary-impairment is separated into (1) the amount representing the credit loss and (2) the amount related to all other factors.
The Company has a formal review process to determine other-than-temporary-impairment for securities in its investment portfolio where there is no intent to sell and it is not more-likely-than-not that it will be required to sell the security before recovery. Factors considered when assessing impairment include:
|
•
|
a decline in the market value of a security by
20%
or more below amortized cost for a continuous period of at least
six months
;
|
|
•
|
a decline in the market value of a security for a continuous period of
12
months;
|
|
•
|
recent credit downgrades of the applicable security or the issuer by rating agencies;
|
|
•
|
the financial condition of the applicable issuer;
|
|
•
|
whether loss of investment principal is anticipated;
|
213
|
•
|
the impact of foreign exchange rates; and
|
|
•
|
whether scheduled interest payments are past due.
|
The Company assesses the ability to recover the amortized cost by comparing the net present value of projected future cash flows with the amortized cost of the security. If the security is in an unrealized loss position and its net present value is less than the amortized cost of the investment, an other-than-temporary impairment is recorded. The net present value is calculated by discounting the Company's estimate of projected future cash flows at the effective interest rate implicit in the debt security at the time of purchase. The Company's estimates of projected future cash flows are driven by assumptions regarding probability of default and estimates regarding timing and amount of recoveries associated with a default. The Company develops these estimates using information based on historical experience, credit analysis and market observable data, such as industry analyst reports and forecasts, sector credit ratings and other relevant data. For mortgage‑backed and asset backed securities, cash flow estimates also include prepayment and other assumptions regarding the underlying collateral including default rates, recoveries and changes in value. The assumptions used in these projections requires the use of significant management judgment.
The Company's assessment of a decline in value included management's current assessment of the factors noted above. The Company also seeks advice from its outside investment managers. If that assessment changes in the future, the Company may ultimately record a loss after having originally concluded that the decline in value was temporary.
Net Investment Income and Realized Gains (Losses)
Net investment income is a function of the yield that the Company earns on invested assets and the size of the portfolio. The investment yield is a function of market interest rates at the time of investment as well as the type, credit quality and maturity of the invested assets. Accrued investment income, which is recorded in Other Assets, was $
91 million
and $
99 million
as of
December 31, 2016
and
December 31, 2015
, respectively.
Net Investment Income
|
|
Year Ended December 31,
|
||||||||||
|
|
2016
|
2015
|
2014
|
||||||||
|
|
(in millions)
|
||||||||||
|
Income from fixed-maturity securities managed by third parties
|
$
|
306
|
|
|
$
|
335
|
|
|
$
|
324
|
|
|
Income from internally managed securities:
|
|||||||||||
|
Fixed maturities
|
103
|
|
|
61
|
|
|
74
|
|
|||
|
Other
|
7
|
|
37
|
|
14
|
|
|||||
|
Other
|
1
|
|
0
|
|
0
|
|
|||||
|
Gross investment income
|
417
|
|
|
433
|
|
|
412
|
|
|||
|
Investment expenses
|
(9
|
)
|
|
(10
|
)
|
|
(9
|
)
|
|||
|
Net investment income
|
$
|
408
|
|
$
|
423
|
|
$
|
403
|
|
||
Net Realized Investment Gains (Losses)
|
|
Year Ended December 31,
|
||||||||||
|
|
2016
|
2015
|
2014
|
||||||||
|
|
(in millions)
|
||||||||||
|
Gross realized gains on available-for-sale securities
|
$
|
28
|
|
$
|
44
|
|
$
|
14
|
|
||
|
Gross realized losses on available-for-sale securities
|
(8
|
)
|
(15
|
)
|
(5
|
)
|
|||||
|
Net realized gains (losses) on other invested assets
|
2
|
|
(8
|
)
|
6
|
|
|||||
|
Other-than-temporary impairment
|
(51
|
)
|
(47
|
)
|
(75
|
)
|
|||||
|
Net realized investment gains (losses)
|
$
|
(29
|
)
|
$
|
(26
|
)
|
$
|
(60
|
)
|
||
214
The following table presents the roll-forward of the credit losses of fixed-maturity securities for which the Company has recognized an other-than-temporary-impairment and where the portion of the fair value adjustment related to other factors was recognized in OCI.
Roll Forward of Credit Losses
in the Investment Portfolio
|
|
Year Ended December 31,
|
||||||||||
|
|
2016
|
2015
|
2014
|
||||||||
|
|
(in millions)
|
||||||||||
|
Balance, beginning of period
|
$
|
108
|
|
$
|
124
|
|
$
|
80
|
|
||
|
Additions for credit losses on securities for which an other-than-temporary-impairment was not previously recognized
|
3
|
|
3
|
|
64
|
|
|||||
|
Eliminations of securities issued by FG VIEs
|
—
|
|
—
|
|
(15
|
)
|
|||||
|
Reductions for securities sold and other settlement during the period
|
(4
|
)
|
(28
|
)
|
(12
|
)
|
|||||
|
Additions for credit losses on securities for which an other-than-temporary-impairment was previously recognized
|
27
|
|
9
|
|
7
|
|
|||||
|
Balance, end of period
|
$
|
134
|
|
$
|
108
|
|
$
|
124
|
|
||
Investment Portfolio
Fixed-Maturity Securities and Short-Term Investments
by Security Type
As of December 31, 2016
|
Investment Category
|
Percent
of
Total(1)
|
Amortized
Cost
|
Gross
Unrealized
Gains
|
Gross
Unrealized
Losses
|
Estimated
Fair
Value
|
AOCI(2)
Gain
(Loss) on
Securities
with
Other-Than-Temporary Impairment
|
Weighted
Average
Credit
Rating
(3)
|
||||||||||||||||||
|
|
(dollars in millions)
|
||||||||||||||||||||||||
|
Fixed-maturity securities:
|
|
|
|
|
|
|
|
|
|
|
|
|
|
||||||||||||
|
Obligations of state and political subdivisions
|
50
|
%
|
$
|
5,269
|
|
$
|
202
|
|
$
|
(39
|
)
|
$
|
5,432
|
|
$
|
13
|
|
AA
|
|||||||
|
U.S. government and agencies
|
4
|
|
424
|
|
17
|
|
(1
|
)
|
440
|
|
—
|
|
AA+
|
||||||||||||
|
Corporate securities
|
15
|
|
1,612
|
|
32
|
|
(31
|
)
|
1,613
|
|
(8
|
)
|
A-
|
||||||||||||
|
Mortgage-backed securities(4):
|
—
|
|
|
|
|
|
|
||||||||||||||||||
|
RMBS
|
9
|
|
998
|
|
27
|
|
(38
|
)
|
987
|
|
(21
|
)
|
A-
|
||||||||||||
|
CMBS
|
5
|
|
575
|
|
13
|
|
(5
|
)
|
583
|
|
—
|
|
AAA
|
||||||||||||
|
Asset-backed securities
|
8
|
|
835
|
|
110
|
|
0
|
|
945
|
|
33
|
|
B
|
||||||||||||
|
Foreign government securities
|
3
|
|
261
|
|
4
|
|
(32
|
)
|
233
|
|
—
|
|
AA
|
||||||||||||
|
Total fixed-maturity securities
|
94
|
|
9,974
|
|
405
|
|
(146
|
)
|
10,233
|
|
17
|
|
A+
|
||||||||||||
|
Short-term investments
|
6
|
|
590
|
|
0
|
|
0
|
|
590
|
|
—
|
|
AAA
|
||||||||||||
|
Total investment portfolio
|
100
|
%
|
$
|
10,564
|
|
$
|
405
|
|
$
|
(146
|
)
|
$
|
10,823
|
|
17
|
|
A+
|
||||||||
215
Fixed-Maturity Securities and Short-Term Investments
by Security Type
As of December 31, 2015
|
Investment Category
|
Percent
of
Total(1)
|
Amortized
Cost
|
Gross
Unrealized
Gains
|
Gross
Unrealized
Losses
|
Estimated
Fair
Value
|
AOCI
Gain
(Loss) on
Securities
with
Other-Than-Temporary Impairment
|
Weighted
Average
Credit
Rating
(3)
|
||||||||||||||||||
|
|
(dollars in millions)
|
||||||||||||||||||||||||
|
Fixed-maturity securities:
|
|
|
|
|
|
|
|
|
|
|
|
|
|
||||||||||||
|
Obligations of state and political subdivisions
|
52
|
%
|
$
|
5,528
|
|
$
|
323
|
|
$
|
(10
|
)
|
$
|
5,841
|
|
$
|
5
|
|
AA
|
|||||||
|
U.S. government and agencies
|
3
|
|
377
|
|
23
|
|
0
|
|
400
|
|
—
|
|
AA+
|
||||||||||||
|
Corporate securities
|
14
|
|
1,505
|
|
38
|
|
(23
|
)
|
1,520
|
|
(13
|
)
|
A-
|
||||||||||||
|
Mortgage-backed securities(4):
|
|
|
|
|
|
|
|
|
|
|
|
|
|
||||||||||||
|
RMBS
|
11
|
|
1,238
|
|
29
|
|
(22
|
)
|
1,245
|
|
(7
|
)
|
A
|
||||||||||||
|
CMBS
|
5
|
|
506
|
|
9
|
|
(2
|
)
|
513
|
|
—
|
|
AAA
|
||||||||||||
|
Asset-backed securities
|
8
|
|
831
|
|
4
|
|
(10
|
)
|
825
|
|
(6
|
)
|
B+
|
||||||||||||
|
Foreign government securities
|
3
|
|
290
|
|
4
|
|
(11
|
)
|
283
|
|
—
|
|
AA+
|
||||||||||||
|
Total fixed-maturity securities
|
96
|
|
10,275
|
|
430
|
|
(78
|
)
|
10,627
|
|
(21
|
)
|
A+
|
||||||||||||
|
Short-term investments
|
4
|
|
396
|
|
0
|
|
0
|
|
396
|
|
—
|
|
AA-
|
||||||||||||
|
Total investment portfolio
|
100
|
%
|
$
|
10,671
|
|
$
|
430
|
|
$
|
(78
|
)
|
$
|
11,023
|
|
$
|
(21
|
)
|
A+
|
|||||||
____________________
|
(1)
|
Based on amortized cost.
|
|
(2)
|
Accumulated OCI. See also Note 20, Other Comprehensive Income.
|
|
(3)
|
Ratings in the tables above represent the lower of the Moody’s and S&P classifications except for bonds purchased for loss mitigation or risk management strategies, which use internal ratings classifications. The Company’s portfolio consists primarily of high-quality, liquid instruments.
|
|
(4)
|
Government-agency obligations were approximately
42%
of mortgage backed securities as of
December 31, 2016
and
54%
as of
December 31, 2015
based on fair value.
|
The Company’s investment portfolio in tax-exempt and taxable municipal securities includes issuances by a wide number of municipal authorities across the U.S. and its territories.
216
The following tables present the fair value of the Company’s available-for-sale portfolio of obligations of state and political subdivisions as of
December 31, 2016
and
December 31, 2015
by state.
Fair Value of Available-for-Sale Portfolio of
Obligations of State and Political Subdivisions
As of December 31, 2016
(1)
|
State
|
State
General
Obligation
|
Local
General
Obligation
|
Revenue Bonds
|
Fair
Value
|
Amortized
Cost
|
Average
Credit
Rating
|
||||||||||||||||
|
|
(in millions)
|
|||||||||||||||||||||
|
Fixed-maturity securities:
|
||||||||||||||||||||||
|
New York
|
$
|
13
|
|
$
|
38
|
|
$
|
570
|
|
$
|
621
|
|
$
|
604
|
|
AA
|
||||||
|
California
|
73
|
|
62
|
|
391
|
|
526
|
|
497
|
|
A+
|
|||||||||||
|
Texas
|
16
|
|
186
|
|
316
|
|
518
|
|
503
|
|
AA
|
|||||||||||
|
Washington
|
81
|
|
68
|
|
201
|
|
350
|
|
348
|
|
AA
|
|||||||||||
|
Florida
|
16
|
|
11
|
|
247
|
|
274
|
|
266
|
|
AA-
|
|||||||||||
|
Massachusetts
|
74
|
|
—
|
|
149
|
|
223
|
|
215
|
|
AA
|
|||||||||||
|
Illinois
|
18
|
|
65
|
|
127
|
|
210
|
|
205
|
|
A+
|
|||||||||||
|
Arizona
|
—
|
|
3
|
|
122
|
|
125
|
|
122
|
|
AA
|
|||||||||||
|
Georgia
|
—
|
|
9
|
|
104
|
|
113
|
|
109
|
|
A+
|
|||||||||||
|
Pennsylvania
|
38
|
|
17
|
|
58
|
|
113
|
|
111
|
|
A+
|
|||||||||||
|
All others
|
153
|
|
155
|
|
1,085
|
|
1,393
|
|
1,364
|
|
AA-
|
|||||||||||
|
Total
|
$
|
482
|
|
$
|
614
|
|
$
|
3,370
|
|
$
|
4,466
|
|
$
|
4,344
|
|
AA-
|
||||||
Fair Value of Available-for-Sale Portfolio of
Obligations of State and Political Subdivisions
As of December 31, 2015
(1)
|
State
|
State
General
Obligation
|
Local
General
Obligation
|
Revenue Bonds
|
Fair
Value
|
Amortized
Cost
|
Average
Credit
Rating
|
||||||||||||||||
|
|
(in millions)
|
|||||||||||||||||||||
|
Fixed-maturity securities:
|
||||||||||||||||||||||
|
New York
|
$
|
13
|
|
$
|
59
|
|
$
|
571
|
|
$
|
643
|
|
$
|
610
|
|
AA
|
||||||
|
Texas
|
28
|
|
224
|
|
325
|
|
577
|
|
542
|
|
AA
|
|||||||||||
|
California
|
78
|
|
66
|
|
411
|
|
555
|
|
521
|
|
A+
|
|||||||||||
|
Washington
|
59
|
|
79
|
|
200
|
|
338
|
|
323
|
|
AA
|
|||||||||||
|
Florida
|
17
|
|
—
|
|
268
|
|
285
|
|
266
|
|
AA-
|
|||||||||||
|
Illinois
|
47
|
|
69
|
|
128
|
|
244
|
|
234
|
|
A
|
|||||||||||
|
Massachusetts
|
75
|
|
—
|
|
148
|
|
223
|
|
207
|
|
AA
|
|||||||||||
|
Arizona
|
—
|
|
10
|
|
181
|
|
191
|
|
181
|
|
AA
|
|||||||||||
|
Pennsylvania
|
48
|
|
26
|
|
47
|
|
121
|
|
115
|
|
A
|
|||||||||||
|
Ohio
|
17
|
|
14
|
|
83
|
|
114
|
|
106
|
|
AA
|
|||||||||||
|
All others
|
156
|
|
168
|
|
1,148
|
|
1,472
|
|
1,396
|
|
AA-
|
|||||||||||
|
Subtotal
|
538
|
|
715
|
|
3,510
|
|
4,763
|
|
4,501
|
|
AA-
|
|||||||||||
|
Short-term investments (2)
|
—
|
|
—
|
|
60
|
|
60
|
|
60
|
|
CC
|
|||||||||||
|
Total
|
$
|
538
|
|
$
|
715
|
|
$
|
3,570
|
|
$
|
4,823
|
|
$
|
4,561
|
|
AA-
|
||||||
____________________
|
(1)
|
Excludes $
966 million
and $
1,078 million
as of
December 31, 2016
and
2015
, respectively, of pre-refunded bonds, at fair value. The credit ratings are based on the underlying ratings and do not include any benefit from bond insurance.
|
(2) Matured in the first quarter of 2016.
217
The revenue bond portfolio is comprised primarily of essential service revenue bonds issued by transportation authorities and other utilities, water and sewer authorities, universities and healthcare providers.
Revenue Bonds
Sources of Funds
|
|
As of December 31, 2016
|
As of December 31, 2015
|
||||||||||||||
|
Type
|
Fair
Value
|
Amortized
Cost
|
Fair
Value
|
Amortized
Cost
|
||||||||||||
|
|
(in millions)
|
|||||||||||||||
|
Fixed-maturity securities:
|
||||||||||||||||
|
Transportation
|
$
|
860
|
|
$
|
824
|
|
$
|
867
|
|
$
|
815
|
|
||||
|
Tax backed
|
617
|
|
601
|
|
610
|
|
576
|
|
||||||||
|
Water and sewer
|
545
|
|
531
|
|
612
|
|
576
|
|
||||||||
|
Higher education
|
513
|
|
499
|
|
518
|
|
487
|
|
||||||||
|
Municipal utilities
|
365
|
|
360
|
|
414
|
|
393
|
|
||||||||
|
Healthcare
|
310
|
|
298
|
|
344
|
|
321
|
|
||||||||
|
All others
|
160
|
|
158
|
|
145
|
|
141
|
|
||||||||
|
Subtotal
|
3,370
|
|
3,271
|
|
3,510
|
|
3,309
|
|
||||||||
|
Short-term investments (1)
|
—
|
|
—
|
|
60
|
|
60
|
|
||||||||
|
Total
|
$
|
3,370
|
|
$
|
3,271
|
|
$
|
3,570
|
|
$
|
3,369
|
|
||||
____________________
(1) Matured in the first quarter of 2016.
The following tables summarize, for all fixed-maturity securities in an unrealized loss position, the aggregate fair value and gross unrealized loss by length of time the amounts have continuously been in an unrealized loss position.
Fixed-Maturity Securities
Gross Unrealized Loss by Length of Time
As of December 31, 2016
|
|
Less than 12 months
|
12 months or more
|
Total
|
||||||||||||||||||||
|
|
Fair
Value
|
Unrealized
Loss
|
Fair
Value
|
Unrealized
Loss
|
Fair
Value
|
Unrealized
Loss
|
|||||||||||||||||
|
|
(dollars in millions)
|
||||||||||||||||||||||
|
Obligations of state and political subdivisions
|
$
|
1,110
|
|
$
|
(38
|
)
|
$
|
6
|
|
$
|
(1
|
)
|
$
|
1,116
|
|
$
|
(39
|
)
|
|||||
|
U.S. government and agencies
|
87
|
|
(1
|
)
|
—
|
|
—
|
|
87
|
|
(1
|
)
|
|||||||||||
|
Corporate securities
|
492
|
|
(11
|
)
|
118
|
|
(20
|
)
|
610
|
|
(31
|
)
|
|||||||||||
|
Mortgage-backed securities:
|
|
|
|
|
|
|
|||||||||||||||||
|
RMBS
|
391
|
|
(23
|
)
|
94
|
|
(15
|
)
|
485
|
|
(38
|
)
|
|||||||||||
|
CMBS
|
165
|
|
(5
|
)
|
—
|
|
—
|
|
165
|
|
(5
|
)
|
|||||||||||
|
Asset-backed securities
|
36
|
|
0
|
|
0
|
|
0
|
|
36
|
|
0
|
|
|||||||||||
|
Foreign government securities
|
44
|
|
(5
|
)
|
114
|
|
(27
|
)
|
158
|
|
(32
|
)
|
|||||||||||
|
Total
|
$
|
2,325
|
|
$
|
(83
|
)
|
$
|
332
|
|
$
|
(63
|
)
|
$
|
2,657
|
|
$
|
(146
|
)
|
|||||
|
Number of securities(1)
|
|
|
622
|
|
|
|
60
|
|
|
|
676
|
|
|||||||||||
|
Number of securities with other-than-temporary impairment
|
|
|
8
|
|
|
|
9
|
|
|
|
17
|
|
|||||||||||
218
Fixed-Maturity Securities
Gross Unrealized Loss by Length of Time
As of December 31, 2015
|
|
Less than 12 months
|
12 months or more
|
Total
|
||||||||||||||||||||
|
|
Fair
Value
|
Unrealized
Loss
|
Fair
Value
|
Unrealized
Loss
|
Fair
Value
|
Unrealized
Loss
|
|||||||||||||||||
|
|
(dollars in millions)
|
||||||||||||||||||||||
|
Obligations of state and political subdivisions
|
$
|
316
|
|
$
|
(10
|
)
|
$
|
7
|
|
$
|
0
|
|
$
|
323
|
|
$
|
(10
|
)
|
|||||
|
U.S. government and agencies
|
77
|
|
0
|
|
—
|
|
—
|
|
77
|
|
0
|
|
|||||||||||
|
Corporate securities
|
381
|
|
(8
|
)
|
95
|
|
(15
|
)
|
476
|
|
(23
|
)
|
|||||||||||
|
Mortgage-backed securities:
|
|
|
|
|
|
|
|
|
|||||||||||||||
|
RMBS
|
438
|
|
(8
|
)
|
90
|
|
(14
|
)
|
528
|
|
(22
|
)
|
|||||||||||
|
CMBS
|
140
|
|
(2
|
)
|
2
|
|
0
|
|
142
|
|
(2
|
)
|
|||||||||||
|
Asset-backed securities
|
517
|
|
(10
|
)
|
—
|
|
—
|
|
517
|
|
(10
|
)
|
|||||||||||
|
Foreign government securities
|
97
|
|
(4
|
)
|
82
|
|
(7
|
)
|
179
|
|
(11
|
)
|
|||||||||||
|
Total
|
$
|
1,966
|
|
$
|
(42
|
)
|
$
|
276
|
|
$
|
(36
|
)
|
$
|
2,242
|
|
$
|
(78
|
)
|
|||||
|
Number of securities(1)
|
|
|
335
|
|
|
|
71
|
|
|
|
396
|
|
|||||||||||
|
Number of securities with other-than-temporary impairment
|
|
|
9
|
|
|
|
4
|
|
|
|
13
|
|
|||||||||||
___________________
|
(1)
|
The number of securities does not add across because lots consisting of the same securities have been purchased at different times and appear in both categories above (i.e., less than 12 months and 12 months or more). If a security appears in both categories, it is counted only once in the total column.
|
Of the securities in an unrealized loss position for 12 months or more as of
December 31, 2016
,
41
securities had unrealized losses greater than
10%
of book value. The total unrealized loss for these securities as of
December 31, 2016
was $
59 million
. As of
December 31, 2015
, of the securities in an unrealized loss position for 12 months or more,
nine
securities had unrealized losses greater than
10%
of book value with an unrealized loss of
$26 million
. The Company has determined that the unrealized losses recorded as of
December 31, 2016
and
December 31, 2015
were yield related and not the result of other-than-temporary-impairment.
The amortized cost and estimated fair value of available-for-sale fixed-maturity securities by contractual maturity as of
December 31, 2016
are shown below. Expected maturities will differ from contractual maturities because borrowers may have the right to call or prepay obligations with or without call or prepayment penalties.
Distribution of Fixed-Maturity Securities
by Contractual Maturity
As of December 31, 2016
|
|
Amortized
Cost
|
Estimated
Fair Value
|
|||||
|
|
(in millions)
|
||||||
|
Due within one year
|
$
|
482
|
|
$
|
550
|
|
|
|
Due after one year through five years
|
1,725
|
|
1,727
|
|
|||
|
Due after five years through 10 years
|
2,112
|
|
2,155
|
|
|||
|
Due after 10 years
|
4,082
|
|
4,231
|
|
|||
|
Mortgage-backed securities:
|
|
|
|
|
|||
|
RMBS
|
998
|
|
987
|
|
|||
|
CMBS
|
575
|
|
583
|
|
|||
|
Total
|
$
|
9,974
|
|
$
|
10,233
|
|
|
219
The investment portfolio contains securities and cash that are either held in trust for the benefit of third party reinsurers in accordance with statutory requirements, invested in a guaranteed investment contract for future claims payments, placed on deposit to fulfill state licensing requirements, or otherwise restricted in the amount of
$285 million
and
$283 million
, based on fair value, as of
December 31, 2016
and
December 31, 2015
, respectively. The investment portfolio also contains securities that are held in trust by certain AGL subsidiaries for the benefit of other AGL subsidiaries in accordance with statutory and regulatory requirements in the amount of
$1,420 million
and
$1,411 million
, based on fair value as of
December 31, 2016
and
December 31, 2015
, respectively.
The fair value of the Company’s pledged securities to secure its obligations under its CDS exposure totaled
$
116 million
and $
305 million
as of
December 31, 2016
and
December 31, 2015
, respectively.
No material investments of the Company were non-income producing for years ended
December 31, 2016
and
2015
, respectively.
Externally Managed Portfolio
The majority of the investment portfolio is managed by
four
outside managers. The Company has established detailed guidelines regarding credit quality, exposure to a particular sector and exposure to a particular obligor within a sector. The Company's investment guidelines generally do not permit its outside managers to purchase securities rated lower than A- by S&P or A3 by Moody’s, excluding a
2.5%
allocation to corporate securities not rated lower than BBB by S&P or Baa2 by Moody’s.
Internally Managed Portfolio
The investment portfolio tables shown above include both assets managed externally and internally. In the table below, more detailed information is provided for the component of the total investment portfolio that is internally managed (excluding short-term investments). The internally managed portfolio, as defined below, represents approximately
15%
and
13%
of the investment portfolio, on a fair value basis as of
December 31, 2016
and
December 31, 2015
, respectively. The internally managed portfolio consists primarily of the Company's investments in securities for (i) loss mitigation purposes, (ii) other risk management purposes and (iii) where the Company believes a particular security presents an attractive investment opportunity.
One of the Company's strategies for mitigating losses has been to purchase securities it has insured that have expected losses, at discounted prices (loss mitigation securities). In addition, the Company holds other invested assets that were obtained or purchased as part of negotiated settlements with insured counterparties or under the terms of our financial guaranties (other risk management assets). During 2016, the Company established an alternative investments group to focus on deploying a portion of the Company's excess capital to pursue acquisitions and develop new business opportunities that complement the Company's financial guaranty business, are in line with its risk profile and benefit from its core competencies. The alternative investments group has been investigating a number of such opportunities, including, among others, both controlling and non-controlling investments in investment managers.
Internally Managed Portfolio
Carrying Value
|
As of December 31,
|
|||||||
|
|
2016
|
2015
|
|||||
|
|
(in millions)
|
||||||
|
Assets purchased for loss mitigation and other risk management purposes:
|
|||||||
|
Fixed-maturity securities, at fair value
|
$
|
1,492
|
|
$
|
1,266
|
|
|
|
Other invested assets
|
107
|
|
114
|
|
|||
|
Other
|
55
|
|
55
|
|
|||
|
Total
|
$
|
1,654
|
|
$
|
1,435
|
|
|
220
|
11.
|
Insurance Company Regulatory Requirements
|
Each of the Company's insurance companies' ability to pay dividends depends, among other things, upon their financial condition, results of operations, cash requirements, compliance with rating agency requirements, and is also subject to restrictions contained in the insurance laws and related regulations of their state of domicile and other states. Financial statements prepared in accordance with accounting practices prescribed or permitted by local insurance regulatory authorities differ in certain respects from GAAP.
The Company's U.S. domiciled insurance companies prepare statutory financial statements in accordance with accounting practices prescribed or permitted by the National Association of Insurance Commissioners (NAIC) and their respective insurance departments. Prescribed statutory accounting practices are set forth in the NAIC Accounting Practices and Procedures Manual. The Company has no permitted accounting practices on a statutory basis, except for those related to CIFGNA which was merged into AGC and therefore subject to statutory merger accounting requiring the restatement of prior year balances of AGC to include CIFGNA. On the CIFG Acquisition Date, accounting policies were conformed with AGC's accounting policies which do not include any permitted practices.
GAAP differs in certain significant respects from U.S. insurance companies' statutory accounting practices prescribed or permitted by insurance regulatory authorities. The principal differences result from the following statutory accounting practices:
|
•
|
upfront premiums are earned when related principal and interest have expired rather than earned over the expected period of coverage;
|
|
•
|
acquisition costs are charged to expense as incurred rather than over the period that related premiums are earned;
|
|
•
|
a contingency reserve is computed based on statutory requirements, whereas no such reserve is required under GAAP;
|
|
•
|
certain assets designated as “non-admitted assets” are charged directly to statutory surplus, rather than reflected as assets under GAAP;
|
|
•
|
investments in subsidiaries are carried on the balance sheet on the equity basis, to the extent admissible, rather than consolidated with the parent;
|
|
•
|
the amount of deferred tax assets that may be admitted is subject to an adjusted surplus threshold and is generally limited to the lesser of those assets the Company expects to realize within
three years
of the balance sheet date or
fifteen percent
of the Company's adjusted surplus. This realization period and surplus percentage is subject to change based on the amount of adjusted surplus. Under GAAP there is no non-admitted asset determination, rather a valuation allowance is recorded to reduce the deferred tax asset to an amount that is more likely than not to be realized;
|
|
•
|
insured credit derivatives are accounted for as insurance contracts rather than as derivative contracts measured at fair value;
|
|
•
|
bonds are generally carried at amortized cost rather than fair value;
|
|
•
|
insured obligations of VIEs and refinancing vehicles debt, where the Company is deemed the primary beneficiary, are accounted for as insurance contracts. Under GAAP, such VIEs and refinancing vehicles are consolidated and any transactions with the Company are eliminated;
|
|
•
|
surplus notes are recognized as surplus and each payment of principal and interest is recorded only upon approval of the insurance regulator rather than liabilities with periodic accrual of interest;
|
|
•
|
push-down acquisition accounting is not applicable under statutory accounting practices, as it is under GAAP;
|
|
•
|
losses are discounted at a rate of
4.0%
or
5.0%
, recorded when the loss is deemed probable and without consideration of the deferred premium revenue. Under GAAP, expected losses are discounted at the risk free rate at the end of each reporting period and are recorded only to the extent they exceed deferred premium revenue;
|
221
|
•
|
the present value of installment premiums and commissions are not recorded on the balance sheet as they are under GAAP; and
|
|
•
|
mergers of acquired companies are treated as statutory mergers at historical balances and financial statements are retroactively revised assuming the merger occurred at the beginning of the prior year, rather than prospectively beginning with the date of acquisition at fair value under GAAP.
|
AG Re, a Bermuda regulated Class 3B insurer, prepares its statutory financial statements in conformity with the accounting principles set forth in the Insurance Act 1978, amendments thereto and related regulations. As of December 31, 2016, the Bermuda Monetary Authority (Authority) now requires insurers to prepare statutory financial statements in accordance with the particular accounting principles adopted by the insurer (which, in the case of AG Re, are U.S. GAAP), subject to certain adjustments. The principal difference relates to certain assets designated as “non-admitted assets” which are charged directly to statutory surplus rather than reflected as assets as they are under U.S. GAAP.
Insurance Regulatory Amounts Reported
|
Policyholders' Surplus
|
Net Income (Loss)
|
||||||||||||||||||
|
As of December 31,
|
Year Ended December 31,
|
||||||||||||||||||
|
2016
|
2015
|
2016
|
2015
|
2014
|
|||||||||||||||
|
(in millions)
|
|||||||||||||||||||
|
U.S. statutory companies:
|
|||||||||||||||||||
|
AGM(1)
|
$
|
2,321
|
|
$
|
2,441
|
|
$
|
191
|
|
$
|
217
|
|
$
|
304
|
|
||||
|
AGC(1)(2)
|
1,896
|
|
1,365
|
|
108
|
|
(92
|
)
|
116
|
|
|||||||||
|
MAC
|
487
|
|
730
|
|
142
|
|
102
|
|
75
|
|
|||||||||
|
Bermuda statutory company:
|
|||||||||||||||||||
|
AG Re
|
1,255
|
|
984
|
|
139
|
|
51
|
|
28
|
|
|||||||||
____________________
|
(1)
|
Policyholders' surplus of AGM and AGC include their indirect share of MAC. AGM and AGC own approximately
61%
and
39%
, respectively, of the outstanding stock of Municipal Assurance Holdings Inc. (MAC Holdings), which owns
100%
of the outstanding common stock of MAC.
|
|
(2)
|
As indicated in Note 2, Acquisitions, AGC completed the acquisition of CIFGH (the parent company of CIFGNA) on July 1, 2016 and Radian Asset on April 1, 2015. Both CIFGNA and Radian Asset was merged with and into AGC, with AGC as the surviving company of the merger. The impact to AGC's policyholders' surplus was approximately
$287 million
from the CIFGH acquisition, on a statutory basis, as of July 1, 2016 and
$333 million
from the Radian Asset acquisition, on a statutory basis, as of April 1, 2015.
|
Contingency Reserves
On July 15, 2013, AGM and its wholly-owned subsidiary AGE (together, the AGM Group) and AGC, were notified that the New York State Department of Financial Services (NYDFS) and the Maryland Insurance Administration (MIA) did not object to the AGM Group and AGC, respectively, reassuming all of the outstanding contingency reserves that the AGM Group and AGC had ceded to AG Re and electing to cease ceding future contingency reserves to AG Re. The insurance regulators permitted the AGM Group and AGC to reassume the contingency reserves in increments over
three years
. In the third quarter of 2015, the AGM Group and AGC each reassumed their respective final installments and as of December 31, 2015, the AGM Group and AGC had collectively reassumed an aggregate of approximately
$522 million
.
From time to time, AGM and AGC have obtained the approval of their regulators to release contingency reserves based on losses or because the accumulated reserve is deemed excessive in relation to the insurer's outstanding insured obligations. In 2016, on the latter basis, AGM obtained the NYDFS's approval for a contingency reserve release of approximately
$175 million
and AGC obtained the MIA's approval for a contingency reserve release of approximately
$152 million
. In addition, MAC also released approximately
$53 million
of contingency reserves, which consisted of the assumed contingency reserves maintained by MAC, as reinsurer of AGM, in respect of the same obligations that were the subject of AGM's
$175 million
release.
222
With respect to the regular, quarterly contributions to contingency reserves required by the applicable Maryland and New York laws and regulations, such laws and regulations permit the discontinuation of such quarterly contributions to a company’s contingency reserves when such company’s aggregate contingency reserves for a particular line of business (i.e., municipal or non-municipal) exceed the sum of the company’s outstanding principal for each specified category of obligations within the particular line of business multiplied by the specified contingency reserve factor for each such category. In accordance with such laws and regulations, and with the approval of the MIA and the NYDFS, respectively, AGC ceased making quarterly contributions to its contingency reserves for both municipal and non-municipal business and AGM ceased making quarterly contributions to its contingency reserves for non-municipal business, in each case beginning in the fourth quarter of 2014. Such cessations are expected to continue for as long as AGC and AGM satisfy the foregoing condition for their applicable lines of business.
Dividend Restrictions and Capital Requirements
Under New York insurance law, AGM and MAC may only pay dividends out of "earned surplus," which is the portion of the company's surplus that represents the net earnings, gains or profits (after deduction of all losses) that have not been distributed to shareholders as dividends, transferred to stated capital or capital surplus, or applied to other purposes permitted by law, but does not include unrealized appreciation of assets. AGM and MAC may each pay dividends without the prior approval of the New York Superintendent of Financial Services (New York Superintendent) that, together with all dividends declared or distributed by it during the preceding 12 months, do not exceed the lesser of
10%
of its policyholders' surplus (as of its last annual or quarterly statement filed with the New York Superintendent) or
100%
of its adjusted net investment income during that period. The maximum amount available during 2017 for AGM to distribute as dividends without regulatory approval is estimated to be approximately
$232 million
, of which approximately
$81 million
is estimated to be available for distribution in the first quarter of 2017. The maximum amount available during 2017 for MAC to distribute as dividends without regulatory approval is estimated to be approximately
$49 million
. Since its capitalization in 2013, MAC has not distributed any dividends. MAC currently intends to allocate the distribution of such amount quarterly in 2017.
Under Maryland's insurance law, AGC may, with prior notice to the Maryland Insurance Commissioner, pay an ordinary dividend that, together with all dividends paid in the prior 12 months, does not exceed the lesser of
10%
of its policyholders' surplus (as of the prior December 31) or
100%
of its adjusted net investment income during that period. The maximum amount available during 2017 for AGC to distribute as ordinary dividends is approximately
$107 million
, of which approximately
$29 million
is available for distribution in the first quarter of 2017.
On June 30, 2016, MAC obtained approval from the NYDFS to repay its
$300 million
surplus note to MAC Holdings and its
$100 million
surplus note (plus accrued interest) to AGM. Accordingly, on June 30, 2016, MAC transferred cash and/or marketable securities to (i) MAC Holdings in an aggregate amount equal to
$300 million
, and (ii) AGM in an aggregate amount of
$102.5 million
. MAC Holdings, upon receipt of such
$300 million
from MAC, distributed cash and/or marketable securities in an aggregate amount of
$300 million
to its shareholders, AGM and AGC, in proportion to their respective
61%
and
39%
ownership interests such that AGM received
$182 million
and AGC received
$118 million
.
For AG Re, any distribution (including repurchase of shares) of any share capital, contributed surplus or other statutory capital that would reduce its total statutory capital by
15%
or more of its total statutory capital as set out in its previous year's financial statements requires the prior approval of the Bermuda Monetary Authority (Authority). Separately, dividends are paid out of an insurer's statutory surplus and cannot exceed that surplus. Further, annual dividends cannot exceed
25%
of total statutory capital and surplus as set out in its previous year's financial statements, which is
$314 million
, without AG Re certifying to the Authority that it will continue to meet required margins.
As of December 31, 2016, the Authority now requires insurers to prepare statutory financial statements in accordance with the particular accounting principles adopted by the insurer (which, in the case of AG Re, are U.S. GAAP), subject to certain adjustments. As a result of this new requirement, certain assets previously non-admitted by AG Re are now admitted, resulting in an increase to AG Re’s statutory capital and surplus limitation. Based on the foregoing limitations, in 2017 AG Re has the capacity to (i) make capital distributions in an aggregate amount up to
$128 million
without the prior approval of the Authority and (ii) declare and pay dividends in an aggregate amount up to the limit of its outstanding statutory surplus, which was approximately
$314 million
as of
December 31, 2016
. Such dividend capacity is further limited by the actual amount of AG Re’s unencumbered assets, which amount changes from time to time due in part to collateral posting requirements. As of
December 31, 2016
, AG Re had unencumbered assets of approximately
$596 million
.
223
U.K. company law prohibits each of AGE and AGUK from declaring a dividend to its shareholders unless it has “profits available for distribution.” The determination of whether a company has profits available for distribution is based on its accumulated realized profits less its accumulated realized losses. While the U.K. insurance regulatory laws impose no statutory restrictions on a general insurer's ability to declare a dividend, the Prudential Regulation Authority's capital requirements may in practice act as a restriction on dividends.
Dividends and Surplus Notes
By Insurance Company Subsidiaries
|
Year Ended December 31,
|
|||||||||||
|
2016
|
2015
|
2014
|
|||||||||
|
(in millions)
|
|||||||||||
|
Dividends paid by AGC to AGUS
|
$
|
79
|
|
$
|
90
|
|
$
|
69
|
|
||
|
Dividends paid by AGM to AGMH
|
247
|
|
215
|
|
160
|
|
|||||
|
Dividends paid by AG Re to AGL
|
100
|
|
150
|
|
82
|
|
|||||
|
Repayment of surplus note by AGM to AGMH
|
—
|
|
25
|
|
50
|
|
|||||
|
Repayment of surplus note by MAC to AGM
|
100
|
|
—
|
|
—
|
|
|||||
|
Repayment of surplus note by MAC to MAC Holdings (1)
|
300
|
|
—
|
|
—
|
|
|||||
____________________
|
(1)
|
MAC Holdings returned
$300 million
to AGM and AGC, in proportion to their ownership percentages, in the second quarter of 2016.
|
Stock Redemption Plan
On November 25, 2016, the New York Superintendent approved AGM's request to repurchase
125
of its shares of common stock from its direct parent, AGMH, for approximately
$300 million
. AGM implemented the stock redemption plan in December 2016. Each share repurchased by AGM was retired and ceased to be an authorized share. Pursuant to AGM's Amended and Restated Charter, the par value of AGM's remaining shares of common stock issued and outstanding increased automatically in order to maintain AGM's total paid-in capital at
$15 million
and its authorized capital at
$20 million
.
|
12.
|
Income Taxes
|
Accounting Policy
The provision for income taxes consists of an amount for taxes currently payable and an amount for deferred taxes. Deferred income taxes are provided for temporary differences between the financial statement carrying amounts and tax bases of assets and liabilities, using enacted rates in effect for the year in which the differences are expected to reverse. A valuation allowance is recorded to reduce the deferred tax asset to an amount that is more likely than not to be realized.
Non-interest-bearing tax and loss bonds are purchased in the amount of the tax benefit that results from deducting contingency reserves as provided under Internal Revenue Code Section 832(e). The Company records the purchase of tax and loss bonds in deferred taxes.
The Company recognizes tax benefits only if a tax position is “more likely than not” to prevail.
Overview
AGL, and its "Bermuda Subsidiaries," which consist of AG Re, AGRO, and Cedar Personnel Ltd., are not subject to any income, withholding or capital gains taxes under current Bermuda law. The Company has received an assurance from the Minister of Finance in Bermuda that, in the event of any taxes being imposed, AGL and its Bermuda Subsidiaries will be exempt from taxation in Bermuda until March 31, 2035. AGL's U.S. and U.K. subsidiaries are subject to income taxes imposed by U.S. and U.K. authorities, respectively, and file applicable tax returns. In addition, AGRO, a Bermuda domiciled company and AGE, a U.K. domiciled company, have elected under Section 953(d) of the U.S. Internal Revenue Code to be taxed as a U.S. domestic corporation.
224
In November 2013, AGL became tax resident in the U.K. although it will remain a Bermuda-based company and its administrative and head office functions will continue to be carried on in Bermuda. As a U.K. tax resident company, AGL is required to file a corporation tax return with Her Majesty’s Revenue & Customs (HMRC). AGL is subject to U.K. corporation tax in respect of its worldwide profits (both income and capital gains), subject to any applicable exemptions. The main rate of corporation tax remains at
20%
for 2016. AGL has also registered in the U.K. to report its Value Added Tax (VAT) liability. The current rate of VAT is
20%
. Assured Guaranty expects that the dividends AGL receives from its direct subsidiaries will be exempt from U.K. corporation tax due to the exemption in section 931D of the U.K. Corporation Tax Act 2009. In addition, any dividends paid by AGL to its shareholders should not be subject to any withholding tax in the U.K. Assured Guaranty does not expect any profits of non-U.K. resident members of the group to be taxed under the U.K. "controlled foreign companies" regime and has obtained a clearance from HMRC confirming this on the basis of current facts.
AGUS files a consolidated federal income tax return with AGC, AG Financial Products Inc. (AGFP), AG Analytics Inc., AGMH and subsidiaries. On April 1, 2015 AGC purchased Radian Asset and Van American. Subsequent to the purchase, Radian Asset merged into AGC and dissolved. Van American joined AGUS consolidated tax group. On July 1, 2016 AGC purchased CIFGNA, which subsequently merged into AGC and dissolved. Assured Guaranty Overseas U.S. Holdings Inc. and its subsidiaries AGRO and AG Intermediary Inc., file their own consolidated federal income tax return.
Provision for Income Taxes
The effective tax rates reflect the proportion of income recognized by each of the Company’s operating subsidiaries, with U.S. subsidiaries taxed at the U.S. marginal corporate income tax rate of
35%
, U.K. subsidiaries taxed at the U.K. marginal corporate tax rate of
20%
unless subject to U.S. tax by election or as a U.S. controlled foreign corporation, and no taxes for the Company’s Bermuda subsidiaries unless subject to U.S. tax by election or as a U.S. controlled foreign corporation. For periods subsequent to April 1, 2015, the U.K. corporation tax rate has been reduced to
20%
and is expected to remain unchanged until April 1, 2017. For period April 1, 2014 to April 1, 2015 the U.K. corporation tax rate was
21%
resulting in a blended tax rate of
20.25%
in 2015. The Company’s overall effective tax rate fluctuates based on the distribution of income across jurisdictions.
A reconciliation of the difference between the provision for income taxes and the expected tax provision at statutory rates in taxable jurisdictions is presented below.
Effective Tax Rate Reconciliation
|
|
Year Ended December 31,
|
||||||||||
|
|
2016
|
2015
|
2014
|
||||||||
|
|
(in millions)
|
||||||||||
|
Expected tax provision (benefit) at statutory rates in taxable jurisdictions
|
$
|
316
|
|
$
|
443
|
|
$
|
490
|
|
||
|
Tax-exempt interest
|
(49
|
)
|
(54
|
)
|
(53
|
)
|
|||||
|
Gain on bargain purchase
|
(125
|
)
|
(19
|
)
|
—
|
|
|||||
|
Change in liability for uncertain tax positions
|
11
|
|
12
|
|
9
|
|
|||||
|
Effect of provision to tax return filing adjustments
|
(15
|
)
|
(11
|
)
|
(6
|
)
|
|||||
|
Other
|
(2
|
)
|
4
|
|
3
|
|
|||||
|
Total provision (benefit) for income taxes
|
$
|
136
|
|
$
|
375
|
|
$
|
443
|
|
||
|
Effective tax rate
|
13.4
|
%
|
26.2
|
%
|
28.9
|
%
|
|||||
The expected tax provision at statutory rates in taxable jurisdictions is calculated as the sum of pretax income in each jurisdiction multiplied by the statutory tax rate of the jurisdiction by which it will be taxed. Pretax income of the Company’s subsidiaries which are not U.S. or U.K. domiciled but are subject to U.S. or U.K. tax by election, establishment of tax residency or as controlled foreign corporations, are included at the U.S. or U.K. statutory tax rate. Where there is a pretax loss in one jurisdiction and pretax income in another, the total combined expected tax rate may be higher or lower than any of the individual statutory rates.
225
The following table presents pretax income and revenue by jurisdiction.
Pretax Income (Loss) by Tax Jurisdiction
|
|
Year Ended December 31,
|
||||||||||
|
|
2016
|
2015
|
2014
|
||||||||
|
|
(in millions)
|
||||||||||
|
United States
|
$
|
921
|
|
$
|
1,284
|
|
$
|
1,420
|
|
||
|
Bermuda
|
126
|
|
177
|
|
142
|
|
|||||
|
U.K.
|
(30
|
)
|
(30
|
)
|
(31
|
)
|
|||||
|
Total
|
$
|
1,017
|
|
$
|
1,431
|
|
$
|
1,531
|
|
||
Revenue by Tax Jurisdiction
|
|
Year Ended December 31,
|
||||||||||
|
|
2016
|
2015
|
2014
|
||||||||
|
|
(in millions)
|
||||||||||
|
United States
|
$
|
1,442
|
|
$
|
1,853
|
|
$
|
1,633
|
|
||
|
Bermuda
|
239
|
|
361
|
|
365
|
|
|||||
|
U.K.
|
(4
|
)
|
(7
|
)
|
(4
|
)
|
|||||
|
Total
|
$
|
1,677
|
|
$
|
2,207
|
|
$
|
1,994
|
|
||
Pretax income by jurisdiction may be disproportionate to revenue by jurisdiction to the extent that insurance losses incurred are disproportionate.
226
Components of Net Deferred Tax Assets
|
As of December 31,
|
|||||||
|
2016
|
2015
|
||||||
|
(in millions)
|
|||||||
|
Deferred tax assets:
|
|||||||
|
Unrealized losses on credit derivative financial instruments, net
|
$
|
66
|
|
$
|
33
|
|
|
|
Unearned premium reserves, net
|
229
|
|
254
|
|
|||
|
Loss and LAE reserve
|
216
|
|
64
|
|
|||
|
Tax and loss bonds
|
50
|
|
39
|
|
|||
|
Alternative minimum tax credit
|
17
|
|
55
|
|
|||
|
Foreign tax credit
|
20
|
|
11
|
|
|||
|
DAC
|
29
|
|
27
|
|
|||
|
Investment basis difference
|
76
|
|
86
|
|
|||
|
Deferred compensation
|
40
|
|
41
|
|
|||
|
Net operating loss
|
64
|
|
—
|
|
|||
|
Other
|
43
|
|
17
|
|
|||
|
Total deferred income tax assets
|
850
|
|
627
|
|
|||
|
Deferred tax liabilities:
|
|||||||
|
Contingency reserves
|
82
|
|
64
|
|
|||
|
Public debt
|
91
|
|
94
|
|
|||
|
Unrealized appreciation on investments
|
84
|
|
108
|
|
|||
|
Unrealized gains on CCS
|
22
|
|
22
|
|
|||
|
Market discount
|
22
|
|
21
|
|
|||
|
Other
|
33
|
|
31
|
|
|||
|
Total deferred income tax liabilities
|
334
|
|
340
|
|
|||
|
Less: Valuation allowance
|
19
|
|
11
|
|
|||
|
Net deferred income tax asset
|
$
|
497
|
|
$
|
276
|
|
|
As of
December 31, 2016
, the Company had alternative minimum tax credits of
$17 million
which do not expire. During
2016
the Company generated
$1 million
of foreign tax credit which will expire in 2026. Management believes sufficient future taxable income exists to realize the full benefit of these tax credits.
As part of the CIFG Acquisition, the Company acquired
$189 million
of net operating losses (NOL) which will begin to expire in 2033. The NOL has been limited under Internal Revenue Code Section 382 due to a change in control as a result of the acquisition. As of
December 31, 2016
, the Company had
$184 million
of NOL’s available to offset its future U.S. taxable income.
Valuation Allowance
As part of the Radian Asset Acquisition, the Company acquired
$19 million
of foreign tax credits (FTC) which will expire in 2020. Of that balance,
$11 million
was guaranteed at the time of the purchase with an additional
$8 million
allocated after filing 2015 tax return. After reviewing positive and negative evidence, the Company came to the conclusion that it is more likely than not that the FTC will not be utilized, and therefore recorded a valuation allowance with respect to this tax attribute.
The Company came to the conclusion that it is more likely than not that the remaining net deferred tax asset will be fully realized after weighing all positive and negative evidence available as required under GAAP. The positive evidence that was considered included the cumulative income the Company has earned over the last
three
years, and the significant unearned premium income to be included in taxable income. The positive evidence outweighs any negative evidence that exists. As such, the Company believes that no valuation allowance is necessary in connection with this deferred tax asset. The Company will continue to analyze the need for a valuation allowance on a quarterly basis.
227
Audits
AGUS has open tax years with the U.S. Internal Revenue Service (IRS) for 2009 forward and is currently under audit for the 2009-2012 tax years. In December of 2016 the IRS issued a Revenue Agent Report (RAR) which did not identify any material adjustments that were not already accounted for in the prior periods. It is expected that the audit will close in 2017 and, depending on the final outcome, reserves for uncertain tax positions may be released. Assured Guaranty Oversees U.S. Holdings Inc. has open tax years of 2013 forward. The Company's U.K. subsidiaries are not currently under examination and have open tax years of 2014 forward. CIFGNA, which was acquired by AGC during 2016, is not currently under examination and has open tax years of 2013 forward.
Uncertain Tax Positions
The following table provides a reconciliation of the beginning and ending balances of the total liability for unrecognized tax positions.
|
2016
|
2015
|
2014
|
|||||||||
|
(in millions)
|
|||||||||||
|
Balance as of January 1,
|
$
|
40
|
|
$
|
28
|
|
$
|
20
|
|
||
|
Effect of provision to tax return filing adjustments
|
6
|
|
10
|
|
6
|
|
|||||
|
Increase in unrecognized tax positions as a result of position taken during the current period
|
4
|
|
2
|
|
2
|
|
|||||
|
Balance as of December 31,
|
$
|
50
|
|
$
|
40
|
|
$
|
28
|
|
||
The Company's policy is to recognize interest related to uncertain tax positions in income tax expense and has accrued
$2 million
for
2016
and
$1 million
per year for the year ended 2015 and 2014 respectively. As of
December 31, 2016
and
December 31, 2015
, the Company has accrued
$7 million
and
$5 million
of interest, respectively.
The total amount of unrecognized tax positions as of
December 31, 2016
would affect the effective tax rate, if recognized.
Tax Treatment of CDS
The Company treats the guaranty it provides on CDS as an insurance contract for tax purposes and as such a taxable loss does not occur until the Company expects to make a loss payment to the buyer of credit protection based upon the occurrence of one or more specified credit events with respect to the contractually referenced obligation or entity. The Company holds its CDS to maturity, at which time any unrealized fair value loss in excess of credit-related losses would revert to zero. The tax treatment of CDS is an unsettled area of the law. The uncertainty relates to the IRS determination of the income or potential loss associated with CDS as either subject to capital gain (loss) or ordinary income (loss) treatment. In treating CDS as insurance contracts the Company treats both the receipt of premium and payment of losses as ordinary income and believes it is more likely than not that any CDS credit related losses will be treated as ordinary by the IRS. To the extent the IRS takes the view that the losses are capital losses in the future and the Company incurred actual losses associated with the CDS, the Company would need sufficient taxable income of the same character within the carryback and carryforward period available under the tax law.
|
13.
|
Reinsurance and Other Monoline Exposures
|
The Company assumes exposure on insured obligations (Assumed Business) and may cede portions of its exposure on obligations it has insured (Ceded Business) in exchange for premiums, net of ceding commissions. The Company historically entered into ceded reinsurance contracts in order to obtain greater business diversification and reduce the net potential loss from large risks.
Accounting Policy
For business assumed and ceded, the accounting model of the underlying direct financial guaranty contract dictates the accounting model used for the reinsurance contract (except for those eliminated as FG VIEs). For any assumed or ceded financial guaranty insurance premiums and financial guaranty insurance losses, the accounting models described in Note 6 are followed. For any assumed or ceded credit derivative contracts, the accounting model in Note 8 is followed.
228
Assumed and Ceded Business
The Company assumes business from third party insurers and reinsurers, including other monoline financial guaranty companies. Under these relationships, the Company assumes a portion of the ceding company’s insured risk in exchange for a portion of the ceding Company's premium for the insured risk (typically, net of a ceding commission). The Company’s facultative and treaty agreements are generally subject to termination at the option of the ceding company:
|
•
|
if the Company fails to meet certain financial and regulatory criteria and to maintain a specified minimum financial strength rating, or
|
|
•
|
upon certain changes of control of the Company.
|
Upon termination under these conditions, the Company may be required (under some of its reinsurance agreements) to return to the ceding company unearned premiums (net of ceding commissions) and loss reserves calculated on a statutory basis of accounting, attributable to reinsurance assumed pursuant to such agreements after which the Company would be released from liability with respect to the Assumed Business.
Upon the occurrence of the conditions set forth in the first bullet above, whether or not an agreement is terminated, the Company may be required to obtain a letter of credit or alternative form of security to collateralize its obligation to perform under such agreement or it may be obligated to increase the level of ceding commission paid.
The downgrade of the financial strength ratings of AG Re or of AGC gives certain ceding companies the right to recapture business they had ceded to AG Re and AGC, which would lead to a reduction in the Company's unearned premium reserve and related earnings on such reserve. With respect to a significant portion of the Company's in-force financial guaranty assumed business, based on AG Re's and AGC's current ratings and subject to the terms of each reinsurance agreement, the third party ceding company may have the right to recapture business it had ceded to AG Re and/or AGC, and in connection therewith, to receive payment from AG Re or AGC of an amount equal to the statutory unearned premium (net of ceding commissions) and statutory loss reserves (if any) associated with that business, plus, in certain cases, an additional required payment. As of
December 31, 2016
, if each third party insurer ceding business to AG Re and/or AGC had a right to recapture such business, and chose to exercise such right, the aggregate amounts that AG Re and AGC could be required to pay to all such companies would be approximately
$45 million
and
$18 million
, respectively.
The Company has Ceded Business to non-affiliated companies to limit its exposure to risk. Under these relationships, the Company ceded a portion of its insured risk to the reinsurer in exchange for the reinsurer receiving a share of the Company's premiums for the insured risk (typically, net of a ceding commission). The Company remains primarily liable for all risks it directly underwrites and is required to pay all gross claims. It then seeks reimbursement from the reinsurer for its proportionate share of claims. The Company may be exposed to risk for this exposure if it were required to pay the gross claims and not be able to collect ceded claims from an assuming company experiencing financial distress. A number of the financial guaranty insurers to which the Company has ceded par have experienced financial distress and been downgraded by the rating agencies as a result. In addition, state insurance regulators have intervened with respect to some of these insurers. The Company’s ceded contracts generally allow the Company to recapture Ceded Business after certain triggering events, such as reinsurer downgrades.
Over the past several years, the Company has entered into several commutations in order to reassume previously ceded books of business from its reinsurers. The Company has also canceled assumed reinsurance contracts.
Net Effect of Commutations of Ceded and
Cancellations of Assumed Reinsurance Contracts
|
|
Year Ended December 31,
|
||||||||||
|
|
2016
|
2015
|
2014
|
||||||||
|
|
(in millions)
|
||||||||||
|
Increase (decrease) in net unearned premium reserve
|
$
|
—
|
|
$
|
23
|
|
$
|
20
|
|
||
|
Increase (decrease) in net par outstanding
|
28
|
|
855
|
|
1,167
|
|
|||||
|
Commutation gains (losses)
|
8
|
|
28
|
|
23
|
|
|||||
229
The following table presents the components of premiums and losses reported in the consolidated statement of operations and the contribution of the Company's Assumed and Ceded Businesses.
Effect of Reinsurance on Statement of Operations
|
|
Year Ended December 31,
|
||||||||||
|
|
2016
|
2015
|
2014
|
||||||||
|
|
(in millions)
|
||||||||||
|
Premiums Written:
|
|||||||||||
|
Direct
|
$
|
165
|
|
$
|
164
|
|
$
|
116
|
|
||
|
Assumed(1)
|
(11
|
)
|
17
|
|
(12
|
)
|
|||||
|
Ceded(2)
|
(17
|
)
|
10
|
|
15
|
|
|||||
|
Net
|
$
|
137
|
|
$
|
191
|
|
$
|
119
|
|
||
|
Premiums Earned:
|
|||||||||||
|
Direct
|
$
|
887
|
|
$
|
792
|
|
$
|
581
|
|
||
|
Assumed
|
27
|
|
40
|
|
47
|
|
|||||
|
Ceded
|
(50
|
)
|
(66
|
)
|
(58
|
)
|
|||||
|
Net
|
$
|
864
|
|
$
|
766
|
|
$
|
570
|
|
||
|
Loss and LAE:
|
|||||||||||
|
Direct
|
$
|
327
|
|
$
|
399
|
|
$
|
132
|
|
||
|
Assumed
|
0
|
|
45
|
|
37
|
|
|||||
|
Ceded
|
(32
|
)
|
(20
|
)
|
(43
|
)
|
|||||
|
Net
|
$
|
295
|
|
$
|
424
|
|
$
|
126
|
|
||
____________________
|
(1)
|
Negative assumed premiums written were due to changes in expected debt service schedules.
|
|
(2)
|
Positive ceded premiums written were due to commutations and changes in expected debt service schedules.
|
In addition to the items presented in the table above, the Company records in net change in fair value of credit derivatives on the consolidated statements of operations, the effect of assumed and ceded credit derivative exposures. These amounts were losses of
$27 million
in 2016 and
$3 million
in 2015 and gains of
$2 million
in 2014.
Other Monoline Exposures
In addition to assumed and ceded reinsurance arrangements, the Company may also have exposure to some financial guaranty reinsurers (i.e., monolines) in other areas. Second-to-pay insured par outstanding represents transactions the Company has insured that were previously insured by third party insurers and reinsurers. The Company underwrites such transactions based on the underlying insured obligation without regard to the primary insurer. Another area of exposure is in the investment portfolio where the Company holds fixed-maturity securities that are wrapped by monolines and whose value may change based on the rating of the monoline. As of
December 31, 2016
, based on fair value, the Company had fixed-maturity securities in its investment portfolio consisting of
$110 million
insured by National,
$83 million
insured by Ambac and
$8 million
insured by other guarantors.
In addition, the Company acquired bonds for loss mitigation or other risk management purposes. As of
December 31, 2016
these bonds had a fair value of
$332 million
insured by MBIA and
$126 million
insured by FGIC UK Limited. On January 10, 2017, the Company delivered the bonds insured by MBIA in connection with its acquisition of AGLN. See Note 2, Acquisitions, for more information on the acquisition of AGLN.
In accordance with U.S. statutory accounting requirements and U.S. insurance laws and regulations, in order for the Company to receive credit for liabilities ceded to reinsurers domiciled outside of the U.S., such reinsurers must secure their liabilities to the Company. All of the unauthorized reinsurers in the tables below are required to post collateral for the benefit of the Company in an amount at least equal to the sum of their ceded unearned premium reserve, loss reserves and contingency reserves all calculated on a statutory basis of accounting. In addition, certain authorized reinsurers in the tables below post collateral on terms negotiated with the Company.
230
Monoline and Reinsurer Exposure by Company
|
|
Par Outstanding
|
|||||||||||
|
As of December 31, 2016
|
||||||||||||
|
Reinsurer
|
Ceded Par
Outstanding (1) |
Second-to-
Pay Insured Par Outstanding (2) |
Assumed Par
Outstanding |
|||||||||
|
|
(in millions)
|
|||||||||||
|
Reinsurers rated investment grade:
|
||||||||||||
|
Tokio Marine & Nichido Fire Insurance Co., Ltd. (3) (4)
|
$
|
3,436
|
|
$
|
—
|
|
$
|
—
|
|
|||
|
Mitsui Sumitomo Insurance Co. Ltd. (3) (4)
|
1,273
|
|
—
|
|
—
|
|
||||||
|
National
|
—
|
|
4,420
|
|
4,364
|
|
||||||
|
Subtotal
|
4,709
|
|
4,420
|
|
4,364
|
|
||||||
|
Reinsurers rated BIG, had rating withdrawn or not rated:
|
||||||||||||
|
American Overseas Reinsurance Company Limited (3)
|
3,573
|
|
—
|
|
30
|
|
||||||
|
Syncora (3)
|
2,062
|
|
1,098
|
|
655
|
|
||||||
|
ACA Financial Guaranty Corp.
|
637
|
|
20
|
|
—
|
|
||||||
|
Ambac
|
115
|
|
2,862
|
|
6,695
|
|
||||||
|
MBIA
|
—
|
|
|
1,024
|
|
|
165
|
|
||||
|
MBIA UK (5)
|
—
|
|
|
319
|
|
|
211
|
|
||||
|
FGIC (6)
|
—
|
|
1,194
|
|
410
|
|
||||||
|
Ambac Assurance Corp. Segregated Account
|
—
|
|
73
|
|
614
|
|
||||||
|
Other (3)
|
60
|
|
529
|
|
120
|
|
||||||
|
Subtotal
|
6,447
|
|
7,119
|
|
8,900
|
|
||||||
|
Total
|
$
|
11,156
|
|
$
|
11,539
|
|
$
|
13,264
|
|
|||
____________________
|
(1)
|
Of the total ceded par to reinsurers rated BIG, had rating withdrawn or not rated,
$384 million
is rated BIG.
|
|
(2)
|
The par on second-to-pay exposure where the primary insurer and underlying transaction rating are both BIG is
$788 million
.
|
|
(3)
|
The total collateral posted by all non-affiliated reinsurers required or had agreed to post collateral as of
December 31, 2016
was approximately
$387 million
.
|
(4) The Company benefits from trust arrangements that satisfy the triple-A credit requirement of S&P and/or Moody’s.
|
(5)
|
See Note 2, Acquisitions, for more information on MBIA UK.
|
|
(6)
|
FGIC includes subsidiaries Financial Guaranty Insurance Company and FGIC UK Limited.
|
231
Amounts Due (To) From Reinsurers
As of December 31, 2016
|
|
Assumed
Premium, net
of Commissions
|
Ceded
Premium, net
of Commissions
|
Assumed
Expected Loss to be Paid |
Ceded
Expected Loss to be Paid |
|||||||||||
|
|
(in millions)
|
||||||||||||||
|
Reinsurers rated investment grade
|
$
|
5
|
|
$
|
(11
|
)
|
$
|
(1
|
)
|
$
|
62
|
|
|||
|
Reinsurers rated BIG, had rating withdrawn or not rated:
|
|||||||||||||||
|
Ambac
|
33
|
|
—
|
|
(1
|
)
|
—
|
|
|||||||
|
Syncora
|
13
|
|
(18
|
)
|
—
|
|
(3
|
)
|
|||||||
|
Ambac Assurance Corp. Segregated Account
|
6
|
|
—
|
|
(47
|
)
|
—
|
|
|||||||
|
FGIC
|
4
|
|
—
|
|
(13
|
)
|
—
|
|
|||||||
|
MBIA
|
0
|
|
—
|
|
(8
|
)
|
—
|
|
|||||||
|
MBIA UK
|
4
|
|
—
|
|
0
|
|
—
|
|
|||||||
|
American Overseas Reinsurance Company Limited
|
—
|
|
(5
|
)
|
—
|
|
28
|
|
|||||||
|
Other
|
—
|
|
(12
|
)
|
—
|
|
—
|
|
|||||||
|
Subtotal
|
60
|
|
(35
|
)
|
(69
|
)
|
25
|
|
|||||||
|
Total
|
$
|
65
|
|
$
|
(46
|
)
|
$
|
(70
|
)
|
$
|
87
|
|
|||
Excess of Loss Reinsurance Facility
AGC, AGM and MAC entered into a
$360 million
aggregate excess of loss reinsurance facility with a number of reinsurers, effective as of January 1, 2016. This facility replaces a similar
$450 million
aggregate excess of loss reinsurance facility that AGC, AGM and MAC had entered into effective January 1, 2014 and which terminated on December 31, 2015. The new facility covers losses occurring either from January 1, 2016 through December 31, 2023, or January 1, 2017 through December 31, 2024, at the option of AGC, AGM and MAC. It terminates on January 1, 2018, unless AGC, AGM and MAC choose to extend it. The new facility covers certain U.S. public finance credits insured or reinsured by AGC, AGM and MAC as of September 30, 2015, excluding credits that were rated non-investment grade as of December 31, 2015 by Moody’s or S&P or internally by AGC, AGM or MAC and is subject to certain per credit limits. Among the credits excluded are those associated with the Commonwealth of Puerto Rico and its related authorities and public corporations. The new facility attaches when AGC’s, AGM’s and MAC’s net losses (net of AGC’s and AGM's reinsurance (including from affiliates) and net of recoveries) exceed
$1.25 billion
in the aggregate. The new facility covers a portion of the next
$400 million
of losses, with the reinsurers assuming pro rata in the aggregate
$360 million
of the
$400 million
of losses and AGC, AGM and MAC jointly retaining the remaining
$40 million
. The reinsurers are required to be rated at least AA- or to post collateral sufficient to provide AGM, AGC and MAC with the same reinsurance credit as reinsurers rated AA-. AGM, AGC and MAC are obligated to pay the reinsurers their share of recoveries relating to losses during the coverage period in the covered portfolio. AGC, AGM and MAC paid approximately
$9 million
of premiums in 2016 for the term January 1, 2016 through December 31, 2016 and had approximately
$9 million
of cash in trust accounts for the benefit of the reinsurers to be used to pay the premium for January 1, 2017 through December 31, 2017.
232
|
14.
|
Related Party Transactions
|
Wellington Management Company, LLP (Wellington) and BlackRock Financial Management, Inc. (BlackRock), each own more than
5%
of the Company's common shares, and each are investment managers for a portion of the Company's investment portfolio. The net expenses from transactions with Wellington and BlackRock were approximately $
4.2 million
in
2016
. The net expenses from transactions with Wellington were $
1.9 million
in
2015
and
$1.9 million
in 2014. As of December 31,
2016
and
2015
there were no other significant amounts payable to or amounts receivable from related parties, other than compensation in the ordinary course of business.
On January 6, 2017, as part of the Company's share repurchase program, the Company repurchased
297,131
common shares from its Chief Executive Officer and
23,062
common shares from its General Counsel. The Company repurchased the shares at the closing price of an AGL common share on the New York Stock Exchange on January 6, 2017. Separately, on that same date, these officers received
297,131
and
23,062
other common shares, respectively, in settlement of share units held by them in the employer stock fund of the Assured Guaranty Ltd. Supplemental Employee Retirement Plan (the AGL SERP). The units needed to be settled in January 2017 pursuant to the terms of an amendment adopted in 2011 to the AGL SERP, which amendment was adopted to comply with requirements of Section 409A of the Internal Revenue Code (the Code) and Section 457A of the Code.
|
15.
|
Commitments and Contingencies
|
Leases
AGL and its subsidiaries are party to various lease agreements accounted for as operating leases. The Company leases and occupies space in New York City through 2032. In addition, AGL and its subsidiaries lease additional office space in various locations under non-cancelable operating leases which expire at various dates through 2029. Rent expense was $
13.4 million
in
2016
, $
10.5 million
in
2015
and $
10.1 million
in
2014
.
AGM entered into an operating lease effective January 1, 2016, for new office space comprising one full floor and one partial floor at 1633 Broadway in New York City. The Company moved the principal place of business of AGM, AGC, MAC and the Company's other U.S. based subsidiaries from 31 West 52nd Street in New York City to this new location during the summer of 2016. The new lease is for approximately
88,000
square feet and runs until 2032, with an option, subject to certain conditions, to renew for
five
years at a fair market rent. The fixed annual rent, which commences after an initial rent holiday, begins at
$6.2 million
, rising in
two
steps to
$7.3 million
for the last
five
years of the initial term. In connection with the move and in return for rent abatement and certain other concessions, AGM terminated its lease on its existing office space at 31 West 52
nd
Street, which had been scheduled to run until
2026
.
On September 23, 2016, AGM entered into an amendment to that lease to include the remaining portion of the partial floor for the remainder of the lease term. The fixed annual rent, which commences after an initial rent holiday, begins at
$1.1 million
per annum, rising in
two
steps to
$1.3 million
for the last
five
years of the initial term.
Future Minimum Rental Payments
|
Year
|
(in millions)
|
|||
|
2017
|
$
|
6
|
|
|
|
2018
|
8
|
|
||
|
2019
|
9
|
|
||
|
2020
|
9
|
|
||
|
2021
|
8
|
|
||
|
Thereafter
|
88
|
|
||
|
Total
|
$
|
128
|
|
|
233
Legal Proceedings
Lawsuits arise in the ordinary course of the Company’s business. It is the opinion of the Company’s management, based upon the information available, that the expected outcome of litigation against the Company, individually or in the aggregate, will not have a material adverse effect on the Company’s financial position or liquidity, although an adverse resolution of litigation against the Company in a fiscal quarter or year could have a material adverse effect on the Company’s results of operations in a particular quarter or year.
In addition, in the ordinary course of their respective businesses, certain of the Company's subsidiaries assert claims in legal proceedings against third parties to recover losses paid in prior periods or prevent losses in the future, including those described in the "Recovery Litigation," section of Note 5, Expected Loss to be Paid. For example, as described there, in January 2016 the Company commenced an action for declaratory judgment and injunctive relief in the U.S. District Court for the District of Puerto Rico to invalidate executive orders issued by the Governor of Puerto Rico directing the retention or transfer of certain taxes and revenues pledged to secure the payment of certain bonds insured by the Company, and in July 2016, the Company filed a motion and form of complaint in the U.S. District Court for the District of Puerto Rico seeking relief from the PROMESA stay in order to file a complaint to protect its interest in certain pledged PRHTA toll revenues. As another example, in December 2008, the Company filed a claim in the Supreme Court of the State of New York against an investment manager in a transaction it insured alleging breach of fiduciary duty, gross negligence and breach of contract. The amounts, if any, the Company will recover in these and other proceedings to recover losses are uncertain, and recoveries, or failure to obtain recoveries, in any one or more of these proceedings during any quarter or year could be material to the Company's results of operations in that particular quarter or year.
Accounting Policy
The Company establishes accruals for litigation and regulatory matters to the extent it is probable that a loss has been incurred and the amount of that loss can be reasonably estimated. For litigation and regulatory matters where a loss may be reasonably possible, but not probable, or is probable but not reasonably estimable, no accrual is established, but if the matter is material, it is disclosed, including matters discussed below. The Company reviews relevant information with respect to its litigation and regulatory matters on a quarterly, and annual basis and updates its accruals, disclosures and estimates of reasonably possible loss based on such reviews.
Litigation
Proceedings Relating to the Company’s Financial Guaranty Business
The Company receives subpoenas
duces tecum
and interrogatories from regulators from time to time.
On November 28, 2011, Lehman Brothers International (Europe) (in administration) (LBIE) sued AGFP, an affiliate of AGC which in the past had provided credit protection to counterparties under CDS. AGC acts as the credit support provider of AGFP under these CDS. LBIE’s complaint, which was filed in the Supreme Court of the State of New York, alleged that AGFP improperly terminated
nine
credit derivative transactions between LBIE and AGFP and improperly calculated the termination payment in connection with the termination of
28
other credit derivative transactions between LBIE and AGFP. Following defaults by LBIE, AGFP properly terminated the transactions in question in compliance with the agreement between AGFP and LBIE, and calculated the termination payment properly. AGFP calculated that LBIE owes AGFP approximately
$29 million
in connection with the termination of the credit derivative transactions, whereas LBIE asserted in the complaint that AGFP owes LBIE a termination payment of approximately
$1.4 billion
. On February 3, 2012, AGFP filed a motion to dismiss certain of the counts in the complaint, and on March 15, 2013, the court granted AGFP's motion to dismiss the count relating to improper termination of the
nine
credit derivative transactions and denied AGFP's motion to dismiss the counts relating to the remaining transactions. On February 22, 2016, AGFP filed a motion for summary judgment on the remaining causes of action asserted by LBIE and on AGFP's counterclaims. Oral argument on AGFP's motion took place on July 21, 2016. LBIE's administrators disclosed in an April 10, 2015 report to LBIE’s unsecured creditors that LBIE's valuation expert has calculated LBIE's claim for damages in aggregate for the
28
transactions to range between a minimum of approximately
$200 million
and a maximum of approximately
$500 million
, depending on what adjustment, if any, is made for AGFP's credit risk and excluding any applicable interest.
On September 25, 2013, Wells Fargo Bank, N.A., as trust administrator of the MASTR Adjustable Rate Mortgages Trust 2007-3 (Wells Fargo), filed an interpleader complaint in the U.S. District Court for the Southern District of New York seeking adjudication of a dispute between Wales LLC (Wales) and AGM as to whether AGM is entitled to reimbursement from
234
certain cashflows for principal claims paid in respect of insured certificates. On September 30, 2016, the court issued an opinion denying a motion for judgment on the pleadings filed by Wales. On January 3, 2017, the Court approved a Stipulation and Order of Dismissal of Wales from the action due to Wales having sold its interests in the MASTR Adjustable Rate Mortgages Trust 2007-3 certificates. On February 9, 2017, the remaining parties submitted a Stipulation and (Proposed) Order of Voluntary Dismissal, which the Court has not yet so-ordered. The Company estimates that an adverse outcome to the interpleader proceeding could increase losses on the transaction by approximately
$10
-
$20 million
, net of expected settlement payments and reinsurance in force.
On December 22, 2014, Deutsche Bank National Trust Company, as indenture trustee for the AAA Trust 2007-2 Re-REMIC (the Trustee), filed a “trust instructional proceeding” petition in the State of California Superior Court (Probate Division, Orange County), seeking the court’s instruction as to how it should allocate the losses resulting from its December 2014 sale of
four
RMBS owned by the AAA Trust 2007-2 Re-REMIC. This sale of approximately
$70 million
principal balance of RMBS was made pursuant to AGC’s liquidation direction in November 2014, and resulted in approximately
$27 million
of gross proceeds to the Re-REMIC. On December 22, 2014, AGC directed the indenture trustee to allocate to the uninsured Class A-3 Notes the losses realized from the sale. On May 4, 2015, the Superior Court rejected AGC’s allocation direction, and ordered the Trustee to allocate to the Class A-3 noteholders a pro rata share of the
$27 million
of gross proceeds. AGC is appealing the Superior Court’s decision to the California Court of Appeal.
On May 28, 2014, Houston Casualty Company Europe, Seguros y Reseguros, S.A. (HCCE) notified Radian Asset that it was demanding arbitration against Radian Asset in connection with housing cooperative losses presented to Radian Asset by HCCE under several years of quota-share surety reinsurance contracts. Through November 30, 2015, HCCE had presented AGC, as successor to Radian Asset, with approximately €
15 million
in claims. In January 2016, Assured Guaranty and HCCE settled all the claims related to the Spanish housing cooperative losses.
Proceedings Related to AGMH’s Former Financial Products Business
The following is a description of legal proceedings involving AGMH’s former Financial Products Business. Although the Company did not acquire AGMH’s former Financial Products Business, which included AGMH’s former GIC business, medium term notes business and portions of the leveraged lease businesses, certain legal proceedings relating to those businesses were against entities that the Company did acquire. While Dexia SA and Dexia Crédit Local S.A. (together, Dexia) have paid all expenses and settlement amounts due to date as a result of the proceedings described below, such indemnification might not be sufficient to fully hold the Company harmless against any injunctive relief or civil or criminal sanction that is imposed against AGMH or its subsidiaries as a result of any potential newly asserted claims related to these matters.
Governmental Investigations into Former Financial Products Business
AGMH and/or AGM received subpoenas
duces tecum
and interrogatories or civil investigative demands from the Attorneys General of the States of Connecticut, Florida, Illinois, Massachusetts, Missouri, New York, Texas and West Virginia relating to their investigations of alleged bid rigging of municipal GICs. In addition, AGMH received a subpoena from the Antitrust Division of the Department of Justice in November 2006 issued in connection with an ongoing criminal investigation of bid rigging of awards of municipal GICs and other municipal derivatives. AGMH responded to such requests when they were received several years ago. While it is possible AGMH may receive additional inquiries from these or other regulators, the Company is not currently aware that any governmental authority, including such Attorneys General or the Department of Justice, are actively pursuing or contemplating legal proceedings with respect to AGMH's former Financial Products Business.
Lawsuits Relating to Former Financial Products Business
From 2008 through 2010, complaints were brought on behalf of a purported class of state, local and municipal government entities alleging federal antitrust violations in the municipal derivatives industry, seeking damages and alleging, among other things, a conspiracy to fix the pricing of, and manipulate bids for, municipal derivatives, including GICs. These actions were consolidated before one judge in the Southern District of New York as Municipal Derivatives Antitrust Litigation (MDL 1950). Following motions to dismiss, amended class action complaints were filed on behalf of a putative class of plaintiffs. The most recently amended, operative class action complaint does not list AGMH or its affiliates as defendants or co-conspirators. On July 8, 2016, the MDL 1950 Court entered an order approving settlement of the remaining class claims, resolving the putative class case.
In addition, the Attorney General of the State of West Virginia filed a lawsuit that, as amended, named AGM and Assured Guaranty U.S. Holdings as defendants and alleged a conspiracy to decrease the returns that West Virginia public entities earned on municipal derivative instruments. Also, approximately
19
California and New York government entities
235
brought individual lawsuits that were not a part of the class action and that did not dismiss AGMH or its affiliates. All these cases were transferred to the Southern District of New York and consolidated with MDL 1950 for pretrial purposes. In June and July 2016, Dexia executed settlement agreements covering the action brought by the Attorney General of the State of West Virginia and the actions brought by the individual California and New York plaintiffs, and on July 1, 2016 and July 27, 2016, respectively, the MDL 1950 court dismissed with prejudice the claims against Assured Guaranty U.S. Holdings and AGM in all such actions. Those settlements release all claims as to Assured Guaranty U.S. Holdings, AGMH and AGM, as well as their parents, subsidiaries and affiliates.
|
16.
|
Long-Term Debt and Credit Facilities
|
Accounting Policy
Long-term debt is recorded at principal amounts net of any unamortized original issue discount or premium and unamortized fair value adjustment for AGMH debt (as of the date of the AGMH acquisition). Discounts and acquisition date fair value adjustments are accreted into interest expense over the life of the applicable debt.
Long Term Debt
The Company has outstanding long-term debt comprising primarily debt issued by AGUS and AGMH. AGUS has issued
7
% Senior Notes,
5
% Senior Notes and Series A, Enhanced Junior Subordinated Debentures. AGMH has issued
6 7/8
% Quarterly Income Bonds Securities (QUIBS),
6.25
% Notes and
5.6
% Notes, as well as
$300 million
Junior Subordinated Debentures. All of such debt is fully and unconditionally guaranteed by AGL; AGL's guarantee of the junior subordinated debentures is on a junior subordinated basis.
Debt Issued by AGUS
7
% Senior Notes.
On May 18, 2004, AGUS issued
$200 million
of
7
% Senior Notes due 2034 (
7
% Senior Notes) for net proceeds of
$197 million
. Although the coupon on the Senior Notes is
7
%, the effective rate is approximately
6.4%
, taking into account the effect of a cash flow hedge executed by the Company in March 2004.
5
% Senior Notes.
On June 20, 2014, AGUS issued
$500 million
of
5
% Senior Notes due 2024 (
5
% Senior Notes) for net proceeds of
$495 million
. The notes are guaranteed by AGL. The net proceeds from the sale of the notes were used for general corporate purposes, including the purchase of AGL common shares.
Series A Enhanced Junior Subordinated Debentures.
On December 20, 2006, AGUS issued
$150 million
of the Debentures due 2066. The Debentures pay a fixed
6.4%
rate of interest until December 15, 2016, and thereafter pay a floating rate of interest, reset quarterly, at a rate equal to
three
month LIBOR plus a margin equal to
2.38%
. AGUS may select at
one
or more times to defer payment of interest for
one
or more consecutive periods for up to
ten
years. Any unpaid interest bears interest at the then applicable rate. AGUS may not defer interest past the maturity date.
Debt Issued by AGMH
6 7/8
% QUIBS.
On December 19, 2001, AGMH issued
$100 million
face amount of
6 7/8
% QUIBS due December 15, 2101, which are callable without premium or penalty.
6.25
% Notes.
On November 26, 2002, AGMH issued
$230 million
face amount of
6.25
% Notes due November 1, 2102, which are callable without premium or penalty in whole or in part.
5.6
% Notes.
On July 31, 2003, AGMH issued
$100 million
face amount of
5.6
% Notes due July 15, 2103, which are callable without premium or penalty in whole or in part.
Junior Subordinated Debentures.
On November 22, 2006, AGMH issued
$300 million
face amount of Junior Subordinated Debentures with a scheduled maturity date of December 15, 2036 and a final repayment date of December 15, 2066. The final repayment date of December 15, 2066 may be automatically extended up to
four
times in
five
-year increments provided certain conditions are met. The debentures are redeemable, in whole or in part, at any time prior to December 15, 2036 at their principal amount plus accrued and unpaid interest to the date of redemption or, if greater, the make-whole redemption price. Interest on the debentures will accrue from November 22, 2006 to December 15, 2036 at the annual rate of
6.4%
. If any amount of the debentures remains outstanding after December 15, 2036, then the principal amount of the outstanding debentures will bear interest at a floating interest rate equal to
one
-month LIBOR plus
2.215%
until repaid. AGMH
236
may elect at
one
or more times to defer payment of interest on the debentures for
one
or more consecutive interest periods that do not exceed
ten
years. In connection with the completion of this offering, AGMH entered into a replacement capital covenant for the benefit of persons that buy, hold or sell a specified series of AGMH long-term indebtedness ranking senior to the debentures. Under the covenant, the debentures will not be repaid, redeemed, repurchased or defeased by AGMH or any of its subsidiaries on or before the date that is
20
years prior to the final repayment date, except to the extent that AGMH has received proceeds from the sale of replacement capital securities. The proceeds from this offering were used to pay a dividend to the shareholders of AGMH.
The principal and carrying values of the Company’s long-term debt are presented in the table below.
Principal and Carrying Amounts of Debt
|
|
As of December 31, 2016
|
As of December 31, 2015
|
|||||||||||||
|
|
Principal
|
|
Carrying
Value
|
|
Principal
|
|
Carrying
Value
|
||||||||
|
|
(in millions)
|
||||||||||||||
|
AGUS:
|
|
|
|
|
|
|
|
|
|
|
|
||||
|
7% Senior Notes
|
$
|
200
|
|
$
|
197
|
|
|
$
|
200
|
|
$
|
197
|
|
||
|
5% Senior Notes
|
500
|
|
496
|
|
500
|
|
495
|
|
|||||||
|
Series A Enhanced Junior Subordinated Debentures
|
150
|
|
150
|
|
|
150
|
|
150
|
|
||||||
|
Total AGUS
|
850
|
|
843
|
|
|
850
|
|
842
|
|
||||||
|
AGMH:
|
|
|
|
|
|
|
|
|
|
||||||
|
6
7
/
8
% QUIBS
|
100
|
|
69
|
|
|
100
|
|
69
|
|
||||||
|
6.25% Notes
|
230
|
|
141
|
|
|
230
|
|
140
|
|
||||||
|
5.6% Notes
|
100
|
|
56
|
|
|
100
|
|
56
|
|
||||||
|
Junior Subordinated Debentures
|
300
|
|
187
|
|
|
300
|
|
180
|
|
||||||
|
Total AGMH
|
730
|
|
453
|
|
|
730
|
|
445
|
|
||||||
|
AGM:
|
|
|
|
|
|
|
|
|
|
||||||
|
Notes Payable
|
9
|
|
10
|
|
|
12
|
|
13
|
|
||||||
|
Total AGM
|
9
|
|
10
|
|
|
12
|
|
13
|
|
||||||
|
Total
|
$
|
1,589
|
|
$
|
1,306
|
|
|
$
|
1,592
|
|
$
|
1,300
|
|
||
Principal payments due under the long-term debt are as follows:
Expected Maturity Schedule of Debt
|
Expected Withdrawal Date
|
AGUS
|
AGMH
|
AGM
|
Total
|
||||||||||||
|
|
(in millions)
|
|||||||||||||||
|
2017
|
$
|
—
|
|
$
|
—
|
|
$
|
4
|
|
$
|
4
|
|
||||
|
2018
|
—
|
|
—
|
|
2
|
|
2
|
|
||||||||
|
2019
|
—
|
|
—
|
|
1
|
|
1
|
|
||||||||
|
2020
|
—
|
|
—
|
|
1
|
|
1
|
|
||||||||
|
2021
|
—
|
|
—
|
|
0
|
|
0
|
|
||||||||
|
2022-2041
|
700
|
|
—
|
|
1
|
|
701
|
|
||||||||
|
2042-2061
|
—
|
|
—
|
|
—
|
|
—
|
|
||||||||
|
2062-2081
|
150
|
|
300
|
|
—
|
|
450
|
|
||||||||
|
Thereafter
|
—
|
|
430
|
|
—
|
|
430
|
|
||||||||
|
Total
|
$
|
850
|
|
$
|
730
|
|
$
|
9
|
|
$
|
1,589
|
|
||||
237
Interest Expense
|
|
Year Ended December 31,
|
||||||||||
|
|
2016
|
2015
|
2014
|
||||||||
|
|
(in millions)
|
||||||||||
|
AGUS:
|
|
|
|
|
|
|
|||||
|
7% Senior Notes
|
$
|
13
|
|
$
|
13
|
|
$
|
13
|
|
||
|
5% Senior Notes
|
26
|
|
26
|
|
13
|
|
|||||
|
Series A Enhanced Junior Subordinated Debentures
|
9
|
|
10
|
|
10
|
|
|||||
|
Total AGUS
|
48
|
|
49
|
|
36
|
|
|||||
|
AGMH:
|
|
|
|
|
|
|
|||||
|
6
7
/
8
% QUIBS
|
7
|
|
7
|
|
7
|
|
|||||
|
6.25% Notes
|
16
|
|
16
|
|
16
|
|
|||||
|
5.6% Notes
|
6
|
|
6
|
|
6
|
|
|||||
|
Junior Subordinated Debentures
|
25
|
|
25
|
|
25
|
|
|||||
|
Total AGMH
|
54
|
|
54
|
|
54
|
|
|||||
|
AGM:
|
|
|
|
|
|
|
|||||
|
Notes Payable
|
0
|
|
(2
|
)
|
2
|
|
|||||
|
Total AGM
|
0
|
|
(2
|
)
|
2
|
|
|||||
|
Total
|
$
|
102
|
|
$
|
101
|
|
$
|
92
|
|
||
Recourse Credit Facilities
2009 Strip Coverage Facility
In connection with the Company's acquisition of AGMH and its subsidiaries from Dexia Holdings Inc., AGM agreed to retain the risks relating to the debt and strip policy portions of the leveraged lease business.
In a leveraged lease transaction, a tax-exempt entity (such as a transit agency) transfers tax benefits to a tax-paying entity by transferring ownership of a depreciable asset, such as subway cars. The tax-exempt entity then leases the asset back from its new owner.
If the lease is terminated early, the tax-exempt entity must make an early termination payment to the lessor. A portion of this early termination payment is funded from monies that were pre-funded and invested at the closing of the leveraged lease transaction (along with earnings on those invested funds). The tax-exempt entity is obligated to pay the remaining, unfunded portion of this early termination payment (known as the strip coverage) from its own sources. AGM issued financial guaranty insurance policies (known as strip policies) that guaranteed the payment of these unfunded strip coverage amounts to the lessor, in the event that a tax-exempt entity defaulted on its obligation to pay this portion of its early termination payment. Following such events, AGM can then seek reimbursement of its strip policy payments from the tax-exempt entity, and can also sell the transferred depreciable asset and reimburse itself from the sale proceeds.
Currently, all the leveraged lease transactions in which AGM acts as strip coverage provider are breaching a rating trigger related to AGM and are subject to early termination. However, early termination of a lease does not result in a draw on the AGM policy if the tax-exempt entity makes the required termination payment. If all the leases were to terminate early and the tax-exempt entities do not make the required early termination payments, then AGM would be exposed to possible liquidity claims on gross exposure of approximately
$953 million
as of
December 31, 2016
.
To date, none of the leveraged lease transactions that involve AGM has experienced an early termination due to a lease default and a claim on the AGM policy.
At
December 31, 2016
, approximately
$1.5 billion
of cumulative strip par exposure had been terminated since 2008 on a consensual basis. The consensual terminations have resulted in no claims on AGM.
On July 1, 2009, AGM and Dexia Crédit Local S.A., acting through its New York Branch (Dexia Crédit Local (NY)), entered into a credit facility (the Strip Coverage Facility). Under the Strip Coverage Facility, Dexia Crédit Local (NY) agreed to make loans to AGM to finance all draws made by lessors on AGM strip policies that were outstanding as of November 13, 2008, up to the commitment amount. There have never been any borrowings under the Strip Coverage Facility, the amount of the leveraged leases covered by the Strip Coverage Facility has declined since July 1, 2009 and, to date, none of the leveraged
238
lease transactions in which AGM acts as the strip coverage provider has experienced an early termination due to a lease default. Consequently, and in view of the credit quality of the relevant tax-exempt entities and the cost of the Strip Coverage Facility, the Company determined that maintaining the Strip Coverage Facility was no longer warranted. On July 29, 2016, the parties terminated the Strip Coverage Facility.
Intercompany Credit Facility and Intercompany Debt
On October 25, 2013, AGL, as borrower, and AGUS, as lender, entered into a revolving credit facility pursuant to which AGL may, from time to time, borrow for general corporate purposes. Under the credit facility, AGUS committed to lend a principal amount not exceeding
$225 million
in the aggregate. Such commitment terminates on October 25, 2018 (the “loan termination date”). The unpaid principal amount of each loan will bear interest at a fixed rate equal to
100%
of the then applicable Federal short-term or mid-term interest rate, as the case may be, as determined under Internal Revenue Code Sec. 1274(d), and interest on all loans will be computed for the actual number of days elapsed on the basis of a year consisting of 360 days. Accrued interest on all loans will be paid on the last day of each June and December, beginning on December 31, 2013, and at maturity. AGL must repay the then unpaid principal amounts of the loans by the third anniversary of the loan termination date.
No
amounts are currently outstanding under the credit facility.
On March 30, 2015, AGUS loaned
$200 million
to AGC to facilitate the acquisition of Radian Asset on April 1, 2015. AGC repaid the loan in full on April 14, 2015.
In addition, in 2012 AGUS borrowed
$90 million
from its affiliate AGRO to fund the acquisition of MAC. During 2016, AGUS repaid
$20 million
in outstanding principal as well as accrued and unpaid interest, and the parties agreed to extend the maturity date of the loan from May 2017 to November 2019. As of
December 31, 2016
,
$70 million
remained outstanding.
Committed Capital Securities
On April 8, 2005, AGC entered into separate agreements (the Put Agreements) with
four
custodial trusts (each, a Custodial Trust) pursuant to which AGC may, at its option, cause each of the Custodial Trusts to purchase up to
$50 million
of perpetual preferred stock of AGC (the AGC Preferred Stock). The custodial trusts were created as a vehicle for providing capital support to AGC by allowing AGC to obtain immediate access to new capital at its sole discretion at any time through the exercise of the put option. If the put options were exercised, AGC would receive
$200 million
in return for the issuance of its own perpetual preferred stock, the proceeds of which may be used for any purpose, including the payment of claims. The put options have not been exercised through the date of this filing.
Distributions on the AGC CCS are determined pursuant to an auction process. Beginning on April 7, 2008 this auction process failed, thereby increasing the annualized rate on the AGC CCS to
one-month LIBOR
plus
250
basis points.
In June 2003,
$200 million
of “AGM CPS”, money market preferred trust securities, were issued by trusts created for the primary purpose of issuing the AGM CPS, investing the proceeds in high-quality commercial paper and selling put options to AGM, allowing AGM to issue the trusts non-cumulative redeemable perpetual preferred stock (the AGM Preferred Stock) of AGM in exchange for cash. There are
four
trusts, each with an initial aggregate face amount of
$50 million
. These trusts hold auctions every
28
days, at which time investors submit bid orders to purchase AGM CPS. If AGM were to exercise a put option, the applicable trust would transfer the portion of the proceeds attributable to principal received upon maturity of its assets, net of expenses, to AGM in exchange for AGM Preferred Stock. AGM pays a floating put premium to the trusts, which represents the difference between the commercial paper yield and the winning auction rate (plus all fees and expenses of the trust). If an auction does not attract sufficient clearing bids, however, the auction rate is subject to a maximum rate of
one-month LIBOR
plus
200
basis points for the next succeeding distribution period. Beginning in August 2007, the AGM CPS required the maximum rate for each of the relevant trusts. AGM continues to have the ability to exercise its put option and cause the related trusts to purchase AGM Preferred Stock. The trusts provide AGM access to new capital at its sole discretion through the exercise of the put options. As of
December 31, 2016
the put option had not been exercised.
See Note 7, Fair Value Measurement, –Other Assets–Committed Capital Securities, for a fair value measurement discussion.
239
|
17.
|
Earnings Per Share
|
Accounting Policy
The Company computes EPS using a two-class method by including participating securities which entitle their holders to receive nonforfeitable dividends or dividend equivalents before vesting. Restricted stock awards and share units under the AGC supplemental executive retirement plan (AGC SERP) are considered participating securities as they received non-forfeitable rights to dividends at the same rate as common stock.
The two-class method of computing EPS is an earnings allocation formula that determines EPS for each class of common stock and participating security according to dividends declared (or accumulated) and participation rights in undistributed earnings. Basic EPS is then calculated by dividing net (loss) income available to common shareholders of Assured Guaranty by the weighted‑average number of common shares outstanding during the period. Diluted EPS adjusts basic EPS for the effects of restricted stock, restricted stock units, stock options and other potentially dilutive financial instruments (“dilutive securities”), only in the periods in which such effect is dilutive. The effect of the dilutive securities is reflected in diluted EPS by application of the more dilutive of (1) the treasury stock method or (2) the two-class method assuming nonvested shares are not converted into common shares. The Company has a single class of common stock.
Computation of Earnings Per Share
|
|
Year Ended December 31,
|
||||||||||
|
|
2016
|
2015
|
2014
|
||||||||
|
|
(in millions, except per share amounts)
|
||||||||||
|
Basic EPS:
|
|||||||||||
|
Net income (loss) attributable to AGL
|
$
|
881
|
|
$
|
1,056
|
|
1,088
|
|
|||
|
Less: Distributed and undistributed income (loss) available to nonvested shareholders
|
1
|
|
1
|
|
0
|
|
|||||
|
Distributed and undistributed income (loss) available to common shareholders of AGL and subsidiaries, basic
|
$
|
880
|
|
$
|
1,055
|
|
1,088
|
|
|||
|
Basic shares
|
133.0
|
|
148.1
|
|
172.6
|
|
|||||
|
Basic EPS
|
$
|
6.61
|
|
$
|
7.12
|
|
$
|
6.30
|
|
||
|
Diluted EPS:
|
|||||||||||
|
Distributed and undistributed income (loss) available to common shareholders of AGL and subsidiaries, basic
|
$
|
880
|
|
$
|
1,055
|
|
$
|
1,088
|
|
||
|
Plus: Re-allocation of undistributed income (loss) available to nonvested shareholders of AGL and subsidiaries
|
0
|
|
0
|
|
0
|
|
|||||
|
Distributed and undistributed income (loss) available to common shareholders of AGL and subsidiaries, diluted
|
$
|
880
|
|
$
|
1,055
|
|
$
|
1,088
|
|
||
|
Basic shares
|
133.0
|
|
148.1
|
|
172.6
|
|
|||||
|
Dilutive securities
|
1.1
|
|
0.9
|
|
1.0
|
|
|||||
|
Diluted shares
|
134.1
|
|
149.0
|
|
173.6
|
|
|||||
|
Diluted EPS
|
$
|
6.56
|
|
$
|
7.08
|
|
$
|
6.26
|
|
||
|
Potentially dilutive securities excluded from computation of EPS because of antidilutive effect
|
0.3
|
|
0.5
|
|
1.6
|
|
|||||
240
|
18.
|
Shareholders' Equity
|
Share Issuances
AGL has authorized share capital of $
5 million
divided into
500,000,000
shares, par value $
0.01
per share. Except as described below, AGL's common shares have no preemptive rights or other rights to subscribe for additional common shares, no rights of redemption, conversion or exchange and no sinking fund rights. In the event of liquidation, dissolution or winding-up, the holders of AGL's common shares are entitled to share equally, in proportion to the number of common shares held by such holder, in AGL's assets, if any remain after the payment of all its liabilities and the liquidation preference of any outstanding preferred shares. Under certain circumstances, AGL has the right to purchase all or a portion of the shares held by a shareholder at fair market value. All of the common shares are fully paid and non assessable. Holders of AGL's common shares are entitled to receive dividends as lawfully may be declared from time to time by AGL's Board of Directors (the Board).
In general, and except as provided below, shareholders have
one
vote for each common share held by them and are entitled to vote with respect to their fully paid shares at all meetings of shareholders. However, if, and so long as, the common shares (and other of AGL's shares) of a shareholder are treated as "controlled shares" (as determined pursuant to section 958 of the Code) of any U.S. Person and such controlled shares constitute
9.5%
or more of the votes conferred by AGL's issued and outstanding shares, the voting rights with respect to the controlled shares owned by such U.S. Person shall be limited, in the aggregate, to a voting power of less than 9.5% of the voting power of all issued and outstanding shares, under a formula specified in AGL's Bye-laws. The formula is applied repeatedly until there is no U.S. Person whose controlled shares constitute 9.5% or more of the voting power of all issued and outstanding shares and who generally would be required to recognize income with respect to AGL under the Code if AGL were a controlled foreign corporation as defined in the Code and if the ownership threshold under the Code were 9.5% (as defined in AGL's Bye-Laws as a 9.5% U.S. Shareholder).
Subject to AGL's Bye-Laws and Bermuda law, AGL's Board has the power to issue any of AGL's unissued shares as it determines, including the issuance of any shares or class of shares with preferred, deferred or other special rights.
Under AGL's Bye-Laws and subject to Bermuda law, if AGL's Board determines that any ownership of AGL's shares may result in adverse tax, legal or regulatory consequences to the Company, any of the Company's subsidiaries or any of its shareholders or indirect holders of shares or its Affiliates (other than such as AGL's Board considers de minimis), the Company has the option, but not the obligation, to require such shareholder to sell to AGL or to a third party to whom AGL assigns the repurchase right the minimum number of common shares necessary to avoid or cure any such adverse consequences at a price determined in the discretion of the Board to represent the shares' fair market value (as defined in AGL's Bye-Laws). In addition, AGL's Board may determine that shares held carry different voting rights when it deems it appropriate to do so to (i) avoid the existence of any 9.5% U.S. Shareholder; and (ii) avoid adverse tax, legal or regulatory consequences to AGL or any of its subsidiaries or any direct or indirect holder of shares or its affiliates. "Controlled shares" includes, among other things, all shares of AGL that such U.S. Person is deemed to own directly, indirectly or constructively (within the meaning of section 958 of the Code). Further, these provisions do not apply in the event one shareholder owns greater than
75%
of the voting power of all issued and outstanding shares.
Under these provisions, certain shareholders may have their voting rights limited to less than one vote per share, while other shareholders may have voting rights in excess of one vote per share. Moreover, these provisions could have the effect of reducing the votes of certain shareholders who would not otherwise be subject to the 9.5% limitation by virtue of their direct share ownership. AGL's Bye-laws provide that it will use its best efforts to notify shareholders of their voting interests prior to any vote to be taken by them.
Share Repurchases
On February 22, 2017, the Board authorized an additional
$300 million
of share repurchases, bringing the total remaining authorization to
$407 million
as of February 23, 2017. The Company expects to repurchase shares from time to time in the open market or in privately negotiated transactions. The timing, form and amount of the share repurchases under the program are at the discretion of management and will depend on a variety of factors, including funds available at the parent company, market conditions, the Company's capital position, legal requirements and other factors. The repurchase program may be modified, extended or terminated by the Board at any time. It does not have an expiration date.
241
Share Repurchases
|
Year
|
Number of Shares Repurchased
|
Total Payments
(in millions)
|
Average Price Paid Per Share
|
||||||||
|
2014
|
24,413,781
|
|
$
|
590
|
|
$
|
24.17
|
|
|||
|
2015
|
20,995,419
|
|
$
|
555
|
|
$
|
26.43
|
|
|||
|
2016
|
10,721,248
|
|
$
|
306
|
|
$
|
28.53
|
|
|||
|
2017 (through February 23, 2017 on a settlement date basis)
|
3,591,369
|
|
$
|
142
|
|
$
|
39.65
|
|
|||
Deferred Compensation
Each of the Chief Executive Officer and the General Counsel of the Company has elected to invest a portion of his AGL SERP account in the employer stock fund within the AGL SERP. Each unit in the employer stock fund represents the right to receive
one
AGL common share upon a distribution from the AGL SERP. Each unit equals the number of AGL common shares which could have been purchased with the value of the account deemed invested in the employer stock fund as of the date of such election. The election to invest in the employer stock fund is irrevocable (i.e., any portion of a AGL SERP account allocated to the employer stock fund and invested in units shall remain allocated to the employer stock fund until the participant receives a distribution from AGL SERP). At the same time such investment elections were made, the Company purchased AGL common shares and placed such shares in trust to be distributed to the Chief Executive Officer and the General Counsel upon a distribution from the AGL SERP in settlement of their units invested in the employer stock fund. As of
December 31, 2016
and
2015
, the Company had
320,193
and
320,193
shares, respectively, in the trust. The Company recorded the purchase of such shares in “deferred equity compensation” in the consolidated balance sheet. As indicated in Note 14, Related Party Transactions, on January 6, 2017, the
320,193
shares were distributed in settlement of the AGL SERP units and therefore, there are
no
shares remaining in trust.
Certain executives of the Company elected to invest a portion of their AGC SERP accounts in the employer stock fund in the AGC SERP. Each unit in the employer stock fund represents the right to receive
one
AGL common share upon a distribution from the AGC SERP. Each unit equals the number of AGL common shares which could have been purchased with the value of the account deemed invested in the employer stock fund as of the date of such election. As of
December 31, 2016
and
2015
, there were
74,309
and
74,309
units, respectively, in the AGC SERP. See Note 19, Employee Benefit Plans.
Dividends
Any determination to pay cash dividends is at the discretion of the Company's Board, and depends upon the Company's results of operations, cash flows from operating activities, its financial position, capital requirements, general business conditions, legal, tax, regulatory, rating agency and contractual restrictions on the payment of dividends, and any other factors the Company's Board deems relevant. For more information concerning regulatory constraints that affect the Company's ability to pay dividends, see Note 11, Insurance Company Regulatory Requirements.
On February 22, 2017, the Company declared a quarterly dividend of $
0.1425
per common share, an increase of nearly
10%
from a quarterly dividend of $
0.13
per common share paid in 2016.
|
19.
|
Employee Benefit Plans
|
Accounting Policy
Share-based compensation expense is based on the grant date fair value using the grant date closing price, the lattice, Monte Carlo or Black-Scholes-Merton (Black-Scholes) pricing models. The Company amortizes the fair value of share-based awards on a straight-line basis over the requisite service periods of the awards, which are generally the vesting periods, with the exception of retirement‑eligible employees. For retirement-eligible employees, certain awards contain retirement provisions and therefore are amortized over the period through the date the employee first becomes eligible to retire and is no longer required to provide service to earn part or all of the award.
The fair value of each award under the Assured Guaranty Ltd. Employee Stock Purchase Plan is estimated at the beginning of each offering period using the Black-Scholes option valuation model.
242
The expense for Performance Retention Plan awards is recognized straight-line over the requisite service period, with the exception of retirement eligible employees. For retirement eligible employees, the expense is recognized immediately.
Assured Guaranty Ltd. 2004 Long-Term Incentive Plan
Under the Assured Guaranty Ltd. 2004 Long-Term Incentive Plan, as amended (the Incentive Plan), the number of AGL common shares that may be delivered under the Incentive Plan may not exceed
18,670,000
. In the event of certain transactions affecting AGL's common shares, the number or type of shares subject to the Incentive Plan, the number and type of shares subject to outstanding awards under the Incentive Plan, and the exercise price of awards under the Incentive Plan, may be adjusted.
The Incentive Plan authorizes the grant of incentive stock options, non-qualified stock options, stock appreciation rights, and full value awards that are based on AGL's common shares. The grant of full value awards may be in return for a participant's previously performed services, or in return for the participant surrendering other compensation that may be due, or may be contingent on the achievement of performance or other objectives during a specified period, or may be subject to a risk of forfeiture or other restrictions that will lapse upon the achievement of one or more goals relating to completion of service by the participant, or achievement of performance or other objectives. Awards under the Incentive Plan may accelerate and become vested upon a change in control of AGL.
The Incentive Plan is administered by the Compensation Committee of the Board, except as otherwise determined by the Board. The Board may amend or terminate the Incentive Plan. As of
December 31, 2016
,
10,232,649
common shares were available for grant under the Incentive Plan.
Time Vested Stock Options
Stock options are generally granted once a year with exercise prices equal to the closing price on the date of grant. To date, the Company has only issued non-qualified stock options. All stock options, except for performance stock options, granted to employees vest in equal annual installments over a
three
-year period and expire
seven years
or
ten years
from the date of grant. Stock options granted to directors vest over
one year
and expire in
seven years
or
ten years
from grant date. None of the Company's options, except for performance stock options, have a performance or market condition.
Time Vested Stock Options
|
Options for
Common Shares
|
Weighted
Average
Exercise Price
|
Number of
Exercisable
Options
|
|||||||
|
Balance as of December 31, 2015
|
2,360,340
|
|
$
|
21.73
|
|
2,275,096
|
|
||
|
Options granted
|
—
|
|
—
|
|
|||||
|
Options exercised
|
(768,212
|
)
|
24.64
|
|
|||||
|
Options forfeited/expired
|
(421,535
|
)
|
25.50
|
|
|||||
|
Balance as of December 31, 2016
|
1,170,593
|
|
$
|
18.43
|
|
1,145,356
|
|
||
As of
December 31, 2016
, the aggregate intrinsic value and weighted average remaining contractual term of stock options outstanding were
$23 million
and
2.3 years
, respectively. As of
December 31, 2016
, the aggregate intrinsic value and weighted average remaining contractual term of exercisable stock options were
$22 million
and
2.3 years
, respectively.
As of
December 31, 2016
the total unrecognized compensation expense related to outstanding nonvested stock options was
$27 thousand
, which will be adjusted in the future for the difference between estimated and actual forfeitures. The Company expects to recognize that expense over the weighted average remaining service period of
0.1 years
.
243
Lattice Option Pricing
Weighted Average Assumptions (1)
|
2014
|
||||
|
Dividend yield
|
2.03
|
%
|
||
|
Expected volatility
|
53.24
|
%
|
||
|
Risk free interest rate
|
2.21
|
%
|
||
|
Expected life
|
6.6 years
|
|
||
|
Forfeiture rate
|
3.5
|
%
|
||
|
Weighted average grant date fair value
|
$
|
10.35
|
|
|
|
(1)
|
No
options were granted in 2016 and 2015.
|
The Company uses a lattice model to value its employee and director stock options, rather than a simple Black-Scholes formula. The Black-Scholes approach is designed for options exercisable only at maturity (European style), but can still be used to value options exercisable at any time after they vest (American style) as long as no dividend payments are being made on the stock. A lattice model can be used for both European and American style options and regardless of whether or not the stock is paying regular dividends. Because the options the Company has granted to its employees and directors are American style and because the Company pays regular dividends on its stock, the Company has selected a lattice model as the appropriate method to value these options.
The expected dividend yield is based on the current expected annual dividend and share price on the grant date. The expected volatility is estimated at the date of grant based on an average of the
7
-year historical share price volatility and implied volatilities of certain at-the-money actively traded call options in the Company. The risk-free interest rate is the implied
7
-year yield currently available on U.S. Treasury zero-coupon issues at the date of grant. The forfeiture rate is based on the historical employee termination information.
The total intrinsic value of stock options exercised during the years ended
December 31, 2016
,
2015
and
2014
was
$4.6 million
,
$2.8 million
and
$3.0 million
, respectively. During the years ended
December 31, 2016
,
2015
and
2014
,
$12.0 million
,
$4.9 million
and
$4.3 million
, respectively, was received from the exercise of stock options. In order to satisfy stock option exercises, the Company issues new shares.
Performance Stock Options
The Company grants performance stock options under the Incentive Plan. These awards are non-qualified stock options with exercise prices equal to the closing price of an AGL common share on the applicable date of grant. These awards vest
35%
,
50%
or
100%
, if the price of AGL's common shares using the highest
40
-day average share price during the relevant
three
-year performance period reaches certain hurdles. If the share price is between the specified levels, the vesting level will be interpolated accordingly. These awards expire
seven years
from the date of grant.
Performance Stock Options
|
Options for
Common Shares
|
Weighted
Average
Exercise Price
|
Number of
Exercisable
Options
|
|||||||
|
Balance as of December 31, 2015
|
239,537
|
|
$
|
17.92
|
|
166,897
|
|
||
|
Options granted
|
—
|
|
—
|
|
|||||
|
Options exercised
|
(5,533
|
)
|
19.08
|
|
|||||
|
Options forfeited/expired
|
(12,595
|
)
|
19.24
|
|
|||||
|
Balance as of December 31, 2016
|
221,409
|
|
$
|
17.89
|
|
221,409
|
|
||
244
As of
December 31, 2016
, the aggregate intrinsic value and weighted average remaining contractual term of performance stock options outstanding were
$4.4 million
and
2.4 years
, respectively. As of
December 31, 2016
, the aggregate intrinsic value and weighted average remaining contractual term of exercisable performance stock options were
$4.4 million
and
2.4 years
, respectively.
As of
December 31, 2016
, there was
no
unexpensed outstanding nonvested performance stock options.
No
options were granted in 2016, 2015 and 2014.
The expected dividend yield is based on the current expected annual dividend and share price on the grant date. The expected volatility is estimated at the date of grant based on an average of the
7
-year historical share price volatility and implied volatilities of certain at-the-money actively traded call options in the Company. The risk-free interest rate is the implied
7
-year yield currently available on U.S. Treasury zero-coupon issues at the date of grant. The forfeiture rate is based on the historical employee termination information.
The total intrinsic value of performance stock options exercised during the years ended
December 31, 2016
and
2015
was
$41 thousand
and
$75 thousand
, respectively. During the years ended
December 31, 2016
and
2015
,
$106 thousand
and
$98 thousand
, respectively, was received from the exercise of performance stock options. In order to satisfy stock option exercises, the Company issues new shares.
Restricted Stock Awards
Restricted stock awards to employees generally vest in equal annual installments over a
four
-year period and restricted stock awards to outside directors vest in full in
one
year. Restricted stock awards to employees are amortized on a straight-line basis over the requisite service periods of the awards, and restricted stock awards to outside directors are amortized over
one
year, which are generally the vesting periods, with the exception of retirement‑eligible employees, discussed above.
Restricted Stock Award Activity
|
Nonvested Shares
|
Number of
Shares
|
Weighted
Average Grant
Date Fair Value
Per Share
|
|||||
|
Nonvested at December 31, 2015
|
62,145
|
|
$
|
25.67
|
|
||
|
Granted
|
58,858
|
|
25.57
|
|
|||
|
Vested
|
(62,145
|
)
|
25.67
|
|
|||
|
Forfeited
|
—
|
|
—
|
|
|||
|
Nonvested at December 31, 2016
|
58,858
|
|
$
|
25.57
|
|
||
As of
December 31, 2016
the total unrecognized compensation cost related to outstanding nonvested restricted stock awards was
$0.6 million
, which the Company expects to recognize over the weighted‑average remaining service period of
0.4 years
. The total fair value of shares vested during the years ended
December 31, 2016
,
2015
and
2014
was
$1.6 million
,
$1 million
and $
1 million
, respectively.
Restricted Stock Units
Restricted stock units are valued based on the closing price of the underlying shares at the date of grant. Restricted stock units awarded to employees have vesting terms similar to those of the restricted stock awards and are delivered on the vesting date. The Company has granted restricted stock units to directors of the Company. Restricted stock units awarded to directors vested over a
one
-year period and were delivered in January 2017.
245
Restricted Stock Unit Activity
|
Nonvested Stock Units
|
Number of
Stock Units
|
Weighted
Average Grant
Date Fair Value
Per Share
|
|||||
|
Nonvested at December 31, 2015
|
689,281
|
|
$
|
23.23
|
|
||
|
Granted
|
377,661
|
|
24.51
|
|
|||
|
Vested
|
(114,701
|
)
|
20.88
|
|
|||
|
Forfeited
|
(6,732
|
)
|
24.38
|
|
|||
|
Nonvested at December 31, 2016
|
945,509
|
|
$
|
24.01
|
|
||
As of
December 31, 2016
, the total unrecognized compensation cost related to outstanding nonvested restricted stock units was
$10.8 million
, which the Company expects to recognize over the weighted‑average remaining service period of
1.8 years
. The total fair value of restricted stock units delivered during the years ended
December 31, 2016
,
2015
and
2014
was
$2 million
,
$6 million
and
$5 million
, respectively.
Performance Restricted Stock Units
The Company has granted performance restricted stock units under the Incentive Plan. These awards vest
35%
,
50%
,
100%
, or
200%
, if the price of AGL's common shares using the highest
40
-day average share price during the relevant
three
-year performance period reaches certain hurdles. If the share price is between the specified levels, the vesting level will be interpolated accordingly.
Performance Restricted Stock Unit Activity
|
Performance Restricted Stock Units
|
Number of
Performance Share Units
|
Weighted
Average Grant
Date Fair Value
Per Share
|
|||||
|
Nonvested at December 31, 2015
|
408,260
|
|
$
|
27.32
|
|
||
|
Granted
|
270,612
|
|
25.62
|
|
|||
|
Delivered
|
(69,437
|
)
|
29.43
|
|
|||
|
Forfeited
|
—
|
|
—
|
|
|||
|
Nonvested at December 31, 2016 (1)
|
609,435
|
|
$
|
26.22
|
|
||
____________________
|
(1)
|
Excludes
355,353
performance restricted stock units that have met performance hurdles and will be eligible for vesting after December 31, 2016.
|
As of
December 31, 2016
, the total unrecognized compensation cost related to outstanding nonvested performance share units was
$6.8 million
, which the Company expects to recognize over the weighted‑average remaining service period of
1.8 years
. The total fair value of performance restricted stock units delivered during the years ended
December 31, 2016
and
2015
was
$2.1 million
and
$6 million
, respectively.
Employee Stock Purchase Plan
The Company established the AGL Employee Stock Purchase Plan (Stock Purchase Plan) in accordance with Internal Revenue Code Section 423, and participation is available to all eligible employees. Maximum annual purchases by participants are limited to the number of whole shares that can be purchased by an amount equal to
10%
of the participant's compensation or, if less, shares having a value of
$25,000
. Participants may purchase shares at a purchase price equal to
85%
of the lesser of the fair market value of the stock on the first day or the last day of the subscription period. The Company has reserved for issuance and purchases under the Stock Purchase Plan
600,000
Assured Guaranty Ltd. common shares.
The fair value of each award under the Stock Purchase Plan is estimated at the beginning of each offering period using the Black‑Scholes option‑pricing model and the following assumptions: a) the expected dividend yield is based on the current expected annual dividend and share price on the grant date; b) the expected volatility is estimated at the date of grant based on
246
the historical share price volatility, calculated on a daily basis; c) the risk-free rate for periods within the contractual life of the option is based on the U.S. Treasury yield curve in effect at the time of grant; and d) the expected life is based on the term of the offering period.
Stock Purchase Plan
|
Year Ended December 31,
|
|||||||||||
|
2016
|
2015
|
2014
|
|||||||||
|
(dollars in millions)
|
|||||||||||
|
Proceeds from purchase of shares by employees
|
$
|
0.9
|
|
$
|
0.8
|
|
$
|
0.9
|
|
||
|
Number of shares issued by the Company
|
39,055
|
|
38,565
|
|
43,273
|
|
|||||
|
Recorded in share-based compensation, net of deferral
|
$
|
0.2
|
|
$
|
0.2
|
|
$
|
0.2
|
|
||
Share‑Based Compensation Expense
The following table presents stock based compensation costs and the effect of deferring such costs as policy acquisition costs, pre-tax. Amortization of previously deferred stock compensation costs is not shown in the table below.
Share‑Based Compensation Expense Summary
|
Year Ended December 31,
|
|||||||||||
|
2016
|
2015
|
2014
|
|||||||||
|
(in millions)
|
|||||||||||
|
Share‑based compensation expense
|
$
|
13
|
|
$
|
10
|
|
$
|
10
|
|
||
|
Share‑based compensation capitalized as DAC
|
0.4
|
|
0.5
|
|
0.3
|
|
|||||
|
Income tax benefit
|
3
|
|
2
|
|
2
|
|
|||||
Defined Contribution Plan
The Company maintains a savings incentive plan, which is qualified under Section 401(a) of the Internal Revenue Code for U.S. employees. The savings incentive plan is available to eligible full-time employees upon hire. Eligible participants could contribute a percentage of their salary subject to a maximum of
$18,000
for
2016
. Contributions are matched by the Company at a rate of
100%
up to
6%
of participant's compensation, subject to IRS limitations. Any amounts over the IRS limits are contributed to and matched by the Company into a nonqualified supplemental executive retirement plan for employees eligible to participate in such nonqualified plan. The Company also makes a core contribution of
6%
of the participant's compensation to the qualified plan, subject to IRS limitations, and the nonqualified supplemental executive retirement plan for eligible employees, regardless of whether the employee contributes to the plan(s). Employees become fully vested in Company contributions after
one
year of service, as defined in the plan. Plan eligibility is immediate upon hire. The Company also maintains similar non-qualified plans for non-U.S. employees.
The Company recognized defined contribution expenses of
$11 million
,
$10 million
and
$11 million
for the years ended
December 31, 2016
,
2015
and
2014
, respectively.
Cash-Based Compensation Plans
The Company maintains a Performance Retention Plan (PRP) that permits the grant of deferred cash based awards to selected employees. Generally, each PRP award is divided into
three
installments that vest over
four
years. The cash payment depends on growth in certain measures of intrinsic value and financial return defined in each PRP award agreement. The Company recognized performance retention plan expenses of
$12 million
,
$11 million
and
$15 million
for the years ended
December 31, 2016
,
2015
and
2014
, respectively.
The Company’s executive officers are eligible to receive compensation under a non-equity incentive plan. The amount of compensation payable is subject to a performance goal being met. The Compensation Committee then uses discretion to determine the actual amount of cash incentive compensation payable to each executive officer for such performance year based on factors and criteria as determined by the Compensation Committee, provided that such discretion cannot be used to increase
247
the amount that was determined to be payable to each executive officer. For an applicable performance year, the Compensation Committee establishes target financial performance measures for the Company and individual non-financial objectives for the executive officers. Most employees other than executive officers are eligible to receive discretionary bonuses.
|
20.
|
Other Comprehensive Income
|
The following tables present the changes in each component of AOCI and the effect of reclassifications out of AOCI on the respective line items in net income.
Changes in Accumulated Other Comprehensive Income by Component
Year Ended
December 31, 2016
|
|
Net Unrealized
Gains (Losses) on
Investments with no Other-Than-Temporary Impairment
|
Net Unrealized
Gains (Losses) on
Investments with Other-Than-Temporary Impairment
|
Cumulative
Translation
Adjustment
|
Cash Flow Hedge
|
Total Accumulated
Other
Comprehensive
Income
|
||||||||||||||
|
(in millions)
|
|||||||||||||||||||
|
Balance, December 31, 2015
|
$
|
260
|
|
$
|
(15
|
)
|
$
|
(16
|
)
|
$
|
8
|
|
$
|
237
|
|
||||
|
Other comprehensive income (loss) before reclassifications
|
(71
|
)
|
(9
|
)
|
(23
|
)
|
—
|
|
(103
|
)
|
|||||||||
|
Amounts reclassified from AOCI to:
|
|||||||||||||||||||
|
Net realized investment gains (losses)
|
(23
|
)
|
52
|
|
—
|
|
—
|
|
29
|
|
|||||||||
|
Net investment income
|
(3
|
)
|
—
|
|
—
|
|
—
|
|
(3
|
)
|
|||||||||
|
Interest expense
|
—
|
|
—
|
|
—
|
|
(1
|
)
|
(1
|
)
|
|||||||||
|
Total before tax
|
(26
|
)
|
52
|
|
—
|
|
(1
|
)
|
25
|
|
|||||||||
|
Tax (provision) benefit
|
8
|
|
(18
|
)
|
—
|
|
0
|
|
(10
|
)
|
|||||||||
|
Total amount reclassified from AOCI, net of tax
|
(18
|
)
|
34
|
|
—
|
|
(1
|
)
|
15
|
|
|||||||||
|
Net current period other comprehensive income (loss)
|
(89
|
)
|
25
|
|
(23
|
)
|
(1
|
)
|
(88
|
)
|
|||||||||
|
Balance, December 31, 2016
|
$
|
171
|
|
$
|
10
|
|
$
|
(39
|
)
|
$
|
7
|
|
$
|
149
|
|
||||
248
Changes in Accumulated Other Comprehensive Income by Component
Year Ended
December 31, 2015
|
|
Net Unrealized
Gains (Losses) on
Investments with no Other-Than-Temporary Impairment
|
Net Unrealized
Gains (Losses) on
Investments with Other-Than-Temporary Impairment
|
Cumulative
Translation
Adjustment
|
Cash Flow Hedge
|
Total Accumulated
Other
Comprehensive
Income
|
||||||||||||||
|
(in millions)
|
|||||||||||||||||||
|
Balance, December 31, 2014
|
$
|
367
|
|
$
|
4
|
|
$
|
(10
|
)
|
$
|
9
|
|
$
|
370
|
|
||||
|
Other comprehensive income (loss) before reclassifications
|
(93
|
)
|
(43
|
)
|
(6
|
)
|
—
|
|
(142
|
)
|
|||||||||
|
Amounts reclassified from AOCI to:
|
|||||||||||||||||||
|
Net realized investment gains (losses)
|
(11
|
)
|
37
|
|
—
|
|
—
|
|
26
|
|
|||||||||
|
Net investment income
|
(9
|
)
|
—
|
|
—
|
|
—
|
|
(9
|
)
|
|||||||||
|
Interest expense
|
—
|
|
—
|
|
—
|
|
(1
|
)
|
(1
|
)
|
|||||||||
|
Total before tax
|
(20
|
)
|
37
|
|
—
|
|
(1
|
)
|
16
|
|
|||||||||
|
Tax (provision) benefit
|
6
|
|
(13
|
)
|
—
|
|
0
|
|
(7
|
)
|
|||||||||
|
Total amount reclassified from AOCI, net of tax
|
(14
|
)
|
24
|
|
—
|
|
(1
|
)
|
9
|
|
|||||||||
|
Net current period other comprehensive income (loss)
|
(107
|
)
|
(19
|
)
|
(6
|
)
|
(1
|
)
|
(133
|
)
|
|||||||||
|
Balance, December 31, 2015
|
$
|
260
|
|
$
|
(15
|
)
|
$
|
(16
|
)
|
$
|
8
|
|
$
|
237
|
|
||||
Changes in Accumulated Other Comprehensive Income by Component
Year Ended
December 31, 2014
|
|
Net Unrealized
Gains (Losses) on
Investments with no Other-Than-Temporary Impairment
|
Net Unrealized
Gains (Losses) on
Investments with Other-Than-Temporary Impairment
|
Cumulative
Translation
Adjustment
|
Cash Flow Hedge
|
Total Accumulated
Other
Comprehensive
Income
|
||||||||||||||
|
(in millions)
|
|||||||||||||||||||
|
Balance, December 31, 2013
|
$
|
178
|
|
$
|
(24
|
)
|
$
|
(3
|
)
|
$
|
9
|
|
$
|
160
|
|
||||
|
Other comprehensive income (loss) before reclassifications
|
196
|
|
(20
|
)
|
(7
|
)
|
—
|
|
169
|
|
|||||||||
|
Amounts reclassified from AOCI to:
|
|||||||||||||||||||
|
Net realized investment gains (losses)
|
(12
|
)
|
74
|
|
—
|
|
—
|
|
62
|
|
|||||||||
|
Interest expense
|
—
|
|
—
|
|
—
|
|
0
|
|
0
|
|
|||||||||
|
Total before tax
|
(12
|
)
|
74
|
|
—
|
|
0
|
|
62
|
|
|||||||||
|
Tax (provision) benefit
|
5
|
|
(26
|
)
|
—
|
|
0
|
|
(21
|
)
|
|||||||||
|
Total amount reclassified from AOCI, net of tax
|
(7
|
)
|
48
|
|
—
|
|
0
|
|
41
|
|
|||||||||
|
Net current period other comprehensive income (loss)
|
189
|
|
28
|
|
(7
|
)
|
0
|
|
210
|
|
|||||||||
|
Balance, December 31, 2014
|
$
|
367
|
|
$
|
4
|
|
$
|
(10
|
)
|
$
|
9
|
|
$
|
370
|
|
||||
249
|
21.
|
Subsidiary Information
|
The following tables present the condensed consolidating financial information for AGUS and AGMH, 100%-owned subsidiaries of AGL, which have issued publicly traded debt securities (see Note 16, Long Term Debt and Credit Facilities). The information for AGL, AGUS and AGMH presents its subsidiaries on the equity method of accounting.
CONDENSED CONSOLIDATING BALANCE SHEET
AS OF
DECEMBER 31, 2016
(in millions)
|
|
Assured
Guaranty Ltd.
(Parent)
|
AGUS
(Issuer)
|
AGMH
(Issuer)
|
Other
Entities
|
Consolidating
Adjustments
|
Assured
Guaranty Ltd.
(Consolidated)
|
|||||||||||||||||
|
ASSETS
|
|
|
|
|
|
|
|
|
|
|
|
|
|||||||||||
|
Total investment portfolio and cash
|
$
|
36
|
|
$
|
384
|
|
$
|
22
|
|
$
|
11,029
|
|
$
|
(368
|
)
|
$
|
11,103
|
|
|||||
|
Investment in subsidiaries
|
6,164
|
|
5,696
|
|
3,734
|
|
296
|
|
(15,890
|
)
|
—
|
|
|||||||||||
|
Premiums receivable, net of commissions payable
|
—
|
|
—
|
|
—
|
|
699
|
|
(123
|
)
|
576
|
|
|||||||||||
|
Ceded unearned premium reserve
|
—
|
|
—
|
|
—
|
|
1,099
|
|
(893
|
)
|
206
|
|
|||||||||||
|
Deferred acquisition costs
|
—
|
|
—
|
|
—
|
|
156
|
|
(50
|
)
|
106
|
|
|||||||||||
|
Reinsurance recoverable on unpaid losses
|
—
|
|
—
|
|
—
|
|
484
|
|
(404
|
)
|
80
|
|
|||||||||||
|
Credit derivative assets
|
—
|
|
—
|
|
—
|
|
69
|
|
(56
|
)
|
13
|
|
|||||||||||
|
Deferred tax asset, net
|
—
|
|
16
|
|
—
|
|
597
|
|
(116
|
)
|
497
|
|
|||||||||||
|
Intercompany receivable
|
—
|
|
—
|
|
—
|
|
70
|
|
(70
|
)
|
—
|
|
|||||||||||
|
Financial guaranty variable interest entities’ assets, at fair value
|
—
|
|
—
|
|
—
|
|
876
|
|
—
|
|
876
|
|
|||||||||||
|
Dividend receivable from affiliate
|
300
|
|
—
|
|
—
|
|
—
|
|
(300
|
)
|
—
|
|
|||||||||||
|
Other
|
11
|
|
78
|
|
26
|
|
801
|
|
(222
|
)
|
694
|
|
|||||||||||
|
TOTAL ASSETS
|
$
|
6,511
|
|
$
|
6,174
|
|
$
|
3,782
|
|
$
|
16,176
|
|
$
|
(18,492
|
)
|
$
|
14,151
|
|
|||||
|
LIABILITIES AND SHAREHOLDERS’ EQUITY
|
|
|
|
|
|
|
|
|
|
|
|
|
|||||||||||
|
Unearned premium reserves
|
—
|
|
—
|
|
—
|
|
4,488
|
|
(977
|
)
|
3,511
|
|
|||||||||||
|
Loss and LAE reserve
|
—
|
|
—
|
|
—
|
|
1,596
|
|
(469
|
)
|
1,127
|
|
|||||||||||
|
Long-term debt
|
—
|
|
843
|
|
453
|
|
10
|
|
—
|
|
1,306
|
|
|||||||||||
|
Intercompany payable
|
—
|
|
70
|
|
—
|
|
300
|
|
(370
|
)
|
—
|
|
|||||||||||
|
Credit derivative liabilities
|
—
|
|
—
|
|
—
|
|
458
|
|
(56
|
)
|
402
|
|
|||||||||||
|
Deferred tax liabilities, net
|
—
|
|
—
|
|
88
|
|
—
|
|
(88
|
)
|
—
|
|
|||||||||||
|
Financial guaranty variable interest entities’ liabilities, at fair value
|
—
|
|
—
|
|
—
|
|
958
|
|
—
|
|
958
|
|
|||||||||||
|
Dividend payable to affiliate
|
—
|
|
300
|
|
—
|
|
—
|
|
(300
|
)
|
—
|
|
|||||||||||
|
Other
|
7
|
|
3
|
|
14
|
|
665
|
|
(346
|
)
|
343
|
|
|||||||||||
|
TOTAL LIABILITIES
|
7
|
|
1,216
|
|
555
|
|
8,475
|
|
(2,606
|
)
|
7,647
|
|
|||||||||||
|
TOTAL SHAREHOLDERS’ EQUITY ATTRIBUTABLE TO ASSURED GUARANTY LTD.
|
6,504
|
|
4,958
|
|
3,227
|
|
7,405
|
|
(15,590
|
)
|
6,504
|
|
|||||||||||
|
Noncontrolling interest
|
—
|
|
—
|
|
—
|
|
296
|
|
(296
|
)
|
—
|
|
|||||||||||
|
TOTAL SHAREHOLDERS’ EQUITY
|
6,504
|
|
4,958
|
|
3,227
|
|
7,701
|
|
(15,886
|
)
|
6,504
|
|
|||||||||||
|
TOTAL LIABILITIES AND SHAREHOLDERS’ EQUITY
|
$
|
6,511
|
|
$
|
6,174
|
|
$
|
3,782
|
|
$
|
16,176
|
|
$
|
(18,492
|
)
|
$
|
14,151
|
|
|||||
250
CONDENSED CONSOLIDATING BALANCE SHEET
AS OF
DECEMBER 31, 2015
(in millions)
|
|
Assured
Guaranty Ltd.
(Parent)
|
AGUS
(Issuer)
|
AGMH
(Issuer)
|
Other
Entities
|
Consolidating
Adjustments
|
Assured
Guaranty Ltd.
(Consolidated)
|
|||||||||||||||||
|
ASSETS
|
|
|
|
|
|
|
|
|
|
|
|
|
|||||||||||
|
Total investment portfolio and cash
|
$
|
10
|
|
$
|
156
|
|
$
|
22
|
|
$
|
11,530
|
|
$
|
(360
|
)
|
$
|
11,358
|
|
|||||
|
Investment in subsidiaries
|
5,961
|
|
5,569
|
|
4,081
|
|
377
|
|
(15,988
|
)
|
—
|
|
|||||||||||
|
Premiums receivable, net of commissions payable
|
—
|
|
—
|
|
—
|
|
833
|
|
(140
|
)
|
693
|
|
|||||||||||
|
Ceded unearned premium reserve
|
—
|
|
—
|
|
—
|
|
1,266
|
|
(1,034
|
)
|
232
|
|
|||||||||||
|
Deferred acquisition costs
|
—
|
|
—
|
|
—
|
|
176
|
|
(62
|
)
|
114
|
|
|||||||||||
|
Reinsurance recoverable on unpaid losses
|
—
|
|
—
|
|
—
|
|
467
|
|
(398
|
)
|
69
|
|
|||||||||||
|
Credit derivative assets
|
—
|
|
—
|
|
—
|
|
207
|
|
(126
|
)
|
81
|
|
|||||||||||
|
Deferred tax asset, net
|
—
|
|
52
|
|
—
|
|
357
|
|
(133
|
)
|
276
|
|
|||||||||||
|
Intercompany receivable
|
—
|
|
—
|
|
—
|
|
90
|
|
(90
|
)
|
—
|
|
|||||||||||
|
Financial guaranty variable interest entities’ assets, at fair value
|
—
|
|
—
|
|
—
|
|
1,261
|
|
—
|
|
1,261
|
|
|||||||||||
|
Dividend receivable from affiliate
|
69
|
|
—
|
|
—
|
|
—
|
|
—
|
|
69
|
|
|||||||||||
|
Other
|
29
|
|
29
|
|
26
|
|
571
|
|
(264
|
)
|
391
|
|
|||||||||||
|
TOTAL ASSETS
|
$
|
6,069
|
|
$
|
5,806
|
|
$
|
4,129
|
|
$
|
17,135
|
|
$
|
(18,595
|
)
|
$
|
14,544
|
|
|||||
|
LIABILITIES AND SHAREHOLDERS’ EQUITY
|
|
|
|
|
|
|
|
|
|
|
|
|
|||||||||||
|
Unearned premium reserves
|
—
|
|
—
|
|
—
|
|
5,143
|
|
(1,147
|
)
|
3,996
|
|
|||||||||||
|
Loss and LAE reserve
|
—
|
|
—
|
|
—
|
|
1,537
|
|
(470
|
)
|
1,067
|
|
|||||||||||
|
Long-term debt
|
—
|
|
842
|
|
445
|
|
13
|
|
—
|
|
1,300
|
|
|||||||||||
|
Intercompany payable
|
—
|
|
90
|
|
—
|
|
300
|
|
(390
|
)
|
—
|
|
|||||||||||
|
Credit derivative liabilities
|
—
|
|
—
|
|
—
|
|
572
|
|
(126
|
)
|
446
|
|
|||||||||||
|
Deferred tax liabilities, net
|
—
|
|
—
|
|
91
|
|
—
|
|
(91
|
)
|
—
|
|
|||||||||||
|
Financial guaranty variable interest entities’ liabilities, at fair value
|
—
|
|
—
|
|
—
|
|
1,349
|
|
—
|
|
1,349
|
|
|||||||||||
|
Dividend payable to affiliate
|
—
|
|
69
|
|
—
|
|
—
|
|
—
|
|
69
|
|
|||||||||||
|
Other
|
6
|
|
13
|
|
15
|
|
622
|
|
(402
|
)
|
254
|
|
|||||||||||
|
TOTAL LIABILITIES
|
6
|
|
1,014
|
|
551
|
|
9,536
|
|
(2,626
|
)
|
8,481
|
|
|||||||||||
|
TOTAL SHAREHOLDERS’ EQUITY ATTRIBUTABLE TO ASSURED GUARANTY LTD.
|
6,063
|
|
4,792
|
|
3,578
|
|
7,222
|
|
(15,592
|
)
|
6,063
|
|
|||||||||||
|
Noncontrolling interest
|
—
|
|
—
|
|
—
|
|
377
|
|
(377
|
)
|
—
|
|
|||||||||||
|
TOTAL SHAREHOLDERS’ EQUITY
|
6,063
|
|
4,792
|
|
3,578
|
|
7,599
|
|
(15,969
|
)
|
6,063
|
|
|||||||||||
|
TOTAL LIABILITIES AND SHAREHOLDERS’ EQUITY
|
$
|
6,069
|
|
$
|
5,806
|
|
$
|
4,129
|
|
$
|
17,135
|
|
$
|
(18,595
|
)
|
$
|
14,544
|
|
|||||
251
CONDENSED CONSOLIDATING STATEMENT OF OPERATIONS
AND COMPREHENSIVE INCOME
FOR THE YEAR ENDED
DECEMBER 31, 2016
(in millions)
|
|
Assured
Guaranty Ltd.
(Parent)
|
AGUS
(Issuer)
|
AGMH
(Issuer)
|
Other
Entities
|
Consolidating
Adjustments
|
Assured
Guaranty Ltd.
(Consolidated)
|
|||||||||||||||||
|
REVENUES
|
|
|
|
|
|
|
|
|
|
|
|
|
|||||||||||
|
Net earned premiums
|
$
|
—
|
|
$
|
—
|
|
$
|
—
|
|
$
|
892
|
|
$
|
(28
|
)
|
$
|
864
|
|
|||||
|
Net investment income
|
0
|
|
0
|
|
0
|
|
412
|
|
(4
|
)
|
408
|
|
|||||||||||
|
Net realized investment gains (losses)
|
0
|
|
2
|
|
0
|
|
(28
|
)
|
(3
|
)
|
(29
|
)
|
|||||||||||
|
Net change in fair value of credit derivatives:
|
|
|
|
|
|
|
|
|
|
|
|||||||||||||
|
Realized gains (losses) and other settlements
|
—
|
|
—
|
|
—
|
|
29
|
|
0
|
|
29
|
|
|||||||||||
|
Net unrealized gains (losses)
|
—
|
|
—
|
|
—
|
|
69
|
|
—
|
|
69
|
|
|||||||||||
|
Net change in fair value of credit derivatives
|
—
|
|
—
|
|
—
|
|
98
|
|
—
|
|
98
|
|
|||||||||||
|
Bargain purchase gain and settlement of pre-existing relationships
|
—
|
|
—
|
|
—
|
|
257
|
|
2
|
|
259
|
|
|||||||||||
|
Other
|
0
|
|
—
|
|
—
|
|
78
|
|
(1
|
)
|
77
|
|
|||||||||||
|
TOTAL REVENUES
|
0
|
|
2
|
|
0
|
|
1,709
|
|
(34
|
)
|
1,677
|
|
|||||||||||
|
EXPENSES
|
|
|
|
|
|
|
|
|
|
|
|
|
|||||||||||
|
Loss and LAE
|
—
|
|
—
|
|
—
|
|
296
|
|
(1
|
)
|
295
|
|
|||||||||||
|
Amortization of deferred acquisition costs
|
—
|
|
—
|
|
—
|
|
30
|
|
(12
|
)
|
18
|
|
|||||||||||
|
Interest expense
|
—
|
|
52
|
|
54
|
|
10
|
|
(14
|
)
|
102
|
|
|||||||||||
|
Other operating expenses
|
29
|
|
2
|
|
2
|
|
217
|
|
(5
|
)
|
245
|
|
|||||||||||
|
TOTAL EXPENSES
|
29
|
|
54
|
|
56
|
|
553
|
|
(32
|
)
|
660
|
|
|||||||||||
|
INCOME (LOSS) BEFORE INCOME TAXES AND EQUITY IN NET EARNINGS OF SUBSIDIARIES
|
(29
|
)
|
(52
|
)
|
(56
|
)
|
1,156
|
|
(2
|
)
|
1,017
|
|
|||||||||||
|
Total (provision) benefit for income taxes
|
—
|
|
18
|
|
20
|
|
(175
|
)
|
1
|
|
(136
|
)
|
|||||||||||
|
Equity in net earnings of subsidiaries
|
910
|
|
794
|
|
274
|
|
44
|
|
(2,022
|
)
|
—
|
|
|||||||||||
|
NET INCOME (LOSS)
|
881
|
|
760
|
|
238
|
|
1,025
|
|
(2,023
|
)
|
881
|
|
|||||||||||
|
Less: noncontrolling interest
|
—
|
|
—
|
|
—
|
|
44
|
|
(44
|
)
|
—
|
|
|||||||||||
|
NET INCOME (LOSS) ATTRIBUTABLE TO ASSURED GUARANTY LTD.
|
$
|
881
|
|
$
|
760
|
|
$
|
238
|
|
$
|
981
|
|
$
|
(1,979
|
)
|
$
|
881
|
|
|||||
|
COMPREHENSIVE INCOME (LOSS)
|
$
|
793
|
|
$
|
685
|
|
$
|
163
|
|
$
|
953
|
|
$
|
(1,801
|
)
|
$
|
793
|
|
|||||
252
CONDENSED CONSOLIDATING STATEMENT OF OPERATIONS
AND COMPREHENSIVE INCOME
FOR THE YEAR ENDED
DECEMBER 31, 2015
(in millions)
|
|
Assured
Guaranty Ltd.
(Parent)
|
AGUS
(Issuer)
|
AGMH
(Issuer)
|
Other
Entities
|
Consolidating
Adjustments
|
Assured
Guaranty Ltd.
(Consolidated)
|
|||||||||||||||||
|
REVENUES
|
|
|
|
|
|
|
|
|
|
|
|
|
|||||||||||
|
Net earned premiums
|
$
|
—
|
|
$
|
—
|
|
$
|
—
|
|
$
|
783
|
|
$
|
(17
|
)
|
$
|
766
|
|
|||||
|
Net investment income
|
0
|
|
1
|
|
0
|
|
432
|
|
(10
|
)
|
423
|
|
|||||||||||
|
Net realized investment gains (losses)
|
0
|
|
0
|
|
1
|
|
(19
|
)
|
(8
|
)
|
(26
|
)
|
|||||||||||
|
Net change in fair value of credit derivatives:
|
|
|
|
|
|
|
|
|
|
|
|||||||||||||
|
Realized gains (losses) and other settlements
|
—
|
|
—
|
|
—
|
|
(18
|
)
|
0
|
|
(18
|
)
|
|||||||||||
|
Net unrealized gains (losses)
|
—
|
|
—
|
|
—
|
|
773
|
|
(27
|
)
|
746
|
|
|||||||||||
|
Net change in fair value of credit derivatives
|
—
|
|
—
|
|
—
|
|
755
|
|
(27
|
)
|
728
|
|
|||||||||||
|
Bargain purchase gain and settlement of pre-existing relationships
|
—
|
|
—
|
|
—
|
|
54
|
|
160
|
|
214
|
|
|||||||||||
|
Other
|
—
|
|
0
|
|
—
|
|
102
|
|
0
|
|
102
|
|
|||||||||||
|
TOTAL REVENUES
|
0
|
|
1
|
|
1
|
|
2,107
|
|
98
|
|
2,207
|
|
|||||||||||
|
EXPENSES
|
|
|
|
|
|
|
|
|
|
|
|
|
|||||||||||
|
Loss and LAE
|
—
|
|
—
|
|
—
|
|
434
|
|
(10
|
)
|
424
|
|
|||||||||||
|
Amortization of deferred acquisition costs
|
—
|
|
—
|
|
—
|
|
29
|
|
(9
|
)
|
20
|
|
|||||||||||
|
Interest expense
|
—
|
|
52
|
|
54
|
|
14
|
|
(19
|
)
|
101
|
|
|||||||||||
|
Other operating expenses
|
30
|
|
1
|
|
1
|
|
202
|
|
(3
|
)
|
231
|
|
|||||||||||
|
TOTAL EXPENSES
|
30
|
|
53
|
|
55
|
|
679
|
|
(41
|
)
|
776
|
|
|||||||||||
|
INCOME (LOSS) BEFORE INCOME TAXES AND EQUITY IN NET EARNINGS OF SUBSIDIARIES
|
(30
|
)
|
(52
|
)
|
(54
|
)
|
1,428
|
|
139
|
|
1,431
|
|
|||||||||||
|
Total (provision) benefit for income taxes
|
—
|
|
18
|
|
19
|
|
(365
|
)
|
(47
|
)
|
(375
|
)
|
|||||||||||
|
Equity in net earnings of subsidiaries
|
1,086
|
|
923
|
|
468
|
|
39
|
|
(2,516
|
)
|
—
|
|
|||||||||||
|
NET INCOME (LOSS)
|
1,056
|
|
889
|
|
433
|
|
1,102
|
|
(2,424
|
)
|
1,056
|
|
|||||||||||
|
Less: noncontrolling interest
|
—
|
|
—
|
|
—
|
|
39
|
|
(39
|
)
|
—
|
|
|||||||||||
|
NET INCOME (LOSS) ATTRIBUTABLE TO ASSURED GUARANTY LTD.
|
$
|
1,056
|
|
$
|
889
|
|
$
|
433
|
|
$
|
1,063
|
|
$
|
(2,385
|
)
|
$
|
1,056
|
|
|||||
|
COMPREHENSIVE INCOME (LOSS)
|
$
|
923
|
|
$
|
787
|
|
$
|
359
|
|
$
|
967
|
|
$
|
(2,113
|
)
|
$
|
923
|
|
|||||
253
CONDENSED CONSOLIDATING STATEMENT OF OPERATIONS
AND COMPREHENSIVE INCOME
FOR THE YEAR ENDED
DECEMBER 31, 2014
(in millions)
|
|
Assured
Guaranty Ltd.
(Parent)
|
AGUS
(Issuer)
|
AGMH
(Issuer)
|
Other
Entities
|
Consolidating
Adjustments
|
Assured
Guaranty Ltd.
(Consolidated)
|
|||||||||||||||||
|
REVENUES
|
|
|
|
|
|
|
|
|
|
|
|
|
|||||||||||
|
Net earned premiums
|
$
|
—
|
|
$
|
—
|
|
$
|
—
|
|
$
|
566
|
|
$
|
4
|
|
$
|
570
|
|
|||||
|
Net investment income
|
0
|
|
0
|
|
1
|
|
412
|
|
(10
|
)
|
403
|
|
|||||||||||
|
Net realized investment gains (losses)
|
0
|
|
0
|
|
0
|
|
(58
|
)
|
(2
|
)
|
(60
|
)
|
|||||||||||
|
Net change in fair value of credit derivatives:
|
|
|
|
|
|
|
|
|
|
|
|||||||||||||
|
Realized gains (losses) and other settlements
|
—
|
|
—
|
|
—
|
|
23
|
|
—
|
|
23
|
|
|||||||||||
|
Net unrealized gains (losses)
|
—
|
|
—
|
|
—
|
|
800
|
|
—
|
|
800
|
|
|||||||||||
|
Net change in fair value of credit derivatives
|
—
|
|
—
|
|
—
|
|
823
|
|
—
|
|
823
|
|
|||||||||||
|
Other
|
—
|
|
—
|
|
—
|
|
259
|
|
(1
|
)
|
258
|
|
|||||||||||
|
TOTAL REVENUES
|
0
|
|
0
|
|
1
|
|
2,002
|
|
(9
|
)
|
1,994
|
|
|||||||||||
|
EXPENSES
|
|
|
|
|
|
|
|
|
|
|
|
|
|||||||||||
|
Loss and LAE
|
—
|
|
—
|
|
—
|
|
122
|
|
4
|
|
126
|
|
|||||||||||
|
Amortization of deferred acquisition costs
|
—
|
|
—
|
|
—
|
|
33
|
|
(8
|
)
|
25
|
|
|||||||||||
|
Interest expense
|
—
|
|
40
|
|
54
|
|
16
|
|
(18
|
)
|
92
|
|
|||||||||||
|
Other operating expenses
|
31
|
|
1
|
|
1
|
|
195
|
|
(8
|
)
|
220
|
|
|||||||||||
|
TOTAL EXPENSES
|
31
|
|
41
|
|
55
|
|
366
|
|
(30
|
)
|
463
|
|
|||||||||||
|
INCOME (LOSS) BEFORE INCOME TAXES AND EQUITY IN NET EARNINGS OF SUBSIDIARIES
|
(31
|
)
|
(41
|
)
|
(54
|
)
|
1,636
|
|
21
|
|
1,531
|
|
|||||||||||
|
Total (provision) benefit for income taxes
|
—
|
|
14
|
|
19
|
|
(469
|
)
|
(7
|
)
|
(443
|
)
|
|||||||||||
|
Equity in net earnings of subsidiaries
|
1,119
|
|
983
|
|
513
|
|
32
|
|
(2,647
|
)
|
—
|
|
|||||||||||
|
NET INCOME (LOSS)
|
1,088
|
|
956
|
|
478
|
|
1,199
|
|
(2,633
|
)
|
1,088
|
|
|||||||||||
|
Less: noncontrolling interest
|
—
|
|
—
|
|
—
|
|
32
|
|
(32
|
)
|
—
|
|
|||||||||||
|
NET INCOME (LOSS) ATTRIBUTABLE TO ASSURED GUARANTY LTD.
|
$
|
1,088
|
|
$
|
956
|
|
$
|
478
|
|
$
|
1,167
|
|
$
|
(2,601
|
)
|
$
|
1,088
|
|
|||||
|
COMPREHENSIVE INCOME (LOSS)
|
$
|
1,298
|
|
$
|
1,114
|
|
$
|
577
|
|
$
|
1,570
|
|
$
|
(3,261
|
)
|
$
|
1,298
|
|
|||||
254
CONDENSED CONSOLIDATING STATEMENT OF CASH FLOWS
FOR THE YEAR ENDED
DECEMBER 31, 2016
(in millions)
|
|
Assured
Guaranty Ltd.
(Parent)
|
AGUS
(Issuer)
|
AGMH
(Issuer)
|
Other
Entities
|
Consolidating
Adjustments
|
Assured
Guaranty Ltd.
(Consolidated)
|
|||||||||||||||||
|
Net cash flows provided by (used in) operating activities
|
$
|
390
|
|
$
|
533
|
|
$
|
213
|
|
$
|
64
|
|
$
|
(1,341
|
)
|
$
|
(141
|
)
|
|||||
|
Cash flows from investing activities
|
|
|
|
|
|
|
|
|
|
|
|
|
|||||||||||
|
Fixed-maturity securities:
|
|
|
|
|
|
|
|
|
|
|
|
|
|||||||||||
|
Purchases
|
(4
|
)
|
(143
|
)
|
(10
|
)
|
(1,489
|
)
|
—
|
|
(1,646
|
)
|
|||||||||||
|
Sales
|
4
|
|
24
|
|
12
|
|
1,325
|
|
—
|
|
1,365
|
|
|||||||||||
|
Maturities
|
—
|
|
30
|
|
—
|
|
1,125
|
|
—
|
|
1,155
|
|
|||||||||||
|
Sales (purchases) of short-term investments, net
|
(26
|
)
|
(237
|
)
|
(10
|
)
|
290
|
|
—
|
|
17
|
|
|||||||||||
|
Net proceeds from financial guaranty variable entities’ assets
|
—
|
|
—
|
|
—
|
|
629
|
|
—
|
|
629
|
|
|||||||||||
|
Intercompany debt
|
—
|
|
—
|
|
—
|
|
20
|
|
(20
|
)
|
—
|
|
|||||||||||
|
Proceeds from stock redemption and return of capital from subsidiaries
|
—
|
|
—
|
|
300
|
|
4
|
|
(304
|
)
|
—
|
|
|||||||||||
|
Acquisition of CIFG, net of cash acquired
|
—
|
|
—
|
|
—
|
|
(442
|
)
|
7
|
|
(435
|
)
|
|||||||||||
|
Other
|
—
|
|
7
|
|
—
|
|
(9
|
)
|
(7
|
)
|
(9
|
)
|
|||||||||||
|
Net cash flows provided by (used in) investing activities
|
(26
|
)
|
(319
|
)
|
292
|
|
1,453
|
|
(324
|
)
|
1,076
|
|
|||||||||||
|
Cash flows from financing activities
|
|
|
|
|
|
|
|
|
|
|
|
|
|||||||||||
|
Return of capital
|
—
|
|
—
|
|
—
|
|
(4
|
)
|
4
|
|
—
|
|
|||||||||||
|
Dividends paid
|
(69
|
)
|
(288
|
)
|
(513
|
)
|
(540
|
)
|
1,341
|
|
(69
|
)
|
|||||||||||
|
Repurchases of common stock
|
(306
|
)
|
—
|
|
—
|
|
(300
|
)
|
300
|
|
(306
|
)
|
|||||||||||
|
Share activity under option and incentive plans
|
11
|
|
—
|
|
—
|
|
(1
|
)
|
—
|
|
10
|
|
|||||||||||
|
Net paydowns of financial guaranty variable entities’ liabilities
|
—
|
|
—
|
|
—
|
|
(611
|
)
|
—
|
|
(611
|
)
|
|||||||||||
|
Payment of long-term debt
|
—
|
|
—
|
|
—
|
|
(2
|
)
|
—
|
|
(2
|
)
|
|||||||||||
|
Intercompany debt
|
—
|
|
(20
|
)
|
—
|
|
—
|
|
20
|
|
—
|
|
|||||||||||
|
Net cash flows provided by (used in) financing activities
|
(364
|
)
|
(308
|
)
|
(513
|
)
|
(1,458
|
)
|
1,665
|
|
(978
|
)
|
|||||||||||
|
Effect of exchange rate changes
|
—
|
|
—
|
|
—
|
|
(5
|
)
|
—
|
|
(5
|
)
|
|||||||||||
|
Increase (decrease) in cash
|
—
|
|
(94
|
)
|
(8
|
)
|
54
|
|
—
|
|
(48
|
)
|
|||||||||||
|
Cash at beginning of period
|
0
|
|
95
|
|
8
|
|
63
|
|
—
|
|
166
|
|
|||||||||||
|
Cash at end of period
|
$
|
0
|
|
$
|
1
|
|
$
|
0
|
|
$
|
117
|
|
$
|
—
|
|
$
|
118
|
|
|||||
255
CONDENSED CONSOLIDATING STATEMENT OF CASH FLOWS
FOR THE YEAR ENDED
DECEMBER 31, 2015
(in millions)
|
|
Assured
Guaranty Ltd.
(Parent)
|
AGUS
(Issuer)
|
AGMH
(Issuer)
|
Other
Entities
|
Consolidating
Adjustments
|
Assured
Guaranty Ltd.
(Consolidated)
|
|||||||||||||||||
|
Net cash flows provided by (used in) operating activities
|
$
|
513
|
|
$
|
408
|
|
$
|
185
|
|
$
|
52
|
|
$
|
(1,210
|
)
|
$
|
(52
|
)
|
|||||
|
Cash flows from investing activities
|
|
|
|
|
|
|
|
|
|
|
|
|
|||||||||||
|
Fixed-maturity securities:
|
|
|
|
|
|
|
|
|
|
|
|
|
|||||||||||
|
Purchases
|
—
|
|
(72
|
)
|
(21
|
)
|
(2,550
|
)
|
66
|
|
(2,577
|
)
|
|||||||||||
|
Sales
|
—
|
|
177
|
|
30
|
|
1,900
|
|
—
|
|
2,107
|
|
|||||||||||
|
Maturities
|
—
|
|
9
|
|
—
|
|
889
|
|
—
|
|
898
|
|
|||||||||||
|
Sales (purchases) of short-term investments, net
|
116
|
|
33
|
|
19
|
|
729
|
|
—
|
|
897
|
|
|||||||||||
|
Net proceeds from financial guaranty variable entities’ assets
|
—
|
|
—
|
|
—
|
|
400
|
|
—
|
|
400
|
|
|||||||||||
|
Proceeds from repayment of surplus notes
|
—
|
|
—
|
|
25
|
|
—
|
|
(25
|
)
|
—
|
|
|||||||||||
|
Acquisition of Radian Asset, net of cash acquired
|
—
|
|
—
|
|
—
|
|
(800
|
)
|
—
|
|
(800
|
)
|
|||||||||||
|
Other
|
—
|
|
(5
|
)
|
—
|
|
74
|
|
—
|
|
69
|
|
|||||||||||
|
Net cash flows provided by (used in) investing activities
|
116
|
|
142
|
|
53
|
|
642
|
|
41
|
|
994
|
|
|||||||||||
|
Cash flows from financing activities
|
|
|
|
|
|
|
|
|
|
|
—
|
|
|||||||||||
|
Return of capital
|
—
|
|
—
|
|
—
|
|
(25
|
)
|
25
|
|
—
|
|
|||||||||||
|
Dividends paid
|
(72
|
)
|
(455
|
)
|
(234
|
)
|
(455
|
)
|
1,144
|
|
(72
|
)
|
|||||||||||
|
Repurchases of common stock
|
(555
|
)
|
—
|
|
—
|
|
—
|
|
—
|
|
(555
|
)
|
|||||||||||
|
Share activity under option and incentive plans
|
(2
|
)
|
—
|
|
—
|
|
—
|
|
—
|
|
(2
|
)
|
|||||||||||
|
Net paydowns of financial guaranty variable entities’ liabilities
|
—
|
|
—
|
|
—
|
|
(214
|
)
|
—
|
|
(214
|
)
|
|||||||||||
|
Payment of long-term debt
|
—
|
|
—
|
|
—
|
|
(4
|
)
|
—
|
|
(4
|
)
|
|||||||||||
|
Net cash flows provided by (used in) financing activities
|
(629
|
)
|
(455
|
)
|
(234
|
)
|
(698
|
)
|
1,169
|
|
(847
|
)
|
|||||||||||
|
Effect of exchange rate changes
|
—
|
|
—
|
|
—
|
|
(4
|
)
|
—
|
|
(4
|
)
|
|||||||||||
|
Increase (decrease) in cash
|
—
|
|
95
|
|
4
|
|
(8
|
)
|
—
|
|
91
|
|
|||||||||||
|
Cash at beginning of period
|
0
|
|
0
|
|
4
|
|
71
|
|
—
|
|
75
|
|
|||||||||||
|
Cash at end of period
|
$
|
0
|
|
$
|
95
|
|
$
|
8
|
|
$
|
63
|
|
$
|
—
|
|
$
|
166
|
|
|||||
256
CONDENSED CONSOLIDATING STATEMENT OF CASH FLOWS
FOR THE YEAR ENDED
DECEMBER 31, 2014
(in millions)
|
|
Assured
Guaranty Ltd.
(Parent)
|
AGUS
(Issuer)
|
AGMH
(Issuer)
|
Other
Entities
|
Consolidating
Adjustments
|
Assured
Guaranty Ltd.
(Consolidated)
|
|||||||||||||||||
|
Net cash flows provided by (used in) operating activities
|
$
|
758
|
|
$
|
223
|
|
$
|
144
|
|
$
|
663
|
|
$
|
(1,211
|
)
|
$
|
577
|
|
|||||
|
Cash flows from investing activities
|
|
|
|
|
|
|
|
|
|
|
|
|
|||||||||||
|
Fixed-maturity securities:
|
|
|
|
|
|
|
|
|
|
|
|
|
|||||||||||
|
Purchases
|
—
|
|
(540
|
)
|
(8
|
)
|
(2,253
|
)
|
—
|
|
(2,801
|
)
|
|||||||||||
|
Sales
|
—
|
|
464
|
|
10
|
|
777
|
|
—
|
|
1,251
|
|
|||||||||||
|
Maturities
|
—
|
|
6
|
|
1
|
|
870
|
|
—
|
|
877
|
|
|||||||||||
|
Sales (purchases) of short-term investments, net
|
(93
|
)
|
(15
|
)
|
(3
|
)
|
269
|
|
—
|
|
158
|
|
|||||||||||
|
Net proceeds from financial guaranty variable entities’ assets
|
—
|
|
—
|
|
—
|
|
408
|
|
—
|
|
408
|
|
|||||||||||
|
Proceeds from repayment of surplus notes
|
—
|
|
—
|
|
50
|
|
—
|
|
(50
|
)
|
—
|
|
|||||||||||
|
Other
|
—
|
|
—
|
|
—
|
|
11
|
|
—
|
|
11
|
|
|||||||||||
|
Net cash flows provided by (used in) investing activities
|
(93
|
)
|
(85
|
)
|
50
|
|
82
|
|
(50
|
)
|
(96
|
)
|
|||||||||||
|
Cash flows from financing activities
|
|
|
|
|
|
|
|
|
|
|
|||||||||||||
|
Return of capital
|
—
|
|
—
|
|
—
|
|
(50
|
)
|
50
|
|
—
|
|
|||||||||||
|
Dividends paid
|
(76
|
)
|
(700
|
)
|
(190
|
)
|
(321
|
)
|
1,211
|
|
(76
|
)
|
|||||||||||
|
Repurchases of common stock
|
(590
|
)
|
—
|
|
—
|
|
—
|
|
—
|
|
(590
|
)
|
|||||||||||
|
Share activity under option and incentive plans
|
1
|
|
—
|
|
—
|
|
—
|
|
—
|
|
1
|
|
|||||||||||
|
Net paydowns of financial guaranty variable entities’ liabilities
|
—
|
|
—
|
|
—
|
|
(396
|
)
|
—
|
|
(396
|
)
|
|||||||||||
|
Net proceeds from issuance of long-term debt
|
—
|
|
495
|
|
—
|
|
—
|
|
—
|
|
495
|
|
|||||||||||
|
Payment of long-term debt
|
—
|
|
—
|
|
—
|
|
(19
|
)
|
—
|
|
(19
|
)
|
|||||||||||
|
Net cash flows provided by (used in) financing activities
|
(665
|
)
|
(205
|
)
|
(190
|
)
|
(786
|
)
|
1,261
|
|
(585
|
)
|
|||||||||||
|
Effect of exchange rate changes
|
—
|
|
—
|
|
—
|
|
(5
|
)
|
—
|
|
(5
|
)
|
|||||||||||
|
Increase (decrease) in cash
|
—
|
|
(67
|
)
|
4
|
|
(46
|
)
|
—
|
|
(109
|
)
|
|||||||||||
|
Cash at beginning of period
|
0
|
|
67
|
|
0
|
|
117
|
|
—
|
|
184
|
|
|||||||||||
|
Cash at end of period
|
$
|
0
|
|
$
|
0
|
|
$
|
4
|
|
$
|
71
|
|
$
|
—
|
|
$
|
75
|
|
|||||
257
|
22.
|
Quarterly Financial Information (Unaudited)
|
A summary of selected quarterly information follows:
|
2016
|
First
Quarter
|
Second
Quarter
|
Third
Quarter
|
Fourth
Quarter
|
Full
Year
|
|||||||||||||||
|
(dollars in millions, except per share data)
|
||||||||||||||||||||
|
Revenues
|
||||||||||||||||||||
|
Net earned premiums
|
$
|
183
|
|
$
|
214
|
|
$
|
231
|
|
$
|
236
|
|
$
|
864
|
|
|||||
|
Net investment income
|
99
|
|
98
|
|
94
|
|
117
|
|
408
|
|
||||||||||
|
Net realized investment gains (losses)
|
(13
|
)
|
10
|
|
(2
|
)
|
(24
|
)
|
(29
|
)
|
||||||||||
|
Net change in fair value of credit derivatives
|
(60
|
)
|
63
|
|
21
|
|
74
|
|
98
|
|
||||||||||
|
Fair value gains (losses) on CCS
|
(16
|
)
|
(11
|
)
|
(23
|
)
|
50
|
|
0
|
|
||||||||||
|
Fair value gains (losses) on FG VIEs
|
18
|
|
4
|
|
(11
|
)
|
27
|
|
38
|
|
||||||||||
|
Bargain purchase gain and settlement of pre-existing relationships
|
—
|
|
—
|
|
259
|
|
—
|
|
259
|
|
||||||||||
|
Other income (loss)
|
34
|
|
18
|
|
(3
|
)
|
(10
|
)
|
39
|
|
||||||||||
|
Expenses
|
||||||||||||||||||||
|
Loss and LAE
|
90
|
|
102
|
|
(9
|
)
|
112
|
|
295
|
|
||||||||||
|
Amortization of DAC
|
4
|
|
5
|
|
4
|
|
5
|
|
18
|
|
||||||||||
|
Interest expense
|
26
|
|
25
|
|
26
|
|
25
|
|
102
|
|
||||||||||
|
Other operating expenses
|
60
|
|
63
|
|
65
|
|
57
|
|
245
|
|
||||||||||
|
Income (loss) before provision for income taxes
|
65
|
|
201
|
|
480
|
|
271
|
|
1,017
|
|
||||||||||
|
Provision (benefit) for income taxes
|
6
|
|
55
|
|
1
|
|
74
|
|
136
|
|
||||||||||
|
Net income (loss)
|
59
|
|
146
|
|
479
|
|
197
|
|
881
|
|
||||||||||
|
Earnings (loss) per share(1):
|
||||||||||||||||||||
|
Basic
|
$
|
0.43
|
|
$
|
1.09
|
|
$
|
3.63
|
|
$
|
1.51
|
|
$
|
6.61
|
|
|||||
|
Diluted
|
$
|
0.43
|
|
$
|
1.09
|
|
$
|
3.60
|
|
$
|
1.49
|
|
$
|
6.56
|
|
|||||
|
Dividends per share
|
$
|
0.13
|
|
$
|
0.13
|
|
$
|
0.13
|
|
$
|
0.13
|
|
$
|
0.52
|
|
|||||
258
|
2015
|
First
Quarter
|
Second
Quarter
|
Third
Quarter
|
Fourth
Quarter
|
Full
Year
|
|||||||||||||||
|
(dollars in millions, except per share data)
|
||||||||||||||||||||
|
Revenues
|
||||||||||||||||||||
|
Net earned premiums
|
$
|
142
|
|
$
|
219
|
|
$
|
213
|
|
$
|
192
|
|
$
|
766
|
|
|||||
|
Net investment income
|
101
|
|
98
|
|
112
|
|
112
|
|
423
|
|
||||||||||
|
Net realized investment gains (losses)
|
16
|
|
(9
|
)
|
(27
|
)
|
(6
|
)
|
(26
|
)
|
||||||||||
|
Net change in fair value of credit derivatives
|
124
|
|
90
|
|
86
|
|
428
|
|
728
|
|
||||||||||
|
Fair value gains (losses) on CCS
|
2
|
|
23
|
|
(15
|
)
|
17
|
|
27
|
|
||||||||||
|
Fair value gains (losses) on FG VIEs
|
(7
|
)
|
5
|
|
2
|
|
38
|
|
38
|
|
||||||||||
|
Bargain purchase gain and settlement of pre-existing relationships
|
—
|
|
214
|
|
—
|
|
—
|
|
214
|
|
||||||||||
|
Other income (loss)
|
(9
|
)
|
55
|
|
(3
|
)
|
(6
|
)
|
37
|
|
||||||||||
|
Expenses
|
||||||||||||||||||||
|
Loss and LAE
|
18
|
|
188
|
|
112
|
|
106
|
|
424
|
|
||||||||||
|
Amortization of DAC
|
4
|
|
6
|
|
5
|
|
5
|
|
20
|
|
||||||||||
|
Interest expense
|
25
|
|
26
|
|
25
|
|
25
|
|
101
|
|
||||||||||
|
Other operating expenses
|
56
|
|
66
|
|
54
|
|
55
|
|
231
|
|
||||||||||
|
Income (loss) before provision for income taxes
|
266
|
|
409
|
|
172
|
|
584
|
|
1,431
|
|
||||||||||
|
Provision (benefit) for income taxes
|
65
|
|
112
|
|
43
|
|
155
|
|
375
|
|
||||||||||
|
Net income (loss)
|
201
|
|
297
|
|
129
|
|
429
|
|
1,056
|
|
||||||||||
|
Earnings (loss) per share(1):
|
||||||||||||||||||||
|
Basic
|
$
|
1.29
|
|
$
|
1.97
|
|
$
|
0.88
|
|
$
|
3.05
|
|
$
|
7.12
|
|
|||||
|
Diluted
|
$
|
1.28
|
|
$
|
1.96
|
|
$
|
0.88
|
|
$
|
3.03
|
|
$
|
7.08
|
|
|||||
|
Dividends per share
|
$
|
0.12
|
|
$
|
0.12
|
|
$
|
0.12
|
|
$
|
0.12
|
|
$
|
0.48
|
|
|||||
____________________
|
(1)
|
Per share amounts for the quarters and the full years have each been calculated separately. Accordingly, quarterly amounts may not sum up to the annual amounts because of differences in the average common shares outstanding during each period and, with regard to diluted per share amounts only, because of the inclusion of the effect of potentially dilutive securities only in the periods in which such effect would have been dilutive.
|
|
ITEM 9.
|
CHANGES IN AND DISAGREEMENTS WITH ACCOUNTANTS ON ACCOUNTING AND FINANCIAL DISCLOSURE
|
None.
|
ITEM 9A.
|
CONTROLS AND PROCEDURES
|
Disclosure Controls and Procedures
Assured Guaranty's management, with the participation of Assured Guaranty Ltd.'s President and Chief Executive Officer and Chief Financial Officer, has evaluated the effectiveness of Assured Guaranty Ltd.'s disclosure controls and procedures (as such term is defined in Rules 13a 15(e) and 15d 15(e) under the Securities Exchange Act of 1934, as amended (the Exchange Act)) as of the end of the period covered by this report. Based on this evaluation, Assured Guaranty Ltd.'s President and Chief Executive Officer and Chief Financial Officer have concluded that, as of the end of such period, Assured Guaranty Ltd.'s disclosure controls and procedures are effective in recording, processing, summarizing and reporting, on a timely basis, information required to be disclosed by Assured Guaranty Ltd. (including its consolidated subsidiaries) in the reports that it files or submits under the Exchange Act.
There has been no change in the Company's internal controls over financial reporting during the Company's quarter ended December 31, 2016, that has materially affected, or is reasonably likely to materially affect, the Company's internal controls over financial reporting.
259
Management's Report on Internal Control over Financial Reporting
The management of Assured Guaranty Ltd. is responsible for establishing and maintaining adequate internal control over financial reporting, as such term is defined in Exchange Act Rule 13a-15(f). Internal control over financial reporting is a process designed by, or under the supervision of the Company's President and Chief Executive Officer and Chief Financial Officer to provide reasonable assurance regarding the reliability of financial reporting and the preparation of the Company's consolidated financial statements for external purposes in accordance with accounting principles generally accepted in the United States of America.
Because of inherent limitations, internal control over financial reporting may not prevent or detect misstatements. Projections of any evaluation of effectiveness to future periods are subject to the risks that controls may become inadequate because of changes in conditions, or that the degree of compliance with the policies or procedures may deteriorate.
On July 1, 2016, the Company acquired CIFG Holding Inc. and its subsidiaries. See Part II, Item 8, Financial Statements and Supplementary Data, Note 2, Acquisitions, for additional information. The Company has extended its Section 404 compliance program under the Sarbanes-Oxley Act of 2002 and the applicable rules and regulations under such Act to include the integration of CIFG Holding Inc. and its subsidiaries' financial data into the Company’s existing systems, processes and related controls, as well as the new processes and controls to accommodate the business combination accounting and financial consolidation of CIFG Holding Inc. and its subsidiaries.
Management of the Company has assessed the effectiveness of the Company's internal control over financial reporting as of December 31, 2016 using the criteria set forth by the Committee of Sponsoring Organizations of the Treadway Commission (COSO) in the 2013 Internal Control-Integrated Framework. Based on this evaluation, management concluded that the Company's internal control over financial reporting was effective as of December 31, 2016 based on criteria in the 2013 Internal Control- Integrated Framework issued by the COSO.
The effectiveness of the Company's internal control over financial reporting as of December 31, 2016 has been audited by PricewaterhouseCoopers LLP, an independent registered public accounting firm, as stated in their "Report of Independent Registered Public Accounting Firm" included in Part II, Item 8, Financial Statements and Supplementary Data.
|
ITEM 9B.
|
OTHER INFORMATION
|
None.
260
|
ITEM 10.
|
DIRECTORS, EXECUTIVE OFFICERS AND CORPORATE GOVERNANCE
|
Information pertaining to this item is incorporated by reference to the sections entitled “Proposal No. 1: Election of Directors”, “Corporate Governance—Did Our Insiders Comply with Section 16(a) Beneficial Ownership Reporting in 2016?”, “Corporate Governance—How Are Directors nominated?” and “Corporate Governance—The Committees of the Board—The Audit Committee” of the definitive proxy statement for the Annual General Meeting of Shareholders, which involves the election of directors and will be filed with the SEC not later than 120 days after the close of the fiscal year pursuant to regulation 14A.
Information about the executive officers of AGL is set forth at the end of Part I of this Form 10-K and is hereby incorporated by reference.
Code of Conduct
The Company has adopted a Code of Conduct, which sets forth standards by which all employees, officers and directors of the Company must abide as they work for the Company. The Code of Conduct is available at www.assuredguaranty.com/governance. The Company intends to disclose on its internet site any amendments to, or waivers from, its Code of Conduct that are required to be publicly disclosed pursuant to the rules of the SEC or the New York Stock Exchange.
|
ITEM 11.
|
EXECUTIVE COMPENSATION
|
This item is incorporated by reference to the sections entitled “Executive Compensation”, “Corporate Governance—Compensation Committee interlocking and insider participation” and “Corporate Governance—How are the directors compensated?” of the definitive proxy statement for the Annual General Meeting of Shareholders, which will be filed with the SEC not later than 120 days after the close of the fiscal year pursuant to regulation 14A.
|
ITEM 12.
|
SECURITY OWNERSHIP OF CERTAIN BENEFICIAL OWNERS AND MANAGEMENT AND RELATED STOCKHOLDER MATTERS
|
This item is incorporated by reference to the sections entitled "Information about our Common Share Ownership" and "Equity Compensation Plans Information" of the definitive proxy statement for the Annual General Meeting of Shareholders, which will be filed with the SEC not later than 120 days after the close of the fiscal year pursuant to regulation 14A.
|
ITEM 13.
|
CERTAIN RELATIONSHIPS AND RELATED TRANSACTIONS, AND DIRECTOR INDEPENDENCE
|
This item is incorporated by reference to the sections entitled “Corporate Governance—What is our related person transactions approval policy and what procedures do we use to implement it?”, “Corporate Governance—What related person transactions do we have?” and “Corporate Governance—Director independence” of the definitive proxy statement for the Annual General Meeting of Shareholders, which will be filed with the SEC not later than 120 days after the close of the fiscal year pursuant to regulation 14A.
|
ITEM 14.
|
PRINCIPAL ACCOUNTING FEES AND SERVICES
|
This item is incorporated by reference to the section entitled “Proposal No. 4: Appointment of Independent Auditors—Independent Auditor Fee Information” and “Proposal No. 4: Appointment of Independent Auditors—Pre-Approval Policy of Audit and Non-Audit Services” of the definitive proxy statement for the Annual General Meeting of Shareholders, which will be filed with the SEC not later than 120 days after the close of the fiscal year pursuant to regulation 14A.
261
|
ITEM 15.
|
EXHIBITS, FINANCIAL STATEMENT SCHEDULES
|
|
(a)
|
Financial Statements, Financial Statement Schedules and Exhibits
|
|
1.
|
Financial Statements
|
The following financial statements of Assured Guaranty Ltd. have been included in Part II, Item 8, Financial Statements and Supplementary Data, hereof:
2. Financial Statement Schedules
The financial statement schedules are omitted because they are not applicable or the required information is shown in the consolidated financial statements or notes thereto.
3. Exhibits*
|
|
|
|
Exhibit
Number
|
Description of Document
|
|
3.1
|
Certificate of Incorporation and Memorandum of Association of the Registrant, as amended by Certificate of Incorporation on Change of Name dated March 30, 2004 and Certificate of Deposit of Memorandum of Increase of Capital dated April 21, 2004 (Incorporated by reference to Exhibit 3.1 to Form 10-K for the year ended December 31, 2009)
|
|
3.2
|
First Amended and Restated Bye-laws of the Registrant, as amended (Incorporated by reference to Exhibit 3.1 to Form 8-K filed on May 10, 2011)
|
|
4.1
|
Specimen Common Share Certificate (Incorporated by reference to Exhibit 4.1 to Form S-1 (#333-111491))
|
|
4.2
|
Certificate of Incorporation and Memorandum of Association of the Registrant, as amended by Certificate of Incorporation on Change of Name dated March 30, 2004 and Certificate of Deposit of Memorandum of Increase of Capital dated April 21, 2004 (See Exhibit 3.1)
|
|
4.3
|
Bye-laws of the Registrant (See Exhibit 3.2)
|
|
4.4
|
Indenture, dated as of May 1, 2004, among the Company, Assured Guaranty U.S. Holdings Inc. and The Bank of New York, as trustee (Incorporated by reference to Exhibit 4.1 to Form 10-Q for the quarter ended March 31, 2004)
|
|
4.5
|
Indenture, dated as of December 1, 2006, entered into among Assured Guaranty Ltd., Assured Guaranty U.S. Holdings Inc. and The Bank of New York, as trustee (Incorporated by reference to Exhibit 4.1 to Form 8-K filed on December 20, 2006)
|
|
4.6
|
First Supplemental Subordinated Indenture, dated as of December 20, 2006, entered into among Assured Guaranty Ltd., Assured Guaranty U.S. Holdings Inc. and The Bank of New York, as trustee (Incorporated by reference to Exhibit 4.2 to Form 8-K filed on December 20, 2006)
|
|
4.7
|
Replacement Capital Covenant, dated as of December 20, 2006, between Assured Guaranty U.S. Holdings Inc. and Assured Guaranty Ltd., in favor of and for the benefit of each Covered Debtholder (as defined therein) (Incorporated by reference to Exhibit 4.1 to Form 8-K filed on December 20, 2006)
|
|
4.8
|
Amended and Restated Trust Indenture dated as of February 24, 1999 between Financial Security Assurance Holdings Ltd. and the Senior Debt Trustee (Incorporated by reference to Exhibit 4.1 to Financial Security Assurance Holdings Ltd.'s Registration Statement to Form S-3 (#333-74165))
|
262
|
|
|
|
Exhibit
Number
|
Description of Document
|
|
4.9
|
Form of Assured Guaranty Municipal Holdings Inc., formerly known as Financial Security Assurance Holdings Ltd. 6
7
/
8
% Quarterly Interest Bond Securities due 2101 (Incorporated by reference to Exhibit 4.1 to Form 10-Q for the quarter ended March 31, 2010)
|
|
4.10
|
Form of Assured Guaranty Municipal Holdings Inc., formerly known as Financial Security Assurance Holdings Ltd. 6.25% Notes due November 1, 2102 (Incorporated by reference to Exhibit 4.2 to Form 10-Q for the quarter ended March 31, 2010)
|
|
4.11
|
Form of Assured Guaranty Municipal Holdings Inc., formerly known as Financial Security Assurance Holdings Ltd. 5.60% Notes due July 15, 2103 (Incorporated by reference to Exhibit 4.3 to Form 10-Q for the quarter ended March 31, 2010)
|
|
4.12
|
Supplemental indenture, dated as of August 26, 2009, between Assured Guaranty Ltd., Financial Security Assurance Holdings Ltd. and U.S. Bank National Association, as trustee (Incorporated by reference to Exhibit 99.1 to Form 8-K filed on September 1, 2009)
|
|
4.13
|
Indenture, dated as of November 22, 2006, between Financial Security Assurance Holdings Ltd. and The Bank of New York, as Trustee (Incorporated by reference to Exhibit 4.1 to Financial Security Assurance Holdings Ltd.'s Form 8-K filed on November 28, 2006)
|
|
4.14
|
Form of Financial Security Assurance Holdings Ltd. Junior Subordinated Debenture, Series 2006-1 (Incorporated by reference to Exhibit 10.3 to Financial Security Assurance Holdings Ltd.'s Form 8-K filed on November 25, 2002)
|
|
4.15
|
Supplemental indenture, dated as of August 26, 2009, between Assured Guaranty Ltd., Financial Security Assurance Holdings Ltd. and The Bank of New York Mellon, as trustee (Incorporated by reference to Exhibit 99.2 to Form 8-K filed on September 1, 2009)
|
|
4.16
|
First Supplemental Indenture, to be dated as of June 24, 2009, between Assured Guaranty U.S. Holdings Inc., Assured Guaranty Ltd. and The Bank of New York Mellon, as trustee (including the form of 8.50% Senior Note due 2014 of Assured Guaranty U.S. Holdings Inc.) (Incorporated by reference to Exhibit 4.1 to Form 8-K filed on June 23, 2009)
|
|
4.17
|
Officers’ Certificate, dated June 20, 2014, related to 5.000% Senior Notes due 2024, containing form of 5.000% Senior Notes due 2024 as Exhibit A thereto (Incorporated by reference to Exhibit 4.1 to Form 8-K filed on June 20, 2014)
|
|
10.1
|
Guaranty by Assured Guaranty Re Ltd. in favor of Assured Guaranty Re Overseas Ltd., amended and restated as of May 1, 2014 (Incorporated by reference to Exhibit 10.1 to Form 10-Q for the quarter ended June 30, 2014)
|
|
10.2
|
Put Agreement between Assured Guaranty Corp. and Woodbourne Capital Trust [I][II][III][IV] (Incorporated by reference to Exhibit 10.6 to Form 10-Q for the quarter ended March 31, 2005)
|
|
10.3
|
Custodial Trust Expense Reimbursement Agreement (Incorporated by reference to Exhibit 10.7 to Form 10-Q for the quarter ended March 31, 2005)
|
|
10.4
|
Assured Guaranty Corp. Articles Supplementary Classifying and Designating Series of Preferred Stock as Series A Perpetual Preferred Stock, Series B Perpetual Preferred Stock, Series C Perpetual Preferred Stock, Series D Perpetual Preferred Stock (Incorporated by reference to Exhibit 10.8 to Form 10-Q for the quarter ended March 31, 2005)
|
|
10.5
|
Purchase Agreement among Dexia Holdings Inc., Dexia Crédit Local S.A. and the Company dated as of November 14, 2008 (Incorporated by reference to Exhibit 99.1 to Form 8-K filed on November 17, 2008)
|
|
10.6
|
Amended and Restated Revolving Credit Agreement dated as of June 30, 2009 among FSA Asset Management LLC, Dexia Crédit Local S.A. and Dexia Bank Belgium S.A. (Incorporated by reference to Exhibit 10.1 to Form 8-K filed on July 8, 2009)
|
|
10.7
|
First Amendment to Amended and Restated Revolving Credit Agreement dated as of September 20, 2010 among FSA Asset Management LLC, Dexia Crédit Local S.A. and Dexia Bank Belgium S.A. (Incorporated by reference to Exhibit 10.11 to Form 10-K for the year ended December 31, 2013)
|
|
10.8
|
Second Amendment to Amended and Restated Revolving Credit Agreement dated as of May 16, 2012 among FSA Asset Management LLC, Dexia Crédit Local S.A. and Dexia Bank Belgium S.A. (Incorporated by reference to Exhibit 10.12 to Form 10-K for the year ended December 31, 2013)
|
|
10.9
|
Assignment Pursuant to the Amended and Restated Revolving Credit Agreement, as amended, dated as of December 12, 2013 between Belfius Bank SA/NV and Dexia Crédit Local S.A. (Incorporated by reference to Exhibit 10.13 to Form 10-K for the year ended December 31, 2013)
|
|
10.10
|
ISDA Master Agreement (Multicurrency-Cross Border) dated as of June 30, 2009 among Dexia SA, Dexia Crédit Local S.A. and FSA Asset Management LLC (Incorporated by reference to Exhibit 10.3.1 to Form 8-K filed on July 8, 2009)
|
263
|
|
|
|
Exhibit
Number
|
Description of Document
|
|
10.11
|
Schedule to the 1992 Master Agreement, Guaranteed Put Contract, dated as of June 30, 2009 among Dexia Crédit Local S.A., Dexia SA and FSA Asset Management LLC (Incorporated by reference to Exhibit 10.3.2 to Form 8-K filed on July 8, 2009)
|
|
10.12
|
Put Option Confirmation, Guaranteed Put Contract, dated June 30, 2009 to FSA Asset Management LLC from Dexia SA and Dexia Crédit Local S.A. (Incorporated by reference to Exhibit 10.3.3 to Form 8-K filed on July 8, 2009)
|
|
10.13
|
ISDA Credit Support Annex (New York Law) to the Schedule to the ISDA Master Agreement, Guaranteed Put Contract, dated as of June 30, 2009 between Dexia Crédit Local S.A. and Dexia SA and FSA Asset Management LLC (Incorporated by reference to Exhibit 10.3.4 to Form 8-K filed on July 8, 2009)
|
|
10.14
|
ISDA Master Agreement (Multicurrency-Cross Border) dated as of June 30, 2009 among Dexia SA, Dexia Crédit Local S.A. and FSA Asset Management LLC (Incorporated by reference to Exhibit 10.4.1 to Form 8-K filed on July 8, 2009)
|
|
10.15
|
Schedule to the 1992 Master Agreement, Non-Guaranteed Put Contract, dated as of June 30, 2009 among Dexia Crédit Local S.A., Dexia SA and FSA Asset Management LLC (Incorporated by reference to Exhibit 10.4.2 to Form 8-K filed on July 8, 2009)
|
|
10.16
|
Put Option Confirmation, Non-Guaranteed Put Contract, dated June 30, 2009 to FSA Asset Management LLC from Dexia SA and Dexia Crédit Local S.A. (Incorporated by reference to Exhibit 10.4.3 to Form 8-K filed on July 8, 2009)
|
|
10.17
|
ISDA Credit Support Annex (New York Law) to the Schedule to the ISDA Master Agreement, Non-Guaranteed Put Contract, dated as of June 30, 2009 between Dexia Crédit Local S.A. and Dexia SA and FSA Asset Management LLC (Incorporated by reference to Exhibit 10.4.4 to Form 8-K filed on July 8, 2009)
|
|
10.18
|
First Demand Guarantee Relating to the “Financial Products” Portfolio of FSA Asset Management LLC issued by the Belgian State and the French State and executed as of June 30, 2009 (Incorporated by reference to Exhibit 10.5 to Form 8-K filed on July 8, 2009)
|
|
10.19
|
Guaranty, dated as of June 30, 2009, made jointly and severally by Dexia SA and Dexia Crédit Local S.A., in favor of Financial Security Assurance Inc. (Incorporated by reference to Exhibit 10.6 to Form 8-K filed on July 8, 2009)
|
|
10.20
|
Indemnification Agreement (GIC Business) dated as of June 30, 2009 by and among Financial Security Assurance Inc., Dexia Crédit Local S.A. and Dexia SA (Incorporated by reference to Exhibit 10.7 to Form 8-K filed on July 8, 2009)
|
|
10.21
|
Pledge and Administration Agreement, dated as of June 30, 2009, among Dexia SA, Dexia Crédit Local S.A., Dexia Bank Belgium SA, Dexia FP Holdings Inc., Financial Security Assurance Inc., FSA Asset Management LLC, FSA Portfolio Asset Limited, FSA Capital Markets Services LLC, FSA Capital Markets Services (Caymans) Ltd., FSA Capital Management Services LLC and The Bank of New York Mellon Trust Company, National Association (Incorporated by reference to Exhibit 10.8 to Form 8-K filed on July 8, 2009)
|
|
10.22
|
Separation Agreement, dated as of July 1, 2009, among Dexia Crédit Local S.A., Financial Security Assurance Inc., Financial Security Assurance International, Ltd., FSA Global Funding Limited and Premier International Funding Co. (Incorporated by reference to Exhibit 10.9 to Form 8-K filed on July 8, 2009)
|
|
10.23
|
Funding Guaranty, dated as of July 1, 2009, made by Dexia Crédit Local S.A. in favor of Financial Security Assurance Inc. and Financial Security Assurance International, Ltd. (Incorporated by reference to Exhibit 10.10 to Form 8-K filed on July 8, 2009)
|
|
10.24
|
Reimbursement Guaranty, dated as of July 1, 2009, made by Dexia Crédit Local S.A. in favor of Financial Security Assurance Inc. and Financial Security Assurance International, Ltd. (Incorporated by reference to Exhibit 10.11 to Form 8-K filed on July 8, 2009)
|
|
10.25
|
Indemnification Agreement (FSA Global Business), dated as of July 1, 2009, by and between Financial Security Assurance Inc., Assured Guaranty Ltd. and Dexia Crédit Local S.A. (Incorporated by reference to Exhibit 10.13 to Form 8-K filed on July 8, 2009)
|
|
10.26
|
Pledge and Administration Annex Amendment Agreement dated as of July 1, 2009 among Dexia SA, Dexia Crédit Local S.A., Dexia Bank Belgium SA, Dexia FP Holdings Inc., Financial Security Assurance Inc., FSA Asset Management LLC, FSA Portfolio Asset Limited, FSA Capital Markets Services LLC, FSA Capital Markets Services (Caymans) Ltd., FSA Capital Management Services LLC and The Bank of New York Mellon Trust Company, National Association (Incorporated by reference to Exhibit 10.14 to Form 8-K filed on July 8, 2009)
|
|
10.27
|
Put Confirmation Annex Amendment Agreement dated as of July 1, 2009 among Dexia SA and Dexia Crédit Local S.A. and FSA Asset Management LLC and Financial Security Assurance Inc. (Incorporated by reference to Exhibit 10.15 to Form 8-K filed on July 8, 2009)
|
264
|
|
|
|
Exhibit
Number
|
Description of Document
|
|
10.28
|
Master Repurchase Agreement between FSA Capital Management Services LLC and FSA Capital Markets Services LLC (Incorporated by reference to Exhibit 10.20 to Form 10-Q for the quarter ended June 30, 2009)
|
|
10.29
|
Confirmation to Master Repurchase Agreement (Incorporated by reference to Exhibit 10.21 to Form 10-Q for the quarter ended June 30, 2009)
|
|
10.30
|
Master Repurchase Agreement Annex I (Incorporated by reference to Exhibit 10.22 to Form 10-Q for the quarter ended June 30, 2009)
|
|
10.31
|
Pledge and Intercreditor Agreement, among Dexia Crédit Local, Dexia Bank Belgium S.A., Financial Security Assurance Inc. and FSA Asset Management LLC, dated November 13, 2008 (Incorporated by reference to Exhibit 10.3 to Financial Security Assurance Holdings Ltd.'s Form 10-Q for the quarter ended September 30, 2008)
|
|
10.32
|
Amended and Restated Pledge and Intercreditor Agreement, dated as of February 20, 2009, between Dexia Crédit Local, Dexia Bank Belgium S.A., Financial Security Assurance Inc., FSA Asset Management LLC, FSA Capital Markets Services LLC and FSA Capital Management Services LLC (Incorporated by reference to Exhibit 10.19 to Financial Security Assurance Holdings Ltd.'s Form 10-K for the year ended December 31, 2008)
|
|
10.33
|
Put Option Agreement, dated as of June 23, 2003 by and between FSA and Sutton Capital Trust I (Incorporated by reference to Exhibit 99.5 to Financial Security Assurance Holdings Ltd.'s Form 10-Q for the quarter ended June 30, 2003)
|
|
10.34
|
Put Option Agreement, dated as of June 23, 2003 by and between FSA and Sutton Capital Trust II (Incorporated by reference to Exhibit 99.6 to Financial Security Assurance Holdings Ltd.'s Form 10-Q for the quarter ended June 30, 2003)
|
|
10.35
|
Put Option Agreement, dated as of June 23, 2003 by and between FSA and Sutton Capital Trust III (Incorporated by reference to Exhibit 99.7 to Financial Security Assurance Holdings Ltd.'s Form 10-Q for the quarter ended June 30, 2003)
|
|
10.36
|
Put Option Agreement, dated as of June 23, 2003 by and between FSA and Sutton Capital Trust IV (Incorporated by reference to Exhibit 99.8 to Financial Security Assurance Holdings Ltd.'s Form 10-Q for the quarter ended June 30, 2003)
|
|
10.37
|
Contribution Agreement, dated as of November 22, 2006, between Dexia S.A. and Financial Security Assurance Holdings Ltd. (Incorporated by reference to Exhibit 10.4 to Financial Security Assurance Holdings Ltd.'s Form 8-K filed on November 28, 2006)
|
|
10.38
|
Replacement Capital Covenant, dated as of November 22, 2006, by Financial Security Assurance Holdings Ltd. (Incorporated by reference to Exhibit 10.5 to Financial Security Assurance Holdings Ltd.'s Form 8-K filed on November 28, 2006)
|
|
10.39
|
Agreement and Amendment between Dexia Holdings Inc., Dexia Credit Local S.A. and the Company dated as of June 9, 2009 (Incorporated by reference to Exhibit 10.1 to Form 8-K filed on June 12, 2009)
|
|
10.40
|
Stock Purchase Agreement, dated as of December 22, 2014, between Assured Guaranty Corp. and Radian Guaranty Inc. (Incorporated by reference to Exhibit 10.44 to Form 10-K for the year ended December 31, 2014)
|
|
10.41
|
Summary of Annual Compensation*
|
|
10.42
|
Director Compensation Summary (Incorporated by reference to Exhibit 10.1 to Form 10-Q for the quarter ended March 31, 2016)*
|
|
10.43
|
Assured Guaranty Ltd. 2004 Long-Term Incentive Plan, as amended and restated as of May 7, 2009 and as amended through the Fourth Amendment*
|
|
10.44
|
Non-Qualified Stock Option Agreement under Assured Guaranty Ltd. 2004 Long-Term Incentive Plan to be used with employment agreement (Incorporated by reference to Exhibit 10.34 to Form 10-K for the year ended December 31, 2005)*
|
|
10.45
|
Non-Qualified Stock Option Agreement under Assured Guaranty Ltd. 2004 Long-Term Incentive Plan (Incorporated by reference to Exhibit 10.35 to Form 10-K for the year ended December 31, 2005)*
|
|
10.46
|
Non-Qualified Stock Option Agreement under Assured Guaranty Ltd. 2004 Long-Term Incentive Plan to be used with employment agreement (Incorporated by reference to Exhibit 10.66 to Form 10-K for the year ended December 31, 2007)*
|
|
10.47
|
Non-Qualified Stock Option Agreement under Assured Guaranty Ltd. 2004 Long-Term Incentive Plan (Incorporated by reference to Exhibit 10.67 to Form 10-K for the year ended December 31, 2007)*
|
265
|
|
|
|
Exhibit
Number
|
Description of Document
|
|
10.48
|
Non-Qualified Stock Option Agreement under Assured Guaranty Ltd. 2004 Long-Term Incentive Plan to be used with employment agreement (Incorporated by reference to Exhibit 10.71 to Form 10-K for the year ended December 31, 2008)*
|
|
10.49
|
Non-Qualified Stock Option Agreement for Outside Directors under Assured Guaranty Ltd. 2004 Long-Term Incentive Plan (Incorporated by reference to Exhibit 10.19 to Form 10-Q for the quarter ended June 30, 2009)*
|
|
10.50
|
2010 Form of Non-Qualified Stock Option Agreement under Assured Guaranty Ltd. 2004 Long-Term Incentive Plan to be used with employment agreement (Incorporated by reference to Exhibit 10.3 to Form 10-Q for the quarter ended March 31, 2010)*
|
|
10.51
|
2010 Form of Non-Qualified Stock Option Agreement under Assured Guaranty Ltd. 2004 Long-Term Incentive Plan for use without employment agreement (Incorporated by reference to Exhibit 10.4 to Form 10-Q for the quarter ended March 31, 2010)*
|
|
10.52
|
2012 Form of Executive Non-Qualified Stock Option Agreement under Assured Guaranty Ltd. 2004 Long-Term Incentive Plan (Incorporated by reference to Exhibit 10.7 to Form 10-Q for the quarter ended March 31, 2012)*
|
|
10.53
|
2013 Form of Executive Non-Qualified Stock Option Agreement under Assured Guaranty Ltd. 2004 Long-Term Incentive Plan (Incorporated by reference to Exhibit 10.1 to Form 10-Q for the quarter ended March 31, 2013)*
|
|
10.54
|
Restricted Stock Unit Agreement for Outside Directors under Assured Guaranty Ltd. 2004 Long Term Incentive Plan (Incorporated by reference to Exhibit 10.37 to Form 10-K for the year ended December 31, 2005)*
|
|
10.55
|
Restricted Stock Unit Agreement for Outside Directors under Assured Guaranty Ltd. 2004 Long-Term Incentive Plan (Incorporated by reference to Exhibit 10.1 to Form 10-Q for the quarter ended June 30, 2007)*
|
|
10.56
|
Restricted Stock Unit Agreement for Outside Directors under Assured Guaranty Ltd. 2004 Long-Term Incentive Plan (Incorporated by reference to Exhibit 10.1 to Form 10-Q for the quarter ended June 30, 2008)*
|
|
10.57
|
Form of amendment to Restricted Stock Unit Awards for Outside Directors (Incorporated by reference to Exhibit 10.3 to Form 10-Q for the quarter ended June 30, 2008)*
|
|
10.58
|
Restricted Stock Agreement for Outside Directors under Assured Guaranty Ltd. 2004 Long-Term Incentive Plan (Incorporated by reference to Exhibit 10.2 to Form 10-Q for the quarter ended June 30, 2008)*
|
|
10.59
|
2014 Restricted Stock Agreement for Outside Directors under Assured Guaranty Ltd. 2004 Long-Term Incentive Plan (Incorporated by reference to Exhibit 10.5 to Form 10-Q for the quarter ended June 30, 2014)*
|
|
10.60
|
Form of Restricted Stock Agreement for Outside Directors under Assured Guaranty Ltd. 2004 Long-Term Incentive Plan, as in effect for awards commencing in 2015 (Incorporated by reference to Exhibit 10.4 to Form 10-Q for the quarter ended March 31, 2015)*
|
|
10.61
|
2013 Form of Executive Restricted Stock Unit Agreement under Assured Guaranty Ltd. 2004 Long-Term Incentive Plan (Incorporated by reference to Exhibit 10.2 to Form 10-Q for the quarter ended March 31, 2013)*
|
|
10.62
|
2014 Form of Executive Restricted Stock Unit Agreement under Assured Guaranty Ltd. 2004 Long-Term Incentive Plan (Incorporated by reference to Exhibit 10.2 to Form 10-Q for the quarter ended June 30, 2014)*
|
|
10.63
|
Form of Executive Restricted Stock Unit Agreement under Assured Guaranty Ltd. 2004 Long-Term Incentive Plan, as in effect for awards commencing in 2015 (Incorporated by reference to Exhibit 10.3 to Form 10-Q for the quarter ended March 31, 2015)*
|
|
10.64
|
2013 Form of Executive Performance-Based Restricted Stock Unit Agreement under Assured Guaranty Ltd. 2004 Long-Term Incentive Plan (Incorporated by reference to Exhibit 10.3 to Form 10-Q for the quarter ended March 31, 2013)*
|
|
10.65
|
2014 Form of Executive Performance-Based Restricted Stock Unit Agreement under Assured Guaranty Ltd. 2004 Long-Term Incentive Plan (Incorporated by reference to Exhibit 10.3 to Form 10-Q for the quarter ended June 30, 2014)*
|
|
10.66
|
2015 Form of Executive Performance-Based Restricted Stock Unit Agreement under Assured Guaranty Ltd. 2004 Long-Term Incentive Plan (Incorporated by reference to Exhibit 10.2 to Form 10-Q for the quarter ended March 31, 2015)*
|
|
10.67
|
First Amendment to the Restricted Stock Unit Agreement for Outside Directors (Incorporated by reference to Exhibit 10.106 to Form 10-K for the year ended December 31, 2012)*
|
|
10.68
|
Assured Guaranty Ltd. Employee Stock Purchase Plan, as amended through the second amendment (Incorporated by reference to Exhibit 10.5 to Form 10-Q for the quarter ended March 31, 2013)*
|
|
10.69
|
Assured Guaranty Ltd. Performance Retention Plan (As Amended and Restated as of February 14, 2008 for Awards Granted during 2007) (Incorporated by reference to Exhibit 10.50 to Form 10-K for the year ended December 31, 2007)*
|
266
|
|
|
|
Exhibit
Number
|
Description of Document
|
|
10.70
|
Assured Guaranty Ltd. Performance Retention Plan (As Amended and Restated as of February 14, 2008) (Incorporated by reference to Exhibit 10.58 to Form 10-K for the year ended December 31, 2007)*
|
|
10.71
|
Terms of Performance Retention Award Four Year Installment Vesting Granted on February 9, 2012 for participants Subject to $1 million Limit (Incorporated by reference to Exhibit 10.10 to Form 10-Q for the quarter ended March 31, 2012)*
|
|
10.72
|
Terms of Performance Retention Award Four Year Installment Vesting Granted on February 7, 2013 for Participants Subject to $1 million Limit (Incorporated by reference to Exhibit 10.4 to Form 10-Q for the quarter ended March 31, 2013)*
|
|
10.73
|
Terms of Performance Retention Award Four Year Installment Vesting Granted on February 5, 2014 for Participants Subject to $1 million Limit (Incorporated by reference to Exhibit 10.4 to Form 10-Q for the quarter ended June 30, 2014)*
|
|
10.74
|
Assured Guaranty Ltd. Executive Severance Plan (Incorporated by reference to Exhibit 10.5 to Form 10-Q for the quarter ended March 31, 2012)*
|
|
10.75
|
Form of Acknowledgement Letter for Participants in Assured Guaranty Ltd. Executive Severance Plan (Incorporated by reference to Exhibit 10.11 to Form 10-Q for the quarter ended March 31, 2012)*
|
|
10.76
|
Assured Guaranty Ltd. Perquisite Policy (Incorporated by reference to Exhibit 10.6 to Form 10-Q for the quarter ended March 31, 2012)*
|
|
10.77
|
Form of Indemnification Agreement between the Company and its executive officers and directors (Incorporated by reference to Exhibit 10.42 to Form 10-K for the year ended December 31, 2005)*
|
|
10.78
|
Assured Guaranty Ltd. Executive Officer Recoupment Policy (Incorporated by reference to Exhibit 10.69 to Form 10-K for the year ended December 31, 2008)*
|
|
10.79
|
Form of Acknowledgement of Assured Guaranty Ltd. Executive Officer Recoupment Policy (Incorporated by reference to Exhibit 10.70 to Form 10-K for the year ended December 31, 2008)*
|
|
10.80
|
Amended and Restated Assured Guaranty Ltd. Executive Officer Recoupment Policy (amended and restated effective November 3, 2015) (Incorporated by reference to Exhibit 10.84 to Form 10-K for the year ended December 31, 2015)*
|
|
10.81
|
Form of Acknowledgement of Amended and Restated Assured Guaranty Ltd. Executive Officer Recoupment Policy (Incorporated by reference to Exhibit 10.85 to Form 10-K for the year ended December 31, 2015)*
|
|
10.82
|
Assured Guaranty Ltd. Supplemental Employee Retirement Plan, as amended and restated effective January 1, 2009 and as amended by the First, Second, Third, Fourth and Fifth Amendments (Incorporated by reference to Exhibit 10.1 to Form 10-Q for the quarter ended September 30, 2012)*
|
|
10.83
|
Assured Guaranty Corp. Supplemental Executive Retirement Plan as amended through the Third Amendment thereto (Incorporated by reference to Exhibit 4.5 to Form S-8 (#333-178625))*
|
|
10.84
|
Financial Security Assurance Holdings Ltd. 1989 Supplemental Executive Retirement Plan (amended and restated as of December 17, 2004) (Incorporated by reference to Exhibit 10.4 to Financial Security Assurance Holdings Ltd.'s Form 8-K filed on December 17, 2004)*
|
|
10.85
|
Amendment to the Financial Security Assurance Holdings Ltd. 1989 Supplemental Employee Retirement Plan (Incorporated by reference to Exhibit 10.29 to Form 10-Q for the quarter ended June 30, 2009)*
|
|
10.86
|
Financial Security Assurance Holdings Ltd. 2004 Supplemental Executive Retirement Plan, as amended on February 14, 2008 (Incorporated by reference to Exhibit 10.3 to Financial Security Assurance Holdings Ltd.'s Form 8-K filed on February 15, 2008)*
|
|
10.87
|
Separation Agreement, dated February 4, 2015, between Robert B. Mills and the Registrant (Incorporated by reference to Exhibit 10.91 to Form 10-K for the year ended December 31, 2014)*
|
|
10.88
|
Agreement and Plan of Merger, dated as of April 12, 2016, among Assured Guaranty Corp., Cultivate Merger Sub, Inc. and CIFG Holding Inc. (Incorporated by reference to Exhibit 10.2 to Form 10-Q for the quarter ended March 31, 2016)
|
|
10.89
|
Share Purchase Agreement relating to the sale and purchase of MBIA UK Insurance Limited, dated September 29, 2016, between MBIA UK (Holdings) Limited and Assured Guaranty Corp. (Incorporated by reference to Exhibit 10.1 to Form 10-Q for the quarter ended September 30, 2016)
|
|
10.90
|
Share Repurchase Agreement dated as of January 3, 2017 between the Company and the Chief Executive Officer*
|
|
10.91
|
Share Repurchase Agreement dated as of January 5, 2017 between the Company and the General Counsel*
|
|
10.92
|
2016 Form of Executive Restricted Stock Unit Agreement under Assured Guaranty Ltd. 2004 Long-Term Incentive Plan*
|
267
|
|
|
|
Exhibit
Number
|
Description of Document
|
|
10.93
|
2016 Form of Performance-Based Restricted Stock Unit Agreement under Assured Guaranty Ltd. 2004 Long-Term Incentive Plan*
|
|
12.1
|
Computation of Ratio of Earnings to Fixed Charges
|
|
21.1
|
Subsidiaries of the Registrant
|
|
23.1
|
Accountants Consent
|
|
31.1
|
Certification of CEO Pursuant to Exchange Act Rules 13A-14 and 15D-14, as Adopted Pursuant to Section 302 of the Sarbanes‑Oxley Act of 2002
|
|
31.2
|
Certification of CFO Pursuant to Exchange Act Rules 13A-14 and 15D-14, as Adopted Pursuant to Section 302 of the Sarbanes‑Oxley Act of 2002
|
|
32.1
|
Certification of CEO Pursuant to 18 U.S.C. Section 1350, as Adopted Pursuant to Section 906 of the Sarbanes‑ Oxley Act of 2002
|
|
32.2
|
Certification of CFO Pursuant to 18 U.S.C. Section 1350, as Adopted Pursuant to Section 906 of the Sarbanes‑ Oxley Act of 2002
|
|
101.1
|
The following financial information from Registrant's Annual Report on Form 10-K for the year ended December 31, 2016 formatted in XBRL (eXtensible Business Reporting Language) interactive data files pursuant to Rule 405 of Regulation S-T: (i) Consolidated Balance Sheets at December 31, 2016 and 2015; (ii) Consolidated Statements of Operations for the years ended December 31, 2016, 2015 and 2014; (iii) Consolidated Statements of Comprehensive Income for the years ended December 31, 2016, 2015 and 2014; (iv) Consolidated Statements of Shareholders' Equity for the years ended December 31, 2016, 2015 and 2014; (v) Consolidated Statements of Cash Flows for the years ended December 31, 2016, 2015 and 2014; and (vi) Notes to Consolidated Financial Statements.
|
|
*
|
Management contract or compensatory plan
|
268
SIGNATURES
Pursuant to the requirements of Section 13 or 15(d) of the Securities Exchange Act of 1934, the Registrant has caused this report to be signed on its behalf by the undersigned, thereunto duly authorized.
|
Assured Guaranty Ltd.
|
||
|
By:
|
/s/ Dominic J. Frederico
Name: Dominic J. Frederico
Title:
President and Chief Executive Officer
|
|
Date: February 24, 2017
Pursuant to the requirements of the Securities Exchange Act of 1934, this report has been signed below by the following persons on behalf of the Registrant and in the capacities and on the dates indicated.
|
Name
|
Position
|
Date
|
||||||||||||
|
/s/ Francisco L. Borges
Francisco L. Borges
|
Chairman of the Board; Director
|
February 24, 2017
|
||||||||||||
|
/s/ Dominic J. Frederico
Dominic J. Frederico
|
President and Chief Executive Officer; Director
|
February 24, 2017
|
||||||||||||
|
/s/ Robert A. Bailenson
Robert A. Bailenson
|
Chief Financial Officer (Principal Financial and Accounting Officer and Duly Authorized Officer)
|
February 24, 2017
|
||||||||||||
|
/s/ G. Lawrence Buhl
G. Lawrence Buhl
|
Director
|
February 24, 2017
|
||||||||||||
|
/s/ Bonnie L. Howard
Bonnie L. Howard
|
Director
|
February 24, 2017
|
||||||||||||
|
/s/ Thomas W. Jones
Thomas W. Jones
|
Director
|
February 24, 2017
|
||||||||||||
|
/s/ Patrick W. Kenny
Patrick W. Kenny
|
Director
|
February 24, 2017
|
||||||||||||
|
/s/ Alan J. Kreczko
Alan J. Kreczko
|
Director
|
February 24, 2017
|
||||||||||||
|
/s/ Simon W. Leathes
Simon W. Leathes
|
Director
|
February 24, 2017
|
||||||||||||
|
/s/ Michael T. O'Kane
Michael T. O'Kane
|
Director
|
February 24, 2017
|
||||||||||||
|
/s/ Yukiko Omura
Yukiko Omura
|
Director
|
February 24, 2017
|
||||||||||||
269
TABLE OF CONTENTS
Part IItem 1. BusinessItem 1A. Risk FactorsItem 1B. Unresolved Staff CommentsItem 2. PropertiesItem 3. Legal ProceedingsItem 4. Mine Safety DisclosuresPart IIItem 5. Market For Registrant's Common Equity, Related Stockholder Matters and Issuer Purchases Of Equity SecuritiesItem 6. Selected Financial DataItem 7. Management's Discussion and Analysis Of Financial Condition and Results Of OperationsNote 5 For Expected Loss To Be Paid,Note 6 For Financial Guaranty Insurance,Note 7 For Fair Value Methodologies For Credit Derivatives and Fg Vie Assets and Liabilities,Note 8 For Credit Derivatives, andNote 9 For Consolidated Fg ViesItem 7A. Quantitative and Qualitative Disclosures About Market RiskItem 8. Financial Statements and Supplementary DataNote 6, Contracts Accounted For As InsuranceNote 8, Contracts Accounted For As Credit DerivativesNote 13, Reinsurance and Other Monoline ExposuresItem 9. Changes in and Disagreements with Accountants on Accounting and Financial DisclosureItem 9A. Controls and ProceduresItem 9B. Other InformationPart IIIItem 10. Directors, Executive Officers and Corporate GovernanceItem 11. Executive CompensationItem 12. Security Ownership Of Certain Beneficial Owners and Management and Related Stockholder MattersItem 13. Certain Relationships and Related Transactions, and Director IndependenceItem 14. Principal Accounting Fees and ServicesPart IVItem 15. Exhibits, Financial Statement Schedules