UNITED STATES SECURITIES AND EXCHANGE COMMISSION
Washington, D.C. 20549
Form 20-F
|
¨
|
REGISTRATION STATEMENT PURSUANT TO SECTION 12(b) OR (g) OF THE SECURITIES EXCHANGE ACT OF 1934
|
|
|
|
OR
|
|
|
þ
|
ANNUAL REPORT PURSUANT TO SECTION 13 OR 15(d) OF THE SECURITIES EXCHANGE ACT OF 1934 FOR THE FISCAL YEAR ENDED ON DECEMBER 31, 2018
|
|
|
|
OR
|
|
|
¨
|
TRANSITION REPORT PURSUANT TO SECTION 13 OR 15(d) OF THE SECURITIES EXCHANGE ACT OF 1934
|
|
|
|
FOR THE TRANSITION PERIOD FROM
TO
________________
|
|
|
|
OR
|
|
|
¨
|
SHELL COMPANY REPORT PURSUANT TO SECTION 13 OR 15(d) OF THE SECURITIES EXCHANGE ACT OF 1934
|
|
|
|
Date of event requiring this shell company report
|
|
COMMISSION FILE NUMBER: 001-35052
Adecoagro S.A.
(Exact name of Registrant as specified in its charter)
N/A
(Translation of Registrant’s name into English)
Grand Duchy of Luxembourg
(Jurisdiction of incorporation or organization)
Vertigo Naos Building, 6, Rue Eugène Ruppert,
L - 2453 Luxembourg
Tel: +352.2644.9372
(Address of principal executive offices)
Aurelien Corrion
Vertigo Naos Building, 6, Rue Eugène Ruppert,
L - 2453 Luxembourg
Email:
aurelien.corrion@intertrustgroup.com
Tel: +352.26449.167
(Name, Telephone, E-Mail and/or Facsimile number and Address of Company Contact Person)
Securities registered or to be registered pursuant to Section 12(b) of the Act:
|
Title of Each Class
|
Name of Each Exchange on Which Registered
|
|
Common Shares
|
New York Stock Exchange
|
Securities registered or to be registered pursuant to Section 12(g) of the Act:
None
Securities for which there is a reporting obligation pursuant to Section 15(d) of the Act:
None
The number of outstanding shares of each of the issuer’s classes of capital stock
as of
December 31, 2018
:
116,555,699 Common Shares, par value $1.50 per share
Indicate by check mark if the registrant is a well-known seasoned issuer, as defined in Rule 405 of the Securities Act
Yes
þ
No
¨
If this report is an annual or transition report, indicate by check mark if the registrant is not required to file reports pursuant to Section 13 or 15(d) of the Securities Exchange Act of 1934.
Yes
¨
No
þ
Indicate by check mark whether the Registrant (1) has filed all reports required to be filed by Section 13 or 15(d) of the Securities Exchange Act of 1934 during the preceding 12 months (or for such shorter period that the Registrant was required to file such reports) and (2) has been subject to such filing requirements for the past 90 days.
Yes
þ
No
¨
Indicate by check mark whether the registrant has submitted electronically and posted on its corporate Web site, if any, every Interactive Data File required to be submitted and posted pursuant to Rule 405 of Regulation S-T (§232.405 of this chapter) during the preceding 12 months (or for such shorter period that the registrant was required to submit and post such files).
Yes
þ
No
¨
Indicate by check mark whether the registrant is a large accelerated filer, an accelerated filer, a non-accelerated filer, or an emerging growth company. See definition of “large accelerated filer," accelerated filer,” and "emerging growth company" in Rule 12b-2 of the Exchange Act. (Check one):
|
Large accelerated filer
¨
|
Accelerated filer
þ
|
Non-accelerated filer
¨
|
|
|
|
Emerging growth company
¨
|
If an emerging growth company that prepares its financial statements in accordance with U.S. GAAP, indicate by check mark if the registrant has elected not to use the extended transition period for complying with any new or revised financial accounting standards provided pursuant to Section 13(a) of the Exchange Act.
¨
Indicate by check mark which basis of accounting the registrant has used to prepare the financial statements included in this filing:
U.S. GAAP
¨
International Financial Reporting Standards as issued by the International Accounting Standards Board
þ
Other
¨
If “Other” has been checked in response to the previous question, indicate by check mark which financial statement item the Registrant has elected to follow:
Item 17
¨
Item 18
¨
If this is an annual report, indicate by check mark whether the registrant is a shell company (as defined in Rule 12b-2 of the Exchange Act). Yes
¨
No
þ
TABLE OF CONTENTS
|
|
|
||
|
|
|
||
|
|
|||
|
|
|
|
|
|
|
|
|
|
|
|
|
|
|
|
|
|||
|
|
|||
|
|
|||
|
|
|||
|
|
|
|
|
|
|
|||
|
|
|||
|
|
|||
|
|
|||
|
|
|
|
|
|
|
|
|
|
|
|
|||
|
|
|||
|
|
|||
|
|
|||
|
|
|||
|
|
|||
|
|
|||
|
|
|
|
|
|
|
|||
|
|
|||
|
|
|||
|
|
|||
|
|
|||
|
|
|
|
|
|
|
|||
|
|
|||
|
|
|||
i
|
|
|||
|
|
|||
|
|
|
|
|
|
|
|||
|
|
|||
|
|
|||
|
|
|||
|
|
|||
|
|
|||
|
|
|
|
|
|
|
|||
|
|
|||
|
|
|||
|
|
|||
|
|
|||
|
|
|||
|
|
|||
|
|
|||
|
|
|||
|
|
|
|
|
|
|
|
|
|
|
|
|||
|
|
|||
|
|
|||
|
|
|||
|
|
|
|
|
|
|
|
||
|
|
|
|
|
|
|
|
|
|
|
|
|
|
|
|
|
|
|
|
|
|
|
||
|
|
|
|
|
|
|
|||
|
|
|||
|
|
|||
|
|
|||
|
|
|||
|
|
|||
ii
iii
FORWARD-LOOKING STATEMENTS
This annual report contains forward-looking statements that are based on our current expectations, assumptions, estimates and projections about us and our industry. These forward-looking statements can be identified by words or phrases such as “anticipate,” “believe,” “continue,” “estimate,” “expect,” “intend,” “is/are likely to,” “may,” “plan,” “should,” “would,” or other similar expressions. The forward-looking statements included in this annual report relate to, among others:
|
•
|
our business prospects and future results of operations;
|
|
•
|
weather and other natural phenomena;
|
|
•
|
developments in, or changes to, the laws, regulations and governmental policies governing our business, including limitations on ownership of farmland by foreign entities in certain jurisdiction in which we operate, environmental laws and regulations;
|
|
•
|
the implementation of our business strategy;
|
|
•
|
our plans relating to acquisitions, joint ventures, strategic alliances or divestitures;
|
|
•
|
the implementation of our financing strategy and capital expenditure plan;
|
|
•
|
the maintenance of our relationships with customers;
|
|
•
|
the competitive nature of the industries in which we operate;
|
|
•
|
the cost and availability of financing;
|
|
•
|
future demand for the commodities we produce;
|
|
•
|
international prices for commodities;
|
|
•
|
the condition of our land holdings;
|
|
•
|
the development of the logistics and infrastructure for transportation of our products in the countries where we operate;
|
|
•
|
the performance of the South American and world economies;
|
|
•
|
the relative value of the Brazilian Real, the Argentine Peso, and the Uruguayan Peso compared to other currencies; and
|
|
•
|
the factors discussed under the section entitled “Risk Factors” in this annual report.
|
These forward-looking statements involve various risks and uncertainties. Although we believe that our expectations expressed in these forward-looking statements are reasonable, our expectations may turn out to be incorrect. Our actual results could be materially different from our expectations. In light of the risks and uncertainties described above, the estimates and forward-looking statements discussed in this annual report might not occur, and our future results and our performance may differ materially from those expressed in these forward-looking statements due to, including, but not limited to, the factors mentioned above. Because of these uncertainties, you should not make any investment decision based on these estimates and forward-looking statements.
The forward-looking statements made in this annual report relate only to events or information as of the date on which the statements are made. We undertake no obligation to update any forward-looking statements to reflect events or circumstances after the date on which the statements are made or to reflect the occurrence of unanticipated events.
iv
PRESENTATION OF FINANCIAL AND OTHER INFORMATION
Certain Defined Terms
In this annual report, unless otherwise specified or if the context so requires:
|
•
|
References to the terms “Adecoagro S.A.”, “Adecoagro”, “we”, “us”, “our”, “Company”; and “our company” refer to, Adecoagro S.A., a corporation organized under the form of a
société anonyme
under the laws of the Grand Duchy of Luxembourg, and its subsidiaries.
|
|
•
|
References to “IFH” and “IFH LP” mean the former International Farmland Holdings, LP, a limited partnership (previously IFH LP and International Farmland Holdings, LLC, or IFH LLC).
|
|
•
|
References to “Adecoagro LP” mean Adecoagro, LP SCS, a limited partnership organized under the form of a
société comandite simple
under the laws of the Grand Duchy of Luxembourg (previously Adecoagro LP and Adecoagro, LLC).
|
|
•
|
References to “$,” “US$,” “U.S. dollars” and “dollars” are to U.S. dollars.
|
|
•
|
References to “Argentine Pesos,” “Pesos” or “Ps.” are to Argentine Pesos, the official currency of Argentina.
|
|
•
|
References to “Brazilian Real,” “Real,” “Reais” or “R$” are to the Brazilian Real, the official currency of Brazil.
|
|
•
|
Unless stated otherwise, references to “sales” are to the consolidated sales of manufactured products and services rendered plus sales of agricultural produce and biological assets.
|
|
•
|
References to “IFRS” are International Financial Reporting Standards issued by the International Accounting Standards Board (“IASB”) and the interpretations of the International Financial Reporting Interpretations Committee (“IFRIC”), together “IFRS.”
|
Background
As part of a corporate reorganization (the “Reorganization”), Adecoagro, a Luxembourg corporation under the form of a société anonyme, was formed as a holding company for IFH for the purpose, among others, of facilitating the initial public offering (the “IPO”) of our common shares, completed on January 28, 2011. Before the IPO, Adecoagro had not engaged in any business or other activities except in connection with its formation and the Reorganization. For an additional discussion of the Reorganization, see “Item 4. Information on the Company—A. History and Development of the Company—History.”
During 2011, we contributed the net proceeds of the IPO to increase our interest in IFH from 98% to 98.64%. During 2012, we issued, in a series of transactions, 1,654,752 shares to certain limited partners of IFH in exchange for their residual interest in IFH, totaling 1.3595%, thereby increasing our interest in IFH to approximately 100%. During 2015 IFH merge into Adecoagro LP; consequently we own 100% of Adecoagro LP for further information please see "Item 4 - A. History and development of the Company - General Information.".
The consolidated financial statements as of
December 31, 2018
,
2017
and
2016
, and for the years then ended (hereinafter, the “Consolidated Financial Statements”) included in this annual report have been prepared in accordance with IFRS. All IFRS effective at the time of preparing the Consolidated Financial Statements have been applied.
Description of accounting policies changed during the period.
During 2018, we have adopted the revaluation model for our farmlands within property, plant and equipment. Previously, we valued all of these assets under the cost model. These amendments have resulted in an increase of property, plant and equipment of US$ 545 million as of December 31, 2018. This higher valuation resulted in an increase of the deferred tax liability of US$ 139 million. This change in accordance with IAS 16, is applied prospectively. The higher valuation, net of its tax effects, is reflected in the Shareholders' equity under the line item "Revaluation surplus".
Also we adopted the revaluation model for our investment property. The higher valuation resulted in an increase in retained earnings of US$ 45 million; an increase in investment property of US$ 40 million as of December 31, 2017, and an increase in deferred tax liability of US$ 12 million. This change was applied retrospectively, in accordance with IAS 8. Consequently, prior year figures have been recast,.
v
Financial reporting in a hyperinflation economy
IAS 29 “Financial Reporting in Hyperinflationary Economies” ("IAS 29") requires that the financial statements of entities whose functional currency is that of a hyperinflationary economy to be adjusted for the effects of changes in a suitable general price index and to be expressed in terms of the current unit of measurement at the closing date of the reporting period. Accordingly, the inflation produced from the date of acquisition or from the revaluation date, as applicable, must be computed in the non-monetary items.
In order to determine whether an economy is categorized as hyperinflationary under the terms of IAS 29, the accounting standard details a series of factors to be considered, including the existence of a cumulative inflation rate in three years that approximates or exceeds 100 %.
During 2018 Argentina experienced a significant increase in inflation, which exceeded the 100% three-year cumulative inflation rate. Also, the remaining indicators support the conclusion that Argentina should be considered a hyperinflationary economy for accounting purposes. As a result, there is sufficient evidence to conclude that Argentina is a hyperinflationary economy under the terms of IAS 29. Therefore, from July 1, 2018, we started applying IAS 29 in the financial reporting of our subsidiaries and associates with Argentine peso as functional currency. We will to continue to apply IAS 29 until such time as the cumulative three-year inflation rate is equal to or less than 70%.
(Please see Note 33 - Basis of preparation and presentations)
Financial statements of a foreign entity with a functional currency of a country that has a highly inflationary economy, are restated to reflect changes in the general price level or index in that country before translation into U.S. Dollars. In adjusting for hyperinflation, a general price index is applied to all non-monetary items in the financial statements (including equity) and the resulting gain or loss, which is the gain or loss on the entity's net monetary position, is recognized in the income statement. Monetary items in the closing statement of financial position are not adjusted. The Company treated all Argentine subsidiaries as a hyperinflationary economy as all of them have Argentine peso as functional currency. The results and financial position of all foreign entities with a functional currency of a country that has a highly inflationary economy are translated at closing rates after the restatement for changes in the general purchasing power Argentine peso.
The inflation adjustment on the initial balances was calculated by means of conversion factor derived from the Argentine price indexes published by the National Institute of Statistics and the year-over-year change in the index was 1.477.
The main procedures for the above-mentioned adjustment are as follows:
|
•
|
Monetary assets and liabilities which are carried at amounts current at the balance sheet date are not restated because they are already expressed in terms of the monetary unit current at the balance sheet date.
|
|
•
|
Non-monetary assets and liabilities which are not carried at amounts current at the balance sheet date, and components of shareholders' equity are adjusted by applying the relevant conversion factors.
|
|
•
|
All items in the income statement are restated by applying the relevant conversion factors.
|
|
•
|
The effect of inflation on the Company’s net monetary position is included in the income statement, in "Other financial results" (Note 9).
|
|
•
|
The ongoing application of the re-translation of comparative amounts to closing exchanges rates under IAS 21 and the hyperinflation adjustments required by IAS 29 will lead to an additional difference on top of the difference arising out of the adoption of hyperinflation accounting.
|
The comparative figures in the Consolidated Financial Statements presented in a stable currency are not adjusted for subsequent changes in the price level or exchange rates. This resulted in an initial difference, arising on the adoption of hyperinflation accounting, between the closing equity of the previous year and the opening equity of the current year. The Company recognized this initial difference directly in equity.
Segment reporting information
.
vi
The measurement principles for the Company’s segment reporting structure are based on the IFRS principles adopted in the interim financial statements through June 30, 2018. Since the adoption of IAS 29 on July 1, 2018, the measurement principles for the Company’s segment reporting structure are based on the IFRS principles adopted in these financial statements, with the exceptions disclose below.
Total segment assets and liabilities are measured in a manner consistent with that of the consolidated financial statements. These assets and liabilities are allocated based on the operations of the segment and the physical location of the asset.
Effective July 1, 2018, we applied IAS 29. (See Above "Financial reporting in a hyperinflation economy").
According to IAS 29, all Argentine peso-denominated non-monetary items in the statement of financial position are adjusted by applying a general price index from the date they were initially recognized to the end of the reporting period. Likewise, all Argentine peso-denominated items in the statement of income should be expressed in terms of the measuring unit current at the end of the reporting period. Consequently, income statement items should be adjusted by applying a general price index on a monthly basis from the dates they were initially recognized in the financial statements through the end of the reporting period. This process is called “re-measurement”.
Once the re-measurement process is completed, all Argentine peso denominated accounts are translated into U.S. Dollars, applying the guidelines in IAS 21 “The Effects of Changes in Foreign Exchange Rates”(“IAS 21”). IAS 21 requires that amounts be translated at the closing rate at the date of the most recent statement of financial position. . Accordingly, monthly results of operations in Argentine pesos, after adjustment for inflation pursuant to IAS 29, must then be converted into U.S. dollars at the closing exchange rate for such monthly reported period. This process is called “translation.”
The re-measurement and translation processes are applied on a monthly basis until year-end. Due to this process, the re-measured and translated results of operations for a given month are subject to change until year-end, affecting comparison and analysis.
Following the adoption of IAS 29 with respect to our Argentine operations, management revised the information reviewed by the chief operating decision maker ("CODM"). Accordingly, from July 1, 2018 the information provided to the CODM departs from the application of IAS 29 and IAS 21 re-measurement and translation processes by adjusting for inflation the segment results operations for each reporting period and translating them into the Company’s reporting currency using the reporting period average exchange rate. The translated amounts were not subsequently re-measured and translated in accordance with the IAS 29 and IAS 21 procedures outlined above. From January 1, 2018 through June 30, 2018, the Company’s segment results were still based on the IFRS measurement principles adopted until June 30, 2018.
In order to evaluate the economic performance of businesses on a monthly basis, results of operations in Argentina are based on monthly data that have been adjusted for inflation and converted into the average exchange rate of the U.S. Dollar each month. These figures are not subsequently readjusted and reconverted as described above under IAS 29 and IAS 21. It should be noted that this translation methodology for evaluating segment information is the same method as the one used by the Company to translate results of operation from its other subsidiaries from other countries that have not been designated hyperinflationary economies because it allows for a more accurate analysis of the economic performance of its business as a whole.
The Company's CODM believes that the exclusion of the re-measurement and translation processes from the segment reporting structure allows for a more useful presentation and facilitates period-to-period comparison and performance analysis.
IFRS 8 requires that segment information be reported on the basis of the internal reports that are regularly reviewed by the entity's CODM to evaluate the company’s operating results. The Company’s CODM does not evaluate monthly results of operation according to the presentation obtained from the application of IAS 29 and IAS 21 as described above because it is considered more useful and accurate that monthly results remain unchanged once translated.
Therefore, the measurement of reported figures in the segment presentation differ from the measurement of the figures reported in the statement of income in the manner described above.
Below is a reconciliation of Segment Information to the Statement of Income that clarifies the difference between the application of IAS 29 and IAS 21 in the Statement of Income and in the reported Segment Information.
vii
|
Crops
|
Rice
|
Dairy
|
||||||||||||||||||||||||
|
Total segment reporting
|
Adjustment
|
|
Total segment reporting
|
Adjustment
|
Total as per statement of income
|
Total segment reporting
|
Adjustment
|
Total as per statement of income
|
||||||||||||||||||
|
Sales of goods sold and services rendered
|
164,538
|
|
(9,120
|
)
|
155,418
|
|
100,013
|
|
(4,610
|
)
|
95,403
|
|
33,201
|
|
(3,491
|
)
|
29,710
|
|
||||||||
|
Cost of goods and services rendered
|
(165,988
|
)
|
9,052
|
|
(156,936
|
)
|
(75,739
|
)
|
766
|
|
(74,973
|
)
|
(31,488
|
)
|
3,361
|
|
(28,127
|
)
|
||||||||
|
Initial recognition and changes in fair value of biological assets and agricultural produce
|
36,422
|
|
(7,755
|
)
|
28,667
|
|
8,967
|
|
(4,842
|
)
|
4,125
|
|
7,295
|
|
(1,840
|
)
|
5,455
|
|
||||||||
|
Gain from changes in net realizable value of agricultural produce after harvest
|
2,704
|
|
(3,613
|
)
|
(909
|
)
|
—
|
|
—
|
|
—
|
|
—
|
|
—
|
|
—
|
|
||||||||
|
Margin on Manufacturing and Agricultural Activities Before Operating Expenses
|
37,676
|
|
(11,436
|
)
|
26,240
|
|
33,241
|
|
(8,686
|
)
|
24,555
|
|
9,008
|
|
(1,970
|
)
|
7,038
|
|
||||||||
|
General and administrative expenses
|
(4,239
|
)
|
37
|
|
(4,202
|
)
|
(5,070
|
)
|
(869
|
)
|
(5,939
|
)
|
(2,034
|
)
|
(246
|
)
|
(2,280
|
)
|
||||||||
|
Selling expenses
|
(5,921
|
)
|
474
|
|
(5,447
|
)
|
(15,465
|
)
|
1,375
|
|
(14,090
|
)
|
(983
|
)
|
41
|
|
(942
|
)
|
||||||||
|
Other operating income, net
|
5,422
|
|
1,741
|
|
7,163
|
|
275
|
|
(58
|
)
|
217
|
|
(1,055
|
)
|
58
|
|
(997
|
)
|
||||||||
|
Profit from Operations Before Financing and Taxation
|
32,938
|
|
(9,184
|
)
|
23,754
|
|
12,981
|
|
(8,238
|
)
|
4,743
|
|
4,936
|
|
(2,117
|
)
|
2,819
|
|
||||||||
|
Depreciation and amortization
|
(1,697
|
)
|
(329
|
)
|
(2,026
|
)
|
(5,846
|
)
|
5,840
|
|
(6
|
)
|
(2,253
|
)
|
(280
|
)
|
(2,533
|
)
|
||||||||
|
Net gain from Fair value adjustment of investment property
|
—
|
|
—
|
|
—
|
|
—
|
|
—
|
|
—
|
|
—
|
|
—
|
|
—
|
|
||||||||
|
All other segments
|
Corporate
|
Total
|
||||||||||||||||||||||||
|
Total segment reporting
|
Adjustment
|
Total as per statement of income
|
Total segment reporting
|
Adjustment
|
Total as per statement of income
|
Total segment reporting
|
Adjustment
|
Total as per statement of income
|
||||||||||||||||||
|
Sales of goods sold and services rendered
|
1,919
|
|
(149
|
)
|
1,770
|
|
—
|
|
—
|
|
—
|
|
810,609
|
|
(17,370
|
)
|
793,239
|
|
||||||||
|
Cost of goods and services rendered
|
(1,412
|
)
|
99
|
|
(1,313
|
)
|
—
|
|
—
|
|
—
|
|
(623,243
|
)
|
13,278
|
|
(609,965
|
)
|
||||||||
|
Initial recognition and changes in fair value of biological assets and agricultural produce
|
(806
|
)
|
(393
|
)
|
(1,199
|
)
|
—
|
|
—
|
|
—
|
|
31,025
|
|
(14,830
|
)
|
16,195
|
|
||||||||
|
Gain from changes in net realizable value of agricultural produce after harvest
|
—
|
|
—
|
|
—
|
|
—
|
|
—
|
|
—
|
|
2,704
|
|
(3,613
|
)
|
(909
|
)
|
||||||||
|
Margin on Manufacturing and Agricultural Activities Before Operating Expenses
|
(299
|
)
|
(443
|
)
|
(742
|
)
|
—
|
|
—
|
|
—
|
|
221,095
|
|
(22,535
|
)
|
198,560
|
|
||||||||
|
General and administrative expenses
|
(155
|
)
|
(9
|
)
|
(164
|
)
|
(19,626
|
)
|
1,433
|
|
(18,193
|
)
|
(56,426
|
)
|
346
|
|
(56,080
|
)
|
||||||||
|
Selling expenses
|
(165
|
)
|
16
|
|
(149
|
)
|
(178
|
)
|
33
|
|
(145
|
)
|
(92,154
|
)
|
1,939
|
|
(90,215
|
)
|
||||||||
|
Other operating income, net
|
10,668
|
|
2,728
|
|
13,396
|
|
(167
|
)
|
36
|
|
(131
|
)
|
99,727
|
|
4,505
|
|
104,232
|
|
||||||||
|
Profit from Operations Before Financing and Taxation
|
10,049
|
|
2,292
|
|
12,341
|
|
(19,971
|
)
|
1,502
|
|
(18,469
|
)
|
172,242
|
|
(15,745
|
)
|
156,497
|
|
||||||||
|
Depreciation and amortization
|
(171
|
)
|
(6
|
)
|
(177
|
)
|
—
|
|
—
|
|
—
|
|
(153,169
|
)
|
(1,085
|
)
|
(154,254
|
)
|
||||||||
|
Net gain from Fair value adjustment of investment property
|
10,680
|
|
2,729
|
|
13,409
|
|
—
|
|
—
|
|
—
|
|
10,680
|
|
2,729
|
|
13,409
|
|
||||||||
Sugar, Ethanol and Energy, and Land Transformation segments have not been reconciliated due to the lack of differences.
viii
Financial Statements
Non-IFRS Financial Measures
To supplement our Consolidated Financial Statements, which are prepared and presented in accordance with IFRS, we use the following non-IFRS financial measures in this annual report, which are based on the information that arose from segment information (Note 3 of our consolidated financial statements, the statement of financial position and the statement of cash flow).
|
•
|
Adjusted Consolidated EBITDA
|
|
•
|
Adjusted Segment EBITDA
|
|
•
|
Adjusted Consolidated EBIT
|
|
•
|
Adjusted Segment EBIT
|
|
•
|
Adjusted Free Cash Flow
|
|
•
|
Adjusted Free Cash Flow from Operations
|
|
•
|
Net Debt
|
|
•
|
Net Debt to Adjusted Consolidated EBITDA
|
In this section, we provide an explanation and a reconciliation of each of our non-IFRS financial measures to their most directly comparable IFRS measures. The presentation of these financial measures is not intended to be considered in isolation or as a substitute for, or superior to, financial information prepared and presented in accordance with IFRS.
We use non-IFRS measures to internally evaluate and analyze financial results. We believe these non-IFRS financial measures provide investors with useful supplemental information about the liquidity and financial performance of our business, enable comparison of financial results between periods where certain items may vary independent of business performance, and enable comparison of our financial results with other public companies, many of which present similar non-IFRS financial measures.
There are limitations associated with the use of non-IFRS financial measures as an analytical tool. In particular, many of the adjustments to our IFRS financial measures reflect the exclusion of items, such as depreciation and amortization, changes in fair value and the related income tax effects of the aforementioned exclusions, that are recurring and will be reflected in our financial results for the foreseeable future. In addition, these measures may be different from non-IFRS financial measures used by other companies, limiting their usefulness for comparison purposes.
Adjusted Consolidated EBITDA, Adjusted Segment EBITDA, Adjusted Consolidated EBIT and Adjusted Segment EBIT
We present Adjusted Consolidated EBITDA, Adjusted Segment EBITDA, Adjusted Consolidated EBIT and Adjusted Segment EBIT in this annual report as supplemental measures of performance of our company and of each operating segment, respectively, that are not required by, or presented in accordance with IFRS. Our Adjusted Consolidated EBITDA equals the sum of our Adjusted Segment EBITDA for each of our operating segments. We define “Adjusted Consolidated EBITDA” as (i) consolidated net profit (loss) for the year, as applicable, before interest expense, income taxes, depreciation and amortization, net gain from fair value adjustments of investment property land foreign exchange gains or losses, other net financial results; and (ii) adjusted by profit or loss from discontinued operations; (iii) adjusted by those items, that do not impact profit and loss, but are recorded directly in shareholders' equity, including (a) the gains or losses from disposals of non-controlling interests in subsidiaries whose main underlying asset is farmland, reflected under the line item: "Reserve from the sale of non-controlling interests in subsidiaries” and (b) the net increase in value of sold farmland, which has been recognized in either revaluation surplus of retained earnings; and (iv) net of the combined effect of the application of IAS 29 and IAS 21 from the Argentine operations included in profit from operations. (See Item 5. Operating and Financial Review and Prospects - A. Operating Results - Critical Accounting Policies and Estimates.")
ix
We define “Adjusted Segment EBITDA” for each of our operating segments as (i) the segment’s share of consolidated profit (loss) from operations before financing and taxation as per segment information for the year, as applicable, before depreciation and amortization; and (ii) adjusted by profit or loss from discontinued operations; (iii) adjusted by those items, that do not impact profit and loss, but are recorded directly in shareholders' equity, including (a) the gains or losses from disposals of non-controlling interests in subsidiaries whose main underlying asset is farmland, reflected under the line item: "Reserve from the sale of non-controlling interests in subsidiaries” and (b) the net increase in value of sold farmland, which has been recognized in either revaluation surplus of retained earnings.
We believe that Adjusted Consolidated EBITDA and Adjusted Segment EBITDA are important measures of operating performance for our company and each operating segment, respectively, because they allow investors and others to evaluate and compare our consolidated operating results and to evaluate and compare the operating performance of our segments, respectively, including our return on capital and operating efficiencies, from period to period by removing the impact of our capital structure (interest expense from our outstanding debt), asset base (depreciation and amortization), tax consequences (income taxes), foreign exchange gains or losses and other financial results. In addition, by including the gains or losses from disposals of non-controlling interests in subsidiaries whose main underlying asset is farmland, investors can also evaluate the full value and returns generated by our land transformation activities. Other companies may calculate Adjusted Consolidated EBITDA and Adjusted Segment EBITDA differently, and therefore our Adjusted Consolidated EBITDA and Adjusted Segment EBITDA may not be comparable to similarly titled measures used by other companies. Adjusted Consolidated EBITDA and Adjusted Segment EBITDA are not measures of financial performance under IFRS, and should not be considered in isolation or as an alternative to consolidated net profit (loss), cash flows from operating activities, segment’s profit from operations before financing and taxation and other measures determined in accordance with IFRS. Items excluded from Adjusted Consolidated EBITDA and Adjusted Segment EBITDA are significant and necessary components to the operations of our business, and, therefore, Adjusted Consolidated EBITDA and Adjusted Segment EBITDA should only be used as a supplemental measure of our company’s operating performance, and of each of our operating segments, respectively. We also believe Adjusted Consolidated EBITDA and Adjusted Segment EBITDA are useful for securities analysts, investors and others to evaluate the financial performance of our company and other companies in the agricultural industry. These non-IFRS measures should be considered in addition to, but not as a substitute for or superior to, the information contained in either our statements of income or segment information.
Our Adjusted Consolidated EBIT equals the sum of our Adjusted Segment EBITs for each of our operating segments. We define “Adjusted Consolidated EBIT” as (i) consolidated net profit (loss) for the year, as applicable, before interest expense, income taxes, foreign exchange gains or losses and other net financial results; and (ii) adjusted by profit or loss from discontinued operations ; (iii) adjusted by gains or losses from disposals of non controlling interests in subsidiaries whose main underlying asset farmland ; and (iv) net of the combined effect of the application of IAS 29 and IAS 21 from the Argentine operations included in profit from operations. We define “Adjusted Segment EBIT” for each of our operating segments as the segment’s share of (i) consolidated profit (loss) from operations before financing and taxation as per segment information for the year, as applicable; and (ii) adjusted by profit or loss from discontinued operations; and (iii) adjusted by those items, that do not impact profit and loss, but are recorded directly in shareholders' equity, including (a) the gains or losses from disposals of non-controlling interests in subsidiaries whose main underlying asset is farmland, reflected under the line item: "Reserve from the sale of non-controlling interests in subsidiaries”; (b) the net increase in value of sold farmland, which has been recognized in either revaluation surplus of retained earnings.
We believe that Adjusted Consolidated EBIT and Adjusted Segment EBIT are important measures of operating performance, for our company and each operating segment, respectively, because they allow investors and others to evaluate and compare our consolidated operating results and to evaluate and compare the operating performance of our segments, from period to period by including the impact of depreciable fixed assets and removing the impact of our capital structure (interest expense from our outstanding debt), tax consequences (income taxes), foreign exchange gains or losses and other financial results. In addition, by including the gains or losses from disposals of non-controlling interests in subsidiaries whose main underlying asset is farmland and also the sale of farmlands, investors can evaluate the full value and returns generated by our land transformation activities. Other companies may calculate Adjusted Consolidated EBIT and Adjusted Segment EBIT differently, and therefore our Adjusted Consolidated EBIT and Adjusted Segment EBIT may not be comparable to similarly titled measures used by other companies. Adjusted Consolidated EBIT and Adjusted Segment EBIT are not measures of financial performance under IFRS, and should not be considered in isolation or as an alternative to consolidated net profit (loss), cash flows from operating activities, segment’s profit from operations before financing and taxation and other measures determined in accordance with IFRS. Items excluded from Adjusted Consolidated EBIT and Adjusted Segment EBIT are significant and necessary components to the operations of our business, and, therefore, Adjusted Consolidated EBIT and Adjusted Segment EBIT should only be used as a supplemental measure of the operating performance of our company, and of each of our operating segments, respectively. We also believe Adjusted Consolidated EBIT and Adjusted Segment EBIT are useful for securities analysts, investors and others to evaluate the financial performance of our company and other companies in the agricultural industry.
x
Adjusted Free Cash Flow and Adjusted Free Cash Flow from Operations
We believe that the measures of Adjusted Free Cash Flow and Adjusted Free Cash Flow from Operations are important measures of liquidity that enable investors to draw important comparisons year to year of the amount of cash generated by the Company’s principal business and financing activities, which includes the cash generated from our land transformation activities, after paying for recurrent items, including interest, taxes and maintenance capital expenditures.
We define Adjusted Free Cash Flow as (i) net cash generated from operating activities net of the combined effect of the application of IAS 29 and IAS 21 from the Argentine operations, less (ii) net cash used in investing activities net of the combined effect of the application of IAS 29 and IAS 21, less (iii) interest paid, plus (iv) proceeds from the sale of non-controlling interest in farming subsidiaries. We define Adjusted Free Cash Flow from Operations as (i) net cash generated from operating activities net of the combined effect of the application of IAS 29 and IAS 21 less (ii) net cash used in investing activities net of the combined effect of the application of IAS 29 and IAS 21 , less (iii) interest paid, plus (iv) proceeds from the sale of non-controlling interest in subsidiaries; plus (v) expansion capital expenditures. (See "Item 3. Key Information--A Selected Financial Data." and "Item 5. Operating and Financial Review and Prospects -- A. Operating Results -- Critical Accounting Policies and Estimates"
Expansion capital expenditures is defined as the required investment to expand current production capacity including organic growth, joint ventures and acquisitions. We define maintenance capital expenditures as the necessary investments in order to maintain the current level of productivity both at an agricultural and industrial level. Proceeds from the sale of non-controlling interest in farming subsidiaries is a measure of the cash generated from our land transformation business that is included under cash from financing activities pursuant to IFRS.
We believe Adjusted Free Cash Flow is an important liquidity measure for the Company because it allows investors and others to evaluate and compare the amount of cash generated by the Company business and financing activities to undertake growth investments, to fund acquisitions, to reduce outstanding financial debt, and to provide a return to shareholders in the form of dividends and/or share repurchases, among other things.
We believe Adjusted Free Cash Flow from Operations is an additional important liquidity metric for the Company because it allows investors and others to evaluate and compare the total amount of cash generated by the Company’s business and financing activities after paying for recurrent items including interests, taxes and maintenance capital expenses. We believe this metric is relevant in evaluating the overall performance of our business.
Other companies may calculate Adjusted Free Cash Flow and Adjusted Free Cash Flow from Operations differently, and therefore our formulation may not be comparable to similarly titled measures used by other companies. Adjusted Free Cash Flow and Adjusted Free Cash Flow from Operations are not measures of liquidity under IFRS, and should not be considered in isolation or as an alternative to consolidated, cash flows from operating activities, net increase, (decrease) in cash and cash equivalents and other measures determined in accordance with IFRS.
Net Debt and Net Debt to Adjusted Consolidated EBITDA
Net debt is defined as the sum of non-current and current borrowings less cash and cash equivalents. This measure is widely used by management.
Management is consistently tracking our leverage position and our ability to repay and service our debt obligations over time. We have therefore set a leverage ratio target that is measured by net debt divided by Adjusted Consolidated EBITDA.
We believe that the ratio net debt to Adjusted Consolidated EBITDA provides useful information to investors because management uses it to manage our debt-equity ratio in order to promote access to capital markets and our ability to meet scheduled debt service obligations.
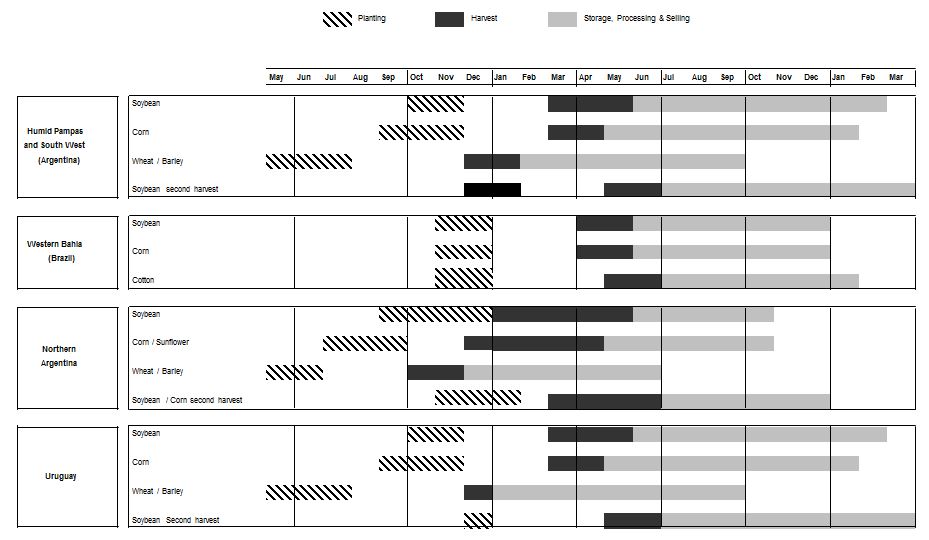
Fiscal Year and Harvest Year
Our fiscal year begins on January 1 and ends on December 31 of each year. However, our production is based on the harvest year for each of our crops and rice. A harvest year varies according to the crop or rice and to the climate in which it is grown. Due to the geographic diversity of our farms, the planting period for a given crop or rice may start earlier on one farm than on another, causing differences in their respective harvesting periods. The presentation of production volume (tons) and product area (hectares) in this annual report, in respect of the harvest years for each of our crops and rice, starts with the first day of the planting period at the first farm to start planting on that harvest year and continues to the last day of the harvesting period of the respective crop or rice on the last farm to finish harvesting that harvest year, as shown in the table below.
xi
Product area for cattle is presented on a harvest year basis given that land utilized for cattle operations is linked to our farming operations and use of farmland during a harvest year. Production volumes for dairy and cattle operations are presented on a fiscal year basis. On the other hand, production volumes and product area in our sugar, ethanol and energy business are presented on a fiscal year basis.
The financial results for all of our products are presented on a fiscal year basis.
Certain Weight Units and Measures in the Agricultural Business
Weight units and measures used in agriculture vary according to the crop and producing country. In order to permit comparability of our operating data with operating data from the international markets, the following table sets forth key weight units and measures used in the agriculture industry:
xii
|
Agricultural weight units and measures
|
|
|
|
1 metric ton
|
1,000 kg
|
1.102 U.S. (short) tons
|
|
1 cubic meter
|
1,000 liters
|
|
|
1 kilogram (kg)
|
2.20462 pounds
|
|
|
1 pound
|
0.45359 kg
|
|
|
1 acre
|
0.40469 hectares
|
|
|
1 hectare (ha)
|
2.47105 acres
|
|
|
Soybean and Wheat
|
|
|
|
1 bushel of soybean
|
60 pounds
|
27.2155 kg
|
|
1 bag of soybean
|
60 kg
|
2.20462 bushels
|
|
1 bushel/acre
|
67.25 kg/ha
|
|
|
1.00 U.S. dollar/bushel
|
2.2046 U.S. dollar/bag
|
|
|
Corn
|
|
|
|
1 bushel of corn
|
56 pounds
|
25.4012 kg
|
|
1 bag of corn
|
60 kg
|
2.36210 bushels
|
|
1 bushel/acre
|
62.77 kg/ha
|
|
|
1.00 U.S. dollar/bushel
|
2.3621 U.S. dollar/bag
|
|
|
Cotton
|
|
|
|
1 bale
|
480 pounds
|
217.72 kg
|
|
1 arroba
|
14.68 kg
|
|
|
Coffee
|
|
|
|
1 bag of coffee
|
60 kg
|
132.28 pounds
|
|
1.00 US$ cents/pound
|
1.3228 U.S. dollar/bag
|
|
|
Dairy
|
|
|
|
1 liter
|
0.264 gallons
|
2.273 pounds
|
|
1 gallon
|
3.785 liters
|
8.604 pounds
|
|
1 lbs
|
0.440 liters
|
0.116 gallons
|
|
1.00 U.S. dollar/liter
|
43.995 U.S. dollar/cwt
|
3.785 U.S. dollar/gallon
|
|
1.00 U.S. dollar/cwt
|
0.023 U.S. dollar/liter
|
0.086 U.S. dollar/gallon
|
|
1.00 U.S. dollar/gallon
|
0.264 U.S. dollar/liter
|
11.622 U.S. dollar/cwt
|
|
Sugar & Ethanol
|
|
|
|
1 kg of TRS equivalent
|
0.95 kg of VHP Sugar
|
0.59 liters of Hydrated Ethanol
|
|
1.00 US$ cents/pound
|
22.04 U.S. dollar/ton
|
|
Presentation of Information — Market Data and Forecasts
This annual report includes information provided by us and by third-party sources that we believe are reliable, including data related to the economic conditions in the markets in which we operate. Unless otherwise indicated, information in this annual report concerning economic conditions is based on publicly available information from third-party sources which we believe to be reasonable. The economic conditions in the markets in which we operate may deteriorate, and those economies may not grow at the rates projected by market data, or at all. The deterioration of the economic conditions in the markets in which we operate may have a material adverse effect on our business, results of operations and financial condition and the market price of our common shares.
Rounding
We have made rounding adjustments to reach some of the figures included in this annual report. Accordingly, numerical figures shown as totals in some tables may not be an arithmetic aggregation of the figures that preceded them.
xiii
Recent Developments
Acquisitions
In January 2019, the Company acquired, the remaining 50% of CHS Agro S.A. a joint venture between the Company and CHS Argentina S.A. After this acquisition, we own 100% of CHS Agro S.A. which has since been renamed as Girasoles del Plata S.A. The consideration for this operation was nominal.
In January 2019, the Company acquired 100% of Olam Alimentos S.A. whose principal asset is a peanuts processing facility located in the Province of Córdoba, (currently Mani del Plata S.A.) from Olam International Ltd. The consideration for this acquisition was 10 million to be disbursed in three installments, with the first payment made at closing.
In February 2019, the Company acquired two dairy facilities from SanCor Cooperativas Unidas Limitada ("SanCor"). The first facility is located in Chivilcoy, Province of Buenos Aires and processes fluid milk while the second facility is located in Morteros, Province of Cordoba and produces powder milk and cheese. Together with this facilities, we also acquired the brands Las Tres Niñas and Angelita. The total consideration for this operations was US$ 47 million.
Disposals
In January 2019, we completed the sale of Q065 Negócios Imobiliários Ltda., a wholly owned subsidiary , which main underlying asset is the Alto Alegre Farm, for a selling price of US$ 16.6 million (Reais 62.5 million), of which US$ 0.8 million (Reais 2.9 million) has already been collected and the balance will be collected in seven annual installments starting in June 2019. This transaction resulted in a gain of US$ 9.3 million, that will be shown in the line “Other operating income, net” under the line item “Gain from the sale of farmland and other assets".
xiv
Not applicable.
Not applicable.
A. SELECTED FINANCIAL DATA
The following selected statement of financial position data as of December 31, 2018, 2017 and 2016 and selected statement of income data and cash flow data for the three years in the period ended December 31, 2018, 2017 and 2016 have been derived from our Consolidated Financial Statements appearing elsewhere in this annual report on Form 20-F. The selected statement of financial position data as of December 31, 2015 and 2014 and for the years ended December 31, 2015 and 2014 has been derived from our annual consolidated financial statements, which have been retroactively recast to give effect to the change of measurement basis for our investment properties. These financial statements are not included in this annual report.
The Consolidated Financial Statements are prepared in accordance with IFRS. All IFRS effective at the time of preparing the Consolidated Financial Statements have been applied.
You should read the information contained in the following tables in conjunction with “Item 5. Operating and Financial Review and Prospects”, “Item 8. Financial Information”, “Item 18. Financial Statements” and the Consolidated Financial Statements and the accompanying notes included elsewhere in this annual report.
Description of the change in accounting policies during the period.
During 2018, we have adopted the revaluation model for our farmlands within property, plant and equipment. Previously, we valued all these group of assets under the cost model. These amendments have resulted in an increase of property, plant and equipment of US$ 545 million. This higher valuation resulted in an increase of the deferred tax liability of US$ 139 million. This change is applied prospectively in accordance with IAS 16. This net effect is reflected in shareholders' equity under the revaluation surplus.
We also adopted the revaluation model for our investment property. The higher valuation resulted in an increase in retained earnings of US$ 45 million. This change was applied retroactively, in accordance with IAS 8. Consequently, prior year figures have been recast.
Financial reporting in a hyperinflation economy
During 2018, Argentina experienced a significant increase in inflation, which exceeded the 100% three-year cumulative inflation rate. Also the remaining indicators do not contradict the conclusion that Argentina should be considered a hyperinflationary economy for accounting purposes. As a results, it is agreed that there is sufficient evidence to conclude that Argentina is a hyperinflationary economy under the terms of IAS 29. Therefore, from July 1, 2018, we started applying IAS 29 in the financial reporting of its subsidiaries and associates with the Argentine peso as functional currency. (See Presentation of Financial and Other Information - Financial reporting in a hyperinflation economy).
1
|
|
For the years ended December 31,
|
|||||||||||||
|
|
2018
|
2017 (*)
|
2016 (*)
|
2015 (*)
|
2014 (*)
|
|||||||||
|
|
(In thousands of $)
|
|||||||||||||
|
Statements of Income Data:
|
|
|
|
|
|
|
|
|
|
|
||||
|
Sale of goods and services rendered
|
793,239
|
|
933,178
|
|
869,235
|
|
674,314
|
|
722,966
|
|
||||
|
Cost of goods sold and services rendered
|
(609,965
|
)
|
(766,727
|
)
|
(678,581
|
)
|
(557,786
|
)
|
(605,325
|
)
|
||||
|
Initial recognition and changes in fair value of biological assets and agricultural produce
|
16,195
|
|
63,220
|
|
125,456
|
|
54,528
|
|
100,216
|
|
||||
|
Changes in net realizable value of agricultural produce after harvest
|
(909
|
)
|
8,852
|
|
(5,841
|
)
|
14,691
|
|
3,401
|
|
||||
|
Margin on manufacturing and agricultural activities before operating expenses
|
198,560
|
|
238,523
|
|
310,269
|
|
185,747
|
|
221,258
|
|
||||
|
General and administrative expenses
|
(56,080
|
)
|
(57,299
|
)
|
(50,750
|
)
|
(48,425
|
)
|
(52,695
|
)
|
||||
|
Selling expenses
|
(90,215
|
)
|
(95,399
|
)
|
(80,673
|
)
|
(70,268
|
)
|
(78,864
|
)
|
||||
|
Other operating income, net
|
104,232
|
|
43,763
|
|
5,752
|
|
52,964
|
|
16,513
|
|
||||
|
Share of loss of joint ventures
|
—
|
|
—
|
|
—
|
|
(2,685
|
)
|
(924
|
)
|
||||
|
Profit from operations before financing and taxation
|
156,497
|
|
129,588
|
|
184,598
|
|
117,333
|
|
105,288
|
|
||||
|
Finance income
|
8,581
|
|
11,744
|
|
7,957
|
|
9,150
|
|
7,291
|
|
||||
|
Finance costs
|
(271,263
|
)
|
(131,349
|
)
|
(165,380
|
)
|
(116,890
|
)
|
(86,472
|
)
|
||||
|
Other financial results - Net gain of inflation effects on the monetary items
|
81,928
|
|
—
|
|
—
|
|
—
|
|
—
|
|
||||
|
Financial results, net
|
(180,754
|
)
|
(119,605
|
)
|
(157,423
|
)
|
(107,740
|
)
|
(79,181
|
)
|
||||
|
(Loss) / Profit before income tax
|
(24,257
|
)
|
9,983
|
|
27,175
|
|
9,593
|
|
26,107
|
|
||||
|
Income tax benefit / (expense)
|
1,024
|
|
4,992
|
|
(12,899
|
)
|
2,479
|
|
(11,669
|
)
|
||||
|
(Loss) / Profit for the year
|
(23,233
|
)
|
14,975
|
|
14,276
|
|
12,072
|
|
14,438
|
|
||||
|
Attributable to:
|
|
|
|
|
|
|
|
|
||||||
|
Equity holders of the parent
|
(24,622
|
)
|
13,198
|
|
11,568
|
|
10,830
|
|
14,518
|
|
||||
|
Non-controlling interest
|
1,389
|
|
1,777
|
|
2,708
|
|
1,242
|
|
(80
|
)
|
||||
|
|
|
|
|
|
|
|
|
|||||||
|
(Loss) / earnings per share from operations attributable to the equity holders of the parent during the year:
|
|
|
|
|
|
|
|
|
||||||
|
Basic (loss) / earnings per share
|
(0.211
|
)
|
0.109
|
|
0.095
|
|
0.090
|
|
0.120
|
|
||||
|
Diluted (loss) / earnings per share
|
(0.211
|
)
|
0.108
|
|
0.094
|
|
0.089
|
|
0.119
|
|
||||
(*) Prior periods have been adjusted to reflect the Company's change in accounting policy for investment properties.
2
|
|
For the Year Ended December 31,
|
|||||||||||||
|
|
2018
|
2017 (*)
|
2016 (*)
|
2015 (*)
|
2014 (*)
|
|||||||||
|
Cash Flow Data:
|
|
|
|
|
|
|
|
|
|
|
||||
|
Net cash generated from operating activities (a)
|
218,513
|
|
237,105
|
|
255,401
|
|
145,186
|
|
120,151
|
|
||||
|
Net cash used in investing activities (b)
|
(174,922
|
)
|
(188,335
|
)
|
(122,014
|
)
|
(125,051
|
)
|
(300,472
|
)
|
||||
|
Net cash generated from financing activities (c)
|
(20,854
|
)
|
70194
|
|
(181,682
|
)
|
92,413
|
|
73,289
|
|
||||
|
(a) It includes 7,598 of the combined effect of the application of IAS 29 and IAS 21 for the Argentine subsidiaries.
|
||||||||||||||
|
(b) It includes 4,122 of the combined effect of the application of IAS 29 and IAS 21 for the Argentine subsidiaries.
|
||||||||||||||
|
(c) It includes (8,231) of the combined effect of the application of IAS 29 and IAS 21 for the Argentine subsidiaries.
|
||||||||||||||
|
Other Financial Data:
|
|
|
|
|
|
|
|
|
||||||
|
Adjusted Segment EBITDA (unaudited)
(1)
|
|
|
|
|
|
|
|
|
||||||
|
Crops
|
34,635
|
|
25,678
|
|
27,462
|
|
33,211
|
|
36,671
|
|
||||
|
Rice
|
18,827
|
|
12,179
|
|
11,698
|
|
6,274
|
|
14,198
|
|
||||
|
Dairy
|
7,189
|
|
12,243
|
|
5,717
|
|
6,356
|
|
9,663
|
|
||||
|
All Other segments
|
(460
|
)
|
556
|
|
9,085
|
|
677
|
|
686
|
|
||||
|
Farming subtotal
|
60,191
|
|
50,656
|
|
53,962
|
|
46,518
|
|
61,218
|
|
||||
|
Ethanol, sugar and energy
|
238,284
|
|
247,301
|
|
265,044
|
|
167,180
|
|
200,441
|
|
||||
|
Land transformation
|
36,227
|
|
—
|
|
—
|
|
23,980
|
|
25,508
|
|
||||
|
Corporate
|
(19,971
|
)
|
(21,664
|
)
|
(20,957
|
)
|
(21,776
|
)
|
(23,233
|
)
|
||||
|
Adjusted Consolidated EBITDA (unaudited)
(1)
|
314,731
|
|
276,293
|
|
298,049
|
|
215,902
|
|
263,934
|
|
||||
________________________________________________________________________________________________
|
(1)
|
See “Presentation of Financial and Other Information” for the definitions of Adjusted Segment EBITDA and Adjusted Consolidated EBITDA and the reconciliation in the table below.
|
|
|
As of December 31,
|
|||||||||||||
|
|
2018
|
2017 (*)
|
2016 (*)
|
2015 (*)
|
2014 (*)
|
|||||||||
|
|
(In thousands of $)
|
|||||||||||||
|
Statement of Financial Position Data:
|
|
|
|
|
|
|
|
|
|
|
||||
|
Biological assets
|
105,387
|
|
167,994
|
|
145,404
|
|
111,818
|
|
124,736
|
|
||||
|
Inventories
|
128,102
|
|
108,919
|
|
111,754
|
|
85,286
|
|
117,106
|
|
||||
|
Property, plant and equipment, net
|
1,480,439
|
|
831,377
|
|
814,867
|
|
696,889
|
|
991,581
|
|
||||
|
Total assets
|
2,277,372
|
|
1,645,089
|
|
1,496,397
|
|
1,392,124
|
|
1,676,947
|
|
||||
|
Non-current borrowings
|
718,484
|
|
663,060
|
|
430,304
|
|
483,651
|
|
491,324
|
|
||||
|
Total borrowings
|
862,116
|
|
817,958
|
|
635,396
|
|
723,339
|
|
698,506
|
|
||||
|
Share Capital
|
183,573
|
|
183,573
|
|
183,573
|
|
183,573
|
|
183,573
|
|
||||
|
Equity attributable to equity holders of the parent
|
1,063,636
|
|
673,880
|
|
700,334
|
|
556,814
|
|
800,421
|
|
||||
|
Non-controlling interest
|
44,509
|
|
9,139
|
|
11,970
|
|
7,335
|
|
7,589
|
|
||||
|
Number of shares (including treasury shares)
|
122,382
|
|
122,382
|
|
122,382
|
|
122,382
|
|
122,382
|
|
||||
(*) Prior periods have been adjusted to reflect the Company's change in accounting policy for investment properties.
The following tables show a reconciliation of Adjusted Segment EBITDA to our segments’ profit / (loss) from operations before financing and taxation, the most directly comparable IFRS financial measure, and a reconciliation of Adjusted Consolidated EBITDA to our net profit (loss) for the year, the most directly comparable IFRS financial measure.
3
|
|
For the year ended December 31, 2018
|
|||||||||||||||||||||||||
|
|
Crops
|
Rice
|
Dairy
|
All other
segments
|
Farming
Subtotal
|
Sugar,
Ethanol
and
Energy
|
Land
Trans-
formation
|
Corporate
|
Total
|
|||||||||||||||||
|
|
(In thousands of $)
|
|||||||||||||||||||||||||
|
Adjusted Segment EBITDA
(unaudited)
|
||||||||||||||||||||||||||
|
Profit/(Loss) from
Operations Before Financing and Taxation as per Segment Information
|
32,938
|
|
12,981
|
|
4,936
|
|
10,049
|
|
60,904
|
|
95,082
|
|
36,227
|
|
(19,971
|
)
|
172,242
|
|
||||||||
|
Net gain from Fair value adjustment of investment property as per Segment Information
|
—
|
|
—
|
|
—
|
|
(10,680
|
)
|
(10,680
|
)
|
—
|
|
—
|
|
—
|
|
(10,680
|
)
|
||||||||
|
Adjusted Segment EBIT (unaudited)
(1)
|
32,938
|
|
12,981
|
|
4,936
|
|
(631
|
)
|
50,224
|
|
|
95,082
|
|
36,227
|
|
(19,971
|
)
|
161,562
|
|
|||||||
|
Depreciation and amortization as per Segment Information
|
1,697
|
|
5,846
|
|
2,253
|
|
171
|
|
9,967
|
|
143,202
|
|
—
|
|
—
|
|
153,169
|
|
||||||||
|
Adjusted Segment EBITDA (unaudited)
(1)
|
34,635
|
|
18,827
|
|
7,189
|
|
(460
|
)
|
60,191
|
|
238,284
|
|
36,227
|
|
(19,971
|
)
|
314,731
|
|
||||||||
|
Reconciliation to Profit
|
|
|
|
|
|
|
|
|
|
|
|
|
|
|
|
|
||||||||||
|
Profit for the year
|
|
|
|
|
|
|
|
|
|
|
|
|
|
|
|
|
(23,233
|
)
|
||||||||
|
Income tax (benefit)
|
|
|
|
|
|
|
|
|
|
|
|
|
|
|
|
|
(1,024
|
)
|
||||||||
|
Interest expense, net
|
|
|
|
|
|
|
|
|
|
|
|
|
|
|
|
|
43,662
|
|
||||||||
|
Foreign exchange, net
|
|
|
|
|
|
|
|
|
|
|
|
|
|
|
|
|
183,195
|
|
||||||||
|
Other financial results - Net gain of inflation effects on the monetary items
|
(81,928
|
)
|
||||||||||||||||||||||||
|
Other financial results, net
|
|
|
|
|
|
|
|
|
|
|
|
|
|
|
|
|
35,825
|
|
||||||||
|
Combined effects of IAS 29 and IAS 21 of the Argentine subsidiaries of Profit from operations
|
15,745
|
|
||||||||||||||||||||||||
|
Net gain from Fair value adjustment of investment property as per Segment Information
|
(10,680
|
)
|
||||||||||||||||||||||||
|
Adjusted Consolidated EBIT (unaudited)
(1)
|
|
|
|
|
|
|
|
|
|
|
|
|
|
|
|
|
161,562
|
|
||||||||
|
Depreciation and amortization as per Segment Information
|
|
|
|
|
|
|
|
|
|
|
|
|
|
|
|
|
153,169
|
|
||||||||
|
Adjusted Consolidated EBITDA (unaudited)
(1)
|
|
|
|
|
|
|
|
|
|
|
|
|
|
|
|
|
314,731
|
|
||||||||
|
(1)
|
See “Presentation of Financial and Other Information” for the definitions of Adjusted Segment EBIT, Adjusted Consolidated EBIT, Adjusted Segment EBITDA and Adjusted Consolidated EBITDA.
|
4
|
|
For the year ended December 31, 2017
|
|||||||||||||||||||||||||
|
|
Crops
|
Rice
|
Dairy
|
All other
segments
|
Farming
Subtotal
|
Sugar,
Ethanol
and
Energy
|
Land
Trans-
formation
|
Corporate
|
Total
|
|||||||||||||||||
|
|
(In thousands of $)
|
|||||||||||||||||||||||||
|
Adjusted Segment EBITDA
(unaudited)
|
|
|
|
|
|
|
|
|
|
|
|
|
|
|
|
|
|
|
||||||||
|
Profit/(Loss) from
Operations Before Financing and Taxation
|
24,167
|
|
8,328
|
|
11,206
|
|
4,699
|
|
48,400
|
|
102,852
|
|
—
|
|
(21,664
|
)
|
129,588
|
|
||||||||
|
Net gain from Fair value adjustment of investment property
|
—
|
|
—
|
|
—
|
|
(4,302
|
)
|
(4,302
|
)
|
—
|
|
—
|
|
—
|
|
(4,302
|
)
|
||||||||
|
Adjusted Segment EBIT (unaudited)
(1)
|
24,167
|
|
8,328
|
|
11,206
|
|
397
|
|
44,098
|
|
102,852
|
|
—
|
|
(21,664
|
)
|
125,286
|
|
||||||||
|
Depreciation and amortization
|
1,511
|
|
3,851
|
|
1,037
|
|
159
|
|
6,558
|
|
144,449
|
|
—
|
|
—
|
|
151,007
|
|
||||||||
|
Adjusted Segment EBITDA (unaudited)
(1)
|
25,678
|
|
12,179
|
|
12,243
|
|
556
|
|
50,656
|
|
247,301
|
|
—
|
|
(21,664
|
)
|
276,293
|
|
||||||||
|
Reconciliation to Profit
|
|
|
|
|
|
|
|
|
|
|
|
|
|
|
|
|
||||||||||
|
Profit for the year
|
|
|
|
|
|
|
|
|
|
|
|
|
|
|
|
|
14,975
|
|
||||||||
|
Income tax expense
|
|
|
|
|
|
|
|
|
|
|
|
|
|
|
|
|
(4,992
|
)
|
||||||||
|
Interest expense, net
|
|
|
|
|
|
|
|
|
|
|
|
|
|
|
|
|
41,078
|
|
||||||||
|
Foreign exchange, net
|
|
|
|
|
|
|
|
|
|
|
|
|
|
|
|
|
38,708
|
|
||||||||
|
Other financial results, net
|
|
|
|
|
|
|
|
|
|
|
|
|
|
|
|
|
39,819
|
|
||||||||
|
Net gain from Fair value adjustment of investment property
|
(4,302
|
)
|
||||||||||||||||||||||||
|
Adjusted Consolidated EBIT (unaudited)
(1)
|
|
|
|
|
|
|
|
|
|
|
|
|
|
|
|
|
125,286
|
|
||||||||
|
Depreciation and amortization
|
|
|
|
|
|
|
|
|
|
|
|
|
|
|
|
|
151,007
|
|
||||||||
|
Adjusted Consolidated EBITDA (unaudited)
(1)
|
|
|
|
|
|
|
|
|
|
|
|
|
|
|
|
|
276,293
|
|
||||||||
|
(1)
|
See “Presentation of Financial and Other Information” for the definitions of Adjusted Segment EBIT, Adjusted Consolidated EBIT, Adjusted Segment EBITDA and Adjusted Consolidated EBITDA.
|
5
|
|
For the year ended December 31, 2016
|
|||||||||||||||||||||||||
|
|
Crops
|
Rice
|
Dairy
|
All other
segments
|
Farming
Subtotal
|
Sugar,
Ethanol
and
Energy
|
Land
Trans-
formation
|
Corporate
|
Total
|
|||||||||||||||||
|
|
(In thousands of $)
|
|||||||||||||||||||||||||
|
Adjusted Segment EBITDA
(unaudited)
|
|
|
|
|
|
|
|
|
|
|
|
|
|
|
|
|
|
|
||||||||
|
Profit/(Loss) from
Operations Before Financing and Taxation
|
26,093
|
|
8,932
|
|
4,753
|
|
22,942
|
|
62,720
|
|
142,835
|
|
—
|
|
(20,957
|
)
|
184,598
|
|
||||||||
|
Net gain from fair value adjustment of investment property
|
—
|
|
—
|
|
—
|
|
(14,049
|
)
|
(14,049
|
)
|
—
|
|
—
|
|
—
|
|
(14,049
|
)
|
||||||||
|
Adjusted Segment EBIT (unaudited)
(1)
|
26,093
|
|
8,932
|
|
4,753
|
|
8,893
|
|
48,671
|
|
142,835
|
|
—
|
|
|
(20,957
|
)
|
170,549
|
|
|||||||
|
Depreciation and amortization
|
1,369
|
|
2,766
|
|
964
|
|
192
|
|
5,291
|
|
122,209
|
|
—
|
|
—
|
|
127,500
|
|
||||||||
|
Adjusted Segment EBITDA (unaudited)
(1)
|
27,462
|
|
11,698
|
|
5,717
|
|
9,085
|
|
53,962
|
|
265,044
|
|
—
|
|
(20,957
|
)
|
298,049
|
|
||||||||
|
Reconciliation to Profit
|
|
|
|
|
|
|
|
|
|
|
|
|
|
|
|
|
||||||||||
|
Profit for the year
|
|
|
|
|
|
|
|
|
|
|
|
|
|
|
|
|
14,276
|
|
||||||||
|
Income tax expense
|
|
|
|
|
|
|
|
|
|
|
|
|
|
|
|
|
12,899
|
|
||||||||
|
Interest expense, net
|
|
|
|
|
|
|
|
|
|
|
|
|
|
|
|
|
40,527
|
|
||||||||
|
Foreign exchange, net
|
|
|
|
|
|
|
|
|
|
|
|
|
|
|
|
|
19,062
|
|
||||||||
|
Other financial results, net
|
|
|
|
|
|
|
|
|
|
|
|
|
|
|
|
|
97,834
|
|
||||||||
|
Net gain from fair value adjustment of investment property
|
|
|
|
|
|
|
|
|
|
|
|
|
|
|
|
|
(14,049
|
)
|
||||||||
|
Adjusted Consolidated EBIT (unaudited)
(1)
|
|
|
|
|
|
|
|
|
|
|
|
|
|
|
|
|
170,549
|
|
||||||||
|
Depreciation and amortization
|
|
|
|
|
|
|
|
|
|
|
|
|
|
|
|
|
127,500
|
|
||||||||
|
Adjusted Consolidated EBITDA (unaudited)
(1)
|
|
|
|
|
|
|
|
|
|
|
|
|
|
|
|
|
298,049
|
|
||||||||
|
(1)
|
See “Presentation of Financial and Other Information” for the definitions of Adjusted Segment EBIT, Adjusted Consolidated EBIT, Adjusted Segment EBITDA and Adjusted Consolidated EBITDA.
|
6
|
|
For the year ended December 31, 2015 (*)
|
|||||||||||||||||||||||||
|
|
Crops
|
Rice
|
Dairy
|
All other
segment
|
Farming
Subtotal
|
Sugar,
Ethanol
and
Energy
|
Land
Trans-
formation
|
Corporate
|
Total
|
|||||||||||||||||
|
|
(In thousands of $)
|
|||||||||||||||||||||||||
|
Adjusted Segment EBITDA
(unaudited)
|
|
|
|
|
|
|
|
|
|
|
|
|
|
|
|
|
|
|
||||||||
|
Profit/(Loss) from
Operations Before Financing and Taxation
|
30,784
|
|
3,287
|
|
4,900
|
|
22,290
|
|
61,270
|
|
69,925
|
|
7,914
|
|
(21,776
|
)
|
117,333
|
|
||||||||
|
Reserve from the sale of non-controlling interest in subsidiaries)
(2)
|
—
|
|
—
|
|
—
|
|
—
|
|
—
|
|
—
|
|
16,066
|
|
—
|
|
16,066
|
|
||||||||
|
Net gain from fair value adjustment of investment property
|
—
|
|
—
|
|
—
|
|
(21,898
|
)
|
(21,898
|
)
|
—
|
|
—
|
|
—
|
|
(21,898
|
)
|
||||||||
|
Adjusted Segment EBIT (unaudited)
(1)
|
30,784
|
|
3,287
|
|
4,900
|
|
392
|
|
39,372
|
|
69,925
|
|
23,980
|
|
|
(21,776
|
)
|
111,501
|
|
|||||||
|
Depreciation and amortization
|
2,427
|
|
2,987
|
|
1,456
|
|
276
|
|
7,146
|
|
97,255
|
|
—
|
|
—
|
|
104,401
|
|
||||||||
|
Adjusted Segment EBITDA (unaudited)
(1)
|
33,211
|
|
6,274
|
|
6,356
|
|
668
|
|
46,518
|
|
167,180
|
|
23,980
|
|
(21,776
|
)
|
215,902
|
|
||||||||
|
Reconciliation to Profit
|
||||||||||||||||||||||||||
|
Profit for the year
|
|
|
|
|
|
|
|
|
|
|
|
|
|
|
|
|
12,072
|
|
||||||||
|
Income tax (benefit)
|
|
|
|
|
|
|
|
|
|
|
|
|
|
|
|
|
(2,479
|
)
|
||||||||
|
Interest expense, net
|
|
|
|
|
|
|
|
|
|
|
|
|
|
|
|
|
49,491
|
|
||||||||
|
Foreign exchange, net
|
|
|
|
|
|
|
|
|
|
|
|
|
|
|
|
|
23,423
|
|
||||||||
|
Other financial results, net
|
|
|
|
|
|
|
|
|
|
|
|
|
|
|
|
|
34,826
|
|
||||||||
|
Reserve from the sale of non-controlling interest in subsidiaries)
|
|
|
|
|
|
|
|
|
|
|
|
|
|
|
|
|
16,066
|
|
||||||||
|
Net gain from fair value adjustment of investment property
|
(21,898
|
)
|
||||||||||||||||||||||||
|
Adjusted Consolidated EBIT (unaudited)
(1)
|
|
|
|
|
|
|
|
|
|
|
|
|
|
|
|
|
111,501
|
|
||||||||
|
Depreciation and amortization
|
|
|
|
|
|
|
|
|
|
|
|
|
|
|
|
|
104,401
|
|
||||||||
|
Adjusted Consolidated EBITDA (unaudited)
(1)
|
|
|
|
|
|
|
|
|
|
|
|
|
|
|
|
|
215,902
|
|
||||||||
|
(1)
|
See “Presentation of Financial and Other Information” for the definitions of Adjusted Segment EBIT, Adjusted Consolidated EBIT, Adjusted Segment EBITDA and Adjusted Consolidated EBITDA.
|
|
(2)
|
This corresponds to an equity line item in our consolidated statements of financial position. See “Presentation of Financial and Other Information” for the definitions of Adjusted Segment EBIT, Adjusted Consolidated EBIT, Adjusted Segment EBITDA and Adjusted Consolidated EBITDA.
|
7
|
|
For the year ended December 31, 2014 (*)
|
|||||||||||||||||||||||||
|
|
Crops
|
Rice
|
Dairy
|
All other
segments
|
Farming
Subtotal
|
Sugar,
Ethanol
and
Energy
|
Land
Trans-
formation
|
Corporate
|
Total
|
|||||||||||||||||
|
|
(In thousands of $)
|
|||||||||||||||||||||||||
|
Adjusted Segment EBITDA
(unaudited)
|
|
|
|
|
|
|
|
|
|
|
|
|
|
|
|
|
|
|
||||||||
|
Profit/(Loss) from
Operations Before Financing and Taxation
|
34,745
|
|
10,937
|
|
8,112
|
|
4,824
|
|
58,618
|
|
69,903
|
|
—
|
|
(23,233
|
)
|
105,288
|
|
||||||||
|
Reserve from the sale of non-controlling interests in subsidiaries (2)
|
—
|
|
—
|
|
—
|
|
—
|
|
—
|
|
—
|
|
25,508
|
|
—
|
|
25,508
|
|
||||||||
|
Net gain from fair value adjustment of investment property
|
—
|
|
—
|
|
—
|
|
(4,536
|
)
|
(4,536
|
)
|
—
|
|
—
|
|
—
|
|
(4,536
|
)
|
||||||||
|
Adjusted Segment EBIT (unaudited)
(1)
|
34,745
|
|
10,937
|
|
8,112
|
|
288
|
|
54,082
|
|
69,903
|
|
25,508
|
|
(23,233
|
)
|
126,260
|
|
||||||||
|
Depreciation and amortization
|
1,926
|
|
3,261
|
|
1,551
|
|
398
|
|
7,136
|
|
130,538
|
|
—
|
|
—
|
|
137,674
|
|
||||||||
|
Adjusted Segment EBITDA (unaudited)
(1)
|
36,671
|
|
14,198
|
|
9,663
|
|
686
|
|
61,218
|
|
200,441
|
|
25,508
|
|
(23,233
|
)
|
263,934
|
|
||||||||
|
Reconciliation to Profit
|
|
|
|
|
|
|
|
|
|
|
|
|
|
|
|
|
||||||||||
|
Profit for the year
|
|
|
|
|
|
|
|
|
|
|
|
|
|
|
|
|
14,438
|
|
||||||||
|
Income tax expense
|
|
|
|
|
|
|
|
|
|
|
|
|
|
|
|
|
11,669
|
|
||||||||
|
Interest expense, net
|
|
|
|
|
|
|
|
|
|
|
|
|
|
|
|
|
47,847
|
|
||||||||
|
Foreign exchange losses, net
|
|
|
|
|
|
|
|
|
|
|
|
|
|
|
|
|
9,246
|
|
||||||||
|
Other financial results, net
|
|
|
|
|
|
|
|
|
|
|
|
|
|
|
|
|
22,088
|
|
||||||||
|
Reserve from the sale of non-controlling interest in subsidiaries)
|
25,508
|
|
||||||||||||||||||||||||
|
Net gain from fair value adjustment of investment property
|
(4,536
|
)
|
||||||||||||||||||||||||
|
Adjusted Consolidated EBIT (unaudited)
(1)
|
|
|
|
|
|
|
|
|
|
|
|
|
|
|
|
|
126,260
|
|
||||||||
|
Depreciation and amortization
|
|
|
|
|
|
|
|
|
|
|
|
|
|
|
|
|
137,674
|
|
||||||||
|
Adjusted Consolidated EBITDA (unaudited)
(1)
|
|
|
|
|
|
|
|
|
|
|
|
|
|
|
|
|
263,934
|
|
||||||||
|
(1)
|
See “Presentation of Financial and Other Information” for the definitions of Adjusted Segment EBIT, Adjusted Consolidated EBIT, Adjusted Segment EBITDA and Adjusted Consolidated EBITDA.
|
|
(2)
|
This corresponds to an equity line item in our consolidated statements of financial position. See “Presentation of Financial and Other Information” for the definitions of Adjusted Segment EBIT, Adjusted Consolidated EBIT, Adjusted Segment EBITDA and Adjusted Consolidated EBITDA.
|
(*) Prior periods have been adjusted to reflect the Company's change in accounting policy for investment properties.
8
|
Adjusted Free Cash Flow
|
2018
|
2017 (*)
|
2016 (*)
|
2015 (*)
|
2014 (*)
|
|||||||||
|
Net cash generated from operating activities
|
218,513
|
|
237,105
|
|
255,401
|
|
145,186
|
|
120,151
|
|
||||
|
Net cash used in investing activities
|
(174,922
|
)
|
(188,335
|
)
|
(122,014
|
)
|
(125,051
|
)
|
(300,472
|
)
|
||||
|
Interest paid
|
(50,021
|
)
|
(41,612
|
)
|
(48,400
|
)
|
(48,438
|
)
|
(48,899
|
)
|
||||
|
Proceeds from the sale of non-controlling interest in subsidiaries
|
—
|
|
—
|
|
—
|
|
21,964
|
|
49,343
|
|
||||
|
Reversal of Expansion Capital expenditures (unaudited)
|
98,011
|
|
70,804
|
|
48,295
|
|
87,956
|
|
237,277
|
|
||||
|
IAS 29 & IAS 21 effect for operating Activities
|
(7,598
|
)
|
—
|
|
—
|
|
—
|
|
—
|
|
||||
|
IAS 29 & IAS 21 effect for investing Activities
|
(4,122
|
)
|
—
|
|
—
|
|
—
|
|
—
|
|
||||
|
Adjusted Free Cash Flow from Operations (unaudited)
|
79,861
|
|
77,962
|
|
133,282
|
|
81,617
|
|
57,400
|
|
||||
|
Expansion Capital expenditures (unaudited)
|
(98,011
|
)
|
(70,804
|
)
|
(48,295
|
)
|
(87,956
|
)
|
(237,277
|
)
|
||||
|
Adjusted Free Cash Flow (unaudited)
|
(18,150
|
)
|
7,158
|
|
84,987
|
|
(6,339
|
)
|
(179,877
|
)
|
||||
|
Indebtedness
|
2018
|
2017 (*)
|
2016 (*)
|
2015 (*)
|
2014 (*)
|
|||||||||
|
Net Debt (unaudited)
|
588,481
|
|
|
548,763
|
|
|
476,828
|
|
|
524,445
|
|
|
584,711
|
|
|
Net Debt / Adjusted Consolidated EBITDA (unaudited)
|
1.87
|
x
|
1.98
|
x
|
1.60
|
x
|
2.43
|
x
|
2.22
|
x
|
||||
|
Reconciliation - Net Debt
|
2018
|
2017 (*)
|
2016 (*)
|
2015 (*)
|
2014 (*)
|
|||||||||
|
Total Borrowings
|
862,116
|
|
817,958
|
|
635,396
|
|
723,339
|
|
698,506
|
|
||||
|
Cash and cash equivalents
|
(273,635
|
)
|
(269,195
|
)
|
(158,568
|
)
|
(198,894
|
)
|
(113,795
|
)
|
||||
|
Net Debt (unaudited)
|
588,481
|
|
548,763
|
|
476,828
|
|
524,445
|
|
584,711
|
|
||||
(*) Prior periods have been adjusted to reflect the Company's change in accounting policy for Investment properties.
Reconciliation of Adjusted Free Cash Flow to Net increase/(decrease) in Cash and Cash Equivalents
|
|
2018
|
2017 (*)
|
2016 (*)
|
2015 (*)
|
2014 (*)
|
|||||||||
|
Net increase/(decrease) in cash and cash equivalents
|
22,737
|
|
118,964
|
|
(48,295
|
)
|
112,548
|
|
(107,032
|
)
|
||||
|
Proceeds from the sale of minority interest in subsidiaries
|
—
|
|
—
|
|
—
|
|
21,964
|
|
49,343
|
|
||||
|
Interest Paid
|
(50,021
|
)
|
(41,612
|
)
|
(48,400
|
)
|
(48,438
|
)
|
(48,899
|
)
|
||||
|
Net cash generated from financing activities
|
20,854
|
|
(70,194
|
)
|
181,682
|
|
(92,413
|
)
|
(73,289
|
)
|
||||
|
IAS 29 & IAS 21 effect for operating activities
|
(4,122
|
)
|
—
|
|
—
|
|
—
|
|
—
|
|
||||
|
IAS 29 & IAS 21 effect for investing activities
|
(7,598
|
)
|
—
|
|
—
|
|
—
|
|
—
|
|
||||
|
Adjusted Free Cash Flow (unaudited)
|
(18,150
|
)
|
7,158
|
|
84,987
|
|
(6,339
|
)
|
(179,877
|
)
|
||||
(*) Prior periods have been adjusted to reflect the Company's change in accounting policy for investment properties.
Reconciliation of Adjusted Free Cash Flow from operations to Net increase/(decrease) in Cash and Cash Equivalents
|
|
2018
|
2017 (*)
|
2016 (*)
|
2015 (*)
|
2014 (*)
|
|||||||||
|
Net increase/(decrease) in cash and cash equivalents
|
22,737
|
|
118,964
|
|
(48,295
|
)
|
112,548
|
|
(107,032
|
)
|
||||
|
Expansion Capital Expenditures (unaudited)
|
98,011
|
|
71,891
|
|
48,295
|
|
87,956
|
|
237,277
|
|
||||
|
Proceeds from the sale of minority interest in subsidiaries
|
—
|
|
—
|
|
—
|
|
21,964
|
|
49,343
|
|
||||
|
Interest Paid
|
(50,021
|
)
|
(41,612
|
)
|
(48,400
|
)
|
(48,438
|
)
|
(48,899
|
)
|
||||
|
Net cash generated / (used) from financing activities
|
20,854
|
|
(70,194
|
)
|
181,682
|
|
(92,413
|
)
|
(73,289
|
)
|
||||
|
IAS 29 & IAS 21 effect for operating activities
|
(4,122
|
)
|
—
|
|
—
|
|
—
|
|
—
|
|
||||
|
IAS 29 & IAS 21 effect for investing activities
|
(7,598
|
)
|
—
|
|
—
|
|
—
|
|
—
|
|
||||
|
Adjusted Free Cash Flow from operations (unaudited)
|
79,861
|
|
79,049
|
|
133,282
|
|
81,617
|
|
57,400
|
|
||||
(*) Prior periods have been adjusted to reflect the Company's change in accounting policy for investment properties.
9
B. CAPITALIZATION AND INDEBTEDNESS
Not Applicable.
C. REASONS FOR THE OFFER AND USE OF PROCEEDS
Not Applicable.
D. RISK FACTORS
Investing in our common shares involves a high degree of risk. Before making an investment decision, you should carefully consider the information contained in this annual report, particularly the risks described below, as well as in our consolidated financial statements and accompanying notes. Our business activities, cash flow, financial condition and results of operations could be materially and adversely affected by any of these risks. The market price of our common shares may decrease due to any of these risks or other factors, and you may lose all or part of your investment. The risks and uncertainties not presently known to us or that we currently deem immaterial may also affect our business operations.
Risks Related to Our Business and Industries
Unpredictable weather conditions, pest infestations and diseases may have an adverse impact on agricultural production.
The occurrence of severe adverse weather conditions, especially droughts, hail, floods or frost or diseases are unpredictable and may have a potentially devastating impact on agricultural production and may otherwise adversely affect the supply and price of the agricultural commodities that we sell and use in our business. Adverse weather conditions may be exacerbated by the effects of climate change which impacts the entirety of our business and policies.
The effects of severe adverse weather conditions may reduce yields of our agricultural activities. Additionally, higher than average temperatures and rainfall can contribute to an increased presence of pest and insects that may adversely impact our agricultural production.
During January and February 2018, Argentina experienced a drought with rain levels below historical averages. Argentina’s Humid Pampas, the country’s corn-belt region, along with the north-east region were among the most affected by the dry weather with reduction in yields of approximately 32% to 24% for corn and soybean compared with our historical averages. The impact was recognized in Initial Recognition and Changes in Fair Value of Biological Assets and Agricultural Produce of corn and soybean of $13.2 million and $9.2 million , respectively, for the year ended December 31, 2018. See “Item 5.-Operating and Financial Review and Prospects-Trends and Factors Affecting Our Results of Operations-(i) Effects of Yield Fluctuations”.
The occurrence and effects of disease and plagues can be unpredictable and devastating to agricultural products, potentially rendering all or a substantial portion of the affected harvests unsuitable for sale. Our agricultural products are also susceptible to fungus and bacteria that are associated with excessively moist conditions. Even when only a portion of the production is damaged, our results of operations could be adversely affected because all or a substantial portion of the production costs have been incurred. Although some diseases are treatable, the cost of treatment is high, and we cannot assure you that such events in the future will not adversely affect our operating results and financial condition. Furthermore, if we fail to control a given plague or disease and our production is threatened, we may be unable to supply our main customers, which could affect our results of operations and financial condition.
Our sugar production depends on the volume and sucrose content of the sugarcane that we cultivate or that is supplied to us by growers located in the vicinity of our mills. Both sugarcane yields and sucrose content depend primarily on weather conditions such as rainfall and temperature, which vary. Weather conditions have historically caused volatility in the ethanol and sugar industries. Future weather patterns may reduce the amount of sugarcane that we can harvest or purchase, or the sucrose content in such sugarcane, and, consequently, the amount of sugar and ethanol we can produce in any given harvest. Any reduction in production volumes could have a material adverse effect on our operating results and financial condition.
As a result, we cannot assure you that future severe adverse weather conditions or pest infestations will not adversely affect our operating results and financial condition.
10
Fluctuation in market prices for our products could adversely affect our financial condition and results of operations.
Prices for agricultural products and by-products, including, among others, sugar, ethanol, and grains, like those of other commodities, have historically been cyclical and sensitive to domestic and international changes in supply and demand and can be expected to fluctuate significantly. In addition, the agricultural products and by-products we produce are traded on commodities and futures exchanges and thus are subject to speculative trading, which may adversely affect us. The prices that we are able to obtain for our agricultural products and by-products depend on many factors beyond our control including:
|
•
|
prevailing world commodity prices, which historically have been subject to significant fluctuations over relatively short periods of time, depending on worldwide demand and supply;
|
|
•
|
changes in the agricultural subsidy levels of certain important producers (mainly the U.S. and the European Union (“E.U.”) and the adoption of other government policies affecting industry market conditions and prices;
|
|
•
|
changes to trade barriers of certain important consumer markets (including China, India, the U.S. and the E.U.) and the adoption of other governmental policies affecting industry market conditions and prices;
|
|
•
|
changes in government policies for biofuels;
|
|
•
|
world inventory levels, i.e., the supply of commodities carried over from year to year;
|
|
•
|
climatic conditions and natural disasters in areas where agricultural products are cultivated;
|
|
•
|
the production capacity of our competitors; and
|
|
•
|
demand for and supply of competing commodities and substitutes.
|
Further, because we may not hedge 100% of the price risk of our agricultural products, we may be unable to have minimum price guarantees for all of our production and are, therefore, exposed to risks associated with the prices of agricultural products and their volatility. We are subject to fluctuations in prices of agricultural products that could result in our receiving lower prices for our agricultural products than our production costs.
In addition, there is a strong relationship between the value of our land holdings and market prices of the commodities we produce, which are affected by global economic conditions. A decline in the prices of grains, sugar, ethanol, or related by-products below their current levels for a sustained period of time could significantly reduce the value of our land holdings and materially and adversely affect our financial condition and results of operations.
Ethanol prices are correlated to the price of sugar and are becoming closely correlated to the price of oil, so that a decline in the price of sugar will adversely affect both our ethanol and sugar businesses, and a decline in the price of oil may adversely affect our ethanol business.
A vast majority of ethanol in Brazil is produced at sugarcane mills that produce both ethanol and sugar. Because sugarcane millers are able to alter their product mix in response to the relative prices of ethanol and sugar, this results in the prices of both products being directly correlated, and the correlation between ethanol and sugar may increase over time. In addition, sugar prices in Brazil are determined by prices in the world market, resulting in a correlation between Brazilian ethanol prices and world sugar prices. Accordingly, a decline in sugar prices would have an adverse effect on the financial performance of our ethanol and sugar businesses.
Currently, gasoline prices in Brazil are set by the Brazilian government through Petrobras. Because flex-fuel vehicles, which have become popular in Brazil, allow consumers to choose between gasoline and ethanol at the pump rather than in the showroom, ethanol prices are now becoming increasingly correlated to gasoline prices and, consequently, oil prices. Therefore, a decline in oil prices or a decision by Petrobras to lower gasoline prices would have an adverse effect on the financial performance of our ethanol and sugar business.
The expansion of our business through acquisitions poses risks that may reduce the benefits we anticipate from these transactions.
As part of our business strategy, we have grown through acquisitions. We plan to continue growing by acquiring other farms and production facilities throughout South America. We believe that the agricultural industry and agricultural activity in the region are highly fragmented and that our future consolidation opportunities will continue to be significant to our growth. However, our management is unable to predict whether or when any prospective acquisitions or strategic alliances will occur, or the likelihood of a certain transaction being completed on favorable terms and conditions. In addition, we are unable to predict the effect that changes in Argentine or Brazilian legislation regarding foreign ownership of rural properties could have in our business. See “—Risks Related to Argentina—Argentine law concerning foreign ownership of rural properties may adversely affect our results of operations and future investments in rural properties in Argentina” and “—Risks Related to Brazil—Changes in Brazilian rules concerning foreign investment in rural properties may adversely affect our investments.” Our ability to continue to expand our
11
business successfully through acquisitions depends on many factors, including our ability to identify acquisitions or access capital markets at an acceptable cost and negotiate favorable transaction terms. Even if we are able to identify acquisition targets and obtain the necessary financing to make these acquisitions, we could financially overextend ourselves, especially if an acquisition is followed by a period of lower than projected prices for our products.
Acquisitions also expose us to the risk of successor liability relating to actions involving an acquired company, its management or contingent liabilities incurred before the acquisition. The due diligence we conduct in connection with an acquisition, and any contractual guarantees or indemnities that we receive from the sellers of acquired companies, may not be sufficient to protect us from, or compensate us for, actual liabilities. Any material liability associated with an acquisition could adversely affect our reputation and results of operations and reduce the benefits of the acquisition.
To support the acquisitions we hope to make, we may need to implement new or upgraded strategies, systems, procedures and controls for our operations and will face risks, including diversion of management time and focus and challenges associated with integrating new managers and employees. Our failure to integrate new businesses successfully could adversely affect our business and financial performance.
We may be unable to realize synergies and efficiency gains from acquisitons or to identify, negotiate or finance future acquisitions, particularly as part of our international growth strategy, successfully or at favorable valuations, or to effectively integrate these acquisitions or joint venture businesses with our current businesses. Any future joint ventures or acquisitions of businesses, technologies, services or products might require us to obtain additional equity or debt financing, which may not be available on favorable terms, or at all. Future acquisitions and joint ventures may also results in unforeseen operating difficulties and expenditures, as well as strain on our organizational culture.
A significant increase in the price of raw materials we use in our operations, or the shortage of such raw materials, could adversely affect our results of operations.
Our production process requires various raw materials, including primarily fertilizer, pesticides and seeds, which we acquire from local and international suppliers. We do not have long-term supply contracts for most of these raw materials. A significant increase in the cost of these raw materials, especially fertilizer and agrochemicals, a shortage of raw materials or the unavailability of these raw materials entirely could reduce our profit margin, reduce our production and/or interrupt the production of some of our products, in all cases adversely affecting the results of our operations and our financial condition.
For example, we rely on fertilizers and agrochemicals, many of which are petro-chemical based. In our Farming business, fertilizers and agrochemicals represented approximately 19% of our total cost of production (including manufacturing and administrative expenses) for the 2017/2018 harvest year. In our Sugar, Ethanol and Energy business, fertilizers and agrochemicals represented 26% of our cost of production (including manufacturing and administrative expenses) for 2017 and 12% for 2018. Worldwide production of agricultural products has increased significantly in recent years, increasing the demand for agrochemicals and fertilizers. This has resulted, among other things, in increased prices for agrochemicals and fertilizers.
Increased energy prices and frequent interruptions of energy supply could adversely affect our business.
We require substantial amounts of fuel oil and other resources for our harvest activities and transport of our agricultural products. During the 2017/18 harvest year, fuel represented 5% of the cost of production (including manufacturing and administrative expenses) of our Farming business. In our Sugar, Ethanol and Energy business, fuel represented 13% of our cost of production (including manufacturing and administrative expenses) for the 2018/19 harvest year. We rely upon third parties for our supply of energy resources used in our operations. The prices for and availability of energy resources may be subject to change or curtailment, respectively, due to, among other things, new laws or regulations, imposition of new taxes or tariffs, interruptions in production by suppliers, imposition of restrictions on energy supply by government, worldwide price levels and market conditions. Over the last few years, the Argentine government has taken certain measures in order to reduce the use of energy during peak months of the year by frequently cutting energy supply to industrial facilities and large consumers to ensure adequate supply for residential buildings. For example, certain of our industrial facilities have been subject to a quota system whereby electricity cuts occur on a work shift basis, resulting in our facilities being shut down during certain work shifts. Also, the Macri administration in Argentina has announced a revision to the current subsidy policies. While some of our facilities utilize different sources of energy, such as firewood and liquefied natural gas, and have attempted to stock their required supplies ahead of higher demand periods, we cannot assure you that we will be able to procure the required energy inputs at acceptable prices. If energy supply is cut for an extended period of time and we are unable to find replacement sources at comparable prices, or at all, our business and results of operations could be adversely affected.
12
We depend on international trade and economic and other conditions in key export markets for our products.
Our operating results depend largely on economic conditions and regulatory policies for our products in major export markets. The ability of our products to compete effectively in these export markets may be adversely affected by a number of factors that are beyond our control, including the deterioration of macroeconomic conditions, volatility of exchange rates, the imposition of greater tariffs or protectionist policies or other trade barriers or other factors in those markets, such as regulations relating to chemical content of products and safety requirements. The European Union, for example, limits the import of genetically modified organisms, or “GMOs.” See “Some of the agricultural commodities and food products that we produce contain genetically modified organisms.”
Due to the growing participation in the worldwide agricultural commodities markets by commodities produced in South America, South American growers, including us, are increasingly affected by the measures taken by importing countries in order to protect their local producers. Measures such as the limitation on imports adopted in a particular country or region may affect the sector’s export volume significantly and, consequently, our operating results.
If the sale of our products into a particular importing country is adversely affected by trade barriers or by any of the factors mentioned above, the relocation of our products to other consumers on terms equally favorable could be impaired, and our business, financial condition and operating results may be adversely affected.
A worldwide economic downturn could weaken demand for our products or lower prices.
The demand for the products we sell may be affected by international, national and local economic conditions that are beyond our control. Adverse changes in the perceived or actual economic climate, such as higher fuel prices, higher interest rates, stock and real estate market declines and/or volatility, more restrictive credit markets, higher taxes, and changes in governmental policies could reduce the level of demand or prices of the products we produce. We cannot predict the duration or magnitude of this downturn or the timing or strength of economic recovery. If a downturn were to continue for an extended period of time or worsen, we could experience a prolonged period of decreased demand and prices. In addition, economic downturns have and may adversely impact our suppliers, which can result in disruptions in goods and services and financial losses.
Our business is seasonal, and our results may fluctuate significantly depending on the growing cycle of our crops.
As with any agricultural business enterprise, our business operations are predominantly seasonal in nature. The harvest of corn, soybean and rice generally occurs from January to May. Wheat is harvested from December to January. Cotton is harvested from June to August, but requires processing which takes approximately two to three months. Our operations and sales are affected by the growing cycle of our crops process and the timing of our harvest sales. In addition, our sugar and ethanol business is subject to seasonal trends based on the sugarcane growing cycle in the center-south region of Brazil. Although, we operate under a “non-stop” or “continuous” harvest model which allows us to crush sugarcane year round, the annual sugarcane harvesting period in the center-south region of Brazil begins in March/April and ends in November/December. This creates price fluctuations which result in fluctuations in our sugar and ethanol inventories, usually peaking in December to take advantage of higher prices during the traditional off-season (i.e., January through April), and a degree of seasonality in our gross profit. Seasonality could have a material adverse effect on our business and financial performance. In addition, our quarterly results may vary as a result of the effects of fluctuations in commodities prices, production yields and costs. Therefore, our results of operations have varied significantly from period to period and are likely to continue to vary, due to seasonal factors.
Our dairy cattle are vulnerable to diseases.
Diseases among our dairy cattle herds, such as mastitis, tuberculosis, brucellosis and foot-and-mouth disease, can have an adverse effect on the productivity of our dairy cows. Outbreaks of cattle diseases may also result in the closure of certain important markets to our cattle-derived products. Although we abide by national veterinary health guidelines, including laboratory analyses and vaccination, to control diseases among our herds, especially foot and mouth disease, we cannot assure you that future outbreaks will not occur. A future outbreak of diseases among our cattle herds could adversely affect our milk sales and operating results and financial condition.
Furthermore, outbreaks, or fears of outbreaks, of any of these or other animal diseases may lead to cancellation of orders by our customers and, particularly if the disease has the potential to affect humans, or create adverse publicity that may have a material adverse effect on consumer demand for our products. Moreover, outbreaks of animal disease may result in foreign governmental action to close export markets to some or all of our products, which may result in the destruction of some or all of these animals.
13
We face significant competition from Brazilian and foreign producers, which could adversely affect our financial performance.
We face strong competition from other producers in our domestic market and from foreign producers in our export markets. The market for commodities is highly fragmented. Small producers can also be important competitors, some of which operate in the informal economy and are able to offer lower prices by meeting lower quality standards. Competition from other producers is a barrier to expanding our sales in the domestic/foreign market. With respect to exports, we compete with other large, vertically integrated producers that have the ability to produce quality products at low cost, as well as with foreign producers.
The Brazilian markets, in particular, are highly price-competitive and sensitive to product substitution. Even if we remain a low-cost producer, customers may seek to diversify their sources of supply by purchasing a portion of the products they need from producers in other countries, as some of our customers in key export markets have begun to do. We expect that we will continue to face strong competition in all of our markets and anticipate that existing or new competitors may broaden their product lines and extend their geographic scope. Any failure by us to respond to product, pricing and other moves by competitors may negatively affect our financial performance.
Our current insurance coverage may not be sufficient to cover our potential losses.
Our production is, in general, subject to different risks and hazards, including adverse weather conditions, fires, diseases and pest infestations, other natural phenomena, industrial accidents, labor disputes, changes in the legal and regulatory framework applicable to us, environmental contingencies and other natural phenomena. Our insurance currently covers only part of the losses we may incur and does not cover losses on crops due to hail storms, fires or similar risks. Furthermore, although we maintain insurance at levels that are customary in our industry, certain types of risks may not be covered by the policies we have for our industrial facilities. Additionally, we cannot guarantee that the indemnification paid by the insurer due to the occurrence of a casualty covered by our policies will be sufficient to entirely compensate us for the damages suffered. Moreover, we may not be able to maintain or obtain insurance of the type and amount desired at reasonable costs. If we were to incur significant liability for which we were not fully insured, it could have a materially adverse effect on our business, financial condition and results of operations.
In addition, even where we incur losses that are ultimately covered by insurance, we may incur additional expenses to mitigate the loss, such as shifting production to another facility. These costs may not be fully covered by our insurance.
A reduction in market demand for ethanol or a change in governmental policies reducing the amount of ethanol required to be added to gasoline may adversely affect our business.
Government authorities of several countries, including Brazil and certain states of the United States, currently require the use of ethanol as an additive to gasoline. Commencing in March 2015, the Brazilian Government increased the required blend of anhydrous ethanol to gasoline from 25% to 27% which created an additional demand for anhydrous ethanol in the order of approximately 800 thousand cubic meters of anhydrous per year.
Approximately 45% of all fuel ethanol in Brazil is consumed in the form of anhydrous ethanol blended with gasoline; the remaining 55% of fuel ethanol is consumed in the form of hydrous ethanol, which is mostly used to power flex-fuel vehicles. Flex-fuel vehicles have the flexibility to run either on gasoline (blended with anhydrous ethanol) or hydrous ethanol. In the United States, almost all gasoline sold contains 10% ethanol. The European Union aims for 10% of the energy used in the transport sector to derive from renewable energy sources by 2020, without specific targets for certain renewable energy sources and without intermediate targets, to be determined by each Member State. Other countries such as Colombia, Mexico, Canada, Philippines and China have a 10% biofuel blending mandate, while Argentina currently has a 12% ethanol blending. In addition, flex-fuel and ethanol powered vehicles in Brazil are entitled to a tax benefit in the form of a lower tax rate on manufactured products (Imposto sobre Produtos Industrializados) and therefore are currently taxed at lower levels than gasoline-only vehicles, which has contributed to the increase in production and sale of flex-fuel vehicles. Many of these policies and incentives stem from, and are mostly driven by, climate change issue. If such concerns or perception were to change, the legal framework and incentive structure promoting the use of ethanol may change, leading to a reduction in the demand for ethanol. In addition, any reduction in the percentage of ethanol required in fuel blended with gasoline or increase in the levels at which flex-fuel vehicles are taxed in Brazil, or any growth in the demand for natural gas and other fuels as an alternative to ethanol, lower gasoline prices or an increase in gasoline consumption (versus ethanol), may cause demand for ethanol to decline and affect our business.
Growth in the sale and distribution of ethanol depends in part on infrastructure improvements, which may not occur on a timely basis, if at all.
14
In contrast to the well-established logistical operations and infrastructure supporting sugar exports, ethanol exports inherently demand much more complex preparation and means of distribution, including outlets from our facilities to ports and shipping to other countries. Substantial infrastructure development by persons and entities outside our control is required for our operations, and the ethanol industry generally, to grow. Areas requiring expansion include, but are not limited to, additional rail capacity, additional storage facilities for ethanol, increases in truck fleets capable of transporting ethanol within localized markets, expansion of refining and blending facilities to handle ethanol, growth in service stations equipped to handle ethanol fuels, and growth in the fleet of flex-fuel vehicles. Specifically, with respect to ethanol exports, improvements in consumer markets abroad are needed in the number and capacity of ethanol blending industrial plants, the distribution channels of gasoline-ethanol blends and the chains of distribution stations capable of handling fuel ethanol as an additive to gasoline. Substantial investments required for these infrastructure changes and expansions may not be made or they may not be made on a timely basis. Any delay or failure in making the changes in or expansion of infrastructure may hurt the demand for or prices of our products, prevent our products’ delivery, impose additional costs on us or otherwise have a serious adverse effect on our business, operating results or financial status. Our business relies on the continuing availability of infrastructure for ethanol production, storage and distribution, and any infrastructure disruptions may have a material adverse effect on our business, financial condition and operating results.
We may be harmed by competition from alternative fuels, products and production methods.
Ethanol competes in the biofuel market with other, established fuels such as biodiesel, as well as fuels that are still in the development phase, including methanol and butanol from biomass. Alternative fuels could become more successful than ethanol in the biofuels market over the medium or long term due to, for example, lower production costs, greater environmental benefits or other more favorable product characteristics. In addition, alternative fuels may also benefit from tax incentives or other more favorable governmental policies than those that apply to ethanol. Furthermore, our success depends on early identification of new developments relating to products and production methods and continuous improvement of existing expertise in order to ensure that our product range keeps pace with technological change. Competitors may gain an advantage over us by, for example, developing or using new products and production methods, introducing new products to the market sooner than we do, or securing exclusive rights to new technologies, thereby significantly harming our competitive position.
A substantial portion of our assets is farmland that is highly illiquid.
We have been successful in partially rotating and monetizing a portion of our investments in farmland. During the last fourteen years, we have executed transactions for the purchase and disposition of land for over $688 million. Ownership of a significant portion of the land we operate is a key part of our business model. However, agricultural real estate is generally an illiquid asset. Moreover, the adoption of laws and regulations that impose limitations on ownership of rural land by foreigners in the jurisdictions in which we operate may also limit the liquidity of our farmland holdings. See “—Risks Related to Argentina—Argentine law concerning foreign ownership of rural properties may adversely affect our results of operations and future investments in rural properties in Argentina” and “—Risks Related to Brazil—Changes in Brazilian rules concerning foreign investment in rural properties may adversely affect our investments.” As a result, it is unlikely that we will be able to adjust our owned agricultural real estate portfolio promptly in response to changes in economic, business or regulatory conditions. Illiquidity in local market conditions may adversely affect our ability to complete dispositions, to receive proceeds generated from any such sales or to repatriate any such proceeds.
We have entered into agriculture partnership agreements in respect of a significant portion of our sugarcane plantations.
As of
December 31, 2018
, approximately 95 % of our sugarcane plantations were leased through agriculture partnership agreements, for periods of an average of six to twelve years. We cannot guarantee that these agriculture partnerships will be renewed after their respective terms. Even if we are able to renew these agreements, we cannot guarantee that such renewals will be on terms and conditions satisfactory to us. Any failure to renew the agriculture partnerships or obtain land suitable for sugarcane planting in sufficient quantity and at reasonable prices to develop our activities could adversely affect our results of operations, increase our costs or force us to seek alternative properties, which may not be available or be available only at higher prices.
We may be subject to labor disputes from time to time that may adversely affect us.
Our employees are represented by unions or equivalent bodies and are covered by collective bargaining or similar agreements which are subject to periodic renegotiation. We may not successfully conclude our labor negotiations on satisfactory terms, which may result in a significant increase in the cost of labor or may result in work stoppages or labor disturbances that disrupt our operations. Cost increases, work stoppages or disturbances that result in substantial amounts of raw product not being processed could have a material and adverse effect on our business, results of operations and financial condition.
15
We may not possess all of the permits and licenses required to operate our business, or we may fail to renew or maintain the licenses and permits we currently hold. This could subject us to fines and other penalties, which could materially adversely affect our results of operations.
We are required to hold a variety of permits and licenses to conduct our farming and industrial operations, including but not limited to permits and licenses concerning land development, agricultural and harvesting activities, seed production, labor standards, occupational health and safety, land use, water use and other matters. We may not possess all of the permits and licenses required for each of our business segments. In addition, the approvals, permits or licenses required by governmental agencies may change without substantial advance notice, and we could fail to obtain the approvals, permits or licenses required to expand our business. If we fail to obtain or to maintain such permits or licenses, or if renewals are granted with onerous conditions, we could be subject to fines and other penalties and be limited in the number or the quality of the products that we could offer. As a result, our business, results of operations and financial condition could be adversely affected.
We are subject to extensive environmental regulation, and concerns regarding climate change may subject us to even stricter environmental regulations.
Our activities are subject to a broad set of laws and regulations relating to the protection of the environment. Such laws include compulsory maintenance of certain preserved areas within our properties, management of pesticides and associated hazardous waste and the acquisition of permits for water use and effluents disposal. In addition, the storage and processing of our products may create hazardous conditions. We could be exposed to criminal and administrative penalties in addition to the obligation to remedy the adverse effects of our operations on the environment and to indemnify third parties for damages.
In addition, pursuant to Brazilian environmental legislation, the corporate entity of a company will be disregarded (such that the owners of the company will be liable for its debts) if necessary to guarantee the payment of costs related to the recovery of environmental damages, whenever the legal entity is deemed by a court to be an obstacle to reimbursement of damages caused to the quality of the environment. We have incurred, and will continue to incur, capital and operating expenditures to comply with these laws and regulations. Because of the possibility of unanticipated regulatory measures or other developments, particularly as environmental laws become more stringent, the amount and timing of future expenditures required to maintain compliance could increase from current levels and could adversely affect the availability of funds for capital expenditures and other purposes. Compliance with existing or new environmental laws and regulations, as well as obligations in agreements with public entities, could result in increased costs and expenses.
Environmental laws and their enforcement are becoming more stringent in Argentina and Brazil increasing the risk of and penalties associated with violations, which could impair or suspend our operations or projects and our operations expose us to potentially adverse environmental legislation and regulation. Failure to comply with past, present or future laws could result in the imposition of fines, third party claims, and investigation by environmental authorities and the relevant public attorney office. For example, the perceived effects of climate change may result in additional legal and regulatory requirements to reduce or mitigate the effects of our industrial facilities’ emissions. Such requirements, if enacted, could increase our capital expenditures and expenses for environmental compliance in the future, which may have a material and adverse effect on our business, results of operations and financial condition. Moreover, the denial of any permit that we have requested, or the revocation of any of the permits that we have already obtained, may have an adverse effect on our results of operations.
Some of the agricultural commodities and food products that we produce contain genetically modified organisms ("GMO").
Our soybean, corn and cotton products contain GMOs in varying proportions depending on the year and the country of production. The use of GMOs in food has been met with varying degrees of acceptance in the markets in which we operate. The United States, Argentina and Brazil, for example, have approved the use of GMOs in food products, and GMO and non-GMO grain in those countries is produced and frequently commingled during the grain origination process. Elsewhere, adverse publicity about genetically modified food has led to governmental regulation limiting sales of GMO products in some of the markets in which our customers sell our products, including the European Union. It is possible that new restrictions on GMO products will be imposed in major markets for some of our products or that our customers will decide to purchase fewer GMO products or not buy GMO products at all, which could have a material adverse effect on our business, results of operations, financial condition or prospects.
Increased regulation of food safety could increase our costs and adversely affect our results of operations.
Our manufacturing facilities and products are subject to regular local, as well as foreign, governmental inspections and extensive regulation in the food safety area, including governmental food processing controls. We currently comply with all food safety requirements in the markets where we conduct our business. We incur significant costs in connection with such compliance
16
and changes in government regulations relating to food safety could require us to make additional investments or incur additional costs to meet the necessary specifications for our products. Our products are often inspected by foreign food safety officials, and any failure to pass those inspections can result in our being required to return all or part of a shipment, destroy all or part of a shipment or incur costs because of delays in delivering products to our customers. Any tightening of food safety regulations could result in increased costs and could have an adverse effect on our business and results of operations.
If our products become contaminated, we may be subject to product liability claims, product recalls and restrictions on exports that would adversely affect our business.
The sale of food products for human consumption involves the risk of injury to consumers. These injuries may result from tampering by third parties, bioterrorism, product contamination or spoilage, including the presence of bacteria, pathogens, foreign objects, substances, chemicals, other agents, or residues introduced during the growing, storage, handling or transportation phases.
We cannot be sure that consumption of our products will not cause a health-related illness in the future or that we will not be subject to claims or lawsuits relating to such matters. Even if a product liability claim is unsuccessful or is not fully pursued, the negative publicity surrounding any assertion that our products caused illness or injury could adversely affect our reputation with existing and potential customers and our corporate and brand image, and we could also incur significant legal expenses. Moreover, claims or liabilities of this nature might not be covered by any rights of indemnity or contribution that we may have against others, which could have a material adverse effect on our business, results of operations or financial condition.
IFRS accounting standards related to biological assets require us to make numerous estimates in the preparation of our financial statements and therefore limit the comparability of our financial statements to similar issuers using U.S. GAAP.
IAS 41 “Biological Assets” requires that we measure our biological assets and agriculture produce at the point of harvest at fair value less costs to sell. Therefore, we are required to make assumptions and estimates relating to, among other things, future agricultural commodity yields, prices, and production costs extrapolated through a discounted cash flow method. For example, the value of our biological assets generated initial recognition and changes in fair value of biological assets amounting to a
$16.2 million
gain in
2018
;
$63.2 million
gain in
2017
and a
$125.5 million
gain in
2016
. The assumptions and estimates used to determine the fair value of biological assets, and any changes to such prior estimates, directly affect our reported results of operations. If actual market conditions differ from our estimates and assumptions, there could be material adjustments to our results of operations. In addition, the use of such discounted cash flow method utilizing these future estimated metrics differs from generally accepted accounting principles in the United States (“U.S. GAAP”). As a result, our financial statements and reported earnings are not directly comparable to those of similar companies in the United States.
Certain of our subsidiaries have substantial indebtedness which could impair their financial condition and decrease the amount of dividends we receive.
Certain of our subsidiaries in Argentina and Brazil have a substantial amount of debt, which requires significant principal and interest payments. As of
December 31, 2018
, we had $588.5 million of net debt outstanding on a consolidated basis, including $500 million of Notes 2027, incurred by Adecoagro S.A. Such indebtedness could affect our subsidiaries’ future operations, for example, by requiring a substantial portion of their cash flows from operations to be dedicated to the payment of principal and interest on indebtedness instead of funding working capital and capital improvements and other investments. The substantial amount of debt incurred by our subsidiaries also imposes significant debt obligations, increasing their cost of borrowing to satisfy business needs and limiting their ability to obtain additional financing.
The substantial level of indebtedness borne by certain of our subsidiaries also affects the amount of cash available to them to pay as dividends, increasing our vulnerability to economic downturns or other adverse developments relative to competitors with less leverage, and limiting our ability to obtain additional financing on their behalf for working capital, capital expenditures, acquisitions or other corporate purposes in the future. Moreover, by reducing the level of dividends we may receive, such indebtedness places limits on our ability to make acquisitions or needed capital expenditures or to pay dividends to our shareholders.
The terms of our indebtedness and that of certain of our subsidiaries impose significant restrictions on our operating and financial flexibility.
The terms of our Senior Notes due 2027 and the debt instruments of some of our subsidiaries contain customary covenants including limitations on our ability to, among other things, incur or guarantee additional indebtedness; make restricted payments, including dividends and prepaying indebtedness; create or permit liens; enter into business combinations and asset sale transactions; make investments, including capital expenditures; and enter into new businesses. Some of these debt instruments are also secured
17
by various collateral including mortgages on farms, pledges of subsidiary stock and liens on certain facilities, equipment and accounts. Some of these debt instruments also contain cross-default provisions, where a default on one loan by one subsidiary could result in lenders of otherwise performing loans declaring a default. These restrictions could limit our ability to obtain future financing, withstand a future downturn in business or the economy in general, conduct operations or otherwise take advantage of business opportunities that may arise. Moreover, by reducing the level of dividends we may receive, the terms of our subsidiaries’ indebtedness places limits on our ability to make acquisitions or needed capital expenditures or to pay dividends to our shareholders.
The financial ratio covenants we are currently required to meet, some of which are measured on a combined basis aggregating results of the borrowing subsidiaries and others which are measured on an individual debtor basis, include, among others, debt service coverage, minimum liquidity and leverage ratios.
The failure to maintain applicable financial ratios, in certain circumstances, would prevent us from borrowing additional amounts and could result in a default under such indebtedness. If we or our subsidiaries are unable to repay those amounts, the affected lenders could initiate bankruptcy-related proceedings or enforce their rights to the collateral securing such indebtedness, which would have a material and adverse effect on our business, results of operations and financial condition.
Fluctuations in interest rates could have a significant impact on our results of operations, indebtedness and cash flow.
As of
December 31, 2018
, approximately
83.9%
of our total debt on a consolidated basis was subject to fixed interest rates and
16.1%
was subject to variable interest rates. As of
December 31, 2018
, borrowings incurred by the Company’s subsidiaries in Brazil were repayable at various dates between January 2019 and September 2024 and bear either fixed interest rates ranging from 2.5% to 7.95% per annum or variable rates based on LIBOR, Taxa de Juros de Longo Prazo ( TJLP); or other specific base-rates plus spreads ranging from 6.89% to 12.03% per annum. At
December 31, 2018
, LIBOR (six months) was 2.88%. Borrowings incurred by the Company´s subsidiaries in Argentina are repayable at various dates between January 2019 and June 2024 and bear either fixed interest rates ranging from 4.5% to 7.0% per annum. Significant interest rate increases can have an adverse effect on our profitability, liquidity and financial position. Currently, our variable interest rate exposure is mainly linked to the LIBOR rate plus specified spreads. If interest rates increase, whether because of an increase in market interest rates or an increase in our own cost of borrowing, our debt service obligations for our variable rate indebtedness would increase even though the amount of borrowings remains the same, and our net income could be adversely affected.
We occasionally use interest rate swaps and forward interest rate contracts to reduce interest rate volatility and funding costs associated with certain debt issues and to achieve a desired proportion of variable-versus fixed-rate debt, based on current and projected market conditions. We have not applied hedge accounting to these transactions and may not do so in the future. Therefore, changes in the fair value of these derivative instruments can result in a non-cash charge or gain being recognized in our financial results for a period preceding the period or periods in which settlement occurs under the derivative instruments and interest payments are made. Changes or shifts in interest rates can significantly impact the valuation of our derivatives and therefore could expose us to substantial mark-to-market losses or gains if interest rates fluctuate materially from the time when the derivatives were entered into. Accordingly, fluctuations in interest rates may impact our financial position, results of operations, and cash flows. See Note 2 to our Consolidated Financial Statementes.
On July 27, 2017, the Financial Conduct Authority (the authority that regulates LIBOR) announced that it intends to stop compelling banks to submit rates for the calculation of LIBOR after 2021. It is unclear whether new methods of calculating LIBOR will be established such that it continues to exist after 2021. The U.S. Federal Reserve, in conjunction with the Alternative Reference Rates Committee, is considering replacing U.S. dollar LIBOR with a newly created index, calculated based on repurchase agreements backed by treasury securities. It is not possible to predict the effect of these changes, other reforms or the establishment of alternative reference rates in the United Kingdom, the United States or elsewhere.
We may not be able to renew our credit lines when they mature, depriving us of needed liquidity.
Certain of our subsidiaries rely substantially on existing uncommitted credit lines to support their operations and business needs through the agricultural harvest cycle. If we are unable to renew these credit lines, or if we cannot replace such credit lines with other borrowing facilities, our financial condition and results of operations may be adversely affected.
There is a risk that we could be treated as a U.S. domestic corporation for U.S. federal income tax purposes, which could materially increase our U.S. federal income tax liability and subject any dividends we pay to U.S. federal withholding tax.
We acquired approximately 98% of IFH, a holding company, which was a partnership for U.S. federal income tax purposes organized under the laws of Delaware, immediately prior to our IPO, in exchange for our common shares. Under U.S. Internal Revenue Code section 7874(b), we would be treated as a U.S. domestic corporation if we were deemed to have acquired substantially
18
all of the assets constituting the trade or business of a U.S. domestic partnership and former members of IFH were deemed to own at least 80% of our common shares by reason of the transfer of those trade or business assets (ignoring common shares issued in our IPO for purposes of the 80% threshold). Although we and our subsidiaries conduct no direct business activity in the United States and we believe that our acquisition of IFH should not be subject to the rules above, those rules are unclear in certain respects and there is limited guidance on the application of the rules to partnership acquisitions. Accordingly, we cannot assure you that the U.S. Internal Revenue Service (“IRS”) will not seek to assert that we are a U.S. domestic corporation, which assertion if successful could materially increase our U.S. federal income tax liability and require us to withhold tax from any dividends we pay to holders of our common shares who are not United States persons within the meaning of U.S. Internal Revenue Code section 7701(a) (30). See “Item 10. Additional Information—E. Taxation”.
We may be classified by the IRS as a “passive foreign investment company” (a “PFIC”), which may result in adverse tax consequences for U.S. investors.
We believe that we will not be a PFIC for U.S. federal income tax purposes for our current taxable year and do not expect to become one in the foreseeable future. Whether the Company will be a PFIC for the current or future tax year will depend on the Company’s assets and income over the course of each such tax year and, as a result, cannot be predicted with certainty as of the date of this Form 20-F. Under circumstances where the cash is not deployed for active purposes, our risk of becoming a PFIC may increase. If we were treated as a PFIC for any taxable year during which a U.S. investor held common shares, certain adverse tax consequences could apply to such U.S. investor. A U.S. taxpayer who holds stock in a foreign corporation during any year in which such corporation qualifies as a PFIC may mitigate such negative tax consequences by making certain U.S. federal income tax elections, which are subject to numerous restrictions and limitations. Holders of the Company’s common shares are urged to consult their own tax advisors regarding the acquisition, ownership, and disposition of the Company’s common shares. See “Material U.S. Federal Income Tax Considerations for U.S. Holders—Passive Foreign Investment Company (“PFIC”) Rules”.
Risks associated with the Countries in which we operate
We operate our business in emerging markets. Our results of operations and financial condition are dependent upon economic conditions in those countries in which we operate, and any decline in economic conditions could harm our results of operations or financial condition.
All of our operations and/or development activities are in South America. As of
December 31, 2018
, based on total asset value, 46.9% of our assets were located in Argentina, 44.9% in Brazil and 2.4% in Uruguay. During the year ended
December 31, 2018
,
61.3%
of our consolidated sales of goods and services rendered were attributable to our Brazilian operations,
25.6%
were attributable to our Argentine operations and
13.1%
were attributable to our Uruguayan operations. In the future we expect to have additional operations in the South American countries in which we now operate or in other countries with similar political, economic and social conditions. Many of these countries have a history of economic instability or crises (such as inflation or recession), government deadlock, political instability, civil strife, changes in laws and regulations, expropriation or nationalization of property, and exchange controls which could adversely affect our business, financial condition and results of operations.
In particular, fluctuations in the economies of Argentina and Brazil and actions adopted by the governments of those countries have had and may continue to have a significant impact on companies operating in those countries, including us. Specifically, we have been affected and may continue to be affected by high levels of inflation, increased interest rates, fluctuations in the value of the Argentine Peso and Brazilian Real against foreign currencies, wage controls, price and foreign exchange controls, regulatory policies, business and tax regulations, political and social tension, and in general by the political, social and economic scenarios in Argentina and Brazil and in other countries that may affect Argentina and Brazil.
The economies of the countries in which we operate may be adversely affected by the deterioration of other global markets.
Financial and securities markets in the countries in which we operate are influenced, to different degrees, by the economic and market conditions in other countries, including other South American and emerging market countries and other global markets. Although economic conditions in these countries may differ significantly from economic conditions in the countries in which we operate, investors’ reactions to developments in these other countries, such as the recent developments in the global financial markets, may substantially affect the capital flows into, and the market value of securities of issuers with operations in, the countries in which we operate. A crisis in other emerging market countries could dampen investor enthusiasm for securities of issuers with South American operations, including our common shares. This could adversely affect the market price for our common shares, as well as make it difficult for us to access capital markets and obtain financing for our operations in the future, on acceptable terms or under any conditions.
19
A significant deterioration in the economic growth of any of the main trading partners of Brazil or Argentina could have a material impact on the trade balance of those countries and could adversely affect their economic growth and that of other countries in the region.
Governments have a high degree of influence in the economies in which we operate, which could adversely affect our results of operations or financial condition.
Governments in many of the markets in which we currently, or may in the future operate frequently intervene in their respective economies and occasionally make significant changes in monetary, credit, industry and other policies and regulations. Government actions to control inflation and other policies and regulations have often involved, among other measures, price controls, currency devaluations, capital controls and limits on imports. We have no control over, and cannot predict what measures or policies governments may take in the future. The results of operations and financial condition of our businesses may be adversely affected by changes in governmental policy or regulations in the jurisdictions in which they operate that impact factors such as:
|
•
|
labor laws;
|
|
•
|
economic growth;
|
|
•
|
currency fluctuations;
|
|
•
|
inflation;
|
|
•
|
exchange and capital control policies;
|
|
•
|
interest rates;
|
|
•
|
liquidity of domestic capital and lending markets;
|
|
•
|
monetary policy;
|
|
•
|
liquidity and solvency of the financial system;
|
|
•
|
limitations on ownership of rural land by foreigners;
|
|
•
|
developments in trade negotiations through the World Trade Organization or other international organizations;
|
|
•
|
environmental regulations;
|
|
•
|
tax laws, including royalties and the effect of tax laws on distributions from our subsidiaries;
|
|
•
|
restrictions on repatriation of investments and on the transfer of funds abroad;
|
|
•
|
expropriation or nationalization;
|
|
•
|
import/export restrictions or other laws and policies affecting foreign trade and investment;
|
|
•
|
price controls or price fixing regulations;
|
|
•
|
restrictions on land acquisition or use or agricultural commodity production; and
|
|
•
|
other political, social and economic developments, including political, social or economic instability, in or affecting the country where each business is based.
|
Uncertainty over whether governments will implement changes in policy or regulation affecting these or other factors in the future may contribute to economic uncertainty and heightened volatility in the securities markets, which may have a material and adverse effect on our business, results of operations and financial condition.
20
Currency exchange rate fluctuations relative to the U.S. dollar in the countries in which we operate our businesses may adversely impact our results of operations and financial condition.
We operate exclusively outside the United States, and our businesses may be impacted by significant fluctuations in foreign currency exchange rates. Our exposure to currency exchange rate fluctuations results from the currency translation adjustments required in connection with the preparation of our Consolidated Financial Statements. The currency exchange exposure stems from the generation of revenues and incurrence of expenses in different currencies and the devaluation of local currency revenues impairing the value of investments in U.S. Dollars. While the Consolidated Financial Statements presented herein are, and our future Consolidated Financial Statements will be, presented in U.S. dollars, the financial statements of our subsidiaries are prepared using the local currency as the functional currency and translated into U.S. dollars by applying: (i) a year-end exchange rate for assets and liabilities; and (ii) an average exchange rate for the year for income and expenses. Resulting exchange differences arising from the translation to our presentation currency are recognized as a separate component of equity. Currencies in Argentina and Brazil have fluctuated significantly against the U.S. dollar in the past. Accordingly, fluctuations in exchange rates relative to the U.S. dollar could impair the comparability of our results from period to period and have a material adverse effect on our results of operations and financial condition.
The Argentine Peso depreciated 31.1% against the U.S. dollar in
2014
, 52.5% in
2015
, 21.9% in
2016
, 17.4% in
2017
and 102.1% in
2018
, based on the official exchange rates published by the Argentine Central Bank. In the past years, the Argentine government imposed restrictions on the purchase of foreign currency (see “—Risks Related to Argentina—Exchange controls could restrict the inflow and outflow of funds in Argentina.”) which measures gave rise to an unofficial market where the U.S. dollar traded at a different market value than reflected in the official Argentine Peso – U.S. Dollar exchange rate. Following national elections in Argentina in 2015, the newly elected Macri administration (the “Macri Administration”) changed the currency policy and lifted almost all of the restrictions on the purchase of foreign currency while at the same time officially depreciating the Argentine Peso, practically eliminating the gap between the official and unofficial exchange rates that coexisted during the previous years. We cannot predict future fluctuations in the exchange rate of the Argentine Peso or whether the Argentine government will change its currency policy.
The Brazilian currency has historically suffered frequent fluctuations. As a consequence of inflationary pressures, in the past, the Brazilian government has implemented various economic plans and adopted a number of exchange rate policies, including sudden devaluations, periodic mini-devaluations during which the frequency of adjustments has ranged from daily to monthly, floating exchange rate systems, exchange controls and dual exchange rate markets. Formally the value of the Real against foreign currencies is determined under a free-floating exchange rate regime, but in fact the Brazilian government is currently intervening in the market, through currency swaps and trading in the spot market, among other measures, every time the currency exchange rate is above or below the levels that the Brazilian government considers appropriate, taking into account, inflation, growth, the performance of the Real against the U.S dollar in comparison with other currencies and other economic factors. Periodically, there are significant fluctuations in the value of the Real against the U.S. dollar. The Real depreciated 14.0% against the U.S. dollar in 2014, 46.2% in 2015, appreciated 16.8% in 2016, in 2017 the Real appreciated 1.5% against U.S. dollar and 17.1% in 2018.
Future fluctuations in the value of the local currencies relative to the U.S. dollar in the countries in which we operate may occur, and if such fluctuations were to occur in one or a combination of the countries in which we operate, our results of operations or financial condition could be adversely affected.
Inflation in some of the countries in which we operate, along with governmental measures to curb inflation, may have a significant negative effect on the economies of those countries and, as a result, on our financial condition and results of operations.
In the past, high levels of inflation have adversely affected the economies and financial markets of some of the countries in which we operate, particularly Argentina and Brazil, and the ability of their governments to create conditions that stimulate or maintain economic growth. Moreover, governmental measures to curb inflation and speculation about possible future governmental measures have contributed to the negative economic impact of inflation and have created general economic uncertainty. As part of these measures, governments have at times maintained a restrictive monetary policy and high interest rates that has limited the availability of credit and economic growth.
A portion of our operating costs in Argentina are denominated in Argentine Pesos and most of our operating costs in Brazil are denominated in Brazilian Reais. Inflation in Argentina or Brazil, without a corresponding Peso or Real devaluation, could result in an increase in our operating costs without a commensurate increase in our revenues, which could adversely affect our financial condition and our ability to pay our foreign currency denominated obligations.
21
After several years of price stability in Argentina, the devaluation of the Peso in January 2002 imposed pressures on the domestic price system that generated high inflation throughout 2002. In 2003, inflation decreased significantly and stabilized. However, in recent years, encouraged by the pace of economic growth, according to the Instituto Nacional de Estadisticas y Censos, or “INDEC” (Argentine Statistics and Census Agency), the consumer price index increased by 9.5% in 2011, 10.8% in 2012, and 10.9% in 2013; while the wholesale price index increased 10.3% in 2009, 14.6% in 2010, 12.7% in 2011, 13.1% in 2012, 14.7% in 2013 and 28.3% in 2014. The accuracy of the measurements of the INDEC has been questioned in the past, and the actual consumer price index and wholesale price index could be substantially higher than those indicated by the INDEC. See “—Risks Related to Argentina—The credibility of several Argentine economic indices have been called into question, which may lead to a lack of confidence in the Argentine economy and may in turn limit our ability to access the credit and capital markets.”
In February 2014 the INDEC modified the methodology for the calculation of the consumer price index (“CPI”) and the gross domestic product. Under the new calculation methodology, the CPI increased by 23.9% in 2014 and 11.9% as of October 2015 (for the first nine months of 2015). However, opposition lawmakers reported an inflation rate of 38.5% and 27.5%, respectively. In December 2015, the Macri administration appointed a former director of a private consulting firm to manage the INDEC. The new director initially suspended the publication of any official data prepared by INDEC and implemented certain methodological reforms and adjusted certain indices based on those reforms. In January 25, 2016, INDEC published two alternative measures of the CPI for year 2015, 29.6% and 31.6%, which were based on data from the City of Buenos Aires and the Province of San Luis. After implementing these methodological reforms in June 2016, the INDEC resumed its publication of the CPI. According to INDEC, the CPI increase in 2017 was 24.8% and in 3028. In 2019, the monthly CPI increase was 2.9% in January, 3.8% in February and 4.7% in March.
Brazil has historically experienced high rates of inflation. Inflation, as well as government efforts to curb inflation, has had significant negative effects on the Brazilian economy, particularly prior to 1995. Inflation rates were 7.8% in 2007 and 9.8% in 2008, compared to deflation of 1.7% in 2009, inflation of 11.3% in 2010, inflation of 5.1% in 2011, inflation of 7.8% in 2012, inflation of 5.5% in 2013, inflation of 3.7% in 2014, inflation of 10.5% in 2015, and 7.2% in 2016, as measured by the General Market Price Index (Indice Geral de Preços — Mercado), compiled by the Getúlio Vargas Foundation (Fundação Getúlio Vargas). However, in 2017 Brazil registered a deflation of 0.53% due to a decrease in the price of food products. In 2018 Brazil registered an inflation of 7.5% due to the depreciation of the Brazilian Real against the U.S. dollar and the increase of the prices of primary products. A significant proportion of our cash costs and our operating expenses are denominated in Brazilian Reais and tend to increase with Brazilian inflation. The Brazilian government’s measures to control inflation have in the past included maintaining a tight monetary policy with high interest rates, thereby restricting the availability of credit and reducing economic growth. This policy has changed in the last two years, when the Brazilian government decreased the interest rate by 775 basis points. Subsequently, the high inflation, arising from the lower interest rate, and the intention to maintain this rate at low levels, led the Brazilian government to adopt other measures to control inflation, such as tax relief for several sectors of the economy and tax cuts for the products included in the basic food basket. These measures were not sufficient to control the inflation, which led the Brazilian government to reinstate a tighter monetary policy. As a result, interest rates have fluctuated significantly. The Special System for Settlement and Custody (Sistema Especial de Liquidação e Custódia, or “SELIC”) interest rate in Brazil at year-end was 13.25% in 2006, 11.25% in 2007, 13.75% in 2008, 8.75% in 2009, 10.75% in 2010, 11.0% in 2011, 7.25% in 2012, 10.0% in 2013, 11.75% in 2014, 14.25% in 2015, 13.75% in 2016, and 7% in 2017 as determined by the Comitê de Política Monetária, or COPOM. In the quarter ended on
December 31, 2018
, the SELIC was 6.5%.
Argentina and/or Brazil may experience high levels of inflation in the future, which may impact domestic demand for our products. Inflationary pressures may also weaken investor confidence in Argentina and/or Brazil, curtail our ability to access foreign financial markets and lead to further government intervention in the economy, including interest rate increases, restrictions on tariff adjustments to offset inflation, intervention in foreign exchange markets and actions to adjust or fix currency values, which may trigger or exacerbate increases in inflation, and consequently have an adverse impact on us. In an inflationary environment, the value of uncollected accounts receivable, as well as of unpaid accounts payable, declines rapidly. If the countries in which we operate experience high levels of inflation in the future and price controls are imposed, we may not be able to adjust the rates we charge our customers to fully offset the impact of inflation on our cost structures, which could adversely affect our results of operations or financial condition.
Depreciation of the Peso or the Real relative to the U.S. Dollar or the Euro may also create additional inflationary pressures in Argentina or Brazil that may negatively affect us. Depreciation generally curtails access to foreign financial markets and may prompt government intervention, including recessionary governmental policies. Depreciation also reduces the U.S. Dollar or Euro value of dividends and other distributions on our common shares and the U.S. Dollar or Euro equivalent of the market price of our common shares. Any of the foregoing might adversely affect our business, operating results, and cash flow, as well as the market price of our common shares.
22
Conversely, in the short term, a significant increase in the value of the Peso or the Real against the U.S. Dollar would adversely affect the respective Argentine and/or Brazilian government’s income from exports. This could have a negative effect on gross domestic product (“GDP”) growth and employment and could also reduce the public sector’s revenues in those countries by reducing tax collection in real terms, as a portion of public sector revenues are derived from the collection of export taxes.
Disruption of transportation and logistics services or insufficient investment in public infrastructure could adversely affect our operating results.
One of the principal disadvantages of the agricultural sector in the countries in which we operate is that key growing regions lie far from major ports. As a result, efficient access to transportation infrastructure and ports is critical to the growth of agriculture as a whole in the countries in which we operate and of our operations in particular. Improvements in transportation infrastructure are likely to be required to make more agricultural production accessible to export terminals at competitive prices. A substantial portion of agricultural production in the countries in which we operate is currently transported by truck, a means of transportation significantly more expensive than the rail transportation available to U.S. and other international producers. Our dependence on truck transportation may affect our position as a low-cost producer so that our ability to compete in the world markets may be impaired.
Even though road and rail improvement projects have been considered for some areas of Brazil and Argentina, and in some cases implemented, substantial investments are required for road and rail improvement projects, which may not be completed on a timely basis, if at all. Any delay or failure in developing infrastructure systems could reduce the demand for our products, impede our products’ delivery or impose additional costs on us. We currently outsource the transportation and logistics services necessary to operate our business. Any disruption in these services could result in supply problems at our farms and processing facilities and impair our ability to deliver our products to our customers in a timely manner.
In Brazil, a strike held by truckers in May 2018 resulted into a complete stop of road transportation throughout the country. As a consequence, the Brazilian government, issued Provisional Measure No. Law No. 13,703/2018 that establishes a Minimum Price for Road Freight Transport Policy and creates the "Freight Table", in which minimum and mandatory values will be defined each six months by the Agência Nacional de Transportes Terrestres - ANTT (National Land Transport Agency). With the creation of the Freight Table, many companies in the agribusiness sector were adversely affected by the increase in transportation costs. Although Law No. 13,703 is still in force, Minister Luiz Fux of the Federal Supreme Court of Brazil recently suspended all lawsuits that contest the legality of the referred policy, which creates legal uncertainty regarding the application of the Freight Table. As long as there is no definition by the Supreme Court, Adecoagro is facing the risk of incurring in higher costs in road transportation, which could significantly affect the costs of our Brazilian operation.
Security breaches and other disruptions could compromise our technology infrastructure and information and expose us to processes disruption and liability, which would cause our business and reputation to suffer.
In the ordinary course of our business, we depend on technology to carry out our business. We also collect and store sensitive data, including intellectual property, our proprietary business information and that of our customers and suppliers, and personally identifiable information of our employees, in our data centers and on our networks. The secure processing, maintenance and transmission of this information is critical to our operations. Despite our security measures, our information technology and infrastructure may be vulnerable to attacks by hackers or breached due to employee error, malfeasance or other disruptions. Any such breach could compromise our networks, our systems, and eventually suffer from systems disruption and/or having the information stored there accessed, publicly disclosed, lost or stolen. Any such access, disclosure or other loss of information could result in legal claims or proceedings, disrupt our operations, damage our reputation, and cause over costs to remedy the harm suffered, which could adversely affect our business/operating margins, revenues and competitive position.
Risks Related to Argentina
Argentine economic and political conditions and perceptions of these conditions in the international market may have a direct impact on our business and our access to international capital and debt markets, and could adversely affect our results of operations and financial condition.
A significant portion of our operations, properties and customers are located in Argentina. The Argentine economy has experienced significant volatility in recent decades, characterized by periods of low or negative growth, high and variable levels of inflation and currency devaluation. Between 2001 and 2003 Argentina experienced a period of severe political, economic and social crisis. In 2002, the enactment of Law No. 25,561 (the “Public Emergency Law”) ended more than a decade of uninterrupted Peso/dollar parity, and the value of the Peso against the U.S. dollar has fluctuated significantly since then.
23
The global economic crisis of 2008 led to a period of economic decline, accompanied by political and social unrest, inflationary and Peso depreciation pressures and lack of consumer and investor confidence. The lingering economic crises in Europe, including the financial crisis in Greece, Spain, Italy and Portugal, the international demand for Argentine products, the stability and competitiveness of the Peso against foreign currencies, confidence among consumers and foreign and domestic investors, the stability and level of inflation and the future political uncertainties, among other factors, may also affect the development of the Argentine economy.
Since 2011, the economic conditions have continued to deteriorate, due to, among other things, the rise of inflation, the continued demand for salary increases, the growth of the fiscal deficit, the required payments to be made on public debt, the reduction of industrial growth, the recession and the increase of the capital outflows from Argentina. The foregoing prevailing economic conditions forced the Argentine government to adopt different measures, including the tightening of foreign exchange controls, the elimination of subsidies to the private sector and the proposals for new taxes. See “—Risks Related to Argentina—Changes in the Argentine tax laws may adversely affect the results of our operations, financial condition and cash flows”.
Since the beginning of 2015, international commodity prices for Argentina’s primary commodity exports have declined, which has had an adverse effect on Argentina’s economic growth. A continued decline in the international prices for Argentina’s main commodity exports could have a direct negative effect on our business, results of operation and financial condition, as well as on Argentina’s economy.
According to the INDEC, Argentina’s GDP, in real terms, grew by 9.2% in 2010, 8.9% in 2011, 1.9% in 2012, 5.6% in 2013 and 0.5% in 2014. The GDP for the first two quarters of 2015 grew by 1.1% and 2.3%, respectively, compared to the same periods in 2014. See “-Risks related to Argentina-The credibility of several Argentine economic indices have been called into question, which may lead to a lack of confidence in the Argentine economy and may in turn limit our ability to access the credit and capital markets” and “-Risks Associated with the Countries in which We Operate-Inflation in some of the countries in which we operate, along with governmental measures to combat inflation, may have a significant negative effect on the economies of those countries and, as a result, on our financial condition and results of operations”. Because of the implementation of certain methodological reforms by the Macri administration and the adjustment of certain indices based on these reforms, the INDEC also revised the GDP data from 2004 through 2015. Among other adjustments, in calculating GDP for 2004, the INDEC made changes to the composition of GDP that resulted in a negative adjustment of approximately 12% for that year. By previously understating inflation, the INDEC had overstated economic growth in real terms. The adjustments made by the INDEC lead to a determination of real GDP growth of 48.6% for the period of 2004 to 2015, as opposed to 65% growth in real terms for the same period resulting from the information used prior to June 2016. Because of these reforms, on November 9, 2016, the Executive Board of the IMF lifted its censure on Argentina, noting that Argentina had resumed the publication of data in a manner consistent with its obligations under the Articles of Agreement of the IMF. On June 29, 2017, INDEC also published revised GDP data for the years 2004 through 2015. According to the INDEC, Argentina’s GDP grew by 2.9% in 2017, compared to the same period in 2016. Additionally, according to the INDEC, Argentina’s GDP decreased 1.4% from January to September 2018, compared to the same period in 2017. The official information related to the GDP of the fourth quarter of 2018 has not been published by the INDEC yet.
In the recent past, social and political tension and high levels of poverty and unemployment have persisted and in recent months industrial activity and consumption has diminished considerably. The deterioration of the economy significantly increased the social and political turmoil, including civil unrest, riots, looting, nationwide protests, strikes and street demonstrations. Due to the high levels of inflation and devaluation, employers both in the public and private sectors are experiencing significant pressure from organized labor unions and their employees to further increase salaries. See “—Risks related to Argentina—The Argentine government may order salary increases to be paid to employees in the private sector, which would increase our operating costs”.
In addition, during the recent past the Argentine Central Bank’s reserves have suffered a substantial decrease mainly as a consequence of the increasing need to import energy and payments of sovereign debt. The reduction of the Argentine Central Bank’s reserves may weaken Argentina’s ability to overcome economic deterioration. This could inhibit the ability of the Argentine Central Bank to adopt measures to curb inflation and could adversely affect Argentina’s economic growth and public finances.
A continued deterioration of the economic, social and/or political conditions may adversely affect the development of the Argentine economy and force the Macri administration to adopt future policies including forced renegotiation or modification of existing contracts, suspension of the enforcement of creditors’ rights, new taxation policies, including royalty and tax increases and retroactive tax claims, and changes in laws and policies affecting foreign trade and investment and salary increases, and/or the provision of additional employee benefits. Any such economic, social and/or political conditions and/or measures could materially affect our business, results of operations and financial condition.
24
The current Argentine administration’s ability to implement economic reforms may be limited.
Argentine presidential, congressional and state government elections were held during 2015 (with the majority of such elections occurring in October 2015). Presidential elections were won by the opposing political party, led by Mauricio Macri, after conducting the first run-off in Argentine history. The elected government, in office since December 10, 2015, has announced and adopted several significant economic and policy reforms:
|
•
|
INDEC Reforms: On January 8, 2016, based on the determination that the INDEC has failed to produce reliable statistical information, particularly with respect to the CPI, GDP, poverty and foreign trade data, the Macri administration declared the national statistical system and the INDEC in a state of administrative emergency. As a result, the INDEC ceased publishing certain key statistical data until a rearrangement of its technical and administrative structure is finalized. In June 2016, the INDEC resumed its publication of the CPI. As of the date of this annual report, the INDEC has begun publishing certain revised data, including GDP, foreign trade and balance of payment statistics, although it remains in a state of administrative emergency. On June 29, 2017 INDEC also published revised GDP data for the years 2004 through 2015.
|
|
•
|
Agreement with holdout creditors: The Macri administration settled the substantial majority of outstanding claims brought by holdout creditors and issued sovereign bonds in the international financial markets passed by Congress through Law No. 27,249. Although the size of the claims involved has decreased significantly, litigation initiated by bondholders that have not accepted Argentina’s settlement offer continues in several jurisdictions.
|
|
•
|
Foreign Exchange Reforms: The elected government eliminated most foreign exchange restrictions, including certain currency controls, which were imposed by the previous administration.However, due to the foreign exchange crisis, soaring inflation and plummeting economic activity during the first half of 2018, on November 8, 2018 the Argentine Central Bank issued Communication “A” 6595 imposing on financial entities a minimum cash requirement equal to 23% up to 29 days; 17% between 30 and 59 days; 11% between 60 and 89 days; 5% between 90 and 179 days; 2% between 180 and 365 days; and 0% for more than 365 days on obligations with international financial facilities; which, however, was repealed on January 1, 2019. In addition, effective October 1, 2018, the Argentine Central Bank defined foreign exchange intervention and non-intervention zones for the U.S. dollar exchange rate until the end of 2018, at Ps.34 per U.S. dollar in the lower bound and Ps.44 per U.S. dollar in the upper bound. Such rates are adjusted daily; provided that beyond the upper bound, the Argentine Central Bank may sell foreign currency for a daily amount of up to US$50 million, and beyond the lower bound, the Argentine Central Bank may increase the monetary base backed with the increase of the federal reserves. As of April 26, 2019, the non-intervention zones were fixed at Ps. 39.755 per U.S. dollar in the lower bound and Ps. 51.448 per U.S. dollar in the upper bound. See “-Risks related to Argentina-Exchange controls could restrict the inflow and outflow of funds in Argentina”.
|
|
•
|
Foreign trade reforms. The Macri administration eliminated export duties on wheat, corn, beef and regional products, and reduced the duty on soybeans from 35% to 30%. Further, the 5% export duty on most industrial and mining exports was eliminated. With respect to payments for imports of goods and services, the Macri administration announced the elimination of limitations for access to the Foreign Exchange Market for any new transactions as of December 17, 2015, and for existing debts incurred in connection with imports of goods and services as of April 22, 2016. On January 2, 2017, the federal government enacted a further reduction of the export duties rate set for soybean and soybean products, setting a monthly 0.5% cut on the export duties rate beginning on January 2018 and until December 2019. However, on September 4, 2018, Decree No. 793/2018 was published which establishes an export duty of 12% on the export for consumption of all merchandise included in tariff positions of the Common Mercosur Nomenclature through December 31, 2020. This export duty may not exceed 4 pesos per U.S. dollar of the taxable value or the official FOB price, as applicable. Additionally, on December 4, 2018, the current Argentine administration imposed duties on the exportation of services (and not only goods) and allowed the Executive Power to impose export duties of up to 30% until December 31, 2020, with a maximum rate of 12% for services and goods that were not subject to export duties before September 2, 2018.
|
|
•
|
Fiscal policy: The Macri administration took steps to anchor fiscal accounts, reduce the primary fiscal deficit, eliminate subsidies, reorganize certain expenditures and generate increased revenue through a tax amnesty program. The fiscal deficit for 2017 was approximately 3.9% of GDP, 0.3% lower than expected; reducing fiscal deficit is one of the most important objectives for the administration in the coming years. Due to the foreign exchange crisis in the second half of 2018, the Argentine government implemented a series of measures aiming at reducing the fiscal deficit drastically for the incoming years, including the suspension of public infrastructure works, the depreciation of the Argentine peso, the re-imposition of export duties, the request of a stand-by loan agreement with the IMF and the elimination of the Supportive Federal Fund (by which the Federal Government distributed 30% of the proceeds of
|
25
the export duties on soybean and soybean products to the provinces and municipalities), among other things. For the incoming years, the Argentine government targets a primary fiscal deficit of 0% of the GDP for 2019 and a primary fiscal surplus of 1% of the GDP for 2020.
|
•
|
Infrastructure state of emergency and reforms. The Macri administration issued Resolution No. 6/2016 of the Ministerio de Energía y Minería de la Nación (National Ministry of Energy and Mining) and Resolution No. 1/2016 of the Ente Nacional Regulador de la Electricidad (National Electricity Regulatory Agency), through which the Macri administration announced the elimination of some energy subsidies currently in effect and a substantial increase in electricity rates. Additionally, the government declared a state of emergency with respect to the national electrical system, which remained effective until December 31, 2017. Under this state of emergency, the Macri administration was permitted to take actions designed to guarantee the supply of electricity.In addition, the Macri administration announced the elimination of certain natural gas subsidies and adjustments to natural gas rates.
|
|
•
|
Correction of monetary imbalances: The Argentine administration has adopted an inflation targeting regime in parallel with the floating exchange rate regime and set inflation targets for the next few years. The Central Bank has increased stabilization efforts to reduce excess monetary imbalances and raised peso interest rates to offset inflationary pressure. However, the goals for 2016 and 2017 have not been met, and the Central Bank has recently announced an increase on the inflation target ranges for 2018 (from between 8% and 12% to 27%); and 2019 (from between 3.5% and 6.5%, to 17%). The inflation for 2017 arose to 24.8%, and for 2018, fostered by a depreciation of 103.83% of the Argentine peso to the U.S. dollar, soared to 47.6%. The official estimation of inflation for 2019 is 29%, while private sources predict an inflation of 35% for the same period. Since October 1, 2018, in addition to the creation of the foreign exchange intervention and non-intervention zones, the Argentine Central Bank adopted a policy of zero currency issuance. Therefore, the Argentine Central Bank recalculated the inflation targets for 2019 and 2020 to 27.8% and 19.6%, respectively.
|
|
•
|
Tax Amnesty Law: On June 29, 2016, the Argentine Congress passed Law No. 27,260, which became effective on July 22, 2016 and provides for a tax amnesty regime and tax reform. This regime allowed individuals and entities to disclose undeclared assets both abroad and in Argentina, under the conditions set forth in the law and within a period extending from its effectiveness until March 31, 2017, without the need to repatriate such assets to Argentina and without penalty (other than charges described below) or the need to explain the source of the funds, among other benefits. The law also provides that there will be no charge on assets worth up to US$25,000, and a discounted applicable tax of 5% on property and assets worth up to US$80,000. Above that threshold, the applicable tax was 10% until the end of 2016 and 15% until the end of March 2017, when the amnesty window closed.
|
|
•
|
Corporate Criminal Liability Law (
Ley de Responsabilidad Penal Empresaria
): On November 8, 2017, the Argentine Congress passed Law No. 27,401 which provides for the criminal liability of corporate entities when the following crimes are committed, directly or indirectly: (a) local or international bribery and influence peddling, (b) negotiations that are incompatible with public office, (c) illegal payments made to public officials under the appearance of taxes or fees owed to the relevant government agency, (d) illegal enrichment of public officers and employees, and (e) producing knowingly false balance sheets and reports to cover up local or international bribery or influence peddling. Companies found liable for committing such crimes may be subject to various sanctions and penalties, including, among others, fines ranging from two to five times the ‘‘undue’’ benefit that was obtained or that could have been obtained through the actions incurred in breach of this regulation. Additionally, Companies found liable may forfeit assets obtained through the illegal actions. The law became effective on March 1, 2018.
|
|
•
|
Amendment to Labor Risks Law: On February 15, 2017, the Argentine congress passed Law 27,348, which amends and complements Labor Risks Law No. 24,557, or the Labor Risks Law, and aims to reduce litigation arising from accidents at work. Under the new regime, prior to filing a lawsuit resulting from work-related accidents, affected workers must go through jurisdictional medical commissions, in order to assess the impact of any accident and to assign benefits provided for under the Labor Risks Law.
|
|
•
|
Capital Markets Reform. On May 9, 2018, the Argentine Congress passed the Productive Financing Law No. 27,440, which reformed, among others, the Capital Markets Law No. 26,831, generally modernizing the entire regulatory framework applicable to the Argentine capital market by incorporating current international practices to contribute to its development. The Argentine Securities Commission (Comisión Nacional de Valores) (“CNV”) has also issued several regulations in line with such reform and currently continues issuing additional resolutions subject to public opinion.
|
26
|
•
|
Social Security Reform Law: On December 28, 2017 Argentine Law No. 27,426 was promulgated. The law provides for modifications to the method of calculation of increases of social security benefits.
|
|
•
|
Labor Reform Draft Bill: The Argentine administration recently announced a draft bill to reform labor and social security which was sent to the Argentine congress for debate on November 21, 2017. On November 29, 2017, the draft bill was passed by the Argentine senate, and sent to the Argentine congress. The draft bill aims to improve competitiveness and efficiency of various sectors, increase employment, attract investment and reduce labor costs.
|
|
•
|
Tax Regime: On December 27, 2017, a draft bill proposing a series of tax and social security reforms was approved by the Argentine congress by means of Law No. 27,430. The law provides for a series of tax and social security reforms intended to eliminate certain existing complexities and inefficiencies of the Argentine tax regime, reduce tax evasion, increase the coverage of income tax as applied to individuals and encourage investment while sustaining the Argentine administration’s medium- and long-term efforts aimed at restoring fiscal balance. The reforms introduced with this law are part of the agenda of the Argentine administration to improve the competitiveness of the Argentine economy (including the reduction of the fiscal deficit), to increase employment and diminish poverty on a sustainable basis. Decree No. 279/2018, published in the Official Gazette on April 7, 2018, regulated the income tax treatment applicable to non-Argentine residents, who receive income or obtain capital gains arising from the investment in financial assets in Argentina. The reform did not substantially modify the tax treatment set forth in Law No. 26,893 to gains recognized by nonresidents on the sale of shares, quotas or other equity participations in Argentine companies as well as “other securities” of Argentine residents. However, it shifted the tax liability from nonresident purchasers to nonresident sellers. Beginning January 1, 2018, when a nonresident seller sells shares or quotas in an Argentine company to a nonresident buyer, the seller must pay Argentine income tax on the capital gains through its legal representative in Argentina. In April 2018, the General Resolution No. 4,227 of the AFIP, established the payment mechanism for the Argentine income tax on capital gains. Furthermore, Decree No. 813/2018, published in the Official Gazette on September 11, 2018, introduced several amendments to Regulatory Decree No. 692/1998, which regulates the Argentine Value Added Tax Law. The main amendments were made in relation to: (i) substitute taxpayers for the payment of the Value Added Tax corresponding to individuals or entities domiciled or resident abroad who render services within Argentina subject to the tax; (ii) digital services provided by individuals or entities domiciled or resident abroad when the effective use or exploitation is carried out in Argentina; (iii) the mechanism for the refund of tax credits generated in the purchase, construction, manufacture, processing or importation of capital assets; and (iv) the mechanism for the recovery of accumulated tax balance by public service companies. On December 27, 2018 Decree No. 1170 was published in the Official Gazette, which amended the regulatory decree of the Income Tax Law, in accordance with the amendments introduced by Law No. 27,430. In addition, pursuant to the amendment to the personal assets tax law approved by Law No. 27,480, enacted on December 5, 2018, for fiscal year 2019 the minimum taxable amount is Ps.2 million. For taxpayers domiciled in Argentina, the tax rate would still be 0.25% if the aggregate amount of declared assets is between Ps.2 million and Ps.5 million, but it would increase to 0.5% on the excess of Ps.5 million if the declared assets are of between Ps.5 and Ps.20 million and to 0.75% on the excess of Ps.20 million if the value of informed assets is higher than Ps.20 million. For individuals and entities not domiciled in Argentina, the tax rate would be maintained at 0.25%, irrespective of the value of the taxable assets.
|
|
•
|
Limitation of Bureaucracy and Simplification: On January 11, 2018, Decree No. 27/2018, or Decree 27/2018, was published in the Argentine Official Gazette, with the objective to reduce government bureaucracy and approve new practices which reduce costs and boost competitiveness.
|
|
•
|
Antitrust Law. On May 24, 2018, the Argentine Congress passed Law No. 27,442, which introduced several changes to the former Antitrust Law No. 25,156, as follows: (i) it envisages the creation of a National Competition Authority, as opposed to having a “dual” authority which will oversee an Antritrust Tribunal and two Secretaries, namely the Secretaria de Conentraciones Económiacas and the Secretaria de Investigaciones de Conductas Anticompetitivas; (ii) in terms of supervising potential mergers, it increases the volume of business’ threshold and provides for the adoption of a suspensory regime, by means of which the parties to a reportable transaction will not be able to close it until they receive authorization from the authority; and (iii) in terms of anticompetitive conducts, it substantially increases fines and presumes that there exists certain conduct that is deemed to be absolutely restrictive to competition and, therefore, illegal per se (i.e. “hard core cartels”). The current non-suspensory regime shall continue to apply until the creation of the National Competition Authority.
|
We cannot predict the impact that these policies or any future polices implemented by the Macri administration or any other national government will have on the Argentine economy as a whole or on our business, results of operation or financial condition, in particular. Moreover, there is uncertainty as to when and if other measures announced during the presidential campaign will be implemented. Some of the measures proposed by the Macri administration may also generate political and social opposition, which
27
may in turn prevent the new government from adopting such measures as proposed. In addition, political parties opposed to the new government retained a majority of the seats in the Argentine Congress in the recent elections, which will require the new government to seek political support from the opposition for its economic proposals and creates further uncertainty in the ability of the new government to pass measures. Political uncertainty in Argentina relating to the measures to be taken by the Macri administration in respect of the Argentine economy could lead to volatility in the market prices of securities of Argentine companies.
The result of the next presidential and provincial elections that will take place in 2019 could generate uncertainty in the Argentine economy and, consequently, in our businesses and the results of our operations.
Argentina's national election for president and vice-president will take place in October 2019, and other relevant local and federal elections will also take place in 2019. The impact that the electoral process and its results could have on the policies and the economy of Argentina is uncertain.
Additionally, it is not possible to predict the measures that may be adopted by the next administration at the national or provincial level, which could have a substantially adverse effect on the economy. We cannot guarantee that current programs and policies that apply to the agricultural sector will continue in place in the future. See “Government intervention in Argentina may have a direct impact on our prices and sales” and “An increase in export and import duties and controls may have an adverse impact on our sales”
The Argentine economy has been adversely affected by economic developments in other markets.
Financial and securities markets in Argentina, and also the Argentine economy, are influenced by economic and market conditions in other markets worldwide, including those relating to a potential trade war between China and the United States. Although economic conditions vary from country to country, investors' reactions to events occurring in one country sometimes demonstrate a "contagion" effect in which an entire region or class of investment is disfavored by international investors.
Consequently, there can be no assurance that the Argentine financial system and securities markets will not continue to be adversely affected by events in developed countries' economies or events in other emerging markets, which could in turn, adversely affect the Argentine economy and, indirectly, our business, financial condition and results of operations, and the market value of our securities.
The economy of Argentina may be affected by its government’s limited access to financing from international markets.
The Argentine economy has experienced significant instability in the past decades, including devaluations, high inflation, and prolonged periods of reduced economic growth, which have led to payment defaults on Argentina’s foreign debt and multiple downgrades in Argentina’s foreign debt rating with attendant restrictions on Argentina’s ability to obtain financing in the international markets.
Argentina’s 2001 sovereign default and its failure to fully restructure its sovereign debt and negotiate with the holdout creditors has limited and may continue to limit Argentina’s ability to access international financing. In 2005, Argentina completed the restructuring of a substantial portion of its indebtedness and settled all of its debt with the IMF. Additionally, in June 2010, Argentina completed the restructuring of a significant portion of the defaulted bonds that were not exchanged in the 2005 restructuring. As a result of debt exchanges carried out in 2005 and 2010, Argentina restructured approximately 93% of its defaulted debt that was eligible for restructuring. However, holdout bondholders that declined to participate in the restructuring, filed lawsuits against Argentina in several countries, including the United States. Since late 2012, rulings from courts in the United States favorable to holdout bondholders aggravated investors’ concerns regarding investment in the country.
In November 2012, the United States District Court for the Southern District of New York in re: “NML Capital, Ltd. v. Republic of Argentina”, ratified and amended the injunction order issued in February 2012, which held that Argentina violated the pari passu clause with respect to the bondholders that had not participated in the sovereign debt restructuring in 2005 and 2010. Pursuant to such ruling, Argentina was required to pay 100% of the amounts due to the plaintiffs, simultaneously with the payment of the amounts due on the next maturity date of the bonds to the bondholders who participated in the debt restructuring. In June 2014, the U.S. Supreme Court denied Argentina’s petition for a writ of certiorari of the U.S. Second Circuit Court of Appeals’ ruling affirming the U.S. District Court’s judgment. Later that month, the U.S. District Court ruled that funds deposited with the Bank of New York Mellon, the trustee which manages payments for Argentina's bonds issued in the 2005 and 2010 debt restructuring, could not be delivered to the holders of restructured debt in the absence of a prior agreement with the holdout bondholders. In June 2015, the U.S. District Court granted partial summary judgment to a group of “me-too” plaintiffs in 36 separate lawsuits,
28
finding that, consistent with the previous ruling of such court, Argentina violated the pari passu clause in the bonds issued to the “me-too” bondholders.
In February 2016, the Macri administration entered into settlement agreements with certain holdout bondholders to settle these claims, which were subject to the approval of the Argentine Congress and the lifting of the pari passu injunctions. In March 2016, after the U.S. District Court agreed to vacate the pari passu injunctions subject to certain conditions, the Argentine Congress ratified these settlement agreements through Law No. 27,249 and repealed the provisions of the so called Lock Law No. 26,017 and the Sovereign Payment Law No. 26,984, which prohibited Argentina from offering holdout bondholders more favorable terms than those offered in the 2005 and 2010 debt restructuring. In recent months, the Argentine national government has reached settlement agreements with holders of a significant portion of the defaulted bonds and has repaid the majority of the holdout creditors with the proceeds of a US$16.5 billion international offering of 3-year, 5-year, 10-year and 30-year bonds on April 22, 2016. Although the size of the claims involved has decreased significantly, litigation initiated by bondholders that have not accepted Argentina’s settlement offer continues in several jurisdictions.
Additionally, foreign shareholders of several Argentine companies have filed claims with the ICSID alleging that the emergency measures adopted by the Argentine national government since the crisis in 2001 and 2002 differ from the just and equal treatment standards set forth in several bilateral investment treaties to which Argentina is a party. ICSID has ruled against Argentina with respect to many of these claims.
Litigation involving holdout creditors, claims with ICSID and other claims against the Argentine national government, resulted and may result in material judgments against the government, lead to attachments of or injunctions relating to Argentina’s assets, or could cause Argentina to default under its other obligations, and such events may prevent Argentina from obtaining favorable terms or interest rates when accessing international capital markets or from accessing international financing at all. Our ability to obtain U.S. dollar-denominated financing has been adversely impacted by these factors. During
2016
,
2017
and
2018
, it became increasingly difficult for Argentine companies to obtain financing in U.S. dollars, and loans in local currencies carry significantly higher interest rates. The termination of the injunctions issued by the United States courts preventing bondholders from receiving their interest payments on the bonds issued pursuant to the 2005 and 2010 exchange offers, and the related subsequent events, have paved the way for the Argentine national government to regain access to the international capital markets. Nonetheless, Argentina’s ability to obtain international or multilateral private financing or direct foreign investment may be limited, which may in turn impair its ability to implement reforms and public policies to foster economic growth. In addition, Argentina’s ongoing litigation with the remaining holdout creditors as well as ICSID and other claims against the Argentine national government, or any future defaults of its financial obligations, may prevent us from accessing the international capital markets or cause the terms of any such transactions less favorable than those provided to companies in other countries in the region, potentially impacting our financial condition.
Without access to international private financing, Argentina may not be able to finance its obligations, and financing from multilateral financial institutions may be limited or not available. This could also inhibit the ability of the Argentine Central Bank to adopt measures to curb inflation and could adversely affect Argentina’s economic growth and public finances, which could, in turn, adversely affect our operations in Argentina, our financial condition or the results of our operations.
The Executive Board of the International Monetary Fund has approved a three-year Stand-By Arrangement for Argentina amounting to US$57.1 billion, following an agreement on an economic plan to be implemented by the Argentine authorities; however, there can be no assurance that such plan will meet its objectives in supporting the Argentine government’s economic priorities, nor are we able to predict what the future consequences will be for the Argentine economy in general or our business in particular.
The Argentine government requested IMF financial support in late May 2018 to help strengthen the Argentine economy in light of the recent financial market turbulence. In early June 2018, Argentina and IMF staff reached an agreement on an economic plan that could be supported by IMF financing in the form of a Stand-By Arrangement for $50.0 billion, and on June 20, 2018, the IMF’s Executive Board approved such plan and the consequent three-year Stand-By Arrangement, and on June 21, 2018, the IMF made the first disbursement of US$15 billion.
On September 2018 the Argentine government negotiated an extension to the Stand-By Arrangement from $50.0 billion to $57.1 billion. By the end of October 2018, the IMF made the second disbursement of $5.7 billion and by the end of December made a third disbursement of $7.6 billion. On April 5, 2019 the IMF approved the fourth disbursement under the Stand-By Arrangement of $10.8 billion.
The purpose of the Stand-By Arrangement is to support the Argentine government’s economic priorities, which include strengthening the Argentine economy and protecting the living standards of the Argentine people.
29
The Argentine government has stated that it intends to take measures to accelerate the pace at which the federal government’s fiscal deficit is reduced. This measure is expected to ultimately lessen the government’s financing needs and put public debt on a downward path.
In addition, the Argentine government’s economic plan intended to put in place measures to offer opportunity and support to the less well-off members of Argentine society. The authorities have committed to ensuring that spending on social assistance, as a share of gross domestic product, will not decline during the next three years.
As of the date of this report, we cannot guarantee that the financing package will be sufficient to enable the Argentine government to achieve the goals of its economic plan, nor are we able to predict what the future consequences will be for the Argentine economy in general or our business in particular.
Argentine law concerning foreign ownership of rural properties may adversely affect our results of operations and future investments in rural properties in Argentina.
Law No. 26,737, passed by the Argentine Congress in December 2011, and its implementing regulation Decree No. 274/2012, as amended and supplemented by Decree No. 820/2016 dated as of February 28, 2012 and of June 30, 2016, respectively, impose limits on the ownership or possession of rural land by foreign legal entities or certain foreign individuals.
Law No. 26,737 and its implementing regulation require that, “foreign ownership” of rural land may not exceed 15% of the total amount of rural land in the Argentine territory calculated also in relation to the territory of the Province, Department or Municipality where the relevant lands are located. For purposes of the law, “foreign ownership” means the ownership (whether by acquisition, transfer, assignment of rights or otherwise) over rural land by: (i) foreign individuals, regardless of whether they are Argentine residents or not; (ii) legal entities where foreign individuals or entities own, whether directly or indirectly, a number of votes sufficient to prevail in the local entity´s decision-making process. It is presumed that foreign legal entities where more than 51% of the stock is directly or indirectly owned by foreign individuals or entities are subject to Law No. 26,737; (iii) companies that issue bonds (a) convertible in stock representing 51% or more of the company’s stock upon conversion and (b) whose holders are foreign individuals or entities; (iv) trusts whose beneficiaries are foreign individuals or entities, as defined pursuant to (i) and (ii) above; (v) joint ventures in which foreign entities or individuals hold a participating interest higher than those set forth by the law; (vi) foreign public law-governed legal entities; and (vii) simple associations or de facto corporations in which foreigners hold shares in the percentage set forth by the new law in relation to corporations or which are controlled by foreigners.
Law No. 26,737 created a National Registry of Rural Land (
Registro Nacional de Tierras Rurales
) in charge of the enforcement of the provisions of the law and registry of rural land.
Any modification to the capital stock of companies that own or possess rural land, by public or private instrument, that implies a direct or indirect change of control, must be reported to the National Registry of Rural Land within 30 days from the date of such modification.
In addition, foreign entities or individuals of the same nationality may not own more than 4.5% of rural land in Argentina and a single foreign entity or individual may not own more than 1,000 hectares in the “core area”, or the “equivalent surface”, as determined by the Interministerial Council of Rural Land (Consejo Interministerial de Tierras Rurales) in accordance with the provinces’ proposal, specifying districts, sub-regions or areas and taking into consideration the location of the land, the proportion of the land area in respect of the total territory of the relevant Province, Department or Municipality and, the quality of the land for use and exploitation. The “equivalent surface” regime may be modified by the Interministerial Council of Rural Lands (Consejo Interministerial de Tierras Rurales) taking into account possible changes in the quality of the land or the growth of urban populations. Pursuant to Decree No. 274/2012, as amended and supplemented by Decree No. 820/2016 the departments that comprise the “core area” are: Marcos Juarez and Union in the Province of Córdoba; Belgrano, San Martin, San Jeronimo, Iriondo, San Lorenzo, Rosario, Constitución, Caseros and General Lopez in the Province of Santa Fe; and the districts of Leandro N. Alem, General Viamonte, Bragado, General Arenales, Junin, Alberti, Rojas, Chivilcoy, Chacabuco, Colon, Salto, San Nicolas, Ramallo, San Pedro, Baradero, San Antonio de Areco, Exaltacion de La Cruz, Capitan Sarmiento, San Andres de Giles, Pergamino, Arrecifes and Carmen de Areco in the Province of Buenos Aires.
Foreign legal entities or individuals may not own rural land that contain or are located beside permanent and significant bodies of water to be determined by the Federal Hydrological Council (
Consejo Hídrico Federal
) and may also include hydrological works and projects considered strategic and of public interest.
Acquisition of rural land will not be deemed as an “investment” under bilateral investment treaties signed by the Argentine Republic, since rural land is deemed as “a non-renewable natural resource”.
30
The regulatory decrees of Law No. 26,737 provide that no previous authorization certificate is required for certain operations such as (i) the transfer of the property or possession rights over real estate properties that were located in an “Industrial Area” or an “Industrial Park”, independently from the acquirer’s nationality, (ii) any modification to the capital stock of companies that own or possess rural land, by public or private instrument, when such modification implies a direct or indirect change of control, provided that such change of control is not made in favor of a new foreign legal entity or individual; and (iii) creation of certain real property rights over the rural land, such as easements.
Upon the issue of Decree No. 820/2016, the effects of Law No. 26,737 have been somewhat mitigated, by setting forth a term of 90 days during which the foreign legal entity or individual that has exceeded the allowed limit of ownership of rural land must reduce their current ownership to the legal limit by (i) transferring or causing any of its controlled legal entities to transfer the amount of rural land that exceeds the legal limit, or (ii) modifying or causing any of its controlled legal entities to modify the type of exploitation awarded to rural lands owned by such foreign legal entity, or (iii) transferring its participation to legal entities that are considered compliant pursuant to the terms of Law No. 26,737.
Law No. 26,737 initially stated that, even though no vested rights could be affected as a result of the application of such law, any act in violation of its provisions would be considered null and void. Decree No. 820/2016 clarified this situation and established that the foreign entities or individuals who owned rural land in excess to the allowed limit of ownership when the Law No. 26,737 came into effect (i) are not obliged to transfer such rural land in excess, and (ii) in the event of transfer of rural lands acquired before Law No. 26,737 was in force, they can acquire the equivalent to such transferred rural land, provided the legal limits established to the type of exploitation and location. Hence, the application of laws regarding foreign ownership of rural lands does not have an adverse effect on the current rural land owned by our Argentine subsidiaries. However, our Argentine subsidiaries may be prevented from acquiring additional rural land in Argentina, which may adversely affect our financial condition and results of our operations.
Our results of operations may be adversely affected by high and possibly increasing inflation in Argentina.
In the past, inflation has materially undermined the Argentine economy and the government’s ability to create conditions that would permit stable growth. High inflation may also undermine Argentina’s foreign competitiveness in international markets and adversely affect economic activity and employment, as well as our business and results of operation. In particular, the profit margin on our services is impacted by the increase in our costs in providing those services, which is influenced by wage inflation in Argentina, as well as other factors.
According to data published by the INDEC, the CPI increased 23.9% in 2014 and 11.9% as of October 2015 (for the first nine months of year 2015). In November 2015, the INDEC suspended the publication of the CPI. According to the most recent publicly available information based on data from the Province of San Luis, the CPI grew by 31.6% in
2017
and by 31.4% in
2018
. According to the most recent publicly available information based on data from the City of Buenos Aires, the CPI grew by 29.6% in
2017
and by 41.0% in
2018
. After implementing certain methodological reforms and adjusting certain macroeconomic statistics based on these reforms, in June 2016 the INDEC resumed its publication of the CPI. According to the INDEC, the monthly CPI increase in 2017 was 1.3% in January, 2.5% in February, 2.4% in March, 2.6% in April, 1.3% in May, 1.2% in June, 1.7% in July, 1.4% in August, 1.9% in September, 1.5% in October, 1.4% in November and 3.1% in December. In 2018, the monthly CPI increase was 1.8% in January and 2.4% in February. INDEC has also published inflation figures for the Wholesale Price Index (Índice de Precios Internos al por Mayor or “WPI”), for 2018, reporting a monthly increase of 4.6% in January and 4.8% in February. The WPI for the year ended December 31, 2017 showed an annual increase of 18.8%. The WPI for the year ended December 31, 2016 showed an annual increase of 34.5%. The WPI for the Transition Period showed an increase of 7.4%.
Uncertainty surrounding future inflation rates may have an adverse impact for Argentina in the long-term credit market.
The Argentine economy has experienced significant volatility in past decades, including numerous periods of low or negative growth and high and variable levels of inflation and currency devaluation. Inflation remains a challenge for Argentina given its persistent nature in recent years and also considering its high levels during 2018. No assurances can be given that the rate of growth experienced over past years will be achieved in future years or that the national economy will not suffer recession. If economic conditions in Argentina were to slow down, or contract, if inflation were to accelerate further, or if the Argentine government's measures to attract or retain foreign investment and international financing in the future to incentivize domestic economy activity are unsuccessful, such developments could adversely affect Argentina's economic growth and in turn affect our financial health and results of operations.
The Argentine Government has announced its intention to reduce the primary fiscal deficit as a percentage of GDP over time and reduce the government's reliance on Central Bank financing. If the measures adopted by the Macri administration are not able to resolve the structural inflationary disruptions of Argentina, the current inflationary levels could subsist and have a negative
31
impact on the economic and financial conditions of Argentina, and as such affect our operations and financial situation. Inflation can also lead to an increase in Argentina's debt and have an adverse effect on Argentina's ability to service its debt, mainly in the medium and long term when most inflation-indexed debt matures. In addition, weaker fiscal results could have a material adverse effect on the Government's ability to access long term financing, which, in turn, could adversely affect Argentina's economy and financial condition and access to international or domestic capital markets.
Current conditions make the application of IAS 29 for our Argentine subsidiaries mandatory .Accordingly, IAS 29 is applicable for financial statements included in any of our filings with the SEC under the Securities Act or the Exchange Act for periods ending after July 1, 2018. We cannot predict the future impact that the application of IAS 29 and related adjustments will have on our Argentine subsidiaries’ financial statements or the effects on our business, results of operations and financial condition. Also, we cannot predict when the application of IAS 29 will no longer be mandatory. We will to continue to apply IAS 29 until such time as the cumulative three-year inflation rate is equal to or less than 70%.
See Item 3 - Presentation of financial and other information - Financial reporting in a hyperinflation economy.
Failure to adequately address actual and perceived risks of institutional deterioration and corruption may adversely affect Argentina's economy and financial condition.
A lack of a solid and transparent institutional framework for contracts with the Argentine government and its agencies and corruption allegations have affected and continue to affect Argentina. Argentina ranked 85 of 180 in the Transparency International's 2018 Corruption Perceptions Index and 117 of 190 in the World Bank's Doing Business 2018 report.
As of the date of this annual report, there are various ongoing investigations into allegations of money laundering and corruption being conducted by the Office of the Argentine Federal Prosecutor, including the largest such investigation, known as Los Cuadernos de las Coimas (the "Notebooks Investigation") which have negatively impacted the Argentine economy and political environment. Depending on how long it takes to close these investigations and their results, companies involved in the investigations may be subject to, among other things, a decrease in their credit ratings, claims filed by their investors, and may further experience restrictions in their access to financing through the capital markets, together with a decrease in their income. Additionally, as the criminal cases against the companies involved in the investigations move forward, said companies may be restricted from rendering services or may face new restrictions, due to their customers' internal standards. These adverse effects could restrict these companies' ability to conduct their operating activities and to meet their financial obligations. As a consequence of the above, the number of suppliers available for our operations may be reduced and, as such, we may experience an adverse effect on our commercial activities and results of operations.
The Argentine government's ability to implement initiatives aimed at strengthening Argentina's institutions and reducing corruption is uncertain as it would be subject to independent review by the judicial branch, as well as legislative support from opposition parties. We cannot give any assurance that the implementation of these measures by the Argentine government will be successful in stopping institutional deterioration and corruption.
The credibility of several Argentine economic indices has been called into question, which may lead to a lack of confidence in the Argentine economy and may in turn limit our ability to access the credit and capital markets.
Between 2007 and 2014, the inflation index determined by INDEC has been the subject of widespread criticism and extensive discussions in connection with analysis of the Argentine economy. The intervention of the former Argentine government in the INDEC in 2007 and the change in the way the inflation index was measured have resulted in disagreements between the former Argentine government and private consultants as to the actual annual inflation rate. The former Argentine government imposed fines on private consultants reporting inflation rates higher than the INDEC data. As a result, private consultants typically shared their data with Argentine lawmakers who opposed the previous government, and who released such data from time to time. The widespread disagreements had the negative effect of eroding public confidence in Argentina’s economy.
Reports published by the International Monetary Fund (“IMF”) in the past state that their staff uses alternative measures of inflation for macroeconomic surveillance, including data produced by private sources, which have shown considerably higher inflation rates than those published by the INDEC since 2007. The IMF has also criticized Argentina for not taking sufficient remedial measures to address the quality of its official data, including inflation and GDP data, as required under the Articles of Agreement of the IMF.
32
In February 2014, the INDEC released a new inflation index, known as National Urban Consumer Price Index (
Índice de Precios al Consumidor Nacional Urbano
) that measured the prices of goods across the country and replaced the previous index that only measured inflation in the urban sprawl of the City of Buenos Aires. Pursuant to these calculations, such new consumer price index rose 23.9% in 2014 and 11.9% during the ten-month period ended October 31, 2015. Even though the new methodology brought inflation statistics closer to those estimated by private sources, material differences between recent official inflation data and private estimates remained during 2015.
However, during December 2015 and January 2016, the new government declared the national statistical system and the INDEC to be in a state of administrative emergency through December 31, 2016. Accordingly, the new head of the INDEC announced the temporary suspension of the publication of official data of prices, poverty, unemployment and GDP until the completion of a full review of INDEC’s policies. Shortly thereafter, the new administration released an alternative CPI index based on data from the City of Buenos Aires and the Province of San Luis. The INDEC resumed its publication of the CPI in June 2016, after implementing certain methodological reforms and adjusting certain macroeconomic statistics on the basis of those reforms. The INDEC also revised GDP data from 2004 through 2015. Among other adjustments, in calculating GDP for 2004, the INDEC made changes to the composition of GDP that resulted in a negative adjustment of approximately 12% for that year. To calculate real GDP for subsequent years based on the revised 2004 GDP, the INDEC used deflators that are consistent with its revised methodology to calculate inflation. By previously understating inflation, the INDEC had overstated economic growth in real terms. The adjustments made by the INDEC lead to a determination of real GDP growth of 48.6% for the period of 2004 to 2015, as opposed to 65% growth in real terms for the same period resulting from the information used prior to June 2016. As a consequence of these reforms, on November 9, 2016, the Executive Board of the IMF lifted its censure on Argentina, noting that Argentina had resumed the publication of data in a manner consistent with its obligations under the Articles of Agreement of the IMF. In March 2018, the Argentine government announced a draft bill to provide INDEC with total autonomy and to transform it into an entity that will guarantee greater statistical independence of the main macroeconomic indicators.
As of the date of this annual report, the impact that these measures and any future measures taken by the new administration with respect to the INDEC will have on the Argentine economy and investors’ perception of the country cannot be predicted. Concern regarding lack of accuracy in the INDEC´s indices could adversely affect investor confidence in the Argentine economy and our ability to access international credit markets to finance our operations and growth.
Government intervention in Argentina may have a direct impact on our prices and sales.
The Argentine government has in the past set certain industry market conditions and prices. In March 2002, the Argentine government fixed the price for milk after a conflict among producers and the government. In 2005, the Argentine government adopted measures in order to increase the domestic availability of beef and reduce domestic prices. The export tax rate was increased and a minimum weight requirement for animals to be slaughtered was established. In March 2006, sales of beef products to foreign markets were temporarily suspended until prices decreased. Furthermore, in 2007 the Argentine government significantly increased export tax rates on exports of crops. A number of restrictions were also imposed on the grain and oilseed markets that essentially limited the access of traders to exports, resulting in a disparity between domestic and world prices. In March 2012, the Undersecretary of Transport created an “indicative price” for the transportation of grains by road fixed on a quarterly basis. The actual price paid for the road transportation of grains cannot be lower than 5% or higher than 15% of the “indicative price” fixed for the applicable period. In some cases, the imposition of this “indicative price” would produce increases in our transportation costs. In addition, on April 9, 2013, the Secretary of Commerce issued a resolution that established a fixed price for selling liquid hydrocarbons for a six months period. The fixed price would be the highest selling price on the date of issuance of the resolution, in certain regions of the country. Notwithstanding the April 9 resolution, YPF (the Argentine government-controlled oil and gas company) implemented gas price increases that were matched by other oil companies. Due to the increase in the price of the wheat, on July 4, 2013, the Secretary of Commerce issued a resolution mandating wheat producers and distributors to sell their stocks to satisfy the domestic demand, seeking to reduce the wheat price. On January 2014, the Secretary of Commerce launched a new program of price controls called Precios Cuidados. Producers and suppliers committed to fixed prices for more than 300 basic products subject to review on a quarterly basis. As of the date hereof, two of our rice products sold under the trademark “Molinos Ala” and "Apostoles" are subject to this program. Violation of the program may result in sanctions, including fines of up to AR$5,000,000.
The Argentine government may pursue other expropriations or similar interventions such as the one relating to YPF. See “—Risks related to Argentina—The economy of Argentina may be affected by its government’s limited access to financing from international markets.” On December 27, 2012 the Argentine Congress passed Law N° 26,831, known as the new Capital Markets Law, which modifies the public offer regime set forth by Law No. 17,811 as amended. On August 1, 2013 Decree No. 1023/2013, which regulates the Capital Markets Law, was enacted.
33
The Capital Markets Law modifies the applicable regime of the Capital Markets, including local Stock Exchange and commodities markets, and of the agents and also the powers conferred to the “CNV”. The main amendments introduced refer to the increase in the power of intervention by the CNV over the Exchange Markets and agents entitling the CNV to appoint supervisors with the ability to veto listed companies´ board decisions, and even disband the board of directors for a period of 180 days; and suspend the activities of agents and markets, without prior notice, when the CNV determines that a breach of applicable regulations has occurred. Also the new Capital Markets Law introduces new and more stringent requirements for agents to obtain authorization to operate in the markets which may result in a reduction of the current number of authorized agents operating in the grain markets. In November, 2016, the Argentine executive branch sent a bill to the Argentine Congress to reform the current Capital Markets Law No. 26,831 which, among other changes, proposes the abrogation of these interventionist powers granted to the CNV and generally seeks to modernize the entire regulatory framework applicable to the Argentine Capital Markets, incorporating current international practices to further its development. However, as of the date of this annual report, such bill has not yet been passed.
Moreover, the Argentine government may increase its level of intervention in certain areas of the economy. For example, on May 3, 2012 the Argentine Congress passed Law No. 26,741 providing for the expropriation of 51% of the share capital of YPF, S.A. (“YPF”), the largest Argentine oil and gas company in Argentina, represented by an identical stake of Class D shares owned, directly or indirectly, by Repsol S.A., a Spanish integrated oil and gas company. This particular measure also sparked a strong international condemnation and had a significant negative impact on foreign direct investment in Argentina as well as further impaired the already limited access to international capital and debt markets. In response to the nationalization of YPF by the Argentine government, the European Union Commission threatened with the imposition of commercial sanctions (
i.e.
unilateral tariff preferences to Argentina). However, during February 2014, the Argentine government and Repsol S.A. agreed to a compensation of $5,000 million payable in Argentine sovereign bonds to compensate Repsol S.A. for the seizure of the YPF shares.
Furthermore, on April 1, 2014 the Argentine Tax Federal Authority (“Administración Federal de Ingresos Públicos – AFIP”) issued Resolution No. 3,593/14 which established a “Systematic Registration of Movements and Grains Stocks Regime” (“Régimen de Registración Sistemática de Movimientos y Existencias de Granos”) pursuant to which all persons involved in the commercialization and manufacturing of grains and dairy products registered with the
Registro Único de Operadores de la Cadena Agroindustrial
(“RUCA” for its acronym in Spanish) must report the stock and stock variations (including locations, transport between the producer´s facilities, etc.) of all grains and other agricultural products (other than those to be applied to sowing) held in inventory or through third parties.
On April 16, 2015, the Argentine Congress passed a law approving the government takeover of the passenger and cargo railways, which became owned by a State-owned company called Ferrocarriles Argentinos Sociedad del Estado. This law is another example of intervention by the Argentine government and may result in higher transportation costs for our products and operations.
Additionally, Decree 1043/2018 established a prior mandatory procedure for dismissals without cause by means of which employers are required to communicate to the Ministry of Production and Labor any dismissal without cause of employees hired for an indefinite period of time. The communication must be submitted at least ten business days before the date of notification of the dismissal without cause. During such term the Ministry of Production and Labor may appoint hearings in order to analyze the conditions of the future termination of employment, and summon the employer and the employee, with the representation of the relevant union, to the hearings. The decree will remain in force until March 31, 2019.
Expropriations and other interventions by the Argentine government such as the one relating to YPF can have an adverse impact on the level of foreign investment in Argentina, the access of Argentine companies to the international capital markets and Argentina’s commercial and diplomatic relations with other countries. In the future, the level of governmental intervention in the economy may continue, which may have adverse effects on Argentina’s economy and, in turn, our business, results of operations and financial condition.
Although many of the above measures were adopted or announced by the former Argentine government, we cannot assure you that the Macri administration will not interfere or increase its intervention by setting prices or regulating other market conditions. Accordingly, we cannot assure you that we will be able to freely negotiate the prices of all our Argentine products in the future or that the prices or other market conditions that the Macri administration might impose will allow us to freely negotiate the prices of our products, which could have a material and adverse effect on our business, results of operations and financial condition.
Government measures to preempt or respond to social unrest may adversely affect the Argentine economy and our business.
Argentina has experienced significant social and political turmoil, including civil unrest, riots, looting, nationwide protests, strikes and street demonstrations. Despite Argentina’s economic recovery and relative stabilization, social and political tension and high levels of poverty and unemployment continue.
34
Future government policies to preempt, or in response to, social unrest may include expropriation, nationalization, forced renegotiation or modification of existing contracts, suspension of the enforcement of creditors’ rights, new taxation policies, including royalty and tax increases and retroactive tax claims, and changes in laws and policies affecting foreign trade and investment. Such policies could destabilize the country and adversely and materially affect the Argentine economy, and thereby our business, results of operations and financial condition.
The Argentine government may order salary increases to be paid to employees in the private sector, which would increase our operating costs.
In the past, the Argentine government has passed laws, regulations and decrees requiring companies in the private sector to increase wages and provide specified benefits to employees, and may do so again in the future. Argentine employers, both in the public and private sectors, have experienced significant pressure from their employees and labor organizations to increase wages and to provide additional employee benefits. Due to the high levels of inflation, employees and labor organizations are demanding significant wage increases. In August 2012, the Argentine government established a 25% increase in minimum monthly salary to 2,875 Argentine pesos, effective as of February 2013. The Argentine government increased the minimum salary, to 4,716 in January 2015, to 5,588 Argentine pesos in August 2015, to 6,060 Argentine pesos in January 2016, to 6,810 Argentine pesos in June 2016, 7,560 Argentine pesos in September 2016, 8.060 Argentine pesos in January 2017, 8,860 Argentine pesos in July 2017,9,500 Argentine pesos in January 2018, 10,000 Argentine pesos in July 2018, 10,700 Argentine pesos in September 2018, and to 11,300 Argentine pesos in December 2018. The Argentine government confirmed that the minimum salary will be increased to 12,500 Argentine pesos by June 2019. Recently, the INDEC published data regarding the evolution of salaries in the private and public sectors, which reflects approximately 32.91% and 32.58% salary increases in the private and public sectors, respectively, for the period from November 2015 through December 2018 and approximately 28.3% and 27.2% salary increase in the private and public sectors, respectively from the period from January 2018 to November 2018. During the second half of 2018, labor unions agreed with employers´ associations on 15% salary increases (and such agreements are currently being revised). In addition, on November 12, 2018, the Argentine government issued a decree imposing the payment of an extraordinary non-remuneratory bonus of AR$5,000 to all workers in the private sector, payable in two installments in December 2018 and February 2019.
Due to the high levels of inflation, employers in both the public and private sectors have historically experienced, and currently are experiencing significant pressure from organized labor and their employees to further increase salaries. If, as a result of such measures, future salary increases in Argentine peso exceed the pace of the devaluation of the Argentine pesos, they could have a material and adverse effect on our expenses and business, results of operations and financial condition.
An increase in export and import duties and controls may have an adverse impact on our sales.
Since 2002, the Argentine government has imposed duties on the exports of various primary and manufactured products, including some of our products. During the last ten years, such export taxes have undergone significant increases, reaching a maximum of 35% in the case of soybean. As of December 2015, the Macri administration eliminated farm export duties on corn, wheat and local products, while soy export taxes were reduced by 5% to 30% and 27% for most soybean products.
On January 2, 2017, the Macri administration enacted a further reduction of the export duties on soybean and soybean products, including a monthly 0.5% cut on the export duties rate starting on January 2018 and until December 2019 has been set. However, on September 4, 2018, Decree No. 793/2018 was published which establishes an export duty of 12% on the export for consumption of all merchandise included in tariff positions of the Common Mercosur Nomenclature through December 31, 2020. This export duty may not exceed 4 pesos per U.S. dollar of the taxable value or the official FOB price, as applicable. Additionally, on December 4, 2018, the current Argentine administration imposed duties on the exportation of services (and not only goods) and allowed the Executive Power to impose export duties of up to 30% until December 31, 2020, with a maximum rate of 12% for services and goods that were not subject to export duties before September 2, 2018.
The Macri administration also imposed the Import Monitoring System (Sistema Integral de Monitoreo de Importaciones or “SIMI”). Under this new system, importers are required to submit certain information electronically through the SIMI application which, once approved, will be valid for 180 calendar days.
In addition, the Macri administration has enacted an import licensing regime that includes automatic and non-automatic licensing for imports. Automatic import licensing provides that the importer is only required to submit information through the SIMI as well as provide other certification related to the imported goods. Non-automatic licensing provides that the authorities have a 10-day period to either approve or reasonably reject the import license requested based on its effect on local businesses, in addition to the other import requirements that the goods be subject to (SIMI, certifications, etc.).
35
Notwithstanding the above, we cannot assure you that there will not be further increases in the export taxes or that other new export taxes or quotas will not be imposed. The imposition of new export taxes or quotas or a significant increase in existing export taxes or the application of export quotas or the imposition of regimes that aim to restrict or control imports and exports could adversely affect our financial condition or results of operations.
Exchange controls could restrict the inflow and outflow of funds in Argentina.
Beginning in 2001 Argentina imposed exchange controls and transfer restrictions substantially limiting the ability of enterprises to retain or obtain foreign currency or make payments abroad.
Although some of these restrictions were subsequently eased, in June 2005, the Argentine government issued Decree No. 616/2005, which established new controls on capital inflows that could result in reduced availability of international credit, including the requirement, subject to certain exceptions, that 30% of all funds remitted to Argentina remain deposited in a domestic financial institution for 365 days in a non-interest bearing account. In addition, since the second half of 2011, the Argentine government increased certain controls on the incurrence of foreign currency-denominated indebtedness, the acquisition of foreign currency and foreign assets by local residents. For example, the Argentine Central Bank adopted regulations that (i) shortened the period for a borrower to convert foreign currency-denominated indebtedness into Argentine pesos, (ii) shortened a borrower’s window of access to the local foreign exchange market in connection with a prepayment of scheduled interest payments in respect of foreign currency-denominated indebtedness and (iii) suspended the ability of local residents to access the local exchange market for the acquisition of foreign currency.
Notwithstanding the measures, adopted by the Macri administration since December 2015, which lifted virtually all exchange and capital controls , the Argentine government may impose or increase exchange controls or transfer restrictions in the future in response to capital flight or a significant depreciation of the Argentine peso. These restrictions and requirements, and any additional exchange controls and transfer restrictions in the future that may be adopted by the Argentine government, could adversely affect our financial condition and the results of our operations, or the market price of our common shares. In addition, other exchange controls could in the future impair or prevent the conversion of anticipated dividends, distributions, or the proceeds from any sale of equity holdings in Argentina, as the case may be, from Argentine pesos into U.S. dollars and the remittance of the U.S. dollars abroad. These restrictions and controls could interfere with the ability of our Argentine subsidiaries to make distributions in U.S. dollars to us and thus our ability to pay dividends in the future.
Changes in the Argentine tax laws may adversely affect the results of our operations, financial condition and cash flows.
On December 29, 2017, the Argentine Government enacted Law No. 27,430 (the "Tax Reform Law"), a comprehensive tax reform which became effective on January 1, 2018. Specifically, Law No. 27,430 introduced amendments to income tax (both at corporate and individual levels), value added tax, tax procedural law, criminal tax law, social security contributions, excise tax, tax on fuels and tax on the transfer of real estate.
The Tax Reform Law introduced several amendments in connection with federal income tax, such as the progressive reduction of the tax rate on corporate level from 35% to a 30% applicable to the fiscal periods starting on January 1, 2018 until December 31, 2019; and to a 25% applicable to the fiscal periods starting on January 1, 2020 onwards, and established that dividends or other profits distributed to Argentine resident individuals and foreign beneficiaries would be subject to taxation. Therefore, as of January 1, 2018, income tax on Argentine resident companies and branches of non-Argentine entities applies in two stages: (i) a first stage charged at the corporate level (at a tax rate of 30% or 25%, depending on the fiscal period involved, as explained above); and (ii) a second stage charged at the shareholder or owner level -when being an Argentine resident individual or a foreign beneficiary- (at a tax rate of 7% or 13%, according to the fiscal period from which the distributed profit derived). The equalization tax, which levied distributions made out of previously untaxed income, was eliminated. The sale, exchange or disposition of shares and other securities not trading in, or listed on, capital markets and securities exchanges by resident individuals and foreign beneficiaries in general is subject to tax at a rate of 15%. Non-residents can opt to be taxed at a rate of 15% on the net gain or 13.5% on the gross amount of the transaction, at the option of the seller.
36
Risks Related to Brazil
Brazilian economic and political conditions and perceptions of these conditions in international markets have a direct impact on our business and our access to international capital and debt markets, which could adversely affect our results of operations and financial condition.
A significant portion of our operations, properties and customers are located in Brazil. Accordingly, our financial condition and results of operations are substantially dependent on economic conditions in Brazil. The Brazilian economy has experienced significant volatility in recent decades, characterized by periods of low or negative growth, high and variable levels of inflation and currency devaluation. Brazil’s GDP, in nominal terms, grew by 6.1% in
2009
, 5.1% in
2010
, decreased 0.1% in
2011
, increased 7.5% in
2012
, increased 3.9% in
2013
, increased 1.9% in
2014
, increased 3.0% in
2015
, increased 0.1% in
2016
and decreased 3.8% in
2017
. We cannot assure you that GDP will increase or remain stable in the future. Future developments in the Brazilian economy may affect Brazil’s growth rates and, consequently, the consumption of sugar, ethanol, and our other products. As a result, these developments could impair our business strategies, results of operations and financial condition.
Historically, Brazil’s political situation has influenced the performance of the Brazilian economy, and political crisis have affected the confidence of investors and the general public, which has resulted in economic deceleration and heightened volatility in the securities issued abroad by Brazilian companies. Future developments in policies of the Brazilian government and/or the uncertainty of whether and when such policies and regulations may be implemented.
Changes in Brazilian tax laws may have a material adverse impact on the taxes applicable to our business and may increase our tax burden.
The Brazilian government frequently implements changes to the Brazilian tax regime that may affect us and our clients. These changes include changes in prevailing tax rates and, occasionally, imposition of temporary taxes, the proceeds of which are earmarked for designated Brazilian government purposes. Some of these changes may result in increases in our tax payments, which could adversely affect industry profitability and increase the prices of our products, restrict our ability to do business in our existing and target markets and cause our financial results to suffer.
Over the past years Brazil has faced an economic recession and the Government is adopting fiscal adjustment measures. Any fiscal adjustment is complex and involves radical and unpopular measures. The Minister of Finance has also been raising the possibility of increasing or creating new taxes. For example, the Brazilian government may reduce or increase at any time through a presidential decree the rates of the tax levied on financial operations, such as credit transactions (“IOF/Credit”), foreign exchange transactions (“IOF/Exchange”), derivative securities transactions (“IOF/Securities”), among other taxable events. On March, 30, 2017, a presidential decree was published in order to introduce a 0.38% rate of the IOF/Credit on some loan transactions, such as credits provided by cooperatives, which were previously subject to a zero percent rate.
It is also common for taxpayers to file suits for the declaration that a certain tax is illegal or unconstitutional. Such cases where the final decision is favorable to taxpayers, a situation that occurs very frequently. Accordingly, the Brazilian Government may propose changes in the tax legislation in order to increase rates or to create new taxes.
The effects of these changes and any other change that could result from the enactment of additional legislation cannot be quantified. We cannot assure you that we will be able to maintain our projected cash flow and profitability following any increases in Brazilian taxes applicable to us and our operations.
We receive certain tax benefits from Brazilian Tax Authorities which we cannot assure will be maintained or renewed.
We receive certain tax benefits by virtue of our production facilities and investment projects in underdeveloped regions in Brazil. We also benefit from tax incentives based on state law, which may become subject to legal challenges based on the argument that the benefits we receive require the unanimous approval of the Brazilian National Board of Financial Policy (Conselho Nacional de Politica Fazendaria), or the CONFAZ, a federal agency composed of the state treasurers of each state. Our main tax benefit of the ICMS (circulation tax for goods and services) from the state of Mato Grosso do Sul (Ivinhema and Angélica Mill) was renewed until 2028.
We cannot assure you that the tax incentives we currently benefit from will be maintained, renewed or that we will obtain new tax incentives on favorable terms. In the event we fail to comply with specific obligations to which we are subject in connection with the tax benefits described above, such benefits may be suspended or cancelled, or we may be required to pay the taxes due in full, plus penalties, which may adversely affect us. Additionally, we cannot assure you that we will be able to renew these tax benefits when they expire, or to obtain additional tax benefits under favorable conditions. State and federal governments frequently
37
implement changes to the tax regimes, such as changes in tax rates, that may adversely affect us or our customers. If our current tax benefits are cancelled or not renewed, we may be materially adversely affected.
Widespread corruption and fraud relating to ownership of real estate may adversely affect our business, especially our land transformation business.
Under Brazilian Legislation, real property ownership is normally transferred by means of a transfer deed, and subsequently registered at the appropriate Real Estate Registry Office under the corresponding real property record. There are uncertainties, corruption and fraud relating to title ownership of real estate in Brazil, mostly in rural areas. In certain cases, the Real Estate Registry Office may register deeds with errors, including duplicate and/or fraudulent entries, and, therefore, deed challenges frequently occur, leading to judicial actions. Property disputes over title ownership are frequent in Brazil, and, as a result, there is a risk that errors, fraud or challenges could adversely affect us.
Social movements and the possibility of expropriation may affect the normal use of, damage, or deprive us of the use of or fair value of, our properties.
Social movements, such as Movimento dos Trabalhadores Rurais Sem Terra and Comissão Pastoral da Terra, are active in Brazil and advocate land reform and mandatory property redistribution by the Brazilian government. Land invasions and occupations of rural areas by a large number of individuals is common practice for these movements, and, in certain areas, including those in which we have invested or are likely to invest, police protection and effective eviction proceedings are not available to land owners. As a result, we cannot assure you that our properties will not be subject to invasion or occupation by these groups. A land invasion or occupation could materially impair the normal use of our lands or have a material adverse effect on our results of operations, financial condition or the value of our common shares. In addition, our land may be subject to expropriation by the Brazilian government. Under Article 184 of the Brazilian Constitution, the Brazilian government may expropriate land that is not in compliance with mandated local “social functions”. A “social function” is defined in Article 186 of the Brazilian Constitution as (i) rational and adequate exploitation of land; (ii) adequate use of natural resources available and preservation of the environment; (iii) compliance with labor laws; and (iv) exploitation of land to promote welfare of owners and employees. If the Brazilian government decides to expropriate any of our properties, our results of operations may be adversely affected, to the extent that potential compensation to be paid by the Brazilian government may be less than the profit we could make from the sale or use of such land. Disputing the Brazilian government’s (*) expropriation of land is usually time-consuming and the outcomes of such challenges are uncertain. In addition, we may be forced to accept public debt bonds, which have limited liquidity, as compensation for expropriated land instead of cash.
Brazilian rules concerning foreign investment in rural properties may adversely affect our investments.
Brazilian Federal Law No. 5,709, effective October 7, 1971 (“Law 5709”) established certain restrictions on the acquisition of rural property by foreigners, including that (i) foreign investors may only acquire rural properties in which agricultural, cattle-raising, industrial or colonization projects are going to be developed as approved by the relevant authorities; (ii) the total rural area to be acquired by a foreign investor cannot exceed one quarter of the surface of the municipality where it is located, and foreigners with the same nationality may not own, cumulatively, more than 10% of the surface of the municipality in which it is located; and (iii) the acquisition or possession (or any in rem right) by a foreigner of rural property situated in an area considered important to national security (i.e. land located at or near the Brazilian border) must be previously approved by the General Office of the National Security Council (Secretaria-Geral do Conselho de Segurança Nacional). Pursuant to Article 23 of Law No. 8,629, of February 25, 1993 (“Law 8629”), the restrictions mentioned in items (i) and (ii) above established by Law 5709 are also applicable for rural lease agreements executed by foreigners. “Parcerias Agrícolas” (agriculture partnerships agreements) have not been subject to these restrictions. Although, a broader interpretation of the existing regulations could have also included these agreements within the limitations for foreigners, the Federal General Attorney’s Office (“AGU”) on October 8, 2012 issued a legal opinion 005/2012, pursuant to which the AGU confirmed the understanding that the “Parcerias Rurais” are not subject to the restrictions or limitations of Law 5709. In addition, pursuant to Law 8629, the acquisition or lease by a foreigner of a rural property exceeding 100 módulos de exploração indefinida – “MEI,” a measurement unit defined by the Regional Superintendence of the National Institute of Colonization and Land Reform (Superintendencia Regional do Instituto Nacional de Colonizaçao e Reforma Agrária – “INCRA”) must be previously approved by the Brazilian National Congress. Law 5709 also establishes that the same restrictions apply to Brazilian companies that are directly or indirectly controlled by foreign investors. Any acquisition or lease of rural property by foreigners in violation of the terms of Law 5709 would be considered null and void under Brazilian law.
Since the enactment of the Brazilian Constitution in 1988, the consensus view was that the restrictions imposed by Federal Law 5709 on the acquisition or lease of rural property above-mentioned did not apply to Brazilian companies controlled by foreigners, pursuant to legal opinion No. GQ-22, issued by the AGU in 1994, which was ratified by legal opinion No. GQ-181, also issued by the AGU in 1998. The Brazilian Constitution and its amendments, in particular Constitutional Amendment No. 6,
38
of August 15, 1995, provides that (i) no restrictions on the acquisition of rural land in Brazil should apply to Brazilian companies; and (ii) any company incorporated and headquartered in Brazil and controlled by foreign investors must receive the same treatment as any other company incorporated and headquartered in Brazil and controlled by Brazilian investors. However, the Brazilian Justice National Council issued an Official Letter on July 13, 2010 addressed to all the Brazilian local State Internal Affairs Bureaus in order for them to adopt procedures within sixty (60) days and instruct the local State Notary and Real Estate Registry Offices to observe the restrictions of the Brazilian law on the acquisitions of rural land by Brazilian companies with foreign equity holders. Thereafter, on August 19, 2010, the AGU revised its prior opinion, and published a new legal opinion which: (i) revoked the AGU’s legal opinions No. GQ-22 and GQ-181; and (ii) confirmed that Brazilian entities controlled by foreigners should be subject to the restrictions described above, and transactions entered into by foreigners in connection with the acquisition of rural properties would be subject to approval from INCRA, the Ministry of Agrarian Development and the Brazilian National Congress, when applicable. This revised opinion was ratified by the President of Brazil and published in the Official Gazette of the Federal Executive on August 23, 2010, becoming effective as of such date. We believe that the acquisitions of rural properties by Brazilian companies directly or indirectly controlled by foreigners registered in the appropriate real estate registry prior to August 23, 2010 are not affected by the AGU’s legal opinion. As a confirmation of such understanding, pursuant to the Joint Normative Ruling N. 1 issued on September 27, 2012 by the Ministries of: (i) Agricultural Development; (ii) Agriculture, Cattle-raising and Supply; (iii) Industry Development and Foreign Commerce; and (iv) Tourism (the “Joint Normative Ruling N. 1”); and the Normative Ruling/IN INCRA No.76, issued on August 23, 2013, a Brazilian company controlled by foreign individuals or companies which acquired or leased rural properties, by means of an act or agreement entered into from June 7, 1994 and August 22, 2010, may register such property before the National System of Rural Registry (Sistema Nacional de Catastro Rural-SNCR), without any administrative sanction. However, as of said date, the acquisition and leasing of rural land in Brazil, including through corporate transactions, will be subject to the above-mentioned restrictions, and will require several additional layers of review and approvals, which may be discretionary (including the approvals from INCRA, Ministry of Agrarian Development and the Brazilian National Congress, when applicable), burdensome and time consuming. Additionally, the Joint Normative Ruling N. 1 sets forth the administrative procedures applicable to requests for authorization for the acquisition or lease of rural properties by foreign investors pursuant to Law 5709. Under the Joint Normative Ruling, in order to obtain the authorization for the acquisition or lease of rural properties, foreign investors must present a project proposal to the INCRA, containing: (i) the rationale for the relationship between the property to be acquired or leased and the project size; (ii) physical and financial schedule of the investment and implementation of the project; (iii) use of official credit (governmental funds) for the total or partial finance of the project; (iv) logistic viability of the execution of the project and, in case of an industrial project, proof of compatibility between the local industrial sites and the geographic location of the lands; and (v) proof of compatibility with the criteria established by the Brazilian Ecological and Economical Zoning (Zoneamento Ecológico Económico do Brasil – ZEE), relating to the location of the property.
While we conduct our operations in Brazil through local subsidiaries, we would be considered a foreign controlled entity within the meaning of the restrictions described above. Therefore, if we are not able to comply with these restrictions and obtain the required approvals in connection with future acquisitions or lease transactions, our business plan, contemplated expansion in Brazil and results of operations will be adversely affected.
Furthermore, there is currently proposed legislation under review in the Brazilian National Congress regarding the acquisition of rural land by Brazilian companies controlled by foreign holders, which if approved may further limit and restrict the investments of companies with foreign equity capital in rural land in Brazil. Such further restrictions, if adopted, may place more strain on our ability to expand our operations in Brazil.
The Brazilian government has exercised, and continues to exercise, significant influence over the Brazilian economy, which, combined with Brazilian political and economic conditions, may adversely affect us.
We may be adversely affected by the following factors, as well as the Brazilian government’s response to these factors:
|
•
|
economic and social instability;
|
|
•
|
increase in interest rates;
|
|
•
|
exchange controls and restrictions on remittances abroad;
|
|
•
|
restrictions and taxes on agricultural exports;
|
|
•
|
exchange rate fluctuations;
|
|
•
|
inflation;
|
|
•
|
volatility and liquidity in domestic capital and credit markets;
|
|
•
|
expansion or contraction of the Brazilian economy, as measured by GDP growth rates;
|
|
•
|
allegations of corruption against political parties, elected officials or other public officials, including allegations made in relation to the ”Car Wash Operation” (
Operação Lava-Jato)
investigation;
|
|
•
|
government policies related to our sector;
|
|
•
|
fiscal or monetary policy and amendments to tax legislation; and
|
39
|
•
|
other political, diplomatic, social or economic developments in or affecting Brazil.
|
Historically, the Brazilian government has frequently intervened in the Brazilian economy and has occasionally made significant changes in economic policies and regulations, including, among others, the imposition of a tax on foreign capital entering Brazil (IOF tax), changes in monetary, fiscal and tax policies, currency devaluations, capital controls and limits on imports. The administration is currently facing domestic pressure to retreat from the current macroeconomic policies in an attempt to achieve higher rates of economic growth. In addition, the Brazilian government is proposing the creation of a tax on financial transactions, including wire transfers, (the so-called “CPMF”) in order to improve the fiscal situation of the country. We cannot predict which policies will be adopted by the Brazilian government and whether these policies will negatively affect the economy or our business or financial performance.
The Brazilian economy has been experiencing a slowdown – GDP growth rates were 7.5%, 3.9%, 1.9%, 2.7%, and 0.1% in 2010, 2011,
2013
,
2014
and
2015
, respectively.GDP decreased 3.8%, 3.6% in 2015 and
2017
, respectively and has shown growth rate in 2017 of 1.0%. Inflation, unemployment and interest rates have increased more recently and the Brazilian Real has weakened significantly in comparison to the U.S. dollar. The market expectations for the years
2018
and
2019
is that the Brazilian economy will continue to slow down and GDP will decrease. Our results of operations and financial condition may be adversely affected by the economic conditions in Brazil.
Allegations of political corruption against the Brazilian government and the Brazilian legislative branch could create economic and political instability.
In the past, members of the Brazilian government and of the Brazilian legislative branch have faced allegations of political corruption. As a result, a number of politicians, including senior federal officials and congressmen, resigned and/or have been arrested. Currently, several members of the Brazilian executive and legislative branches of government are being investigated as a result of allegations of unethical and illegal conduct identified by the Car Wash Operation (
Operação Lava-Jato
) being conducted by the Office of the Brazilian Federal Prosecutor. On April 17th, 2016 the impeachment process of the Brazilian President was approved by the House of Representatives and, on August 31st, 2016 the process was approved by Senate. The Brazilian President was replaced by the Vice-President until a new election is to be held in 2018. The new President has been trying to implement political and economic reforms related to fiscal and social security matters, and other measures targeting higher economic rates of growth and employment. On November 11, 2017, a reform to Brazil's labor laws (Law No. 13,467/2017) establish that mutually agreed arrangements between an employer and employee in many circumstances prevail over general labor laws.
We cannot predict which policies will be adopted by the new Brazilian government and whether these policies will negatively affect the economy and our business or results of operations.
Additionally, the potential outcome of investigations and proceedings related to the Car Wash Operation (
Operação Lava-Jato
) is unknown, but they have already had an adverse impact on the general market perception of the Brazilian economy and the conclusion of these proceedings or further allegations of illicit conduct could have additional adverse effects in the Brazilian economy. In this sense, the political crisis could worsen the economic conditions in Brazil, which may adversely affect our results of operations and financial condition.
Moreover, the economic and political crisis have resulted in a further downgrading of the country’s long-term credit rating from two of the three major rating companies, placing Brazil 3 notches below the limit of the speculative investment grade level (“junk”). Standard & Poor's downgraded Brazil to BB with a stable outlook in January 2018, Fitch Ratings downgraded to BB- with a stable outlook in February 2018, while Moody’s maintained its Ba2 rating, with a negative outlook since May 2017. According to Standard & Poor's and Fitch, the downgrade is mainly based on the postponement of the constitutional amendment to reform Brazil’s current pension system, considered vital to closing a huge fiscal deficit, and the great uncertainty surrounding the upcoming presidential elections. Although Brazilian economy is currently showing better results, such as lower inflation and higher growth rate, we cannot neither predict which candidate will become the next president nor which policies this candidate will adopt and whether these policies will negatively affect the economy or our business or financial performance.
Restrictions on the movement of capital out of Brazil may impair our ability to receive payments from our Brazilian Subsidiaries and restrict their ability to make payments in U.S. dollars.
In the past, the Brazilian economy has experienced balance of payment deficits and shortages in foreign exchange reserves, and the Brazilian government has responded by restricting the ability of Brazilian or foreign persons or entities to convert
reais
into foreign currencies. The Brazilian government may institute a restrictive exchange control policy in the future. Any restrictive
40
exchange control policy could prevent or restrict our Brazilian Subsidiaries’ access to U.S. dollars, and consequently their ability to meet their U.S. dollar obligations and may adversely affect our financial condition and results of operations.
Our business in Brazil is subject to governmental regulation.
Our Brazilian operations are subject to a variety of national, state, and local laws and regulations, including environmental, agricultural, health and safety and labor laws. We invest financial and managerial resources to comply with these laws and related permit requirements. Our failure to do so could subject us to fines or penalties, enforcement actions, claims for personal injury or property damages, or obligations to investigate and/or remediate damage or injury. Moreover, if applicable laws and regulations, or the interpretation or enforcement thereof, become more stringent in the future, our capital or operating costs could increase beyond what we currently anticipate, and the process of obtaining or renewing licenses for our activities could be hindered or even opposed by the competent authorities.
We are also subject to laws and regulations imposed in Brazil and its agencies, including (i) the National Agency of Petroleum, Natural Gas and Biofuels (
Agência Nacional do Petróleo
,
Gás Natural e Biocombustível(“ANP”)
) and by the Brazilian Electricity Regulatory Agency (
Agência Nacional de Energia Elétrica
) (“ANEEL”) on account of our production of sugarcane, ethanol and electric energy (ii) the Ministry of Agriculture, Breeding Cattle and Supply (
Ministerio da Agricultura
,
Pecuaria e Abastecimento(“MAPA”)
), on account of our agricultural, sugarcane and ethanol production activities. If an adverse final decision is issued in an administrative process, we could be exposed to penalties and sanctions derived from the violation of any of these laws and regulations, including the payment of fines, and, depending on the level of severity applied to the infraction, the closure of facilities and/or stoppage of activities and the cancellation or suspension of the registrations, authorizations and licenses, which may also result in temporary interruption or discontinuity of activities in our plants, and adversely affect our business, financial status, and operating results.
Government laws and regulations in Brazil governing the burning of sugarcane could have a material adverse impact on our business or financial performance.
In Brazil, a relevant percentage of sugarcane is currently harvested by burning the crop, which removes leaves in addition to eliminating insects and other pests. The states of São Paulo, Minas Gerais and Mato Grosso do Sul, among others, have established laws and regulations that limit and/or entirely prohibit the burning of sugarcane and there is a likelihood that increasingly stringent regulations will be imposed by those states and other governmental agencies in the near future.
Such limitations arise from a Brazilian Federal Decree that set forth the complete elimination of the harvest by burning the crop until 2018 in areas where it is possible to carry out mechanized harvest. In the state of Minas Gerais, the deadline imposed by the State Government for the elimination of the harvest by burning the crop is 2014, for areas with declivity lower than 12%, and for areas with declivity higher than 12%, they are subject to an additional term at the discretion of the State Environmental Agency, on a case by case basis. Nevertheless, in the state of Mato Grosso do Sul, the current deadline is 2018 for the elimination of harvest by burning the crop for areas where mechanized harvest can be carried out, as per the Brazilian Federal Decree.
We currently make significant investments to comply with these laws and regulations. Although our plans for the implementation of mechanized harvesting are underway, with 98.3% of our sugarcane harvest mechanized during the
2017
-
2018
harvest, the strengthening of these laws and regulations or the total prohibition of sugarcane burning would require us to increase our planned investment in harvesting equipment, which, in turn, would limit our ability to fund other investments. In addition, the state of São Paulo has imposed an obligation on growers to dedicate a certain percentage of land used for sugarcane cultivation for native or reclaimed forest area. The cost of setting aside this land is difficult to predict and may increase costs for us or our sugarcane suppliers. As a result, the costs to comply with existing or new laws or regulations are likely to increase, and, in turn, our ability to operate our plants and harvest our sugarcane crops may be adversely affected.
Risks Related to a Luxembourg Company
We are a Luxembourg corporation (“société anonyme”) and it may be difficult for you to obtain or enforce judgments against us or our executive officers and directors in the United States.
We are organized under the laws of the Grand Duchy of Luxembourg. Most of our assets are located outside the United States. Furthermore, most of our directors and officers and experts reside outside the United States, and most of their assets are located outside the United States. As a result, you may find it difficult to effect service of process within the United States upon these persons or to enforce judgments outside the United States obtained against us or these persons in U.S. courts, including
41
judgments in actions predicated upon the civil liability provisions of the U.S. federal securities laws. Likewise, it may also be difficult for you to enforce in U.S. courts judgments obtained against us or these persons in courts located in jurisdictions outside the United States, including actions predicated upon the civil liability provisions of the U.S. federal securities laws. It may also be difficult for an investor to bring an action in a Luxembourg court predicated upon the civil liability provisions of the U.S. federal securities laws against us or these persons. Luxembourg law provides shareholders the right to bring a derivative action on behalf of the Company only in limited circumstances and subject to conditions only admit, shareholders’ right to bring a derivative action on behalf of the company.
Service of process within Luxembourg upon the Company may be possible, provided that The Hague Convention on the Service Abroad of Judicial and Extrajudicial Documents in Civil or Commercial Matters of November 15, 1965 is complied with. As there is no treaty in force on the reciprocal recognition and enforcement of judgments in civil and commercial matters between the United States and the Grand Duchy of Luxembourg, courts in Luxembourg will not automatically recognize and enforce a final judgment rendered by a U.S. court. The enforceability in Luxembourg courts of judgments entered by U.S. courts will be subject prior any enforcement in Luxembourg to the procedure and the conditions set forth in particular in the Luxembourg procedural code, which conditions may include the following (subject to court interpretation which may evolve):
|
•
|
the judgment of the U.S. court is final and duly enforceable (
exécutoire
) in the United States;
|
|
•
|
the U.S. court had jurisdiction over the subject matter leading to the judgment (that is, its jurisdiction was established in compliance both with Luxembourg private international law rules and with the applicable domestic U.S. federal or state jurisdictional rules);
|
|
•
|
the U.S. court has applied to the dispute the substantive law which would have been applied by Luxembourg courts;
|
|
•
|
the judgment was granted following proceedings where the counterparty had the opportunity to appear, and if it appeared, to present a defense;
|
|
•
|
the U.S. court has acted in accordance with its own procedural laws; and
|
|
•
|
the judgment of the U.S. court does not contravene Luxembourg international public policy.
|
Under our articles of incorporation, we indemnify and hold our directors harmless against all claims and suits brought against them, subject to limited exceptions. Under our articles of incorporation, to the extent allowed or required by law, the rights and obligations among or between us, any of our current or former directors, officers and company employees and any current or former shareholder will be governed exclusively by the laws of Luxembourg and subject to the jurisdiction of the Luxembourg courts, unless such rights or obligations do not relate to or arise out of their capacities as such. Although there is doubt as to whether U.S. courts would enforce such provision in an action brought in the United States under U.S. securities laws, such provision could make the enforcement of judgments obtained outside Luxembourg more difficult as to the enforcement against our assets in Luxembourg or jurisdictions that would apply Luxembourg law.
You may have more difficulty protecting your interests than you would as a shareholder of a U.S. corporation.
Our corporate affairs are governed by our articles of incorporation and by the laws governing joint stock companies organized under the laws of the Grand Duchy of Luxembourg as well as such other applicable local law, rules and regulations. The rights of our shareholders and the responsibilities of our directors and officers under Luxembourg law are different from those applicable to a corporation incorporated in the United States. As a foreign private issuer, we are exempt from certain rules under the Exchange Act, and consequently, there may be less publicly available information about us than is regularly published by or about U.S. issuers. Also, Luxembourg regulations governing the securities of Luxembourg companies may not be as extensive as those in effect in the United States, and Luxembourg law and regulations in respect of corporate governance matters may not be as protective of minority shareholders as state corporation laws in the United States. Therefore, you may have more difficulty protecting your interests in connection with actions taken by our directors and officers or our principal shareholders than you would as a shareholder of a corporation incorporated in the United States.
Luxembourg and European insolvency and bankruptcy laws are substantially different from U.S. insolvency laws and may offer our shareholders less protection than they would have under U.S. insolvency and bankruptcy laws.
As a company organized under the laws of the Grand Duchy of Luxembourg and with its registered office in Luxembourg, we are subject to Luxembourg insolvency and bankruptcy laws in the event any insolvency proceedings are initiated against us including, among other things, Council and European Parliament Regulation (EU) 2015/848 of 20 May 2015 on insolvency proceedings (recast). Should courts in another European country determine that the insolvency and bankruptcy laws of that country apply to us in accordance with and subject to such EU regulations, the courts in that country could have jurisdiction over the
42
insolvency proceedings initiated against us. Insolvency and bankruptcy laws in Luxembourg or the relevant other European country, if any, may offer our shareholders less protection than they would have under U.S. insolvency and bankruptcy laws and make it more difficult for them to recover the amount they could expect to recover in a liquidation under U.S. insolvency and bankruptcy laws.
You may not be able to participate in equity offerings, and you may not receive any value for rights that we may grant.
Pursuant to Luxembourg corporate law, existing shareholders are generally entitled to preemptive subscription rights in the event of capital increases and issues of shares against cash contributions. However, under our articles of incorporation, the board of directors has been authorized to waive, limit or suppress such preemptive subscription rights until the fifth anniversary of the publication of the authorization granted to the board in respect of such waiver by the general meeting of shareholders. The current authorization was renewed by decision of the shareholder meeting held on April 20, 2016 and is valid until April 20, 2021.
A. HISTORY AND DEVELOPMENT OF THE COMPANY
General Information
Adecoagro is a Luxembourg société anonyme (a joint stock company). The Company’s legal name is “Adecoagro S.A.” Adecoagro was incorporated on June 11, 2010 and on October 26, 2010 all the outstanding shares of Adecoagro were acquired by IFH.
On October 30, 2010, the members of IFH transferred pro rata approximately 98% of their membership interests in IFH to Adecoagro in exchange for common shares of Adecoagro. On January 28, 2011, Adecoagro completed the IPO of its shares listed on the New York Stock Exchange (“NYSE”). The shares are traded under the symbol “AGRO.” In a series of transactions during 2012, we transferred shares of Adecoagro to certain limited partners of IFH in exchange for their residual interest in IFH increasing our interest in IFH to approximately 100%.
On March 27, 2015, Adecoagro commenced a series of transactions for the purpose of transfering the domicile of Adecoagro LP to Luxembourg. In connection with the Adecoagro LP re-domiciliation, Adecoagro merged IFH into Adecoagro LP (Delaware) with Adecoagro LP (Delaware) as the surviving entity and on April 1, 2015 Adecoagro GP S.à r.l., a société à responsibilité limitée organized under the laws of Luxembourg, became he general partner of Adecoagro LP on April 1, 2015. Also on April 1, 2015, Adecoagro completed the re-domiciliation of Adecoagro LP (Delaware) out of Delaware to Luxembourg and Adecoagro LP without dissolution or liquidation, continued its corporate existence as Adecoagro LP S.C.S., a société comandite simple organized under Luxembourg law, effective April 2, 2015. For a detailed description of the Adecoagro LP redomiciliation please see “Corporate Development” below.
Adecoagro is registered with the Luxembourg Registry of Trade and Companies under number B153681. Adecoagro has its registered office at 6, Rue Eugène Ruppert, L-2453, Luxembourg, Grand Duchy of Luxembourg. Our telephone number is (+352) 264491.
History
In September 2002, we commenced our operations with the acquisition of 100% of the equity interests of Pecom Agropecuaria S.A., an Argentine corporation (sociedad anónima), and we rapidly became one of the largest agricultural companies in Argentina. Totaling more than 74,000 hectares of farmland, this acquisition represented one of the largest stock purchase transactions in South America in 2002. In connection with the acquisition, Pecom Agropecuaria S.A. changed its name to Adeco Agropecuaria S.A. (“Adeco Agropecuaria”). Adeco Agropecuaria was the platform from which we executed our expansion plans, including the acquisition of additional land and the diversification of our business activities.
In 2004, we began our regional expansion and acquired a farm in Uruguay (approximately 5,086 hectares) and three farms in Western Bahia Brazil (20,419 hectares). In 2005, we continued the expansion of our crop business in Argentina with the acquisitions of La Agraria S.A. (approximately 4,857 hectares) and Establecimientos El Orden S.A. and Cavok S.A. (approximately 15,157 hectares) and Las Horquetas farm (2,086 hectares).
In 2005, we acquired our first sugar and ethanol mill, Usina Monte Alegre S.A. (“UMA”), with a crushing capacity of 0.9 million tons of sugarcane per year at that time. UMA became our platform for expansion in the Brazilian sugar and ethanol sector.
43
In 2006 and 2007, we continued our land portfolio expansion and vertical integration through the acquisitions of Pilagá S.A. (formerly Pilagá S.R.L. and before that, Pilagá S.A.G.), one of the largest and oldest agriculture companies in Argentina, with more than 88,000 hectares and two rice processing facilities, and one additional farm of approximately 2,400 hectares in Argentina and two farms of approximately 4,000 hectares in Brazil for the production of crops. Also, in December 2007, we acquired Bañado del Salado S.A., Agro Invest S.A. and Forsalta S.A., with more than 43,000 hectares for crop production in Argentina, and one farm in Uruguay of approximately 3,177 hectares.
During 2007, we also began the expansion of our dairy business in Argentina. After five years of research, we began the construction of a “free-stall” dairy facility with a capacity to milk 3,000 cows.
In Brazil, during 2007, we began the construction of a sugarcane cluster in Mato Grosso do Sul with a projected 10.0 million tons of sugarcane crushing capacity. Angelica was the first greenfield mill we built from inception, with a nominal crushing capacity of 4.9 million tons. We also bought approximately 13,000 hectares of farmland for the planting of sugarcane to supply the mill. Angelica began operating during August 2008, and reached full operational capacity during April 2010.
Additionally, in August 2010, we acquired Dinaluca S.A., an agricultural company consisting of a farm located in the province of Corrientes, Argentina, and with more than 14,000 hectares for crop production in Argentina. Further, between August and November 2011, we acquired: (i) Compañía Agroforestal de Servicios y Mandatos S.A., an agricultural Argentine company owning more than 4,900 hectares of land in the province of Santiago del Estero, (ii) Simoneta S.A., an agricultural Argentine company owner of more than 4,600 hectares of land in the province of La Pampa, and (iii) 3,400 hectares of land for crop production in the province of San Luis, Argentina.
During 2012, we began the construction of our second free stall dairy facility in Argentina, with a capacity of 3,500 milking cows.
On February 26, 2013, Adecoagro formed the joint venture CHS Agro S.A., together with CHS de Argentina S.A., a leading farmer-owned energy, grains and foods company based in the United States were each held 50% interest. CHS Agro built a sunflower processing facility located in the city of Pehuajo, Province of Buenos Aires, Argentina. The facility processes blackoil and confectionary sunflower into specialty products such as in-shell seeds and oil seeds, which are entirely exported. The joint venture grows confectionary sunflower on leased farms, while blackoil sunflower is originated from third parties. On January 14, 2019 and after a restructuring of the joint venture, we purchased 50% capital stock of CHS Agro from CHS de Argentina S.A.
During March 2013, we began the construction of the second greenfield project in our sugarcane cluster in Mato Grosso do Sul. The Ivinhema mill, with 5.7 million tons of sugarcane crushing capacity and located 45 km south of Angelica, consolidate our cluster, generating important synergies and economies of scale, improving operational margins and Adjusted Free Cash Flow. Ivinhema was built in two phases: the first phase with 2.0 million tons of capacity was completed during April 2012, and the second phase with 3.0 million tons of crushing capacity was completed in mid-2015.
During October 2017, we completed the construction of our first bio-digester. The facility generates electricity by burning biogas extracted from the effluents produced by our milking cows. On November 3, 2017, we began generating and delivering 1.4 MW of electricity to the local power grid. In addition to increasing revenues and securing our energy requirements, this facility enhances the sustainability of our free stall dairy operation by reducing greenhouse gas emissions, improving the effluent management and concentrating valuable nutrients, which are applied back to the fields.
On February 5, 2019 we acquired a peanut processing facility for $10 million. The facility is located in Dalmacio Vélez, Province of Cordoba, Argentina.
In light of the improved regulatory framework and outlook for the agribusiness sector in Argentina, we have identified several growth opportunities across our farming operations. These investments will allow us to increase operational efficiency, reduce costs and enhance returns across our dairy, rice and crops segments.
On February 8, 2019 we acquired two milk processing plants and two trademarks from SanCor Cooperativas Unidas Limitadas. One of the facilities is located in the city of Chivilcoy, Province of Buenos Aires, and is primarily focused on fluid milk production for the domestic market in Argentina. The other facility is located in the city of Morteros, Province of Cordoba, and produces dry milk and cheese for the export market. In addition, we acquired “Las 3 Niñas” and “Angelita” trademarks. Both brand names are well recognized in Argentina and represent a solid commercialization vehicle for retail consumer dairy products.
Corporate Development
44
On October 30, 2010, as part of the corporate reorganization, referred to herein as the Reorganization, AFI Ltd., a subsidiary of IFH LLC and the parent of Adecoagro LLC, distributed its interest in Adecoagro LLC to IFH LLC and commenced a process of dissolution, making IFH LLC the direct parent of Adecoagro LLC. Thereafter, our shareholders transferred pro rata 98% of their membership interests in IFH LLC to Adecoagro (a corporation organized under the laws of the Grand Duchy of Luxembourg with no prior holdings or operations, formed for the purpose, among others, of facilitating our IPO) in exchange for 100% of the common shares of Adecoagro.
In connection with the Reorganization, Adecoagro converted IFH LLC from a limited liability company to IFH LP, a Delaware limited partnership. owned 2% by our shareholders, approximately 98% by Adecoagro, in each case as limited partners, and the remainder by Ona Ltd., a newly formed Maltese corporation, as its general partner. Adecoagro LLC was also converted to Adecoagro LP, a Delaware limited partnership, owned approximately 100% by IFH LP as limited partner, and the remainder by Toba Ltd., a newly formed Maltese corporation, as its general partner.
On January 28, 2011, we successfully completed our initial public offering of our shares listed on the NYSE and on February 2, 2011 we issued 28,405,925 shares, at a price of US$11 per share. The shares trade under the symbol “AGRO.”
On February 2, 2011, we also issued and sold to Al Gharrafa Investment Company (“Al Gharrafa”), a wholly owned subsidiary of Qatar Holding LLC and one of our shareholders, 7,377,598 common shares at a purchase price of $10.65 per share, which is equal to the price per common share paid by the underwriters of our initial public offering of the Company, pursuant to an agreement entered into on January 6, 2011. In addition, on February 11, 2011, we issued 4,285,714 shares when the over-allotment option was exercised by the underwriters in our IPO.
During 2012, the Company issued in a series of transactions 1,654,752 shares to certain limited partners of IFH in exchange for their residual interest in IFH increasing Adecoagro’s interest in IFH to approximately 100%.
On February 5, 2013, we completed an underwritten secondary offering of 13.9 million common shares of Adecoagro offered by our shareholder, HBK Master Fund LP at a price per share to the public of $8.00 pursuant to an effective shelf registration statement on Form F-3 filed with the SEC. On February 13, 2013, HBK Master Fund LP sold an additional 2.1 million common shares of Adecoagro pursuant to the overallotment option it granted to the underwriter in the secondary offering.
On March 27, 2015, Adecoagro commenced a series of transactions for the purpose of transferring the domicile of Adecoagro LP to Luxembourg. In connection with the Adecoagro LP redomiciliation, Adecoagro merged IFH LP into Adecoagro LP with Adecoagro LP (Delaware) as the surviving entity. In connection with this merger, all of the assets and liabilities of IFH L.P. vested in Adecoagro LP (Delaware), Ona Ltd became its general partner and Toba Ltd became a wholly owned subsidiary of Adecoagro LP (Delaware). In connection with the transactions completed on March 27, 2015, Ona Ltd. assigned its general partnership interest in Adecoagro LP to Adecoagro GP S.a.r.l., a société responsibilitie limitee organized under the laws of Luxembourg, on April 1, 2015. Also on April 1, 2015, Adecoagro completed the redomiciliation of Adecoagro LP (Delaware) out of Delaware to Luxembourg and Adecoagro LP, without dissolution or liquidation, continued its corporate existence as Adecoagro LP S.C.S., a société en comandite simple organized under Luxembourg law, effective April 2, 2015. Since that date the affairs of Adecoagro LP S.C.S. have been governed by its by-laws and Luxembourg law.
On March 21, 2016, we completed an underwritten secondary offering of 12.0 million shares of Adecoagro offered by our shareholders, Quantum Partner LP and Geosor Corporation, at a price per share to the public of $11.7 pursuant to an effective shelf registration statement on Form F-3 filed with the SEC. In connection with this offering, the selling shareholders granted the underwriter the right to purchase up to 1,800,000 additional common shares exercisable once at any time within 30 days after March 21,2016. On April 20, 2016, the underwriter elected to purchase an additional 350,000 common shares at a price of 11.40 per common share.
On September 21, 2017, the Company issued US$500 million principal amount of its 6.000% Senior Notes due 2027 (the “Securities”). The Securities were issued pursuant to an Indenture dated as of September 21, 2017 (the “Indenture”), among us, as issuer, Adeco AgropecuariaS.A., Pilagá S.A., Adecoagro Brasil Participacoes S.A., Adecoagro Vale do Ivinhema S.A. and Usina Monte Alegre Ltda., as guarantors (the “Guarantors”) and The Bank of New York Mellon, as trustee, registrar, paying agent and transfer agent, and are be guaranteed on a senior unsecured basis by each of the Guarantors.
45
The following chart summarizes our corporate structure as of April 2019. The Restricted Subsidiaries and Unrestricted Subsidiaries shown on the chart refer to the terms Restricted Subsidiary and Unrestricted Subsidiary, respectively, as defined in our Senior Notes Indenture attached hereto as Exhibit 4.43.
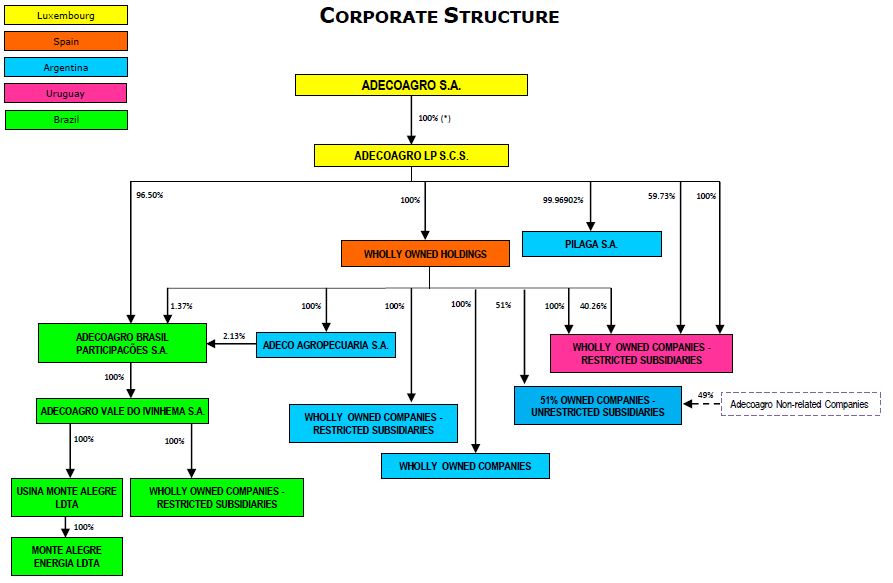
Principal Capital Expenditures
Capital expenditures totaled $199.6 million, $133.2 million and $149.8 million for the years ended
December 31, 2018
,
2017
and
2016
, respectively.
For a discussion of our capital expenditures and future projections, see “Item 5. Operating and Financial Review and Prospects—B. Liquidity and Capital Resources—Capital Expenditure Commitments.”
B. BUSINESS OVERVIEW
Our Company
We are a leading agroindustrial company in South America, with operations in Argentina, Brazil and Uruguay. We are currently involved in a broad range of businesses, including farming crops and other agricultural products, dairy operations, sugar, ethanol and energy production and land transformation. Our sustainable business model is focused on (i) a low-cost production model that leverages growing or producing each of our agricultural products in regions where we believe we have competitive advantages, (ii) reducing the volatility of our returns through product and geographic diversification and use of advanced technology, (iii) benefiting from vertical integration in key segments of the agro-industrial chain, (iv) acquiring and transforming land to improve its productivity and realizing land appreciation through strategic dispositions, and (v) implementing sustainable production practices and technologies focused on long-term profitability.
As of December 31, 2018, we owned a total of
231,712
hectares, comprised of 19 farms in Argentina, 9 farms in Brazil and one farm in Uruguay. In addition we own and operate several agro-industrial production facilities including three rice processing facilities in Argentina, three dairy facilities with approximately
8,035
milking cows in Argentina, 11 grain and rice conditioning
46
and storage plants in Argentina, and three sugar and ethanol mills in Brazil with a sugarcane crushing capacity of
12.3
million tons
(1)
.
We believe that we are:
|
•
|
one of the largest owners of productive farmland in South America, with more than 192,413 owned productive hectares as of December 31, 2018 (excluding legal land reserves pursuant to local regulations and other land reserves) located in Argentina, Brazil and Uruguay, producing a wide range of agricultural products.
|
|
•
|
a leading producer of grains and oilseeds in South America. During the 2017/2018 harvest year, we harvested 186,306 hectares (including 73,021 leased hectares and 35,714 second crop hectares) and produced 503,788 tons of grains, including soybeans, corn, wheat, sunflower and cotton;
|
|
•
|
one of the largest fully integrated producers of rough (unprocessed) rice in the world, planting 40,289 hectares (including 1,700 leased hectares) and producing 276,693 tons during the 2017/2018 harvest year, which accounted for 22% of the total Argentine production according to the
Confederacion de Molinos Arroceros del Mercosur
(“Conmasur”). We are also a large processor and exporter of white rice (processed) in Argentina, accounting for 19%
of total white rice production capacity in Argentina and 35% of total Argentine white rice exports during 2018, according to
Camara de Industriales Arroceros de Entre Ríos (Federacion de Entidades
Arroceras)
.
|
|
•
|
a leading dairy producer in South America in terms of our cutting-edge technology, productivity per cow and grain conversion efficiencies, producing
101.3 million
liters of raw milk during 2018.
|
|
•
|
a growing producer of sugar and ethanol in Brazil, where we currently own three sugar and ethanol mills, with an aggregate installed capacity of 12.4 million tons per year and full cogeneration capacity (the generation of electricity from sugarcane bagasse, the fiber portion of sugarcane that remains after the extraction of sugarcane juice) of 232 MW as of December 31, 2018. Our operation is highly integrated, meaning that
94,6%
of the sugarcane crushed at our mills is supplied from our own plantations. As of December 31, 2018, our sugarcane plantation consisted of
153,690
hectares; and.
|
|
•
|
one of the leading companies in South America involved in the acquisition and transformation of undermanaged land to more productive uses, generating higher cash yields. During the last twelve fiscal years, we have consistently sold a portion of our fully mature farmland every year. In aggregate, we have sold over
91,400
hectares generating capital gains of approximately
$234 million
.
|
We are engaged in three main businesses:
1.
Farming Business
: As of December 31, 2018 we owned 221,425 hectares (excluding sugarcane farms) of farmland in Argentina, Brazil and Uruguay, of which 123,131 hectares are croppable, 14,054 hectares are being evaluated for transformation, 55,228 hectares are suitable for raising beef cattle and are mostly leased to third party cattle farmers, constituting a total of 192,413 productive hectares, and 39,299 hectares are legal land reserves pursuant to local regulations or other land reserves. During the 2017/2018 harvest year we held leases or have entered into agriculture partnerships for an additional 70,415 croppable hectares. We own the facilities and have the resources to store and condition 100% of our crop and rice production. We do not depend on third parties to condition our production for sale. Our farming business is subdivided into four main businesses:
|
•
|
Crop business
: We produce a wide range of agricultural commodities including soybeans, corn, wheat, sunflower and cotton, among others. In Argentina, our farming activities are conducted mainly in the Argentine humid pampas region, where agro-ecological conditions are optimal for low-cost production. Since 2004, we have expanded our operations throughout the center-west region of Uruguay and the western part of the state of Bahia, Brazil, as well as in the northern region of Argentina. During the 2017/2018 harvest year, we planted approximately
190,325
hectares of crops, including second harvests, producing 503,788 tons of grains, including soybeans, wheat and corn, sunflower and cotton. We also planted an additional
6,010
hectares where we produced over 150,000 tons of forage that we used for cow feed in our dairy operation. During the current 2018/19 harvest year, we planted approximately 189,010 hectares of crops, including second harvest, and also planted an additional 4,793 hectares of forage.
|
47
|
•
|
Rice business
: We own a fully-integrated rice operation in Argentina. We produce irrigated rice in the northeast provinces of Argentina, where the availability of water, sunlight, and fertile soil results in one of the most ideal regions in the world for producing rice at low cost. We believe that we are one of the largest producers of rough (unprocessed) rice in Argentina, producing 276,693 tons during the 2017/2018 harvest year, which accounted for 21% of the total Argentine production according to Conmasur. We own three rice mills that process our own production, as well as rice purchased from third parties. We produce different types of white and brown rice that are sold both in the domestic Argentine retail market under our own brand; and exported. During the current 2018/19 harvest year, we planted 40,434 hectares of rice.
|
|
•
|
Dairy business
: We believe that we are a leading dairy producer in South America in terms of our utilization of cutting-edge technology, productivity per cow and grain conversion efficiencies. Through the production of raw milk, we are able to transform forage and grains into value-added animal protein. Our “free-stall” dairies in Argentina allow us to optimize our use of resources (land, dairy cow feed and capital), increase our productivity and maximize the conversion of forage and grain into raw milk. We produced
101.3 million
liters of raw milk during 2018, with a daily average of
8,035
milking cows, delivering an average of 36.6 liters of milk per cow per day. On October, 2017 we completed the construction of our first bio-digestor with a 1.4MWH of installed capacity. The facility generates electricity by burning biogas extracted from the effluents produced by our eight thousand milking cows. On November 3, 2017, we began the energy generation and the delivery of electricity to the local power grid. In addition to increasing revenues and securing our energy requirements, this facility enhances the sustainability of our free stall dairy operation by reducing greenhouse gas emissions, improving the effluent management and concentrating valuable nutrients which are applied back to the fields.
|
|
•
|
All Other Segments business
: Our all other segments business consists of leasing pasture land to cattle farmers in Argentina. We lease over 18.005 hectares of pasture land which is not suitable for crop production to third party cattle farmers.
|
The following table sets forth, for the periods indicated, certain data relating to our farming business:
|
|
Year Ended December 31,
|
||||||||
|
2018
|
2017
|
2016
|
|||||||
|
Sales
|
(in thousands of $)
|
||||||||
|
Crops (1)
|
155,418
|
|
197,222
|
|
142,124
|
|
|||
|
Rice (2)
|
95,403
|
|
86,479
|
|
96,562
|
|
|||
|
Dairy
|
29,710
|
|
37,522
|
|
32,897
|
|
|||
|
All Other Segments (3)
|
1,770
|
|
1,338
|
|
960
|
|
|||
|
Total
|
282,301
|
|
322,561
|
|
272,543
|
|
|||
|
Harvest year
|
|||||||||
|
2017/2018
|
2016/2017
|
2015/2016
|
|||||||
|
Production
|
(in tons)
|
||||||||
|
Crops (tons)
(4)
|
685,657
|
|
652,201
|
|
583,639
|
|
|||
|
Rice (tons)
(5)
|
276,693
|
|
234,831
|
|
220,758
|
|
|||
|
Total
|
962,350
|
|
887,032
|
|
804,397
|
|
|||
|
|
Year Ended December 31
|
||||||||
|
|
2018
|
2017
|
2016
|
||||||
|
Dairy (thousands of liters)
(6)
|
101,300
|
|
93,168
|
|
92,395
|
|
|||
48
|
Harvest year
|
||||||||||||
|
|
2018/2019
|
2017/2018
|
2016/2017
|
2015/2016
|
||||||||
|
Planted Area
|
(in hectares, including second harvest)
|
|||||||||||
|
Crops
(7)
|
189,412
|
|
192,438
|
|
190,325
|
|
178,491
|
|
||||
|
Rice
|
40,435
|
|
40,289
|
|
39,728
|
|
37,580
|
|
||||
________________________________________________________________________________________________
|
(1)
|
Includes soybeans, corn, wheat, sunflower and cotton, among others.
|
|
(2)
|
Sales of processed rice, including rough rice purchased from third parties and processed in our facilities.
|
|
(3)
|
All Other Segments encompasses our remaining interests in the beef Cattle and Coffee businesses. Our beef cattle business consists of over 59 thousand hectares of pasture land that is not suitable for crop production and as a result is leased to third parties for cattle grazing activities.
|
|
(4)
|
Crop production does not include 120,221 tons, 155,300 tons and 136,797 tons, of forage produced in the 2017/2018, 2016/2017 and 2015/2016 harvest years, respectively.
|
|
(5)
|
Expressed in tons of rough rice produced on owned and leased farms
.
As of December 31, 2018, the 2018/19 harvest year of rice harvest had not begun.
|
|
(6)
|
Raw milk produced at our dairy farms.
|
|
(7)
|
Includes
6,010
hectares, 5,177 hectares, and 5,514 hectares, used for the production of forage during the 2017/18, 2016/2017, and 2015/2016 harvest years, respectively.
|
2. Sugar
,
Ethanol and Energy Business:
We cultivate and harvest sugarcane which is then processed in our own mills to produce sugar, ethanol and energy. As of December 31, 2018, our total sugarcane plantation consisted of
153,690
hectares, planted over both owned and leased land. We currently own and operate three sugar and ethanol mills, UMA, Angélica and Ivinhema, with a total crushing capacity of
12.3
(1)
million tons of sugarcane per year as of December 31, 2018. UMA is a small but efficient mill located in the state of Minas Gerais, Brazil, with a sugarcane crushing capacity of 1.2
(2)
million tons per year, full cogeneration capacity and an associated sugar brand with strong presence in the regional retail market (
Açúcar Monte Alegre
). We plant and harvest 99.7% of the sugarcane milled at UMA, with the remaining 0.3% acquired from third parties. Angélica and Ivinhema are two new, modern mills, which we built in the state of Mato Grosso do Sul, Brazil, with current sugarcane crushing capacities of 5.5
(3)
and 5.6
(3)
million tons per year, respectively. Both mills are located 45 km apart, and form a cluster surrounded by one large sugarcane plantation. Angelica and Ivinhema are equipped with high pressure steam boilers and turbo-generators with the capacity to use all the sugarcane bagasse by-product to generate electricity. Approximately 28% of the electricity generated is used to power the mill and the excess electricity is sold to the local power grid, resulting in the mills having full cogeneration capacity.
For the year ended December 31, 2018, we crushed 11.4 million tons of sugarcane. Our mills produce both sugar and ethanol, and accordingly, we have some flexibility to adjust our production (within certain capacity limits that generally vary between 40% and 75%) between sugar and ethanol, to take advantage of more favorable market demand and prices at given points in time. For the year ended December 31, 2018 we produced
344,137
tons of sugar and
675,001
cubic meters of ethanol.
As of December 31, 2018, our overall sugarcane plantation consisted of
153,690
hectares of sugarcane in the states of Mato Grosso do Sul and Minas Gerais, Brazil, of which 10,287 hectares of sugarcane were planted on owned land, and 143,403 hectares were planted on land leased from third parties under long term agreements.
(1)
Assuming an average of 5,151 hours
49
The following table sets forth, for the periods indicated, certain data relating to our sugar, ethanol and energy business:
|
Year Ended December 31,
|
|||||||||
|
|
2018
|
2017
|
2016
|
||||||
|
Sales
|
(In thousands of $)
|
||||||||
|
Sugar
|
128,377
|
|
305,688
|
|
330,895
|
|
|||
|
Ethanol
|
324,661
|
|
241,650
|
|
211,451
|
|
|||
|
Energy
|
57,797
|
|
62,218
|
|
53,995
|
|
|||
|
Other
|
103
|
|
1,061
|
|
351
|
|
|||
|
Total
|
510,938
|
|
610,617
|
|
596,692
|
|
|||
|
Year Ended December 31,
|
|||||||||
|
Production
|
2018
|
2017
|
2016
|
||||||
|
Sugar (tons)
|
344,137
|
|
567,068
|
|
701,060
|
|
|||
|
Ethanol (cubic meters)
|
675,001
|
|
434,015
|
|
422,395
|
|
|||
|
Energy (MWh exported)
|
705,539
|
|
712,425
|
|
751,037
|
|
|||
|
|
Year Ended December 31,
|
||||||||
|
Other Metrics
|
2018
|
2017
|
2016
|
||||||
|
Sugarcane milled (% owned)
|
94,6%
|
|
89
|
%
|
91
|
%
|
|||
|
Sugarcane crushing capacity (millions of tons)
|
12.3
|
|
12.3
|
|
11.2
|
|
|||
|
% Mechanized harvesting operations — Consolidated
|
99
|
%
|
98
|
%
|
98
|
%
|
|||
|
% Mechanized /harvesting operations — Cluster
|
100
|
%
|
100
|
%
|
100
|
%
|
|||
(1)
Assuming an average of 5,151 crushing hours
(2)
Assuming an average of 4,805 crushing hours
(3)
Assuming an average of 5,168 crushing hours
3. Land Transformation Business:
We acquire farmlands we believe are underdeveloped or underutilized and, by implementing cutting-edge production technology and agricultural best practices, transform the land to be suitable for more productive uses, enhance yields and increase the value of the land. During the sixteen-year period since our inception, we have effectively put into production 174,866 hectares of land that was previously undeveloped or undermanaged. During 2018, we put into production
508
hectares and in addition continued the transformation process of over 132,428 hectares we own. We realize and capture land transformation value through the strategic disposition of assets that have reached full development potential. We believe that the rotation of our land portfolio allows us to re-allocate capital efficiently, maximizing our return on invested capital. Our current owned land portfolio consists of
231,712
hectares, distributed throughout our operating regions as follows: 90% in Argentina, 8% in Brazil, and 1% in Uruguay. During the last twelve years, we sold 22 of our fully mature farms, generating capital gains of approximately
$234 million
.
We promote sustainable land use through our land transformation activities, which seek to promote environmentally responsible agricultural production and a balance between production and ecosystem preservation. We do not operate in heavily wooded areas or wetland areas.
From time to time, the company seeks to recycle its capital by disposing of a portion of its fully developed farms. This allows the company to monetize the capital gains generated by its land transformation activities and allocate its capital to acquire land with higher transformation potential or to deploy it in other businesses, thereby enhancing the return on invested capital. Please see also “-Risks Related to Argentina-Recent Changes in Argentine law concerning foreign ownership of rural properties may adversely affect our results of operations and future investments in rural properties in Argentina” and “-Risks Related to Brazil- Recent changes in Brazilian rules concerning foreign investment in rural properties may adversely affect our investments.”
50
The following table sets forth, for the periods indicated, certain data relating to our land transformation business:
|
|
Year Ended December 31,
|
||||||||
|
|
2018
|
2017
|
2016
|
||||||
|
Undeveloped/Undermanaged land put into production (hectares)
|
508
|
|
1,065
|
|
4,274
|
|
|||
|
Ongoing transformation of croppable land (hectares)
|
132,936
|
|
132,428
|
|
131,363
|
|
|||
|
Number of farms sold
|
2
|
|
—
|
|
—
|
|
|||
|
Hectares sold
|
9,300
|
|
—
|
|
—
|
|
|||
|
Capital gains from the sale of land ($ thousands) (1)
|
35,000
|
|
—
|
|
—
|
|
|||
(1) Includes the sale of non-controlling interests in farmland companies
Our Strengths
We believe the following are our competitive strengths:
|
•
|
Unique and strategic asset base.
We own strategically located farmland and agro-industrial assets in Argentina, Brazil and Uruguay. We engage in continuous improvement of our operations and practices, resulting in the reduction of operating costs and an increase in productivity, ultimately enhancing the value of our properties and generating capital gains. Our operations also benefit from strategically located industrial facilities throughout Argentina and Brazil, increasing operating efficiencies and reducing operating and logistical costs. We are vertically integrated where economics and returns are attractive, where the efficiency of our primary operation is significantly enhanced, or where lack of a competitive market results in the absence of a transparent price determination mechanism. Our diversified asset base creates valuable synergies and economies of scale, including (i) the ability to transfer the technologies and best practices that we have developed across our business lines, (ii) the ability to apply value-adding land transformation strategies to farmland in connection with our farming and sugarcane operations, and (iii) a greater ability to negotiate more favorable terms with our suppliers and customers.
|
Owning a significant portion of the land on which we operate is a key element of our business model.
|
•
|
Low-cost production leveraging agro-ecological competitive advantages.
Each of the commodity products we grow is produced in regions where agro-ecological conditions provide competitive advantages and which, through the implementation of our efficient and sustainable production model, allow us to become one of the lowest cost producers.
|
|
•
|
Our grain and oilseed production is based in the Argentine humid pampas region where soil fertility, regular rainfalls, temperate climate, availability of land and proximity to ports contribute to the reduced use of fertilizers and agrochemicals, high productivity and stable yields and efficient logistics, ultimately resulting in one of the lowest costs per ton of grain produced and delivered.
|
|
•
|
Our rice operation is located in the northeast provinces of Argentina, one of the best rice farming regions in the world due to plentiful sunlight, abundant availability of water for low cost irrigation and large potential for expansion.
|
|
•
|
Our dairy operation is situated in the Argentine humid pampas region, where cow feed (grains, oilseeds and forage) is efficiently and abundantly produced at a low cost and climate and sanitary conditions are optimal for cow comfort, which enhances productivity, cow reproduction rates and milk quality.
|
|
•
|
We produce sugarcane in the center-south region of Brazil, where the combination of soil and climate result in high sugarcane productivity and quality, resulting in one of the lowest production costs in the world, significantly lower than other major sugar producing regions, including India, China, the United States, the United Kingdom, France and Germany.
|
|
•
|
Standardized and scalable agribusiness model applying technological
innovation.
We have consistently used innovative production techniques to ensure that we are at the forefront of technological improvements and environmental sustainability standards in our industry. We are implementing an agribusiness model that consists of specializing our workforce and defining standard protocols to track crop development and control production variables, thereby enhancing management
|
51
decision-making. We further optimize our agribusiness model through the effective implementation and constant adaptation of a portfolio of advanced agricultural and information technologies and best practices tailored to each region in which we operate and commodity we produce, allowing us to improve our crop yields, reduce operating costs and maximize margins in a sustainable manner.
|
•
|
In our farming business, we use “no-till” technology as the cornerstone of our crop production and have been able to implement this technique in areas within our production regions where it had not been used before. Furthermore, we also utilize crop rotation, second harvests, integrated pest management, balanced fertilization, water management and mechanization. Additionally, we use the innovative silo bag storage method, utilizing large polyethylene bags with a capacity of 180-200 tons which can be left on the field for 12 months, resulting in low-cost, scalable and flexible storage on the field during harvest, which we believe allows us to expand our crop storage capacity at a low cost, generate important logistic and freight savings by moving our production in the off-season when freight fares are lower, and time the entry of our production into the market at optimal price points. See “-Operations and Principal Activities-Farming-Storage and Conditioning.”
|
|
•
|
In our dairy business, we believe that we were the first company in South America to implement the “free-stall” production system, resulting in more efficient conversion of feed to raw milk and higher production rates per cow compared to our peers in the region.
|
|
•
|
In our sugar, ethanol and energy business, our sugarcane cluster, constituted by the Ivinhema and Angélica mills (i) has a highly mechanized planting and harvesting operation, which has increased our sugarcane production, reduced our operating costs and contributed to environmental sustainability by eliminating the need to burn the sugarcane before harvest; (ii) has the capacity to use all the bagasse (a by-product of the sugar and ethanol production process) that is produced, with almost no incremental cost, to cogenerate 216 MW per day of clean and renewable electricity; (iii) has the capacity of processing 51,600 tons of sugarcane per day and (iv) has the ability to recycle by-products such as filter cake and vinasse by using them as fertilizers in our sugarcane fields, as well as recycling water and other effluents, generating important savings in input costs and protecting the environment.
|
|
•
|
Unique diversification model to mitigate cash flow volatility.
We pursue a unique multi-tier diversification strategy to reduce our exposure to production and market fluctuations that may impact our cash flow and operating results. We seek geographic diversification by spreading our portfolio of farmland and agro-industrial assets across different regions of Argentina, Brazil and Uruguay, thereby lowering our risk exposure to weather-related losses and contributing to stable cash flows. Additionally, we produce a variety of products including soybeans, corn, wheat, sunflower, cotton, barley, sorghum, rice, raw milk, sugar, ethanol and energy, which lowers our risk exposure to potentially depressed market conditions of any specific product. Moreover, through vertical integration in the rice, dairy, sugar, ethanol and energy businesses, we process and transform a portion of our agricultural commodities into branded retail products, reducing our commodity price risk and our reliance on the standard market distribution channels for unprocessed products. Finally, our commercial committee defines our commercial policies based on market fundamentals and the consideration of logistical and production data to develop a customized sale/hedge risk management strategy for each product.
|
|
•
|
Expertise in acquiring farmland with transformation and appreciation potential.
Since our inception in 2002, we have executed transactions for the purchase and disposition of land for over $652 million and sold over
91,400
hectares of developed land, generating capital gains of approximately
$234 million
. We believe we have a superior track record and have positioned ourselves as a key player in the land business in South America. Our business development team has gained extensive expertise in evaluating and acquiring farmland throughout South America and has a solid understanding of the productivity potential of each region and of the potential for land transformation and appreciation. To date, we have analyzed over 11 million hectares of farmland spread throughout the regions in which we operate and other productive regions in the world. We have developed a methodology to assess farmland and to appraise its potential value with a high degree of accuracy and efficiency by using information generated through sophisticated technology, including satellite images, rain and temperature records, soil analyses, and topography and drainage maps. Our management team has gained extensive experience in transforming and maximizing the appreciation potential of our land portfolio through the implementation of our agribusiness techniques described above. We also have an extensive track record of rotating our asset portfolio to generate capital gains and monetize the transformation and appreciation generated through our land transformation activities and agricultural operations.
|
|
•
|
Experienced management team, knowledgeable employees.
Our people are our most important asset. We have an experienced senior management team with an average of more than 20 years of experience working in our sector and a solid track record of implementing and executing large scale growth projects such as land transformations, greenfield
|
52
developments of industrial plants, and integrating acquisitions within our organization. Recruiting technically qualified employees at each of our farms and operating sites is a main focus of our senior management and a key to our success.
Our Business Strategy
We intend to maintain our position as a leading agricultural company in South America by expanding and consolidating each of our business lines, creating value for our shareholders. The key elements of our business strategy are:
|
•
|
Expand our farming business through organic growth
,
leasing and
strategic acquisitions.
We will continue to seek opportunities for organic growth, target attractive acquisition and leasing opportunities and strive to maximize operating synergies and achieve economies of scale in each of our three main farming business areas (crops, rice and dairy). We have identified several organic expansion projects that we are currently undertaking. These projects form part of our strategic growth plan, We believe that the execution risk associated with these projects is not expected to be significant as we are investing in existing operations that are highly efficient. Also our expected results do not rely exclusively on rising commodity prices, which we expect to remain constant at current levels.
|
◦
Dairy business: The construction of free stall #3 is completed and we continue to populate the facility. As of the day of this report, we are operating at 85% of total capacity, targeting operations at full capacity by the end of 2019. We are advancing well in growing and securing corn silage to feed additional cows. As for the bio-digester, we already stabilized energy production generating attractive results.
In addition we have completed the acquisition of two milk processing facilities from SanCor Cooperativas Unidas Limitadas. Both plants are well equipped and strategically located. The facility located in the city of Morteros, Province of Cordoba, is at the center of Argentina´s largest dairy basin and has a total processing capacity of 910 thousand liters per day aimed at producing powder milk and cheese for the export market. The facility located in Chivilcoy, Province of Buenos Aires, is halfway between our dairy free stalls facilities and the City of Buenos Aires, the largest fluid dairy market. The total processing capacity of this facility is up to 700thousand liters per day. (See Business Overview – Our Company). These acquisitions are part of our long term growth strategy and are similar to the strategies adopted for our rice, sugar, ethanol, and energy businesses. We believe that being vertically integrated has allowed us to control the supply chain, which has in turn enhanced efficiencies and increased margins. Also, these transactions will provide us with the flexibility to sell into the export and domestic markets, based on relative profitability with a view to generate attractive returns.
◦
Rice business: We expect to conclude investments by the first half of 2019, allowing us to improve our rice processing and distribution capabilities, and increase the value of main by-products.
◦
Crops: We have completed the acquisition of a peanut processing facility equipped with cutting-edge technology, which has been granted all the necessary certifications and export permits. This transaction is in line with our strategy to grow our peanut business as it will enable us to control processing activities and develop direct and long term relations with different customers around the world.
|
•
|
Consolidate our sugar and ethanol cluster in the state of Mato Grosso do Sul, Brazil.
Our main strategy for our sugar and ethanol business is to consolidate our cluster in Mato Grosso do Sul, Brazil, through the ramping up of our Ivinhema and Angelica mills, which as of December 2018 reached a nominal capacity of 12.4 million tons per year. See “-Sugar, Ethanol and Energy-Our Mills.” The consolidation of the cluster will generate important synergies, operating efficiencies and economies of scale such as (i) a reduction in the average distance from the sugarcane fields to the mills, generating important savings in sugarcane transportation expenses; (ii) one centralized management team, reducing total administration cost per ton of sugarcane milled; and (iii) a large sugarcane plantation supplying two mills, allowing for non-stop harvesting. We believe that our sugarcane cluster in Mato Grosso do Sul will allow us to become one of the most efficient and low cost producers of sugar, ethanol and energy in Brazil. Additionally, we plan to continue to monitor closely the Brazilian sugar and ethanol industries and may pursue selective acquisitions that provide opportunities to increase our economies of scale, operating synergies and profitability.
|
After reaching full capacity, our operating teams have been focused on finding ways to continue maximizing efficiency and generating additional synergies and cost dilution. In this process, our teams have identified certain bottlenecks in our industrial operations that may be removed with minimal investments which will allow us to increase crushing volumes per hour and total capacity per year. We are now engaged in an organic growth project to increase the nominal crushing capacity by 30%. The project will be implemented in two phases:
53
- Phase 1 is complete. It consisted in expanding Angelica’s crushing capacity by 0.9 million tons. Crushing capacity was expanded by 150 tons/hour by installing larger mill rollers in the first mill, and expanding the sugar centrifugation and ethanol filtration processes.
- Phase 2 will consist of expanding Ivinhema’s capacity by 2.1 million tons (400 tons/hour), between 2019 and 2022. This will be achieved by installing a new mill (#6) expanding the sugarcane reception, juice treatment and sugar factory. Crushing will grow gradually and reach full capacity in 2023.
|
•
|
Further increase our operating efficiencies while maintaining a diversified portfolio.
We intend to continue to focus on improving the efficiency of our operations and maintaining a low-cost structure to increase our profitability and protect our cash flows from commodity price cycle risk. We seek to maintain our low-cost platform by (i) making additional investments in advanced technologies, including those related to agricultural, industrial and logistical processes and information technology, (ii) improving our economies of scale through organic growth, strategic acquisitions, and more efficient production methods, and (iii) fully utilizing our resources to increase our production margins. In addition, we intend to mitigate commodity price cycle risk and minimize our exposure to weather related losses by (i) maintaining a diversified product mix and vertically integrating production of certain commodities and (ii) geographically diversifying the locations of our farms.
|
|
•
|
Continue to implement our land transformation strategy.
We plan to continue to enhance the value of our owned farmland and future land acquisitions by making them suitable for more profitable agricultural activities, thereby seeking to maximize the return on our invested capital in our land assets. In addition, we expect to continue rotating our land portfolio through strategic dispositions of certain properties in order to realize and monetize the transformation and appreciation value created by our land transformation activities. We also plan to leverage our knowledge and experience in land asset- management to identify superior buying and selling opportunities.
|
Operations and Principal Activities
Farming Business
Our Farming business line is divided into three main reportable operating businesses, namely crops, rice and dairy. We conduct our farming operations primarily on our own land and, to a lesser extent, on land leased from third parties. During harvest year 2017/2018 our farming operations were conducted on a total of 232,796 hectares of land, of which we own 154,664 hectares (excluding sugarcane farms) and we leased the remaining 78,132 hectares from third parties. The following table sets forth our production volumes for each of our farming business lines.
|
Harvest Year
|
|||||||||
|
2017/2018
|
2016/2017
|
2015/2016
|
|||||||
|
Production
|
(in tons)
|
||||||||
|
Crops
(1)
|
537,181
|
|
652,201
|
|
583,639
|
|
|||
|
Rice
(2)
|
276,693
|
|
234,831
|
|
220,758
|
|
|||
|
|
Year Ended December 31,
|
||||||||
|
|
2018
|
2017
|
2016
|
||||||
|
Dairy (thousands of liters)
(3)
|
101,300
|
|
93,168
|
|
92,395
|
|
|||
________________________________________________________________________________________________
|
(1)
|
As of the date of this annual report, the harvest of soybean, corn, sunflower, cotton and rice pertaining to the 2018/2019 harvest year is ongoing. The only crop which has been almost fully harvested in the current 2018/19 harvest year is wheat, with a total production of 71,644 tons.
|
|
(2)
|
Expressed in tons of rough rice.
|
|
(3)
|
Raw milk produced.
|
Crops Business (Grains, Oilseeds and Cotton)
Our agricultural production is mainly based on planting, growing and harvesting crops over our owned croppable area. During the 2017/2018 harvest year, we planted crops over a total area of approximately 189,918 hectares, including our owned land, land
54
leased from third parties and hectares planted in second harvests. During mid 2018 we began the planting of crops pertaining to the 2018/19 harvest year, which will be concluded during the first quarter of 2019, with a total planted area of 189,412 hectares. Our main products include soybean, corn, wheat, sunflower, and cotton. Other products, such as sorghum and barley, among others, are sown occasionally and represent only a small percentage of total sown land.
The following table sets forth, for the harvest years indicated, the planted hectares for our main products:
|
|
Harvest Year
|
||||||||
|
|
2017/2018
|
2016/2017
|
2015/2016
|
||||||
|
Product Area
|
(In hectares)
|
||||||||
|
Soybeans
(l)
|
81,270
|
|
84,434
|
|
88,377
|
|
|||
|
Corn
(2)
|
55,029
|
|
47,157
|
|
42,657
|
|
|||
|
Wheat
(3)
|
34,631
|
|
38,009
|
|
32,396
|
|
|||
|
Sunflower
|
2,869
|
|
5,413
|
|
9,547
|
|
|||
|
Cotton
|
3,132
|
|
2,640
|
|
—
|
|
|||
|
Forage
(4)
|
4,793
|
|
5,177
|
|
5,514
|
|
|||
|
Peanut
|
9,375
|
|
9,475
|
|
—
|
|
|||
|
Total
|
191,099
|
|
192,305
|
|
178,491
|
|
|||
________________________________________________________________________________________________
(1) Includes soybean first crop and second crop planted area.
(2) Includes sorghum and chia.
(3) Includes barley crop.
(4) Forage includes corn silage, wheat silage and sorghum used for cow feed in our dairy operation.
(5) As of December 31, 2018.
The following table sets forth, for the harvest years indicated, the production volumes for our main products
|
|
Harvest Year
|
|||||||||||
|
|
2018/2019
|
2017/2018
|
2016/2017
|
2015/2016
|
||||||||
|
Crop Production
(1)
|
(In tons)
|
|||||||||||
|
Soybeans
(2)
|
250
|
|
6,571
|
|
230,899
|
|
237,681
|
|
||||
|
Corn
(2)
|
52,241
|
|
55,951
|
|
298,324
|
|
248,269
|
|
||||
|
Wheat
|
62,146
|
|
79,341
|
|
115,339
|
|
82,167
|
|
||||
|
Sunflower
(2)
|
4,771
|
|
3,558
|
|
10,112
|
|
15,521
|
|
||||
|
Cotton lint
(2)
|
783
|
|
—
|
|
198
|
|
—
|
|
||||
|
Total
(2)
|
120,191
|
|
145,421
|
|
654,872
|
|
583,638
|
|
||||
________________________________________________________________________________________________
(1) Does not include 120,221, 155,300 and 136,797tons of forage produced in the 2017/18,2016/17, and 2015/2016, harvest years respectively.
(2) As of the date of this annual report, the harvest of soybean, corn, sunflower and cotton pertaining to the 2018/19 harvest year is ongoing. The only crop which has been fully harvested is wheat.
The following table below sets forth, for the periods indicated, the sales for our main products:
55
|
|
Year Ended December 31,
|
||||||||
|
|
2018
|
2017
|
2016
|
||||||
|
Sales
|
(In thousands of $)
|
||||||||
|
Soybeans
|
84,217
|
|
85,527
|
|
63,797
|
|
|||
|
Corn
(l)
|
38,631
|
|
86,238
|
|
48,502
|
|
|||
|
Wheat
(2)
|
32,706
|
|
16,723
|
|
18,191
|
|
|||
|
Sunflower
|
1,598
|
|
3,163
|
|
7,275
|
|
|||
|
Cotton
|
—
|
|
420
|
|
1,434
|
|
|||
|
Other crops
(3)
|
7,386
|
|
5,151
|
|
2,925
|
|
|||
|
Adjustments
(4)
|
(9,120
|
)
|
—
|
|
N/A
|
|
|||
|
Total
|
155,418
|
|
197,222
|
|
142,124
|
|
|||
________________________________________________________________________________________________
(1) Includes sorghum, chia and peanut.
(2) Includes barley.
(3) Includes other crops and farming services.
(4) Accumulated adjustment of Hyperinflation accounting translation for our Crops segment sales.
Soybeans
Soybeans are an annual legume widely grown due to their high content of protein (40%) and oil (20%). They have been grown for over 3,000 years in Asia and, more recently, have been successfully cultivated around the world. The world’s top producers of soybeans currently are the United States, Brazil, Argentina, China and India. Soybeans are one of the few plants that provide a complete protein supply as they contain all eight essential amino acids. About 85% of the world’s soybeans are processed, or “crushed,” annually into soybean meal and oil. Approximately 98% of soybean meal is further processed into animal feed, with the balance used to make soy flour and proteins. Of the oil content, 85% is consumed as edible oil and the rest is used for industrial products such as fatty acids, soaps and biodiesel. We sell our soybeans mainly to crushing and processing industries, which produce soybean oil and soybean meal used in the food, animal feed and biofuel industries.
We grow soybeans in Argentina, Brazil and Uruguay. In the 2015/16 harvest year, we planted a total area of 88,377 hectares of soybean, producing a total of 237,681 tons representing 51% of our total crop planted area that year, and 41% of our total crop production. In the 2016/17 harvest year, we planted a total area of 84,435 hectares of soybean, producing a total of 230,899 tons representing 46% of our total crop planted area that year, and 35% of our total crop production. In the 2017/18 harvest year, we planted a total area of 81,269 hectares of soybean, producing a total of 155,281 tons representing 42% of our total crop planted area that year, and 29% of our total crop production.
Soybeans comprised, 7%, 9%, and 8.6% of our total consolidated sales in 2016, 2017, and 2018 respectively
Corn
Corn is a cereal grown around the world and is one of the world’s most widely consumed foods. The main component of corn grain is starch (72% to 73% of grain weight), followed by proteins (8% to 11%). Corn grain is directly used for food and animal feed (beef, swine and poultry meat production and dairy). Corn is also processed to make food and feed ingredients (such as high fructose corn syrup, corn starch and lysine), or industrial products such as ethanol and polylactic acid (PLA). Oil, flour and sugar are also extracted from corn, with several uses in the food, medicine and cosmetic industries. Additionally, there are specific corn types used for direct human consumption such as popcorn and sweet corn.
We grow corn in Argentina, Brazil and Uruguay. In the 2015/2016 harvest year, we planted a total area of approximately 41,636 hectares of corn, including the second harvest, producing a total of 243,972 tons of corn representing 25% of our total planted area that year, and 43% of our total crop production. In the 2016/2017 harvest year, we planted a total area of approximately 48,8678 hectares of corn, including the second harvest, producing a total of 268,603 tons of corn representing 28% of our total planted area that year, and 42% of our total crop production.In the 2017/2018 harvest year, we planted a total area of approximately 56,741 hectares of corn, including the second harvest, producing a total of 243,898 tons of corn representing 30% of our total planted area that year, and 30% of our total crop production.
Corn comprised 7% of our consolidated sales in 2016, 9% of our consolidated sales in 2017, and 4.5% of our consolidated sales in 2018.
56
Wheat
Wheat is the world’s largest cereal-grass crop. Unlike other cereals, wheat grain contains a high amount of gluten, the protein that provides the elasticity necessary for excellent bread making. Although most wheat is grown for human consumption, other industries use small quantities to produce starch, paste, malt, dextrose, gluten, alcohol, and other products. Inferior and surplus wheat and various milling by products are used for livestock feed. We sell wheat to exporters and to local mills that produce flour for the food industry.
In the 2016/2017 harvest year, we planted a total area of approximately 38,009 hectares of wheat, producing a total of 115,339 tons of wheat. In the current 2017/2018 harvest year, we planted a total area of approximately 36,533 hectares of wheat, producing a total of 79,675 tons of wheat. In the current 2018/2019 harvest year, we planted a total area of approximately 40,335 hectares of wheat, producing a total of 11,087 tons of wheat.
Wheat comprised 2% of our total consolidated sales in 2016, 2% of our total consolidated sales in 2017, and 3.8% of our total consolidated sales in 2018.
Sunflower
There are two types of sunflower, the most important in terms of volume being the oilseed sunflower, which is primarily grown for the oil extracted from the seed. Sunflower oil is considered one of the top three oils for human consumption, due to its high oil content (39-49%) and its oil composition (90% of oleic and linoleic oil). The other type of sunflower is the confectionary sunflower, which is used for direct human consumption. Sunflower seeds are an exceptional source of vitamin E, omega-6 fatty acids, dietary fiber and minerals. We grow both types of sunflower.
We grow sunflower in Argentina and Uruguay. In the 2015/2016 harvest year, we planted a total area of approximately 9,547 hectares of sunflower producing a total of 15,521 tons of sunflower representing 6% of our total crop planted area that year, and 3% of our total crop production.In the 2016/2017 harvest year, we planted a total area of approximately 5,413 hectares of sunflower producing a total of 10,112 tons of sunflower representing 3% of our total crop planted area that year, and 2% of our total crop production. In the 2017/2018 harvest year, we planted a total area of approximately 2,869 hectares of sunflower producing a total of 5,181 tons of sunflower representing 1.5% of our total crop planted area that year, and 1% of our total crop production.
Sunflower comprised 1% of our total consolidated sales in 2016, 0.3% in 2017, and 0.2% in 2018.
Cotton
Cotton is the world’s most popular natural fiber. The cotton fiber is made primarily into yarns and threads for use in the textile and apparel sectors. Clothing accounts for approximately 60% of cotton consumption. Cotton is also used to make home furnishings, such as draperies (the third major end use), or professional garments (about 5% of cotton fiber demand). The cottonseed is used in animal feeding or crushed in order to separate its three products - oil, meal and hulls. Cottonseed oil is used primarily for cooking oil and salad dressing. In recent years, there has been a growing demand for cotton oil for biodiesel production.
We plant upland cotton, the most common type of cotton planted and processed around the world. We produce and sell cotton lint and cotton seed.
We grow cotton in northern Argentina and in the western part of Bahia, Brazil. We did not plant any cotton in the 2015/16 harvest year. In the 2016/2017 harvest year, we planted a total area of approximately 2,640 hectares of cotton producing a total of 198 tons of cotton lint, representing 1% of our total planted crop area that year, and 0.03% of our total crop production. In the 2017/2018 harvest year, we planted a total area of approximately 3,132 hectares of cotton producing a total of 886 tons of cotton lint, representing 1.6% of our total planted crop area that year, and 0.02% of our total crop production.
Cotton comprised 0.2% of our total consolidated sales in 2016, 0.05% of our total consolidated sales in 2017 and 0.00% of our total consolidated sales in 2018.
Forages
57
In addition to the above mentioned crops, we are engaged in the production of forage in Argentina, including corn silage, wheat silage and sorghum silage. We use forage as cow feed in our dairy operation. During the 2017/2018 harvest year, we planted 4,793
hectares of forage and produced 120,021 tons of forage.
Crop Production Process
Our crop production process is directly linked to the geo-climatic conditions of our farms and our crop cycles, which define the periods for planting and harvesting our various products. Our crop diversification and the location of our farms in various regions of South America enable us to implement an efficient planting and harvesting system throughout the year, which includes second harvests in many cases. Our production process begins with the planting of each crop. After harvesting, crops may go through a processing phase where the grain or seeds are cleaned and dried to reach the required market standards.
For additional discussion of our harvest years and the presentation of production and product area information in this annual report, see “Presentation of Financial and Other Information-Fiscal Year and Harvest Year.”
Rice Business
Rice is the main food staple for about half of the world’s population. Although it is cultivated in over 100 countries and on almost every continent, 90% of the world’s rice is grown and consumed in Asia. Globally, rice is the most important crop in terms of its contribution to human diets and production value. There are three main types of rice: short grain, medium grain and long grain rice. Each one has a different taste and texture. We produce long grain rice and Carolina double rice, a variety of medium grain rice.
We conduct our rice operation in the northeast of Argentina, which is one of the most efficient locations in the world for producing rice at a low cost. This is a result of optimum natural agronomic conditions, including plentiful sunlight, abundant availability of water for low cost irrigation and large quantities of land. The use of public water for artificial irrigation is governed by provincial regulations and is subject to the granting of governmental permits. We currently have permits for the use of water in our production of rice in the provinces of Corrientes and Santa Fe. Maintenance of our permits is subject to our compliance with applicable laws and regulations, which is supervised by the corresponding governmental authority (
e.g.
, the Ministry of Water, Public Services and Environment (
Ministerio de Agua
,
Servicios Publicos y Medio Ambiente
), in the province of Santa Fe, and the Water Institute of the Province of Corrientes (
Instituto Correntino del Agua
).
The following table sets forth, for the harvest years indicated, the total number of planted rice hectares we owned and leased as well as the overall rough rice we produced:
|
|
Harvest Year
|
|||||||||||
|
Rice Product Area & Production
|
2018/2019
|
2017/2018
|
2016/2017
|
2015/2016
|
||||||||
|
Owned planted area (hectares)
|
38,579
|
|
38,579
|
|
38,028
|
|
35,880
|
|
||||
|
Leased planted area (hectares)
|
1,700
|
|
1,700
|
|
1,700
|
|
1,700
|
|
||||
|
Total rice planted (hectares)
|
40,279
|
|
40,279
|
|
39,728
|
|
37,580
|
|
||||
|
Rough rice production (tons)
(1)
|
—
|
|
276,693
|
|
234,831
|
|
220,758
|
|
||||
(1) As of the date of this annual report, the harvest of rice pertaining to the 2018/2019 harvest year is ongoing.
We grow rice on 4 farms we own and 2 farms we lease, all located in Argentina. In the 2016/2017 harvest year, we planted a total area of approximately 39,728 hectares of rice, producing a total of 234,831 tons, representing 18% of our total planted area that year, and 26% of our total farming production. In the 2017/2018 harvest year, we planted a total area of approximately 40,289hectares of rice, producing a total of 276,693 tons, representing 17% of our total planted area that year, and 34% of our total farming production. In the current 2018/2019 harvest year, we planted a total of 40,434 hectares of rice, which have not been fully harvested as of the date of this report.
Rice Production Process
58
The rice production cycle lasts approximately five to six months, beginning in September of each year and ending in April of the following year. Rice planting continues until November, followed by treatment of the rice, which lasts approximately three months, until January. In February we begin harvesting, which lasts until April. After harvesting, the rice is ready for processing.
We process rice in our three rice mills in Argentina, where we are able to process our entire rice crop and utilize our excess milling capacity to process rough rice we purchase from third party growers.
At the mill, we clean the rice to remove all impurities. We then put it through a dryer to remove excess moisture from the grains. Proper drying results in increased storage life, prevents deterioration in quality and leads to optimum milling. Once dried, the rice grain, now known as rough rice or paddy rice, is ready for storage. We store rice in elevators or in silo bags until milling. During the milling process, the rough rice goes through a de-husking machine that removes the husk from the kernel. The rice that is obtained after this process is known as brown rice and is ready for human consumption. Brown rice becomes white rice after it is polished to remove the excess bran.
The main objective of the milling process is to remove the husk and the bran, preserving the quality of the whole grain. Although the process is highly automated and uses advanced technology, some rice grains are broken in the process. The percentage of broken rice depends on a number of factors such as the crop development cycle at the farm, the variety of the grain, the handling and the industrial process. Average processing of rough rice results in 58% white rice, 12% broken rice and 20% rice husk and 10% bran which is sold for use as cattle feed or floor bedding in the poultry business.
|
|
Year Ended December 31,
|
||||||||
|
|
2018
|
2017
|
2016
|
||||||
|
Processed Rice Production
|
(In tons)
|
||||||||
|
Rough rice processed — own
|
266,078
|
|
208,292
|
|
206,794
|
|
|||
|
Rough rice processed — third party
|
10,615
|
|
33,282
|
|
16,382
|
|
|||
|
Total rough rice processed
|
276,693
|
|
241,574
|
|
223,176
|
|
|||
|
|
Year Ended December 31,
|
||||||||
|
|
2018
|
2017
|
2016
|
||||||
|
Processed Rice Sales
|
(In thousand of $)
|
||||||||
|
Total Sales
|
95,403
|
|
86,479
|
|
96,562
|
|
|||
Rice comprised 11% of our total consolidated sales in 2016, 9% in 2017 and 12% in 2018.
Rice Seed Production
In our rice seed facility in Argentina, we are involved in the genetic development of new rice varieties adapted to local conditions to increase rice productivity and quality to improve both farm production as well as the manufacturing process. In connection with these efforts, we have entered into agreements with selected research and development institutions such as the National Institute of Agriculture Technology (
Instituto Nacional de Tecnología
Agropecuaria
, or “INTA”) in Argentina, the Instituto Riograndense do Arroz or "IRGA " in Brazil, the Híbridos de Arroz para América Latina or "HIAA" in Colombia, the Latin American Fund for Irrigated Rice (
Fondo Latinoamericano para Arroz de Riego
, or “FLAR”) in Colombia, the Santa Catarina State Agricultural Research and Rural Extension Agency (
Empresa
de pesquisa Agropecuária e Extensão Rural de Santa Catarina
, or “EPAGRI”) in Brazil and
Badische Anilin- und Soda-
Fabrik (“Basf”) in Germany. Our own technical team is continuously testing and developing new rice varieties. Our first rice seed variety, Ita Caabo 105, was released to the market in 2008. In 2011 we released our second variety Ita Caabo 110, and at the beginning of 2014 we released our third variety, Ita Caabo 107. We are currently experimenting with a wide range of varieties to continue improving our productivity. These seeds are both used at our farms and sold to rice farmers in Argentina, Brazil, Uruguay and Paraguay. We are also developing, alongside Basf, a herbicide-tolerant rice variety to assist in the control of harmful weeds.
Dairy Business
We conduct our dairy operation in our farms located in the Argentine humid pampas region. This region is one of the best places in the world for producing raw milk at a low cost, due to the availability of grains and forages produced efficiently and at
59
low cost, and favorable weather for cow comfort and productivity. Our dairy operation consists of three free-stall dairy facilities with a total capacity of approximately
8,035
milking cows.
The following table sets forth, for the periods indicated below, the total number of our dairy cows, average daily milk production per cow and our total milk production:
|
|
Year Ended December 31,
|
||||||||
|
Dairy Herd & Production
|
2018
|
2017
|
2016
|
||||||
|
Total dairy herd (head)
|
8,035
|
|
8,043
|
|
7,947
|
|
|||
|
Average milking cows
|
7,581
|
|
6,967
|
|
6,880
|
|
|||
|
Average daily production (liters per cow)
|
36.6
|
|
36.6
|
|
36.7
|
|
|||
|
Total production (thousands of liters)
|
101,300
|
|
93,168
|
|
92,395
|
|
|||
|
|
Year Ended December 31
|
||||||||
|
Dairy Sales
|
2018
|
2017
|
2016
|
||||||
|
|
(In thousands of $)
|
||||||||
|
Sales
|
29,710
|
|
37,522
|
|
32,897
|
|
|||
As of December 31,
2018
,
2017
and
2016
, we owned a dairy herd of
8,043
,
7,947
and
7,701
head, respectively, including
6,967
,
6,880
and
6,658
milking cows, respectively, with an average production of
36.6
,
36.6
and
36.7
liters per cow per day, respectively.
Dairy comprised 4% of our total consolidated sales in 2016 and 4% and 3.8% for 2017 and 2018 respectively.
Also, our free-stall dairies #1 and #2 are fully ramped-up and delivering productivity. We plan to invest $55 million over the next four years to build free-stalls #3 and #4. We believe that this project will allow us to double production capacity,
reaching over 185 million liters of fluid milk production per year and reach over 14 thousand milking cows. We believe this
investment is a unique opportunity to leverage on Argentina’s competitive advantages in transforming vegetable protein into
milk protein, our operational expertise and the positive outlook for global and local milk prices.
On February 8, 2019 we acquired two milk processing plants and two trademarks from SanCor Cooperativas Unidas
Limitadas. One of the facilities is located in the city of Chivilcoy, Province of Buenos Aires, and is primarily focused on fluid
milk production for the domestic market in Argentina. The second facility is located in the city of Morteros, Province of
Cordoba, and produces dry milk and cheese for the export market. In addition, we acquired the “Las 3 Niñas” and “Angelita”
trademarks. Both brand names are well recognized in Argentina and represent a solid commercialization vehicle for retail.
consumer dairy products
Dairy Production Process
We wean calves during the 24 hours subsequent to birth and during the next 60 days raise them on pasteurized milk and high protein meal. Male calves are fed concentrates and hay for an additional 3 months in the farm before they are sent to our feedlot to be fattened for sale. Young heifers remain in open corrals during the next 13 months where they are fed with concentrates and forage until they are ready for breeding. Calving occurs nine months later. Heifers are subsequently milked for an average of 320 days. Dairy cows are once again inseminated during the 42- to 90-day period following calving. This process is repeated once a year for a period of six or seven years. The pregnancy rate for our herd is between 85% and 90% per year.
Each cow in our dairy herd is mechanically milked three times a day. The milk obtained is cooled to less than four degrees centigrade in order to preserve its quality and is then stored in a tank. Milk is delivered to large third party milk processing facilities on a daily basis by tank trucks. We feed our dairy cows mainly with corn and alfalfa silages, some grass and corn grain, supplemented as needed with soybean by-products, hay, vitamins and minerals.
We have invested in technology to improve the genetics of our cows, animal health and feeding in order to enhance our milk production. These investments include top quality imported semen from genetically improved North American Holstein bulls, agricultural machinery and devices, use of dietary supplements and modern equipment to control individual milk production and
60
cooling. Our feeding program is focused on high conversion of feed into milk, while maintaining cows in good health and comfort. We have also invested in technology and know-how so as to increase our forage production and utilization.
In 2007, we began the construction of an advanced “free-stall” dairy in Argentina, and started operating in March 2008. This technology allows large- scale milk production at increased efficiency levels. Our free-stall dairy model consists of 3,500 cows confined inside a large barn where they are free to move within the indoor corrals. We feed our cows specific protein rich diets composed of corn grain and silage and milk them three times a day, using a milking mechanism consisting of an 80-cow rotary platform, which milks an average of 400 cows per hour. Having proved the success of our model we built a second free stall diary in 2011 and started operations during August 2012.
Implementation of the free-stall system allows us to position ourselves as a key player in the dairy industry and boost our agricultural and industrial integration presence in the South American agricultural sector. By eliminating cow grazing, we reduced the amount of land utilized for milk production, which freed up more land for our agricultural and land development activities. Cow productivity (measured in liters of milk produced per day) using the free-stall system increases by up to 40% compared to traditional grazing systems. These productivity gains are because the free-stall system significantly improves the conversion rate of animal feed to milk, resulting in an approximate 40% increase in the conversion ratio, or the production of 1.4 liters of milk for each 1 kg of animal feed as compared to the average of 1 liter of milk for each 1 kg of feed associated with the usual grazing model.
This increased productivity and conversion rate are mainly due to improved cow comfort and an enhanced diet quality. We assess cow comfort through the engagement of expert consultants, who recommended designing beds covered with sand. The sand plays a significant role in helping cows to rest comfortably. Additionally, we installed a cooling system to increase cow comfort as well. This system relies on water sprinklers and ventilation fans located all over the facility to create a controlled, cool atmosphere, which improves cow comfort as the Holstein herd is originally adapted to cold regions. Additionally, we manage diet quality by adapting our feeding regime based on the various feeding stages in the lifetime of each cow. The actual feeding is fully mechanized, and we carefully control the harvesting and storage of feed. The control of all productivity variables, such as reproduction, health and operations, supports efficiency gains through standardized processes. Finally, the physical concentration of the animals facilitates efficient overall management of the dairy business as a whole. In terms of the environment, the free-stall model allows for a better effluent treatment, which includes a sand-manure separator stage, a decantation pool and an anaerobic lagoon. All these processes help to decrease the organic matter content of the effluent and deliver a cleaner output. The final treated effluent is used to fert-irrigate crops adjacent to the dairy operation. Accordingly, we transform dairy waste into a high value-added by-product, which reduces fertilizer usage.
During October, 2017 we completed the construction of our first bio-digester. This facility enhances the sustainability of our free stall dairy operation by reducing greenhouse gas emissions, improving the effluent management and concentrating valuable nutrients which are applied back to the fields. It generates electricity by burning biogas extracted from the effluents produced by our seven thousand milking cows. On November 3, 2017, we began generating and delivering 1.4 MW of electricity to the local power grid. In addition of enchancein the sustainability of our diary operation, it increases revenues and secures our energy requirements.
The free-stall dairy is expected to allow us to become an efficient large-scale milk producer and optimize the use of our resources (land, cattle and capital) through the standardization of processes. Process standardization provides high operational control and allows us to scale-up our production efficiently and quickly.
All Other Segments
All Other Segments primarily encompasses our cattle business. Our cattle segment consists of pasture land that is not suitable for crop production due to soil quality and is leased to third parties for cattle grazing activities.
We currently own 59,534 hectares of cattle grazing land located in the Argentine provinces of Corrientes, Santa Fe and Buenos Aires. In 2018, we entered into new lease agreements with third party cattle farmers for a total area of 27,216 hectares.
Storage and Conditioning for the Farming Business
Our storage and conditioning facilities in the farming business allow us to condition, store and deliver our products with no third-party involvement. All our crop storage facilities are located close to our farms, allowing us to (i) reduce storage and conditioning costs; (ii) reduce freight costs since we only commence moving the product once the final destination is determined, whether locally or to a port, (iii) capitalize on fluctuations in the prices of commodities; and (iv) improve commercial performance by mixing grains to avoid discounts due to sub-standard quality.
61
We own two conditioning and storage facilities for grains and oilseeds, with a total built storage capacity of
38,740
tons. Our largest storage facility, with a capacity of 19,240 tons, is located in the province of Santa Fe, Argentina, in the town of Christophersen. It has a railway loading terminal, providing logistical flexibility and savings. We also own in Argentina three rice mills, which account for over
120,000
tons of total storage capacity, and one additional conditioning facilities for rice handling, with a total storage capacity of 6,300 tons.
Set forth below is our storage capacity as of
December 31, 2018
:
|
Storage Capacity
|
Nominal
|
||
|
Crops (tons)
|
38,740
|
|
|
|
Rice (tons)
|
120,000
|
|
|
In addition, we use silo bags to increase our storage capacity at low cost. Silo bags are an efficient low-cost method for grain storage. As crops are harvested, they are placed inside large polyethylene bags that can be left in the fields for approximately 12 months without damaging the grain. Each silo bag can hold up to 180 to 200 tons of product, depending on the type of grain. During the 2017/2018 harvest year, we stored approximately 50% of our grain production through silo bags.
Silo bags offer important operational and logistic advantages, such as (i) low cost storage; (ii) flexible and scalable capacity that is adapted based on production and commercial strategy; (iii) harvest efficiencies since the bags are filled on the field allowing for a non-stop harvest operation regardless of any logistical setbacks; (iv) logistic efficiencies leading to lower freight since grains are transported during the off-season when truck fares are lower; (v) increased ability to monitor quality and identify different grain qualities, since grains are stored in relatively small amounts (200 tons) and easily monitored, maximizing our commercial performance; and (vi) better use of our drying capacity throughout the year. Silo bags are commercially accepted. Grains stored in silo bags can be sold in the market, and if such grains are to be delivered post-harvest, we charge storage costs. Additionally, we can store grains to be used as seed during the following season (soybeans, rice and wheat), achieving quality seed management. We have expanded the use of silo bags from Argentina to our operations in Brazil and Uruguay.
Grain conditioning facilities at our farms allow our trade desk to optimize commercialization costs and to achieve commercial quality standards and avoid price discounts. These facilities are operated to dry, clean, mix and separate different qualities of each grain in order to achieve commercial standards. By mixing different batches of a same grain type, differentiated by quality parameters such as moisture, percentage broken, and percentage damaged, among others, we can achieve commercial standards without having to discount a lower-quality stand-alone batch. Efficient management of these facilities results in a lower cost for grain conditioning and a better achievable price.
Set forth below is our drying capacity as of
December 31, 2018
:
|
Drying Capacity
|
Nominal
|
||
|
Crops (tons/day)
|
8,640
|
|
|
|
Rice (tons/day)
|
6,300
|
|
|
Some grains such as soybeans, wheat and rice, can be used for seed during the next planting season. We produce almost 97% of the seed used for planting these crops in our fields. The seed is stored in silo bags and/or grain facilities, where it can be processed, classified, and prepared for planting during next crop season. A deep survey and monitoring process is carried out in order to evaluate, control and deliver high quality seed to our farms.
The rest of our seed requirements are purchased from seed suppliers in order to incorporate new enhanced varieties into our planting plan.
Marketing, Sales and Distribution for the Farming Business
Crops
In Argentina, grain prices are based on the market prices quoted on Argentine grain exchanges, such as the
Bolsa de Cereales de Buenos Aires
and the
Bolsa de Cereales de Rosario
, which use as a reference the prevailing prices in international grain exchanges (including CBOT and ICE-NY). In Uruguay, local prices are based on an export parity (during harvest) or import parity in the case of post-harvest sales, which, in each case, take into account the prices and costs associated with each market. In Brazil, the
62
grain market includes the
Bolsa de Mercadorias e Futuros
(Brazilian Grain Exchange), which, as in Argentina, uses as a price reference the international grain exchanges (including CBOT and ICE-NY). Prices are quoted in relation to the month of delivery and the port in which the product is to be delivered. Different conditions in price, such as terms of storage and shipment, are negotiated between us and the end buyer. We negotiate sales with the top traders and industrial companies in our markets. We also engage in hedging positions by buying and selling futures and options in commodities exchanges, including the Chicago Board of Trade, the New York Board of Trade, BMF&FBOVESPA Exchange and the
Mercado a Término de Buenos Aires
(MATBA).
Soybeans:
Our soybean crop is sold to local companies and is ultimately exported or diverted to the crushing industry. Approximately 32% of the soybean crop was hedged pre-harvest, by forward sales and sales in the futures markets. Harvest and post-harvest sales are a function of the export market versus local premiums paid by crushers (oil, meal and biodiesel) and logistics considerations. Our five largest customers comprised approximately 67% of our sales in the year ended December 31, 2018. . In Argentina, the applicable export tax rate on soybeans May-19 is 27.4%. There are no export taxes in Brazil and Uruguay.
During 2018 we sold more than 39,000 tons (approximately 16% of our production) certified by the Round Table on Responsible Soybean (“RTRS”), capturing premiums over market value.
RTRS is a civil organization that promotes responsible production, processing, and trading of soy on a global level. During 2012 and 2013 we also certified our silo plant in Argentina under 2BSvs (Biomass, Biofuels Sustainability Voluntary Scheme), based on sustainability criteria of the European Directive 2009/28/EC.
Corn
:
Our corn crop is sold to local companies. Our four largest customers comprised approximately 69% of our sales in the year ended December 31, 2018. Approximately 47% of our production is destined for local market and 53% is sold to exported.
Wheat
:A
pproximately 40% of our production is destined for local market and 60% is exported. Quality segregation allows us to negotiate premiums with the millers and export market. Brazil is the main importer of Argentine wheat. Our four largest customers comprised approximately 72% of our sales in the year ended December 31, 2018.
Sunflower:
Our sunflower production from Argentina is sold to local companies. Sales are made pursuant by production agreements of sunflower for confectionary, high oil content sunflower and seed. Our three largest customers comprised 100% of our sales in the year ended December 31, 2018.
Cotton:
We typically make pre-harvest sales of cotton fiber produced in Argentina into the export market. Sales for the textile industry are based on domestic demand and premiums. Our five largest customers comprised approximately 100% of our sales in the year ended December 31, 2018. Cotton seed is sold in the domestic market to meet feed demand.
Rice:
Rough rice is available for sale commencing after the harvest of each year. White rice availability is based on our milling capacity. 70% of our total rice production is sold into the export market, with the remainder sold in Argentina in the retail market. We export approximately 21% of our exported volume to the Middle East, 73% balance to other Latin American countries, Central America, Europe and Africa. We sell approximately 30% of our rice in the Argentine retail market through two brands we own that have a 18% market share. Local rice prices are driven by regional supply demand and exchange rate in Brazil. Our five largest customers for rice comprised approximately 50% of our sales in the year ended December 31, 2018.
Dairy
:
During most of 2018, we sold our entire raw milk production to three dairy producers. These companies manufacture a range of consumer products sold in Argentina and abroad. We negotiate the price of raw milk on a monthly basis in accordance with domestic supply and demand with these companies. The price of the milk we sell is mainly based on the percentage of fat and protein that it contains and the temperature at which it is cooled. The price we obtain for our milk also rises or falls based on the content of bacteria and somatic cells.
Sugar, Ethanol and Energy Business
Sugarcane
Sugarcane is the most efficient agricultural raw material used in the production of sugar and ethanol. Ethanol produced from sugarcane is highly regarded as an environmentally friendly biofuel with the following characteristics.
63
Renewable:
Sugarcane ethanol, unlike coal or oil, which can be depleted, is produced from sugarcane plants that grow back year after year, provided that they are replanted every six to eight years.
Sustainable:
Sugarcane only needs to be replanted every five to seven years, as a semi-perennial crop. It can be harvested without uprooting the plant, and therefore its cultivation has less of an impact on the soil and the surrounding environment. The mechanization of the harvesting and planting process further improves sustainable agricultural management.
Energy Efficient:
Sugarcane is highly efficient in converting sunlight, water and carbon dioxide into stored energy. The energy output of sugarcane is equal to nine times the energy input used in the production process, whereas the energy output of corn ethanol is only about 1.9 to 2.3 times the energy input used in its production process. Sugarcane produces seven times more energy compared to corn used for ethanol production.
Low Carbon Emissions:
Compared to gasoline, sugarcane ethanol reduces greenhouse gases by more than 61%, which is the greatest reduction of any other liquid biofuel produced today in large quantities. Ethanol made from sugarcane is deemed an advanced biofuel by the United States EPA.
Synergies:
The main raw material used in the production of electricity in sugar mills is bagasse, which is a by-product of the sugarcane milling process, allowing for a renewable source of co- generated electricity.
Sugarcane is a tropical grass that grows best in locations with stable, warm temperatures and high humidity, although cold and dry winters are an important factor for the sucrose concentration of sugarcane. The climate and topography of the center-south region of Brazil is ideal for the cultivation of sugarcane and accounts for approximately 85% of Brazil’s sugarcane production.
As of December 31, 2018, our sugarcane plantations consisted of
153,690
hectares of sugarcane planted in the center-south region of Brazil. Approximately 93% of our sugarcane is planted over land leased through agricultural partnerships. Under these agreements, our partners lease land to us for periods of between one and two sugarcane cycles, equivalent to periods of between 10 to 12 years, on which we cultivate the sugarcane. Lease payments are based on the market value of the sugarcane set forth by the regulations of the State of Sao Paulo Sugarcane, Sugar and Alcohol Growers Counsel (
Conselho dos Produtores de
Cana-de-Açúcar, Açúcar e Álcool do Estado de Sao Paulo
, or “Consecana”). We planted and harvested approximately
94,6%
of the total sugarcane we milled during 2018, with the remaining 5,4% purchased directly from third parties at prices also determined by the Consecana system, based on the sucrose content of the cane and the prices of sugar and ethanol. The following table sets forth a breakdown during the time periods indicated of the amount of sugarcane we milled that was grown on our owned and leased land or purchased from third parties:
|
|
Year Ended December 31,
|
||||||||
|
|
2018
|
2017
|
2016
|
||||||
|
(In tons)
|
|||||||||
|
Grown on our owned and leased land
|
10,748,091
|
|
9,068,844
|
|
10,164,671
|
|
|||
|
Purchased from third parties
|
611,112
|
|
1,172,959
|
|
949,837
|
|
|||
|
Total
|
11,359,203
|
|
10,241,803
|
|
11,114,508
|
|
|||
Sugarcane Harvesting Cycle
The annual sugarcane harvesting period in the center-south region of Brazil begins in April and ends in November/December of each year. In Mato Grosso do Sul, where our cluster is located, the weather pattern is less seasonal than in Sao Paulo. Our wet season is dryer and our dry season is more humid than traditional sugarcane regions. As a consequence of this weather pattern, the sugar content (TRS) gap between the beginning and the end of the year compared to the peak of the harvest is much smaller than in Sao Paulo. This allows us to grow and harvest sugarcane year round with a minimal impact on sugar content (TRS).
Since the beginning of the 2016/17 harvest year we implemented a “non-stop” or “continuous harvest”. This means that we will harvest and crush sugarcane year-round, without stopping during the traditional off-season. This new strategy will allow us to increase annual sugarcane milling and sugar, ethanol and energy production by approximately 10%. Another benefit of the system is that we will be producing ethanol in the off-season, when market prices usually have a high premium to prices at harvest. In addition, cogeneration efficiency is related to harvested volumes and unrelated to TRS, enabling us to utilize our cogeneration potential during the whole year. Considering that approximately 85% of total costs are fixed, this model will result not only in higher revenues but also in the dilution of our fixed costs
.
64
We plant several sugarcane varieties, depending on the quality of the soil, the local microclimate and the estimated date of harvest of such area. Once planted, sugarcane can be harvested, once a year, up to six to eight consecutive years. With each subsequent harvest, agricultural yields decrease. The plantations must be carefully managed and treated during the year in order to continue to attain sugar yields similar to a newly-planted crop.
We believe we own one of the most mechanized harvesting operations in Brazil. Our sugarcane harvesting process is currently 98% mechanized (100% at Angélica and Ivinhema mills and 86% at UMA mill) and the remaining 2% is harvested manually. Mechanized harvesting does not require burning prior to harvesting, significantly reducing environmental impact when compared to manual harvesting. In addition, the leaves that remain on the fields after the sugarcane has been harvested mechanically create a protective cover for the soil, reducing evaporation and protecting it from sunlight and erosion. This protective cover of leaves decomposes into organic material over time, which increases the fertility of the soil. Mechanized harvesting is more time efficient and has lower costs when compared to manual harvesting. Sugarcane is ready for harvesting when the crop’s sucrose content is at its highest level. Sucrose content and sugarcane yield (tons of cane per hectare) are important measures of productivity for our harvesting operations. Geographical factors, such as soil quality, topography and climate, as well as agricultural techniques that we implement, affect our productivity. Since most sugar mills produce both sugar and ethanol in variable mixes, the industry has adopted a conversion index for measuring sugar and ethanol production capacity, the Total Recoverable Sugar (“TRS”) index, which measures the amount of kilograms of sugar per ton of sugarcane.
During the 2018 harvest, our mills harvested sugarcane with an average TRS content of 128 kg/ton and an average yield of 89 tons of sugarcane per hectare.
Once the sugarcane is harvested, it is transported to our mills for inspection and weighing. We utilize our own trucks and trailers for transportation purposes. The average transportation distance from the sugarcane fields to the mills is approximately 28 kilometers at UMA and 33 kilometers at Angélica and Ivinhema.
Our Sugar Mills
We currently own three sugar mills in Brazil, UMA, Angélica and Ivinhema. Our mills produce sugar, ethanol and energy, and have the flexibility to adjust the production mix between sugar and ethanol, to take advantage of more favorable market demand and prices at given points in time. As of December 31, 2018, our sugar mills had a total installed crushing capacity of 12.4 million tons of sugarcane, of which 11.3 million tons correspond to our sugarcane cluster in Mato Grosso do Sul, Brazil. As of December 31, 2018, we concluded the 2018 harvest crushing an aggregate volume of 11.4 million tons of sugarcane.
The Usina Monte Alegre mill (“UMA”) is located in the state of Minas Gerais, Brazil, and has a sugarcane crushing capacity of 1.1 million tons per year, full cogeneration capacity and an associated sugar brand with strong presence in the regional retail market (
Açúcar Monte Alegre
). We plant and harvest 99.7% of the sugarcane milled at UMA, with the remaining 0.3% acquired from third parties. On December 31, 2018, UMA concluded its harvest operations for the 2018 season, crushing 1.1 million tons of sugarcane.
Angélica is an advanced mill, completed in 2010 and located in the state of Mato Grosso do Sul, Brazil, with a total sugarcane crushing capacity of 5.4 million tons per year. The mill is equipped with two modern high pressure boilers and three turbo-generators with the capacity to generate approximately 65 MW of electricity through the use of sugarcane bagasse. The energy produced through this process is used to power the mill with an excess of 64MW available for sale to the power grid. Angélica has the flexibility to vary production between ethanol and sugar from 60% to 40% for either product.
During mid-2011, we started the construction of our third mill, Ivinhema, located in the state of Mato Grosso do Sul, approximately 45 kilometers south of our existing Angelica mill, in order to complete our planned sugarcane cluster in that region. The construction of the first phase of the Ivinhema mill was completed during the beginning of 2013 reaching 2.0 million tons of sugarcane crushing capacity, and milling operations commenced on April 25, 2013. During early 2014, we began the construction of the second phase of the Ivinhema, adding 3.7 million tons of additional nominal crushing capacity. The investment consisted of expanding the milling equipment, building a new fluidized bed boiler, two new electrical generators and expanding the sugar factory and ethanol distillery, as well as expanding the sugarcane plantation and agricultural machinery.The construction was completed during mid-2015. Ivinhema now has a total milling capacity of 5.7 million tons per year. The mill is equipped with state-of-the-art technology including full cogeneration capacity, flexibility to produce sugar and ethanol and fully mechanized agricultural operations. Ivinhema has capacity to produce up to 331,250 tons of sugar, 331,250 cubic meters of ethanol and 389,550 MWh of energy exports.
65
We are currently undertaking an expansion project to increase the nominal crushing capacity by 30%. The project will be implemented in two phases
- Phase 1 is complete and consisted in expanding Angelica’s crushing capacity by 0.9 million tons throughout 2017 and 2018. Crushing capacity was expanded by 150 tons/hour by installing larger mill rollers in the first mill, and expanding the sugar centrifugation and ethanol filtration processes. Crushing will grow gradually and reach full capacity by 2019.
- Phase 2 will consist of expanding Ivinhema’s capacity by 2.1 million tons (400 tons/hour), between 2018 and 2022. This will be achieved by installing a new mill (#6) expanding the sugarcane reception, juice treatment and sugar factory. Crushing will grow gradually and reach full capacity in 2023.
We plant and harvest 94% of the sugarcane milled at our cluster, with the remaining 6% acquired from third parties. On December 31, 2018, our sugarcane cluster concluded its harvest operations for the 2018 season, crushing 10.3 million tons of sugarcane.
Our Main Products
The following table sets forth a breakdown of our production volumes by product for the years indicated:
|
|
Year Ended December 31,
|
||||||||
|
|
2018
|
2017
|
2016
|
||||||
|
Sugar (tons)
|
344,137
|
|
567,068
|
|
701,060
|
|
|||
|
Ethanol (cubic meters)
|
675,001
|
|
434,015
|
|
422,395
|
|
|||
|
Energy (MWh exported)
|
705,539
|
|
712,425
|
|
751,037
|
|
|||
The following table sets forth our sales for each of the sugarcane by-products we produce for the years indicated:
|
|
Year Ended December 31,
|
||||||||
|
|
2018
|
2017
|
2016
|
||||||
|
|
(In thousands of $)
|
||||||||
|
Sugar
|
128,377
|
|
305,688
|
|
330,895
|
|
|||
|
Ethanol
|
324,661
|
|
241,650
|
|
211,451
|
|
|||
|
Energy
|
57,797
|
|
62,218
|
|
53,995
|
|
|||
|
Other
|
103
|
|
1,063
|
|
351
|
|
|||
|
Total
|
510,938
|
|
610,619
|
|
596,692
|
|
|||
Sugar
As of December 31, 2018 our sugar production capacity was approximately 3,550 tons per day which, in a normal year of 6,819 hours of milling, results in an annual sugar maximum production capacity of over 1,008,643 tons of sugar. The increased capacity is the result of enhanced operational efficiencies and the completion of the second phase of the Ivinhema mill. In 2018, we produced
344,137
tons of sugar, compared to
567,068
tons of sugar in 2017 and
701,060
tons of sugar in 2016.
We produce two types of sugar: very high polarization (“VHP”) standard raw sugar and white crystal sugar. VHP sugar, a raw sugar with a 99.3% or higher sucrose content, is similar to the type of sugar traded in major commodities exchanges, including the standard NY11 contract. The main difference between VHP sugar and NY11 raw sugar is the sugar content of VHP sugar, and it therefore commands a price premium over NY11 raw sugar. Crystal sugar is a non-refined white sugar (color 150 ICUMSA) produced directly from sugarcane juice.
Sugar sales comprised 38%, 33% and15,8% of our total consolidated sales in 2016, 2017 and 2018, respectively.
Sugar Production Process
There are essentially five steps in the sugar manufacturing process. First, we crush the sugarcane to extract the sugarcane juice.We then treat the juice to remove impurities. The residue is used to make an organic compost used as fertilizer in our sugarcane fields. The juice is then boiled until the sugar crystallizes, and sugar is then separated from the molasses
66
(glucose which does not crystallize) by centrifugation. The resulting sugar is dried and sent to storage and/or packaging. We use the molasses in our production of ethanol.
Ethanol
As of December 2018, our ethanol production capacity was approximately 3,050 cubic meters per day which, in a normal year of 6,819 hours of milling, results in maximum annual production capacity of over 866,581 cubic meters of ethanol. The increased capacity is the result of enhanced operational efficiencies and the completion of the second phase of the Ivinhema mill. In 2016 we produced
422,395
cubic meters of ethanol, compared to
434,015
cubic meters in 2017 and
675,001
cubic meters in 2018.
We produce and sell two different types of ethanol: hydrous ethanol and anhydrous ethanol (as further described in “-Production Process-Ethanol”). Ethanol sales comprised 24% of our total consolidated sales in 2016, 26% of our total consolidated sales in 2017 and 40% of our total consolidated sales in 2018.
Ethanol Production Process
Ethanol is produced through the fermentation of sugarcane juice or diluted molasses. Initially, we process the sugarcane used
in ethanol production the same way that we process it for sugar production. The molasses resulting from this process is mixed
with clear juice and then with yeast in fermentation vats, and the resulting wine has an ethanol content of approximately 8% to
10%. After the fermentation is complete, the yeast is separated for recycling in the ethanol production process. We distill the
wine to obtain hydrous ethanol. In order to produce anhydrous ethanol, hydrous ethanol undergoes a dehydration process in a
molecular sieve. The liquid remaining after these processes is called vinasse, which we further process to make liquid organic
fertilizer that we use in our sugarcane plantations.
Cogeneration
We generate electricity from sugarcane bagasse (the fiber portion of sugarcane that remains after the extraction of sugarcane juice) in our three mills located in Brazil. As of December 31, 2018, total installed cogeneration capacity reached 232MW, of which 167MW are available for resale to third parties after supplying our mills’ energy requirements. The ability to generate electricity from the by-product of the sugarcane crushing process on a large enough scale to fully power a mill with excess electricity being available is referred to as having full cogeneration capacity. Our three mills are duly licensed by the Agência Nacional de Energia Elétrica (“ANEEL”) to generate and sell electricity. During the year ended December 31, 2018, 2017 and 2016 we sold 772,681 MWh, 860,814 MWh, and 1,028,323 MWh to the local electricity market, comprising 7%, 6%, and 5% of our consolidated sales respectively.
Cogeneration Production Process
Sugarcane is composed of water, fibers, sucrose and other sugars and minerals. When the sugarcane goes through the milling process, we separate the water, sugar and minerals from the fibers or sugarcane bagasse. Bagasse is an important sub-product of sugarcane, and it is used as fuel for the boilers in our mills. Sugarcane bagasse is burned in our state-of-the-art boilers to produce high pressure steam (67 atm) which is used in our high-efficiency turbo-generators to generate electricity to power our mills. The excess electricity, about 66% of production, is sold to the national power grid.
67
The following flow chart demonstrates the sugar, ethanol and cogeneration production process:
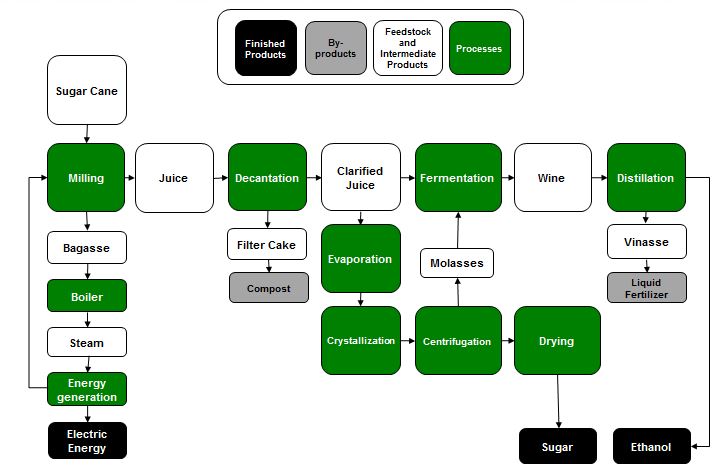
Historically, the energy produced by Brazilian mills has not been price competitive when compared to the low-cost Brazilian hydro-electricity, which accounts for almost 90% of the country’s electricity matrix. Consequently, the majority of the groups in the sugar and ethanol sector have not invested in expanding their energy generation for sale, and the majority of the mills were constructed with less efficient, low-pressure boilers. Since 2000, the Brazilian economy has experienced significant growth, which in turn has resulted in increased demand for energy.
However, hydro- and thermo-electricity have not been able to keep pace for the following reasons: (1) new hydro-electric plants are located in regions (such as the Amazon) distant from consumption centers; (2) significant lead-time is required to construct new hydro- and thermo-electric plants; (3) significant investments are required for transmission lines, pipelines (for natural gas used in thermo-electric plants) and barges; (4) significant environmental costs are associated with both types of electricity generation; and (5) prices for fuel (natural gas) used in the generation of thermo-electricity have increased resulting in greater dependence on Bolivia (Brazil’s principal natural gas supplier). As a result, energy prices in Brazil have been increasing, and alternative sources, such as the electricity from the cogeneration of sugarcane bagasse, have become increasingly competitive and viable options to satisfy the increasing energy demands. Sugarcane bagasse cogeneration is particularly competitive since sugarcane-based electricity is generated following the sugarcane harvest and milling which occurs during the dry season in Brazil, when hydroelectric generation is at its lowest levels.
The main advantages of energy generated by sugarcane bagasse are:
|
•
|
It is a clean and renewable energy;
|
|
•
|
It complements hydropower, the main source of Brazilian energy, as it is generated during the sugarcane harvest period (April to December) when water reservoirs are at their lowest level;
|
|
•
|
It requires a short period of time to start operations; and
|
|
•
|
It requires only a small investment in transmission lines when plants are located close to consumer centers.
|
68
As of December 2018, our total installed cogeneration capacity at our cluster and UMA mill was 216MW and 16MW
respectively, of which 155MW and 12MW are available to sell to the market.
We believe that there is a high potential for growth in the generation of electricity, and we are prepared to make investments to the extent economically viable.
Storage and Conditioning for the Sugar, Ethanol and Energy business
Our sugar and ethanol storage and conditioning facilities are located at our mill sites and allow us to deliver our products when they are ready to be commercialized with no third-party involvement. Having such facilities at mill sites allows us to (i) reduce storage and conditioning costs; (ii) reduce freight costs since we only commence moving the product once the final destination is determined, whether locally or to a port; and (iii) capitalize on fluctuations in the prices of sugar and ethanol.
|
Nominal Storage Capacity
|
Cluster
|
UMA
|
Total
|
||||||
|
Ethanol (cubic meters)
|
160,000
|
|
|
27,000
|
|
|
187,000
|
|
|
|
Sugar (tons)
|
155,000
|
|
|
36,400
|
|
|
191,400
|
|
|
Marketing, Sales and Distribution for the Sugar, Ethanol and Energy business
Sugar:
We sell sugar both in the domestic and the international markets. The domestic sales are processed by our own brand called “Monte Alegre”, which is established in the state of Minas Gerais,Brazil, allowing us to have a competitive advantage amongst our peers. Prices for the sugar we export are set in accordance with international market prices, which are in turn determined in accordance with the ICE # 11 futures contracts. For the fiscal period ended on December 31, 2018 our largest six customers in this segment comprised approximately 99% of our sales.
Ethanol:
Almost all of our ethanol sales are in the domestic Brazilian market given the increasing demand generated from the increase in flex-fuel vehicles in Brazil and better ethanol parity at the gas stations. Around 41% of our ethanol sales are made through formal agreements. The remaining volumes are sold through daily sale orders through specialized brokerage firms or directly with distribution companies and the prices for these transactions are set using the ESALQ hydrous index as a reference. Our largest eight customers by volume comprised approximately 79% of our sales in the period ended December 31, 2018.
Cogeneration:
We also sell electricity co-generated at our sugar and ethanol mills to the grid. Sales are made to commercialization companies, in the spot market, to distributor and through government auctions in long- term contracts. Our largest four customers comprised 97% of our sales revenues in the period ended December 31, 2018.
The Brazilian energy agency, ANEEL, has organized yearly auctions for alternative energy and for renewable sources at favored rates. As a hedging strategy, we sell the electricity production of our mills through long-term contracts adjusted for inflation by reference to the National Index of Consumer Prices (“IPCA”).
In 2009, UMA entered into a 10-year agreement with CEMIG for the sale of approximately 46,200 MWh during the harvest periods each year (May to November of each year) at a rate of R$ 233.93 per megawatt hour in 2015. In 2009, Angélica sold energy in a public auction carried out by Camara de Comercialização de Energia Elétrica (“CCEE”), Angélica entered into a 15-year agreement with CCEE for the sale of 87,600 MWh per year at a rate of R$232.10 per MWh (price for year 2015). In August 2010, Angélica participated in a public auction, whereupon Angélica entered into a second 15-year agreement with CCEE starting in 2011, for the sale of 131,400 MWh per year at a rate of R$206.30 per MWh (price for year 2015). The delivery period for the first auction is May to December and for the second the delivery period starts in April and ends in November of each year. The rates under both agreements are adjusted annually for inflation by reference to the IPCA. In August 2013, Ivinhema sold 87,600 MWh in an auction carried out by CCEE at R$146.08 per MWh. This volume was delivered in 2018 and its price was adjusted annually by IPCA.
Land Transformation Business
Land transformation is an important element of our business model and a driver of value creation. Through land transformation, we optimize land use and increase the productive potential and value of our farmland. Our land transformation model consists of changing the use of underutilized or undermanaged agricultural land to more profitable cash generating agricultural activities,
69
such as turning low cash-yielding cattle pasture land into high cash-yielding croppable land, allowing profitable agricultural activities, such as crop, rice and sugarcane production.
Since our inception, we have successfully identified multiple opportunities for the acquisition of undeveloped or undermanaged farmland with high potential for transformation. During the sixteen-year period since our inception, we have effectively put into production over 171 thousand hectares that were previously undeveloped or inefficiently managed and are undergoing the transformation process.
The land transformation process begins by determining the productive potential of each plot of land. This will vary according to soil properties, climate, productive risks, and the available technology in each specific region. Before commencing the transformation process, we perform environmental impact studies to evaluate the potential impact on the local ecosystem, with the goal of promoting environmentally responsible agricultural production and ecosystem preservation, thereby supporting sustainable land use. We do not operate in heavily wooded areas or primarily wetland areas.
The transformation process for underdeveloped and undermanaged land requires us to make initial investments during a period of one to up to three years, and the land reaches stable productive capability the third to seventh year following commencement of the land transformation activities.
We are engaged in three different categories of the land transformation process, which are defined by the previous use of the land:
|
•
|
Underdeveloped land (savannahs and natural grasslands): This is the most drastic transformation phase since it demands both physical and chemical transformation of the soil. First, the land is mechanically cleared to remove native vegetation. The soil is then mechanically leveled for agricultural operations: in the case of land being transformed for rice production, this process involves heavy land movements and systematization required for irrigation and drainage channels, roads and bridges. In the case of land destined for sugarcane plantations, land movements will also be necessary for the construction of terraces to prevent the excess of water runoff. Certain soils must be chemically treated and corrected by incorporating nutrients such as limestone, gypsum and phosphorous, as is the case of the Brazilian ‘Cerrado’. Soil correction is not required in Argentina or Uruguay due to the natural fertility of the soil. Pesticides and fertilizers are then applied to the soil in preparation for planting. In the case of land destined for crop production (grains and oilseeds), soybean, which is sometimes referred to as a colonizing crop, is usually planted during the first years due to its resistance to pests, weeds and extreme weather and soil conditions. Thereafter, the land will enter into a crop rotation scheme to reduce the incidence of plague and disease and to balance soil nutrients. In the case of rice and sugar cane, which are produced in a monoculture system, there is no colonizing crop or rotation involved. Intensive plague and weed controls and additional soil correction will take place during these first three to five years. Land productivity or yields, measured in tons of soybean or other crops per hectare, will be initially low and will gradually increase year by year. During the first five to seven years, the yields will increase at high and sustained rates. After the seventh year we consider the land developed as yield volatility is reduced and growth is only achievable at marginal rates. Since our inception in 2002, we have put into production about 70 thousand hectares of undeveloped land into productive croppable land.
|
|
•
|
Undermanaged or underutilized farmland (cultivated pastures and poorly managed agriculture): This transformation process is lighter than the one described above since it does not require the initial mechanical clearing of vegetation or land leveling. Only in the case of land being prepared for rice production will leveling be required for efficient flood-irrigation. The transformation of cattle pastures or poor agriculture in the Brazilian ‘Cerrado’ will begin with soil correction and soil tillage in preparation for planting of the first soybean or sugarcane crop. The process will then continue as described in the case above. Land productivity or crop yields will grow at high rates during the first three to five years of the transformation process and will then commence to stabilize and grow at marginal rates, at which point we consider the land developed. Since our inception in 2002 we have put into production over 101 thousand hectares of undermanaged or underutilized farmland into croppable land.
|
|
•
|
Ongoing transformation of croppable land: The application of efficient and sustainable crop production technologies and best practices such as “no-till”, crop rotations, integrated pest and weed management and balanced fertilization, among others, incrementally increases soil quality and land productivity over time, maximizing return on invested capital and increasing the land value of our properties. Our entire farmland portfolio is constantly undergoing this phase of land transformation. During the 2017/2018 harvest year, we operated 134,875 hectares of own developed farmland which were enhanced by the use of best productive practices and technology.
|
In each of these categories of transformation, the metric the company uses to track the level and analyze the progress of the transformation process is the level and tendency of crop yields and the number of years the land has been under crop production.
70
Consequently, the process of land transformation is evidenced by the results of the activities within our other business segments, primarily our crops, rice and sugarcane segments. Accordingly the costs associated with the transformation process described above are allocated within these other business segments. As a result, there may be variations in our results from one season to the next according to the amount of farmland undergoing transformation and the amount of land sold and our ability to identify and acquire new farmland.
Our land transformation segment seeks not only to profit from crop and rice cultivation, but also from the opportunistic disposition of successfully transformed farmland. We strategically sell farms that have reached productive maturity with marginal potential for further productivity increases (years three to seven after commencing the land transformation process) to realize and monetize the capital gains arising from the land transformation process. Land transformation proceeds are in turn reinvested in the purchase of strategic farmland with potential for transformation and appreciation. The rotation of our land portfolio allows us to allocate capital efficiently. Since 2006 we have had a solid track record of selling farmland and achieving profitable returns. During the last twelve years, we have sold
22 farms, generating capital gains of approximately $240 million.
These capital gains are generated by three main factors:
(i) the acquisition of land at opportunistic prices below the market value or fair value of the land;
(ii) the land transformation and ongoing land transformation process described above enhances the productivity and profitability of land, ultimately increasing the value of the land; and
(iii) general market appreciation of land driven by increase in commodity prices and supply and demand dynamics in the land market. In this regard, during the last 30 years, since 1977, farmland prices in Argentina’s core production region have increased an average of 8.1% per year according to data published by
Margenes Agropecuarios
. The value of the farms we sold between 2006 and 2018 as well as our overall land portfolio, has been positively impacted by this external factor.
We believe we are one of the most active players in the land business in South America. Since our inception in 2002, we have executed transactions for the purchase and sale of land for over $730 million. Our business development team is responsible for analyzing, selecting, acquiring and selling land. The team has gained extensive expertise in evaluating and acquiring farmland throughout South America, and has a solid understanding of the productivity potential of each region and of the potential for land transformation and appreciation. Since 2002, the team has analyzed over 11 million hectares of farmland with a total value of approximately $16 billion. We have developed a methodology to analyze investment opportunities, taking into account price, transformation potential, productive model, financial projections, and investment requirements, among others. Our analysis also employs advanced information technology, including the use of satellite images, rain and temperature records, soil analyses, and topography and drainage maps. From time to time, we may leverage our favorable position in and knowledge of the land market to engage in opportunistic buying and selling transactions.
The following table sets forth our acquisitions and divestitures since our inception:
71
|
|
Acquisition
|
Divestitures
|
Total Land Holdings
|
||||||
|
Year Ended December 31,
|
(In hectares)
|
||||||||
|
2002
|
74,898
|
|
—
|
|
74,898
|
|
|||
|
2003
|
—
|
|
—
|
|
74,898
|
|
|||
|
2004
|
34,659
|
|
—
|
|
109,557
|
|
|||
|
2005
|
22,262
|
|
—
|
|
131,819
|
|
|||
|
2006
|
5,759
|
|
3,507
|
|
134,071
|
|
|||
|
2007
|
113,197
|
|
8,714
|
|
239,274
|
|
|||
|
2008
|
43,783
|
|
4,857
|
|
278,200
|
|
|||
|
2009
|
—
|
|
5,005
|
|
273,195
|
|
|||
|
2010
|
14,755
|
|
5,086
|
|
282,864
|
|
|||
|
2011
|
12,992
|
|
2,439
|
|
293,417
|
|
|||
|
2012
|
—
|
|
9,475
|
|
283,942
|
|
|||
|
2013
|
—
|
|
14,176
|
|
269,766
|
|
|||
|
2014
|
—
|
|
12,887
|
|
257,036
|
|
|||
|
2015
|
—
|
|
10,905
|
|
246,139
|
|
|||
|
2016
|
—
|
|
—
|
|
246,139
|
|
|||
|
2017
|
—
|
|
—
|
|
246,139
|
|
|||
|
2018
|
—
|
|
14,427
|
|
231,712
|
|
|||
Our Farms
Appraisal of Farms.
In September 2018, in order to assess the market value of rural properties in Brazil, Argentina and Uruguay, we requested an appraisal by Cushman & Wakefield Argentina S.A., independent real estate valuation firm knowledgeable about the agriculture industry and the local real estate market. As part of these appraisals, the value of each of our properties was determined using the sales comparison approach taking into account current offerings and prices buyers had recently paid for comparable sites, adjusted for the differences between comparable properties and the subject property to arrive at an estimate of the value. The major elements of comparison used to value the properties included the property rights conveyed, the financial terms incorporated into the transaction, the conditions or motivations surrounding the sale, changes in market conditions since the sale, the location of the real estate and the physical characteristics of the property.
The above mentioned valuations assumed good and marketable title to subject properties, which were assumed to be free and clear of all liens and encumbrances. The valuation did not include site measurements and no surveys of the subject properties were undertaken. In addition, the valuations also assumed (a) responsible ownership and competent management of the subject properties; (b) there were no hidden or unapparent conditions of the subject properties, subsoil or structures that render the subject properties more or less valuable; (c) full compliance with all applicable federal, state and local zoning and environmental regulations and laws and (d) all required licenses, certificates of occupancy and other governmental consents were or can be obtained and renewed for any use on which the value opinion contained in the appraisals is based. Unless otherwise stated in the appraisals, the existence of potentially hazardous or toxic materials that may have been used in the construction or maintenance of the improvements or may be located at or about the subject properties was not considered in arriving at the appraisal of value. These materials (such as formaldehyde foam insulation, asbestos insulation and other potentially hazardous materials) may adversely affect the value of the subject properties.
Cushman & Wakefield has informed us their assessment of the market value of our farmland as of September 30, 2018. According to Cushman & Wakefield, the market value of our farmland totaled $846.7 million, out of which $773.5 million correspond to the market value of our farmland in Argentina and Uruguay, and the remaining $73.2 million correspond to the market value of our farmland in Brazil. Net of minority interests in certain Argentine farms, the market value of our farmland totaled $790.6 million. These valuations are only intended to provide an indicative approximation of the market value of our farmland property as of September 30, 2018 based on then current market conditions. This information is subject to change based on a host of variables and market conditions.
72
|
Farm
|
State, Country
|
Gross Size
(Hectares)
|
Current Use
|
||||
|
El Meridiano
|
Buenos Aires, Argentina
|
6,302
|
|
Grains
|
|||
|
Las Horquetas
|
Buenos Aires, Argentina
|
2,086
|
|
Grains & Cattle
|
|||
|
San Carlos
|
Buenos Aires, Argentina
|
4,215
|
|
Grains
|
|||
|
Huelen
|
La Pampa, Argentina
|
4,633
|
|
Grains
|
|||
|
La Carolina
(2)
|
Santa Fe, Argentina
|
4,306
|
|
Grains & Cattle
|
|||
|
El Orden
(2)
|
Santa Fe, Argentina
|
3,506
|
|
Grains & Cattle
|
|||
|
La Rosa
|
Santa Fe, Argentina
|
4,087
|
|
Grains & Cattle
|
|||
|
San Joaquín
|
Santa Fe, Argentina
|
37,273
|
|
Rice, Grains & Cattle
|
|||
|
Carmen
|
Santa Fe, Argentina
|
10,021
|
|
Grains
|
|||
|
Abolengo
|
Santa Fe, Argentina
|
7,473
|
|
Grains
|
|||
|
Santa Lucia
|
Santiago del Estero, Argentina
|
17,495
|
|
Grains & Cattle
|
|||
|
El Colorado
|
Santiago del Estero, Argentina
|
4,960
|
|
Grains
|
|||
|
La Guarida
(1)
|
Santiago del Estero, Argentina
|
7,880
|
|
Grains & Cattle
|
|||
|
La Garrucha
(1)
|
Salta, Argentina
|
1,839
|
|
Grains
|
|||
|
Los Guayacanes
(1)
|
Salta, Argentina
|
3,693
|
|
Grains
|
|||
|
Ombú
|
Formosa, Argentina
|
18,321
|
|
Grains & Cattle
|
|||
|
Oscuro
|
Corrientes, Argentina
|
33,429
|
|
Rice, Grains & Cattle
|
|||
|
Itá Caabó
|
Corrientes, Argentina
|
22,888
|
|
Rice, Grains & Cattle
|
|||
|
Alto Alegre
|
Tocantins, Brazil
|
6,082
|
|
Grains & Cotton
|
|||
|
Bela Manhã
|
Mato Grosso do Sul, Brazil
|
381
|
|
Sugarcane
|
|||
|
Ouro Verde
|
Mato Grosso do Sul, Brazil
|
679
|
|
Sugarcane
|
|||
|
Don Fabrício
|
Mato Grosso do Sul, Brazil
|
3,302
|
|
Sugarcane
|
|||
|
Takuarê
|
Mato Grosso do Sul, Brazil
|
489
|
|
Sugarcane
|
|||
|
Agua Branca
|
Mato Grosso do Sul, Brazil
|
1,614
|
|
Sugarcane
|
|||
|
Nossa Senhora Aparecida
|
Mato Grosso do Sul, Brazil
|
540
|
|
Sugarcane
|
|||
|
Sapálio
|
Mato Grosso do Sul, Brazil
|
6,140
|
|
Sugarcane
|
|||
|
Carmen (Agua Santa)
|
Mato Grosso do Sul, Brazil
|
146
|
|
Sugarcane
|
|||
|
La Pecuaria
|
Duranzo, Uruguay
|
3,177
|
|
Grains
|
|||
|
Doña Marina
|
Corrientes, Argentina
|
14,755
|
|
Rice
|
|||
|
Total
|
|
231,712
|
|
|
|||
(1) On June 2014, we completed the sale of a 49.0% interest in Global Anceo S.L.U and Global Hisingen S.L.U, two Spanish subsidiaries that owned La Guarida, La Garrucha and Los Guayacanes farms.
(2) On December 2015, we completed the sale of a 49% interest in Global Acamante S.L.U, Global Calidon S.L.U, Global Carelio S.L.U, and Global Mirabilis S.L.U, whose main underlying assets are El Orden and La Carolina
A substantial portion of our assets consists of rural real estate. The agricultural real estate market in Brazil, Argentina and Uruguay is particularly characterized by volatility and illiquidity. As a result, we may experience difficulties in immediately adjusting our portfolio of rural properties in response to any alterations in the economic or business environments. The volatility of the local market could affect our ability to sell and receive the proceeds from such sales, which could give rise to a material adverse effect on our business, results of operations and financial condition. See “Item 3. Key Information-D. Risk Factors-Risks Related to Our Business and Industries-A substantial portion of our assets is farmland that is highly illiquid.”
Land Leasing and Agriculture Partnerships.
We enter into operating lease agreements based on criteria regarding the quality and projected profitability of the property, as well as our production and yield objectives in the short or medium term. Generally, we become aware of farms available for lease directly through the owners of farms near our farms and in some cases through regional brokers.
73
We tend to be more open to leasing farmland for sugarcane production than for our farming businesses, where we own the majority of the land that we farm. We lease land for our sugarcane production primarily because leases in this sector are long term, lasting between one or two sugarcane cycles (with each cycle lasting generally 6 years), which allows us to implement and reap the productivity benefits of our land transformation strategies. Sugarcane lease payments are established in terms of tons of sugarcane per hectare, depending on the productivity of the land in terms of tons per hectare and sucrose content per hectare and also on the distance from the land to the mill. Sugarcane prices are based on the market value of the sugarcane set forth by the regulations of the State of Sao Paulo Sugarcane, Sugar and Alcohol Growers Counsel (Conselho dos Produtores de Cana-de-Açúcar, Açúcar e Álcool do Estado de Sao Paulo, or “Consecana”). Given the strategic location of our mills in the region and the inherent inefficiency of growing crops other than sugarcane in this region, we expect to be able to renew our leases for the sugarcane farmland with minimal issues.
With respect to our farming business, the initial duration of lease agreements is generally one harvest year. Leases of farmland for production of grains include agreements with both fixed and variable lease payments in local currency or U.S. dollars per hectare.
Land Management.
We manage our land through an executive committee composed of a country manager, regional manager, farm manager and members of the Technology Adecoagro Group (“TAG”) that meet on a monthly basis. We delegate individual farm management to farm managers, who are responsible for farm operations and receive advisory support from TAG to analyze and determine the most suitable and efficient technologies to be applied. Our executive committee establishes commercial and production rules based on sales, market expectations and risk allocation, and fulfilling production procedures and protocols.
Following an acquisition of property, we make investments in technology in order to improve productivity and to increase its value. Occasionally when we purchase property, a parcel of the property is sub-utilized or the infrastructure may be in need of improvement, including traditional fencing and electrical fencing, irrigation equipment and machinery, among other things.
74
Property, Plant and Equipment
In addition to our farmland, we also own the following principal industrial facilities:
|
Facility
|
|
Province, Country
|
|
Relevant
Operational Data
|
|
Current Use
|
|
“Christophersen”
|
|
Santa Fe, Argentina
|
|
18,700 tons of storage capacity. 2,400 tons per day of drying capacity
|
|
Seedbed and stockpiling plant
(1)
|
|
“Semillero Itá Caabó”
|
|
Corrientes, Argentina
|
|
|
|
Rice genetic improvement program
|
|
“Molino Ala — Mercedes”
|
|
Corrientes, Argentina
|
|
Installed capacity of 4,682 tons
of white rice monthly, and husk rice drying capacity of 2,400 tons per day
|
|
Rice processing and drying plant
|
|
“Molino Ala — San Salvador”
|
|
Entre Ríos, Argentina
|
|
Installed capacity of 5,208 tons
of white rice monthly, and husk rice drying capacity of 1,100 tons per day
|
|
Rice processing and drying plant
|
|
Molino Franck
|
|
Santa Fe, Argentina
|
|
Processing capacity of 5,617 tons of white rice monthly, and husk rice drying capacity of 1,600 tons per day
|
|
Rice processing and drying plant
|
|
Free-Stall I, Free-Stall II and Free-Stall III
|
Santa Fe, Argentina
|
Production capacity of 135 million liters of raw milk
10,500 milking cows
|
Raw milk production
|
|||
|
Bio-digester
|
Santa Fe, Argentina
|
1,4 MW capacity
|
Energy generation
|
|||
|
“Angélica Agroenergía”
|
|
Mato Grosso do Sul, Brazil
|
|
Installed milling capacity of 5.5 million tons of
sugarcane annually, 328,000 tons
of VHP sugar and over 262,000
cubic meters of ethanol, and
over 370,000 MWh
|
|
Sugar and ethanol mill producing hydrated ethanol, anhydrous ethanol and VHP sugar. Sells energy to local network
|
|
“Ivinhema Agroenergía”
|
|
Mato Grosso do Sul, Brazil
|
|
Installed milling capacity of
5.8 million tons of
sugarcane annually, 328,000 tons
of VHP sugar, 328,000
cubic meters of ethanol, and
over 445,000 MWh
|
|
Sugar and ethanol mill producing hydrated ethanol and VHP sugar. Sells energy to local network
|
________________________________________________________________________________________________
|
(1)
|
Classification of wheat and soybean seeds.
|
For additional information regarding our property, plant and equipment, see Note 12 of the Consolidated Financial Statements.
Customers
We sell manufactured and agricultural products to a large base of customers. The type and class of customers may differ depending on our business segments. For the year ended December 31, 2018 more than 90% of our sales of crops were sold to 10 well-known customers (both multinational or local) with good credit history. Of these customers, our biggest four customers represented almost 65% of our sales and the remaining ten represented approximately 25% of our net sales in the course of that year.
In the Sugar, Ethanol and Energy segment, sales of ethanol were concentrated in 6 customers, which represented 75% of total sales of ethanol for the year ended December 31, 2018. Approximately 96% of our sales of sugar were concentrated in 3 well-known traders for the year ended December 31, 2018. The remaining 4%, which mainly relates to “crystal sugar”, were dispersed among several customers. In 2018, energy sales are 97% concentrated in 4 major customers.
75
Competition
The farming sector is highly fragmented. Although we are one of South America’s leading producers, due to the atomized nature of the farming sector, our overall market share in some of the industries in which we participate is insubstantial. Our production volume, however, improves our ability to negotiate favorable supply, transportation and delivery logistics with our suppliers, third-party transporters, ports and other facilities, and customers. Although competition in agriculture varies considerably by product and sector, in general, there are a large number of producers, and each one of them controls only a small portion of the total production. Therefore individual producers often have little influence on the market and cause little or no effect on market prices as a result of their individual strategies, explaining why producers are price takers and not price makers. In many cases, the price is established in international market exchanges. As the majority of agricultural products are commodities, which stifles product differentiation, the principal competition factors are cost of production and volume efficiency gains. In addition, agricultural producers face strong foreign competition, and with this competition the factors are often more difficult to identify.
The majority of farming producers in developed countries can rely on specific protectionist policies and subsidies from their governments in order to maintain their position in the market. In general, we have been able to obtain discounts for the acquisition of supplies and excess prices for our production in the farming sector. In this sector, we view SLC Agrícola S.A., BrasilAgro - Companhia Brasileira de Propriedades Agrícolas, Sollus Agrícola, Radar Propriedades Agrícolas, El Tejar S.A., Cresud SACIF y A, MSU S.A. and Los Grobo Agropecuaria, among others, as our competitors. We also compete in Argentina with retailers of agricultural products, including other branded rice products, such as Molinos Río de la Plata S.A., Dos Hermanos S.H., Sagemüller S.A. and Cooperativa Arroceros Villa Elisa Ltda.
The sugar and ethanol industries are highly competitive. In Brazil, we compete with numerous small-and medium-sized sugar and ethanol producers. Despite increased consolidation, the Brazilian sugar and ethanol industries remain highly fragmented, with more than 411 sugar mills. Some of the largest industry players with whom we compete are Raizen, Biosev, Atvos, Tereos, São Martinho, Bunge, Santa Terezinha, Lincoln Junqueira and Coruripe. We also face competition from international sugar producers, such as those in the U.S. and the European Union, where local regulators have historically implemented tariffs, agriculture subsidies and/or other governmental incentive programs, of which some remain, to protect local sugar producers from foreign competition. The following table describes the Brazilian competitive landscape:
|
|
Brazil
|
|
|
Number of Mills
|
411
|
|
|
Sugarcane crushed (million tons)
|
633.3
|
|
|
Ethanol Production (million cubic meters)
|
27.8
|
|
|
Sugar Production (million tons)
|
37.9
|
|
________________________________________________________________________________________________
Source: Ministry of Agriculture & CONAB
With respect to farmland, there have historically been few companies competing to acquire and lease farmland for the purpose of benefiting from land appreciation and optimization of yields in different commercial activities. However, we believe that new companies, may become active players in the acquisition of farmland and the leasing of sown land, which would add competitors to the market in coming years.
Supplies and Suppliers
Our principal supplies for our farming business are seeds, fertilizers, pesticides and fuel, which represented 9%, 8%, 12% and 5%, respectively, of our total direct costs (including leasing cost). Further, these supplies represented 35% of our total cost of production (including manufacturing and administrative expenses) for 2018. As we use direct sowing in 99% of our planted area, without requiring soil preparation, fuel represents only 5% of the total cost of production for 2018.
Our principal supplies for our sugar, ethanol and energy business are diesel, lubricants and fertilizers, which collectively represented 19% of our total cost of production (including manufacturing and administrative expenses) the sugar, ethanol and energy business for 2018. We have an extensive network of suppliers for each of our business segments and for each required input within each segment, resulting in lower reliance on any particular supplier. Our ten largest suppliers account for 29.25% of our total expenditures for supplies in 2018. While we value the relationships we have developed with each of our suppliers given the quality we have come to expect, we do not consider any single supplier to be key to our production.
76
We have been able to obtain lower prices particularly due to the volume that derives from our large-scale operations.
Seasonality
Our business activities are inherently seasonal. We generally harvest and sell most of our grains (corn, soybean, rice and sunflower) between February and August, with the exception of wheat, which is harvested from December to January. Peanut is harvested from April to May, and sales are executed with higher intensity during the third quarter of the year. Cotton is a unique in that while it is typically harvested from June to August, it requires processing which takes about two to three months to complete. Sales in our dairy business segment tend to be more stable. However, milk production is generally higher during the fourth quarter, when the weather is more suitable for production. Although our Sugar, Ethanol and Electricity cluster is currently operating under a “non-stop” or “continuous” harvest and without stopping during traditional off-season, the rest of the sector in Brazil is still primarily operating with large off-season periods from December/January to March/April. The result of large off-season periods is fluctuations in our sugar and ethanol sales and in our inventories, usually peaking in December to take advantage of higher prices during the traditional off-season period (i.e., January through April). As a result of the above factors, there may be significant variations in our financial results from one quarter to another. In addition our quarterly results may vary as a result of the effects of fluctuations in commodities prices, production yields and costs on the determination of changes in fair value of biological assets and agricultural produce. See “Item 5. Operating and Financial Review and Prospects-A. Operating Results-Critical Accounting Policies and Estimates-Biological Assets and Agricultural Produce.”
Sustainability
Our production model is based on sustainability standards that seek to produce food and renewable energy on a long-term basis. Those standards include best practices and certifications that promote development and health, customer satisfaction and stakeholders' interest, neighboring community welfare, food care and food safety, and environmental protection.Accordingly, our sustainable approach to farming requires that we take into account not only economic, but also social and environmental aspects specifically adapted to local circumstances. We believe we accomplish these goals through a team committed to our values: trust, transparency, efficiency, innovation and sustainability.
Our people
We constantly care about the development, health and safety of our employees. We also promote enhanced working conditions, while we support training and internal education programs to improve skills and educate with the newest technologies and business practices. We implement and constantly revise our health and safety programs in each of our businesses.
Standardized and Scalable Agribusiness Model
We have adopted an agribusiness model that allows us to engage in large-scale farming activities in an efficient and sustainable manner. Our agribusiness model consists of developing a specialized workforce and defining standard protocols to track crop development and control production variables, thereby enhancing efficient decision making and facilitating continuous improvement. This approach allows us to grow in scale, execute our expansion plan and efficiently manage various production units spread across different regions by effectively replicating our productive model. Process standardization also helps us assure compliance with local law and regulations and reduce social and environmental risks.
We continue to develop and implement crop protocols. The purpose of these protocols is to coordinate and consolidate the knowledge on crop management for each area in order to standardize the implementation of these protocols. The protocols contain all the technical information for managing crops. This information is constantly reviewed by agricultural teams and their advisors, making it possible to preserve the technical knowledge of the company and at the same time improve agricultural production and make decisions pursuant to the company’s guidelines. Based on the results of the application of these protocols, we conduct an annual review of the techniques used and their results. This evaluation is done by means of crop campaign analysis, in which all teams review and discuss the last harvest year’s productive performance and the technological package for the new harvest year.
When processes and protocols are defined they can be audited and certified by qualified third parties. Adecoagro is currently in the process of certifying its crop and rice production in Argentina under ISO 9001. We are also working to implement ISO 14001 and OHSAS 18001 in most of the operating units.
In order to achieve efficient scales of production, we have redesigned our field sizes by removing useless cattle infrastructure such as fencing. Larger fields reduce the overlapping of farmworks, enhancing operating efficiency, reducing the use of inputs and achieving agronomic timing (planting or harvesting on time). The goal is to reduce operative time and to improve efficiency
77
in the use of inputs. Large-scale production also requires the implementation of advanced technology such as GPS (Global Positioning System), GIS (Geographic Information System) and modern machinery as well.
We are also adopting operational protocols and procedures in our industrial facilities to improve control of processing variables. In the case of our rice mills, we have certified good manufacturing practices, and in some cases, HACCP (Hazard Analysis and Critical Control Points) standard. Currently we are in the process to implement the FSSC 22000 standard (Food Safety System Certification) in the rice mills, alongside with good manufacturing practices, Kosher and gluten free certifications.
When market conditions provide price premiums for certified grains or oilseeds, we evaluate the feasibility of implementing specific certifications. Some examples of this are RTRS (Round Table on Responsible Soybeans) and EPA (Environmental Protection Agency, US) certifications for Sustainable Soybeans in Argentina. In Brazil, we are certifying sugar-based products for EPA. Bonsucro certifications and Organic Sugar Certification (Usina Monte Alegre).
Contractors
Contractors play a significant role in our farming business model. If cost competitive, we seek to outsource most of the typical farm work, such as planting, spraying and harvesting. Outsourcing allows us to reduce our investments in heavy machinery and equipment such as tractors or harvesters, enhancing the efficient allocation of our capital in our core productive activities. Notwithstanding, we are reviewing the contractor model and comparing it with the use of own machinery in some of our crops and rice operations. We are willing to develop our own-equipment-based model where efficiencies could be enhanced.
The contractor model in the Argentine humid pampas region has existed for over fifty years and has developed into a highly competitive market. Contractors have gained extensive expertise and skill in the management of agricultural machinery and have access to modern advanced technology. When working with them, we seek to develop win-win relationships with our contractors by considering them as part of our production team and providing constant technical training and support through our GTA (as defined below) activities. We strive to have a number of contractors associated with each farm to generate competition and allow benchmarking to enhance operational efficiency and ensure high-quality service.
In regions where this model is not fully developed, we use a mixed system where we hire the most experienced contractors in the region and we also operate our own machinery. We promote the development of new contractors by providing training and selling them our used machinery. We also promote the movement of selected contractors from developed regions into new marginal regions by offering them an opportunity to grow their businesses. In other regions where there is no established contractor system or there is specific farm work (rice land leveling for instance), we own majority of the machinery. In our Sugar, Ethanol and Energy business, we own or lease and operate all the agricultural equipment and machinery needed for sugarcane planting and harvesting operations. Such model is performing very well and is encouraging us to consider it for our Farming businesses. Our main goal is to achieve high-quality farm works, both when selecting any contractor and when using our own machinery. In Brazil we partially employ the contractor model only for specific tasks such as land leveling, and aerial spraying among others.
Adecoagro Technical Group (Grupo Tecnico Adecoagro “GTA”)
The GTA is an internal group formed by agronomists, farm managers, external advisors, contractors, trainees and suppliers, whose main goal is to excel in production management by providing constant technical education and analysis regarding production technologies. Although the GTA is focused on developing such knowledge under common criteria for the whole company, it also considers different production systems, such as crops, rice and dairy in Argentina and Uruguay, and sugarcane in Minas Gerais and Mato Grosso do Sul, Brazil. In order to achieve their goals, the group meets every 20 days to analyze and discuss technical aspects of the farming production processes.
The GTA participates in the design of the most efficient and productive land use strategies, the definition of the optimal crop production mix for each farm and region, and supervises and evaluates the implementation of the most profitable and sustainable technologies to be adapted and applied in each region. Additionally, the GTA promotes specific external training courses, facilitates participation in external technical groups, organizes technical farm tours, offers support in establishing the crop planting plan and delivers a full-season analysis for each crop annually. This analysis is essential in order to allow technical improvements to be implemented for the following crop season.
Since the GTA is involved in different regions, it plays a relevant role in spreading best practices among productive regions, including “no-till” in lesser-developed areas. In order to evaluate and adapt the proper technologies locally, a vast network of test plots in agrochemicals, seeds, and farm-works are being carried out under specific technical guidelines. Such development is performed to make the necessary technological adjustments in respect of fertilizer levels, choice of the best product varieties for each crop, determination of the best planting periods and improvement in crop management and agricultural mechanization, resulting in higher yields coupled with reduced costs.
78
In order to continually improve our technical development, we participate in specialized industry groups, such as CREA and AAPRESID in Argentina, with which we share values and goals. “CREA” is a 50-year-old farmers’ association focused on developing and supporting technical excellence with local farmers. “AAPRESID” is a technical association of highly innovative farmers specializing in no-till development. We participate in certain CREA and AAPRESID discussion groups in which we share and evaluate common technical matters. We take advantage of their vast network of test plots and we constantly exchange technological knowledge for implementation in our farms.
In addition, the GTA is focusing its resources on pursuing improvements trough implementing advanced techniques. Such techniques comprise variable inputs usage by type of soil based on precision agriculture technology, intensification techniques relating to soil occupation times and diversified crop rotations, adjusting “no-till” in rice production, developing sugarcane production technologies involving agricultural mechanization and minimum tillage, and developing cotton production technologies involving “no-till” and crop rotation among others.
By implementing all these education programs and development activities, the GTA provides to the company a network that focuses on the fine-tuning and optimization of the efficiencies throughout all the production processes of each business line.
Technology and Best Practices
We have consistently used innovative production techniques to ensure that we are at the forefront of technological improvements and standards in our industry. For example, we use the “no-till” technology and “crop rotation” to improve our crop yields. We also practice the use of “second harvests” or double cropping where conditions permit, allowing us to plant and harvest a second crop from the same farmland in the same harvest year. Our crop production model is based on balanced fertilization, integrated pest and weed management and crop intensification. We use the innovative silo bag storage method in our rice and crop businesses allowing us to time the entry of our rice production into the market at optimal price points. Additionally, we believe we were the first company in South America to implement the innovative “free-stall” infrastructure in dairy operations resulting in increased raw milk production compared to our peers. The free-stall method is a model that provides for better control over production variables by confining dairy cows into large barns. Those barns are equipped with state-of-the-art technology to enhance cow-comfort conditions, such as sand beds, water-spray cooling system and fans. In addition, installations are equipped with indoor corrals and a mechanical advanced milking system on a rotary platform, allowing us to utilize production efficiencies and thereby increase milk production volumes while maximizing our land use and resulting in significantly higher conversion rates of animal feed into milk.
Our sugarcane harvesting is 98% mechanized, which has significantly improved operating efficiency, therefore reducing operating costs. We have modern facilities in the sugar and ethanol business including advanced sugar and ethanol mills with high-pressure boilers and that achieve one of the highest ratios of energy produced per ton of cane milled, according to the Cane Technology Center Benchmark program. Our Angélica sugar plant was the first continuously operative facility in Brazil, requiring no production stoppages between sugar batches.
No-Till
“No-till” is the cornerstone of our crop production technology and the key to maintaining and even increasing the value and productivity of our land assets. “No-till” - often called zero tillage or direct sowing - is a technology developed more than 30 years ago to grow crops from year to year without disturbing the soil through tillage, and arose as an opposition to conventional tillage.
Conventional farming consists of using plows to turn and till the soil to remove weeds, mix in soil additives such as fertilizers, and prepare the surface for seeding. Soil tillage leads to unfavorable effects such as soil compaction, loss of organic matter, degradation of soil components, death or disruption of microorganisms, evaporation of soil humidity and soil erosion where topsoil is blown or washed away by wind or rain.
“No-till” farming avoids these negative effects by excluding the use of tillage. The “no-till” technology consists of leaving crop plant residues on the surface of the soil after harvesting a crop. These residues form a mulch or permanent cover protecting the soil from erosion risks caused by heavy rains and strong winds. This protective cover also helps natural precipitation and irrigation water infiltrate the soil effectively while decreasing water loss from evaporation. Absence of tillage helps prevent soil compaction, allowing the soil to absorb more water and roots to grow deeper into the soil. Furthermore, “no-till” reduces the emergence of weeds and enhances biological processes that positively impact soil properties, conserving and even improving the presence of organic matter and microorganisms and associated nutrients (nitrogen, phosphorous, etc).
The combination of these advantages results in important cost reductions due to a lower use of inputs, mainly diesel, fertilizers and pesticides, and higher crop yields, thus increasing the profitability of our business. These benefits are achieved in the medium to long term, resulting in a continuous increase of land productivity and thus its value. From an operational standpoint, “no-till”
79
facilitates the conditions to perform most of the operations on time such as planting, spraying and harvesting, which enhances the development of large-scale operations and specially improves the probability of planting each crop at the optimum moment.
Crop Rotation
Crop rotation is the practice of growing a series of dissimilar types of crops in the same area in sequential seasons. Crop rotation allows us to better control the buildup of harmful weeds and reduces the incidence of plagues and diseases that often occur when the same commodity is continuously cropped. Crop rotation also allows us to balance the fertility demands of various crops to avoid the excessive depletion of soil nutrients, contributing to a more efficient use of fertilizers and a sustainable use of herbicides and pesticides. Crop rotation results in increased yields and reduced production costs, providing a high rate of return. Our crop rotation model is tailored to each of our farming regions based on climatic and soil conditions. For example, in Argentina’s Humid Pampas, our three-year crop rotation cycle involves the planting of a wheat crop followed by a soybean double-crop in the first year, a corn crop in the second year, and a soybean crop in the third year. In some areas of the Humid Pampas, where agro-climatic conditions are adequate, we enhance our crop rotation by introducing some industrial crops such as peanut and confectionary sunflower.
Second Harvest - Double Cropping
Second harvest, also known as “double cropping”, is the practice of consecutively producing two crops on the same land within the same growing year. Double cropping is possible only in regions with long growing seasons, which is determined mainly by climate conditions such as rain and temperature. Double cropping allows us to increase the profitability of our land, diversify our production and commercial risk and enhance operational efficiencies through a better utilization of machinery, freight, labor and other resources, resulting in a dilution of our fixed costs. Double cropping has important agronomical advantages as well, such as having crops on the land for a longer period of time, which, enhanced by “no-till” and crop rotation practices results in the improvement of the physical and chemical properties of the soil in the long term. We implement and adapt different double cropping systems for each of our productive regions in Argentina and Uruguay, with the most frequent being wheat/soybean, wheat/corn, sunflower/soybean, corn/soybean and sunflower/corn.
Integrated Pest Management (IPM)
Integrated pest management (“IPM”) involves a deep analysis of agronomical, economic and environmental aspects with the goal of determining the most efficient way to control the pests. It simultaneously achieves three main goals: (i) enhancing crop productivity, (ii) reducing use of pesticides and (iii) decreasing the risk of agrochemical contamination. The first stage of IPM is to train the people who will be involved in pesticide usage. The pesticide to be applied is selected considering local regulations (only locally approved pesticides are used) and the minimum resulting environmental risks due to its chemical classification. Additionally, when selecting biotechnologically developed crops, we evaluate the potential reduction of pesticide uses that may be achieved. The doses of pesticides are defined by vendor recommendations and adjusted through agronomical expertise (specific to a crop and a pest). The timing of pesticide application is based on economic threshold that takes into account the crop situation (growing stage, climate conditions), the potential damage of the pest (type, population, growing stage), the presence of “beneficial” pests, and finally, the price relationship between grains and pesticides. We also use biological pest controls by breeding and releasing natural enemies of the relevant pest, as is the case with the borer plague in sugarcane. The relevance of the pest is measured by implementing specific scouting methodologies, which are adapted to large-scale farming. Scouting is carried out by trained employees who supervise all the fields on a weekly basis. The pesticide doses are applied by high-tech machinery, the majority of which is outsourced. IPM machinery is accurately calibrated to increase its application efficiency and to reduce any potential contamination risk. Climate conditions are taken into account, as well, in determining the optimal timing for spraying, to avoid drifting, evaporation and leakage risks.
Balanced Fertilization
Balanced fertilization consists of determining an optimum use of fertilizers at the proper grades and in the proper amounts to supply the correct ratio of nutrients and to ensure that the soil will sustain high crop yields over time, consequently decreasing contamination risks. At the beginning of each crop season, we perform extensive soil studies in each of our farms to monitor the amount of organic matter, nitrogen, phosphorus and potassium levels in each field. Based on this analysis and considering the potential yield for each field, the crop rotation, and relative prices between fertilizers and agricultural products, we determine the optimum amount of fertilizer to be applied in order to maximize the economic response of the crop.
80
Water management
Since crops need sufficient water to achieve their potential yields, we are engaged in techniques aimed to increase the efficiency of water usage and at the same time to decrease soil erosion risks. In that regard, “no-till” presents strong advantages since it improves rainfall infiltration and increases the soil’s water storage capacity. In areas that may be subject to excess water, we are developing terraces, soil leveling and other techniques intended to decrease runoff and erosion risks. In some of the jurisdictions in which we operate, the use of water for irrigation requires obtaining special permits. For certain irrigated crops such as rice, we focus on the design and operation of rainwater harvesting, collecting water from rain in semi-natural reservoirs destined for future irrigation. In addition, we have developed a water recycle system for each farm where excess of water (derived from drainage and rainfalls) can be reused, instead of being drained out of the farm. Channels to conduct the water and drain the fields are developed by experts in order to deliver water in the most efficient manner. We are also developing Precision Leveling system (with zero or controlled grade level) in most of our rice farms to increase productivity and reduce production costs. This technique involves a precise leveling of the land based on GPS and Laser technology. When fields are accurately leveled, water irrigation requirements are reduced, thus lowering the cost of labor and energy. Efficient management of irrigation results in a positive impact on yields. Additionally, as the fields can be larger, there are some operational benefits that can be achieved by reducing machinery working times. Currently, we are implementing polypipe irrigation system in some rice-fields. This technology consists of deploying plastic pipes to conduct irrigation water from big channel to the fields, thus reducing water consumption, alongside with a small reduction of area devoted to infrastructure. In addition, we are using drones to assess water levels during rice irrigation season. Through this high-precision surveillance method, we are enhancing water management, which improves potential yield, while reducing water consumption. Drones use different cameras to detect water levels even when dense canopies cover the fields. Other crops such corn seed and, sunflower seed are irrigated by highly efficient pivot spraying systems. This type of irrigation system allows us to distribute water uniformly throughout the field, improving the use of water in terms of total millimeters per year. We conduct soil moisture sampling to define the best moment and amount of water to be used for irrigation in each plot.
Mechanization
We incorporate all available mechanization technology into our business that is cost-effective. We believe that by employing mechanization technology we improve our operating efficiency and are better able to reach desired economies of scale in our operations. Mechanization also enables us to adopt new associated technologies faster and hastens our development efforts. In our farming business, we are using cutting-edge mechanized technology for planting, spraying, harvesting and irrigating and for soil preparation and management. We also employ advanced mechanization technology in our logistics and product processing operations, including transportation, drying operations and grain sorting and storage. We have developed mechanization technology to benefit sugarcane planting and harvesting, which traditionally have not benefitted from such mechanization.
Synergies
The technologies we employ are very closely linked, and the joint implementation of a number of them will result in positive synergies for our entire production system. For example, implementation of the “no-till” technology can be enhanced by crop rotations, due to the positive biological effects generated by the different types of roots from each crop in the soil. Benefits of integrated pest management are improved when combined with the “no-till” and crop rotation strategies, since the crop stubble that remains on the soil can be a barrier to some plagues, and because some other pests are specific to a particular crop and the crop rotation can be sufficient to control them. We consider these synergies when we develop our crop seeding schedule. . In the case of re-use of residues, we benefited from our experience in sugarcane, where almost everything is re-used and no residues are generated. By transferring such conceptual ideas to our dairy operations, we ended up in reusing the manure from the cows to generate renewable electricity.
AgTech (Agricultural digital-based Technology)
Since inception, we have been introducing cutting-edge technologies to increase our production efficiency. As digital and information-based technologies are rapidly advancing, we are currently devoting time and efforts to work closely with AgTech Startups that could bring solutions to our operational processes. We are monitoring both local and international startups, with the goal of adopting efficient digital technology in our operations (see “Research & Developments” section).
In accordance with the growing risks in cybersecurity threats, we have adopted a series of measures design to mitigate these risks. Among these measures, we perform periodic analyses in order to detect and correct vulnerabilities; we have adopted well known tools to try to stop cyber-attacks like viruses, trojans, hackers and other threats; we have a Disaster Recovery Plan , and we have implemented procedures and policies to address or minimize internal risks.
81
Information Technology
We employ the World Class ERP Oracle eBusiness Suite to standardize and integrate our processes throughout the company and improve controls and information accuracy and consolidation. The Oracle eBusiness Suite allows us to fulfill our local accounting and fiscal needs while facilitating operational coordination across our geographic areas and lines of business, reducing our operational costs and minimizing duplication and inefficiencies. It also provides our management with consolidated results in a timely manner. In addition, our integrated security plan includes an offsite safeguarded system that guarantees business continuity.
Environmental Aspects
We are implementing a production model that reflects a strong commitment to the environment. Our responsibility to the environment begins with complying with local regulations. In order to be better stewards of the environment, we are implementing environmental management plans for our operations. Those plans involve different stages, which include educating our own and outsourced staff, monitoring ecological parameters, preventing negative effects, and correcting deviations. Natural resources such as land, water, air and biodiversity are taken into account when we evaluate both the development of a new production project and the operation of an on-going one. In that regard, we are constantly evaluating best practices to be implemented in our operations. See “-Technology and Best Practices.” With land being one of the most relevant natural resource in our operations, we have developed a sustainable land use strategy that considers factors beyond the requirements of local law and regulations. There are ecosystems that we do not consider appropriate for agricultural development, such as heavy forests and key wetlands. We evaluate development of other areas (savannahs, natural grasses, bush land, lowlands) only after carrying out an environmental impact assessment. In addition to such evaluations, we analyze the agricultural potential of the land in respect of the soil, the climate, crop productivity and available technology, among other factors. Through this approach, we make sure that we grow the most suitable crop in each region with the aim of being the lowest cost producer of the sector. We then consolidate our analysis into a land transformation plan, which includes the best land use option and implements best practices such as the “no-till” technology, crop rotations, integrated pest and weed management, balanced fertilization, responsible pesticide usage and water management. All these best practices aim to increase resource efficiency and to decrease the risk of contamination and waste production and are consolidated into an environmental management plan, which includes biodiversity management when applicable. We aim to properly implement our sustainable production model to enhance land productivity and therefore increase land value. With respect to pesticide contamination risks, we are implementing a responsible pesticide use program, which includes personnel training, personnel protection elements, application recommendations, pesticide selection criteria, pesticide handling and storage and after-use pesticide packages management (which are specifically cleaned, collected and stored for recycling purposes under third parties’ programs).
Additionally, in some regions where biodiversity matters are relevant, we are implementing biodiversity management plans, which mainly consists of periodically monitoring flora and fauna, detecting significant variations of their populations, and proposing measures to reduce any potential threats to local species. As a result, we are implementing some practices such as prohibiting hunting on our farms, developing environmental private protection areas (where natural vegetation is protected by implementing sustainable production practices). As environmental matters require specific expertise and an understanding of complex relationships, we hire highly qualified consultants , and are entering into cooperative arrangements and agreements with educational institutions. We are also developing relationships with well recognized environmental non-governmental organizations, such as The Nature Conservancy.
In Brazil, we have the Brazilian Forestry Code (Código Florestal Brasileiro) as the main source for our environmental policies. Accordingly, we analyze and identify all natural areas inside our own farms and inside leased areas, and make a development plan that defines actions for their preservation. Some examples of these activities are the reforestation of Permanent Preservation Areas (Áreas de Preservación Permanente) and Legal Reserve Areas (Áreas de Reserva Legal), Along with natural regeneration techniques, we are producing seedlings of more than 70 native species to reforest those areas. We are strongly committed to the preservation of forests, and we only develop areas for farming if they were previously used for agricultural purposes or for pasture. We do not operate in massive forests, large wetlands or areas with high biodiversity value. We concern ourselves with the protection of riverbanks and surrounding areas of streams and springs, as they are important for soil conservation and as refuges for native fauna. In that regard, we are implementing periodic monitoring of wildlife and native flora as well. We have a partnership with The Nature Conservancy (“TNC”), an international environmental non-governmental organization, to cooperate in a regional project with goal to organize the environmental preservation of areas of ecological importance. The project includes the feasibility analysis to acquiring such areas to replace reserve areas on our own land and land we lease, through a reserve compensation scheme. This model was developed by TNC and was adopted by the regional environmental authorities. This program will allow us to protect larger blocks of critical ecosystems instead of having smaller reserve areas in each farm, while allowing us to use areas in our farms that were previously developed and would have lesser environmental value as reserve areas.
82
In respect of our industrial processing activities, we focus on energy-efficient processes that increases productivity with minimum waste disposal. At the same time, we constantly promote the re-use of any by-product or residue within the industrial processes when feasible, or in the fields when their economic analysis make sense. A successful example of this approach is the use of manure to produce electricity and the use of bio fertilizers to grow crops in our Dairy Farm. Another successful story is the use of all Sugar and Ethanol industrial by-products (vinasse, filter cake and composted ashes) as bio fertilizers in our cane fields.
Since November 2017, we are producing renewable electricity from our bio-digester built in our Dairy Farm. The bio-digester transforms cow manure into biogas with high methane content, which then fuels a cogeneration facility that generates 1.4 MW of Power. The electricity produced is sold to the grid under a long-term contract with an Argentinean federal utility. Additionally, as this project allows us to reduce GHG emissions, we commenced the feasibility assessment to deliver carbon credits from the bio-digester. In 2011, we received a grant from Sustainable Energy and Climate Change Initiative from the Inter-American Development Bank (SECCI) in order to carry out the pre-feasibility assessment. We have also received a grant from the “Agencia Nacional de Promoción Científica y Tecnologica”, an agency which promotes technological innovation, to partially fund the investment. In July 2016, we participated of Argentina’s “RenovAr” renewable energy auction and entered into a 20-year contract to supply up to 9,145 MWh per year at an average price of US$ 158.92 per MWh plus bonifications. At UMA, we have implemented a pilot plant that produces biogas from vinasse, developed in partnership with Efficiencia, a subsidiary of Companhia Energética de Minas Gerais (“CEMIG”). The technology developed during this project will allow us to generate additional energy from vinasse while maintaining the fertilizer recycling potential of UMA. We are currently replicating this project under a Commercial scale in our Cluster in Mato Grosso do Sul (Brazil). These emission reduction projects could also improve our efficiency by decreasing the carbon emission.
Social Programs
Apart from complying with local labor regulations, we seek to promote the personal and professional development of our employees by offering them an adequate working environment with proper health and safety protections. We aim to develop a transparent relationship with local authorities. Finally, one of our main goals is to contribute positively to the social development of the communities in which we operate, creating new jobs, preserving the environment, providing training opportunities through our internship program and assisting with social development. In order to implement our social development programs, we analyze the areas in which we operate and give special attention to education and poverty rates, possible alliances with other social actors, and potential synergies with local government programs. In addition to social development programs, we contribute to community organizations in each area where we operate, such as hospitals, schools, daycare centers and fire stations, among others. We also have a voluntary matching program where Adecoagro matches each donation from our employees at a 2:1 ratio.
Education
Our sugarcane and rice operations have a very important economic impact in the communities where we are located, and we have developed a Social Action Program in the various municipalities. In 2005, we started a partnership with Cimientos in Corrientes, Santa Fe, Santiago del Estero and Entre Rios in Argentina, through which we have awarded 45 educational programs in 164 urban and rural schools located close to our rice operations. These programs benefit 22,870 students. Cimientos is a non-profit organization that promotes equal educational opportunities for children and youth from low-income families in Argentina. In 2016 we started another program together with CONCIENCIA (a local NGO) in which we support our employees’ children to complete their education. This new program began in Salta near to Los Guayacanes, and 16 children participated. In 2017 we extended the program to the City of San Salvador, where 18 children participated and between the two establishments we reached a total of 34 children in the program.
Additionally, we have partnered with Fundação Bradesco in Mato Grosso do Sul, Brazil, working with the local municipalities of Angélica and Ivinhema to re-train teachers at their schools, aiming to improve the performance of public schools to a level of regional excellence. We also have partnerships to encourage the habit of reading through the training of teachers of municipal schools as storytellers and investment in libraries.
Nutrition
In Argentina, we work in partnership with Conin Foundation, which fights malnourishment in children, focusing its actions in three main aspects: education, assistance and research. In 201
8
, we donated nearly 4,5 tons of powdered milk. We also work in partnership with the Argentine Food Bank Network, to whom we are currently donating approximately 22 tons of processed rice. This network operates in 17 cities and is a nonprofit distribution enterprise that serves the community by acquiring donated food and making it available to people who are hungry through a network of community agencies. These agencies include school feeding programs, food pantries, soup kitchens, hospices, substance abuse clinics, after-school programs and other nonprofit organizations. Additionally, we have been contributing food to Solidagro (6.7 tons), an alliance
83
between rural corporate institutions and civic organizations that seek to solve famine and malnutrition problems, since 2007. We are also collaborating with selected soup kitchen initiatives such as Caritas Christophersen, San Gregorio Foundation and Mercedes City Soup Kitchen.
Additionally, in 2018 we agreed on a new campaign together with a basketball club in the province of Corrientes, Argentina. The campaign was called “Festejá cada punto vale triple” (Celebrate, each point is worth triple). With this campaign for each point the basketball team scores during this season, Adecoagro will donate 3 kilos of rice to the Conin Foundation centers located within the province of Corrientes. In December 2018, we provided 13.5 tons of rice to these centers.
In Brazil, we support several local schools, kindergartens, homes for the elderly and APAEs (local associations to support seriously deficient in the community) with financial investment and training to improve social management. Because of these initiatives, ABRINQ Foundation as Child Friendly Company certified the Monte Alegre unit.
Internship Program
The purpose of our internship program is to promote the development of highly qualified professionals for the community by providing first-time work experience, good quality training and access to highly technology-oriented operations. We seek to facilitate interns’ future access to the job market while detecting potential key employees. The interns actively participate in the TAG training program, which includes monthly technical meetings, external training and farm tours. In order to accomplish these goals we promote institutional relationships with local and international universities and high schools. Over 331 interns have participated in our program during the last 15 years, of which 94 were subsequently incorporated into our teams.
Material Agreements
For a description of the material agreements relating to our indebtedness, please see “Item 5.-Operating and Financial Review and Prospects-B. Liquidity and Capital Resources-Indebtedness and Financial Instruments.”
Argentina
Consignment Contract with Establecimiento Las Marías
Our subsidiary, Pilaga S.A. entered into a consignment contract dated February 19, 2000, with Establecimiento Las Marias S.A.C.I.F.A. pursuant to which Las Marias was granted exclusive license to sell the products or imports of Pilagá S.A. in Argentina. For its services, Las Marias collects a commission of 9.56%, calculated over the gross amounts of the sales made by Las Marias on behalf of Pilagá S.A., net of commercial discounts, before VAT and any other applicable tax that is applied in any invoicing. The term of the agreement is one year from March 1, 2000, automatically renewable for additional one-year periods.
Brazil
Sugar Sale Agreement
On January 13, 2015, Adecoagro Vale do Ivinhema S.A. entered into a Sugar Sales Agreement with Louis Dreyfus Commodities Suisse S.A. pursuant to which Adecoagro Vale do Ivinhema S.A. a agreed to supply 100,000 metric tons of Brazilian VHP (very high polarization) during 2015/2016 harvest year. This amount of sugar was delivered from May to December 2015 in Paranaguá port. The price was fixed in reference to the NY#11 futures contract price.
On September 5, 2014, Adecoagro Vale do Ivinhema S.A. entered into a Sugar Sales Agreement with Alvean Sugar S.L. (vía Agroglobal S.A.), pursuant to which Adecoagro Vale do Ivinhema S.A. agreed to supply 70,000 metric tons of Brazilian VHP (very high polarization) during 2015/2016 harvest year. This amount of sugar was delivered from May to November 2015 in Paranaguá port. The price was fixed in reference to the NY#11 futures contract price.
On October 21, 2014, Adecoagro Vale do Ivinhema S.A. entered into a Sugar Sales Agreement with Bunge Agritrade S/A (vía Adecoagro Uruguay S.A., previously Agroglobal S.A.), pursuant to which Adecoagro Vale do Ivinhema S.A. agreed to supply 101,500 metric tons of Brazilian VHP (very high polarization) during 2015/2016 harvest year. This amount of sugar was delivered from June to December 2015 in Paranaguá port. The price was fixed in reference to the NY#11 futures contract price.
84
Electric Energy Agreements
In the beginning of 2009, UMA entered into a 10-year agreement for the sale of energy to CEMIG, under which UMA agreed to provide 9 MW of energy, approximately 46,215 MWh during the harvest period (May to November of each year) at a rate of R$166.69 per megawatt hour. The price of energy under the contract is adjusted annually according to inflation rate and tariff discounts.
Adecoagro Vale do Ivinhema S.A. entered into an agreement for the sale of energy to CCEE. This agreement is a result of a public auction by the Brazilian federal government in August 2008, carries a term of 15 years, and requires Adecoagro Vale do Ivinhema S.A. to supply CCEE with 87,600 MWh annually during the harvest periods each year (April to December), at a rate of R$157.15/MWh. The Price of energy under the contract is adjusted annually according to inflation.
In August 2010, Adecoagro Vale do Ivinhema S.A. participated in a public auction by the Brazilian federal government. As a result of this auction, Adecoagro Vale do Ivinhema S.A. entered into second 15-year agreement with CCEE starting in 2011, for the sale of 131,400 MWh per year at a rate of R$154.25/MWh.
Intellectual Property
As of March 2019, our corporate group owned 36 trademarks registered with the Argentine National Intellectual Property Institute, had 1 trademark in the process of renovation and had 8 trademarks in the process of registration. Also, Adeco Brasil and UMA owned 16 trademarks registered with the Brazilian National Industrial Property Institute (“INPI”), and had submitted 10 trademark registration requests, all of which are currently being challenged by third parties or were initially denied by INPI. In addition, Adeco Agropecuaria Brasil S.A. had submitted one trademark for registration. Agroglobal S.A. (now Adecoagro Uruguay S.A.) has one trademark registered in Uruguay.
In Argentina, we are required to renew our trademark registrations when they expire at the end of their respective terms. Under the Argentine Trade and Service Marks Law No. 22,362, the term of duration of a registered trademark is 10 years from its issue date, and a trademark may be indefinitely renewed for equal periods thereafter if, within the five-year period prior to each expiration, the trademark was used in the marketing of a product, in the rendering of a service or as the designation of an activity.
In Brazil, title to a trademark is acquired only once its valid registration has been issued by the INPI. During the registration process, the person requesting the trademark merely has an expectation of the right to use the trademark to identify its products or services. Under Law No. 9,279, of May 14, 1996 (the Brazilian Industrial Property Law), the holder of a trademark has the right to its exclusive use throughout Brazil. The term of duration of a registered trademark is 10 years from its issue date, and a trademark may be indefinitely renewed for equal periods thereafter. Within a five-year period from the issue date, the owner has an obligation to use the trademark in the marketing of a product, in the rendering of a service or as the designation of an activity. If the owner does not use the trademark within such five-year period, it may be subject to a forfeiture process, upon request of any third party with legitimate interest in the trademark. The same forfeiture process may occur if the owner fails to use the trademark for any five-year period, continuously. If the trademark is declared forfeited, the trademark rights are terminated.
Insurance
The type and level of insurance coverage we obtain is determined based on consultation with leading insurance brokers. We carry policies with leading U.S., European, and local insurance companies, and we are currently insured against a variety of risks, including losses and damages relating to our plants, equipment and buildings. We believe our level of insurance coverage is customary and appropriate for a company of our size and with respect to our activities. Our insurance currently covers only part of the losses we may incur and does not cover losses on crops due to hail storms, fires or similar risks.
Legal and Administrative Proceedings
In the ordinary course of business, we are subject to certain contingent liabilities with respect to existing or potential claims, lawsuits and other proceedings, including those involving tax, social security, labor lawsuits and other matters. We accrue liabilities when it is probable that future costs will be incurred and such costs can be reasonably estimated. See “Item 8. Financial Information-A. Consolidated Statements and Other Financial Information-Legal and Administrative Proceedings.”
Environmental Regulations and Compliance
Our businesses in the various emerging market countries in which we operate are subject to comprehensive national, state and municipal laws and regulations relating to the preservation and protection of the environment to which those businesses must adhere. These laws and regulations require some of our businesses to obtain permits or licenses that have to be renewed periodically in order to allow us to continue to operate. If such permits or licenses lapse or are not renewed or if we fail to obtain any required
85
environmental licenses and permits, or if we do not comply with any other requirements or obligations established under the applicable environmental laws and regulations, we may be subject to fines or criminal sanctions and might face partial or total suspension of our operations and suspension or cancellation of our environmental licenses and permits. In addition, our businesses which hold debt from banks, and multilateral lenders in particular, are typically required to adhere to environmental standards that exceed those of the country in which the business operates (
e.g.
, World Bank standards).
We are currently either in compliance with or are in the process of applying for permits that would put us in compliance with all applicable environmental laws and material environmental licenses and permits. Specifically, the operational license of UMA is currently being renewed. On June 10, 2014, we applied for the renewal of the operational license for the Angélica mill to mill up to 4 million tons of sugarcane per year. On April 24, 2015, we obtained a installation license (licença de instalação) for the Ivinhema mill, to mill up to 5 million tons of sugarcane per year. On July 23, 2015, we obtained the operational license (licença de operação) from IMASUL authorizing us to mill up to 5 million tons of sugarcane per year.
In addition to the installation and operational license, the Ivinhema mill must obtain other permits including licenses for water capture and use of controlled products, among others. Failure to obtain the necessary environmental licenses may prevent us from operating the Ivinhema mill or may subject us to sanctions.
Our operating businesses have the required environmental monitoring, equipment and procedures, and we utilize third-party contractors to conduct regular environmental audits. Our environmental expenses relate to consultants we use to perform environmental impact studies for our development projects and control and monitoring procedures. However, as environmental regulations are expected to become more stringent in some of the countries where we operate, our environmental compliance costs are likely to increase due to the cost of compliance with any future environmental regulations. While we are not aware of any material environmental liabilities related to our ongoing operations, we may be subject to cleanup costs, which we do not expect to be material.
Regulation and Control of Agri-Food Production in Argentina
The National Office of Agricultural Commerce Control (Oficina Nacional de Control Comercial Agropecuario, or “ONCCA”) created on November 27, 1996, as a decentralized entity of the Ministry of Agriculture was the agency responsible for controlling the commercialization and manufacturing of agricultural livestock, meat and dairy products in Argentina.
As of February 25, 2011 the ONCCA was dissolved pursuant to Decree No. 192/2011. The faculties previously held by the ONCCA have been transferred to the Ministry of Agriculture and to a new entity incorporated (Unidad de Coordinacion y Evaluacion de Subsidios al Consumo Interno) by means of Decree No. 193/2011, intended exclusively for the protection and promotion of activities and granting subsidies. As a result, the Ministry of Agriculture is the enforcement authority of the decrees issued by the ONCCA and is in charge of monitoring the agricultural compliance with the commercialization regulations. Furthermore, the new entity integrated by Ministers and officials from the Ministry of Economy, Ministry Agriculture and Industry and the AFIP will be responsible for the administration, allocation and payment of subsidies for wheat, corn and soybean, and will be in charge of the registry for the export of cattle.
Under applicable regulations, all persons involved in the commercialization and manufacturing of grains and dairy products must be registered with the Register of Operators (Registro Unico de Operadores or "RUO"), which provides for registration of any individual or company involved in the trade and industrialization of agri-food products in the markets for grains, livestock and dairy products and their by-products and/or derivatives. This registration must be renewed each year. Grain producers must stock grains at facilities and must keep a record of the grain stock stored at such facilities. Failure to register with the RUO, or cancellation of such registration, will lead to requirements that the operator cease its operating activities and closure its facilities.
On April 1, 2014 the AFIP issued Resolution No. 3,593/14 which established a “Systematic Regristration of Movements and Grains Stocks Regime” (“Régimen de Registración Sistemática de Movimientos y Existencias de Granos”) by which all persons involved in the commercialization and manufacturing of grains and dairy products registered with the RUO must report the stock and stock variations (including locations, transport between the producer´s facilities, etc.) of all grains other agricultural products (other than those to be applied to sowing) held in their own or other third party´s name.
In the event of a violation of any of the applicable regulations, sanctions may be imposed, including fines and suspension or cancellation of the registration, which would result in the immediate cessation of activities and closure of facilities.
C.
ORGANIZATIONAL STRUCTURE
Corporate Structure
86
We are a corporation organized under the laws of the Grand Duchy of Luxembourg under the form of a
société anonyme
. As of April 20, 2017, we held approximately 100% of the interests in Adecoagro LP S.C.S., a
société en commandite simple
organized under Luxemburg law with a de minimis remaining interest owned by Adecoagro GP
S.à r.l, a société à responsibilitié limitée
organized under Luxemburg law and our substantially wholly-owned subsidiary. Adecoagro LP S.C.S. is a holding company with operating subsidiaries owning farmland and facilities throughout Argentina, Brazil and Uruguay. For a diagram of our Organizational structure as of April 20, 2018, please see “Item 4. Information on the Company – A. History and Development of the Company – History.”
As of April 20, 2018, our principal shareholders were Al Gharrafa Investment Company, Stichting Pensioenfonds Zorg en Welzijn, Jennison Associates Bienville Capital Management LLC and EMS Capital LP. See “Item 7. Major Shareholders and Related Party Transactions—A. Major Shareholders.”
D.
PROPERTY, PLANTS AND EQUIPMENT
See “—B. Business Overview—Land Transformation—Our Farms”; “—Property, Plant and Equipment.”
Not applicable.
Overview
We are engaged in agricultural, manufacturing and land transformation activities. Our agricultural activities consist of harvesting certain agricultural products, including crops (soybeans, corn, wheat, etc.), rough rice, and sugarcane, for sale to third parties and for internal use as inputs in our various manufacturing processes, and producing fluid milk. Our manufacturing activities consist of (i) selling manufactured products, including processed rice, sugar, ethanol and energy, among others, and (ii) providing services, such as grain warehousing and conditioning and handling and drying services, among others. Our land transformation activities consist of the acquisition of farmlands or businesses with underdeveloped or underutilized agricultural land and implementing production technology and agricultural best practices to enhance yields and increase the value of the land. Please see also "Risk Factors-Risks Related to Argentina- Argentine law concerning foreign ownership of rural properties may adversely affect our results of operations and future investments in rural properties in Argentina" and "Risk Factors-Risks Related to Brazil- Recent changes in Brazilian rules concerning foreign investment in rural properties may adversely affect our investments."
We are organized into three main lines of business: farming; land transformation; and sugar, ethanol and energy. These lines of business consist of six reportable operating segments, which are evaluated by the chief operating decision-maker based upon their economic characteristics, the nature of the products they offer, their production processes and their type and class of customers and distribution methods. Our farming business is comprised of four reportable operating segments: Crops, Rice, Dairy, and All Other Segments. Each of our Sugar, Ethanol and Energy and Land Transformation lines of business is also a reportable operating segment. Please see – Operating Segments” for a discussion of our six operating reportable segments.
There are significant economic differences between our agricultural and manufacturing activities. Some of our agricultural activities generally do not involve further manufacturing processes, including those within the crops, dairy and All Other Segments. Our other agricultural activities in the rice and sugar, ethanol and energy segments generally involve further manufacturing processes, comprising our manufacturing activities. The table below sets forth our agricultural and manufacturing activities by segment.
|
Segment
|
|
Agricultural Product
|
|
Manufactured Product and Services Rendered
|
|
Crops
|
|
Soybean Corn Wheat Sunflower Cotton
|
|
Grain drying and conditioning
|
|
|
|
|
|
|
|
Rice
|
|
Rough rice
|
|
White rice and brown rice
|
|
|
|
|
|
|
|
Dairy
|
|
Fluid milk
|
|
Processed milk, and dairy products
|
|
|
|
|
|
|
|
Sugar, Ethanol and Energy
|
|
Sugarcane
|
|
Sugar, Ethanol and Energy
|
Manufacturing Activities
87
The gross profit of our manufacturing activities is a function of our sales of manufactured products and services rendered and the related costs of manufacturing those products or delivering those services. We recognize an amount of revenue representing the actual dollar amount collected or to be collected from our customers. Our principal costs consist of raw materials, labor and social security expenses, maintenance and repairs, depreciation, lubricants and other fuels, among others. We obtain our raw materials principally from our own agricultural activities and, to a lesser extent, from third parties.
Agricultural Activities
Our agricultural activities involve the management of the biological transformation of biological assets into agricultural produce for sale to third parties, or into agricultural products that we use in our manufacturing activities. We measure our biological assets and agricultural produce in accordance with lAS 41 "Agriculture." lAS 41 requires biological assets to be measured on initial recognition and at each balance sheet date at their fair value less cost to sell, with changes in fair value recognized in the statement of income as they occur. As market prices are generally not available for biological assets while they are growing, we use the present value of expected net cash flows as a valuation technique to determine fair value, as further discussed below in "-Critical Accounting Policies and Estimates." ln addition, agricultural produce at the point of harvest is measured at fair value less cost to sell, which is generally determined by reference to the quoted market price in the relevant market. Consequently, the gains and losses arising on initial recognition and changes in fair value of our biological assets and the initial recognition of our agricultural produce at the point of harvest are accounted for in the statement of income in the line item "lnitial recognition and changes in fair value of biological assets and agricultural produce."
After agricultural produce is harvested, we may hold it in inventory at net realizable value up to the point of sale, which includes market selling price less direct selling expenses, with changes in net realizable value recognized in the statement of income when they occur. When we sell our inventory, we sell at the prevailing market price and we incur direct selling expenses.
We generally recognize the agricultural produce held in inventory at net realizable value with changes recognized in the statement of income as they occur. Therefore, changes in net realizable value represent the difference in value from the last measurement through the date of sale on an aggregated basis.
We consider gains and losses recorded in the line items of the statement of income "lnitial recognition and changes in fair value of biological assets and agricultural produce" and "Changes in net realizable value of agricultural produce after harvest" to be realized only when the related produce or manufactured product is sold to third parties and, therefore, converted into cash or other financial assets. Therefore, "realized" gains or losses mean that the related produce or product has been sold and the proceeds are included in revenues for the year. Please see “–Critical Accounting Policies and Estimates – Biological Assets and Agricultural Produce” for a discussion of the accounting treatment, financial statement, presentation and disclosure related to our agricultural activities.
Land Transformation
The Land Transformation segment includes two types of operations. The first relates to the acquisition of farmlands or businesses with underdeveloped or underutilized agricultural land (land which we have identified as capable of being transformed into more productive farmland by enhancing yields and increasing its future value). When we acquire a farmland business for an acquisition price below its estimated fair value, we recognize an immediate gain (a "purchase bargain gain"). The land acquired is recognized at its fair value at the acquisition date and is subsequently carried at cost under the cost model in IAS 16.
The second type of operation undertaken within this segment relates to the realization of value through the strategic disposition of assets (i.e. farmland) that may have reached full development potential. Once we believe certain land has reached full growth potential, we may decide to realize such incremental value through the disposition of the land.
The results of these two activities (purchase bargain gains as a result of opportunistic acquisitions of businesses with underdeveloped or underutilized land below fair market value, and gains on dispositions reflecting the ultimate realization of cash value on dispositions of transformed farmlands) are included separately in the Land Transformation segment.
Land transformation activities themselves are not reflected in this segment; rather, they are reflected in all of our other agricultural activities in other segments. The results of our land transformation strategy are realized as a separate activity upon disposition of transformed farmlands and other rural properties.
88
A.
OPERATING RESULTS
Trends and Factors Affecting Our Results of Operations
Description of accounting policies changed during the fiscal year.
Revaluation Model for farmlands (IAS 16/IAS40)
Since September 2018, the Company changed the accounting policy for its farmlands, adopting a new revaluation model (See Item 3. Key Information-A. Selected Financial Data) For all farmlands with a total valuation of US$ 785 million as of December 31, 2018, the valuation is determined using a sales comparison approach prepared by an independent expert. Sale prices of comparable properties are adjusted considering the specific aspects of each property, with price per hectare as the more important criterion. The Company estimated that, other factors being equal, a 10% reduction on the sales price for the period ended December 31, 2018 would have reduced the value of the farmlands by US$ 78.5 million. This would generate a negative effect on the "Revaluation surplus" item in the statement of Changes in Shareholders' Equity. If farmlands were stated on the historical cost basis, that means, not having applied the revaluation model, the amount of the farmland item as of December 31, 2018 would be US$ 235 million.
Also, since September 2018, the Company changed the accounting policy for all investment properties, adopting a new revaluation model (See Item 3. Key Information-A. Selected Financial Data). For all investment properties with a total valuation of US$ 40.7 million as of December 31, 2018, the valuation was determined using sales comparison approach prepared by an independent expert. Sale prices of comparable properties are adjusted considering the specific aspects of each property, with price per hectare as the more important criterion. The increase or decrease in the fair value is recognized in the statement of income under the line item "Other Operating Income, Net". The Company estimated that, other factors being equal, a 10% reduction on the sales price for the period ended December 31, 2018 would have reduced the value of the investment properties on US$ 4.1 million, which would impact the line item "Net gain from fair value adjustment.
(i) Hyperinflation in Argentina (IAS 29 / IAS 21)
Effectively from July 1, 2018, the Group applied IAS 29 “Financial Reporting in Hyperinflationary Economies” (“IAS 29”) to its operations in Argentina. IAS 29 “Financial Reporting in Hyperinflationary Economies” requires that financial statements of entities whose functional currency is that of a hyperinflationary economy must be adjusted for the effects of changes in the general price index and expressed in terms of the current unit of measurement at the closing date of the reporting period (“inflation accounting”). (See note 33 to our Consolidated Financial Statements). In order to determine whether an economy is categorized as hyperinflationary under the terms of IAS 29, the standard details a series of factors to be considered, including the existence of a cumulative inflation rate in three years that approximates or exceeds 100%. (See Item 3. Key Information-A. Selected Financial Data). Argentina experienced a significant increase in inflation during 2018, which exceeded the 100% three-year cumulative inflation rate.
The application of IAS 29 affects only Argentine operations, which represents 13% of our profit from operations.
IAS 29 requires to adjust all non-monetary items in the statement of financial position by applying a general price index from the day they were booked to the end of the reporting period. At the same time, it also requires that all items in the statement of income are expressed in terms of the measuring unit current at the end of the reporting period. Consequently, each reporting period on a monthly basis results of operation measured in Argentine Pesos is adjusted for inflation by the applicable monthly inflation rate each month.
After the restatement process, Paragraph 42 of IAS 21 “The Effects of Changes in Foreign Exchange Rates”, addresses the way results must be translated under inflation accounting, stating that “…all amounts shall be translated at the closing rate at the date of the most recent statement of financial position…” Accordingly, monthly results of operations in Argentine Pesos, after adjustment for inflation pursuant to IAS 29, as described above, must then be converted into U.S. dollars at the closing exchange rate for such monthly reported period This process is called “translation”.. This conversion changes every prior reported monthly statement of income in U.S. dollars as each monthly amount is readjusted under IAS 29 for inflation per above and reconverted at different exchange rates for each monthly reported period under IAS 21. As a result, the impact of monthly inflationary adjustments and monthly conversion adjustments vary the results of operation month to month until year end.
The Company prepares monthly financial reports, issues unaudited quarterly financial statements and uses the U.S. dollar as its reporting currency in all reports. Applying both IAS 29 and IAS 21 as described above, the monthly and quarterly results change every period as a consequence of the above mentioned re-measurement and translation processes. This variation is further exacerbated by the fact that most of the sales in the crops segment are recorded during the first-half of the year due to the seasonality of the operations in Argentina. As a result of the foregoing factors, the Company’s management evaluates the financial results monthly using the monthly average U.S. dollar exchange rate and with respect to the presentation of segment information, amounts are translated
89
on a monthly basis. For this reason, the financial information presented in the Segment information footnote includes results of operations that are based on monthly data and which have been adjusted for inflation and converted into the average exchange rate of the U.S. dollar each month. These figures are not subsequently readjusted and reconverted as described above under IAS 29 and IAS 21. It should be noted that this translation methodology for evaluating segment information is the same method as the one used by the Company to translate results of operation from its other subsidiaries from other countries that have not been designated hyperinflationary economies because it allows for a more accurate analysis of the economic performance of its business as a whole.
Consequently, the difference between re-measurement and translation information with the management information is reconciled by the combined effect of the application of both processes.
(ii) Effects of Yield Fluctuations
The occurrence of severe adverse weather conditions, especially droughts, hail, floods or frost, are unpredictable and may have a potentially devastating impact on agricultural production and may otherwise adversely affect the supply and prices of the agricultural commodities that we sell and use in our business. The effects of severe adverse weather conditions may also reduce yields at our farms. Yields may also be affected by plague, disease or weed infection and operational problems.
The following table sets forth our average crop, rice and sugarcane yields per hectare for the periods indicated:
|
|
2017/2018
|
2016/2017
|
2015/2016
|
% Change
|
||||||||||
|
Harvest
Year (1)
|
Harvest
Year (1)
|
Harvest
Year (1)
|
2017/2018 -2016/2017
|
2016/2017 -2015/2016
|
||||||||||
|
Corn (2)
|
4.3
|
|
5.4
|
|
5.8
|
|
(20,4)%
|
|
(6.9
|
)%
|
||||
|
Soybean
|
2.5
|
|
2.8
|
|
2.8
|
|
(10.7
|
)%
|
—
|
%
|
||||
|
Soybean (second harvest)
|
1.2
|
|
2.5
|
|
2.4
|
|
(52.0
|
)%
|
4.2
|
%
|
||||
|
Wheat (3)
|
2.2
|
|
3.0
|
|
2.5
|
|
(26.7
|
)%
|
20.0
|
%
|
||||
|
Sunflower
|
1.8
|
|
1.9
|
|
1.6
|
|
(5.3
|
)%
|
18.8
|
%
|
||||
|
Rice
|
6.9
|
|
5.9
|
|
5.9
|
|
16.9
|
%
|
—
|
%
|
||||
|
Sugarcane (4)
|
89.3
|
|
85.1
|
|
98.2
|
|
4.9
|
%
|
(13.3
|
)%
|
||||
(1) This column reflects the full harvest season.
(2) Includes sorghum, chia and peanut.
(3) Includes barley, rye, oats and chickpea.
(4) Does not consider harvested area for planting activities.
(iii) Effects of Fluctuations in Production Costs
We experience fluctuations in our production costs due to the fluctuation in the costs of (i) fertilizers, (ii) agrochemicals, (iii) seeds, (iv) fuel, (v) farm leases and (vi) labor. The use of advanced technology, however, allows us to increase our efficiency, in large part mitigating the fluctuations in production costs. Some examples of how the implementation of production technology has allowed us to increase our efficiency and reduce our costs include the use of no-till technology (also known as “direct sowing”, which involves farming without the use of tillage, leaving plant residues on the soil to form a protective cover which positively impacts costs, yields and the soil), crop rotation, second harvest in one year, integrated pest management, and balanced fertilization techniques to increase the productive efficiency in our farmland. Increased mechanization of harvesting and planting operations in our sugarcane plantations and utilization of modern, high pressure boilers in our sugar and ethanol mills has also yielded higher rates of energy production per ton of sugarcane milled.
(iv) Effects of Fluctuations in Commodities Prices
Commodity prices have historically experienced substantial fluctuation. For example, between January 1, 2018 and December 31, 2018, sugar prices decreased by 20.6%, according to Intercontinental Exchange of New York (“ICE-NY”) data, and ethanol prices decreased by 5.9%, according to Escola Superior de Agricultura “Luiz de Queiroz” (“ESALQ”) data. Also, based on Chicago Board of Trade (“CBOT”) data, from January 1, 2018 and December 31, 2018, soybean prices decreased 7.3% and corn prices increased by 6.9%. Commodity price fluctuations impact our statement of income as follows:
90
|
•
|
Initial recognition and changes in the fair value of biological assets and agricultural produce in respect of unharvested biological assets undergoing biological transformation;
|
|
•
|
Changes in net realizable value of agricultural produce for inventory carried at its net realizable value; and
|
|
•
|
Sales of manufactured products and agricultural produce to third parties.
|
The following graphs show the spot market price of some of our products for the periods indicated:

(v) Fiscal Year and Harvest Year
Our fiscal year begins on January 1 and ends on December 31 of each year. However, our production is based on the harvest year for each of our crops and rice. A harvest year varies according to the crop or rice plant and to the climate in which it is grown. Due to the geographic diversity of our farms, the planting period for a given crop or rice may start earlier on one farm than on another, causing differences for their respective harvesting periods. The presentation of production volume (tons) and production area (hectares) in this report in respect of the harvest years for each of our crops and rice starts with the first day of the planting period at the first farm to start planting in that harvest year to the last day of the harvesting period of the crop or rice planting on the last farm to finish harvesting that harvest year.
On the other hand, production volumes for dairy and production volume and production area for sugar, ethanol and energy business are presented on a fiscal year basis.
The financial results in respect of all of our products are presented on a fiscal year basis.
(vi) Effects of Fluctuations of the Production Area
Our results of operations also depend on the size of the production area. The size of our own and leased area devoted to crop, rice and sugarcane production fluctuates from period to period in connection with the purchase and development of new farmland, the sale of developed farmland, the lease of new farmland and the termination of existing farmland lease agreements. Lease agreements
91
are usually settled following the harvest season, from July to September for crops and rice, and from May to April for sugarcane. The length of the lease agreements are usually one year for crops, one to five years for rice and five to six years for one-cycle sugarcane or twelve to fourteen years for two-cycle of sugarcane. Regarding crops, the production area can be planted and harvested one or two times per year. As an example, wheat can be planted in July and harvested in December. Right after its harvest, soybean can be planted in the same area and harvested in April. As a result, planted and harvested area can exceed the production area during one year. The production area for sugarcane can exceed the harvested area in one year. Grown sugarcane can be left in the fields and then harvested the following year.
The following table sets forth the production area for the periods indicated:
|
|
Year ended December 31,
|
|||||||||||||
|
|
2018
|
2017
|
2016
|
Chg (%) 2018-2017
|
Chg (%) 2017-2016
|
|||||||||
|
|
|
Hectares
|
|
|
|
|||||||||
|
Crops
(1)
|
151,842
|
|
153,970
|
|
145,410
|
|
(1.4
|
)%
|
5.9
|
%
|
||||
|
Rice
|
40,435
|
|
40,289
|
|
39,728
|
|
0.4
|
%
|
1.4
|
%
|
||||
|
Sugar, Ethanol and Energy
|
153,690
|
|
143,617
|
|
134,591
|
|
7.0
|
%
|
6.7
|
%
|
||||
(1) Does not include second crop and forage area.
The increase in sugar, ethanol and energy production area in 2018 is explained by an increase in leased hectares that provide sufficient cane supply for the entire year in accordance with the long-term growth plan of the company.
(vii) Effect of Acquisitions, dispositions and land transformation
Our business model includes the transformation of pasture and unproductive land into land suitable for growing various crops and the transformation of inefficient farms into farms suitable for more efficient uses through the implementation of advanced and sustainable agricultural practices, such as "no-till" technology and crop rotation. During approximately the first three to five years of the land transformation process of any given parcel, we must invest heavily in transforming the land, and, accordingly, crop yields during such period tend to be lower than crop yields once the land is completely transformed. After the transformation process has been completed, the land requires less investment, and crop yields gradually increase. As a result, there may be variations in our results from one season to the next according to the amount of land in the process of transformation.
Our business model also includes the identification, acquisition, development and selective disposition of farmlands or other rural properties that after implementing agricultural best practices and increasing crop yields we believe have the potential to appreciate in terms of their market value. As a part of this strategy, we purchase and sell farms and other rural properties from time to time. Please see also “Risk Factors—Risks Related to Argentina-Argentine law concerning foreign ownership of rural properties may adversely affect our results of operations and future investments in rural properties in Argentina” and “Risk Factors—Risks Related to Brazil—Changes in Brazilian rules concerning foreign investment in rural properties may adversely affect our investments.” included in “Item 3. Risk Factors” in our Form 20-F.
The results included in the Land Transformation segment are related to the acquisition and disposition of farmland businesses and not to the physical transformation of the land. The decision to acquire and/or dispose of a farmland business depends on several market factors that vary from period to period, rendering the results of these activities in one financial period when an acquisition of disposition occurs not directly comparable to the results in other financial periods when no acquisitions or dispositions occurred.
Our results of operations for earlier periods that do not include a recently completed acquisition or do include farming operations subsequently disposed of may not be comparable to the results of a more recent period that reflects the results of such acquisition or disposition. During 2018 we sold two farms in Brazil, "Rio de Janeiro" and "Conquista", for a total consideration of $52.4 million for 9,300 hectares.
(viii) Macroeconomic Developments in Emerging Markets
We generate nearly all of our revenue from the production of food and renewable energy in emerging markets. Therefore, our operating results and financial condition are directly impacted by macroeconomic and fiscal developments, including fluctuations in currency exchange rates, inflation and interest rate fluctuations, in those markets. The emerging markets where we conduct our business (including Argentina, Brazil and Uruguay) remain subject to such fluctuations.
(ix) Effects of Export Taxes on Our Products
92
Following the economic and financial crisis experienced by Argentina in 2002, the Argentine government increased export taxes on agricultural products. Since December 2015, the only product that had remained subject to export taxes was soybean and its derivatives. However, in September 2018 due to economic volatility, the government imposed a 12% export tax on all goods exported from Argentina. A 12% export tax will be imposed on the FOB export price of “primary product” goods (including agricultural goods), subject to a cap of four pesos (ARS 4) per U.S. dollar of the corresponding tax value or official FOB price for primary product goods. For all other products, the cap amount will be fixed at three pesos (ARS 3) per U.S. dollar of the corresponding tax value or official FOB price.
As local prices are determined taking into consideration the export parity reference, any increase or decrease in export taxes would affect our financial results.
(x) Effects of Foreign Currency Fluctuations
Each of our Argentine, Brazilian and Uruguayan subsidiaries uses local currency as its functional currency. A significant portion of our operating costs in Argentina are denominated in Argentine Pesos and most of our operating costs in Brazil are denominated in Brazilian Reais. For each of our subsidiaries’ statements of income, foreign currency transactions are translated into the local currency, as such subsidiaries’ functional currency, using the exchange rates prevailing as of the dates of the relevant specific transactions. Exchange differences resulting from the settlement of such transactions and from the translation at year-end exchange rates of monetary assets and liabilities denominated in foreign currencies are recognized in the statement of income under “finance income” or “finance costs,” as applicable. Our Consolidated Financial Statements are presented in U.S. dollars, and foreign exchange differences that arise in the translation process are disclosed in the consolidated statement of comprehensive income.
As of December 31, 2018, the Peso-U.S. dollar exchange rate was Ars. 37.7 per U.S. dollar as compared to Ars.18.65 per U.S. dollar as of December 31, 2017. As of December 31, 2018, the Real-U.S. dollar exchange rate was R$3.87 per U.S. dollar as compared to R$3.31 per U.S. dollar as of December 31, 2017.
The following graph shows the Argentine Peso-U.S. dollar rate and the Real-U.S. dollar rate of exchange for the periods indicated:
Our principal foreign currency fluctuation risk involves changes in the value of the Brazilian Reais relative to the U.S. dollar. Periodically, we evaluate our exposure and consider opportunities to mitigate the effects of currency fluctuations by entering into currency forward contracts and other hedging instruments.
(xi) Seasonality
Our business activities are inherently seasonal. We generally harvest and sell corn, soybean, rice and sunflower between February and August, and wheat from December to January. With the implementation of “continuous harvest”, sugarcane production is more stable during the year; however, the typical harvesting period in Brazil begins between April and May and ends between November and December. Sales of ethanol are generally concentrated during off-season to capture higher seasonal prices. Sales in other business segments, such as in our Dairy segment, tend to be more stable. However, milk sales are generally higher during the fourth quarter, when weather conditions are more favorable for production. As a result of the above factors, there may be significant variations in our results of operations from one quarter to another, since planting activities may be more concentrated in one quarter whereas harvesting activities may be more concentrated in another quarter. In addition, our quarterly results may vary as a result of
93
the effects of fluctuations in commodity prices and production yields and costs related to the “Initial recognition and changes in fair value of biological assets and agricultural produce” line item. See “—Critical Accounting Policies and Estimates-Biological Assets and Agricultural Produce.”
(xii) Capital Expenditures and Other Investments
Our capital expenditures during the last three years consisted mainly of expenses related to (i) transforming and increasing the productivity of our land, (ii) planting sugarcane and (iii) expanding and upgrading our production facilities in concordance to our 5-year plan presented in 2017. Capital expenditures (including both maintenance and expansion) totaled $133.1 million for the period ended December 31, 2016; $199.6 million for the period ended December 31, 2017; and $220.4 million for the period ended December 31, 2018. The increase in 2018 compared to 2017 is primarily due to: (a) investments related to the increase in nominal crushing capacity and to new sugarcane hectares planted to supply the growing industrial capacity; (b) the construction of our third free stall with a capacity for 3,500 milking cows, where we started operations during the last two quarters. See also “Capital Expenditure Commitments.”
(xiii) Effects of Corporate Taxes on Our Income
We are subject to a variety of taxes on our results of operations. The following table shows the applicable income tax rates in effect for 2018:
|
|
Tax Rate (%)
|
|
Argentina
(1)
|
30
|
|
Brazil
(2)
|
34
|
|
Uruguay
|
25
|
|
Spain
|
25
|
|
Luxembourg
|
26
|
________________________________________________________________________________________________
|
(1)
|
During 2017, the Argentine Goverment introduced changes in the income tax. The income tax rate will be reduced to 30% for the years 2018 and 2019, and to 25% from 2020 onwards. A new tax on dividends is created with a rate of 7% for the years 2018 and 2019, and 13% from 2020 onwards.
|
|
(2)
|
Including the Social Contribution on Net Profit (CSLL).
|
Critical Accounting Policies and Estimates
We prepare our Consolidated Financial Statements in accordance with IFRS. The critical accounting policies are policies important to the portrayal of a company’s financial condition and operating results, and which require management to make difficult and subjective judgments that are inherently uncertain. Based on this definition, we have identified the following significant accounting policies as critical to the understanding of our Consolidated Financial Statements. The preparation of our Consolidated Financial Statements requires management to make estimates and assumptions that affect the reported amounts of assets and liabilities and disclosure of contingent assets and liabilities at the date of the financial statements and the reported amounts of expenses during the reporting periods. The principal area where our management is required to make significant judgments about estimates where actual results could differ materially from such estimates is in the carrying amount of our biological assets. These estimates and judgments are subject to an inherent degree of uncertainty. We believe that the estimates and judgments upon which we rely are reasonable based upon information available to us at the time that these estimates and judgments are made. We continually evaluate our judgments, estimates and assumptions. To the extent there are material differences between these estimates and actual results, our Consolidated Financial Statements will be affected.
The Company’s critical accounting policies and estimates are consistent with those described in Note 33 to our Audited Consolidated Financial Statements.
Biological Assets and Agricultural Produce
Before harvest, our crops are biological assets. Subsequent to harvest, biological transformation ceases and the harvested crops meet the definition of agricultural produce under IAS 41 “Biological Assets.” As prescribed by IAS 41, we measure growing crops which have not attained significant biological growth at cost less any impairment losses, which approximates fair value. Capitalized expenses for growing crops include land preparation expenses and other direct production expenses incurred during the sowing period including costs of labor, fuel, seeds, agrochemical and fertilizer, among others. We measure biological assets (at initial recognition, when the biological asset has attained significant biological growth, and at each subsequent measurement reporting date) and agricultural produce at the point of harvest at fair value less selling costs. The objective of the fair value model under IAS 41 is to recognize gains and losses arising from such measurements gradually over the asset’s life rather than only on sale or realization. IAS
94
41 prescribes, among other things, the accounting treatment for biological assets during the period of growth, degeneration, production and procreation, and for the initial measurement of agricultural produce at the point of harvest.
We account for agricultural produce after harvest as inventory, as further described below.
95
The following table sets forth the way in which we value biological assets and agricultural produce for each of our principal products:
|
|
Biological Asset
|
|
|
|
|
||
|
|
No significant
biological growth
|
|
Significant
biological growth
|
|
Agricultural Produce
|
|
Manufactured Product
|
|
|
|
|
|
|
|
|
|
|
Crops
|
Crop from planting to approximately 60 days following planting
|
|
Crop, from approximately 60 days after planting up to the moment of harvest (total period of approximately 3 to 5 months).
|
|
Harvested crop (soybean, corn, wheat, etc.)
|
|
N/A
|
|
|
|
|
|
|
|
|
|
|
Rice
|
Rice plant from planting to approximately 60 days following planting
|
|
Rice plant, from approximately 60 days after planting up to the moment of harvest (total period of approximately 3 to 4 months).
|
|
Harvested rough rice
|
|
Processed rice (white rice) and rice snacks
|
|
|
|
|
|
|
|
|
|
|
Dairy
|
Dairy cow is considered a biological asset from birth/purchase to death or sale.
|
|
Fluid milk
|
|
N/A
|
||
|
|
|
|
|
|
|
||
|
Cattle
|
Beef cattle are considered a biological asset from birth/purchase to death or sale.
|
|
N/A
|
|
N/A
|
||
|
|
|
|
|
|
|
||
|
Sugar, ethanol and energy
|
The produce derived from the sugarcane from planting or after harvest up to approximately 30 days following planting
|
|
The produce derived from the sugarcane, from approximately 30 days after planting until harvest (total period of 10 to 14 months)
|
|
Sugarcane
|
|
Sugar, ethanol and energy
|
|
|
|
|
|
|
|
|
|
|
Valuation Criteria
|
Cost, which approximates fair value less accumulated impairment losses, if any. For dairy and cattle, fair value less estimated cost to sell.
|
|
Fair value (using discounted cash flow valuation) less cost to sell.
|
|
Net realizable value, except for rough rice and milk which are valued at cost.
|
|
Cost
|
Gains and losses that arise from measuring biological assets at fair value less selling costs and measuring agricultural produce at the point of harvest at fair value less selling costs are recognized in the statement of income in the period in which they arise as “Initial recognition and changes in fair value of biological assets and agricultural produce.” We value our inventories of agricultural produce after harvest at net realizable value, except for rough rice, which is valued at cost.
When an active market exists for biological assets, we use the quoted market price in the most relevant market as a basis to determine the fair value of our biological assets, as in the case of cattle. For other biological assets where there is neither an active market nor market-determined prices during the growth cycle, we determine their fair value through the use of DCF valuation techniques. Therefore, we generally derive the fair value of our growing biological assets from the expected cash flows of the related agricultural produce. The DCF method requires the input of highly subjective assumptions, including observable and unobservable data. Generally, the estimation of the fair value of biological assets is based on models or inputs that are not observable in the market, and the use of unobservable inputs is significant to the overall valuation of the assets. Various factors influence the availability of observable inputs, including, but not limited to, the type of asset and its location, climate changes and the technology used, among others.
96
Unobservable inputs are determined based on the best information available, for example, by reference to historical information regarding past practices and results, statistical and agronomical information and other analytical techniques. Changes in the assumptions underlying such subjective inputs can materially affect the fair value estimate and impact our results of operations and financial condition from period to period.
The DCF method requires the following significant inputs to project revenues and costs:
Production cycles;
Production area in hectares;
Estimated crop and rice yields;
Estimated sucrose content (Total Recoverable Sugar or TRS) for sugarcane;
Estimated costs of harvesting and other costs to be incurred until the crops and rice reach maturity (mainly costs of pesticides, herbicides and spraying);
Estimated transportation costs;
Market prices; and
Discount rates.
In contrast to biological assets whose fair value is generally determined using the DCF method, we typically determine the fair value of our agricultural produce at the point of harvest using market prices.
Market prices used in the DCF model are determined by reference to observable data in the relevant market (e.g., for crops and sugar). Harvesting costs and other costs are estimated based on historical and statistical data. Yields are estimated by our agronomic engineers based on several factors, including the location of the farmland, soil type, environmental conditions, infrastructure and other restrictions and growth at the time of measurement. Yields are subject to a high degree of uncertainty and may be affected by several factors out of our control, including but not limited to extreme or unusual weather conditions, plagues and other diseases. Discount rates reflect current market assessments of the assets involved and the time value of money.
As of December 31, 2018, the impact of a 5% increase (decrease) in estimated yields, with all other variables held constant, would result in an increase (decrease) in the fair value of our plantations less cost to sell of $6.3 million ( for 2017 the fair value was $9.0 million) for sugarcane. As of December 31, 2018, the impact of a 20% increase (decrease) in estimated yields, with all other variables held constant, would result in an increase (decrease) in the fair value of our plantations less cost to sell of $3.8 million (for 2017 this fair value was $2.7 million) for crops and $6.2 million (2017: $8.2 million) for rice.
The key assumptions discussed above are highly sensitive. Reasonable shifts in assumptions including but not limited to increases or decreases in prices, costs and discount rates used would result in a significant increase or decrease to the fair value of biological assets. Estimates of production in themselves are dependent on various assumptions, in addition to those described above, including but not limited to several factors such as location, environmental conditions and other restrictions. Changes in these estimates could materially impact on estimated production, and could therefore affect estimates of future cash flows used in the assessment of fair value.
The valuation models and their assumptions are reviewed annually, or quarterly if warranted, and, if necessary, adjusted. Since the years ended December 31, 2016 we made no changes to the models.
The aggregate gains and losses arising during a period on initial recognition and from the changes in fair value less costs to sell of biological assets is affected by the way we treat our harvesting and production costs for accounting purposes. Since IAS 41 does not provide guidance on the treatment of these costs, we generally capitalize all costs directly involved with the management of biological assets. These costs may include labor, planting, fertilizers, agrochemicals, harvesting, irrigation and feeding, among others. Then, the cost of the biological asset is adjusted periodically by the re-measurement of the biological asset at fair value less cost to sell. For example, before significant biological growth is attained, costs and expenses are capitalized as biological assets, and once biological assets reach significant biological growth we adjust biological assets to fair value less cost to sell. Accordingly, capitalized biological assets are adjusted periodically at fair value less cost to sell. At the point of harvest, we recognize the agricultural produce at fair value less cost to sell. The periodic adjustments in fair value less cost to sell reflect period to period gains or losses. After agricultural produce is harvested, we may hold it in inventory at net realizable value up to the point of sale, which includes market selling price less direct selling expenses, with changes in net realizable value recognized in the statement of income as incurred. When we sell our inventory, we sell at the prevailing market price and we incur direct selling expenses.
We generally recognize the agricultural produce of crops held in inventory at net realizable value with changes recognized in the statement of income as they occur. Therefore, changes in net realizable value represent the difference in value from the last measurement through the date of sale on an aggregated basis.
97
We consider gains and losses recorded in the line items of the statement of income “Initial recognition and changes in fair value of biological assets and agricultural produce” and “Changes in net realizable value of agricultural produce after harvest” to be realized only when the related produce or manufactured product is sold to third parties and, therefore, converted into cash or other financial assets. Therefore, “realized” gains or losses means that the related produce or product has been sold and the proceeds are included in revenues for the year.
The sale of agricultural produce is revenue as defined in IAS 18. However, IAS 41 does not provide guidance on the presentation of revenues and costs arising from the selling of biological assets and agricultural produce. Due to the lack of guidance in IAS 41 and based on IAS 1, “Presentation of financial statements,” we present, as a matter of accounting policy, our sales of biological assets and agricultural produce and their respective costs within the lines items “Sales of goods and services rendered” and “Cost of goods and services rendered.” See Notes 4 and 5 to our Consolidated Financial Statements for a breakdown of sales and costs for goods sold and services rendered. The sale of agricultural produce and biological assets represents the consideration received or receivable for the sale to third parties based generally on the applicable quoted market prices of the respective produce or biological asset in the relevant markets at the point of sale. At the point of sale, our agricultural produce is measured at net realizable value, which reflects the sale price less the direct cost to sell, and our biological assets are measured at fair value less cost to sell, in each case, using the applicable quoted market prices in the relevant markets.
Based on the foregoing, the profit of our agricultural produce is recognized under the line ítems “Initial recognition and changes in fair value of biological assets and agricultural produce” and “Changes in net realizable value of agricultural produce after harvest.” When the agricultural produce is sold to third parties we do not record any additional profit as the gain or loss had already been recognized.
The profit of our manufactured products is recognized when they are sold. The cost of manufactured products includes, among others, the cost of agricultural produce transferred internally at fair market value (i.e. harvested sugarcane, rough rice, fluid milk, etc).
Property, plant and equipment
Farmlands are recognized at fair value based on periodic, but at least annual, valuations prepared by an external independent expert. A revaluation reserve is credited in shareholders’ equity. The valuation is determined using sales Comparison Approach. Sale prices of comparable properties are adjusted considering the specific aspects of each property, the most relevant premise being the price per hectare (Level 3) (see Note 12).
Investment property
Investment property consists of farmland for rental or for capital appreciation and not used in production or for sale in the ordinary course of business, and it is measured at fair value. The changes of the Fair value, which is based on an independent external expert, impacts the profit and loss of the period, in the line item Other operating income, net (see Note 13).
Operating Segments
IFRS 8 “Operating Segments” requires an entity to report financial and descriptive information about its reportable segments, which are operating segments or aggregations of operating segments that meet specified criteria. Operating segments are components of an entity about which separate financial information is available that is evaluated regularly by the chief operating decision maker (“CODM”) in deciding how to allocate resources and in assessing performance. The CODM evaluates the business based on the differences in the nature of its operations, products and services. The amount reported for each segment item is the measure reported to the CODM for these purposes.
The Company operates in three major lines of business, namely, Farming; Sugar, Ethanol and Energy; and Land Transformation.
•
The Company’s
‘Farming’
business is comprised of four reportable segments:
|
•
|
The Company’s
‘Crops’
segment consists of planting, harvesting and sale of grains, oilseeds and fibers (including wheat, corn, soybeans, cotton and sunflowers, among others), and to a lesser extent the provision of grain warehousing/conditioning, handling and drying services to third parties and the purchase and sale of crops produced by third parties. Each underlying crop in this segment does not represent a separate operating segment. Management seeks to maximize the use of the land through the cultivation of one or more type of crops. Types and surface amount of crops cultivated may vary from harvest year to harvest year depending on
|
98
several factors, some of them out of the Company´s control. Management is focused on the long-term performance of the productive land, and to that extent, the performance is assessed considering the aggregated combination, if any, of crops planted in the land. A single manager is responsible for the management of operating activity of all crops rather than for each individual crop.
|
•
|
The Company’s
‘Rice’
segment consists of planting, harvesting, processing and marketing of rice;
|
|
•
|
The Company’s
‘Dairy’
segment consists of the production and sale of milk;
|
|
•
|
The Company’s
‘All other segments’
segment
consists of the aggregation of the remaining non-reportable operating segments, which do not meet the quantitative thresholds for disclosure and for which the Company’s management does not consider them to be of continuing significance, namely, Coffee and Cattle.
|
•
The Company’s
‘Sugar, Ethanol and Energy’
segment consists of cultivating sugarcane which is processed in owned sugar mills, transformed into ethanol, sugar and electricity and marketed;
•
The Company’s
‘Land Transformation’
segment comprises the (i) identification and acquisition of underdeveloped and undermanaged farmland businesses; and (ii) realization of value through the strategic disposition of assets (generating profits).
•
The Company’s
‘Corporate’
segment comprises certain other activities of a holding function nature not allocable to the segments
In order to evaluate the economic performance of businesses on a monthly basis, results of operations are based on monthly data that have been adjusted for inflation and converted into the average exchange rate of the U.S. Dollar each month in Argentine subsidiaries. These already converted figures are subsequently not readjusted and reconverted. It should be noted that this translation methodology for evaluating segment information is the same that the company uses to translate results of operation from its other subsidiaries from other countries that have not been designated hyperinflationary economies because it allows for a more accurate analysis of the economic performance of its business as a whole.
The following table presents selected historical financial and operating data solely for the periods indicated below as it is used for our discussion of results of operations.
99
|
|
Year ended December 31,
|
||||||||||||||
|
|
2018
|
2017
|
2016
|
Chg (%) 2018-2017
|
Chg (%) 2017-2016
|
||||||||||
|
Sales
|
( In thousands of $)
|
||||||||||||||
|
Farming Business
|
282,301
|
|
322,561
|
|
272,543
|
|
(12.5
|
)%
|
18,4%
|
|
|||||
|
Crops
|
155,418
|
|
197,222
|
|
142,124
|
|
(21.2
|
)%
|
38.8
|
%
|
|||||
|
Soybean(1)
|
84,217
|
|
85,527
|
|
63,797
|
|
(1.5
|
)%
|
34.1
|
%
|
|||||
|
Corn (2)
|
38,639
|
|
86,238
|
|
48,502
|
|
(55.2
|
)%
|
77.8
|
%
|
|||||
|
Wheat (3)
|
32,706
|
|
16,723
|
|
18,191
|
|
95.6
|
%
|
(8.1
|
)%
|
|||||
|
Sunflower
|
1,598
|
|
3,163
|
|
7,275
|
|
(49.5
|
)%
|
(56.5
|
)%
|
|||||
|
Cotton Lint
|
—
|
|
420
|
|
1,434
|
|
(100.0
|
)%
|
(70.7
|
)%
|
|||||
|
Other crops(4)
|
7,378
|
|
5,151
|
|
2,925
|
|
43.2
|
%
|
76.1
|
%
|
|||||
|
Adjustments (5)
|
(9,120
|
)
|
—
|
|
—
|
|
100.0
|
%
|
N/A
|
|
|||||
|
Rice (6)
|
95,403
|
|
86,479
|
|
96,562
|
|
10.3
|
%
|
(10.4
|
)%
|
|||||
|
Dairy
|
29,710
|
|
37,522
|
|
32,897
|
|
(20.8
|
)%
|
14.1
|
%
|
|||||
|
All other segments (7)
|
1,770
|
|
1,338
|
|
960
|
|
32.3
|
%
|
39.4
|
%
|
|||||
|
Sugar, Ethanol and Energy Business
|
510,938
|
|
610,617
|
|
596,692
|
|
(16.3
|
)%
|
2.3
|
%
|
|||||
|
Sugar
|
128,377
|
|
305,688
|
|
330,895
|
|
(58.0
|
)%
|
(7.6
|
)%
|
|||||
|
Ethanol
|
324,661
|
|
241,650
|
|
211,451
|
|
34.4
|
%
|
14.3
|
%
|
|||||
|
Energy
|
57,797
|
|
62,218
|
|
53,995
|
|
(7.1
|
)%
|
15.2
|
%
|
|||||
|
Other (8)
|
103
|
|
1,061
|
|
351
|
|
(90.3
|
)%
|
202.3
|
%
|
|||||
|
Total
|
793,239
|
|
933,178
|
|
869,235
|
|
(15.0
|
)%
|
7.4
|
%
|
|||||
|
Land Transformation (9)
|
36,227
|
|
—
|
|
—
|
|
100.0
|
%
|
N/A
|
|
|||||
|
2018/2019
|
2017/2018
|
2016/2017
|
2015/2016
|
|||||||||||||||
|
Harvest
|
Harvest
|
Harvest
|
Harvest
|
Chg (%) 2017/2018-2016/2017
|
Chg (%) 2016/2017-2015/2016
|
|||||||||||||
|
Production
|
Year (10)
|
Year (10)
|
Year (10)
|
Year (10)
|
||||||||||||||
|
Farming Business
|
|
|
|
|
|
|
|
|
||||||||||
|
Crops (tons)(11)
|
104,970
|
|
533,692
|
|
603,578
|
|
583,640
|
|
(11.6
|
)%
|
3.4
|
%
|
||||||
|
Soybean (tons )
|
N/A
|
|
171,392
|
|
206,437
|
|
237,681
|
|
(17
|
)%
|
(13.1
|
)%
|
||||||
|
Corn (tons) (2)
|
N/A
|
|
277,955
|
|
271,698
|
|
248,270
|
|
2.3
|
%
|
9.4
|
%
|
||||||
|
Wheat (tons) (3)
|
104,970
|
|
78,640
|
|
115,173
|
|
82,167
|
|
(31.7
|
)%
|
40.2
|
%
|
||||||
|
Sunflower (tons )
|
N/A
|
|
5,181
|
|
10,112
|
|
15,521
|
|
(48.8
|
)%
|
(34.8
|
)%
|
||||||
|
Cotton Lint (tons)
|
N/A
|
|
523
|
|
159
|
|
—
|
|
228.9
|
%
|
N/A
|
|
||||||
|
Rice(12) (tons )
|
N/A
|
|
276,693
|
|
234,819
|
|
220,758
|
|
17.8
|
%
|
6.4
|
%
|
||||||
|
|
Year ended December 31,
|
||||||||||||||
|
|
2018
|
2017
|
2016
|
Chg (%) 2018-2017
|
Chg (%) 2017-2016
|
||||||||||
|
Processed rice(13) (tons)
|
275,573
|
|
241,574
|
|
229,905
|
|
14.1
|
%
|
5.1
|
%
|
|||||
|
Dairy(14) (thousand liters)
|
101,328
|
|
93,168
|
|
92,395
|
|
8.8
|
%
|
0.8
|
%
|
|||||
|
Sugar, Ethanol and Energy Business
|
|
|
|
|
|
|
|
||||||||
|
Sugar (tons)
|
344,137
|
|
567,068
|
|
701,060
|
|
(39.3
|
)%
|
(19.1
|
)%
|
|||||
|
Ethanol (cubic meters)
|
675,001
|
|
434,015
|
|
422,395
|
|
55.5
|
%
|
2.8
|
%
|
|||||
|
Energy (MWh)
|
705,539
|
|
712,425
|
|
751,037
|
|
(1.0
|
)%
|
(5.1
|
)%
|
|||||
|
Land Transformation Business (hectares traded)
|
9,300
|
|
—
|
|
—
|
|
N/A
|
|
N/A
|
|
|||||
100
|
2018/2019
|
2017/2018
|
2016/2017
|
2015/2016
|
Chg (%) 2017/2018-2016/2017
|
Chg (%) 2016/2017-2015/2016
|
|||||||||||||
|
Harvest
|
Harvest
|
Harvest
|
Harvest
|
|||||||||||||||
|
Planted Area
|
Year (15)
|
Year
|
Year
|
Year
|
||||||||||||||
|
|
|
|
(Hectares)
|
|
|
|||||||||||||
|
Farming Business(16)
|
|
|
|
|
|
|
|
|
||||||||||
|
Crops
|
199,163
|
|
195,981
|
|
190,326
|
|
178,490
|
|
3.0
|
%
|
6.6
|
%
|
||||||
|
Soybean
|
75,727
|
|
81,269
|
|
84,435
|
|
88,377
|
|
(3.7
|
)%
|
(4.5
|
)%
|
||||||
|
Corn (2)
|
67,907
|
|
66,115
|
|
54,653
|
|
42,657
|
|
21.0
|
%
|
28.1
|
%
|
||||||
|
Wheat (3)
|
40,611
|
|
36,533
|
|
38,009
|
|
32,396
|
|
(3.9
|
)%
|
17.3
|
%
|
||||||
|
Sunflower
|
3,931
|
|
2,869
|
|
5,413
|
|
9,547
|
|
(47.0
|
)%
|
(43.3
|
)%
|
||||||
|
Cotton
|
5,158
|
|
3,132
|
|
2,640
|
|
—
|
|
18.6
|
%
|
—
|
%
|
||||||
|
Forage
|
5,828
|
|
6,063
|
|
5,177
|
|
5,514
|
|
17.1
|
%
|
(6.1
|
)%
|
||||||
|
Rice
|
40,435
|
|
40,289
|
|
39,728
|
|
37,580
|
|
1.4
|
%
|
5.7
|
%
|
||||||
|
Total Planted Area
|
239,598
|
|
236,270
|
|
230,054
|
|
216,070
|
|
2.7
|
%
|
6.5
|
%
|
||||||
|
Second Harvest Area
|
41,493
|
|
35,948
|
|
39,739
|
|
32,896
|
|
(9.5
|
)%
|
20.8
|
%
|
||||||
|
Leased Area
|
79,932
|
|
72,115
|
|
64,245
|
|
57,595
|
|
12.2
|
%
|
11.5
|
%
|
||||||
|
Owned Croppable Area (17)
|
112,345
|
|
122,144
|
|
120,893
|
|
120,065
|
|
1.0
|
%
|
0.7
|
%
|
||||||
|
|
Year ended December 31,
|
||||||||||||||
|
|
2018
|
2017
|
2016
|
Chg (%) 2018 - 2017
|
Chg (%) 2017 - 2016
|
||||||||||
|
Sugar, Ethanol and Energy Business
|
|
|
|
|
|
|
|||||||||
|
Sugarcane plantation
|
153,690
|
|
143,617
|
|
134,591
|
|
7.0
|
%
|
6.7
|
%
|
|||||
|
Owned land
|
8,748
|
|
8,748
|
|
8,748
|
|
—
|
%
|
—
|
%
|
|||||
|
Leased land
|
144,942
|
|
134,869
|
|
125,843
|
|
7.5
|
%
|
7.2
|
%
|
|||||
|
(1)
|
Includes soybean, soybean oil and soybean meal.
|
|
(2)
|
Includes sorghum, chia and peanuts.
|
|
(3)
|
Includes barley, rye, oats and chickpea.
|
|
(4)
|
Includes seeds and farming services.
|
(5) Accumulated adjustment of Hyperinflation accounting translation for our Crops segment sales (See "Hyperinflation in Argentina").
|
(6)
|
Sales of processed rice including rough rice purchased from third parties and processed in our own facilities, rice seeds and services.
|
|
(7)
|
All other segments include our cattle business which primarily consists of leasing land to a third party based on the price of beef. See “Item 4. Information on the Company-B. Business Overview-Cattle Business.” in our Form 20-F.
|
(8) Includes operating leases and other services.
(9) Represents capital gains from the sale of land.
(10) The table reflects the production in respect of harvest years as of December 31.
|
(11)
|
Crop production does not include tons of forage produced.
|
|
(12)
|
Expressed in tons of rough rice produced on owned and leased farms. The rough rice we produce, along with additional rough rice we purchase from third parties, is ultimately processed and constitutes the product sold in respect of the rice business.
|
|
(13)
|
Includes rough rice purchased from third parties and processed in our own facilities. Expressed in tons of rough rice (1 ton of processed rice is approximately equivalent to 1.6 tons of rough rice).
|
|
(14)
|
Raw milk produced at our dairy farms.
|
(15) Represents the planting plan for 2018/2019 campaign. As of December 31, 2018, 82.0% of the planting plan is seeded.
|
(16)
|
Includes hectares planted in the second harvest.
|
|
(17)
|
Does not include potential croppable areas being evaluated for transformation and does not include forage area.
|
101
Year ended December 31, 2018 as compared to year ended December 31, 2017
The following table sets forth certain financial information with respect to our consolidated results of operations for the years indicated.
|
|
2018
|
2017
|
Chg (%) 2018-2017
|
|||||
|
|
(In thousands of $)
|
|||||||
|
Sales of goods and services rendered
|
793,239
|
|
933,178
|
|
(15.0
|
)%
|
||
|
Cost of goods sold and services rendered
|
(609,965
|
)
|
(766,727
|
)
|
(20.4
|
)%
|
||
|
Initial recognition and Changes in fair value of biological assets and agricultural produce
|
16,195
|
|
63,220
|
|
(74.4
|
)%
|
||
|
Changes in net realizable value of agricultural produce after harvest
|
(909
|
)
|
8,852
|
|
(110.3
|
)%
|
||
|
Margin on Manufacturing and Agricultural Activities Before Operating Expenses
|
198,560
|
|
238,523
|
|
(16.8
|
)%
|
||
|
General and administrative expenses
|
(56,080
|
)
|
(57,299
|
)
|
(2.1
|
)%
|
||
|
Selling expenses
|
(90,215
|
)
|
(95,399
|
)
|
(5.4
|
)%
|
||
|
Other operating income, net
|
104,232
|
|
43,763
|
|
138.2
|
%
|
||
|
Profit from Operations Before Financing and Taxation
|
156,497
|
|
129,588
|
|
20.8
|
%
|
||
|
Finance income
|
8,581
|
|
11,744
|
|
(26.9
|
)%
|
||
|
Finance costs
|
(271,263
|
)
|
(131,349
|
)
|
106.5
|
%
|
||
|
Other financial results - Net gain of inflation effects on the monetary items
|
81,928
|
|
—
|
|
100.0
|
%
|
||
|
Financial results, net
|
(180,754
|
)
|
(119,605
|
)
|
51.1
|
%
|
||
|
(Loss) / Profit Before Income Tax
|
(24,257
|
)
|
9,983
|
|
(343.0
|
)%
|
||
|
Income tax Benefit
|
1,024
|
|
4,992
|
|
(83.1
|
)%
|
||
|
(Loss) / Profit for the Year
|
(23,233
|
)
|
14,975
|
|
(255.1
|
)%
|
||
102
Sales of Goods and Services Rendered
|
Year ended December 31,
|
Crops
|
Rice
|
Dairy
|
All other segments
|
Sugar, Ethanol and Energy
|
Total
|
|||||||||||
|
(In thousands of $)
|
|||||||||||||||||
|
2018
|
155,418
|
|
95,403
|
|
29,710
|
|
1,770
|
|
510,938
|
|
793,239
|
|
|||||
|
2017
|
197,222
|
|
86,478
|
|
37,523
|
|
1,336
|
|
610,619
|
|
933,178
|
|
|||||
Total sales of goods and service rendered totaled $793.2 million, 15.0% less than in 2017, primarily as a result of:
|
•
|
Sales decreased $99.7 million in our Sugar, Ethanol and Energy segment, mainly due to: (i) 23.5% lower prices of sugar, from $371.6 per ton in 2017 to $284.3 per ton in 2018; (ii) a 8.3% decrease in the price of ethanol, from $549.6 per cubic meter in 2017 to $503.8 per cubic meter in 2018; (iii)
a
13.2% decrease in the volume of energy sold, from 860.8 MWh in 2017 to 747.2 MWh in 2018; and (iv) a 2.5% decrease in the volume of sugar and ethanol sold, measured in TRS (Total Recoverable Sugar), from 1.60 million tons in 2017 to 1.56 million tons in 2018. The decrease in volume of sugar and ethanol sold was due to inventories build-up, of 48.8 thousand tons measured in TRS during 2018 compared to an inventories sell-off of 36.4 thousand tons measured in TRS in 2017. This was partially offset by a 11.8% increase year-over-year in sugarcane milled, from 10.2 million tons during 2017 to 11.4 million tons in 2018 due to (i) a 2.7% increase in milling per hour from 2,074 tons per hour in 2017 to 2,130 tons per hour in 2018 due to enhancements and investments at industrial level in concordance with the long term plan of the company; (ii) increase in effective milling days from 221 days in 2017, to 231 days in 2018, due to adequate weather conditions; and (iii) a 4.9% increase in sugarcane yields, from 85.1 tons per hectare in 2017 to 89.3 tons per hectare in 2018, that ensured cane availability.
|
The decrease in volume of energy sold was due to (a) lower third parties energy purchases from 167.0 MWh during 2017 to 72.0 MWh for 2018; (b) a 10.8% decrease in cogeneration efficiency, from 69.6 MWh per ton during 2017, to 62.1 MWh per ton in 2018, which is primarily due to the fact that: (i) energy consumption in Angelica is now higher as a result of the increase in crushing capacity; (ii) during 2018 we adopted a strategy to redirect steam to maximize the production of ethanol, that consumes more energy. This decrease was partially offset by a 7.1% increase in energy prices, from $72.3 per MWh during 2017, to $77.4 per MWh in 2018.
103
The following figure sets forth the variables that determine our Sugar and Ethanol sales:
|
(1)
|
On average, one metric ton of sugarcane contains 140 kilograms of TRS. While a mill can produce either sugar or ethanol, the TRS input requirements differ between these two products. On average, 1.045 kilograms of TRS equivalent are required to produce 1.0 kilogram of sugar, while the amount of TRS required to produce 1 liter of ethanol is 1.691 kilograms
|
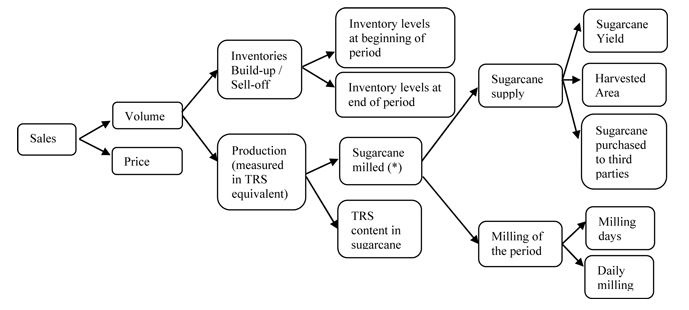
The following figure sets forth the variables that determine our Energy sales:
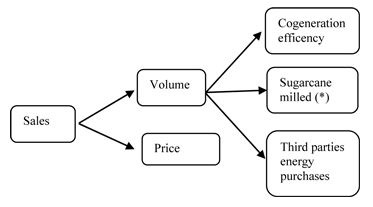
The following table sets forth the breakdown of sales of manufactured products for the years indicated.
|
|
Year ended December 31,
|
Year ended December 31,
|
Year ended December 31,
|
|||||||||||||||||||||||
|
|
2018
|
2017
|
Chg %
|
2018
|
2017
|
Chg %
|
2018
|
2017
|
Chg %
|
|||||||||||||||||
|
|
(in millions of $)
|
(in thousand units)
|
(in dollars per unit)
|
|||||||||||||||||||||||
|
Ethanol (M3)
|
324.7
|
|
241.7
|
|
34.3
|
%
|
644.4
|
|
439.7
|
|
46.6
|
%
|
503.8
|
|
549.6
|
|
(8.3
|
)%
|
||||||||
|
Sugar (tons)
|
128.4
|
|
305.7
|
|
(58.0
|
)%
|
451.5
|
|
822.6
|
|
(45.1
|
)%
|
284.3
|
|
371.6
|
|
(23.5
|
)%
|
||||||||
|
Energy (MWh)
|
57.8
|
|
62.2
|
|
(7.1
|
)%
|
747.2
|
|
860.8
|
|
(13.2
|
)%
|
77.4
|
|
72.3
|
|
7.1
|
%
|
||||||||
|
Others
|
0.1
|
|
1.1
|
|
(90.9
|
)%
|
|
|
|
|
|
|
|
|
|
|
|
|
||||||||
|
TOTAL
|
510.9
|
|
610.6
|
|
(16.3
|
)%
|
|
|
|
|
|
|
|
|
|
|
|
|
||||||||
|
•
|
Sales decreased $41.8 million in our Crops segment mainly driven by: (i) a $9.1 million effect of hyperinflation accounting and translation in 2018 for our Argentine operations (See "Hyperinflation in Argentina"); (ii) a 6.5% decrease in the volume of soybean sold, from 282.5 thousand tons in 2017 to 264.1 thousand tons in 2018; and (iii) a 59.5% decrease in the volume of corn sold, from 599.1 thousand tons in 2017 to 242.5 thousand tons in 2018. The decrease in the volume of soybean and
|
104
corn sold was mainly driven by lower yields, from 2.7 tons per hectare in 2017 to 2.1 tons per hectare in 2018 for soybean and from 5.4 tons per hectare in 2017 to 4.2 tons per hectare in 2018 for corn. Variation in yields was caused by dry weather conditions during January and March of 2018, which is the critical period for water requirement and development of the crops, affecting mainly north and center regions of Argentina, and Uruguay. This decrease was partially offset by (i) higher sales volumes of wheat, from 103.6 thousand tons in 2017 to 174.5 thousand tons in 2018; (ii) higher prices of soybean, from $302.7 per ton in 2017 to $318.9 per ton in 2018 due to higher proportion of FOB sales; (iii) higher prices of corn, from $143.9 per ton in 2017, to $159.3 per ton in 2018; and (iv) greater selling prices of wheat, from $161.5 per ton in 2017 to $187.4 per ton in 2018.
The following table sets forth the breakdown of sales for the years indicated.
|
|
Year ended December 31,
|
Year ended December 31,
|
Year ended December 31,
|
|||||||||||||||||||||||
|
|
2018
|
2017
|
% Chg
|
2018
|
2017
|
% Chg
|
2018
|
2017
|
% Chg
|
|||||||||||||||||
|
|
(In millions of $)
|
(In thousands of tons)
|
(In $ per ton)
|
|||||||||||||||||||||||
|
Soybean
|
84.2
|
|
85.5
|
|
(1.5
|
)%
|
264.1
|
|
282.5
|
|
(6.5
|
)%
|
318.9
|
|
302.7
|
|
5.4
|
%
|
||||||||
|
Corn (1)
|
38.6
|
|
86.2
|
|
(55.2
|
)%
|
242.5
|
|
599.1
|
|
(59.5
|
)%
|
159.3
|
|
143.9
|
|
10.7
|
%
|
||||||||
|
Wheat (2)
|
32.7
|
|
16.7
|
|
95.8
|
%
|
174.5
|
|
103.6
|
|
68.4
|
%
|
187.4
|
|
161.5
|
|
16.0
|
%
|
||||||||
|
Others
|
9.0
|
|
8.7
|
|
3.4
|
%
|
|
|
|
|
|
|
|
|
|
|
|
|
||||||||
|
Adjustments (3)
|
(9.1
|
)
|
—
|
|
100.0
|
%
|
||||||||||||||||||||
|
Total
|
155.4
|
|
197.2
|
|
(21.2
|
)%
|
|
|
|
|
|
|
|
|
|
|
|
|
||||||||
|
(1)
|
Includes sorghum, popcorn and peanut.
|
|
(2)
|
Includes barley, rye, oats and chickpea.
|
|
(3)
|
Accumulated adjustment of Hyperinflation accounting translation for our Crops segment sales (See "Hyperinflation in Argentina").
|
|
•
|
Sales decreased $7.8 million in our Dairy segment mainly caused by (i) a $3.5 million effect of hyperinflation accounting and translation in 2018 for our Argentine operations (See "Hyperinflation in Argentina"); (ii) a 20% decrease in fluid milk prices from $0.35 per liter in 2017 to $0.28 per liter in 2018 due to sharp depreciation of the Argentine peso; and (iii) 0.4 thousand tons of powder milk stock build-up during 2018. This decrease was partially offset by (a) higher milk production volumes, from 93.2 million liters in 2017 to 101.3 million liters in 2018 and (b) the $1.8 million derived from electricity sales during 2018 compared to null sales in 2017 as we started to deliver energy from the new bio-digester that transforms effluents from our free stalls into renewal electricity. Higher milk production was due to 8.8% increase in milking cows from 6,967 cows in 2017 to 7,581 cows in 2018, as we finished the construction of our third free stall and started populating it since September 2018.
|
This was partially offset by:
|
•
|
Sales increased $8.9 million in our Rice segment, mainly due to (i) a 29.6% increase in the volume of white rice sold, from 140.5 thousand tons during 2017 to 182.1 thousand tons in 2018; and (ii) a 8.8% increase in the sale of by products, from $17.1 million during 2017 to $18.6 million in 2018. The increase in the volume of white rice sold is mainly due to (a) a 16.9% increase in rice yields, from 5.9 tons per hectare during 2017 to 6.9 tons per hectare in 2018, and (b) a 10.2% increase in industrial efficiency and rice quality, which allowed us to transform 1.77 tons of rough rice into 1 ton of white rice during 2017, and 1.59 tons of rough rice into 1 ton of white rice in 2018. The increase in volumes sold were partially offset by (i) a reduction in average selling prices from $493.8 per ton in 2017 to $447.3 per ton in 2018; and (ii) a $4.6 million effect of hyperinflation accounting and translation in 2018 for our Argentine operations (See "Hyperinflation in Argentina").
|
The profit of our agricultural produce is recognized under the line items “Initial recognition and changes in fair value of biological assets and agricultural produce” and “Changes in net realizable value of agricultural produce after harvest”. When the agricultural produce is sold to third parties, we do not record any additional profit or loss as the gain or loss has already been recognized.
The profit of our manufactured products is recognized when they are sold. The cost of manufactured products includes, among others, the cost of agricultural produce transferred internally at fair market value (i.e. harvested sugarcane, rough rice, fluid milk, etc).
105
Cost of Goods Sold and Services Rendered
|
Year ended December 31,
|
Crops
|
Rice
|
Dairy
|
All other segments
|
Sugar, Ethanol and Energy
|
Total
|
|||||||||||
|
(In thousands of $)
|
|||||||||||||||||
|
2018
|
(156,936
|
)
|
(74,973
|
)
|
(28,127
|
)
|
(1,313
|
)
|
(348,616
|
)
|
(609,965
|
)
|
|||||
|
2017
|
(196,302
|
)
|
(71,087
|
)
|
(36,979
|
)
|
(853
|
)
|
(461,506
|
)
|
(766,727
|
)
|
|||||
In the case of our agricultural produce sold to third parties (i.e. soybean, corn, wheat and fluid milk), the value of Cost of Goods and Services Rendered is equal to the value of Sales and Services Rendered. The profit of these products is fully recognized under the line items “Initial recognition and changes in fair value of biological assets and agricultural produce” and “Changes in net realizable value of agricultural produce after harvest.” When the agricultural produce is sold to third parties, we do not record any additional profit or loss as the gain or loss has already been recognized.
In the case of our manufactured products sold to third parties (i.e. sugar, ethanol, energy and white rice), the profit is recognized when they are sold. The Cost of Goods and Services Rendered of these products includes, among others, the cost of the agricultural produce (i.e. harvested sugarcane and rough rice), which is the raw material used in the industrial process and is transferred internally from the farm to the industry at fair market value.
Cost of manufactured products sold and services rendered totaled $610.0 million, 20.4% less than 2017. This decrease was primarily due to:
|
•
|
a $112.9 million decrease in our Sugar, Ethanol and Energy segment, mainly due to: (i) the 2.6% decrease in the volume
|
of sugar and ethanol sold measured in TRS; and (ii) a 22.4% lower unitary cost in dollar terms due to (a) the 10.9% increase in sugarcane milling, which diluted fixed cost per tons; (b) depreciation of the Brazilian Real in 2018 compared to 2017; and (c) a 47.9% decrease in third parties' purchase of sugarcane, which has a higher cost, from 1.2 million tons during 2017 to 0.6 million tons in 2018.
|
•
|
a $39.4 million decrease in our Crops segment mainly due to the decrease in Sales of Goods and Services Rendered.
|
|
•
|
a $8.9 million decrease in our Dairy segment mainly due to the decrease in Sales of Goods and Services Rendered.
|
106
These figures were partially offset by:
|
•
|
a $3.9 million increase in our Rice segment, mainly due to the 29.6% increase in volume sold, partially offset by 18.6% lower unitary costs, from $506.1 per ton in 2017 to $411.8 per ton in 2018, due to higher yields and depreciation of the Argentine Peso, coupled with effect of hyperinflation accounting and translation in 2018 for our Argentine operations (See "Hyperinflation in Argentina").
|
Initial Recognition and Changes in Fair Value of Biological Assets and Agricultural Produce
|
Year ended December 31,
|
Crops
|
Rice
|
Dairy
|
All other segments
|
Sugar, Ethanol and Energy
|
Total
|
|||||||||||
|
(In thousands of $)
|
|||||||||||||||||
|
2018
|
28,667
|
|
4,125
|
|
5,455
|
|
(1,199
|
)
|
(20,853
|
)
|
16,195
|
|
|||||
|
2017
|
17,158
|
|
10,236
|
|
11,769
|
|
267
|
|
23,790
|
|
63,220
|
|
|||||
Initial recognition and changes in fair value of biological assets and agricultural produce totaled $ 16.2 million, 74.4% less than 2017. This decrease was primarily due to:
|
•
|
A $44.6 million decrease in our Sugar, Ethanol and Energy segment from a gain of $23.8 million in 2017 (of which $2.9 million were unrealized gains) to a loss of $20.9 million during 2018 (which includes $37.8 million of unrealized losses). This decrease was mainly due to:
|
- A $40.7 million decrease in the recognition of fair value minus the cost of sell of non-harvested sugarcane, from $2.9 million in 2017 to a loss of $37.8 million in 2018, which was mainly generated by a decrease in projected yields as a result of below average rainfalls during the last quarter of 2018, coupled with a decrease in projected sugar prices.
- A $3.9 million decrease in the recognition at fair value less cost to sell of harvested sugarcane, from $20.9 million in 2017 to $16.9 million during 2018 due to the decrease in sugar prices.
|
•
|
a $6.3 million decrease in our Dairy segment , mainly due to the decrease in the recognition at fair value less cost to sell of fluid milk, from $11.8 million in 2017 (of which $9.9 million were realized) to $5.5 million in 2018 (of which $7.9 million were realized), mainly due to (i) 18.3% lower fluid milk prices; and (ii) a $4.0 million lower cow valuation due to effect of hyperinflation accounting and translation in 2018 for our Argentine operations (See "Hyperinflation in Argentina"). This decrease was partially offset by the 8.8% increase in milking cows from an average of 6,967 heads in 2017, to an average of 7,581 heads in 2018, which are used to populate free-stall #3.
|
|
•
|
a $6.1 million decrease in our Rice segment, from $10.2 million during 2017 (of which $ 4.9 million were realized) to $4.1 million in 2018 (of which $9.1 million were realized), due to (i) a decrease of $4.8 million caused by effect of hyperinflation accounting and translation in 2018 for our Argentine operations (See "Hyperinflation in Argentina"); and (ii) lower recognition at fair value less cost to sell of non-harvested rice, from a gain of $3.7 million in 2017 to a loss of $3.9 million in 2018, mainly explained by normalization of expected yields in comparison with exceptional weather conditions for rice harvest during 2017/2018.
|
These decreases were partially offset by:
|
•
|
A $11.5 million increase in our Crops segment from $17.2 million in 2017 (of which $4.4 million were unrealized) to $28.7 million during 2018 (of which $8.2 million were unrealized). This increase is primarily due to:
|
- An increase of $23.4 million in the recognition of fair value minus the cost of sell of harvested crops, from $15.2 million in 2017 to $38.6 million in 2018, mainly due to lower production costs in dollar terms, due to the depreciation of the Argentine Peso, partially offset by; (i) a $7.8 million effect of hyperinflation accounting and translation in 2018 for our Argentine operations (See "Hyperinflation in Argentina"); and (ii) lower grain production.
107
Changes in Net Realizable Value of Agricultural Produce after Harvest
|
Year ended December 31,
|
Crops
|
Rice
|
Dairy
|
All other segments
|
Sugar, Ethanol and Energy
|
Total
|
|||||||||||
|
(In thousands of $)
|
|||||||||||||||||
|
2018
|
(909
|
)
|
—
|
|
—
|
|
—
|
|
—
|
|
(909
|
)
|
|||||
|
2017
|
8,852
|
|
—
|
|
—
|
|
—
|
|
—
|
|
8,852
|
|
|||||
Changes in net realizable value of agricultural produce after harvest is mainly composed by: (i) profit or loss from commodity price fluctuations during the period of time the agricultural produce is in inventory, which impacts its fair value; (ii) profit or loss from the valuation of forward contracts related to agricultural produce in inventory; and (iii) profit from direct exports.
Changes in net realizable value of agricultural produce after harvest totaled negative $0.9 million, $9.8 less than 2017. This result is mainly explained by lower gains from the valuation of our agricultural produce held in inventories.
General and Administrative Expenses
|
Year ended December 31,
|
Crops
|
Rice
|
Dairy
|
All other segments
|
Sugar, Ethanol and Energy
|
Corporate
|
Total
|
|||||||||||||
|
(In thousands of $)
|
||||||||||||||||||||
|
2018
|
(4,202
|
)
|
(5,939
|
)
|
(2,280
|
)
|
(164
|
)
|
(25,302
|
)
|
(18,193
|
)
|
(56,080
|
)
|
||||||
|
2017
|
(2,981
|
)
|
(4,699
|
)
|
(1,058
|
)
|
(174
|
)
|
(26,806
|
)
|
(21,581
|
)
|
(57,299
|
)
|
||||||
Our general and administrative expenses totaled $56.1 million, 2.1% less than 2017. The decrease is mainly explained as a result of the depreciation of the Brazilian Real and the Argentine peso, which was partially offset by the effect of hyperinflation accounting and translation in 2018 for our Argentine operations (See "Hyperinflation in Argentina"), which generated an increase in depreciation expenses for Crops, Rice and Dairy segments.
Selling Expenses
|
Year ended December 31,
|
Crops
|
Rice
|
Dairy
|
All other segments
|
Sugar, Ethanol and Energy
|
Corporate
|
Total
|
|||||||||||||
|
(In thousands of $)
|
||||||||||||||||||||
|
2018
|
(5,447
|
)
|
(14,090
|
)
|
(942
|
)
|
(149
|
)
|
(69,442
|
)
|
(145
|
)
|
(90,215
|
)
|
||||||
|
2017
|
(7,501
|
)
|
(13,324
|
)
|
(711
|
)
|
(156
|
)
|
(73,664
|
)
|
(43
|
)
|
(95,399
|
)
|
||||||
Selling expenses totaled $90.2 million, 5.4% less than 2017. This decrease is explained by:
|
•
|
a $4.2 million decrease in the Sugar, Ethanol and Energy segment, due to the decrease in sales of sugar and ethanol by 2.6% measured in TRS, coupled with depreciation of the Brazilian Real in 2018.
|
|
•
|
a $2.1 million decrease in our Crops segment, due to (i) a 16.6% decrease in total segment sales; (ii) no direct exports realized during 2018, compared to 83.7 thousand tons of corn exported in 2017, which generated $0.7 million fobbing costs; and (iii) by effect of hyperinflation accounting and translation in 2018 for our Argentine operations (See "Hyperinflation in Argentina").
|
These decreases were partially offset by:
|
•
|
$0.8 million increase in our Rice segment, due to a 29.6% increase in white rice sales, partially offset by effect of hyperinflation accounting and translation in 2018 for our Argentine operations (See "Hyperinflation in Argentina").
|
108
Other Operating Income, Net
|
Year ended December 31,
|
Crops
|
Rice
|
Dairy
|
All other segments
|
Sugar, Ethanol and Energy
|
Land Transformation
|
Corporate
|
Total
|
|||||||||||||||
|
(In thousands of $)
|
|||||||||||||||||||||||
|
2018
|
7,163
|
|
217
|
|
(997
|
)
|
13,396
|
|
48,357
|
|
36,227
|
|
(131
|
)
|
104,232
|
|
|||||||
|
2017
|
7,719
|
|
724
|
|
662
|
|
4,279
|
|
30,419
|
|
—
|
|
(40
|
)
|
43,763
|
|
|||||||
Other operating income increased 138.2%, from $43.8 million in 2017, to $104.2 million during 2018, primarily due to:
|
•
|
a $36.2 million increase in our Land Transformation segment due to the sale of the "Rio de Janeiro" and "Conquista" farms, located in Brazil, for a total consideration of $53.0 million for 9,300 croppable hectares.
|
|
•
|
a $17.9 million increase in our Sugar, Ethanol & Energy segment mainly explained by the mark-to-market effect of our sugar hedge positions.
|
|
•
|
a $9.1 million increase in all other segments related to net gains from the fair value adjustment of investment property, composed of farms under lease agreements, coupled with $2.7 million increase by the effect of hyperinflation accounting and translation in 2018 for our Argentine operations (See "Hyperinflation in Argentina").
|
Financial Results, Net
Our net financial results decreased from a loss of $119.6 million in 2017 to a loss of $180.8 million during 2018. This was mainly due to a 373.3% increase in foreign exchange losses caused by a depreciation in the Argentine Peso, which increased from 17% in 2017 to 102.3% in 2018, and the higher depreciation of the Brazilian Real, which increased from 6% in 2017 to a 17.2% in 2018. Both effects produced foreign exchange losses of $183.2 million in 2018 compared to losses of $38.7 million in 2017. This loss was partially offset by an increase of $81.9 million due to the effect of hyperinflation accounting and translation.
The following table sets forth the breakdown of financial results for the periods indicated.
|
|
Year ended December 31,
|
|||||||
|
|
2018
|
2017
|
|
|||||
|
|
(In $ thousand)
|
% Change
|
||||||
|
Interest income
|
7,915
|
|
11,230
|
|
(29.5
|
)%
|
||
|
Interest expense
|
(51,577
|
)
|
(52,308
|
)
|
(1.4
|
)%
|
||
|
Foreign exchange losses, net
|
(183,195
|
)
|
(38,708
|
)
|
373.3
|
%
|
||
|
Cash flow hedge – transfer from equity
|
(26,693
|
)
|
(20,758
|
)
|
28.6
|
%
|
||
|
Loss from interest rate /foreign exchange rate derivative financial instruments
|
(3,024
|
)
|
(2,163
|
)
|
39.8
|
%
|
||
|
Other financial results - Net gain of inflation effects on the monetary items
|
81,928
|
|
—
|
|
100.0
|
%
|
||
|
Taxes
|
(3,136
|
)
|
(3,705
|
)
|
(15.4
|
)%
|
||
|
Other Expenses
|
(2,972
|
)
|
(13,193
|
)
|
(77.5
|
)%
|
||
|
Total Financial Results
|
(180,754
|
)
|
(119,605
|
)
|
51.1
|
%
|
||
109
Income Tax benefit / (expense)
Current income tax benefit totaled a gain of $1.0 million in 2018, which equates to a consolidated effective tax rate of 4.2%. For the fiscal year 2017, we registered an income tax gain of $5.0 million. In 2018, we recorded non-taxable income in the amount of $13.0 million, mainly related to a Complementary Law in Brazil, which allows the Company to consider as non-taxable income the Government grant related to the ICMS tax. This effect was partially offset by a loss of $5.8 related to the effects of the application of IAS 29 on Argentina Shareholders' equity. In 2017, the effective tax rate was 50.0% based on non-deductible expenses in Brazil and Uruguay for an amount of 1.4 million.
Loss for the Year
As a result of the foregoing, our net income during 2018 decreased $38.2 million, from a gain of $15.0 million in 2017 to a loss of $23.2 million in 2018.
110
Year ended
December 31, 2017
as compared to year ended
December 31, 2016
The following table sets forth certain financial information with respect to our consolidated results of operations for the periods indicated.
|
|
2017
|
2016
|
Chg (%) 2017 - 2016
|
|||||
|
|
(In thousands of $)
|
|||||||
|
Sales of goods and services rendered
|
933,178
|
|
869,235
|
|
7.4
|
%
|
||
|
Cost of goods sold and services rendered
|
(766,727
|
)
|
(678,581
|
)
|
13.0
|
%
|
||
|
Initial recognition and Changes in fair value of biological assets and agricultural produce
|
63,220
|
|
125,456
|
|
(49.6
|
)%
|
||
|
Changes in net realizable value of agricultural produce after harvest
|
8,852
|
|
(5,841
|
)
|
(251.5
|
)%
|
||
|
Margin on Manufacturing and Agricultural Activities Before Operating Expenses
|
238,523
|
|
310,269
|
|
(23.1
|
)%
|
||
|
General and administrative expenses
|
(57,299
|
)
|
(50,750
|
)
|
12.9
|
%
|
||
|
Selling expenses
|
(95,399
|
)
|
(80,673
|
)
|
18.3
|
%
|
||
|
Other operating income, net
|
43,763
|
|
(8,297
|
)
|
(627.5
|
)%
|
||
|
Profit from Operations Before Financing and Taxation
|
129,588
|
|
170,549
|
|
(24.0
|
)%
|
||
|
Finance income
|
11,744
|
|
7,957
|
|
47.6
|
%
|
||
|
Finance costs
|
(131,349
|
)
|
(165,380
|
)
|
(20.6
|
)%
|
||
|
Financial results, net
|
(119,605
|
)
|
(157,423
|
)
|
(24.0
|
)%
|
||
|
Profit Before Income Tax
|
9,983
|
|
13,126
|
|
(23.9
|
)%
|
||
|
Income tax Benefit / (Expense)
|
4,992
|
|
(9,387
|
)
|
(153.2
|
)%
|
||
|
Profit for the Year
|
14,975
|
|
3,739
|
|
300.5
|
%
|
||
Sales of Goods and Services Rendered
|
Year ended December 31,
|
Crops
|
Rice
|
Dairy
|
All other segments
|
Sugar, Ethanol and Energy
|
Total
|
|||||||||||
|
(In thousands of $)
|
|||||||||||||||||
|
2017
|
197,222
|
|
86,478
|
|
37,523
|
|
1,336
|
|
610,619
|
|
933,178
|
|
|||||
|
2016
|
142,124
|
|
96,562
|
|
32,897
|
|
960
|
|
596,692
|
|
869,235
|
|
|||||
Sales of manufactured products and services rendered increased 7.4%, from $869.2 million in 2016 to $933.2 million in 2017, primarily as a result of:
|
•
|
a $55.1 million increase in our Crops segment mainly driven by: (i) a 101.9% increase in the volume of corn sold, from
|
294.7 thousand tons in 2016 to 595.1 thousand tons in 2017; (ii) a 15.9% increase in the volume of soybean sold, from 243.8 thousand tons in 2016 to 282.5 thousand tons in 2017; and (iii) a 7.4% increase in soybean prices, from $261.7 per ton in 2016 to $281.1 per ton in 2017. The increase in the volume of corn sold was mainly driven by higher sales of commercialized corn from third parties profiting from arbitrage opportunities, from 59.8 thousand in 2016 to 337.5 thousand tons in 2017. The increase in the volume of soybean sold was mainly due to: (a) higher sales of commercialization of third parties soybean, from 0.8 thousand tons in 2016 to 22.8 thousand tons in 2017; and (b) a 4.2% increase in yields for soybean second harvest, from 2.4 tons/hectare in 2016 to 2.5 tons/hectare in 2017. This increase is partially offset by a 20.1% decrease in the volume of wheat sold, from 129.6 thousand tons in 2016 to 103.6 thousand tons in 2017; mainly due to a 37.9% decrease in wheat production, from 115.3 thousands in 2016 to 71.6 thousands in 2017, caused by unfavorable weather conditions during 2017.
111
The following table sets forth the breakdown of sales of manufactured products for the years indicated.
|
|
Year ended December 31,
|
Year ended December 31,
|
Year ended December 31,
|
|||||||||||||||||||||||
|
|
2017
|
2016
|
% Chg
|
2017
|
2016
|
% Chg
|
2017
|
2016
|
% Chg
|
|||||||||||||||||
|
|
(In millions of $)
|
(In thousands of tons)
|
(In $ per ton)
|
|||||||||||||||||||||||
|
Soybean
|
79.4
|
|
63.8
|
|
24.5
|
%
|
282.5
|
|
243.8
|
|
15.9
|
%
|
281.1
|
|
261.7
|
|
7.4
|
%
|
||||||||
|
Corn (1)
|
86.2
|
|
48.5
|
|
77.7
|
%
|
595.1
|
|
294.7
|
|
101.9
|
%
|
144.9
|
|
164.6
|
|
(12.0
|
)%
|
||||||||
|
Wheat (2)
|
16.7
|
|
18.2
|
|
(8.2
|
)%
|
103.6
|
|
129.6
|
|
(20.1
|
)%
|
161.5
|
|
140.4
|
|
15.0
|
%
|
||||||||
|
Others
|
14.8
|
|
11.6
|
|
27.6
|
%
|
|
|
|
|
|
|
|
|
|
|
|
|
||||||||
|
Total
|
197.2
|
|
142.1
|
|
38.8
|
%
|
|
|
|
|
|
|
|
|
|
|
|
|
||||||||
|
(1)
|
Includes sorghum, popcorn and peanut.
|
|
(2)
|
Includes barley
|
|
•
|
a $13.9 million increase in our Sugar, Ethanol and Energy segment, mainly due to: (i) a 2.9% increase in the price of ethanol,from $534.1 per cubic meter in 2016 to $549.6 per cubic meter in 2017; (ii) a 37.7% increase in the price of energy, from $52.5 per MWh in 2016 to $72.3 in 2017; and (iii) a 2.3% increase in the volume of sugar and ethanol sold, measured in TRS (Total Recoverable Sugar), from 1.57 million tons in 2016 to 1.60 million tons in 2017. The increase in volume of sugar and ethanol sold was due to an inventories sell-off, of 36.4 thousand tons measured in TRS in 2017 compared to an inventories build-up of 76.1 thousand tons measured in TRS in 2016; partially offset by above average rains during the last quarter of 2017, that generated a 7.9% decrease in the sugarcane milled, from 11.1 million tons in 2016 to 10.2 million tons in 2017, which caused disruptions in harvesting operations. The unfavorable weather during 2017 was partially mitigated by improvements in operational efficiency, with a 3.5% increase in daily milling, from 45.1 thousand tons milled per day to 46.6 thousand tons milled per day. The increase in the volume of sugar and ethanol sold, was partially offset by: (a) a 3.5% decrease in the price of sugar, from $385.1 per ton in 2016 to $371.6 per ton in 2017; and (b)16.3% decrease in the volume of energy sold, from 1.0 million MWh in 2016 to 0.9 million MWh in 2017, caused by the decrease in sugarcane milled.
|
The following figure sets forth the variables that determine our Sugar and Ethanol sales:
|
(1)
|
On average, one metric ton of sugarcane contains 140 kilograms of TRS. While a mill can produce either sugar or ethanol, the TRS input requirements differ between these two products. On average, 1.045 kilograms of TRS equivalent are required to produce 1.0 kilogram of sugar, while the amount of TRS required to produce 1 liter of ethanol is 1.691 kilograms
|

112
The following figure sets forth the variables that determine our Energy sales:

The following table sets forth the breakdown of sales of manufactured products for the years indicated.
|
|
Year ended December 31,
|
Year ended December 31,
|
Year ended December 31,
|
|||||||||||||||||||||||
|
|
2017
|
2016
|
Chg %
|
2017
|
2016
|
Chg %
|
2017
|
2016
|
Chg %
|
|||||||||||||||||
|
|
(in millions of $)
|
(in thousand units)
|
(in dollars per unit)
|
|||||||||||||||||||||||
|
Ethanol (M3)
|
241.7
|
|
211.5
|
|
14.3
|
%
|
439.7
|
|
395.9
|
|
11.1
|
%
|
549.6
|
|
|
534.1
|
|
2.9
|
%
|
|||||||
|
Sugar (tons)
|
305.7
|
|
330.9
|
|
(7.6
|
)%
|
822.6
|
|
859.3
|
|
(4.3
|
)%
|
371.6
|
|
|
385.1
|
|
(3.5
|
)%
|
|||||||
|
Energy (MWh)
|
62.2
|
|
54.0
|
|
15.2
|
%
|
860.8
|
|
1,028.3
|
|
(16.3
|
)%
|
72.3
|
|
|
52.5
|
|
37.7
|
%
|
|||||||
|
Others
|
1.1
|
|
0.4
|
|
175.0
|
%
|
|
|
|
|
|
|
|
|
|
|
|
|
||||||||
|
TOTAL
|
610.6
|
|
596.7
|
|
2.3
|
%
|
|
|
|
|
|
|
|
|
|
|
|
|
||||||||
|
•
|
a $4.6 million increase in our Dairy segment mainly caused by: (i) a 25.0% increase in fluid milk prices from $0.28 per liter in 2016 to $0.35 per liter in 2017 due to unfavorable weather conditions in Argentina that negatively impacted national production; and (ii) a 6.2% increase in the amount of liters of fluid milk sold, from 87.0 million liters in 2016 to 92.3 million liters in 2017. The increase in the amount of volume sold is attributable to a 1.3% increase in the size of the milking cow herd in order to supply our new free stall 3, from an average of 6,880 heads in 2016 to an average of 6,967 heads in 2017. In our free-stall production system, cows are confined in barns where they are protected from harsh weather conditions (rain, wind, heat, etc.), and as a result, our productivity was not affected by the unfavorable weather conditions.
|
This was partially offset by:
|
•
|
a $10.1 million decrease in our Rice segment, mainly due to a 10.5% decrease in the volume of white rice sold measured in tons of rough rice, from 278.2 thousand tons in 2016 to 248.9 thousand tons in 2017. The decrease in the volume of white rice sold is explained by an inventories build-up of 30.5 thousand tons in 2017 compared to an inventories sell-off of 25.8 thousand tons in 2016, this is due to a commercial strategy to postpone white rice sales to the first half of 2018 in order to capture higher prices and enhance margins. The decrease in the segment was partially offset by a 1.5% increase in the price of white rice sold measured in rough rice, from $271.1 per ton in 2016 to $275.1 per ton in 2017.
|
The profit of our agricultural produce is recognized under the line items “Initial recognition and changes in fair value of biological assets and agricultural produce” and “Changes in net realizable value of agricultural produce after harvest”. When the agricultural produce is sold to third parties we do not record any additional profit as the gain or loss had already been recognized.
The profit of our manufactured products is recognized when they are sold. The cost of manufactured products includes, among others, the cost of agricultural produce transferred internally at fair market value (i.e. harvested sugarcane, rough rice, fluid milk, etc).
113
Cost of Goods Sold and Services Rendered
|
Year ended December 31,
|
Crops
|
Rice
|
Dairy
|
All other segments
|
Sugar, Ethanol and Energy
|
Total
|
|||||||||||
|
(In thousands of $)
|
|||||||||||||||||
|
2017
|
(196,302
|
)
|
(71,087
|
)
|
(36,979
|
)
|
(853
|
)
|
(461,506
|
)
|
(766,727
|
)
|
|||||
|
2016
|
(141,731
|
)
|
(83,574
|
)
|
(32,571
|
)
|
(212
|
)
|
(420,493
|
)
|
(678,581
|
)
|
|||||
In the case of our agricultural produce sold to third parties (i.e. soybean, corn, wheat and fluid milk), the value of Cost of Goods and Services Rendered is equal to the value of Sales and Services Rendered. The profit of these products is fully recognized under the line items “Initial recognition and changes in fair value of biological assets and agricultural produce” and “Changes in net realizable value of agricultural produce after harvest.” When the agricultural produce is sold to third parties, we do not record any additional profit or loss as the gain or loss has already been recognized.
In the case of our manufactured products sold to third parties (i.e. sugar, ethanol, energy and white rice), the profit is recognized when they are sold. The Cost of Goods and Services Rendered of these products includes, among others, the cost of the agricultural produce (i.e. harvested sugarcane and rough rice), which is the raw material used in the industrial process and is transferred internally from the farm to the industry at fair market value.
Cost of goods sold and services rendered increased 13.0%, from $678.6 million in 2016 to $766.7 million in 2017. This increase was primarily due to:
|
•
|
$41.0 million increase in our Sugar, Ethanol and Energy segment, mainly due to: (i) the 2.3% increase in the volume of sugar and ethanol sold measured in TRS; (ii) a 23.5% increase in third party cane, from 0.9 million tons in 2016 to 1.2 million tons in 2017; (iii) a higher unitary cost in dollar terms due to a 13.3% decrease in sugarcane yields, from 98.2 tons per hectare in 2016 to 85.1 tons per hectare in 2017; (iv) the elimination of the PIS COFINS(tax on ethanol) rebate during 2017, which negatively affected our industrial costs, coupled with a 8.3% increase in the amount of tax to be paid per m3 of ethanol sold ; and (v) the appreciation of the Brazilian Real since the beginning of 2016.
|
These figures were partially offset by:
|
•
|
a $12.5 million decrease in our Rice segment, mainly due to the 10.5% decrease in volume sold; which was partially offset by a 4.9% decrease in the unitary cost in dollar terms due to efficiencies gained during 2017.
|
Initial Recognition and Changes in Fair Value of Biological Assets and Agricultural Produce
|
Year ended December 31,
|
Crops
|
Rice
|
Dairy
|
All other segments
|
Sugar, Ethanol and Energy
|
Total
|
|||||||||||
|
(In thousands of $)
|
|||||||||||||||||
|
2017
|
17,158
|
|
10,236
|
|
11,769
|
|
267
|
|
23,790
|
|
63,220
|
|
|||||
|
2016
|
48,790
|
|
10,498
|
|
5,476
|
|
(13
|
)
|
60,705
|
|
125,456
|
|
|||||
Initial recognition and changes in fair value of biological assets and agricultural produce decreased 49.6%, from $125.5 million in 2016 to $63.2 million in 2017. The decrease was mainly due to:
|
•
|
A $36.9 million decrease in our Sugar, Ethanol and Energy segment from $60.7 million in 2016 (of which $2.9 million were unrealized) to $23.8 million in 2017 (of which $0.3 million were unrealized). This decrease was mainly due to:
|
– a $39.5 million decrease in the recognition at fair value less cost to sell of harvested sugarcane at the point of harvest, from $60.4 million in 2016 to $20.9 million in 2017 due to: (i) a 3.5% decrease in sugar prices; and (ii) a 13.3% decrease
114
in sugarcane yields, from 98.2 tons per hectare in 2016 to 85.1 tons per hectare in 2017, due to above than average yields achieved in 2016 as a result of favorable weather conditions.
– a $2.6 million increase in the recognition at fair value less cost to sell of non-harvested sugarcane, from $0.3 million in 2016 to $2.9 million in the same period in 2017, mainly generated by: (i) 6.7% increase in our sugarcane plantation, from 134.6 thousand hectares in 2016 to 143.6 thousand hectares in 2017, in order to achieve our long term plan to increase milling in our cluster by 30%; and (ii) the 7.9% decrease in milling in 2017, as a result of leaving a higher amount of unharvested sugarcane in the fields, which has more time to grow and leads to a higher biological asset value.
|
•
|
a $31.6 million decrease in our Crops segment from $48.8 million in 2016 (of which $4.4 million were unrealized) to $17.2 million in 2017 (of which $5.8 million were unrealized). This decrease is primarily due to a decrease of $32.9 million in the recognition at fair value less cost to sell of crops at the point of harvest, from $48.1 million in 2016 to $15.2 million in 2017, mainly due to: (i) lower commodities prices, mainly corn, at the moment of harvesting; and (ii) higher production costs due to the appreciation of the Argentine Peso in real terms.
|
These decreases were partially offset by:
|
•
|
a $6.3 million increase in our Dairy segment, mainly due to the increase in the recognition at fair value less cost to sell of fluid milk, from $5.5 million in 2016 (of which $1.3 million were unrealized) to $11.8 million in 2017 (of which $1.5 million were unrealized), mainly due to the 26.2% increase in fluid milk prices.
|
Changes in Net Realizable Value of Agricultural Produce after Harvest
|
Year ended December 31,
|
Crops
|
Rice
|
Dairy
|
All other segments
|
Sugar, Ethanol and Energy
|
Total
|
|||||||||||
|
(In thousands of $)
|
|||||||||||||||||
|
2017
|
8,852
|
|
—
|
|
—
|
|
—
|
|
—
|
|
8,852
|
|
|||||
|
2016
|
(5,841
|
)
|
—
|
|
—
|
|
—
|
|
—
|
|
(5,841
|
)
|
|||||
Changes in net realizable value of agricultural produce after harvest is mainly composed by: (i) profit or loss from commodity price fluctuations during the period of time the agricultural produce is in inventory, which impacts its fair value; (ii) profit or loss from the valuation of forward contracts related to agricultural produce in inventory; and (iii) profit from direct exports. Changes in net realizable value of agricultural produce after harvest increased from a loss of $5.8 million in 2016 to a gain of $8.9 million in 2017. This increase is mainly explained by the increase in soybean prices that impacted positively in the valuation of our inventory, while during 2016 our soybean inventories suffered a negative impact, as soybean prices increased above our forward contracts.
General and Administrative Expenses
|
Year ended December 31,
|
Crops
|
Rice
|
Dairy
|
All other segments
|
Sugar, Ethanol and Energy
|
Corporate
|
Total
|
|||||||||||||
|
(In thousands of $)
|
||||||||||||||||||||
|
2017
|
(2,981
|
)
|
(4,699
|
)
|
(1,058
|
)
|
(174
|
)
|
(26,806
|
)
|
(21,581
|
)
|
(57,299
|
)
|
||||||
|
2016
|
(2,770
|
)
|
(3,373
|
)
|
(983
|
)
|
(290
|
)
|
(22,648
|
)
|
(20,686
|
)
|
(50,750
|
)
|
||||||
Our general and administrative expenses increased 12.9%, from $50.8 million in 2016 to $57.3 million in 2017. The increase is mainly explained by the annual average appreciation of the Brazilian Real.
115
Selling Expenses
|
Year ended December 31,
|
Crops
|
Rice
|
Dairy
|
All other segments
|
Sugar, Ethanol and Energy
|
Corporate
|
Total
|
|||||||||||||
|
(In thousands of $)
|
||||||||||||||||||||
|
2017
|
(7,501
|
)
|
(13,324
|
)
|
(711
|
)
|
(156
|
)
|
(73,664
|
)
|
(43
|
)
|
(95,399
|
)
|
||||||
|
2016
|
(5,692
|
)
|
(11,583
|
)
|
(752
|
)
|
(49
|
)
|
(62,518
|
)
|
(79
|
)
|
(80,673
|
)
|
||||||
Selling expenses increased 18.3%, from $80.7 million in 2016 to $95.4 million in 2017, mainly explained by the increase ethanol sales coupled with the appreciation of the Brazilian Real.
Other Operating Income, Net
|
Year ended December 31,
|
Crops
|
Rice
|
Dairy
|
All other segments
|
Sugar, Ethanol and Energy
|
Corporate
|
Total
|
|||||||||||||
|
(In thousands of $)
|
||||||||||||||||||||
|
2017
|
7,719
|
|
724
|
|
662
|
|
4,279
|
|
30,419
|
|
(40
|
)
|
43,763
|
|
||||||
|
2016
|
(8,787
|
)
|
402
|
|
686
|
|
22,546
|
|
(8,903
|
)
|
(192
|
)
|
5,752
|
|
||||||
Other operating income increased from a $5.8 million loss in 2016 to a $43.8 million gain in 2017, primarily due to:
|
•
|
a $39.3 million increase in our Sugar, Ethanol & Energy segment mainly explained by the mark-to-market effect of our sugar hedge positions;
|
|
•
|
a $16.5 million increase in our Crops segment due to the mark-to-market effect of our soybean and corn hedge positions.
|
These figures were partially offset by:
|
•
|
a $18.3 decrease in our All other segments due to the net gain of $9.7 from the fair value adjustment of investment property, composed of farms under lease agreements and a $8.5 million decrease in all other segments due to the gain proceeding from an arbitration proceeding against Marfrig Argentina claiming unpaid invoices in 2016, respectively.
|
Other operating income, net of our Rice, Dairy, Land Transformation and Corporate segments remained essentially unchanged.
Financial Results, Net
Our financial results, net improved from a loss of $157.4 million in 2016 to a loss of $119.6 million in 2017. This was mainly due to the $20.8 million loss that was reclassified from Equity to the “Financial Result, net” line item 2017, in comparison with the $85.2 million loss that was reclassified in 2016, as a substantial portion of our debt matured in 2016 (see “Hedge Accounting-Cash Flow Hedge” described on Note 2 to our Consolidated Financial Statements). This was partially offset by: (i) an increase in our FX losses, from a loss of $19.0 million in 2016 to a loss of $ 38.7 million in 2017, due to the 17% and 6% depreciation of the Argentine Peso and the Brazilian Real, respectively in 2017, compared to the 14% depreciation of the Argentine Peso and the 19% appreciation of the Brazilian Real in 2016; and (ii) the accrue of prepayment related expenses that correspond to existing loans in Brazil, $10.8 million, as the proceeds from our bond issuance were used to repay existing debt of our Brazilian subsidiaries.
116
The following table sets forth the breakdown of financial results for the years indicated.
|
|
Year ended December 31,
|
|||||||
|
|
2017
|
2016
|
|
|||||
|
|
(In $ thousand)
|
% Change
|
||||||
|
Interest income
|
11,230
|
|
7,671
|
|
46.4
|
%
|
||
|
Interest expense
|
(52,308
|
)
|
(48,198
|
)
|
8.5
|
%
|
||
|
Foreign exchange losses, net
|
(38,708
|
)
|
(19,062
|
)
|
103.1
|
%
|
||
|
Cash flow hedge – transfer from equity
|
(20,758
|
)
|
(85,214
|
)
|
(75.6
|
)%
|
||
|
Loss from interest rate /foreign exchange rate derivative financial instruments
|
(2,163
|
)
|
(5,694
|
)
|
(62.0
|
)%
|
||
|
Taxes
|
(3,705
|
)
|
(2,719
|
)
|
36.3
|
%
|
||
|
Other Expenses
|
(13,193
|
)
|
(4,207
|
)
|
213.6
|
%
|
||
|
Total Financial Results
|
(119,605
|
)
|
(157,423
|
)
|
(24.0
|
)%
|
||
Income Tax (expense) / benefit
For the year ended December 31, 2017, we recognized a consolidated income tax gain of $5.0 million on gain before income taxes of $10.0 million. For the year ended December 31, 2016 we recognized a consolidated income tax expense of $12.9 million ongain before income taxes of $27.2 million. In 2017 the benefit was mainly explained by (1) the recognition of previously unrecognized tax losses now recouped for an amount of $7.6 million in Luxembourg, due to the extent that it has become probable that future taxable profit will allow the deferred tax asset to be recovered; (2) non-taxable income in Brazil, which resulted in non recognition of $2.4 million of income tax and (3) a gain of $1.7 million related to the changes of the statutory income tax rate in Argentina (described on Note 2 to our Consolidated Financial Statements). These effects were partially offset by non-deductible expenses in Brazil and unused tax losses recognized in our operations in Argentina for $2.3 million due to a worsened projections derived for lower expected commodities prices. The effective tax rates were 47.5% for the year ended December 31, 2016 due to non-deductible expenses, mainly related to losses from derivatives in Uruguay ($4.1 million).
Profit / (Loss) for the Year
As a result of the foregoing, our net result for the year increased from $14.3 million in 2016 to $15.0 million in 2017.
B.
LIQUIDITY AND CAPITAL RESOURCES
Our liquidity and capital resources are and will be influenced by a variety of factors, including:
|
•
|
our ability to generate cash flows from our operations;
|
|
•
|
the level of our outstanding indebtedness and the interest that we are obligated to pay on such outstanding indebtedness;
|
|
•
|
our capital expenditure requirements, which consist primarily of investments in new farmland, in our operations, in equipment and plant facilities and maintenance costs; and
|
|
•
|
our working capital requirements.
|
Our principal sources of liquidity have traditionally consisted of shareholders’ contributions, short and long term borrowings and proceeds received from the disposition of transformed farmland or subsidiaries.
We believe that our working capital will be sufficient during the next 12 months to meet our liquidity requirements.
117
Years ended
December 31, 2018
,
2017
and
2016
The table below reflects our statements of Cash Flow for the fiscal years ended
December 31, 2018
,
2017
and
2016
.
|
|
Year ended December 31,
|
|||||||
|
|
2018
|
2017
|
|
2016 (*)
|
||||
|
|
(in thousands of $)
|
|||||||
|
Cash and cash equivalents at the beginning of the year
|
269,195
|
|
158,568
|
|
198,894
|
|
||
|
Effect of exchange rate changes and inflation on cash and cash equivalents (d)
|
(18,297
|
)
|
(8,337
|
)
|
7,969
|
|
||
|
Net cash generated from operating activities (a)
|
218,513
|
|
237,105
|
|
255,401
|
|
||
|
Net cash used in investing activities (b)
|
(174,922
|
)
|
(188,335
|
)
|
(122,014
|
)
|
||
|
Net cash used / generated from financing activities (c)
|
(20,854
|
)
|
70,194
|
|
|
(181,682
|
)
|
|
|
Cash and cash equivalents at the end of the year
|
273,635
|
|
269,195
|
|
158,568
|
|
||
(*) Prior periods have been adjusted to reflect the Company's change in accounting policy for Investment properties.
(a) For the year 2018 it includes
7,598
of the combine effect of IAS 29 and IAS 21 of the Argentine subsidiaries.
(b) For the year 2018 it includes
4,122
of the combine effect of IAS 29 and IAS 21 of the Argentine subsidiaries.
(c) For the year 2018 it includes
(8,231)
of the combine effect of IAS 29 and IAS 21 of the Argentine subsidiaries.
(d) For the year 2018 it include
(3,489)
of the combine effect of IAS 29 and IAS 21 of the Argentine subsidiaries.
Operating Activities
Year ended
December 31, 2018
For the year ended
December 31, 2018
, net cash generated by operating activities was
$218.5 million
. During this year, we generated a net loss of
$23.2 million
that included non-cash charges relating primarily to depreciation and amortization of $154.3 million, interest and other financial expenses, net of
$44.3 million
,
$36.2 million
gain from the sale of farmland and other assets,
$13.4 million
net gain from the fair value adjustment of investment properties,
$51.5 million
gain from derivative financial instruments and forwards,
$30.3 million
gain from the unrealized portion of “Initial recognition and changes in fair value of biological assets”,
$183.2 million
foreign exchanges losses,
$26.7 million
loss as a result of the reclassification from Equity to Financial results, net in connection with the cash flow hedge accounting, and
$81.9 million
net gain of inflation effects on the monetary items.
In addition, other changes in operating asset and liability balances resulted in a net decrease in cash of $18.7 million, primarily due to an increase trade and other receivables. During 2018 income tax paid totaled
$1.9 million
.
The net cash generated by operating activities in 2018 includes
$7.6
million of the positive combined effect of IAS 29 and IAS 21 of the Argentine subsidiaries. (See “Item 5. Operating and Financial Review and Prospects-A. Operating Results- Critical Accounting Policies and Estimates”).
Year ended
December 31, 2017
For the year ended
December 31, 2017
, net cash generated by operating activities was $237.1 million . During this year, we generated a net income of $15.0 million that included non-cash charges relating primarily to depreciation and amortization of $151.0 million, interest and other financial expenses, net of $53.4 million, $38.7 million gain from derivative financial instruments and forwards, $14.6 million gain from the unrealized portion of “Initial recognition and changes in fair value of biological assets”, $38.7 million foreign exchanges losses, and $20.8 million loss as a result of the reclassification from Equity to Financial Results, net in connection with the cash flow hedge accounting.
In addition, other changes in operating asset and liability balances resulted in a net decrease in cash of $18.7 million, primarily due to an increase the cash collected for the derivative positions. During 2017 income tax paid totaled $2.9 million.
118
Year ended
December 31, 2016
For the year ended
December 31, 2016
, net cash generated by operating activities was $255.4 million. During this year, we generated a net income of $14.3 million that included non-cash charges relating primarily to depreciation and amortization of $127.5 million, income tax expense of $12.9 million, $14.0 million net gain from the fair value adjustment of investment properties, interest and other financial expenses, net of $44.7 million, $21.7 million loss from derivative financial instruments and forwards, $9.8 million gain from the unrealized portion of “Initial recognition and changes in fair value of biological assets”, $19.1 million foreign exchanges losses, and $85.2 million loss as a result of the reclassification from Equity to Financial Results, net in connection with the cash flow hedge accounting.
In addition, other changes in operating asset and liability balances resulted in a net decrease in cash of $51.5 million, primarily due to an increase in trade and other receivables, an increase in inventories totaling $22.3 million, an increase in biological asset of $23.7 million, and an increase of $17.9 million from derivative financial instruments. These effects were partially offset by an increase of $39.1 million in trade and other payables.
Investing Activities
Year ended
December 31, 2018
Net cash used in investing activities totaled
$174.9 million
in the year ended
December 31, 2018
, primarily due to $92.7 million related to the renewal and expansion of our sugarcane plantation; $114.4 million related to purchase of agricultural and industrial equipment. Net inflows from investments activities were related to proceeds from the sale of farmland and other assets for $31.5 million and interest income of
$7.9 million
.
Net cash used in investing activities includes
$4.1
million of the positive combine effect of IAS 29 and IAS 21 of the Argentine subsidiaries.
Year ended
December 31, 2017
Net cash used in investing activities totaled $188.3 million in the year ended
December 31, 2017
, primarily due to $84.0 million related to the renewal and expansion of our sugarcane plantation; $114.5 million related to purchase of agricultural and industrial equipment. Net inflows from investments activities were related to interest income of $11.2 million.
Year ended
December 31, 2016
Net cash used in investing activities totaled $122.0 million in the year ended
December 31, 2016
, primarily due to $74.2 million related to the renewal and expansion of our sugarcane plantation; $58.3 million related to purchase of agricultural and industrial equipment. Net inflows from investments activities were related to interest income of $7.7 million.
Financing Activities
Year ended
December 31, 2018
Net cash used in financing activities was
$20.9 million
in the year ended
December 31, 2018
, primarily derived from the incurrence in Argentina of new long term loan by Rabobank for $50 million and from the incurrence of short term loan of
$318.1 million
for our working capital expenditures. All these effects were partially offset by payments of long and short term borrowings for
$124.3 million
and $190.6 million, respectively. During this period Interest paid net totaled
$50.0 million
and re-purchase of our own shares totaled
$15.7 million
.
Net cash used in financing activities includes
$8.2
million of the negative combine effect of IAS 29 and IAS 21 of the Argentine subsidiaries.
Year ended
December 31, 2017
Net cash provided by financing activities was $70.2 million in the year ended
December 31, 2017
, primarily derived from the issuance of senior notes 2027 for $495.7 million and from the incurrence of a new syndicated long term loan by Rabobank and ING among others lenders in the amounts of $232.4 million and short term loan of $106.7 million, respectively. The main use of proceeds of the notes was the prepayment of long-term debt of our Brazilian subsidiaries. Accordingly, payments of long-term borrowings totaled $602.7 million. Interest paid net totaled $41.6 million and re-purchase of our own shares totaled $38.4 million.
119
Year ended
December 31, 2016
Net cash used in financing activities was $181.7 million in the year ended
December 31, 2016
primarily derived from net payment of borrowings in the amounts of $125.2 million. During this period, interest paid totaled $48.4 million and re-purchases of our own shares totaled $4.8 million.
Cash and Cash Equivalents
Historically since our cash flows from operations were insufficient to fund our working capital needs and investment plans, we funded our operations with proceeds from short-term and long-term indebtedness and capital contributions from existing and new private investors. In 2011, we raised $421.8 million from an Initial Public Offering (“IPO”) and simultaneous private placement. As of
December 31, 2018
, our cash and cash equivalents amounted to
$273.6 million
.
However, we may need additional cash resources in the future to continue our investment plans. Also, we may need additional cash if we experience a change in business conditions or other developments. We also might need additional cash resources in the future if we find and wish to pursue opportunities for investment, acquisitions, strategic alliances or other similar investments. If we ever determine that our cash requirements exceed our amounts of cash and cash equivalents on hand, we might seek to issue debt or additional equity securities or obtain additional credit facilities or realize the disposition of transformed farmland and/or subsidiaries. Any issuance of equity securities could cause dilution for our shareholders. Any incurrence of additional indebtedness could increase our debt service obligations and cause us to become subject to additional restrictive operating and financial covenants, and could require that we pledge collateral to secure those borrowings, if permitted to do so. It is possible that, when we need additional cash resources, financing will not be available to us in amounts or on terms that would be acceptable to us or at all.
Indebtedness and Financial Instruments
The table below illustrates the maturity of our indebtedness (excluding obligations under finance leases) and our exposure to fixed and variable interest rates:
|
|
As of December 31,
|
||||
|
|
2018
|
2017
|
|||
|
Fixed rate:
|
|
|
|
|
|
|
Less than 1 year(l)
|
105,708
|
|
132,998
|
|
|
|
Between 1 and 2 years
|
16,287
|
|
35,762
|
|
|
|
Between 2 and 3 years
|
25,704
|
|
20,097
|
|
|
|
Between 3 and 4 years
|
43,507
|
|
20,130
|
|
|
|
Between 4 and 5 years
|
26,415
|
|
16,310
|
|
|
|
More than 5 years
|
505,456
|
|
495,754
|
|
|
|
Total fixed rate:
|
723,077
|
|
721,051
|
|
|
|
Variable rate:
|
|
|
|||
|
Less than 1 year(l)
|
37,724
|
|
21,833
|
|
|
|
Between 1 and 2 years
|
17,278
|
|
22,871
|
|
|
|
Between 2 and 3 years
|
29,861
|
|
17,945
|
|
|
|
Between 3 and 4 years
|
22,886
|
|
18,215
|
|
|
|
Between 4 and 5 years
|
18,251
|
|
11,164
|
|
|
|
More than 5 years
|
12,444
|
|
4,774
|
|
|
|
Total variable rate:
|
138,444
|
|
96,802
|
|
|
|
Total:
|
861,521
|
|
817,853
|
|
|
________________________________________________________________________________________________
|
(1)
|
The Company plans to partially rollover its short term debt using new available lines of credit, or on using operating cash flow to cancel such debt.
|
Borrowings incurred by the Company’s subsidiaries in Brazil are repayable at various dates between January 2019 and September 2024 and bear either fixed interest rates ranging from
2.5%
to
7.95%
per annum or variable rates based on LIBOR or other specific base-rates plus spreads ranging from
6.89%
to
12.03%
per annum. At
December 31, 2018
LIBOR (six months) was
2.88%
(
2017
:
1.84%
).
120
Borrowings incurred by the Company´s subsidiaries in Argentina are repayable at various dates between January 2019 and June 2024 and bear either fixed interest rates ranging from
4.50%
and
7.00%
per annum for those borrowings denominated in U.S. Dollar, and a fixed interest rate at
62.00%
per annum for those borrowings denominated in Argentine pesos.
121
Brazilian Subsidiaries
The main loans of the Company’s Brazilian Subsidiaries identified below are:
|
Bank
|
Grant date
|
Nominal
amount
|
Capital outstanding as of December 31
|
Maturity date
|
Annual interest rate
|
||||||||
|
2018
|
2017
|
||||||||||||
|
(In millions)
|
Millions of
Reais
|
Millions of
equivalent
Dollars
|
Millions of
equivalent
Dollars
|
||||||||||
|
Banco Do Brasil (1)
|
October 2012
|
R$
|
130.0
|
|
R$
|
72.7
|
|
18.8
|
|
27.6
|
|
November 2022
|
2.94% minus 15% of performance bonus
|
|
Itau BBA FINAME Loan (2)
|
December 2012
|
R$
|
45.9
|
|
R$
|
12.1
|
|
3.1
|
|
7.6
|
|
December 2022
|
2.50%
|
|
Banco do Brasil / Itaú BBA Finem Loan (3)
|
September 2013
|
R$
|
273.0
|
|
R$
|
147.1
|
|
38.0
|
|
53.4
|
|
January 2023
|
6.83%
|
|
BNDES Finem Loan (4)
|
November 2013
|
R$
|
215.0
|
|
R$
|
110.8
|
|
28.6
|
|
41.4
|
|
January 2023
|
3.75%
|
|
Tokyo-Mitsubishi (5)
|
August 2016
|
US$
|
30.0
|
|
—
|
|
8.6
|
|
30.0
|
|
August 2019
|
6.35%
|
|
|
ING Bank N.V. (6)
|
October 2018
|
US$
|
75.0
|
|
-
|
|
75.0
|
|
—
|
|
October 2023
|
6.33%
|
|
|
(1)
|
Collateralized by (i) a first degree mortgage of the Carmen (Santa Agua) farm; (ii) a first degree mortgage of the Sapálio farm; and (iii) liens over the Ivinhema mill and equipment.
|
|
(2)
|
Collateralized by (i) a first degree mortgage of the Carmen (Santa Agua) farm; (ii) a first degree mortgage of the Sapálio farm; and (iii) liens over the Ivinhema mill and equipment.
|
|
(3)
|
Collateralized by (i) a first degree mortgage of the Carmen (Santa Agua) farm; (ii) a first degree mortgage of the Sapálio farm; (iii) liens over the Ivinhema mill and equipment; and (iv) long term power purchase agreements (PPA).
|
|
(4)
|
Collateralized by (i) liens over the Ivinhema mill and equipment; and (ii) power sales contracts.
|
|
(5)
|
Collateralized by sales contracts.
|
|
(6)
|
Collateralized by sales contracts.
|
Argentinian Subsidiaries
The principal loan of Adeco Agropecuaria S.A. and Pilaga S.A., our Argentinian Subsidiaries is:
|
Bank
|
Grant date
|
Nominal
amount
|
Capital outstanding as of
December 31
|
Maturity date
|
Annual interest rate
|
|
|
2018
|
2017
|
|||||
|
(In millions)
|
(In millions)
|
(In millions)
|
||||
|
IFC Tranche A (1)
|
Dec-16
|
US$25.00
|
US$22.70
|
US$24.67
|
Sep-21
|
4.3% per annum
|
|
IFC Tranche B (1)
|
Dec-16
|
US$25.00
|
US$21.40
|
US$24.93
|
Sep-23
|
4% plus LIBOR
|
|
Rabobank (2)
|
Jun-18
|
US$50.00
|
US$50.00
|
—
|
Jun-24
|
3% plus LIBOR
|
(1) Collateralized by a US$
113 million
mortgage over Carmen farm, which is property of Adeco Agropecuaria S.A.
(2) Collateralized by the pledge of the shares of Dinaluca S.A., Compañía Agroforestal S.M.S.A. y Bañado del Salado S.A.
The above mentioned loans contain customary financial covenants and restrictions which require us to meet pre-defined financial ratios, among other restrictions, as well as restrictions on the payment of dividends. These financial ratios are measured considering the statutory financial statements of the Argentinian Subsidiaries.
Senior Notes 2027
On September 21, 2017, the Company issued senior notes (the “Notes 2027”) for US$ 500 million, at an annual nominal rate of 6%. The Notes will mature on September 21, 2027. Interest on the Notes is payable semi-annually in arrears on March 21 and September 21 of each year, beginning on March 21, 2018. The total proceeds of the issuance net of expenses was $495.7 million.
During
2018
and
2017
the Company was in compliance with all financial covenants.
122
As of
December 31, 2018
, our short term debt totaled $143.4 million.
We maintain lines of credit with several banks in order to finance our working capital requirements. We believe that we will continue to be able to obtain additional credit to finance our working capital needs in the future based on our past track record and current market conditions.
C.
RESEARCH AND DEVELOPMENT, PATENTS AND LICENSES, ETC.
We are involved in the genetic improvement and development of new rice varieties in respect of our rice seed business in Argentina. Our efforts are directed to improving all processes related to the selection of better materials. The focus is on obtaining superior seeds with weather yield, industrial performance, commercial quality and culinary parameters, with market demand being the ultimate driver. On the farm level, we aim our research of new varieties and hybrids of rice adapted to local conditions and production parameters. In connection with to these goals, we have entered into agreements with selected research and development institutions such as INTA in Argentina, FLAR and HIAAL in Colombia, EPAGRI, IRGA, BASF and others. Our rice seed research team continuously tests and develops new varieties.
We are currently reinforcing our partnership with HIAAL (Híbridos de Arroz para América Latina or Rice Hybrids for Latam) in order to develop rice hybrid seeds.
Since 2008, we developed and released four new rice varieties to the market. The newest one, named SCS121 CL, was introduced in 2017, and includes the Clearfield® technology, which was developed in collaboration with BASF, and is tolerant to herbicides that control harmful weeds.
We have registered our own varieties of rice seeds with the corresponding Argentine authorities; the National Institute of Seeds (INASE) and the National Registry of Seed Variety Property (RNPC). Regarding intellectual property of our seeds, we operate under the standards of ArPOV (Asociación Argentina de Protección de las Obtenciones Vegetales)
We use our seed varieties in our farms and also sell them to rice producers in Argentina, Brazil, Uruguay and Paraguay.
We are also developing Zero Grade Level technology in our farms, which help us to reduce water consumption and so energy consumption as well. Additionally, we are developing an Irrigation Surveillance methodology based on the use of Drones, from which we expect to improve water management efficiencies and improved rice yield performance. See more details for both cases in “Technology and Best Practices” section.
Regarding our Sugar & Ethanol business, we have effectively implemented state-of-the-art technologies such as high pressure boilers for high cogeneration capacity, full mechanization of agricultural operations with online GPS tracking systems on all vehicles (trucks, combines, planters), and concentrated vinasse system among others. In addition to that, we are developing vinasse-to-biogas technology in our Cluster in Mato Grosso do Sul (For more details see “Sugar, Ethanol and Energy” in “Operations and Principal Activities” Section). Currently, we are developing a seedling production method called “MPB” (Muda Pre Brotada or Pre-Sprout Seedling). It briefly consist of making the seedling sprout in a greenhouse and planting them directly on the fields, instead of the traditional planting of billets (sugarcane stalk pieces). Two main goals are pursued through this technique. One is to introduce new promising and healthy varieties quickly. Second goal is to obtain a reduction of planting cost, which is achieved by using much less volume of planting seedling per hectare. In addition, and because of this, more land can be applied to sugarcane for milling, instead of using that sugarcane for seedling purposes.
With regards to our Dairy segment in Argentina, we have successfully adapted and implemented the Free Stall model in our operations. Additionally, we have invested in technology to improve the genetics, health and feeding techniques of our cows in order to enhance our milk production. Currently, we are implementing Sexed Semen Technology in all our cows, which is delivering preliminary promising results. The primary goal is to enhance the production of females from our own herd. This allows us to increase the speed-capacity of organic growth and/or to intensify our cow-genetic selection process. The former being critical to our current Dairy growth project, and the latter being key to improve cow performance (productivity, health, and fertility) (See more details in “Dairy Business” in “Operations and Principal Activities” Section).
In addition to traditional R&D activities, since we are constantly looking to improve efficiencies in each of our businesses, we are also constantly researching and analyzing all the available technologies that could be applied in our operations. In addition, we do not only select the best technologies and techniques, but we are strongly involved in their adaptation to our specific needs and local circumstances. Our internal research group is comprised of interdisciplinary teams (agronomists, veterinarians, industrial
123
engineers, technicians, finance and commercial). The group offers support to all business lines and through different levels, from the optimization of current operations, evaluation of new technologies, development of new products, to the assessment of a whole new production system.
Currently we are actively involved in the local AgTech (Agricultural digital-based Technology) ecosystems to identify any high-potential Startup that would not only be able to provide alternative solutions for our operationsand potentially the market. We are also evaluating potential investment in Startups that fit our business (see “Technology and Best Practices” section)
We do not own any registered patents, industrial models or designs, apart from those described in the first paragraph of this section.
D.
TREND INFORMATION
See “Item 5. Operating and Financial Review and Prospects—A. Operating Results—Trends and Factors Affecting Our Results of Operations.”
E.
OFF-BALANCE SHEET ARRANGEMENTS
For any of the periods presented, we did not have any off-balance sheet transactions, arrangements or obligations with unconsolidated entities or otherwise that are reasonably likely to have a material effect on our financial condition, results of operations or liquidity.
F.
TABULAR DISCLOSURE OF CONTRACTUAL OBLIGATIONS
The following table summarizes our significant contractual obligations and commitments as of
December 31, 2018
:
|
|
Less than 1 year
|
Between 1 and 2 years
|
Between 2 and 5 years
|
Over
5 Years
|
Total
|
|||||
|
|
(in millions of $)
|
|||||||||
|
Borrowings
(1)
|
190.7
|
|
74.5
|
|
286.6
|
|
636.8
|
|
1,188.6
|
|
|
Leases and agricultural partnership
|
30.0
|
|
23.0
|
|
56.0
|
|
50.0
|
|
159.0
|
|
|
Total
|
220.7
|
|
97.5
|
|
342.6
|
|
686.8
|
|
1,347.6
|
|
(1)
Includes interest
124
G.
SAFE HARBOR
See section entitled “Forward-Looking Statements” appearing on page iv in this annual report.
.
DIRECTORS AND SENIOR MANAGEMENT
Board of Directors
The following table sets forth information for our directors as of the date of this annual report:
|
Name
|
Position (*)
|
Date of
appointment
|
Age
|
Year term
expires
|
|
Plínio Musetti
|
Chairman
|
2017
|
64
|
2020
|
|
Mariano Bosch
|
Director /CEO
|
2017
|
48
|
2020
|
|
Alan Leland Boyce
|
Director
|
2016
|
58
|
2019
|
|
Andrés Velasco Brañes
|
Director
|
2016
|
57
|
2019
|
|
Daniel González
|
Director
|
2017
|
48
|
2020
|
|
Guillaume Van der Linden
|
Director
|
2018
|
58
|
2021
|
|
Mark Schachter
|
Director
|
2018
|
38
|
2021
|
|
Ivo Andrés Sarjanovic
|
Director
|
2018
|
53
|
2021
|
|
Alejandra Smith
|
Director
|
2019
|
2022
|
|
Plínio Musetti, Alan Leland Boyce, Guillaume van der Linden, Mark Schachter, Andrés Velasco Brañes, Daniel González , Ivo Andrés Sarjanovic and Alejandra Smith qualify as independent directors in accordance with NYSE standards.
A description of the main tasks currently performed by each director as well as a description of each director’s employment history and education follows:
Plínio Musetti.
Mr. Musetti has been a member of the Company’s board of directors since 2011 and an observer since 2010. Mr. Musetti is a Managing Partner of Janos Holding responsible for long term equity investments for Family offices in Brazil, following his role as Partner of Pragma Gestão de Patrimonio, since June 2010. From 2008 to 2009, Mr. Musetti served as the Chief Executive Officer of Satipel Industrial S.A., leading the company’s initial public offering process and aiding its expansion plan and merger with Duratex S.A. From 1992 to 2002, Mr. Musetti served as the Chief Executive Officer of Elevadores Atlas, during which time he led the company’s operational restructuring, initial public offering process and the sale to the Schindler Group. From 2002 to 2008, Mr. Musetti served as a partner at JP Morgan Partners and Chief Executive Officer of Vitopel S.A. (JP Morgan Partners’ portfolio company) where he led its private equity investments in Latin America. Mr. Musetti has also served as a Director of Diagnósticos de America S.A. from 2002 to 2009. In addition, Mr. Musetti is currently serving as a Board member of Raia Drogasil S.A. Mr. Musetti graduated in Civil Engineering and Business Administration from Mackenzie University and attended the Program for Management Development at Harvard Business School in 1989. Mr. Musetti is a Brazilian citizen.
Mariano Bosch.
Mr. Bosch is a co-founder of Adecoagro and has been the Chief Executive Officer and a member of the Company’s board of directors since inception (2002). From 1995 to 2002, Mr. Bosch served as the founder and Chief Executive Officer of BLS Agribusiness, an agricultural consulting, technical management and administration company. Mr. Bosch has over 22 years of experience in agribusiness development. He is involved in business organizations such as IDEA, YPO, AACREA, FPC and AAPRESID. He graduated with a degree in Agricultural Engineering from the University of Buenos Aires. In 2018, he received a Konex award.
Alan Leland Boyce.
Mr. Boyce is a co-founder of Adecoagro and has been a member of the Company’s board of directors since 2002 and has been Chairman of the Risk and Commercial Committee since 2011. Mr. Boyce is co-founder and Chairman of Materra LLC, a California based owner and operator of 15,000 acres of farmland where it grows pistachios, dates, citrus and organic vegetables. Since 1985, Mr. Boyce has served as the Chief Financial Officer of Boyce Land Co. Inc., a farmland management company that runs 10 farmland limited partnerships in the United States. Mr. Boyce is co-founder and CEO of Westlands Solar Farms, the only farmer-owned utility scale solarPV developer in California and recently co-founded Prairie Harvest, which is developing hemp processing technologies to efficiently separate CBD in the field. Mr. Boyce formerly served as the director of
125
special situations at Soros Fund Management from 1999 to 2007, where he managed an asset portfolio of the Quantum Fund and had principal operational responsibilities for the fund’s investments in South America. Mr. Boyce also served as managing director at the Community Reinvestment Act at Bankers Trust from 1986 to 1999 where he was in charge of fixed-income arbitrage proprietary trading, the bank’s mortgage portfolio and compliance. In addition, Mr Boyce was senior managing director for investment strategy at Countrywide Financial from 2007 to 2008, and worked at the U.S. Federal Reserve Board from 1982 to 1984. He graduated with a degree in Economics from Pomona College, and has a Masters in Business Administration from Stanford University. Mr. Boyce is an American citizen.
Andres Velasco Brañes.
Mr. Velasco has been a member of the Company’s board of directors since 2011. Mr. Velasco was the Minister of Finance of Chile between March 2006 and March 2010, and was also the president of the Latin American and Caribbean Economic Association from 2005 to 2007. Prior to entering the government sector, Mr. Velasco was Sumitomo-FASID Professor of Development and International Finance at Harvard University’s John F. Kennedy School of Government, an appointment he had held since 2000. From 1993 to 2000, he was Assistant and then Associate Professor of Economics and the director of the Center for Latin American and Caribbean Studies at New York University. During 1988 to 1989, he was Assistant Professor at Columbia University. Currently Mr. Velasco serves as Adjunct Professor of Public Policy at Harvard University, and a Tinker Visiting Professor at Columbia University. He also performs consulting services on various economic matters rendering economic advice to an array of clients, including certain of our shareholders. Mr. Velasco has been appointed Dean of New School of Public Policy at London School of Economics. Mr. Velasco holds a Ph.D. in economics from Columbia University and was a postdoctoral fellow in political economy at Harvard University and the Massachusetts Institute of Technology. He received a B.A. in economics and philosophy and an M.A. in international relations from Yale University. Mr. Velasco is a Chilean citizen.
Daniel C. Gonzalez.
Mr. Gonzalez has been a member of the Company’s board of directions since April 16, 2014. Mr. Gonzalez holds a degree in Business Administration from the Argentine Catholic University. He served for 14 years in the investment bank Merrill Lynch & Co in Buenos Aires and New York, holding the positions of Head of Mergers and Acquisitions for Latin America and President for the Southern Cone (Argentina, Chile, Peru and Uruguay), among others. While at Merrill Lynch, Mr. Gonzalez played a leading role in several of the most important investment banking transactions in the region and was an active member of the firm’s global fairness opinion committee. He remained as a consultant to Bank of America Merrill Lynch after his departure from the bank. Previously, he was Head of Financial Planning and Investor Relations in Transportadora de Gas del Sur SA. Mr. Gonzalez is currently the Chief Executive Officer of YPF Sociedad Anónima, where he is also a member of its Board of Directors. Mr Gonzalez is also a member of the Board of Directors of Hidroeléctrica Piedra del Aguila S.A. Mr. González is an Argentine citizen.
Guillaume van der Linden
Mr. van der Linden has been a member of the Company’s board of directors since 2009. Since 2007, Mr. van der Linden has been Senior Investment Manager at PGGM Vermogensbeheer B.V., responsible for investments in emerging markets credit. From 1993 to 2007, Mr. van der Linden worked for ING Bank in various roles, including in risk management and derivatives trading. From 1988 to 1993, Mr. van der Linden was employed as a management consultant for KPMG and from 1985 to 1988 as a corporate finance analyst for Bank Mees & Hope. Mr. van der Linden graduated with Masters degrees in Economics from Erasmus University Rotterdam and Business Administration from the University of Rochester. Mr. van der Linden is a Dutch citizen.
Mark Schachter.
Mr. Schachter has been a member of the Company’s board of directors since 2009. Mr. Schachter has been a Managing Partner of Elm Park Capital Management since 2010. From 2004 to 2010, he was a Portfolio Manager with HBK Capital Management where he was responsible for the firm’s North American private credit activities. His responsibilities included corporate credit investments with a primary focus on middle-market lending and other special situation investment opportunities. From 2003 to 2004, Mr. Schachter worked for American Capital, a middle-market private equity and mezzanine firm and worked in the investment banking division of Credit Suisse Group from 2001 to 2003. Mr. Schachter received a degree in Business
Administration from the Ivey Business School at the University of Western Ontario and completed the Program for Leadership Development at Harvard Business School. Mr. Schachter is a Canadian citizen and has permanent American residence.
Ivo Andrés Sarjanovic.
Mr. Sarjanovic served for more than 25 years in Cargill International, starting as trader in the Grain and Oilseeds business. While in Cargill he held between years 2000-2011 the position of Vice-president and Global Trading Manager of Oilseeds in Geneva, coordinating worldwide trading and crushing activities, and between 2007-2011 he was also the Africa and Middle East General Manager of Agriculture. From 2011 to 2014 Mr. Sarjanovic held the position of Vice-president and World Manager of Cargill Sugar Operations, playing a leading role in the radical transformation of the organization that led to the strategic decision to spin-off in 2014 the sugar business of Cargill creating Alvean Sugar SL, a joint venture integrated with Copersucar, Brazil. Mr. Sarjanovic served as the Chief Executive Officer of Alvean until 2017, during which time he led the company to become the biggest sugar trader in the world. Mr. Sarjanovic is currently serving as non-executive Board member of Agflow S.A. and executive Board member of Sophicom, and also lectures at the University of Geneva’s Master in Commodities. Mr. Sarjanovic holds a B.A. in Economic Sciences, major in Accounting, from the National University of Rosario, Argentina.
126
Additionally, he completed executive studies at IMD in Lausanne, at Oxford University and at Harvard Business School, and was a PhD candidate in Economics at New York University. Mr. Sarjanovic is an Argentine/Italian/Swiss citizen.
Alejandra Smith.
Ms. Smith is the founder of Edge Consultants, a management consulting firm, which helps its clients grow their businesses´ market share profitability, by leveraging strategic and operational expertise. Ms. Smith began her career in Procter & Gamble in 1983, where she acted as Director of the Health & Beauty Business Unit. She held posts in Mexico, Canada and throughout Latin America, where her team consistently drove company expansion into more profitable mass categories. In 1994 Ms. Smith joined PepsiCo, initially co-leading the beverages Go to Market technological transformation in the USA. She was later appointed to the team in charge of the M&A of bottlers in Mexico, the largest international division, where she also established a profitable bottled water category. Subsequently, Ms. Smith transferred to the company's Snacks & Food Division to work in the Latin America and Asia Pacific regions as Commercial SVP and Quaker CEO, . Ms. Smith worked for two multinational Fortune 100 Companies across the Americas and Asia Pacific. Ms. Smith concurrently serves as an independent member of the board of directors of BEPENSA (where she serves as president of the Compensation and Evaluation Committee), Zurich, City Express and Corona. Ms. Smith is fully bicultural and bilingual, holds degrees in Business Administration & Economics from the Instituto Tecnológico Autónomo de Mexico ( ITAM ). Ms. Smith is a Mexican citizen.
Executive Officers
The following table shows certain information with respect to our senior management as of the date of this annual report:
|
Name
|
Position
|
Year
Designated
|
Age
|
|||
|
Mariano Bosch
|
Chief Executive Officer & Co-founder
|
2002
|
48
|
|||
|
Carlos A. Boero Hughes
|
Chief Financial Officer
|
2008
|
52
|
|||
|
Emilio F. Gnecco
|
Chief Legal Officer
|
2005
|
42
|
|||
|
Walter Marcelo Sanchez
|
Chief Commercial Officer & Co-founder
|
2002
|
56
|
|||
|
Renato Junqueira Santos Pereira
|
Director of Sugar and Ethanol Operations
|
2014
|
41
|
|||
|
Mario José Ramón Imbrosciano
|
Director of Business Development
|
2003
|
48
|
|||
|
Leonardo Berridi
|
Country Manager for Brazil
|
2004
|
58
|
|||
|
Ezequiel Garbers
|
Country Manager for ARG/URU & Co-founder
|
2004
|
51
|
|||
|
Pilar Lacoste
|
Director of Consumer Products
|
2019
|
40
|
|||
Mariano Bosch.
See “—Board of Directors.”
Carlos A. Boero Hughes.
Mr. Boero Hughes is our Chief Financial Officer, covering the company’s operations in Argentina, Brazil and Uruguay, and a member of Adecoagro’s Senior Management since 2008. He began working at Adecoagro in August 2008 overseeing our finance and administrative departments. Mr. Boero Hughes has over 20 years of experience in agricultural business and financial markets. Mr Boero Hughes is also a member of the Board of Directors of Loma Negra C.I.A.S.A. Prior to joining us, he was Chief Financial Officer for South America and Co-Chief Executive Officer for Noble Group LTD operations in Argentina, Uruguay and Paraguay from October 2006 to July 2008. From 2003 to 2006, he worked at Noble Group LTD as Financial Director for Argentina and Structure Finance Manager for South America. He worked at Citibank N.A. from 1997 to 2003 as Relationship and Product Manager, focused in the agribusiness industry, and at Banco Privado de Inversiones S.A. as Relationship Manager. He also worked for six years at Carlos Romano Boero S.A.I.C., a flour and dairy cow feed mill family company, as Commercial Manager, Local Grain Elevator and Nursery Manager and finally as General Manager. Mr. Boero Hughes holds a degree in Business Administration from the University of Buenos Aires and a Masters in Business Administration from the Argentine Catholic University. He also graduated from INSEAD’s Executive Program in 2007.
Emilio Federico Gnecco.
Mr. Gnecco is our Chief Legal Officer for all operations in Argentina, Brazil and Uruguay and a member of Adecoagro’s Senior Management since 2005. He is responsible for all legal and corporate matters and compliance. Before joining us, he was a corporate law associate at the law firm of Marval, O’Farrell & Mairal for more than 8 years, where he specialized in mergers and acquisitions, project financing, structured finance, corporate financing, private equity, joint ventures and corporate law and business contracts in general. Mr. Gnecco was in charge of Adecoagro’s corporate matters including mergers and acquisitions since our inception in 2002. Prior to that, he worked at the National Civil Court of Appeals of the City of Buenos Aires for four years. Mr. Gnecco has a law degree from the University of Buenos Aires, where he graduated with honors.
127
Walter Marcelo Sanchez.
Mr. Sanchez is a co-founder of Adecoagro and our Chief Commercial Officer for all operations in Argentina, Brazil and Uruguay and a member of Adecoagro’s Senior Management since 2002. He coordinates the Commercial Committee and is responsible for the trading of all commodities produced by Adecoagro. Mr. Sanchez has over 22 years of experience in agricultural business trading and market development. Before joining us, he was the head of the business development department at Agroexpress.com S.A., an agriculture e-business marketplace. He has extensive international commercial expertise. He worked with South American Meat Products Company (SAMPCO) in Chicago, Illinois and traveled through Western Europe marketing beef products to restaurant chains such as MAREDO. Mr. Sanchez also worked as the commercial director of various agricultural companies, such as Distribuidora Chinquihue S.A. (a Chilean fish and shellfish trading company), Frigolomas S.A. (a beef processing company) and Fleimar S.A. (a marketer of meat products). Mr. Sanchez also had commercial responsibilities at Nutryte S.A. and Estancias y Cabana Las Lilas S.A. (formerly COMEGA S.A.), an Argentine farmland agribusiness company. Mr. Sanchez graduated from Universidad Nacional de Mar del Plata with a degree in Agricultural Engineering.
Renato Junqueira Santos Pereira.
Renato Junqueira Santos Pereira is the Director of our Sugar, Ethanol & Energy business and has been a member of the senior management team since 2014. He began working at Adecoagro in 2010 as the Operations Manager for our Sugar, Ethanol & Energy business and has vast experience in the Brazilian sugarcane industry. Before joining Adecoagro, he served as the CFO of Moema Group, one of the largest sugarcane clusters in Brazil. His main responsibilities at Moema included designing the optimal capital structure to finance the construction of five greenfield mills, preparing the company for an IPO and coordinating the M&A process which culminated in a $1.5 billion dollar sale to Bunge Ltda. Previously, Mr. Pereira held responsibilities as Mill Director and Agricultural Manager in Moema’s mills. He is an Agricultural Engineer from Universidade de Sao Paulo and holds an MBA from the University of California, Davis.
Mario José Ramón Imbrosciano.
Mr. Imbrosciano is the head of our Business Development Department for all operations in Argentina, Brazil and Uruguay where he oversees all new business initiatives, and a member of Adecoagro’s Senior Management since 2003. He has over 27 years of experience in farm management and agriculture production. Prior to joining Adecoagro, Mr. Imbrosciano was the Chief Operating Officer of Beraza Hnos. S.C., a farming company that owns farms in the humid pampas region of Argentina. He was in charge of production, commercialization and logistics for a 60,000 hectare operation. Mr. Imbrosciano has also worked as a private consultant for various clients. Mr. Imbrosciano received a degree in Agricultural Production Engineering from the Argentine Catholic University and holds a Masters in Business Administration from the Instituto de Altos Estudios of the Universidad Austral.
Leonardo Raúl Berridi.
Mr. Berridi is our Country Manager for Brazil and, prior to the Reorganization, had been Adecoagro’s Country Manager for Brazil since the beginning of its operations in Brazil and a member of Adecoagro’s Senior Management since 2004. He coordinates all of our operations and human resources development activities in Brazil. Mr. Berridi has over 27 years of international experience in agricultural business. Prior to joining us, Mr. Berridi was Vice President of Pago Viejo S.A., a company dedicated to agriculture production and dairy farming in the western part of the province of Buenos Aires, Argentina. He also worked for Trans-Continental Tobacco Corporation as Chief Operating Officer of Epasa (Exportadora de Productos Agrarios S.A.), a company dedicated to producing, processing and exporting tobacco in the north east and north west of Argentina, and Production Manager of World Wide Tobacco España S.A. in the Caceres and Zamora provinces in Spain. Mr. Berridi holds a degree in Forestry Engineering from the Universidad Nacional de La Plata.
Ezequiel Garbers.
Mr. Garbers is the Country Manager for Argentina and Uruguay and a member of Adecoagro’s Senior Management and the Country Manager since 2002. He coordinates all of our production and human resources development activities in Argentina and Uruguay. Mr. Garbers has over 20 years of experience in agriculture production. Prior to joining Adecoagro, he was the Chief Operating Officer of an agricultural consulting and investment company he co-founded, developing projects both within and outside of Argentina, related to crop production and the cattle and dairy business. Mr. Garbers holds a degree in Agronomic Engineering from the University of Buenos Aires and a Masters in Business Administration from the Instituto de Altos Estudios of the Austral University.
Pilar Lacoste.
Ms. Lacoste is the Director of Consumer Products and is responsible for the business and brand development in Argentina’s retail unit. She has over 19 years of experience in leading consumer goods companies. Prior to joining Adecoagro in March 2019, she was a Sales Development Director at Danone Dairy Argentina. Ms. Lacoste also held various positions in sales, route to market and strategic planning for Danone’s Dairy and Waters divisions, from August 2009 through February 2019. In addition, Ms. Lacoste held other positions in the commercial planning department for 9 years in Anheuser-Busch InBev. Ms. Lacoste holds a Master in Business Administration and an Executive MBA from the IAE Business School and a Business Administration degree from the University of San Andres.
Our managers supervise our day-to-day transactions so as to ensure that all of our general strategic objectives are carried out, and they report to our board of directors.
128
B.
COMPENSATION
Compensation of Directors and Executive Officers
The compensation of the Company’s directors is approved annually at the ordinary general shareholders’ meeting. For 2018, the aggregate compensation earned by our directors amounted to a grant of up to a total of 49,455 restricted stock units and $550 thousand in cash. These figures do not include Mr. Mariano Bosch’s and Mr. Walter Marcelo Sanchez´s compensation in cash nor in restricted units, which they both declined. For year 2019, the aggregate compensation approved to be earned by our directors amounted to a grant of up to a total of 55,552 restricted stock shares and $500 thousand in cash. These figures do not include Mr. Mariano Bosch’s compensation in cash nor in restricted units, which he declined.
The aggregate compensation package of our executive officers for year 2018 amounted to $1,712,868 in cash and 343,498 restricted shares granted to our senior management. These grants were made under the Adecoagro Amended and Restated Restricted Share and Restricted Stock Unit Plan, as amended. See “—E. Share Ownership—Share Options and Restricted Share and Restricted Stock Unit Plan.”Annual cash bonuses are designed to incentivize our named executive officers at a variable level of compensation based on the Company’s financial and operating performance and each executive’s individual performance. Annual executive cash bonuses and stock unit awards are impacted by seniority and individual executive performance. 80% of variable performance is related to achievement of financial targets consisting of Adjusted EBITDA, Net Income, Adjusted Net Cash Flow from Operations, Cash Earnings and Return on Invested Capital. The remaining 20% is based on the achievement of individual objectives and by evaluating each executive’s level of proficiency in the following competencies: general characteristics, teamwork, professional competencies, environmental and social commitment, problem solving and thinking skills and managerial skills. In the past, actual bonus amounts have been determined shortly after fiscal year end. Our Chief Executive Officer presents the final calculation of the annual cash bonuses for our named executives to the Compensation Committee of the board of directors. The Compensation Committee then reviews actual Company and individual performance, and determines the amount payable consistent with the attainment of such individual’s performance based on the above criteria.
We do not pay or set aside any amounts for pension, retirement or other similar benefits for our officers and directors.
C.
BOARD PRACTICES
Pursuant to our articles of incorporation, the board of directors must be composed of between three and eleven members. The number of directors is determined and the directors are appointed at the general meeting of shareholders (except in case of a vacancy in the office of a director because of death, retirement, resignation, dismissal, removal or otherwise, the remaining directors may fill such vacancy and appoint a successor in accordance with applicable Luxembourg law).
Currently, the board of directors has eleven members. The directors are appointed by the general meeting of shareholders for a period of up to three years; provided, however, the directors shall be elected on a staggered basis, with one-third of the directors being elected each year and provided further that such three year term may be exceeded by a period up to the annual general meeting held following the third anniversary of the appointment. Directors may be removed with or without cause (
ad nutum
) by the general meeting of shareholders by a simple majority of votes cast at a general meeting of shareholders. The directors are eligible for re-election indefinitely.
There are no agreements with majority shareholders, customers, suppliers or others governing the selection of any of the directors or members of senior management. None of our non-executive directors has a service contract with us that provides for benefits upon termination of employment.
The board of directors is empowered to manage Adecoagro and carry out our operations. The board of directors is vested with the broadest powers to manage the business of the Company and to authorize and/or perform all acts of disposal, management and administration falling within the purposes of Adecoagro and all powers not expressly reserved by Luxembourg law or by our articles of incorporation to the general meeting of shareholders is within the competence of the board of directors.
Accordingly, within the limitations established by Luxembourg law and in particular the Luxembourg law of August 10, 1915 on commercial companies (as amended) and our articles of incorporation, the board of directors can take any action (by resolution or otherwise) it deems necessary, appropriate, convenient or fit to implement the purpose of the Company, including without limitation.
|
a.
|
execute any acts or contracts on our behalf aimed at fulfilling our corporate purpose, including those for which a special power of attorney is required;
|
129
|
b.
|
carry out any transactions;
|
|
c.
|
agree, establish, authorize and regulate our operations, services and expenses;
|
|
d.
|
delegate special tasks to directors, regulate the formation and operation of committees and fix the remuneration and compensation of expenses of advisors and/or staff with special duties, with a charge to overhead;
|
|
e.
|
appoint, suspend or remove agents or employees, establish their duties, remuneration, and bonuses and grant them the powers that it deems advisable;
|
|
f.
|
grant signature authorization to directors and officers, grant general or special powers of attorney, including those to prosecute;
|
|
g.
|
call regular and special shareholders’ meetings and establish agendas, submit for the shareholders’ approval our inventory, annual report, balance sheet, statement of income and exhibits, propose depreciation, amortization and reserves that it deems advisable, establish the amount of gains and losses, propose the distribution of earnings and submit all this to the shareholders’ meeting for consideration and resolution;
|
|
h.
|
fix the date for the payment of dividends established by the shareholders’ meeting and make their payment; and
|
|
i.
|
make decisions relating to the issuance, subscription or payment of shares pursuant to our articles of incorporation and decision of the regular or special shareholders’ meetings.
|
As of the date of this annual report, the chairman of the board of directors is Mr. Plínio Musetti. The board of directors has the following four committees: Audit Committee, Compensation Committee, Risk and Commercial Committee and Strategy Committee. On May 13, 2011, the former Risk and Strategy Committee split into the current Risk and Commercial Committee and the Strategy Committee.
Audit Committee
The Company’s articles of incorporation provide that the board of directors may set up an audit committee. The board of directors has set up an Audit Committee composed by independent directors and has appointed, pursuant to board resolutions dated May 10, 2018, Mr. Mark Schachter (Chairman), Mr. Ivo Andrés Sarjanovic and Mr. Andrés Velasco Brañes, as members of its audit committee.
The Company’s articles of incorporation provide that the audit committee shall (a) assist the board of directors in fulfilling its oversight responsibilities relating to the integrity of the Company’s financial statements, including periodically reporting to the board of directors on its activity and the adequacy of the Company’s systems of internal controls over financial reporting; (b) make recommendations for the appointment, compensation, retention and oversight of, and consider the independence of, the Company’s external auditors; (c) review material transactions (as defined in the articles) between the Company or its subsidiaries with related parties (other than transactions that were reviewed and approved by the independent members of the board of directors as defined in the articles of the Company) or other governing body of any subsidiary of the Company or through any other procedures as the board of directors may deem substantially equivalent to the foregoing) to determine whether their terms are consistent with market conditions or are otherwise fair to the Company and its subsidiaries; and (d) perform such other duties imposed on it by the laws and regulations of the regulated market(s) on which the shares of the Company are listed, applicable to the Company, as well as any other duties entrusted to it by the board of directors.
In addition, the charter of the audit committee sets forth, among other things, the audit committee’s purpose and responsibilities.
Compensation Committee
The Company has a Compensation Committee that reviews and approves the compensation and benefits of the executive officers and other key employees, and makes recommendations to the board of directors regarding principles for compensation, performance evaluation, and retention strategies. It is responsible for administering our share option plans and our restricted share and restricted stock unit plan for executive officers and other key employees. See “—E. Share Ownership—Share Options and Restricted Share and Restricted Stock Unit Plan.” The committee has the discretion to interpret and amend the Plan, and delegate to the Chief Executive Officer the right to award equity-based compensation to executive officers and other key employees. The
130
committee meets at least once a year and as needed on the initiative of the Chief Executive Officer or at the request of one of its members. The members of the Compensation Committee, appointed pursuant to board resolutions dated May 10, 2018, are Mr. Guillaume van der Linden (Chairman),Mr. Daniel González, Mr. Plínio Musetti and Mr. Andrés Velasco Brañes.
Risk and Commercial Committee
The Company has a Risk and Commercial Committee that has the duty to (i) make such inquiries as are necessary or advisable to understand and evaluate material business risks and risk management processes as they evolve from time to time; (ii) review with the board of directors and management the guidelines and policies to govern the process for assessing and managing risks; (iii) discuss and review with the board of directors management’s efforts to evaluate and manage the Company’s business from a risk perspective; (iv) request input from the board of directors, management and operating staff, as well as from outside resources, as it may deem necessary; (v) discuss with the board of directors and management which elements of enterprise risk are most significant, the prioritization of business risks, and make recommendations as to resource allocation for risk management and risk mitigation strategies and activities; and (vi) oversee the development of plans for risk mitigation in any area which it deems to be a material risk to the Company; and monitor management’s implementation of such plans, and the effectiveness generally of its risk mitigation strategies and activities.
The committee meets at least four times a year and as often as deemed necessary or appropriate in its judgment. The members of the Risk and Commercial Committee appointed by the board meeting held on May 10, 2018 are Mr. Alan Leland Boyce (Chairman), Mr. Andrés Velasco Brañes and Mr. Ivo Andrés Sarjanovic.
Strategy Committee
The Company’s Strategy Committee has the duty to: (i) discuss and review with the board management’s identification and setting of strategic goals; including potential acquisitions, joint ventures and strategic alliances and dispositions; (ii) make recommendations to the board of directors as to the means of pursuing strategic goals; and (iii) review with the board management’s progress in implementing its strategic decisions and suggest appropriate modifications to reflect changes in market and business conditions.
The committee meets at least four times a year and as often as deemed necessary or appropriate in its judgment. The members of Strategy Committee appointed by the board meetings held on May 10, 2018 are Mr. Plínio Musetti (Chairman), Mr. Guillaume van der Linden, and Mr. Daniel Gonzalez.
D.
EMPLOYEES
Employees
On
December 31, 2018
, we had 7,743 employees, of whom 93% were unionized. Approximately 4% of our workforce is comprised of temporary workers. We comply with all labor laws. Historically, we have had a positive relationship with the trade unions.
The following table sets forth our number of employees by each of our business segments:
|
|
As of December 31,
|
|||||||
|
|
2018
|
2017
|
2016
|
|||||
|
Farming and Land Transformation
|
1,188
|
|
1,136
|
|
1,137
|
|
||
|
Sugar, Ethanol and Energy
|
5,770
|
|
5,859
|
|
6,428
|
|
||
|
Administrative
|
785
|
|
795
|
|
761
|
|
||
|
Total
|
7,743
|
|
7,790
|
|
8,326
|
|
||
We do not have any severance agreements with our senior executive directors and managers.
Benefits
131
The benefits granted to our employees follow the market standard, including health plans and Spanish, English and Portuguese language lessons. In some cases, depending on the working location, we also provide meal, transportation, parking or financial aid for junior employees who are still in college. For senior management, we also provide vehicles.
E.
SHARE OWNERSHIP
Share Ownership
The total number of shares of the Company beneficially owned by our directors and executive officers, as of the date of this annual report, was 5,178,718, which represents 4.45% of the total shares of the company. See table in “Item 7. Major Shareholders and Related Party Transactions” for information regarding share ownership by our directors and executive officers.
Share Options and Restricted Share and Restricted Stock Unit Plan
Adecoagro/IFH 2004 Stock Incentive Option Plan and Adecoagro/IFH 2007/2008 Equity Incentive Plan
The Company maintains the Adecoagro/IFH 2004 Incentive Option Plan (formerly, the International Farmland Holdings, LLC 2004 Incentive Option Plan, and referred to herein as the “2004 Plan”) and the Adecoagro/IFH 2007/2008 Equity Incentive Plan (formerly, the International Farmland Holdings, LLC 2007/2008 Equity Incentive Plan, and referred to herein as the “2007/2008 Plan”). The 2004 Plan and the 2007/2008 Plan are collectively referred to herein as the “Option Plans.” Initially, the Option Plans provided for the grant of options to purchase ordinary units of IFH. In connection with the Reorganization, the Option Plans were amended and restated to provide for the grant of options to purchase ordinary shares of the Company, and all then-outstanding options to purchase IFH ordinary units were converted into options to purchase the Company’s ordinary shares.
The number of ordinary shares reserved and available for issuance under the 2004 Plan and the 2007/2008 Plan are 1,634,220 and 142,019, respectively. Shares subject to awards that become forfeited, cancelled, expired, withheld upon exercise, reacquired by the Company prior to vesting or otherwise terminated will again be available for future awards under the Option Plans.
Administration and Eligibility
The Option Plans are administered by the Compensation Committee of the Company’s board of directors (the “Committee”). The Committee has general authority to, among other things, select individuals for participation, determine the time and amount of grants, and interpret the plans and awards. The Committee determines the vesting requirements of the awards. The Option Plans require that the exercise price of any future grants shall be no less than the greater of the fair market value of our ordinary shares on the date of grant and the par value per ordinary share.
Individuals eligible to receive options under the 2004 Plan include officers and employees, and under the 2007/2008 Plan include officers, employees, directors, prospective employees and consultants.
Amendment and Termination
The board of directors may amend or terminate the Option Plans in its discretion, and the Committee may amend any outstanding options in its discretion, except participant consent will be needed if a participant’s rights are adversely affected. If not previously terminated by the board of directors, the Option Plans will terminate on the 10th anniversary of its adoption. The 2004 Plan was amended to extend the term to 20
th
anniversary of its adoption.
Granted Options
Under the 2004 Plan, options to purchase 2,402,228 ordinary shares were granted and the weighted average exercise price of all granted options was $6.67. Under the 2007/2008 Plan, as of the same date, options to purchase 2,228,166 ordinary shares were granted, and the weighted average exercise price of all granted options was $13.07.
Outstanding options under the 2004 Plan vested in three equal installments on the first three anniversaries of the date of grant, and options under the 2007/2008 Plan generally vest in four equal installments on the first four anniversaries of the date of grant. Vesting under each of the Option Plans is generally subject to the participant’s continued service as of each applicable vesting date, and all options terminate 10 years from the date of grant. No further option under both plans will be granted.
132
Adecoagro S.A. Amended and Restated Restricted Share and Restricted Stock Unit Plan
On November 11, 2011, the Board of Directors of the Company approved the amendment and restatement of the Adecoagro S.A. Restricted Share Plan, now known as the Amended and Restated Restricted Share and Restricted Stock Unit Plan (as amended from time to time, the “Plan).
The Plan provides for awards of restricted shares or restricted stock units to employees, officers, members of the board of directors and other service providers of the Company. The purpose of the Plan is to further align the interests of participants with those of the shareholders by providing participants with long-term incentive compensation opportunities tied to the performance of the Company’s ordinary shares.
On March 13, 2018 and March 12, 2019, the Plan was once again amended by the Board of Directors to increase the number of common shares available for issuance with respect to which awards may be made by an aggregate 1,264,189 common shares. Currently, the maximum number of common shares with respect to which awards may be made under the Plan is equal to 4,728,930 common shares inclusive of such Shares that are subject to outstanding grants of Awards. To the extent any award under the Plan is canceled, expired, forfeited, surrendered settled in cash, or otherwise terminated without delivery of shares the shares retained by or returned to the Company will again be available for future awards under the Plan. The shares available for issuance as well as outstanding awards under the Plan are subject to adjustment in the event of a reorganization, stock split, merger or similar change. Under the Plan, as of the date of this annual report, 3,188,536 ordinary shares had been issued to directors, senior management and employees.
Administration and Eligibility
The Plan is administered by the Committee. The Committee has general authority to grant awards, determine the recipients of awards and prescribe the terms of awards, as well as authority to interpret and apply the terms of the Plan and individual awards. The Committee determines the amount and the vesting requirements of the awards.
Terms of Awards
A grant of restricted shares represents ordinary shares that are issued subject to vesting requirements and transfer restrictions, as determined by the Committee in its discretion. The vesting requirements may be based on the continued employment or service of the participant for a specified time period or on the attainment of specified business performance goals established by the Committee. Subject to the transfer restrictions and vesting requirements of the award, the participant will have the rights of a stockholder of the Company, including voting rights and the right to receive dividends.
The number of restricted shares or restricted stock units awarded to individuals each year will be based on Company performance. Once awarded, the restricted shares or restricted stock units are subject to a service-based vesting schedule and vest in three equal annual installments on the first three anniversaries of the date of grant, subject only to the participant’s continued service to the Company as of each applicable vesting date. Restricted stock units are payable following the vesting of an award in shares.
Amendment and Termination
The board of directors may amend, modify, suspend or terminate the Plan in its discretion, except participant consent will be needed if participants’ rights are adversely affected. If not previously terminated by the board of directors, the Plan will terminate on the 10th anniversary of its adoption.
Share Options and Restricted Shares
The total number of ordinary and restricted shares to be issued upon exercise of the options to directors and executive officers as a group under our Option Plans is 1,530,200 in the aggregate. The range of exercise prices per ordinary shares under our 2004 Plan is $5.83 to $8.62 (1,492,890 options). The range of exercise prices per ordinary shares under our 2007 Plan is $12.82 to $13.40 (37,310 options). Upon the exercise of all options no single beneficiary would own more than 1% of total outstanding shares.
The total number of restricted stock units to be issued under the Plan to directors and executive officers as a group is 302,770 in the aggregate. Upon receipt of shares under the Plan no single beneficiary would own more than 1% of total outstanding shares.
133
A.
MAJOR SHAREHOLDERS
The following table sets forth the beneficial ownership of our shares for each person known to us to own beneficially at least 5% of our common shares and our directors and executive officers, based on the information most recently available to the Company, as of April 24, 2018.
As of April 24, 2018, we had 116,671,360 outstanding shares. Beneficial ownership is determined in accordance with the rules and regulations of the SEC. In computing the number of shares beneficially owned by a person and the percentage ownership of that person, we have included shares that the person has the right to acquire within 60 days from April 24, 2018, including through the exercise of any option, warrant or other right or the conversion of any other security. These shares, however, are not included in the computation of the percentage ownership of any other person.
|
|
Number
|
Percent
|
|||
|
Principal Shareholders:
|
|
|
|
|
|
|
Al Gharrafa Investment Company (1)
|
15,983,265
|
|
13.7
|
%
|
|
|
Stichting Pensioenfonds Zorg en Welzijn (2)
|
15,381,385
|
|
13.3
|
%
|
|
|
Route One Investment LP (3)
|
10,310,134
|
|
8.9
|
%
|
|
|
EMS Capital LP (4)
|
10,073,000
|
|
8.6
|
%
|
|
|
Brandes Investment Partners LP (5)
|
8,138,682
|
|
7.0
|
%
|
|
|
Jennison Associates, LLC (6)
|
6,115,520
|
|
5.3
|
%
|
|
|
Directors and Executive Officers as a Group*
|
4,917,980
|
|
4.2
|
%
|
|
________________________________________________________________________________________________
* No single beneficially owns more than 1% based on the total number of outstanding shares.
|
(1)
|
The address of Al Gharrafa Investment Company is C/O Intertrust Corporate Services (Cayman) Limited, 190 Elgin Street, George Town, Grand Cayman, KY1-9005, Cayman Islands.
|
|
(2)
|
The address of Stichting Pensioenfonds Zorg en Welzijn is P.O. BOX 4001 NL-3700 KA Zeist The Netherlands.
|
|
(3)
|
The address of Route One Investment LP is 1 Letterman Drive, Building D, Suite 200, San Francisco, CA 94129, United States.
|
|
(4)
|
The address of EMS Capital LP is 767 Fifth Avenue 46th floor, New York, NY 10153.
|
|
(5)
|
The address of Brandes Investment Partners LP is 11988 El Camino Real, Suite 600, PO Box 919048, San Diego, CA 92130-9048, United States.
|
|
(6)
|
The address of Jennison Associates LLC is 466 Lexington Avenue, New York, NY 10017.
|
As of April 25, 2018, 93,874,817 shares, representing 42.7% of our outstanding common shares were held by United States record holders.
B.
RELATED PARTY TRANSACTIONS
Share Purchase and Sale Agreement and UMA Right of First Offer Agreement
In connection with the Share Purchase and Sale Agreement, dated February 16, 2006. The IFH Parties also entered into a Right of First Offer Agreement with Marcelo Weyland Barbosa Vieira, Paulo Albert Weyland Vieira, Mario Jorge de Lemos Vieira, and Corina de Almeida Leite, each of which is a current indirect shareholder in IFH, (together the “UMA Members”), dated February 16, 2006, whereby the IFH Parties agreed to grant the UMA Members a right of first offer to acquire the shares of UMA, or all or substantially all of the assets of UMA, or the real property or plot of land where the commercial offices of UMA is currently located and which is currently subject to a right-of-way and easement agreement granted to Mario Corina, Alfenas Agrícola Ltda. The rights granted to each of the UMA Members, their permitted affiliates, assignees, successors or heirs under such agreement are only in effect for as long as such entities hold such an equity interest in IFH or any of its affiliates.
Agriculture Partnership Agreements
Some of our agriculture partnership agreements are entered into with certain minority shareholders of the Company, for a total of 9,946.7 hectares. For the years ended December 31, 2018, 2017 and 2016, we recorded other net amount (payables) or receivables for payments in advance amounting to $(0.2) million, $(0.4) million and $(0.7) million, respectively, and recognized expenses amounting to $2.3 million, $3.3 million and $2.9 million, respectively, in connection with these agreements.
134
Registration Rights Agreement
In connection with the Reorganization, we entered into a registration rights agreement providing holders of our issued and outstanding common shares on January 28, 2011 (such holders being hereinafter referred to as the “Existing Investors” and such common shares subject to the agreement being hereinafter referred to as the “Registrable Securities”) with certain rights to require us to register their shares for resale under the Securities Act of 1933, as amended (“Securities Act”). Pursuant to the agreement, if holders of a majority of the Registrable Securities notify us, no earlier than 180 days after the effective date of the registration statement previously filed by us on Form F-1, we are required, subject to certain limitations, to file a registration statement under the Securities Act in order to register the resale of the amount of ordinary shares requested by such holders. The underwriters in such an offering will have the right, subject to certain limitations, to limit the number of shares included in such registration. The Existing Investors have the right to require us to file one such registration. In addition, if we propose to register any of our securities under the Securities Act, Existing Investors are entitled to notice of such registration and are entitled to certain “piggyback” registration rights allowing such holders to include their common shares in such registration, subject to certain restrictions. Furthermore, Existing Investors may require us to register the resale of all or a portion of their shares on a registration statement on Form F-3 once we are eligible to use Form F-3. In an underwritten offering, the underwriters have the right, subject to certain restrictions, to limit the number of Registrable Securities Existing Investors may include.
To see a summary of the balances and transactions with related parties, please see Note 31 to our Consolidated Financial Statements.
Shelf Registration Statement on Form F-3
The Company filed a shelf registration statement on Form F-3 with the U.S. Securities and Exchange Commission (SEC) on September 23, 2013, which was declared effective by the SEC on December 23, 2013. Pursuant to the Shelf Registration Statement, certain shareholders may offer and sell from time to time, in one or more offerings, up to 55,821,281 common shares. The registration of the common shares for disposition by the principal shareholders does not mean that the principal shareholders will actually offer or sell any of the shares. The specifics of future offerings, if any, including the names of participating shareholders, the amount of shares to be offered and the offering price, will be determined at the time of any such offerings and will be described in a prospectus supplement filed at the time of any such offerings.
On March 21, 2016, we completed an underwritten secondary offering of 12.0 million common shares of Adecoagro offered by our shareholders Quantum Partners LP and Geosor Corporation, at a price per share to the public of $11.70 pursuant to the effective shelf registration statement described in the previous paragraph.
Advisory Service Agreement
On April 18, 2018 the Company, executed an Advisory Service Agreement with Mr. Abbas Farouq Zuaiter (former director of the Company) for a term of 12 months. As consideration for the provision of advisory services under the agreement, the company will pay Mr. Abbas Farouq Zuaiter $ 50,000 and an award of restricted equity interests in the company with a value of $50,000.
On April 17, 2019 the Company, executed an Advisory Service Agreement with Mr. Marcelo Vieira (former director of the Company) for a term of 24 months. As consideration for the provision of advisory services under the agreement, the company will pay Mr. Vieira $ 50,000 per each year of the contact, and an award of restricted equity interests in the company with a value of $50,000.
C.
INTERESTS OF EXPERTS AND COUNSEL
Not applicable.
135
A.
CONSOLIDATED STATEMENTS AND OTHER FINANCIAL INFORMATION.
See Item 18. Financial Statements and page F-1 through F-78 for our Consolidated Financial Statements.
Legal and Administrative Proceedings
We are subject to several laws, regulations and business practices of the countries in which we operate. In the ordinary course of business, we are subject to certain contingent liabilities with respect to existing or potential claims, lawsuits and other proceedings, including those involving tax, social security, labor lawsuits and other matters. We accrue liabilities when it is probable that future costs will be incurred and such costs can be reasonably estimated. Currently, we are not engaged in any material litigation or arbitration and no material litigation or claims are known to us to be pending or threatened against us which, either alone or on a combined basis, may result in an adverse effect on our business, results of operations, or cash flows.
In Argentina and Brazil we are engaged in several legal proceedings, including tax, social security, labor, civil, environmental, administrative and other proceedings, for which we have established provisions in an aggregate amount of $3.6 million as of
December 31, 2018
. In addition, there are currently certain legal proceedings pending in which we are involved for which we have not established provisions. In the opinion of our management, the ultimate disposition of any threatened or pending matters, either individually or on a combined basis, will not have a material adverse effect on our combined financial condition, liquidity, or results of operations other than as described below.
The Brazilian government filed a tax enforcement action against UMA to demand excise taxes (Imposto sobre Produtos Industrializados, or “IPI”), or a federal value-added tax on industrial products, in the amount of approximately $3.4 million. We have obtained a favorable initial decision from the lower court, which accepted our argument on procedural grounds based on the Brazilian government’s loss of its procedural right to demand the IPI debts. Currently, the case is under review by an appellate court following the appeal filed by the Brazilian government. We have not made any provision for this claim based on legal counsel’s view that the risk of an unfavorable decision in this matter is remote. If this proceeding is decided adversely to us, our results of operations and financial condition may be materially adversely affected.
José Valter Laurindo de Castilhos, Companhia Rio de Janeiro Agropecuária Ltda. and other former owners of the Rio de Janeiro and Conquista Farms have filed suit against us for the payment of a supplementary amount of approximately $39.5 million, as well as indemnity for moral and material damages, as a result of the alleged breach of the purchase agreement entered into by the parties. The lower court ruled in our favor, allowing us to keep possession of the Rio de Janeiro Farm. This decision has been appealed by Mr. Castilhos to the Superior Court of Justice (“Superior Tribunal de Justiça”). The Brazilian Superior Court of Justice determined that the case had no merit. This decision can be appealed by Mr. Castilhos. We have not made any provision for this claim based on legal counsel’s view that the risk of an unfavorable decision in this matter is remote. If this proceeding is decided adversely to us, our results of operations and financial condition may be materially adversely affected.
The INCRA conducted an investigation to determine the falsehood of the CCIR delivered to us by the former owner of Rio de Janeiro Farm (the “Farm”) back in January 2005 when we acquired the Farm. The INCRA also conducted an investigation related to the
cadeia dominial
of the Farm to determine the correct chain of ownership through the successive transfers of ownership of the Farm, in order to confirm that the
destaque publico
occurred or that the State does not have interest in claiming ownership. No irregularity was found that could jeopardize the acquisition deed or affect the ownership of the Farm.
Dividend Policy
The amount and payment of dividends will be determined by a simple majority vote at a general shareholders’ meeting, typically but not necessarily, based on the recommendation of our board of directors. All shares of our capital stock rank
pari passu
with respect to the payment of dividends. Pursuant to our articles of incorporation, the board of directors has the power to distribute interim dividends in accordance with applicable Luxembourg law. Dividends may be lawfully declared and paid if our net profits and distributable reserves are sufficient under Luxembourg law.
Under Luxembourg law, at least 5% of our net profits per year must be allocated to the creation of a legal reserve until such reserve has reached an amount equal to 10% of our issued share capital. If the legal reserve subsequently falls below the 10% threshold, at least 5% of the annual net profits again must be allocated toward the reserve. The legal reserve is not available for distribution.
136
Adecoagro is a holding company and has no material assets other than its ownership of partnership interests in Adecoagro LP SCS, in turn, is a holding entity with no material assets other than its indirect ownership of shares in operating subsidiaries in foreign countries. If we were to distribute a dividend at some point in the future, we would cause the operating subsidiaries to make distributions to Adecoagro LP SCS, which in turn would make distributions to Adecoagro in an amount sufficient to cover any such dividends.
Our subsidiaries in Argentina and Brazil are subject to certain restrictions on their ability to declare or pay dividends. See “Item 5. Operating and Financial Review and Prospects—B. Liquidity and Capital Resources—Indebtedness and Financial Instruments”, and also see “—Risks Related to our Business and Industries—Certain of our subsidiaries have substantial indebtedness which could impair their financial condition and decrease the amount of dividends we receive.
B.
SIGNIFICANT CHANGES
Except as otherwise disclosed in this annual report, there has been no undisclosed significant change since the date of the annual Consolidated Financial Statements.
A.
OFFER AND LISTING DETAILS
Our common shares have been listed on the NYSE under the symbol “AGRO” since January 28, 2011. As of the date of this report, our issued share capital amounts to $183,572,723, represented by 122,381,815 (of which 4,643,396 were treasury shares as of
December 31, 2018
) shares with a nominal value of $1.50 each. All issued shares are fully paid up.
B.
PLAN OF DISTRIBUTION
Not applicable.
C.
MARKETS
Our common shares have been listed on the NYSE under the symbol “AGRO” since January 28, 2011. See “—A. Offer and Listing Details.”
D.
SELLING SHAREHOLDERS
Not applicable.
E.
DILUTION
Not applicable.
F.
EXPENSES OF THE ISSUE
Not applicable.
A.
SHARE CAPITAL
Not applicable.
B.
MEMORANDUM AND ARTICLES OF ASSOCIATION
The following is a summary of some of the terms of our common shares, based in particular on our articles of incorporation and the Luxembourg law of August 10, 1915 on commercial companies as amended.
137
Adecoagro’s shares are governed by Luxembourg law and its articles of incorporation. More information concerning shareholders’ rights can be found in the Luxembourg law on commercial companies dated August 10, 1915, as amended and the articles of incorporation.
The following is a summary of the rights of the holders of our shares that are material to an investment in our common shares. These rights are set out in our articles of association or are provided by applicable Luxembourg law, and may differ from those typically provided to shareholders of U.S. companies under the corporation laws of some states of the United States. This summary does not contain all information that may be important to you. For more complete information, you should read our updated articles of association, which are attached as an exhibit to this annual report.
General
Adecoagro is a Luxembourg
société anonyme
(a joint stock company). The Company’s legal name is “Adecoagro S.A.” Adecoagro was incorporated on June 11, 2010 and on October 26, 2010 all the outstanding shares of Adecoagro were acquired by IFH LLC.
On October 30, 2010, the members of IFH LLC transferred pro rata approximately 98% of their membership interests in IFH LLC to Adecoagro in exchange for common shares of Adecoagro. In a series of transactions during 2012, we transferred shares of Adecoagro to certain limited partners of IFH in exchange for their residual interest in IFH, increasing our interest in IFH to approximately 100%.
On January 28, 2011, Adecoagro completed the IPO of its shares on the NYSE. The shares are traded under the symbol “AGRO.”
On March 27, 2015, Adecoagro commenced a series of transactions for the purpose of transfering the domicile of Adecoagro LP to Luxembourg. In connection with the Adecoagro LP redomiciliation, Adecoagro merged IFH into Adecoagro LP with Adecoagro LP as the surviving entity and Adecoagro GP S.à r.l.,
a société à responsibilitié limitée
organized under the laws of Luxembourg, became the general partner of Adecoagro LP on April 1, 2015. Also on April 1, 2015, Adecoagro completed the redomiciliation of Adecoagro LP (Delaware) out of Delaware to Luxembourg and Adecoagro LP, without dissolution or liquidation, continued its corporate existence as Adecoagro LP S.C.S.,
a société en commandite simple
organized under Luxembourg law, effective April 2, 2015. For a detailed description of the Adecoagro LP redomiciliation please see “Item 4. Information on the Company—A. History and Development of the Company—History. Since that date the affairs of Adecoagro LP S.C.S. have been governed by its articles of association and Luxembourg law.
Adecoagro is registered with the Luxembourg Registry of Trade and Companies under number B153681. Adecoagro has its registered office at 6 Rue Eugène Ruppert, L-2453, Luxembourg, Grand Duchy of Luxembourg.
The corporate purpose of Adecoagro, as stated in Article 4 of our articles of incorporation (Purpose Object), is the following: The object of Adecoagro is the holding of participations, in any form whatsoever, in Luxembourg and foreign companies, or other entities or enterprises, the acquisition by purchase, subscription, or in any other manner as well as the transfer by sale, exchange or otherwise of stock, bonds, debentures, notes and other securities or rights of any kind including interests in partnerships, and the holding, acquisition, disposal, investment in any manner (in), development, licensing or sub licensing of, any patents or other intellectual property rights of any nature or origin as well as the ownership, administration, development and management of its portfolio. Adecoagro may carry out its business through branches in Luxembourg or abroad.
Adecoagro may borrow in any form and proceed to the issuance by private or public means of bonds, convertible bonds and debentures or any other securities or instruments it deems fit.
In a general fashion it may grant assistance (by way of loans, advances, guarantees or securities or otherwise) to companies or other enterprises in which Adecoagro has an interest or which form part of the group of companies to which Adecoagro, belongs or any entity as Adecoagro may deem fit (including upstream or cross stream), take any controlling, management, administrative and/or supervisory measures and carry out any operation which it may deem useful in the accomplishment and development of its purposes.
Finally, Adecoagro can perform all commercial, technical and financial or other operations, connected directly or indirectly in all areas in order to facilitate the accomplishment of its purpose.
138
Share Capital
As of
December 31, 2018
our issued share capital amounted to $183,572,722.50, represented by 122,381,815 shares in issue (of which 4,643,396 were treasury shares) with a nominal value of $1.50 each. All issued shares are fully paid up.
As of
December 31, 2018
there were 118,189,329 common shares outstanding.
We have an authorized unissued share capital of $3,000,000,000, including the issued share capital as of
December 31, 2018
of $183,572,722.50 and are authorized to issue up to 2,000,000,000 shares of a nominal value of $1.50 each (taking into account the shares issued as of
December 31, 2018
) out of such authorized share capital. Our authorized unissued share capital as of
December 31, 2018
is $2,816,427,277.50.
Our articles of incorporation authorize the board of directors to issue shares within the limits of the authorized un-issued share capital at such times and on such terms as the board or its delegates may decide for a period ending on April 20, 2021 (unless it is extended, amended or renewed and we currently intend to seek renewals and/or extensions as required from time to time). Accordingly, the board may issue shares up to the number of authorized un-issued shares pursuant to the above until the latter date against contributions in cash, contributions in kind or by way of incorporation of available reserves at such times and on such terms and conditions, including the issue price, as the board of directors or its delegate(s) may in its or their discretion resolve and the general meeting of shareholders has waived and has authorized the board of directors to waive, suppress or limit, any pre-emptive subscription rights of shareholders provided for by law to the extent it deems such waiver, suppression or limitation advisable for any issue or issues of shares within the authorized share capital. Further, on April 19, 2017 the extraordinary meeting of shareholders adjusted such authorization to 5 years; this is, until April 20, 2021, in line with the amendments to the Luxembourg law of August 10, 1915 on commercial companies as amended.
Our authorized share capital is determined (and may be increased, reduced or extended) by our articles of incorporation, as amended from time to time, by the decision of our shareholders at an extraordinary general shareholders’ meeting with the necessary quorum and majority provided for the amendment of our articles of incorporation. See “—Amendment to the Articles of Incorporation” and “—General Meeting of Shareholders”.
Under Luxembourg law, existing shareholders benefit from a preemptive subscription right on the issuance of shares for cash consideration. However, our shareholders have, in accordance with Luxembourg law, authorized the board to suppress, waive or limit any preemptive subscription rights of shareholders provided by law to the extent the board deems such suppression, waiver or limitation advisable for any issuance or issuances of shares within the scope of our authorized unissued share capital. Such shares may be issued above, at or below market value (down to zero) as well as by way of incorporation of available reserves and premium for a period ending on April 2021 (unless it is extended, amended or renewed and we currently intend to seek renewals and/or extensions as required from time to time). Further, on April 19, 2017 the extraordinary meeting of shareholders adjusted the authorized un-issued share capital and related authorizations to five years; this is, until April 20, 2021, in line with the amendments to the Luxembourg law of August 10, 1915 on commercial companies as amended.
Form and Transfer of shares
Our shares are issued in registered form only and are freely transferable. Luxembourg law does not impose any limitations on the rights of Luxembourg or non-Luxembourg residents to hold or vote our shares.
Under Luxembourg law, the ownership of registered shares is evidenced by the inscription of the name of the shareholder, the number of shares held by him or her in the register of shares held at the registered office of the Company. Each transfer of shares in the share register shall be effected by written declaration of transfer to be recorded in the register of shares, such declaration to be dated and signed by the transferor and the transferee, or by their duly appointed agents. We may accept and enter into the share register any transfer effected pursuant to an agreement or agreements between the transferor and the transferee, true and complete copies of which have been delivered to us.
We may appoint registrars in different jurisdictions, each of whom may maintain a separate register for the shares entered in such register. We have appointed Computershare as our New York registrar and transfer agent. The holders of our shares may elect to be entered in one of the registers and to be transferred from time to time from one register to another register provided that our board of directors may however impose transfer restrictions for shares that are registered, listed, quoted, dealt in, or have
139
been placed in certain jurisdictions in compliance with the requirements applicable therein. The transfer to the register kept at the Company’s registered office may always be requested by a shareholder.
In addition, our articles of incorporation provide that our shares may be held through a securities settlement system or a professional depository of securities. Shares held in such manner have the same rights and obligations as shares recorded in our shareholder register(s) (subject to complying with certain formalities). Shares held through a securities settlement system or a professional depository of securities may be transferred in accordance with customary procedures for the transfer of securities in book-entry form.
Issuance of Shares
Pursuant to Luxembourg law of August 10, 1915 on commercial companies as amended, the issuance of shares in Adecoagro requires the approval by the general meeting of shareholders at the quorum and majority provided for the amendment of our articles of incorporation. See “—Amendment to the Articles of Incorporation” and “—General Meeting of Shareholders”. The general meeting of shareholders may however approve an authorized unissued share capital and authorize the board of directors to issue shares up to the maximum amount of such authorized unissued share capital for a maximum period of five years. The general meeting may amend, renew or extend such authorized share capital and authorization to the board of directors to issue shares.
We have currently an authorized unissued share capital of $3,000,000,000, including the issued share capital as of December 31, 2017 of $183,572,722.50, and are authorized to issue up to 2,000,000,000 shares of a nominal value of $1.50 each (taking into account the shares already issued) out of such authorized share capital. As of December 31, 2017 the un-issued share capital was $2,816,427,277.50. Our board has been authorized to issue shares within the limits of the authorized un-issued share capital at such times and on such terms as the board or its delegates may decide for a period ending on April 20, 2021 (unless it is extended, amended or renewed and we currently intend to seek renewals and/or extensions as required from time to time). Further, on April 19, 2017 the extraordinary meeting of shareholders adjusted the authorized un-issued share capital and related authorizations to 5 years; until April 20, 2021, in line with the amendments to the Luxembourg law of August 10, 1915 on commercial companies as amended. Accordingly, the board may issue shares up to the total number of authorized un-issued shares until the latter date against contributions in cash, contributions in kind or by way of incorporation of available reserves at such times and on such terms and conditions, including the issue price, as the board of directors or its delegate(s) may in its or their discretion resolve while waiving, suppressing or limiting, any pre-emptive subscription rights of shareholders provided for by law to the extent it deems such waiver, suppression or limitation advisable for any issue or issues of shares within the authorized share capital.
Our articles provide that no fractional shares may be issued.
Our shares have no conversion rights and there are no redemption or sinking fund provisions applicable to our common shares.
Preemptive Rights
Unless limited or cancelled by the board of directors as described above, holders of our shares have a pro rata preemptive right to subscribe for any new shares issued for cash consideration. Our articles provide that, in the event of an increase of the issued share capital by the board of directors within the limits of the authorized un-issued share capital, preemptive rights can be waived, suppressed or limited by the board of directors for a period ending on April 20, 2021. On April 19, 2017 the extraordinary meeting of shareholders adjusted such authorization to 5 years; until April 20, 2021, in line with the amendments to the Luxembourg law of August 10, 1915 on commercial companies as amended.
Repurchase of Shares
We cannot subscribe for our own shares.
We may, however, repurchase issued shares or have another person repurchase issued shares for our account, subject in particular to the following conditions:
|
•
|
the prior authorization of the general meeting of shareholders (at the quorum and majority for ordinary resolutions), which authorization sets forth the terms and conditions of the proposed repurchase and in particular the maximum number of shares to be repurchased, the duration of the period for which the authorization is given (which may not exceed five years) and, in the case of repurchase for consideration, the minimum and maximum consideration per share, must have been obtained;
|
140
|
•
|
the repurchase may not reduce our net assets on a non-consolidated basis to a level below the aggregate of the issued share capital and the reserves that we must maintain pursuant to Luxembourg law or its articles of incorporation; and
|
|
•
|
only fully paid up shares may be repurchased.
|
The general meeting of shareholders has authorized that the Company, and/or any wholly-owned subsidiary (and/or any person acting on their behalf), may purchase, acquire, receive or hold shares in the Company under article 430-15 of the Luxembourg law of August 10, 1915, as amended, from time to time up to 20% of the issued share capital, on the following terms and on such terms as referred to below and as shall further be determined by the board of directors of the Company, such authorization being valid (subject to renewal) for a period of five years from January 10, 2011. Such period was thereafter extended to end on April 20, 2021.
Acquisitions may be made in any manner including without limitation, by tender or other offer(s), buyback program(s), over the stock exchange or in privately negotiated transactions or in any other manner as determined by the board of directors (including derivative transactions or transactions having the same or similar economic effect than an acquisition).
In the case of acquisitions for value:
(i) in the case of acquisitions other than in the circumstances set forth under (ii), for a net purchase price being (x) no less than fifty per cent of the lowest stock price and (y) no more than fifty per cent above the highest stock price, in each case being the closing price, as reported by the New York City edition of the Wall Street Journal, or, if not reported therein, any other authoritative source to be selected by the board of directors of the Company (hereafter, the closing price), over the ten (10) trading days preceding the date of the purchase (or as the case may be the date of the commitment to the transaction);
(ii) in case of a tender offer (or if deemed appropriate by the board of directors, a buyback program),
a. in case of a formal offer being published, for a set net purchase price or a purchase price range, each time within the following parameters: no less than fifty per cent of the lowest stock price and (y) no more than fifty per cent above the highest stock price, in each case being the closing price over the ten (10) trading days preceding the publication date, provided however that if the stock exchange price during the offer period fluctuates by more than 10%, the board of directors may adjust the offer price or range to such fluctuations;
b. in case a public request for sell offers is made, a price range may be set (and revised by the board of directors as deemed appropriate) provided that acquisitions may be made at a price which is no less than fifty per cent of the lowest stock price and (y) no more than fifty per cent above the highest stock price, in each case being the closing price over a period determined by the board of directors provided that such period may not start more than five (5) trading days before the sell offer start date of the relevant offer and may not end after the last day of the relevant sell offer period.
In addition, pursuant to Luxembourg law the board of directors may repurchase shares without the prior approval of the general meeting of shareholders if necessary to prevent serious and imminent harm to us or if the acquisition of shares has been made in view of the distribution thereof to the employees.
A share repurchase program was approved by the board of directors of the Company on September 12, 2013 to acquire up to 5% of the total outstanding share capital of the Company to be held as treasury shares (the “Share Repurchase Program”). The Share Repurchase Program was implemented in compliance with the authorization granted by the general meeting of shareholders of the Company, any applicable law, rules or regulations described above and the following limits approved by the board of directors of the Company. The Share Repurchase Program was approved for a period of 12 months from September 23, 2014 (the date of its announcement) or until reaching the maximum number of shares authorized under the Share Repurchase Program, whichever occurs first. The Share Repurchase Program was renewed by decision of the Board of Directors on August 11, 2015 and on August 9, 2016 for an additional period of 12 months, ending on September 23, 2017 or until reaching the maximum number of shares authorized under the Program, whichever occurs first. In April 4, 2017, the board of directors amended the Share Repurchase Program to include repurchases under Open Market Transactions, in reliance on the “safe harbour” from liability for manipulation provided by Rule 10b-18 of the Securities Exchange Act and in privately negotiated transactions.
Capital Reduction
141
The articles of incorporation provide that the issued share capital may be reduced, subject to the approval by the general meeting of shareholders at the quorum and majority provided for the amendment of our articles of incorporation. See “—Amendment to the Articles of Incorporation” and “—General Meeting of Shareholders”.
General Meeting of Shareholders
In accordance with Luxembourg law and our articles of incorporation, any regularly constituted general meeting of shareholders of Adecoagro represents the entire body of shareholders of the Company. It shall have the broadest powers to order, carry out or ratify acts relating to the operations of the Company.
The annual general meeting of shareholders of Adecoagro as well as any other meetings of shareholders shall be held in the Grand Duchy of Luxembourg at such place and time as indicated in the notice of the meeting.
Each of our shares entitles the holder thereof to attend our general meeting of shareholders, either in person or by proxy, to address the general meeting of shareholders, and to exercise voting rights, subject to the provisions of our articles of incorporation. Each share entitles the holder to one vote at a general meeting of shareholders. There is no minimum shareholding required to be able to attend or vote at a general meeting of shareholders.
A shareholder may act at any general meeting of shareholders by appointing another person (who need not be a shareholder) as his proxy, which proxy shall be in writing and comply with such requirements as determined by our board with respect to the attendance to the general meeting, and proxy forms in order to enable shareholders to exercise their right to vote. All proxies must be received by us (or our agents) no later than the day preceding the fifth (5th) working day before the date of the general meeting except if our board of directors decides to change such time frame.
Our articles of incorporation provide that in the case of shares held through the operator of a securities settlement system or depository, a holder of such shares wishing to attend a general meeting of shareholders must receive from such operator or depository a certificate certifying the number of shares recorded in the relevant account on the blocking date and certifying that the shares in the account shall be blocked until the close of the general meeting. Such certificates should be submitted to us no later than the day preceding the fifth working day before the date of the general meeting unless our board fixes a different period.
Our board of directors may determine a date preceding a general meeting as the record date for admission to such general meeting. When convening a general meeting of shareholders, we will publish the convening notice (which must be published at least fifteen days before the meeting) in the
Recueil Électronique des Sociétés et Association
, and in a Luxembourg newspaper and in the case the shares of the Company are listed on a regulated market, in accordance with the publicity requirements of such regulated market applicable to the Company. If all of the shareholders are present or represented at a general meeting of shareholders, the general meeting may be held without prior notice or publication. These convening notices must contain the agenda of the meeting and set out the conditions for attendance and representation at the meeting.
All materials relating to a general meeting of shareholders (including the notice) will be available at the website of Adecoagro at www.adecoagro.com and will be filed with the SEC on Form 6-K. The information on our website is not incorporated by reference in, and does not constitute a part of, this annual report.
Luxembourg law provides that the board of directors is obliged to convene a general meeting of shareholders if shareholders representing, in the aggregate, 10% of the issued share capital so require in writing with an indication of the agenda. In such case, the general meeting of shareholders must be held within one month of the request. If the requested general meeting of shareholders is not held within one month, shareholders representing, in the aggregate, 10% of the issued share capital, may petition the competent president of the district court in Luxembourg to have a court appointee convene the meeting. Luxembourg law provides that shareholders representing, in the aggregate, 10% of the issued share capital may request that additional items be added to the agenda of a general meeting of shareholders. That request must be made by registered mail sent to the registered office at least five days before the holding of the general meeting of shareholders.
Voting Rights
Each share of our shares entitles the holder thereof to one vote at a general meeting of shareholders.
Luxembourg law distinguishes between “ordinary” general meetings of shareholders and “extraordinary” general meetings of shareholders.
142
Extraordinary general meetings of shareholders are convened to resolve in particular upon an amendment to the articles of incorporation and certain other limited matters including those described below and are generally subject to the quorum and majority requirements described below. All other general meetings of shareholders are ordinary general meetings of shareholders.
Ordinary General Meetings of Shareholders
. At an ordinary general meeting of shareholders there is no quorum requirement, and resolutions are adopted by a simple majority of the votes validly cast, irrespective of the number of shares represented. Abstentions are not considered “votes”.
Extraordinary General Meetings of Shareholders
. An extraordinary general meeting of shareholders convened for the purpose of in particular (a) an increase or decrease of the authorized or issued share capital, (b) a limitation or exclusion of preemptive rights, (c) approving a legal merger or de-merger of Adecoagro, (d) dissolution of the Company or (e) an amendment of the articles of incorporation must generally have a quorum of at least 50% of our issued share capital except in limited circumstances provided for by Luxembourg law. If such quorum is not reached, the extraordinary general meeting of shareholders may be reconvened, pursuant to appropriate notification procedures, at a later date with no quorum requirement applying.
Irrespective of whether the proposed actions described in the preceding paragraph will be subject to a vote at the first or a subsequent extraordinary general meeting of shareholders, such actions are generally subject to the approval of at least two-thirds of the votes validly cast at such extraordinary general meeting of shareholders (except in limited circumstances provided for by Luxembourg law). Abstentions are not considered “votes”.
Appointment and Removal of Directors
. Members of the board of directors may be elected by simple majority of the votes validly cast at any general meeting of shareholders. Under the articles of incorporation, all directors are elected for a period of up to three years with such possible extension as provided therein provided however the directors shall be elected on a staggered basis, with one third (1/3) of the directors being elected each year and provided further that such three year term may be exceeded by a period up to the annual general meeting held following the third anniversary of the appointment. Any director may be removed with or without cause by a simple majority vote at any general meeting of shareholders. The articles of incorporation provide that in case of a vacancy the board of directors may co-opt a director.
Neither Luxembourg law nor our articles of incorporation contain any restrictions as to the voting of our shares by non-Luxembourg residents.
Amendment to the Articles of Incorporation
Luxembourg law requires an extraordinary general meeting of shareholders to resolve upon an amendment to the articles of incorporation. The agenda of the extraordinary general meeting of shareholders must indicate the proposed amendments to the articles of incorporation.
An extraordinary general meeting of shareholders convened for the purpose of amending the articles of incorporation must generally have a quorum of at least 50% of our issued share capital. If such quorum is not reached, the extraordinary general meeting of shareholders may be reconvened at a later date with no quorum according to the appropriate notification procedures. Irrespective of whether the proposed amendment will be subject to a vote at the first or a subsequent extraordinary general meeting of shareholders, the amendment is generally subject to the approval of at least two-thirds of the votes cast at such extraordinary general meeting of shareholders.
Any resolutions to amend the articles of incorporation must be taken before a Luxembourg notary and such amendments must be published in accordance with Luxembourg law.
Merger and Division
A merger by absorption whereby a Luxembourg company, after its dissolution without liquidation transfers to another company all of its assets and liabilities in exchange for the issuance to the shareholders of the company being acquired of shares in the acquiring company, or a merger effected by transfer of assets to a newly incorporated company, must, in principle, be approved by an extraordinary general meeting of shareholders of the Luxembourg company to be held before a notary. Similarly the de-merger of a Luxembourg company is generally subject to the approval by an extraordinary general meeting of shareholders.
Liquidation
In the event of the liquidation, dissolution or winding-up of Adecoagro, the assets remaining after allowing for the payment of all liabilities will be paid out to the shareholders pro rata to their respective shareholdings. The decision to voluntarily liquidate,
143
dissolve or wind-up require the approval by an extraordinary general meeting of shareholders of the Company to be held before a notary.
No Appraisal Rights
Neither Luxembourg law nor our articles of incorporation provide for any appraisal rights of dissenting shareholders.
Distributions
Subject to Luxembourg law, each share is entitled to participate equally in distributions if and when if declared by the general meeting of shareholders out of funds legally available for such purposes. Pursuant to the articles of incorporation, the general meeting of shareholders may approve distributions and the board of directors may declare interim distribution, to the extent permitted by Luxembourg law.
Declared and unpaid distributions held by us for the account of the shareholders shall not bear interest. Under Luxembourg law, claims for unpaid distributions will lapse in our favor five years after the date such distribution has been declared.
Annual Accounts
Each year the board of directors must prepare annual accounts, that is, an inventory of the assets and liabilities of Adecoagro together with a balance sheet and a profit and loss account. The board of directors must also prepare, each year, consolidated accounts and management reports on the annual accounts and consolidated accounts. The annual accounts, the consolidated accounts, the management report and the auditor’s reports must be available for inspection by shareholders at the registered office of Adecoagro at least 8 calendar days prior to the date of the annual general meeting of shareholders.
The annual accounts and the consolidated accounts, after approval by the annual general meeting of shareholders, will need to be filed with the Luxembourg registry of trade and companies within one month after the approval and no more than seven months after the close of the financial year.
Information Rights
Luxembourg law gives shareholders limited rights to inspect certain corporate records 8 calendar days prior to the date of the annual general meeting of shareholders, including the annual accounts with the list of directors and auditors, the consolidated accounts, the notes to the annual accounts and the consolidated accounts, a list of shareholders whose shares are not fully paid-up, the management reports, the auditor’s report and in case of amendments to the articles, the text of the proposed amendments and the draft of the resulting consolidated articles.
Any registered shareholder is entitled to receive a copy of the annual accounts, the consolidated accounts, the auditor’s reports and the management reports free of charge 8 calendar days prior to the date of the annual general meeting of shareholders upon request.
Under Luxembourg law, it is generally accepted that a shareholder has the right to receive responses to questions concerning items on the agenda for a general meeting of shareholders, if such responses are necessary or useful for a shareholder to make an informed decision concerning such agenda item, unless a response to such questions could be detrimental to our interests.
One or more shareholders representing at least 10% of the share capital or 10% of the votes attached to all existing securities may ask the board of directors written questions on one or more management operations (opérations de gestion) of the company and, as the case may be, of subsidiaries it controls. In the latter case, the request must be assessed in view of the interest of the companies included within the consolidation. In the absence of response within a period of one month, these shareholders may apply to the court for the appointment of experts instructed to submit a report on the management operations targeted in the question.
Board of Directors
The management of Adecoagro is vested in a board of directors. Our articles of incorporation provide that the board must comprise at least three members and no more than eleven members. The number of directors is determined and the directors are appointed at the general meeting of shareholders (except in case of a vacancy in the office of a director because of death, retirement, resignation, dismissal, removal or otherwise, the remaining directors may fill such vacancy and appoint a successor in accordance with applicable Luxembourg law).
144
The directors are appointed for a period of up to three years; provided however the directors shall be elected on a staggered basis, with one-third of the directors being elected each year and provided further that such three year term may be exceeded by a period up to the annual general meeting held following the third anniversary of the appointment. Directors may be removed with or without cause (
ad nutum
) by the general meeting of shareholders by a simple majority of votes cast at a general meeting of shareholders. The directors shall be eligible for re-election indefinitely. The general shareholders’ meeting may dismiss one or more directors at any time, with or without cause by a resolution passed by simple majority vote, irrespective of the number of shares present at such general shareholders’ meeting.
Currently our board has 9 members (see “Item 6. Directors, Senior Management and Employees—A. Directors and Senior Management—Board of Directors”). The board meets as often as required by our interests.
A majority of the members of the board in office (and able to vote) present or represented at a board meeting constitutes a quorum, and resolutions are adopted by the simple majority vote of the board members present or represented (and able to vote). The board may also take decisions by means of resolutions in writing signed by all directors.
Our board may delegate the daily management of the business of Adecoagro, as well as the power to represent Adecoagro in its day to day business, to individual directors or other officers or agents of the Company (with power to sub-delegate). In addition the board of directors may delegate the daily management of the business of Adecoagro, as well as the power to represent Adecoagro in its day to day business to an executive or other committee as it deems fit. The board of directors shall determine the conditions of appointment and dismissal as well as the remuneration and powers of any person or persons so appointed.
Currently the board of directors has appointed the officers listed under “Item 6. Directors, Senior Management and Employees—A. Directors and Senior Management.”
The board of directors may (but shall not be obliged to unless required by law) establish one or more committees (including without limitation an audit committee, a risk and commercial committee, a strategy committee and a compensation committee) and for which it shall, if one or more of such committees are set up, appoint the members (who may be but do not need to be board members), determine the purpose, powers and authorities as well as the procedures and such other rules as may be applicable thereto (subject as to the audit committee as set forth therein).
Currently our board has set up an audit committee. See “Item 6. Directors, Senior Management and Employees—C. Board Practices.” Our board has set up a compensation committee. See “Item 6. Directors, Senior Management and Employees—C. Board Practices.” Our board has set up a risk and commercial committee. See “Item 6. Directors, Senior Management and Employees—C. Board Practices.” Our board has set up a strategy committee. See “Item 6. Directors, Senior Management and Employees—C. Board Practices.”
No director or member of any committee shall, solely as a result of being a director, be prevented from contracting with us, either with regard to his tenure of any office or place of profit or as vendor, purchaser or in any other manner whatsoever, nor shall any contract in which any director or member of any committee is in any way interested be liable to be avoided, in account of his position as director or member of any committee nor shall any director or member of any committee who is so interested be liable to account for us or the shareholders for any remuneration, profit or other benefit realized by the contract by reason of the director or member of any committee holding that office or of the fiduciary relationship thereby established.
Any director or, as the case may be, member of any committee having a direct or indirect interest in a transaction conflicting with our interest, which has to be considered by the board of directors or the relevant committee, as the case may be, shall be obliged to advise the board or the committee thereof and to cause a record of his statement to be included in the minutes of the meeting. He may not take part in these deliberations nor in the vote of the resolution. At the next following general meeting or board of directors’ meeting, before any resolution is put to vote, a special report shall be made on any transactions in which any of the directors or members of any committee may have had an interest conflicting with our interest.
No shareholding qualification for directors is required.
Directors and other officers, past and present, are entitled to indemnification from us to the fullest extent permitted by law against liability and all expenses reasonably incurred by him in connection with any claim, action, suit or proceeding in which he is involved by virtue of his being or having been a director. We may purchase and maintain for any director or other officer insurance against any such liability.
No indemnification shall be provided against any liability to us or our shareholders by reason of willful misfeasance, bad faith, gross negligence or reckless disregard of the duties involved in the conduct of his office. No indemnification will be provided
145
in the event of a settlement (unless approved by a court of competent jurisdiction or the board), nor will indemnification be provided in proceedings in which that director or officer has been finally adjudicated to have acted in bad faith and not in the interest of the Company.
Transfer Agent and Registrar
The transfer agent and registrar for our common shares is Computershare. The holders of our shares may elect to be entered in one of the registers and to be transferred from time to time from one register to another register provided that our board of directors may however impose transfer restrictions for shares that are registered, listed, quoted, dealt in, or have been placed in certain jurisdictions in compliance with the requirements applicable therein. The transfer to the register kept in Luxembourg may always be requested by a shareholder.
C.
MATERIAL CONTRACTS
See “Item 4. Information on the Company—B. Business Overview.”
D.
EXCHANGE CONTROLS
In 1991, the Argentine Convertibility Law established a fixed exchange rate according to which the Argentine Central Bank was statutorily obliged to sell U.S. dollars to any individual at a fixed exchange rate of Ps.1.00 per $1.00. In 2001 Argentina experienced a period of severe political, economic and social crisis, and on January 6, 2002, the Argentine congress enacted the Public Emergency Law abandoning more than ten years of fixed Peso-U.S. dollar parity. After devaluing the Peso and setting the official exchange rate at Ps.1.40 per $1.00, on February 11, 2002, the Argentine government allowed the Peso to float. The shortage of U.S. dollars and their heightened demand caused the Peso to further devaluate significantly in the first half of 2002. The Argentine Central Bank may indirectly affect this market through its active participation. Due to the deterioration of the economic and financial situation in Argentina during 2001 and 2002, in addition to the abandonment of the Peso-U.S. dollar parity, the Argentine government established a number of monetary and currency exchange control measures, including a partial freeze on bank deposits, the suspension on payments of its sovereign foreign debt, restrictions on the transfer of funds out of, or into, Argentina, and the creation of the Single Free Foreign Exchange Market (“
Mercado Único y Libre de Cambios
”, or the “FX Market”) through which all purchases and sales of foreign currency must be made. Although since 2003 these restrictions have been progressively eased to some extent, as a consequence of the increase of the demand in Argentina for U.S. dollars and the capital flow out of Argentina, the Argentine government imposed during 2011 some additional restrictions on the transfer of funds from Argentina and reduced the time required to comply with the mandatory transfer of funds into Argentina.
Most foreign exchange restrictions and restrictions on transfer of funds into and out of Argentina that had been enacted since 2011, were lifted by the Macri administration in December 2016, reestablishing Argentine residents’ rights to purchase and remit outside of Argentina foreign currency with no maximum amount and without specific allocation or prior approval.
In December 2015, in line with the economic reforms implemented by the new administration, the Argentine Ministry of Treasury issued Resolution No. 3/2015 which eliminated the requirement to maintain a registered, non-transferable and non-interest bearing deposit by reducing the amount of the deposit from 30% to 0%. Consequently, such deposit is no longer applicable to, among other transactions, foreign financial debts, inflows of funds of non-residents and repatriations by residents. In addition, pursuant to Resolution No. 1-E/2017 dated January 5, 2017, the minimum period of time (120 days) that proceeds from new financial indebtedness (incurred by residents granted by foreign creditors) and portfolio investments of non residents were required to remain in Argentina pursuant to Resolution No. 3/2015 was reduced to zero. The Argentine Ministry of Treasury is entitled to modify the percentage of and period that funds must be kept in Argentina when a change in the macroeconomic situation so requires.
In addition, on August 8, 2016, the Argentine Central Bank issued Communication “A” 6037, which repealed most of the restrictions to purchase currency and those relating to the inflow and outflow of funds into and from Argentina (except for the obligation of Argentine exporters of goods and services to repatriate to the FX Market foreign currency proceeds from exportation transactions, such as receivables relating to the exportation of goods, which shall also be settled through the foreign exchange market).
Furthermore, on May 19, 2017, the Central Bank issued Communication ‘‘A’’ 6244, which entered into effect on July 1, 2017 and was amended by Communication ‘‘A’’ 6312 dated August 30, 2017, and pursuant to which new regulations regarding access to the foreign exchange market were established, essentially abrogating all prior regulations on the matter. Pursuant to these regulations:
146
The principle of a free foreign exchange market is established.
The obligation to carry out any exchange operation through an authorized entity is maintained.
The restrictions regarding hours to operate in the MULC are eliminated.
The obligation of Argentine residents to comply with the ‘‘Survey of foreign assets and liabilities’’ (Communication ‘‘A’’ 6401) is maintained and in force, even if there had been no inflow of funds to the MULC and/or no future access to it for the operations to be declared.
On November 1, 2017, the Argentine executive branch issued Decree No. 893/2017 (complemented by Communication ‘‘A’’ 6363 of the Central Bank dated November 10, 2017) pursuant to which foreign exchange restrictions related to exports of goods and services that continued to be in place (Mercado Único y Libre de Cambios) were eliminated, including the obligation of Argentine residents to transfer to Argentina and sell in the FX Market the proceeds of their exports of goods within the applicable deadline.
For additional information regarding all current foreign exchange restrictions and exchange control regulations in Argentina, investors should consult their legal advisors and read the applicable rules mentioned herein, as well as any amendments and complementary regulations, which are available at the Argentine Ministry of Treasury’s website: www.economia.gob.ar, or the Argentine Central Bank’s website: www.bcra.gob.ar.
E.
TAXATION
MATERIAL LUXEMBOURG TAX CONSIDERATIONS FOR HOLDERS OF COMMON SHARES
The following is a summary discussion of certain Luxembourg tax considerations of the acquisition, ownership and disposition of your shares that may be applicable to you if you acquire our shares. This does not purport to be a comprehensive description of all of the tax considerations that may be relevant to any of the Company’s common shares, and does not purport to include tax considerations that arise from rules of general application or that are generally assumed to be known to holders. This discussion is not a complete analysis or listing of all of the possible tax consequences of such transactions and does not address all tax considerations that might be relevant to particular holders in light of their personal circumstances or to persons that are subject to special tax rules.
It is not intended to be, nor should it be construed to be, legal or tax advice. This discussion is based on Luxembourg laws and regulations as they stand on the date of this annual report and is subject to any change in law or regulations or changes in interpretation or application thereof (and which may possibly have a retroactive effect). Prospective investors should therefore consult their own professional advisers as to the effects of state, local or foreign laws and regulations, including Luxembourg tax law and regulations, to which they may be subject.
As used herein, a “Luxembourg individual” means an individual resident in Luxembourg who is subject to personal income tax (impôt sur le revenu) on his or her worldwide income from Luxembourg or foreign sources, and a “Luxembourg corporate holder” means a company (that is, a fully taxable entity within the meaning of Article 159 of the Luxembourg Income Tax Law) resident in Luxembourg subject to corporate income tax (impôt sur le revenu des collectivités) on its worldwide income from Luxembourg or foreign sources. For purposes of this summary, Luxembourg individuals and Luxembourg corporate holders are collectively referred to as “Luxembourg Holders”. A “non-Luxembourg Holder” means any investor in shares of Adecoagro other than a Luxembourg Holder.
Tax regime applicable to realized capital gains
Luxembourg Holders
Luxembourg resident individual holders
Capital gains realized by Luxembourg resident individuals who do not hold their shares as part of a commercial or industrial business and who hold no more than 10% of the share capital of the Company will only be taxable if they are realized on a sale of shares that takes place before their acquisition or within the first six months following their acquisition.
Luxembourg resident corporate holders
147
Capital gains realized upon the disposal of shares by a fully taxable resident corporate holder will in principle be subject to corporate income tax and municipal business tax. The combined applicable rate (including an unemployment fund contribution) is 26.01% for the fiscal year ending 2018 for a corporate holder established in Luxembourg-City. An exemption from such taxes may be available to the holder pursuant to article 166 of the Luxembourg Income Tax Law subject to the fulfilment of the conditions set forth therein. The scope of the capital gains exemption can be limited in the cases provided by the Grand Ducal Decree of December 21, 2001.
Non-Luxembourg Holders
An individual who is a non-Luxembourg Holder of shares (and who does not have a permanent establishment, a permanent representative or a fixed place of business in Luxembourg) will only be subject to Luxembourg taxation on capital gains arising upon disposal of such shares if such holder has (together with his or her spouse and underage children) directly or indirectly held more than 10% of the capital of Adecoagro at any time during the past five years, and either (i) such holder has been a resident of Luxembourg for tax purposes for at least 15 years and has become a non-resident within the last five years preceding the realization of the gain, subject to any applicable tax treaty, or (ii) the disposal of shares occurs within six months from their acquisition (or prior to their actual acquisition), subject to any applicable tax treaty.
A corporate non-Luxembourg Holder (that is, an entity within the meaning of Article 159 of the Luxembourg Income Tax Law), which has a permanent establishment, a permanent representative or a fixed place of business in Luxembourg to which shares are attributable, will bear corporate income tax and municipal business tax on a gain realized on a disposal of such shares as set forth above for a Luxembourg corporate holder. However, gains realized on the sale of the shares may benefit from the full exemption provided for by Article 166 of the Luxembourg Income Tax Law and by the Grand Ducal Decree of December 21, 2001 subject in each case to fulfillment of the conditions set out therein.
A corporate non-Luxembourg Holder, which has no permanent establishment in Luxembourg to which the shares are attributable, will bear corporate income tax on a gain realized on a disposal of such shares under the same conditions applicable to an individual non-Luxembourg Holder, as set out above. In principle a corporate non-Luxembourg holders is only subject to taxation under (ii) above and not to taxation under (i) above. This result obtains from the provision that when a corporate Luxembourg holder migrates abroad and becomes a corporate non-Luxembourg holders, at that moment in time such holder is deemed liquidated for Luxembourg tax purposes and taxation applies at the moment in time.
Tax regime applicable to distributions
Withholding tax
Distributions imputed for tax purposes on newly accumulated profits are subject to a withholding tax of 15%. The rate of the withholding tax may be reduced pursuant to double tax avoidance treaty existing between Luxembourg and the country of residence of the relevant holder, subject to the fulfilment of the conditions set forth therein.
No withholding tax applies if the distribution is made to (i) a Luxembourg resident corporate holder (that is, a fully taxable entity within the meaning of Article 159 of the Luxembourg Income Tax Law), (ii) an undertaking of collective character which is resident of a Member State of the European Union and is referred to by article 2 of the Council Directive of 2011/96 concerning the common fiscal regime applicable to parent and subsidiary companies of different member states of November 20, 2011 (the "Parent Subsidiary Directive"), (iii) a corporation or a cooperative company resident in Norway, Iceland or Liechtenstein and subject to a tax comparable to corporate income tax as provided by the Luxembourg Income Tax Law, (iv) an undertaking with a collective character subject to a tax comparable to corporate income tax as provided by the Luxembourg Income Tax Law which is resident in a country that has concluded a tax treaty with Luxembourg, (v) a Luxembourg permanent establishment of one of the afore-mentioned categories and (vi) a corporation company resident in Switzerland which is subject to corporate income tax in Switzerland without benefiting from an exemption, provided that at the date of payment, the holder holds or commits to hold directly or through a tax transparent vehicle, during an uninterrupted period of at least twelve months, shares representing at least 10% of the share capital of Adecoagro or acquired for an acquisition price of at least EUR 1,200,000, and provided that the dividend recipient is not excluded to benefit from the Parent Subsidiary Directive under its mandatory general anti-avoidance rule, as implemented in Luxembourg.
Luxembourg Holders
With the exception of a Luxembourg corporate holders benefitting from the exemption referred to above, Luxembourg individual holders, and Luxembourg corporate holders subject to Luxembourg corporation taxes, must include the distributions
148
paid on the shares in their taxable income, 50% of the amount of such dividends being exempted from tax. The applicable withholding tax can, under certain conditions, entitle the relevant Luxembourg Holder to a tax credit.
Net wealth tax
Luxembourg Holders
Luxembourg net wealth tax will not be levied on a Luxembourg Holder with respect to the shares held unless (i) the Luxembourg Holder is a legal entity subject to net wealth tax in Luxembourg; or (ii) the shares are attributable to an enterprise or part thereof which is carried on through a permanent establishment, a fixed place of business or a permanent representative in Luxembourg.
Net wealth tax is levied annually at the rate depending on the amount the net wealth of enterprises resident in Luxembourg or, a reduced rate of 0.05% for the portion of the net wealth exceeding EUR 500 million, as determined for net wealth tax purposes (i.e. 0.5% on an amount up to EUR 500 million and 0.05% on the amount of taxable net wealth exceeding EUR 500 million). The shares may be exempt from net wealth tax subject to the conditions set forth by Paragraph 60 of the Law of October 16, 1934 on the valuation of assets (
Bewertungsgesetz
), as amended.
Non-Luxembourg Holders
Luxembourg net wealth tax will not be levied on a non-Luxembourg Holder with respect to the shares held unless the shares are attributable to an enterprise or part thereof which is carried on through a permanent establishment or a permanent representative in Luxembourg.
United States Federal Income Taxation of the Company
Our business assets and properties are located, and all of our employees and executives are based outside the United States. Our business is directly conducted through operating companies organized under the laws of countries other than the United States. These non-U.S. operating companies are indirectly owned by Adecoagro LP SCS, a holding company which is a societe commandite simple organized under the laws of Luxembourg. As a partnership that is not engaged in a trade or business within the United States within the meaning of section 864 of the Internal Revenue Code, Adecoagro LP SCS is not itself subject to U.S. federal net income taxes. We acquired approximately 98 percent of Adecoagro LP SCS, predecessor company, IFH, prior to undertaking the IPO in exchange for our stock.
Under rules to prevent expatriation of and by U.S. corporations and certain U.S. partnerships under Code section 7874(b), we would be treated as a U.S. domestic corporation if for this purpose (i) we were deemed to have acquired substantially all of the assets constituting the trade or business of a U.S. domestic partnership and (ii) former members of IFH were deemed to own at least 80% of our stock by reason of the transfer of those trade or business assets (ignoring stock issued in the IPO for purposes of the 80% threshold) and (iii) we were found not to conduct substantial business activities in Luxembourg. In that event, we would be subject to U.S. federal net income tax on our worldwide income and dividends we pay to non-U.S. shareholders would be subject to U.S. federal withholding tax at a 30% rate (subject to reduction, to the extent the beneficial owner of the dividend is entitled to claim a reduced rate of withholding under an applicable income tax treaty).
We believe that the restructuring transactions executed prior to or in connection with the IPO should not be subject to section 7874(b). Accordingly, we do not believe that we will be subject to U.S. federal income tax on our worldwide income nor do we anticipate paying dividends subject to U.S. federal withholding tax. However, the relevant rules are unclear in certain respects and there is limited guidance on the application of the rules to acquisitions of partnerships or partnership assets constituting a trade or business. Accordingly, we cannot assure you that the IRS will not seek to assert that we are a U.S. domestic corporation, which assertion if successful could materially increase our U.S. federal income tax liability. Prospective holders who are non-United States persons should also note that, in that event, we would be required to withhold tax from any dividends we pay to non-U.S. Holders (subject to any applicable income tax treaties applicable to those non-U.S. Holders).
Shareholders are urged to consult their own tax advisors about the possible application of section 7874. The remainder of this discussion assumes that we are not treated as a U.S. corporation for U.S. federal income tax purposes.
Material U.S. Federal Income Tax Considerations for U.S. Holders
149
The following is a discussion of the material U.S. federal income tax considerations relating to the purchase, ownership and disposition of our common shares. This discussion applies only to beneficial owners of common shares that are “U.S. Holders” (as defined below), who have purchased our common shares in the open market and that hold our common shares as “capital assets” for U.S. federal income tax purposes (generally, property held for investment). This discussion is based on the U.S. Internal Revenue Code of 1986, as amended, (the “Code”), its legislative history, final, temporary and proposed Treasury regulations, administrative pronouncements and judicial decisions, all as of the date hereof, and all of which are subject to change and to differing interpretations (possibly with retroactive effect). No ruling has been sought from the IRS with respect to any U.S. federal income tax consequences described below, and there can be no assurance that the IRS or a court will not take a contrary position.
This discussion does not address all U.S. federal income tax considerations that may be relevant to a particular holder based on its particular circumstances with respect to the acquisition, ownership and disposition of our common shares, and you are urged to consult your own tax advisor regarding your specific tax situation, including the potential impact of recently enacted legislation (P.L. 115-97) commonly referred to as the Tax Cut and Jobs Act (the “Act”). For example, the discussion does not address the tax considerations that may be relevant to U.S. Holders in special tax situations, such as:
|
•
|
insurance companies;
|
|
•
|
tax-exempt organizations (including private foundations);
|
|
•
|
brokers or dealers in securities or currencies and traders in securities that elect to mark to market;
|
|
•
|
banks and financial institutions;
|
|
•
|
partnerships or other pass-through entities (or a person holding our common shares through a partnership or other pass-through entity or arrangement treated as such);
|
|
•
|
real estate investment trusts and regulated investment companies;
|
|
•
|
companies that accumulate earnings to avoid U.S. federal income tax;
|
|
•
|
persons who acquire common shares through the exercise of employee share options or other compensation: arrangements;
|
|
•
|
persons liable for alternative minimum tax;
|
|
•
|
S corporations;
|
|
•
|
accrual-method taxpayers subject to special tax accounting rules under Section 451(b) of the Code;
|
|
•
|
holders whose functional currency for U.S. federal income tax purposes is not the U.S. dollar or that hold shares through non-U.S. brokers of other non-U.S. intermediaries;
|
|
•
|
certain former U.S. citizens or residents or U.S. expatriates;
|
|
•
|
holders that hold our common shares as part of a hedge, straddle or conversion or other integrated transaction;
|
|
•
|
holders that purchase or sell our common shares as part of a wash sale for U.S. federal income tax purposes; or
|
|
•
|
holders that own, directly, indirectly, or constructively, 10% or more of the total combined voting power or value of our common shares.
|
This discussion does not address the alternative minimum tax consequences of owning common shares or the indirect consequences to holders of equity interests in partnerships or other entities that own our common shares. Moreover, this discussion does not address the state, local and foreign tax consequences of acquiring, owning, or disposing of our common shares, or any aspect of U.S. federal tax law (such as the estate, generation-skipping and gift tax) other than U.S. federal income taxation.
You are a “U.S. Holder” if you are a beneficial owner of our common shares and you are, for U.S. federal income tax purposes:
|
•
|
an individual who is a citizen or resident of the United States;
|
|
•
|
a corporation, or any other entity taxable as a corporation, created or organized in or under the laws of the United States or any State thereof, including the District of Columbia;
|
|
•
|
an estate, the income of which is subject to U.S. federal income taxation regardless of its source; or
|
150
|
•
|
a trust (a) if a court within the United States is able to exercise primary supervision over its administration and one or more U.S. persons have the authority to control all of its substantial decisions or (b) that has a valid election in effect under applicable Treasury regulations to be treated as a U.S. person for U.S. federal income tax purposes.
|
If a partnership (or an entity or arrangement treated as a partnership for U.S. federal income tax purposes) owns our common shares, the tax treatment of a partner will generally depend upon the status of the partner and upon the activities of the partnership. A partnership that owns our common shares, and partners in such a partnership, should consult their own tax advisors, including the potential impact of the Act.
Passive Foreign Investment Company (“PFIC”) Rules
U.S. Holders generally will be subject to a special, generally adverse tax regime that would differ in certain material respects from the tax treatment described below if we are, or were to become, a PFIC for U.S. federal income tax purposes.
In general, we will be a PFIC with respect to a U.S. Holder if, for any taxable year in which the U.S. Holder held our common shares, either (i) at least 75% of our gross income for the taxable year is passive income or (ii) at least 50% of the value (determined on the basis of a quarterly average) of our assets during such taxable year is attributable to assets that produce or are held for the production of passive income. For this purpose, “passive income” generally includes, among other things and subject to certain exceptions, dividends, interest, royalties, rents, annuities, gains from commodities and securities transactions, net foreign currency gains and net gains from assets that produce passive income. If a foreign corporation owns at least 25% by value of the stock of another corporation, the foreign corporation is treated for purposes of the PFIC tests as owning its proportionate share of the assets of the other corporation, and as receiving directly its proportionate share of the other corporation’s income.
If we were to be treated as a PFIC, gain realized on the sale or other disposition of your common shares would in general not be treated as capital gain that is eligible for preferential tax rates in the case of individual, trust or estate U.S. Holders. Instead, if you are a U.S. Holder, unless you make a timely “mark-to-market” election electing to be taxed annually on a mark-to-market basis with respect to your common shares, or you make a timely “qualified electing fund” election electing to be taxed annually on the earnings and gains of the PFIC attributable to your common shares (irrespective of distributions), you would be treated as if you had realized such gain ratably over your holding period in the common shares and would be taxed at the highest tax rate in effect for each such year to which the gain was allocated, together with an interest charge in respect of the tax attributable to each such year except for the current year. In addition, unless you make a timely “mark-to-market” election or “qualified electing fund” election, distributions that you receive from us as a direct or indirect U.S. Holder will not be eligible for the preferential tax rates applicable to qualified dividend income if we are treated as a PFIC with respect to you either in the taxable year of the distribution or the preceding taxable year, but instead will be taxable at the tax rates applicable to ordinary income, and to the extent they are treated as “excess distributions” under the PFIC rules, they will also be subject to the PFIC interest charge described above. A U.S. Holder will be required to make an annual filing with the IRS if such holder holds common shares in any year in which we are classified as a PFIC. With certain exceptions, your common shares will continue to be treated as stock in a PFIC if we were a PFIC at any time during your holding period in your common shares even if we no longer meet the PFIC tests in a later year.
Although the determination of whether a corporation is a PFIC is made annually, and thus may be subject to change, we do not believe that we were a PFIC for U.S. federal income tax purposes for our most recently completed taxable year, nor that we will be one for our current taxable year. The U.S. federal income tax rules relating to PFICs are complex. Prospective U.S. investors are urged to consult their own tax advisers with respect to the application of the PFIC rules to their investment in our common shares. The remainder of this discussion assumes that we are not a PFIC.
Taxation of Dividends
Under the U.S. federal income tax laws, and subject to the PFIC rules discussed above, distributions with respect to our common shares (other than certain pro rata distributions of common shares) made to U.S. Holders will, to the extent made from our current or accumulated earnings and profits, as determined under U.S. federal income tax principles, constitute dividends for U.S. federal income tax purposes that are taxable to the U.S. Holder. Distributions in excess of our current and accumulated earnings and profits, as determined under U.S. federal income tax principles, will be treated as a non-taxable return of capital to the extent of the U.S. Holder’s adjusted tax basis in the common shares and thereafter as capital gain from the sale or exchange of the common shares. We do not currently maintain calculations of our earnings and profits under U.S. federal income tax principles. Unless and until these calculations are made, distributions should be presumed to be taxable dividends for U.S. federal
151
income tax purposes. As used below, the term “dividend” means a distribution that constitutes a dividend for U.S. federal income tax purposes.
Dividends (including amounts withheld on account of foreign taxes) paid with respect to our common shares generally will be includible in the gross income of a U.S. Holder as ordinary income on the day on which the dividends are actually or constructively received by the U.S. Holder. Dividends with respect to our common shares will not be eligible for the dividends received deduction allowed to U.S. corporations in respect of dividends received from other U.S. corporations or certain foreign corporations.
If you are an individual, trust or estate U.S. Holder, dividends paid on the common shares that constitute “qualified dividend income” will be taxable to you at the preferential rates of taxation applicable to long-term capital gains. Dividends paid on our common shares will be treated as “qualified dividend income” if:
|
•
|
the common shares are readily tradable on an established securities market in the United States or (b) we are eligible for benefits of the income tax treaty between Luxembourg and the United States (the “Treaty”);
|
|
•
|
we are not, in the year prior to the year in which the dividend was paid, and are not, in the year in which the dividend is paid, a PFIC;
|
|
•
|
the U.S. Holder holds the common shares for more than 60 days during the 121-day period beginning 60 days before the ex-dividend date and meet other holding period requirements;
|
|
•
|
the U.S. Holder is not under an obligation to make related payments with respect to positions in substantially similar or related property.
|
We believe that our common shares should not be treated as stock of a PFIC for U.S. federal income tax purposes. See “-Passive Foreign Investment Company (“PFIC”) Rules” above.
As our common shares are listed on the New York Stock Exchange and should qualify as readily tradable on an established securities market in the United States so long as they are so listed, we believe dividends paid by us on our common shares will be qualified dividend income (provided the other conditions listed above are met). There can, however, be no assurance that our common shares will be considered readily tradable on an established securities market in the future. However, even if our common shares are not considered readily tradeable on an established securities market in the United States, as long as we are eligible for benefits of the Treaty, dividends paid by us will be qualified dividend income (provided the other conditions listed above are met). U.S. Holders should consult their own tax advisors regarding the availability of the preferential rates of taxation with respect to dividends in light of their own particular situations, including related restrictions and special rules. Corporate U.S. Holders are taxed on dividend income at the U.S. federal corporate income tax rate whether or not the dividend income is qualified dividend income.
The amount of any cash dividend paid in foreign currency will equal the U.S. dollar value of the dividend, calculated by reference to the exchange rate in effect on the date the distribution is includible in the gross income of the U.S. Holder, regardless of whether the payment is in fact converted to U.S. dollars at that time. A U.S. Holder should not recognize any foreign currency gain or loss in respect of such dividend distribution if such foreign currency is converted into U.S. dollars on the date the dividend distribution is includible in the U.S. Holder’s gross income. If the foreign currency is not converted into U.S. dollars on the date the dividend distribution is includible in the U.S. Holders gross income, however, gain or loss may be recognized upon a subsequent conversion of the foreign currency to U.S. dollars. Such foreign currency gain or loss, if any, generally will be U.S.-source ordinary income or loss and will not be eligible for the preferential tax rate applicable to qualified dividend income. The amount of any distribution of property other than cash will be the fair market value of such property on the date of distribution.
Dividends received by U.S. Holders will constitute foreign-source income and will, depending on the U.S. Holder's circumstances, generally be “passive” or “general” or "foreign branch" income for U.S. foreign tax credit purposes. Subject to limitations under U.S. federal income tax law concerning credits or deductions for foreign taxes and certain exceptions for short-term and hedged positions, a Luxembourg withholding tax imposed on dividends described above under “Material Luxembourg Tax Considerations for Holders of Shares-Tax regime applicable to distributions-Withholding tax” should be treated as a foreign income tax eligible for credit against a U.S. Holder’s U.S. federal income tax liability (or at a U.S. Holder’s election, may be deducted in computing taxable income if the U.S. Holder has elected to deduct all foreign income taxes for the taxable year). To the extent a refund of the tax withheld is available to a U.S. Holder under Luxembourg law or under the Treaty, the amount of tax withheld that is refundable will not be eligible for credit against the U.S. Holder’s U.S. federal income tax liability. Special limitations on foreign tax credits apply to dividends subject to the preferential U.S. federal income tax rate of taxation for qualified dividend income. The rules with respect to foreign tax credits and deductions are complex, and U.S. Holders are urged to consult
152
their independent tax advisors regarding the availability of the foreign tax credit under their particular circumstances, including the effects of the Treaty.
Taxation of Capital Gains
Subject to the PFIC rules discussed above, gain or loss realized by a U.S. Holder on the sale, exchange or other taxable disposition of common shares will be subject to U.S. federal income taxation as capital gain or loss in an amount equal to the difference between the U.S. dollar value of the amount realized (including the gross amount of the proceeds before the deduction of any foreign tax) on the sale or other taxable disposition and such U.S. Holder’s adjusted tax basis, determined in U.S. dollars, in the common shares. Capital gains of individual, trust or estate U.S. Holders derived with respect to capital assets held for more than one year generally are eligible for the preferential rates of taxation applicable to long-term capital gains. The deductibility of capital losses is subject to limitations under the Code.
Capital gain or loss, if any, realized by a U.S. Holder on the sale, exchange or other taxable disposition of a common share generally will be treated as U.S.-source income or loss for U.S. foreign tax credit purposes. Consequently, in the case of a disposition of a common share that is subject to Luxembourg or other foreign income tax imposed on the gain, the U.S. Holder may not be able to use such foreign taxes as a foreign tax credit against their U.S. federal income tax liability on such disposition (i.e., because the income or loss on the disposition would be U.S.-source) but may apply such foreign taxes as a foreign tax credit against U.S. federal income tax due on other income the U.S. Holder may have that is treated as derived from foreign sources in the appropriate foreign tax credit limitation category. Alternatively, the U.S. Holder may take a deduction for the foreign income tax if such holder does not take a credit for any foreign income tax during the taxable year.
If the consideration received for our common shares is paid in foreign currency, the amount realized will be the U.S. dollar value of the payment received translated at the spot rate of exchange on the date of disposition. If our common shares are treated as traded on an established securities market and the relevant U.S. Holder is either a cash basis taxpayer or an accrual basis taxpayer who has made a special election (which must be applied consistently from year to year and cannot be changed without the consent of the IRS), such holder will determine the U.S. dollar value of the amount realized in a foreign currency by translating the amount received at the spot rate of exchange on the settlement date of the sale. If our common shares are not treated as traded on an established securities market, or the relevant U.S. Holder is an accrual basis taxpayer that is not eligible to or does not elect to determine the amount realized using the spot rate on the settlement date, such U.S. Holder will recognize foreign currency gain or loss to the extent of any difference between the U.S. dollar amount realized on the date of disposition (as determined above) and the U.S. dollar value of the currency received at the spot rate on the settlement date. A U.S. Holder’s initial tax basis in our common shares will equal the cost of such common shares. If a U.S. Holder used foreign currency to purchase our common shares, the cost of our common shares will be the U.S. dollar value of the foreign currency purchase price on the date of purchase. If our common shares are treated as traded on an established securities market and the relevant U.S. Holder is either a cash basis taxpayer or an accrual basis taxpayer who has made the special election described above, such holder will determine the U.S. dollar value of the cost of such common shares by translating the amount paid at the spot rate of exchange on the settlement date of the purchase.
Net Investment Income Tax
Certain U.S. Holders that are individuals, estates or trusts that do not fall into a special class of trusts that is exempt from such tax will be subject to a 3.8% “net investment income” tax on the lesser of (1) the U.S. Holder’s “net investment income” (or “undistributed net investment income” in the case of an estate or trust) for the relevant taxable year and (2) the excess of the U.S. Holder’s modified adjusted gross income for the taxable year over a certain threshold (which in the case of individuals is between $125,000 and $250,000, depending on the individual’s circumstances). A U.S. Holder’s net investment income generally includes its dividend income and its net gains from the disposition of common shares, unless such dividend income or net gains are derived in the ordinary course of the conduct of a trade or business (other than a trade or business that consists of certain passive or trading activities). Each U.S. Holder that is an individual, estate or trust is urged to consult its tax advisors regarding the applicability of the “net investment income” tax to its income and gains in respect of its investment in the common shares.
Information Reporting and Backup Withholding
In general, dividends on common shares, and payments of the proceeds of a sale, exchange or other taxable disposition of common shares, paid within the U.S. or through certain U.S. related financial intermediaries to a U.S. Holder are subject to information reporting and may be subject to backup withholding unless the holder is an exempt recipient or, in the case of backup withholding, provides an accurate taxpayer identification number and certifies under penalty of perjury that the holder is a U.S. person and is not subject to backup withholding.
153
Backup withholding is not an additional tax. Any amounts withheld under the backup withholding rules generally will be allowed as a refund or a credit against a U.S. Holder’s U.S. federal income tax liability, provided that the required information is timely furnished to the IRS.
Certain U.S. Holders who hold interests in “specified foreign financial assets” (as defined in Section 6038D of the Code) are generally required to file an IRS Form 8938 as part of their U.S. federal income tax returns to report their ownership of such specified foreign financial assets, which may include our common shares, if the total value of those assets exceeds certain thresholds. Financial assets that are held through a U.S. financial institution are not subject to this reporting requirement. Investors who fail to report this required information could become subject to substantial penalties. In addition, in the event a U.S. Holder that is required to file IRS Form 8938 does not file such form, the statute of limitations on the assessment and collection of U.S. federal income taxes of such holder for the related tax year may not close until three years after the date that the required information is filed. U.S. Holders are encouraged to consult with their own tax advisors regarding their tax reporting obligations.
F.
DIVIDENDS AND PAYING AGENTS
Not applicable.
G.
STATEMENT BY EXPERTS
Not applicable.
H.
DOCUMENTS ON DISPLAY
We are required to file annual and special reports and other information with the SEC. You may read and copy any documents filed by the Company at the SEC’s public reference room at 100 F Street, N.E., Room 1580, Washington, D.C. 20549. Please call the SEC at 1-800-SEC-0330 for further information on the public reference room. The SEC also maintains a website at http://www.sec.gov which contains reports and other information regarding registrants that file electronically with the SEC.
I.
SUBSIDIARY INFORMATION
Not applicable.
In the normal course of business, we are exposed to commodity price and interest rate risks, primarily related to our crop production activities and changes in exchange rates and interest rates. We manage our exposure to these risks through the use of various financial instruments, none of which are entered into for trading purposes. We have established policies and procedures governing the use of financial instruments, specifically as they relate to the type and volume of such financial instruments. Our use of financial derivative instruments is associated with our core business and is regulated by internal control policies. For further information on our market risks, please see Note 2 to our Consolidated Financial Statements.
A.
DEBT SECURITIES
Not applicable.
B.
WARRANTS AND RIGHTS
Not applicable.
C.
OTHER SECURITIES
Not applicable.
154
D.
AMERICAN DEPOSITORY SHARES
Not applicable.
155
Not applicable.
Not applicable.
a) Disclosure Controls and Procedures
Our company’s management, with the participation of the Chief Executive Officer and Chief Financial Officer, conducted an evaluation pursuant to Rule 13a-15 promulgated under the Securities Exchange Act of 1934, of the effectiveness of our disclosure controls and procedures as of
December 31, 2018
. There are inherent limitations to the effectiveness of any system of disclosure controls and procedures, including the possibility of human error and the circumvention or overriding of the controls and procedures. Accordingly, even effective disclosure controls and procedures can only provide reasonable assurance of achieving their control objectives. Based on this evaluation, our company’s Chief Executive Officer and Chief Financial Officer concluded that such disclosure controls and procedures were effective as of
December 31, 2018
.
b) Management’s Annual Report on Internal Control over Financial Reporting
The Company’s Management is responsible for establishing and maintaining adequate internal control over financial reporting as defined in Rules 13a-15(f) and 15d-15(f) under the Securities Exchange Act of 1934. The Company’s internal control over financial reporting is a process designed under the supervision of the Company’s Chief Executive Officer and Chief Financial Officer that: (i) pertains to the maintenance of records that, in reasonable detail, accurately and fairly reflect the transactions and dispositions of the Company’s assets; (ii) provides reasonable assurance that transactions are recorded as necessary to permit preparation of financial statements for external reporting in accordance with generally accepted accounting principles, and that receipts and expenditures are being made only in accordance with authorization of the Company’s management and directors; and (iii) provides reasonable assurance regarding prevention or timely detection of unauthorized acquisition, use or disposition of the Company’s assets that could have a material effect on the financial statements.
Because of its inherent limitations, internal control over financial reporting may not prevent or detect misstatements. Also, projections of any evaluation of effectiveness to future periods are subject to the risk that controls may become inadequate because of changes in conditions, or that the degree of compliance with the policies or procedure may deteriorate. The Company, with the participation of its Chief Executive Officer and Chief Financial Officer, has assessed the effectiveness of the Company’s internal control over financial reporting as of
December 31, 2018
.
We assessed the effectiveness of the Company’s internal controls over financial reporting as of
December 31, 2018
. In making this assessment, management used the criteria established in “Internal Control — Integrated Framework (2013)” issued by the Committee of Sponsoring Organizations of the Treadway Commission (“COSO”). As a result of this assessment, the Company’s management has determined that the Company’s internal control over financial reporting was effective as of
December 31, 2018
.
c) Attestation Report of the Registered Public Accounting Firm
The effectiveness of the Company’s internal control over financial reporting as of
December 31, 2018
has been audited by Price Waterhouse & Co S.R.L, an independent registered public accounting firm, our independent auditor, as stated in their report which is included herein at page F-2 of our Consolidated Financial Statements.
d) Changes in internal control over financial reporting
As required by Rule 13a-15(d), under the Exchange Act, our management, including our Chief Executive Officer and Chief Financial Officer, conducted an evaluation of our internal control over financial reporting to determine whether any change occurred during the period covered since the last report that has materially affected, or is reasonably likely to materially affect, our internal control over financial reporting. Based on this evaluation, it has been determined that there has been no change during the period
156
covered by this annual report that has materially affected, or is reasonably likely to materially affect, our internal control over financial reporting.
Item 16.
A.
Audit Committee Financial Expert
Our audit committee consists of three independent directors: Mr. Mark Schachter, Mr. Andrés Velasco Brañes and Mr.
Ivo Sarjanovic
. Our board of directors has determined that Mr. Mark Schachter has the attributes of an “audit committee financial expert” and is independent within the meaning of this Item 16A and satisfies the financial literacy requirements of the NYSE.
B.
Code of Ethics
We have adopted a code of ethics and business conduct that applies to our directors, executive officers and all employees. The text of our code of ethics is posted on our web site at: www.adecoagro.com.
C.
Principal Accountant Fees and Services
The following table sets forth the aggregate fees by categories specified below in connection with certain professional services rendered by Price Waterhouse & Co. S.R.L., a member firm of Price WaterhouseCoopers International Limited Network, an independent registered accounting public firm and our principal external auditors, for the periods indicated. Except as set forth below, we did not pay any other fees to our auditors during the periods indicated below.
|
|
For the year ended
December 31,
|
||||
|
|
(in thousands of $)
|
||||
|
|
2018
|
2017
|
|||
|
Audit Fees
(1)
|
1,282
|
|
1,481
|
|
|
|
Tax fees
(2)
|
—
|
|
38
|
|
|
|
Total
|
1,282
|
|
1,519
|
|
|
|
(1)
|
“Audit fees” means the aggregate fees billed for professional services rendered by our principal auditors for the audit of our consolidated financial statements and internal control over financial reporting of the Company, the statutory financial statements of the Company and its subsidiaries, and any other audit services required for the SEC or other regulatory filings.
|
|
(2)
|
"Tax fees" includes fees for permitted tax compliance and tax advisory services rendered by our principal auditors.
|
During the fiscal year ended
December 31, 2018
and
2017
, no non-audit-related services were provided by our principal auditors.
Audit Committee Approval Policies and Procedures
The Audit Committee has adopted pre-approval policies and procedures requiring that all audit and non-audit services performed by our independent auditors must be pre-approved by the Audit Committee. The Audit Committee annually reviews and pre-approves the services that may be provided by the independent auditors without obtaining specific pre-approval from the Audit Committee. Any service proposals submitted by external auditors that are not pre-approved services need to be discussed and approved by the Audit Committee during its meetings. Once the proposed service is approved, we or our subsidiaries formalize the engagement of services.
The Audit Committee or its Chairman, or any member of the Audit Committee to whom such authority is delegated, may approve in advance any permitted audit or permitted non-audit services and fees up to a predetermined amount. The Audit Committee is authorized to establish other policies and procedures for the pre-approval of such services and fees. The Audit Committee approved all of the non-audit services described above and determined that the provision of such services is compatible with maintaining the independence of Price Waterhouse & Co. S.R.L.
D.
Exemptions from the Listing Standards for Audit Committees
Not applicable.
157
E.
Purchases of Equity Securities by the Issuer and Affiliated Purchasers
|
|
(a) Total Number of
Shares (Units)
Purchased
|
(b) Average Price
Paid per Share
|
(c) Total Number of
Shares Purchased as
Part of Publicly
Announced Plans or
Programs
|
(d) Maximum
Number of Shares
that may yet be
Purchased Under the
Plans or Programs
|
|
09/1/2013-09/30/2013
|
55,899
|
7.52
|
55,899
|
6,063,192
|
|
10/01/2013-10/31/2013
|
74,676
|
7.61
|
74,676
|
5,988,516
|
|
11/1/2013-11/30/2013
|
59,273
|
7.88
|
59,273
|
5,929,243
|
|
12/1/2013-12/31/2013
|
464,606
|
7.84
|
464,606
|
5,464,637
|
|
1/1/2014-1/31/2014
|
785,517
|
7.71
|
785,517
|
4,679,120
|
|
2/1/2014-2/28/2014
|
828,883
|
7.69
|
828,883
|
3,850,237
|
|
3/1/2014-3/31/2015
|
74,992
|
7.84
|
74,992
|
3,775,245
|
|
8/1/2015-8/31/2014
|
2,747
|
7.98
|
2,747
|
6,063,192
|
|
9/1/2015-9/30/2015
|
37,052
|
7.93
|
37,052
|
6,026,140
|
|
10/1/2015-10/31/2015
|
448
|
7.99
|
448
|
6,025,692
|
|
9/1/2016-9/30/2016
|
93,939
|
10.95
|
93,939
|
6,063,192
|
|
11/1/2016-11/30/2016
|
38,949
|
10.79
|
38,949
|
6,024,243
|
|
12/1/2016-12/31/2016
|
323,844
|
10.26
|
323,844
|
5,700,399
|
|
1/1/2017-1/31/2017
|
114,079
|
10.79
|
114,079
|
5,586,320
|
|
4/1/2017-4/30/2017
|
73,059
|
11.14
|
73,059
|
5,513,261
|
|
5/1/2017-5/31/2017
|
2,400
|
10.99
|
2,400
|
5,510,861
|
|
6/1/2017-6/30/2017
|
637,240
|
10.33
|
637,240
|
4,708,864
|
|
7/1/2017-7/31/2017
|
164,757
|
9.94
|
164,757
|
4,640,198
|
|
8/1/2017-8/31/2017
|
68,666
|
9.83
|
68,666
|
4,606,332
|
|
9/1/2017-9/30/2017
|
33,866
|
10.12
|
33,866
|
6,027,190
|
|
10/1/2017-10/31/2017
|
54,452
|
10.47
|
54,452
|
5,972,738
|
|
11/1/2017-11/30/2017
|
1,702,545
|
9.30
|
1,702,545
|
4,270,193
|
|
12/1/2017-12/31/2017
|
998,381
|
10.03
|
998,381
|
3,271,812
|
|
1/1/2018-1/31/2018
|
678,186
|
10.00
|
678,186
|
2,593,626
|
|
2/1/2018-2/28/2018
|
718,067
|
9.31
|
718,067
|
1,875,559
|
|
4/1/2018-4/26/2018
|
217,331
|
7.90
|
217,331
|
1,658,228
|
|
Total
|
8,303,854
|
9.20
|
8,303,854
|
|
The total number of shares purchased set forth above were purchased pursuant to the Company´s Repurchase Program adopted on September 12, 2013. See “Item 10 – Additional Information – Repurchase of Shares”.
F.
Change in Registrant’s Certifying Accountant
Not applicable.
G.
Corporate Governance
Our corporate governance practices are governed by Luxembourg law (particularly the law of August 10th, 1915 on commercial companies) and our articles of association. As a Luxembourg company listed on the NYSE, we are not required to comply with all of the corporate governance listing standards of the NYSE. We, however, believe that our corporate governance practices meet or exceed, in all material respects, the corporate governance standards that are generally required for controlled companies by the NYSE. The following is a summary of the significant ways that our corporate governance practices differ from the corporate governance standards required for listed U.S. companies by the NYSE (provided that our corporate governance practices may differ in non-material ways from the standards required by the NYSE that are not detailed here):
158
Majority of Independent Directors
Under NYSE standards, U.S. listed companies must have a majority of independent directors. There is no legal obligation under Luxembourg law to have a majority of independent directors on the board of directors.
Non-management Directors’ Meetings
Under NYSE standards, non-management directors must meet at regularly scheduled executive sessions without management present and, if such group includes directors who are not independent, a meeting should be scheduled once per year including only independent directors. Neither Luxembourg law nor our Articles of Association require the holding of such meetings ad we do not have a set policy for these meetings. Our Articles of Association provide, however, that the board shall meet as often as required by the best interest of the Company. For additional information, see “Item 6. Directors, Senior Management and Employees—A. Directors and Senior Management.”
Communication with Non-Management Directors
NYSE-listed companies are required to provide a method for interested parties to communicate directly with the non-management directors as a group. Shareholders may send communications to the Company’s non-management directors by writing to Mr. Plínio Musetti at Rua Amauri, 255 - 17th Floor, Jardim Europa, São Paulo, SP 01448-000, Brazil, telephone: (5511) 3035-1588. Communications will be referred to the Presiding Director for appropriate action. The status of all outstanding concerns addressed to the Presiding Director will be reported to the board of directors as appropriate.
Audit Committee
Under NYSE standards, listed U.S. companies are required to have an audit committee composed of independent directors that satisfies the requirements of Rule 10A-3 promulgated under the Exchange Act of 1934. Our Articles of Association provide that the board of directors may set up an audit committee. The board of directors has set up an Audit Committee and has appointed Mr. Mark Schachter , Mr. Ivo Andrés Sarjanovic and Mr. Andres Velasco Brañes as members of its audit committee. In accordance with NYSE standards, we have an audit committee entirely composed of independent directors. For additional information, see “Item 6. Directors, Senior Management and Employees—C. Board Practices”.
Under NYSE standards, all audit committee members of listed U.S. companies are required to be financially literate or must acquire such financial knowledge within a reasonable period and at least one of its members shall have experience in accounting or financial administration. In addition, if a member of the audit committee is simultaneously a member of the audit committee of more than three public companies, and the listed company does not limit the number of audit committees on which its members may serve, then in each case the board must determine whether the simultaneous service would prevent such member from effectively serving on the listed company’s audit committee and shall publicly disclose its decision. No comparable provisions on audit committee membership exist under Luxembourg law or our articles of association.
Standards for Evaluating Director Independence
Under NYSE standards, the board is required, on a case by case basis, to express an opinion with regard to the independence or lack of independence of each individual director. Neither Luxembourg law nor our Articles of Association require the board to express such an opinion. In addition, the definition of “independent” under the rules of the NYSE differs in some non-material respects from the definition contained in our Articles of Association.
Audit Committee Responsibilities
Pursuant to our Articles of Association, the audit committee shall assist the board of directors in fulfilling its oversight responsibilities relating to the integrity of the Company’s financial statements, including periodically reporting to the board of directors on its activity and the adequacy of the Company’s system of internal controls over financial reporting. As per the audit committee charter, as amended, the audit committee shall make recommendations for the appointment, compensation, retention and oversight of, and consider the independence of, the company’s external auditors. The audit committee is required to review material transactions (as defined by the Articles of Association) between us or our subsidiaries with related parties, perform such other duties imposed to it by laws and regulations of the regulated market(s) on which the shares of the Company are listed, and also perform the other duties entrusted to it by the board.
The NYSE requires certain matters to be set forth in the audit committee charter of U.S. listed companies. Our audit committee charter provides for many of the responsibilities that are expected from such bodies under the NYSE standard; however, due to
159
our equity structure and holding company nature, the charter does not contain all such responsibilities, including provisions related to setting hiring policies for employees or former employees of independent auditors.
Nominating/Corporate Governance Committee.
The NYSE requires that a listed U.S. company have a nominating/corporate governance committee of independent directors and a committee charter specifying the purpose, duties and evaluation procedures of the committee. As permitted under Luxembourg law and our Articles of Association, we do not currently have a nominating or corporate governance committee.
Shareholder Voting on Equity Compensation Plans
Under NYSE standards, shareholders of U.S. listed companies must be given the opportunity to vote on equity compensation plans and material revisions thereto, except for employment inducement awards, certain grants, plans and amendments in the context of mergers and acquisitions, and certain specific types of plans. Neither Luxembourg corporate law nor our articles of incorporation require shareholder approval of equity based compensation plans. Luxembourg law only requires approval of the board of directors for the adoption of equity based compensation plans.
Disclosure of Corporate Governance Guidelines
NYSE-listed companies must adopt and disclose corporate governance guidelines. Neither Luxembourg law nor our Articles of Association require the adoption or disclosure of corporate governance guidelines. Our board of directors follows corporate governance guidelines consistent with our equity structure and holding company nature, but we have not codified them and therefore do not disclose them on our website.
Code of Business Conduct and Ethics
Under NYSE standards, listed companies must adopt and disclose a code of business conduct and ethics for directors, officers and employees, and promptly disclose any waivers of the code for directors or executive officers. Neither Luxembourg law nor our Articles of Association require the adoption or disclosure of such a code of conduct.
We have adopted a code of ethics and business conduct that applies to our directors, executive officers and all employees. The text of our code of ethics is posted on our web site at: www.adecoagro.com. And substantially complies with the NYSE´s requirements under the Code of Business Conduct and Ethics.
Chief Executive Officer Certification
A chief executive officer of a U.S. company listed on NYSE must annually certify that he or she is not aware of any violation by the company of NYSE corporate governance standards. In accordance with NYSE rules applicable to foreign private issuers, our chief executive officer is not required to provide NYSE with this annual compliance certification. However, in accordance with NYSE rules applicable to all listed companies, our chief executive officer must promptly notify NYSE in writing after any of our executive officers becomes aware of any noncompliance with any applicable provision of NYSE’s corporate governance standards. In addition, we must submit an executed written affirmation annually and an interim written affirmation each time a change occurs to the board or the audit committee.
H.
Mine Safety Disclosure
Not applicable.
|
Item 17.
|
Financial Statements
|
We have responded to Item 18 in lieu of responding to this item.
|
Item 18.
|
Financial Statements.
|
See pages F-1 through F-87 of this annual report.
160
|
Item 19.
|
Exhibits
|
|
Exhibit Number
|
|
Description
|
|
1.1
|
|
|
|
|
|
|
|
4.1
|
|
|
|
|
|
|
|
4.2
|
|
|
|
|
|
|
|
4.3
|
|
|
|
|
|
|
|
4.5
|
|
|
|
|
|
|
|
4.6
|
|
|
|
|
|
|
|
4.7
|
|
|
|
|
|
|
|
4.8
|
|
|
|
|
|
|
|
4.14
|
|
|
|
|
|
|
|
4.16
|
|
|
|
|
|
|
|
4.17
|
|
|
|
|
|
|
|
4.18
|
|
|
161
|
4.23
|
|
|
|
|
|
|
|
4.24
|
|
|
|
|
|
|
|
4.25
|
|
|
|
|
|
|
|
4.26
|
|
|
|
|
|
|
|
4.27
|
|
|
|
|
|
|
|
4.28
|
|
|
|
|
|
|
|
4.29
|
|
|
|
|
|
|
|
4.30
|
|
|
|
|
|
|
|
4.35
|
|
|
|
|
|
|
|
4.39
|
|
|
|
|
|
|
|
4.40
|
|
|
|
|
|
|
|
4.42
|
|
|
|
4.43
|
||
|
|
|
|
162
|
8.1
|
|
|
|
|
|
|
|
12.1
|
|
|
|
|
|
|
|
12.2
|
|
|
|
|
|
|
|
13.1
|
|
|
|
13.2
|
|
|
|
|
|
|
|
15.1
|
|
|
|
|
|
|
|
15.2
|
|
|
|
101.INS
|
XBRL Instance Document.
|
|
|
101.SCH
|
XBRL Taxonomy Extension Schema Document.
|
|
|
101.CAL
|
XBRL Taxonomy Extension Calculation Linkbase Document.
|
|
|
101.DEF
|
XBRL Taxonomy Extension Definition Linkbase Document.
|
|
|
101.LAB
|
XBRL Taxonomy Extension Label Linkbase Document.
|
|
|
101.PRE
|
XBRL Taxonomy Extension Presentation Linkbase Document.
|
|
163
SIGNATURES
The registrant hereby certifies that it meets all of the requirements for filing on Form 20-F and that it has duly caused and authorized the undersigned to sign this annual report on its behalf.
|
Adecoagro S.A.
|
|
|
|
/s/ Mariano Bosch
|
|
Name: Mariano Bosch
|
|
Title: Chief Executive Officer
|
Date:
April 29, 2019
164
Adecoagro S.A.
Consolidated Financial Statements as of
December 31, 2018
and
2017
and for the years ended
December 31, 2018
,
2017
and
2016
Report of Independent Registered Public Accounting Firm
To the Board of directors and shareholders of Adecoagro S.A.
Opinions on the Financial Statements and Internal Control over Financial Reporting
We have audited the accompanying consolidated statements of financial position of Adecoagro S.A. and its subsidiaries (the “Company”) as of December 31, 2018 and 2017, and the related consolidated statements of income, of comprehensive income, of changes in shareholders’ equity and of cash flows for each of the three years in the period ended December 31, 2018, including the related notes (collectively referred to as the “consolidated financial statements”). We also have audited the Company’s internal control over financial reporting as of December 31, 2018, based on criteria established in Internal Control - Integrated Framework (2013) issued by the Committee of Sponsoring Organizations of the Treadway Commission (COSO).
In our opinion, the consolidated financial statements referred to above present fairly, in all material respects, the financial position of the Company as of December 31, 2018 and 2017, and the results of its operations and its cash flows for each of the three years in the period ended December 31, 2018 in conformity with International Financial Reporting Standards as issued by the International Accounting Standards Board. Also in our opinion, the Company maintained, in all material respects, effective internal control over financial reporting as of December 31, 2018, based on criteria established in Internal Control - Integrated Framework (2013) issued by the COSO.
Change in Accounting Principles
As discussed in Note 33 to the consolidated financial statements, the Company changed the manner in which it accounts for investment property and the manner in which it accounts for property, plant and equipment in 2018.
Basis for Opinions
The Company's management is responsible for these consolidated financial statements, for maintaining effective internal control over financial reporting, and for its assessment of the effectiveness of internal control over financial reporting, included in Management's Annual Report on Internal Control over Financial Reporting appearing under Item 15. Our responsibility is to express opinions on the Company’s consolidated financial statements and on the Company's internal control over financial reporting based on our audits. We are a public accounting firm registered with the Public Company Accounting Oversight Board (United States) ("PCAOB") and are required to be independent with respect to the Company in accordance with the U.S. federal securities laws and the applicable rules and regulations of the Securities and Exchange Commission and the PCAOB.
We conducted our audits in accordance with the standards of the PCAOB. Those standards require that we plan and perform the audits to obtain reasonable assurance about whether the consolidated financial statements are free of material misstatement, whether due to error or fraud, and whether effective internal control over financial reporting was maintained in all material respects.
Our audits of the consolidated financial statements included performing procedures to assess the risks of material misstatement of the consolidated financial statements, whether due to error or fraud, and performing procedures that respond to those risks. Such procedures included examining, on a test basis, evidence regarding the amounts and disclosures in the consolidated financial statements. Our audits also included evaluating the accounting principles used and significant estimates made by management, as well as evaluating the overall presentation of the consolidated financial statements. Our audit of internal control over financial reporting included obtaining an understanding of internal control over financial reporting, assessing the risk that a material weakness exists, and testing and evaluating the design and operating effectiveness of internal control based on the assessed risk. Our audits also included performing such other procedures as we considered necessary in the circumstances. We believe that our audits provide a reasonable basis for our opinions.
Definition and Limitations of Internal Control over Financial Reporting
A company’s internal control over financial reporting is a process designed to provide reasonable assurance regarding the reliability of financial reporting and the preparation of financial statements for external purposes in accordance with generally accepted accounting principles. A company’s internal control over financial reporting includes those policies and procedures
F-
2
that (i) pertain to the maintenance of records that, in reasonable detail, accurately and fairly reflect the transactions and dispositions of the assets of the company; (ii) provide reasonable assurance that transactions are recorded as necessary to permit preparation of financial statements in accordance with generally accepted accounting principles, and that receipts and expenditures of the company are being made only in accordance with authorizations of management and directors of the company; and (iii) provide reasonable assurance regarding prevention or timely detection of unauthorized acquisition, use, or disposition of the company’s assets that could have a material effect on the financial statements.
Because of its inherent limitations, internal control over financial reporting may not prevent or detect misstatements. Also, projections of any evaluation of effectiveness to future periods are subject to the risk that controls may become inadequate because of changes in conditions, or that the degree of compliance with the policies or procedures may deteriorate.
Buenos Aires, Argentina.
April 29, 2019.
/s/ PRICE WATERHOUSE & CO. S.R.L.
/s/
(Partner)
Jorge Frederico Zabaleta
We have served as the Company’s auditor since 2008.
F-
3
Legal information
Denomination:
Adecoagro S.A.
Legal address:
Vertigo Naos Building, 6, Rue Eugène Ruppert, L-2453, Luxembourg
Company activity:
Agricultural and agro-industrial
Date of registration:
June 11, 2010
Expiration of company charter:
No term defined
Number of register (RCS Luxembourg):
B153.681
Issued Capital Stock
: 122,381,815 common shares
Outstanding Capital stock:
116,555,699 common shares
Treasury shares:
5,826,116 common shares
F-
4
Adecoagro S.A.
Consolidated Statements of Income
for the years ended
December 31, 2018
,
2017
and
2016
(All amounts in US$ thousands, except shares and per share data and as otherwise indicated)
|
|
Note
|
2018
|
2017 (*)
|
2016 (*)
|
|||||
|
Sales of goods and services rendered
|
4
|
793,239
|
|
933,178
|
|
|
869,235
|
|
|
|
Cost of goods sold and services rendered
|
5
|
(609,965
|
)
|
(766,727
|
)
|
|
(678,581
|
)
|
|
|
Initial recognition and changes in fair value of biological assets and agricultural produce
|
15
|
16,195
|
|
63,220
|
|
|
125,456
|
|
|
|
Changes in net realizable value of agricultural produce after harvest
|
|
(909
|
)
|
8,852
|
|
|
(5,841
|
)
|
|
|
Margin on manufacturing and agricultural activities before operating expenses
|
|
198,560
|
|
238,523
|
|
310,269
|
|
||
|
General and administrative expenses
|
6
|
(56,080
|
)
|
(57,299
|
)
|
|
(50,750
|
)
|
|
|
Selling expenses
|
6
|
(90,215
|
)
|
(95,399
|
)
|
|
(80,673
|
)
|
|
|
Other operating income, net
|
8
|
104,232
|
|
43,763
|
|
|
5,752
|
|
|
|
Profit from operations
|
|
156,497
|
|
129,588
|
|
184,598
|
|
||
|
Finance income
|
9
|
8,581
|
|
11,744
|
|
|
7,957
|
|
|
|
Finance costs
|
9
|
(271,263
|
)
|
(131,349
|
)
|
|
(165,380
|
)
|
|
|
Other financial results - Net gain of inflation effects on the monetary items
|
9
|
81,928
|
|
—
|
|
—
|
|
||
|
Financial results, net
|
9
|
(180,754
|
)
|
(119,605
|
)
|
(157,423
|
)
|
||
|
(Loss) / Profit before income tax
|
|
(24,257
|
)
|
9,983
|
|
27,175
|
|
||
|
Income tax benefit / (expense)
|
10
|
1,024
|
|
4,992
|
|
|
(12,899
|
)
|
|
|
(Loss) / Profit for the year
|
|
(23,233
|
)
|
14,975
|
|
14,276
|
|
||
|
Attributable to:
|
|
|
|
|
|
|
|
||
|
Equity holders of the parent
|
|
(24,622
|
)
|
13,198
|
|
|
11,568
|
|
|
|
Non-controlling interest
|
|
1,389
|
|
1,777
|
|
|
2,708
|
|
|
|
(Loss) / Earnings per share from operations attributable to the equity holders of the parent during the year:
|
|
|
|
|
|
|
|
||
|
Basic earnings per share
|
11
|
(0.211
|
)
|
0.109
|
|
|
0.095
|
|
|
|
Diluted earnings per share
|
11
|
(0.211
|
)
|
0.108
|
|
|
0.094
|
|
|
(*) Prior periods have been recast to reflect the Company's change in accounting policy for Investment properties as described in Note 33.
The accompanying notes are an integral part of these consolidated financial statements.
F-
5
Adecoagro S.A.
Consolidated Statements of Comprehensive Income
for the years ended
December 31, 2018
,
2017
and
2016
(All amounts in US$ thousands, except shares and per share data and as otherwise indicated)
|
|
2018
|
2017 (*)
|
2016 (*)
|
|||||
|
(Loss) / Profit for the year
|
(23,233
|
)
|
14,975
|
|
14,276
|
|
||
|
Other comprehensive income:
|
|
|
||||||
|
- Items that may be reclassified subsequently to profit or loss:
|
|
|
||||||
|
Exchange differences on translating foreign operations
|
(121,296
|
)
|
(21,233
|
)
|
32,859
|
|
||
|
Cash flow hedge, net of income tax (Note 2)
|
(32,195
|
)
|
12,608
|
|
100,615
|
|
||
|
- Items that will not be reclassified to profit or loss:
|
||||||||
|
Revaluation surplus net of income tax (Note 10, 12, 33)
|
405,906
|
|
—
|
|
—
|
|
||
|
Other comprehensive income / (loss) for the year
|
252,415
|
|
(8,625
|
)
|
133,474
|
|
||
|
Total comprehensive income for the year
|
229,182
|
|
6,350
|
|
147,750
|
|
||
|
Attributable to:
|
|
|
|
|
|
|
||
|
Equity holders of the parent
|
213,641
|
|
6,322
|
|
147,376
|
|
||
|
Non-controlling interest
|
15,541
|
|
28
|
|
374
|
|
||
(*) Prior periods have been recast to reflect the Company's change in accounting policy for Investment properties as described in Note 33.
The accompanying notes are an integral part of these consolidated financial statements.
F-
6
Adecoagro S.A.
Consolidated Statements of Financial Position
as of
December 31, 2018
,
2017
and 2016
(All amounts in US$ thousands, except shares and per share data and as otherwise indicated)
|
|
Note
|
2018
|
2017 (*)
|
2016 (*)
|
|||||
|
ASSETS
|
|
|
|
|
|
||||
|
Non-Current Assets
|
|
|
|
|
|
||||
|
Property, plant and equipment, net
|
12
|
1,480,439
|
|
831,377
|
|
814,867
|
|
||
|
Investment property
|
13
|
40,725
|
|
42,342
|
|
44,581
|
|
||
|
Intangible assets, net
|
14
|
27,909
|
|
17,192
|
|
17,252
|
|
||
|
Biological assets
|
15
|
11,270
|
|
11,276
|
|
8,516
|
|
||
|
Deferred income tax assets
|
10
|
16,191
|
|
30,808
|
|
25,043
|
|
||
|
Trade and other receivables, net
|
18
|
38,820
|
|
22,107
|
|
17,412
|
|
||
|
Other assets
|
|
1,184
|
|
535
|
|
566
|
|
||
|
Total Non-Current Assets
|
|
1,616,538
|
|
955,637
|
|
928,237
|
|
||
|
Current Assets
|
|
|
|
|
|
||||
|
Biological assets
|
15
|
94,117
|
|
156,718
|
|
136,888
|
|
||
|
Inventories
|
19
|
128,102
|
|
108,919
|
|
111,754
|
|
||
|
Trade and other receivables, net
|
18
|
158,686
|
|
150,107
|
|
157,528
|
|
||
|
Derivative financial instruments
|
17
|
6,286
|
|
4,483
|
|
3,398
|
|
||
|
Other assets
|
|
8
|
|
30
|
|
24
|
|
||
|
Cash and cash equivalents
|
20
|
273,635
|
|
269,195
|
|
158,568
|
|
||
|
Total Current Assets
|
|
660,834
|
|
689,452
|
|
568,160
|
|
||
|
TOTAL ASSETS
|
|
2,277,372
|
|
1,645,089
|
|
1,496,397
|
|
||
|
SHAREHOLDERS EQUITY
|
|
|
|
|
|
||||
|
Capital and reserves attributable to equity holders of the parent
|
|
|
|
|
|
||||
|
Share capital
|
22
|
183,573
|
|
183,573
|
|
183,573
|
|
||
|
Share premium
|
22
|
900,503
|
|
908,934
|
|
937,250
|
|
||
|
Cumulative translation adjustment
|
|
(666,037
|
)
|
(552,604
|
)
|
(533,120
|
)
|
||
|
Equity-settled compensation
|
|
16,191
|
|
17,852
|
|
17,218
|
|
||
|
Cash flow hedge
|
2
|
(56,884
|
)
|
(24,691
|
)
|
(37,299
|
)
|
||
|
Other reserves
|
32,380
|
|
—
|
|
—
|
|
|||
|
Treasury shares
|
|
(8,741
|
)
|
(6,967
|
)
|
(1,859
|
)
|
||
|
Revaluation surplus
|
383,889
|
|
—
|
|
—
|
|
|||
|
Reserve from the sale of non-controlling interests in subsidiaries
|
41,574
|
|
41,574
|
|
41,574
|
|
|||
|
Retained earnings
|
|
237,188
|
|
106,209
|
|
92,997
|
|
||
|
Equity attributable to equity holders of the parent
|
|
1,063,636
|
|
673,880
|
|
700,334
|
|
||
|
Non-controlling interest
|
|
44,509
|
|
9,139
|
|
11,970
|
|
||
|
TOTAL SHAREHOLDERS EQUITY
|
|
1,108,145
|
|
683,019
|
|
712,304
|
|
||
|
LIABILITIES
|
|
|
|
|
|
||||
|
Non-Current Liabilities
|
|
|
|
|
|
||||
|
Trade and other payables
|
25
|
211
|
|
827
|
|
1,427
|
|
||
|
Borrowings
|
26
|
718,484
|
|
663,060
|
|
430,304
|
|
||
|
Deferred income tax liabilities
|
10
|
168,171
|
|
10,457
|
|
14,689
|
|
||
|
Payroll and social liabilities
|
27
|
1,219
|
|
1,240
|
|
1,235
|
|
||
|
Derivatives financial instruments
|
17
|
—
|
|
—
|
|
662
|
|
||
|
Provisions for other liabilities
|
28
|
3,296
|
|
4,078
|
|
3,299
|
|
||
|
Total Non-Current Liabilities
|
|
891,381
|
|
679,662
|
|
451,616
|
|
||
|
Current Liabilities
|
|
|
|
|
|
||||
|
Trade and other payables
|
25
|
106,226
|
|
98,423
|
|
92,158
|
|
||
|
Current income tax liabilities
|
|
1,398
|
|
503
|
|
1,387
|
|
||
|
Payroll and social liabilities
|
27
|
25,978
|
|
27,267
|
|
26,844
|
|
||
|
Borrowings
|
26
|
143,632
|
|
154,898
|
|
205,092
|
|
||
|
Derivative financial instruments
|
17
|
283
|
|
552
|
|
6,406
|
|
||
|
Provisions for other liabilities
|
28
|
329
|
|
765
|
|
590
|
|
||
|
Total Current Liabilities
|
|
277,846
|
|
282,408
|
|
332,477
|
|
||
|
TOTAL LIABILITIES
|
|
1,169,227
|
|
962,070
|
|
784,093
|
|
||
|
TOTAL SHAREHOLDERS EQUITY AND LIABILITIES
|
|
2,277,372
|
|
1,645,089
|
|
1,496,397
|
|
||
(*) Prior periods have been recast to reflect the Company's change in accounting policy for Investment properties as in Note 33.
The accompanying notes are an integral part of these consolidated financial statements.
F-
7
Adecoagro S.A.
Consolidated Statements of Changes in Shareholders’ Equity
for the years ended
December 31, 2018
,
2017
and
2016
(All amounts in US$ thousands, except shares and per share data and as otherwise indicated)
|
|
Attributable to equity holders of the parent
|
|
|
|||||||||||||||||||
|
|
Share capital
(Note 22)
|
Share
premium
(Note 22)
|
Cumulative
translation
adjustment
|
Equity-settled
compensation
|
Cash flow hedge (*)
|
Treasury
shares
|
Reserve from the sale of non-controlling
interests in subsidiaries
|
Retained
earnings
|
Subtotal
|
Non-
controlling
interest
|
Total
shareholders’
equity
|
|||||||||||
|
Balance at January 1, 2016
|
183,573
|
|
937,674
|
|
(568,316
|
)
|
16,631
|
|
(137,911
|
)
|
(1,936
|
)
|
41,574
|
|
81,265
|
|
552,554
|
|
11,596
|
|
564,150
|
|
|
Loss for the year
|
—
|
|
—
|
|
—
|
|
—
|
|
—
|
|
—
|
|
—
|
|
11,568
|
|
11,568
|
|
2,708
|
|
14,276
|
|
|
Other comprehensive income:
|
|
|
|
|
|
|
|
|
|
|
|
|
|
|
|
|
||||||
|
- Items that may be reclassified subsequently to profit or loss:
|
|
|
|
|
|
|
|
|
|
|
|
|
|
|
|
|
||||||
|
Exchange differences on translating foreign operations
|
—
|
|
—
|
|
35,196
|
|
—
|
|
—
|
|
—
|
|
—
|
|
—
|
|
35,196
|
|
(2,337
|
)
|
32,859
|
|
|
Cash flow hedge (*)
|
—
|
|
—
|
|
—
|
|
—
|
|
100,612
|
|
—
|
|
—
|
|
—
|
|
100,612
|
|
3
|
|
100,615
|
|
|
Other comprehensive income for the year
|
—
|
|
—
|
|
35,196
|
|
—
|
|
100,612
|
|
—
|
|
—
|
|
—
|
|
135,808
|
|
(2,334
|
)
|
133,474
|
|
|
Total comprehensive income for the year
|
—
|
|
—
|
|
35,196
|
|
—
|
|
100,612
|
|
—
|
|
—
|
|
11,568
|
|
147,376
|
|
374
|
|
147,750
|
|
|
Employee share options (Note 23)
|
|
|
|
|
|
|
|
|
|
|
|
|
|
|
|
|
||||||
|
- Exercised
|
—
|
|
438
|
|
—
|
|
(140
|
)
|
—
|
|
82
|
|
—
|
|
—
|
|
380
|
|
—
|
|
380
|
|
|
- Forfeited
|
—
|
|
—
|
|
—
|
|
(164
|
)
|
—
|
|
—
|
|
—
|
|
164
|
|
—
|
|
—
|
|
—
|
|
|
Restricted shares (Note 23):
|
|
|
|
|
|
|
|
|
|
|
|
|
|
|
|
|
||||||
|
- Value of employee services
|
—
|
|
—
|
|
—
|
|
4,796
|
|
—
|
|
—
|
|
—
|
|
—
|
|
4,796
|
|
—
|
|
4,796
|
|
|
- Vested
|
—
|
|
3,225
|
|
—
|
|
(3,905
|
)
|
—
|
|
680
|
|
—
|
|
—
|
|
—
|
|
—
|
|
—
|
|
|
Purchase of own shares (Note 22)
|
—
|
|
(4,087
|
)
|
—
|
|
—
|
|
—
|
|
(685
|
)
|
—
|
|
—
|
|
(4,772
|
)
|
—
|
|
(4,772
|
)
|
|
Balance at December 31, 2016 (**)
|
183,573
|
|
937,250
|
|
(533,120
|
)
|
17,218
|
|
(37,299
|
)
|
(1,859
|
)
|
41,574
|
|
92,997
|
|
700,334
|
|
11,970
|
|
712,304
|
|
(*) Net of
49,106
of income tax.
(**) 2016 information has been recast to reflect the Company's change in accounting policy for Investment properties as described in Note 33.
The accompanying notes are an integral part of these consolidated financial statements.
F-
8
Adecoagro S.A.
Consolidated Statements of Changes in Shareholders’ Equity
for the years ended
December 31, 2018
,
2017
and
2016
(All amounts in US$ thousands, except shares and per share data and as otherwise indicated)
|
|
Attributable to equity holders of the parent
|
|
|
|||||||||||||||||||
|
|
Share capital
(Note 22)
|
Share
premium
(Note 22)
|
Cumulative
translation
adjustment
|
Equity-settled
compensation
|
Cash flow
hedge
(*)
|
Treasury
shares
|
Reserve from the sale of non-controlling interests in subsidiaries
|
Retained
earnings
|
Subtotal
|
Non-
controlling
interest
|
Total
shareholders’
equity
|
|||||||||||
|
Balance at January 1, 2017
|
183,573
|
|
937,250
|
|
(533,120
|
)
|
17,218
|
|
(37,299
|
)
|
(1,859
|
)
|
41,574
|
|
92,997
|
|
700,334
|
|
11,970
|
|
712,304
|
|
|
Profit for the year
|
—
|
|
—
|
|
—
|
|
—
|
|
—
|
|
—
|
|
—
|
|
13,198
|
|
13,198
|
|
1,777
|
|
14,975
|
|
|
Other comprehensive income:
|
|
|
|
|
|
|
|
|
|
|
|
|
|
|
|
|
||||||
|
- Items that may be reclassified subsequently to profit or loss:
|
|
|
|
|
|
|
|
|
|
|
|
|
|
|
|
|
||||||
|
Exchange differences on translating foreign operations
|
—
|
|
—
|
|
(19,484
|
)
|
—
|
|
—
|
|
—
|
|
—
|
|
—
|
|
(19,484
|
)
|
(1,749
|
)
|
(21,233
|
)
|
|
Cash flow hedge (*)
|
—
|
|
—
|
|
—
|
|
—
|
|
12,608
|
|
—
|
|
—
|
|
—
|
|
12,608
|
|
—
|
|
12,608
|
|
|
Other comprehensive income for the year
|
—
|
|
—
|
|
(19,484
|
)
|
—
|
|
12,608
|
|
—
|
|
—
|
|
—
|
|
(6,876
|
)
|
(1,749
|
)
|
(8,625
|
)
|
|
Total comprehensive income for the year
|
—
|
|
—
|
|
(19,484
|
)
|
—
|
|
12,608
|
|
—
|
|
—
|
|
13,198
|
|
6,322
|
|
28
|
|
6,350
|
|
|
Employee share options (Note 23):
|
|
|
|
|
|
|
|
|
|
|
|
|
|
|
|
|
||||||
|
- Exercised
|
—
|
|
50
|
|
—
|
|
(21
|
)
|
—
|
|
10
|
|
—
|
|
—
|
|
39
|
|
—
|
|
39
|
|
|
- Forfeited
|
—
|
|
—
|
|
—
|
|
(14
|
)
|
—
|
|
—
|
|
—
|
|
14
|
|
—
|
|
—
|
|
—
|
|
|
Restricted shares (Note 23):
|
|
|
|
|
|
|
|
|
|
|
|
|
|
|
|
|
||||||
|
- Value of employee services
|
—
|
|
—
|
|
—
|
|
5,552
|
|
—
|
|
—
|
|
—
|
|
—
|
|
5,552
|
|
—
|
|
5,552
|
|
|
- Vested
|
—
|
|
4,149
|
|
—
|
|
(4,883
|
)
|
—
|
|
734
|
|
—
|
|
—
|
|
—
|
|
—
|
|
—
|
|
|
Purchase of own shares (Note 22)
|
—
|
|
(32,515
|
)
|
—
|
|
—
|
|
—
|
|
(5,852
|
)
|
—
|
|
—
|
|
(38,367
|
)
|
—
|
|
(38,367
|
)
|
|
Dividends
|
—
|
|
—
|
|
—
|
|
—
|
|
—
|
|
—
|
|
—
|
|
—
|
|
—
|
|
(2,859
|
)
|
(2,859
|
)
|
|
Balance at December 31, 2017 (**)
|
183,573
|
|
908,934
|
|
(552,604
|
)
|
17,852
|
|
(24,691
|
)
|
(6,967
|
)
|
41,574
|
|
106,209
|
|
673,880
|
|
9,139
|
|
683,019
|
|
(*) Net of
(52,282)
of income tax.
(**) 2017 information has been recast to reflect the Company's change in accounting policy for Investment properties as described in Note 33.
The accompanying notes are an integral part of these consolidated financial statements.
F-
9
Adecoagro S.A.
Consolidated Statements of Changes in Shareholders’ Equity
for the years ended
December 31, 2018
,
2017
and
2016
(All amounts in US$ thousands, except shares and per share data and as otherwise indicated)
|
|
Attributable to equity holders of the parent
|
|
|
|||||||||||||||||||||||
|
|
Share capital
(Note 22)
|
Share
premium
(Note 22)
|
Cumulative
translation
adjustment
|
Equity-settled
compensation
|
Cash flow
hedge
(*)
|
Other reserves
|
Treasury
shares
|
Revaluation surplus (**)
|
Reserve from the sale of non-controlling interests in subsidiaries
|
Retained
earnings
|
Subtotal
|
Non-
controlling
interest
|
Total
shareholders’
equity
|
|||||||||||||
|
Balance at January 1, 2018
|
183,573
|
|
908,934
|
|
(552,604
|
)
|
17,852
|
|
(24,691
|
)
|
—
|
|
(6,967
|
)
|
—
|
|
41,574
|
|
106,209
|
|
673,880
|
|
9,139
|
|
683,019
|
|
|
Adjustment of opening balance for the application of IAS 29 (Note 33)
|
—
|
|
—
|
|
—
|
|
—
|
|
—
|
|
—
|
|
—
|
|
—
|
|
—
|
|
187,941
|
|
187,941
|
|
20,237
|
|
208,178
|
|
|
Total equity at the beginning of the financial year
|
183,573
|
|
908,934
|
|
(552,604
|
)
|
17,852
|
|
(24,691
|
)
|
—
|
|
(6,967
|
)
|
—
|
|
41,574
|
|
294,150
|
|
861,821
|
|
29,376
|
|
891,197
|
|
|
Profit for the year
|
—
|
|
—
|
|
—
|
|
—
|
|
—
|
|
—
|
|
—
|
|
—
|
|
—
|
|
(24,622
|
)
|
(24,622
|
)
|
1,389
|
|
(23,233
|
)
|
|
Other comprehensive income:
|
|
|
|
|
|
|
|
|
|
|
|
|
|
|
|
|
|
|
|
|
||||||
|
- Items that may be reclassified subsequently to profit or loss:
|
|
|
|
|
|
|
|
|
|
|
|
|
|
|
|
|
|
|
|
|
||||||
|
Exchange differences on translating foreign operations
|
—
|
|
—
|
|
(113,433
|
)
|
—
|
|
—
|
|
—
|
|
—
|
|
—
|
|
—
|
|
—
|
|
(113,433
|
)
|
(7,863
|
)
|
(121,296
|
)
|
|
Cash flow hedge (*)
|
—
|
|
—
|
|
—
|
|
—
|
|
(32,193
|
)
|
—
|
|
—
|
|
—
|
|
—
|
|
—
|
|
(32,193
|
)
|
(2
|
)
|
(32,195
|
)
|
|
- Items will not be reclassified to profit or loss:
|
||||||||||||||||||||||||||
|
Revaluation surplus (**)
|
—
|
|
—
|
|
—
|
|
—
|
|
—
|
|
—
|
|
—
|
|
383,889
|
|
—
|
|
—
|
|
383,889
|
|
22,017
|
|
405,906
|
|
|
Other comprehensive income for the year
|
—
|
|
—
|
|
(113,433
|
)
|
—
|
|
(32,193
|
)
|
—
|
|
—
|
|
383,889
|
|
—
|
|
—
|
|
238,263
|
|
14,152
|
|
252,415
|
|
|
Total comprehensive income for the year
|
—
|
|
—
|
|
(113,433
|
)
|
—
|
|
(32,193
|
)
|
—
|
|
—
|
|
383,889
|
|
—
|
|
(24,622
|
)
|
213,641
|
|
15,541
|
|
229,182
|
|
|
Reserves for the benefit of government grants (1)
|
—
|
|
—
|
|
—
|
|
—
|
|
—
|
|
32,380
|
|
—
|
|
—
|
|
—
|
|
(32,380
|
)
|
—
|
|
—
|
|
—
|
|
|
Employee share options (Note 23):
|
|
|
|
|
|
|
|
|
|
|
|
|
|
|
|
|
||||||||||
|
- Forfeited
|
—
|
|
—
|
|
—
|
|
(40
|
)
|
—
|
|
—
|
|
—
|
|
—
|
|
—
|
|
40
|
|
—
|
|
—
|
|
—
|
|
|
Restricted shares (Note 23):
|
|
|
|
|
||||||||||||||||||||||
|
- Value of employee services
|
—
|
|
—
|
|
—
|
|
3,899
|
|
—
|
|
—
|
|
—
|
|
—
|
|
—
|
|
—
|
|
3,899
|
|
—
|
|
3,899
|
|
|
- Vested
|
—
|
|
4,775
|
|
—
|
|
(5,520
|
)
|
—
|
|
—
|
|
745
|
|
—
|
|
—
|
|
—
|
|
—
|
|
—
|
|
—
|
|
|
Purchase of own shares (Note 22)
|
—
|
|
(13,206
|
)
|
—
|
|
—
|
|
—
|
|
—
|
|
(2,519
|
)
|
—
|
|
—
|
|
—
|
|
(15,725
|
)
|
—
|
|
(15,725
|
)
|
|
Dividends
|
—
|
|
—
|
|
—
|
|
—
|
|
—
|
|
—
|
|
—
|
|
—
|
|
—
|
|
—
|
|
—
|
|
(408
|
)
|
(408
|
)
|
|
Balance at December 31, 2018
|
183,573
|
|
900,503
|
|
(666,037
|
)
|
16,191
|
|
(56,884
|
)
|
32,380
|
|
(8,741
|
)
|
383,889
|
|
41,574
|
|
237,188
|
|
1,063,636
|
|
44,509
|
|
1,108,145
|
|
(*) Net of
11,322
of Income tax.
(**) Net of
139,223
of Income tax.
(1) Correspond to the presumed credit of ICMS (Imposto sobre Circulação de Mercadorias e Prestação de Serviços) over the sale values in our Sugar, ethanol and energy business. (please see Note 24).
The accompanying notes are an integral part of these consolidated financial statements.
F-
10
Adecoagro S.A.
for the years ended
December 31, 2018
,
2017
and
2016
(All amounts in US$ thousands, except shares and per share data and as otherwise indicated)
|
|
Note
|
2018
|
2017 (*)
|
2016 (*)
|
|||||
|
Cash flows from operating activities:
|
|
|
|
|
|
|
|
||
|
(Loss) / Profit for the year
|
|
(23,233
|
)
|
14,975
|
|
14,276
|
|
||
|
Adjustments for:
|
|
|
|
|
|
||||
|
Income tax (benefit) / expense
|
10
|
(1,024
|
)
|
(4,992
|
)
|
12,899
|
|
||
|
Depreciation
|
12
|
153,034
|
|
150,071
|
|
126,799
|
|
||
|
Amortization
|
14
|
1,220
|
|
936
|
|
701
|
|
||
|
Loss from the disposal of other property items
|
8
|
95
|
|
986
|
|
1,255
|
|
||
|
Gain from the sale of farmland and other assets
|
8
|
(36,227
|
)
|
—
|
|
—
|
|
||
|
Net gain from the Fair value adjustment of Investment properties
|
13
|
(13,409
|
)
|
(4,302
|
)
|
(14,049
|
)
|
||
|
Equity settled share-based compensation granted
|
7
|
4,728
|
|
5,552
|
|
4,796
|
|
||
|
(Gain) / Loss from derivative financial instruments and forwards
|
8, 9
|
(51,504
|
)
|
(38,679
|
)
|
21,745
|
|
||
|
Interest and other financial expense, net
|
9
|
44,347
|
|
53,446
|
|
44,734
|
|
||
|
Initial recognition and changes in fair value of non harvested biological assets (unrealized)
|
30,299
|
|
(14,645
|
)
|
(9,811
|
)
|
|||
|
Changes in net realizable value of agricultural produce after harvest (unrealized)
|
647
|
|
(2,371
|
)
|
90
|
|
|||
|
Provision and allowances
|
|
2,126
|
|
825
|
|
341
|
|
||
|
Net gain of inflation effects on the monetary items
|
9
|
(81,928
|
)
|
—
|
|
—
|
|
||
|
Foreign exchange losses, net
|
9
|
183,195
|
|
38,708
|
|
19,062
|
|
||
|
Cash flow hedge – transfer from equity
|
9
|
26,693
|
|
20,758
|
|
85,214
|
|
||
|
Subtotal
|
|
239,059
|
|
221,268
|
|
308,052
|
|
||
|
Changes in operating assets and liabilities:
|
|
|
|
|
|
|
|
||
|
(Increase) in trade and other receivables
|
|
(65,942
|
)
|
(9,476
|
)
|
(30,996
|
)
|
||
|
(Increase) in inventories
|
|
(41,531
|
)
|
(4,089
|
)
|
(22,301
|
)
|
||
|
Decrease / (Increase) in biological assets
|
|
2,958
|
|
(18,013
|
)
|
(23,677
|
)
|
||
|
(Increase) / Decrease in other assets
|
|
(777
|
)
|
2
|
|
83
|
|
||
|
Decrease / (Increase) in derivative financial instruments
|
|
50,021
|
|
40,910
|
|
(17,892
|
)
|
||
|
Increase in trade and other payables
|
|
31,148
|
|
6,555
|
|
39,054
|
|
||
|
Increase in payroll and social security liabilities
|
|
5,876
|
|
1,953
|
|
3,052
|
|
||
|
(Decrease) / Increase in provisions for other liabilities
|
|
(430
|
)
|
855
|
|
1,175
|
|
||
|
Net cash generated from operating activities before taxes paid
|
|
220,382
|
|
239,965
|
|
256,550
|
|
||
|
Income tax paid
|
|
(1,869
|
)
|
(2,860
|
)
|
(1,149
|
)
|
||
|
Net cash generated from operating activities
|
(a)
|
218,513
|
|
237,105
|
|
|
255,401
|
|
|
The accompanying notes are an integral part of these consolidated financial statements.
F-
11
Adecoagro S.A.
Consolidated Statements of Cash Flows (Continued)
for the years ended
December 31, 2018
,
2017
and
2016
(All amounts in US$ thousands, except shares and per share data and as otherwise indicated)
|
|
Note
|
2018
|
2017 (*)
|
2016 (*)
|
|||||
|
Cash flows from investing activities:
|
|
|
|
|
|
|
|
||
|
Purchases of property, plant and equipment
|
12
|
(207,069
|
)
|
(198,550
|
)
|
(132,392
|
)
|
||
|
Purchase of cattle and non current biological assets
|
15
|
(5,706
|
)
|
(1,694
|
)
|
(1,713
|
)
|
||
|
Purchases of intangible assets
|
14
|
(3,321
|
)
|
(2,141
|
)
|
(1,218
|
)
|
||
|
Interest received
|
9
|
7,915
|
|
11,230
|
|
7,671
|
|
||
|
Proceeds from disposal of other property items
|
|
1,748
|
|
2,820
|
|
2,215
|
|
||
|
Proceeds from the sale of farmland and other assets
|
21
|
31,511
|
|
—
|
|
3,423
|
|
||
|
Net cash used in investing activities
|
(b)
|
(174,922
|
)
|
(188,335
|
)
|
|
(122,014
|
)
|
|
|
Cash flows from financing activities:
|
|
|
|
|
|
|
|
||
|
Issuance of senior notes
|
26
|
—
|
|
495,678
|
|
—
|
|
||
|
Proceeds from long-term borrowings
|
26
|
45,536
|
|
232,433
|
|
167,385
|
|
||
|
Payments of long-term borrowings
|
26
|
(124,349
|
)
|
(602,700
|
)
|
(277,913
|
)
|
||
|
Proceeds from short-term borrowings
|
26
|
318,108
|
|
106,730
|
|
257,395
|
|
||
|
Payments of short-term borrowings
|
26
|
(190,630
|
)
|
(64,787
|
)
|
(272,033
|
)
|
||
|
Interest paid
|
|
(50,021
|
)
|
(41,612
|
)
|
|
(48,400
|
)
|
|
|
Prepayment related expenses
|
—
|
|
(6,080
|
)
|
—
|
|
|||
|
Proceeds from equity settled shared-based compensation exercised
|
—
|
|
39
|
|
380
|
|
|||
|
Payment of derivatives financial instruments
|
|
(2,578
|
)
|
(9,476
|
)
|
(3,724
|
)
|
||
|
Purchase of own shares
|
|
(15,725
|
)
|
(38,367
|
)
|
(4,772
|
)
|
||
|
Dividends paid to non-controlling interest
|
(1,195
|
)
|
(1,664
|
)
|
—
|
|
|||
|
Net cash (used) / generated from financing activities
|
(c)
|
(20,854
|
)
|
70,194
|
|
|
(181,682
|
)
|
|
|
Net increase / (decrease) in cash and cash equivalents
|
|
22,737
|
|
118,964
|
|
|
(48,295
|
)
|
|
|
Cash and cash equivalents at beginning of year
|
20
|
269,195
|
|
158,568
|
|
198,894
|
|
||
|
Effect of exchange rate changes and inflation on cash and cash equivalents
|
(d)
|
(18,297
|
)
|
(8,337
|
)
|
7,969
|
|
||
|
Cash and cash equivalents at end of year
|
20
|
273,635
|
|
269,195
|
|
158,568
|
|
||
(*) Prior periods have been recast to reflect the Company's change in accounting policy for Investment properties as described in Note 33.
(a) Includes
7,598
of the combine effect of IAS 29 and IAS 21 of the Argentine subsidiaries.
(b) Includes
4,122
of the combine effect of IAS 29 and IAS 21 of the Argentine subsidiaries.
(c) Includes
(8,231)
of the combine effect of IAS 29 and IAS 21 of the Argentine subsidiaries.
(d) Includes
(3,489)
of the combine effect of IAS 29 and IAS 21 of the Argentine subsidiaries.
Non-cash investing and financing transactions disclosed in other notes are the seller financing of Subsidiaries in Note 21.
The accompanying notes are an integral part of these consolidated financial statements.
F-
12
Adecoagro S.A.
Notes to the Consolidated Financial Statements (Continued)
(All amounts in US$ thousands, except shares and per share data and as otherwise indicated)
|
1.
|
General information
|
Adecoagro S.A. (the "Company" or "Adecoagro") is the Group’s ultimate parent company and is a société anonyme (stock corporation) organized under the laws of the Grand Duchy of Luxembourg. Adecoagro is a holding company primarily engaged through its operating subsidiaries in agricultural and agro-industrial activities. The Company and its operating subsidiaries are collectively referred to hereinafter as the "Group". These activities are carried out through three major lines of business, namely, Farming; Sugar, Ethanol and Energy and Land Transformation. Farming is further comprised of three reportable segments, which are described in detail in Note 3 to these consolidated financial statements.
Adecoagro is a Public Company listed in the New York Stock Exchange as a foreign registered company under the symbol of AGRO.
These consolidated financial statements have been approved for issue by the Board of Directors on March 12, 2019.
|
2.
|
Financial risk management
|
Risk management principles and processes
The Group’s activities are exposed to a variety of financial risks. The Group’s overall risk management program focuses on the unpredictability of financial markets and seeks to minimize the Group’s capital costs by using suitable means of financing and to manage and control the Group’s financial risks effectively. The Group uses financial instruments to hedge certain risk exposures.
The Group’s approach to the identification, assessment and mitigation of risk is carried out by a Risk and Commercial Committee, which focuses on timely and appropriate management of risk.
The principal financial risks are related to raw material price, end-product price, exchange rate, interest rate, liquidity and credit. This section provides a description of the principal risks and uncertainties that could have a material adverse effect on the Group’s strategy, performance, results of operations and financial condition. These risks do not appear in any particular order of potential materiality or probability of occurrence.
|
•
|
Exchange rate risk
|
The Group’s cash flows, statement of income and statement of financial position are presented in U.S. Dollars and may be affected by fluctuations in exchange rates. Currency risks as defined by IFRS 7 arise on account of monetary assets and liabilities being denominated in a currency that is not the functional currency.
A significant majority of the Group’s business activities is conducted in the respective functional currencies of the subsidiaries (primarily the Brazilian Reais and the Argentine Peso). However, the Group may transact in currencies other than the respective functional currencies, mainly the U.S. Dollars. As such, these subsidiaries may hold U.S. Dollar denominated monetary balances at each year-end as indicated in the tables below.
The Group’s net financial position exposure to the U.S. Dollar is managed on a case-by-case basis, partly by hedging certain expected cash flows with foreign exchange derivative contracts.
The following tables show the net monetary position of the respective subsidiaries within the Group categorized by functional currency. Non-U.S. Dollar amounts are presented in U.S. Dollars for purpose of these tables.
The accompanying notes are an integral part of these consolidated financial statements.
F-
13
Adecoagro S.A.
Notes to the Consolidated Financial Statements (Continued)
(All amounts in US$ thousands, except shares and per share data and as otherwise indicated)
|
2.
|
Financial risk management (continued)
|
|
|
2018
|
|||||||||
|
|
Subsidiaries’ functional currency
|
|||||||||
|
Net monetary position
(Liability)/ Asset
|
Argentine
Peso
|
Brazilian
Reais
|
Uruguayan
Peso
|
U.S. Dollar
|
Total
|
|||||
|
Argentine Peso
|
(21,757
|
)
|
—
|
|
—
|
|
—
|
|
(21,757
|
)
|
|
Brazilian Reais
|
—
|
|
35,884
|
|
—
|
|
—
|
|
35,884
|
|
|
U.S. Dollar
|
(260,372
|
)
|
(480,501
|
)
|
24,512
|
|
115,681
|
|
(600,680
|
)
|
|
Uruguayan Peso
|
—
|
|
—
|
|
(909
|
)
|
—
|
|
(909
|
)
|
|
Total
|
(282,129
|
)
|
(444,617
|
)
|
23,603
|
|
115,681
|
|
(587,462
|
)
|
|
|
2017
|
|||||||||
|
|
Subsidiaries’ functional currency
|
|||||||||
|
Net monetary position
(Liability)/ Asset
|
Argentine
Peso
|
Brazilian
Reais
|
Uruguayan
Peso
|
U.S. Dollar
|
Total
|
|||||
|
Argentine Peso
|
(21,958
|
)
|
—
|
|
—
|
|
—
|
|
(21,958
|
)
|
|
Brazilian Reais
|
—
|
|
(17,134
|
)
|
—
|
|
—
|
|
(17,134
|
)
|
|
U.S. Dollar
|
(204,446
|
)
|
(461,966
|
)
|
20,451
|
|
124,125
|
|
(521,836
|
)
|
|
Uruguayan Peso
|
—
|
|
—
|
|
(1,101
|
)
|
—
|
|
(1,101
|
)
|
|
Total
|
(226,404
|
)
|
(479,100
|
)
|
19,350
|
|
124,125
|
|
(562,029
|
)
|
The Group’s analysis shown on the tables below is carried out based on the exposure of each functional currency subsidiary against the U.S. Dollar. The Group estimated that, other factors being constant, a hypothetical
10%
appreciation/depreciation of the U.S. Dollar against the respective functional currencies for the years ended
December 31, 2018
and
2017
would have decreased/increased the Group’s
Profit before income tax
for the year. A
10%
depreciation of the U.S. Dollar against the functional currencies would have an equal and opposite effect on the income statement. A portion of this effect would have been recognized as other comprehensive income since a portion of the Company’s borrowings was used as cash flow hedge of the foreign exchange rate risk of a portion of its highly probable future sales in U.S. Dollars (see Hedge Accounting - Cash Flow Hedge below for details).
|
|
Functional currency
|
||||||||
|
Net monetary position
|
Argentine
Peso
|
Brazilian
Reais
|
Uruguayan
Peso
|
Total
|
|||||
|
2018
|
U.S. Dollar
|
(26,037
|
)
|
(48,050
|
)
|
2,451
|
|
(71,636
|
)
|
|
2017
|
U.S. Dollar
|
(20,445
|
)
|
(46,197
|
)
|
2,045
|
|
(64,597
|
)
|
The tables above only consider the effect of a hypothetical appreciation / depreciation of the U.S. Dollars on the Group’s net financial position. A hypothetical appreciation / depreciation of the U.S. Dollar against the functional currencies of the Group’s subsidiaries has historically had a positive / negative effect, respectively, on the fair value of the Group’s biological assets and the end prices of the Group’s agriculture produce, both of which are generally linked to the U.S. Dollar.
Hedge Accounting Cash Flow Hedge
Effective July 1, 2013, the Group formally documented and designated cash flow hedging relationships to hedge the foreign exchange rate risk of a portion of its highly probable future sales in U.S. Dollars using a portion of its borrowings denominated in U.S. Dollars, currency forwards and foreign currency floating-to-fixed interest rate swaps.
Principal amounts of long-term borrowings (non-derivative financial instruments) and notional values of foreign currency forward contracts (derivative financial instruments) were designated as hedging instruments. These instruments are exposed to Brazilian Reais/ U.S. Dollar foreign currency risks related to operations in Brazil and Argentine Peso/U.S. Dollar in Argentina,
The accompanying notes are an integral part of these consolidated financial statements.
F-
14
Adecoagro S.A.
Notes to the Consolidated Financial Statements (Continued)
(All amounts in US$ thousands, except shares and per share data and as otherwise indicated)
|
2.
|
Financial risk management (continued)
|
respectively. As of
December 31, 2018
and
2017
, approximately
19.5%
and
24.6%
, respectively, of projected sales qualify as highly probable forecast transactions for hedge accounting purposes and were designated as hedged items.
The Group has prepared formal documentation in order to support the designation above, including an explanation of how the designation of the hedging relationship is aligned with the Group’s Risk Management Policy, identification of the hedging instrument, the hedged transactions, the nature of the risk being hedged and an analysis which demonstrates that the hedge is expected to be highly effective. The Group reassesses the prospective and retrospective effectiveness of the hedge on an ongoing basis comparing the foreign currency component of the carrying amount of the hedging instruments and of the highly probable future sales.
Under cash flow hedge accounting, effect of changes in foreign currency exchange rates on derivative and non-derivative hedging instruments not be immediately recognized in profit or loss, but be reclassified from equity to profit or loss in the periods when the future sales occur, thus allowing for a more appropriate presentation of the results for the period reflecting the strategy in the Group’s Risk Management Policy.
The Company expects that the cash flows will occur and affect profit or loss between
2019
and
2023
.
For the year ended
December 31, 2018
, a total amount before income tax of US$
75,822
gain (US$
530
gain in
2017
) was recognized in other comprehensive income and an amount of US$
26,693
loss (US$
20,758
loss in
2017
) was reclassified from equity to profit or loss within “Financial results, net”.
|
•
|
Raw material price risk
|
Inflation in the costs of raw materials and goods and services from industry suppliers and manufacturers presents risks to project economics. A significant portion of the Group’s cost structure includes the cost of raw materials primarily seeds, fertilizers and agrochemicals, among others. Prices for these raw materials may vary significantly.
|
•
|
End-product price risk
|
Prices for commodities products have historically been cyclical, reflecting overall economic conditions and changes in capacity within the industry, which affect the profitability of entities engaged in the agribusiness industry. The Group combines different actions to minimize price risk. A percentage of crops are to be sold during and post harvest period. The Group manages minimum and maximum prices for each commodity as well as gross margin per each crop as to decide when and how to sell. End-product price risks are hedged if economically viable and possible by entering into forward contracts with major trading houses or by using derivative financial instruments, consisting mainly of crops and sugar future contracts, but also includes occasionally put and call options. A movement in end-product futures prices would result in a change in the fair value of the end product hedging contracts. These fair value changes, after taxes, are recorded in the statement of income.
Contract positions are designed to ensure that the Group would receive a defined minimum price for certain quantities of its production. The counterparties to these instruments generally are major financial institutions. In entering into these contracts, the Group has assumed the risk that might arise from the possible inability of counterparties to meet the terms of their contracts. The Group does not expect any material losses as a result of counterparty defaults. The Group is also obliged to pay margin deposits and premiums for these instruments. These estimates represent only the sensitivity of the financial instruments to market risk and not the Group exposure to end product price risks as a whole, since the crops and cattle products sales are not financial instruments within the scope of IFRS 7 disclosure requirements.
|
•
|
Liquidity risk
|
The Group is exposed to liquidity risks, including risks associated with refinancing borrowings as they mature, and that borrowing facilities are not available to meet cash requirements. Failure to manage liquidity risks could have a material impact on the Group’s cash flow and statement of financial position.
Prudent liquidity risk management includes managing the profile of debt maturities and funding sources close oversight of cash flows projections, maintaining sufficient cash, and ensuring the availability of funding from an adequate amount of
The accompanying notes are an integral part of these consolidated financial statements.
F-
15
Adecoagro S.A.
Notes to the Consolidated Financial Statements (Continued)
(All amounts in US$ thousands, except shares and per share data and as otherwise indicated)
|
2.
|
Financial risk management (continued)
|
committed credit facilities and the ability to close out market positions. The Group's ability to fund its existing and prospective debt requirements is managed by maintaining diversified funding sources with adequate available funding lines from high quality lenders; and reaching to have long-term financial facilities. During 2017 the Company issued a
10
years Note, which improved the maturity of the borrowings (see Note 26).
As of
December 31, 2018
, cash and cash equivalents of the Group totaled U$S
273.6 million
, which could be used for managing liquidity risk.
The tables below analyzes the Group’s non-derivative financial liabilities and derivative financial liabilities into relevant maturity groupings based on the remaining period at the statement of financial position to the contractual maturity date. The amounts disclosed in the table are the contractual undiscounted cash flows and as a result they do not reconcile to the amounts disclosed on the statement of financial position except for short-term payables when discounting is not applied.
|
At December 31, 2018
|
Less than
1 year
|
Between
1 and 2 years
|
Between 2
and 5 years
|
Over
5 Years
|
Total
|
|||||
|
Trade and other payables
|
95,956
|
|
6
|
|
18
|
|
187
|
|
96,167
|
|
|
Borrowings
|
190,671
|
|
74,478
|
|
286,557
|
|
636,836
|
|
1,188,542
|
|
|
Derivative financial instruments
|
258
|
|
25
|
|
—
|
|
—
|
|
283
|
|
|
Total
|
286,885
|
|
74,509
|
|
286,575
|
|
637,023
|
|
1,284,992
|
|
|
At December 31, 2017
|
Less than
1 year
|
Between
1 and 2 years
|
Between 2
and 5 years
|
Over
5 Years
|
Total
|
|||||
|
Trade and other payables
|
85,239
|
|
557
|
|
49
|
|
221
|
|
86,066
|
|
|
Borrowings
|
197,975
|
|
96,867
|
|
56,486
|
|
797,226
|
|
1,148,554
|
|
|
Derivative financial instruments
|
552
|
|
—
|
|
—
|
|
—
|
|
552
|
|
|
Total
|
283,766
|
|
97,424
|
|
56,535
|
|
797,447
|
|
1,235,172
|
|
|
•
|
Interest rate risk
|
The Group’s interest rate risk arises from long-term borrowings at floating rates, which expose the Group to cash flow interest rate risk. Borrowings issued at fixed rates expose the Group to fair value interest rate risk. The interest rate profile of the Group's borrowings is set out in Note 26.
The Group occasionally manages its cash flow interest rate risk exposure by using floating-to-fixed interest rate swaps. Such interest rate swaps have the economic effect of converting borrowings from floating rates to fixed rates.
The following tables show a breakdown of the Group’s fixed-rate and floating-rate borrowings per currency denomination and functional currency of the subsidiary issuing the loans (excluding finance leases). These analyses are performed after giving effect to interest rate swaps.
The analysis for the year ended
December 31, 2018
and
2017
is as follows:
The accompanying notes are an integral part of these consolidated financial statements.
F-
16
Adecoagro S.A.
Notes to the Consolidated Financial Statements (Continued)
(All amounts in US$ thousands, except shares and per share data and as otherwise indicated)
|
2.
|
Financial risk management (continued)
|
|
|
2018
|
|||||||||
|
|
Subsidiaries’ functional currency
|
|||||||||
|
Rate per currency denomination
|
Argentine
Peso
|
Brazilian
Reais
|
Uruguayan
Peso
|
U.S. Dollar
|
Total
|
|||||
|
Fixed rate:
|
|
|
|
|
|
|
|
|
||
|
Argentine Peso
|
2,320
|
|
—
|
|
—
|
|
—
|
|
2,320
|
|
|
Brazilian Reais
|
—
|
|
62,939
|
|
—
|
|
—
|
|
62,939
|
|
|
U.S. Dollar
|
49,218
|
|
87,722
|
|
16,510
|
|
504,368
|
|
657,818
|
|
|
Subtotal fixed-rate borrowings
|
51,538
|
|
150,661
|
|
16,510
|
|
504,368
|
|
723,077
|
|
|
Variable rate:
|
|
|
|
|
|
|
|
|
||
|
Brazilian Reais
|
—
|
|
19,329
|
|
—
|
|
—
|
|
19,329
|
|
|
U.S. Dollar
|
111,453
|
|
7,662
|
|
—
|
|
—
|
|
119,115
|
|
|
Subtotal variable-rate borrowings
|
111,453
|
|
26,991
|
|
—
|
|
—
|
|
138,444
|
|
|
Total borrowings as per analysis
|
162,991
|
|
177,652
|
|
16,510
|
|
504,368
|
|
861,521
|
|
|
Finance leases
|
595
|
|
—
|
|
—
|
|
—
|
|
595
|
|
|
Total borrowings as per statement of financial position
|
163,586
|
|
177,652
|
|
16,510
|
|
504,368
|
|
862,116
|
|
|
|
2017
|
|||||||||
|
|
Subsidiaries’ functional currency
|
|||||||||
|
Rate per currency denomination
|
Argentine
Peso
|
Brazilian
Reais
|
Uruguayan
Peso
|
U.S. Dollar
|
Total
|
|||||
|
Fixed rate:
|
|
|
|
|
|
|
|
|
||
|
Argentine Peso
|
6,448
|
|
—
|
|
—
|
|
—
|
|
6,448
|
|
|
Brazilian Reais
|
—
|
|
96,951
|
|
—
|
|
—
|
|
96,951
|
|
|
U.S. Dollar
|
68,963
|
|
34,675
|
|
10,010
|
|
504,004
|
|
617,652
|
|
|
Subtotal fixed-rate borrowings
|
75,411
|
|
131,626
|
|
10,010
|
|
504,004
|
|
721,051
|
|
|
Variable rate:
|
|
|
|
|
|
|
|
|
||
|
Brazilian Reais
|
—
|
|
27,668
|
|
—
|
|
—
|
|
27,668
|
|
|
U.S. Dollar
|
49,599
|
|
19,535
|
|
—
|
|
—
|
|
69,134
|
|
|
Subtotal variable-rate borrowings
|
49,599
|
|
47,203
|
|
—
|
|
—
|
|
96,802
|
|
|
Total borrowings as per analysis
|
125,010
|
|
178,829
|
|
10,010
|
|
504,004
|
|
817,853
|
|
|
Finance leases
|
105
|
|
—
|
|
—
|
|
—
|
|
105
|
|
|
Total borrowings as per statement of financial position
|
125,115
|
|
178,829
|
|
10,010
|
|
504,004
|
|
817,958
|
|
For the years ended
December 31, 2018
and
2017
, if interest rates on floating-rate borrowings had been
1%
higher with all other variables held constant, the Group’s
Profit before income tax
for the years would have decreased as shown below. A
1%
decrease in interest rates would have an equal and opposite effect on the income statement.
|
|
2018
|
|||||||||
|
|
Subsidiaries’ functional currency
|
|||||||||
|
Rate per currency denomination
|
Argentine
Peso
|
Brazilian
Reais
|
Uruguayan
Peso
|
U.S. Dollar
|
Total
|
|||||
|
Variable rate:
|
|
|
|
|
|
|
|
|
||
|
Brazilian Reais
|
—
|
|
(193
|
)
|
—
|
|
—
|
|
(193
|
)
|
|
U.S. Dollar
|
(1,115
|
)
|
(77
|
)
|
—
|
|
—
|
|
(1,192
|
)
|
|
Total effects on profit before income tax
|
(1,115
|
)
|
(270
|
)
|
—
|
|
—
|
|
(1,385
|
)
|
The accompanying notes are an integral part of these consolidated financial statements.
F-
17
Adecoagro S.A.
Notes to the Consolidated Financial Statements (Continued)
(All amounts in US$ thousands, except shares and per share data and as otherwise indicated)
|
2.
|
Financial risk management (continued)
|
|
|
2017
|
|||||||||
|
|
Subsidiaries’ functional currency
|
|||||||||
|
Rate per currency denomination
|
Argentine
Peso
|
Brazilian
Reias
|
Uruguayan
Peso
|
U.S. Dollar
|
Total
|
|||||
|
Variable rate:
|
|
|
|
|
|
|
|
|
||
|
Brazilian Reais
|
—
|
|
(277
|
)
|
—
|
|
—
|
|
(277
|
)
|
|
U.S. Dollar
|
(496
|
)
|
(195
|
)
|
—
|
|
—
|
|
(691
|
)
|
|
Total effects on profit before income tax
|
(496
|
)
|
(472
|
)
|
—
|
|
—
|
|
(968
|
)
|
The sensitivity analysis has been determined assuming that the change in interest rates had occurred at the date of the statement of financial position and had been applied to the exposure to interest rate risk for financial instruments in existence at that date. The
100
basis point increase or decrease represents management's assessment of a reasonable possible change in those interest rates, which have the most impact on the Group, specifically the United States and Brazilian rates over the period until the next annual statement of financial position date.
|
•
|
Credit risk
|
The Group’s exposures to credit risk arise in certain agreements in relation to amounts owed for physical product sales, the use of derivative instruments, and the investment of surplus cash balances. The Group is also exposed to political and economic risk events, which may cause non-payment of foreign currency obligations to the Group.
The Group’s policy is to manage credit exposure to trading counterparties within defined trading limits. All of the Group’s significant counterparties are assigned internal credit limits.
The Group sells to a large base of customers. Type and class of customers may differ depending on the Group’s business segments. For the years ended
December 31, 2018
and
2017
, more than
87%
and
97%
, respectively, of the Group’s sales of crops were sold to
49
and
111
well-known customers (both multinational and local) with good credit history with the Group. In the Sugar, Ethanol and Energy segment, sales of ethanol were concentrated in
54
and
7
customers, which represented
100%
and
100%
of total sales of ethanol for the years ended
December 31, 2018
and
2017
, respectively. Approximately
99%
and
87%
of the Group’s sales of sugar were concentrated in
19
and
24
well-known traders for the years ended
December 31, 2018
and
2017
, respectively. The remaining
1%
and
13%
, which mainly relates to “crystal sugar”, were dispersed among several customers. In
2018
and
2017
, energy sales are
97%
and
99%
concentrated in
29
major customers. In the dairy segment,
92%
and
100%
of the sales were concentrated in
21
and
29
well-known customers in
2018
and
2017
, respectively.
No credit limits were exceeded during the reporting periods and management does not expect any losses from non-performance by these counterparties. If any of the Group’s customers are independently rated, these ratings are used. Otherwise, the Group assesses the credit quality of the customer taking into account its financial position, past experience and other factors (see Note 18 for details). The Group may seek cash collateral, letter of credit or parent company guarantees, as considered appropriate. Sales to customers are primarily made by credit with customary payment terms. The maximum exposure to credit risk is represented by the carrying amount of each financial asset in the statement of financial position after deducting any impairment allowance. The Group’s exposure of credit risk arising from trade receivables is set out in Note 18.
The Group is exposed to counterparty credit risk on cash and cash equivalent balances. The Group holds cash on deposit with a number of financial institutions. The Group manages its credit risk exposure by limiting individual deposits to clearly defined limits. The Group only deposits with high quality banks and financial institutions. As of
December 31, 2018
and
2017
, the total amount of cash and cash equivalents mainly comprise cash in banks and short-term bank deposits. The Group is authorized to transact with banks rated “BBB+” or higher. As of
December 31, 2018
and
2017
,
5
and
4
banks (primarily JP Morgan, HSBC, Banco Safra, Banco do Brasil and Banco Bradesco) accounted for more than
78%
and
78%
, respectively, of the total cash deposited. The remaining amount of cash and cash equivalents relates to cash in hand. Additionally, during the year ended
December 31, 2018
, the Group invested in fixed-term bank deposits with mainly
one
bank (HSBC) and also entered into derivative contracts (currency forward). The Group’s exposure of credit risk arising from cash and cash equivalents is set out in Note 20.
The accompanying notes are an integral part of these consolidated financial statements.
F-
18
Adecoagro S.A.
Notes to the Consolidated Financial Statements (Continued)
(All amounts in US$ thousands, except shares and per share data and as otherwise indicated)
|
2.
|
Financial risk management (continued)
|
The Group’s primary objective for holding derivative financial instruments is to manage currency exchange rate risk, interest rate risk and commodity price risk. The Group generally enters into derivative transactions with high-credit-quality counterparties and, by policy, limits the amount of credit exposure to any one counterparty based on an analysis of that counterparty's relative credit standing. The amounts subject to credit risk related to derivative instruments are generally limited to the amounts, if any, by which counterparty's obligations exceed the obligations with that counterparty.
The Group also entered into crop commodity futures traded in the established trading markets of Argentina and Brazil through well-rated brokers. Management does not expect any counterparty to fail to meet its obligations.
|
•
|
Capital risk management
|
The Group’s objectives when managing capital are to safeguard the Group’s ability to continue as a going concern in order to provide returns for shareholders and benefits for other stakeholders and to maintain an optimal capital structure to reduce the cost of capital. In order to maintain or adjust the capital structure, it may adjust the amount of dividends paid to shareholders, return capital to shareholders, issue new shares or by own shares or sell assets to reduce debt. Consistent with others in the industry, the Group monitors capital on the basis of the gearing ratio. This ratio is calculated as total debt (including current and non-current borrowings as shown in the consolidated statement of financial position, if applicable) divided by total capital. Total capital is calculated as equity, as shown in the consolidated statement of financial position, plus total debt. During the year ended
December 31, 2018
, the strategy was to maintain the gearing ratio within
0.40
to
0.60
, as follows:
|
|
2018
|
2017 (*)
|
|||
|
Total debt
|
862,116
|
|
817,958
|
|
|
|
Total equity
|
1,108,145
|
|
683,019
|
|
|
|
Total capital
|
1,970,261
|
|
1,500,977
|
|
|
|
Gearing ratio
|
0.44
|
|
0.54
|
|
|
(*) Prior periods have been recast to reflect the Company's change in accounting policy for Investment properties as described in Note 33.
|
•
|
Derivative financial instruments
|
As part of its business operations, the Group uses a variety of derivative financial instruments to manage its exposure to the financial risks discussed above. As part of this strategy, the Group may enter into derivatives of (i) interest rate to manage the composition of floating and fixed rate debt; (ii) currency to manage exchange rate risk, and (iii) crop (future contracts and put and call options) to manage its exposure to price volatility stemming from its integrated crop production activities. The Group’s policy is not to use derivatives for speculative purposes.
Derivative financial instruments involve, to a varying degree, elements of market and credit risk not recognized in the financial statements. The market risk associated with these instruments resulting from price movements is expected to offset the market risk of the underlying transactions, assets and liabilities, being hedged. The counterparties to the agreements relating to the Group’s contracts generally are large institutions with credit ratings equal to or higher than BBB+. The Group continually monitors the credit rating of such counterparties and seeks to limit its financial exposure to any one financial institution. While the contract or notional amounts of derivative financial instruments provide one measure of the volume of these transactions, they do not represent the amount of the Group’s exposure to credit risk. The amounts potentially subject to credit risk (arising from the possible inability of counterparties to meet the terms of their contracts) are generally limited to the amounts, if any, by which the counterparties’ obligations under the contracts exceed the Group’s obligations to the counterparties.
The accompanying notes are an integral part of these consolidated financial statements.
F-
19
Adecoagro S.A.
Notes to the Consolidated Financial Statements (Continued)
(All amounts in US$ thousands, except shares and per share data and as otherwise indicated)
|
2.
|
Financial risk management (continued)
|
The following tables show the outstanding positions for each type of derivative contract as of the date of each statement of financial position:
|
▪
|
Futures/ options
|
As of
December 31, 2018
:
|
|
2018
|
|||||||||||
|
Type of
derivative contract
|
Quantities
(thousands)
(**)
|
Notional
amount
|
Fair
Value Asset/
(Liability)
|
(Loss)/Gain
(*)
|
||||||||
|
Futures:
|
|
|
|
|
|
|
|
|
||||
|
Sale
|
|
|
|
|
|
|
|
|
||||
|
Corn
|
(97
|
)
|
(14,791
|
)
|
(209
|
)
|
(209
|
)
|
||||
|
Soybean
|
25
|
|
8,089
|
|
527
|
|
177
|
|
||||
|
Wheat
|
(14
|
)
|
(2,483
|
)
|
(11
|
)
|
(85
|
)
|
||||
|
Sugar
|
208,837
|
|
64,753
|
|
5,483
|
|
12,765
|
|
||||
|
Options:
|
|
|
|
|
|
|
|
|
||||
|
Buy put
|
||||||||||||
|
Sugar
|
6,326
|
|
128
|
|
267
|
|
393
|
|
||||
|
Sell call
|
||||||||||||
|
Sugar
|
1,118
|
|
132
|
|
(25
|
)
|
(156
|
)
|
||||
|
Total
|
216,195
|
|
55,828
|
|
6,032
|
|
12,885
|
|
||||
As of
December 31, 2017
:
|
|
2017
|
|||||||||||
|
Type of
derivative contract
|
Quantities
(thousands)
(**)
|
Notional
amount
|
Fair
Value Asset/
(Liability)
|
(Loss)/Gain
(*)
|
||||||||
|
Futures:
|
|
|
|
|
|
|
|
|
||||
|
Sale
|
|
|
|
|
|
|
|
|
||||
|
Corn
|
(33
|
)
|
(3,198
|
)
|
48
|
|
361
|
|
||||
|
Soybean
|
83
|
|
19,195
|
|
670
|
|
(765
|
)
|
||||
|
Wheat
|
(45
|
)
|
(7,083
|
)
|
(38
|
)
|
(38
|
)
|
||||
|
Sugar
|
343,874
|
|
121,072
|
|
3,231
|
|
3,808
|
|
||||
|
Options:
|
|
|
|
|
|
|
|
|
||||
|
Sell put
|
|
|
|
|
|
|
|
|
||||
|
Sugar
|
3,572
|
|
83
|
|
54
|
|
(30
|
)
|
||||
|
Total
|
347,451
|
|
130,069
|
|
3,965
|
|
3,336
|
|
||||
(*) Included in the line item “(Loss) / Gain from commodity derivative financial instruments” of Note 8.
(**) All quantities expressed in tons and m
3
.
Commodity future contract fair values are computed with reference to quoted market prices on future exchanges.
The accompanying notes are an integral part of these consolidated financial statements.
F-
20
Adecoagro S.A.
Notes to the Consolidated Financial Statements (Continued)
(All amounts in US$ thousands, except shares and per share data and as otherwise indicated)
|
2.
|
Financial risk management (continued)
|
|
▪
|
Foreign currency floating-to-fixed interest rate swap
|
In July 2016 the Group's subsidiary in Brazil, Adecoagro Vale do Ivinhema entered into a Reais
90 million
loan with Bradesco. The loan bears interest at a variable rate of CDI (an interbanking floating interest rate in US$) plus
2.1%
per year. At same moment and with same bank, the Company entered into a swap operation, which intention was to effectively convert the principal amount and interest rate denominated in Reais, to a principal amount an interest rate denominated in US$, plus a fixed rate of
6.55%
. The swap expired on Sep 2017. As of expiration date, the group recognized a gain of US$
3
included whitin "Financial Results, net.”
|
▪
|
Currency forward
|
During the year ended on
December 31, 2018
, the Group entered into several currency forward contracts in order to hedge the fluctuation of the U.S. Dollar against Euro for a total notional amount of US$
4.9 million
. The currency forward contracts maturity date is January 2019. The outstanding contracts resulted in the recognition of a gain amounting to US$
0.1 million
in
2018
.
During 2017 the Group did not entered into any currency forward contract in Brazil. During the year ended December 31, 2016 the Group entered into several currency forward contracts with Brazilian banks in order to hedge the fluctuation of the Brazilian Reais against the U.S. Dollar for a total aggregate amount of US$
57.2 million
. The currency forward contracts entered in 2016 had maturity dates ranging between March 2016 and April 2017. These contracts resulted in a recognition of a loss of US$
2.0 million
and US$
5.0 million
in
2018
and
2017
, respectively.
During the year ended on
December 31, 2017
, the Group entered into several currency forward contracts in order to hedge the fluctuation of the U.S. Dollar against Euro for a total notional amount of US$
10.5 million
. The currency forward contracts maturity date is March 2017. The outstanding contracts resulted in the recognition of a gain amounting to US$
0.1 million
in
2017
.
Gains and losses on currency forward contracts are included within “Financial results, net” in the statement of income.
|
▪
|
Euro-bob price swap
|
As Petrobras (the Brazilian oil state company) started to track the movements of the international gasoline to set its domestic prices in 2017, the Group's subsidiary in Brazil, Adecoagro Vale do Ivinhema entered into a swap operation in March 2018, which intention was to mitigate the effects of the gasoline volatility in the ethanol prices sold by the company. The swaps expired according to the due dates and as of December 31, 2018 all the swaps positions were already liquidated. The Group recorded a loss of US$
1.6 million
.
The accompanying notes are an integral part of these consolidated financial statements.
F-
21
Adecoagro S.A.
Notes to the Consolidated Financial Statements (Continued)
(All amounts in US$ thousands, except shares and per share data and as otherwise indicated)
|
3.
|
Segment information
|
According to IFRS 8, operating segments are identified based on the ‘management approach’. Operating segments are components of an entity about which separate financial information is available that is evaluated regularly by the chief operating decision maker (“CODM”) in deciding how to allocate resources and in assessing performance. The Group’s CODM is the Management Committee. IFRS 8 stipulates external segment reporting based on the Group’s internal organizational and management structure and on internal financial reporting to the chief operating decision maker.
The Group operates in three major lines of business, namely, Farming; Sugar, Ethanol and Energy; and Land Transformation.
•
The Company’s ‘Farming’ is further comprised of five reportable segments:
•
The Company’s ‘Crops’ Segment consists of planting, harvesting and sale of grains, oilseeds and fibers (including wheat, corn, soybeans, cotton and sunflowers, among others), and to a lesser extent the provision of grain warehousing/conditioning and handling and drying services to third parties. Each underlying crop in this segment does not represent a separate operating segment. Management seeks to maximize the use of the land through the cultivation of one or more type of crops. Types and surface amount of crops cultivated may vary from harvest year to harvest year depending on several factors, some of them out of the Group´s control. Management is focused on the long-term performance of the productive land, and to that extent, the performance is assessed considering the aggregated combination, if any, of crops planted in the land. A single manager is responsible for the management of operating activity of all crops rather than for each individual crop.
•
The Company’s ‘Rice’ Segment consists of planting, harvesting, processing and marketing of rice.
•
The Company’s ‘Dairy’ Segment consists of the production and sale of raw milk and other dairy products.
•
The Company’s ‘All Other Segments’ consists of the aggregation of the remaining non-reportable operating segments, which do not meet the quantitative thresholds for disclosure, namely, Coffee and Cattle.
•
The Company’s ‘Sugar, Ethanol and Energy’ Segment consists of cultivating sugarcane which is processed in owned sugar mills, transformed into ethanol, sugar and electricity and marketed;
•
The Company’s ‘Land Transformation’ Segment comprises the (i) identification and acquisition of underdeveloped and undermanaged farmland businesses; and (ii) realization of value through the strategic disposition of assets (generating profits).
Total segment assets and liabilities are measured in a manner consistent with that of the consolidated financial statements. These assets and liabilities are allocated based on the operations of the segment and the physical location of the asset.
Effective July 1, 2018, the Group applied IAS 29 “Financial Reporting in Hyperinflationary Economies” (“IAS 29”) to its operations in Argentina. IAS 29 “Financial Reporting in Hyperinflationary Economies” requires that the financial statements of entities whose functional currency is that of a hyperinflationary economy be adjusted for the effects of changes in the general price index and be expressed in terms of the current unit of measurement at the closing date of the reporting period (“inflation accounting”). In order to determine whether an economy is classified as hyperinflationary, IAS 29 sets forth a series of factors to be considered, including whether the amount of cumulative inflation nears or exceeds a threshold of 100 %. Accordingly, Argentina has been classified as a hyperinflationary economy under the terms of IAS 29 from July 1, 2018. (Please see Note 33 - Basis of preparation and presentations).
According to IAS 29, all Argentine Peso-denominated non-monetary items in the statement of financial position are adjusted by applying a general price index from the date they were initially recognized to the end of the reporting period. Likewise, all Argentine Peso-denominated items in the statement of income should be expressed in terms of the measuring unit current at the end of the reporting period, consequently, income statement items are adjusted by applying a general price index on a monthly basis from the dates they were initially recognized in the financial statements to the end of the reporting period. This process is called “re-measurement”.
The accompanying notes are an integral part of these consolidated financial statements.
F-
22
Adecoagro S.A.
Notes to the Consolidated Financial Statements (Continued)
(All amounts in US$ thousands, except shares and per share data and as otherwise indicated)
|
3.
|
Segment information (continued)
|
Once the re-measurement process is completed, all Argentine Peso denominated accounts are translated into U.S. Dollars, the Group’s reporting currency, applying the guidelines in IAS 21 “The Effects of Changes in Foreign Exchange Rates”(“IAS 21”). IAS 21 requires that amounts be translated at the closing rate at the date of the most recent statement of financial position. This process is called “translation”.
The re-measurement and translation processes are applied on a monthly basis until year-end. Due to this process, the re-measured and translated results of operations for a given month are subject to change until year-end, affecting comparison and analysis.
Following the adoption of IAS 29 to the Argentine operations of the Group, management revised the information reviewed by the CODM. Accordingly, as from July 1, 2018, (commencement of hyper-inflation accounting in Argentina), the information provided to the CODM departs from the application of IAS 29 and IAS 21 re-measurement and translation processes as follows. The segment results of the Argentinean operations for each reporting period were adjusted for inflation and translated into the Group’s reporting currency using the reporting period average exchange rate. The translated amounts were not subsequently re-measured and translated in accordance with the IAS 29 and IAS 21 procedures outlined above. From January 1, 2018 through June 30, 2018, the Group’s segment results were still based on the IFRS measurement principles adopted until June 30, 2018.
In order to evaluate the economic performance of businesses on a monthly basis, results of operations in Argentina are based on monthly data that have been adjusted for inflation and converted into the average exchange rate of the U.S. Dollar each month. These already converted figures are subsequently not readjusted and reconverted as described above under IAS 29 and IAS 21. It should be noted that this translation methodology for evaluating segment information is the same that the company uses to translate results of operation from its other subsidiaries from other countries that have not been designated hyperinflationary economies because it allows for a more accurate analysis of the economic performance of its business as a whole.
The Group’s CODM believes that the exclusion of the re-measurement and translation processes from the segment reporting structure allows for a more useful presentation and facilitates period-to-period comparison and performance analysis.
The following tables show a reconciliation of each reportable segment as per the information reviewed by the CODM and the reportable segment measured in accordance with IAS 29 and IAS 21 as per the consolidated financial statements.
|
Crops
|
Rice
|
Dairy
|
||||||||||||||||||||||||
|
Total segment reporting
|
Adjustment
|
Total as per statement of income
|
Total segment reporting
|
Adjustment
|
Total as per statement of income
|
Total segment reporting
|
Adjustment
|
Total as per statement of income
|
||||||||||||||||||
|
Sales of goods sold and services rendered
|
164,538
|
|
(9,120
|
)
|
155,418
|
|
100,013
|
|
(4,610
|
)
|
95,403
|
|
33,201
|
|
(3,491
|
)
|
29,710
|
|
||||||||
|
Cost of goods and services rendered
|
(165,988
|
)
|
9,052
|
|
(156,936
|
)
|
(75,739
|
)
|
766
|
|
(74,973
|
)
|
(31,488
|
)
|
3,361
|
|
(28,127
|
)
|
||||||||
|
Initial recognition and changes in fair value of biological assets and agricultural produce
|
36,422
|
|
(7,755
|
)
|
28,667
|
|
8,967
|
|
(4,842
|
)
|
4,125
|
|
7,295
|
|
(1,840
|
)
|
5,455
|
|
||||||||
|
Gain from changes in net realizable value of agricultural produce after harvest
|
2,704
|
|
(3,613
|
)
|
(909
|
)
|
—
|
|
—
|
|
—
|
|
—
|
|
—
|
|
—
|
|
||||||||
|
Margin on Manufacturing and Agricultural Activities Before Operating Expenses
|
37,676
|
|
(11,436
|
)
|
26,240
|
|
33,241
|
|
(8,686
|
)
|
24,555
|
|
9,008
|
|
(1,970
|
)
|
7,038
|
|
||||||||
|
General and administrative expenses
|
(4,239
|
)
|
37
|
|
(4,202
|
)
|
(5,070
|
)
|
(869
|
)
|
(5,939
|
)
|
(2,034
|
)
|
(246
|
)
|
(2,280
|
)
|
||||||||
|
Selling expenses
|
(5,921
|
)
|
474
|
|
(5,447
|
)
|
(15,465
|
)
|
1,375
|
|
(14,090
|
)
|
(983
|
)
|
41
|
|
(942
|
)
|
||||||||
|
Other operating income, net
|
5,422
|
|
1,741
|
|
7,163
|
|
275
|
|
(58
|
)
|
217
|
|
(1,055
|
)
|
58
|
|
(997
|
)
|
||||||||
|
Profit from Operations Before Financing and Taxation
|
32,938
|
|
(9,184
|
)
|
23,754
|
|
12,981
|
|
(8,238
|
)
|
4,743
|
|
4,936
|
|
(2,117
|
)
|
2,819
|
|
||||||||
|
Depreciation and amortization
|
(1,697
|
)
|
(329
|
)
|
(2,026
|
)
|
(5,846
|
)
|
5,840
|
|
(6
|
)
|
(2,253
|
)
|
(280
|
)
|
(2,533
|
)
|
||||||||
|
Net gain from Fair value adjustment of investment property
|
—
|
|
—
|
|
—
|
|
—
|
|
—
|
|
—
|
|
—
|
|
—
|
|
—
|
|
||||||||
The accompanying notes are an integral part of these consolidated financial statements.
F-
23
Adecoagro S.A.
Notes to the Consolidated Financial Statements (Continued)
(All amounts in US$ thousands, except shares and per share data and as otherwise indicated)
|
3.
|
Segment information (continued)
|
|
All other segments
|
Corporate
|
Total
|
||||||||||||||||||||||||
|
Total segment reporting
|
Adjustment
|
Total as per statement of income
|
Total segment reporting
|
Adjustment
|
Total as per statement of income
|
Total segment reporting
|
Adjustment
|
Total as per statement of income
|
||||||||||||||||||
|
Sales of goods sold and services rendered
|
1,919
|
|
(149
|
)
|
1,770
|
|
—
|
|
—
|
|
—
|
|
810,609
|
|
(17,370
|
)
|
793,239
|
|
||||||||
|
Cost of goods and services rendered
|
(1,412
|
)
|
99
|
|
(1,313
|
)
|
—
|
|
—
|
|
—
|
|
(623,243
|
)
|
13,278
|
|
(609,965
|
)
|
||||||||
|
Initial recognition and changes in fair value of biological assets and agricultural produce
|
(806
|
)
|
(393
|
)
|
(1,199
|
)
|
—
|
|
—
|
|
—
|
|
31,025
|
|
(14,830
|
)
|
16,195
|
|
||||||||
|
Gain from changes in net realizable value of agricultural produce after harvest
|
—
|
|
—
|
|
—
|
|
—
|
|
—
|
|
—
|
|
2,704
|
|
(3,613
|
)
|
(909
|
)
|
||||||||
|
Margin on Manufacturing and Agricultural Activities Before Operating Expenses
|
(299
|
)
|
(443
|
)
|
(742
|
)
|
—
|
|
—
|
|
—
|
|
221,095
|
|
(22,535
|
)
|
198,560
|
|
||||||||
|
General and administrative expenses
|
(155
|
)
|
(9
|
)
|
(164
|
)
|
(19,626
|
)
|
1,433
|
|
(18,193
|
)
|
(56,426
|
)
|
346
|
|
(56,080
|
)
|
||||||||
|
Selling expenses
|
(165
|
)
|
16
|
|
(149
|
)
|
(178
|
)
|
33
|
|
(145
|
)
|
(92,154
|
)
|
1,939
|
|
(90,215
|
)
|
||||||||
|
Other operating income, net
|
10,668
|
|
2,728
|
|
13,396
|
|
(167
|
)
|
36
|
|
(131
|
)
|
99,727
|
|
4,505
|
|
104,232
|
|
||||||||
|
Profit from Operations Before Financing and Taxation
|
10,049
|
|
2,292
|
|
12,341
|
|
(19,971
|
)
|
1,502
|
|
(18,469
|
)
|
172,242
|
|
(15,745
|
)
|
156,497
|
|
||||||||
|
Depreciation and amortization
|
(171
|
)
|
(6
|
)
|
(177
|
)
|
—
|
|
—
|
|
—
|
|
(153,169
|
)
|
(1,085
|
)
|
(154,254
|
)
|
||||||||
|
Net gain from Fair value adjustment of investment property
|
10,680
|
|
2,729
|
|
13,409
|
|
—
|
|
—
|
|
—
|
|
10,680
|
|
2,729
|
|
13,409
|
|
||||||||
Sugar, Ethanol and Energy, and Land Transformation segments have not been reconciliated due to the lack of differences.
The accompanying notes are an integral part of these consolidated financial statements.
F-
24
Adecoagro S.A.
Notes to the Consolidated Financial Statements (Continued)
(All amounts in US$ thousands, except shares and per share data and as otherwise indicated)
|
3.
|
Segment information (continued)
|
The following table presents information with respect to the Group’s reportable segments. Certain other activities of a holding function nature not allocable to the segments are disclosed in the column
‘Corporate’
.
Segment analysis for the year ended
December 31, 2018
|
|
Farming
|
Sugar,
Ethanol and Energy
|
Land Transformation
|
Corporate
|
Total
|
|||||||||||||||||||||
|
|
Crops
|
Rice
|
Dairy
|
All other
segments
|
Farming
subtotal
|
|||||||||||||||||||||
|
Sales of goods and services rendered
|
164,538
|
|
100,013
|
|
33,201
|
|
1,919
|
|
299,671
|
|
510,938
|
|
—
|
|
—
|
|
810,609
|
|
||||||||
|
Cost of goods sold and services rendered
|
(165,988
|
)
|
(75,739
|
)
|
(31,488
|
)
|
(1,412
|
)
|
(274,627
|
)
|
(348,616
|
)
|
—
|
|
—
|
|
(623,243
|
)
|
||||||||
|
Initial recognition and changes in fair value of biological assets and agricultural produce
|
36,422
|
|
8,967
|
|
7,295
|
|
(806
|
)
|
51,878
|
|
(20,853
|
)
|
—
|
|
—
|
|
31,025
|
|
||||||||
|
Changes in net realizable value of agricultural produce after harvest
|
2,704
|
|
—
|
|
—
|
|
—
|
|
2,704
|
|
—
|
|
—
|
|
—
|
|
2,704
|
|
||||||||
|
Margin on manufacturing and agricultural activities before operating expenses
|
37,676
|
|
33,241
|
|
9,008
|
|
(299
|
)
|
79,626
|
|
141,469
|
|
—
|
|
—
|
|
221,095
|
|
||||||||
|
General and administrative expenses
|
(4,239
|
)
|
(5,070
|
)
|
(2,034
|
)
|
(155
|
)
|
(11,498
|
)
|
(25,302
|
)
|
—
|
|
(19,626
|
)
|
(56,426
|
)
|
||||||||
|
Selling expenses
|
(5,921
|
)
|
(15,465
|
)
|
(983
|
)
|
(165
|
)
|
(22,534
|
)
|
(69,442
|
)
|
—
|
|
(178
|
)
|
(92,154
|
)
|
||||||||
|
Other operating income, net
|
5,422
|
|
275
|
|
(1,055
|
)
|
10,668
|
|
15,310
|
|
48,357
|
|
36,227
|
|
(167
|
)
|
99,727
|
|
||||||||
|
Profit / (loss) from operations before financing and taxation
|
32,938
|
|
12,981
|
|
4,936
|
|
10,049
|
|
60,904
|
|
95,082
|
|
36,227
|
|
(19,971
|
)
|
172,242
|
|
||||||||
|
Depreciation and amortization
|
(1,697
|
)
|
(5,846
|
)
|
(2,253
|
)
|
(171
|
)
|
(9,967
|
)
|
(143,202
|
)
|
—
|
|
—
|
|
(153,169
|
)
|
||||||||
|
Net gain from Fair value adjustment of investment property
|
—
|
|
—
|
|
—
|
|
10,680
|
|
10,680
|
|
—
|
|
—
|
|
—
|
|
10,680
|
|
||||||||
|
Initial recognition and changes in fair value of biological assets and agricultural produce (unrealized)
|
8,205
|
|
(181
|
)
|
(599
|
)
|
102
|
|
7,527
|
|
(37,808
|
)
|
—
|
|
—
|
|
(30,281
|
)
|
||||||||
|
Initial recognition and changes in fair value of biological assets and agricultural produce (realized)
|
28,217
|
|
9,148
|
|
7,894
|
|
(908
|
)
|
44,351
|
|
16,955
|
|
—
|
|
—
|
|
61,306
|
|
||||||||
|
Changes in net realizable value of agricultural produce after harvest (unrealized)
|
(647
|
)
|
—
|
|
—
|
|
—
|
|
(647
|
)
|
—
|
|
—
|
|
—
|
|
(647
|
)
|
||||||||
|
Changes in net realizable value of agricultural produce after harvest (realized)
|
3,351
|
|
—
|
|
—
|
|
—
|
|
3,351
|
|
—
|
|
—
|
|
—
|
|
3,351
|
|
||||||||
|
Farmlands and farmland improvements, net
|
547,842
|
|
173,481
|
|
727
|
|
22,891
|
|
744,941
|
|
51,567
|
|
—
|
|
—
|
|
796,508
|
|
||||||||
|
Machinery, equipment and other fixed assets, net
|
5,049
|
|
23,135
|
|
32,821
|
|
459
|
|
61,464
|
|
338,607
|
|
—
|
|
—
|
|
400,071
|
|
||||||||
|
Bearer plants, net
|
427
|
|
—
|
|
—
|
|
—
|
|
427
|
|
232,529
|
|
—
|
|
—
|
|
232,956
|
|
||||||||
|
Work in progress
|
8,690
|
|
5,214
|
|
14,317
|
|
18
|
|
28,239
|
|
22,665
|
|
—
|
|
—
|
|
50,904
|
|
||||||||
|
Investment property
|
—
|
|
—
|
|
—
|
|
40,725
|
|
40,725
|
|
—
|
|
—
|
|
—
|
|
40,725
|
|
||||||||
|
Goodwill
|
9,463
|
|
4,142
|
|
—
|
|
2,110
|
|
15,715
|
|
5,635
|
|
—
|
|
—
|
|
21,350
|
|
||||||||
|
Biological assets
|
27,347
|
|
17,173
|
|
10,298
|
|
3,094
|
|
57,912
|
|
47,475
|
|
—
|
|
—
|
|
105,387
|
|
||||||||
|
Finished goods
|
29,144
|
|
9,507
|
|
1,170
|
|
—
|
|
39,821
|
|
39,937
|
|
—
|
|
—
|
|
79,758
|
|
||||||||
|
Raw materials, stocks held by third parties and others
|
15,834
|
|
7,394
|
|
2,217
|
|
121
|
|
25,566
|
|
22,778
|
|
—
|
|
—
|
|
48,344
|
|
||||||||
|
Total segment assets
|
643,796
|
|
240,046
|
|
61,550
|
|
69,418
|
|
1,014,810
|
|
761,193
|
|
—
|
|
—
|
|
1,776,003
|
|
||||||||
|
Borrowings
|
111,692
|
|
58,999
|
|
543
|
|
4,860
|
|
176,094
|
|
600,810
|
|
—
|
|
85,212
|
|
862,116
|
|
||||||||
|
Total segment liabilities
|
111,692
|
|
58,999
|
|
543
|
|
4,860
|
|
176,094
|
|
600,810
|
|
—
|
|
85,212
|
|
862,116
|
|
||||||||
The accompanying notes are an integral part of these consolidated financial statements.
F-
25
Adecoagro S.A.
Notes to the Consolidated Financial Statements (Continued)
(All amounts in US$ thousands, except shares and per share data and as otherwise indicated)
|
3.
|
Segment information (continued)
|
Segment analysis for the year ended
December 31, 2017
|
|
Farming
|
Sugar,
Ethanol and Energy
|
Land Transformation
|
Corporate
|
Total
|
|||||||||||||||||||||
|
|
Crops
|
Rice
|
Dairy
|
All other
segments
|
Farming
subtotal
|
|||||||||||||||||||||
|
Sales of goods and services rendered
|
197,222
|
|
86,478
|
|
37,523
|
|
1,336
|
|
322,559
|
|
610,619
|
|
—
|
|
—
|
|
933,178
|
|
||||||||
|
Cost of goods sold and services rendered
|
(196,302
|
)
|
(71,087
|
)
|
(36,979
|
)
|
(853
|
)
|
(305,221
|
)
|
(461,506
|
)
|
—
|
|
—
|
|
(766,727
|
)
|
||||||||
|
Initial recognition and changes in fair value of biological assets and agricultural produce
|
17,158
|
|
10,236
|
|
11,769
|
|
267
|
|
39,430
|
|
23,790
|
|
—
|
|
—
|
|
63,220
|
|
||||||||
|
Changes in net realizable value of agricultural produce after harvest
|
8,852
|
|
—
|
|
—
|
|
—
|
|
8,852
|
|
—
|
|
—
|
|
—
|
|
8,852
|
|
||||||||
|
Margin on manufacturing and agricultural activities before operating expenses
|
26,930
|
|
25,627
|
|
12,313
|
|
750
|
|
65,620
|
|
172,903
|
|
—
|
|
—
|
|
238,523
|
|
||||||||
|
General and administrative expenses
|
(2,981
|
)
|
(4,699
|
)
|
(1,058
|
)
|
(174
|
)
|
(8,912
|
)
|
(26,806
|
)
|
—
|
|
(21,581
|
)
|
(57,299
|
)
|
||||||||
|
Selling expenses
|
(7,501
|
)
|
(13,324
|
)
|
(711
|
)
|
(156
|
)
|
(21,692
|
)
|
(73,664
|
)
|
—
|
|
(43
|
)
|
(95,399
|
)
|
||||||||
|
Other operating income, net
|
7,719
|
|
724
|
|
662
|
|
4,279
|
|
13,384
|
|
30,419
|
|
—
|
|
(40
|
)
|
43,763
|
|
||||||||
|
Profit / (loss) from operations before financing and taxation
|
24,167
|
|
8,328
|
|
11,206
|
|
4,699
|
|
48,400
|
|
102,852
|
|
—
|
|
(21,664
|
)
|
129,588
|
|
||||||||
|
Depreciation and amortization
|
(1,511
|
)
|
(3,851
|
)
|
(1,037
|
)
|
(159
|
)
|
(6,558
|
)
|
(144,449
|
)
|
—
|
|
—
|
|
(151,007
|
)
|
||||||||
|
Net gain from Fair value adjustment of investment property
|
—
|
|
—
|
|
—
|
|
4,302
|
|
4,302
|
|
—
|
|
—
|
|
—
|
|
4,302
|
|
||||||||
|
Initial recognition and changes in fair value of biological assets and agricultural produce (unrealized)
|
4,366
|
|
5,346
|
|
1,849
|
|
159
|
|
11,720
|
|
2,925
|
|
—
|
|
—
|
|
14,645
|
|
||||||||
|
Initial recognition and changes in fair value of biological assets and agricultural produce (realized)
|
12,792
|
|
4,890
|
|
9,920
|
|
108
|
|
27,710
|
|
20,865
|
|
—
|
|
—
|
|
48,575
|
|
||||||||
|
Changes in net realizable value of agricultural produce after harvest (unrealized)
|
2,371
|
|
—
|
|
—
|
|
—
|
|
2,371
|
|
—
|
|
—
|
|
—
|
|
2,371
|
|
||||||||
|
Changes in net realizable value of agricultural produce after harvest (realized)
|
6,481
|
|
—
|
|
—
|
|
—
|
|
6,481
|
|
—
|
|
—
|
|
—
|
|
6,481
|
|
||||||||
|
Farmlands and farmland improvements, net
|
70,126
|
|
13,688
|
|
248
|
|
9,346
|
|
93,408
|
|
26,342
|
|
—
|
|
—
|
|
119,750
|
|
||||||||
|
Machinery, equipment and other fixed assets, net
|
21,365
|
|
18,851
|
|
12,175
|
|
341
|
|
52,732
|
|
390,350
|
|
—
|
|
—
|
|
443,082
|
|
||||||||
|
Bearer plants, net
|
252
|
|
—
|
|
—
|
|
1,832
|
|
2,084
|
|
236,826
|
|
—
|
|
—
|
|
238,910
|
|
||||||||
|
Work in progress
|
714
|
|
1,940
|
|
5,659
|
|
—
|
|
8,313
|
|
21,322
|
|
—
|
|
—
|
|
29,635
|
|
||||||||
|
Investment property
|
—
|
|
—
|
|
—
|
|
42,342
|
|
42,342
|
|
—
|
|
—
|
|
—
|
|
42,342
|
|
||||||||
|
Goodwill
|
3,221
|
|
1,480
|
|
—
|
|
1,110
|
|
5,811
|
|
6,601
|
|
—
|
|
—
|
|
12,412
|
|
||||||||
|
Biological assets
|
31,745
|
|
29,717
|
|
9,338
|
|
4,016
|
|
74,816
|
|
93,178
|
|
—
|
|
—
|
|
167,994
|
|
||||||||
|
Finished goods
|
21,146
|
|
8,476
|
|
—
|
|
—
|
|
29,622
|
|
32,266
|
|
—
|
|
—
|
|
61,888
|
|
||||||||
|
Raw materials,Stocks held by third parties and others
|
17,958
|
|
9,927
|
|
1,726
|
|
364
|
|
29,975
|
|
17,056
|
|
—
|
|
—
|
|
47,031
|
|
||||||||
|
Total segment assets
|
166,527
|
|
84,079
|
|
29,146
|
|
59,351
|
|
339,103
|
|
823,941
|
|
—
|
|
—
|
|
1,163,044
|
|
||||||||
|
Borrowings
|
69,789
|
|
62,790
|
|
2,384
|
|
3,829
|
|
138,792
|
|
633,638
|
|
—
|
|
45,528
|
|
817,958
|
|
||||||||
|
Total segment liabilities
|
69,789
|
|
62,790
|
|
2,384
|
|
3,829
|
|
138,792
|
|
633,638
|
|
—
|
|
45,528
|
|
817,958
|
|
||||||||
The accompanying notes are an integral part of these consolidated financial statements.
F-
26
Adecoagro S.A.
Notes to the Consolidated Financial Statements (Continued)
(All amounts in US$ thousands, except shares and per share data and as otherwise indicated)
|
3.
|
Segment information (continued)
|
Segment analysis for the year ended
December 31, 2016
|
|
Farming
|
Sugar,
Ethanol and Energy
|
Land Transformation
|
Corporate
|
Total
|
|||||||||||||||||||||
|
|
Crops
|
Rice
|
Dairy
|
All other
segments
|
Farming
subtotal
|
|||||||||||||||||||||
|
Sales of goods and services rendered
|
142,124
|
|
96,562
|
|
32,897
|
|
960
|
|
272,543
|
|
596,692
|
|
—
|
|
—
|
|
869,235
|
|
||||||||
|
Cost of goods sold and services rendered
|
(141,731
|
)
|
(83,574
|
)
|
(32,571
|
)
|
(212
|
)
|
(258,088
|
)
|
(420,493
|
)
|
—
|
|
—
|
|
(678,581
|
)
|
||||||||
|
Initial recognition and changes in fair value of biological assets and agricultural produce
|
48,790
|
|
10,498
|
|
5,476
|
|
(13
|
)
|
64,751
|
|
60,705
|
|
—
|
|
—
|
|
125,456
|
|
||||||||
|
Changes in net realizable value of agricultural produce after harvest
|
(5,841
|
)
|
—
|
|
—
|
|
—
|
|
(5,841
|
)
|
—
|
|
—
|
|
—
|
|
(5,841
|
)
|
||||||||
|
Margin on manufacturing and agricultural activities before operating expenses
|
43,342
|
|
23,486
|
|
5,802
|
|
735
|
|
73,365
|
|
236,904
|
|
—
|
|
—
|
|
310,269
|
|
||||||||
|
General and administrative expenses
|
(2,770
|
)
|
(3,373
|
)
|
(983
|
)
|
(290
|
)
|
(7,416
|
)
|
(22,648
|
)
|
—
|
|
(20,686
|
)
|
(50,750
|
)
|
||||||||
|
Selling expenses
|
(5,692
|
)
|
(11,583
|
)
|
(752
|
)
|
(49
|
)
|
(18,076
|
)
|
(62,518
|
)
|
—
|
|
(79
|
)
|
(80,673
|
)
|
||||||||
|
Other operating income, net
|
(8,787
|
)
|
402
|
|
686
|
|
22,546
|
|
14,847
|
|
(8,903
|
)
|
—
|
|
(192
|
)
|
5,752
|
|
||||||||
|
Profit / (loss) from operations before financing and taxation
|
26,093
|
|
|
8,932
|
|
|
4,753
|
|
|
22,942
|
|
|
62,720
|
|
|
142,835
|
|
|
—
|
|
|
(20,957
|
)
|
|
184,598
|
|
|
Depreciation and amortization
|
(1,369
|
)
|
(2,766
|
)
|
(964
|
)
|
(192
|
)
|
(5,291
|
)
|
(122,209
|
)
|
—
|
|
—
|
|
(127,500
|
)
|
||||||||
|
Net gain from Fair value adjustment of investment property
|
—
|
|
—
|
|
—
|
|
14,049
|
|
14,049
|
|
—
|
|
—
|
|
—
|
|
14,049
|
|
||||||||
|
Initial recognition and changes in fair value of biological assets and agricultural produce (unrealized)
|
5,790
|
|
2,316
|
|
1,319
|
|
107
|
|
9,532
|
|
279
|
|
—
|
|
—
|
|
9,811
|
|
||||||||
|
Initial recognition and changes in fair value of biological assets and agricultural produce (realized)
|
43,000
|
|
8,182
|
|
4,157
|
|
(120
|
)
|
55,219
|
|
60,426
|
|
—
|
|
—
|
|
115,645
|
|
||||||||
|
Changes in net realizable value of agricultural produce after harvest (unrealized)
|
(90
|
)
|
—
|
|
—
|
|
—
|
|
(90
|
)
|
—
|
|
—
|
|
—
|
|
(90
|
)
|
||||||||
|
Changes in net realizable value of agricultural produce after harvest (realized)
|
(5,751
|
)
|
—
|
|
—
|
|
—
|
|
(5,751
|
)
|
—
|
|
—
|
|
—
|
|
(5,751
|
)
|
||||||||
Total segment assets and liabilities are measured in a manner consistent with that of the consolidated financial statements. These assets and liabilities are allocated based on the operations of the segment and the physical location of the asset.
The accompanying notes are an integral part of these consolidated financial statements.
F-
27
Adecoagro S.A.
Notes to the Consolidated Financial Statements (Continued)
(All amounts in US$ thousands, except shares and per share data and as otherwise indicated)
|
3.
|
Segment information (continued)
|
Total reportable segments’ assets and liabilities are reconciled to total assets as per the statement of financial position as follows:
|
|
2018
|
2017
|
|||
|
Total reportable assets as per segment information
|
1,776,003
|
|
1,163,044
|
|
|
|
Intangible assets (excluding goodwill)
|
6,559
|
|
4,780
|
|
|
|
Deferred income tax assets
|
16,191
|
|
30,808
|
|
|
|
Trade and other receivables
|
197,506
|
|
172,214
|
|
|
|
Other assets
|
1,192
|
|
565
|
|
|
|
Derivative financial instruments
|
6,286
|
|
4,483
|
|
|
|
Cash and cash equivalents
|
273,635
|
|
269,195
|
|
|
|
Total assets as per the statement of financial position
|
2,277,372
|
|
1,645,089
|
|
|
|
|
2018
|
2017
|
|||
|
Total reportable liabilities as per segment information
|
862,116
|
|
817,958
|
|
|
|
Trade and other payables
|
106,437
|
|
99,250
|
|
|
|
Deferred income tax liabilities
|
168,171
|
|
10,457
|
|
|
|
Payroll and social liabilities
|
27,197
|
|
28,507
|
|
|
|
Provisions for other liabilities
|
3,625
|
|
4,843
|
|
|
|
Current income tax liabilities
|
1,398
|
|
503
|
|
|
|
Derivative financial instruments
|
283
|
|
552
|
|
|
|
Total liabilities as per the statement of financial position
|
1,169,227
|
|
962,070
|
|
|
Non-current assets and revenues and fair value gains and losses are shown by geographic region. These are the regions in which the Group is active: Argentina, Brazil and Uruguay.
As of and for the year ended
December 31, 2018
:
|
|
Argentina
|
Brazil
|
Uruguay
|
Total
|
|||||||
|
Property, plant and equipment
|
811,890
|
|
656,586
|
|
11,963
|
|
1,480,439
|
|
|||
|
Investment property
|
40,725
|
|
—
|
|
—
|
|
40,725
|
|
|||
|
Goodwill
|
15,081
|
|
6,269
|
|
—
|
|
21,350
|
|
|||
|
Non-current portion of biological assets
|
11,270
|
|
—
|
|
—
|
|
11,270
|
|
|||
|
Sales of goods and services rendered
|
207,480
|
|
496,966
|
|
106,163
|
|
810,609
|
|
|||
|
Initial recognition and changes in fair value of biological assets and agricultural produce
|
45,985
|
|
(13,541
|
)
|
(1,419
|
)
|
31,025
|
|
|||
|
Changes in net realizable value of agricultural produce after harvest
|
1,148
|
|
1,436
|
|
120
|
|
2,704
|
|
|||
The accompanying notes are an integral part of these consolidated financial statements.
F-
28
Adecoagro S.A.
Notes to the Consolidated Financial Statements (Continued)
(All amounts in US$ thousands, except shares and per share data and as otherwise indicated)
|
3.
|
Segment information (continued)
|
As of and for the year ended
December 31, 2017
:
|
|
Argentina
|
Brazil
|
Uruguay
|
Total
|
|||||||
|
Property, plant and equipment
|
113,758
|
|
710,523
|
|
7,096
|
|
831,377
|
|
|||
|
Investment property
|
42,342
|
|
—
|
|
—
|
|
42,342
|
|
|||
|
Goodwill
|
5,095
|
|
7,317
|
|
—
|
|
12,412
|
|
|||
|
Non-current portion of biological assets
|
11,276
|
|
—
|
|
—
|
|
11,276
|
|
|||
|
Sales of goods and services rendered
|
214,888
|
|
545,859
|
|
172,431
|
|
933,178
|
|
|||
|
Initial recognition and changes in fair value of biological assets and agricultural produce
|
36,341
|
|
26,326
|
|
553
|
|
63,220
|
|
|||
|
Changes in net realizable value of agricultural produce after harvest
|
5,705
|
|
1,346
|
|
1,801
|
|
8,852
|
|
|||
As of and for the year ended
December 31, 2016
:
|
|
Argentina
|
Brazil
|
Uruguay
|
Total
|
|||||||
|
Sales of goods and services rendered
|
164,264
|
|
432,468
|
|
272,503
|
|
869,235
|
|
|||
|
Initial recognition and changes in fair value of biological assets and agricultural produce
|
62,970
|
|
62,556
|
|
(70
|
)
|
125,456
|
|
|||
|
Loss from changes in net realizable value of agricultural produce after harvest
|
(4,491
|
)
|
(958
|
)
|
(392
|
)
|
(5,841
|
)
|
|||
The accompanying notes are an integral part of these consolidated financial statements.
F-
29
Adecoagro S.A.
Notes to the Consolidated Financial Statements (Continued)
(All amounts in US$ thousands, except shares and per share data and as otherwise indicated)
|
4.
|
Sales
|
|
|
2018
|
2017
|
2016
|
|||||
|
Manufactured products and services rendered:
|
|
|
|
|
|
|
||
|
Rice
|
92,560
|
|
83,849
|
|
94,331
|
|
||
|
Ethanol
|
324,661
|
|
241,650
|
|
211,451
|
|
||
|
Sugar
|
128,377
|
|
305,688
|
|
330,895
|
|
||
|
Soybean oil and meal
|
14,059
|
|
6,119
|
|
—
|
|
||
|
Energy
|
57,797
|
|
62,218
|
|
53,995
|
|
||
|
Powder milk
|
8,646
|
|
2,713
|
|
4,816
|
|
||
|
Services
|
487
|
|
1,144
|
|
1,160
|
|
||
|
Operating Leases
|
643
|
|
771
|
|
984
|
|
||
|
Others
|
7,826
|
|
5,273
|
|
1,423
|
|
||
|
|
635,056
|
|
709,425
|
|
699,055
|
|
||
|
Agricultural produce and biological assets:
|
|
|
|
|
|
|
||
|
Soybean
|
66,471
|
|
79,408
|
|
63,797
|
|
||
|
Cattle for dairy
|
2,891
|
|
3,380
|
|
3,059
|
|
||
|
Corn
|
33,106
|
|
82,482
|
|
48,502
|
|
||
|
Cotton
|
—
|
|
420
|
|
1,434
|
|
||
|
Milk
|
19,267
|
|
31,656
|
|
24,561
|
|
||
|
Wheat
|
30,091
|
|
14,835
|
|
16,951
|
|
||
|
Peanut
|
1,752
|
|
3,648
|
|
1,703
|
|
||
|
Sunflower
|
1,314
|
|
3,163
|
|
7,275
|
|
||
|
Rice
|
216
|
|
—
|
|
950
|
|
||
|
Barley
|
1,203
|
|
1,888
|
|
1,240
|
|
||
|
Seeds
|
461
|
|
727
|
|
625
|
|
||
|
Others
|
1,411
|
|
2,146
|
|
83
|
|
||
|
|
158,183
|
|
223,753
|
|
170,180
|
|
||
|
Total sales
|
793,239
|
|
933,178
|
|
869,235
|
|
||
Commitments to sell commodities at a future date
The Group entered into contracts to sell non-financial instruments, mainly sugar, soybean and corn through sales forward contracts. Those contracts are held for purposes of delivery the non-financial instrument in accordance with the Group’s expected sales. Accordingly, as the own use exception criteria are met; those contracts are not recorded as derivatives.
The notional amount of these contracts is US$
68.1 million
as of
December 31, 2018
(
2017
: US$
63.3 million
;
2016
: US$
111.8 million
) comprised primarily of
11,498 thousand
tons of sugar (US$
2.7 million
),
12,822 thousand
m3 of ethanol (US$
6.7 million
),
636,647 thousand
mwh of energy (US$
40.3 million
),
14,279 thousand
tons of soybean (U$S
3.6 million
),
26,273 thousand
tons of wheat (US$
5.3 million
), and
53,927 thousand
tons of corn (US$
8.5 million
) which expire between February 2019 and December 2019.
The accompanying notes are an integral part of these consolidated financial statements.
F-
30
Adecoagro S.A.
Notes to the Consolidated Financial Statements (Continued)
(All amounts in US$ thousands, except shares and per share data and as otherwise indicated)
|
5.
|
Cost of goods sold and services rendered
|
As of
December 31, 2018
:
|
|
2018
|
||||||||||||||||
|
|
Crops
|
Rice
|
Dairy
|
All other
segments
|
Sugar,
Ethanol and
Energy
|
Total
|
|||||||||||
|
Finished goods at the beginning of 2018 (Note 19)
|
21,146
|
|
8,476
|
|
—
|
|
—
|
|
32,266
|
|
61,888
|
|
|||||
|
Adjustment of opening net book amount for the application of IAS 29
|
42
|
|
1,354
|
|
—
|
|
—
|
|
—
|
|
1,396
|
|
|||||
|
Cost of production of manufactured products (Note 6)
|
17,930
|
|
61,600
|
|
7,546
|
|
36
|
|
349,495
|
|
436,607
|
|
|||||
|
Purchases
|
63,533
|
|
15,540
|
|
872
|
|
—
|
|
43,531
|
|
123,476
|
|
|||||
|
Agricultural produce
|
104,941
|
|
—
|
|
20,879
|
|
1,277
|
|
—
|
|
127,097
|
|
|||||
|
Transfer to raw material
|
(24,375
|
)
|
—
|
|
—
|
|
—
|
|
—
|
|
(24,375
|
)
|
|||||
|
Direct agricultural selling expenses
|
12,629
|
|
—
|
|
—
|
|
—
|
|
—
|
|
12,629
|
|
|||||
|
Tax recoveries (i)
|
—
|
|
—
|
|
—
|
|
—
|
|
(32,380
|
)
|
(32,380
|
)
|
|||||
|
Changes in net realizable value of agricultural produce after harvest
|
(909
|
)
|
—
|
|
—
|
|
—
|
|
—
|
|
(909
|
)
|
|||||
|
Finished goods at the end of December 31, 2018 (Note 19)
|
(29,144
|
)
|
(9,507
|
)
|
(1,170
|
)
|
—
|
|
(39,937
|
)
|
(79,758
|
)
|
|||||
|
Exchange differences
|
(8,857
|
)
|
(2,490
|
)
|
—
|
|
—
|
|
(4,359
|
)
|
(15,706
|
)
|
|||||
|
Cost of goods sold and services rendered, and direct agricultural selling expenses
|
156,936
|
|
74,973
|
|
28,127
|
|
1,313
|
|
348,616
|
|
609,965
|
|
|||||
(i) Correspond to the presumed credit of ICMS (Imposto sobre Circulação de Mercadorias e Prestação de Serviços) over the sale values.
As of
December 31, 2017
:
|
|
2017
|
||||||||||||||||
|
|
Crops
|
Rice
|
Dairy
|
All other
segments
|
Sugar,
Ethanol and
Energy
|
Total
|
|||||||||||
|
Finished goods at the beginning of 2017
|
13,117
|
|
5,473
|
|
—
|
|
—
|
|
49,601
|
|
68,191
|
|
|||||
|
Cost of production of manufactured products (Note 6)
|
5,565
|
|
68,969
|
|
—
|
|
237
|
|
378,864
|
|
453,635
|
|
|||||
|
Purchases
|
82,842
|
|
7,779
|
|
2,410
|
|
—
|
|
93,106
|
|
186,137
|
|
|||||
|
Agricultural produce
|
102,734
|
|
—
|
|
34,569
|
|
616
|
|
1,015
|
|
138,934
|
|
|||||
|
Transfer to raw material
|
(12,998
|
)
|
(1,354
|
)
|
—
|
|
—
|
|
—
|
|
(14,352
|
)
|
|||||
|
Direct agricultural selling expenses
|
22,940
|
|
—
|
|
—
|
|
—
|
|
—
|
|
22,940
|
|
|||||
|
Tax recoveries (i)
|
—
|
|
—
|
|
—
|
|
—
|
|
(28,478
|
)
|
(28,478
|
)
|
|||||
|
Changes in net realizable value of agricultural produce after harvest
|
8,852
|
|
—
|
|
—
|
|
—
|
|
—
|
|
8,852
|
|
|||||
|
Finished goods at the end of December 31, 2017 (Note 19)
|
(21,146
|
)
|
(8,476
|
)
|
—
|
|
—
|
|
(32,266
|
)
|
(61,888
|
)
|
|||||
|
Exchange differences
|
(5,604
|
)
|
(1,304
|
)
|
—
|
|
—
|
|
(336
|
)
|
(7,244
|
)
|
|||||
|
Cost of goods sold and services rendered, and direct agricultural selling expenses
|
196,302
|
|
71,087
|
|
36,979
|
|
853
|
|
461,506
|
|
766,727
|
|
|||||
(i) Correspond to the presumed credit of ICMS (Imposto sobre Circulação de Mercadorias e Prestação de Serviços) over the sale values.
The accompanying notes are an integral part of these consolidated financial statements.
F-
31
Adecoagro S.A.
Notes to the Consolidated Financial Statements (Continued)
(All amounts in US$ thousands, except shares and per share data and as otherwise indicated)
|
5.
|
Cost of goods sold and services rendered (continued)
|
As of
December 31, 2016
:
|
|
2016
|
||||||||||||||||
|
|
Crops
|
Rice
|
Dairy
|
All other
segments
|
Sugar,
Ethanol and
Energy
|
Total
|
|||||||||||
|
Finished goods at the beginning of 2016
|
16,034
|
|
6,904
|
|
55
|
|
—
|
|
24,631
|
|
47,624
|
|
|||||
|
Cost of production of manufactured products (Note 6)
|
478
|
|
61,254
|
|
371
|
|
206
|
|
376,791
|
|
439,100
|
|
|||||
|
Purchases
|
25,954
|
|
22,303
|
|
4,414
|
|
—
|
|
89,745
|
|
142,416
|
|
|||||
|
Agricultural produce
|
110,252
|
|
—
|
|
27,628
|
|
—
|
|
—
|
|
137,880
|
|
|||||
|
Transfer to raw material
|
(8,603
|
)
|
—
|
|
—
|
|
—
|
|
—
|
|
(8,603
|
)
|
|||||
|
Direct agricultural selling expenses
|
—
|
|
—
|
|
—
|
|
—
|
|
(24,156
|
)
|
(24,156
|
)
|
|||||
|
Tax recoveries (i)
|
19,077
|
|
—
|
|
—
|
|
—
|
|
—
|
|
19,077
|
|
|||||
|
Changes in net realizable value of agricultural produce after harvest
|
(5,841
|
)
|
—
|
|
—
|
|
—
|
|
—
|
|
(5,841
|
)
|
|||||
|
Finished goods at the end of December 31, 2016
|
(13,117
|
)
|
(5,473
|
)
|
—
|
|
—
|
|
(49,601
|
)
|
(68,191
|
)
|
|||||
|
Exchange differences
|
(2,503
|
)
|
(1,414
|
)
|
103
|
|
6
|
|
3,083
|
|
(725
|
)
|
|||||
|
Cost of goods sold and services rendered, and direct agricultural selling expenses
|
141,731
|
|
83,574
|
|
32,571
|
|
212
|
|
420,493
|
|
678,581
|
|
|||||
(i) Correspond to the presumed credit of ICMS (Imposto sobre Circulação de Mercadorias e Prestação de Serviços) over the sale values.
The accompanying notes are an integral part of these consolidated financial statements.
F-
32
Adecoagro S.A.
Notes to the Consolidated Financial Statements (Continued)
(All amounts in US$ thousands, except shares and per share data and as otherwise indicated)
|
6.
|
Expenses by nature
|
The Group presents the statement of income under the function of expense method. Under this method, expenses are classified according to their function as part of the line items “cost of goods sold and direct agricultural selling expenses”, “general and administrative expenses” and “selling expenses”.
The following table provides the additional disclosure required on the nature of expenses and their relationship to the function within the Group:
Expenses by nature for the year ended
December 31, 2018
:
|
|
Cost of production of manufactured products (Note 5)
|
General and
Administrative
Expenses
|
Selling
Expenses
|
Total
|
||||||||||||||||||||||
|
|
Crops
|
Rice
|
Dairy
|
All other
segments
|
Sugar,
Ethanol and
Energy
|
Total
|
||||||||||||||||||||
|
Salaries, social security expenses and employee benefits
|
—
|
|
5,055
|
|
115
|
|
36
|
|
46,106
|
|
51,312
|
|
29,245
|
|
5,908
|
|
86,465
|
|
||||||||
|
Raw materials and consumables
|
733
|
|
4,391
|
|
282
|
|
—
|
|
10,122
|
|
15,528
|
|
—
|
|
—
|
|
15,528
|
|
||||||||
|
Depreciation and amortization
|
—
|
|
1,764
|
|
118
|
|
—
|
|
115,253
|
|
117,135
|
|
9,667
|
|
767
|
|
127,569
|
|
||||||||
|
Fuel, lubricants and others
|
—
|
|
117
|
|
—
|
|
—
|
|
26,267
|
|
26,384
|
|
614
|
|
192
|
|
27,190
|
|
||||||||
|
Maintenance and repairs
|
—
|
|
1,452
|
|
30
|
|
—
|
|
19,715
|
|
21,197
|
|
1,573
|
|
365
|
|
23,135
|
|
||||||||
|
Freights
|
47
|
|
2,519
|
|
436
|
|
—
|
|
685
|
|
3,687
|
|
—
|
|
24,700
|
|
28,387
|
|
||||||||
|
Export taxes / selling taxes
|
—
|
|
—
|
|
—
|
|
—
|
|
—
|
|
—
|
|
—
|
|
42,074
|
|
42,074
|
|
||||||||
|
Export expenses
|
—
|
|
—
|
|
—
|
|
—
|
|
—
|
|
—
|
|
—
|
|
2,774
|
|
2,774
|
|
||||||||
|
Contractors and services
|
2,885
|
|
254
|
|
1,279
|
|
—
|
|
7,901
|
|
12,319
|
|
—
|
|
—
|
|
12,319
|
|
||||||||
|
Energy transmission
|
—
|
|
—
|
|
—
|
|
—
|
|
—
|
|
—
|
|
—
|
|
2,689
|
|
2,689
|
|
||||||||
|
Energy power
|
—
|
|
1,239
|
|
138
|
|
—
|
|
1,340
|
|
2,717
|
|
145
|
|
57
|
|
2,919
|
|
||||||||
|
Professional fees
|
—
|
|
52
|
|
—
|
|
—
|
|
484
|
|
536
|
|
7,781
|
|
556
|
|
8,873
|
|
||||||||
|
Other taxes
|
—
|
|
71
|
|
—
|
|
—
|
|
1,841
|
|
1,912
|
|
1,309
|
|
10
|
|
3,231
|
|
||||||||
|
Contingencies
|
—
|
|
—
|
|
—
|
|
—
|
|
—
|
|
—
|
|
1,345
|
|
—
|
|
1,345
|
|
||||||||
|
Lease expense and similar arrangements
|
—
|
|
276
|
|
3
|
|
—
|
|
—
|
|
279
|
|
1,077
|
|
53
|
|
1,409
|
|
||||||||
|
Third parties raw materials
|
—
|
|
2,913
|
|
—
|
|
—
|
|
13,154
|
|
16,067
|
|
—
|
|
—
|
|
16,067
|
|
||||||||
|
Others
|
3
|
|
1,697
|
|
223
|
|
—
|
|
5,067
|
|
6,990
|
|
3,324
|
|
10,070
|
|
20,384
|
|
||||||||
|
Subtotal
|
3,668
|
|
21,800
|
|
2,624
|
|
36
|
|
247,935
|
|
276,063
|
|
56,080
|
|
90,215
|
|
422,358
|
|
||||||||
|
Own agricultural produce consumed
|
14,262
|
|
39,800
|
|
4,922
|
|
—
|
|
101,560
|
|
160,544
|
|
—
|
|
—
|
|
160,544
|
|
||||||||
|
Total
|
17,930
|
|
61,600
|
|
7,546
|
|
36
|
|
349,495
|
|
436,607
|
|
56,080
|
|
90,215
|
|
582,902
|
|
||||||||
The accompanying notes are an integral part of these consolidated financial statements.
F-
33
Adecoagro S.A.
Notes to the Consolidated Financial Statements (Continued)
(All amounts in US$ thousands, except shares and per share data and as otherwise indicated)
|
6.
|
Expenses by nature (continued)
|
Expenses by nature for the year ended
December 31, 2017
:
|
|
Cost of production of manufactured products (Note 5)
|
General and
Administrative
Expenses
|
Selling
Expenses
|
Total
|
||||||||||||||||||||||
|
|
Crops
|
Rice
|
Dairy
|
All other
segments
|
Sugar,
Ethanol and
Energy
|
Total
|
||||||||||||||||||||
|
Salaries, social security expenses and employee benefits
|
—
|
|
7,115
|
|
—
|
|
229
|
|
50,243
|
|
57,587
|
|
33,969
|
|
6,724
|
|
98,280
|
|
||||||||
|
Raw materials and consumables
|
695
|
|
3,579
|
|
—
|
|
—
|
|
9,343
|
|
13,617
|
|
—
|
|
—
|
|
13,617
|
|
||||||||
|
Depreciation and amortization
|
—
|
|
836
|
|
—
|
|
8
|
|
119,427
|
|
120,271
|
|
6,162
|
|
778
|
|
127,211
|
|
||||||||
|
Fuel, lubricants and others
|
—
|
|
109
|
|
—
|
|
—
|
|
25,272
|
|
25,381
|
|
454
|
|
242
|
|
26,077
|
|
||||||||
|
Maintenance and repairs
|
—
|
|
1,750
|
|
—
|
|
—
|
|
17,005
|
|
18,755
|
|
1,189
|
|
469
|
|
20,413
|
|
||||||||
|
Freights
|
—
|
|
6,074
|
|
—
|
|
—
|
|
572
|
|
6,646
|
|
—
|
|
33,682
|
|
40,328
|
|
||||||||
|
Export taxes / selling taxes
|
—
|
|
—
|
|
—
|
|
—
|
|
—
|
|
—
|
|
—
|
|
36,808
|
|
36,808
|
|
||||||||
|
Export expenses
|
—
|
|
—
|
|
—
|
|
—
|
|
—
|
|
—
|
|
—
|
|
3,511
|
|
3,511
|
|
||||||||
|
Contractors and services
|
1,054
|
|
—
|
|
—
|
|
—
|
|
6,191
|
|
7,245
|
|
—
|
|
—
|
|
7,245
|
|
||||||||
|
Energy transmission
|
—
|
|
—
|
|
—
|
|
—
|
|
—
|
|
—
|
|
—
|
|
3,312
|
|
3,312
|
|
||||||||
|
Energy power
|
—
|
|
1,342
|
|
—
|
|
—
|
|
1,525
|
|
2,867
|
|
190
|
|
53
|
|
3,110
|
|
||||||||
|
Professional fees
|
—
|
|
51
|
|
—
|
|
—
|
|
352
|
|
403
|
|
7,519
|
|
1,633
|
|
9,555
|
|
||||||||
|
Other taxes
|
—
|
|
93
|
|
—
|
|
—
|
|
1,978
|
|
2,071
|
|
845
|
|
5
|
|
2,921
|
|
||||||||
|
Contingencies
|
—
|
|
—
|
|
—
|
|
—
|
|
—
|
|
—
|
|
2,174
|
|
—
|
|
2,174
|
|
||||||||
|
Lease expense and similar arrangements
|
—
|
|
269
|
|
—
|
|
—
|
|
—
|
|
269
|
|
1,334
|
|
56
|
|
1,659
|
|
||||||||
|
Third parties raw materials
|
—
|
|
6,808
|
|
—
|
|
—
|
|
34,161
|
|
40,969
|
|
—
|
|
—
|
|
40,969
|
|
||||||||
|
Others
|
6
|
|
955
|
|
—
|
|
—
|
|
4,261
|
|
5,222
|
|
3,463
|
|
8,126
|
|
16,811
|
|
||||||||
|
Subtotal
|
1,755
|
|
28,981
|
|
—
|
|
237
|
|
270,330
|
|
301,303
|
|
57,299
|
|
95,399
|
|
454,001
|
|
||||||||
|
Own agricultural produce consumed
|
3,810
|
|
39,988
|
|
—
|
|
—
|
|
108,534
|
|
152,332
|
|
—
|
|
—
|
|
152,332
|
|
||||||||
|
Total
|
5,565
|
|
68,969
|
|
—
|
|
237
|
|
378,864
|
|
453,635
|
|
57,299
|
|
95,399
|
|
606,333
|
|
||||||||
The accompanying notes are an integral part of these consolidated financial statements.
F-
34
Adecoagro S.A.
Notes to the Consolidated Financial Statements (Continued)
(All amounts in US$ thousands, except shares and per share data and as otherwise indicated)
|
6.
|
Expenses by nature (continued)
|
Expenses by nature for the year ended
December 31, 2016
:
|
|
Cost of production of manufactured products (Note 5)
|
|
|
|
||||||||||||||||||||||
|
|
Crops
|
Rice
|
Dairy
|
All other
segments
|
Sugar,
Ethanol and
Energy
|
Total
|
General and
Administrative
Expenses
|
Selling
Expenses
|
Total
|
|||||||||||||||||
|
Salaries, social security expenses and employee benefits
|
—
|
|
5,590
|
|
—
|
|
206
|
|
54,225
|
|
60,021
|
|
30,935
|
|
5,358
|
|
96,314
|
|
||||||||
|
Raw materials and consumables
|
468
|
|
3,927
|
|
—
|
|
—
|
|
7,025
|
|
11,420
|
|
—
|
|
—
|
|
11,420
|
|
||||||||
|
Depreciation and amortization
|
—
|
|
856
|
|
—
|
|
—
|
|
102,620
|
|
103,476
|
|
5,006
|
|
695
|
|
109,177
|
|
||||||||
|
Fuel, lubricants and others
|
—
|
|
86
|
|
—
|
|
—
|
|
26,307
|
|
26,393
|
|
450
|
|
368
|
|
27,211
|
|
||||||||
|
Maintenance and repairs
|
—
|
|
1,408
|
|
—
|
|
—
|
|
21,641
|
|
23,049
|
|
931
|
|
390
|
|
24,370
|
|
||||||||
|
Freights
|
—
|
|
4,901
|
|
14
|
|
—
|
|
330
|
|
5,245
|
|
—
|
|
29,976
|
|
35,221
|
|
||||||||
|
Export taxes / selling taxes
|
—
|
|
—
|
|
—
|
|
—
|
|
—
|
|
—
|
|
—
|
|
29,375
|
|
29,375
|
|
||||||||
|
Export expenses
|
—
|
|
—
|
|
—
|
|
—
|
|
—
|
|
—
|
|
—
|
|
3,649
|
|
3,649
|
|
||||||||
|
Contractors and services
|
10
|
|
—
|
|
39
|
|
—
|
|
4,374
|
|
4,423
|
|
—
|
|
—
|
|
4,423
|
|
||||||||
|
Energy transmission
|
—
|
|
—
|
|
—
|
|
—
|
|
—
|
|
—
|
|
—
|
|
2,890
|
|
2,890
|
|
||||||||
|
Energy power
|
—
|
|
913
|
|
—
|
|
—
|
|
1,007
|
|
1,920
|
|
795
|
|
211
|
|
2,926
|
|
||||||||
|
Professional fees
|
—
|
|
90
|
|
—
|
|
—
|
|
387
|
|
477
|
|
5,495
|
|
1,105
|
|
7,077
|
|
||||||||
|
Other taxes
|
—
|
|
58
|
|
—
|
|
—
|
|
2,012
|
|
2,070
|
|
653
|
|
8
|
|
2,731
|
|
||||||||
|
Contingencies
|
—
|
|
—
|
|
—
|
|
—
|
|
—
|
|
—
|
|
1,835
|
|
—
|
|
1,835
|
|
||||||||
|
Lease expense and similar arrangements
|
—
|
|
145
|
|
—
|
|
—
|
|
—
|
|
145
|
|
1,185
|
|
51
|
|
1,381
|
|
||||||||
|
Third parties raw materials
|
—
|
|
3,001
|
|
—
|
|
—
|
|
26,552
|
|
29,553
|
|
—
|
|
—
|
|
29,553
|
|
||||||||
|
Tax recoveries
|
—
|
|
—
|
|
—
|
|
—
|
|
(11,527
|
)
|
(11,527
|
)
|
—
|
|
—
|
|
(11,527
|
)
|
||||||||
|
Others
|
—
|
|
1,344
|
|
—
|
|
—
|
|
4,428
|
|
5,772
|
|
3,465
|
|
6,597
|
|
15,834
|
|
||||||||
|
Subtotal
|
478
|
|
22,319
|
|
53
|
|
206
|
|
239,381
|
|
262,437
|
|
50,750
|
|
80,673
|
|
393,860
|
|
||||||||
|
Own agricultural produce consumed
|
—
|
|
38,935
|
|
318
|
|
—
|
|
137,410
|
|
176,663
|
|
—
|
|
—
|
|
176,663
|
|
||||||||
|
Total
|
478
|
|
61,254
|
|
371
|
|
206
|
|
376,791
|
|
439,100
|
|
50,750
|
|
80,673
|
|
570,523
|
|
||||||||
|
7.
|
Salaries and social security expenses
|
|
|
2018
|
2017
|
2016
|
|||||
|
Wages and salaries (i)
|
105,931
|
|
132,025
|
|
117,423
|
|
||
|
Social security costs
|
29,865
|
|
30,558
|
|
28,849
|
|
||
|
Equity-settled share-based compensation
|
4,728
|
|
5,552
|
|
4,796
|
|
||
|
|
140,524
|
|
168,135
|
|
151,068
|
|
||
|
(i)
|
Includes US$
32,636
, US$
41,172
and US$
28,475
, capitalized in Property, Plant and Equipment for the years
2018
,
2017
and
2016
, respectively.
|
The accompanying notes are an integral part of these consolidated financial statements.
F-
35
Adecoagro S.A.
Notes to the Consolidated Financial Statements (Continued)
(All amounts in US$ thousands, except shares and per share data and as otherwise indicated)
|
8.
|
Other operating income, net
|
|
|
2018
|
2017 (*)
|
2016 (*)
|
|||||
|
Gain from disposal of farmland and other assets (Note 21)
|
36,227
|
|
—
|
|
—
|
|
||
|
Gain / (Loss) from commodity derivative financial instrument
|
54,694
|
|
40,842
|
|
(16,007
|
)
|
||
|
Loss from disposal of other property items
|
(95
|
)
|
(986
|
)
|
(1,255
|
)
|
||
|
Settlement agreement (Note 29)
|
—
|
|
—
|
|
8,489
|
|
||
|
Net gain from fair value adjustment of investment property
|
13,409
|
|
4,302
|
|
14,049
|
|
||
|
Losses related to energy business
|
—
|
|
(3,247
|
)
|
—
|
|
||
|
Others
|
(3
|
)
|
2,852
|
|
476
|
|
||
|
|
104,232
|
|
43,763
|
|
5,752
|
|
||
(*) Prior periods have been recast to reflect the Company's change in accounting policy for Investment properties as described in Note 33.
|
9.
|
Financial results, net
|
|
|
2018
|
2017
|
2016
|
|||||
|
Finance income:
|
|
|
|
|
|
|
||
|
- Interest income
|
7,915
|
|
11,230
|
|
7,671
|
|
||
|
- Other income
|
666
|
|
514
|
|
286
|
|
||
|
Finance income
|
8,581
|
|
11,744
|
|
7,957
|
|
||
|
Finance costs:
|
|
|
|
|
|
|
||
|
- Interest expense
|
(51,577
|
)
|
(52,308
|
)
|
(48,198
|
)
|
||
|
- Cash flow hedge – transfer from equity (Note 2)
|
(26,693
|
)
|
(20,758
|
)
|
(85,214
|
)
|
||
|
- Foreign exchange losses, net
|
(183,195
|
)
|
(38,708
|
)
|
(19,062
|
)
|
||
|
- Taxes
|
(3,136
|
)
|
(3,705
|
)
|
(2,719
|
)
|
||
|
- Loss from interest rate/foreign exchange rate derivative financial instruments
|
(3,024
|
)
|
(2,163
|
)
|
(5,694
|
)
|
||
|
- Prepayment related expenses (Note 26 - Brazilian subsidiaries)
|
—
|
|
(10,847
|
)
|
—
|
|
||
|
- Other expenses
|
(3,638
|
)
|
(2,860
|
)
|
(4,493
|
)
|
||
|
Finance costs
|
(271,263
|
)
|
(131,349
|
)
|
(165,380
|
)
|
||
|
Other financial results - Net gain of inflation effects on the monetary items
|
81,928
|
|
—
|
|
—
|
|
||
|
Total financial results, net
|
(180,754
|
)
|
(119,605
|
)
|
(157,423
|
)
|
||
|
10.
|
Taxation
|
Adecoagro is subject to the applicable general tax regulations in Luxembourg.
The Group’s income tax has been calculated on the estimated assessable taxable results for the year at the rates prevailing in the respective foreign tax jurisdictions. The subsidiaries of the Group are required to calculate their income taxes on a separate basis according to the rules and regulations of the jurisdictions where they operate. Therefore, the Group is not legally permitted to compensate subsidiaries’ losses against subsidiaries’ income. The details of the provision for the Group’s consolidated income tax are as follows:
|
|
2018
|
2017 (*)
|
2016 (*)
|
|||||
|
Current income tax
|
(2,846
|
)
|
(13,425
|
)
|
(21,505
|
)
|
||
|
Deferred income tax
|
3,870
|
|
18,417
|
|
8,606
|
|
||
|
Income tax benefit / (expense)
|
1,024
|
|
4,992
|
|
(12,899
|
)
|
||
The accompanying notes are an integral part of these consolidated financial statements.
F-
36
Adecoagro S.A.
Notes to the Consolidated Financial Statements (Continued)
(All amounts in US$ thousands, except shares and per share data and as otherwise indicated)
|
10.
|
Taxation (continued)
|
(*) Prior periods have been recast to reflect the Company's change in accounting policy for Investment properties as described in Note 33.
The statutory tax rate in the countries where the Group operates for all of the years presented are:
|
Tax Jurisdiction
|
Income Tax Rate
|
||
|
Argentina (i)
|
30
|
%
|
|
|
Brazil
|
34
|
%
|
|
|
Uruguay
|
25
|
%
|
|
|
Spain
|
25
|
%
|
|
|
Luxembourg
|
26
|
%
|
|
(i) During 2017, the Argentine Government introduced changes in the income tax. The income tax rate will be reduced to
30%
for the years 2018 and 2019, and to
25%
from 2020 onwards. A new tax on dividends is created with a rate of
7%
for the years 2018 and 2019, and
13%
from 2020 onwards. Considering 2018 resulted in losses for Argentine subsidiaries, no deferred income tax liability was recognized for future tax dividends.
Deferred tax assets and liabilities of the Group as of
December 31, 2018
and
2017
, without taking into consideration the offsetting of balances within the same tax jurisdiction, will be recovered or settled as follows:
|
|
2018
|
2017
|
|||
|
Deferred income tax asset to be recovered after more than 12 months
|
76,225
|
|
97,992
|
|
|
|
Deferred income tax asset to be recovered within 12 months
|
62,626
|
|
20,191
|
|
|
|
Deferred income tax assets
|
138,851
|
|
118,183
|
|
|
|
Deferred income tax liability to be settled after more than 12 months
|
(289,158
|
)
|
(91,742
|
)
|
|
|
Deferred income tax liability to be settled within 12 months
|
(1,673
|
)
|
(6,090
|
)
|
|
|
Deferred income tax liability
|
(290,831
|
)
|
(97,832
|
)
|
|
|
Deferred income tax (liability) / assets, net
|
(151,980
|
)
|
20,351
|
|
|
The gross movement on the deferred income tax account is as follows:
|
|
2018
|
2017
|
|||
|
Beginning of year
|
20,351
|
|
10,354
|
|
|
|
Tax effect on the opening net book amount for the application of IAS 29
|
(64,208
|
)
|
—
|
|
|
|
Exchange differences
|
16,878
|
|
295
|
|
|
|
Effect of adoption of fair value valuation for farmlands
|
(139,223
|
)
|
—
|
|
|
|
Others
|
(970
|
)
|
—
|
|
|
|
Tax (charge) relating to cash flow hedge (i)
|
11,322
|
|
(8,715
|
)
|
|
|
Income tax benefit
|
3,870
|
|
18,417
|
|
|
|
End of year
|
(151,980
|
)
|
20,351
|
|
|
(i) Relates to the gain or loss before income tax of cash flow hedge recognized in other comprehensive income amounting to US$
75,822
for the year ended
December 31, 2018
(
2017
: US$
(565)
); net of the reclassification from Equity to Income Statements of US$
(32,305)
for the year ended
December 31, 2018
(
2017
: US$
(20,758)
)
The accompanying notes are an integral part of these consolidated financial statements.
F-
37
Adecoagro S.A.
Notes to the Consolidated Financial Statements (Continued)
(All amounts in US$ thousands, except shares and per share data and as otherwise indicated)
|
10.
|
Taxation (continued)
|
The movement in the deferred income tax assets and liabilities during the year, without taking into consideration the offsetting of balances within the same tax jurisdiction, is as follows:
|
Deferred income tax
liabilities
|
Property,
plant and
equipment
|
Investment property
|
Biological
assets
|
Others
|
Total
|
||||||||||
|
At January 1, 2017
|
58,832
|
|
13,543
|
|
14,122
|
|
17,475
|
|
103,972
|
|
|||||
|
Charged / (credited) to the statement of income
|
11,411
|
|
1,076
|
|
3,707
|
|
(15,583
|
)
|
611
|
|
|||||
|
Exchange differences
|
(4,437
|
)
|
(1,990
|
)
|
(1,057
|
)
|
733
|
|
(6,751
|
)
|
|||||
|
At December 31, 2017
|
65,806
|
|
12,629
|
|
16,772
|
|
2,625
|
|
97,832
|
|
|||||
|
Charged / (credited) to the statement of income
|
31,237
|
|
2,730
|
|
(10,438
|
)
|
1,570
|
|
25,099
|
|
|||||
|
Tax effect on the opening net book amount for the application of IAS 29
|
63,357
|
|
—
|
|
164
|
|
687
|
|
64,208
|
|
|||||
|
Effect of adoption of fair value valuation for farmlands
|
139,223
|
|
—
|
|
—
|
|
—
|
|
139,223
|
|
|||||
|
Exchange differences
|
(29,040
|
)
|
(3,405
|
)
|
(3,032
|
)
|
(54
|
)
|
(35,531
|
)
|
|||||
|
At December 31, 2018
|
270,583
|
|
11,954
|
|
3,466
|
|
4,828
|
|
290,831
|
|
|||||
|
Deferred income tax
assets
|
Provisions
|
Tax loss
carry
forwards
|
Equity-settled
share-based
compensation
|
Biological
assets
|
Others
|
Total
|
||||||||||||
|
At January 1, 2017
|
2,431
|
|
97,118
|
|
5,640
|
|
—
|
|
9,137
|
|
114,326
|
|
||||||
|
Charged / (credited) to the statement of income
|
(705
|
)
|
11,907
|
|
41
|
|
—
|
|
7,785
|
|
19,028
|
|
||||||
|
Tax charge relating to cash flow hedge
|
—
|
|
(8,715
|
)
|
—
|
|
—
|
|
—
|
|
(8,715
|
)
|
||||||
|
Exchange differences
|
757
|
|
(4,193
|
)
|
—
|
|
(3,020
|
)
|
(6,456
|
)
|
||||||||
|
At December 31, 2017
|
2,483
|
|
96,117
|
|
5,681
|
|
—
|
|
13,902
|
|
118,183
|
|
||||||
|
(Credited) / charged to the statement of income
|
2,003
|
|
(10,798
|
)
|
(379
|
)
|
4,572
|
|
33,571
|
|
28,969
|
|
||||||
|
Others
|
—
|
|
—
|
|
—
|
|
—
|
|
(970
|
)
|
(970
|
)
|
||||||
|
Tax charge relating to cash flow hedge
|
—
|
|
11,322
|
|
—
|
|
—
|
|
—
|
|
11,322
|
|
||||||
|
Exchange differences
|
(526
|
)
|
(16,421
|
)
|
—
|
|
22
|
|
(1,728
|
)
|
(18,653
|
)
|
||||||
|
At December 31, 2018
|
3,960
|
|
80,220
|
|
5,302
|
|
4,594
|
|
44,775
|
|
138,851
|
|
||||||
Tax loss carry forwards in Argentina and Uruguay generally expire within
5 years
. Tax loss carry forwards in Brazil and Luxembourg do not expire. However, in Brazil, the taxable profit for each year can only be reduced by tax loss carry forward up to a maximum of
30%
.
In order to fully realize the deferred tax asset, the Group will need to generate future taxable income in the countries where the tax loss carry forward were incurred. Based upon the level of historical taxable income and projections for future taxable income over the periods in which the deferred tax assets are deductible, management believes that as at
December 31, 2018
, it is probable that the Group will realize some portion of the deferred tax assets in Brazil and Argentina.
The accompanying notes are an integral part of these consolidated financial statements.
F-
38
Adecoagro S.A.
Notes to the Consolidated Financial Statements (Continued)
(All amounts in US$ thousands, except shares and per share data and as otherwise indicated)
|
10.
|
Taxation (continued)
|
As of
December 31, 2018
, the Group’s tax loss carry forwards and their corresponding jurisdictions are as follows:
|
Jurisdiction
|
Tax loss carry forward
|
Expiration period
|
|||
|
Argentina (1)
|
83,872
|
|
5 years
|
||
|
Brazil
|
155,124
|
|
No expiration date.
|
||
|
Uruguay
|
4,986
|
|
5 years
|
||
|
Luxembourg
|
28,231
|
|
No expiration date.
|
||
(1) As of December 31, 2018, the ageing of the determination tax loss carry forward in Argentina is as follows:
|
Year of generation
|
Amount
|
||
|
2015
|
17,536
|
|
|
|
2016
|
1,565
|
|
|
|
2017
|
15,889
|
|
|
|
2018
|
48,882
|
|
|
Deferred income tax assets are recognized for tax loss carry-forwards to the extent that the realization of the related tax benefit through future taxable profits is probable. The Group did not recognize deferred income tax assets of US$
1.2 million
in respect of losses amounting to US$
4.7 million
that can be carried forward against future taxable income.
The tax on the Group’s profit before income tax differs from the theoretical amount that would arise using the weighted average tax rate applicable to profits of the consolidated entities as follows:
|
|
2018
|
2017 (*)
|
2016 (*)
|
|||||
|
Tax calculated at the tax rates applicable to profits in the respective countries
|
2,956
|
|
(3,013
|
)
|
(7,156
|
)
|
||
|
Non-deductible items
|
(2,249
|
)
|
(1,406
|
)
|
(3,304
|
)
|
||
|
Non-deductible items – changes in estimates on previous year
|
—
|
|
—
|
|
(1,182
|
)
|
||
|
Effect of the changes in the statutory income tax rate in Argentina
|
(1,013
|
)
|
1,781
|
|
—
|
|
||
|
Unused tax losses
|
(4,181
|
)
|
(2,265
|
)
|
—
|
|
||
|
Tax losses where no deferred tax asset was recognized
|
(2,368
|
)
|
(29
|
)
|
(569
|
)
|
||
|
Non-taxable income
|
13,069
|
|
2,437
|
|
—
|
|
||
|
Previously unrecognized tax losses now recouped to reduce tax expenses
|
—
|
|
7,595
|
|
—
|
|
||
|
Effect of IAS 29 on Argentina´s Shareholder´s equity and deferred income tax
|
(5,825
|
)
|
—
|
|
—
|
|
||
|
Others
|
635
|
|
(108
|
)
|
(688
|
)
|
||
|
Income tax benefit / (expense)
|
1,024
|
|
4,992
|
|
(12,899
|
)
|
||
The accompanying notes are an integral part of these consolidated financial statements.
F-
39
Adecoagro S.A.
Notes to the Consolidated Financial Statements (Continued)
(All amounts in US$ thousands, except shares and per share data and as otherwise indicated)
|
11.
|
Earnings per share
|
(a) Basic
Basic earnings per share is calculated by dividing the profit attributable to equity holders of the Group by the weighted average number of shares in issue during the period excluding ordinary shares held as treasury shares (Note 22).
|
|
2018
|
2017
|
2016
|
|||||
|
(Loss) / Profit from operations attributable to equity holders of the Group
|
(24,622
|
)
|
13,198
|
|
11,568
|
|
||
|
Weighted average number of shares in issue (thousands)
|
116,637
|
|
120,599
|
|
121,421
|
|
||
|
Basic (loss) / earnings per share from operations
|
(0.211
|
)
|
0.109
|
|
0.095
|
|
||
(b) Diluted
Diluted earnings per share is calculated by adjusting the weighted average number of shares outstanding to assume conversion of all dilutive potential shares. The Group has
two
categories of dilutive potential shares: equity-settled share options and restricted units. For these instruments, a calculation is done to determine the number of shares that could have been acquired at fair value, based on the monetary value of the subscription rights attached to outstanding share options. The number of shares calculated as above is compared with the number of shares that would have been issued assuming the exercise of the equity-settled share options. As of
December 31, 2018
, there were
737 thousands
(
2017
:
851 thousands
;
2016
:
1,658 thousands
) share options/restricted units outstanding that could potentially have a dilutive impact in the future but were antidilutive for the periods presented.
|
|
2018
|
2017
|
2016
|
|||||
|
(Loss) / Profit from operations attributable to equity holders of the Group
|
(24,622
|
)
|
13,198
|
|
11,568
|
|
||
|
Weighted average number of shares in issue (thousands)
|
116,637
|
|
120,599
|
|
121,421
|
|
||
|
Adjustments for:
|
||||||||
|
- Employee share options and restricted units (thousands)
|
1,198
|
|
1,604
|
|
1,695
|
|
||
|
Weighted average number of shares for diluted earnings per share (thousands)
|
117,835
|
|
122,203
|
|
123,116
|
|
||
|
Diluted (loss) / earnings per share from operations
|
(0.211
|
)
|
0.108
|
|
0.094
|
|
||
The accompanying notes are an integral part of these consolidated financial statements.
F-
40
Adecoagro S.A.
Notes to the Consolidated Financial Statements (Continued)
(All amounts in US$ thousands, except shares and per share data and as otherwise indicated)
|
12.
|
Property, plant and equipment
|
Changes in the Group’s property, plant and equipment in
2018
and
2017
were as follows:
|
|
Farmlands (*)
|
Farmland
improvements
|
Buildings and
facilities
|
Machinery,
equipment,
furniture and
fittings
|
Bearer plants
|
Others
|
Work in
progress
|
Total
|
|||||||||||||||
|
At January 1, 2017
|
|
|
|
|
|
|
|
|
|
|
|
|
|
|
|
|
|||||||
|
Cost
|
122,117
|
|
20,907
|
|
305,748
|
|
633,536
|
|
341,666
|
|
15,067
|
|
21,641
|
|
1,460,682
|
|
|||||||
|
Accumulated depreciation
|
—
|
|
(11,267
|
)
|
(115,693
|
)
|
(382,226
|
)
|
(125,497
|
)
|
(11,132
|
)
|
—
|
|
(645,815
|
)
|
|||||||
|
Net book amount
|
122,117
|
|
9,640
|
|
190,055
|
|
251,310
|
|
216,169
|
|
3,935
|
|
21,641
|
|
814,867
|
|
|||||||
|
At December 31, 2017
|
|
|
|
|
|
|
|
|
|
|
|
|
|
|
|||||||||
|
Opening net book amount
|
122,117
|
|
9,640
|
|
190,055
|
|
251,310
|
|
216,169
|
|
3,935
|
|
21,641
|
|
814,867
|
|
|||||||
|
Exchange differences
|
(11,374
|
)
|
(1,219
|
)
|
(4,473
|
)
|
(5,853
|
)
|
(4,089
|
)
|
(390
|
)
|
(2,901
|
)
|
(30,299
|
)
|
|||||||
|
Additions
|
—
|
|
—
|
|
15,495
|
|
62,101
|
|
84,278
|
|
2,351
|
|
37,856
|
|
202,081
|
|
|||||||
|
Transfers
|
—
|
|
2,711
|
|
12,963
|
|
11,183
|
|
—
|
|
11
|
|
(26,868
|
)
|
—
|
|
|||||||
|
Disposals
|
—
|
|
—
|
|
(162
|
)
|
(3,913
|
)
|
—
|
|
(40
|
)
|
—
|
|
(4,115
|
)
|
|||||||
|
Reclassification to non-income tax credits (**)
|
—
|
|
—
|
|
(205
|
)
|
(788
|
)
|
—
|
|
—
|
|
(93
|
)
|
(1,086
|
)
|
|||||||
|
Depreciation
|
—
|
|
(2,125
|
)
|
(20,829
|
)
|
(67,960
|
)
|
(57,448
|
)
|
(1,709
|
)
|
—
|
|
(150,071
|
)
|
|||||||
|
Closing net book amount
|
110,743
|
|
9,007
|
|
192,844
|
|
246,080
|
|
238,910
|
|
4,158
|
|
29,635
|
|
831,377
|
|
|||||||
|
|
Farmlands (*)
|
Farmland
improvements
|
Buildings and
facilities
|
Machinery,
equipment,
furniture and
fittings
|
Bearer plants
|
Others
|
Work in
progress
|
Total
|
|||||||||||||||
|
At December 31, 2017
|
|
|
|
|
|
|
|
|
|
|
|
|
|
|
|
|
|||||||
|
Cost
|
110,743
|
|
22,399
|
|
329,366
|
|
696,266
|
|
421,855
|
|
16,999
|
|
29,635
|
|
1,627,263
|
|
|||||||
|
Accumulated depreciation
|
—
|
|
(13,392
|
)
|
(136,522
|
)
|
(450,186
|
)
|
(182,945
|
)
|
(12,841
|
)
|
—
|
|
(795,886
|
)
|
|||||||
|
Net book amount
|
110,743
|
|
9,007
|
|
192,844
|
|
246,080
|
|
238,910
|
|
4,158
|
|
29,635
|
|
831,377
|
|
|||||||
|
Year ended December 31, 2018
|
|
|
|
|
|
|
|
|
|
|
|
|
|
|
|||||||||
|
Opening net book amount
|
110,743
|
|
9,007
|
|
192,844
|
|
246,080
|
|
238,910
|
|
4,158
|
|
29,635
|
|
831,377
|
|
|||||||
|
Adjustment of opening net book amount for the application of IAS 29
|
211,328
|
|
11,520
|
|
22,563
|
|
5,181
|
|
—
|
|
1,140
|
|
856
|
|
252,588
|
|
|||||||
|
Exchange differences
|
(78,858
|
)
|
(3,310
|
)
|
(34,195
|
)
|
(49,222
|
)
|
(36,504
|
)
|
1,410
|
|
(6,408
|
)
|
(207,087
|
)
|
|||||||
|
Additions
|
—
|
|
97
|
|
13,773
|
|
50,759
|
|
96,365
|
|
2,098
|
|
61,829
|
|
224,921
|
|
|||||||
|
Revaluation surplus (Note 33)
|
545,129
|
|
—
|
|
—
|
|
—
|
|
—
|
|
—
|
|
—
|
|
545,129
|
|
|||||||
|
Reclassification from investment property
|
3,313
|
|
—
|
|
—
|
|
—
|
|
—
|
|
—
|
|
—
|
|
3,313
|
|
|||||||
|
Transfers
|
—
|
|
2,012
|
|
14,264
|
|
18,577
|
|
—
|
|
49
|
|
(34,902
|
)
|
—
|
|
|||||||
|
Disposals
|
—
|
|
—
|
|
(149
|
)
|
(2,144
|
)
|
—
|
|
(85
|
)
|
(67
|
)
|
(2,445
|
)
|
|||||||
|
Disposals of subsidiaries
|
(11,471
|
)
|
—
|
|
(593
|
)
|
(17
|
)
|
(1,667
|
)
|
—
|
|
—
|
|
(13,748
|
)
|
|||||||
|
Reclassification to non-income tax credits (**)
|
—
|
|
—
|
|
(114
|
)
|
(422
|
)
|
—
|
|
—
|
|
(39
|
)
|
(575
|
)
|
|||||||
|
Depreciation
|
—
|
|
(3,002
|
)
|
(19,771
|
)
|
(63,644
|
)
|
(64,148
|
)
|
(2,469
|
)
|
—
|
|
(153,034
|
)
|
|||||||
|
Closing net book amount
|
780,184
|
|
16,324
|
|
188,622
|
|
205,148
|
|
232,956
|
|
6,301
|
|
50,904
|
|
1,480,439
|
|
|||||||
|
At December 31, 2018
|
|
|
|
|
|
|
|
|
|
|
|
|
|
|
|||||||||
|
Cost of fair value
|
780,184
|
|
32,718
|
|
344,915
|
|
718,978
|
|
480,049
|
|
21,611
|
|
50,904
|
|
2,429,359
|
|
|||||||
|
Accumulated depreciation
|
—
|
|
(16,394
|
)
|
(156,293
|
)
|
(513,830
|
)
|
(247,093
|
)
|
(15,310
|
)
|
—
|
|
(948,920
|
)
|
|||||||
|
Net book amount
|
780,184
|
|
16,324
|
|
188,622
|
|
205,148
|
|
232,956
|
|
6,301
|
|
50,904
|
|
1,480,439
|
|
|||||||
(*) Prior periods have been recast to reflect the Company's change in accounting policy for Investment properties as described in Note 33.
The accompanying notes are an integral part of these consolidated financial statements.
F-
41
Adecoagro S.A.
Notes to the Consolidated Financial Statements (Continued)
(All amounts in US$ thousands, except shares and per share data and as otherwise indicated)
|
12.
|
Property, plant and equipment (continued)
|
(**) Brazilian federal tax law allows entities to take a percentage of the total cost of the assets purchased as a tax credit. As of
December 31, 2018
and
2017
, ICMS (Imposto sobre Circulação de Mercadorias e Prestação de Serviços) tax credits were reclassified to trade and other receivables.
Depreciation is calculated using the straight-line method to allocated their cost over the estimated usefull lives. Farmlands are not depreciated.
|
Farmland improvements
|
5-25 years
|
|
Buildings and facilities
|
20 years
|
|
Furniture and fittings
|
10 years
|
|
Computer equipment
|
3-5 years
|
|
Machinery and equipment
|
4-10 years
|
|
Vehicles
|
4-5 years
|
|
Bearer plants
|
6 years - based on productivity
|
The assets’ residual values and useful lives are reviewed, and adjusted if appropriate, at each statement of financial position date.
Since September 2018 the Group changed the accounting policy for its farmlands (See Note 33 - Basis of presentation - Changes in accounting policies), adopting the valuation at Fair Value. For all farmlands with a total valuation of US$
785 million
as of December 31, 2018, the valuation was determined using sales Comparison Approach prepared by an independent expert. Sale prices of comparable properties are adjusted considering the specific aspects of each property, the most relevant premise being the price per hectare (Level 3).
The Group estimated that, other factors being constant, a
10%
reduction on the Sales price for the period ended December 31, 2018 would have reduced the value of the farmlands on US$
78.5 million
, which would impact, net of its tax effect on the "Revaluation surplus" item in the statement of Changes in Shareholders' Equity. If farmlands were stated on the historical cost basis, the amount as of December 31, 2018 would be US$
235 million
”.
Depreciation charges are included in “Cost of production of Biological Assets”, “Cost of production of manufactures products”, “General and administrative expenses”, “Selling expenses” and capitalized in “Property, plant and equipment” for the years ended
December 31, 2018
and
2017
.
During the year ended
December 31, 2018
, borrowing costs of US$
12,764
(
2017
:US$
3,660
) were capitalized as components of the cost of acquisition or construction for qualifying assets.
Certain of the Group’s assets have been pledged as collateral to secure the Group’s borrowings and other payables. The net book value of the pledged assets amounts to US$
349,400
as of
December 31, 2018
(
2017
: US$
265,099
).
The accompanying notes are an integral part of these consolidated financial statements.
F-
42
Adecoagro S.A.
Notes to the Consolidated Financial Statements (Continued)
(All amounts in US$ thousands, except shares and per share data and as otherwise indicated)
|
13.
|
Investment property
|
Changes in the Group’s investment property in
2018
and
2017
were as follows:
|
|
2018
|
2017 (*)
|
|||
|
Beginning of the year
|
42,342
|
|
44,581
|
|
|
|
Net gain from fair value adjustment (Note 8)
|
13,409
|
|
4,302
|
|
|
|
Reclassification to property, plant and equipment (i)
|
(3,313
|
)
|
—
|
|
|
|
Exchange difference
|
(11,713
|
)
|
(6,541
|
)
|
|
|
End of the year
|
40,725
|
|
42,342
|
|
|
|
Fair value
|
40,725
|
|
42,342
|
|
|
|
Net book amount
|
40,725
|
|
42,342
|
|
|
(i) Relates to new contracts with third parties.
Since September 2018 the Group changed the accounting policy for all Investment properties. (See Note 33 - Basis of presentation - Changes in accounting policies), adopting the valuation at Fair Value. For all Investment properties with a total valuation of US$
40.7 million
as of December 31, 2018, the valuation was determined using Sales Comparison Approach prepared by an independent expert. Sale prices of comparable properties are adjusted considering the specific aspects of each property, the most relevant premise being the price per hectare (Level 3). The increase /decrease in the Fair value is recognized in the Statement of income under the line item "Other operating income, net". The Group estimated that, other factors being constant, a
10%
reduction on the Sales price for the period ended December 31, 2018 would have reduced the value of the Investment properties on US$
4.1 million
, which would impact the line item "Net gain from fair value adjustment ".
The accompanying notes are an integral part of these consolidated financial statements.
F-
43
Adecoagro S.A.
Notes to the Consolidated Financial Statements (Continued)
(All amounts in US$ thousands, except shares and per share data and as otherwise indicated)
|
14.
|
Intangible assets
|
Changes in the Group’s intangible assets in
2018
and
2017
were as follows:
|
|
Goodwill
|
Software
|
Others
|
Total
|
|||||||
|
At January 1, 2017
|
|
|
|
|
|
|
|
|
|||
|
Cost
|
13,405
|
|
5,406
|
|
2,671
|
|
21,482
|
|
|||
|
Accumulated amortization
|
—
|
|
(2,505
|
)
|
(1,725
|
)
|
(4,230
|
)
|
|||
|
Net book amount
|
13,405
|
|
2,901
|
|
946
|
|
17,252
|
|
|||
|
Year ended December 31, 2017
|
|
|
|
|
|
|
|||||
|
Opening net book amount
|
13,405
|
|
2,901
|
|
946
|
|
17,252
|
|
|||
|
Exchange differences
|
(993
|
)
|
(244
|
)
|
(10
|
)
|
(1,247
|
)
|
|||
|
Additions
|
—
|
|
2,089
|
|
34
|
|
2,123
|
|
|||
|
Amortization charge (i)
|
—
|
|
(895
|
)
|
(41
|
)
|
(936
|
)
|
|||
|
Closing net book amount
|
12,412
|
|
3,851
|
|
929
|
|
17,192
|
|
|||
|
At December 31, 2017
|
|
|
|
|
|
|
|||||
|
Cost
|
12,412
|
|
7,251
|
|
2,695
|
|
22,358
|
|
|||
|
Accumulated amortization
|
—
|
|
(3,400
|
)
|
(1,766
|
)
|
(5,166
|
)
|
|||
|
Net book amount
|
12,412
|
|
3,851
|
|
929
|
|
17,192
|
|
|||
|
Year ended December 31, 2018
|
|
|
|
|
|
|
|||||
|
Opening net book amount
|
12,412
|
|
3,851
|
|
929
|
|
17,192
|
|
|||
|
Adjustment of opening net book amount for the application of IAS 29 (Note 33)
|
15,554
|
|
836
|
|
—
|
|
16,390
|
|
|||
|
Exchange differences
|
(6,616
|
)
|
(1,139
|
)
|
(20
|
)
|
(7,775
|
)
|
|||
|
Additions
|
—
|
|
3,217
|
|
105
|
|
3,322
|
|
|||
|
Amortization charge (i)
|
—
|
|
(1,168
|
)
|
(52
|
)
|
(1,220
|
)
|
|||
|
Closing net book amount
|
21,350
|
|
5,597
|
|
962
|
|
27,909
|
|
|||
|
At December 31, 2018
|
|
|
|
|
|
|
|||||
|
Cost
|
21,350
|
|
10,163
|
|
2,781
|
|
34,294
|
|
|||
|
Accumulated amortization
|
—
|
|
(4,566
|
)
|
(1,819
|
)
|
(6,385
|
)
|
|||
|
Net book amount
|
21,350
|
|
5,597
|
|
962
|
|
27,909
|
|
|||
|
(i)
|
Amortization charges are included in “General and administrative expenses” and “Selling expenses” for the years ended
December 31, 2018
and
2017
, respectively. There were no impairment charges for any of the years presented (see Note 32 (a)).
|
The accompanying notes are an integral part of these consolidated financial statements.
F-
44
Adecoagro S.A.
Notes to the Consolidated Financial Statements (Continued)
(All amounts in US$ thousands, except shares and per share data and as otherwise indicated)
|
15.
|
Biological assets
|
Changes in the Group’s biological assets in
2018
and
2017
were as follows:
|
|
2018
|
||||||||||||||||
|
|
Crops
(ii)
|
Rice
(ii)
|
Dairy
|
All other
segments
|
Sugarcane
(ii)
|
Total
|
|||||||||||
|
Beginning of the year
|
31,745
|
|
29,717
|
|
9,338
|
|
4,016
|
|
93,178
|
|
167,994
|
|
|||||
|
Adjustment of opening net book amount for the application of IAS 29
|
640
|
|
17
|
|
—
|
|
—
|
|
—
|
|
657
|
|
|||||
|
Increase due to purchases
|
—
|
|
—
|
|
—
|
|
906
|
|
—
|
|
906
|
|
|||||
|
Initial recognition and changes in fair value of biological assets (i)
|
28,663
|
|
4,125
|
|
5,455
|
|
(1,198
|
)
|
(20,850
|
)
|
16,195
|
|
|||||
|
Decrease due to harvest / disposals
|
(104,941
|
)
|
(39,578
|
)
|
(25,800
|
)
|
(1,278
|
)
|
(105,536
|
)
|
(277,133
|
)
|
|||||
|
Costs incurred during the year
|
78,984
|
|
33,121
|
|
23,731
|
|
1,769
|
|
94,121
|
|
231,726
|
|
|||||
|
Exchange differences
|
(7,744
|
)
|
(10,229
|
)
|
(2,426
|
)
|
(1,121
|
)
|
(13,438
|
)
|
(34,958
|
)
|
|||||
|
End of the year
|
27,347
|
|
17,173
|
|
10,298
|
|
3,094
|
|
47,475
|
|
105,387
|
|
|||||
|
|
2017
|
||||||||||||||||
|
|
Crops
(ii)
|
Rice
(ii)
|
Dairy
|
All other
segments
|
Sugarcane
(ii)
|
Total
|
|||||||||||
|
Beginning of the year
|
28,189
|
|
25,575
|
|
6,827
|
|
2,433
|
|
82,380
|
|
145,404
|
|
|||||
|
Increase due to purchases
|
—
|
|
—
|
|
610
|
|
1,084
|
|
—
|
|
1,694
|
|
|||||
|
Initial recognition and changes in fair value of biological assets (i)
|
17,158
|
|
10,236
|
|
11,769
|
|
267
|
|
23,790
|
|
63,220
|
|
|||||
|
Decrease due to harvest / disposals
|
(102,734
|
)
|
(43,842
|
)
|
(34,569
|
)
|
(616
|
)
|
(113,184
|
)
|
(294,945
|
)
|
|||||
|
Costs incurred during the year
|
92,034
|
|
39,547
|
|
26,002
|
|
1,478
|
|
101,277
|
|
260,338
|
|
|||||
|
Exchange differences
|
(2,902
|
)
|
(1,799
|
)
|
(1,301
|
)
|
(630
|
)
|
(1,085
|
)
|
(7,717
|
)
|
|||||
|
End of the year
|
31,745
|
|
29,717
|
|
9,338
|
|
4,016
|
|
93,178
|
|
167,994
|
|
|||||
(i) Biological asset with a production cycle of more than one year (that is dairy and cattle) generated “Initial recognition and changes in fair value of biological assets” amounting to US$
4,257
for the year ended
December 31, 2018
(
2017
: US$
12,036
). In
2018
, an amount of US$
2,414
(
2017
: US$
2,830
) was attributable to price changes, and an amount of US$
1,843
(
2017
: US$
9,206
) was attributable to physical changes.
(ii)
Biological assets that are measured at fair value within level 3 of the hierarchy.
The accompanying notes are an integral part of these consolidated financial statements.
F-
45
Adecoagro S.A.
Notes to the Consolidated Financial Statements (Continued)
(All amounts in US$ thousands, except shares and per share data and as otherwise indicated)
|
15.
|
Biological assets (continued)
|
Cost of production as of
December 31, 2018
:
|
Crops
|
Rice
|
Dairy
|
All other
segments
|
Sugar,
Ethanol and
Energy
|
Total
|
||||||||||||
|
Salaries, social security expenses and employee benefits
|
2,710
|
|
5,336
|
|
3,429
|
|
540
|
|
9,408
|
|
21,423
|
|
|||||
|
Depreciation and amortization
|
147
|
|
—
|
|
—
|
|
—
|
|
3,436
|
|
3,583
|
|
|||||
|
Fertilizers, agrochemicals and seeds
|
34,961
|
|
10,189
|
|
—
|
|
—
|
|
35,016
|
|
80,166
|
|
|||||
|
Fuel, lubricants and others
|
811
|
|
660
|
|
683
|
|
60
|
|
2,790
|
|
5,004
|
|
|||||
|
Maintenance and repairs
|
943
|
|
2,349
|
|
1,557
|
|
287
|
|
1,789
|
|
6,925
|
|
|||||
|
Freights
|
119
|
|
387
|
|
80
|
|
92
|
|
—
|
|
678
|
|
|||||
|
Contractors and services
|
23,231
|
|
10,571
|
|
—
|
|
38
|
|
5,621
|
|
39,461
|
|
|||||
|
Feeding expenses
|
—
|
|
—
|
|
9,795
|
|
146
|
|
—
|
|
9,941
|
|
|||||
|
Veterinary expenses
|
—
|
|
—
|
|
1,522
|
|
141
|
|
—
|
|
1,663
|
|
|||||
|
Energy power
|
109
|
|
2,432
|
|
764
|
|
—
|
|
—
|
|
3,305
|
|
|||||
|
Professional fees
|
165
|
|
83
|
|
140
|
|
4
|
|
177
|
|
569
|
|
|||||
|
Other taxes
|
1,293
|
|
114
|
|
8
|
|
83
|
|
42
|
|
1,540
|
|
|||||
|
Lease expense and similar arrangements
|
11,868
|
|
174
|
|
—
|
|
3
|
|
34,666
|
|
46,711
|
|
|||||
|
Others
|
2,627
|
|
826
|
|
289
|
|
30
|
|
1,176
|
|
4,948
|
|
|||||
|
Subtotal
|
78,984
|
|
33,121
|
|
18,267
|
|
1,424
|
|
94,121
|
|
225,917
|
|
|||||
|
Own agricultural produce consumed
|
—
|
|
—
|
|
5,464
|
|
345
|
|
—
|
|
5,809
|
|
|||||
|
Total
|
78,984
|
|
33,121
|
|
23,731
|
|
1,769
|
|
94,121
|
|
231,726
|
|
|||||
The accompanying notes are an integral part of these consolidated financial statements.
F-
46
Adecoagro S.A.
Notes to the Consolidated Financial Statements (Continued)
(All amounts in US$ thousands, except shares and per share data and as otherwise indicated)
|
15.
|
Biological assets (continued)
|
Cost of production as of
December 31, 2017
:
|
Crops
|
Rice
|
Dairy
|
All other
segments
|
Sugar,
Ethanol and
Energy
|
Total
|
||||||||||||
|
Salaries, social security expenses and employee benefits
|
3,999
|
|
7,312
|
|
4,762
|
|
386
|
|
12,224
|
|
28,683
|
|
|||||
|
Depreciation and amortization
|
413
|
|
—
|
|
—
|
|
—
|
|
5,989
|
|
6,402
|
|
|||||
|
Fertilizers, agrochemicals and seeds
|
35,715
|
|
10,647
|
|
9
|
|
—
|
|
31,144
|
|
77,515
|
|
|||||
|
Fuel, lubricants and others
|
1,075
|
|
666
|
|
741
|
|
64
|
|
3,220
|
|
5,766
|
|
|||||
|
Maintenance and repairs
|
1,303
|
|
2,419
|
|
1,912
|
|
220
|
|
2,329
|
|
8,183
|
|
|||||
|
Freights
|
234
|
|
500
|
|
128
|
|
77
|
|
—
|
|
939
|
|
|||||
|
Contractors and services
|
29,738
|
|
14,706
|
|
—
|
|
30
|
|
4,232
|
|
48,706
|
|
|||||
|
Feeding expenses
|
—
|
|
—
|
|
9,585
|
|
174
|
|
—
|
|
9,759
|
|
|||||
|
Veterinary expenses
|
—
|
|
—
|
|
1,783
|
|
148
|
|
—
|
|
1,931
|
|
|||||
|
Energy power
|
123
|
|
1,954
|
|
698
|
|
—
|
|
—
|
|
2,775
|
|
|||||
|
Professional fees
|
180
|
|
173
|
|
220
|
|
19
|
|
84
|
|
676
|
|
|||||
|
Other taxes
|
1,621
|
|
156
|
|
7
|
|
129
|
|
91
|
|
2,004
|
|
|||||
|
Lease expense and similar arrangements
|
13,057
|
|
138
|
|
—
|
|
—
|
|
40,757
|
|
53,952
|
|
|||||
|
Others
|
4,576
|
|
876
|
|
368
|
|
122
|
|
1,207
|
|
7,149
|
|
|||||
|
Subtotal
|
92,034
|
|
39,547
|
|
20,213
|
|
1,369
|
|
101,277
|
|
254,440
|
|
|||||
|
Own agricultural produce consumed
|
—
|
|
—
|
|
5,789
|
|
109
|
|
—
|
|
5,898
|
|
|||||
|
Total
|
92,034
|
|
39,547
|
|
26,002
|
|
1,478
|
|
101,277
|
|
260,338
|
|
|||||
Biological assets in
December 31, 2018
and
2017
were as follows:
|
|
2018
|
2017
|
|||
|
Non-current
|
|
|
|
|
|
|
Cattle for dairy production (i)
|
9,859
|
|
8,989
|
|
|
|
Breeding cattle (ii)
|
1,310
|
|
1,984
|
|
|
|
Other cattle (ii)
|
101
|
|
303
|
|
|
|
|
11,270
|
|
11,276
|
|
|
|
Current
|
|
|
|
|
|
|
Breeding cattle (iii)
|
1,683
|
|
1,729
|
|
|
|
Other cattle (iii)
|
439
|
|
349
|
|
|
|
Sown land – crops (ii)
|
27,347
|
|
31,745
|
|
|
|
Sown land – rice (ii)
|
17,173
|
|
29,717
|
|
|
|
Sown land – sugarcane (ii)
|
47,475
|
|
93,178
|
|
|
|
|
94,117
|
|
156,718
|
|
|
|
Total biological assets
|
105,387
|
|
167,994
|
|
|
|
(i)
|
Classified as bearer and mature biological assets.
|
|
(ii)
|
Classified as consumable and immature biological assets.
|
|
(iii)
|
Classified as consumable and mature biological assets.
|
The accompanying notes are an integral part of these consolidated financial statements.
F-
47
Adecoagro S.A.
Notes to the Consolidated Financial Statements (Continued)
(All amounts in US$ thousands, except shares and per share data and as otherwise indicated)
|
15.
|
Biological assets (continued)
|
The fair value less estimated point of sale costs of agricultural produce at the point of harvest amounted to US$
105,536
for the year ended
December 31, 2018
(
2017
: US$
113,184
).
The following table presents the Group´s biological assets that are measured at fair value at
December 31, 2018
and
2017
(see Note 17 to see the description of each fair value level):
|
|
2018
|
2017
|
|||||||||||||||||||||
|
|
Level 1
|
Level 2
|
Level 3
|
Total
|
Level 1
|
Level 2
|
Level 3
|
Total
|
|||||||||||||||
|
Cattle for dairy production
|
—
|
|
9,859
|
|
—
|
|
9,859
|
|
—
|
|
8,989
|
|
—
|
|
8,989
|
|
|||||||
|
Breeding cattle
|
2,993
|
|
—
|
|
—
|
|
2,993
|
|
3,713
|
|
—
|
|
—
|
|
3,713
|
|
|||||||
|
Other cattle
|
—
|
|
540
|
|
—
|
|
540
|
|
—
|
|
652
|
|
—
|
|
652
|
|
|||||||
|
Sown land – sugarcane
|
—
|
|
—
|
|
47,475
|
|
47,475
|
|
—
|
|
—
|
|
93,178
|
|
93,178
|
|
|||||||
|
Sown land – crops
|
—
|
|
—
|
|
27,347
|
|
27,347
|
|
—
|
|
—
|
|
31,745
|
|
31,745
|
|
|||||||
|
Sown land – rice
|
—
|
|
—
|
|
17,173
|
|
17,173
|
|
—
|
|
—
|
|
29,717
|
|
29,717
|
|
|||||||
There were no transfers between any levels during the year.
The accompanying notes are an integral part of these consolidated financial statements.
F-
48
Adecoagro S.A.
Notes to the Consolidated Financial Statements (Continued)
(All amounts in US$ thousands, except shares and per share data and as otherwise indicated)
|
15.
|
Biological assets (continued)
|
The following significant unobservable inputs were used to measure the Group´s biological assets using the discounted cash flow valuation technique:
|
Description
|
Unobservable
inputs
|
Range of unobservable inputs
|
Relationship of unobservable
inputs to fair value
|
|||||
|
|
|
2018
|
2017
|
|
||||
|
Sown land – sugarcane
|
Sugarcane yield – tonnes per hectare; Sugarcane TRS (kg of sugar per ton of cane) Production Costs – US$ per hectare. (Include maintenance, harvest and leasing costs)
|
-Sugarcane yield: 60-100 tn/ha
-Sugarcane TRS: 120-140 kg of sugar/ton of cane -Maintenance costs: 500-700 US$/ha -Harvest costs: 9.0 -15.0 US$/ton of cane -Leasing costs: 12.0-14.4 tn/ha |
-Sugarcane yield: 60-100 tn/ha
-Sugarcane TRS: 120-140 kg of sugar/ton of cane -Maintenance costs: 500-700 US$/ha -Harvest costs: 9.0 -14.0 US$/ton of cane -Leasing costs: 11.4-14.4 tn/ha |
The higher the sugarcane yield, the higher the fair value. The higher the maintenance, harvest and leasing costs per hectare, the lower the fair value. The higher the TRS of sugarcane, the higher the fair value.
|
||||
|
Sown land – crops
|
Crops yield – tonnes per hectare; Commercial Costs – US$ per hectare;
Production Costs – US$ per hectare. |
- Crops yield: 1.2 – 5.2 tn/ha for Wheat, 2.2 – 9.4 tn/ha for Corn, 1.1 - 4.1 tn/ha for Soybean and 1.5-2.1 for Sunflower
- Commercial Costs: 55-120 US$/ha for Wheat, 85-230 US$/ha for Corn, 55-110 US$/ha for Soybean and 45-80 US$/ha for Sunflower - Production Costs: 140-460 US$/ha for Wheat, 300-620 US$/ha for Corn, 260-460 US$/ha for Soybean and 220-360 US$/ha for Sunflower |
- Crops yield: 1.5 – 5.1 tn/ha for Wheat, 4.0 – 8.0 tn/ha for Corn, 1.4 - 3.4 tn/ha for Soybean and 2.1-3.5 for Sunflower
- Commercial Costs: 50-110 US$/ha for Wheat, 107-300 US$/ha for Corn, 172-176 US$/ha for Soybean and 10-37 US$/ha for Sunflower - Production Costs: 200-540 US$/ha for Wheat, 230-550 US$/ha for Corn, 250-350 US$/ha for Soybean and 230-350 US$/ha for Sunflower |
The higher the crops yield, the higher the fair value. The higher the commercial and direct costs per hectare, the lower the fair value.
|
||||
|
Sown land – rice
|
Rice yield – tonnes per hectare;
Commercial Costs – US$ per hectare; Production Costs – US$ per hectare. |
-Rice yield: 6.0 -7.4 tn/ha
-Commercial Costs: 11-14 US$/ha -Production Costs: 830-1,090 US$/ha |
-Rice yield: 5.0 -5.9 tn/ha
-Commercial Costs: 3-9 US$/ha -Production Costs: 750-1,000 US$/ha |
The higher the rice yield, the higher the fair value. The higher the commercial and direct costs per hectare, the lower the fair value.
|
||||
As of
December 31, 2018
, the impact of a reasonable 10 % increase (decrease) in estimated costs, with all other variables held constant, would result in a decrease (increase) in the fair value of the Group’s plantations less cost to sell of US$
7.9 million
for sugarcane, US$
2.8 million
for crops and US$
2.0 million
for rice.
As of
December 31, 2017
, the impact of a reasonable 10 % increase (decrease) in estimated costs, with all other variables held constant, would result in a decrease (increase) in the fair value of the Group’s plantations less cost to sell of US$
8.6 million
for sugarcane, US$
1.5 million
for crops and US$
3.4 million
for rice.
The accompanying notes are an integral part of these consolidated financial statements.
F-
49
Adecoagro S.A.
Notes to the Consolidated Financial Statements (Continued)
(All amounts in US$ thousands, except shares and per share data and as otherwise indicated)
|
16.
|
Investments in joint ventures
|
The table below lists the Group’s investment in joint ventures for the years ended
December 31, 2018
, 2017 and
2016
:
|
|
% of ownership interest held
|
||||||
|
Name of the entity
|
Country of
incorporation and operation
|
December 31, 2018
|
December 31, 2017
|
December 31, 2016
|
|||
|
CHS AGRO S.A. (i)
|
Argentina
|
50
|
%
|
50
|
%
|
50
|
%
|
On February 26, 2013, the Group formed CHS AGRO, a joint venture with CHS Inc. CHS Inc. is a leading farmer-owned energy, grains and foods company based in the United States. The Group holds a
50%
interest in CHS AGRO. On October 2014, CHS AGRO finished its sunflower processing plant in the city of Pehuajo, Province of Buenos Aires, Argentina.
The following amounts represent the assets (including goodwill) and liabilities, and income and expenses of the joint ventures:
|
|
2018
|
2017
|
|||
|
Assets:
|
|
|
|
|
|
|
Non-current assets
|
9,860
|
|
7,931
|
|
|
|
Current assets
|
6,710
|
|
8,882
|
|
|
|
|
16,570
|
|
16,813
|
|
|
|
Liabilities:
|
|
|
|
|
|
|
Non-current liabilities
|
25,949
|
|
22,002
|
|
|
|
Current liabilities
|
18,622
|
|
19,197
|
|
|
|
|
44,571
|
|
41,199
|
|
|
|
Net liabilities of joint venture
|
(28,001
|
)
|
(24,386
|
)
|
|
|
|
2018
|
2017
|
2016
|
|||||
|
Income
|
9,305
|
|
14,879
|
|
9,390
|
|
||
|
Expenses
|
(31,989
|
)
|
(22,657
|
)
|
(16,048
|
)
|
||
|
Loss before income tax
|
(22,684
|
)
|
(7,778
|
)
|
(6,658
|
)
|
||
The shares in the joint ventures were not publicly traded for any of the years presented.
There are no contingent liabilities relating to the Group’s interest in the joint ventures, and no contingent liabilities of the ventures themselves.
According to the laws of certain of the countries in which the Group operates,
5%
of the profit of the year is separated to constitute legal reserves until they reach legal capped amounts (
20%
of total capital). These legal reserves are not available for dividend distribution and can only be released to absorb losses. The Group’s joint ventures have not reached the legal capped amounts.
The Group guarantees some financial debt of CHS AGRO for an amount of
$9.8 million
.
The accompanying notes are an integral part of these consolidated financial statements.
F-
50
Adecoagro S.A.
Notes to the Consolidated Financial Statements (Continued)
(All amounts in US$ thousands, except shares and per share data and as otherwise indicated)
|
17.
|
Financial instruments by category
|
The Group classified its financial assets in the following categories:
(a) Financial assets at fair value through profit or loss
Financial assets at fair value through profit or loss are financial assets held for trading. A financial asset is classified in this category if acquired principally for the purpose of selling in the short-term. Derivatives are also categorized as held for trading unless they are designated as hedges. For all years presented, the Group’s financial assets at fair value through profit or loss comprise mainly derivative financial instruments.
(b) Financial assets at amortized cost.
Financial assets at amortized cost, namely loans and receivables, are non-derivative financial assets with fixed or determinable payments that are not quoted in an active market. Loans and receivables comprise “trade and other receivables” and “cash and cash equivalents” in the statement of financial position.
The following tables show the carrying amounts of financial assets and financial liabilities by category of financial instrument and reconciliation to the corresponding line item in the statements of financial position, as appropriate. Since the line items “Trade and other receivables, net” and “Trade and other payables” contain both financial instruments and non-financial assets or liabilities (such as other tax receivables or advance payments for services to be received in the future), the reconciliation is shown in the columns headed “Non-financial assets” and “Non-financial liabilities”. There was no reclassification between categories for the adoption of IFRS 9 (see Note 33).
|
|
Financial assets at amortized cost
|
Assets at fair
value through
profit or loss
|
Subtotal
financial
assets
|
Non-
financial
assets
|
Total
|
|||||||||
|
December 31, 2018
|
|
|
|
|
|
|
|
|
|
|
||||
|
Assets as per statement of financial position
|
|
|
|
|
|
|
|
|
|
|
||||
|
Trade and other receivables
|
91,183
|
|
—
|
|
91,183
|
|
106,323
|
|
197,506
|
|
||||
|
Derivative financial instruments
|
—
|
|
6,286
|
|
6,286
|
|
—
|
|
6,286
|
|
||||
|
Cash and cash equivalents
|
273,635
|
|
—
|
|
273,635
|
|
—
|
|
273,635
|
|
||||
|
Total
|
364,818
|
|
6,286
|
|
371,104
|
|
106,323
|
|
477,427
|
|
||||
|
|
Liabilities at
fair value
through profit
or loss
|
Financial
liabilities at
amortized cost
|
Subtotal
financial
liabilities
|
Non-
financial
liabilities
|
Total
|
|||||||||
|
Liabilities as per statement of financial position
|
|
|
|
|
|
|
|
|
|
|
||||
|
Trade and other payables
|
—
|
|
96,167
|
|
96,167
|
|
10,270
|
|
106,437
|
|
||||
|
Borrowings (excluding finance lease liabilities) (i)
|
—
|
|
861,521
|
|
861,521
|
|
—
|
|
861,521
|
|
||||
|
Finance leases
|
—
|
|
595
|
|
595
|
|
—
|
|
595
|
|
||||
|
Derivative financial instruments (i)
|
283
|
|
—
|
|
283
|
|
—
|
|
283
|
|
||||
|
Total
|
283
|
|
958,283
|
|
958,566
|
|
10,270
|
|
968,836
|
|
||||
(i) Effective July 1, 2013, the Group formally documented and designated cash flow hedging relationships to hedge the foreign exchange rate risk of a portion of its highly probable future sales in U.S. Dollars using a portion of its borrowings denominated in U.S. Dollars, currency forwards and foreign currency floating-to-fixed interest rate swaps (see Note 2).
The accompanying notes are an integral part of these consolidated financial statements.
F-
51
Adecoagro S.A.
Notes to the Consolidated Financial Statements (Continued)
(All amounts in US$ thousands, except shares and per share data and as otherwise indicated)
|
17.
|
Financial instruments by category (continued)
|
|
|
Financial assets at amortized cost
|
Assets at fair
value through
profit or loss
|
Subtotal
financial
assets
|
Non-
financial
assets
|
Total
|
|||||||||
|
December 31, 2017
|
|
|
|
|
|
|
|
|
|
|
||||
|
Assets as per statement of financial position
|
|
|
|
|
|
|
|
|
|
|
||||
|
Trade and other receivables
|
68,869
|
|
—
|
|
68,869
|
|
103,345
|
|
172,214
|
|
||||
|
Derivative financial instruments
|
—
|
|
4,483
|
|
4,483
|
|
—
|
|
4,483
|
|
||||
|
Cash and cash equivalents
|
269,195
|
|
—
|
|
269,195
|
|
—
|
|
269,195
|
|
||||
|
Total
|
338,064
|
|
4,483
|
|
342,547
|
|
103,345
|
|
445,892
|
|
||||
|
|
Liabilities at
fair value
through profit
or loss
|
Financial
liabilities at
amortized cost
|
Subtotal
financial
liabilities
|
Non-
financial
liabilities
|
Total
|
|||||||||
|
Liabilities as per statement of financial position
|
|
|
|
|
|
|
|
|
|
|
||||
|
Trade and other payables
|
—
|
|
86,066
|
|
86,066
|
|
13,184
|
|
99,250
|
|
||||
|
Borrowings (excluding finance lease liabilities) (i)
|
—
|
|
817,853
|
|
817,853
|
|
—
|
|
817,853
|
|
||||
|
Finance leases
|
—
|
|
105
|
|
105
|
|
—
|
|
105
|
|
||||
|
Derivative financial instruments (i)
|
552
|
|
—
|
|
552
|
|
—
|
|
552
|
|
||||
|
Total
|
552
|
|
904,024
|
|
904,576
|
|
13,184
|
|
917,760
|
|
||||
(i) Effective July 1, 2013,the Group formally documented and designated cash flow hedging relationships to hedge the foreign exchange rate risk of a portion of its highly probable future sales in U.S. Dollars using a portion of its borrowings denominated in U.S. Dollars, currency forwards and foreign currency floating-to-fixed interest rate swaps (see Note 2).
Liabilities carried at amortized cost also included liabilities under finance leases where the Group is the lessee and which therefore have to be measured in accordance with IAS 17. The categories disclosed are determined by reference to IFRS 9. Finance leases are excluded from the scope of IFRS 7. Therefore, finance leases have been shown separately.
Because of the short maturities of most trade accounts receivable and payable, other receivables and liabilities, and cash and cash equivalents, their carrying amounts at the closing date do not differ significantly from their respective fair values. The fair value of long-term borrowings is disclosed in Note 26.
Income, expense, gains and losses on financial instruments can be assigned to the following categories:
|
|
Financial asset at amortized cost
|
Assets/ liabilities
at fair value
through profit or
loss
|
Other financial
liabilities at
amortized cost
|
Total
|
|||||||
|
December 31, 2018
|
|
|
|
|
|
|
|
|
|||
|
Interest income (i)
|
7,915
|
|
—
|
|
—
|
|
7,915
|
|
|||
|
Interest expense (i)
|
(35,794
|
)
|
—
|
|
(15,783
|
)
|
(51,577
|
)
|
|||
|
Foreign exchange gains / (losses) (i)
|
(108,936
|
)
|
(41,218
|
)
|
(33,041
|
)
|
(183,195
|
)
|
|||
|
Gain from derivative financial instruments (ii)
|
—
|
|
51,670
|
|
—
|
|
51,670
|
|
|||
|
Net result
|
(136,815
|
)
|
10,452
|
|
(48,824
|
)
|
(175,187
|
)
|
|||
The accompanying notes are an integral part of these consolidated financial statements.
F-
52
Adecoagro S.A.
Notes to the Consolidated Financial Statements (Continued)
(All amounts in US$ thousands, except shares and per share data and as otherwise indicated)
|
17.
|
Financial instruments by category (continued)
|
|
|
Financial assets at amortized cost
|
Assets/ liabilities
at fair value
through profit or
loss
|
Financial
liabilities at
amortized cost
|
Total
|
|||||||
|
December 31, 2017
|
|
|
|
|
|
|
|
|
|||
|
Interest income (i)
|
11,230
|
|
—
|
|
—
|
|
11,230
|
|
|||
|
Interest expense (i)
|
(41,968
|
)
|
—
|
|
(10,340
|
)
|
(52,308
|
)
|
|||
|
Foreign exchange gains/ (losses) (i)
|
(15,634
|
)
|
(9,402
|
)
|
(13,672
|
)
|
(38,708
|
)
|
|||
|
Loss from derivative financial instruments (ii)
|
—
|
|
38,679
|
|
—
|
|
38,679
|
|
|||
|
Net result
|
(46,372
|
)
|
29,277
|
|
(24,012
|
)
|
(41,107
|
)
|
|||
|
(i)
|
Included in “Financial Results, net” in the statement of income.
|
|
(ii)
|
Included in “Other operating income, net” and “Financial Results, net” in the statement of income.
|
Determining fair values
IFRS 13 defines fair value as the price that would be received to sell an asset or paid to transfer a liability in an orderly transaction between market participants at the measurement date. All financial instruments recognized at fair value are allocated to one of the valuation hierarchy levels of IFRS 13. This valuation hierarchy provides for three levels. The allocation reflects which of the fair values derive from transactions in the market and where valuation is based on models because market transactions are lacking. The level in the fair value hierarchy is categorized in its entirety is determined on the basis of the lowest level input that is significant to the fair value measurement in its entirety.
As of
December 31, 2018
and
2017
, the financial instruments recognized at fair value on the statement of financial position comprise derivative financial instruments.
In the case of Level 1, valuation is based on unadjusted quoted prices in active markets for identical financial assets that the Group can refer to at the date of the statement of financial position. The financial instruments the Group has allocated to this level mainly comprise crop futures and options traded on the stock market.
Derivatives not traded on the stock market allocated to Level 2 are valued using models based on observable market data. The financial instruments the Group has allocated to this level mainly comprise interest-rate swaps and foreign-currency interest-rate swaps.
In the case of Level 3, the Group uses valuation techniques not based on inputs observable in the market. This is only permissible insofar as no observable market data are available. The Group does not have financial instruments allocated to this level for any of the years presented.
The following tables present the Group’s financial assets and financial liabilities that are measured at fair value as of
December 31, 2018
and
2017
and their allocation to the fair value hierarchy:
|
|
|
Level 1
|
Level 2
|
Total
|
||||||
|
Assets
|
|
|
|
|
|
|
|
|||
|
Derivative financial instruments
|
2018
|
6,286
|
|
—
|
|
6,286
|
|
|||
|
Derivative financial instruments
|
2017
|
4,463
|
|
20
|
|
4,483
|
|
|||
|
Liabilities
|
|
|
|
|
|
|
|
|||
|
Derivative financial instruments
|
2018
|
(254
|
)
|
(29
|
)
|
(283
|
)
|
|||
|
Derivative financial instruments
|
2017
|
(498
|
)
|
(54
|
)
|
(552
|
)
|
|||
There were
no
transfers within level 1 and 2 during the years ended
December 31, 2018
and
2017
.
The accompanying notes are an integral part of these consolidated financial statements.
F-
53
Adecoagro S.A.
Notes to the Consolidated Financial Statements (Continued)
(All amounts in US$ thousands, except shares and per share data and as otherwise indicated)
|
17.
|
Financial instruments by category (continued)
|
When no quoted prices in an active market are available, fair values (particularly with derivatives) are based on recognized valuation methods. The Group uses a range of valuation models for this purpose, details of which may be obtained from the following table:
|
Class
|
Pricing Method
|
Parameters
|
Pricing Model
|
Level
|
Total
|
||||||
|
Futures
|
Quoted price
|
—
|
—
|
1
|
5,790
|
|
|||||
|
Options
|
Quoted price
|
—
|
—
|
1
|
242
|
|
|||||
|
NDF
|
Quoted price
|
Foreign-exchange curve.
|
Present value method
|
2
|
(29
|
)
|
|||||
|
|
|
|
|
|
6,003
|
|
|||||
|
18.
|
Trade and other receivables, net
|
|
|
2018
|
2017
|
|||
|
Non-current
|
|
|
|
|
|
|
Trade receivables
|
—
|
|
6,597
|
|
|
|
Trade receivables
|
—
|
|
6,597
|
|
|
|
Advances to suppliers
|
2,343
|
|
2,363
|
|
|
|
Income tax credits
|
4,429
|
|
6,955
|
|
|
|
Non-income tax credits (i)
|
15,998
|
|
1,863
|
|
|
|
Judicial deposits
|
2,908
|
|
3,191
|
|
|
|
Receivable from disposal of subsidiary (Note 21)
|
10,944
|
|
—
|
|
|
|
Other receivables
|
2,198
|
|
1,138
|
|
|
|
Non-current portion
|
38,820
|
|
22,107
|
|
|
|
Current
|
|
|
|
|
|
|
Trade receivables
|
60,167
|
|
43,078
|
|
|
|
Receivables from related parties (Note 31)
|
8,337
|
|
10,218
|
|
|
|
Less: Allowance for trade receivables
|
(2,503
|
)
|
(1,002
|
)
|
|
|
Trade receivables – net
|
66,001
|
|
52,294
|
|
|
|
Prepaid expenses
|
9,396
|
|
11,565
|
|
|
|
Advances to suppliers
|
43,365
|
|
36,497
|
|
|
|
Income tax credits
|
2,560
|
|
2,046
|
|
|
|
Non-income tax credits (i)
|
28,232
|
|
38,865
|
|
|
|
Receivable from disposal of subsidiary (Note 21)
|
3,709
|
|
—
|
|
|
|
Cash collateral
|
1,505
|
|
380
|
|
|
|
Receivables from related parties (Note 31)
|
324
|
|
176
|
|
|
|
Other receivables
|
3,594
|
|
8,284
|
|
|
|
Subtotal
|
92,685
|
|
97,813
|
|
|
|
Current portion
|
158,686
|
|
150,107
|
|
|
|
Total trade and other receivables, net
|
197,506
|
|
172,214
|
|
|
(i) Includes US$
575
(
2017
:
1,086
) reclassified from property, plant and equipment.
The fair values of current trade and other receivables approximate their respective carrying amounts due to their short-term nature. The fair values of non-current trade and other receivables approximate their carrying amount, as the impact of discounting is not significant.
The accompanying notes are an integral part of these consolidated financial statements.
F-
54
Adecoagro S.A.
Notes to the Consolidated Financial Statements (Continued)
(All amounts in US$ thousands, except shares and per share data and as otherwise indicated)
|
18.
|
Trade and other receivables, net (continued)
|
The carrying amounts of the Group’s trade and other receivables are denominated in the following currencies (expressed in U.S. Dollars):
|
|
2018
|
2017
|
|||
|
Currency
|
|
|
|
|
|
|
U.S. Dollar
|
52,342
|
|
50,400
|
|
|
|
Argentine Peso
|
42,896
|
|
48,911
|
|
|
|
Uruguayan Peso
|
534
|
|
415
|
|
|
|
Brazilian Reais
|
101,734
|
|
72,488
|
|
|
|
|
197,506
|
|
172,214
|
|
|
As of
December 31, 2018
trade receivables of US$
9,509
(
2017
: US$
5,052
) were past due but not impaired. The ageing analysis of these receivables indicates that US$
1,167
and US$
318
are over 6 months in
December 31, 2018
and
2017
, respectively.
Since January 1, 2018, for trade receivables, the Company applies the simplified approach permitted by IFRS 9, which requires expected lifetime losses to be recognized from initial recognition of the receivables, see note 33.1 (i) for further details.
Until December 31, 2017 the Group recognized an allowance for trade receivables when there was objective evidence that the Group would not be able to collect all amounts due according to the original terms of the receivables.
Delinquency in payments was an indicator that a receivable may be impaired. However, management considers all available evidence in determining when a receivable is impaired. Generally, trade receivables, which are more than 180 days past due are fully provided for. However, certain receivables 180+ days overdue are not provided for based on a case-by-case analysis of credit quality analysis. Furthermore, receivables, which are not 180+ days overdue, may be provided for if specific analysis indicates a potential impairment.
Movements on the Group’s allowance for trade receivables are as follows:
|
|
2018
|
2017
|
2016
|
|||||
|
At January 1
|
1,002
|
|
643
|
|
481
|
|
||
|
Charge of the year
|
2,468
|
|
758
|
|
387
|
|
||
|
Unused amounts reversed
|
(237
|
)
|
(133
|
)
|
(178
|
)
|
||
|
Used during the year
|
(281
|
)
|
(193
|
)
|
—
|
|
||
|
Exchange differences
|
(449
|
)
|
(73
|
)
|
(47
|
)
|
||
|
At December 31
|
2,503
|
|
1,002
|
|
643
|
|
||
The creation and release of allowance for trade receivables have been included in “Selling expenses” in the statement of income. Amounts charged to the allowance account are generally written off, when there is no expectation of recovering additional cash.
The maximum exposure to credit risk at the reporting date is the carrying value of each class of receivable mentioned above.
As of
December 31, 2018
, approximately
55%
(
2017
:
89%
) of the outstanding unimpaired trade receivables (neither past due not impaired) relate to sales to
24
well-known multinational companies with good credit quality standing, including but not limited to Raizen Combustiveis S.A., Camara de Comercializacao de Energia Electrica CCEE, Establecimientos Las Marias SACIFA, Cofco Resources S.A., Granar S.A., Rodoil Distribuidora de Combustiveis LTDA, among others. Most of these entities or their parent companies are externally credit-rated. The Group reviews these external ratings from credit agencies.
The remaining percentage as of
December 31, 2018
and
2017
of the outstanding unimpaired trade receivables (neither past due nor impaired) relate to sales to a dispersed large quantity of customers for which external credit ratings may not be available. However, the total base of customers without an external credit rating is relatively stable.
The accompanying notes are an integral part of these consolidated financial statements.
F-
55
Adecoagro S.A.
Notes to the Consolidated Financial Statements (Continued)
(All amounts in US$ thousands, except shares and per share data and as otherwise indicated)
|
18.
|
Trade and other receivables, net (continued)
|
New customers with less than six months of history with the Group are closely monitored. The Group has not experienced credit problems with these new customers to date. The majority of the customers for which an external credit rating is not available are existing customers with more than six months of history with the Group and with no defaults in the past. A minor percentage of customers may have experienced some non-significant defaults in the past but fully recovered.
|
19.
|
Inventories
|
|
|
2018
|
2017
|
|||
|
Raw materials
|
48,140
|
|
46,836
|
|
|
|
Finished goods (Note 5) (1)
|
79,758
|
|
61,888
|
|
|
|
Others
|
204
|
|
195
|
|
|
|
|
128,102
|
|
108,919
|
|
|
(1) Finished goods of Crops reportable segment are valued at fair value.
|
20.
|
Cash and cash equivalents
|
|
|
2018
|
2017
|
|||
|
Cash at bank and on hand
|
197,544
|
|
118,358
|
|
|
|
Short-term bank deposits
|
76,091
|
|
150,837
|
|
|
|
|
273,635
|
|
269,195
|
|
|
|
21.
|
Disposals
|
Year Ended December 31, 2018
In May 2018, the Group completed the sale of Q45 Negócios Imobiliários Ltda., a wholly owned subsidiary, which main underlying asset is the Rio De Janeiro Farm, for a selling price of US$
34 million
(Reais
120 million
), which was fully collected as of the date of these financial statements. This transaction resulted in a gain of US$
22 million
included in “Other operating income, net” under the line item “Gain from the sale of farmland and other assets”.
In June 2018, the Group completed the sale of Q43 Negócios Imobiliários Ltda., a wholly owned subsidiary , which main underlying asset is the Conquista Farm, for a selling price of US$
18.4 million
(Reais
68 million
), of which US$
2.0 million
(Reais
7.5 million
) has already been collected and the balance will be collected in four annual installments starting in June 2019. This transaction resulted in a gain of US$
14 million
, included in “Other operating income, net” under the line item “Gain from the sale of farmland and other assets”
The accompanying notes are an integral part of these consolidated financial statements.
F-
56
Adecoagro S.A.
Notes to the Consolidated Financial Statements (Continued)
(All amounts in US$ thousands, except shares and per share data and as otherwise indicated)
22. Shareholders' contributions
The share capital of the Group is represented by common shares with a nominal value of US$
1.5
per share and
one
vote each.
|
|
Number of shares
|
Share capital and
share premium
|
|||
|
At January 1, 2016
|
122,382
|
|
1,121,247
|
|
|
|
Employee share options exercised (Note 23) (1)
|
—
|
|
438
|
|
|
|
Restricted shares and units vested (Note 23)
|
—
|
|
3,225
|
|
|
|
Purchase of own shares
|
—
|
|
(4,087
|
)
|
|
|
At December 31,2016
|
122,382
|
|
1,120,823
|
|
|
|
Employee share options exercised (Note 23) (1)
|
—
|
|
50
|
|
|
|
Restricted shares and units vested (Note 23)
|
—
|
|
4,149
|
|
|
|
Purchase of own shares
|
—
|
|
(32,515
|
)
|
|
|
At December 31,2017
|
122,382
|
|
1,092,507
|
|
|
|
Restricted shares units vested (Note 23)
|
—
|
|
4,775
|
|
|
|
Purchase of own shares
|
—
|
|
(13,206
|
)
|
|
|
At December 31,2018
|
122,382
|
|
1,084,076
|
|
|
|
(1)
|
Treasury shares were used to settle these options and units.
|
Share Repurchase Program
On September 24, 2013, the Board of Directors of the Company has authorized a share repurchase program for up to
5%
of its outstanding shares. The repurchase program has commenced on September 24, 2013 and is reviewed by the Board of Directors after each 12-month period. On August 14, 2018, the Board of Directors approved the extension of the program for an additional twelve-month period, ending September 23, 2019.
Repurchases of shares under the program are made from time to time in open market transactions in compliance with the trading conditions of Rule 10b-18 under the U.S. Securities Exchange Act of 1934, as amended, and applicable rules and regulations. The share repurchase program does not require Adecoagro to acquire any specific number or amount of shares and may be modified, suspended, reinstated or terminated at any time in the Company’s discretion and without prior notice.
As of
December 31, 2018
, the Company repurchased
8,421,549
shares under this program, of which
2,598,423
have been applied to some exercise of the Company’s stock option plan and restricted stock units plan. In 2018, 2017 and 2016 the Company repurchased shares for an amount of US$
15,725
; US$
38,367
and US$
4,772
, respectively. The outstanding treasury shares as of December 31, 2018 totaled
5,826,116
.
The accompanying notes are an integral part of these consolidated financial statements.
F-
57
Adecoagro S.A.
Notes to the Consolidated Financial Statements (Continued)
(All amounts in US$ thousands, except shares and per share data and as otherwise indicated)
|
23.
|
Equity-settled share-based payments
|
The Group has set a “2004 Incentive Option Plan” and a “2007/2008 Equity Incentive Plan” (collectively referred to as “Option Schemes”) under which the Group granted equity-settled options to senior managers and selected employees of the Group's subsidiaries. Additionally, in 2010 the Group has set a “Adecoagro Restricted Share and Restricted Stock Unit Plan” (referred to as “Restricted Share Plan”) under which the Group grants restricted stock units to senior and medium management and key employees of the Group’s subsidiaries.
|
(a)
|
Option Schemes
|
The fair value of the options under the Option Schemes was measured at the date of grant using the Black-Scholes valuation technique.
As of the date of these financial statements all options has already been vested and expensed.
The Adecoagro/ IFH 2004 Stock Incentive Option Plan
was effectively established in 2004 and is administered by the Compensation Committee of the Company. Options are exercisable over a
ten
-year period. In May 2014 this period was extended for another
ten
year-period.
Movements in the number of equity-settled options outstanding and their related weighted average exercise prices under the Adecoagro/ IFH 2004 Stock Incentive Option Plan are as follows:
|
2018
|
2017
|
2016
|
|||||||||||||||
|
|
Average
exercise
price per
share
|
Options
(thousands)
|
Average
exercise
price per
Share
|
Options
(thousands)
|
Average
exercise
price per
Share
|
Options
(thousands)
|
|||||||||||
|
At January 1
|
6.66
|
|
1,634
|
|
6.66
|
|
1,641
|
|
6.67
|
|
1,696
|
|
|||||
|
Exercised
|
—
|
|
—
|
|
5.83
|
|
(7
|
)
|
6.96
|
|
(55
|
)
|
|||||
|
At December 31
|
6.66
|
|
1,634
|
|
6.66
|
|
1,634
|
|
6.66
|
|
1,641
|
|
|||||
Options outstanding at year end under this Plan have the following expiry date and exercise prices:
|
|
Exercise
price per share
|
Shares (in thousands)
|
|||||||||
|
Expiry date (i):
|
2018
|
2017
|
2016
|
||||||||
|
May 1, 2024
|
5.83
|
|
496
|
|
496
|
|
495
|
|
|||
|
May 1, 2025
|
5.83
|
|
452
|
|
452
|
|
452
|
|
|||
|
January 1, 2026
|
5.83
|
|
142
|
|
142
|
|
150
|
|
|||
|
February 16, 2026
|
7.11
|
|
103
|
|
103
|
|
103
|
|
|||
|
October 1, 2026
|
8.62
|
|
441
|
|
441
|
|
441
|
|
|||
(i) On May 2014, the Board of directors decided to extend the expired date of the Plan.
The Adecoagro/ IFH 2007/ 2008 Equity Incentive Plan
was effectively established in late 2007 and is administered by the Compensation Committee of the Company. Options are exercisable over a
ten
-year period.
Movements in the number of equity-settled options outstanding and their related weighted average exercise prices under the Adecoagro/ IFH 2007/2008 Equity Incentive Plan are as follows:
The accompanying notes are an integral part of these consolidated financial statements.
F-
58
Adecoagro S.A.
Notes to the Consolidated Financial Statements (Continued)
(All amounts in US$ thousands, except shares and per share data and as otherwise indicated)
|
23.
|
Equity-settled unit-based payments (continued)
|
|
|
2018
|
2017
|
2016
|
||||||||||||||
|
|
Average
exercise
price per
share
|
Options
(thousands)
|
Average
exercise
price per
share
|
Options
(thousands)
|
Average
exercise
price per
share
|
Options
(thousands)
|
|||||||||||
|
At January 1
|
13.31
|
|
851
|
|
13.07
|
|
1,658
|
|
13.07
|
|
1,701
|
|
|||||
|
Forfeited
|
13.27
|
|
(11
|
)
|
13.40
|
|
(4
|
)
|
12.98
|
|
(43
|
)
|
|||||
|
Expired
|
12.82
|
|
(103
|
)
|
12.82
|
|
(803
|
)
|
—
|
|
—
|
|
|||||
|
At December 31
|
13.37
|
|
737
|
|
13.31
|
|
851
|
|
13.07
|
|
1,658
|
|
|||||
Options outstanding at year-end under the Adecoagro/ IFH 2007/2008 Equity Incentive Plan have the following expiry date and exercise prices:
|
|
Exercise price per share
|
Shares (in thousands)
|
|||||||||
|
Expiry date:
|
2018
|
2017
|
2016
|
||||||||
|
From Nov 13, 2017 to Aug 25, 2018
|
12.82
|
|
—
|
|
105
|
|
908
|
|
|||
|
January 30, 2019
|
13.40
|
|
595
|
|
595
|
|
595
|
|
|||
|
June 1, 2019
|
12.82
|
|
3
|
|
3
|
|
3
|
|
|||
|
November 1, 2019
|
13.40
|
|
11
|
|
11
|
|
11
|
|
|||
|
From Jan 30, 2020 to Sep 1, 2020
|
13.40
|
|
97
|
|
106
|
|
110
|
|
|||
|
From Jan 30, 2020 to Sep 1, 2020
|
12.82
|
|
31
|
|
31
|
|
31
|
|
|||
The following table shows the exercisable shares at year end under both the Adecoagro/ IFH 2004 Incentive Option Plan and the Adecoagro/ IFH 2007/ 2008 Equity Incentive Plan:
|
|
Exercisable shares
in thousands
|
|
|
2018
|
2,371
|
|
|
2017
|
2,485
|
|
|
2016
|
3,299
|
|
|
(b)
|
Restricted Stock Unit Plan
|
The Restricted Stock Unit Plan was effectively established in 2010 and amended in November 2011. It is administered by the Compensation Committee of the Company. Restricted shares or units under these Plan vest over a
3
-year period from the date of grant at
33%
on each anniversary of the grant date. Participants are entitled to receive one common share of the Company for each restricted share or restricted unit granted. There are no performance requirements for the delivery of common shares, except that a participant’s employment with the Group must not have been terminated prior to the relevant vesting date. If the participant ceases to be an employee for any reason, any unvested restricted unit shall not be converted into common shares. The maximum number of ordinary shares with respect to which awards may be made under the Plan is
3,982,658
, of which 3,896,809 have already been granted and 976,234 will be vested on future periods. The maximum numbers of ordinary shares is revised annually.
At
December 31, 2018
, the Group recognized compensation expense US$
4.9 million
related to the restricted stock units granted under the Restricted Share Plan (
2017
: US$
5.6 million
and 2016: US$
4.8 million
).
The restricted shares under the Restricted Share Plan were measured at fair value at the date of grant.
The accompanying notes are an integral part of these consolidated financial statements.
F-
59
Adecoagro S.A.
Notes to the Consolidated Financial Statements (Continued)
(All amounts in US$ thousands, except shares and per share data and as otherwise indicated)
|
23.
|
Equity-settled unit-based payments (continued)
|
Key grant-date fair value and other assumptions under the Restricted Share Plan are detailed below:
|
Grant Date
|
Apr 1,
2016
|
May 15,
2016
|
Apr 1,
2017
|
May 15,
2017
|
Apr 1,
2018
|
May 15,
2018
|
|||||||||||
|
Fair value
|
12.63
|
|
12.52
|
|
11.88
|
|
12.14
|
|
8.43
|
|
9.10
|
|
|||||
|
Possibility of ceasing employment before vesting
|
—
|
%
|
—
|
%
|
—
|
%
|
—
|
%
|
—
|
%
|
—
|
%
|
|||||
Movements in the number of restricted shares outstanding under the Restricted Share Plan are as follows:
|
|
Restricted
stock units
(thousands)
|
Restricted
stock units
(thousands)
|
Restricted
stock units
(thousands)
|
|||||
|
|
2018
|
2017
|
2016
|
|||||
|
At January 1
|
969
|
|
1,000
|
|
1,018
|
|
||
|
Granted (1)
|
530
|
|
488
|
|
464
|
|
||
|
Forfeited
|
(25
|
)
|
(29
|
)
|
(29
|
)
|
||
|
Vested
|
(498
|
)
|
(490
|
)
|
(453
|
)
|
||
|
At December 31
|
976
|
|
969
|
|
1,000
|
|
||
(1) Approved by the Board of Directors of March 13, 2018 and the Shareholders Meeting of April 18, 2018.
|
24.
|
Legal and other reserves
|
According to the laws of certain of the countries in which the Group operates, a portion of the profit of the year (
5%
) is separated to constitute legal reserves until they reach legal capped amounts. These legal reserves are not available for dividend distribution and can only be released to absorb losses. The legal limit of these reserves has not been met.
Legal and other reserves amount to US$
3,664
as of
December 31, 2018
(
2017
: US$
4,139
) and are included within the balance of retained earnings in the statement of changes in shareholders’ equity.
The Company may make distributions in the form of dividends or otherwise to the extent that it has distributable retained earnings or available distributable reserves (including share premium) that result from the Stand Alone Financial Statements prepared in accordance with Luxembourg GAAP.
No
distributable retained earning result from the Stand Alone Financial Statements of the Company as of
December 31, 2018
, but the Company has distributable reserves in excess of US$
918,131
.
In the other reserves line, it is included the benefit that the Company has regarding ICMS conceded by the government of the Estate of Mato Grosso do Sul. In accordance with the Complementary Law 160/17, grants related to ICMS, conceded by any Estate of Brazil, were considered as Investments Grants. This investment grants will not be computed to calculate income tax, since they were accounted as an Equity Reserve. This reserve cannot be distribute, unless income tax is paid on the reserve.
The accompanying notes are an integral part of these consolidated financial statements.
F-
60
Adecoagro S.A.
Notes to the Consolidated Financial Statements (Continued)
(All amounts in US$ thousands, except shares and per share data and as otherwise indicated)
|
25.
|
Trade and other payables
|
|
|
2018
|
2017
|
|||
|
Non-current
|
|
|
|
|
|
|
Payable from acquisition of property, plant and equipment (i)
|
—
|
|
521
|
|
|
|
Other payables
|
211
|
|
306
|
|
|
|
|
211
|
|
827
|
|
|
|
Current
|
|
|
|
|
|
|
Trade payables
|
94,483
|
|
82,824
|
|
|
|
Advances from customers
|
3,813
|
|
6,722
|
|
|
|
Amounts due to related parties (Note 31)
|
354
|
|
628
|
|
|
|
Taxes payable
|
6,457
|
|
6,462
|
|
|
|
Other payables
|
1,119
|
|
1,787
|
|
|
|
|
106,226
|
|
98,423
|
|
|
|
Total trade and other payables
|
106,437
|
|
99,250
|
|
|
|
(i)
|
These trades payable are mainly collateralized by property, plant and equipment of the Group.
|
The fair values of current trade and other payables approximate their respective carrying amounts due to their short-term nature. The fair values of non-current trade and other payables approximate their carrying amounts, as the impact of discounting is not significant.
The accompanying notes are an integral part of these consolidated financial statements.
F-
61
Adecoagro S.A.
Notes to the Consolidated Financial Statements (Continued)
(All amounts in US$ thousands, except shares and per share data and as otherwise indicated)
|
26.
|
Borrowings
|
|
|
2018
|
2017
|
|||
|
Non-current
|
|
|
|
|
|
|
Senior Notes
|
496,118
|
|
495,707
|
|
|
|
Bank borrowings
|
221,971
|
|
167,315
|
|
|
|
Obligations under finance leases
|
395
|
|
38
|
|
|
|
|
718,484
|
|
663,060
|
|
|
|
Current
|
|
|
|
|
|
|
Senior Notes
|
8,250
|
|
8,250
|
|
|
|
Bank overdrafts
|
2,320
|
|
6,214
|
|
|
|
Bank borrowings
|
132,862
|
|
140,367
|
|
|
|
Obligations under finance leases
|
200
|
|
67
|
|
|
|
|
143,632
|
|
154,898
|
|
|
|
Total borrowings
|
862,116
|
|
817,958
|
|
|
As of
December 31, 2018
, total bank borrowings include collateralized liabilities of US$
87,738
(
2017
: US$
136,322
). These loans are mainly collateralized by property, plant and equipment, sugarcane plantations, sugar export contracts and shares of certain subsidiaries of the Group.
Notes 2027
On September 21, 2017, the Company issued senior notes (the “Notes”) for US$
500 million
, at an annual nominal rate of
6%
. The Notes will mature on September 21, 2027. Interest on the Notes are payable semi-annually in arrears on March 21 and September 21 of each year. The total proceeds nets of expenses was US$
495.7 million
.
The Notes are fully and unconditionally guaranteed on a senior unsecured basis by certain of our current and future subsidiaries. As of the Issue Date, Adeco Agropecuaria S.A., Adecoagro Brasil Participações S.A., Adecoagro Vale do Ivinhema S.A., Pilagá S.A. and Usina Monte Alegre Ltda. are the only Subsidiary Guarantors.
The Notes contain customary financial covenants and restrictions which require us to meet pre-defined financial ratios, among other restrictions. During
2018
and
2017
the Group was in compliance with these financial covenants.
The accompanying notes are an integral part of these consolidated financial statements.
F-
62
Adecoagro S.A.
Notes to the Consolidated Financial Statements (Continued)
(All amounts in US$ thousands, except shares and per share data and as otherwise indicated)
|
26.
|
Borrowings (continued)
|
The maturity of the Group's borrowings (excluding obligations under finance leases) and the Group's exposure to fixed and variable interest rates is as follows:
|
|
2018
|
|
2017
|
||
|
Fixed rate:
|
|
|
|
|
|
|
Less than 1 year
|
105,708
|
|
132,998
|
|
|
|
Between 1 and 2 years
|
16,287
|
|
35,762
|
|
|
|
Between 2 and 3 years
|
25,704
|
|
20,097
|
|
|
|
Between 3 and 4 years
|
43,507
|
|
20,130
|
|
|
|
Between 4 and 5 years
|
26,415
|
|
16,310
|
|
|
|
More than 5 years
|
505,456
|
|
495,754
|
|
|
|
|
723,077
|
|
721,051
|
|
|
|
Variable rate:
|
|
|
|
|
|
|
Less than 1 year
|
37,724
|
|
21,833
|
|
|
|
Between 1 and 2 years
|
17,278
|
|
22,871
|
|
|
|
Between 2 and 3 years
|
29,861
|
|
17,945
|
|
|
|
Between 3 and 4 years
|
22,886
|
|
18,215
|
|
|
|
Between 4 and 5 years
|
18,251
|
|
11,164
|
|
|
|
More than 5 years
|
12,444
|
|
4,774
|
|
|
|
|
138,444
|
|
96,802
|
|
|
|
|
861,521
|
|
817,853
|
|
|
Borrowings incurred by the Group’s subsidiaries in Brazil are repayable at various dates between January 2019 and September 2024 and bear either fixed interest rates ranging from
2.5%
to
7.95%
per annum or variable rates based on LIBOR or other specific base-rates plus spreads ranging from
6.89%
to
12.03%
per annum. At
December 31, 2018
LIBOR (six months) was
2.88%
(
2017
:
1.84%
).
Borrowings incurred by the Group´s subsidiaries in Argentina are repayable at various dates between January 2019 and June 2024 and bear either fixed interest rates ranging from
4.50%
and
7.00%
per annum for those borrowings denominated in U.S. Dollar, and a fixed interest rate at
62.00%
per annum for those borrowings denominated in Argentine pesos.
The accompanying notes are an integral part of these consolidated financial statements.
F-
63
Adecoagro S.A.
Notes to the Consolidated Financial Statements (Continued)
(All amounts in US$ thousands, except shares and per share data and as otherwise indicated)
|
26.
|
Borrowings (continued)
|
Brazilian Subsidiaries
The main loans of the Group’s Brazilian Subsidiaries are:
|
Bank
|
Grant date
|
Nominal
amount
|
Capital outstanding as of December 31
|
Maturity date
|
Annual interest rate
|
||||||||
|
2018
|
2017
|
||||||||||||
|
(In millions)
|
Millions of
Reais
|
Millions of
equivalent
Dollars
|
Millions of
equivalent
Dollars
|
||||||||||
|
Banco Do Brasil (1)
|
October 2012
|
R$
|
130.0
|
|
R$
|
72.7
|
|
18.8
|
|
27.6
|
|
November 2022
|
2.94% minus 15% of performance bonus
|
|
Itau BBA FINAME Loan (2)
|
December 2012
|
R$
|
45.9
|
|
R$
|
12.1
|
|
3.1
|
|
7.6
|
|
December 2022
|
2.50%
|
|
Banco do Brasil / Itaú BBA Finem Loan (3)
|
September 2013
|
R$
|
273.0
|
|
R$
|
147.1
|
|
38.0
|
|
53.4
|
|
January 2023
|
6.83%
|
|
BNDES Finem Loan (4)
|
November 2013
|
R$
|
215.0
|
|
R$
|
110.8
|
|
28.6
|
|
41.4
|
|
January 2023
|
3.75%
|
|
Tokyo-Mitsubishi (5)
|
August 2016
|
US$
|
30.0
|
|
—
|
|
8.6
|
|
30.0
|
|
August 2019
|
6.35%
|
|
|
ING Bank N.V. (6)
|
October 2018
|
US$
|
75.0
|
|
-
|
|
75.0
|
|
—
|
|
October 2023
|
6.33%
|
|
|
(1)
|
Collateralized by (i) a first degree mortgage of the Carmen (Santa Agua) farm; (ii) a first degree mortgage of the Sapálio farm; and (iii) liens over the Ivinhema mill and equipment.
|
|
(2)
|
Collateralized by (i) a first degree mortgage of the Carmen (Santa Agua) farm; (ii) a first degree mortgage of the Sapálio farm; and (iii) liens over the Ivinhema mill and equipment.
|
|
(3)
|
Collateralized by (i) a first degree mortgage of the Carmen (Santa Agua) farm; (ii) a first degree mortgage of the Sapálio farm; (iii) liens over the Ivinhema mill and equipment; and (iv) long term power purchase agreements (PPA).
|
|
(4)
|
Collateralized by (i) liens over the Ivinhema mill and equipment; and (ii) power sales contracts.
|
|
(5)
|
Collateralized by sales contracts.
|
|
(6)
|
Collateralized by sales contracts.
|
The above mentioned loans contain certain customary financial covenants and restrictions which require us to meet pre-defined financial ratios, among other restrictions, as well as restrictions on the payment of dividends. These financial ratios are measured considering the statutory financial statements of the Brazilian Subsidiaries.
During
2018
and
2017
the Group was in compliance with all financial covenants.
Argentinian Subsidiaries
The main loans of the Group’s Argentinian Subsidiaries are:
|
Bank
|
Grant date
|
Nominal
amount
|
Capital outstanding as of
December 31
|
Maturity date
|
Annual interest rate
|
|
|
2018
|
2017
|
|||||
|
(In millions)
|
(In millions)
|
(In millions)
|
||||
|
IFC Tranche A (1)
|
Dec-16
|
US$25.00
|
US$22.70
|
US$24.67
|
Sep-21
|
4.3% per annum
|
|
IFC Tranche B (1)
|
Dec-16
|
US$25.00
|
US$21.40
|
US$24.93
|
Sep-23
|
4% plus LIBOR
|
|
Rabobank (2)
|
Jun-18
|
US$50.00
|
US$50.00
|
—
|
Jun-24
|
3% plus LIBOR
|
(1) Collateralized by a US$
113 million
mortgage over Carmen farm, which is property of Adeco Agropecuaria S.A.
(2) Collateralized by the pledged of the shares of Dinaluca S.A., Compañía Agroforestal S.M.S.A. y Bañado del Salado S.A.
The above mentioned loans contain certain customary financial covenants and restrictions which require us to meet pre-defined financial ratios, among other restrictions, as well as restrictions on the payment of dividends. These financial ratios are measured considering the statutory financial statements of the Argentinian Subsidiaries.
The accompanying notes are an integral part of these consolidated financial statements.
F-
64
Adecoagro S.A.
Notes to the Consolidated Financial Statements (Continued)
(All amounts in US$ thousands, except shares and per share data and as otherwise indicated)
|
26.
|
Borrowings (continued)
|
During
2018
and
2017
the Group was in compliance with all financial covenants.
The carrying amount of short-term borrowings is approximate its fair value due to the short-term maturity. Long term borrowings subject to variable rate approximate their fair value.The fair value of long-term subject to fix rate do not significant differ from their fair value. The fair value (level 2) of the notes equals US$
460 million
and US$
497 million
,
91.91%
and
99.49%
of the nominal amount.
The breakdown of the Group´s borrowing by currency is included in Note 2 - Interest rate risk.
Evolution of the Group's borrowings as December 31, 2018 and 2017 is as follow:
|
|
2018
|
2017
|
|||
|
Amount at the beginning of the year
|
817,958
|
|
635,396
|
|
|
|
Issuance of senior notes
|
—
|
|
495,678
|
|
|
|
Proceeds from long term borrowings
|
45,536
|
|
232,433
|
|
|
|
Payments of long term borrowings
|
(124,349
|
)
|
(602,700
|
)
|
|
|
Proceeds from short term borrowings
|
318,108
|
|
106,730
|
|
|
|
Payments of short term borrowings
|
(190,630
|
)
|
(64,787
|
)
|
|
|
Payments of interest (1).
|
(47,401
|
)
|
(39,118
|
)
|
|
|
Accrued interest
|
61,186
|
|
51,005
|
|
|
|
Exchange differences, inflation and translation, net
|
(19,506
|
)
|
(4,588
|
)
|
|
|
Others
|
1,214
|
|
7,909
|
|
|
|
Amount at the end of the year
|
862,116
|
|
817,958
|
|
|
(1): Excludes payment of interest related to trade and other payables.
The accompanying notes are an integral part of these consolidated financial statements.
F-
65
Adecoagro S.A.
Notes to the Consolidated Financial Statements (Continued)
(All amounts in US$ thousands, except shares and per share data and as otherwise indicated)
27. Payroll and social security liabilities
|
|
2018
|
2017
|
|||
|
Non-current
|
|
|
|
|
|
|
Social security payable
|
1,219
|
|
1,240
|
|
|
|
|
1,219
|
|
1,240
|
|
|
|
Current
|
|
|
|
|
|
|
Salaries payable
|
8,841
|
|
6,199
|
|
|
|
Social security payable
|
3,112
|
|
3,702
|
|
|
|
Provision for vacations
|
9,770
|
|
12,323
|
|
|
|
Provision for bonuses
|
4,255
|
|
5,043
|
|
|
|
|
25,978
|
|
27,267
|
|
|
|
Total payroll and social security liabilities
|
27,197
|
|
28,507
|
|
|
|
28.
|
Provisions for other liabilities
|
The Group is subject to several laws, regulations and business practices of the countries where it operates. In the ordinary course of business, the Group is subject to certain contingent liabilities with respect to existing or potential claims, lawsuits and other proceedings, including those involving tax, labor and social security, administrative and civil and other matters. The Group accrues liabilities when it is probable that future costs will be incurred and it can reasonably estimate them. The Group bases its accruals on up-to-date developments, estimates of the outcomes of the matters and legal counsel experience in contesting, litigating and settling matters. As the scope of the liabilities becomes better defined or more information is available, the Group may be required to change its estimates of future costs, which could have a material effect on its results of operations and financial condition or liquidity.
The table below shows the movements in the Group's provisions for other liabilities categorized by type of provision:
|
|
Labor, legal and
other claims
|
Others
|
Total
|
|||||
|
At January 1, 2017
|
3,857
|
|
32
|
|
3,889
|
|
||
|
Additions
|
4,750
|
|
—
|
|
4,750
|
|
||
|
Used during year
|
(3,754
|
)
|
(25
|
)
|
(3,779
|
)
|
||
|
Exchange differences
|
(15
|
)
|
(2
|
)
|
(17
|
)
|
||
|
At December 31, 2017
|
4,838
|
|
5
|
|
4,843
|
|
||
|
Additions
|
1,147
|
|
—
|
|
1,147
|
|
||
|
Used during year
|
(1,379
|
)
|
—
|
|
(1,379
|
)
|
||
|
Exchange differences
|
(986
|
)
|
—
|
|
(986
|
)
|
||
|
At December 31, 2018
|
3,620
|
|
5
|
|
3,625
|
|
||
Analysis of total provisions:
|
|
2018
|
2017
|
|||
|
Non current
|
3,296
|
|
4,078
|
|
|
|
Current
|
329
|
|
765
|
|
|
|
|
3,625
|
|
4,843
|
|
|
The Group is engaged in several legal proceedings, including tax, labor, civil, administrative and other proceedings in Brazil, which qualified as contingent liabilities for an aggregate claimed nominal amount of US$
23.1 million
and US$
21.0 million
as of
December 31, 2018
and
2017
, respectively.
The accompanying notes are an integral part of these consolidated financial statements.
F-
66
Adecoagro S.A.
Notes to the Consolidated Financial Statements (Continued)
(All amounts in US$ thousands, except shares and per share data and as otherwise indicated)
|
29.
|
Disclosure of leases and similar arrangements
|
The Group as lessee
Operating leases:
The Group leases land for crop cultivation in Argentina. The leases have an average term of a crop year and are renewable at the option of the lessee for additional periods. Under the lease agreements, rent accrues generally at the time of harvest. Rent is payable at several times during the crop year. Lease expense was US$
11.9 million
for the year ended
December 31, 2018
(
2017
: US$
14.0 million
;
2016
: US$
6.8 million
). Lease expense is capitalized as part of biological assets.
The Group also leases various offices and machinery under cancellable operating lease agreements which involve no significant amount.
The future aggregate minimum lease payments under cancellable operating leases are as follows:
|
|
2018
|
2017
|
|||
|
No later than 1 year
|
9,082
|
|
7,841
|
|
|
|
Later than 1 year and no later than 5 years
|
426
|
|
1,234
|
|
|
|
|
9,508
|
|
9,075
|
|
|
Agriculture “partnerships”
(
parceria
by its exact term in Portuguese)
:
The Group enters into contracts with landowners to cultivate sugarcane on their land. These contracts have an average term of
6
years.
Under these contracts, the Group makes payments based on the market value of sugarcane per hectare (in tons) used by the Group in each harvest, with the market value based on the price of sugarcane published by CONSECANA and a fixed amount of total recoverable sugar per ton. Lease expense was US$
34.6 million
for the year ended
December 31, 2018
(
2017
: US$
41.10 million
;
2016
: US$
38.5 million
). Lease expense is included in “Initial recognition and changes in fair value of biological assets and agricultural produce” in the statement of income.
Finance leases:
Most of the leased assets carried in the consolidated statement of financial position as part of a finance lease relate to long-term rental and lease agreements for vehicles, machinery and equipment. Obligations under finance leasing totals US$
595
and US$
105
as of
December 31, 2018
and
2017
, respectively.
The Group as lessor
Operating leases:
The Group acts as a lessor in connection with an operating lease related to leased farmland, classified as investment property. The lease payments received are recognized in profit or loss. The lease has a term of
ten
years.
The following amounts have been recognized in the statement of income in the line “Sales goods and services rendered”:
|
|
2018
|
2017
|
2016
|
|||||
|
Rental income
|
643
|
|
771
|
|
984
|
|
||
The future minimum rental payments receivable under cancellable leases are as follows:
The accompanying notes are an integral part of these consolidated financial statements.
F-
67
Adecoagro S.A.
Notes to the Consolidated Financial Statements (Continued)
(All amounts in US$ thousands, except shares and per share data and as otherwise indicated)
|
29.
|
Disclosure of leases and similar arrangements (continued)
|
|
|
2018
|
2017
|
|||
|
No later than 1 year
|
32
|
|
504
|
|
|
|
Later than 1 year and no later than 5 years
|
306
|
|
1,014
|
|
|
|
|
338
|
|
1,518
|
|
|
On September 2013, Marfrig Argentina S.A. (“Marfrig Argentina”), the Argentine subsidiary of the Brazilian company Marfrig Alimentos S.A. (“Marfrig Alimentos"), unilaterally early terminated the lease agreements for grazing land entered into with the Group on December 2009. The termination of the lease agreements was effective in the fourth quarter of 2013, and on April 2014, the Group filed an arbitration proceeding against Marfrig Argentina and Marfrig Alimentos claiming unpaid invoices for US$
0.5 million
and indemnification for early termination. On September 2016, the Parties settled the arbitration proceedings in the amount of US$
9 million
. As of December 31, 2016 the Group collected US$
7 million
and as of that date of this financial statements the Group collected the full amount.
This settlement, net of the unpaid invoices and other expenses resulted in an income of US$
8.5 million
reflected in the line item "Other operating income, net" as of December 31, 2016.
Finance leases:
The Group does not act as a lessor in connection with finance leases.
The accompanying notes are an integral part of these consolidated financial statements.
F-
68
Adecoagro S.A.
Notes to the Consolidated Financial Statements (Continued)
(All amounts in US$ thousands, except shares and per share data and as otherwise indicated)
30. Group companies
The following table details the subsidiaries that comprised the Group as of
December 31, 2018
and
2017
:
|
|
|
|
2018
|
2017
|
|||||
|
|
Activities
|
Country of
incorporation
and operation
|
Ownership
percentage
held if not
100 %
|
Ownership
percentage
held if not
100 %
|
|||||
|
Details of principal subsidiary undertakings:
|
|
|
|
|
|
|
|||
|
Operating companies (unless otherwise stated):
|
|
|
|
|
|
|
|||
|
Adeco Agropecuaria S.A.
|
(a)
|
Argentina
|
—
|
|
—
|
|
|||
|
Pilagá S.A.
|
(a)
|
Argentina
|
99.94
|
%
|
99.94
|
%
|
|||
|
Cavok S.A.
|
(a)
|
Argentina
|
51
|
%
|
51
|
%
|
|||
|
Establecimientos El Orden S.A.
|
(a)
|
Argentina
|
51
|
%
|
51
|
%
|
|||
|
Bañado del Salado S.A.
|
(a)
|
Argentina
|
—
|
|
—
|
|
|||
|
Agro Invest S.A.
|
(a)
|
Argentina
|
51
|
%
|
51
|
%
|
|||
|
Forsalta S.A.
|
(a)
|
Argentina
|
51
|
%
|
51
|
%
|
|||
|
Dinaluca S.A.
|
(a)
|
Argentina
|
—
|
|
—
|
|
|||
|
Simoneta S.A.
|
(a)
|
Argentina
|
—
|
|
—
|
|
|||
|
Compañía Agroforestal S.M.S.A.
|
(a)
|
Argentina
|
—
|
|
—
|
|
|||
|
Energía Agro S.A.U.
|
(a)
|
Argentina
|
—
|
|
—
|
|
|||
|
L3N S.A.
|
(e)
|
Argentina
|
—
|
|
—
|
|
|||
|
Adeco Agropecuaria Brasil Ltda.
|
(b)
|
Brazil
|
—
|
|
—
|
|
|||
|
Adecoagro Vale do Ivinhema Ltda. ("AVI")
|
(b)
|
Brazil
|
—
|
|
—
|
|
|||
|
Adecoagro Commodities Ltda.
|
(b)
|
Brazil
|
—
|
|
—
|
|
|||
|
Usina Monte Alegre Ltda. ("UMA")
|
(b)
|
Brazil
|
—
|
|
—
|
|
|||
|
Adecoagro Energia Ltda.
|
(b)
|
Brazil
|
—
|
|
—
|
|
|||
|
Kelizer S.A.
|
(a)
|
Uruguay
|
—
|
|
—
|
|
|||
|
Agroglobal S.A. (f.k.a. Adecoagro Uruguay S.A.)
|
(a)
|
Uruguay
|
—
|
|
—
|
|
|||
|
Holdings companies:
|
|
|
|
|
|
||||
|
Adeco Brasil Participações S.A.
|
—
|
Brazil
|
—
|
|
—
|
|
|||
|
Adecoagro LP S.C.S.
|
(d)
|
Luxembourg
|
—
|
|
—
|
|
|||
|
Adecoagro GP S.a.r.l.
|
—
|
Luxembourg
|
—
|
|
—
|
|
|||
|
Ladelux S.C.A.
|
—
|
Uruguay
|
—
|
|
—
|
|
|||
|
Spain Holding Companies
|
(c)
|
Spain
|
—
|
|
—
|
|
|||
(a) Mainly crops, rice, cattle and others.
(b) Mainly sugarcane, ethanol and energy.
(c) Comprised by (1) wholly owned subsidiaries: Kadesh Hispania S.L.U.; Leterton España S.L.U.; Global Asterion S.L.U.; Global Acasto S.L.U.; Global Laertes S.L.U.; Global Seward S.L.U.; Global Pindaro S.L.U.; Global Pileo S.L.U.; Peak Texas S.L.U.; Peak City S.L.U.; Global Neimoidia S.L.U. and 51% controlled subsidiaries (see note 21): Global Acamante S.L.U.; Global Carelio S.L.U.; Global Calidon S.L.U.; Global Mirabilis S.L.U. Global Anceo S.L.U.Global Hisingen S.L.U.
(d) The continuer from the merger between Adecoagro LP and International Farmland Holdings LP.
(e) Mainly dairy
The accompanying notes are an integral part of these consolidated financial statements.
F-
69
Adecoagro S.A.
Notes to the Consolidated Financial Statements (Continued)
(All amounts in US$ thousands, except shares and per share data and as otherwise indicated)
30. Group companies (continued)
The percentage voting right for each principal subsidiary is the same as the percentage of capital stock held. Issued share capital represents only ordinary shares/ quotas, units or their equivalent. There are
no
preference shares or units issued in any subsidiary undertaking.
According to the laws of certain of the countries in which the Group operates,
5%
of the profit of the year is separated to constitute legal reserves until they reach legal capped amounts (
20%
of total capital). These legal reserves are not available for dividend distribution and can only be released to absorb losses. The Group’s joint ventures have not reached the legal capped amounts.
|
31.
|
Related-party transactions
|
The following is a summary of the balances and transactions with related parties:
|
Related party
|
Relationship
|
Description of transaction
|
Income (loss) included in the
statement of income
|
Balance receivable
(payable)/(equity)
|
|||||||||||||||
|
2018
|
2017
|
2016
|
2018
|
2017
|
|||||||||||||||
|
Mario Jorge de Lemos Vieira / Cia Agropecuaria Monte Alegre / Alfenas Agricola Ltda / Marcelo Weyland Barbosa Vieira / Paulo Albert Weyland Vieira
|
(i)
|
Cost of manufactured products sold and services rendered (ii)
|
(2,279
|
)
|
(3,326
|
)
|
(42
|
)
|
—
|
|
—
|
|
|||||||
|
|
Receivables from related parties (Note 18)
|
—
|
|
—
|
|
—
|
|
324
|
|
176
|
|
||||||||
|
|
Payables (Note 25)
|
—
|
|
—
|
|
—
|
|
(160
|
)
|
(367
|
)
|
||||||||
|
Directors and senior management
|
Employment
|
Compensation selected employees
|
(7,122
|
)
|
(7,040
|
)
|
(5,213
|
)
|
(16,353
|
)
|
(17,985
|
)
|
|||||||
|
CHS Agro
|
Joint venture
|
Receivables from related parties (Note 18) (iii)
|
—
|
|
—
|
|
—
|
|
8,337
|
|
10,218
|
|
|||||||
|
|
Payables (Note 25)
|
—
|
|
—
|
|
—
|
|
(194
|
)
|
(261
|
)
|
||||||||
|
|
Sales of goods
|
456
|
|
2,487
|
|
372
|
|
—
|
|
—
|
|
||||||||
|
|
Services
|
210
|
|
88
|
|
87
|
|
—
|
|
—
|
|
||||||||
|
|
Interest income
|
242
|
|
308
|
|
326
|
|
—
|
|
—
|
|
||||||||
|
(i)
|
Shareholders of the Company.
|
|
(ii)
|
Relates to agriculture partnership agreements (“parceria”).
|
|
(iii)
|
It includes US$
8 million
of a loan that accruing a
3%
interest rate per year with the final maturity in 2022.
|
The accompanying notes are an integral part of these consolidated financial statements.
F-
70
Adecoagro S.A.
Notes to the Consolidated Financial Statements (Continued)
(All amounts in US$ thousands, except shares and per share data and as otherwise indicated)
|
32.
|
Critical accounting estimates and judgments
|
Critical accounting policies are those that are most important to the portrayal of the Group’s financial condition, results of operations and cash flows, and require management to make difficult, subjective or complex judgments and estimates about matters that are inherently uncertain. Management bases its estimates on historical experience and other assumptions that it believes are reasonable. The Group’s critical accounting policies are discussed below.
Actual results could differ from estimates used in employing the critical accounting policies and these could have a material impact on the Group’s results of operations. The Group also has other policies that are considered key accounting policies, such as the policy for revenue recognition. However, these other policies, which are discussed in the notes to the Group’s financial statements, do not meet the definition of critical accounting estimates, because they do not generally require estimates to be made or judgments that are difficult or subjective.
(a)Impairment testing
At the date of each statement of financial position, the Group reviews the carrying amounts of its property, plant and equipment and finite lived intangible assets to determine whether there is any indication that those assets have suffered an impairment loss. If any such indication exists, the recoverable amount of the asset is estimated in order to determine the extent, if any, of the impairment loss. Where the asset does not generate cash flows that are independent from other assets, the Group estimates the recoverable amount of the cash-generating unit to which the asset belongs. The Group’s property, plant and equipment items generally do not generate independent cash flows.
Goodwill is tested for impairment annually or more frequently if events or changes in circumstances indicate that the carrying amount may be impaired. The impairment review requires management to undertake certain judgments, including estimating the recoverable value of the CGU to which the goodwill relates, based on either fair value less costs-to-sell or the value-in-use, as appropriate, in order to reach a conclusion on whether it deems the goodwill is impaired or not.
For purposes of the impairment testing, each CGU represents the smallest identifiable group of assets that generate cash inflows that are largely independent of the cash inflows from other assets or group of assets.
Farmlands may be used for different activities that may generate independent cash flows. When farmlands are used for single activities (i.e. crops), these are considered as one CGU. When farmland businesses are used for more than one segment activity (i.e. crops and cattle or rental income), the farmland is further subdivided into two or more CGUs, as appropriate, for purposes of impairment testing. Generally, each separate farmland within Argentina and Uruguay are treated as single CGUs, while in Brazil, management identified a farmland together with its related mill as separate CGUs.
Based on these criteria, management identified a total amount of
39
CGUs as of September 30, 2018 and
39
CGUs as of September 30, 2017.
As of September 30, 2018 and 2017, there were
no
impairment indicators on the Company’s long lived assets. Therefore, the Group only tested those CGUs with allocated goodwill in Argentina, Brazil and Uruguay.
CGUs tested based on a fair-value-less-costs-to-sell model at September 30, 2018 and 2017:
As of September 30, 2018, the Group identified
11
CGUs in Argentina and Uruguay (2017:
11
CGUs) to be tested based on this model (all CGUs with allocated goodwill). Estimating the fair value less costs-to-sell is based on the best information available, and refers to the amount at which the CGU could be bought or sold in a current transaction between willing parties. In calculating the fair value less costs-to-sell, management may be assisted by the work of external advisors. When using this model, the Group applies the “sales comparison approach” as its method of valuing most properties. This method relies on results of sales of similar agricultural properties to estimate the value of the CGU. This approach is based on the theory that the fair value of a property is directly related to the selling prices of similar properties.
Fair values are determined by extensive analysis which includes current and potential soil productivity of the land (the ability to produce crops and maintain livestock) projected margins derived from soil use, rental value obtained for soil use, if
The accompanying notes are an integral part of these consolidated financial statements.
F-
71
Adecoagro S.A.
Notes to the Consolidated Financial Statements (Continued)
(All amounts in US$ thousands, except shares and per share data and as otherwise indicated)
|
32.
|
Critical accounting estimates and judgments (continued)
|
applicable, and other factors such as climate and location. Farmland ratings are established by considering such factors as soil texture and quality, yields, topography, drainage and rain levels. Farmland may contain farm outbuildings. A farm outbuilding is any improvement or structure that is used for farming operations. Outbuildings are valued based on their size, age and design.
Based on the factors described above, each farm property is assigned different soil classifications for the purposes of establishing a value, Soil classifications quantify the factors that contribute to the agricultural capability of the soil. Soil classifications range from the most productive to the least productive.
The first step to establishing an assessment for a farm property is a sales investigation that identifies the valid farm sales in the area where the farm is located.
A price per hectare is assigned for each soil class within each farm property. This price per hectare is determined based on the quantitative and qualitative analysis mainly described above.
The results are then tested against actual sales, if any, and current market conditions to ensure the values produced are accurate, consistent and fair.
The following table shows only the
11
CGUs (2017:
11
CGUs) where goodwill was allocated at each period end and the corresponding amount of goodwill allocated to each one:
|
CGU / Operating segment / Country
|
September 30,
2018
|
September 30,
2017
|
||||
|
La Carolina / Crops / Argentina
|
112
|
|
35
|
|
||
|
La Carolina / Cattle / Argentina
|
38
|
|
12
|
|
||
|
El Orden/ Crops / Argentina
|
170
|
|
53
|
|
||
|
El Orden/ Cattle / Argentina
|
14
|
|
4
|
|
||
|
La Guarida / Crops / Argentina
|
1,149
|
|
358
|
|
||
|
La Guarida / Cattle / Argentina
|
937
|
|
292
|
|
||
|
Los Guayacanes / Crops / Argentina
|
1,449
|
|
452
|
|
||
|
Doña Marina / Rice / Argentina
|
3,385
|
|
1,595
|
|
||
|
Huelen / Crops / Argentina
|
3,369
|
|
1,787
|
|
||
|
El Colorado / Crops / Argentina
|
1,484
|
|
787
|
|
||
|
El Colorado / Cattle / Argentina
|
216
|
|
115
|
|
||
|
Closing net book value of goodwill allocated to CGUs tested (Note 14)
|
12,323
|
|
5,490
|
|
||
|
Closing net book value of PPE items and other assets allocated to CGUs tested
|
179,545
|
|
34,668
|
|
||
|
Total assets allocated to CGUs tested
|
191,868
|
|
40,158
|
|
||
Based on the testing above, the Group determined that none of the CGUs, with allocated goodwill, were impaired at September 30, 2018 and 2017.
CGUs tested based on a value-in-use model at September 30, 2018 and 2017:
As of September 30, 2018, the Group identified
2
CGUs (2017:
3
CGUs) in Brazil to be tested base on this model (all CGUs with allocated goodwill). In performing the value-in-use calculation, the Group applied pre-tax rates to discount the future pre-tax cash flows. In each case, these key assumptions have been made by management reflecting past experience and are consistent with relevant external sources of information, such as appropriate market data. In calculating value-in-use, management may be assisted by the work of external advisors.
The key assumptions used by management in the value-in-use calculations which are considered to be most sensitive to the calculation are:
The accompanying notes are an integral part of these consolidated financial statements.
F-
72
Adecoagro S.A.
Notes to the Consolidated Financial Statements (Continued)
(All amounts in US$ thousands, except shares and per share data and as otherwise indicated)
|
32.
|
Critical accounting estimates and judgments (continued)
|
|
Key Assumptions
|
September 30,
2018
|
September 30,
2017
|
||
|
Financial projections
|
Covers 4 years for UMA
|
Covers 4 years for UMA
|
||
|
|
Cover 7 years for AVI
|
Cover 7 years for AVI
|
||
|
Yield average growth rates
|
0-1%
|
0-1%
|
||
|
Future pricing increases
|
0.11% per annum
|
1.13% per annum
|
||
|
Future cost increases
|
3.11% per annum
|
0.09% per annum
|
||
|
Discount rates
|
8.4%
|
7.6%
|
||
|
Perpetuity growth rate
|
2.0%
|
2.0%
|
||
Discount rates are based on the risk-free rate for U. S. government bonds, adjusted for a risk premium to reflect the increased risk of investing in South America and Brazil in particular. The risk premium adjustment is assessed for factors specific to the respective CGUs and reflects the countries that the CGUs operate in.
The following table shows only the
3
CGUs where goodwill was allocated at each period end and the corresponding amount of goodwill allocated to each one:
|
CGU/ Operating segment
|
September 30,
2018
|
September 30,
2017
|
||||
|
AVI / Sugar, Ethanol and Energy
|
3,966
|
|
5,012
|
|
||
|
UMA / Sugar, Ethanol and Energy
|
2,107
|
|
2,622
|
|
||
|
Closing net book value of goodwill allocated to CGUs tested (Note 14)
|
6,073
|
|
7,634
|
|
||
|
Closing net book value of PPE items and other assets allocated to CGUs tested
|
618,818
|
|
719,558
|
|
||
|
Total assets allocated to 3 CGUs tested
|
624,891
|
|
727,192
|
|
||
Based on the testing above, the Group determined that none of the CGUs, with allocated goodwill, were impaired at September 30, 2018 and 2017.
Management views these assumptions as conservative and does not believe that any reasonable change in the assumptions would cause the carrying value of these CGU’s to exceed the recoverable amount.
As of December 31, 2018, the Group determined that there is no indicators of impairment.
(b) Biological assets
The nature of the Group’s biological assets and the basis of determination of their fair value are explained under Note 33.11. The discounted cash flow model requires the input of highly subjective assumptions including observable and unobservable data. Generally the estimation of the fair value of biological assets is based on models or inputs that are not observable in the market and the use of unobservable inputs is significant to the overall valuation of the assets. Unobservable inputs are determined based on the best information available, for example by reference to historical information of past practices and results, statistical and agronomical information, and other analytical techniques. Key assumptions include future market prices, estimated yields at the point of harvest, estimated production cycle, future cash flows, future costs of harvesting and other costs, and estimated discount rate.
Market prices are generally determined by reference to observable data in the principal market for the agricultural produce. Harvesting costs and other costs are estimated based on historical and statistical data. Yields are estimated based on several factors including the location of the farmland and soil type, environmental conditions, infrastructure and other restrictions and growth at the time of measurement. Yields are subject to a high degree of uncertainty and may be affected by several factors out of the Group’s control including but not limited to extreme or unusual weather conditions, plagues and other crop diseases, among other factors.
The accompanying notes are an integral part of these consolidated financial statements.
F-
73
Adecoagro S.A.
Notes to the Consolidated Financial Statements (Continued)
(All amounts in US$ thousands, except shares and per share data and as otherwise indicated)
|
32.
|
Critical accounting estimates and judgments (continued)
|
The key assumptions discussed above are highly sensitive. Reasonable shifts in assumptions including but not limited to increases or decreases in prices, costs and discount factors used would result in a significant increase or decrease to the fair value of biological assets. In addition, cash flows are projected over a number of years and based on estimated production. Estimates of production in themselves are dependent on various assumptions, in addition to those described above, including but not limited to several factors such as location, environmental conditions and other restrictions. Changes in these estimates could materially impact on estimated production, and could therefore affect estimates of future cash flows used in the assessment of fair value (see Note 15).
(c) Fair value of derivatives and other financial instruments
Fair values of derivative financial instruments are computed with reference to quoted market prices on trade exchanges, when available. The fair values of commodity options are calculated using year-end market rates together with common option pricing models. The fair value of interest rate swaps has been calculated using a discounted cash flow analysis.
(d) Income taxes
The Group is subject to income taxes in numerous jurisdictions. Significant judgment is required in determining the worldwide provision for income taxes. There are many transactions and calculations for which the ultimate tax determination is uncertain. The Group recognizes liabilities for anticipated tax audit issues based on estimates of whether additional taxes will be due. Where the final tax outcome of these matters is different from the amounts that were initially recorded, such differences will impact the current and deferred income tax assets and liabilities in the period in which such determination is made.
Deferred tax assets are reviewed each reporting date and reduced to the extent that it is no longer probable that sufficient taxable income will be available to allow all or part of the asset to be settled. Deferred tax assets and liabilities are not discounted. The ultimate realization of deferred tax assets is dependent upon the generation of future taxable income during the periods in which those temporary differences become deductible. Management considers the scheduled reversal of deferred tax liabilities, projected future taxable income and tax planning strategies in making this assessment (see Note 10 for details).
(e) Fair value for farmlands and investment property
Property, plant and equipment
Farmlands are recognized at fair value based on periodic, but at least annual, valuations prepared by an external independent expert. A revaluation reserve is credited in shareholders’ equity. The valuation is determined using sales Comparison Approach. Sale prices of comparable properties are adjusted considering the specific aspects of each property, the most relevant premise being the price per hectare (Level 3) (see Note 12).
Investment property
Investment property consists of farmland for rental or for capital appreciation and not used in production or for sale in the ordinary course of business, and it is measured at fair value. The changes of the Fair value, which is based on an independent external expert, impacts the profit and loss of the period, in the line item Other operating income, net (see Note 13).
The accompanying notes are an integral part of these consolidated financial statements.
F-
74
Adecoagro S.A.
Notes to the Consolidated Financial Statements (Continued)
(All amounts in US$ thousands, except shares and per share data and as otherwise indicated)
33. Summary of significant accounting policies
The principal accounting policies applied in the preparation of these consolidated financial statements are set out below. These policies have been consistently applied to all the years presented, unless otherwise stated.
Financial reporting in a hyperinflation economy
IAS 29 “Financial Reporting in Hyperinflationary Economies” requires that the financial statements of entities whose functional currency is that of a hyperinflationary economy to be adjusted for the effects of changes in a suitable general price index and to be expressed in terms of the current unit of measurement at the closing date of the reporting period. Accordingly, the inflation produced from the date of acquisition or from the revaluation date, as applicable, must be computed in the non-monetary items.
In order to conclude on whether an economy is categorized as hyperinflationary under the terms of IAS 29, the Standard details a series of factors to be considered, including the existence of a cumulative inflation rate in three years that approximates or exceeds 100 %.
Considering the a significant increase in inflation during 2018, which exceeded the 100% three-year cumulative inflation rate, and that the rest of the indicators do not contradict the conclusion that Argentina should be considered a hyperinflationary economy for accounting purposes. It is agreed that there is sufficient evidence to conclude that Argentina is a hyperinflationary economy under the terms of IAS 29 and that as from July 1, 2018, it will apply IAS 29 as from that date in the financial reporting of its subsidiaries and associates with Argentine peso as functional currency.
Financial statements of a foreign entity with a functional currency of a country that has a highly inflationary economy, are restated to reflect changes in the general price level or index in that country before translation into U.S. Dollars. In adjusting for hyperinflation, a general price index is applied to all non-monetary items in the financial statements (including equity) and the resulting gain or loss, which is the gain or loss on the entity's net monetary position, is recognized in the income statement. Monetary items in the closing statement of financial position are not adjusted. The Group treated all Argentine subsidiaries as a hyperinflationary economy as all of them have argentine peso as functional currency. The results and financial position of all foreign entities with a functional currency of a country that has a highly inflationary economy are translated at closing rates after the restatement for changes in the general purchasing power argentine peso.
The inflation adjustment on the initial balances was calculated by means of conversion factor derived from the Argentine price indexes published by the National Institute of Statistics and the year-over-year change in the index was 1.477.
The main procedures for the above-mentioned adjustment are as follows:
•
Monetary assets and liabilities which are carried at amounts current at the balance sheet date are not restated because they are already expressed in terms of the monetary unit current at the balance sheet date.
•
Non-monetary assets and liabilities which are not carried at amounts current at the balance sheet date, and components of shareholders' equity are adjusted by applying the relevant conversion factors.
•
All items in the income statement are restated by applying the relevant conversion factors. The company has elected not to segregate the impact of inflation over financial results.
•
The effect of inflation on the Company’s net monetary position is included in the income statement, in "Other financial results" (Note 9).
•
The ongoing application of the re-translation of comparative amounts to closing exchanges rates under IAS 21 and the hyperinflation adjustments required by IAS 29 will lead to a difference in addition to the difference arising on the adoption of hyperinflation accounting.
The accompanying notes are an integral part of these consolidated financial statements.
F-
75
Adecoagro S.A.
Notes to the Consolidated Financial Statements (Continued)
(All amounts in US$ thousands, except shares and per share data and as otherwise indicated)
|
33
|
Summary of significant accounting policies (continued)
|
The comparative figures in these consolidated financial statements presented in a stable currency are not adjusted for subsequent changes in the price level or exchange rates. This resulted in an initial difference, arising on the adoption of hyperinflation accounting, between the closing equity of the previous year and the opening equity of the current year. The Company recognized this initial difference directly in equity.
|
/33.1
|
Basis of preparation and presentation
|
The consolidated financial statements of the Group have been prepared in accordance with International Financial Reporting Standards (IFRS) of the International Accounting Standards Board (IASB) and the Interpretations of the International Financial Reporting Interpretations Committee (IFRIC). All IFRS issued by the IASB, effective at the time of preparing these consolidated financial statements have been applied.
The consolidated financial statements have been prepared under the historical cost convention as modified by financial assets and financial liabilities (including derivative instruments) at fair value through profit or loss, biological assets and agricultural produce at the point of harvest and farmlands measured at fair value.
The preparation of consolidated financial statements in conformity with IFRS requires the use of certain critical accounting estimates. It also requires management to exercise its judgment in the process of applying the Group’s accounting policies. The areas involving a higher degree of judgment or complexity, or areas where assumptions and estimates are significant to the consolidated financial statements are disclosed in Note 32.
Description of accounting policies changed during the period.
During the period ended September 30, 2018, the group has adopted the revaluation model for its farmlands within property, plant and equipment. Previously, the Company valued all these group of assets under the cost model. These amendments have resulted in an increase of property, plant and equipment of US$
545 million
. This higher valuation resulted in an increase of the deferred tax liability of US$
139 million
. This change in accordance with IAS 16 is applied prospectively.
The Company also adopted the revaluation model for its investment property. The higher valuation resulted in an increase in Retained earning of US$
45 million
; an increase in investment property of US$
40 million
as of December 31, 2017and an increase in Deferred tax liability of US$
12 million
. This change was applied retrospectively, in accordance with IAS 8. Consequently, prior year figures have been recast, as shown below:
|
31 December 2016 (Previously stated)
|
Increase/ (Decrease)
|
31 December 2016 (Recast)
|
31 December 2017 (Previously stated)
|
Increase/ (Decrease)
|
31 December 2017 (Recast)
|
|||||||
|
Property, plant and equipment (*)
|
802,608
|
|
12,259
|
|
814,867
|
|
820,931
|
|
10,446
|
|
831,377
|
|
|
Investment property
|
2,666
|
|
41,915
|
|
44,581
|
|
2,271
|
|
40,071
|
|
42,342
|
|
|
Deferred tax assets
|
38,586
|
|
(13,543
|
)
|
25,043
|
|
43,437
|
|
(12,629
|
)
|
30,808
|
|
|
Total assets
|
1,455,766
|
|
40,631
|
|
1,496,397
|
|
1,607,201
|
|
37,888
|
|
1,645,089
|
|
|
Retained earnings
|
50,998
|
|
41,999
|
|
92,997
|
|
60,984
|
|
45,225
|
|
106,209
|
|
|
Cumulative Translation Adjustment
|
(527,364
|
)
|
(5,756
|
)
|
(533,120
|
)
|
(541,545
|
)
|
(11,059
|
)
|
(552,604
|
)
|
|
Non-controlling interest
|
7,582
|
|
4,388
|
|
11,970
|
|
5,417
|
|
3,722
|
|
9,139
|
|
|
Total equity
|
671,673
|
|
40,631
|
|
712,304
|
|
645,131
|
|
37,888
|
|
683,019
|
|
(*) Property, plant and equipment was impacted due to a transfer from investment property to Property plant and equipment ocurred in 2016.
The accompanying notes are an integral part of these consolidated financial statements.
F-
76
Adecoagro S.A.
Notes to the Consolidated Financial Statements (Continued)
(All amounts in US$ thousands, except shares and per share data and as otherwise indicated)
33.1 Basis of preparation and presentation (continued)
Profit and Loss
|
December 31, 2017
|
Increase/ (Decrease)
|
December 31, 2017 (recast)
|
December 31, 2016
|
Increase/ (Decrease)
|
December 31, 2016 (recast)
|
|||||||
|
Other operating income
|
39,461
|
|
4,302
|
|
43,763
|
|
(8,297
|
)
|
14,049
|
|
5,752
|
|
|
Profit / (Loss) before income tax
|
5,681
|
|
4,302
|
|
9,983
|
|
13,126
|
|
14,049
|
|
27,175
|
|
|
Income tax (expense) / benefit
|
6,068
|
|
(1,076
|
)
|
4,992
|
|
(9,387
|
)
|
(3,512
|
)
|
(12,899
|
)
|
|
Profit / (Loss) for the year
|
11,749
|
|
3,226
|
|
14,975
|
|
3,739
|
|
10,537
|
|
14,276
|
|
|
Basic earnings per share
|
0.083
|
|
0.026
|
|
0.109
|
|
0.017
|
|
0.078
|
|
0.095
|
|
|
Diluted earnings per share
|
0.082
|
|
0.026
|
|
0.108
|
|
0.017
|
|
0.077
|
|
0.094
|
|
The Company considers these changes better reflects the current value of its farmlands and Investments properties; and therefore provides more relevant information to management, users of the Financial Statements and others.
(a) New and amended standards adopted by the Group:
A number of new or amended standards became applicable for the current reporting period and the Group had to change its accounting policies as a result of adopting the following standards:
–
IFRS 9 Financial Instruments, and
–
IFRS 15 Revenue from Contracts with Customers.
The impact of adopting IFRS 15 and IFRS 9 was not significant and therefore no cumulative effect upon adoption was recorded. The adoption of IFRS 15 was made by the modified retrospective method.
In accordance with the transitional provisions of IFRS 9, comparative figures have not been restated.
(b) Impact of standards issued but not yet applied by the Group
Below is a description of the standards, amendments and interpretations issued by the IASB to existing standards that have been issued and are mandatory for the Group with closer adoption:
In January 2016, the IASB finished its long-standing project on lease accounting and published IFRS 16, "Leases", which replaces the current guidance in IAS 17. This will require far-reaching changes in accounting by leases in particular. The standard applies to annual periods beginning on or after 1 January 2019.
The Company’s management is currently evaluating the potential impact of our pending adoption of the new standard on our consolidated financial statements.
|
33.2
|
Scope of consolidation
|
The consolidated financial statements include the results of the Company and all of its subsidiaries from the date that control commences to the date that control ceases. They also include the Group’s share of the net income of its jointly-controlled entities on an equity-accounted basis from the point at which joint control commences, to the date that it ceases.
(a) Subsidiaries
Subsidiaries are all entities over which the Group has control. The Group controls an entity when the Group is exposed to, or has rights to, variable returns from its involvement with the entity and has the ability to affect those returns through its power over the entity. Subsidiaries are fully consolidated from the date that control commences and deconsolidated from the date that control ceases.
The accompanying notes are an integral part of these consolidated financial statements.
F-
77
Adecoagro S.A.
Notes to the Consolidated Financial Statements (Continued)
(All amounts in US$ thousands, except shares and per share data and as otherwise indicated)
|
33.2
|
Scope of consolidation (continued)
|
The Group uses the acquisition method of accounting to account for business combinations. The consideration transferred for the acquisition of a subsidiary is the fair value of the assets transferred, the liabilities incurred and the equity interests issued by the Group. The consideration transferred includes the fair value of any asset or liability resulting from a contingent consideration arrangement. Acquisition-related costs are expensed as incurred. Identifiable assets acquired and liabilities and contingent liabilities assumed in a business combination are measured initially at their fair values at the acquisition date.
The Group recognizes any non-controlling interest in the acquiree on an acquisition-by-acquisition basis either at fair value or at the non-controlling interest’s proportionate share of the acquiree’s net assets.
The excess of the consideration transferred, the amount of any non-controlling interest in the acquiree and the acquisition-date fair value of any previous equity interest in the acquiree over the fair value of the identifiable net assets acquired is recorded as goodwill.
Inter-company transactions, balances and unrealized gains on transactions between group companies are eliminated. Unrealized losses are also eliminated. Accounting policies of subsidiaries have been changed where necessary to ensure consistency with the policies adopted by the Group.
(b) Changes in ownership interests in subsidiaries without change of control
Transactions with non-controlling interests that do not result in loss of control are accounted for as equity transactions – that is, as transactions with the owners in their capacity as owners. The difference between the fair value of any consideration paid and the relevant share acquired of the carrying value of net assets of the subsidiary is recorded in equity. Gains or losses on disposals to non-controlling interests are also recorded in equity.
(c) Disposal of subsidiaries
When the Group ceases to have control any retained interest in the entity is re-measured to its fair value at the date when control is lost, with the change in carrying amount recognized in profit or loss. The fair value is the initial carrying amount for the purposes of subsequently accounting for the retained interest as an associate, joint venture or financial asset. In addition, any amount previously recognized in other comprehensive income in respect of that entity is accounted for as if the Group had directly disposed of the related assets or liabilities. This may mean that amounts previously recognized in other comprehensive income are reclassified to profit or loss.
(d) Joint arrangements
Under IFRS 11, investments in joint arrangements are classified as either joint operations or joint ventures depending on the contractual rights and obligations each investor has rather than the legal structure of the joint arrangement.
The Group has assessed the nature of its joint arrangements and determined them to be joint ventures and value them under the equity method.
Under the equity method of accounting, interests in joint ventures are initially recognized in the consolidated statement of financial position at cost and adjusted thereafter to recognize the Group’s share of the post-acquisition of profits or losses and movements in other comprehensive income, respectively. When the share of losses of an investee equals or exceeds the carrying amount of an investment the Group discontinue applying the equity method, the investment is reduced to zero and does not record additional losses. If the investee subsequently reports net income, the Group would resume applying the equity method only after its share of that net income equals the share of net losses not recognized during the period the equity method was suspended.
Unrealized gains on transactions between the Group and its joint ventures are eliminated to the extent of the Group’s interest in the joint ventures. Unrealized losses are also eliminated unless the transaction provides evidence of an impairment of the asset transferred. Accounting policies of the joint ventures have been changed where necessary to ensure consistency with the policies adopted by the Group.
The accompanying notes are an integral part of these consolidated financial statements.
F-
78
Adecoagro S.A.
Notes to the Consolidated Financial Statements (Continued)
(All amounts in US$ thousands, except shares and per share data and as otherwise indicated)
|
33.3
|
Segment reporting
|
According to IFRS 8, operating segments are identified based on the ‘management approach’. This approach stipulates external segment reporting based on the Group’s internal organizational and management structure and on internal financial reporting to the chief operating decision maker (the Management Committee in the case of the Company)
|
33.4
|
Foreign currency translation
|
(a) Functional and presentation currency
Items included in the financial statements of each of the Group’s entities are measured using the currency of the primary economic environment in which the entity operates (‘the functional currency’). The consolidated financial statements are presented in US dollars, which is the Group’s presentation currency.
(b) Transactions and balances
Foreign currency transactions are translated into the functional currency using the exchange rates prevailing at the dates of the transactions or valuation where items are remeasured. Foreign exchange gains and losses resulting from the settlement of such transactions and from the translation at year-end exchange rates of monetary assets and liabilities denominated in foreign currencies are recognized in the statement of income, in the line Item “Finance income” or “Finance cost”, as appropriate.
(c) Group companies
The results and financial position of Group entities (except those that has the currency of a hyper-inflationary economy - Argentine subsidiaries) (see Note 33) that have a functional currency different from the presentation currency are translated into the presentation currency as follows:
|
•
|
assets and liabilities for each statement of financial position presented are translated at the closing rate at the date of that statement of financial position;
|
|
•
|
income and expenses for each statement of income are translated at average exchange rates (unless this average is not a reasonable approximation of the cumulative effect of the rates prevailing on the transaction dates, in which case income and expenses are translated at the rate on the dates of the transactions); and
|
|
•
|
all resulting exchange differences are recognized as a separate component of equity.
|
When a foreign operation is partially disposed of or sold, exchange differences that were recorded in equity are recognized in the statement of income as part of the gain or loss on sale.
Goodwill and fair value adjustments arising on the acquisition of a foreign entity are treated as assets and liabilities of the foreign entity and translated at the closing rate.
|
33.5
|
Property, plant and equipment
|
Farmlands are recognized at fair value based on periodic, but at least annual, valuations prepared by an external independent expert. A revaluation reserve is credited in shareholders’ equity. All other property, plant and equipment is recorded at cost, less accumulated depreciation and impairment losses, if any. Historical cost comprises the purchase price and any costs directly attributable to the acquisition. Under the definition of Property plant and equipment is included the bearer plants, such as sugarcane and coffee trees.
Where individual components of an item of property, plant and equipment have different useful lives, they are accounted for as separate items, which are depreciated separately.
Subsequent costs are included in the asset’s carrying amount or recognized as a separate asset, as appropriate, only when it is probable that future economic benefits associated with the item will flow to the Group and the cost of the item can be measured reliably. The carrying amount of the replaced part is derecognized. All other repairs and maintenance are charged to the statement of income when they are incurred.
The accompanying notes are an integral part of these consolidated financial statements.
F-
79
Adecoagro S.A.
Notes to the Consolidated Financial Statements (Continued)
(All amounts in US$ thousands, except shares and per share data and as otherwise indicated)
33.5 Property, plant and equipment (continued)
The depreciation methods and periods used by the group are disclosed in Note 12.
Gains and losses on disposals are determined by comparing the proceeds with the carrying amount and are recognized within “Other operating income, net” in the consolidated statement of income.
|
33.6
|
Investment property
|
Investment property consists of farmland for rental or for capital appreciation and not used in production or for sale in the ordinary course of business, and it is measured at fair value. net of any impairment losses if any. The changes of the Fair value, which is based on an independent external expert, impacts the profit and loss of the period, in the line item Other operating income, net.
|
33.7
|
Leases
|
The Group classifies its leases at the inception as finance or operating leases. Leases are classified as finance leases whenever the terms of the lease transfer substantially all the risks and rewards of ownership to the lessee. All other leases are classified as operating leases and charged to the statements of income in a straight-line basis over the period of the lease. Finance leases are capitalized at the lease’s inception at the lower of the fair value of the leased property and the present value of the minimum lease payments. The corresponding rental obligations, net of finance charges, are included as “Borrowings”
|
33.8
|
Goodwill
|
Goodwill represents future economic benefits arising from assets that are not capable of being individually identified and separately recognized by the Group on an acquisition. Goodwill on acquisition is initially measured at cost. being the excess of the consideration over the fair value of the Group’s share of net assets of the acquired subsidiary undertaking at the acquisition date. Following initial recognition, goodwill is measured at cost less any accumulated impairment losses. It is allocated to those cash generating units expected to benefit from the acquisition for the purpose of impairment testing. Goodwill arising on the acquisition of subsidiaries is included within “Intangible assets” on the statement of financial position. Goodwill arising on the acquisition of foreign entities is treated as an asset of the foreign entity denominated in the local currency and translated at the closing rate.
Goodwill is not amortized but tested for impairment on an annual basis, or more frequently if there is an indication of impairment (see Note 32 (a)). Gains and losses on the disposal of a Group entity include any goodwill relating to the entity sold (see Note 33.10).
|
33.9
|
Other intangible assets
|
Other intangible assets that are acquired by the Group, which have finite useful lives, are measured at cost less accumulated amortization and impairment losses, if any. These intangible assets comprise trademarks and computer software and are amortized in the statement of income on a straight-line basis over their estimated useful lives estimated to be
10
to
20
years and
3
to
5
years, respectively.
|
33.10
|
Impairment of assets
|
Goodwill
For the purpose of impairment testing, assets are grouped at the lowest levels for which there are separately identifiable cash flows, known as cash-generating units. If the recoverable amount of the cash-generating unit is less than the carrying amount of the unit, the impairment loss is allocated first to reduce the carrying amount of any goodwill allocated to the unit and then to the other assets of the unit pro-rata on the basis of the carrying amount of each asset may in the unit. Impairment losses recognized for goodwill cannot be reversed in a subsequent period. Recoverable amount is the higher of fair value less costs to sell and value
The accompanying notes are an integral part of these consolidated financial statements.
F-
80
Adecoagro S.A.
Notes to the Consolidated Financial Statements (Continued)
(All amounts in US$ thousands, except shares and per share data and as otherwise indicated)
33.10 Impairment of assets (continued)
in use. In assessing value in use, the estimated future cash flows are discounted to their present value using a pre-tax discount rate that reflects current market assessments of the time value of money and the risks specific to the asset for which the estimates of future cash flows have not been adjusted (see Note 32 (a) for details).
Property, plant and equipment and finite lived intangible assets
At each statement of financial position date, the Group reviews the carrying amounts of its property, plant and equipment and other intangible assets which have finite lives to determine whether there is any indication that those assets have suffered an impairment loss. If any such indication exists, the recoverable amount of the asset is estimated in order to determine the extent, if any, of the impairment loss. Where the asset does not generate cash flows that are independent from other assets, the Group estimates the recoverable amount of the cash-generating unit to which the asset belongs.
If the recoverable amount of an asset or cash-generating unit is estimated to be less than its carrying amount, that carrying amount is reduced to its recoverable amount. An impairment loss is recognized immediately in the statement of income.
Where an impairment loss subsequently reverses, the carrying amount of the asset or cash-generating unit is increased to the revised estimate of its recoverable amount, not to exceed the carrying amount that would have been determined had no impairment loss been recognized for the asset or cash-generating unit in prior years. A reversal of an impairment loss is recognized immediately in the statement of income.
|
33.11
|
Biological assets
|
Biological assets comprise growing crops (mainly corn, wheat, soybeans, sunflower and rice), sugarcane, coffee and livestock (growing herd and cattle for dairy production).
The Group distinguishes between consumable and bearer biological assets, and between mature and immature biological assets. “Consumable” biological assets are those assets that may be harvested as agriculture produce or sold as biological assets, for example livestock intended for dairy production. “Bearer” biological assets are those assets capable of producing more than one harvest, for example sugarcane or livestock from which raw milk is produced. “Mature” biological assets are those that have attained harvestable specifications (for consumable biological assets) or are able to sustain regular harvests (for bearer biological assets). “Immature” biological assets are those assets other than mature biological assets.
Costs are capitalized as biological assets if, and only if, (a) it is probable that future economic benefits will flow to the entity, and (b) the cost can be measured reliably. The Group capitalizes costs such as: planting, harvesting, weeding, seedlings, irrigation, agrochemicals, fertilizers and a systematic allocation of fixed and variable production overheads that are directly attributable to the management of biological assets, among others. Costs that are expensed as incurred include administration and other general overhead and unallocated production overhead, among others.
Biological assets, both at initial recognition and at each subsequent reporting date, are measured at fair value less costs to sell, except where fair value cannot be reliably measured. Cost approximates fair value when little biological transformation has taken place since the costs were originally incurred or the impact of biological transformation on price is not expected to be material.
Gains and losses that arise on measuring biological assets at fair value less costs to sell and measuring agricultural produce at the point of harvest at fair value less costs to sell are recognized in the statement of income in the period in which they arise in the line item “Initial recognition and changes in fair value of biological assets and agricultural produce”.
Where there is an active market for a biological asset or agricultural produce, quoted market prices in the most relevant market are used as a basis to determine the fair value. Otherwise, when there is no active market or market-determined prices are not available, fair value of biological assets is determined through the use of valuation techniques.
The accompanying notes are an integral part of these consolidated financial statements.
F-
81
Adecoagro S.A.
Notes to the Consolidated Financial Statements (Continued)
(All amounts in US$ thousands, except shares and per share data and as otherwise indicated)
|
33.11
|
Biological assets (continued)
|
Therefore, the fair value of biological assets is generally derived from the expected discounted cash flows of the related agricultural produce. The fair value of the agricultural produce at the point of harvest is generally derived from market determined prices. A general description of the determination of fair values based on the Company’s business segments follow:
|
•
|
Growing crops:
|
Growing crops, for which biological growth is not significant, are measured at cost, which approximates fair value. Expenditure on growing crops includes land preparation expenses and other direct expenses incurred during the sowing period including labor, seedlings, agrochemicals and fertilizers among others.
Otherwise, biological assets are measured at fair value less estimated point-of-sale costs at initial recognition and at any subsequent period. Point-of-sale costs include all costs that would be necessary to sell the assets
The fair value of growing crops excluding sugarcane and coffee is measured based on a formula, which takes into consideration the estimated crop yields, estimated market prices and costs, and discount rates. Yields are determined based on several factors including location of farmland, environmental conditions and other restrictions and growth at the time of measurement. Yields are multiplied by sown hectares to determine the estimated tons of crops to be obtained. The tons are then multiplied by a net cash flow determined at the future crop prices less the direct costs to be incurred. This amount is discounted at a discount rate, which reflects current market assessments of the assets involved and the time value of money.
|
•
|
Growing herd and cattle:
|
Livestock are measured at fair value less estimated point-of-sale costs, with any changes therein recognized in the statement of income, on initial recognition as well as subsequently at each reporting period. The fair value of livestock is determined based on the actual selling prices less estimated point-of-sale costs in the markets where the Group operates.
|
•
|
Coffee:
|
The agricultural produce growing on the coffee trees, are biological assets, and are valued at fair value less cost to sell. Projected costs include maintenance, pruning, land leasing, harvesting and coffee treatment. These estimates are discounted at an appropriate discount rate.
|
•
|
Sugarcane:
|
Sugarcane planting costs form part of Property plant and equipment. The agricultural produce growing on sugarcane is classified as biological assets and are measured at fair value less cost to sell. The fair value of agricultural produce growing on sugarcane depends on the variety, location and maturity of the plantation.
Agricultural produce growing in the Sugarcane, for which biological growth is not significant, is valued at cost, which approximates fair value. Expenditure on the agricultural produce growing in the sugarcane consists mainly of labor, agrochemicals and fertilizers among others. When it has attained significant biological growth, it is measured at fair value through a discounted cash flow model. Revenues are based on estimated yearly production volume (which will be destined to sugar, ethanol, energy and raw cane production) and the price is calculated as the average of daily prices for sugar future contracts (Sugar #11 ICE-NY contracts) for a six months period. Projected costs include maintenance and land leasing among others. These estimates are discounted at an appropriate discount rate.
|
33.12
|
Inventories
|
Inventories comprise of raw materials, finished goods (including harvested agricultural produce and manufactured goods) and others.
Harvested agricultural produce (except for rice and milk) are measured at net realizable value until the point of sale because there is an active market in the produce, there is a negligible risk that the produce will not be sold and there is a well-established practice in the industry carrying the inventories at net realizable value. Changes in net realizable value are recognized
The accompanying notes are an integral part of these consolidated financial statements.
F-
82
Adecoagro S.A.
Notes to the Consolidated Financial Statements (Continued)
(All amounts in US$ thousands, except shares and per share data and as otherwise indicated)
|
33.12
|
Inventories (continued)
|
in the statement of income in the period in which they arise under the line item “Changes in net realizable value of agricultural produce after harvest”.
All other inventories (including rice and milk) are measured at the lower of cost and net realizable value. Cost is determined using the weighted average method.
|
33.13
|
Financial assets
|
Financial assets are classified in the following categories: at fair value through profit or loss and at amortized cost, namely loans and receivables. The classification depends on the purpose for which the financial assets were acquired. Management determines the classification of its financial assets at initial recognition (see Note 17).
(a) Recognition and measurement
Regular purchases and sales of financial assets are recognized on the trade-date – the date on which the Group commits to purchase or sell the asset. Financial assets not carried at fair value through profit or loss are initially recognized at fair value plus transaction costs. Financial assets carried at fair value through profit or loss are initially recognized at fair value and transaction costs are expensed in the statement of income. Financial assets are derecognized when the rights to receive cash flows from the investments have expired or have been transferred and the Group has transferred substantially all risks and rewards of ownership. Financial assets at fair value through profit or loss are subsequently carried at fair value. Loans and receivables are subsequently carried at amortized cost using the effective interest method.
Gains or losses arising from changes in the fair value of the “financial assets at fair value through profit or loss” category are presented in the statement of income within “Other operating income, net” in the period in which they arise.
If the market for a financial asset is not active (and for unlisted securities), the Group establishes fair value by using valuation techniques. These include the use of recent arm’s length transactions, reference to other instruments that are substantially the same, discounted cash flow analysis, and option pricing models, making maximum use of market inputs and relying as little as possible on entity-specific inputs.
The Group assesses at each statement of financial position date whether there is objective evidence that a financial asset or a group of financial assets is impaired. Impairment testing of trade receivables is described in Note 33.15.
(b) Offsetting financial instruments
Financial assets and liabilities are offset and the net amount reported in the statement of financial position when there is a legally enforceable right to offset the recognized amounts and there is an intention to settle on a net basis, or realize the asset and settle the liability simultaneously. This right must not be contingent on future events and must be enforceable in any case.
|
33.14
|
Derivative financial instruments and hedging activities
|
Derivatives are initially recognized at fair value on the date a derivative contract is entered into and are subsequently remeasured at their fair value. Commodity future contract fair values are computed with reference to quoted market prices on future exchanges markets. The fair values of commodity options are calculated using year-end market rates together with common option pricing models. The fair value of interest rate swaps has been calculated using a discounted cash flow analysis.
The Group manages exposures to financial and commodity risks using hedging instruments that provide the appropriate economic outcome. The principal hedging instruments used may include commodity future contracts, put and call options, foreign exchange forward contracts and interest rate swaps. The Group does not use derivative financial instruments for speculative purposes.
The accompanying notes are an integral part of these consolidated financial statements.
F-
83
Adecoagro S.A.
Notes to the Consolidated Financial Statements (Continued)
(All amounts in US$ thousands, except shares and per share data and as otherwise indicated)
33.14 Derivative financial instruments (continued)
The Group’s policy is to apply hedge accounting to hedging relationships where it is both permissible under IFRS 9, practical to do so and its application reduces volatility, but transactions that may be effective hedges in economic terms may not always qualify for hedge accounting under IFRS 9. Any derivatives that the Group holds to hedge these exposures are classified as “held for trading” and are shown in a separate line on the face of the statement of financial position. The method of recognizing gains or losses on derivatives depends on whether the derivative is designated as a hedging instrument, and if so, the nature of the item being hedged. Gains and losses on commodity derivatives are classified within “Other operating income, net”. Gains and losses on interest rate and foreign exchange rate derivatives are classified within ‘Financial results, net’. The Group designates certain derivatives as hedges of the foreign currency risk associated with highly probable forecast transactions (cash flow hedge).
The Group documents at the inception of the transaction the relationship between hedging instruments and hedged items, as well as its risk management objectives and strategy for undertaking various hedging transactions. The Group also documents its assessment, both at hedge inception and on an ongoing basis, of whether the instruments that are used in hedging transactions are highly effective in offsetting changes in fair value or cash flows of hedged items.
Cash flow hedge
The effective portion of the gain or loss on the instruments that are designated and qualify as cash flow hedges is recognized in other comprehensive income. The gain or loss relating to the ineffective portion is recognized immediately in the statement of income within "Finance income” or “Finance cost”, as appropriate.
Amounts accumulated in equity are reclassified to profit or loss in the periods when the hedged item affects profit or loss. The gain or loss relating to the effective portion is recognized in the statement of income within "Finance income” or “Finance cost”, as appropriate.
When a hedging instrument expires or is sold, or when a hedge no longer meets the criteria for hedge accounting, any cumulative gain or loss existing in equity at that time remains in equity and is recognized when the forecast transaction is ultimately recognized in the statement of income. When a forecast transaction is no longer expected to occur, the cumulative gain or loss that was reported in equity is immediately transferred to the statement of income.
|
33.15
|
Trade and other receivables and trade and other payables
|
Trade receivables are recognized initially at fair value and subsequently measured at amortized cost using the effective interest method. In the case of receivables, less allowance for trade receivables.
The group applies the IFRS 9 simplified approach to measuring expected credit losses which uses a lifetime expected loss allowance for all trade receivables. To measure the expected credit losses, trade receivables have been grouped based on shared credit risk characteristics and the days past due.
|
33.16
|
Cash and cash equivalents
|
Cash and cash equivalents includes cash in hand, deposits held at call with banks and other short-term highly liquid investments with original maturities of three months or less. In the statements of cash flows, interest paid is presented within financing cash flows and interest received is presented within investing activities.
|
33.17
|
Borrowings
|
Borrowings are initially recognized at fair value, net of transaction costs incurred. Borrowings are subsequently measured at amortized cost using the effective interest method. Borrowing costs are capitalized during the period of time that is required to complete and prepare the asset for its intended use.
The accompanying notes are an integral part of these consolidated financial statements.
F-
84
Adecoagro S.A.
Notes to the Consolidated Financial Statements (Continued)
(All amounts in US$ thousands, except shares and per share data and as otherwise indicated)
|
33.18
|
Provisions
|
Provisions are recognized when (i) the Group has a present legal or constructive obligation as a result of past events; (ii) it is probable that an outflow of resources will be required to settle the obligation; and (iii) a reliable estimate of the amount of the obligation can be made. Provisions are measured at the present value of the expenditures expected to be required to settle the obligation using a pre-tax rate that reflects current market assessments of the time value of money and the risks specific to the obligation.
|
33.19
|
Onerous contracts
|
The Group enters into contracts, which require the Group to sell commodities in accordance with the Group's expected sales. These contracts do not qualify as derivatives. These contracts are not recognized until at least one of the parties has performed under the agreement. However, when the contracts are onerous, the Group recognizes the present obligation under the contracts as a provision included within “Provision and other liabilities” in the statement of financial position. Losses under these onerous contracts are recognized within “Other operating income, net” in the statement of income.
|
33.20
|
Current and deferred income tax
|
The Group’s tax benefit or expense for each year comprises the charge for current tax payable and deferred taxation attributable to the Group’s operating subsidiaries. Tax is recognized in the statement of income, except to the extent that it relates to items recognized directly in equity. In this case, the tax is also recognized in equity.
The current income tax charge is calculated on the basis of the tax laws enacted at the date of the statement of financial position in the countries where the Group’s subsidiaries operate and generate taxable income. Management periodically evaluates positions taken in tax returns with respect to situations in which applicable tax regulation is subject to interpretation. It establishes provisions where appropriate on the basis of amounts expected to be paid to the tax authorities.
Deferred income tax is recognized, using the liability method, on temporary differences arising between the tax bases of assets and liabilities and their carrying amounts in the consolidated financial statements. However, the deferred income tax is not accounted for if it arises from initial recognition of an asset or liability in a transaction other than a business combination that at the time of the transaction affects neither accounting nor taxable profit or loss. Deferred income tax is determined using tax rates (and laws) effective in the countries where the Group’s subsidiaries operate and generate taxable income.
Deferred income tax assets are recognized only to the extent that it is probable that future taxable profit will be available against which the temporary differences can be utilized.
Deferred income tax is provided on temporary differences arising on investments in subsidiaries, except where the timing of the reversal of the temporary difference is controlled by the Group and it is probable that the temporary difference will not reverse in the foreseeable future.
The Group is able to control the timing of dividends from its subsidiaries and hence does not expect to remit overseas earnings in the foreseeable future in a way that would result in a charge to taxable profit. Hence deferred tax is recognized in respect of the retained earnings of overseas subsidiaries only to the extent that, at the date of the statement of financial position, dividends have been accrued as receivable or a binding agreement to distribute past earnings in future has been entered into by the subsidiary.
33.21 Revenue Recognition
The Group’s primary activities comprise agricultural and agro-industrial activities.
The Group’s agricultural activities comprise growing and selling agricultural produce. In accordance with IAS 41 “Agriculture”, cattle are measured at fair value with changes therein recognized in the statement of income as they arise. Agricultural produce is measured at net realizable value with changes therein recognized in the statement of income as they arise. Therefore, sales of agricultural produce and cattle generally do not generate any separate gains or losses in the statement of income.
The accompanying notes are an integral part of these consolidated financial statements.
F-
85
Adecoagro S.A.
Notes to the Consolidated Financial Statements (Continued)
(All amounts in US$ thousands, except shares and per share data and as otherwise indicated)
33.21 Revenue recognition (continued)
The Group’s agro-industrial activities comprise the selling of manufactured products (i.e. industrialized rice, milk-related products, ethanol, sugar, energy, among others). These sales are measured at the fair value of the consideration received or receivable, net of returns and allowances, trade and other discounts, and sales taxes, as applicable.
Revenue is recognized when the full control have been transferred to the buyer, recovery of the consideration is probable, the associated costs and possible return of goods can be estimated reliably, and there is no continuing management involvement with the goods. Transfers of control vary depending on the individual terms of the contract of sale. Revenues are recognised when control of the products has transferred, being when the products are delivered to the customer, having this full discretion over the channel and price to sell the products, and there is no unfulfilled obligation that could affect the customer’s acceptance of the products.
The Group also provides certain agricultural-related services such as grain warehousing/conditioning and other services, e.g. handling and drying services. Revenue from services is recognized as services are provided.
The Group leases owned farmland property to third parties under operating lease agreements. Rental income is recognized on a straight-line basis over the period of the lease.
The Group is a party to a 10-year power agreement for the sale of electricity which expires in 2018. The delivery period starts in May and ends in November of each year. The Group is also a party to two 15-year power agreements which delivery period starts in March and ends in December of each year, these two agreements will expire in 2024 and 2025, respectively. Prices under all the agreements are adjusted annually for inflation. Revenue related to the sale of electricity under these two agreements is recorded based upon output delivered.
|
33.22
|
Farmlands sales
|
The Group’s strategy is to profit from land appreciation value generated through the transformation of its productive capabilities. Therefore, the Group may seek to realize value from the sale of farmland assets and businesses.
Farmland sales are not recognized until (i) the sale is completed, (ii) the Group has determined that it is probable the buyer will pay, (iii) the amount of revenue can be measured reliably, and (iv) the Group has transferred to the buyer the risk of ownership, and does not have a continuing involvement. Gains from “farmland sales” are included in the statement of income under the line item “Other operating income, net”.
|
33.23
|
Assets held for sale and discontinued operations
|
When the Group intends to dispose of, or classify as held for sale, a business component that represents a separate major line of business or geographical area of operations, or a subsidiary acquired exclusively with a view to resale, it classifies such operations as discontinued. The post tax profit or loss of the discontinued operations is shown as a single amount on the face of the statement of income, separate from the other results of the Group. Assets and liabilities classified as held for sale are measured at the lower of carrying value and fair value less costs to sell.
Non-current assets and disposal groups are classified as held for sale if their carrying amount will be recovered through a disposal rather than through continuing use. This condition is regarded as met only when management is committed to the sale (disposal), the sale (disposal) is highly probable and expected to be completed within one year from classification and the asset is available for immediate sale (disposal) in its present condition. The statements of income for the comparative periods are represented to show the discontinued operations separate from the continuing operations.
The accompanying notes are an integral part of these consolidated financial statements.
F-
86
Adecoagro S.A.
Notes to the Consolidated Financial Statements (Continued)
(All amounts in US$ thousands, except shares and per share data and as otherwise indicated)
|
33.24
|
Earnings per share
|
Basic earnings per share is calculated by dividing the net income for the year attributable to equity holders of the parent by the weighted average number of ordinary shares outstanding during the year. Diluted net earnings per share is computed by dividing the net income for the period by the weighted average number of ordinary shares outstanding, and when dilutive, adjusted for the effect of all potentially dilutive shares, including share options, on an as-if converted basis.
|
33.25
|
Equity-settled share-based payments
|
The Group issues equity settled share-based payments to certain directors, senior management and employees. Options under the awards were measured at fair value at the date of grant. An expense is recognized to spread the fair value of each award over the vesting period on a straight-line basis, after allowing for an estimate of the awards that will eventually vest. The estimate of the level of vesting is reviewed at least annually, with any impact on the cumulative charge being recognized immediately.
|
33.26
|
Research and development
|
Research phase expenditure is expensed as incurred. Development expenditure is capitalized as an internally generated intangible asset only if it meets strict criteria, relating in particular to technical feasibility and generation of future economic benefits. Research expenses have been immaterial to date. The Group has not capitalized any development expenses to date.
|
34.
|
Events occurring after the reporting period
|
▪
Acquisitions
In January 2019, the Company acquired from CHS Argentina, the
50%
of CHS Agro S.A. After this acquisition, we own
100%
the CHS Agro S.A. Afterwards, the name of the Company changed to Girasoles del Plata S.A. The consideration for this operation was negligible.
In January 2019, the Company acquired
100%
of Olam Alimentos S.A. which main asset is a peanuts processing facility located in the Province of Córdoba, (currently Mani del Plata S.A.) from Olam Argentina S.A. and Olam International Ltd. for a total consideration of US$
10 millions
; which payment was agreed to make in
3
annual instalments. The first payment was made on the closing date.
In February 2019, the Company acquired two dairy facilities from SanCor, one in Chivilcoy, Province of Buenos Aires, which process fluid milk and an other one in Morteros, Province of Cordoba, which produces powder milk and cheese. Together with this
2
plants, we acquired the brands Las Tres Niñas and Angelita. The total consideration for this operations was US$
47 million
, which has already been disbursed.
The Company is currently evaluating the impacts of the precedent transactions.
▪
Disposals
In January 2019, the Group completed the sale of Q065 Negócios Imobiliários Ltda., a wholly owned subsidiary , which main underlying asset is the Alto Alegre Farm, for a selling price of US$
16.6 million
(Reais
62.5 million
), of which US$
0.8 million
(Reais
2.9 million
) has already been collected and the balance will be collected in seven annual installments starting in June 2019. This transaction resulted in a gain of US$
9.3 million
, that wiill be shown in the line “Other operating income, net” under the line item “Gain from the sale of farmland and other assets”.
The accompanying notes are an integral part of these consolidated financial statements.
F-
87
TABLE OF CONTENTS
Part IItem 1. Identity Of Directors, Senior Management and AdvisersItem 2. Offer Statistics and Expected TimetableItem 3. Key InformationItem 4. Information on The CompanyItem 4B. Unresolved Staff CommentsItem 5. Operating and Financial Review and ProspectsItem 6. Directors, Senior Management and EmployeesItem 7. Major Shareholders and Related Party TransactionsItem 8. Financial InformationItem 9. The Offer and ListingItem 10. Additional InformationItem 11. Quantitative and Qualitative Disclosures About Market RiskItem 12. Description Of Securities Other Than Equity SecuritiesPart IIItem 13. Defaults, Dividend Arrearages and DelinquenciesItem 14. Material Modifications To The Rights Of Security Holders and Use Of ProceedsItem 15. Controls and ProceduresPart IIIItem 17. Financial StatementsItem 18. Financial StatementsItem 19. Exhibits