ASPEN INSURANCE HOLDINGS LTD
UNITED STATES
SECURITIES AND EXCHANGE COMMISSION
Washington, D.C. 20549
____________________________________________________________
Form 10-K
____________________________________________________________
|
ý
|
ANNUAL REPORT PURSUANT TO SECTION 13 OR 15(d) OF THE SECURITIES EXCHANGE ACT OF 1934
|
Or
|
¨
|
TRANSITION REPORT PURSUANT TO SECTION 13 OR 15(d) OF THE SECURITIES EXCHANGE ACT OF 1934
|
For the transition period from ______________ to _____________
Commission file number 001-31909

ASPEN INSURANCE HOLDINGS LIMITED
(Exact name of registrant as specified in its charter)
|
Bermuda
|
|
Not Applicable
|
|
(State or other jurisdiction of
incorporation or organization)
|
|
(I.R.S. Employer
Identification No.)
|
|
141 Front Street
Hamilton, Bermuda
|
|
HM 19
|
|
(Address of principal executive offices)
|
|
(Zip Code)
|
Registrant’s telephone number, including area code
(441) 295-8201
|
Securities registered pursuant to Section 12(b) of the Act:
|
|||
|
Title of Each Class
|
Name of Each Exchange on Which Registered
|
||
|
Ordinary Shares, 0.15144558¢ par value
|
New York Stock Exchange, Inc.
|
||
|
5.95% Fixed-to-Floating Rate Perpetual Non-Cumulative Preference Shares
|
New York Stock Exchange, Inc.
|
||
|
5.625% Perpetual Non-Cumulative Preference Shares
|
New York Stock Exchange, Inc.
|
||
Securities registered pursuant to Section 12(g) of the Act: None.
Indicate by check mark if the registrant is a well-known seasoned issuer, as defined in Rule 405 of the Securities Act. Yes
ý
No
¨
Indicate by check mark if the registrant is not required to file reports pursuant to Section 13 or Section 15(d) of the Exchange Act. Yes
¨
No
ý
Indicate by check mark whether the registrant (1) has filed all reports required to be filed by Section 13 or 15(d) of the Exchange Act of 1934 during the preceding 12 months (or for such shorter periods that the registrant was required to file such reports), and (2) has been subject to such filing requirements for the past 90 days. Yes
ý
No
¨
Indicate by check mark whether the registrant has submitted electronically every Interactive Data File required to be submitted pursuant to Rule 405 of Regulation S-T (§232.405 of this chapter) during the preceding 12 months (or for such shorter period that the registrant was required to submit such files). Yes
ý
No
¨
Indicate by check mark if disclosure of delinquent filers pursuant to Item 405 of Regulation S-K (§229.405 of this chapter) is not contained herein, and will not be contained, to the best of the registrant’s knowledge, in the definitive proxy or information statements incorporated by reference in Part III of this Form 10-K or any amendment to this Form 10-K
ý
Indicate by check mark whether the registrant is a large accelerated filer, an accelerated filer, a non-accelerated filer, a smaller reporting company or an emerging growth company. See the definitions of “large accelerated filer,” “accelerated filer,” “smaller reporting company” and “emerging growth company” in Rule 12b-2 of the Exchange Act.:
|
Large accelerated filer
|
ý
|
Accelerated filer
|
¨
|
Non-accelerated filer
|
¨
|
Smaller reporting company
|
¨
|
Emerging growth company
|
¨
|
|||
If an emerging growth company, indicate by check mark if the registrant has elected not to use the extended transition period for complying with any new or revised financial accounting standards provided pursuant to Section 13(a) of the Exchange Act.
¨
Indicate by check mark whether the registrant is a shell company (as defined in Rule 12b-2 of the Act). Yes
¨
No
ý
The aggregate market value of the ordinary shares held by non-affiliates of the registrant, as of June 30,
2018
, was approximately
$2.4 billion
based on the closing price of the ordinary shares on the New York Stock Exchange on that date, assuming solely for the purpose of this calculation that all directors and employees of the registrant were “affiliates.” The determination of affiliate status is not necessarily a conclusive determination for other purposes and such status may have changed since June 30,
2018
.
As of
February 11, 2019
, there were
59,862,693
outstanding ordinary shares, with a par value of
0.15144558¢
per ordinary share.
ASPEN INSURANCE HOLDINGS LIMITED
FORM 10-K
TABLE OF CONTENTS
|
|
|
Page
|
|
Aspen Holdings and Subsidiaries
|
||
|
Cautionary Statement Regarding Forward-Looking Statements
|
||
|
PART I
|
||
|
Item 1.
|
Business
|
|
|
Item 1A.
|
Risk Factors
|
|
|
Item 1B.
|
Unresolved Staff Comments
|
|
|
Item 2.
|
Properties
|
|
|
Item 3.
|
Legal Proceedings
|
|
|
Item 4.
|
Mine Safety Disclosures
|
|
|
PART II
|
||
|
Item 5.
|
Market for Registrant’s Common Equity, Related Stockholder Matters and Issuer Purchases of
Equity Securities
|
|
|
Item 6.
|
Selected Financial Data
|
|
|
Item 7.
|
Management’s Discussion and Analysis of Financial Condition and Results of Operations
|
|
|
Item 7A.
|
Quantitative and Qualitative Disclosures about Market Risk
|
|
|
Item 8.
|
Financial Statements and Supplementary Data
|
|
|
Item 9.
|
Changes in and Disagreements with Accountants on Accounting and Financial Disclosure
|
|
|
Item 9A.
|
Controls and Procedures
|
|
|
Item 9B.
|
Other Information
|
|
|
PART III
|
||
|
Item 10.
|
Directors, Executive Officers and Corporate Governance
|
|
|
Item 11.
|
Executive Compensation
|
|
|
Item 12.
|
Security Ownership of Certain Beneficial Owners and Management and Related Stockholder Matters
|
|
|
Item 13.
|
Certain Relationships and Related Transactions, and Director Independence
|
|
|
Item 14.
|
Principal Accounting Fees and Services
|
|
|
PART IV
|
||
|
Item 15.
|
Exhibits, Financial Statement Schedules
|
|
|
Item 16.
|
Form 10-K Summary
|
|
|
Index to Consolidated Financial Statements and Reports
|
||
1
Aspen Holdings and Subsidiaries
Unless the context otherwise requires, references in this Annual Report on Form 10-K (this “report”) to the “Company,” the “Aspen Group,” “we,” “us” or “our” refer to Aspen Insurance Holdings Limited (“Aspen Holdings”) or Aspen Holdings and its subsidiaries, which consist of: Aspen Insurance UK Limited (“Aspen U.K.”), Aspen (UK) Holdings Limited (“Aspen U.K. Holdings”), Aspen (US) Holdings Limited (“Aspen U.S. Holdings”), Aspen Insurance UK Services Limited (“Aspen U.K. Services”), AIUK Trustees Limited (“AIUK Trustees”), Aspen Bermuda Limited (“Aspen Bermuda”), Aspen Underwriting Limited (“AUL”, corporate member of Lloyd’s Syndicate 4711, “Syndicate 4711”), Aspen European Holdings Limited (“Aspen European”), Aspen Managing Agency Limited (“AMAL”), Aspen Singapore Pte. Ltd. (“Aspen Singapore”), Aspen U.S. Holdings, Inc. (“Aspen U.S. Holdings”), Aspen Specialty Insurance Company (“Aspen Specialty”), Aspen Specialty Insurance Management, Inc. (“Aspen Management”), Aspen Re America, Inc. (“Aspen Re America”), Aspen Insurance U.S. Services Inc. (“Aspen U.S. Services”), Aspen Specialty Insurance Solutions LLC (“ASIS”), Acorn Limited (“Acorn”), Blue Waters Insurers, Corp. (“Blue Waters”), APJ Continuation Limited (“APJ”), APJ Asset Protection Jersey Limited (“APJ Jersey”), Aspen UK Syndicate Services Limited (“AUKSSL”, formerly APJ Services Limited), Aspen Risk Management Limited (“ARML”), Aspen American Insurance Company (“AAIC”), Aspen Recoveries Limited (“Aspen Recoveries”), Aspen Capital Management, Ltd (“ACM”), Silverton Re Ltd. (“Silverton”), Aspen Capital Advisors Inc. (“Aspen Advisors”), Peregrine Reinsurance Ltd (“Peregrine”) and Aspen Cat Fund Limited (“ACF”), Aspen Insurance Ireland Holdings Limited (“Aspen Ireland Holdings”), Aspen Insurance Ireland Designated Activity Company (“Aspen Ireland DAC”) and any other direct or indirect subsidiary collectively, as the context requires. Aspen U.K., Aspen Bermuda, Aspen Specialty, AAIC and AUL (as corporate member of Syndicate 4711 which is managed by AMAL) are our principal operating subsidiaries and each referred to herein as an “Operating Subsidiary” and collectively referred to as the “Operating Subsidiaries.” References in this report to “U.S. Dollars,” “dollars,” “$” or “¢” are to the lawful currency of the United States of America, references to “British Pounds,” “pounds,” “GBP” or “£” are to the lawful currency of the United Kingdom and references to “euros” or “€” are to the lawful currency adopted by certain member states of the European Union (the “E.U.”), unless the context otherwise requires.
Cautionary Statement Regarding Forward-Looking Statements
This report contains forward-looking statements within the meaning of Section 27A of the Securities Act of 1933, as amended (the “Securities Act”), and Section 21E of the Securities Exchange Act of 1934, as amended (the “Exchange Act”), that are made pursuant to the “safe harbor” provisions of The Private Securities Litigation Reform Act of 1995. Forward-looking statements include all statements that do not relate solely to historical or current facts. In particular, statements that use the words such as “believe,” “anticipate,” “expect,” “assume,” “objective,” “target,” “plan,” “estimate,” “project,” “seek,” “will,” “may,” “aim,” “likely,” “continue,” “intend,” “guidance,” “outlook,” “trends,” “future,” “could,” “would,” “should,” “target,” “predict,” “potential,” “on track” or their negatives or variations and similar terminology and words of similar import generally involve forward-looking statements.
All forward-looking statements rely on a number of assumptions, estimates and data concerning future results and events that are subject to a number of risks, uncertainties, assumptions and other factors, many of which are outside our control that could cause actual results to differ materially from such forward-looking statements. Accordingly, there are important factors that could cause our actual results to differ materially from those anticipated in the forward-looking statements. We believe that these factors include, but are not limited to, those set forth in Item 1A under “Risk Factors” as those factors may be updated from time to time in our periodic filings with the United States Securities and Exchange Commission (the “SEC”) which are accessible on the SEC’s website at http://www.sec.gov.
The inclusion of forward-looking statements in this report should not be considered as a representation by us that current plans or expectations will be achieved. Forward-looking statements speak only as of the date on which they are made and we undertake no obligation to publicly update or revise any forward-looking statement, whether as a result of new information, future developments or otherwise, except as required by law.
2
PART I
|
Item 1.
|
Business
|
General
Aspen Insurance Holdings Limited (“Aspen Holdings”) was incorporated on May 23, 2002 as a holding company headquartered in Bermuda. We underwrite specialty insurance and reinsurance on a global basis through our Operating Subsidiaries based in Bermuda, the United States and the United Kingdom: Aspen U.K. and AUL (corporate member of Syndicate 4711 at Lloyd’s of London and managed by AMAL) (United Kingdom), Aspen Bermuda (Bermuda) and Aspen Specialty and AAIC (United States). We also have branches in Australia, Canada, Ireland, Singapore, Switzerland and the United Arab Emirates. Please see Exhibit 21.1 of this report for a complete list of our subsidiaries and our corporate chart.
Our goal is to generate superior value and long-term return on capital for our shareholders while ensuring that we have sufficient capital and liquidity to meet our obligations. We believe our global underwriting talent and product capabilities, coupled with our focus on expense discipline and risk management, position us to achieve this goal.
Business Combination
On August 27, 2018, the Company entered into a definitive Agreement and Plan of Merger (the “Merger Agreement”) with Highlands Holdings, Ltd., a Bermuda exempted company (“Highlands”), and Highlands Merger Sub, Ltd., a Bermuda exempted company and wholly-owned subsidiary of Highlands (“Merger Sub”). Under the Merger Agreement, subject to the satisfaction or waiver of certain conditions set forth therein, and in the related statutory merger agreement, the Company will merge with and into Merger Sub in accordance with the Bermuda Companies Act (the “Merger”), with the Company surviving the Merger as a wholly-owned subsidiary of Highlands. Highlands and Merger Sub are affiliates of certain investment funds managed by affiliates of Apollo Global Management, LLC, a leading global alternative investment manager. As previously announced, Christopher O’Kane will step down from his position as Group Chief Executive Officer and director of the Board of Directors of the Company (the “Board”) on or shortly after the completion of the Merger and, subject to and contingent upon the Merger, will be replaced by Mark Cloutier.
Pursuant to the Merger Agreement, at the effective time of the Merger, each ordinary share of the Company issued and outstanding immediately prior to such time (other than ordinary shares owned by Aspen as treasury shares, owned by any subsidiary of the Company or owned by Highlands, Merger Sub or any of their respective subsidiaries, which will be canceled as set forth in the Merger Agreement) will be converted into the right to receive
$42.75
in cash, without interest and less any required withholding taxes. At the effective time of the Merger, each of the Company’s issued and outstanding
5.95%
Fixed-to-Floating Rate Perpetual Non-Cumulative Preference Shares and
5.625%
Perpetual Non-Cumulative Preference Shares (collectively, the “Preference Shares”) will remain issued and outstanding. The Merger Agreement restricts the Company from declaring or paying any dividends other than the quarterly dividends on Aspen’s ordinary shares that were previously declared and publicly announced prior to the date of the Merger Agreement and periodic cash dividends on the Preference Shares in accordance with the terms of the applicable certificate of designation.
All required regulatory approvals in connection with the Merger have been obtained and we anticipate that the Merger will be completed shortly. The Merger is subject to the satisfaction or waiver of a number of conditions, including, among others, the maintenance of certain financial strength ratings of the Operating Subsidiaries. The Merger Agreement also contains certain termination rights, including Highlands’ right to terminate if we suffered aggregate net losses exceeding
$350 million
resulting from certain catastrophic events occurring between July 1, 2018 and January 31, 2019. We do not believe that the net catastrophe losses arising from such catastrophic events during the specified period exceeded
$350 million
. For further details on the potential risks related to the Merger, refer to Part I, Item 1A, “Risk Factors — Risks Relating to the Merger.”
For further details on the Merger, refer to Part II, Item 7, “Management’s Discussion and Analysis of Financial Condition and Results of Operations — Aspen’s Year In Review” and Note 19 of our consolidated financial statements, “Commitments and Contingencies — Contingent Liabilities.”
Reportable Segments
We manage our insurance and reinsurance businesses as two distinct business segments, Aspen Insurance and Aspen Reinsurance (“Aspen Re”), to enhance and better serve our global customer base. Financial data relating to our two business segments is included in Item 7, “Management’s Discussion and Analysis of Financial Condition and Results of Operations” and in Note 5 of our consolidated financial statements, “Segment Reporting.”
Aspen Reinsurance
. Aspen Re consists of (i) property catastrophe reinsurance, (ii) other property reinsurance, (iii) casualty reinsurance, and (iv) specialty reinsurance. Aspen Capital Markets forms part of the property catastrophe reinsurance line of business as it focuses primarily on property catastrophe business through the use of alternative capital. Aspen Re is led by Emil Issavi, President and Chief Underwriting Officer of Aspen Re.
3
In Aspen Re, property reinsurance business is assumed by Aspen Bermuda, Aspen U.K. and AUL (which is the sole corporate member of Syndicate 4711 at Lloyd’s of London (“Lloyd’s”) managed by AMAL) and written by teams located in Bermuda, Singapore, Switzerland, the United Kingdom, the United States, the United Arab Emirates and Australia. The property reinsurance business written in the United States is written exclusively by Aspen Re America as reinsurance intermediary.
Casualty reinsurance is mainly assumed by Aspen U.K. and AUL and written by teams located in Singapore, Switzerland, the United Kingdom, the United States, the United Arab Emirates and Australia. A small number of casualty reinsurance contracts are written by Aspen Bermuda. The business written in the United States is produced by Aspen Re America.
Specialty reinsurance is assumed by Aspen Bermuda, Aspen U.K., AUL, and AAIC and written by teams located in Ireland, Singapore, Switzerland, the United Kingdom, the United States, the United Arab Emirates and Australia. A small number of specialty reinsurance contracts are written by Aspen Bermuda. The reinsurance business written in the United States is produced by Aspen Re America and is written by AAIC.
Aspen Re continued its participation in the alternative reinsurance market through Aspen Capital Markets. Aspen Capital Markets focuses on developing alternative reinsurance structures to leverage Aspen Re’s existing underwriting franchise, increase its operational flexibility in the capital markets and provide investors direct access to its underwriting expertise.
Aspen Insurance
. Our insurance segment consists of (i) property and casualty insurance, (ii) marine, aviation and energy insurance, (iii) and financial and professional lines insurance. The insurance segment is led by David Cohen, President and Chief Underwriting Officer of Aspen Insurance.
In our insurance segment, property and casualty insurance is written primarily in the London Market by Aspen U.K. and in the United States by AAIC and Aspen Specialty (on an admitted and excess and surplus lines basis, respectively). Our marine, aviation and energy insurance and financial and professional lines insurance are written mainly by Aspen U.K. and AUL with most of the same lines also written in the United States by AAIC and Aspen Specialty. We also write property, casualty and financial and professional lines business through Aspen Bermuda and marine, energy, financial and professional lines business through Aspen Singapore.
4
Business Segments
We are organized into two business segments, namely Aspen Re and Aspen Insurance. We have determined our reportable segments, Aspen Re and Aspen Insurance, by taking into account the manner in which management makes operating decisions and assesses operating performance. Profit or loss for each of the business segments is measured by underwriting profit or loss. Underwriting profit is the excess of net earned premiums over the sum of losses and loss expenses, amortization of deferred policy acquisition costs and general and administrative expenses. Underwriting profit or loss provides a basis for management to evaluate the segment’s underwriting performance.
We provide additional disclosures for corporate and other (non-operating) income and expenses. Corporate and other income and expenses include net investment income, net realized and unrealized investment gains or losses, expenses associated with managing the Aspen Group, certain strategic and non-recurring costs, changes in fair value of derivatives or loan notes issued by variable interest entities, interest expenses, net realized and unrealized foreign exchange gains or losses, and income taxes, none of which are allocated to the business segments. Corporate expenses are not allocated to our business segments as they typically do not fluctuate with the levels of premiums written and are not directly related to our business segment operations. We do not allocate our assets by business segment as we evaluate underwriting results of each business segment separately from the results of our investment portfolio.
The table below sets forth the gross written premiums by business segment for the
twelve months ended
December 31, 2018
,
2017
and
2016
:
|
|
Twelve Months Ended December 31, 2018
|
Twelve Months Ended December 31, 2017
|
Twelve Months Ended December 31, 2016
|
|||||||||||||||||||
|
Business Segment
|
Gross
Written Premiums
|
% of Total
|
Gross
Written Premiums
|
% of Total
|
Gross
Written Premiums
|
% of Total
|
||||||||||||||||
|
|
($ in millions, except for percentages)
|
|||||||||||||||||||||
|
Reinsurance
|
$
|
1,495.7
|
|
43.4
|
%
|
$
|
1,548.5
|
|
46.1
|
%
|
$
|
1,413.2
|
|
44.9
|
%
|
|||||||
|
Insurance
|
1,951.2
|
|
56.6
|
|
1,812.4
|
|
53.9
|
|
1,733.8
|
|
55.1
|
|
||||||||||
|
Total
|
$
|
3,446.9
|
|
100.0
|
%
|
$
|
3,360.9
|
|
100.0
|
%
|
$
|
3,147.0
|
|
100.0
|
%
|
|||||||
For a review of our results by business segment, refer to Part II, Item 7, “Management’s Discussion and Analysis of Financial Condition and Results of Operations” and Note 5 of our consolidated financial statements, “Segment Reporting.”
Reinsurance
Aspen Re consists of property catastrophe reinsurance, other property reinsurance, casualty reinsurance, and specialty reinsurance. In addition, Aspen Capital Markets forms part of property catastrophe reinsurance as it focuses primarily on property catastrophe business through the use of alternative capital. Aspen Capital Markets leverages the Company’s underwriting and analytical expertise and earns management and performance fees from the Company and other third party investors primarily through the management of ILS funds.
5
The reinsurance business we write can be analyzed by geographic region, reflecting the location of the reinsured risks, as set forth in the table below for the
twelve months ended
December 31, 2018
,
2017
and
2016
:
|
|
Twelve Months Ended December 31, 2018
|
Twelve Months Ended December 31, 2017
|
Twelve Months Ended December 31, 2016
|
|||||||||||||||||||
|
Reinsurance
|
Gross
Written Premiums
|
% of Total
|
Gross
Written Premiums |
% of Total
|
Gross
Written
Premiums
|
% of Total
|
||||||||||||||||
|
|
($ in millions, except for percentages)
|
|||||||||||||||||||||
|
Australia/Asia
|
$
|
141.3
|
|
9.4
|
%
|
$
|
139.7
|
|
9.0
|
%
|
$
|
117.3
|
|
8.3
|
%
|
|||||||
|
Caribbean
|
3.7
|
|
0.2
|
|
10.1
|
|
0.7
|
|
10.0
|
|
0.7
|
|
||||||||||
|
Europe (excluding U.K.)
|
75.0
|
|
5.0
|
|
82.0
|
|
5.3
|
|
99.1
|
|
7.0
|
|
||||||||||
|
United Kingdom
|
9.2
|
|
0.6
|
|
14.2
|
|
0.9
|
|
14.1
|
|
1.0
|
|
||||||||||
|
United States & Canada
(1)
|
741.2
|
|
49.7
|
|
774.2
|
|
50.0
|
|
698.4
|
|
49.4
|
|
||||||||||
|
Worldwide excluding United States
(2)
|
33.9
|
|
2.3
|
|
35.7
|
|
2.3
|
|
36.5
|
|
2.6
|
|
||||||||||
|
Worldwide including United States
(3)
|
387.8
|
|
25.9
|
|
392.9
|
|
25.4
|
|
357.6
|
|
25.3
|
|
||||||||||
|
Others
|
103.6
|
|
6.9
|
|
99.7
|
|
6.4
|
|
80.2
|
|
5.7
|
|
||||||||||
|
Total
|
$
|
1,495.7
|
|
100.0
|
%
|
$
|
1,548.5
|
|
100.0
|
%
|
$
|
1,413.2
|
|
100.0
|
%
|
|||||||
_______________
|
(1)
|
“United States and Canada” consists of individual policies that insure risks specifically in the United States and/or Canada, but not elsewhere. It also includes gross written premium of
$259.7 million
related to CGB Diversified Services, Inc. (“CGB DS”) and
$33.1 million
related to AG Logic Holdings, LLC and its affiliates (“AgriLogic”) which we purchased in January 2016 and sold in December 2017 as part of our strategic partnership with CGB DS (
2017
—
$269.7 million
,
2016
—
$178.9 million
AgriLogic). For more information on CGB DS, refer to “— Specialty Reinsurance” below.
|
|
(2)
|
“Worldwide excluding the United States” consists of individual policies that insure risks wherever they may be across the world but specifically excludes the United States.
|
|
(3)
|
“Worldwide including the United States” consists of individual policies that insure risks wherever they may be across the world but specifically includes the United States.
|
Aspen Re’s gross written premiums by principal line of business were as follows for the
twelve months ended
December 31, 2018
,
2017
and
2016
:
|
|
Twelve Months Ended December 31, 2018
|
Twelve Months Ended December 31, 2017
|
Twelve Months Ended December 31, 2016
|
|||||||||||||||||||
|
Reinsurance
|
Gross
Written Premiums
|
% of Total
|
Gross
Written Premiums |
% of Total
|
Gross
Written
Premiums
|
% of Total
|
||||||||||||||||
|
|
($ in millions, except for percentages)
|
|||||||||||||||||||||
|
Property catastrophe reinsurance
|
$
|
262.8
|
|
17.6
|
%
|
$
|
279.3
|
|
18.0
|
%
|
$
|
273.0
|
|
19.3
|
%
|
|||||||
|
Other property reinsurance
|
346.0
|
|
23.1
|
|
350.3
|
|
22.6
|
|
328.2
|
|
23.2
|
|
||||||||||
|
Casualty reinsurance
|
328.1
|
|
21.9
|
|
319.0
|
|
20.6
|
|
320.6
|
|
22.7
|
|
||||||||||
|
Specialty reinsurance
(1)
|
558.8
|
|
37.4
|
|
599.9
|
|
38.8
|
|
491.4
|
|
34.8
|
|
||||||||||
|
Total
|
$
|
1,495.7
|
|
100.0
|
%
|
$
|
1,548.5
|
|
100.0
|
%
|
$
|
1,413.2
|
|
100.0
|
%
|
|||||||
`1
_______________
|
(1)
|
Includes gross written premium of
$259.7 million
related to CGB DS and
$33.1 million
related to AgriLogic (
2017
—
$269.7 million
,
2016
—
$178.9 million
related to AgriLogic).
|
Property Catastrophe Reinsurance
:
Property catastrophe reinsurance is generally written on a treaty excess of loss basis where we provide protection to an insurer for an agreed portion of the total losses from a single event in excess of a specified loss amount. In the event of a loss, most contracts provide for coverage of a second occurrence following the payment of a premium to reinstate the coverage under the contract, which is referred to as a reinstatement premium. The coverage provided under excess of loss reinsurance contracts may be on a worldwide basis or limited in scope to selected regions or geographical areas.
Aspen Capital Markets provides quota share support for Aspen Re’s global property catastrophe excess of loss reinsurance business. In 2018, quota share support for Aspen Re was provided by separate cells of Peregrine. For more information on Peregrine, refer to Note 7 of our consolidated financial statements, “Variable Interest Entities.”
6
Other Property Reinsurance
:
Other property reinsurance includes property risks written on excess of loss and proportional treaties, facultative or single risk reinsurance. Risk excess of loss reinsurance provides coverage to a reinsured where it experiences a loss in excess of its retention level on a single “risk” basis. A “risk” in this context might mean the insurance coverage on one building or a group of buildings for fire or explosion or the insurance coverage under a single policy which the reinsured treats as a single risk. This line of business is generally less exposed to accumulations of exposures and losses but can still be impacted by catastrophes, such as earthquakes and hurricanes. Proportional treaty reinsurance provides proportional coverage to the reinsured, meaning that, subject to event limits where applicable and ceding commissions, we pay the same share of the covered original losses as we receive in premiums charged for the covered risks. Proportional contracts typically involve close client relationships which often include regular audits of the cedants’ data.
Casualty Reinsurance
:
Casualty reinsurance is written on an excess of loss, proportional and facultative basis and consists of U.S. treaty, international treaty and casualty facultative reinsurance. Our U.S. treaty and facultative business comprises exposures to workers’ compensation (including catastrophe), medical malpractice, general liability, auto liability, professional liability and excess liability including umbrella liability. Our international treaty business reinsures exposures mainly with respect to general liability, auto liability, professional liability, workers’ compensation and excess liability.
Specialty Reinsurance
:
Specialty reinsurance is written on an excess of loss and proportional basis and consists of credit and surety reinsurance, agriculture reinsurance, mortgage reinsurance and insurance, marine, aviation, terrorism, engineering, cyber and other specialty line
s
. Our credit and surety reinsurance business consists of trade credit, surety (mainly European, Japanese and Latin American risks) and mortgage reinsurance and insurance and political risks. Our specialty agricultural reinsurance business covers crop and multi-peril business. Other specialty lines include reinsurance treaties and some insurance policies covering policyholders’ interests in marine, energy, aviation liability, space, contingency, terrorism, engineering, nuclear and personal accident. In addition, specialty reinsurance included admitted and direct U.S. crop insurance. U.S. crop insurance business previously written via AgriLogic is written on a reinsurance basis through our strategic partnership with CGB DS via Crop Re Services LLC (“Crop Re”), a Delaware limited liability company responsible for directing the placement of reinsurance on behalf of CGB DS and CGB Insurance Company (“CGBIC”), an Indiana insurance company affiliate of CGB DS and an RMA licensed crop insurer. For more information on Crop Re, see Note 6 of our consolidated financial statements, “Investments.” We have also increased our capacity through other collateralized reinsurance arrangements via Aspen Capital Markets.
A high percentage of the property catastrophe reinsurance contracts we write exclude or limit coverage for losses arising from the peril of terrorism. Within the U.S., our other property reinsurance contracts generally include limited coverage for acts that are certified as “acts of terrorism” by the U.S. Treasury Department under the Terrorism Risk Insurance Act (“TRIA”), the Terrorism Risk Insurance Extension Act of 2005 (“TRIEA”), the Terrorism Risk Insurance Program Reauthorization Act of 2007 (“TRIPRA”), which expired on December 31, 2014, and now the Terrorism Risk Insurance Program Reauthorization Act of 2015 (the “2015 TRIA Reauthorization”). We have written a limited number of property reinsurance contracts, both on a pro rata and risk excess basis, specifically covering the peril of terrorism. These contracts typically exclude coverage protecting against nuclear, biological, chemical or radiological attack, though we have written a small number of contracts that do not exclude such attacks, the coverage of which may be applicable to non-terrorism events.
7
Insurance
Our insurance segment consists of property and casualty insurance, marine, aviation and energy insurance and financial and professional lines insurance. The insurance business we write can be analyzed by geographic region, reflecting the location of the insured risk, as set forth in the table below for the
twelve months ended
December 31, 2018
,
2017
and
2016
:
|
|
Twelve Months Ended December 31, 2018
|
Twelve Months Ended December 31, 2017
|
Twelve Months Ended December 31, 2016
|
|||||||||||||||||||
|
Insurance
|
Gross
Written Premiums
|
% of Total
|
Gross
Written Premiums |
% of Total
|
Gross
Written
Premiums
|
% of Total
|
||||||||||||||||
|
|
($ in millions, except for percentages)
|
|||||||||||||||||||||
|
Australia/Asia
|
$
|
34.6
|
|
1.8
|
%
|
$
|
27.6
|
|
1.5
|
%
|
$
|
23.2
|
|
1.3
|
%
|
|||||||
|
Caribbean
|
4.0
|
|
0.2
|
|
7.5
|
|
0.4
|
|
4.3
|
|
0.2
|
|
||||||||||
|
Europe (excluding U.K.)
|
17.6
|
|
0.9
|
|
12.5
|
|
0.7
|
|
10.6
|
|
0.6
|
|
||||||||||
|
United Kingdom
|
280.9
|
|
14.4
|
|
244.1
|
|
13.5
|
|
217.3
|
|
12.5
|
|
||||||||||
|
United States & Canada
(1)
|
1,134.7
|
|
58.1
|
|
955.1
|
|
52.7
|
|
898.6
|
|
51.8
|
|
||||||||||
|
Worldwide excluding United States
(2)
|
36.2
|
|
1.9
|
|
52.4
|
|
2.9
|
|
54.2
|
|
3.2
|
|
||||||||||
|
Worldwide including United States
(3)
|
388.0
|
|
19.9
|
|
475.7
|
|
26.2
|
|
479.6
|
|
27.7
|
|
||||||||||
|
Others
|
55.2
|
|
2.8
|
|
37.5
|
|
2.1
|
|
46.0
|
|
2.7
|
|
||||||||||
|
Total
|
$
|
1,951.2
|
|
100.0
|
%
|
$
|
1,812.4
|
|
100.0
|
%
|
$
|
1,733.8
|
|
100.0
|
%
|
|||||||
_______________
|
(1)
|
“United States and Canada” consists of individual policies that insure risks specifically in the United States and/or Canada, but not elsewhere.
|
|
(2)
|
“Worldwide excluding the United States” consists of individual policies that insure risks wherever they may be across the world but specifically excludes the United States.
|
|
(3)
|
“Worldwide including the United States” consists of individual policies that insure risks wherever they may be across the world but specifically includes the United States.
|
Our gross written premiums by our principal line of business within our insurance segment were as follows for the
twelve months ended
December 31, 2018
,
2017
and
2016
:
|
|
Twelve Months Ended December 31, 2018
|
Twelve Months Ended December 31, 2017
|
Twelve Months Ended December 31, 2016
|
|||||||||||||||||||
|
Insurance
|
Gross
Written Premiums
|
% of Total
|
Gross
Written Premiums |
% of Total
|
Gross
Written
Premiums
|
% of Total
|
||||||||||||||||
|
|
($ in millions, except for percentages)
|
|||||||||||||||||||||
|
Property and casualty insurance
|
$
|
903.9
|
|
46.3
|
%
|
$
|
856.9
|
|
47.2
|
%
|
$
|
858.2
|
|
49.5
|
%
|
|||||||
|
Marine, aviation and energy insurance
|
368.4
|
|
18.9
|
|
385.3
|
|
21.3
|
|
396.3
|
|
22.9
|
|
||||||||||
|
Financial and professional lines insurance
|
678.9
|
|
34.8
|
|
570.2
|
|
31.5
|
|
479.3
|
|
27.6
|
|
||||||||||
|
Total
|
$
|
1,951.2
|
|
100.0
|
%
|
$
|
1,812.4
|
|
100.0
|
%
|
$
|
1,733.8
|
|
100.0
|
%
|
|||||||
Property and Casualty Insurance
:
The property and casualty insurance line consists of U.S. and U.K. commercial property, commercial liability, U.S. primary casualty, excess casualty, environmental liability and railroad liability, written on a primary, excess, quota share, program and facultative basis.
U.S. and U.K. Commercial Property:
Property insurance provides physical damage and business interruption coverage for losses arising from weather, fire, theft and other causes.
The U.S. commercial property team covers mercantile, manufacturing, municipal and commercial real estate business. The U.K. commercial team’s client base is predominantly U.K. institutional property owners, small and middle market corporates and public sector clients.
Commercial Liability:
Commercial liability is primarily written in the United Kingdom and provides employers’ liability coverage, products and public liability coverage for insureds domiciled in the United Kingdom and Ireland. The U.K. regional team also covers directors’ and officers’ (“D&O”) and professional indemnity, predominantly to small and medium corporates. On August 2, 2018, we announced our decision to cease underwriting international professional indemnity on the Lloyd’s platform.
8
U.S. Primary Casualty:
The U.S. primary casualty account consists primarily of lines written within the primary insurance sectors. We are focused on delivering expertise to brokers and customers in hospitality, real estate, construction and products liability.
Excess Casualty:
The excess casualty line comprises medium and large, sophisticated and risk-managed insureds worldwide and covers broad-based risks at lead/high excess attachment points, including general liability, commercial and residential construction liability, life science, railroads, trucking, product and public liability and associated types of cover found in general liability policies in the global insurance market, written from the United Kingdom, the United States and Bermuda.
Environmental Liability:
The environmental account primarily provides contractors’ pollution liability and pollution legal liability across industry segments that have environmental regulatory drivers and contractual requirements for coverage, including real estate and public entities, contractors and engineers, energy contractors and environmental contractors and consultants. The business is written in both the primary and excess insurance markets in the United States, Canada and the United Kingdom.
Railroad Liability
: Our railroad liability business was established in 2016 and consists of primary and excess liability business for freight, commuter and excursion railroads. It also provides general liability coverage to the railroad support industry (contractors, repair shops and products manufacturers) as well as contingent liability for railcar fleet owners/managers and railroad protective liability in the United States.
On a significant portion of our property and casualty insurance contracts we are obligated to offer terrorism coverage under TRIPRA, and now the 2015 TRIA Reauthorization. Wherever possible, we exclude coverage protection against nuclear, biological, chemical or radiological (“NBCR”) attacks. However, certain U.S. states (notably New York and Florida) prohibit admitted market companies, such as AAIC, from fully excluding such perils, resulting in some level of exposures to NBCR as well as fire following such events. In addition, we would expect to benefit from the protection of 2015 TRIA Reauthorization and the over-arching $100 billion industry loss cap (subject to the relevant deductible and co-retention).
Marine, Aviation and Energy Insurance
:
Our marine, aviation and energy insurance line consists of marine and energy liability, onshore energy physical damage, offshore energy physical damage, marine hull, specie and inland and ocean marine, written on a primary, excess, quota share, program and facultative basis.
Marine and Energy Liability:
The marine and energy liability business based in the U.K. includes marine liability cover mainly related to the liabilities of ship-owners and port operators, including reinsurance of Protection and Indemnity Clubs (“P&I Clubs”). It also provides liability cover globally (including the U.S.) for companies in the oil and gas sector, both onshore and offshore and in the power generation sector. Our liability for U.S. commercial construction is now being written under our global excess casualty line and we are no longer writing new construction liability in this class.
Onshore Energy Physical Damage:
Our marine, energy and construction property unit underwrites a variety of worldwide onshore energy and construction sector classes of business with a focus on property covers.
Offshore
Energy Physical Damage:
Offshore energy physical damage provides insurance cover against physical damage losses in addition to operators’ extra expenses for companies operating in the oil and gas exploration and production sector.
Marine Hull:
The marine hull team insures physical damage to ships (including war and associated perils) and related marine assets. Effective August 2018, we ceased underwriting marine hull on the Lloyd’s platform although we continue to write hull-related risks in our U.S. ocean marine business.
Specie:
The specie business line focuses on the insurance of high value property items on an all risks basis, including fine art, general and bank related specie, jewelers’ block and armored car.
Inland and Ocean Marine:
The inland and ocean marine team writes business principally covering builders’ construction risk, contractors’ equipment, and global transportation exposures such as marine cargo and hull, inland transit, warehousing and war, in addition to exhibition, fine arts and museums insurance. The book also consists of our Managing General Agent,
Blue Waters Insurers, Corp., which consists of inland, ocean marine and cargo business in Puerto Rico.
Aviation:
In August 2018, we decided to no longer underwrite aviation business. Prior to August 2018, the aviation team wrote physical damage insurance on hulls and spares (including war and associated perils), aviation hull deductible cover and comprehensive legal liability for airlines, smaller operators of airline equipment, airports and associated business and non-critical component part manufacturers.
Financial and Professional Lines Insurance
:
Our financial and professional lines consists of financial and corporate risks, professional liability, management liability, credit and political risks, crisis management, accident and health, surety risks, and technology liability (cyber risks), written on a primary, excess, quota share, program and facultative basis.
9
Financial and Corporate Risks:
Our financial institutions business is written on both a primary and excess of loss basis and consists of professional liability, crime insurance and D&O cover, with the largest exposure comprising risks headquartered in the United Kingdom, followed by Australia, the United States and Canada. We cover financial institutions including commercial and investment banks, asset managers, insurance companies, stockbrokers and insureds with hybrid business models. This account also includes a book of D&O insurance for commercial insureds located outside of the United States and a worldwide book of representations and warranties and tax indemnity business.
Professional Liability:
Our professional liability business is written out of the United States (including errors and omissions (“E&O”)) and Bermuda and is written on both a primary and excess of loss basis. We insure a wide range of professions including lawyers, accountants, architects, engineers, doctors and medical technicians. This account also includes a portfolio of technology liability and data protection insurance. The data protection insurance covers firms for first party costs and third party liabilities associated with their breach of contractual or statutory data protection obligations. Prior to August 2018, we previously wrote professional liability on the Lloyd’s platform focusing on risks in the United Kingdom with some European, Australian and Canadian business.
Management Liability:
Our management liability business is written out of the United States, the United Kingdom and Bermuda. We insure a diverse group of commercial and financial institutions predominantly on an excess basis. Our products include D&O liability, fiduciary liability, employment practices liability, fidelity insurance and blended liability programs including E&O liability. The focus of the account is predominantly on risks headquartered in the U.S. or risks with a material U.S. exposure.
Credit and Political Risks:
The credit and political risks team writes business covering the credit and contract frustration risks on a variety of trade and non-trade related transactions, as well as political risks (including multi-year war on land cover). We provide credit and political risks cover worldwide but with concentrations in a number of countries, such as China, Brazil, Russia (where we significantly reduced our exposures from 2014), the Netherlands and the United States.
Crisis Management:
The Crisis Management team writes insurance designed to protect individuals and corporations operating in high-risk areas around the world, including covering the shipping industry’s exposure to acts of piracy. It also writes terrorism and political violence insurance, providing coverage for damage to property (largely fixed assets such as buildings) resulting from acts of terrorism, strikes, riots, civil commotion or political violence, in addition to product recall business, a new product we began to write in 2016. This book is written on a global basis, although capacity is selectively deployed.
Accident and Health:
The global accident and health team focuses on insurance and reinsurance products which help protect individuals, groups and companies from the consequences of accidental death or disability whether resulting from accident or sickness. This may include single or multi-person losses as well as major catastrophic events such as air crashes, earthquakes or terrorist attacks. Coverage written includes whole account treaty and facultative reinsurance protection for insurance companies.
Surety Risks:
Our surety team writes commercial surety risks, admiralty bonds and similar maritime undertakings including, but not limited to, federal and public official bonds, license and permits and fiduciary and miscellaneous bonds, focused on Fortune 1000 companies and large, privately owned companies in the United States.
Technology Liability (Cyber Risks)
: Technology liability is written globally and provides coverage for technology, media and telecommunications firms offering protection for damages and legal defense expenses associated with financial loss claims from third parties and various forms of intellectual property breaches. We also incorporate data protection indemnity insurance against costs and liabilities that may arise when a company breaches its data protection obligations.
Underwriting and Reinsurance Purchasing
Our objective is to create a diversified portfolio of insurance and reinsurance risks, diversified across lines of business, products, geographic areas of coverage, cedants and sources. The acceptance of appropriately priced risk is the core of our business. Underwriting requires judgment, based on important assumptions about matters that are inherently unpredictable and beyond our control, and for which historical experience and probability analysis may not provide sufficient guidance. We view underwriting quality and risk management as critical to our success.
Underwriting.
Our underwriting activities are managed in two product areas: reinsurance and insurance. For a discussion of our business and business segments, refer to “Business — General” and “Business — Business Segments” above.
Our Group Chief Executive Officer is supported by our Group Director of Underwriting who assists in the management of the underwriting process by developing our underwriting control framework and acting as an independent reviewer of underwriting activity across our businesses.
We underwrite according to the following principles:
|
•
|
operate within agreed boundaries as defined by the Aspen Underwriting Principles for the relevant class of business;
|
10
|
•
|
operate within prescribed maximum underwriting authority limits, which we delegate in accordance with an understanding of each individual’s capabilities, tailored to the classes of business written by the particular underwriter;
|
|
•
|
evaluate the underlying data provided by clients and adjust such data where we believe it does not adequately reflect the underlying exposure;
|
|
•
|
price each submission based on our experience in the class of business, and where appropriate, by deploying one or more actuarial models either developed internally or licensed from third-party providers;
|
|
•
|
maintain a peer review process to sustain high standards of underwriting discipline and consistency and a sampling methodology for simpler insurance risks;
|
|
•
|
more complex risks may involve peer review by several underwriters and input from catastrophe risk management specialists, our team of actuaries and senior management; and
|
|
•
|
risks outside of agreed underwriting authority limits are referred to the Group Chief Executive Officer and/or to the appropriate entity board as exceptions for approval before we accept the risks.
|
Reinsurance Purchasing.
We purchase reinsurance and retrocession to mitigate and diversify our risk exposure to a level consistent with our risk appetite and to increase our insurance and reinsurance underwriting capacity. These agreements provide for recovery of a portion of our losses and loss adjustment expenses from our reinsurers. The amount and type of reinsurance that we purchase varies from year to year and is dependent on a variety of factors, including, but not limited to, the cost of a particular reinsurance contract and the nature of our gross exposures assumed, with the aim of securing cost-effective protection. We have a centralized ceded reinsurance department which coordinates the placement of all of our treaty reinsurance placements.
We have reinsurance covers in place for the majority of our insurance classes of business on an excess-of-loss basis and/or proportional treaty basis. The excess of loss covers provide protection in various layers and excess of varying attachment points according to the scope of cover provided. In 2018, we increased proportional reinsurance protection compared to our previous coverage in 2017. In 2019 we expect to purchase less proportional reinsurance protection and more excess-of-loss protection compared to 2018.
With respect to natural perils coverage, we buy protections that cover both our insurance and reinsurance lines of business through a variety of products, including, but not limited to, excess of loss reinsurance, facultative reinsurance, aggregate covers, whole account covers and collaterized products which can be on either an indemnity or an index linked basis. For example, we may purchase industry loss warranty reinsurance which provides retrocessional coverage when insurance industry losses for a defined event exceed a certain level. We expect the type and level of coverage that we purchase will vary over time, reflecting our view of the changing dynamics of the underlying exposure and the reinsurance markets. We manage our risk by seeking to limit the amount of exposure assumed from any one reinsured and the amount of the aggregate exposure to catastrophe losses from a single event in any one geographical zone.
On April 25, 2018, Kendall Re Ltd. (“Kendall Re”), a Bermuda exempted company licensed and registered as a special purpose insurer under the Bermuda Insurance Act 1978 and related regulations, issued $225.0 million Series 2018-1 Class A Principal At-Risk Variable Rate Notes due May 6, 2021 under a variable rate note program from which the proceeds will be used to provide Aspen Bermuda with fully-collateralized retrocessional reinsurance protections against losses from a range of international perils, including U.S. named storms, U.S. and Canada earthquakes, U.S. severe thunderstorms, U.S. wildfires, U.S. winter storms and European windstorms. Additionally, Aspen Re continues to purchase quota share protection for worldwide catastrophe losses through Aspen Capital Markets and other collateralized reinsurance arrangements.
Although reinsurance agreements contractually obligate our reinsurers to reimburse us for an agreed-upon portion of our gross paid losses, we remain liable to our insureds to the extent that our reinsurers do not meet their obligations under these agreements. As a result, and in line with our risk management objectives, we evaluate the financial condition of our reinsurers and monitor concentrations of credit risk on an on-going basis. In general, we seek to place our reinsurance with highly rated companies with which we have a strong trading relationship or have fully collateralized arrangements in place. We maintain a list of authorized reinsurers graded for short, medium and long tail business which is regularly reviewed and updated by the Reinsurance Credit Committee. For additional information, please refer to Note 9, “Reinsurance” of our consolidated financial statements.
Risk Management
We have a comprehensive risk management framework that defines the corporate risk appetite, risk strategy and the policies required to monitor, manage and mitigate the risk inherent in our business. In doing so, we aim to comply with corporate governance and industry best practice and to monitor risks against six main risk objectives: (i) ensuring losses remain within planned limits, (ii) ensuring volatility of results fall within planned limits, (iii) compliance with existing and emerging regulatory requirements,
11
(iv) preserving rating agency credit ratings, (v) maintaining adequate solvency and liquidity, and (vi) avoiding any reputational risk. Below is a summary of our current risk governance arrangements and risk management strategy:
Risk Governance
Board of Directors.
The Board considers effective identification, measurement, monitoring, management and reporting of the risks facing our business to be key elements of its responsibilities and those of the Group Chief Executive Officer and management. Matters relating to risk management that are reserved for the Board include approval of the internal controls and risk management framework and any changes to the Aspen Group’s risk appetite statement and key risk limits. The Board also receives reports at each scheduled meeting from the Group Chief Risk Officer and the Chair of the Risk Committee as well as training in risk management processes including the design, operation, use and limitations of the internal model. The internal model is an economic capital model which has been developed internally for use in certain business decision-making processes, the assessment of risk-based capital requirements and for various regulatory purposes. As a result of these arrangements and processes, the Board, assisted by management and the Board Committees, is able to exercise effective oversight of the operation of the risk management strategy described in “— Risk Management Strategy” below.
Board Committees.
The Board delegates oversight of the management of certain key risks to its Risk, Audit and Investment Committees. Each of the committees is chaired by an independent director of the Company who also reports to the Board on the committees’ discussions and matters arising.
Risk Committee:
The purpose of the Risk Committee is to assist the Board in its oversight duties in respect of the management of risk, including:
|
•
|
making recommendations to the Board regarding management’s proposals for the risk management framework, risk appetite, key risk limits and the use of our internal model;
|
|
•
|
monitoring compliance with the agreed Aspen Group risk appetite and key risk limits; and
|
|
•
|
oversight of the stress and scenario testing process established by management.
|
Audit Committee:
The Audit Committee is primarily responsible for assisting the Board in its oversight of the integrity of the financial statements. The Audit Committee is also responsible for reviewing the adequacy and effectiveness of the Company’s internal controls and receives regular reports from both internal and external auditors. In addition, the Audit Committee oversees the Company’s compliance with applicable laws and regulations.
Investment Committee:
The Investment Committee is primarily responsible for setting and monitoring the Aspen Group’s investment risk and asset allocation policies and ensuring that the Chair of the Risk Committee is kept informed of such matters.
Management Committees.
The Aspen Group also has a number of executive management committees which have oversight of certain risk management processes including the following:
Group Executive Committee:
The Group Executive Committee is the main executive committee responsible for advising the Group Chief Executive Officer on matters relating to the strategy and conduct of the Aspen Group’s business.
Capital and Risk Principles Committee:
The primary purpose of the Capital and Risk Principles Committee is to assist the Group Chief Executive Officer and the Group Chief Risk Officer in their oversight duties in respect of the design and operation of the Aspen Group’s risk management systems. In particular, it has specific responsibilities in relation to the internal model and for the establishment of risk limits for accumulating underwriting exposures and monitoring solvency and liquidity requirements.
Reserve Committee:
The Reserve Committee is responsible for managing reserving risk and making recommendations to the Group Chief Executive Officer and the Group Chief Financial Officer relating to the appropriate level of reserves to include in the Aspen Group’s financial statements.
Underwriting Committee:
The purpose of the Underwriting Committee is to assist the Group Chief Executive Officer in his oversight duties in respect of the management and control of underwriting risk, including oversight of the independent review of the quality of each team’s underwriting.
Reinsurance Credit Committee:
The purpose of the Reinsurance Credit Committee is to seek to minimize credit risks arising from insurance and reinsurance counterparties by the assessment and monitoring of collateralized reinsurance arrangements, direct cedants, intermediaries and reinsurers.
Group Operations Committee
: The purpose of the Group Operations Committee is to
o
versee the Aspen Group’s operational support functions to ensure that they are strategically aligned to provide coordinated, efficient and cost effective operational support to the execution of the Aspen Group’s underwriting plans.
12
Group Chief Risk Officer.
Among other things, our Group Chief Risk Officer provides the Board and the Risk Committee with reports and advice on risk management issues.
Risk Management Strategy
We operate an integrated enterprise-wide risk management strategy designed to deliver shareholder value in a sustainable and efficient manner while providing a high level of policyholder protection. The execution of our integrated risk management strategy is based on:
|
•
|
the establishment and maintenance of an internal control and risk management system based on a three lines of defense approach to the allocation of responsibilities between risk accepting units (first line), risk management activity and oversight from other central control functions (second line) and independent assurance (third line);
|
|
•
|
identifying material risks to the achievement of the Aspen Group’s objectives including emerging risks;
|
|
•
|
the articulation at Group level of our risk appetite and a consistent set of key risk limits for each material component of risk;
|
|
•
|
the cascading of risk appetite and key risk limits for material risks to each operating subsidiary and, where appropriate, risk accepting business units;
|
|
•
|
measuring, monitoring, managing and reporting risk positions and trends;
|
|
•
|
the use, subject to an understanding of its limitations, of the internal model to test strategic and tactical business decisions and to assess compliance with the risk appetite statement; and
|
|
•
|
stress and scenario testing, including reverse stress testing, designed to help us better understand and develop contingency plans for the likely effects of extreme events or combinations of events on capital adequacy and liquidity.
|
Risk Appetite Statement.
The risk appetite statement is a central component of the Aspen Group’s overall risk management framework and is approved by the Board. It sets out, at a high level, how we think about risk in the context of our business model, Aspen Group objectives and strategy. It sets out boundary conditions and limits for the level of risk we assume, together with a statement of the reward we aim to receive for this level of risk. Our risk appetite statement comprises the following components:
|
•
|
Risk preferences:
a high level description of the types of risks we prefer to assume and those we prefer to minimize or avoid;
|
|
•
|
Return objective:
a description of the return on capital we seek to achieve, subject to our risk constraints;
|
|
•
|
Volatility constraint:
a target limit on earnings volatility; and
|
|
•
|
Capital constraint:
a minimum level of risk adjusted capital.
|
Risk Components.
The main types of risks that we face are summarized as follows:
Insurance risk:
The risk that underwriting results vary from their expected amounts, including the risk that reserves established in respect of prior periods differ significantly from the level of reserves included in the Aspen Group’s financial statements.
Market risk:
The risk of variation in the income generated by, and the fair value of, our investment portfolio, cash and cash equivalents and derivative contracts including the effect of changes in foreign currency exchange rates.
Credit risk:
The risk of diminution in the value of insurance receivables as a result of counter-party default. This principally comprises default and concentration risks relating to amounts receivable from intermediaries, policyholders and reinsurers. We include credit risks related to our investment portfolio under market risk. We include credit risks related to insurance contracts (e.g. credit and political risk policies) under insurance risk.
Liquidity risk:
The risks of failing to maintain sufficient liquid financial resources to meet liabilities as they fall due or to provide collateral as required for commercial or regulatory purposes.
Operational risk:
The risk of loss resulting from inadequate or failed internal processes, personnel or systems, or from external events.
Strategic risk
: The risk of adverse impact on shareholder value or income and capital of adverse business decisions, poor execution or failure to respond to market changes.
13
Regulatory risk
: The risk of non-compliance with regulatory requirements, including ensuring we understand and comply with changes to those requirements is assessed and managed as operational risk. There is a residual risk that changes in regulation impact our ability to operate profitably in some jurisdictions or some lines of business.
Taxation risk
: The risk that we do not understand, plan for and manage our tax obligations is assessed and managed as operational risk. There is a residual risk that changes in taxation impact our ability to operate profitably in some jurisdictions or some lines of business.
Emerging risk
: The risk that events or issues not previously identified or fully understood impact the operations or financial results of the Aspen Group.
We divide risks into “core” and “non-core” risks. Core risks comprise those risks which are inherent in the operation of our business, including insurance risks in respect of our underwriting operations and market and liquidity risks in respect of our investment activity. We intentionally expose the Company to core risks with a view to generating shareholder value but seek to manage the resulting volatility in our earnings and financial condition within the limits defined by our risk appetite. However, these core risks are intrinsically difficult to measure and manage and we may not, therefore, be successful in this respect. All other risks, including regulatory and operational risks, are classified as non-core. We seek, to the extent we regard as reasonably practicable and economically viable, to avoid or minimize our exposure to non-core risks.
Key Risk Limits.
We use the term risk limit to mean the upper limit of our tolerance for exposure to a given risk. Key risk limits are a sub-set of risk limits and are subject to annual approval by the Board on the advice of the Risk Committee as part of the annual business planning process. If a risk exceeds key risk limits, the Group Chief Risk Officer is required to report the excess and management’s plans for dealing with it to the Risk Committee.
Business Distribution
Our business is produced principally through brokers and reinsurance intermediaries. The brokerage distribution channel provides us with access to an efficient, global distribution system without the significant time and expense which would be incurred in creating wholly-owned distribution networks. The brokers and reinsurance intermediaries typically act in the interest of ceding clients or insurers and are instrumental to our continued relationship with our clients.
The following tables show our gross written premiums by broker for each of our business segments for the
twelve months ended
December 31, 2018
,
2017
and
2016
:
|
|
Twelve Months Ended December 31, 2018
|
Twelve Months Ended December 31, 2017
|
Twelve Months Ended December 31, 2016
|
|||||||||||||||||||
|
Reinsurance
|
Gross
Written Premiums
|
% of Total
|
Gross
Written Premiums |
% of Total
|
Gross
Written
Premiums
|
% of Total
|
||||||||||||||||
|
|
($ in millions, except for percentages)
|
|||||||||||||||||||||
|
Aon Corporation
|
$
|
363.7
|
|
24.3
|
%
|
$
|
374.5
|
|
24.2
|
%
|
$
|
394.6
|
|
27.9
|
%
|
|||||||
|
Marsh & McLennan Companies, Inc.
|
312.1
|
|
20.9
|
|
321.8
|
|
20.8
|
|
285.1
|
|
20.2
|
|
||||||||||
|
Willis Group Holdings, Ltd.
|
282.2
|
|
18.9
|
|
315.8
|
|
20.4
|
|
291.8
|
|
20.6
|
|
||||||||||
|
Others
(1)
|
537.7
|
|
35.9
|
|
536.4
|
|
34.6
|
|
441.7
|
|
31.2
|
|
||||||||||
|
Total
|
$
|
1,495.7
|
|
100.0
|
%
|
$
|
1,548.5
|
|
100.0
|
%
|
$
|
1,413.2
|
|
100.0
|
%
|
|||||||
_______________
|
(1)
|
Includes gross written premium of
$259.7 million
related to CGB DS and
$33.1 million
related to AgriLogic (
2017
—
$269.7 million
,
2016
—
$178.9 million
related to AgriLogic which we purchased in January 2016 and sold in December 2017) as part of our strategic partnership with CGB DS.
|
14
|
|
Twelve Months Ended December 31, 2018
|
Twelve Months Ended December 31, 2017
|
Twelve Months Ended December 31, 2016
|
|||||||||||||||||||
|
Insurance
|
Gross
Written Premiums
|
% of Total
|
Gross
Written Premiums |
% of Total
|
Gross
Written
Premiums
|
% of Total
|
||||||||||||||||
|
|
($ in millions, except for percentages)
|
|||||||||||||||||||||
|
Marsh & McLennan Companies, Inc.
|
$
|
230.9
|
|
11.9
|
%
|
$
|
214.3
|
|
11.8
|
%
|
$
|
177.1
|
|
10.2
|
%
|
|||||||
|
Aon Corporation
|
180.8
|
|
9.3
|
|
176.5
|
|
9.7
|
|
183.1
|
|
10.6
|
|
||||||||||
|
Willis Group Holdings, Ltd.
|
145.1
|
|
7.4
|
|
123.4
|
|
6.8
|
|
137.8
|
|
7.9
|
|
||||||||||
|
Brown & Brown Inc
|
121.9
|
|
6.2
|
|
57.3
|
|
3.2
|
|
44.2
|
|
2.5
|
|
||||||||||
|
Ryan Specialty
|
101.1
|
|
5.2
|
|
94.7
|
|
5.2
|
|
89.9
|
|
5.2
|
|
||||||||||
|
AmWINS Group Inc
|
86.4
|
|
4.4
|
|
86.8
|
|
4.8
|
|
66.6
|
|
3.8
|
|
||||||||||
|
CRC Swett
|
78.8
|
|
4.0
|
|
87.3
|
|
4.8
|
|
75.4
|
|
4.3
|
|
||||||||||
|
Arthur J Gallagher (UK) Limited
|
70.8
|
|
3.6
|
|
69.7
|
|
3.8
|
|
45.1
|
|
2.6
|
|
||||||||||
|
Jardine Lloyd Thompson Ltd.
|
58.5
|
|
3.0
|
|
56.6
|
|
3.1
|
|
47.7
|
|
2.8
|
|
||||||||||
|
Others
|
876.9
|
|
45.0
|
|
845.8
|
|
46.8
|
|
866.9
|
|
50.1
|
|
||||||||||
|
Total
|
$
|
1,951.2
|
|
100.0
|
%
|
$
|
1,812.4
|
|
100.0
|
%
|
$
|
1,733.8
|
|
100.0
|
%
|
|||||||
Claims Management
We have a staff of experienced claims professionals organized into insurance and reinsurance teams which are managed separately. We have developed processes and internal business controls for identifying, tracking and settling claims, and authority levels have been established for all individuals involved in the reserving and settlement of claims.
The key responsibilities of our claims management departments are to:
|
•
|
process, manage and resolve reported insurance or reinsurance claims efficiently and accurately to ensure the proper application of intended coverage, reserving in a timely fashion for the probable ultimate cost of both indemnity and expense and make timely payments in the appropriate amount on those claims for which we are legally obligated to pay;
|
|
•
|
select appropriate counsel and experts for claims, manage claims-related litigation and regulatory compliance;
|
|
•
|
contribute to the underwriting process by collaborating with both underwriting teams and senior management in terms of the evolution of policy language and endorsements and providing claim-specific feedback and education regarding legal activity;
|
|
•
|
contribute to the analysis and reporting of financial data and forecasts by collaborating with the finance and actuarial functions relating to the drivers of actual claim reserve developments and potential for financial exposures on known claims; and
|
|
•
|
support our marketing efforts through the quality of our claims service.
|
On those accounts where it is applicable, a team of in-house claims professionals oversees and regularly audits claims handled under outsourcing agreements and manages those large claims and coverage issues on referral as required under the terms of those agreements.
Senior management receives a regular report on the status of our reserves and settlement of claims. We recognize that fair interpretation of our reinsurance agreements and insurance policies with our customers, and timely payment of valid claims, are a valuable service to our clients and enhance our reputation.
Reserves
Under U.S. Generally Accepted Accounting Principles (“U.S. GAAP”) and applicable insurance laws and regulations in the countries in which we operate, we are required to establish loss reserves for the estimated unpaid portion of the ultimate liability for losses and loss expenses under the terms of our policies and agreements with our insured and reinsured customers. The process of estimating these reserves involves a considerable degree of judgment and, as of any given date, is inherently uncertain. For a full discussion regarding our loss and loss expenses reserving process, refer to Part II, Item 7, “Management’s Discussion and
15
Analysis of Financial Condition and Results of Operations — Critical Accounting Policies — Reserving Approach” and Part II, Item 8, “Financial Statements and Supplementary Data” and Item 1A, “Risk Factors — Insurance Risks — Our financial condition and operating results may be adversely affected if actual claims exceed our loss reserves.”
Investments
Our current investment strategy is focused on delivering stable investment income and total return through all market cycles while maintaining appropriate portfolio liquidity and credit quality to meet the requirements of our customers, rating agencies and regulators. To enhance investment returns where possible, we tactically adjust the duration of the investment portfolio and asset allocation taking into account the average liability duration of our reinsurance and insurance risks and our views of interest rates, the yield curve, credit spreads and markets for different assets.
The Investment Committee of the Board establishes investment guidelines and supervises our investment activity. The Investment Committee regularly monitors our overall investment results and performance against our investment objectives and guidelines. These guidelines specify minimum criteria on the overall credit quality and liquidity characteristics of the portfolio, and include limitations on the size of certain holdings and restrictions on purchasing certain types of securities. Management and the Investment Committee review our investment performance and assess credit and market risk concentrations and exposures to issuers. We follow an investment strategy designed to emphasize the preservation of capital and provide sufficient liquidity for the prompt payment of claims.
In
2018
, we engaged BlackRock Financial Management Inc., Alliance Capital Management L.P., DWS Investment Management Americas Inc., Pacific Investment Management Company LLC, Goldman Sachs Asset Management L.P. and Conning Asset Management Limited to provide investment advisory and management services for our portfolio of fixed income and equity investments. We have agreed to pay investment management fees based on the average market values of total assets held under management at the end of each calendar quarter. These agreements may be terminated generally by either party on short notice without penalty.
For additional information concerning our investments, refer to Part II, Item 7, “Management’s Discussion and Analysis of Financial Condition and Results of Operations”, Note 6 of our consolidated financial statements, “Investments,” and Note 8 of our consolidated financial statements, “Fair Value Measurements.” For additional information concerning Other-Than-Temporary Impairment of Investments, refer to Note 2(c) of our consolidated financial statements, “Basis of Preparation and Significant Accounting Policies — Accounting for Investments, Cash and Cash Equivalents.”
Competition
The insurance and reinsurance industries are mature and highly competitive. Competition varies significantly on the basis of product and geography. Insurance and reinsurance companies compete on the basis of many factors, including premium charges, general reputation and perceived financial strength, the terms and conditions of the products offered, ratings assigned by independent rating agencies, speed of claims payments, reputation and experience in the particular risk to be underwritten, quality of service, the jurisdiction where the reinsurer or insurer is licensed or otherwise authorized, capacity and coverages offered and various other factors. Increased competition could result in fewer submissions for our products and services, lower rates charged, slower premium growth and less favorable policy terms and conditions, any of which could adversely impact our growth and profitability.
We compete with major U.S., U.K., Bermudian, European and other international insurers and reinsurers and underwriting syndicates from Lloyd’s, some of which have longer operating histories, more capital and/or more favorable ratings than we do, as well as greater marketing, management and business resources. We also compete with capital market participants that create alternative products, such as catastrophe bonds, that are intended to compete with traditional reinsurance products. In addition to asset managers and reinsurers who provide collateralized reinsurance and retrocessional coverage, the availability of these non-traditional products could reduce the demand for both traditional insurance and reinsurance products.
Our competitors include, but are not limited to, American International Group, Inc., Arch Capital Group Ltd., Axis Capital Holdings Limited, Chubb Limited, Sompo International, Everest Re Group Limited, Hannover Re, Lancashire Holdings Limited, Munich Re, PartnerRe Ltd., QBE Insurance Group Limited, Renaissance Re Holdings Ltd., SCOR SA, Swiss Re, Validus Holdings Ltd. (a subsidiary of AIG), XL Catlin (a subsidiary of AXA XL and AXA SA), MS Amlin plc and various Lloyd’s syndicates and Government-sponsored insurers and reinsurers.
16
Ratings
Ratings by independent agencies are an important factor in establishing the competitive position of (re)insurance companies and are important to our ability to market and sell our products and services. Rating organizations continually review the financial positions of insurers, including us. As at February 11, 2019, the financial strength ratings of our Operating Subsidiaries were as follows:
|
Rating Agency
|
Rating
|
Rated Operating Subsidiary
|
Agency
’
s Rating Definition
|
Ranking of Rating
|
|
Standard & Poor’s Financial Services LLC (“S&P”)
|
A (Strong - Negative outlook)
|
Aspen U.K and Aspen Bermuda
|
Strong capacity to meet financial commitments but somewhat more susceptible to the adverse effects of changes in circumstances and economic conditions than those in higher-rated categories
|
The ‘A’ grouping is the third highest of twelve major rating categories.
|
|
A.M. Best
|
A (Excellent) (Stable)
|
Aspen U.K., Aspen Bermuda, Aspen Specialty and AAIC
|
An excellent ability to meet ongoing insurance obligations
|
The ‘A’ grouping is the second highest of seven major rating categories.
|
|
Moody’s Investors Service, Inc. (“Moody’s”)
|
A2 (Negative outlook)
|
Aspen U.K and Aspen Bermuda
|
Considered upper-medium grade and subject to low credit risk
|
The ‘A’ grouping is the third highest of nine major rating categories. Each of the second through seventh categories has an appended numerical modifier of ‘1’, ‘2’ and ‘3’, indicating that the obligation ranks in the higher end, mid-category or lower end, respectively, of the rating category.
|
The rating agencies published updated reviews of our ratings following our announcement of the Merger. On August 28, 2018, S&P affirmed the ratings of the applicable Operating Subsidiaries and affirmed their outlook as negative. S&P stated that the negative outlook indicates the possibility that they may decrease the ratings of the applicable Operating Subsidiaries by one level if we do not improve our underwriting performance during the next two years. On August 29, 2018, Moody’s affirmed the ratings of the applicable Operating Subsidiaries and affirmed their outlook as negative. Moody’s noted that our business fundamentals will remain the key drivers for such ratings over the next twelve to eighteen months. On August 29, 2018, A.M. Best placed the ratings of the applicable Operating Subsidiaries under review with developing implications. A.M. Best stated that it needs to assess the impact of the planned change in ownership on our balance sheet strength, operating performance and business profile and the ratings will be addressed pending the completion of the Merger.
These ratings reflect the respective opinions of S&P, A.M. Best, and Moody regarding the ability of the relevant Operating Subsidiary to pay claims and are not evaluations directed to our investors or recommendations to buy, sell or hold our securities. These ratings are subject to periodic review by, and may be revised downward or revoked at the sole discretion of, S&P, A.M. Best, and Moody’s, respectively.
For a discussion of some potential risks relating to the ratings of our Operating Subsidiaries, refer to Part I, Item 1A, “Risk Factors — Risks Relating to the Merger — A condition of the Merger is the maintenance of financial strength ratings of our Operating Subsidiaries and Highlands may become entitled to terminate the Merger Agreement if we receive a clear indication from A.M. Best or S&P that such agency intends to downgrade the financial strength rating of our Operating Subsidiaries and if Highlands exercises such right it could adversely affect our business, financial condition and results of operations” and “Risk Factors — Strategic Risks — Our Operating Subsidiaries are rated and our Lloyd’s business benefits from a rating by one or more of A.M. Best, S&P and Moody’s and a decline in any of these ratings could adversely affect our standing among brokers and customers and cause our premiums and earnings to decrease.”
17
Employees
As at
December 31, 2018
, we employed
1,151
persons in the following countries:
|
Country
|
As at December 31, 2018
|
As at December 31, 2017
|
|||||
|
United Kingdom
|
611
|
|
686
|
|
|||
|
United States
|
429
|
|
499
|
|
|||
|
Bermuda
|
45
|
|
55
|
|
|||
|
Switzerland
|
21
|
|
32
|
|
|||
|
Singapore
|
26
|
|
33
|
|
|||
|
Ireland
|
9
|
|
11
|
|
|||
|
United Arab Emirates
|
7
|
|
8
|
|
|||
|
France
|
—
|
|
4
|
|
|||
|
Germany
|
—
|
|
3
|
|
|||
|
Australia
|
3
|
|
3
|
|
|||
|
Total
|
1,151
|
|
1,334
|
|
|||
We believe that relations with our employees, none of which are subject to collective bargaining agreements, are good.
Regulatory Matters
General
The business of insurance and reinsurance is regulated in most countries, although the degree and type of regulation varies significantly from one jurisdiction to another. The discussion below summarizes the material laws and regulations applicable to our Operating Subsidiaries and, where relevant, Peregrine, Silverton and Aspen Capital Markets. Our Operating Subsidiaries have met or exceeded the solvency margins and ratios applicable to them under relevant law and regulation as at December 31, 2018 and December 31, 2017.
Bermuda Regulation
The Insurance Act 1978, as amended (the “Insurance Act”), regulates insurance companies and insurance intermediaries in Bermuda, and it provides that no person may carry on any insurance business in or from within Bermuda unless registered as an insurer or intermediary by the Bermuda Monetary Authority (the “BMA”) under the Insurance Act. The Insurance Act applies to both insurance and reinsurance business. We have one Bermuda-based Operating Subsidiary, Aspen Bermuda, a Class 4 insurer under the Insurance Act. We also have Peregrine and Silverton licensed as Special Purpose Insurers (“SPI”) under the Insurance Act. We also have a Bermuda-based insurance management subsidiary, ACM, which is registered under the Insurance Act as an insurance manager and as an insurance agent.
On March 25, 2016, Bermuda’s prudential framework for (re)insurance and group supervision was confirmed as being fully equivalent to the regulatory standards applied to European reinsurance companies and insurance groups in accordance with the requirements of the Solvency II Directive. Bermuda was granted this full ‘Solvency II equivalence’ for an unlimited period by the European Commission based on an assessment conducted by the European Insurance and Occupational Pensions Authority, and the equivalence decision was applied retroactively to January 1, 2016.
Group Supervision.
The BMA has implemented a framework for group supervision. The BMA may, in respect of an insurance group, determine whether it is appropriate for it to be the group supervisor of that group. For purposes of the Insurance Act, an insurance group is defined as a group of companies that conducts insurance business. If the BMA determines that it is the group supervisor, it designates a specified insurer that is a member of the insurance group as the “designated insurer” to facilitate and maintain compliance by the group with the Group Rules (as defined below). Pursuant to the Insurance Act, the BMA acts as the group supervisor of the Aspen Group and has designated Aspen Bermuda as the designated insurer.
In carrying out its functions, the BMA makes rules for assessing the financial situation and the solvency position of the Aspen Group and/or its members and rules in respect of the system of governance and risk management of the insurance group and supervisory reporting and disclosures of the insurance group.
18
The current supervision, solvency and public disclosure rules (together, the “Group Rules”) apply to the Aspen Group so long as the BMA remains our group supervisor. Through the Group Rules, the BMA may take action which affects the Company. The most significant requirements of the Group Rules are set out below.
Group Financial Statements and Group Statutory Financial Return.
Every insurance group is required to prepare an annual group statutory financial return which must be submitted to the BMA by the designated insurer within five months after its financial year end (unless specifically extended by the BMA for a longer period not exceeding eight months).
The group statutory financial return must consist of the following documents: a cover sheet, an insurance group business solvency certificate, statutory financial statements, particulars of ceded reinsurance comprising of the top ten unaffiliated reinsurers for which the group has the highest recoverable balances and any reinsurer with recoverable balances exceeding 15% of the insurance group’s statutory capital and surplus, any adjustments applied to the group financial statements by the group to produce the economic balance sheet in the form of a reconciliation, a list of non-insurance financial regulated entities owned by the group and particulars of qualifying members as defined within the Group Rules. The Group Rules prescribe the rules pertaining to the preparation and substance of the group statutory financial statements (which include, in statutory form, a group balance sheet, a group income statement, a group statement of capital and surplus, and notes thereto).
Every insurance group must prepare and submit, on an annual basis, consolidated audited financial statements including notes to the financial statements of the parent company of the group prepared under GAAP Standards (“Group Financial Statements”). The Group Financial Statements must be audited annually by the group’s approved auditor who must prepare an auditor’s report in accordance with generally accepted auditing standards. The designated insurer is required to file with the BMA annually the audited Group Financial Statements within five months from the end of the relevant financial year, or such longer period as permitted by the BMA not exceeding eight months. The Group Financial Statements are published by the BMA on its website.
In addition to the annual filings, every insurance group is required to submit quarterly consolidated financial statements of the parent company of the group, comprising unaudited consolidated group financial statements and a schedule of intra-group transactions and risk concentrations which will include details of material intra-group transactions, details surrounding all intra-group reinsurance and retrocession arrangements that have materialized since the most recent quarterly or annual financial return filed with the BMA and details of the top ten largest exposures to unaffiliated counterparties exposures exceeding 10% of the insurer’s statutory capital and surplus.
Group Capital and Solvency Return.
Every insurance group must also prepare and submit a group capital and solvency return (“Group CSR”) in accordance with the Group Rules, which must consist of the following documents: a Group CSR declaration, the Group Bermuda Solvency Capital Requirement (“BSCR”), a risk-based capital adequacy model, and associated schedules, a Group Solvency Self-Assessment (“GSSA”), a Financial Condition Report and an opinion of a BMA approved Group Actuary on the economic balance sheet technical provisions. The Group Rules require that the insurance group perform the GSSA, which provides a determination of both the quality and quantity of the capital required to adequately cover material risks, at least annually. The Group CSR declaration must be signed by two directors of the parent company, one of which may be the chief executive, and either the chief risk officer or the chief financial officer of the parent company. The Group CSR must be filed within five months after the end of the financial year or such longer period, not exceeding eight months, as the BMA may determine.
Group Minimum Solvency Margin and Group Enhanced Capital Requirements.
Aspen Holdings must ensure that the group’s statutory assets exceed the amount of its statutory liabilities by the aggregate minimum margin of solvency of each qualifying member. A member is a qualifying member of the insurance group if it is subject to solvency requirements in the jurisdiction in which it is registered.
Every insurance group must maintain available capital and surplus in an amount equal to or exceeding its Enhanced Capital Requirement (“ECR”). An insurance group’s ECR is to be calculated at the end of its relevant year by reference to either the BSCR Model or a BMA approved group internal capital model. For the financial year ending
December 31, 2018
, Aspen Holdings has relied on the BSCR model.
The BMA expects insurance groups to operate at or above a group Target Capital Level (“TCL”) which exceeds the Group ECR. The TCL for insurance groups is set at 120% of its Group ECR. The Aspen Group holds capital in excess of its TCL as at
December 31, 2018
.
Economic Balance Sheet Framework
. The Economic Balance Sheet (“EBS”) framework is an accounting balance sheet approach using market consistent values for all current assets and current obligations relating to in-force business which applies to commercial insurers and insurance groups for which the BMA is group supervisor from the 2016 financial year end. The EBS framework is embedded as part of the Group CSR and forms the basis for the insurer’s ECR.
Public Disclosures
. The Group Rules also include the requirement for insurance groups to prepare and publish a Financial Condition Report (“FCR”). Among other things, the FCR must provide details of measures governing business operations, the
19
corporate governance framework, solvency and the financial performance of an insurance group. The FCR is publicly disclosed and is intended to provide additional information to the public in relation to the group’s business model, whereby they can make an informed assessment on whether the business is run in a prudent manner. The FCR is required to be filed with the BMA on or before the filing date of the Group CSR (May 31st of each year for Aspen Holdings) and will need to be published on the insurance group’s website, no later than fourteen days after being filed with the BMA.
Group Eligible Capital.
The Group Rules also outline the eligible capital regime for insurance groups. The tiered capital system classifies all capital instruments into one of three tiers based on their “loss absorbency” characteristics with the highest quality capital classified as Tier 1 Capital and lesser quality capital classified as either Tier 2 Capital or Tier 3 Capital.
Group Governance
. The Group Rules require Aspen Holdings to establish and effectively implement corporate governance policies and procedures, which it must periodically review to ensure they continue to support the overall organizational strategy of the group. In particular, Aspen Holdings must: (i) ensure that operational and oversight responsibilities of the group are clearly defined and documented and that the reporting of material deficiencies and fraudulent activities are transparent and devoid of conflicts of interest; (ii) establish systems for identifying on a risk sensitive basis those policies and procedures that must be reviewed annually and those policies and procedures that must be reviewed at other regular intervals; (iii) establish a risk management and internal controls framework and ensure that it is assessed regularly and such assessment is reported to the parent company board and the chief and senior executives; (iv) establish and maintain sound accounting and financial reporting procedures and practices for the group; and (v) establish and keep under review group functions relating to actuarial, compliance, internal audit and risk management functions which must address certain specific requirements as set out in the Group Rules.
A supervisory college was held by relevant regulators of the Aspen Group (i.e., the BMA, the PRA, North Dakota and Texas) in July 2018. Supervisory colleges are a regular part of the group supervision process and are intended to facilitate supervision on a group and legal entity level by allowing involved supervisors from various jurisdictions to acquire a better understanding of the group with respect to risk exposures and inherent risks, financial position and soundness, capital adequacy, business activities, risk management and governance systems. Similar to prior supervisory colleges, the BMA did not identify any material issues although it asked to be appraised of certain matters relating to the Aspen Group’s strategy, solvency and risk management.
Local Entity Supervision
. Aspen Bermuda, as an insurer carrying on general insurance business under the Insurance Act, is registered as a Class 4 insurer. In addition, the Insurance Act outlines provisions for SPIs, such as Peregrine and Silverton, insurance managers and insurance agents.
Principal Representative, Head and Principal Office
. The Insurance Act requires every insurer, such as Aspen Bermuda, to appoint and maintain a principal representative resident in Bermuda and to maintain a principal office in Bermuda. The principal representative must be knowledgeable in insurance and is responsible for arranging the maintenance and custody of the statutory accounting records and for ensuring that the annual Statutory Financial Return, Statutory Financial Statements and Capital and Solvency Return for the insurer are filed. The principal representative is also responsible for notifying the BMA where the principal representative believes there is a likelihood of Aspen Bermuda becoming insolvent or that a reportable “event” under the Insurance Act has, to the principal representative’s knowledge, occurred or is believed to have occurred.
Further, any registered insurer that is a Class 3A, 3B, or Class 4 insurer, such as Aspen Bermuda, is required to maintain a head office in Bermuda and direct and manage its insurance business from Bermuda. The Bermuda Insurance Act provides that in considering whether an insurer satisfies the requirements of having its head office in Bermuda, the BMA may consider (i) where the underwriting, risk management and operational decision making occurs; (ii) whether senior executives who are responsible for, and involved in, the decision making are located in Bermuda; and (iii) where meetings of the board of directors occur. The BMA will also consider (i) the location where management meets to effect policy decisions; (ii) the residence of the officers, insurance managers or employees; and (iii) the residence of one or more directors in Bermuda.
Approved Independent Auditor.
The Insurance Act generally requires all insurers to appoint an independent auditor who will annually audit and report on the insurer’s statutory financial statements and statutory financial return, with the exception of SPIs who may file an application under the Insurance Act to have the requirement of filing annual audited financial statements with the BMA waived. Aspen Bermuda, as a Class 4 insurer, must appoint an independent auditor who will annually audit and report on the GAAP financial statements and the statutory financial return of the insurer, both of which are required to be filed annually with the BMA. The independent auditor must be approved by the BMA.
Loss Reserve Specialist.
Class 4 insurers are required to submit an opinion of their BMA approved loss reserve specialist with their capital and solvency return in respect of their EBS technical provisions.
Annual Financial Statements and Annual Statutory Financial Return.
As prescribed by the Insurance Act, Aspen Bermuda, a Class 4 insurer, must prepare an annual statutory financial return which shall consist of an insurer information sheet, a report of the approved independent auditor on the statutory financial statements, a statutory balance sheet, a statutory statement of income, a statutory statement of capital and surplus, notes to the statutory financial statements and a statutory declaration of compliance.
20
In addition to preparing statutory financial statements, Aspen Bermuda must file audited financial statements prepared in accordance with GAAP in respect of each financial year. Such statements must be filed with the BMA within a period of four months from the end of the financial year or such longer period, not exceeding seven months, as the BMA may determine. The audited financial statements will be published by the BMA.
Annual Capital and Solvency Return.
Class 4 insurers are required to file a capital and solvency return in respect of their general business which must consist of the following documents: a CSR declaration, the BSCR and associated schedules, a Commercial Insurer’s Solvency Self-Assessment (“CISSA”), a Financial Condition Report and an opinion of a BMA approved Loss Reserve Specialist on the economic balance sheet technical provisions. The Insurance (Prudential Standards) (Class 4 and 3B Solvency Requirement) Rules 2008 require that the insurer perform the CISSA, which provided a determination of both the quality and quantity of the capital required to adequately cover material risks, at least annually. The CISSA allows the BMA to obtain an insurer’s view of the capital resources required to achieve its business objectives and to assess the company’s governance, risk management and controls surrounding this process. The CSR declaration must be signed by two directors of the company, one of which may be the Chief Executive Officer and either the Chief Risk Officer or the Chief Financial Officer. The CSR must be filed within four months after the end of the financial year or such longer period, not exceeding seven months, as the BMA may determine.
Public Disclosures.
Commercial insurers are required to prepare an FCR providing details of, among other things, measures governing the business operations, corporate governance framework and solvency and financial performance of the insurer. Where the commercial insurer is part of an insurance group, the BMA, as Group Supervisor, may waive the submission of the legal entity FCR and may require the submission of the Group FCR which must clearly include information specific to the insurer. Aspen Bermuda has been granted a waiver for the submission of the legal entity FCR for the financial year ending December 31, 2018.
Enhanced Capital Requirements and Minimum Solvency Margin.
The BSCR employs a standard mathematical model that correlates the risk underwritten by Bermuda insurers to the capital that is dedicated to their business. The BSCR applies a standard measurement format to the risk associated with an insurer’s assets, liabilities and premiums, including a formula to take account of the catastrophe risk exposure. Aspen Bermuda must maintain available capital and surplus in an amount equal to or exceeding its ECR calculated using the BSCR model.
In order to minimize the risk of a shortfall in capital arising from an unexpected adverse deviation, the BMA expects that insurers operate at or above a threshold captive level (termed the target capital level (“TCL”)), which exceeds an insurer’s ECR. The TCL for a Class 4 insurer is set at 120% of ECR. Aspen Bermuda holds capital in excess of its TCL as at December 31, 2018.
As a Class 4 Insurer, Aspen Bermuda is also required to meet a minimum margin of solvency, which is the minimum amount by which the value of the general business assets of the insurer must exceed its general business liabilities, being equal to the greater of: (i) $100,000,000; or (ii) 50% of net premiums written (being gross premiums written less any premiums ceded by the insurer (not exceeding 25% of gross premiums)) in its current financial year; or (iii) 15% of net losses and loss expense provisions and other insurance reserves; or (iv) 25% of the ECR reported at the end of its relevant year.
Minimum Liquidity Ratio.
The Insurance Act provides a minimum liquidity ratio for general business insurers, like Aspen Bermuda. An insurer engaged in general business is required to maintain the value of its relevant assets at not less than 75% of the amount of its relevant liabilities. Relevant assets include, but are not limited to, cash and time deposits, quoted investments, unquoted bonds and debentures, investments in mortgage loans on real estate, investment income due and accrued, accounts and premiums receivable, reinsurance balances receivable and funds held by ceding reinsurers. There are certain categories of assets which, unless specifically permitted by the BMA, do not automatically qualify as relevant assets, such as unquoted equity securities, investments in and advances to affiliates and real estate and collateral loans. The relevant liabilities are total general business insurance reserves and total other liabilities less deferred income tax, sundry liabilities (by interpretation, those not specifically defined), and letters of credit and guarantees.
The BMA performed a prudential review of Aspen Bermuda in November 2016. No material issues were identified.
Supervision, Investigation and Intervention.
The BMA may appoint an inspector with extensive powers to investigate the affairs of an insurer, such as Aspen Bermuda, if it believes that such an investigation is in the best interests of its policyholders or persons who may become policyholders. In order to verify or supplement information otherwise provided to the BMA, the BMA may direct an insurer to produce documents or information relating to matters connected with its business.
An inspector may examine on oath any past or present officer, employee or insurance manager of the insurer under investigation in relation to its business and apply to the court in Bermuda for an order that other persons may also be examined on any matter relevant to the investigation. It is the duty of any insurer in relation to whose affairs an inspector has been appointed and of any past or present officer, employee or insurance manager of such insurer to produce to the inspector on request all books, records and documents relating to the insurer which are in its custody or control and to assist the inspector in connection with the investigation.
21
If the BMA believes there is a risk of an insurer becoming insolvent or being in breach of the Insurance Act or any conditions imposed upon its registration under the Insurance Act, the BMA may, among other things, direct the insurer: (i) not to take on any new insurance business; (ii) not to vary any insurance contract if the effect would be to increase its liabilities; (iii) not to make certain investments; (iv) to realize certain investments; (v) to maintain in or transfer to the custody of a specified bank certain assets; (vi) not to declare or pay any dividends or other distributions, or to restrict the making of such payments; (vii) to limit its premium income; (viii) to remove a controller or officer; and/or (ix) to file a petition for the winding up of the insurer.
The BMA has the power to assist other regulatory authorities, including foreign insurance regulatory authorities, with their investigations involving insurance and reinsurance companies in Bermuda if it is satisfied that the assistance being requested is in connection with the discharge of regulatory responsibilities and that such cooperation is in the public interest.
Restrictions on Dividends, Distributions and Reduction of Capital.
Our Bermuda subsidiaries must comply with the provisions of the Bermuda Companies Act 1981, as amended (the “Companies Act”), regulating the payment of dividends and distributions. A Bermuda company may not declare or pay a dividend or make a distribution out of contributed surplus if there are reasonable grounds for believing that: (i) the company is, or would after the payment be, unable to pay its liabilities as they become due; or (ii) the realizable value of the company’s assets would thereby be less than its liabilities. Further, as mandated by the Insurance Act, an insurer may not declare or pay any dividends during any financial year if it would cause the insurer to fail to meet its relevant margins, and an insurer which fails to meet its relevant margins on the last day of any financial year may not, without the approval of the BMA, declare or pay any dividends during the next financial year. In addition, as a Class 4 insurer, Aspen Bermuda may not in any financial year pay dividends which would exceed 25% of its total statutory capital and surplus, as shown on its statutory balance sheet in relation to the previous financial year, unless it files with the BMA a solvency affidavit at least seven days in advance. Further, Aspen Bermuda must obtain the prior approval of the BMA before reducing by 15% or more its total statutory capital as set out in its previous year’s financial statements.
Special Purpose Insurer
. Peregrine and Silverton are registered as SPIs licensed to carry on special purpose business under the Insurance Act. Special purpose business is defined under the Insurance Act as insurance business under which an insurer fully funds its liabilities to the persons insured through (i) the proceeds of any one or more of (x) a debt issuance where the repayment rights of the providers of such debt are subordinated to the rights of the person insured, or (y) some other financing mechanism approved by the BMA; (ii) cash; and (iii) time deposits. An SPI may only enter into contracts, or otherwise assume obligations, that are solely necessary for it to give effect to the special purpose for which it has been established.
Unlike other (re)insurers, SPIs are fully funded to meet their (re)insurance obligations and are deemed “bankruptcy remote”. As a result, the application and supervision processes are streamlined to facilitate the transparent structure. As SPIs, Peregrine and Silverton need to maintain a minimum solvency margin by which the value of the special purpose business assets must exceed its special purpose business liabilities by at least $1.00. Further, SPIs are currently not required to file annual loss reserve specialist opinions. SPIs are required to file electronic statutory financial returns via an E-SFR system. The BMA has the discretion to modify such insurer’s statutory filings requirements under the Insurance Act. Like other (re)insurers, the principal representative of an SPI has a duty to inform the BMA in relation to solvency matters, where applicable.
Segregated Account Companies.
Peregrine and Silverton are also registered in Bermuda as segregated accounts companies under the Segregated Accounts Companies Act 2000, as amended. As a segregated accounts company, Peregrine and Silverton are required to segregate the assets and liabilities linked to their respective segregated accounts from the assets and liabilities linked to their other respective segregated accounts and from their general account assets and liabilities. The assets of each segregated account are only intended to be used to meet liabilities to creditors of that segregated account and are not intended to be available to meet liabilities to creditors in respect of other segregated accounts or, except where otherwise agreed and permitted by law, general account creditors of Peregrine or Silverton. The segregated account representative of a segregated accounts company has the duty to inform the Registrar of Companies in relation to solvency matters and non-compliance, where applicable.
Change of Controller and Officer Notifications.
Under the Insurance Act, where the shares of a shareholder or insurer or the shares of its parent company are traded on a recognized stock exchange, each shareholder or prospective shareholder will be responsible for notifying the BMA in writing of his becoming or ceasing to be a shareholder controller, directly or indirectly, of 10%, 20%, 33% or 50% of Aspen Holdings and ultimately Aspen Bermuda, Peregrine and Silverton within 45 days of such a change. The BMA may serve a notice of objection on any shareholder controller of Aspen Bermuda, Peregrine and Silverton if it appears to the BMA that the person is no longer fit and proper to be such a controller. A shareholder controller must notify the BMA where he has reduced or disposed of his holding in a Class 4 insurer where the proportion of the voting rights in the insurer held by him will have reduced or fallen below 10%, 20%, 33% or 50% not later than 45 days after such disposal.
Aspen Bermuda is required to notify the BMA in writing in the event of any person becoming or ceasing to be a controller, a controller being a managing director, chief executive of the insurer or of another company of which it is a subsidiary, or other person in accordance with whose directions or instructions the directors or controllers of the insurer or of another company of which it is a subsidiary are accustomed to act, including any person who holds, or is entitled to exercise, 10% or more of the voting
22
shares or voting power or is able to exercise a significant influence over the management of Aspen Bermuda. Peregrine and Silverton are required to file with the annual statutory financial statements a list of every person who has become or ceased to be a shareholder controller, director or other officer during the financial year.
Each of Aspen Holdings and Aspen Bermuda is required to notify the BMA in writing in the event any person has become or ceased to be an officer of it, an officer being a director, chief executive or senior executive performing duties of underwriting, actuarial, risk management, compliance, internal audit, finance or investment matters. ACM is required to notify the BMA in writing in the event any person becomes or ceases to be a shareholder controller or officer of ACM within 14 days of such change.
Applications were made to the BMA with respect to each of Aspen Bermuda, Peregrine, Silverton and ACM pursuant to change of controller and officer notifications under the Insurance Act in connection with the Merger. The BMA provided its approval in early 2019.
Notification of Material Change.
No insurer shall take any steps to give effect to a material change, unless it has first served such notice on the BMA that it intends to effect such material change and before the end of 30 days, either the BMA has notified such company in writing that it has no objection to such change or that period has lapsed without the BMA having issued a notice of objection.
Designated insurers are also required to give notice to the BMA if any member of its group intends to give effect to any material change as defined under the Insurance Act. The designated insurer shall notify the BMA of any material change, effected by a member of the group, within 30 days of such material change taking effect.
An application was made to the BMA on behalf of Aspen Bermuda pursuant to a material change notification under the Insurance Act in connection with the Merger. The BMA provided its approval in early 2019.
The Bermuda Insurance Code of Conduct.
All Bermuda insurers are required to comply with the BMA’s Insurance Code of Conduct (the “Bermuda Insurance Code”) which was last amended in July 2015. The Bermuda Insurance Code is divided into six categories, including: (i) Proportionality Principle; (ii) Corporate Governance; (iii) Risk Management; (iv) Governance Mechanism; (v) Outsourcing; and (vi) Market Discipline and Disclosure. These categories contain the duties, requirements and compliance standards to be adhered to by all insurers under the Insurance Act. Failure to comply with these requirements will be a factor taken into account by the BMA in determining whether an insurer is conducting its business in a sound and prudent manner under the Insurance Act and could result in the BMA exercising its powers of intervention and will be a factor in calculating the operational risk charge applicable in accordance with that insurer’s risk based capital model.
In 2016, the BMA introduced an Insurance Manager Code of Conduct (the “Manager Code”) that insurance managers such as ACM are required to comply with. The Manager Code establishes duties, requirements and standards to be complied with by insurance managers registered under the Insurance Act, including the procedures and principles to be observed by such persons.
U.K. and E.U. Regulation
General.
U.K. insurance companies are regulated by the Prudential Regulation Authority (the “PRA”) and the Financial Conduct Authority (the “FCA”). The PRA is responsible for the prudential regulation of banks, building societies, credit unions, insurers and major investment firms and the FCA is responsible, among other things, for the regulation of the conduct of business of financial services firms. Aspen U.K. is authorized by the PRA to effect and carry out (re)insurance contracts in the U.K. in all classes of general (non-life) business and is regulated by both the PRA and the FCA for prudential and conduct of business matters, respectively.
An insurance company with authorization to write insurance business in the U.K. may currently provide cross-border services in other member states of the European Economic Area (“EEA”) subject to having notified the appropriate EEA host state regulator via the PRA prior to commencement of the provision of services and the appropriate EEA host state regulator not having good reason to refuse consent. As an alternative, such an insurance company may establish a branch office within another EEA member state, subject to it also notifying the appropriate EEA host state regulator via the PRA. Aspen U.K. notified the Financial Services Authority (the “FSA”) (the PRA’s predecessor) of its intention to write insurance and reinsurance business in all other EEA member states. As a result, Aspen U.K. is licensed to write insurance business under the “freedom of services” within all EEA member states and under the “freedom of establishment” rights in Ireland (freedom of services and freedom of establishment rights together, “Passporting Rights”) contained in the European Council’s Insurance Directives. As a general insurer, Aspen U.K. is able to carry out reinsurance business on a cross-border services basis across the EEA. The PRA is responsible for the prudential regulation of Aspen U.K.’s European branch and the FCA and the Central Bank of Ireland (CBI) is responsible for the conduct of business regulation of the Irish branch.
Following the United Kingdom’s decision to withdraw from the E.U. (“Brexit”), our U.K. operations may lose their EEA financial services Passporting Rights, depending on the U.K.’s withdrawal agreement or any transitional arrangements. Aspen will
23
utilize the newly established Lloyd’s Brussels Subsidiary through Aspen Managing Agency Limited (“AMAL”). The Lloyd’s Brussels Subsidiary is a Lloyd’s insurance company set up in Belgium to ensure Lloyd’s partners can continue to access the market across the EEA. The Lloyd’s Brussels Subsidiary is authorized and regulated by the National Bank of Belgium and regulated by the Financial Services and Markets Authority. The Lloyd’s Brussels Subsidiary commenced writing all non-life risks from non-U.K. EEA countries from January 1, 2019.
To further mitigate against the risks of Brexit, we submitted an application to the Central Bank of Ireland for authorization of a new insurance subsidiary in Dublin, Republic of Ireland. Aspen Ireland will ensure that we can continue serving partners and clients in the EEA following the U.K.’s exit from the E.U. Subject to regulatory approval, it is anticipated that Aspen Ireland will be operational during the first half of 2019.
Depending on the outcome of political negotiations associated with Brexit, it may be necessary for Aspen to undertake portfolio transfers of its EEA insurance policies to allow for contract continuity post-Brexit. Such an undertaking would involve the transfer of all non-U.K. EEA underwriting liabilities existing in relevant insurance classes in Aspen U.K. to Aspen Ireland and allow these liabilities to continue to be administered post-Brexit. A similar transfer of EEA insurance policies would be required between Lloyd’s and Lloyd’s Brussels Subsidiary.
For more information on the uncertainty surrounding the implementation and effect of Brexit, refer to Part I, Item 1A, “Risk Factors — Regulatory Risks — The United Kingdom’s decision to withdraw from the E.U. could adversely impact our business, results of operations and financial condition” below.
Supervision.
The PRA’s most recent review of Aspen U.K. was in April 2018 when they undertook their Periodic Summary Meeting. During 2018, the PRA has focused on underwriting performance in the wider specialty insurance market. Aspen maintains an ongoing dialogue with the PRA on this topic. The FCA last conducted a review of Aspen U.K. in February 2015 and no material issues were raised as a result of this review.
Restrictions on Dividend Payments.
The company law of England and Wales prohibits English companies, including Aspen U.K., AMAL and AUL, from declaring dividends to their shareholders unless they have profits available for distribution. The determination of whether a company has profits available for distribution is based on its accumulated realized profits and other distributable reserves less its accumulated realized losses. While the U.K. insurance regulatory rules impose no statutory restrictions on a general insurer’s ability to declare a dividend, the PRA’s rules require each authorized insurance company within its jurisdiction to maintain its solvency margin at all times. In line with common market practice for regulated institutions, the PRA previously requested that it be afforded with the opportunity to provide a “non-objection” prior to all future dividend payments made by Aspen U.K. In 2017, the PRA stated that they no longer routinely require Aspen U.K. to apply for a non-objection to dividends provided such dividend payment and Aspen U.K.’s resulting capital position are within Aspen U.K.’s board-approved solvency capital risk appetite.
Solvency Requirements.
Under the E.U. directive covering the capital adequacy, risk management and regulatory reporting for insurers (the “Solvency II Directive”), an insurer has the option of seeking the approval of a full or partial internal model from its regulator or to use a standard formula to calculate its capital requirements. On December 5, 2015, Aspen U.K. received approval from the PRA to use an agreed Internal Model to calculate its Solvency Capital Requirement (“SCR”) for Aspen U.K. and Aspen European from January 1, 2016. Aspen U.K. is required to ensure that the Internal Model operates properly on a continuous basis and that it continues to comply with the “Solvency Capital Requirements — Internal Models” provisions as set out in the PRA rulebook and Solvency II Delegated Acts. If Aspen U.K. fails to comply with these requirements, the PRA may revoke its approval for Aspen U.K. to use the Internal Model or apply a capital buffer to the SCR calculated by the Internal Model. Aspen U.K. must maintain the ability to calculate its SCR using the Standard Formula as prescribed by European Insurance and Occupational Pensions Authority (“EIOPA”) in accordance with the Solvency II Directive.
On February 11, 2019, Aspen European and Aspen Holdings (acting as guarantor of Aspen European) entered into an LOC facility agreement with National Australia Bank Limited, London Branch, for the purpose of obtaining a letter of credit in favor of Aspen U.K. for a sum not to exceed $100 million. This facility enables Aspen U.K. to use a letter of credit as Tier 2 Ancillary Own Funds to meet its internal risk appetite requirements above its SCR. Up to 50% of the SCR can be covered by Tier 2 capital as represented by the Ancillary Own Funds. In the event Aspen U.K. demands payment of cash funds under this facility, Aspen Holdings as guarantor would be required to repay the letter of credit.
Aspen U.K. is required to maintain a minimum margin of solvency equivalent to its SCR at all times, the calculation of which depends on the type and amount of insurance business written. The financial resources maintained in support of the SCR must be adequate, both as to amount and quality, to ensure that there is no significant risk that Aspen U.K.’s liabilities cannot be met as they fall due. If the PRA considers that there are insufficient capital resources, it can advise an insurer of the amount and quality of capital resources it considers necessary for that insurer. For more information regarding the risks associated with Solvency II, refer to Part I, Item 1A, “Risk Factors — Regulatory Risks — The E.U. Directive on Solvency II may affect the way in which Aspen U.K. and AMAL manage their businesses.”
24
Under the Solvency II regime, solvency requirements apply to both Aspen U.K. and Aspen European. Aspen U.K. is also required to meet local capital requirements for its branches in Canada, Singapore, Australia and its insurance activities in Switzerland. Aspen U.K. holds capital in excess of all of its regulatory capital requirements as at December 31, 2018.
Solvency II Regime Reports and Returns.
Under the Solvency II regime, Aspen U.K. is required to disclose to the PRA quarterly and annually Quantitative Reporting Templates (“QRTs”) and, at least every three years, a narrative Regular Supervisory Report (“RSR”). The QRTs report quantitative information on a Solvency II and local GAAP basis including, among other things, the balance sheet and own funds, Solvency II capital position, invested assets, premiums, claims and technical provisions, reinsurance and group specific information. The RSR includes both qualitative and quantitative information and is more forward-looking. Aspen U.K. must also complete a set of annual National Specific Templates (“NSTs”) which are only applicable to solo firms (i.e., specific companies as against groups). An annual Solvency and Financial Condition Report (“SFCR”), which must include a mixture of narrative information and a sub-set of the QRTs, must also be submitted and posted on Aspen’s website. Similarly, Aspen U.K. must submit an annual Own Risk and Solvency Assessment (“ORSA”) to the PRA. The ORSA report is produced annually and provides a summary of all of the activity and processes during the preceding year to assess and report on risks and ensure that our overall solvency needs are met at all times including a forward-looking assessment. It also explains the linkages between business strategy, business planning and capital and risk management processes. In 2016, the PRA granted Aspen U.K. a waiver for five years absolving it from the requirement to produce the QRTs, RSR, SFCR and ORSA at EEA-sub-group level due to Aspen Bermuda being subject to equivalent group supervision.
There are additional returns required by local regulators for Aspen U.K.’s branches in Australia, Canada, Ireland, Singapore and Switzerland.
Change of Control Prior Notifications.
The PRA and the FCA regulate the acquisition of “control” of any U.K. insurance company and Lloyd’s managing agent which are authorized under the Financial Services and Markets Act 2000 (“FSMA”). Any legal entity or individual that (together with any person with whom it or he is “acting in concert”) directly or indirectly acquires 10% or more of the shares in a U.K. authorized insurance company or Lloyd’s managing agent, or their parent company, or is entitled to exercise or control the exercise of 10% or more of the voting power in such authorized insurance company or Lloyd’s managing agent or their parent company, would be considered to have acquired “control” for the purposes of the relevant legislation, as would a person who had significant influence over the management of such authorized insurance company or their parent company by virtue of his shareholding or voting power in either. A purchaser of 10% or more of the ordinary shares of the Company would therefore be considered to have acquired “control” of Aspen U.K. or AMAL. Under FSMA, any person proposing to acquire “control” over a U.K. authorized insurance company must give prior notification to the PRA and the FCA of his intention to do so. The PRA and the FCA would then have upwards of sixty working days to consider that person’s application to acquire “control.” Failure to make the relevant prior application could result in action being taken against Aspen U.K. or AMAL (as relevant) by the PRA and the FCA. Failure to make the relevant prior application would constitute criminal offense. A person who is already deemed to have “control” will require prior approval of the PRA and the FCA if such person increases their level of “control” beyond certain percentages. These percentages are 20%, 30% and 50%. Similar requirements apply in relation to the acquisition of control of a U.K. authorized person which is an insurance intermediary (such as AUKSSL and ARML) except that the threshold triggering the requirement for prior approval is 20% of the shares or voting power in the insurance intermediary or its parent company. The approval of the Council of Lloyd’s is also required in relation to the change of control of a Lloyd’s managing agent or member. Broadly, Lloyd’s applies the same tests in relation to control as are set out in FSMA (see above) and in practice coordinates its approval process with that of the PRA. Change of control applications have been filed by Highlands in connection with the Merger and those applications were approved in early 2019.
PRA, FCA and Bank of England Powers Over Unregulated Parent Companies.
The Financial Services Act 2012 created additional powers for the FCA, PRA and the Bank of England to impose requirements on U.K. parent companies, such as Aspen European, of certain regulated firms. The powers allow the regulators to: (i) direct qualifying parent undertakings to comply with specific requirements; (ii) take enforcement action against qualifying parent undertakings if those directions are breached; and (iii) gather information from qualifying parent undertakings. For example, if an authorized firm is in crisis, the new powers may allow a regulator to direct a parent company to provide that firm with capital or liquidity necessary to improve the position of the firm. The definition of “qualifying parent undertakings” could allow the regulators to exercise these powers against an intermediate U.K. parent company of an insurer that is not at the head of the ownership chain. How the FCA, PRA and Bank of England will exercise these powers over unregulated holding companies remains uncertain but the FCA, PRA and Bank of England have indicated that they will be used rarely and only where the other regulatory tools available are ineffective.
Senior Managers and Certification Regime.
In December 2018, the FCA and PRA extended the application of the Senior Managers & Certification Regime, which previously applied to U.K.-regulated entities in the banking sector, to insurers, reinsurers, Lloyd’s managing agencies, insurance intermediaries and other U.K.-regulated entities. The Senior Managers & Certification Regime (“SM&CR”) is an enhanced individual accountability framework which builds upon and replaces the existing regulatory framework of the Senior Insurance Managers Regime. The SM&CR seeks to ensure that senior persons who are effectively running
25
insurance firms, or who have responsibility for other key functions at those firms, meet standards of fitness and propriety for acting with integrity, honesty and skill and that senior management be responsible for compliance with U.K. regulatory requirements.
Insurance Distribution Directive.
On October 1, 2018, the Insurance Distribution Directive (“IDD”) replaced the Insurance Mediation Directive (“IMD”). While IMD only applied to insurance intermediaries, IDD applies to all those who conduct insurance distribution to customers, such as insurers (i.e., Aspen U.K.), Lloyd’s managing agencies (i.e., AMAL), insurance intermediaries (i.e., AUKSSL and ARML) and firms such as banks or retailers who provide insurance alongside their primary business and whose customers range from individual consumers to large multinational organizations. The main provisions of IDD include remuneration disclosure, cross-selling limitations and professional training requirements.
Branch Regulations
Switzerland
General.
Aspen U.K. established a branch in Zurich, Switzerland in 2007 to write property and casualty reinsurance. The Federal Office of Private Insurance, a predecessor to the Financial Markets Supervisory Authority (“FINMA”) confirmed that such reinsurance operations were not subject to its supervision under the Insurance Supervision Act (Switzerland), so long as the Swiss branch only writes reinsurance.
In 2010, Aspen U.K. received approval from FINMA to establish an insurance branch in Zurich, Switzerland. The activities of the Switzerland insurance branch are regulated by FINMA pursuant to the Insurance Supervision Act (Switzerland). In 2016, it was confirmed that FINMA was obliged to supervise the reinsurance operations of Aspen U.K.’s Swiss branch as a result of having both insurance and reinsurance operations in Switzerland. Effective 2017, we decided to no longer write insurance business via the insurance branch in Switzerland.
Supervision.
FINMA conducted a review of Aspen U.K.’s Swiss operations in November 2018. No material issues were identified.
Singapore
General.
In 2008, Aspen U.K. received approval from the Monetary Authority of Singapore (“MAS”) to establish a reinsurance branch in Singapore. The activities of the Singapore branch are regulated by the MAS pursuant to The Insurance Act of Singapore. Aspen U.K. is also registered by the Accounting and Corporate Regulatory Authority (“ACRA”) as a foreign company in Singapore and in that capacity is separately regulated by ACRA pursuant to The Companies Act of Singapore. AMAL set up a subsidiary company, Aspen Singapore Pte. Ltd. (“ASPL”), to access insurance business in Singapore and regulatory approval for ASPL to act as an intermediary was received from MAS in 2015. ASPL was incorporated by ACRA in 2015 as a local company regulated by the Companies Act of Singapore.
Supervision.
The MAS conducted a review in August 2016 of the Singapore branch of Aspen U.K. No material issues were identified.
Canada
General.
Aspen U.K. has a Canadian branch whose activities are regulated by the Office of the Superintendent of Financial Institutions (“OSFI”). OSFI is the federal regulatory authority that supervises Canadian and non-Canadian insurance companies operating in Canada pursuant to the Insurance Companies Act (Canada). In addition, the branch is subject to the laws and regulations of each of the provinces and territories in which it is licensed.
Supervision.
OSFI carried out an inspection visit to the Canadian branch of Aspen U.K. in September 2014. No material issues were identified. OSFI has informed us that it plans to conduct a review of our Canadian branch in April 2019.
Australia
General.
In 2008, Aspen U.K. received authorization from the Australian Prudential Regulation Authority (“APRA”) to establish a branch in Australia. The activities of the Australian branch are regulated by APRA pursuant to the Insurance Act of Australia 1973. Aspen U.K. is also registered by the Australian Securities and Investments Commission as a foreign company in Australia under the Corporations Act of Australia 2001.
Supervision.
APRA undertook a review of Aspen U.K.’s Australian branch in November 2018. No material issues were identified.
26
For additional information on our branches, refer to Note 19(a) of our consolidated financial statements, “Commitments and Contingent Liabilities — Restricted Assets.”
Other Regulated Firms
General
. AUKSSL (previously APJ Services Limited) and ARML are authorized and regulated by the FCA. Both companies are subject to a separate prudential regime and other requirements for insurance intermediaries under the FCA Handbook.
Dubai
General.
AUKSSL established a branch in Dubai through which it places reinsurance business into Aspen U.K. The Dubai Financial Services Authority (“DFSA”) confirmed its approval of the branch in 2015. The DFSA undertook a review of AUKSSL’s Dubai branch in June 2018. No material issues were identified.
Lloyd’s Regulation
General.
We participate in the Lloyd’s market through our ownership of AMAL and AUL. AMAL is the managing agent for Syndicate 4711. AUL provides underwriting capacity to Syndicate 4711 and is a Lloyd’s corporate member. AMAL is authorized by the PRA and regulated by the FCA and the PRA. AMAL received FSA (predecessor to the PRA and FCA) authorization in 2008. Our Lloyd’s operations are also subject to supervision by the Council of Lloyd’s. AMAL received authorization from Lloyd’s for Syndicate 4711 in 2008. The PRA and the FCA have been granted broad authorization and intervention powers as they relate to the operations of all insurers, including Lloyd’s syndicates, operating in the U.K. The Lloyd’s market is authorized by the PRA and regulated by both the PRA and the FCA and is required to implement certain rules prescribed by the PRA and the FCA, which it does by the powers it has under the Lloyd’s Act 1982 relating to the operation of the Lloyd’s market. Lloyd’s prescribes, in respect of its managing agents and corporate members, certain minimum standards relating to their management and control, solvency and various other requirements. The PRA and the FCA directly monitor Lloyd’s managing agents’ compliance with their own regulatory requirements. If it appears to the PRA or the FCA that either Lloyd’s is not fulfilling its regulatory responsibilities or that managing agents are not complying with the applicable regulatory rules and guidance, they may intervene in accordance with their powers under the FSMA. By entering into a membership agreement with Lloyd’s, AUL undertakes to comply with all Lloyd’s byelaws and regulations as well as the provisions of the Lloyd’s Acts and FSMA that are applicable to it. The operation of Syndicate 4711, as well as AMAL and their respective directors, are subject to the Lloyd’s supervisory regime.
Supervision.
AMAL was in scope for the PRA Periodic Summary Meeting performed in April 2018. The small number of actions arising from the review have been completed.
Solvency Requirements.
Underwriting capacity of a member of Lloyd’s must be supported by providing a deposit (referred to as “Funds at Lloyd’s”) in the form of cash, securities or letters of credit in an amount determined in accordance with Lloyd’s requirements and the Solvency II regime. The amount of such deposit is calculated for each member through the completion of an annual capital adequacy exercise. Under these requirements, Lloyd’s must demonstrate that each member has sufficient assets to meet its underwriting liabilities plus a required solvency margin. This margin can have the effect of reducing the amount of funds available to distribute as profits to the member or increasing the amount required to be funded by the member to cover its solvency margin. In 2015, Lloyd’s received confirmation that its application to use its Internal Model to calculate its SCR was approved by the PRA. Effective in 2016, Lloyd’s Internal Model has been used to calculate Lloyd’s capital requirement.
Restrictions.
A Reinsurance to Close (“RITC”) is a reinsurance contract to transfer the responsibility for discharging all the liabilities that attach to one year of account of a syndicate into a later year of account of the same or different syndicate in return for a premium. A RITC is usually put in place after the third year of operations of a syndicate year of account. If the managing agency concludes that an appropriate RITC for a syndicate that it manages cannot be determined equitably or negotiated on commercially acceptable terms in respect of a particular underwriting year, the underwriting year must remain open and be placed into run-off. During this period there cannot be a release of the Funds at Lloyd’s of a corporate member that is a member of that syndicate without the consent of Lloyd’s and such consent will only be considered where the member has surplus Funds at Lloyd’s.
Intervention Powers.
The Council of Lloyd’s has wide discretionary powers to regulate members’ underwriting at Lloyd’s. It may, for instance, change the basis on which syndicate expenses are allocated or vary the Funds at Lloyd’s or the investment criteria applicable to the provision of Funds at Lloyd’s. Exercising any of these powers might affect the return on an investment of the corporate member in a given underwriting year. Further, the annual business plans of a syndicate are subject to the review and approval of the Lloyd’s Franchise Board. The Franchise Board is responsible for setting risk management and profitability targets for the Lloyd’s market and operates a business planning and monitoring process for all syndicates.
If a member of Lloyd’s is unable to pay its debts to policyholders, such debts may be payable by the Lloyd’s Central Fund, which in many respects acts as an equivalent to a state guaranty fund in the United States. If Lloyd’s determines that the Central
27
Fund needs to be increased, it has the power to assess premium levies on current Lloyd’s members. The Council of Lloyd’s has discretion to call or assess up to 3% of a member’s underwriting capacity in any one year as a Central Fund contribution. Our syndicate capacity for the
2019
underwriting year is
$611.3 million
(
2018
underwriting year —
$736.0 million
). Above this level, it requires consent of members voting at a general meeting.
Jersey Regulation
General.
In 2010, we purchased APJ Jersey, a Jersey registered insurance company which is subject to the jurisdiction of the Jersey Financial Services Commission (“JFSC”). The JFSC sets the solvency regime for insurance companies under its jurisdiction. APJ Jersey holds funds in excess of the minimum requirement.
Supervision.
JFSC undertook a review of APJ Jersey in March 2013. No material matters were identified.
U.S. Regulation
General.
AAIC is a Texas-domiciled insurance company and is licensed to write insurance on an admitted basis in 50 U.S. states, the District of Columbia, Puerto Rico and the U.S. Virgin Islands. In addition, AAIC is a certified surety company approved by the U.S. Department of the Treasury.
We also write surplus lines policies through Aspen Specialty, Aspen U.K. and AMAL. Aspen Specialty is an insurance company domiciled and licensed in North Dakota and is therefore subject to North Dakota laws and regulations applicable to domestic insurers. Although Aspen Specialty is not licensed in any other state, it is eligible to write surplus lines policies on a non-admitted basis in all other U.S. states and the District of Columbia. Aspen Specialty accepts business only through licensed surplus lines brokers and does not market directly to the public.
Aspen U.K. is not licensed to write insurance on an admitted basis in any state in the U.S. but, as an alien insurer, it is eligible to write surplus lines business in all 50 U.S. states, the District of Columbia and other U.S. jurisdictions based on its listing in the Quarterly Listing of Alien Insurers of the International Insurers Department (“IID”) of the National Association of Insurance Commissioners (“NAIC”). Pursuant to IID requirements, Aspen U.K. has established a U.S. surplus lines trust fund with a U.S. bank to secure U.S. surplus lines policies. Syndicate 4711 also appears on the IID listing. As of
December 31, 2018
, Aspen U.K.’s and Syndicate 4711’s surplus lines trust funds were
$198.8 million
.
Following the enactment of the Non-Admitted and Reinsurance Reform Act (the “NRRA”) as part of the Dodd-Frank Wall Street Reform and Consumer Protection Act (the “Dodd-Frank Act”), no U.S. state can prohibit a surplus lines broker from placing business with a non-admitted insurer domiciled outside the U.S., such as Aspen U.K., that appears on the IID. IID listed insurers are required to report and continually maintain a capital and/or surplus amount of $45 million. As a matter of U.S. federal law, this means that Aspen U.K. should be surplus lines eligible in every U.S. state, even in states where Aspen U.K. has not previously been an eligible surplus lines insurer. Some states have developed eligibility standards and filing requirements separate from the IID listing, and our satisfaction of this additional listing or filing requirement is necessary to maintain our eligibility and acceptance by surplus lines brokers in those states.
Aspen Specialty, Aspen U.K. and AMAL are subject to limited state insurance regulations in states where they are surplus lines eligible. Specifically, rate and form regulations otherwise applicable to admitted insurers generally do not apply to Aspen Specialty, Aspen U.K. and AMAL’s surplus lines transactions. In addition, because Aspen U.K. and AMAL are not licensed under the laws of any U.S. state, U.S. solvency regulation tools otherwise applicable to admitted insurers do not generally apply to Aspen U.K. and AMAL. However, Aspen U.K. and AMAL are subject to federal and state incidental regulations in areas such as those pertaining to federal and state reporting related to terrorism coverage and post-disaster emergency orders. We monitor federal and state regulations and directives and comply as necessary for all affected subsidiaries.
Aspen Management is a Massachusetts corporation licensed as a surplus lines broker in Massachusetts, Connecticut, Georgia, New York and Texas. ASIS is a California limited liability company licensed as a surplus lines broker in California. Aspen Management and ASIS serve as surplus lines brokers only for companies within the Aspen Group and do not act on behalf of non-Aspen third parties or market directly to the public.
Aspen Re America is a Delaware corporation and functions as a reinsurance intermediary with offices in Connecticut, Florida, Georgia, Illinois and New York. Aspen Re America acts as a reinsurance intermediary for Aspen U.K. and as an approved Lloyd’s coverholder for the purpose of accessing certain non-U.S. business for AMAL only. Aspen Re America does not provide reinsurance intermediary services for non-Aspen third parties or market directly to the public.
Aspen U.S. Services is a Delaware corporation that provides administrative and technical services to our U.S. entities, primarily from our Rocky Hill, Connecticut office. It is authorized to contract such business in the various states where we have physical offices. No filings are required with state insurance departments.
28
In December 2017, Aspen U.S. Holdings sold all AgriLogic subsidiaries, except AgriLogic Consulting, to CGB DS, a Louisiana corporation, in exchange for a 23.2% stake in the newly formed company, Crop Re, a Delaware limited liability company responsible for directing the placement of reinsurance on behalf of CGB DS and CGBIC, an Indiana insurance company affiliate of CGB DS and a Risk Management Agency licensed crop insurer. The remaining 76.8% of Crop Re is owned by CGB DS. AAIC’s primary crop insurance coverage will be run-off and AAIC, or an affiliate of AAIC, will provide quota share reinsurance to CGBIC for both federal and state regulated crop insurance as part of Aspen’s ownership in Crop Re. For more information on Crop Re, refer to Note 6 of our consolidated financial statements, “Investments.” Effective February 1, 2018, Aspen U.S. Holdings sold 50% of AgriLogic Consulting to one of the original founders of AgriLogic and 10% to CGB DS in exchange for a percentage of future cash flows of AgriLogic Consulting. Aspen U.S. Holdings retains a 40% interest in AgriLogic Consulting.
Blue Waters Insurers, Corp. is a Puerto Rico licensed insurance producer that is authorized to issue marine coverage on behalf of AAIC. Puerto Rico is a territory of the U.S. and an NAIC accredited jurisdiction.
State Insurance Holding Company Acts.
Aspen Specialty and its affiliates are subject to the insurance holding company laws of North Dakota, and AAIC and its affiliates are subject to the insurance holding company laws of Texas. The holding company laws require that each U.S. insurance company within the holding company system furnish annual information about certain transactions with affiliated companies. Generally, all material transactions among companies in the holding company system affecting Aspen Specialty or AAIC, including sales, loans, reinsurance agreements, service agreements and dividend payments, must be fair and, if material or of a specified category, require prior notice and approval or non-disapproval by the North Dakota Commissioner of Insurance for Aspen Specialty or the Texas Commissioner of Insurance for AAIC.
The insurance holding company laws of North Dakota and Texas also require the annual submission of an enterprise risk report by a domestic insurer’s ultimate controlling person identifying risks likely to have a material adverse effect upon the financial condition or liquidity of such insurer or its insurance holding company system as a whole.
Change of Control Prior Notifications.
Before a person can acquire control of a U.S. domestic insurer or its holding company (or any person controlling such domestic insurer or holding company), such as the Company, prior written approval must generally be obtained from the insurance commissioner of the state where the insurer is domiciled. A person is generally presumed to have acquired “control” if it acquires, directly or indirectly, 10% or more of the voting securities of a U.S. domestic insurer or its holding company. This statutory presumption of control may be rebutted by a showing that control does not exist in fact.
Prior to granting approval of a “Form A” application to acquire control of a domestic insurer or its holding company, the domiciliary state insurance commissioner will consider such factors as the financial strength of the proposed acquirer, the integrity and management of the acquirer’s board of directors and executive officers, the acquirer’s plans for the future operations of the domestic insurer and any anti-competitive results that may arise from the consummation of the acquisition of control. These laws also require prior notice of a proposed divestiture of a controlling interest in a domestic insurer or its holding company. These laws may discourage potential acquisition or divestiture proposals and may delay, deter or prevent a change of control involving us, including through unsolicited transactions that some or all of our shareholders might consider to be desirable.
In connection with the Merger, Highlands filed a Form A change of control application with the Texas Department of Insurance in respect to AAIC in October 2018 and made a similar change of control filing in November 2018 with the North Dakota Insurance Department with respect to Aspen Specialty. North Dakota approved the Aspen Specialty change of control in November 2018 and Texas approved the AAIC change of control in February 2019.
State Insurance Regulation.
State insurance authorities have broad authority to regulate admitted insurance business, including licensing, admitted assets, capital and surplus, market conduct, regulating unfair trade and claims practices, establishing reserve requirements or solvency standards, filing of rates and forms and regulating investments and dividends.
AAIC and Aspen Specialty prepare statutory financial statements in accordance with Statutory Accounting Principles (“SAP”) and procedures prescribed or permitted by applicable domiciliary states. State insurance laws and regulations require Aspen Specialty and AAIC to file statutory financial statements with insurance departments in every state where they are licensed. State insurance departments also conduct periodic examinations of the books and records, financial reporting, policy filings and market conduct of insurance companies licensed in their states. Coordinated financial examinations are generally carried out every five years by the insurance departments of the domiciliary states under guidelines promulgated by the NAIC. In 2014, AAIC and ASIC completed Texas and North Dakota financial examinations for the five-year period ending December 31, 2012 and no material issues were identified. A routine financial examination of AAIC and ASIC commenced in late 2017 for the period January 1, 2013 through December 31, 2017 for which no report has yet been issued.
Statutory Accounting Principles.
SAP is a basis of accounting developed to assist insurance regulators in monitoring and regulating the solvency of insurance companies. SAP is generally designed to report information in respect of an insurance company’s ability to meet its obligations to policyholders and claimants, and focuses on surplus adequacy. Accordingly, statutory
29
accounting focuses on valuing assets and liabilities of insurers at financial reporting dates in accordance with appropriate insurance law and regulatory provisions applicable in each insurer’s domiciliary state.
U.S. GAAP is concerned with a company’s solvency but it is also concerned with other financial measurements, such as income and cash flows. Accordingly, U.S. GAAP gives more consideration to appropriate matching of revenue and expenses and accounting for management’s stewardship of assets than does SAP. As a direct result, different assets and liabilities and different amounts of assets and liabilities will be reflected in financial statements prepared in accordance with U.S. GAAP as opposed to SAP.
The application of the SAP rules on AAIC and Aspen Specialty, established by the NAIC and adopted by the Departments of Insurance of the states, establishes, among other things, the amount of statutory surplus and statutory net income of our U.S. Operating Subsidiaries and thus determines, in part, the amount of funds they have available to pay as dividends to parent company entities.
State Dividend Limitations.
Under North Dakota and Texas law, respectively, Aspen Specialty and AAIC may only pay dividends out of earned surplus as distinguished from contributed surplus. In addition, under North Dakota and Texas law, an insurance company’s policyholder surplus after payment of a dividend must be reasonable in relation to its outstanding liabilities and adequate for its financial needs.
In addition, the ability of Aspen Specialty or AAIC to declare extraordinary dividends is subject to prior approval of the applicable state insurance regulator. The North Dakota insurance law defines an extraordinary dividend as a dividend that exceeds, together with all dividends declared or distributed by the insurer within the preceding twelve months, the lesser of:
|
•
|
10% of its policyholders surplus as of the preceding December 31; or
|
|
•
|
the net income, not including realized capital gains, for the preceding calendar year.
|
The Texas insurance law defines an extraordinary dividend as a dividend that exceeds, together with all dividends declared or distributed by the insurer within the preceding twelve months, the greater of:
|
•
|
10% of its policyholders surplus as of the preceding December 31; or
|
|
•
|
the net income for the preceding calendar year.
|
Aspen U.S. Holdings must also meet its own dividend eligibility requirements under Delaware corporate law in order to distribute any dividends received from Aspen Specialty and AAIC. In particular, any dividend paid by Aspen U.S. Holdings must be declared out of surplus or net profits.
The dividend limitations imposed by the North Dakota and Texas insurance laws are based on the financial results of Aspen Specialty and AAIC determined by using SAP accounting practices, which differ in certain respects from accounting principles used in financial statements prepared in conformity with U.S. GAAP. The significant differences relate to deferred acquisition expenses, deferred income taxes, required investment reserves, reserve calculation assumptions and surplus notes. Since both North Dakota and Texas law require insurance companies to pay dividends out of earned surplus as distinguished from contributed surplus, neither Aspen Specialty nor AAIC could pay a dividend as of
December 31, 2018
.
Own Risk and Solvency Assessment (ORSA).
The North Dakota and Texas insurance laws require an insurer, or the insurance group, to conduct an internal own risk and solvency assessment at least annually of such insurer’s material risks in normal and stressed environments and submit an annual summary report, which is a confidential assessment of the material and relevant risks associated with such insurer’s business plan, as well as the sufficiency of its capital resources to support these risks. We have filed the annual required summary report of our own risk and solvency assessment with the Texas Department of Insurance, our lead U.S. insurance regulator.
Cybersecurity Regulations.
In 2017, new cybersecurity rules took effect for financial institutions, insurers and certain other companies supervised by the New York Department of Financial Services (the “NYDFS Cybersecurity Regulation”), such as AAIC, which is licensed in New York. The NYDFS Cybersecurity Regulation imposes significant regulatory burdens intended to protect the confidentiality, integrity and availability of information systems.
In 2017, the NAIC also adopted the Insurance Data Security Model Law (the “Cybersecurity Model Law”). The Cybersecurity Model Law requires insurers, insurance producers and other entities required to be licensed under state insurance laws to comply with certain requirements under state insurance laws, such as developing and maintaining a written information security program, conducting risk and overseeing the data security practices of third-party vendors. The Cybersecurity Model Law closely resembles the NYDFS Cybersecurity Regulation and has been adopted by several U.S. states. If all U.S. states fail to enact the Cybersecurity Model Law within the next five years, federal legislation in this area may be enacted to pre-empt state law.
30
State Risk-Based Capital Regulations.
Most states require their domestic insurers to annually report their risk-based capital based on a formula that takes into account the risk characteristics of the insurer, including asset risk, insurance risk, interest rate risk and business risk. The states use the formula as an early warning regulatory tool to identify possibly inadequately capitalized insurers for the purposes of initiating regulatory action, and not as a means to rank insurers generally. Most states’ insurance law imposes broad confidentiality requirements on those engaged in any manner in the insurance business and on the regulator as to the use and publication of risk-based capital data. The regulator typically has explicit regulatory authority to require various actions by, or to take various actions against, insurers whose total adjusted capital does not exceed certain risk-based capital levels.
Additionally, since February 2016, the NAIC has been developing a methodology for the calculation of group capital for all entities in an insurance holding company system. The goal is to provide a simple method for U.S. regulators to aggregate the available capital and the minimum capital of each entity in a group in a way that applies to all companies regardless of their structure. One conceptual issue with the group capital calculation is its intended use, which regulators have still not articulated, other than characterizing it as “another regulatory tool,” rather than a regulatory requirement. While the group capital calculation is still under discussion and will be field tested by volunteers in 2019, it is expected that the new group capital calculation tool will use a risk-based capital aggregation methodology.
Residual Market Mechanisms and Guaranty Funds.
Licensed and admitted U.S. insurers such as Aspen Specialty and AAIC are required to participate in various state residual market mechanisms whose goal is to provide affordability and availability of insurance to those consumers who may not otherwise be able to obtain insurance, including, for example catastrophe insurance in high-risk areas. The mechanics of how each state’s residual markets operate may differ, but generally, risks are either assigned to various private carriers or the state manages the risk through a pooling arrangement. If losses exceed the funds the pool has available to pay those losses, the pools have the ability to assess insurers to provide additional funds to the pool. The amounts of the assessment for each company are normally based upon the proportion of each insurer’s (and in some cases the insurer’s and its affiliates’) written premium for coverages similar to those provided by the pool, and are frequently uncapped. State guaranty associations also have the ability to assess licensed U.S. insurers in order to provide funds for payment of losses for insurers which have become insolvent. In many cases, but not all, assessed insurers may recoup the amount of these guaranty fund and state pool assessments through premium rates, premium tax credits or policy surcharges.
Operations of Aspen U.K. and Aspen Bermuda.
Aspen U.K. and Aspen Bermuda are not admitted to engage in the business of insurance in the U.S. although, as stated above, Aspen U.K. and Syndicate 4711, due to their inclusion in the NAIC Quarterly Listing of Alien Insurers, are eligible to write surplus lines business as alien, non-admitted insurers in all 50 U.S. states, the District of Columbia and other U.S. jurisdictions, such as Puerto Rico, in accordance with the Dodd-Frank Act. The laws of most states regulate or prohibit the sale of insurance and reinsurance within their jurisdictions by non-admitted insurers and reinsurers. We do not intend that Aspen Bermuda maintain an office or solicit, advertise, settle claims or conduct other insurance activities in any jurisdiction other than Bermuda where the conduct of such activities would require Aspen Bermuda to be so admitted. Aspen U.K. does not maintain an office in the U.S. but it reinsures U.S. primary risk as an alien accredited/trusteed reinsurer in 50 U.S. states and the District of Columbia and, as noted above, writes excess and surplus lines business as an eligible, but non-admitted, alien surplus lines insurer. It accepts business only through U.S. licensed surplus lines brokers and does not market directly to the public. Although it does not underwrite or handle claims directly in the U.S., Aspen U.K. may grant limited underwriting authorities and retain third-party administrators, duly licensed, for the purpose of facilitating U.S business. Aspen U.K. has also issued limited underwriting authorities to various affiliated U.S. entities described above.
In addition to the regulatory requirements imposed by the jurisdictions in which they are licensed, reinsurers’ business operations are affected by regulatory requirements in various U.S. states governing “credit for reinsurance” laws imposed on ceding companies. In general, a ceding company which obtains reinsurance from a reinsurer that is licensed, accredited, authorized or approved by the jurisdiction or state in which the reinsurer is domiciled is permitted to take a credit on its statutory financial statements in an aggregate amount equal to the liability for unearned premiums (which are that portion of premiums written which applies to the unexpired portion of the policy period) and loss reserves and loss adjustment expense reserves ceded to the reinsurer. However, cedants are permitted to take a credit to statutory surplus resulting from reinsurance obtained from a non-licensed and non-accredited reinsurer only to the extent that the reinsurer provides a letter of credit, trust account or other acceptable security arrangement.
For its U.S. reinsurance activities, Aspen U.K. has established and must maintain a multi-beneficiary U.S. trust fund for the benefit of its U.S. cedants so that they are able to take financial statement credit for reinsurance without the need for Aspen U.K. to post contract-specific security. The minimum trust fund amount is $20.0 million plus an amount equal to 100% of Aspen U.K.’s U.S. reinsurance liabilities collateralized under this arrangement. The total market value of assets in the Aspen U.K. multi-beneficiary trust were
$1,336.4 million
as at
December 31, 2018
and
$1,350.9 million
as at December 31,
2017
. For its U.S. reinsurance activities, Aspen Bermuda likewise has established and must maintain a multi-beneficiary U.S. trust fund for the benefit of its U.S. cedants so that they are able to take financial statement credit for reinsurance without the need for Aspen Bermuda to post contract specific security. The minimum trust fund amount is $20.0 million plus an amount equal to 100% of Aspen Bermuda’s U.S. reinsurance liabilities collateralized under this arrangement. As further explained below, Aspen Bermuda obtained
31
approval to post reduced collateral in Florida, New York and North Dakota (i.e., 20% versus 100%). As at
December 31, 2018
, the total value of assets held in the Aspen Bermuda multi-beneficiary trust were
$1,112.4 million
(
2017
—
$1,333.6 million
).
As a result of the Dodd-Frank Act, only a ceding insurer’s state of domicile can dictate the credit for reinsurance requirements. Other NAIC jurisdictions in which a ceding insurer is licensed are no longer able to require additional collateral from non-admitted reinsurers or otherwise impose their own credit for reinsurance laws on ceding insurers domiciled in other states. In 2011, the NAIC adopted revisions to its Credit for Reinsurance Model Law and Model Regulation (together the “Amended Credit for Reinsurance Model Act”). As at December 1, 2017, the Amended Credit for Reinsurance Model Act has been adopted in at least 34 states, including Texas, where the law took effect on January 1, 2018 and North Dakota, where the law took effect on January 1, 2016. In those states that have adopted the Amended Credit for Reinsurance Model Act and adopted regulations to establish application and approval procedures, qualifying non-admitted reinsurers domiciled in “qualified jurisdictions” who meet certain minimum rating and capital requirements would, upon application to and approval by the state Insurance Departments, be permitted to post less than the 100% collateral currently required with respect to a cedant domiciled in that state. Bermuda is among the approved “qualified jurisdictions” which allows U.S. states that have adopted the Amended Credit for Reinsurance Model Act to implement reduced collateral requirements with respect to reinsurers domiciled in Bermuda, such as Aspen Bermuda. Aspen Bermuda has obtained approval to post reduced collateral in Florida, New York and North Dakota (i.e., 20% versus 100%). Texas promulgated regulations, effective June 19, 2018, that permit a reinsurer to post less than 100% collateral. We will continue to monitor developments in collateral reduction with a view to seeking approval to post reduced collateral in other relevant states over time.
Further, the Dodd-Frank Act authorizes the U.S. Department of Treasury and the Office of the U.S. Trade Representative to negotiate covered agreements governing certain matters relating to insurance with foreign jurisdictions, including reinsurance collateral, group supervision and exchange of information between supervisory authorities. Such covered agreements could pre-empt state insurance laws. In September 2017, the U.S. federal authorities and the E.U. signed a covered agreement and, in response to Brexit, the U.S. and U.K. signed a covered agreement in December 2018 consistent with the U.S. and E.U. agreement. In terms of reinsurance, both covered agreements eliminate collateral and local presence requirements for alien reinsurers operating in non-domestic markets. In connection with an alien reinsurer’s assumption of insurance business from a U.S. cedant, both covered agreements give U.S. states five years from execution to remove existing reinsurance collateral requirements for alien reinsurers that meet certain standards. These standards include minimum capital and solvency ratios, confirmation of financial condition by the reinsurer’s domestic regulator and claims payment standards. If U.S. states do not remove such reinsurance collateral requirements within the five year period, U.S. state credit for reinsurance laws could be subject to federal collateral reduction legislation that pre-empts the state laws.
The NAIC is working on proposed amendments to the Amended Credit for Reinsurance Model Act and Model Regulation in order to satisfy the substantive and timing requirements of the covered agreements. In addition to removing the reinsurance collateral obligations for alien reinsurers, the proposed NAIC amendments would also provide a means by which reinsurers domiciled in other qualifying non-U.S. jurisdictions as well as reinsurers domiciled in qualifying states can achieve equivalent reinsurance collateral status for reinsurance contracts with U.S. insurers.
Lloyd’s is licensed as a market in Illinois, Kentucky and the U.S. Virgin Islands to write insurance business. It is also eligible to write surplus lines and reinsurance business in all other U.S. states and territories. Lloyd’s as a whole makes certain returns to U.S. regulators and each syndicate makes quarterly trust returns to the New York Department of Financial Services with respect to its surplus lines and reinsurance business. Separate trust funds are in place to support this business.
As at
December 31, 2018
, Syndicate 4711 had
$75.2 million
(December 31, 2017 —
$73.1 million
) held in trust for its surplus lines business and
$43.1 million
(December 31, 2017 —
$49.3 million
) held in trust for its reinsurance business.
Investment adviser regulation.
Our subsidiary Aspen Capital Advisors Inc. (“Aspen Advisors”) is registered with the SEC as a registered investment adviser. Aspen Advisors is the investment adviser to a private investment fund that primarily invests in securities tied to weather, natural disasters or other insurance risks as well as certain collateralized property catastrophe reinsurance contracts. In the future, Aspen Advisors may form and manage additional privately offered pooled investment vehicles, customize funds for single investors or groups of investors or manage separately managed accounts of other qualified clients on a limited basis. Aspen Advisors net assets under management as at
December 31, 2018
were
$86.3
million (December 31, 2017 —
$91.9 million
), all of which were managed on a discretionary basis. The amount disclosed differs from Aspen Advisors “regulatory assets under management” disclosed in Part 1 of its Form ADV, which is calculated in accordance with the requirements of that form.
Aspen Advisors is subject to regulation as an investment adviser by the SEC. Federal and state securities laws and regulations are primarily intended to protect investors in the securities markets and generally grant regulatory agencies broad rulemaking and enforcement powers, including the power to limit or restrict the conduct of business for failure to comply with such laws and regulations. The SEC and state securities regulatory authorities from time to time may make inquiries and conduct examinations regarding compliance by Aspen Advisors with securities and other laws and regulations. We intend to cooperate with such inquiries and examinations and take corrective action when warranted. Aspen Advisors may also be subject to similar laws and regulations
32
in foreign countries if it provides investment advisory services, offers products similar to those described above or conducts other activities.
Available Information
Our website is maintained at www.aspen.co. The information on our website is not incorporated by reference in this report. We make available, free of charge through our website, our Annual Reports on Form 10-K, Quarterly Reports on Form 10-Q, Current Reports on Form 8-K and amendments to those reports filed or furnished pursuant to Section 13(a) or 15(d) of the Exchange Act as soon as reasonably practicable after we electronically file such material with, or furnish such material to, the SEC. We also make available, free of charge from our website, our Code of Business Conduct and Ethics, Corporate Governance Guidelines, Audit Committee Charter, Compensation Committee Charter, Corporate Governance and Nominating Committee Charter, Disclosure Policy and Director Independence Standards. Such information is also available in print for any shareholder who sends a request to Aspen Insurance Holdings Limited, Attention: Company Secretary, 141 Front Street, Hamilton HM19, Bermuda.
The SEC maintains an internet site that contains reports, proxy and information statements, and other information regarding issuers, including the Company, that file electronically with the SEC. The address of the SEC’s website is www.sec.gov.
33
|
Item 1A.
|
Risk Factors
|
You should carefully consider the following risk factors and all other information set forth in this report, including our consolidated financial statements and the notes thereto. Any of the risks described below could materially and adversely affect our business, operating results or financial condition and could cause the trading price of our securities to decline significantly. The risk factors described below could also cause our actual results to differ materially from those in the forward-looking and other statements contained in this report and other documents that we file with the SEC. The risks and uncertainties described below are not the only ones we face. However, these are the risks we believe to be material as of the date of this report. Additional risks not presently known to us or that we currently deem immaterial may also impair our future business or operating results.
Introduction
As with any publicly traded company, investing in our equity and debt securities carries risks. Our risk management strategy is designed to identify, measure, monitor and manage material risks that we can control and which could adversely affect our financial condition and operating results. We have invested significant resources to develop the appropriate risk management policies and procedures to implement this strategy. Nonetheless, the future business environment is intrinsically uncertain and difficult to forecast and, as a result, our risk management methods may not be successful. For more information on our risk management strategy, refer to Part I, Item 1, “Business — Risk Management — Risk Management Strategy.”
Risks Relating to the Merger
Failure to consummate the Merger within the expected time frame or at all could have a material adverse impact on our business, financial condition and results of operations.
There can be no assurance that the Merger will be consummated. The Merger is subject to the satisfaction or waiver of a number of conditions, including, among others, the maintenance of certain financial strength ratings of certain of our Operating Subsidiaries. Refer to “— A condition of the Merger is the maintenance of financial strength ratings of our Operating Subsidiaries and Highlands may become entitled to terminate the Merger Agreement if we receive a clear indication from A.M. Best or S&P that such agency intends to downgrade the financial strength rating of our Operating Subsidiaries and if Highlands exercises such right it could adversely affect our business, financial condition and results of operations” below. The Merger Agreement also contains certain termination rights, including Highlands’ right to terminate if we suffered aggregate net losses exceeding
$350 million
. The closing conditions for the Merger may not be satisfied or satisfied on a timely basis which makes the completion and timing of the completion of the Merger uncertain.
If the Merger is not completed on a timely basis or at all, our ongoing business may be adversely affected and, without realizing any of the benefits of having completed the Merger, we may be subject to a number of risks including the following:
|
•
|
The price of our ordinary shares could decrease significantly given the current stock price reflects a market assumption that the Merger will occur;
|
|
•
|
If the Merger is not consummated, the investment goals of our shareholders may be materially different than those of our shareholders on a pre-Merger announcement basis given trading in our ordinary shares increased substantially following the announcement of the Merger Agreement;
|
|
•
|
Under certain circumstances, we may be required to pay Highlands a termination fee in the amount of $82.9 million, which may affect our financial condition and results of operations;
|
|
•
|
The Merger may not be completed as a result of the occurrence of an event, change or other circumstances that have a material adverse effect on our business;
|
|
•
|
If the Merger is not consummated, management and key personnel may be required to expend considerable time and effort reviewing and reconsidering our long-term strategy, which may detract from their ability to run our core business; and
|
|
•
|
Current and prospective employees may experience uncertainty about their future roles with us, which might adversely affect our ability to attract and retain employees who generate and service our business.
|
The announcement of the Merger may adversely affect our business, financial condition and results of operations.
We are subject to business uncertainties and contractual restrictions while the Merger is pending and uncertainty about the effect of the Merger on our employees and the brokers, insurers, cedants, customers and other third parties with whom we have a business relationship may have an adverse effect on our business, operations and financial condition regardless of whether or not the Merger is completed. These risks include the following, all of which could be exacerbated by a delay in the completion of the Merger:
34
|
•
|
Our ratings may be adversely affected, which could have an adverse effect on our business, financial condition and operating results;
|
|
•
|
Brokers, insurers, cedants, customers and other third parties with whom we have a business relationship may delay or defer certain business decisions or might decide to seek to terminate, change or renegotiate their relationships with us as a result of the Merger, which could negatively affect our revenues, earnings and cash flows, as well as the market price of our ordinary shares;
|
|
•
|
The manner in which brokers, insurers, cedants and other third parties perceive the Company may be negatively impacted, which in turn could affect our ability to compete for or write new business or obtain renewals in the marketplace;
|
|
•
|
Current and prospective employees may experience uncertainty about their future roles with us, which might adversely affect our ability to attract and retain employees who generate and service our business;
|
|
•
|
Time and resources committed by our management to matters relating to the Merger could otherwise have been devoted to our existing business or to pursuing other beneficial opportunities; and
|
|
•
|
We could be subject to litigation related to the Merger, including litigation related to any failure to complete the Merger or related to any enforcement proceeding commenced against the Company to perform its obligations under the Merger Agreement.
|
In addition, we expect to pay significant costs relating to the Merger, such as financial, legal, accounting advisory and printing fees, whether or not the Merger is completed. For more information, refer to Note 19(d) of our consolidated financial statements, “Commitments and Contingencies — Contingent Liabilities.”
A condition of the Merger is the maintenance of financial strength ratings of our Operating Subsidiaries and Highlands may become entitled to terminate the Merger Agreement if we receive a clear indication from A.M. Best or S&P that such agency intends to downgrade the financial strength rating of our Operating Subsidiaries and if Highlands exercises such right it could adversely affect our business, financial condition and results of operations.
A condition of the Merger is the maintenance of financial strength ratings of our Operating Subsidiaries. For further details on the ratings of our Operating Subsidiaries, refer to Part I, Item 1 “Business — Ratings” above. Under the Merger Agreement, Highlands may be entitled to terminate the Merger Agreement following a clear indication from A.M. Best or S&P that such rating agency intends to downgrade the financial strength rating of our Operating Subsidiaries. If we receive such indication, under the Merger Agreement, we have agreed to cooperate with Highlands and work together in good faith to develop and implement in a timely manner a plan for addressing any matters raised by such rating agency so as to avoid a rating downgrade. If no agreement can be reached, we maintain the right to take such measures as we reasonably see fit. If we take measures that cause, or would reasonably be expected to cause, a Triggering Event (as defined in the Merger Agreement) without the consent of Highlands, then Highlands may become entitled to terminate the Merger Agreement following notification to us.
As described above, failure to consummate the Merger could have a material adverse impact on our business, financial condition and results of operations. Refer to “— Failure to consummate the Merger within the expected time frame or at all could have a material adverse impact on our business, financial condition and results of operations” above. The adverse effects of a termination of the Merger Agreement could be compounded by the adverse effects of a rating downgrade on our competitive position in the (re)insurance industry, liquidity and financial flexibility as described below under “— Our Operating Subsidiaries are rated and our Lloyd’s business benefits from a rating by one or more of A.M. Best, S&P and Moody’s and a decline in any of these ratings could adversely affect our standing among brokers and customers and cause our premiums and earnings to decrease.”
Insurance Risks
Our financial condition and operating results may be adversely affected by the occurrence of catastrophic events.
As part of our insurance and reinsurance operations, we assume substantial exposure to losses resulting from catastrophic events. Catastrophes can be caused by various unpredictable events, including, but not limited to, severe weather, floods, explosions, wildfires, volcanic eruptions, earthquakes and tsunamis. The severe weather events to which we are exposed include tropical storms, cyclones, hurricanes, winter storms, tornadoes, hailstorms and severe rainfall causing flash floods.
The incidence, severity and magnitude of catastrophes are inherently unpredictable and our losses from such catastrophes have been and can be substantial. In addition, we expect that increases in the values and concentrations of insured property will increase the severity of such occurrences in the future and that global climate change may increase the frequency and severity of severe weather events, wildfires and flooding. Although we attempt to manage our exposure to such events through a multitude of approaches (including geographic diversification, geographic limits, individual policy limits, exclusions or limitations from coverage, purchase of reinsurance and expansion of supportive collateralized capacity), the availability of these management tools
35
may be dependent on market factors and, to the extent available, may not respond in the way that we expect. In addition, a single catastrophic event could affect multiple geographic zones or the frequency or severity of catastrophic events could exceed our estimates. As a result, the occurrence of one or more catastrophic events or an unusual frequency of smaller events may result in substantial volatility in, and may materially adversely affect, our business, financial condition or operating results.
The models we use to assess our exposure to losses from future catastrophes contain inherent uncertainties and our actual losses may therefore differ significantly from expectations.
To help assess our exposure to losses from catastrophes we use computer-based models which simulate multiple scenarios using a variety of assumptions. These models are developed in part by third party vendors and their effectiveness relies on the numerous inputs and assumptions contained within them, including, but not limited to, scientific research, historical data, exposure data provided by insureds and reinsureds, data on the terms and conditions of insurance policies and the professional judgment of our employees and other industry specialists. While the models have evolved considerably over time, they do not necessarily accurately measure the statistical distribution of future losses due to the inherent limitations of the inputs and assumptions on which they rely. These limitations are evidenced by significant variation in the results obtained from different models, material changes in model results over time due to refinement of the underlying data elements and assumptions and the uncertain predictive capability and performance of models over longer time intervals. The effect of these limitations is that future losses from catastrophic events may be larger and more frequent than expected or reported in our financial statements to date based on model assumptions, resulting in a material adverse effect on our financial condition or operating results.
Global climate change may have a material adverse effect on our operating results and financial condition if we do not adequately assess and price for any increased frequency and severity of catastrophes resulting from these environmental factors.
There is widespread consensus in the scientific community that there is a long-term upward trend in global air and sea temperatures which is likely to increase the severity and frequency of severe weather events over the coming decades. Rising sea levels are also expected to add to the risks associated with coastal flooding in many geographical areas. Large scale climate change could also increase both the frequency and severity of natural catastrophes and our loss costs associated with property damage and business interruption due to storms, floods and other weather-related events. In addition, global climate change could impair our ability to predict the costs associated with future weather events and could also give rise to new environmental liability claims in the energy, manufacturing and other industries we serve.
Given the scientific uncertainty of predicting the effect of climate cycles and climate change on the frequency and severity of catastrophes and the lack of adequate predictive tools, we may not be able to adequately model the associated exposures and potential losses in connection with such catastrophes which could have a material adverse effect on our business, financial condition or operating results.
Our operating results may be adversely affected by one or more large losses from events other than catastrophes.
Large losses from single events can occur if we are exposed to such events through more than one (re)insurance contract. Such losses are referred to as “clash losses.” We seek to manage our exposure to large losses from events other than catastrophes by identifying possible scenarios under which we could be exposed and limiting our exposure to these potential scenarios. Some of the more significant scenarios we have identified are terrorist attacks, fire, explosion or spill at a refinery or offshore oil and gas installation, the collapse of a major office building, accidents at nuclear power stations, a series of simultaneous cyber-attacks, the collision of two ships, an explosion in a port and the loss of a passenger airplane.
These risks are inherently unpredictable. It is difficult to predict the frequency of events of this nature and to estimate the amount of loss that any given occurrence will generate. Some of these large losses may also have the potential for exposure across multiple lines of business. As a consequence, our results could be materially adversely affected if there is an unexpected large number of clash losses in a period or if there is one or more of such losses of an unexpected large value. Our results may also be adversely affected if losses arise from a scenario we have not modeled. To the extent that losses from these risks occur, our financial condition and operating results could be materially affected.
We could face unanticipated losses from war, terrorism and political unrest, government action that is hostile to commercial interests and from sovereign, sub-sovereign and corporate defaults, and these or other unanticipated losses could have a material adverse effect on our financial condition or operating results.
We have substantial exposure to unexpected, large losses resulting from man-made catastrophic events such as, but not limited to, acts of war, acts of terrorism and losses resulting from political instability, government action that is hostile to commercial interests and sovereign, sub-sovereign and corporate defaults. These risks are inherently unpredictable as it is difficult to predict
36
their occurrence with statistical certainty or to estimate the amount of loss such an occurrence may generate. Terrorist attacks around the globe and ongoing unrest in the Middle East and North Korea have highlighted the unpredictable but increasingly present threat of terrorism and political instability.
Terrorist events could generate greater interest in political violence insurance coverage and greater awareness of the risks multinational corporations face in conflict-prone regions. We closely monitor the amount and types of coverage we provide for terrorism risk under insurance policies and reinsurance treaties. Even in cases where we have deliberately sought to exclude such coverage, there can be no assurance that a court or arbitration panel will interpret policy language or issue a ruling favorable to us. Accordingly, we may not be able to eliminate our exposure to terrorist events and there remains a risk that our reserves will not be adequate to cover such losses should they materialize. Notably, the Terrorism Risk Insurance Program Reauthorization Act of 2015 (the “2015 TRIA Reauthorization”) does not provide coverage for reinsurance losses. In addition, we have limited terrorism coverage for exposure to catastrophe losses related to acts of terrorism in the reinsurance that we purchase. Although the 2015 TRIA Reauthorization provides benefits in the event of certain acts of terrorism occurring in the United States, those benefits are subject to a deductible and other limitations.
The 2015 TRIA Reauthorization, which extended the Terrorism Risk Insurance Act of 2002 to December 31, 2020, fixed the insurer deductible at 20% of an insurer’s direct earned premium of the preceding calendar year and the federal share of compensation at 85% of insured losses that exceed insurer deductibles, but only until January 1, 2016, from which time the federal share decreased, and will continue to decrease, by 1 percentage point per calendar year until it is equal to 80%. Given the unpredictable frequency and severity of terrorism losses and the limited terrorism coverage in our own reinsurance program, future losses from acts of terrorism could materially and adversely affect our operating results or financial condition.
Our operating results may be adversely affected by an unexpected accumulation of attritional losses.
In addition to our exposures to catastrophes and other large losses as discussed above, our operating results may be adversely affected by unexpectedly large accumulations of attritional losses. We seek to manage this risk by using appropriate underwriting processes to guide the pricing, terms and acceptance of risks. These processes, which may include pricing models, are intended to ensure that premiums received are sufficient to cover the expected levels of attritional losses and a contribution to the cost of catastrophes and large losses where necessary. However, it is possible that our underwriting approaches or our pricing models may not work as intended and that actual losses from a class of risks may be greater than expected. Our pricing models are also subject to the same limitations as the models used to assess our exposure to catastrophe losses noted above. Accordingly, these factors could adversely impact our financial condition and/or operating results.
The effects of emerging claim and coverage issues, such as (but not limited to) bad faith claims or disputed policy terms, on our business are uncertain.
Claim and coverage issues can arise when the application of (re)insurance policy language to potentially covered claims is unclear or disputed by the parties. When such issues emerge they may adversely affect our business by extending coverage beyond our underwriting intent or increasing the number or size of claims. In some instances, these coverage changes may not become apparent until after we have issued (re)insurance contracts that are affected by such changes. As a result, the full extent of our liability under (re)insurance policies may not be known for many years after the policies are issued. Emerging claim and coverage issues could therefore have an adverse effect on our operating results and financial condition. In particular, our exposure to casualty (re)insurance lines increases our potential exposure to this risk due to the uncertainties of expanded theories of liability and the “long-tail” nature of these lines of business.
Recently, the Florida insurance market has seen an increase in losses and loss adjustment expenses due to the prevalence of assignment of benefits (“AOB”) claims. Through AOB, homeowners are increasingly assigning the benefit of their insurance recovery to third parties (including the right to claim back legal fees if they are successful in arguing for a larger than initially offered pay-out). AOB practice in Florida has been characterized by an inflated size and number of claims, increased litigation, interference in the adjustment of claims and the assertion of bad faith actions and one-way attorney fees. There were a large number of AOB claims following Hurricane Irma in 2017. It remains to be seen whether AOB claims will materially alter the loss experience of (re)insurers in the wake of Hurricane Michael in 2018, however, ongoing AOB activity and related potentially fraudulent claims activity may materially affect us by inflating the size of our losses and loss adjustment expenses.
The monetary impact of certain claims may be difficult to predict or ascertain upon inception and potential losses from such claims can be significant. For example, the full extent of our liability and exposure from claims of bad faith is not ascertainable until the claim has been presented and investigated. As such, a significant award in monetary terms on the basis of bad faith could adversely affect our financial condition or operating results.
37
The (re)insurance business is historically cyclical and we expect to experience periods with excess underwriting capacity and unfavorable premium rates and policy terms and conditions.
The insurance and reinsurance industry has historically been cyclical. It is characterized by periods of intense competition on price and policy terms and conditions due to excessive underwriting capacity (a “soft” market) and periods when shortages of capacity permit favorable premium levels (a “hard” market). The supply of (re)insurance has increased over the past several years as a result of capital provided by new entrants to the market, including alternative third party capital providers, and the commitment of additional capital by existing or new (re)insurers which has caused premium rates to decrease. Further development of these factors could lead to a significant reduction in premium rates, less favorable policy terms and conditions and fewer submissions for our underwriting services. In addition, hard markets, if any, are likely to be shorter and more regional than in the past as a result of this new capital. Changes in the frequency and severity of losses suffered by insureds and insurers may also significantly affect the cycles of the (re)insurance business. In addition, the cycle may fluctuate as a result of changes in economic, legal, political and social factors. Since cyclicality is due in large part to the collective actions of insurers, reinsurers and general economic conditions and the occurrence of unpredictable events, we cannot predict the timing or duration of changes in the market cycle. If we fail to manage the cyclical nature of the (re)insurance business, our operating results and financial condition could be materially adversely affected.
A material proportion of our business relies on the assessment and pricing of individual risks by third parties.
We authorize managing general agents, general agents and other producers to write business on our behalf from time to time within underwriting authorities we prescribe. We rely on the underwriting controls of these agents and producers to write business within the underwriting authorities we provide. Although we monitor our underwriting on an ongoing basis, our monitoring efforts may not be adequate and our agents and producers may exceed their underwriting authorities or otherwise breach obligations owed to us. There is also the risk that we may be held responsible for obligations that arise from the acts or omissions of third parties if they are deemed to have acted on our behalf. In addition, our agents, producers, insureds or other third parties may commit fraud or otherwise breach their obligation to us. To the extent that our agents, producers, insureds or other third parties exceed their authorities, commit fraud or otherwise breach obligations owed to us, our operating results and financial condition may be materially adversely affected.
Our reliance on third party assessment and pricing of individual risk extends to our reinsurance treaty business. Similar to other reinsurers, we do not separately evaluate each of the individual risks assumed under most reinsurance treaties. We are therefore largely dependent on the original underwriting decisions made by ceding companies. We are subject to the risk that the ceding companies may not have adequately evaluated the risks to be reinsured and that the premiums ceded to us may not adequately compensate us for the risks we assume and the losses we may incur. As a result of this reliance on ceding companies, our operating results and financial condition may be materially adversely affected.
The failure of any risk management and loss limitation methods we employ could have a material adverse effect on our financial condition and operating results.
We employ various risk management and loss limitation methods. We seek to mitigate our loss exposure by writing a number of our insurance and reinsurance contracts on an excess of loss basis, such that we only pay losses that exceed a specified retention. We also seek to limit certain risks, such as catastrophes and political risks, by geographic diversification. Geographic zone limitations involve significant underwriting judgments, including the determination of zone boundaries and the allocation of policy limits to zones. In the case of proportional (also known as pro rata) property reinsurance treaties, we often seek per occurrence limitations or loss and loss expense ratio caps to limit the impact of losses from any one event, although we may not be able to obtain such limits in certain markets. Various provisions in our policies intended to limit our risks, such as limitations or exclusions from certain coverage and choice of forum, may not always be enforceable. Purchasing reinsurance is another loss limitation method we employ which may not always respond in the way intended due to disputes relating to coverage terms, exclusions or counterparty credit risk.
We cannot guarantee that any of these loss limitation methods will be effective or that disputes relating to coverage will be resolved in our favor. As a result of the risks that we (re)insure, unforeseen events could result in claims that substantially exceed our expectations which could have a material adverse effect on our financial condition or operating results.
The reinsurance that we purchase may not always be available on favorable terms or we may choose to retain a higher proportion of particular risks compared to previous years.
From time to time, market conditions have limited, and in some cases prevented, insurers and reinsurers from obtaining the types and amounts of reinsurance that they consider adequate for their business needs. Accordingly, we may not be able to obtain our desired amount of reinsurance or retrocession protection on terms that are acceptable to us from entities with a satisfactory
38
credit rating or which is collateralized. Even if such capacity is available, we may also choose to retain a higher proportion of particular risks than in previous years due to pricing, terms and conditions or strategic emphasis. We may also seek alternative means of transferring risk, including expanded participation via our Aspen Capital Markets platform in alternative reinsurance structures. These solutions may not provide commensurate levels of protection compared to traditional retrocession. Our inability to obtain adequate reinsurance or other protection for our own account at favorable prices and on acceptable terms could have a material adverse effect on our business, operating results and financial condition.
Our financial condition and operating results may be adversely affected if actual claims exceed our loss reserves.
Our operating results and financial condition depend on our ability to accurately assess the potential losses associated with the risks that we (re)insure. While we believe that our loss reserves as of
December 31, 2018
were adequate, establishing an appropriate level of loss reserves is an inherently uncertain process and requires a considerable amount of judgment. In addition, changes in the level of inflation also result in an increased level of uncertainty in our estimation of loss reserves, particularly for those lines of business that are considered “long-tail,” such as casualty, as they require a relatively long period of time to finalize and settle claims for a given accident year. To the extent actual claims exceed our expectations, we will be required to recognize the less favorable experience immediately which could cause a material increase in our provisions for liabilities and a reduction in our profitability, including operating losses and reduction of capital.
For example, if catastrophic events or other large losses occur, we may fail to adequately estimate our reserve requirements and our actual losses and loss expenses may deviate, perhaps substantially, from our reserve estimates. Reserving for losses in the property and catastrophe markets is inherently complicated in that losses in excess of the attachment level of the policies are characterized by high severity and low frequency, and other factors which could vary significantly as claims are settled. This limits the volume of relevant industry claims experience available from which to reliably predict ultimate losses following a loss event.
Only reserves applicable to losses incurred up to the reporting date may be set aside in our financial statements, with no allowance for future losses. However, there are specific areas of our current reserves which have additional uncertainty associated with them. In property reinsurance, there is uncertainty relating to the ultimate settlement of losses related to Hurricanes Harvey, Irma and Maria that occurred in the third quarter of 2017, the California Wildfires that occurred in the fourth quarter of 2017 and 2018, Typhoon Jebi and Hurricane Florence that occurred in the third quarter of 2018 and Hurricane Michael that occurred in the fourth quarter of 2018. The actual development of losses and expenses versus our estimates creates a high level of uncertainty.
Some of these events have also impacted specialty reinsurance, marine and energy insurance and, to a lesser degree, there is a risk of litigation associated with the hurricanes which may affect casualty reinsurance. In casualty reinsurance, there are additional uncertainties associated with claims emanating from the 2008 global financial crisis and subsequent market events, and the potential for new types of claim to arise given the long-tail nature of many of the reinsurance risks. In the insurance segment, we wrote a book of financial institutions risks which have a number of notifications relating to the financial crisis in 2008 and subsequent market events. These factors can impact the claims adjustment processes which are dependent on the gathering of the necessary information on which to assess coverage, liability, causation and quantum.
Our calculation of reserves for losses and loss expenses also includes assumptions about future payments for settlement of claims and claims-handling expenses, such as medical treatment and litigation costs. We write casualty business in the United States, the United Kingdom, Australia and certain other territories where claims inflation has in many years run at higher rates than general inflation. To the extent inflation causes these costs to increase above reserves established for these claims, we will be required to increase our loss reserves with a corresponding reduction in our net income in the period in which the deficiency is identified, which could materially adversely affect our financial results.
The preparation of our financial statements requires us to make many estimates and judgments that are more difficult than companies operating outside the financial sector.
The preparation of our consolidated financial statements requires us to make many estimates and judgments that affect the reported amounts of assets, liabilities (including reserves), revenues and expenses and related disclosures of contingent liabilities. We evaluate our estimates on an ongoing basis, including those related to premium recognition, insurance and other reserves, reinsurance recoverables, investment valuations, intangible assets, bad debts, impairments, income taxes, contingencies, derivatives and litigation. We base our estimates on market prices, where possible, and on various other assumptions we believe to be reasonable under the circumstances, which form the basis for our judgments about the carrying values of assets and liabilities that are not readily apparent from other sources.
While we believe that our earliest accident years are capable of providing us with meaningful actuarial indications, estimates and judgments for new (re)insurance lines of business are more difficult to make than those made for more mature lines of business because we have more limited historical information through
December 31, 2018
. A significant part of our current loss reserves is in respect of incurred but not reported (“IBNR”) reserves. This IBNR reserve is based almost entirely on estimates involving
39
actuarial and statistical projections of our expectations of the ultimate settlement and administration costs. In addition to limited historical information for certain lines of business, we utilize actuarial models as well as historical insurance industry loss development patterns to establish loss reserves. Accordingly, actual claims and claim expenses paid may deviate, perhaps substantially, from the reserve estimates reflected in our financial statements, which could materially adversely affect our financial results.
If actual renewals of our existing policies and contracts do not meet expectations, our gross written premiums in future fiscal periods and our future operating results could be materially adversely affected.
A majority of our insurance policies and reinsurance contracts are for a one-year term. We make assumptions about the renewal rate and pricing of our prior year’s policies and contracts in our financial forecasting process. If actual renewals do not meet expectations, our gross written premiums in future fiscal periods and our future operating results and financial condition could be materially adversely affected. For Aspen Re, this risk is especially prevalent in the first quarter of each year when a large number of annual reinsurance contracts are subject to renewal.
Cyber threats are an evolving risk area affecting not only the specific cyber insurance we provide but also the liability coverage we provide.
We have introduced processes to manage our potential liabilities as a result of specific cyber coverage and other cover we provide to our (re)insurance clients. However, given that this is an area where the threat landscape is uncertain and continuing to evolve, there is a risk that increases in the frequency and effectiveness of cyber-attacks on our clients could adversely affect our financial condition and operating results. This risk is also dependent on the measures our clients use to protect themselves to keep pace with the emerging threat, as well as the development and issuance of policy terms which are reactive to the evolving threat landscape.
Our U.S. excess and surplus lines insurance business is subject to non-standard risks and increased risk from changing market conditions.
Excess and surplus lines insurance forms a substantial portion of the business written by our U.S.-based insurance operations. We also write U.S. excess and surplus lines insurance from the U.K. Excess and surplus lines insurance covers risks that are typically more complex and unusual than standard risks and requires a high degree of specialized underwriting. As a result, excess and surplus lines risks do not often fit the underwriting criteria of standard insurance carriers. Our excess and surplus lines insurance business fills the insurance needs of businesses with unique characteristics and is generally considered higher risk than the standard market. If our underwriting staff inadequately judges and prices the risks associated with the business underwritten in the excess and surplus lines market, our financial results could be adversely impacted.
Further, the excess and surplus lines market is significantly affected by the conditions of the property and casualty insurance market in general. This cyclicality can be more pronounced in the excess and surplus market than in the standard insurance market. During times of hard market conditions (when market conditions are more favorable to insurers because rates increase and coverage terms become more restrictive), business tends to move from the admitted market to the excess and surplus lines market and growth in the excess and surplus market tends to accelerate faster than growth in the standard insurance market. When soft market conditions are prevalent (when market conditions are less favorable to insurers because rates decrease and coverage terms become less restrictive), standard insurance carriers tend to grant more expansive coverage terms and expand market share by moving into business lines traditionally characterized as excess and surplus lines, exacerbating the effect of rate decreases. If we fail to manage the cyclical nature and volatility of the revenues and profit we generate in the excess and surplus lines market, our financial results could be adversely impacted.
Market and Liquidity Risks
Our financial condition and operating results may be adversely affected by reductions in the aggregate value of our investment portfolio.
Our operating results depend in part on the performance of our investment portfolio. Our funds are invested by several professional investment management firms in accordance with our investment guidelines. Our investment guidelines stress diversification of risks, preservation of capital and provision of liquidity. For more information on our investment guidelines, refer to “Business — Investments” under Part I, Item 1 above. However, our investments are subject to a variety of financial and capital market risks including, but not limited to, changes in interest rates, credit spreads, equity prices, foreign currency exchange rates, market volatility and risks inherent to particular securities. Prolonged and severe disruptions in the public debt and equity markets, including, among other things, widening of credit spreads, bankruptcies, defaults, and significant ratings downgrades, may cause significant losses in our investment portfolio. Market volatility can make it difficult to value certain securities if their trading
40
becomes infrequent. Depending on market conditions, we could incur substantial additional realized and unrealized investment losses in future periods.
Separately, the occurrence of large claims may force us to liquidate securities at an inopportune time which may cause us to realize capital losses. Large investment losses could decrease our asset base and thereby affect our ability to underwrite new business. Additionally, such losses could have a material adverse impact on our shareholders’ equity, business and financial strength and debt ratings. For the
twelve months ended
December 31, 2018
, our net invested assets generated a total return of
$52.2 million
before tax.
The aggregate performance of our investment portfolio also depends to a significant extent on the ability of our investment managers to select and manage appropriate investments. As a result, we are also exposed to operational risks which may include, but are not limited to, a failure of our investment managers to perform their services in a manner consistent with our investment guidelines, technological and staffing deficiencies, inadequate disaster recovery plans, interruptions to business operations due to impaired performance or failure or inaccessibility of information or IT systems. The result of any of these operational risks could adversely affect our investment portfolio, financial performance and ability to conduct our business.
Our results of operations and investment portfolio may be materially affected by conditions impacting the level of interest rates in the global capital markets and major economies, such as central bank policies on interest rates and the rate of inflation.
As a global insurance and reinsurance company, we are affected by the monetary policies of the Bank of England, the European Central Bank, the U.S. Federal Reserve Board and other central banks around the world. Since the Financial Crisis of 2007 and 2008 these central banks have taken a number of actions to spur economic activity such as keeping interest rates low and enacting Quantitative Easing. Unconventional monetary policy from the major central banks, and reversal of such policies, and moderate global economic growth remain key uncertainties for markets and our business. In December 2015 the U.S. Federal Reserve raised the Federal Funds Rate for the first time since the Financial Crisis, effectively embarking on a tightening cycle to normalize interest rates which have risen 2.00% from 2015 to 2018. In September 2017, the Federal Reserve announced it will begin to reduce the size of its balance sheet effectively beginning a reversal of Quantitative Easing to normalize the balance sheet whilst maintaining its tightening cycle bias. Other central banks have expressed their intention to pare back unprecedented monetary stimulus by normalizing both their policy rates and balance sheets as economic growth improves.
The U.S. Federal Reserve has raised rates multiple times in 2018 and has signaled more may be expected in 2019. Such actions may have a material impact on the pricing levels of our fixed-income investments. Refer to Note 23 of our consolidated financial statements, “Subsequent Events” for information on the interest rate swaps we executed in January 2019.
Our exposure to interest rate risk relates primarily to the market price and cash flow variability of fixed income instruments that are associated with changes in interest rates. Our investment portfolio contains interest rate sensitive instruments, such as fixed income securities which have been, and will likely continue to be, affected by changes in interest rates from central bank monetary policies, domestic and international economic and political conditions, levels of inflation and other factors beyond our control.
Interest rates are highly sensitive to many factors, including governmental monetary policies, inflation, domestic and international economic and political conditions and other factors beyond our control. For example, inflation could lead to higher interest rates causing the current unrealized gain position in our fixed maturity portfolio to decrease. As a result of the interest rate environment, we have diversified our investment portfolio by investing in a real estate fund and emerging market debt to enhance the returns on our investment portfolio. However, these assets are riskier in nature and could adversely impact our investment portfolio.
Interest rate fluctuations could also have an adverse effect on our mortgage reinsurance business. In both the U.S. and international mortgage markets, rising interest rates, among other factors, generally reduce the volume of new mortgage originations. A decline in the volume of new mortgage originations would have an adverse effect on our new mortgage reinsurance written. Conversely, declining interest rates historically have increased the rate at which borrowers refinance their existing mortgages, thereby resulting in cancellations of the mortgage insurance covering the refinanced loans, potentially having an adverse effect on the volume of mortgage insurance underlying our reinsurance, our levels of premium and any growth in such business.
Steps that may be taken by central banks to raise interest rates in the future to combat higher inflation than we had anticipated could, in turn, lead to an increase in our loss costs. Changes in the level of inflation also result in an increased level of uncertainty in our estimation of loss reserves for our long-tail lines of business. As a result of the above factors, our business, financial condition, liquidity or operating results could be adversely affected.
41
Unexpected volatility or illiquidity associated with some of our investments could significantly and negatively affect our financial results, liquidity and ability to conduct business.
We hold, or may in the future purchase, certain investments such as publicly traded equities, high yield bonds, bank loans, emerging market debt, non-agency residential mortgage-backed securities, asset-backed securities, commercial mortgage-backed securities, real estate funds, middle market loans and short term secured products. During the height of the financial crisis, both fixed income and equity markets were more illiquid and volatile than expected. If we require significant amounts of cash on short notice in excess of normal cash requirements, we may have difficulty selling these investments in a timely manner and/or be forced to sell them for less than we otherwise would have been able to realize. If we are forced to sell our assets in unfavorable market conditions, there can be no assurance that we will be able to sell them for the prices at which we have recorded them and we may be forced to sell them at significantly lower prices. As a result of the above factors, our business, financial condition, liquidity or operating results could be adversely affected.
Volatility and uncertainty in general economic conditions and in financial, commodity and mortgage markets could adversely impact our business prospects, operating results, financial position and liquidity.
In recent years, global financial markets have been characterized by volatility and uncertainty. Unfavorable economic conditions could increase our funding costs, limit our access to the capital markets or make credit harder to obtain. Uncertainties in the financial and commodity markets may also affect our counterparties which could adversely affect their ability to meet their obligations to us. For example, a significant portion of the business sourced by Crop Re Services LLC (“Crop Re”) provides revenue protection to farmers for their expected crop revenues which can be affected by changes in crop prices. Significant losses to our agriculture classes of business could be incurred in the event of a decline in agricultural commodity prices prior to harvest which could, in turn, affect our financial condition or operating results.
Deterioration or volatility in the financial markets or general economic and political conditions could result in a prolonged economic downturn or trigger another recession and our operating results, financial position and liquidity could be materially and adversely affected. Further, unfavorable economic conditions could have a material adverse effect on certain of the lines of business we write, including, but not limited to, credit and political risks, professional liability and surety risks.
We provide credit reinsurance to mortgage guaranty insurers and commercial credit insurers. We are exposed to the risk that losses from mortgage insurance materially exceed the net premiums that are received to cover such risks, which may, subject to liability caps, result in operating and economic losses to us. Mortgage insurance underwriting losses that have the potential to exceed our risk appetite are associated with the systemic impacts of severe mortgage defaults, driven by large scale economic downturns and high unemployment. As of December 31,
2018
, the majority of our exposure to mortgage-related underwriting risks was in the United States, with a smaller amount of exposure in Australia.
A downgrade of U.S. or non-U.S. government securities by credit rating agencies could adversely impact the value of such securities in our investment portfolio and create uncertainty in the market generally.
A downgrade of U.S. or non-U.S. government securities by credit rating agencies has the potential to adversely impact the value of our investment portfolio and may cause the average credit rating of our investment portfolio to fall and create greater volatility in the prices of our other investments. In addition, a downgrade in the rating of U.S. or non-U.S. government securities may have an adverse impact on fixed income markets or have a material adverse effect on our financial condition or operating results.
The determination of the amount of allowances and impairments taken on our investments is highly subjective and could materially impact our operating results or financial position.
We perform reviews of our investments on a quarterly basis to determine whether declines in fair value below the cost basis are considered other-than-temporary impairments in accordance with applicable accounting guidance regarding the recognition and presentation of other-than-temporary impairments. The process of determining whether a security is other-than-temporarily impaired requires judgment and involves analyzing many factors. For additional information regarding this process, see Note 2(c) of our consolidated financial statements, “Basis of Preparation and Significant Accounting Policies —Accounting for Investments, Cash and Cash Equivalents.” Assessing the accuracy of the level of impairments taken, and allowances reflected, in our financial statements is inherently uncertain given the subjective nature of the process. Furthermore, additional impairments may need to be taken or allowances provided in the future with respect to events that may impact specific investments. While historically our other-than-temporary impairments have not been material, historical trends may not be indicative of future impairments or allowances. Thus future material impairments themselves or any error in accurately accounting for them may have a material adverse effect on our financial condition or results of operations.
42
Our investment portfolio and our credit and political risk underwriting exposures may be materially adversely affected by global climate change regulation and other factors.
World leaders met at the 2015 United Nations Climate Change Conference in December 2015 in Paris and agreed to limit global greenhouse gas emissions in the atmosphere to a level which would not increase the average global temperature by more than 2° Celsius, with an aspiration of limiting such increase to 1.5° Celsius (the “Paris Agreement”). In order for governments to achieve their existing and future international commitments to limit the concentration of greenhouse gases under the Paris Agreement, there is widespread consensus in the scientific community that a significant percentage of existing proven fossil fuel reserves may not be consumed. In addition, divestment campaigns, which call on asset owners to divest from direct ownership of commingled funds that include fossil fuel equities and bonds, likewise signals a change in society’s attitude towards the social and environmental externalities of doing business.
The U.S. Government nevertheless indicated that it would cease participating in the Paris Agreement on June 1, 2017 (confirmed at the recent G20 meeting of November 30 - December 1, 2018), which may create further uncertainty regarding investment and valuation for both the fossil fuel and renewable sectors. In accordance with the Paris Agreement, the earliest possible effective withdrawal date by the United States from the Paris Agreement cannot be before November 4, 2020.
As a result of the above, energy companies and other companies engaged in the production or storage of fossil fuels may experience unexpected or premature devaluations or write-offs of their fossil fuel reserves. As at
December 31, 2018
, we had
$229.1 million
, or
2.96%
of our Managed Portfolio, invested in the energy sector. Government policies to slow global climate change by, for example, setting limits on carbon emissions may also have an adverse impact on other sectors, such as utilities, transportation and manufacturing. A material change in the asset value of fossil fuels or the securities of energy companies and companies in these other sectors may therefore materially adversely affect our investment portfolio and our results of operations and financial condition.
We provide credit and political risk insurance to banks and other institutions providing lending to government and private organizations. In some cases the lending relates to private organizations involved in the energy sector or governments or government agencies which are dependent on fossil fuels for their revenue. A material change in the asset value of fossil fuels may therefore materially adversely affect our exposures to credit and political risk.
Our financial condition or operating results may be adversely affected by currency fluctuations that we may not be effective at mitigating.
A significant portion of our operations is conducted outside the United States. Accordingly, we are subject to legal, economic and market risks associated with operating in countries throughout the world, including devaluations and fluctuations in currency exchange rates, imposition or increase of investment and other restrictions by foreign governments; and the requirement of complying with a wide variety of laws.
We report our operating results and financial condition in U.S. Dollars. Outside the United States, we predominantly generate revenue and expenses in the local currency. Our U.S. operations earn revenue and incur expenses primarily in U.S. dollars. In our London market operations, we earn revenue in a number of different currencies, but expenses are almost entirely incurred in the British Pound. In addition to the U.S. Dollar and the British Pound, our functional currencies are the Euro, the Swiss Franc, the Australian Dollar, the Canadian Dollar and the Singapore Dollar. The table below gives an approximate analysis of gross written premiums and general, administrative and corporate expenses by currency for the year ended
December 31, 2018
.
|
|
U.S. Dollars
|
|
|
GBP
|
|
|
Other
|
|
|
|
Gross Written Premiums
|
74.4
|
%
|
8.9
|
%
|
16.7
|
%
|
|||
|
General, Administrative and Corporate Expenses
|
74.3
|
%
|
19.2
|
%
|
6.5
|
%
|
|||
During the course of
2018
, the U.S. Dollar/British Pound exchange rate, our most significant exchange rate exposure, fluctuated from a high of £1:$
1.4339
to a low of £1:$
1.2487
. For the twelve months ended
December 31, 2018
,
16.7%
of our gross premiums were written in currencies other than the U.S. Dollar and the British Pound (
2017
—
17.3%
). Further, a portion of our loss reserves and investments are also in currencies other than the U.S. Dollar and the British Pound. We may, from time to time, experience losses resulting from fluctuations in the values of these non-U.S./non-British currencies which could adversely affect our results.
As a result of devaluations and fluctuations in currency exchange rates or the imposition of limitations on conversion of foreign currencies into U.S. Dollars, we are subject to currency translation exposure on the profits of our operations, in addition to economic
43
exposure. Furthermore, the mismatch between the British Pound revenues and expenses, together with any net British Pound balance sheet position we hold in our London market operations creates a currency exchange exposure. Through our underwriting of credit and political risk, we are also exposed to the risk of paying claims in the event that a host government imposes a moratorium on the remittance overseas of foreign currency payments.
Following the U.K’s decision to withdraw from the E.U., as further described under “— The United Kingdom’s decision to withdraw from the E.U. could adversely impact our business, results of operations and financial condition” below, the value of the British Pound significantly weakened as compared to the U.S. Dollar. The British Pound continued to be volatile in 2018 and has not returned to the levels experienced before the U.K.’s referendum given the uncertainty regarding the U.K.’s withdrawal agreement or any transitional arrangements. As a result, the U.S. Dollars required to be translated into British Pounds to cover our net sterling expenses has decreased, while our net British Pound assets we hold became less valuable when translated into U.S. Dollars. This risk could have a significant adverse effect on our financial condition, cash flow and results of operations in the future if the British Pound continues to weaken.
From time to time we may hedge part of our operating exposure to exchange rate movements but such mitigating attempts may not be successful. We may use forward exchange contracts to manage some of our foreign currency exposure. However, it is possible that we will not successfully structure those contracts so as to effectively manage these risks, or we may take managing steps that have the unintended effect of increasing the risk if predictions turn out not to be accurate, which could adversely affect our operating results.
Credit Risks
Our operating results may be adversely affected by the failure of policyholders, brokers or other intermediaries to honor their payment obligations.
In accordance with industry practice, we generally pay amounts owed on claims under our insurance and reinsurance contracts to brokers and these brokers, in turn, pay these amounts to the clients that purchased insurance and reinsurance from us. In some jurisdictions where we write a significant amount of business, if a broker fails to make such a payment it is highly likely that we will be liable to the client for the deficiency because of local laws or contractual obligations. Likewise, when the client pays premiums for policies to brokers for payment to us, these premiums are generally considered to have been paid and, in most cases, the client will no longer be liable to us for those amounts whether or not we have actually received the premiums. Consequently, we assume a degree of credit risk associated with brokers with respect to most of our (re)insurance business.
In addition, bankruptcy, liquidity problems, distressed financial conditions or the general effects of economic recession may increase the risk that policyholders may not pay a part of, or the full amount of, premiums owed to us despite an obligation to do so. The terms of our contracts or local law may not permit us to cancel our insurance even if we have not received payment. If non-payment becomes widespread, whether as a result of bankruptcy, lack of liquidity, adverse economic conditions, operational failure, delay due to litigation, bad faith and fraud or other events, it could have a material adverse impact on our business and operating results.
Our financial condition and operating results may be adversely affected by the failure of one or more reinsurers or capital market counterparties to meet their payment obligations.
We purchase reinsurance for our own account in order to mitigate the effect of certain large and multiple losses upon our financial condition. Our reinsurers or capital market counterparts are dependent on their ratings in order to continue to write business and some have suffered downgrades in ratings in the past as a result of their exposures. Our reinsurers or capital market counterparties may also be affected by adverse developments in the financial markets, which could adversely affect their ability to meet their obligations to us. Insolvency of these counterparties, their inability to continue to write business or reluctance to make timely payments under the terms of their agreements with us could have a material adverse effect on us because we remain liable to our insureds or cedants in respect of the reinsured risks.
Our liquidity and counterparty risk exposures may be adversely affected by the impairment of financial institutions.
We routinely execute transactions with counterparties in the financial services industry, including brokers and dealers, commercial banks, investment banks and other institutions. We are exposed to the risk that these counterparties are unable to make payments or provide collateral to a third party when required, or that securities that we own are required to be sold at a loss in order to meet liquidity, collateral or other payment requirements. In addition, our investments in various fixed income securities issued by financial institutions exposes us to credit risk in the event of default by these issuers. With respect to derivatives transactions that require exchange of collateral, due to mark to market movements, our risk may be exacerbated in the event of default by a counterparty. In such an event, we may not receive the collateral due to us from the defaulted counterparty. Refer to Note 23 of
44
our consolidated financial statements, “Subsequent Events” for information on the interest rate swaps we executed in January 2019. Any such losses could materially and adversely affect our business and operating results.
Strategic Risks
Our operating effectiveness and efficiency initiative aimed at optimizing our business processes is subject to execution risk, may subject our business to other risks and may not realize the intended benefits.
We have launched, and plan to continue to implement, our program to enhance operating effectiveness and efficiency and to enhance our market position (the “Effectiveness and Efficiency Program”). The Effectiveness and Efficiency Program presents potential uncertainties and risks that may impact our ability to achieve anticipated operating enhancements and/or cost reductions, or otherwise impact our business including:
|
•
|
our ability to successfully develop and execute the Effectiveness and Efficiency Program to create operating and cost efficiencies through focus on improving several operational levers;
|
|
•
|
charges relating to the Effectiveness and Efficiency Program being different from those initially estimated, including changes in the size and components of different aspects;
|
|
•
|
changes in the planned timing of the Effectiveness and Efficiency Program;
|
|
•
|
the results and timing of employee consultation processes and related regulations in certain jurisdictions where we operate;
|
|
•
|
disruption in our business associated with the Effectiveness and Efficiency Program and related activities;
|
|
•
|
disruption to our internal control environment;
|
|
•
|
whether the Effectiveness and Efficiency Program provides a sufficient return on our capital expenditure investment over time; and
|
|
•
|
whether new IT and data tools enable intended results.
|
In addition, as part of the Effectiveness and Efficiency Program, we may reduce employee headcount and these actions may adversely disrupt operating activities, may negatively affect employee morale and loyalty and may make it more difficult to retain or rehire key personnel. A lower headcount may result in a decrease in gross written premiums across particular insurance and reinsurance lines due to lower production in our accounts.
If we are not successful in developing and executing the Effectiveness and Efficiency Program, we may not be able to achieve targeted expense savings within the expected time frame, which could adversely impact our business, results of operations and financial condition. Our failure to achieve targeted operating enhancements and/or cost reductions could also result in the implementation of additional restructuring related activities, which may be dilutive to our earnings and otherwise materially adversely affect our business, financial condition or results of operations. For more information on the Effectiveness and Efficiency Program, refer to Part II, Item 7, “Management’s Discussion and Analysis of Financial Condition and Results of Operations — Aspen’s Year in Review.”
We operate in a highly competitive environment and substantial new capital inflows into the (re)insurance industry may increase competition.
Insurance and reinsurance markets are highly competitive. We continue to experience increased competition in a number of lines of business which has caused a decline in rate increases or a reduction in rates in such lines. We compete with existing international and regional (re)insurers some of which have greater financial, marketing and management resources than us. We also compete with new market entrants and alternative capital markets, funds and other providers of insurance and alternative reinsurance products such as insurance-linked securities, catastrophe bonds and derivatives. In recent years, hedge funds, pension funds, endowments and investment banks have been increasingly active in the reinsurance market and markets for related risks. Further, we believe new entrants or existing competitors may attempt to replicate all or part of our business model and provide further competition in the markets in which we participate. We generally expect increased competition from a wider range of entrants over time. We have already seen that such new or alternative capital causes reductions in prices of our products and reduces the duration or amplitude of attractive portions of the historical market cycles. Refer to Part I, Item 1, “Business — Competition” above for a discussion of our competitors. Recently, insureds have retained a greater proportion of their risk portfolios than previously, and industrial and commercial companies have increasingly relied on their own subsidiary insurance companies and other mechanisms for funding their risks rather than via risk transferring insurance. We have sought to address this risk by developing our own capital markets capability but there is no guarantee it will succeed.
Increased competition could result in fewer submissions, lower premium rates, less favorable policy terms and conditions and greater expenses relating to customer acquisition and retention, which could have a material adverse impact on our operating results or financial condition.
45
Our Operating Subsidiaries are rated and our Lloyd’s business benefits from a rating by one or more of A.M. Best, S&P and Moody’s and a decline in any of these ratings could adversely affect our standing among brokers and customers and cause our premiums and earnings to decrease.
Ratings have become an increasingly important factor in establishing the competitive position of insurance and reinsurance companies. Rating agencies represent independent opinions of the financial strength of insurers and reinsurers and their ability to meet policyholder obligations. These ratings are not an evaluation directed toward the protection of investors or a recommendation to buy, sell or hold our ordinary shares. The ratings of our Operating Subsidiaries are subject to periodic review by, and may be placed on credit watch, revised downward or revoked at the sole discretion of, A.M. Best, Moody’s or S&P. For information on the ratings of our Operating Subsidiaries and the updated reviews from the rating agencies following our announcement of the Merger, refer to Part I, Item 1, “Business — Ratings” above.
If our Operating Subsidiaries’ or Lloyd’s ratings are reduced from their current levels by any of A.M. Best, Moody’s or S&P, our competitive position in the (re)insurance industry might suffer and it may be more difficult for us to market our products, expand our (re)insurance portfolio and renew our existing (re)insurance policies and agreements. A rating downgrade may also require us to establish trusts or post letters of credit for ceding company clients and could trigger provisions allowing some clients to terminate their (re)insurance contracts with us. Some contracts also provide for the return of premium to the ceding client in the event of a rating downgrade. It is increasingly common for our reinsurance contracts to contain such terms. Whether a cedant would exercise any of these rights could depend on various factors, such as the reason for and the extent of such downgrade, the prevailing market conditions and the pricing and availability of replacement reinsurance coverage. A downgrade could result in a substantial loss of business as ceding companies and brokers that place such business move to other reinsurers with higher ratings and therefore such downgrade may materially and adversely impact our business, operating results, liquidity and financial flexibility.
In addition, a downgrade of the financial strength rating of Aspen U.K., Aspen Bermuda or Aspen Specialty by A.M. Best below “B++” would constitute an event of default under our revolving credit facility with Barclays Bank PLC and other lenders. Additionally, the cost and availability of unsecured financing are generally dependent on the borrower’s long-term and short-term debt ratings. A lower rating may lead to higher borrowing costs, thereby adversely impacting our liquidity and financial flexibility and by extension our business, financial condition and results of operations.
For information on the potential risks associated with a downgrade of the financial strength ratings of our Operating Subsidiaries in connection with the Merger, refer to “— A condition of the Merger is the maintenance of financial strength ratings of our Operating Subsidiaries and Highlands may become entitled to terminate the Merger Agreement if we receive a clear indication from A.M. Best or S&P that such agency intends to downgrade the financial strength rating of our Operating Subsidiaries and if Highlands exercises such right it could adversely affect our business, financial condition and results of operations” above.
Any future acquisitions, growth of our operations through the addition of new lines of (re)insurance business, expansion into new geographic regions and/or joint ventures or partnerships may expose us to risks.
As part of our long-term strategy, we have pursued, and may continue to pursue, growth through acquisitions and/or strategic investments in new businesses. We may also decide to sell businesses or enter into strategic ventures with third parties. Further, we may engage in confidential acquisition negotiations that are not publicly announced unless and until those negotiations result in a definitive agreement. Such negotiations would likely require management and key personnel to expend considerable time and effort on the negotiations, which may detract from their ability to run our core business. In addition, an acquisition can be expensive and time consuming. Although considerable funds may be expended in the negotiations phase, an acquisition or disposition, including the Merger, may ultimately not be completed for a variety of reasons.
We have limited experience in identifying quality merger or acquisition candidates, as well as successfully acquiring and integrating their operations. Successful integration depends, among other things, on our ability to effectively integrate acquired businesses or new personnel into our existing risk management techniques, manage any regulatory issues created by our entry into new markets and geographic locations, retain key personnel and obtain personnel required for expanded operations. The failure to integrate successfully or to manage the challenges presented by the integration process, such as in connection with the Merger, may have an adverse effect on our business, financial condition or results of operations. See “Risks Related to the Merger” above.
Consolidation in the (re)insurance industry could adversely impact our business and results of operations.
Continued consolidation in the (re)insurance industry could lead consolidated entities to try to use their enhanced market power to negotiate price reductions for our products and services and/or obtain a larger market share through increased line sizes. If competitive pressures reduce our prices, we would expect to write less business on a gross written premium basis. As the (re)insurance industry consolidates, competition for customers will become more intense and the importance of acquiring and properly servicing each customer will become greater. We could incur greater expenses relating to customer acquisition and retention, further reducing our operating margins. The resulting change in the competitive landscape may also impact our ability
46
to attract the most talented insurance professionals and retain and incentivize existing employees. In addition, insurance companies that merge may be able to spread their risks across a consolidated, larger capital base so that they require less reinsurance.
If our competitors join this trend of consolidation, we could also experience more robust competition from larger, better capitalized competitors. The effect of such consolidation and possible increased scale of our competitors may mean that we experience increased pressure on rates, with the prospect that we may choose to write less business overall, and relatively more business at unfavorable rates as a result. Any of the foregoing could adversely affect our business, strategy or our results of operations.
We depend on a few brokers for a large portion of our insurance and reinsurance revenues and the loss of business provided by any one of those brokers could adversely affect us.
We market our insurance and reinsurance products worldwide primarily through insurance and reinsurance brokers. Refer to Part I, Item 1, “Business — Business Distribution” above for our principal brokers by segment. Several of these brokers also have, or may in the future acquire, ownership interests in (re)insurance companies that compete with us, and these brokers may favor their own (re)insurers over other companies. The failure or inability of brokers to market our (re)insurance products successfully or the loss of all or a substantial portion of the business provided by one or more of these brokers could have a material adverse effect on our business.
In addition, there has been a trend of increased consolidation of agents and brokers. As we distribute most of our products through agents and brokers, consolidation could impact our ability to access business and our relationships with, and fees paid to, agents and brokers. In the Lloyds’s market, independent London wholesalers continue to be acquired by larger global brokers, which may result in enhanced market power for these larger brokers in placing (re)insurance. Consolidation of distributors may also increase the likelihood that distributors will try to renegotiate the terms of existing selling agreements to terms less favorable to us. As brokers merge with or acquire each other, any resulting failure or inability of brokers to market our products successfully, or the loss of a substantial portion of the business sourced by one or more of our key brokers, could have a material adverse effect on our business and results of operations.
Our efforts to expand in targeted markets or develop products may not be successful and may create increased risks.
A number of our planned business initiatives involve expanding existing products in targeted markets or developing new products. For example, Aspen Advisors is registered as an investment adviser with the SEC and advises on insurance-linked securities. Through Aspen Capital Markets, our alternative reinsurance division, we have also expanded our participation in the alternative reinsurance market through collateralized reinsurance arrangements. To develop new markets and products, we may need to make substantial capital and operating expenditures, which may adversely affect our results in the near term. In addition, the demand for new markets or products may not meet our expectations. To the extent we are able to expand in new markets or market new products, our risk exposures may change and the data and models we use to manage such exposures may not be as sophisticated as those we use in existing markets or with existing products. This, in turn, could lead to losses in excess of expectations that individually or in the aggregate may materially adversely affect our business, financial condition and results of operations.
We are exposed to risks in connection with our management of alternative reinsurance platforms on behalf of investors in Peregrine, Silverton and in any other entities Aspen Capital Markets manages or could manage in the future.
Those of our subsidiaries that are engaged in the management of alternative reinsurance platforms as part of our Aspen Capital Markets division may owe certain legal duties and obligations to third party investors (including reporting obligations) and are subject to a variety of often complex laws and regulations relating to the management of those structures. Although we continually monitor our policies and procedures to ensure compliance, faulty judgments, simple errors or mistakes, or the failure of our personnel to adhere to established policies and procedures could result in our failure to comply with applicable laws or regulations which could result in significant liabilities, penalties or other losses and significantly harm our business and results of operations.
In addition, our third party investors may decide not to renew their interests in the entities we manage which could materially impact the financial condition of such entities. Certain of our third party capital investors provide significant capital investment in respect of the entities we manage. The loss or alteration of this capital support could be detrimental to our financial condition and results of operations. Moreover, we can provide no assurance that we may be able to attract and raise additional third party capital for our existing managed entities or for potential new managed entities and therefore we may forego existing and/or potential attractive fee income and other income-generating opportunities.
Furthermore, notwithstanding any capital holdback, we may decide to return to our investors all or a portion of the third party capital held by entities we manage as collateral prior to the maturity specified in the terms of the particular underlying transactional documents. A return of capital to our investors is final. As a result, if we release collateral early and capital is returned to our
47
investors, we may not have sufficient collateral to pay the claims associated with such losses in the event losses are significantly larger than we anticipated.
We may require additional capital in the future, which may not be available or may only be available on unfavorable terms.
Our future capital requirements depend on many factors, including our ability to write new business successfully, deploy capital into more profitable business lines, identify acquisition opportunities, manage investments and preserve capital in volatile markets, and establish premium rates and reserves at levels sufficient to cover losses. Our operations are subject to significant volatility in capital due to our exposure to potentially significant catastrophic events. We monitor our capital adequacy on an ongoing basis. To the extent our funds are insufficient to fund future operating requirements or cover claims losses, we may need to raise additional funds through corporate finance transactions or curtail our growth and reduce our liabilities. Any such financing, if available at all, may be on terms that are not favorable to us. Our ability to raise any financing is also restricted under the Merger Agreement. Our ability to raise such capital successfully would depend upon the facts and circumstances at the time, including our financial position and operating results, market conditions and applicable regulatory filings and legal issues. If we cannot obtain adequate capital on favorable terms, or obtain it at all, our business, financial condition and operating results could be adversely affected.
Our debt, credit and International Swaps and Derivatives Association (“ISDA”) agreements may limit our financial and operational flexibility, which may affect our financial condition, liquidity and ability to conduct our business.
We have incurred indebtedness and may incur additional indebtedness in the future. Additionally, we have entered into credit facilities with various institutions which provide revolving lines of credit to us and our Operating Subsidiaries and issue letters of credit to our clients in the ordinary course of business. We have also entered into ISDA agreements relating to derivative transactions. Refer to Note 23 of our consolidated financial statements, “Subsequent Events” for information on the interest rate swaps we executed in January 2019. The agreements relating to our debt, credit facilities and our ISDA agreements contain covenants that may limit our ability, among other things, to borrow money, make particular types of investments or other restricted payments, sell assets, merge or consolidate. Some of these agreements also require us to maintain specified ratings and financial ratios, including a minimum net worth covenant. If we fail to comply with these covenants or meet required financial ratios, the lenders or counterparties under these agreements could declare a default and demand immediate repayment of all amounts owed to them. As a result, our business, financial condition and operating results could be adversely affected.
If we are in default under the terms of these agreements, we may also be restricted in our ability to declare or pay any dividends, redeem, purchase or acquire any shares or make a liquidation payment and are at risk of cross-default on other arrangements. In addition, the cost and availability of these arrangements vary and any adverse change in the cost or availability of such arrangements could adversely impact our business, financial condition and operating results.
Regulatory Risks
The regulatory systems under which we operate and potential changes thereto could have a material adverse effect on our business.
Our activities are subject to extensive regulation under the laws and regulations of the U.S., U.K., Bermuda and the E.U. and its member states and the other jurisdictions in which we operate. Our Operating Subsidiaries may not be able to maintain necessary licenses, permits, authorizations or accreditations in territories where we currently engage in business or obtain them in new territories, or may be able to do so only at significant cost. In addition, we may not be able to comply fully with, or obtain appropriate exemptions from, the wide variety of laws and regulations applicable to insurance or reinsurance companies or holding companies. In addition to insurance and financial industry regulations, our activities are also subject to relevant economic and trade sanctions, money laundering regulations, and anti-corruption laws including the U.S. Foreign Corrupt Practices Act and the U.K. Bribery Act 2010, which may increase the costs of regulatory compliance, limit or restrict our ability to do business or engage in certain regulated activities, or subject us to the possibility of regulatory actions, proceedings and fines. Although we have in place systems and controls designed to comply with applicable laws and regulations, there can be no assurance that we, our employees, or our agents acting on our behalf are in full compliance with all applicable laws and regulations or their interpretation by the relevant authorities and given the complex nature of the risks, it may not always be possible for us to ascertain compliance with such laws and regulations. Failure to comply with or to obtain appropriate authorizations and/or exemptions under any applicable laws or regulations, including those referred to above, could subject us to investigations, criminal sanctions or civil remedies, including fines, injunctions, loss of an operating license, reputational consequences, and other sanctions, all of which could have a material adverse effect on our business. Changes in the laws or regulations to which our Operating Subsidiaries are subject could also have a material adverse effect on our business. In addition, in most jurisdictions, government regulatory authorities have the power to interpret or amend applicable laws and regulations, and have discretion to grant, renew or revoke licenses and approvals we need to conduct our activities. Such authorities may require us to incur substantial costs in order to comply with such laws and regulations. Refer to Part I, Item 1, “Business — Regulatory Matters” above for more information.
48
The insurance and reinsurance industries are subject to political, regulatory and legislative initiatives or proposals from time to time which could adversely affect our business.
Governments and regulatory bodies may take unpredictable action to ensure continued supply of insurance, particularly where a given event leads to withdrawal of capacity from the market. For example, regulators may seek to force us to offer certain covers to (re)insureds, constrain our flexibility to apply certain terms and conditions or constrain our ability to make changes to the pricing of our contracts. There can be no assurance as to the effect that any such governmental or regulatory actions will have on the financial markets generally or on our competitive position, business and financial condition.
The terms of the U.S. federal multi-peril crop insurance (“MPCI”) program, which is administered by the Risk Management Agency (the “RMA”) of the U.S. Department of Agriculture, may change and adversely impact us. The Agricultural Act of 2014, also known as the 2014 U.S. Farm Bill, was signed into law in February 2014 and fixes the terms of the MPCI program through February 2019. The Agricultural Improvement Act of 2018, which amends the terms of the MPCI program, was passed by the U.S. Senate on December 12, 2018. The RMA periodically reviews and proposes changes to the Standard Reinsurance Agreement (“SRA”) used in connection with the MPCI program. Given that agriculture insurance premiums driven by the MPCI program represent a large portion of the business produced by the portfolio of CGBIC, such changes to the SRA could impact MPCI risk and profitability, and, in turn, adversely affect our financial results through our crop reinsurance business.
Further, recent political initiatives to restrict free trade, end regulatory alignment and close markets, such as the U.K.’s decision to withdraw from the E.U. (“Brexit”) and the Trump administration’s decision to withdraw from the Trans-Pacific partnership, could adversely affect the insurance and reinsurance industry and, in turn, our business. The reinsurance industry is disproportionately impacted by restraints on the free flow of capital and risk because the value it provides depends on our ability to globally diversify risk. Increasing barriers to free trade and the free flow of capital could adversely affect our business strategy or results of operations.
Changes in regulations that adversely affect the U.S. mortgage insurance and reinsurance market could affect our operations significantly and could reduce the demand for mortgage insurance.
In addition to the general regulatory risks that are described herein, the reinsurance we write could also be indirectly affected by various additional regulations relating particularly to our U.S. mortgage reinsurance operations. U.S. federal and state regulations affect the scope of operations of mortgage guaranty insurers and commercial credit insurers, to whom we provide credit reinsurance. Legislative and regulatory changes could cause demand for private mortgage insurance to decrease, which could have an adverse impact on our U.S. mortgage reinsurance operations. Increases in the maximum loan amount that the U.S. Federal Housing Administration can insure, and reductions in the mortgage insurance premiums it charges, can reduce the demand for private mortgage insurance. Decreases in the maximum loan amounts government-sponsored enterprises, such as the Federal National Mortgage Association (Fannie Mae) and the Federal Home Loan Mortgage Corporation (Freddie Mac) (the “GSEs”), will purchase or guarantee, increases in GSE fees, or decreases in the maximum loan-to-value ratio for loans the GSEs will purchase, can also reduce demand for private mortgage insurance. Changes in these laws or regulations could have an indirect adverse impact on the profitability of our U.S. mortgage reinsurance business.
Material changes in voting rights and related party transactions may require regulatory approval or oversight by insurance regulators.
Insurance regulators, such as the PRA, the FCA and the BMA, impose certain requirements on operating entities they regulate including notification of shareholders, whether directly or indirectly, reaching certain levels of ownership. Prior approval of ownership and transfer of shares by the regulators may be required under certain circumstances. For example, if any entity were to hold 20% or more of the voting rights or 20% or more of the issued ordinary shares of Aspen Holdings, transactions between Aspen U.K. and such entity may have to be reported to the PRA if the value of those transactions exceeds certain threshold amounts that would render them material connected party transactions. In these circumstances, we can give no assurance that these material connected party transactions will not be subject to regulatory intervention by the PRA or other insurance regulators. See “Business — Regulatory Matters” in Item 1 above for more information.
Any transactions between companies within the Aspen Group that are material related party transactions also have to be reported to certain insurance regulators. We can give no assurance that the existence or effect of such related party transactions and the insurance regulator’s assessment of the overall solvency of Aspen Holdings and its subsidiaries, even in circumstances where the Operating Subsidiary has sufficient assets of its own to cover its required margin of solvency, would not result in regulatory intervention by the insurance regulators with regard to such Operating Subsidiary.
49
One or more of our insurance subsidiaries may be required by its regulator to hold additional capital to meet relevant solvency requirements.
Any of our Operating Subsidiaries may be required to hold additional capital in order to meet solvency requirements. Among other matters, Bermuda statutes, regulations and policies of the BMA require Aspen Bermuda to maintain minimum levels of statutory capital, surplus and liquidity to meet solvency standards. The BMA has a risk-based capital adequacy model called the BSCR to assist the BMA both in measuring risk and in determining appropriate levels of capitalization for Aspen Bermuda and the Aspen Group (under the Group Supervision Regime). Further, the BMA requires Class 4 commercial insurers and insurance groups to perform an assessment of their own risk and solvency requirements. The Commercial Insurers / Group Solvency Self-Assessment have the insurer/insurance group determine the capital resources required to achieve its strategic goals, after assessing all reasonably foreseeable material risks arising from its operations or operational environment. These statutes and regulations may restrict our ability to write insurance and reinsurance policies, make certain investments and distribute funds. Refer to Part I, Item 1, “Business — Regulatory Matters — Bermuda Regulation — Group Minimum Solvency Margin and Group Enhanced Capital Requirements” above for more information.
Similarly, under the Solvency II regime, Aspen European and Aspen U.K. are required to provide the PRA with calculations of their solvency position. If they do not meet the solvency requirements this could trigger regulatory intervention by the PRA. Our Syndicate 4711 is also required to provide Lloyd’s with a calculation of the capital requirement for the next year’s syndicate business plan. Lloyd’s review that calculation and can require additional Funds at Lloyd’s to be lodged if they determine that there are issues with such calculation. Refer to Part I, Item 1, “Business — Regulatory Matters — U.K. and E.U. Regulation — Solvency Requirements” above for more information on our solvency requirements.
Aspen U.K. and Aspen European may be affected by the FCA, the PRA and the Bank of England powers over unregulated U.K. parent companies.
The Financial Services Act 2012 created powers for the FCA, the PRA and the Bank of England to impose requirements on U.K. parent companies of certain regulated firms, as referenced in Part I, Item 1, “Business — Regulatory Matters” above. The powers allow the regulators to: (i) direct qualifying parent undertakings to comply with specific requirements; (ii) take enforcement action against qualifying parent undertakings if those directions are breached; and (iii) gather information from qualifying parent undertakings. For example, if an authorized firm is in crisis, the powers may allow a regulator to direct a parent company to provide that firm with capital or liquidity necessary to improve the position of the firm. The definition of “qualifying parent undertakings” could allow the regulators to exercise these powers against an intermediate U.K. parent company of an insurer that is not at the head of the ownership chain. Aspen European, as an English-registered intermediate parent company of Aspen U.K., could potentially be subject to these powers and there can be no assurance as to the impact of such powers on our results of operations and/or financial condition.
The E.U. Directive on Solvency II may affect the way in which Aspen U.K. and AMAL manage their businesses.
The E.U. directive known as Solvency II covering the capital adequacy, risk management and regulatory reporting for insurers and reinsurers came into effect on 1 January 2016. Solvency II has established a revised set of E.U.-wide capital requirements, valuation techniques and risk management requirements that replace the minimum requirements in previous E.U. directives. Solvency II presents a number of risks to regulatory compliance, in particular for Aspen U.K. and AMAL. The Solvency II regime also requires an accelerated quarterly close process across the Aspen Group to allow those U.K. entities to meet their regulatory disclosure obligations.
Our approach to compliance is based on our current understanding of the Solvency II requirements and any material changes thereto could have a material adverse effect on our business. Aspen received approval from the PRA to use an agreed Internal Model to calculate its Solvency Capital Requirement (“SCR”) for Aspen U.K. and our European sub-group headed by Aspen European as from January 1, 2016. Aspen U.K. is required to ensure that the Internal Model operates properly on a continuous basis and that it continues to comply with the “Solvency Capital Requirements — Internal Models” provisions as set out in the PRA rulebook and Solvency II Delegated Acts. If Aspen U.K. fails to comply with these requirements, the PRA may impose capital add-ons requiring Aspen U.K. to hold more capital than the regulatory requirement calculated by its Internal Model. Failure to comply could result in the PRA revoking Aspen U.K.’s approval to use its Internal Model which, in turn, would require Aspen U.K. to calculate its regulatory capital in accordance with the PRA’s standard formula approach. Implementing the PRA’s standard formula approach would likely increase Aspen U.K.’s capital requirement and may adversely impact our operating results and financial conditions.
The European Commission deemed the regulatory regime in Bermuda to be “equivalent” to Solvency II with effect from January 1, 2016. With effect from October 12, 2016, Aspen European and Aspen U.K. have been granted a five year waiver from group supervision requirements being applied to the European sub-group due to Aspen Bermuda being subject to equivalent group supervision.
50
Although Solvency II is now in force, uncertainty remains as to how the Solvency II regime will be enforced or amended and the effectiveness of the coordination and cooperation of information sharing among supervisory bodies and regulators, such as the PRA, with the BMA as group supervisor or the effect, if any, these developments may have on the Aspen Group’s operations and financial condition. This uncertainty has increased as a result of the unpredictable consequences of Brexit. The U.K. may agree with the E.U. a process by which its future Solvency II regime can be determined as equivalent with that of the remaining E.U. members in order to limit market disruption in a post-Brexit environment.
The activities of any of our insurance subsidiaries may be subject to review by insurance regulators of differing jurisdictions which may impose greater burdens than anticipated.
The activities of our Operating Subsidiaries may be subject to review by regulators where different supervisory expectations may exist. For example, Aspen U.K. is authorized to do business in the United Kingdom and has permission to conduct business in Canada, Switzerland, Australia, Singapore, Ireland, all other EEA states and certain Latin American countries. In addition, both Aspen U.K. and AMAL are eligible to write surplus lines business in 50 U.S. States, the District of Columbia, Puerto Rico and the U.S. Virgin Islands, as alien surplus lines insurers. We can give no assurance, however, that insurance regulators in the United States, Bermuda or elsewhere will not review the activities of Aspen U.K. and AMAL and assess that they are subject to such jurisdiction’s licensing or other requirements. As a result, both Aspen U.K and AMAL were subject to mandatory 2018 data calls under the 2015 TRIA Reauthorization propounded by the U.S. Federal Insurance Office and the NAIC.
Aspen Bermuda does not maintain a principal office and its personnel do not solicit, advertise, settle claims or conduct other activities that may constitute the transaction of the business of (re)insurance in any jurisdiction in which it is not licensed or otherwise not authorized to engage in such activities. However, inquiries or challenges to Aspen Bermuda’s (re)insurance activities may be raised in the future. The offshore insurance and reinsurance regulatory environment has become subject to increased scrutiny in many jurisdictions, including the U.S. at both Federal and state levels. Compliance with any new laws, regulations or settlements impacting offshore insurers or reinsurers, such as Aspen Bermuda, could have a material adverse effect on our business.
In addition, Aspen U.K. and Aspen Bermuda are currently affected by U.S. “credit for reinsurance” requirements in connection with their reinsurance of risks of U.S. cedants. Historically state insurance laws have required, alien, non-admitted reinsurers, such as Aspen U.K. and Aspen Bermuda, to fully collateralize their reinsurance obligations to U.S. cedants. As a result, Aspen U.K. and Aspen Bermuda have each established a multi-beneficiary U.S. trust fund for the benefit of their U.S. cedants, enabling such cedants to satisfy U.S. credit for reinsurance requirements. Unless otherwise subject to reduction, such U.S. trust funds must hold funds equal to 100% of the reinsurer’s reinsurance obligations to U.S. cedants.
In 2011, the NAIC amended its credit for reinsurance model law to permit non-U.S. reinsurers to post reduced reinsurance collateral in certain circumstances. A majority of states, including Texas, North Dakota, New York, Florida and California, have incorporated these changes into their state laws and regulations and therefore provide that if an alien, non-admitted reinsurer satisfies certain requirements, including rating and financial requirements, and is domiciled in a qualifying U.S. jurisdiction, it may post reinsurance collateral in an amount lower than 100% of the reinsurer’s obligations. Many non-U.S. reinsurers have applied for and received approval for reduced collateral in applicable states. Aspen Bermuda has received approval for reduced collateral in North Dakota, Florida and New York. Texas enacted a reduced credit for reinsurance statute effective January 1, 2018 and adopted enabling regulations effective June 19, 2018. Aspen Bermuda may file an application for reduced collateral in Texas. As a result, Aspen Bermuda could be subject to increased regulatory review by the regulators in such states.
On January 13, 2017, the U.S. federal authorities and their E.U. counterparts announced the successful completion of their negotiations of a covered agreement, which was signed on September 22, 2017. In terms of reinsurance, the covered agreement eliminates collateral and local presence requirements for E.U. and U.S. reinsurers operating in each other’s markets. In connection with an alien reinsurer’s assumption of insurance business from a U.S. cedant, the covered agreement gives the U.S. states five years from the execution of the covered agreement to remove the existing reinsurance collateral requirements for such alien, non-admitted reinsurers domiciled in the E.U. (such as Aspen U.K.) that meet certain standards. These standards include, among others, minimum capital and solvency ratios, confirmation of financial condition by the reinsurer’s domestic regulator and claims payment standards. If U.S. states do not remove such reinsurance collateral requirements, the states’ credit for reinsurance laws will face federal pre-emption determinations.
The NAIC is working on proposed amendments to the Amended Credit for Reinsurance Model Act and Model Regulation in order to satisfy the substantive and timing requirements of the covered agreement. In addition to removing the reinsurance collateral obligations for E.U. reinsurers as required by the covered agreement, the proposed NAIC amendments would also provide a means by which reinsurers domiciled in other qualifying non-U.S. jurisdictions as well as reinsurers domiciled in qualifying states can achieve equivalent reinsurance collateral status for reinsurance contracts with U.S. insurers. Additionally, on December 12, 2018, the U.S. federal authorities announced that they plan to enter into a covered agreement with the U.K., which will extend the benefits of the U.S./E.U. covered agreement to the U.K. after Brexit. For more detail on the U.S./E.U. covered agreement, refer to Part I, Item 1, “Business — Regulatory Matters” above. There is no guarantee, however, that cedants will be willing to accept reduced
51
collateral pursuant to the covered agreement and NAIC requirements. In addition, to the extent we require liquid assets to meet certain cash obligations, the collateral requirements of Aspen U.K. and Aspen Bermuda’s multi-beneficiary U.S. trust fund could adversely impact our liquidity position
Changes to the Bermuda regulatory system, including changes to its Group Supervisory regime, could have a material adverse effect on our business.
The BMA is our group supervisor and has designated Aspen Bermuda as the designated insurer. As group supervisor, the BMA will (i) assess the Aspen Group’s compliance with the BMA’s solvency rules, (ii) perform ongoing supervisory review and assessment of the Aspen Group’s financial position and governance systems, (iii) coordinate the gathering and dissemination of relevant or essential information, (iv) convene and conduct supervisory colleges with other supervisory authorities that have regulatory oversight of entities within a group and (v) coordinate any enforcement action that may be taken against any of the members of the Aspen Group. We are unable to predict with certainty how these laws, frameworks and/or regulations will be enforced or amended, the form in which any pending or future laws, frameworks and/or regulations could be adopted, the effectiveness of the coordination and cooperation of information sharing among supervisory bodies and regulators, or the effect, if any, these developments would have on our operations and financial condition.
The Council of Lloyd’s and the Lloyd’s Franchise Board have wide discretionary powers to supervise members of Lloyd’s.
The Council of Lloyd’s may vary the method by which the capital requirement, or the investment criteria applicable to Funds at Lloyd’s, is determined. Variance to the capital requirement determination method might affect the maximum amount of the overall premium income that we are able to underwrite. Variation in both might affect our return on investments. The Lloyd’s Franchise Board also has wide discretionary powers in relation to the business of Lloyd’s managing agents, such as AMAL, including the requirement for compliance with the franchise performance and underwriting guidelines. The Lloyd’s Franchise Board imposes certain restrictions on underwriting or on reinsurance arrangements for any Lloyd’s syndicate and changes in these requirements imposed on us may have an adverse impact on our ability to underwrite which in turn will have an adverse effect on our financial performance.
Changes in Lloyd’s regulation or the Lloyd’s market could make Syndicate 4711 less attractive.
Changes in Lloyd’s regulation or other developments in the Lloyd’s market could make operating Syndicate 4711 less attractive. For example, Lloyd’s imposes a number of charges on businesses operating in the Lloyd’s market, including annual subscriptions and Central Fund levies for members and policy signing charges. Despite the principle that each member of Lloyd’s is only responsible for the proportion of risk written on its behalf, a Central Fund acts as a policyholder’s protection fund to make payments where other members have failed to pay valid claims. The Council of Lloyd’s may resolve to make payments from the Central Fund for the advancement and protection of members, which could lead to additional or special levies being payable by Syndicate 4711. The bases and amounts of these charges may be varied by Lloyd’s and could adversely affect our financial and operating results.
Syndicate 4711 may also be affected by a number of other changes in Lloyd’s regulation, such as changes to the process for the release of profits and new member compliance requirements. The ability of Lloyd’s syndicates to trade in certain classes of business at current levels may be dependent on the maintenance by Lloyd’s of a satisfactory credit rating issued by an accredited rating agency. At present, the financial security of the Lloyd’s market is regularly assessed by three independent rating agencies, A.M. Best, S&P and Fitch Ratings. Refer to “Credit Risks — Our Operating Subsidiaries are rated, and our Lloyd’s business benefits from a rating by one or more of A.M. Best, S&P and Moody’s, and a decline in any of these ratings could adversely affect our standing among brokers and customers and cause our premiums and earnings to decrease and limit our ability to pay dividends on our ordinary shares” above.
The syndicate capital setting process within AMAL is subject to the PRA rules but is conducted by Lloyd’s under its detailed procedures. Lloyd’s could request an increase in capital under the PRA rules in similar circumstances as set out in “Business — Regulatory Matters” in Item 1 above. Lloyd’s as whole, including Syndicate 4711, is also subject to the provisions of Solvency II as noted above.
Potential changes to the U.S. regulatory system could have an adverse effect on the business of our U.S. operating companies.
The purpose of the state insurance regulatory statutes is to protect U.S. policyholders, not our shareholders or noteholders. The system of regulation generally administered in the United States by the state insurance departments relates to, among other things, solvency standards, restrictions on the nature, quality and concentration of investments, statutory accounting standards, and the regulation of insurance policies, market conduct and premium rates. Among other matters, these statutes require Aspen Specialty and AAIC to maintain minimum levels of capital, surplus and liquidity and to comply with applicable risk-based capital
52
requirements. Insurance holding company laws and regulations also impose restrictions on the insurer’s ability to pay dividends and distributions to its shareholders. Taken together, state regulation of insurer investments, premium rates, capital adequacy and dividend restrictions could potentially restrict the ability of Aspen entities in the U.S. to write new business or distribute assets to Aspen Holdings.
State insurance holding company laws also require prior notice and state insurance department approval of certain transactions between a U.S. insurer and any affiliate as well as changes in control of an insurer or its holding company. Any purchaser of 10% or more of the outstanding voting securities of an insurance company or its holding company is presumed to have acquired control, unless this presumption is rebutted. Therefore, an investor who intends to acquire 10% or more of our outstanding voting securities may need to comply with these laws and would be required to file applications with the North Dakota and Texas insurance departments for regulatory approvals for such acquisition and obtain prior approvals from such departments.
Recent changes in state insurance laws address a number of standards that affect insurance holding company systems, including corporate governance, group-wide supervision, own risk and solvency assessments, accounting for group-wide risks in risk-based capital calculations, cybersecurity matters and imposition of additional disclosure obligations. New U.S. laws and regulations or changes to existing laws and regulations or the interpretation of these laws and regulations could have a material adverse effect on our business or operating results.
In addition, the U.S. Congress has enacted legislation providing a greater role for the federal government in the regulation of insurance. For example, the Dodd-Frank Act established a Federal Insurance Office (“FIO”) within the U.S. Department of Treasury Department to collect data on the insurance industry, recommend changes to the state system of insurance regulation and pre-empt certain state insurance laws. One permitted area of federal involvement is the negotiation of “covered agreements” with foreign jurisdiction which would have the effect of pre-empting state law. For more information on the covered agreement between the U.S. and the E.U., refer to Part I, Item 1, “Business — Regulatory Matters — U.S. Regulation — Operations of Aspen U.K. and Aspen Bermuda.” The Dodd-Frank Act also authorized the creation of the Financial Stability Oversight Council (“FSOC”), a financial regulatory organization chaired by the U.S. Secretary of the Treasury. FSOC has the authority to determine that non-bank financial institutions such as insurance companies are systemically significant and therefore subject to prudential supervision by the Board of Governors of the Federal Reserve. There are currently no such non-bank financial institutions designated by FSOC as systemically significant. While we have received no notice from FSOC regarding a proposed determination of systemic importance, additional laws and regulation adopted in the future or changes in existing laws and regulations could impose significant burdens on us, impact the ways in which we conduct our business, increase compliance costs, duplicate state regulation and/or could result in a competitive disadvantage.
Despite the above, President Trump has expressed the goal of dismantling or rolling back the Dodd-Frank Act, which may present regulatory risks to our businesses. On May 24, 2018, President Trump signed into law the Economic Growth, Regulatory Relief and Consumer Protection Act (“Economic Growth Act”), which includes provisions meant to roll back certain banking regulations contained in the Dodd-Frank Act. Section 211 of the Economic Growth Act directs the Director of FIO and the Board of Governors of the Federal Reserve to (i) support increasing transparency at any global insurance or international standard setting regulatory or supervisory forum in which they participate, including by advocating for greater public access to IAIS meetings; and (ii) to achieve consensus positions with the states through the NAIC prior to taking a position with respect to an insurance proposal by a global insurance regulatory or supervisory forum. President Trump issued a signing statement with the Economic Growth Act signaling that the executive branch bodies may not achieve consensus positions with the states through the NAIC prior to taking a position on international insurance proposals. Thus, the Economic Growth Act may have a material effect on our business operations in the U.S. or elsewhere.
Changes in U.S. state insurance legislation and insurance department regulation may impact liabilities assumed by our business.
Aspen Specialty, AAIC, Aspen U.K. and various affiliates are subject to periodic changes in U.S. state insurance legislation and insurance department regulation which may materially affect the liabilities assumed by the companies in such states. For example, as a result of natural disasters or emergency orders, related regulations may be periodically issued or enacted by individual states. This may impact the cancellation or non-renewal of property policies issued in those states for an extended period of time, increasing the potential liability to us on such extended policies. Failure to adhere to these regulations could result in the imposition of fines, fees, penalties and loss of approval to write business in such states. Further, certain states with catastrophe exposures (e.g., California earthquakes and wildfires, Florida hurricanes) have opted to establish state-run, state-owned reinsurers that compete with us and therefore reduce the amount of business available to us.
53
Government authorities seek to more closely monitor and regulate the insurance industry which may adversely affect our business.
The Attorneys General for multiple U.S. states and other insurance regulatory authorities have previously investigated a number of issues and practices within the insurance industry, and in particular insurance brokerage compensation practices. To the extent that state regulation of brokers and intermediaries becomes more onerous, costs of regulatory compliance for Aspen Management, ASIS and Aspen Re America will increase. These investigations of the insurance industry in general, whether involving us specifically or not, together with any legal or regulatory proceedings, related settlements and industry reform or other changes arising therefrom, may materially adversely affect our business and operating results.
The United Kingdom
’
s decision to withdraw from the E.U. could adversely impact our business, results of operations and financial condition.
The formal process of the U.K. leaving the E.U. commenced on March 29, 2017 when the Prime Minister of the U.K. notified the European Council under Article 50 of the Treaty on the European Union (“Article 50”) of the U.K.’s intention to leave. The U.K. will remain a member state of the E.U. until it negotiates and reaches an agreement in relation to the withdrawal from the E.U. or, if earlier, upon the expiration of a two year period following the Article 50 notification (i.e. on March 29, 2019). In November 2018, the U.K. and E.U. announced agreement on a draft text of a withdrawal agreement, which would include the application of transitional provisions under which E.U. law would broadly remain in force in the U.K. until the end of December 2020. However, there is uncertainty as to whether the withdrawal agreement, which is subject to approval of the U.K. Parliament, will actually be entered. In the absence of such an agreement there would be no transitional provisions and a “hard” Brexit would occur on March 29, 2019, unless the U.K. Government were to revoke its Article 50 notice or if the two year period were to be extended.
The uncertainty surrounding the implementation and effect of Brexit, the terms and conditions of such exit, the legal and regulatory framework that would apply to the U.K. and its relationship with the remaining members of the E.U. (including in relation to trade and services) during a withdrawal process and after Brexit is effected has caused, and is likely to cause, increased economic volatility and market uncertainty globally, in particular volatility of currency exchange rates, interest rates and credit spreads. It has already led, and may continue to lead, to disruptions for the European and global financial markets, such as the decrease in the value of the British Pound and of market values of listed E.U. companies, in particular from the financial services and insurance sector, and the downgrade of the credit ratings for the U.K. by Standard & Poor’s, Moody’s and Fitch (all with negative outlook). For more information on the effect of a credit rating downgrade, refer to “Market and Liquidity Risks — A downgrade of U.S. or non-U.S. government securities by credit rating agencies could adversely impact the value of such securities in our investment portfolio and create uncertainty in the market generally” above. As well as short-term issues, the long-term effect of Brexit on the value of our investment portfolio at this time is uncertain, and such volatility and uncertainty will likely continue as negotiations progress to determine the future terms of the U.K.’s relationship with the E.U.
Brexit could lead to potentially divergent national laws and regulations as the U.K. determines which E.U. laws to replace or replicate. We may have to review our underwriting platforms and incur additional regulatory costs as a result. Aspen U.K. may lose its EEA financial services passport which provides it the license to operate across borders within the single EEA market without obtaining local regulatory approval where insurers and cedants are located. For example, Aspen’s Lloyd’s operations are subject to the continued ability of Lloyd’s to operate a subsidiary in Brussels, Belgium to write Lloyd’s businesses would seek access to the single market following Brexit. Operational and capital requirements relating thereto might result in increased costs or Funds at Lloyd’s and might not provide the same access to markets that Aspen currently requires to conduct business in the EEA. In addition, depending on the terms of Brexit, the U.K.’s regulatory regime in terms of Solvency II regulation and governance could also diverge and no longer be equivalent. For more information, refer to “Regulatory Risks — The E.U. Directive on Solvency II may affect the way in which Aspen U.K. and AMAL manage their businesses” above.
Depending on the terms of Brexit or if there is a “hard” Brexit, the U.K. could also lose access to the single E.U. market and to the global trade deals negotiated by the E.U. on behalf of its members. Such a decline in trade could affect the attractiveness of the U.K. as a global investment center and, as a result, could have a detrimental impact on U.K. growth. Although we have an international customer base, we could be adversely affected by reduced growth and greater volatility in the U.K. economy.
Changes to U.K. immigration policy could likewise occur as a result of Brexit, including by restricting the free travel of employees from and to the U.K. Although the U.K. will likely seek to retain its diverse pool of talent, London’s role as a global center for specialty (re)insurance business may decline, particularly if financial services entities shift their headquarters to the E.U. and the E.U. financial services passport is not maintained.
There is also some concern that the result of the Brexit referendum could encourage other countries to conduct their own referenda on their continuing relationship with and participation in the E.U. This could possibly lead to exits by other E.U. members, which could draw out the current levels volatility and uncertainty being felt within the E.U. market. Any of the above effects of Brexit, and others which cannot be anticipated, could adversely affect our business, results of operations and financial condition.
54
Changes in current accounting practices and future pronouncements may materially impact our reported financial results.
Unanticipated developments in accounting practices may require us to incur considerable additional expenses to comply with such developments, particularly if we are required to prepare information relating to prior periods for comparative purposes or to apply the new requirements retroactively. Such developments may also significantly impact the presentation of such financial statements and may require restatements. The impact of changes in current accounting practices and future pronouncements cannot be predicted but they may affect the calculation of net income, net equity and other relevant financial statement line items.
Other Operational Risks
We could be adversely affected by the loss of one or more of our senior underwriters or key employees or by an inability to attract and retain senior staff.
Our success has depended and will continue to depend, in substantial part, on our ability to attract and retain our teams of underwriters in various business lines and other key employees. The loss of one or more of our senior underwriters could adversely impact our business by, for example, making it more difficult to retain clients or other business contacts whose relationship depends in part on the service of the departing personnel. In general, the loss of key services of any members of our current underwriting teams may adversely affect our business and operating results.
We also rely substantially upon the services of our senior management team. Although we have employment agreements with all members of our senior management team, if we were to unexpectedly lose the services of one or more of our senior management team or other key personnel, our business or ratings could be adversely affected. For example, an unplanned change in our senior management team could cause a risk of disruption to our business including, but not limited to, our underwriting, claims handling, reserving and financial reporting functions. We do not currently maintain key-man life insurance policies with respect to any of our employees.
Changes in employment laws, taxation and acceptable compensation practice may limit our ability to attract senior employees to our current operating platforms.
Our business and operations are, by their nature, international and we compete for senior employees on a global basis. Changes in local employment legislation, taxation and the approach of regulatory bodies to compensation practice within our operating jurisdictions may impact our ability to recruit or retain senior employees or the cost to us of doing so.
For example, in the United Kingdom the Senior Insurance Managers Regime (“SIMR”) extends the scope of regulatory pre-approval requirements for senior managers to more functions covered and to non-U.K. senior managers with the ability to influence U.K. companies. As well as the regulatory pre-approval for those senior insurance managers, there are evolving individual regulatory accountability requirements and sanctions and requirements in relation to their remuneration. Any failure to retain senior employees may adversely affect the strategic growth of our business and our operating results.
Our business is subject to risks related to litigation.
We may be subject to a variety of legal actions relating to our current and past business operations including, but not limited to, disputes over coverage or claims adjudication, including claims alleging that we have acted in bad faith in the administration of claims by our policyholders, disputes with our agents, producers or network providers over compensation and termination of contracts and related claims, disputes relating to certain business acquired or disposed of by us and disputes with former employees. We cannot determine with any certainty what new theories of recovery may evolve or what their impact may be on our business.
Multi-party or class action claims may present additional exposure to substantial economic, non-economic or punitive damage awards. The loss of even one of these claims, if it results in a significant damage award or a judicial ruling that was otherwise detrimental, could create a precedent in the industry that affects a great many future or unrelated claims and so could have a material adverse effect on our operating results and financial condition. There is potential risk of increased litigation as a result of employees raising disputes or grievances in relation to Aspen’s Efficiency and Effectiveness Program.
55
We rely on the execution of complex internal processes to maintain our operations and the operational risks that are inherent to our business, including those resulting from fraud or employee errors or omissions, may result in financial losses.
We rely on the accurate execution of complex internal processes to maintain our operations. We seek to monitor and control our exposure to risks arising from these processes through a risk control framework encompassing a variety of reporting systems, internal controls, management review processes and other mechanisms. We cannot provide absolute assurance that these processes and procedures will effectively control all known risks or effectively identify unforeseen risks, or that our employees and third party agents will effectively implement them. Loss may result from, among other things, fraud, errors, failure to document transactions properly, failure to obtain proper internal authorization, failure to comply with underwriting or other internal guidelines or failure to comply with regulatory requirements. Loss from these risks could adversely affect our business, results of operations and financial condition. In addition, insurance policies that we have in place with third parties may not protect us in the event that we experience a significant loss from these risks.
A failure in our operational systems or infrastructure or those of third parties, including those caused by security breaches or cyber-attacks could disrupt our business, damage our reputation and cause losses.
Our operations rely on the secure processing, storage, and transmission of confidential and other information and assets, including in our computer systems and networks. Our business, including our ability to adequately price products and services, establish reserves, provide an effective and secure service to our customers, value our investments and report our financial results in a timely and accurate manner, depends significantly on the integrity, availability and timeliness of the data we maintain, as well as the data and assets held through third party outsourcers, service providers and systems. Cybersecurity and technology threats can include phishing scams, account takeovers, introductions of malware, attempts at electronic break-ins, and the computerized submission of fraudulent and/or duplicative payment requests. Any such breaches or interference (including attempted breaches or interference) by third parties or by insiders that may occur in the future could have a material adverse impact on our business, reputation, financial condition or results of operations.
In an effort to ensure the integrity of such data, we implement new security measures and systems and improve or upgrade our existing security measures and systems on a continuing basis. Although we have implemented administrative and technical controls and take protective actions to reduce the risk of cyber incidents and to protect our information technology and assets, and we endeavor to modify such procedures as circumstances warrant and negotiate agreements with third party providers to protect our assets, such measures may be insufficient to prevent, among other things, unauthorized access, computer viruses, malware or other malicious code or cyber-attack, catastrophic events, system failures and disruptions (including in relation to new security measures and systems), employee errors or malfeasance, third party (including outsourced service providers) errors or malfeasance, loss of assets and other security events (each, a “Security Event”). Like other global companies, we have from time to time experienced, and are likely to continue to be subject to, Security Events, none of which to date have had a material adverse impact on our business, results of operations or financial condition. As the breadth and complexity of our security infrastructure continues to grow, the potential risk of a Security Event increases. If additional Security Events occur, these events may jeopardize our or our clients’ or counterparties’ confidential and other information processed and stored with us, and transmitted through our computer systems and networks, or otherwise cause interruptions, delays, or malfunctions in our, our clients’, counterparties’ or third parties’ operations, or result in data loss or loss of assets which could result in significant losses and/or fines, reputational damage or a material adverse effect on our business, financial condition or operating results. We may be required to expend significant additional resources to modify our protective measures or to investigate and remediate vulnerabilities or other exposures and to pursue recovery of lost data or assets and we may be subject to litigation and financial losses. We currently maintain cyber liability insurance that provides third party or first party liability coverages to protect us, subject to policy limits and coverages, against certain events that could be a Security Event. However, a Security Event could nonetheless have a material adverse effect on our operating results or financial condition.
We outsource certain technology and business process functions to third parties including offshore and cloud service providers and may increasingly do so in the future. If we do not effectively develop, implement and monitor our outsourcing strategy, third party providers do not perform as anticipated or we experience technological or other problems with a transition, we may not realize productivity improvements or cost efficiencies and may experience operational difficulties, increased costs and loss of business. Our outsourcing of certain technology and business processes functions to third parties may expose us to enhanced risks related to data security, which could result in monetary and reputational damages. In addition, our ability to receive services from third party providers may be impacted by cultural differences, political instability, unanticipated regulatory requirements or policies. As a result, our ability to conduct our business may be adversely affected.
Despite the contingency plans and facilities we have in place and our efforts to observe the regulatory requirements surrounding information security, our ability to conduct business may be adversely affected by a disruption of the infrastructure that supports our business in the communities in which we are located, or of outsourced services or functions, including a disruption involving electrical, communications, transportation, or other services we use. If a disruption occurs in one location and our employees in
56
that location are unable to occupy our offices and conduct business or communicate with or travel to other locations, our ability to service and interact with clients may suffer and we may not be able to successfully implement contingency plans that depend on communication or travel. If sustained or repeated, such business interruption, system failure, service denial or data loss and/or damage could result in a deterioration of our ability to write and process business, provide customer service, pay claims in a timely fashion or perform other necessary business functions.
Data protection failures
could disrupt our business, damage our reputation and cause losses.
The regulatory environment surrounding information security and privacy is increasingly demanding. We are subject to numerous U.S. federal and state laws and non-U.S. regulations governing the protection of personal and confidential information of our clients or employees, including in relation to medical records, credit card data and financial information.
On May 25, 2018, the European General Data Protection Regulation (the “GDPR”) became directly applicable in all E.U. member states replacing the Data Protection Directive (95/46/EC). We are subject to the GDPR when offering goods and services to E.U. based data subjects (regardless of whether involving our E.U. based subsidiary or operations). The GDPR sets out a number of requirements that must be complied with when handling the personal data of such E.U. based data subjects including: the obligation to appoint data protection officers where appropriate; new rights for individuals to be “forgotten” and rights to data portability; the principal of accountability and the obligations to report data breaches. The GDPR also retained and added to some existing requirements, including restrictions on transfers outside the EEA and the requirement to include specific data protection provisions in agreements with data processors. These laws and regulations are increasing in complexity and number, change frequently and sometimes conflict. In particular, the legislation introduced by each E.U. member state to implement the GDPR are not fully harmonized as the GDPR allows national variations in certain areas. We continue to monitor compliance with all relevant E.U. member states’ laws and regulations, including where permitted derogations from the GDPR are introduced.
The introduction of the GDPR, and the resultant changes in E.U. member states’ national laws and regulations, increased our compliance obligations and triggered an update of our policies and processes relating to our collection and use of data. There is a risk that these compliance obligations could increase, further leading to an increase in compliance costs which may have an adverse impact on our business, financial condition or results of operations.
If any person, including any of our employees or those with whom we share such information, negligently disregards or intentionally breaches our established controls with respect to our client or employee data, or otherwise mismanages or misappropriates that data, we could be subject to significant monetary damages, regulatory enforcement actions, fines and/or criminal prosecution in one or more jurisdictions. For example, sanctions for non-compliance with the GDPR could result in a penalty of up to the higher of (a) €20 million; and (b) 4% of a firm’s global annual revenue for the preceding financial year for certain infringements, such as unlawful data transfer outside of the EEA. In addition, a data breach could result in negative publicity which could damage our reputation and have an adverse effect on our business, financial condition or results of operations.
Our internal controls over financial reporting may have gaps or other deficiencies.
Our internal control system was designed to provide reasonable assurance regarding the reliability of financial reporting and the preparation of financial statements for external purposes in accordance with generally accepted accounting principles. However, our internal controls over financial reporting may have gaps or other deficiencies and there is no guarantee that significant deficiencies or material weaknesses in internal controls may not occur in the future. Any such gaps or deficiencies may require significant resources to remediate and may also expose us to litigation, regulatory fines or penalties, or other losses. Inadequate process design or a failure in operating effectiveness could result in a material misstatement of our financial statements due to, but not limited to, poorly designed systems, changes in end-user computing, poorly designed IT reports, ineffective oversight of outsourced processes, failure to perform relevant management reviews, accounting errors or duplicate payments, any of which could result in a restatement of financial accounts.
We may be adversely affected if our capital models provide materially different indications than actual results.
We have made substantial investments to develop proprietary analytic and modeling capabilities to facilitate our underwriting, risk management, capital modeling and allocation, and risk assessments relating to the risks we assume. These models and other tools help us to manage our risks, understand our capital utilization and risk aggregation, inform management and other stakeholders of capital requirements and seek to improve the risk/return profile or optimize the efficiency of the amount of capital we apply to cover the risks in the individual contracts we sell and in our portfolio as a whole. However, given the inherent uncertainty of modeling techniques and the application of such techniques, the possibility of human or systems error, the challenges inherent in consistent application of complex methodologies in a fluid business environment and other factors, our models, tools and databases may not accurately address the risks we currently cover or the emergence of new matters which might be deemed to impact certain of our coverages. Accordingly, our models may understate the exposures we are assuming. Conversely, our models may prove too conservative and contribute to factors which may impede our ability to grow in respect of new markets or perils or in connection
57
with our current portfolio of coverages or the loss environment otherwise may prove more benign than our capital loading for catastrophes or other modeled losses. In such case of excess capital, we would make a judgment about redeploying the capital in lines of businesses or pursuing other capital management activities, such as dividends or share repurchases, which judgment will also depend on modeling techniques and results. If capital models prove inadequate, our result of operations and financial condition may be materially adversely impacted.
The failure of our underwriting processes could have an adverse effect on our results of operations or financial condition.
We seek to manage our loss exposure by maintaining a disciplined underwriting process throughout our (re)insurance operations. Underwriting is a matter of judgment, involving important assumptions about matters that are inherently unpredictable and beyond our control, and for which historical experience and probability analysis may not provide sufficient guidance. The failure of any of the underwriting risk management strategies that we employ could have a material adverse effect on our financial condition, results of operations or cash flows.
We rely on internal controls to limit our risk exposure within prescribed parameters. However, our controls and monitoring efforts may be ineffective, permitting one or more underwriters to exceed their underwriting authority and cause us to (re)insure risks outside the agreed upon guidelines. To the extent that our underwriters exceed their authorities, agree to inappropriate contract terms and conditions or are influenced by broker incentives, or if there is ineffective channel management or inaccurate underwriting data capture and reporting leading to licensing and sanction breaches, our financial condition or results of operations could be materially adversely affected.
Risks Related to Our Securities
Our ability to pay dividends or to meet ongoing cash requirements may be constrained by our holding company structure.
We are a holding company and, as such, we do not expect to have any significant operations or assets other than our ownership of the shares of our subsidiaries, including our Operating Subsidiaries. Dividends and other permitted distributions and loans from our Operating Subsidiaries are expected to be our sole source of funds to meet ongoing cash requirements, including our debt service payments and other expenses, and dividend payments, to our preference and ordinary shareholders, as appropriate. Our Operating Subsidiaries are subject to capital, regulatory and other requirements that inform their ability to declare and pay dividends and make loans to other Aspen Group companies. In line with common market practice for regulated institutions, the PRA, the regulatory agency which oversees the prudential regulation of insurance companies in the U.K. such as Aspen U.K., previously requested that it be afforded the opportunity to provide a “non-objection” prior to all future dividend payments made by Aspen U.K. In 2017, the PRA stated that they no longer routinely require Aspen U.K. to apply for a non-objection to dividends provided such dividend payment and Aspen U.K.’s subsequent capital position are within Aspen U.K.’s board-approved solvency capital risk appetite. Refer to Part I, Item 1, “Business — Regulatory Matters — Bermuda Regulation — Restrictions on Dividends, Distributions and Reduction of Capital,” “Business — Regulatory Matters — U.K. and E.U. Regulation — Restrictions on Dividend Payments,” and “Business — Regulatory Matters — U.S. Regulation — State Dividend Limitations” above and “Management’s Discussion and Analysis of Financial Condition and Results of Operations — Liquidity” in Part II, Item 7 below for more information on our ability to pay dividends. These and other requirements may mean that our Operating Subsidiaries are unable to pay sufficient dividends to enable us to meet our ongoing cash requirements, which could materially adversely affect our liquidity or financial condition.
Certain regulatory and other constraints may limit our ability to pay dividends on our securities.
We are subject to Bermuda regulatory constraints that affect our ability to pay dividends on our ordinary shares and make other distributions on our Preference Shares (as defined below). Under the Companies Act, we may declare or pay a dividend or distribution out of contributed surplus only if we have reasonable grounds to believe that we are, and would after the payment be, able to meet our liabilities as they become due or if the realizable value of our assets would thereby not be less than our liabilities. Refer to Part I, Item 1, “Business — Regulatory Matters”, Part II, Item 7, “Management’s Discussion and Analysis of Financial Condition and Results of Operations — Liquidity” and Note 15 of our consolidated financial statements, “Statutory Requirements and Dividends Restrictions” for more information on our ability to pay dividends.
The Merger Agreement restricts the payment of dividends on our ordinary shares.
The Merger Agreement restricts us from declaring or paying any dividends on ordinary shares, including our regular quarterly dividend (other than the quarterly dividends on our ordinary shares that were declared and publicly announced prior to the date of the Merger Agreement).
58
There are provisions in our charter documents which may reduce or increase the voting rights of our ordinary shares without regard to corresponding ownership.
In general, and except as provided below, shareholders have one vote for each ordinary share held by them and are entitled to vote at all meetings of shareholders. However, if, and so long as, the ordinary shares of a shareholder are treated as “controlled shares” (as determined under section 958 of the Internal Revenue Code of 1986, as amended (the “Code”)) of any U.S. Person (as defined below) and such controlled shares constitute 9.5% or more of the votes conferred by our issued shares, the voting rights with respect to the controlled shares of such U.S. Person (a “9.5% U.S. Shareholder”) shall be limited, in the aggregate, to a voting power of less than 9.5%, under a formula specified in our bye-laws. The formula is applied repeatedly until the voting power of all 9.5% U.S. Shareholders has been reduced to less than 9.5%. This provision was intended to mitigate the risk that Aspen Holdings or any of our non-U.S. subsidiaries would be characterized as a “controlled foreign corporation” for U.S. federal income tax purposes. As described below however, this provision will not mitigate this risk based on a recent legislative change. Refer to “Risks Related to Taxation — Holders of 10% or more of Aspen Holdings’ shares may be subject to U.S. income taxation under the controlled foreign corporation (“CFC”) rules” below for more information.
In addition, the Board may limit a shareholder’s voting rights (including appointment rights, if any, granted to holders of our 5.95% Fixed-to-Floating Rate Perpetual Non-Cumulative Preference Shares and 5.625% Perpetual Non-Cumulative Preference Shares, each with a liquidation preference of $25 per share (collectively, the “Preference Shares”)) where it deems it appropriate to do so to (i) avoid the existence of any 9.5% U.S. Shareholder, and (ii) avoid certain material adverse tax, legal or regulatory consequences to us or any holder of our shares or its affiliates. “Controlled shares” includes, among other things, all shares of the Company that such U.S. Person is deemed to own directly, indirectly or constructively (within the meaning of section 958 of the Code). As of
December 31, 2018
, there were
59,743,156
ordinary shares outstanding of which
5,675,600
ordinary shares would constitute 9.5% of the votes conferred by our issued and outstanding shares.
For purposes of this discussion, the term “U.S. Person” means: (i) a citizen or resident of the United States, (ii) a partnership or corporation, or entity treated as a corporation, created or organized in or under the laws of the United States, or any political subdivision thereof, (iii) an estate the income of which is subject to U.S. federal income taxation regardless of its source, or (iv) a trust if either (x) a court within the United States is able to exercise primary supervision over the administration of such trust and one or more U.S. Persons have the authority to control all substantial decisions of such trust or (y) the trust has a valid election in effect to be treated as a U.S. Person for U.S. federal income tax purposes or (z) any other person or entity that is treated for U.S. federal income tax purposes as if it were one of the foregoing.
Under these provisions, certain shareholders may have their voting rights limited to less than one vote per share, while other shareholders may have voting rights in excess of one vote per share. Refer to Part II, Item 5, “Market for the Registrant’s Common Equity, Related Stockholder Matters and Issuer Purchaser of Equity Securities — Bye-Laws.” Moreover, these provisions could have the effect of reducing the votes of certain shareholders who would not otherwise be subject to the 9.5% limitation by virtue of their direct share ownership.
As a result of any reallocation of votes, voting rights of some of our shareholders might increase above 5% of the aggregate voting power of the outstanding ordinary shares, thereby possibly resulting in such shareholders becoming a reporting person subject to Schedule 13D or 13G filing requirements under the Exchange Act. In addition, the reallocation of the votes of our shareholders could result in some of the shareholders becoming subject to filing requirements under Section 16 of the Exchange Act.
We also have the authority under our bye-laws to request information from any shareholder for the purpose of determining whether a shareholder’s voting rights are to be reallocated under the bye-laws. If a shareholder fails to respond to our request for information or submits incomplete or inaccurate information in response to a request by us, we may, in our sole discretion, eliminate such shareholder’s voting rights.
There are provisions in our bye-laws which may restrict the ability to transfer ordinary shares and which may require shareholders to sell their ordinary shares.
The Board may decline to register a transfer of any ordinary shares if it appears to the Board, in its sole and reasonable discretion, after taking into account the limitations on voting rights contained in our bye-laws, that any non-de minimis adverse tax, regulatory or legal consequences to us, any of our subsidiaries or any of our shareholders or their affiliates may occur as a result of such transfer. Our bye-laws also provide that if the Board determines that share ownership by a person may result in material adverse tax consequences to us, any of our subsidiaries or any shareholder or its affiliates, then we have the option to require that shareholder to sell the repurchase right for fair market value the minimum number of ordinary shares held by such person which is necessary to eliminate the material adverse tax consequences.
59
Some of the provisions in our bye-laws and in the laws and regulations of the jurisdictions where we conduct business could delay or deter a takeover attempt that shareholders might consider desirable and may make it more difficult to replace members of our Board.
Our bye-laws contain provisions that may entrench directors and make it more difficult for shareholders to replace directors even if shareholders consider it beneficial to do so. These provisions could delay or prevent a change of control that shareholders might consider favorable. For example, these provisions may prevent a shareholder from receiving the benefit from any premium over the market price of our ordinary shares offered by a bidder in a potential takeover. Even in the absence of an attempt to effect a change in management or a takeover attempt, these provisions may adversely affect the prevailing market price of our ordinary shares if they are viewed as discouraging changes in management and takeover attempts perceived as beneficial in the future.
For example, our bye-laws contain the following provisions that could have such an effect:
|
•
|
election of directors is staggered, meaning that members of only one of three classes of directors are elected each year;
|
|
•
|
directors serve for a term of three years (unless aged 70 years or older);
|
|
•
|
directors may decline to approve or register any transfer of shares to the extent they determine, in their sole discretion, that any non-de minimis adverse tax, regulatory or legal consequences to Aspen Holdings, any of its subsidiaries, shareholders or affiliates would result from such transfer;
|
|
•
|
if directors determine that share ownership by any person may result in material adverse tax consequences to Aspen Holdings, any of its subsidiaries, shareholders or affiliates, we have the option, but not the obligation, to purchase or assign to a third party the right to purchase the minimum number of shares held by such person solely to the extent that it is necessary to eliminate such material risk;
|
|
•
|
shareholders have limited ability to remove directors; and
|
|
•
|
if the ordinary shares of any U.S. Person constitute 9.5% or more of the votes conferred by the issued shares of Aspen Holdings, the voting rights with respect to the controlled shares of such U.S. Person shall be limited, in the aggregate, to a voting power of less than 9.5%, refer to “— There are provisions in our charter documents which may reduce or increase the voting rights of our ordinary shares without regard to corresponding ownership” above.
|
Further, as described under Part I, Item 1, “Business — Regulatory Matters,” prospective shareholders are required to notify our regulators on becoming “controllers” of any of our Operating Subsidiaries through ownership of ordinary shares above certain thresholds, typically 10% of outstanding ordinary shares. Some regulators, such as the PRA, require their approval prior to such shareholder becoming a “controller.” Other regulators may serve a notice of objection or are entitled to injunctive relief. There can be no assurance that the applicable regulatory body would agree that a shareholder who owned greater than 10% of our ordinary shares did not, because of the limitation on the voting power of such shares, control the applicable Operating Subsidiary.
These laws may discourage potential acquisition proposals and may delay, deter or prevent a change of control of the Company, including through transactions, and in particular unsolicited transactions, that some or all of our shareholders might consider to be desirable. If these restrictions delay, deter or prevent a change of control, such restrictions may make it more difficult to replace members of our Board and may have the effect of entrenching management regardless of their performance.
We cannot pay a dividend on our ordinary shares unless the full dividends for the most recently ended dividend period on all outstanding Preference Shares have been declared and paid.
Our Preference Shares rank senior to our ordinary shares with respect to the payment of dividends. As a result, unless the full dividends for the most recently ended dividend period on all outstanding Preference Shares have been declared and paid (or declared and a sum sufficient for the payment thereof has been set aside), we cannot declare or pay a dividend on our ordinary shares. Under the terms of our Preference Shares, these restrictions will continue until full dividends on all outstanding Preference Shares for four consecutive dividend periods have been declared and paid (or declared and a sum sufficient for the payment thereof has been set aside for payment). Refer to Part II, Item 5 “Market for the Registrant’s Common Equity, Related Stockholder Matters and Issuer Purchases of Equity Securities — Description of our Preference Shares” below for more information on our Preference Shares.
Our ordinary shares rank junior to our Preference Shares in the event of a liquidation, winding up or dissolution of the Company.
In the event of a liquidation, winding up or dissolution of the Company, our ordinary shares rank junior to our Preference Shares. In such an event, there may not be sufficient assets remaining after payments to holders of our Preference Shares to ensure payments
60
to holders of ordinary shares. Refer to Part II, Item 5 “Market for the Registrant’s Common Equity, Related Stockholder Matters and Issuer Purchases of Equity Securities — Description of our Preference Shares” below for more information on our Preference Shares.
U.S. persons who own our securities may have more difficulty in protecting their interests than U.S. persons who are shareholders of a U.S. corporation.
The Companies Act, which applies to us, differs in some material respects from laws generally applicable to U.S. corporations and their shareholders. These differences include, but are not limited to, the manner in which directors must disclose transactions in which they have an interest, the rights of shareholders to bring class action and derivative lawsuits, the scope of indemnification available to directors and officers and provisions relating to the amalgamations, mergers and acquisitions and takeovers. Holders of our ordinary shares and Preference Shares may therefore have more difficulty protecting their interests than would shareholders of a corporation incorporated in a jurisdiction within the U.S.
Generally, the duties of directors and officers of a Bermuda company are owed to the company only. Shareholders of Bermuda companies typically do not have rights to take action against directors or officers of the company and may only do so in limited circumstances. Class actions and derivative actions are typically not available to shareholders under Bermuda law. The Bermuda courts, however, would ordinarily be expected to permit a shareholder to commence an action in the name of a company to remedy a wrong to the company where the act complained of is alleged to be beyond the corporate power of the company or illegal, or would result in the violation of the company’s memorandum of association or bye-laws. Furthermore, consideration would be given by a Bermuda court to acts that are alleged to constitute a fraud against the minority shareholders or, for instance, where an act requires the approval of a greater percentage of the company’s shareholders than that which actually approved it. When the affairs of a company are being conducted in a manner that is oppressive or prejudicial to the interests of some shareholders, one or more shareholders may apply to the Supreme Court of Bermuda, which may make such order as it sees fit, including an order regulating the conduct of the company’s affairs in the future or ordering the purchase of the shares of any shareholders by other shareholders or by the company. Additionally, under our bye-laws and as permitted by Bermuda law, each shareholder has waived any claim or right of action against our directors or officers for any action taken by directors or officers in the performance of their duties, except for actions involving fraud or dishonesty. In addition, the rights of holders of our securities and the fiduciary responsibilities of our directors under Bermuda law are not as clearly established as under statutes or judicial precedent in U.S. jurisdictions, particularly the State of Delaware.
We are a Bermuda company and it may be difficult to effect service of process on us or enforce judgments against us or our directors and executive officers in the United States.
We are incorporated under the laws of Bermuda and our business is based in Bermuda. In addition, certain of our directors and officers reside outside the United States, and a substantial portion of our assets and the assets of such persons are located in jurisdictions outside the United States. As such, it may be difficult or impossible to effect service of process upon us or those persons in the United States or to recover against us or them on judgments of U.S. courts, including judgments predicated upon civil liability provisions of the U.S. federal securities laws.
We have been advised by Bermuda counsel that there is no treaty in force between the U.S. and Bermuda providing for the reciprocal recognition and enforcement of judgments in civil and commercial matters. As a result, whether a U.S. judgment would be enforceable in Bermuda against us or our directors and officers depends on whether the U.S. court that entered the judgment is recognized by the Bermuda court as having jurisdiction over us or our directors and officers, as determined by reference to Bermuda conflict of law rules. A judgment debt from a U.S. court that is final and for a sum certain based on U.S. federal securities laws will not be enforceable in Bermuda unless the judgment debtor had submitted to the jurisdiction of the U.S. court, and the issue of submission and jurisdiction is a matter of Bermuda (not U.S.) law.
In addition to and irrespective of jurisdictional issues, the Bermuda courts will not enforce a U.S. federal securities law that is either penal or contrary to public policy in Bermuda. It is the advice of our Bermuda counsel that an action brought pursuant to a public or penal law, the purpose of which is the enforcement of a sanction, power or right at the instance of the state in its sovereign capacity, will not be entertained by a Bermuda court. Certain remedies available under the laws of U.S. jurisdictions, including certain remedies under U.S. federal securities laws, would not be available under Bermuda law or enforceable in a Bermuda court, as they would be contrary to Bermuda public policy. Further, no claim may be brought in Bermuda against us or our directors and officers in the first instance for violation of U.S. federal securities laws because these laws have no extraterritorial jurisdiction under Bermuda law and do not have force of law in Bermuda. A Bermuda court may, however, impose civil liability on us or our directors and officers if the facts alleged in a complaint constitute or give rise to a cause of action under Bermuda law.
61
The New York Stock Exchange may suspend trading generally as a result of technical issues which could cause an interruption in the trading market for our securities.
Our ordinary shares trade on the NYSE under the symbol “AHL” and our Preference Shares also trade on the NYSE. Trading in our securities that are listed on the NYSE may be halted due to a market disruption event, systems failure, cyber security attack or for other technical reasons. If the NYSE is unable to maintain the availability of its electronic trading systems or otherwise safeguard the security of trading within those platforms due to the occurrence of a technical failure, cyber-attack or other information security incident, an investor’s ability to trade in our securities may be compromised. On a few occasions in the past the NYSE has suspended trading in all securities listed on the NYSE due to unusual but major technical issues. During such a halt in trading, there may be no trading market for our ordinary shares or Preference Shares making it difficult for an investor to sell our securities in the volume, or at a price and time, which is attractive to such investor.
Risks Related to Taxation
Our non-U.S. companies (other than AUL) may be subject to U.S. income tax and that may have a material adverse effect on our operating results and your investment.
If Aspen Holdings or any of its non-U.S. subsidiaries (other than AUL) were considered to be engaged in a trade or business in the United States, it could be subject to U.S. corporate income and additional branch profits taxes on the portion of its earnings effectively connected to such U.S. business, in which case its operating results could be materially adversely affected. However, the operating results of Aspen U.K. should not be materially adversely affected as Aspen U.K. is considered to be engaged in a U.S. trade or business solely as a result of the binding authorities granted to certain subsidiaries incorporated in the United States.
We intend to manage the business of Aspen Holdings and its non-U.S. subsidiaries so that none of these companies (other than AUL) should be subject to U.S. corporate income tax because none of these companies should be treated as engaged in a trade or business within the United States (other than Aspen U.K. and APJ Jersey with respect to the business produced pursuant to the binding authorities granted to certain subsidiaries incorporated in the United States). However, U.S. excise tax on premium income attributable to U.S. risks, U.S. Base Erosion and Anti-abuse Tax (“BEAT”) on premium ceded from U.S. subsidiaries to non-U.S. related parties, U.S. withholding tax on certain U.S. source investment income, and U.S. corporate income and additional branch profits tax on the profits attributable to the business of Aspen U.K. produced pursuant to the above described binding authority agreements, and profits attributable to APJ Jersey reflecting the recent expansion of its business into the Latin American market may apply. However, because there is considerable uncertainty as to the activities which constitute being engaged in a trade or business within the United States, we cannot be certain that the U.S. Internal Revenue Service (“IRS”) will not contend successfully that some or all of Aspen Holdings or its non-U.S. subsidiaries (other than AUL) is/are engaged in a trade or business in the United States based on activities in addition to the binding authorities discussed above.
AUL is a member of Lloyd’s and subject to a closing agreement between Lloyd’s and the IRS (the “Closing Agreement”). Pursuant to the terms of the Closing Agreement, all members of Lloyd’s, including AUL, are subject to U.S. federal income taxation. Those members that are entitled to the benefits of a U.S. income tax treaty are deemed to be engaged in a U.S. trade or business through a U.S. permanent establishment. Those members not entitled to the benefits of such a treaty are merely deemed to be engaged in a U.S. trade or business. The Closing Agreement provides rules for determining the income considered to be attributable to the permanent establishment or U.S. trade or business. We believe that AUL may be entitled to the benefits of the U.S. income tax treaty with the U.K., although the position is not certain.
Our non-U.K. companies may be subject to U.K. tax that may have a material adverse effect on our operating results.
None of us, other than our subsidiaries that are incorporated in the U.K. (“the U.K. Subsidiaries”), should be treated as being resident in the U.K. for corporation tax purposes except for APJ Jersey which, although not incorporated in the U.K., is treated as resident in the U.K. as a result of its central management and control being exercised from the U.K. Each of us, other than the U.K. Subsidiaries and APJ Jersey, currently intends to manage our affairs so that none of us, other than the U.K. Subsidiaries and APJ Jersey, is resident in the U.K. for tax purposes.
A company that is not resident in the U.K. for corporation tax purposes can nevertheless be subject to U.K. corporation tax if it carries on a trade through a permanent establishment in the U.K. but, in that case, the charge to U.K. corporation tax is limited to profits (both revenue profits and capital gains) attributable directly or indirectly to such permanent establishment.
Each of us, other than the U.K. Subsidiaries and APJ Jersey, currently intends to operate in such a manner that none of us (other than the U.K. Subsidiaries and APJ Jersey) carries on a trade through a permanent establishment in the U.K. Nevertheless, because neither case law nor U.K. statute completely defines the activities that constitute trading in the U.K. through a permanent establishment, Her Majesty’s Revenue and Customs (“HMRC”) might contend successfully that any of us (other than the U.K. Subsidiaries and APJ Jersey) are trading in the U.K. through a permanent establishment.
62
The U.K. has no income tax treaty with Bermuda. There are circumstances in which companies that are neither resident in the U.K. nor entitled to the protection afforded by a double tax treaty between the U.K. and the jurisdiction in which they are resident may be exposed to income tax in the U.K. (other than by deduction or withholding) on the profits of a trade carried on there, even if that trade is not carried on through a permanent establishment. However, each of us intends to operate in such a manner that none of us falls within the charge to income tax in the U.K. (other than by deduction or withholding).
If any of us, other than the U.K. Subsidiaries and APJ Jersey, were treated as being resident in the U.K. for U.K. corporation tax purposes, or as carrying on a trade in the U.K., whether or not through a permanent establishment, our operating results could be materially adversely affected.
Our U.K. operations may be affected by recent changes in U.K. and Australian tax law.
The U.K. Subsidiaries and APJ Jersey should be treated as resident in the U.K. and accordingly be subject to U.K. tax in respect of their worldwide income and gains. Any change in the basis or rate of U.K. corporation tax could materially adversely affect the operations of the U.K. resident companies. The U.K. corporation tax rate is currently 19% and will be reduced to 17% with effect from April 1, 2020.
The Organization for Economic Co-operation and Development (“OECD”) published its final reports on Base Erosion and Profit Shifting (“BEPS Reports”) in October 2015, containing recommendations on measures to coordinate multilateral action on international tax rules. Recommended actions include ensuring that transfer pricing outcomes are in line with value creation (noting that the current rules may facilitate the transfer of risks or capital away from countries where the economic activity takes place), neutralizing the effect of hybrid financial instruments and entities and limiting the deductibility of interest payments for tax purposes.
In response to the BEPS recommendations, revised transfer pricing guidelines have been adopted and legislation has been introduced in relation to hybrid mismatches, the latter of which came into effect on January 1, 2017. Legislation to restrict tax deductions for interest expenses of large groups, in line with the OECD’s recommendations, was brought into effect from April 1, 2017. These changes to U.K. tax law in response to the BEPS Reports may have a material adverse effect on our intra-group financing arrangements and our results.
Legislation restricting the amount of U.K. profit in any particular accounting period that can be offset by historical tax losses was brought into effect from April 1, 2017. Should utilization of any tax losses be delayed or restricted as a result of this legislation, this could have a material adverse effect on our results.
The U.K. diverted profits tax (“DPT”) is separate from U.K. corporation tax and is charged at a higher rate of 25%. It is an anti-avoidance measure aimed at protecting the U.K. tax base against the artificial diversion of profits that are being earned by activities carried out in the U.K. but which are not otherwise being taxed in the U.K., in particular as a result of arrangements amongst companies in the same multinational group. The U.K.’s network of double tax treaties does not offer protection from a DPT charge. In the event that the rules apply to certain arrangements, then upfront payment of HMRC’s estimate of the deemed tax liability may be required. If any of our U.K. or non-U.K. companies is liable for DPT as a result of intra-group arrangements, this could have a material adverse effect on our results.
The U.K. Criminal Finances Act, which came into force on September 30, 2017, created a new corporate criminal offense of failure to prevent facilitation of tax evasion. A company (wherever incorporated) will be guilty (on a strict liability basis) if a person performing services for or on behalf of that company (whether as an employee, agent or in any other capacity), facilitates the commission by another person of a U.K. tax evasion offense, or, in certain circumstances, a tax evasion offense under any non-U.K. law, unless the company can prove that it had reasonable prevention procedures in place. Should any Aspen Group entities be held criminally liable under this legislation, this may have a material impact on our results.
The Australian Government announced a new diverted profits tax which applies to tax years beginning on or after July 1, 2017. The diverted profits tax is set at 40% and is modeled on the U.K.’s DPT. If Aspen U.K.’s Australian branch is deemed liable for Australian DPT as a result of intra-group arrangements, this could have a material adverse effect on our results in future years.
Our U.K. and U.S. operations may be adversely affected by a transfer pricing adjustment in computing U.K. or U.S. taxable profits.
Any arrangements between U.K.-resident entities of the Aspen Group and other members of the Aspen Group are subject to the U.K. transfer pricing regime. Consequently, if any agreement (including any reinsurance agreements) between a U.K.-resident entity of the Aspen Group and any other Aspen Group entity (whether that entity is resident in or outside the U.K.) is found not to be on arm’s length terms and as a result a U.K. tax advantage is being obtained, an adjustment will be required to compute U.K. taxable profits as if such an agreement were on arm’s length terms. Similar rules apply in the U.S and would have a similar impact
63
on our U.S. resident entities if transfer pricing adjustments were required. Any transfer pricing adjustment could adversely impact the tax charge suffered by the relevant U.K. or U.S. resident entities of the Aspen Group.
The BEPS Reports included a recommendation that groups should be required to report details of their operations and intra-group transactions in each jurisdiction, known as country by country reporting (“CBCR”). The U.K. has implemented these recommendations with effect from January 1, 2016. Many non-OECD countries are still considering the implications of the proposals. It is possible that our approach to transfer pricing may become subject to greater scrutiny from the tax authorities in the jurisdictions in which we operate, which may lead to transfer pricing audits in the future. Any transfer pricing adjustment could adversely impact the tax charge suffered by the relevant entities of the Aspen Group.
In April 2016, the E.U. issued proposals to require all E.U. entities (including branches) to publish their CBCR reports. The proposals, if implemented, are likely to cause increased audit activity from E.U. tax authorities. Legislation has been enacted giving power to introduce regulations requiring public disclosure of U.K. CBCR reports, although this power has not yet been exercised.
Our operations may be affected by the introduction of an E.U. financial transaction tax (“FTT”).
On February 14, 2013, the E.U. Commission published a proposal for a Directive for a common FTT in those E.U. Member States which choose to participate (the “FTT Zone”). The FTT proposal remains subject to negotiation between the participating Member States and consensus has not yet been reached as to the scope of the tax and how it should be levied. The introduction of FTT in the proposed or similar form could have an adverse effect on our business and operating results.
Our operations may be affected by the introduction of the Common Reporting Standard (“CRS”).
The CRS has been introduced as an initiative by the OECD and is imposed by its member countries, including those within the E.U. through the E.U. Directive on Administrative Co-operation. Similar to the U.S. Foreign Account Tax Compliance Act, the CRS requires financial institutions which are subject to the rules to report certain information in respect of financial account holders. We intend to operate in compliance with the CRS. Any inadvertent failure to do so may have an adverse effect on our business and operating results.
Recent and future changes in U.S. federal income tax law or the manner in which it is interpreted could materially adversely affect the non-U.S. insurance industry and our results of operations.
The Tax Cuts and Jobs Act (the “2017 Act”) was passed by the U.S. Congress and was signed into law on December 22, 2017, with certain provisions intended to eliminate certain perceived tax advantages of companies (including insurance companies) that have legal domiciles outside the United States but have certain U.S. connections and United States persons investing in such companies. For example, the 2017 Act includes BEAT that could make affiliate reinsurance between United States and non-U.S. members of the Aspen Group economically unfeasible.
As discussed in more detail below, the 2017 Act also revises the rules applicable to passive foreign investment companies (“PFICs”) and controlled foreign corporations (“CFCs”). Although we are currently unable to predict the ultimate impact of the 2017 Act on our business, shareholders and results of operations, the 2017 Act may increase the tax liability of the U.S. members of the Aspen Group that reinsure with non-U.S. Aspen Group members and may impact the timing and amount of U.S. federal income taxes imposed on certain U.S. shareholders. Further, it
is possible that
other
legislation
could be introduced and enacted by the current Congress or future Congresses that could have an adverse impact on us. Thus in addition to direct risks, it is possible that over time the BEAT, and the Act generally, may result in increased prices for certain reinsurance or insurance products, which could cause a decrease in demand for these products and services due to limitations on the available resources of our clients or their underlying insureds. This could reduce our access to capital and in that event we could experience a material adverse effect on our business, financial condition and results of operations.
U.S. federal income tax laws and interpretations regarding whether a company is engaged in a trade or business within the U.S. is a PFIC, or whether U.S. Persons would be required to include in their gross income the “subpart F income” of a CFC or RPII are subject to change, possibly on a retroactive basis. There currently are only recently proposed regulations regarding the application of the PFIC rules to insurance companies, and the regulations regarding RPII have been in proposed form since 1991. New regulations or pronouncements interpreting or clarifying such rules may be forthcoming. The Company cannot be certain if, when, or in what form such regulations or pronouncements may be implemented or made, or whether such guidance will have a retroactive effect.
64
Holders of 10% or more of Aspen Holdings’ shares may be subject to U.S. income taxation under the controlled foreign corporation (“CFC”) rules.
A “10% U.S. Shareholder” (as defined below) of a non-U.S. corporation that is a CFC at any time during a taxable year that owns shares in such non-U.S. corporation directly or indirectly through non-U.S. entities on the last day of the non-U.S. corporation’s taxable year during which it is a CFC must include in its gross income for U.S. federal income tax purposes its pro rata share of the CFC’s “subpart F income” and global low taxed intangible income (“GILTI”) even if the subpart F income or GILTI is not distributed. A “10% U.S. Shareholder” is a U.S. Person (as defined below) that owns (directly, indirectly through non-U.S. entities or “constructively” (as defined below)) at least 10% of the total combined voting power or value of all classes of stock of a non-U.S. corporation. The 2017 Act expanded the definition of 10% U.S. Shareholder to include ownership by value (rather than just vote), so provisions in our organizational documents described above reducing the voting power of 9.5% U.S. Shareholders will no longer mitigate the potential risk of 10% U.S. Shareholder status. “Subpart F income” of a non-U.S. insurance corporation typically includes “foreign personal holding company income” (such as interest, dividends and other types of passive income), as well as insurance and reinsurance income (including underwriting and investment income), and GILTI is generally business income of the CFC (other than subpart F income and certain other categories of income) reduced by 10% of the adjusted tax basis of the CFC’s depreciable tangible personal property (based on a computation that generally aggregates all of a 10% U.S. Shareholder’s GILTI from its investments in CFCs) that is potentially subject to further reductions depending on the nature of the applicable 10% U.S. Shareholder. A non-U.S. corporation is considered a CFC if “10% U.S. Shareholders” own (directly, indirectly through non-U.S. entities or by attribution by application of the constructive ownership rules of section 958(b) of the Code (i.e., “constructively”)) more than 50% of the total combined voting power of all classes of voting stock of that non-U.S. corporation, or the total value of all stock of that non-U.S. corporation. For the purposes of taking into account insurance income, a CFC also includes a non-U.S. corporation earning insurance income in which more than 25% of the total combined voting power of all classes of stock (or more than 25% of the total value of the stock) is owned by 10% U.S. Shareholders on any day during the taxable year of such corporation, if the gross amount of premiums or other consideration for the reinsurance or the issuing of insurance or annuity contracts (other than certain insurance or reinsurance related to some country risks written by certain insurance companies, not applicable here) exceeds 75% of the gross amount of all premiums or other consideration in respect of all risks.
For purposes of this discussion, the term “U.S. Person” means: (i) a citizen or resident of the United States, (ii) a partnership or corporation created or organized in or under the laws of the United States, or organized under the laws of any political subdivision thereof, (iii) an estate the income of which is subject to U.S. federal income taxation regardless of its source, (iv) a trust if either (x) a court within the United States is able to exercise primary supervision over the administration of such trust and one or more U.S. Persons have the authority to control all substantial decisions of such trust or (y) the trust has a valid election in effect to be treated as a U.S. Person for U.S. federal income tax purposes and (z) any other person or entity that is treated for U.S. federal income tax purposes as if it were one of the foregoing.
We believe that because of the anticipated dispersion of our share ownership, no U.S. Person who owns shares of Aspen Holdings directly or indirectly through one or more non-U.S. entities should be treated as owning (directly, indirectly through non-U.S. entities, or constructively) 10% or more of the total voting power or value of all classes of shares of Aspen Holdings or any of its non-U.S. subsidiaries. Our shares may not be as widely dispersed as we believe, however, due to the application of certain ownership attribution rules. No assurance may be given that a U.S. Person who owns our shares will not be characterized as a 10% U.S. Shareholder, in which case such U.S. Person may be subject to taxation under the CFC rules.
U.S. Persons who hold our shares may be subject to U.S. income taxation at ordinary income rates on their proportionate share of our related party insurance income (“RPII”).
If the RPII (determined on a gross basis) of any of our non-U.S. Operating Subsidiaries, Silverton, Peregrine and APJ Jersey were to equal or exceed 20% of that company’s gross insurance income in any taxable year and direct or indirect insureds (and persons related to those insureds) own directly or indirectly through entities 20% or more of the voting power or value of Aspen Holdings, then a U.S. Person who owns any shares of such non-U.S. Operating Subsidiary (directly or indirectly through non-U.S. entities) on the last day of the taxable year on which it is an RPII CFC would be required to include in its income for U.S. federal income tax purposes such person’s pro rata share of such company’s RPII for the entire taxable year, determined as if such RPII were distributed proportionately only to U.S. Persons on that date regardless of whether such income is distributed, in which case such person’s investment could be materially adversely affected. In addition, any RPII that is includible in the income of a U.S. tax-exempt organization may be treated as unrelated business taxable income. The amount of RPII earned by a non-U.S. Operating Subsidiary (generally, premium and related investment income from the indirect or direct insurance or reinsurance of any direct or indirect U.S. holder of shares or any person related to such holder) will depend on a number of factors, including the identity of persons directly or indirectly insured or reinsured by the company. We believe that the direct or indirect insureds of each of our non-U.S. Operating Subsidiaries (and related persons) did not directly or indirectly own 20% or more of either the voting power or value of our shares in prior years of operation and we do not expect this to be the case in the foreseeable future. Additionally, we do not expect gross RPII of each of our non-U.S. Operating Subsidiaries to equal or exceed 20% of its gross insurance income
65
in any taxable year for the foreseeable future, but we cannot be certain that this will be the case because some of the factors which determine the extent of RPII may be beyond our control.
U.S. Persons who dispose of our shares may be subject to U.S. federal income taxation at the rates applicable to dividends on a portion of such disposition.
Section 1248 of the Code, in conjunction with the RPII rules, provides that if a U.S. Person disposes of shares in a non-U.S. corporation that earns insurance income in which U.S. Persons own 25% or more of the shares (even if the amount of gross RPII is less than 20% of the corporation’s gross insurance income and the ownership of its shares by direct or indirect insureds and related persons is less than the 20% threshold), any gain from the disposition will generally be treated as a dividend to the extent of the holder’s share of the corporation’s undistributed earnings and profits that were accumulated during the period that the holder owned the shares (whether or not such earnings and profits are attributable to RPII). In addition, such a holder will be required to comply with certain reporting requirements, regardless of the amount of shares owned by the holder. These RPII rules should not apply to dispositions of our shares because Aspen Holdings will not itself be directly engaged in the insurance business. The RPII provisions, however, have never been interpreted by the courts or the Treasury Department in final regulations, and regulations interpreting the RPII provisions of the Code exist only in proposed form. It is not certain whether these regulations will be adopted in their proposed form or what changes or clarifications might ultimately be made thereto or whether any such changes, as well as any interpretation or application of the RPII rules by the IRS, the courts, or otherwise, might have retroactive effect. The Treasury Department has authority to impose, among other things, additional reporting requirements with respect to RPII. Accordingly, the meaning of the RPII provisions and the application thereof to us is uncertain.
U.S. Persons who hold our shares will be subject to adverse tax consequences if we are considered to be a passive foreign investment company (“PFIC”) for U.S. federal income tax purposes.
If we are considered a PFIC for U.S. federal income tax purposes, a U.S. Person who owns any of our shares will be subject to adverse tax consequences, including subjecting the investor to a greater tax liability than might otherwise apply and subjecting the investor to tax on amounts in advance of the date on which tax would otherwise be imposed, in which case such U.S. Person’s investment could be materially adversely affected. In addition, if we were considered a PFIC, upon the death of any U.S. individual owning shares, such individual’s heirs or estate would not be entitled to a “step-up” in the basis of the shares that might otherwise be available under U.S. federal income tax laws. The 2017 Act limits the potential application of an insurance income exception to the PFIC rules to a non-U.S. insurance company that is a qualifying insurance corporation that would be taxable as an insurance company if it were a U.S. corporation and maintains insurance liabilities of more than 25% of such company’s assets for a taxable year (or maintains insurance liabilities that at least equal or exceed 10% of its assets and it satisfies a facts and circumstances test that requires a showing that the failure to exceed the 25% threshold is due to run-off or rating agency circumstances) (the “Reserve Test”). In addition, the IRS issued proposed regulations intended to clarify the application of the PFIC rules to non-U.S. insurance companies. These proposed regulations will not be effective until adopted in final form. We believe that we are not, have not been, and currently do not expect to become, a PFIC for U.S. federal income tax purposes. We cannot assure you, however, that we will not be deemed a PFIC by the IRS because we cannot predict the likelihood of finalization of the proposed regulations or the scope, nature, or impact of the proposed regulations on us, should they be formally adopted or enacted or whether our non-U.S. insurance subsidiaries will be able to satisfy the Reserve Test in future years. Accordingly, no assurance may be given that we will not be characterized as a PFIC. If we were considered a PFIC, it could have material adverse tax consequences for an investor that is subject to U.S. federal income taxation.
U.S. tax-exempt organizations who own our shares may recognize unrelated business taxable income.
A U.S. tax-exempt organization may recognize unrelated business taxable income if a portion of the insurance income of any of our non-U.S. Operating Subsidiaries is allocated to the organization, which generally would be the case if any of our non-U.S. Operating Subsidiaries is a CFC and the tax-exempt shareholder is a U.S. 10% Shareholder or there is RPII, certain exceptions do not apply and the tax-exempt organization owns any of our shares. Although we do not believe that any U.S. Persons should be allocated such insurance income, we cannot be certain that this will be the case. U.S. tax-exempt investors are advised to consult their own tax advisors.
Scope of application of the Foreign Account Tax Compliance Act (“FATCA”) is uncertain.
The FATCA provisions of the Code require withholding agents to withhold 30% of a U.S. dividend interest or other fixed payment made to a Foreign Financial Institution (“FFI”) and will, beginning January 1, 2019, require withholding on gross proceeds from the sale of securities which produce U.S. source interest or dividends, unless the FFI has entered into an agreement with the IRS to report account information for any of the FFI’s U.S. accountholders. Certain entities in the Aspen Group were identified as FFIs and were registered with the IRS ahead of the commencement date. The U.S. Treasury released models for Intergovernmental FATCA Agreements (“IGAs”) with other jurisdictions that will allow FFIs in those jurisdictions to report U.S. accountholder
66
information only to local revenue authorities rather than the IRS. The U.K. / U.S. IGA was signed in September 2012. Non-Publicly Traded Securities Holders may be required to provide any information that we determine necessary to avoid the imposition of such withholding tax in order to allow us to satisfy such obligations. In the event that this withholding tax is imposed, our operating results could be materially adversely affected.
U.S. Persons may be subject to FBAR and
“
Specified Foreign Financial Asset
”
reporting requirements.
U.S. Persons holding our shares should consider their possible obligation to file FINCEN Form 114,
Foreign Bank and Financial Accounts Report
, with respect to their shares. Additionally, such U.S. and non-U.S. persons should consider their possible obligations to annually report certain information with respect to us with their U.S. federal income tax returns. Shareholders should consult their tax advisors with respect to these or any other reporting requirement which may apply with respect to their ownership of our shares.
The impact of Bermuda’s letter of commitment to the OECD to eliminate harmful tax practices is uncertain and could adversely affect our tax status in Bermuda.
The OECD has published reports and launched a global dialogue among member and non-member countries on measures to limit harmful tax competition. These measures are largely directed at counteracting the effects of tax havens and preferential tax regimes in countries around the world. In the OECD’s progress report dated April 2, 2009, Bermuda was designated as an OECD “White List” jurisdiction that has substantially implemented the internationally agreed tax standards. The standards for the OECD compliance are to have at least 12 signed Tax Information Exchange Agreements (“TIEAs”) with other OECD members or non-OECD members. Bermuda has signed approximately 41 TIEAs which exceeds the requisite amount and demonstrates Bermuda’s commitment to preserve the standards. In April 2016, Bermuda agreed to participate in the Tax Sharing requirements for CBCR. We are not able to predict what changes will arise from the commitment or whether such changes will subject us to additional taxes. We submitted a CBCR to the Bermudian tax authorities in December 2017.
Changes to Bermuda tax policies may impact our financial position.
Under current Bermuda law, we are not subject to tax on income, profits, withholding, capital gains or capital transfers. Furthermore, we obtained from the Minister of Finance of Bermuda under the Exempted Undertakings Tax Protection Act 1966 (as amended) an assurance that, in the event Bermuda enacts legislation imposing tax computed on profits, income, any capital asset, gain or appreciation, or any tax in the nature of estate duty or inheritance tax, then the imposition of the tax will not be applicable to us or our operations until March 31, 2035. Tax policy and legislation in Bermuda could change in the future (as is the case in other jurisdictions) and as such no guarantee can be given as to whether the current tax treatment afforded to us will continue after March 31, 2035.
Item 1B.
Unresolved Staff Comments
Not applicable.
|
Item 2.
|
Properties
|
We lease office space in Hamilton, Bermuda where we are headquartered. In addition, the Company and its subsidiaries lease office space in the United States, the United Kingdom, Australia, Ireland, Singapore, Switzerland and the United Arab Emirates. We renew and enter into leases in the ordinary course of business as required. We believe our current facilities and the leaseholds with respect thereto are sufficient for us to conduct our operations for the foreseeable future. For more information on our leasing arrangements, refer to Note 19(b) of our consolidated financial statements, “Commitments and Contingent Liabilities — Operating leases.”
|
Item 3.
|
Legal Proceedings
|
Similar to the rest of the insurance and reinsurance industry, we are subject to litigation and arbitration in the ordinary course of our business. Our subsidiaries are regularly engaged in the investigation, conduct and defense of disputes, or potential disputes, resulting from questions of insurance and reinsurance coverage or claims activities. Pursuant to our insurance and reinsurance arrangements, many of these disputes are resolved by arbitration or other forms of alternative dispute resolution. In some jurisdictions, noticeably the U.S., a failure to deal with such disputes or potential disputes in an appropriate manner could result in an award of “bad faith” punitive damages against our Operating Subsidiaries. In addition, we may be subject to lawsuits and regulatory actions in the normal course of business that do not arise from, or directly relate to, insurance and reinsurance coverage or claims. This category of litigation typically involves, among other things, allegations of underwriting errors or omissions, employment claims or regulatory activity.
67
While any legal or arbitration proceedings contain an element of uncertainty, we do not believe that the eventual outcome of any specific litigation, arbitration or alternative dispute resolution proceedings to which we are currently a party will have a material adverse effect on the financial condition of our business as a whole.
|
Item 4.
|
Mine Safety Disclosures
|
Not applicable.
68
PART II
|
Item 5.
|
Market for the Registrant’s Common Equity, Related Stockholder Matters and Issuer Purchases of Equity Securities
|
Market Information
Our ordinary shares began publicly trading on December 4, 2003. Prior to that time, there was no trading market for our ordinary shares. The New York Stock Exchange (“NYSE”) symbol for our ordinary shares is AHL. Pursuant to the Merger Agreement, at the effective time of the Merger, each of our ordinary shares issued and outstanding immediately prior to such time (other than ordinary shares owned by us as treasury shares, owned by any of our subsidiaries or owned by Highlands, Merger Sub or any of their respective subsidiaries, which will be canceled as set forth in the Merger Agreement) will be automatically canceled and converted into the right to receive
$42.75
in cash, without interest and less any required withholding taxes. For further details, refer to Part I, Item 1, “Business — Business Combination.”
The following table sets forth the high and low sales prices per share of our ordinary shares as reported in composite NYSE trading and the dividends paid per ordinary share for the periods indicated:
|
|
Price Range of
Ordinary Shares
|
Dividends Paid Per
Ordinary Share
|
|||||
|
Period
|
High
|
Low
|
|||||
|
|
|
|
|||||
|
2018
|
|
|
|
||||
|
First Quarter
|
$45.00
|
$35.05
|
$0.24
|
||||
|
Second Quarter
|
$45.35
|
$40.70
|
$0.24
|
||||
|
Third Quarter
|
$41.80
|
$36.50
|
$0.24
|
||||
|
Fourth Quarter
|
$42.08
|
$41.13
|
$0.00
|
||||
|
2017
|
|
|
|
||||
|
First Quarter
|
$57.70
|
$52.00
|
$0.22
|
||||
|
Second Quarter
|
$53.80
|
$49.60
|
$0.24
|
||||
|
Third Quarter
|
$51.75
|
$36.45
|
$0.24
|
||||
|
Fourth Quarter
|
$43.00
|
$40.10
|
$0.24
|
||||
Number of Holders of Ordinary Shares
As of December 31, 2018, there were
196 holders of record
of our ordinary shares, not including beneficial owners of ordinary shares registered in nominee or street name, and there was one holder of record of each of our Preference Shares.
Dividends
The Merger Agreement restricts us from declaring or paying any dividends on our ordinary shares other than the quarterly dividends on our ordinary shares that were previously declared and publicly announced prior to the date of the Merger Agreement. We are not restricted under the Merger Agreement from declaring or paying periodic cash dividends on the Preference Shares in accordance with the terms of the applicable certificate of designation. For a summary of the restriction limiting our ability to declare and pay dividends on the our ordinary shares under the Merger Agreement, refer to Part I, Item 1, “Risk Factors — Risks Related to Our Securities — The Merger Agreement restricts the payment of dividends on our ordinary shares.” For further details on the Merger, refer to Part II, Item 7, “Management’s Discussion and Analysis of Financial Condition and Results of Operations — Aspen’s Year In Review.”
In addition, given we are a holding company and have no direct operations, our ability to pay dividends is restricted by the ability of the Operating Subsidiaries to pay us dividends. The ability of the Operating Subsidiaries to pay us dividends or other distributions is subject to the laws and regulations applicable to each jurisdiction, as well as the Operating Subsidiaries’ need to maintain capital requirements adequate to maintain their insurance and reinsurance operations and their financial strength ratings issued by independent rating agencies. For more information on the regulatory restrictions limiting the ability of our Operating Subsidiaries to declare and pay dividends, refer to Part I, Item 1, “Business — Regulatory Matters,” Item 1A, “Risk Factors — Risks Related to Our Securities — Our ability to pay dividends or to meet ongoing cash requirements may be constrained by our holding company structure” and Part II, Item 7, “Management’s Discussion and Analysis of Financial Condition and Results of Operations — Liquidity.”
69
We are also subject to Bermuda regulatory constraints that affects our ability to pay dividends on our ordinary shares and Preference Shares and make other payments. Under the Companies Act, we may declare or pay a dividend or make a distribution out of distributable reserves only if we have reasonable grounds for believing that we are, and would after the payment be, able to pay our liabilities as they become due and if the realizable value of our assets would thereby not be less than our liabilities.
In addition, unless the full dividends for the most recently ended dividend period on all outstanding Preference Shares have been declared and paid, we cannot declare or pay a dividend on our ordinary shares. Our credit facilities also restrict our ability to pay dividends. See Part II, Item 7, “Management’s Discussion and Analysis of Financial Condition and Results of Operations — Liquidity.”
Purchases of Equity Securities by Issuer and Affiliated Purchasers
We did not repurchase any of our ordinary shares during the three months ended
December 31, 2018
. As at
December 31, 2018
, we had
$220.0 million
remaining under the share repurchase authorization program which expired on February 8, 2019 and was not renewed by the Board of Directors. As set forth in the Merger Agreement, we are restricted from redeeming, purchasing or otherwise acquiring any outstanding ordinary shares unless Highlands consents in writing.
Recent Sales of Unregistered Securities
None.
Securities Authorized For Issuance Under Equity Compensation Plans
Refer to “Equity Compensation Plan Information” contained in Part III, Item 12 below.
70
Performance Graph
The following performance graph and related information shall not be deemed to be “soliciting material” or to be “filed” with the SEC or subject to the liabilities of Section 18 of the Exchange Act, and the report shall not be deemed to be incorporated by reference into any prior or subsequent filing by the Company under the Securities Act or the Exchange Act.
The following graph illustrates the cumulative 5-year shareholder return, including reinvestment of dividends, of our ordinary shares compared with such return for the (i) S&P 500 Composite Stock Price Index and (ii) S&P Property & Casualty Industry Group Stock Price Index, in each case measured during the period from December 31,
2013
to
December 31, 2018
, assuming $100 was invested on December 31,
2013
. As depicted in the graph below, the cumulative total return during this period was (i)
11.5%
on our ordinary shares, (ii)
35.6%
for the S&P 500 Composite Stock Price Index and (iii)
53.3%
for the S&P Property & Casualty Industry Group Stock Price Index.
Comparison of 5 Year Cumulative Total Return*
Among Aspen Insurance Holdings Limited, the S&P 500 Composite Stock Price Index and
the S&P 500 Property & Casualty Industry Group Stock Price Index
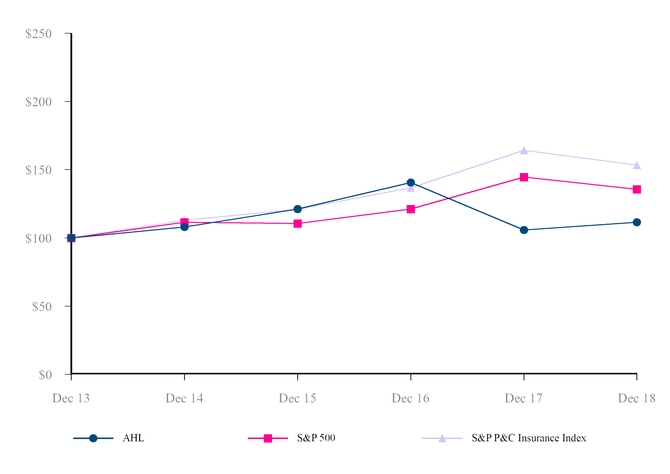
_______________
*$100 invested on December 31,
2013
in stock or index, including reinvestment of dividends (fiscal year ending December 31)
|
|
12/13
|
12/14
|
12/15
|
12/16
|
12/17
|
12/18
|
||||||||||||
|
Aspen Insurance Holdings Limited
|
100.00
|
|
107.95
|
|
121.20
|
|
140.62
|
|
105.84
|
|
111.52
|
|
||||||
|
S&P 500
|
100.00
|
|
111.39
|
|
110.58
|
|
121.13
|
|
144.65
|
|
135.63
|
|
||||||
|
S&P 500 Property & Casualty Insurance
|
100.00
|
|
112.98
|
|
121.00
|
|
136.83
|
|
164.18
|
|
153.27
|
|
||||||
The stock price performance included in the graph above is not necessarily indicative of future stock performance.
71
Bye-Laws
Below is a description of our bye-laws, as amended, as of the date of this report:
The Board and Corporate Action.
Our bye-laws provide that the Board shall consist of not less than six and not more than 15 directors. Subject to our bye-laws and Bermuda law, the directors shall be elected or appointed by holders of ordinary shares. The Board is divided into three classes, designated Class I, Class II and Class III. Our Class I directors are elected to serve until the 2020 annual general meeting, our Class II directors are elected to serve until the 2018 annual general meeting and our Class III directors are elected to serve until our 2019 annual general meeting. Notwithstanding the foregoing, directors who are seventy years or older shall be elected every year and shall not be subject to a three-year term. In addition, notwithstanding the foregoing, each director shall hold office until such director’s successor shall have been duly elected or until such director is removed from office or such office is otherwise vacated. In the event of any change in the number of directors, the Board shall apportion any newly created directorships among, or reduce the number of directorships in, such class or classes as shall equalize, as nearly as possible, the number of directors in each class. In no event will a decrease in the number of directors shorten the term of any incumbent director.
Generally, the affirmative vote of a majority of the directors present at any meeting at which a quorum is present shall be required to authorize corporate action. Corporate action may also be taken by a unanimous written resolution of the Board without a meeting and with no need to give notice. The quorum necessary for the transaction of business of the Board may be fixed by the Board and, unless so fixed at any other number, shall be a majority of directors in office and in no event less than two directors.
Voting Cutbacks.
In general, and except as provided below, on a poll shareholders have one vote for each ordinary share held by them and are entitled to vote at all meetings of shareholders. However, if, and so long as, the shares of a shareholder in the Company are treated as “controlled shares” (as determined pursuant to section 958 of the Code) of any U.S. Person and such controlled shares constitute 9.5% or more of the votes conferred by the issued shares of Aspen Holdings, the voting rights with respect to the controlled shares owned by such U.S. Person shall be limited, in the aggregate, to a voting power of less than 9.5%, under a formula specified in our bye-laws. The formula is applied repeatedly until the voting power of all 9.5% U.S. Shareholders has been reduced to less than 9.5%. In addition, our Board may limit a shareholder’s voting rights when it deems it appropriate to do so to (i) avoid the existence of any 9.5% U.S. Shareholder; and (ii) avoid certain material adverse tax, legal or regulatory consequences to the Company or any of its subsidiaries or any shareholder or its affiliates. “Controlled shares” includes, among other things, all shares of the Company that such U.S. Person is deemed to own directly, indirectly or constructively (within the meaning of section 958 of the Code). The amount of any reduction of votes that occurs by operation of the above limitations will generally be reallocated proportionately among all other shareholders of Aspen Holdings whose shares were not “controlled shares” of the 9.5% U.S. Shareholder so long as such: (i) reallocation does not cause any person to become a 9.5% U.S. Shareholder and (ii) no portion of such reallocation shall apply to the shares held by Wellington Underwriting plc (“Wellington”) or the Names’ Trustee, except where the failure to apply such increase would result in any person becoming a 9.5% shareholder.
Under these provisions, certain shareholders may have their voting rights limited to less than one vote per share, while other shareholders may have voting rights in excess of one vote per share. Moreover, these provisions could have the effect of reducing the votes of certain shareholders who would not otherwise be subject to the 9.5% limitation by virtue of their direct share ownership. Our bye-laws provide that shareholders will be notified of their voting interests prior to any vote to be taken by them.
We are authorized to require any shareholder to provide information as to that shareholder’s beneficial share ownership, the names of persons having beneficial ownership of the shareholder’s shares, relationships with other shareholders or any other facts the directors may deem relevant to a determination of the number of ordinary shares attributable to any person. If any holder fails to respond to this request or submits incomplete or inaccurate information, we may, in our sole discretion, eliminate the shareholder’s voting rights. All information provided by the shareholder shall be treated by the Company as confidential information and shall be used by the Company solely for the purpose of establishing whether any 9.5% U.S. Shareholder exists (except as otherwise required by applicable law or regulation).
These voting cut-back provisions were incorporated into the Company’s bye-laws to seek to mitigate the risk of any U.S. Person that owns our ordinary shares directly or indirectly through non-U.S. entities being characterized as a 10% U.S. Shareholder for U.S. federal income tax purposes. However, the 2017 Act expanded the definition of 10% U.S. Shareholder to include ownership by value (rather than just vote), so provisions in our organizational documents described above reducing the voting power of 9.5% U.S. Shareholders will no longer mitigate the potential risk of 10% U.S. Shareholder status. Our shares may not be as widely dispersed as we believed at December 31, 2017 due to, for example, the application of certain ownership attribution rules, and no assurance may be given that a U.S Person who owns our shares will not be characterized as a 10% U.S. Shareholder, in which case such U.S. Person may be subject to taxation under the CFC rules and may have their votes cut-back as noted above. Refer to Part I, Item 1, “Risk Factors — Risks Related to Our Securities — There are provisions in our charter documents which may reduce or increase the voting rights of our ordinary shares” above.
Shareholder Action.
Except as otherwise required by the Companies Act and our bye-laws, any question proposed for the consideration of the shareholders at any general meeting requires the affirmative vote of a majority of the voting power of votes
72
cast at such meeting (in each case, after taking into account voting power adjustments under our bye-laws). Our bye-laws require that annual general meetings be called by at least twenty-one (21) days’ written notice.
The following actions require approval by the affirmative vote of at least 75% of the voting power of shares entitled to vote at a meeting of shareholders (in each case, after taking into account voting power adjustments under our bye-laws): any amendment to Bye-Laws 13 (first sentence - Modification of Rights); 24 (Transfer of Shares); 49 (Voting); 63, 64, 65 and 66 (Adjustment of Voting Power); 67 (Other Adjustments of Voting Power); 76 (Purchase of Shares); 84 or 85 (Certain Subsidiaries); provided, however, that in the case of any amendments to Bye-Laws 24, 63, 64, 65, 66, 67 or 76, such amendment shall only be subject to this voting requirement if the Board determines in its sole discretion that such amendment could adversely affect any shareholder in any non-de minimis respect.
The discontinuance of the Company out of Bermuda to another jurisdiction shall be approved by the affirmative vote of at least 66% of the voting power of shares entitled to vote at a meeting of shareholders.
On December 10, 2018, holders of the Company’s ordinary shares approved an amendment to Bye-Law 50 (Voting) at the special general meeting of shareholders held on December 10, 2018 to reduce the shareholder vote required to approve a merger or amalgamation with, or a sale, lease or transfer of all or substantially all of the assets of the Company to, a third party from the affirmative vote of at least 66% of the voting power of the shares entitled to vote at a meeting of the shareholders to a simple majority of the votes cast at a meeting of the shareholders.
Shareholder action may be taken by resolution in writing signed by the shareholders (or the holders of such class of shares) who at the date of the notice of the resolution in writing represent the majority of votes that would be required if the resolution had been voted on at a meeting of the shareholders.
Amendment.
Our bye-laws may be revoked or amended by a majority of the Board, but no revocation or amendment shall be operative unless and until it is approved at a subsequent general meeting of the Company by the shareholders by resolution passed by a majority of the voting power of votes cast at such meeting (in each case, after taking into account voting power adjustments under the bye-laws) or such greater majority as required by our bye-laws.
Voting of Non-U.S. Subsidiary Shares.
If the voting rights of any shares of the Company are adjusted pursuant to our bye-laws and we are required or entitled to vote at a general meeting of any of Aspen U.K., Aspen Bermuda, Aspen U.K. Holdings, Aspen U.K. Services, AIUK Trustees, AMAL, AUL, Acorn or any other non-U.S. subsidiary of ours (together, the “Non-U.S. Subsidiaries”), our directors shall refer the subject matter of the vote to our shareholders and seek direction from such shareholders as to how they should vote on the resolution proposed by the Non-U.S. Subsidiary.
In the event that a voting cutback is required, substantially similar provisions are or will be contained in the bye-laws (or equivalent governing documents) of the Non-U.S. Subsidiaries. This provision was amended at the 2009 annual general meeting to require the application of this bye-law only in the event that a voting cutback is required, as described above.
Capital Reduction.
At the 2009 annual general meeting, our bye-laws were amended to permit a capital reduction of part of a class or series of shares.
Treasury Shares.
Our bye-laws permit the Board, at its discretion and without the sanction of a shareholder resolution, to authorize the acquisition of our own shares, or any class, at any price (whether at par or above or below) to be held as treasury shares upon such terms as the Board may determine, provided that such acquisition is effected in accordance with the provisions of the Companies Act. Subject to the provisions of our bye-laws, any of our shares held as treasury shares shall be at the disposal of the Board, which may hold all or any of the shares, dispose of or transfer all or any of the shares for cash or other consideration, or cancel all or any of the shares.
Corporate Purpose.
Our certificate of incorporation, memorandum of association and our bye-laws do not restrict our corporate purpose and objects.
73
Description of our Preference Shares
5.95% Fixed-to-Floating Rate Perpetual Non-Cumulative Preference Shares.
On April 25, 2013, the Board authorized the issuance and sale of up to $300.0 million of our 5.95% Fixed-to-Floating Rate Perpetual Non-Cumulative Preference Shares, with a liquidation preference of $25 per security (the “5.95% Preference Shares”). On May 2, 2013, we issued
11,000,000
5.95% Preference Shares for an aggregate amount of $275.0 million. At the effective time of the Merger, each issued and outstanding 5.95% Preference Share will remain issued and outstanding as a preference share and shall be entitled to the same dividend and all other preferences and privileges, rights, qualifications, limitations, and restrictions set forth in the certificate of designation. Dividends on our 5.95% Preference Shares are payable on a non-cumulative basis only when, as and if declared by the Board at the annual rate of 5.95% of the $25 liquidation preference of each 5.95% Preference Share, payable quarterly in cash on January 1, April 1, July 1 and October 1 of each year. Commencing on July 1, 2023, dividends on the 5.95% Preference Shares will be payable, on a non-cumulative basis, when, as and if declared by the Board, at a floating annual rate equal to 3-month LIBOR plus 4.06%. This floating dividend will be reset quarterly. Generally, unless the full dividends for the most recently ended dividend period on all outstanding 5.95% Preference Shares have been declared and paid, we cannot declare or pay a dividend on our ordinary shares.
Whenever dividends on any 5.95% Preference Shares have not been declared and paid for the equivalent of any six dividend periods, whether or not consecutive (a “nonpayment”), subject to certain conditions, the holders of the 5.95% Preference Shares, acting together as a single class with holders of any and all other series of preference shares having similar appointing rights then outstanding (including the 5.625% Preference Shares), will be entitled, at a special meeting called at the request of record holders of at least 20% of the aggregate liquidation preference of the 5.95% Preference Shares or of any other series of appointing preference shares then outstanding (including the e 5.625% Preference Shares) to the appointment of a total of two directors and the number of directors that comprise our Board will be increased by the number of directors so appointed. These appointing rights and the terms of the directors so appointed will continue until dividends on the 5.95% Preference Shares and any such series of voting preference shares following the nonpayment shall have been fully paid for at least four consecutive dividend periods.
In addition, the affirmative vote or consent of the holders of at least 66
2/3
% of the aggregate liquidation preference of outstanding 5.95% Preference Shares and any series of appointing preference share (including the 5.625% Preference Shares), acting together as a single class, will be required for the authorization or issuance of any class or series of senior shares (or any security convertible into or exchangeable for senior notes) ranking senior to the 5.95% Preference Shares as to dividend rights or rights upon liquidation, winding up or dissolution and for amendments to our memorandum of association or bye-laws that would materially adversely affect the existing terms of the 5.95% Preference Shares.
We may redeem the 5.95% reference Shares at our option, in whole or in part, at a redemption price equal to $25 per 5.95% Preference Share, plus any declared and unpaid dividends, if any (i) on July 1, 2023 and on any dividend payment date thereafter and (ii) on any dividend payment date following the occurrence of a tax event or on the dividend payment date following the occurrence of a capital disqualification redemption event.
Our 5.95% Preference Shares are listed on the NYSE under symbol “AHLPRC.”
5.625% Perpetual Non-Cumulative Preference Shares.
On July 27, 2016, the Board authorized the issuance and sale of up to $300.0 million of our 5.625% Perpetual Non-Cumulative Preference Shares, with a liquidation preference of $25 per security (the “5.625% Preference Shares”). On September 13, 2016, we issued 10,000,000 5.625% Preference Shares for an aggregate amount of $250.0 million. At the effective time of the Merger, each issued and outstanding 5.625% Preference Share will remain issued and outstanding and shall be entitled to the same dividend and all other preferences and privileges, rights, qualifications, limitations, and restrictions set forth in the certificate of designation. Dividends on our 5.625% Preference Shares are payable on a non-cumulative basis only when, as and if declared by the Board at the annual rate of 5.625% of the $25 liquidation preference of each 5.625% Preference Share, payable quarterly in cash on January 1, April 1, July 1 and October 1 of each year. In the event of our liquidation, winding up or dissolution, our ordinary shares will rank junior to the 5.625% Preference Shares.
Whenever dividends on any 5.625% Preference Shares have not been declared and paid for the equivalent of any six dividend periods, whether or not consecutive (a “nonpayment”), subject to certain conditions, the holders of our 5.625% reference Shares, acting together as a single class with holders of any and all other series of preference shares having similar appointing rights then outstanding (including the 5.95% Preference Shares), will be entitled to the appointment of a total of two directors and the number of directors that comprise our Board will be increased by the number of directors so appointed. These appointing rights and the terms of the directors so appointed will continue until dividends on the 5.625% Preference Shares and any such series of voting preference shares following the nonpayment shall have been fully paid for at least four consecutive dividend periods.
In addition, the affirmative vote or consent of the holders of at least 66
2
/
3
% of the aggregate liquidation preference of outstanding 5.625% Preference Shares and any series of appointing preference shares (including the 5.95% Preference Shares), voting together as a single class, will be required for the authorization or issuance of any class or series of senior shares (or any security convertible
74
into or exchangeable for senior shares) ranking senior to the 5.625% Preference Shares as to dividend rights or rights upon our liquidation and for amendments to our memorandum of association or bye-laws that would materially adversely affect the rights of holders of the 5.625% Preference Shares.
We may redeem the 5.625% Preference Shares at our option, in whole or in part, at a redemption price equal to $25 per 5.625% Preference Share, plus any declared and unpaid dividends, if any, (i) at any time following the occurrence of a tax event and (ii) on January 1, 2027 and any dividend payment date thereafter.
Our 5.625% Preference Shares are listed on the NYSE under the symbol “AHLPRD.”
|
Item 6.
|
Selected Financial Data
|
The following table sets forth our selected historical financial information for the periods ended and as of the dates indicated. The summary income statement data for the
twelve months ended
December 31, 2018
,
2017
,
2016
,
2015
and
2014
and the balance sheet data as of
December 31, 2018
,
2017
,
2016
,
2015
and
2014
are derived from our audited consolidated financial statements. The consolidated financial statements as of
December 31, 2018
, and for each of the
twelve months ended
December 31, 2018
,
2017
and
2016
, and the report thereon of KPMG LLP, an independent registered public accounting firm, are included elsewhere in this report. These historical results, including the ratios presented below, are not necessarily indicative of results to be expected from any future period. You should read the following selected consolidated financial information along with the information contained in this report, including Item 8, “Financial Statements and Supplementary Data” and Item 7, “Management’s Discussion and Analysis of Financial Condition and Results of Operations” and the audited consolidated financial statements and related notes included elsewhere in this report.
75
|
|
Twelve Months Ended December 31,
|
|||||||||||||||||||
|
|
2018
|
2017
|
2016
|
2015
|
2014
|
|||||||||||||||
|
|
($ in millions, except per share amounts and percentages)
|
|||||||||||||||||||
|
Summary Income Statement Data
|
|
|
|
|
||||||||||||||||
|
Gross written premiums
|
$
|
3,446.9
|
|
$
|
3,360.9
|
|
$
|
3,147.0
|
|
$
|
2,997.3
|
|
$
|
2,902.7
|
|
|||||
|
Net premiums written
|
2,082.0
|
|
2,212.5
|
|
2,593.7
|
|
2,646.2
|
|
2,515.2
|
|
||||||||||
|
Net premiums earned
|
2,214.7
|
|
2,306.6
|
|
2,637.3
|
|
2,473.3
|
|
2,405.3
|
|
||||||||||
|
Loss and loss adjustment expenses
|
(1,573.0
|
)
|
(1,994.7
|
)
|
(1,576.1
|
)
|
(1,366.2
|
)
|
(1,307.5
|
)
|
||||||||||
|
Amortization of deferred policy acquisition costs, general, administrative and corporate expenses
|
(863.3
|
)
|
(902.7
|
)
|
(1,019.0
|
)
|
(907.6
|
)
|
(896.9
|
)
|
||||||||||
|
Net investment income
|
198.2
|
|
189.0
|
|
187.1
|
|
185.5
|
|
190.3
|
|
||||||||||
|
Net (loss)/income
|
(145.8
|
)
|
(266.4
|
)
|
203.4
|
|
323.1
|
|
355.8
|
|
||||||||||
|
Basic (loss)/earnings per share
|
(2.97
|
)
|
(5.22
|
)
|
2.67
|
|
4.64
|
|
4.92
|
|
||||||||||
|
Fully diluted (loss)earnings per share
|
(2.97
|
)
|
(5.22
|
)
|
2.61
|
|
4.54
|
|
4.82
|
|
||||||||||
|
Basic weighted average shares outstanding (millions)
|
59.7
|
|
59.8
|
|
60.5
|
|
61.3
|
|
64.5
|
|
||||||||||
|
Diluted weighted average shares outstanding (millions)
|
59.7
|
|
59.8
|
|
61.9
|
|
62.7
|
|
65.9
|
|
||||||||||
|
Selected Ratios (based on U.S. GAAP income statement data):
|
|
|
|
|
|
|
|
|
||||||||||||
|
Loss ratio (on net premiums earned)
(1)
|
71.0
|
%
|
86.5
|
%
|
59.8
|
%
|
55.2
|
%
|
54.4
|
%
|
||||||||||
|
Expense ratio (on net premiums earned)
(2)
|
39.0
|
%
|
39.2
|
%
|
38.7
|
%
|
36.7
|
%
|
37.3
|
%
|
||||||||||
|
Combined ratio
(3)
|
110.0
|
%
|
125.7
|
%
|
98.5
|
%
|
91.9
|
%
|
91.7
|
%
|
||||||||||
|
Summary Balance Sheet Data
|
|
|
|
|
|
|
|
|
||||||||||||
|
Total cash and investments
(4,8)
|
$
|
7,823.1
|
|
$
|
8,687.8
|
|
$
|
9,174.1
|
|
$
|
8,811.7
|
|
$
|
8,607.4
|
|
|||||
|
Premiums receivable
(5)
|
1,551.1
|
|
1,596.3
|
|
1,472.5
|
|
1,151.6
|
|
1,058.6
|
|
||||||||||
|
Total assets
|
12,532.9
|
|
12,906.4
|
|
12,090.1
|
|
11,048.8
|
|
10,716.3
|
|
||||||||||
|
Loss and loss adjustment expense reserves
|
7,074.2
|
|
6,749.5
|
|
5,319.9
|
|
4,938.2
|
|
4,750.8
|
|
||||||||||
|
Reserves for unearned premiums
|
1,709.1
|
|
1,820.8
|
|
1,618.6
|
|
1,587.2
|
|
1,441.8
|
|
||||||||||
|
Loan notes issued by variable interest entities, at fair value
(9)
|
4.6
|
|
86.6
|
|
223.4
|
|
190.6
|
|
138.6
|
|
||||||||||
|
Long-term debt
|
424.7
|
|
549.5
|
|
549.3
|
|
549.2
|
|
549.1
|
|
||||||||||
|
Total shareholders’ equity
|
2,656.0
|
|
2,928.5
|
|
3,648.3
|
|
3,419.9
|
|
3,419.3
|
|
||||||||||
|
Per Share Data (Based on U.S. GAAP balance sheet data):
|
|
|
|
|
|
|
|
|
||||||||||||
|
Book value per ordinary share
(6)
|
$35.83
|
$40.59
|
$47.68
|
$46.99
|
$46.16
|
|||||||||||||||
|
Diluted book value per share (treasury stock method)
(7)
|
$35.48
|
$40.10
|
$46.72
|
$46.00
|
$45.13
|
|||||||||||||||
|
Cash dividend declared per ordinary share
|
$0.72
|
$0.94
|
$0.86
|
$0.83
|
$0.78
|
|||||||||||||||
______________
|
(1)
|
The loss ratio is calculated by dividing losses and loss adjustment expenses by net premiums earned.
|
|
(2)
|
The expense ratio is calculated by dividing amortization of deferred policy acquisition costs and general, administrative and corporate expenses by net premiums earned.
|
|
(3)
|
The combined ratio is the sum of the loss ratio and the expense ratio.
|
|
(4)
|
Total cash and investments include cash, cash equivalents, fixed income securities, equities, bank loans, other investments, short-term investments and catastrophe bonds.
|
|
(5)
|
Premiums receivable including funds withheld.
|
|
(6)
|
Book value per ordinary share is based on total shareholders’ equity excluding the aggregate value of the liquidation preferences of our preference shares, divided by the number of shares outstanding of
62,017,368
,
60,918,373
,
59,774,464
,
59,474,085
and
59,743,156
as at December 31,
2014
,
2015
,
2016
,
2017
and
2018
, respectively.
|
|
(7)
|
Diluted book value per share is calculated based on total shareholders’ equity excluding the aggregate value of the liquidation preferences of our preference shares, as at December 31,
2014
,
2015
,
2016
,
2017
and
2018
, divided by the number of dilutive equivalent shares outstanding of
63,444,356
,
62,240,466
,
61,001,071
,
60,202,409
and
60,320,879
as at December 31,
2014
,
2015
,
2016
,
2017
and
2018
, respectively. As at December 31,
2014
,
2015
,
2016
,
2017
and
2018
, there were
1,426,988
,
1,322,093
,
1,226,607
,
728,324
and
577,723
of dilutive equivalent shares, respectively. Potentially dilutive shares outstanding are calculated using the treasury method and all relate to employee, director and investor options.
|
76
|
(8)
|
Including cash within consolidated variable interest entities of
$26.9 million
as at
December 31, 2018
and
$166.6 million
as at
December 31, 2017
.
|
|
(9)
|
All of the loan notes issued by our consolidated variable interest entities, at fair value, of
$4.6 million
as at
December 31, 2018
, were classified as current liabilities due and payable in less than one year. For more information, refer to Note 7, “Variable Interest Entities” of our consolidated financial statements.
|
77
Item 7. Management’s Discussion and Analysis of Financial Condition and Results of Operations
The following is a discussion and analysis of our financial condition and results of operations for the
twelve months ended
December 31, 2018
,
2017
and
2016
. This discussion and analysis should be read in conjunction with our audited consolidated financial statements and related Notes contained in this report. This discussion contains forward-looking statements that involve risks and uncertainties and that are not historical facts, including statements about our beliefs and expectations. Our actual results could differ materially from those anticipated in these forward-looking statements as a result of various factors, including those discussed below and particularly under the headings “Risk Factors,” “Business” and “Cautionary Statement Regarding Forward-Looking Statements” contained in Item 1A, Item 1, and Part I of this report, respectively.
Aspen’s Year in Review
Business Combination.
On August 27, 2018, the Company entered into a definitive Agreement and Plan of Merger (the “Merger Agreement”) with Highlands Holdings, Ltd., a Bermuda exempted company (“Highlands”), and Highlands Merger Sub, Ltd., a Bermuda exempted company and wholly owned subsidiary of Highlands (“Merger Sub”). Under the Merger Agreement, subject to the satisfaction or waiver of certain conditions set forth therein, and in the related statutory merger agreement, the Company will merge with and into Merger Sub in accordance with the Bermuda Companies Act (the “Merger”), with the Company surviving the Merger as a wholly-owned subsidiary of Highlands. Highlands and Merger Sub are affiliates of certain investment funds managed by affiliates of Apollo Global Management, LLC, a leading global alternative investment manager. As previously announced, Christopher O’Kane will step down from his position as Group Chief Executive Officer and director of the Board on or shortly after the completion of the Merger and, subject to and contingent upon the Merger, will be replaced by Mark Cloutier.
Pursuant to the Merger Agreement, at the effective time of the Merger, each ordinary share of the Company issued and outstanding immediately prior to such time (other than ordinary shares owned by Aspen as treasury shares, owned by any subsidiary of the Company or owned by Highlands, Merger Sub or any of their respective subsidiaries, which will be canceled as set forth in the Merger Agreement) will be converted into the right to receive
$42.75
in cash, without interest and less any required withholding taxes. At the effective time of the Merger, each of the Company’s issued and outstanding
5.95%
Fixed-to-Floating Rate Perpetual Non-Cumulative Preference Shares and
5.625%
Perpetual Non-Cumulative Preference Shares (collectively, the “Preference Shares”) will remain issued and outstanding. The Merger Agreement restricts the Company from declaring or paying any dividends other than the quarterly dividends on Aspen’s ordinary shares that were previously declared and publicly announced prior to the date of the Merger Agreement and periodic cash dividends on the Preference Shares in accordance with the terms of the applicable certificate of designation.
All required regulatory approvals in connection with the Merger have been obtained and we anticipate that the Merger will be completed shortly. The Merger is subject to the satisfaction or waiver of a number of conditions, including, among others, the maintenance of certain financial strength ratings of the Operating Subsidiaries. The Merger Agreement also contains certain termination rights, including Highlands’ right to terminate if we suffered aggregate net losses exceeding
$350 million
resulting from certain catastrophic events occurring between July 1, 2018 and January 31, 2019. We do not believe that the net catastrophe losses arising from such catastrophic events during the specified period exceeded
$350 million
. For further details on the potential risks related to the Merger, refer to Part I, Item 1A, “Risk Factors — Risks Relating to the Merger.”
For further details on the Merger, refer to Part II, Item 7, “Management’s Discussion and Analysis of Financial Condition and Results of Operations — Aspen’s Year In Review” and Note 19(d) of our consolidated financial statements, “Commitments and Contingencies — Contingent Liabilities.”
Effectiveness and Efficiency Program.
We launched the Effectiveness and Efficiency Program in October 2017 to allow us to be a more nimble organization with faster decision-making ability and a more competitive expense ratio. We exceeded our target to achieve run rate savings of $30 million in
2018
and we continue to expect to achieve approximately $55 million of run rate savings in 2019. We recognized
$37.5 million
of expenses associated with the Effectiveness and Efficiency Program in
2018
(
2017
—
$15.2 million
).
As part of the Effectiveness and Efficiency Program, Aspen UK Services, Aspen U.S. Services and Aspen Bermuda entered into an outsourcing agreement, dated April 1, 2018, with Genpact (UK) Limited, a company registered in England and Wales. Under the outsourcing agreement, Genpact provides Aspen with a range of operational business processes, primarily from their offshore service center in Gurgaon, India. In addition, Aspen UK Services, Aspen U.S. Services and Aspen Bermuda entered into an outsourcing agreement with Cognizant Worldwide Limited, a company registered in England, on August 31, 2018 for the provision of information technology services.
Business Portfolio Optimization
. In 2018, we reduced our net retentions through the purchase of additional reinsurance for both of our business segments as part of our strategy to reduce volatility and our exposures to 1-in-100 and 1-in-250 cat events relative to total shareholders’ equity. Total ceded written premiums in
2018
increase
d by
$216.5 million
compared to
2017
due to
78
an increase in the proportion of business ceded to our casualty, financial institutions and property quota share programs. In addition, we increased ceded reinsurance for our property catastrophe business lines where business previously ceded to Silverton, a consolidated entity, is now ceded to Peregrine, a non-consolidated entity.
As we continue to reposition the insurance segment, we decided to no longer underwrite international professional liability and marine hull on the Lloyd’s platform and aviation effective August 2018. In addition, we closed Aspen U.K.’s reinsurance branches in Paris, France and Cologne, Germany during
2018
.
Capital Management
. We continue to focus on capital management and maintain our capital at an appropriate level. On June 18, 2018, we elected to redeem
$125.0 million
in aggregate principal amount of the $250 million 6.00% Senior Notes due 2020, the only material debt issued by Aspen Holdings currently outstanding. The redemption resulted in a realized loss, or make-whole payment, of
$8.6 million
.
On April 25, 2018, Kendall Re issued $225.0 million Series 2018-1 Class A Principal At-Risk Variable Rate Notes due May 6, 2021 under a variable rate note program from which the proceeds will be used to provide Aspen Bermuda with fully-collateralized retrocessional reinsurance protections against losses from a range of international perils, including U.S. named storms, U.S. and Canada earthquakes, U.S. severe thunderstorms, U.S. wildfires, U.S. winter storms and European windstorms. The results and balance sheet of Kendall Re are not included within our condensed consolidated financial statements because we do not hold variable or voting interest in Kendall Re.
We did not repurchase any ordinary shares in
2018
under the
$250.0 million
share repurchase program which expired on February 8, 2019 and was not renewed. As set forth in the Merger Agreement, we are prohibited from redeeming, purchasing or otherwise acquiring any outstanding ordinary shares unless Highlands consents in writing.
79
Financial Overview
The following overview of our
2018
,
2017
and
2016
operating results and financial condition is intended to identify important themes and should be read in conjunction with the more detailed discussion further below.
Operating highlights
|
•
|
Gross written premiums of
$3,446.9 million
in
2018
, an
increase
of
2.6%
from
2017
.
|
|
•
|
Combined ratio of
110.0%
for
2018
, including
$262.9 million
, or
12.1
percentage points of pre-tax catastrophe losses, net of reinsurance and reinstatements, compared with
125.7%
for
2017
, which included
$561.9 million
or
24.6
percentage points of pre-tax catastrophe losses, net of reinsurance and reinstatements, and
98.5%
for
2016
, which included
$164.4 million
, or
6.3
percentage points of pre-tax catastrophe losses, net of reinsurance and reinstatements.
|
|
•
|
Net favorable development on prior year loss reserves of
$111.1 million
, or
5.0
combined ratio points, for
2018
compared with
$105.4 million
, or
4.6
combined ratio points, for
2017
and
$129.3 million
, or
4.9
combined ratio points, for
2016
.
|
|
•
|
Annualized net return on average equity of a
7.7%
loss
for
2018
compared with an
11.1%
loss
in
2017
and a
5.4%
gain
in
2016
.
|
Gross written premiums.
The changes in our business segments’ gross written premiums for the twelve months ended
December 31, 2018
,
2017
and
2016
were as follows:
|
Gross Written Premiums for the Twelve Months Ended December 31,
|
||||||||||||||||||
|
Business Segment
|
2018
|
2017
|
2016
|
|||||||||||||||
|
|
($ in millions)
|
% change
|
($ in millions)
|
% change
|
(in millions)
|
|||||||||||||
|
Reinsurance
|
$
|
1,495.7
|
|
(3.4
|
)%
|
$
|
1,548.5
|
|
9.6
|
%
|
$
|
1,413.2
|
|
|||||
|
Insurance
|
1,951.2
|
|
7.7
|
%
|
1,812.4
|
|
4.5
|
%
|
1,733.8
|
|
||||||||
|
Total
|
$
|
3,446.9
|
|
2.6
|
%
|
$
|
3,360.9
|
|
6.8
|
%
|
$
|
3,147.0
|
|
|||||
Overall gross written premiums in
2018
increased by
2.6%
compared to
2017
. In
2018
, gross written premiums in our reinsurance segment
decrease
d by
3.4%
compared to
2017
due primarily to reductions in mortgage business written within our specialty reinsurance business line. The
7.7%
increase
in gross written premiums in our insurance segment in
2018
was due to growth in property and casualty insurance, and financial and professional lines insurance, partially offset by reductions in marine, aviation and energy insurance where we exited certain lines of business as we continue to experience challenging market conditions. In
2017
, gross written premiums increased by
6.8%
compared to
2016
due primarily to growth in specialty reinsurance business lines and financial and professional insurance.
Ceded written premiums.
Overall ceded written premiums in
2018
increase
d by
18.9%
compared to
2017
. Ceded written premiums increased in both business segments. The changes in our business segments’ ceded written premiums for the twelve months ended
December 31, 2018
,
2017
and
2016
were as follows:
|
Ceded Written Premiums for the Twelve Months Ended December 31,
|
||||||||||||||||||
|
Business Segment
|
2018
|
2017
|
2016
|
|||||||||||||||
|
|
($ in millions)
|
% change
|
($ in millions)
|
% change
|
(in millions)
|
|||||||||||||
|
Reinsurance
|
$
|
312.8
|
|
4.8
|
%
|
$
|
298.5
|
|
107.3
|
%
|
$
|
144.0
|
|
|||||
|
Insurance
|
1,052.1
|
|
23.8
|
%
|
849.9
|
|
107.6
|
%
|
409.3
|
|
||||||||
|
Total
|
$
|
1,364.9
|
|
18.9
|
%
|
$
|
1,148.4
|
|
107.6
|
%
|
$
|
553.3
|
|
|||||
Ceded reinsurance premiums in our insurance segment increased by
$202.2 million
in
2018
primarily due to an increase in the proportion of business ceded to our casualty, financial institutions and property quota per share programs. Ceded reinsurance costs in our reinsurance segment increased by
$14.3 million
in
2018
due to increased ceded reinsurance in property catastrophe reinsurance where business previously ceded to Silverton, a consolidated entity, is now ceded to Peregrine, a non-consolidated entity.
Ceded written premiums in our insurance segment increased by
107.6%
in
2017
compared to
2016
due to the restructuring of our ceded reinsurance arrangements and the recognition of reinstatement premiums associated with increased catastrophes and large losses. Ceded written premiums in our reinsurance segment increased by
107.3%
in
2017
compared to
2016
due to new business opportunities written in conjunction with increased retrocession, additional ceded written premiums following the sale of AgriLogic in December 2017 and the recognition of reinstatement premiums associated with increased catastrophe losses.
80
Combined ratio.
We monitor the ratio of losses and expenses to net earned premium (the “combined ratio”) as a measure of relative performance where a lower ratio represents a better result than a higher ratio. The combined ratios for our two business segments for the twelve months ended
December 31, 2018
,
2017
and
2016
were as follows:
|
|
Combined Ratios for the Twelve Months Ended December 31,
|
||||||||
|
Business Segment
|
2018
|
2017
|
2016
|
||||||
|
Reinsurance
|
104.0
|
%
|
125.1
|
%
|
90.0
|
%
|
|||
|
Insurance
|
104.0
|
%
|
117.9
|
%
|
99.6
|
%
|
|||
|
Total
(1)
|
110.0
|
%
|
125.7
|
%
|
98.5
|
%
|
|||
__________________
|
(1)
|
The total combined ratio includes the impact from corporate expenses.
|
The overall combined ratio for
2018
improve
d by
15.7
percentage points compared to
2017
due mainly to a decrease in the loss ratio. The improvement in loss ratio was due primarily to a
$301.3 million
decrease
in catastrophe losses and a
$38.7 million
decrease
in large losses, partially offset by a
$91.9 million
decrease in net earned premiums. The expense ratio
decrease
d by
0.2
percentage points due to a reduction in general, administrative and corporate expenses and a decrease in policy acquisition expenses due to over-rider commissions associated with the increase in ceded reinsurance premiums partially offset by a reduction in net earned premiums.
The combined ratio for
2017
increase
d by
27.2
percentage points compared to
2016
due mainly to the increase in the loss ratio as a result of a
$409.6 million
increase in catastrophe losses, a
$59.7 million
increase
in large losses, a
$23.9 million
decrease
prior year reserve releases, an increase in attritional losses in our insurance segment and a
$330.7 million
decrease in net earned premiums. The expense ratio for
2017
increase
d by
0.5
percentage points due to a reduction in net earned premiums and an increase in general, administrative and corporate expenses, partially offset by a decrease in policy acquisition expenses due to over-rider commissions associated with the increase in ceded reinsurance.
In each of the years ended
December 31, 2018
,
2017
and
2016
, we recorded a reduction in the level of reserves for prior years. In
2018
, we reported net favorable development on prior year loss reserves of
$111.1 million
, or
5.0
combined ratio points, compared with
$105.4 million
, or
4.6
combined ratio points, for
2017
, and
$129.3 million
, or
4.9
combined ratio points, for
2016
.
Overall reserve releases in
2018
increased
by
$5.7 million
compared to
2017
due to a
$19.1 million
increase
in net reserve releases in our insurance segment offsetting a
$13.4 million
reduction in net reserve releases in our reinsurance segment. Overall reserve releases in
2017
decrease
d by
$23.9 million
compared to
2016
due an
$18.7 million
decrease
in net reserve releases in our insurance segment and a
$5.2 million
decrease in reserve releases in our reinsurance segment. Further information relating to the release of reserves can be found below under “— Reserves for Losses and Loss Adjustment Expenses — Prior Year Loss Reserves.”
Amortization of deferred policy acquisition costs decreased in
2018
compared to
2017
and in
2017
compared to
2016
due to an increase in over-rider commissions associated with the increase in ceded reinsurance.
General, administrative and corporate expenses
decrease
d to
$491.7 million
in
2018
from
$502.2 million
in
2017
and were broadly in line with
$490.1 million
in
2016
. The
decrease
in expenses in
2018
compared to
2017
was largely due to reductions in administration costs in the reinsurance segment following the sale of AgriLogic, and a reduction in operating expenses in the insurance segment. These reductions were offset by a
$44.5 million
increase in non-operating expenses, which included
$39.0 million
of advisor fees related to the Merger and a
$22.3 million
increase in costs associated with the Effectiveness and Efficiency Program, offset by a reduction in other non-operating expenses primarily due to the write back of a
$14.1 million
buyout provision. The increase in
2017
compared to
2016
was largely due to
$15.2 million
of costs associated with the Effectiveness and Efficiency Program and increased costs associated with growth in our insurance business, partially offset by lower provisions for performance-related remuneration.
Net investment income.
We generated net investment income of
$198.2 million
in
2018
, an
increase
of
4.9%
compared to the prior year (
2017
—
$189.0 million
;
2016
—
$187.1 million
) primarily due to increased income from our fixed income portfolio. The increase in investment income in
2017
compared to
2016
was also primarily due to the increase in the book yield of the fixed income portfolio.
Taxes.
We recognized an income tax
benefit
for the
twelve months ended
December 31, 2018
of
$10.2 million
compared to a
benefit
of
$15.4 million
and an
expense
of
$6.1 million
in
2017
and
2016
, respectively. The effective tax rate for the
twelve months ended
December 31, 2018
on our loss before tax was
6.5%
(
2017
—
5.5%
;
2016
—
2.9%
).
81
The increase in the tax rate, (defined as the tax charge or credit, divided by the profit or loss before tax) for
2018
was due to the successful conclusion of a U.K. tax inquiry which enabled the release of a
$12.8 million
provision we were holding against the potential disallowance of a prior period adjustment. The tax benefit was partially offset by the introduction of U.S. BEAT on premium ceded from U.S. subsidiaries to non-U.S. related parties. In addition, the tax rate for
2017
benefited from a tax credit associated with the adoption of ASU 2016-09, “
Compensation - Stock Compensation
” and a tax credit regarding deductions available for certain research and development expenditure. The tax benefit in 2017 was not materially affected by the U.S. Tax Cuts and Jobs Act which was signed on December 22, 2017. The impact of the U.S. federal income tax rate reduction from 34% in
2017
to 21% in
2018
has been reflected in measuring deferred taxes.
The effective tax rate is subject to revision in future periods if circumstances change and depends on the relative profitability of the business underwritten in Bermuda (where the rate of tax on corporate profits is zero), the United Kingdom (where the corporation tax rate is 19% and will be reduced to 17% effective April 1, 2020) and the United States (where the federal income tax rate was previously 34% and was reduced to 21% effective January 1, 2018). The tax in each of the years is representative of the geographic spread of our business between taxable and non-taxable jurisdictions in such years.
Net income.
We reported a net
loss
after taxes of
$145.8 million
in
2018
compared to a net
loss
of
$266.4 million
in
2017
and net
income
of
$203.4 million
in
2016
. The decrease in net
loss
in
2018
was primarily due to the
$412.2 million
increase in underwriting income as a result of the
$301.3 million
decrease
in catastrophe losses and a
$39.4 million
reduction in expenses, partially offset by a
$91.9 million
reduction
in net earned premiums. The net loss in
2017
was due primarily to a
$625.5 million
decrease
in underwriting income mainly from a
$409.6 million
increase in catastrophe losses, a
$330.7 million
reduction
in net earned premiums and a
$23.9 million
reduction in reserve releases, partially offset by a
$116.3 million
reduction in expenses.
Other comprehensive income.
Total other comprehensive income
decrease
d by
$66.0 million
(
2017
—
$50.8 million
decrease
), net of taxes, for the
twelve
months ended
December 31, 2018
. The
decrease
in total other comprehensive income includes a net unrealized
loss
of
$81.0 million
in the available for sale investment portfolio (
2017
—
$9.2 million
net unrealized
loss
) largely attributable to the impact of rising interest rates on our bond portfolios, a
$4.5 million
reclassification of net realized
loss
to net income (
2017
—
$3.6 million
reclassified realized
gains
), a
$1.8 million
unrealized
loss
(
2017
—
$2.6 million
unrealized
gain
) on the hedged derivative contracts and an unrealized
gain
in foreign currency translation of
$12.3 million
(
2017
—
$40.6 million
unrealized
loss
) largely attributable to the impact from the continued strengthening of the U.S. dollar.
Dividends.
Dividends paid on our ordinary shares in
2018
were
$42.9 million
(
2017
—
$56.2 million
;
2016
—
$52.7 million
). The decrease in dividends on our ordinary shares in 2018 was because, effective August 27, 2018, we are restricted from declaring or paying any dividends on our ordinary shares under the Merger Agreement.
Dividends paid on our outstanding Preference Shares in
2018
were
$30.5 million
(
2017
—
$36.2 million
;
2016
—
$41.8 million
). The reduction in dividends in
2018
and
2017
was due to the redemption of the 7.401% Preference Shares and 7.250% Preference Shares on January 3, 2017 and July 3, 2017, respectively. Under the Merger Agreement, we continue to be able to pay periodic cash dividends on the Preference Shares in accordance with the terms of the applicable certificate of designation.
Shareholders’ equity and financial leverage.
Total shareholders’ equity
decrease
d by
$272.5 million
from
$2,928.5 million
as at
December 31, 2017
to
$2,656.0 million
as at
December 31, 2018
, the most significant movements of which were as follows:
|
•
|
a
decrease
of
$220.3 million
in retained earnings due to a net loss of
$145.8 million
and the payment of
$73.4 million
in dividends on our outstanding ordinary shares and Preference Shares; and
|
|
•
|
a
reduction
of
$66.0 million
in other comprehensive income which included a
$76.5 million
net unrealized loss on available for sale investments, a
$12.3 million
gain
in foreign currency translation and a
$1.8 million
net loss in the value of hedged foreign exchange contracts.
|
As at
December 31, 2018
and
2017
, our total shareholders’ equity included Preference Shares with a total value as measured by their respective liquidation preferences of
$525.0 million
less issue costs of
$13.1 million
.
Our
$300 million
4.650%
Senior Notes due 2023 (the “2023 Senior Notes”) and
$125.0 million
6.00%
Senior Notes due 2020 (the “2020 Senior Notes”) were the only material debt issued by Aspen Holdings as at
December 31, 2018
and
2017
totaling
$424.7 million
and
$549.5 million
, respectively. On June 18, 2018, we elected to redeem
$125.0 million
in aggregate principal amount of the 2020 Senior Notes which resulted in a realized loss, or make-whole payment, of
$8.6 million
. In addition to the 2020 Senior Notes and 2023 Senior Notes, as at
December 31, 2018
we also reported
$4.6 million
of debt previously issued by Silverton (
2017
—
$86.6 million
). For further information on Silverton, refer to Note 7 of our consolidated financial statements, “Variable Interest Entities.”
Management monitors the ratio of the total of debt and hybrids to total capital, with total capital defined as shareholders’ equity plus outstanding debt excluding loan notes issued by variable interest entities. As at
December 31, 2018
, the debt to capital ratio decreased to
13.8%
(
2017
—
15.8%
) primarily due to the partial redemption of the 2020 Senior Notes in June 2018, partially offset by a decrease in capital due to catastrophe losses and unrealized losses in our investment portfolio. We also monitor the ratio of
82
the total debt and the liquidation preference of our Preference Shares to total capital which was
30.4%
as at
December 31, 2018
(
2017
—
30.5%
). The Preference Shares are classified in our balance sheet as equity but may receive a different treatment in some cases under the capital adequacy assessments made by certain rating agencies.
Diluted book value per ordinary share as at
December 31, 2018
was
$35.48
, a
decrease
of
11.5%
compared to
$40.10
as at
December 31, 2017
. Book value per ordinary share is based on total shareholders’ equity, less preference shares (liquidation preference less issue expenses) and non-controlling interests, divided by the number of ordinary shares in issue at the end of the period. Balances as at
December 31, 2018
and
2017
were as follows:
|
As at December 31, 2018
|
At December 31, 2017
|
|||||||
|
|
($ in millions, except for share amounts)
|
|||||||
|
Total shareholders’ equity
|
$
|
2,656.0
|
|
$
|
2,928.5
|
|
||
|
Preference shares less issue expenses
|
(511.9
|
)
|
(511.9
|
)
|
||||
|
Non-controlling interests
|
(3.7
|
)
|
(2.7
|
)
|
||||
|
Net assets attributable to ordinary shareholders
|
$
|
2,140.4
|
|
$
|
2,413.9
|
|
||
|
Issued ordinary shares
|
59,743,156
|
|
59,474,085
|
|
||||
|
Issued and potentially dilutive ordinary shares
|
60,320,879
|
|
60,202,409
|
|
||||
Market Conditions, Rate Trends and Developments
Results for the (re)insurance market were once again dominated by catastrophe losses in 2018. Losses from natural catastrophes in 2018 are estimated to be the fourth highest on record for the (re)insurance industry. In addition, there remains an abundance of capital across all products and geographies which continues to place pressure on (re)insurance price increases.
We achieved an overall rate increase of approximately
3%
for our reinsurance business during the January 1, 2019 renewals where we renewed approximately 40% of our annual book of reinsurance business excluding our strategic partnership with CGB DS. Our Aspen Capital Markets business continues to provide investors with direct access to our underwriting expertise and to provide brokers and clients with additional capacity. The January 1 renewals are less important for our insurance segment. During 2018, we achieved price increases of approximately
4%
in property and casualty insurance and approximately
8%
in marine, aviation and energy insurance, whereas prices across our financial and professional lines insurance remained broadly flat.
We continue to seek to balance our underwriting portfolio and to target the best risk-adjusted returns. In connection with this objective, we anticipate reducing our total purchase of ceded and retrocessional reinsurance in 2019 as we purchase less proportional reinsurance protection and more excess of loss protection compared to 2018. As a result of these actions, we expect our net written premium to gross written premium ratio to increase from 60% in 2018 to approximately 75% in 2019.
With regard to our Effectiveness and Efficiency Program, we exceeded our target to achieve run rate savings of $30 million in 2018 and continue to expect to achieve approximately $55 million of run rate savings in 2019.
Refer to Part I, Item 1A, “Risk Factors” and “Cautionary Statement Regarding Forward-Looking Statements” included in this report.
Recent Developments
On January 16, 2019, Aspen Bermuda entered into a number of standard fixed for floating interest rate swaps with a total notional amount of
$3,318.0 million
due to mature between January 18, 2021 and January 18, 2034. Aspen Bermuda entered into the swaps in the ordinary course of its investment activities to partially mitigate any negative impact of rises in interest rates on the market value of our fixed income portfolio.
Critical Accounting Policies
Our consolidated financial statements contain certain amounts that are inherently subjective in nature and require management to make assumptions and best estimates to determine the reported values. We believe that the following critical accounting policies affect the more significant estimates used in the preparation of our consolidated financial statements. A statement of all the significant accounting policies we use to prepare our financial statements is included in the Notes to the consolidated financial statements. If factors such as those described in Part I, Item 1A, “Risk Factors” cause actual events to differ from the assumptions used in applying the accounting policies and calculating financial results, there could be a material adverse effect on our operating results, financial condition and liquidity.
83
Written Premiums
Written premiums comprise the estimated premiums on contracts of insurance and reinsurance entered into in the reporting period, except in the case of proportional reinsurance contracts, where written premiums relate only to our estimated proportional share of premiums due on contracts entered into by the ceding company prior to the end of the reporting period.
All premium estimates are reviewed regularly, comparing actual reported premiums to expected ultimate premiums along with a review of the collectability of premiums receivable. Based on management’s review, the appropriateness of the premium estimates is evaluated, and any adjustments to these estimates are recorded in the periods in which they become known. Adjustments to original premium estimates could be material and these adjustments may directly and significantly impact earnings in the period they are determined because the subject premium may be fully or substantially earned.
We refer to premiums receivable which are not fixed at the inception of the contract as adjustment premiums. The proportion of adjustment premiums included in the premium estimates varies between business lines with the largest adjustment premiums associated with property and casualty reinsurance business and the smallest with property and liability insurance lines.
Adjustment premiums are most significant in relation to reinsurance contracts. Different considerations apply to non-proportional and proportional treaties as follows:
Non-proportional treaties.
A large number of the reinsurance contracts we write are written on a non-proportional or excess of loss treaty basis. As the ultimate level of business written by each cedant can only be estimated at the time the reinsurance is placed, the reinsurance contracts generally stipulate a minimum and deposit premium payable under the contract with an adjustable premium determined by variables such as the number of contracts covered by the reinsurance, the total premium received by the cedant and the nature of the exposures assumed. Minimum and deposit premiums generally cover the majority of premiums due under such treaty reinsurance contracts and the adjustable portion of the premium is usually a small portion of the total premium receivable. For excess of loss contracts, the minimum and deposit premium, as defined in the contract, is generally considered to be the best estimate of the contract’s written premium at inception. Accordingly, this is the amount we generally record as written premium in the period the underlying risks incept.
During the life of a contract, notifications from cedants and brokers may affect the estimate of ultimate premium and result in either increases or reductions in reported revenue. Changes in estimated adjustable premiums do not generally have a significant impact on short-term liquidity as the payment of adjustment premiums generally occurs after the expiration of a contract.
Many non-proportional treaties also include a provision for the payment to us by the cedant of reinstatement premiums based on loss experience under such contracts. Reinstatement premiums are the premiums charged for the restoration of the reinsurance limit of an excess of loss contract to its full amount after payment by the reinsurer of losses as a result of an occurrence. These premiums relate to the future coverage obtained during the remainder of the initial policy term and are included in revenue in the same period as the corresponding losses.
Proportional treaties (“treaty pro rata”).
Estimates of premiums assumed under treaty pro rata reinsurance contracts are recorded in the period in which the underlying risks are expected to incept and are based on information provided by brokers and ceding companies and estimates of the underlying economic conditions at the time the risk is underwritten. We estimate premiums receivable initially and update our premium estimates regularly throughout the contract term based on treaty statements received from the ceding company.
The reported gross written premiums for treaty pro rata business include estimates of premiums due to us but not yet reported by the cedant because of time delays between contracts being written by our cedants and their submission of treaty statements to us. This additional premium is normally described as pipeline premium. Treaty statements disclose information on the underlying contracts of insurance written by our cedants and are generally submitted on a monthly or quarterly basis, from 30 to 90 days in arrears. In order to report all risks incepting prior to a period end, we estimate the premiums written between the last submitted treaty statement and the period end. Treaty pro rata premiums are written predominantly in our other property, specialty and casualty reinsurance lines of business.
Property treaty pro rata contributed significantly to our reinsurance segment where we wrote
$182.0 million
in gross written premium in
2018
(
2017
—
$242.5 million
), or
12.2%
of the gross written premiums in our reinsurance segment, of which
$106.1 million
was estimated (
2017
—
$76.6 million
) and
$75.9 million
was reported by the cedants (
2017
—
$165.9 million
). Excluding the impact of costs, such as reinsurance premiums and operating expenses, we estimate that the impact of a $1.0 million increase/decrease in our estimated gross written premiums in our property treaty pro rata business would increase/decrease net income before tax by approximately
$0.1 million
for the year ended
December 31, 2018
(
2017
—
$0.3 million
increase/decrease).
84
The most likely drivers of change in our premium estimates in decreasing order of magnitude are:
|
•
|
changes in renewal rate or rate of new business acceptances by cedant insurance companies leading to lower or greater volumes of ceded premiums than our estimate, which could result from changes in the relevant primary market that could affect more than one of our cedants or could be a consequence of changes in marketing strategy or risk appetite by a particular cedant;
|
|
•
|
changes in the rates being charged by cedants; and
|
|
•
|
differences between the pattern of inception dates assumed in our estimate and the actual pattern of inception dates.
|
We anticipate that ultimate premiums might reasonably be expected to vary by up to 5% as a result of variations in one or more of the assumptions described above, although larger variations are possible. Based on gross written premiums of
$182.0 million
(
2017
—
$242.5 million
) in our property reinsurance treaty pro rata account as at
December 31, 2018
, a variation of 5% could increase or reduce net income before tax by approximately
$0.7 million
(
2017
—
$1.2 million
).
Earned premiums.
Premiums are recognized as earned over the policy exposure periods. The premium related to the unexpired portion of each policy at the end of the reporting period is included in the balance sheet as unearned premiums.
Reserving Approach
We are required by U.S. GAAP to establish loss reserves for the estimated unpaid portion of the ultimate liability for losses and loss expenses (“ultimate losses”) under the terms of our policies and agreements with our insured and reinsured customers. Our loss reserves comprise the following components:
|
•
|
the cost of claims reported to us but not yet paid known as case reserves (“case reserves”);
|
|
•
|
IBNR reserves to cover the anticipated cost of claims incurred but not reported. Within this, we also include the potential development of reported claims; and
|
|
•
|
the expenses associated with settling claims, including legal and other fees and the general expenses of administering the claims adjustment process, known as the loss adjustment expenses (“LAE”).
|
Prior to the selection of the reserves to be included in our financial statements, our actuarial team employs a number of techniques to establish a range of estimates from which they consider it reasonable for management to select a ‘best estimate’ (the “actuarial range”).
Case Reserves.
For reported claims, reserves are established on a case-by-case basis within the parameters of coverage provided in the insurance policy or reinsurance agreement. The method of establishing case reserves for reported claims differs among our operations. With respect to our insurance operations, we are advised of potential insured losses and our claims handlers record reserves for the estimated amount of the expected indemnity settlement, loss adjustment expenses and cost of defense where appropriate. The reserve estimate reflects the judgment of the claims personnel and is based on claim information obtained to date, general reserving practices, the experience and knowledge of the claims personnel regarding the nature of the specific claim and where appropriate and available, advice from legal counsel, loss adjusters and other claims experts.
With respect to our reinsurance claims operations, claims handlers set case reserves for reported claims generally based on the claims reports received from our ceding companies and take into consideration our cedants’ own reserve recommendations and our prior loss experience with the cedant. Additional case reserves (“ACR”), in addition to the cedants’ own recommended reserves, may be established by us to reflect our estimated ultimate cost of a loss. ACRs are generally the result of either a claims handler’s own experience and knowledge of handling similar claims, general reserving practices or the result of reserve recommendations following an audit of cedants’ reserves.
Case reserves are based on a subjective judgment of facts and circumstances and are established for the purposes of internal reserving only. Accordingly, they do not represent a commitment to any course of conduct or admission of liability on our behalf in relation to any specific claim.
IBNR Reserves.
The need for IBNR reserves arises from time lags between when a loss occurs and when it is actually reported and settled. By definition, we do not have specific information on IBNR claims so they need to be estimated by actuarial methodologies. IBNR reserves are therefore generally calculated at an aggregate level and cannot generally be identified as reserves for a particular loss or contract. We calculate IBNR reserves by class of business within each line of business. Where appropriate, analyses may be conducted on sub-sets of a class of business. IBNR reserves are calculated by projecting our ultimate losses on each class of business and subtracting paid losses and case reserves. IBNR reserves also cover the anticipated cost of claims incurred but not reported, within this we also include any potential development of reported claims. Over recent years, we have begun to place greater reliance on our actual actuarial experience for our long-tail lines of business that we have written since our
85
inception in 2002. We believe that our earliest accident years are now capable of providing us with meaningful actuarial indications. Estimates and judgments for new insurance and reinsurance lines of business are more difficult to make than those made for more mature lines of business because we have more limited historical information through
December 31, 2018
.
Sources of Information.
Claims information received typically includes the loss date, details of the claim, the recommended reserve and reports from the loss adjusters dealing with the claim. In respect of pro rata treaties and any business written through managing general agents, we receive regular statements (bordereaux) which provide paid and outstanding claims information, often with large losses separately identified. Following widely reported loss events, such as catastrophes, we adopt a proactive approach to establish our likely exposure to claims by reviewing policy listings and contacting brokers and policyholders as appropriate.
Actuarial Methodologies.
The main projection methodologies that are used by our actuaries are as follows:
|
•
|
Initial expected loss ratio (“IELR”) method:
This method calculates an estimate of ultimate losses by applying an estimated loss ratio to an estimate of ultimate earned premium for each accident year. The estimated loss ratio may be based on pricing information and/or industry data and/or historical claims experience revalued to the year under review.
|
|
•
|
Bornhuetter-Ferguson (“BF”) method:
The BF method uses as a starting point an assumed IELR and blends in the loss ratio, which is implied by the claims experience to date using benchmark loss development patterns on paid claims data (“Paid BF”) or reported claims data (“Reported BF”). Although the method tends to provide less volatile indications at early stages of development and reflects changes in the external environment, it can be slow to react to emerging loss development and can, if the IELR proves to be inaccurate, produce loss estimates which take longer to converge with the final settlement value of loss.
|
|
•
|
Loss development (“Chain Ladder”) method:
This method uses actual loss data and the historical development profiles on older accident years to project more recent, less developed years to their ultimate position.
|
|
•
|
Exposure-based method:
This method is typically used for specific large catastrophic events such as a major hurricane. All exposure is identified and we work with known market information and information from our cedants to determine a percentage of the exposure to be taken as the ultimate loss.
|
In addition to these methodologies, our actuaries may use other approaches depending upon the characteristics of the class of business and available data.
In general terms, the IELR method is most appropriate for classes of business and/or accident years where the actual paid or reported loss experience is not yet mature enough to modify our initial expectations of the ultimate loss ratios. Typical examples would be recent accident years for classes of business in casualty reinsurance. The BF method is generally appropriate where there are few reported claims and a relatively less stable pattern of reported losses. Typical examples would be our treaty risk excess class of business in our reinsurance segment and marine hull class of business in our insurance segment. The Chain Ladder method is appropriate when there are relatively stable patterns of loss emergence and a relatively large number of reported claims. Typical examples are the U.K. commercial property and U.K. commercial liability classes of business in our international insurance business.
Reserving Procedures and Process.
Our actuaries calculate the IELR, BF and Chain Ladder and, if appropriate, other methods for each class of business and each accident year. They then calculate a single point actuarial mean best estimate (“ultimate”) for each class of business and provide a stochastic distribution around the mean for each line of business. The actuarial methodologies involve significant subjective judgments reflecting many factors, including but not limited to, changes in legislative conditions, changes in judicial interpretation of legal liability policy coverages and inflation. Our actuaries collaborate with our underwriting, claims, legal and finance teams in identifying factors which are incorporated in their range of ultimates in which management’s best estimate is most likely to fall. The actuarial stochastic distribution is designed to provide management with a range from which it is reasonable to select a single management best estimate for inclusion in our financial statements.
There are no differences between our year-end and our quarterly internal reserving procedures and processes because our actuaries perform the basic projections and analyses described above for each class of business quarterly.
Selection of Reported Gross Reserves.
Management, through its Reserve Committees, reviews the actuarial stochastic distribution and any other evidence before selecting its management best estimate of reserves for each line of business. Management selects the “management best estimate” by considering all the information provided to them and the risks and uncertainties associated with the actuarial mean best estimate. Management has to date selected its best estimate above that of the actuarial mean best estimate and within the range of the actuarial stochastic distribution. The management mean best estimate provides the basis for management’s recommendation to the Audit Committee and the Board regarding the reserve amounts and related disclosures to be recorded in our financial statements.
86
There are three Reserve Committees, one for each of the insurance and reinsurance segments and a “core” committee that makes final reserving recommendations. The “core” Reserve Committee currently consists of the Group Chief Risk Officer (the chair), the Group Chief Financial Officer, the Group Head of Capital Management, the Group Chief Accounting Officer, the President and Chief Underwriting Officer of Aspen Re, the President and Chief Underwriting Officer of Aspen Insurance and the Executive Vice President of Global Business Performance and Strategy of Aspen Insurance. Senior members of the insurance and reinsurance segment underwriting and claims staff comprise the remaining members of each of the insurance and reinsurance reserve committees, respectively.
Each class of business is reviewed in detail by management through its Reserve Committee at least once a year. The timing of such reviews varies throughout the year. Additionally, we review the emergence of actual losses relative to expectations every fiscal quarter for all classes of business. If warranted from this analysis, we may accelerate the timing of our detailed actuarial reviews.
Uncertainties.
While the management selected reserves make a reasonable provision for unpaid loss and loss adjustment expense obligations, we note that the process of estimating required reserves, by its very nature, involves uncertainty and therefore the ultimate claims may fall outside the actuarial range. The level of uncertainty can be influenced by such factors as the existence of coverage with long duration reporting patterns and changes in claims handling practices, as well as the other factors described above.
Given many of the coverages underwritten involve claims that may not be ultimately settled for many years after they are incurred, subjective judgments as to the ultimate exposure to losses are an integral and necessary component of the loss reserving process. We review our reserves regularly, using a variety of statistical and actuarial techniques to analyze current claims costs, frequency and severity data, and prevailing economic, social and legal factors. Reserves established in prior periods are adjusted as claims experience develops and new information becomes available.
Estimates of IBNR are generally subject to a greater degree of uncertainty than estimates of the cost of settling claims already notified to us, where more information about the claim event is generally available. IBNR claims often may not be apparent to the insured until many years after the event giving rise to the claims has happened. Classes of business where the IBNR proportion of the total reserve is high, such as casualty insurance, will typically display greater variations between initial estimates and final outcomes because of the greater degree of difficulty of estimating these reserves.
Classes of business where claims are typically reported relatively quickly after the claim event tend to display lower levels of volatility between initial estimates and final outcomes. Reinsurance claims are subject to a longer time lag both in their reporting and in their time to final settlement. The time lag is a factor which is included in the projections to ultimate claims within the actuarial analyses and helps to explain why in general a higher proportion of the initial reinsurance reserves are represented by IBNR than for insurance reserves for business in the same class. Delays in receiving information from cedants are an expected part of normal business operations and are included within the statistical estimate of IBNR to the extent that current levels of backlog are consistent with historical data. Currently, there are no processing backlogs which would materially affect our financial statements.
Allowance is made, however, for changes or uncertainties which may create distortions in the underlying statistics or which might cause the cost of unsettled claims to increase or reduce when compared with the cost of previously settled claims, including:
|
•
|
changes in our processes which might accelerate or slow down the development and/or recording of paid or incurred claims;
|
|
•
|
changes in the legal environment (including challenges to tort reform);
|
|
•
|
the effects of inflation;
|
|
•
|
changes in the mix of business;
|
|
•
|
the impact of large losses; and
|
|
•
|
changes in our cedants’ reserving methodologies.
|
These factors are incorporated in the recommended reserve range from which management selects its best point estimate. We take all reasonable steps to ensure that we utilize all appropriate information and actuarial techniques in establishing our IBNR reserves. However, given the uncertainty in establishing claims liabilities, it is likely that the final outcome will prove to be different from the original provision established at the balance sheet date. Changes to our previous estimates of prior period loss reserves impact the reported calendar year underwriting results by worsening our reported results if the prior year reserves prove to be deficient or improving our reported results if the prior year reserves prove to be redundant. As at
December 31, 2018
, a 5% change in the gross reserve for IBNR losses would have equated to a change of approximately
$198.5 million
in loss reserves which would
87
represent
126.2%
of loss before income tax for the
twelve months ended
December 31, 2018
. As at
December 31, 2017
, a 5% change in the gross reserve for IBNR losses would have equated to a change of approximately
$186.0 million
in loss reserves which would represent
66.0%
of income before income tax for the
twelve months ended
December 31, 2017
. A 5% change in our net loss reserves equates to
$249.8 million
and represents
5.0%
of shareholders’ equity as at
December 31, 2018
.
There are specific areas of our selected reserves which have additional uncertainty associated with them. Refer to Part I, Item 1A, “Risk Factors —Insurance Risks — Our financial condition and operating results may be adversely affected if actual claims exceed our loss reserves” for a discussion of the specific areas of our selected reserves which have additional uncertainty. In each case, management believes they have selected an appropriate best estimate based on current information and current analyses.
Loss Reserving Sensitivity Analysis.
The most significant key assumptions identified in the reserving process are that (i) the historic loss development and trend experience is assumed to be indicative of future loss development and trends, (ii) the information developed from internal and independent external sources can be used to develop meaningful estimates of the initial expected ultimate loss ratios, and (iii) no significant losses or types of losses will emerge that are not represented in either the initial expected loss ratios or the historical development patterns.
We believe that there is potentially significant risk in estimating loss reserves for long-tail lines of business and for immature accident years that may not be adequately captured through traditional actuarial projection methodologies. As discussed above, these methodologies usually rely heavily on projections of prior year trends into the future. In selecting our best estimate of future liabilities, we consider both the results of actuarial point estimates of loss reserves in addition to the stochastic distribution of reserves. In determining the appropriate best estimate, we review (i) the position of overall reserves within the actuarial distribution, (ii) the result of bottom up analysis by accident year reflecting the impact of parameter uncertainty in actuarial calculations, and (iii) specific qualitative information on events that may have an effect on future claims but which may not have been adequately reflected in actuarial best estimates, such as the potential for outstanding litigation or claims practices of cedants to have an adverse impact.
Effect if Actual Results Differ From Assumptions.
Given the risks and uncertainties associated with the process for estimating reserves for losses and loss expenses, management has performed an evaluation of the potential variability in loss reserves and the impact this variability may have on reported results, financial condition and liquidity. Because of the inherent uncertainties discussed above, we have developed a reserving philosophy which attempts to incorporate prudent assumptions and estimates, and we have generally experienced favorable net development on prior year reserves in the last several years. However, there is no assurance that this will occur in future periods.
Management’s best estimate of the net reserve for losses and loss expenses as at
December 31, 2018
was
$4,996.6 million
. The following tables show the effect on estimated net reserves for losses and loss expenses as at
December 31, 2018
of a change in two of the most critical assumptions in establishing reserves: (i) loss emergence patterns, accelerated or decelerated by three and six months; and (ii) expected loss ratios varied by plus or minus five and ten percent. Management believes that these scenarios present a reasonable range of variability around the booked reserves using standard actuarial techniques. Loss reserves may vary beyond these scenarios in periods of heightened or reduced claim activity. The reserves resulting from the changes in the assumptions are not additive and should be considered separately. The following tables vary the assumptions employed therein independently. In addition, the tables below do not adjust any parameters other than the ones described above.
88
Net reserve for losses and loss expenses as at
December 31, 2018
— Sensitivity to loss emergence patterns
|
Change in assumption
|
Reserve for losses and loss expenses
|
||||
|
($ in millions)
|
|||||
|
Six month acceleration
|
$
|
4,803.4
|
|
||
|
Three month acceleration
|
$
|
4,883.6
|
|
||
|
No change (selected)
|
4,996.6
|
|
|||
|
Three month deceleration
|
$
|
5,089.8
|
|
||
|
Six month deceleration
|
$
|
5,292.7
|
|
||
Net reserve for losses and loss expenses as at
December 31, 2018
— Sensitivity to expected loss ratios
|
Change in assumption
|
Reserve for losses and loss expenses
|
||||
|
($ in millions)
|
|||||
|
10% favorable
|
$
|
4,701.0
|
|
||
|
5% favorable
|
$
|
4,848.8
|
|
||
|
No change (selected)
|
4,996.6
|
|
|||
|
5% unfavorable
|
$
|
5,146.3
|
|
||
|
10% unfavorable
|
$
|
5,288.0
|
|
||
The most significant variance in the above scenarios (i.e., a six month deceleration of loss emergence patterns) would have the effect of increasing losses and loss expenses by
$296.1 million
.
Management believes that the reserve for losses and loss expenses are sufficient to cover expected claims incurred before the reporting date on the basis of the methodologies and judgments used to support its estimates. However, there can be no assurance that actual payments will not vary significantly from total reserves. The reserve for losses and loss expenses and the methodology of estimating such reserve are regularly reviewed and updated as new information becomes known. Any resulting adjustments are reflected in income in the period in which they become known.
89
Results of Operations
Our consolidated financial statements are prepared in accordance with U.S. GAAP. The discussions that follow include tables and discussions relating to our consolidated income statement and our segmental operating results for the
twelve months ended
December 31, 2018
,
2017
and
2016
.
Consolidated Income Statement
|
|
Twelve Months Ended
|
|||||||||||
|
|
December 31, 2018
|
December 31, 2017
|
December 31, 2016
|
|||||||||
|
|
($ in millions, except for percentages)
|
|||||||||||
|
Revenues
|
|
|
||||||||||
|
Gross written premiums
|
$
|
3,446.9
|
|
$
|
3,360.9
|
|
$
|
3,147.0
|
|
|||
|
Net premiums written
|
2,082.0
|
|
2,212.5
|
|
2,593.7
|
|
||||||
|
Gross premiums earned
|
3,534.4
|
|
3,209.2
|
|
3,086.3
|
|
||||||
|
Net premiums earned
|
2,214.7
|
|
2,306.6
|
|
2,637.3
|
|
||||||
|
Net investment income
|
198.2
|
|
189.0
|
|
187.1
|
|
||||||
|
Realized and unrealized investment gains
|
110.0
|
|
148.9
|
|
108.4
|
|
||||||
|
Other income
|
9.0
|
|
8.9
|
|
5.7
|
|
||||||
|
Total Revenues
|
2,531.9
|
|
2,653.4
|
|
2,938.5
|
|
||||||
|
Expenses
|
|
|
|
|
|
|
||||||
|
Insurance losses and loss adjustment expenses
|
1,573.0
|
|
1,994.7
|
|
1,576.1
|
|
||||||
|
Amortization of deferred policy acquisition costs
|
371.6
|
|
400.5
|
|
528.9
|
|
||||||
|
General, administrative and corporate expenses
|
491.7
|
|
502.2
|
|
490.1
|
|
||||||
|
Interest on long-term debt
|
25.9
|
|
29.5
|
|
29.5
|
|
||||||
|
Change in fair value of derivatives
|
31.8
|
|
(27.7
|
)
|
24.6
|
|
||||||
|
Change in fair value of loan notes issued by variable interest entities
|
4.4
|
|
(21.2
|
)
|
17.1
|
|
||||||
|
Realized and unrealized investment losses
|
174.7
|
|
28.4
|
|
63.2
|
|
||||||
|
Realized loss on the debt extinguishment
|
8.6
|
|
—
|
|
—
|
|
||||||
|
Net realized and unrealized exchange losses/(gains)
|
3.5
|
|
23.9
|
|
(1.8
|
)
|
||||||
|
Other expense
|
2.7
|
|
4.9
|
|
1.3
|
|
||||||
|
Total Expenses
|
2,687.9
|
|
2,935.2
|
|
2,729.0
|
|
||||||
|
(Loss) income from operations before income tax
|
(156.0
|
)
|
(281.8
|
)
|
209.5
|
|
||||||
|
Income tax benefit (expense)
|
10.2
|
|
15.4
|
|
(6.1
|
)
|
||||||
|
Net (Loss) Income
|
$
|
(145.8
|
)
|
$
|
(266.4
|
)
|
$
|
203.4
|
|
|||
|
Ratios
|
|
|
|
|
|
|
||||||
|
Loss ratio
|
71.0
|
%
|
86.5
|
%
|
59.8
|
%
|
||||||
|
Expense ratio
|
39.0
|
%
|
39.2
|
%
|
38.7
|
%
|
||||||
|
Combined ratio
|
110.0
|
%
|
125.7
|
%
|
98.5
|
%
|
||||||
90
Gross written premiums.
The following table analyzes the overall change in gross written premiums for our two business segments in the
twelve months ended
December 31, 2018
,
2017
and
2016
:
|
|
Gross Written Premiums for the Twelve Months Ended December 31,
|
|||||||||||||||||
|
Business Segment
|
2018
|
2017
|
2016
|
|||||||||||||||
|
|
($ in millions)
|
% change
|
($ in millions)
|
% change
|
(in millions)
|
|||||||||||||
|
Reinsurance
(1)
|
$
|
1,495.7
|
|
(3.4
|
)%
|
$
|
1,548.5
|
|
9.6
|
%
|
$
|
1,413.2
|
|
|||||
|
Insurance
|
1,951.2
|
|
7.7
|
%
|
1,812.4
|
|
4.5
|
%
|
1,733.8
|
|
||||||||
|
Total
|
$
|
3,446.9
|
|
2.6
|
%
|
$
|
3,360.9
|
|
6.8
|
%
|
$
|
3,147.0
|
|
|||||
____________________
|
(1)
|
Includes gross written premium of
$259.7 million
related to CGB DS and
$33.1 million
related to AgriLogic (
2017
—
$269.7 million
,
2016
—
$178.9 million
related to AgriLogic).
|
Overall gross written premiums
increased
by
2.6%
in
2018
compared to
2017
. Gross written premiums in our reinsurance segment
decrease
d by
3.4%
in
2018
compared to
2017
due to reductions in premiums written in property catastrophe reinsurance, other property reinsurance and specialty reinsurance, partially offset by a modest increase in premiums written in casualty reinsurance. Gross written premiums in our insurance segment
increase
d by
7.7%
due to growth in property and casualty insurance, and financial and professional lines insurance, partially offset by reductions in marine, aviation and energy insurance where we have exited certain lines of business and continue to experience challenging market conditions.
Overall gross written premiums in
2017
increased
by
6.8%
compared to
2016
. Gross written premiums in our reinsurance segment increased by
9.6%
in
2017
compared to
2016
due to growth in agriculture insurance business written within specialty reinsurance and
$32.3 million
of reinstatement premiums associated with catastrophe losses. Gross written premiums in our insurance segment increased by
4.5%
in
2017
compared to
2016
due to growth in financial and professional lines insurance partially offset by reductions in marine, aviation and energy insurance and property and casualty insurance.
Ceded written premiums.
The following table analyzes the overall change in ceded written premiums for our two business segments in the
twelve months ended
December 31, 2018
,
2017
and
2016
:
|
|
Ceded Written Premiums for the Twelve Months Ended December 31,
|
|||||||||||||||||
|
Business Segment
|
2018
|
2017
|
2016
|
|||||||||||||||
|
|
($ in millions)
|
% change
|
($ in millions)
|
% change
|
(in millions)
|
|||||||||||||
|
Reinsurance
|
$
|
312.8
|
|
4.8
|
%
|
$
|
298.5
|
|
107.3
|
%
|
$
|
144.0
|
|
|||||
|
Insurance
|
1,052.1
|
|
23.8
|
%
|
849.9
|
|
107.6
|
%
|
409.3
|
|
||||||||
|
Total
|
$
|
1,364.9
|
|
18.9
|
%
|
$
|
1,148.4
|
|
107.6
|
%
|
$
|
553.3
|
|
|||||
Total ceded written premiums in
2018
increase
d by
$216.5 million
compared to
2017
. The changes in our reinsurance program reduced our retention ratio, which is defined as net written premiums as a percentage of gross written premiums, from
65.8%
in
2017
to
60.4%
in
2018
. Ceded reinsurance premiums increased for our insurance segment primarily due to an increase in the proportion of business ceded to our casualty, financial institutions and property quota share programs. Ceded reinsurance premiums increased for our reinsurance segment due to increased ceded reinsurance for our property catastrophe business lines where business previously ceded to Silverton, a consolidated entity, is now ceded to Peregrine, a non-consolidated entity. Ceded reinsurance premiums for our reinsurance segment also increased as a result of the transitional arrangements following the sale of AgriLogic in December 2017.
Total ceded written premiums in
2017
increased by
$595.1 million
compared to
2016
, resulting in a decrease in our retention ratio from
82.4%
in
2016
to
65.8%
in
2017
. Ceded written premiums increased in both business segments in part due to the purchase of a whole account quota share contract. Ceded reinsurance premiums increased for our insurance segment due to the restructure of our ceded reinsurance arrangements though the use of significant quota share reinsurance arrangements and the recognition of ceded premiums to reinstate cover following catastrophe and other large losses. Ceded reinsurance premiums increased for our reinsurance segment due to increased reinsurance for our property catastrophe and other property business lines due to new business opportunities which were written in conjunction with an increase in retrocession, an increase in ceded reinsurance premiums as a result of the transitional arrangements following the sale of AgriLogic in December 2017 and the recognition of additional ceded premiums as a result of reinstating cover following catastrophe losses.
91
Net premiums earned.
The following table analyzes the overall change in net premiums earned for our two business segments in the
twelve months ended
December 31, 2018
,
2017
and
2016
:
|
|
Net Premiums Earned for the Twelve Months Ended December 31,
|
|||||||||||||||||
|
Business Segment
|
2018
|
2017
|
2016
|
|||||||||||||||
|
|
($ in millions)
|
% change
|
($ in millions)
|
% change
|
(in millions)
|
|||||||||||||
|
Reinsurance
(1)
|
$
|
1,256.4
|
|
4.2
|
%
|
$
|
1,206.1
|
|
2.0
|
%
|
$
|
1,181.9
|
|
|||||
|
Insurance
|
958.3
|
|
(12.9
|
)%
|
1,100.5
|
|
(24.4
|
)%
|
1,455.4
|
|
||||||||
|
Total
|
$
|
2,214.7
|
|
(4.0
|
)%
|
$
|
2,306.6
|
|
(12.5
|
)%
|
$
|
2,637.3
|
|
|||||
____________________
|
(1)
|
Includes net earned premium of
$243.6 million
related to CGB DS and
$2.8 million
related to AgriLogic (
2017
—
$198.8 million
,
2016
—
$114.5 million
related to AgriLogic).
|
Net premiums earned
decreased
by
$91.9 million
, or
4.0%
, in
2018
compared to
2017
due to a
$417.1 million
increase in ceded earned premiums partially offset by a
$325.2 million
increase
in gross earned premiums. Net premiums earned decreased by
$330.7 million
, or
12.5%
, in
2017
compared to
2016
due to a
$453.6 million
increase
in ceded earned premiums partially offset by a
$122.9 million
increase
in gross earned premiums.
L
osses and loss adjustment expenses.
The loss ratio for
2018
of
71.0%
improved
by
15.5
percentage points compared to
2017
and losses and loss adjustment expenses decreased from
$1,994.7 million
in
2017
to
$1,573.0 million
in
2018
. The improvement in the loss ratio was largely due to a
$301.3 million
decrease
in catastrophe losses and a
$38.7 million
decrease
in large losses which offset the impact from a
$91.9 million
decrease in net earned premiums. Net losses from catastrophes decreased from
$576.0 million
in
2017
to
$274.7 million
in
2018
. Large losses in
2018
included
$39.7 million
of fire-related losses,
$19.6 million
credit and surety losses, and
$9.9 million
in relation to a dam construction.
The loss ratio for
2017
of
86.5%
increased by
26.7
percentage points compared to
2016
and losses and loss adjustment expenses increased from
$1,576.1 million
in
2016
to
$1,994.7 million
in
2017
. The increase in the loss ratio was largely due to a
$409.6 million
increase in catastrophe losses, a
$59.7 million
increase
in large losses, a
$23.9 million
decrease
in prior year losses and a
$330.7 million
decrease in net earned premiums. Net losses from catastrophes increased from
$166.4 million
in
2016
to
$576.0 million
in
2017
. Large losses in
2017
i
ncluded
$64.0 million
of fire-related losses, a
$12.6 million
surety loss, an
$11.1 million
loss related to cyber and terrorism and a
$4.8 million
loss from a refinery explosion.
In the reinsurance segment, the loss ratio for
2018
was
73.8%
compared to
92.6%
in
2017
largely due to a
$245.1 million
decrease in catastrophe losses which offset the impact from a
$24.3 million
increase
in large losses and a
$13.4 million
decrease
in reserve releases. In
2018
, there were
$222.2 million
of catastrophe losses, net of reinsurance recoveries, associated with Hurricanes Florence and Michael in the U.S., Typhoon Jebi in Japan, Winter Storm Friederike in Europe, wildfires in California, U.K. winter storms and other U.S. and Asian weather-related events. In
2017
, we experienced
$467.3 million
of catastrophe losses, net of reinsurance recoveries, associated with Hurricanes Harvey, Irma and Maria, wildfires in California, earthquakes in Mexico and other weather-related events in the U.S. and Australia.
In the insurance segment, the loss ratio for
2018
was
67.4%
compared to
79.8%
in
2017
largely due to a
$56.2 million
decrease
in catastrophe losses, a
$47.6 million
decrease
in large losses and a
$19.1 million
increase
in reserve releases which more than offset the impact from a
$142.2 million
decrease in net earned premiums. In
2018
, there were
$52.5 million
of catastrophe losses associated with Hurricanes Florence and Michael, wildfires in California, U.K. winter storms and other U.S. and Asian weather-related events. The loss ratio for
2017
was
79.8%
compared to
63.1%
for
2016
mainly due to a
$57.1 million
increase in catastrophe losses, a
$34.4 million
increase in large losses, an
$18.7 million
decrease
in reserve releases and a
$354.9 million
decrease in net earned premiums. In
2017
, our insurance segment experienced
$108.7 million
of catastrophe losses associated with Hurricanes Harvey, Irma and Maria, wildfires in California and U.S. weather-related events.
Overall, prior year reserve releases in
2018
increased by
$5.7 million
from
$105.4 million
in
2017
to
$111.1 million
. Reserve releases in the reinsurance segment in
2018
were
$68.4 million
compared to
$81.8 million
in
2017
and came from property catastrophe reinsurance, other property reinsurance and specialty reinsurance lines. Reserve releases in the insurance segment in
2018
were
$42.7 million
compared to
$23.6 million
in
2017
and came from property and casualty, and marine, aviation and energy lines.
Overall, prior year reserve releases in
2017
decrease
d by
$23.9 million
from
$129.3 million
in
2016
to
$105.4 million
. Reserve releases in the reinsurance segment in
2017
were across all business lines, totaling
$81.8 million
. Reserve releases in the insurance segment in 2017 were
$23.6 million
compared to
$42.3 million
in 2016 and came principally from marine, energy and aviation insurance.
92
We have presented loss ratios both including and excluding the impact from catastrophe losses to aid in the analysis of the underlying performance of the business segments. We have defined major
2018
catastrophe losses as losses associated with Hurricanes Florence and Michael, Typhoon Jebi in Japan, Winter Storm Friederike in Europe, wildfires in California, U.K. winter storms and other U.S. and Asian weather-related events. We have defined major
2017
catastrophe losses as losses associated with Hurricanes Harvey, Irma and Maria, the earthquakes in Mexico, a tornado in Mississippi, Cyclone Debbie in Australia, wildfires in California and other U.S. weather-related events. We have defined major
2016
catastrophe losses as losses associated with wildfires in North America, Hurricane Matthew and other weather-related events in the U.S., several earthquakes and a hailstorm in the Netherlands.
The underlying changes in loss ratios by business segment for the twelve months ended
December 31, 2018
,
2017
and
2016
are shown in the tables below. The total loss ratio represents the calendar year U.S. GAAP loss ratio. The current year adjustments represent catastrophe loss events incurred in those years which reflect net claims and reinstatement premium adjustments.
|
For the Twelve Months Ended December 31, 2018
|
Total Loss
Ratio
|
Current Year
Adjustments
|
Loss
Ratio Excluding
Current Year
Adjustments
|
||||||
|
Reinsurance
|
73.8
|
%
|
(17.1
|
)%
|
56.7
|
%
|
|||
|
Insurance
|
67.4
|
%
|
(5.5
|
)%
|
61.9
|
%
|
|||
|
Total
|
71.0
|
%
|
(12.1
|
)%
|
58.9
|
%
|
|||
|
For the Twelve Months Ended December 31, 2017
|
Total Loss
Ratio
|
Current Year
Adjustments
|
Loss
Ratio Excluding
Current Year
Adjustments
|
||||||
|
Reinsurance
|
92.6
|
%
|
(37.7
|
)%
|
54.9
|
%
|
|||
|
Insurance
|
79.8
|
%
|
(10.4
|
)%
|
69.4
|
%
|
|||
|
Total
|
86.5
|
%
|
(24.6
|
)%
|
61.9
|
%
|
|||
|
For the Twelve Months Ended December 31, 2016
|
Total Loss
Ratio
|
Current Year
Adjustments
|
Loss
Ratio Excluding
Current Year
Adjustments
|
||||||
|
Reinsurance
|
55.7
|
%
|
(9.7
|
)%
|
46.0
|
%
|
|||
|
Insurance
|
63.1
|
%
|
(3.5
|
)%
|
59.6
|
%
|
|||
|
Total
|
59.8
|
%
|
(6.3
|
)%
|
53.5
|
%
|
|||
Expenses
. We monitor the ratio of expenses to gross earned premium (the “gross expense ratio”) as a measure of the cost effectiveness of our amortization of deferred policy acquisition costs, general, administrative and corporate expenses. The tables below present the contribution of the amortization of deferred policy acquisition costs and general, administrative and corporate expenses to the gross expense ratios and the total net expense ratios for the
twelve months ended
December 31, 2018
,
2017
and
2016
. We also present the effect of reinsurance purchased which impacts the reported net expense ratio by expressing the expenses as a proportion of net earned premiums.
|
For the Twelve Months Ended December 31, 2018
|
|||||||||
|
Ratios Based on Gross Earned Premium
|
Reinsurance
|
Insurance
|
Total
|
||||||
|
Gross policy acquisition expense ratio
|
19.1
|
%
|
19.1
|
%
|
19.1
|
%
|
|||
|
Effect of ceded reinsurance
|
1.7
|
%
|
(7.5
|
)%
|
(2.3
|
)%
|
|||
|
Net policy acquisition expense ratio
|
20.8
|
%
|
11.6
|
%
|
16.8
|
%
|
|||
|
Gross general, administrative and corporate expense ratio
(1)
|
7.4
|
%
|
12.3
|
%
|
13.9
|
%
|
|||
|
Effect of ceded reinsurance premiums
|
2.0
|
%
|
12.7
|
%
|
8.3
|
%
|
|||
|
Net general and administrative expense ratio
|
9.4
|
%
|
25.0
|
%
|
22.2
|
%
|
|||
|
Total net expense ratio
|
30.2
|
%
|
36.6
|
%
|
39.0
|
%
|
|||
93
|
For the Twelve Months Ended December 31, 2017
|
|||||||||
|
Ratios Based on Gross Earned Premium
|
Reinsurance
|
Insurance
|
Total
|
||||||
|
Gross policy acquisition expense ratio
|
18.6
|
%
|
18.5
|
%
|
18.6
|
%
|
|||
|
Effect of ceded reinsurance
|
0.9
|
%
|
(3.5
|
)%
|
(1.2
|
)%
|
|||
|
Net policy acquisition expense ratio
|
19.5
|
%
|
15.0
|
%
|
17.4
|
%
|
|||
|
Gross general, administrative and corporate expense ratio
(1)
|
10.8
|
%
|
14.4
|
%
|
15.6
|
%
|
|||
|
Effect of ceded reinsurance premiums
|
2.2
|
%
|
8.7
|
%
|
6.2
|
%
|
|||
|
Net general, administrative and corporate expense ratio
|
13.0
|
%
|
23.1
|
%
|
21.8
|
%
|
|||
|
Total net expense ratio
|
32.5
|
%
|
38.1
|
%
|
39.2
|
%
|
|||
|
For the Twelve Months Ended December 31, 2016
|
|||||||||
|
Ratios Based on Gross Earned Premium
|
Reinsurance
|
Insurance
|
Total
|
||||||
|
Gross policy acquisition expense ratio
|
18.3
|
%
|
19.3
|
%
|
18.9
|
%
|
|||
|
Effect of ceded reinsurance
|
0.9
|
%
|
1.5
|
%
|
1.2
|
%
|
|||
|
Net policy acquisition expense ratio
|
19.2
|
%
|
20.8
|
%
|
20.1
|
%
|
|||
|
Gross general, administrative and corporate expense ratio
(1)
|
13.5
|
%
|
12.9
|
%
|
15.9
|
%
|
|||
|
Effect of ceded reinsurance premiums
|
1.6
|
%
|
2.8
|
%
|
2.7
|
%
|
|||
|
Net general, administrative and corporate expense ratio
|
15.1
|
%
|
15.7
|
%
|
18.6
|
%
|
|||
|
Total net expense ratio
|
34.3
|
%
|
36.5
|
%
|
38.7
|
%
|
|||
____________________
(1)
The total group general and administrative expense ratio includes corporate and non-operating expenses. Comparative ratios have been re-presented to include corporate and non-operating expenses.
Net policy acquisition expenses decreased by
$28.9 million
in
2018
compared to
2017
primarily due to an increase in over-rider commissions associated with the increase in ceded reinsurance. Policy acquisition expenses decreased by
$128.4 million
in
2017
compared to
2016
despite the increase in gross policy acquisition expenses as it was offset by an increase in over-rider commissions associated with the increase in ceded reinsurance.
The increase in the gross policy acquisition expense ratio from
18.6%
in
2017
to
19.1%
in
2018
was due to a change in the mix of business written in the insurance segment and an increase of commission expense for crop business in the reinsurance segment following the sale of AgriLogic.
The slight reduction in the gross policy acquisition expense ratio from
18.9%
in
2016
to
18.6%
in
2017
was due to a decrease in profit commission accruals in the insurance segment partially offset by an increase in the acquisition ratio in the reinsurance segment due to an increase in profit commission accruals and the prior year benefiting from Federal Excise Tax (“FET”) refunds.
General, administrative and corporate expenses
decreased
by
$10.5 million
from
$502.2 million
in
2017
to
$491.7 million
in
2018
. The net general, administrative and corporate expense ratio in 2018
decreased
by
1.7
percentage points compared to the prior period due to reductions in administration costs in the reinsurance segment following the sale of AgriLogic and a reduction in operating expenses in the insurance segment offset by a
$44.5 million
increase in other non-operating costs. Non-operating costs in 2018 include the recognition of
$39.0 million
of advisor fees related to the Merger,
$37.5 million
of costs associated with the Effectiveness and Efficiency Program and
$11.3 million
of retention costs, partially offset by the write back of a
$14.1 million
buy out provision which was no longer exercisable.
General, administrative and corporate expenses
increased
by
$12.1 million
from
$490.1 million
in
2016
to
$502.2 million
in
2017
due to
$15.2 million
of costs associated with the Effectiveness and Efficiency Program, and increased costs associated with growth in our insurance business, partially offset by lower provisions for performance-related remuneration.
94
Investment gains.
Total net realized and unrealized investment
losses
for
the twelve months
ended
December 31, 2018
were
$64.7 million
(
2017
—
losses
of
$120.5 million
;
2016
—
losses
of
$45.2 million
).
Net investment income
. In
2018
, we generated net investment income of
$198.2 million
, an
increase
of
4.9%
from the prior year (
2017
—
$189.0 million
,
2016
—
$187.1 million
) primarily due to an increase in the book yield of the fixed income portfolio. The increase in investment income in
2017
compared with
2016
was also primarily due to the increase in the book yield of the fixed income portfolio despite a reduction in dividend income following the sale of a portion of our equity portfolio in the third quarter of
2017
.
Foreign exchange contracts.
We use foreign exchange contracts to manage foreign currency risk. A foreign exchange contract involves an obligation to purchase or sell a specified currency at a future date at a price set at the time of the contract. Foreign exchange contracts will not eliminate fluctuations in the value of our assets and liabilities denominated in foreign currencies, but rather allow us to establish a rate of exchange for a future point in time.
As at
December 31, 2018
, we held foreign exchange contracts that were not designated as hedging under ASC 815 - “
Derivatives and Hedging”
with a notional amount of
$1,257.3 million
(
2017
—
$751.6 million
). The foreign exchange contracts are recorded as derivatives at fair value in the balance sheet with changes recorded as a change in fair value of derivatives in the statement of operations. For the
twelve months ended
December 31, 2018
, the impact of foreign exchange contracts on net income was a
loss
of
$31.8 million
(
December 31, 2017
—
gain
of
$27.7 million
).
As at
December 31, 2018
, we held foreign exchange contracts that were designated as hedging under ASC 815 with a notional amount of
$94.3 million
(
2017
—
$60.6 million
). The foreign exchange contracts are recorded as derivatives at fair value with the effective portion recorded in other comprehensive income and the ineffective portion recorded as a change in fair value of derivatives in the statement of operations. The contracts are considered to be effective and therefore the movement in other comprehensive income representing the effective portion was a
loss
of
$2.1 million
for the
twelve months ended
December 31, 2018
(
December 31, 2017
—
gain
of
$3.0 million
).
As the foreign exchange contracts settle, the realized gain or loss is reclassified from other comprehensive income into general, administration and corporate expenses of the statement of operations and other comprehensive income. For the
twelve months ended
December 31, 2018
, the amount recognized within general, administration and corporate expenses for settled foreign exchange contracts was a realized
loss
of
$1.2 million
(
December 31, 2017
—
gain
of
$4.4 million
recognized within general, administration and corporate expenses).
Interest on long-term debt.
Interest on long-term debt of
$25.9 million
is the interest due on the 2020 Senior Notes and 2023 Senior Notes. The reduction in the interest charge in the
twelve months ended
December 31, 2018
was due to the redemption, on June 18, 2018, of
$125.0 million
of our 6.00% Senior Notes due 2020.
Income before tax.
In
the twelve months ended
December 31,
2018
, loss before tax was
$156.0 million
(
2017
—loss of
$281.8 million
;
2016
— income of
$209.5 million
), consisting of the amounts set out in the table below:
|
For the Twelve Months Ended
|
||||||||||||
|
December 31, 2018
|
December 31, 2017
|
December 31, 2016
|
||||||||||
|
|
($ in millions)
|
|||||||||||
|
Underwriting (loss) income
|
$
|
(87.6
|
)
|
$
|
(499.8
|
)
|
$
|
125.7
|
|
|||
|
Corporate expenses
|
(56.8
|
)
|
(58.3
|
)
|
(73.8
|
)
|
||||||
|
Non-operating expenses
|
(77.2
|
)
|
(32.7
|
)
|
(9.7
|
)
|
||||||
|
Other income (expense)
|
6.3
|
|
4.0
|
|
4.4
|
|
||||||
|
Net investment income
|
198.2
|
|
189.0
|
|
187.1
|
|
||||||
|
Change in fair value of derivatives
|
(31.8
|
)
|
27.7
|
|
(24.6
|
)
|
||||||
|
Change in fair value of loan notes issued by variable interest entities
|
(4.4
|
)
|
21.2
|
|
(17.1
|
)
|
||||||
|
Realized and unrealized investment gains
|
110.0
|
|
148.9
|
|
108.4
|
|
||||||
|
Realized and unrealized investment losses
|
(174.7
|
)
|
(28.4
|
)
|
(63.2
|
)
|
||||||
|
Realized loss on the debt extinguishment
|
(8.6
|
)
|
—
|
|
—
|
|
||||||
|
Net realized and unrealized foreign exchange (losses) gains
|
(3.5
|
)
|
(23.9
|
)
|
1.8
|
|
||||||
|
Interest expense
|
(25.9
|
)
|
(29.5
|
)
|
(29.5
|
)
|
||||||
|
(Loss) income before tax
|
$
|
(156.0
|
)
|
$
|
(281.8
|
)
|
$
|
209.5
|
|
|||
95
The improvement in the underwriting result in
2018
compared to
2017
was due to lower catastrophe losses, a decrease in large losses and a modest increase in reserve releases. The decrease in underwriting income in
2017
compared to
2016
was due to higher catastrophe losses, lower reserve releases, an increase in large losses, an increase in attritional losses in the insurance segment and a reduction in net premiums earned partially offset by a reduction in expenses.
The increase in corporate and non-operating expenses in
2018
compared to
2017
was due to a
$72.4 million
increase in other non-operating costs which includes the recognition of
$39.0 million
of advisor fees related to the Merger,
$37.5 million
of costs associated with implementing the Effectiveness and Efficiency Program and
$11.3 million
of retention costs, partially offset by the write back of a
$14.1 million
buy out provision. The increase in corporate and non-operating expenses in
2017
compared to
2016
was due to
$15.2 million
of costs associated with implementing the Effectiveness and Efficiency Program and higher salary costs due to increased headcount, partially offset by reductions in performance-related remuneration provisions.
Realized and unrealized investment gains.
In
2018
, we recorded a reduction in net gross realized and unrealized gains and losses in the statement of operations of
$64.7 million
(
2017
—
$120.5 million
gains) driven primarily by mark to market losses in our fixed income portfolios. For more details, refer to Note 6 of our consolidated financial statements, “Investments.”
Realized loss on debt extinguishment.
On June 18, 2018, we redeemed
$125.0 million
of our 2020 Senior Notes resulting in a realized loss, or make-whole payment, of
$8.6 million
.
Change in fair value of derivatives.
The change in fair value of derivatives in
2018
was attributable to foreign exchange contracts that had a
loss
of
$31.8 million
compared to a
gain
of
$27.7 million
in
2017
and a loss of
$21.5 million
in
2016
. Interest rate swaps had a realized loss of
$3.1 million
in
2016
. There was no gain or loss from interest rate swaps in
2018
or
2017
because we terminated the swaps on May 6, 2016. Refer to Note 23 of our consolidated financial statements, “Subsequent Events” for information on the interest rate swap we executed in January 2019.
The
$4.4 million
change in fair value of loan notes issued by variable interest entities represents the proportion of profit generated by Silverton attributable to third-party investors. The
$21.2 million
reduction in the value of the loan notes in
2017
is due to catastrophe losses assumed by Silverton. The increase in the value in
2016
is due to premiums received by Silverton being greater than the losses assumed.
Income tax expense.
There was an income tax benefit for the
twelve months ended
December 31, 2018
of
$10.2 million
compared to an income tax benefit of
$15.4 million
in
2017
and an income tax expense of
$6.1 million
in
2016
. The effective tax rate (defined as the tax charge or credit, divided by the profit or loss before tax), for the
twelve months ended
December 31, 2018
on our loss before tax was
6.5%
(
2017
—
5.5%
;
2016
—
2.9%
) and is representative of the geographic spread of our business between taxable and non-taxable jurisdictions.
The tax benefit for
2018
included the release of a
$12.8 million
provision we had been holding against the potential disallowance of a prior period adjustment following the successful conclusion of a U.K. tax inquiry. The tax benefit was partially offset by the introduction of U.S. BEAT on premium ceded from U.S. subsidiaries to non-U.S. related parties and withholding tax charges on premium ceded from our Australian branch to related parties. In addition, the tax rate for
2017
benefited from a tax benefit associated with the adoption of ASU 2016-09, “
Compensation - Stock Compensation
” and a tax benefit regarding deductions available for certain research and development expenditure.
The effective tax rate for the year is subject to revision in future periods if circumstances change and depends on the relative profitability of those parts of business underwritten in Bermuda (where the rate of tax on corporate profits is zero), the United Kingdom (where the corporation tax rate is 19% and will be reduced to 17% effective April 1, 2020) and the United States (where the federal income tax rate is 21% effective January 1, 2018).
Net income after tax.
In
2018
, we had a net loss after tax of
$145.8 million
, equivalent to
$2.97
basic loss per ordinary share adjusted for the
$30.5 million
preference share dividends and
$1.0 million
non-controlling interest. In
2017
, we had net loss after tax of
$266.4 million
, equivalent to
$5.22
basic loss per ordinary share adjusted for the
$36.2 million
preference share dividends,
$8.0 million
of preference share redemption costs and
$1.3 million
non-controlling interest. In
2016
, we had net income after tax of
$203.4 million
, equivalent to fully diluted earnings per ordinary share of
$2.61
. For a more detailed description of basic and diluted earnings per ordinary share, see Note 4 of our consolidated financial statements, “Earnings per Ordinary Share.”
96
Underwriting Results by Business Segment
We are organized into two business segments, namely reinsurance and insurance. We have determined our reportable segments, Aspen Insurance and Aspen Re, by taking into account the manner in which management makes operating decisions and assesses
operating performance.
Management measures segment results on the basis of the combined ratio, which is obtained by dividing the sum of the losses and loss expenses, amortization of deferred policy acquisition costs and operating and administrative expenses by net premiums earned. Other than corporate expenses, indirect operating and administrative expenses are allocated to business segments predominantly based on each segment’s proportional share of gross earned premiums.
Non-underwriting disclosures.
We provide additional disclosures for corporate and other (non-underwriting) income and expenses. Corporate and other income and expenses include net investment income, net realized and unrealized investment gains or losses, expenses associated with managing the Aspen Group, certain strategic and non-recurring costs, changes in fair value of derivatives and changes in fair value of loan notes issued by variable interest entities, interest expense, net realized and unrealized foreign exchange gains or losses and income taxes, which are not allocated to the business segments. Corporate expenses are not allocated to our business segments as they typically do not fluctuate with the levels of premiums written and are not directly related to our segment operations.
We do not allocate our assets by business segment as we evaluate underwriting results of each segment separately from the results of our investment portfolio. Segment profit or loss for each of our business segments is measured by underwriting profit or loss. Refer to Note 5 of our consolidated financial statements, “Segment Reporting” for information on gross and net premiums written and earned, underwriting results, and combined ratios and reserves for each of our business segments.
Reinsurance
Our reinsurance segment consists of property catastrophe reinsurance, other property reinsurance, casualty reinsurance and specialty reinsurance. For a more detailed description of this segment, refer to Part I, Item 1, “Business — Business Segments — Reinsurance” and Note 5 of our consolidated financial statements, “Segment Reporting.”
Gross written premiums.
The table below shows our gross written premiums for each line of business in our reinsurance segment for the twelve months ended
December 31, 2018
,
2017
and
2016
and the percentage change in gross written premiums for each line of business:
|
|
For the Twelve Months Ended December 31,
|
|||||||||||||||||
|
Lines of Business
|
2018
|
2017
|
2016
|
|||||||||||||||
|
|
($ in millions)
|
% change
|
($ in millions)
|
% change
|
($ in millions)
|
|||||||||||||
|
Property catastrophe reinsurance
|
$
|
262.8
|
|
(5.9
|
)%
|
$
|
279.3
|
|
2.3
|
%
|
$
|
273.0
|
|
|||||
|
Other property reinsurance
|
346.0
|
|
(1.2
|
)%
|
350.3
|
|
6.7
|
%
|
328.2
|
|
||||||||
|
Casualty reinsurance
|
328.1
|
|
2.9
|
%
|
319.0
|
|
(0.5
|
)%
|
320.6
|
|
||||||||
|
Specialty reinsurance
|
558.8
|
|
(6.9
|
)%
|
599.9
|
|
22.1
|
%
|
491.4
|
|
||||||||
|
Total
|
$
|
1,495.7
|
|
(3.4
|
)%
|
$
|
1,548.5
|
|
9.6
|
%
|
$
|
1,413.2
|
|
|||||
The decrease in gross written premiums in property catastrophe reinsurance was primarily due to the recognition of
$22.2 million
of reinstatement premiums associated with the catastrophe events which occurred in 2017 compared with
$12.6 million
of reinstatement premiums associated with the catastrophe losses that occurred in
2018
. The
decrease
in gross written premiums in other property reinsurance was due to a reduction in risk excess and pro rata premiums. The
increase
in gross written premiums in casualty reinsurance was due to favorable adjustments to prior year premium estimates. The
decrease
in gross written premiums in specialty reinsurance was largely due to reductions in engineering and mortgage business which offset growth in agriculture reinsurance business.
The
9.6%
increase
in gross written premiums for
the twelve months ended
December 31,
2017
compared to the equivalent period in
2016
was primarily due to
$22.2 million
of reinstatement premiums associated with catastrophe losses recognized in 2017 partially offset by premium reductions due to challenging market conditions and downward revisions on premium estimates. The
increase
in gross written premiums in other property reinsurance was largely due to reductions in premium estimates for proportional contracts in the comparative period. Gross written premiums in casualty reinsurance
decrease
d slightly due to reductions in U.S. casualty treaty business lines. The
increase
in gross written premiums in specialty reinsurance was predominantly due to growth in agriculture insurance business, as well as growth in engineering and cyber business lines.
Ceded written premiums.
Total ceded written premiums in
2018
were
$312.8 million
, an
increase
of
$14.3 million
compared to
2017
. The increase in ceded written premiums in property catastrophe reinsurance was due to ceding business to Peregrine, a
97
non-consolidated entity, which business had previously been ceded to Silverton, a consolidated entity. The decrease in ceded written premiums in specialty reinsurance was due to a reduction in retrocession costs for our agriculture business.
Total ceded written premiums in
2017
were
$298.5 million
, an increase of
$154.5 million
compared to
$144.0 million
in
2016
. Ceded written premiums increased across all lines of business due to the purchase of a whole account quota share contract in the first quarter of
2017
. Ceded written premiums increased in property catastrophe reinsurance and other property reinsurance due to new business opportunities which were written in conjunction with an increase in retrocession. Ceded written premiums also increased in property catastrophe reinsurance and other property reinsurance due to the recognition of ceded costs to reinstate cover following catastrophe losses. The increase in ceded written premiums in specialty reinsurance was due to an increase in retrocession costs in connection with a fronting arrangement written as part of the transitional arrangements following the sale of our agriculture business in December 2017.
Net premiums earned.
Net premiums earned increased by
$50.3 million
, or
4.2%
, in
2018
compared to
2017
largely due to increased gross earned premiums from credit and surety business written in our specialty reinsurance business line, partially offset by increased ceded costs. Net premiums earned increased by
$24.2 million
, or
2.0%
, in
2017
compared to
2016
largely due to increased business written in specialty reinsurance and inwards reinstatement premiums associated with catastrophe losses, partially offset by increased ceded costs.
Losses and loss adjustment expenses
. The loss ratio was
73.8%
in
2018
, a decrease of
18.8
percentage points compared to
92.6%
in
2017
. The decrease in the loss ratio was mainly due to a
$245.1 million
decrease
in catastrophe losses which offset a
$24.3 million
increase
in large losses and a
$13.4 million
decrease
in reserve releases. In
2018
, our reinsurance segment experienced
$222.2 million
of catastrophe losses, net of reinsurance recoveries, including
$49.3 million
from Typhoon Jebi,
$15.3 million
from Hurricane Florence,
$2.9 million
from Winter Storm Friederike,
$28.7 million
from Hurricane Michael,
$70.5 million
from the wildfires in California,
$6.4 million
from Typhoon Trami and
$49.1 million
from other U.S. and Asian weather-related events. Large losses experienced during
2018
included
$13.0 million
of credit and surety losses,
$26.7 million
of fire-related losses, and
$9.9 million
in relation to the construction of a dam, compared with
$25.3 million
of fire-related losses in
2017
.
The loss ratio in
2017
increased to
92.6%
compared to
55.7%
in
2016
mainly due to an increase in catastrophe losses of
$352.5 million
and a
$5.2 million
decrease in prior year reserve releases compared to
2016
and
$25.3 million
of large fire related losses, the largest of which was a fire in a chemical plant, compared with no large losses in
2016
. In
2017
, our reinsurance segment experienced
$467.3 million
of catastrophe losses, net of reinsurance recoveries, including
$72.1 million
from Hurricane Harvey,
$119.6 million
from Hurricane Irma,
$57.1 million
from Hurricane Maria,
$16.6 million
from the earthquakes in Mexico,
$7.2 million
from a tornado in Mississippi,
$5.7 million
from Cyclone Debbie in Australia,
$125.8 million
from the wildfires in California and
$32.9 million
from U.S. weather-related events.
The
$13.4 million
reduction
in prior year reserve releases from
$81.8 million
in the twelve months ended
December 31, 2017
to
$68.4 million
in the current period was primarily due to a reduction in reserve releases in our casualty reinsurance and specialty reinsurance business lines. The reserve releases in
2017
included a
$13.1 million
reinsurance recovery in respect of an offshore energy-related loss that occurred in Africa and adverse development of
$12.8 million
in casualty reinsurance due to the U.K. Ministry of Justice decision to increase the discount rate used to calculate lump sum awards in U.K. bodily injury cases, known as the Ogden rate. The
$5.2 million
decrease in prior year reserve releases from
$87.0 million
in the twelve months ended December 31,
2016
compared to
$81.8 million
in
2017
was due predominantly to a decrease in reserve releases from casualty lines. Prior year reserve releases are further discussed below under “Reserves for Losses and Loss Adjustment Expenses.”
Policy acquisition, general and administrative expenses.
Amortization of deferred policy acquisition costs were
$260.9 million
for
the twelve months
ended
December 31, 2018
, equivalent to
20.8%
of net premiums earned (
2017
—
$235.5 million
or
19.5%
of net premiums earned;
2016
—
$226.4 million
or
19.2%
of net premiums earned). The
increase
in the acquisition ratio was due predominantly to the impact on net earned premiums from ceding a greater proportion of written premiums to third parties as well as an increase of commission expense for crop business in the reinsurance segment following the sale of AgriLogic. The
increase
in policy acquisition expense ratio in
2017
compared with
2016
was due to an increase in profit commission accruals and the prior period benefiting from FET refunds.
Our general and administrative expenses
decreased
by
$38.8 million
from
$157.3 million
in
2017
to
$118.5 million
in
2018
. Our general and administrative expense ratio was
9.4%
in
2018
compared to
13.0%
in
2017
due primarily to a reduction in administration costs following the sale of AgriLogic and lower provisions for performance-related remuneration. Our general and administrative expense ratio of
13.0%
in
2017
decreased from
15.1%
in
2016
due to a lower provision for performance-related remuneration.
98
Insurance
Our insurance segment consists of property and casualty insurance, marine, aviation and energy insurance, and financial and professional lines insurance. For a more detailed description of this segment, refer to Part I, Item 1, “Business — Business Segments — Insurance” and Note 5 of our consolidated financial statements, “Segment Reporting.”
Gross written premiums.
The table below shows our gross written premiums for each line of business for the twelve months ended
December 31, 2018
,
2017
and
2016
and the percentage change in gross written premiums for each line:
|
|
For the Twelve Months Ended December 31,
|
|||||||||||||||||
|
Lines of Business
|
2018
|
2017
|
2016
|
|||||||||||||||
|
|
($ in millions)
|
% change
|
($ in millions)
|
% change
|
($ in millions)
|
|||||||||||||
|
Property and casualty insurance
|
$
|
903.9
|
|
5.5
|
%
|
$
|
856.9
|
|
(0.2
|
)%
|
$
|
858.2
|
|
|||||
|
Marine, aviation and energy insurance
|
368.4
|
|
(4.4
|
)%
|
385.3
|
|
(2.8
|
)%
|
396.3
|
|
||||||||
|
Financial and professional lines insurance
|
678.9
|
|
19.1
|
%
|
570.2
|
|
19.0
|
%
|
479.3
|
|
||||||||
|
Total
|
$
|
1,951.2
|
|
7.7
|
%
|
$
|
1,812.4
|
|
4.5
|
%
|
$
|
1,733.8
|
|
|||||
The
increase
in gross written premiums in property and casualty insurance was largely attributable to growth in our U.K. regional and U.S excess casualty business lines. The
decrease
in gross written premiums in marine, aviation and energy insurance was largely attributable to reductions in aviation and Lloyd’s marine hull following the decision to exit these lines in the third quarter of 2018. These reductions were partially offset by growth in U.S. inland marine, marine and energy liability and U.S. ocean marine business lines. The
increase
in gross written premiums in financial and professional lines insurance was largely attributable to growth in U.S. professional lines, management liability, accident and health, and credit and political risk business lines.
The
decrease
in gross written premiums in
2017
compared to
2016
in property and casualty insurance was largely attributable to reductions in primary global casualty and program business as a result of a change in our appetite for this type of business, partially offset by growth in our U.K. regional and excess casualty business lines. The
decrease
in gross written premiums in marine, aviation and energy insurance was largely attributable to continued challenging market conditions in marine and energy liability and aviation business lines. The
increase
in gross written premiums in financial and professional lines insurance was largely attributable to growth in our management liability, surety, cyber and accident and health business lines.
Ceded written premiums.
Total ceded written premiums for
2018
was
$1,052.1 million
, an increase of
$202.2 million
from
2017
. Ceded written premiums increased primarily due to an increase in the proportion of business ceded to our casualty, financial institutions and property quota share programs.
Ceded reinsurance for
2017
was
$849.9 million
, an increase of
$440.6 million
from
2016
. Ceded reinsurance increased as a result of the impact from restructuring our ceded reinsurance arrangements in the second half of 2016 and in particular through the use of significant quota share reinsurance arrangements which aim to reduce earnings volatility and benefit the expense ratio through an increase in over-rider commissions. Ceded written premiums also increased across all lines of business due to the purchase of a whole account quota share contract and due to the recognition of ceded costs to reinstate cover following catastrophe losses.
Net premiums earned.
Net premiums earned decreased by
$142.2 million
, or
12.9%
, in
2018
compared to
2017
due to the impact from the increase in the proportion of business ceded to our quota share treaties. Net premiums earned decreased by
$354.9 million
, or
24.4%
, in
2017
compared to
2016
due to the impact from the decreases in ceded written premiums in
2017
.
Losses and loss adjustment expenses.
The loss ratio in
2018
was
67.4%
compared to
79.8%
in
2017
. The improvement in the loss ratio in
2018
was primarily due a
$56.2 million
decrease
in catastrophe losses, a
$47.6 million
decrease
in large losses and a
$19.1 million
increase
in prior year reserve releases which offset the impact from a decrease in net earned premiums. The loss ratio in
2017
of
79.8%
increase
d from
63.1%
in
2016
due primarily to an
$18.7 million
reduction in prior year reserve releases and a
$57.1 million
increase
in catastrophe losses.
In
2018
, the insurance segment experienced
$52.5 million
of catastrophe losses, net of reinsurance recoverables, due to
$4.7 million
from U.K. winter storms,
$5.8 million
from Hurricane Florence,
$14.5 million
from wildfires in California,
$9.6 million
from Hurricane Michael,
$1.3 million
from an Alaskan Earthquake and
$16.6 million
from other U.S. and Asian weather-related events. Large losses experienced during
2018
included a
$6.6 million
trade credit loss and
$13.0 million
of fire-related losses.
In
2017
, the insurance segment experienced
$108.7 million
of catastrophe losses, consisting of
$22.4 million
from Hurricane Harvey,
$20.6 million
from Hurricane Irma,
$13.2 million
from Hurricane Maria,
$10.2 million
from wildfires in California and
99
$42.3 million
associated with U.S. weather-related events. Large losses experienced during 2016 included
$38.7 million
of fire-related losses, a
$12.6 million
surety loss, an
$11.1 million
loss related to cyber and terrorism and a
$4.8 million
refinery explosion.
In 2016, the insurance segment experienced
$51.6 million
of catastrophe losses, consisting of
$39.9 million
associated with U.S. weather-related events and
$11.7 million
associated with Hurricane Matthew. Large losses included
$32.7 million
of energy-related losses,
$11.8 million
of fire-related losses and a
$4.2 million
aviation loss.
In
2018
, there were reserve releases of
$42.7 million
compared to
$23.6 million
of reserve releases in
2017
. The reserve releases were primarily from property and casualty and marine, aviation and energy lines. The reserve releases in
2017
were principally from our marine, aviation and energy business lines which included an additional
$15.4 million
reinsurance recovery in respect of an offshore energy-related loss that occurred in Africa which offset adverse development in property and casualty insurance and financial and professional lines insurance. The reserve releases in 2016 were predominantly from marine, energy and aviation insurance and financial and professional lines insurance offsetting adverse development in our property and casualty insurance. Prior year reserve releases are further discussed under “Reserves for Losses and Loss Adjustment Expenses” below.
Policy acquisition, general and administrative expenses.
Amortization of deferred policy acquisition costs were
$110.7 million
in
2018
, equivalent to
11.6%
of net premiums earned (
2017
—
$165.0 million
or
15.0%
of net premiums earned;
2016
—
$302.5 million
or
20.8%
of net earned premium). The
decrease
in the acquisition expense ratio in
2018
compared with
2017
was largely due to an increase in over-rider commissions associated with an increase in ceded reinsurance. The
decrease
in the acquisition expense ratio in
2017
compared with
2016
was due to lower profit commission accruals and an increase in over-rider commissions.
Our general and administrative expenses
decrease
d by
$14.7 million
to
$239.2 million
in
2018
from
$253.9 million
in
2017
. Our general and administrative expense ratio was
25.0%
in
2018
compared to
23.1%
in
2017
as although there was a reduction in direct costs including accruals for performance-related pay this was less significant than the reduction in net earned premiums due to the increase in ceded costs. General and administrative expenses of
$253.9 million
in
2017
increased from
$228.4 million
in
2016
largely due to costs associated with growth in the business.
Balance Sheet
Total cash and investments
As at
December 31, 2018
and
December 31, 2017
, total cash and investments, including accrued interest receivable, were
$7.8 billion
and
$8.7 billion
, respectively. Total cash and investments decreased mainly as a result of increased payments associated with the increase in ceded written premiums and due to increased claims payments during
2018
associated with catastrophe losses in 2017. Our investment strategy is focused on delivering stable investment income and total return through all market cycles while maintaining appropriate portfolio liquidity and credit quality to meet the requirements of our customers, rating agencies and regulators.
As of December 31, 2018, our investments consisted of a diversified portfolio of fixed income securities including U.S. Dollar BBB Emerging Market Debt and money market funds. Our overall portfolio strategy remains focused on high quality fixed income investments. In the first quarter of 2018, we took advantage of rising equity markets and sold our remaining equity portfolio. Proceeds from the sales were reinvested into a core fixed income strategy. As at
December 31, 2018
, the Company had a
4.5%
position in BBB Emerging Market Debt and a
1.3%
position in a real estate fund representing in total
5.8%
of our Managed Portfolio. As at
December 31, 2017
the Company had a
5.8%
position in equities, a
4.0%
position in U.S. Dollar BBB Emerging Market Debt and a
0.2%
in risk asset portfolio cash representing in total
10.0%
of our Managed Portfolio.
Book yield for the year ended
December 31, 2018
on the fixed income portfolio was
2.69%
, an
increase
of
13
basis points from
2.56%
at
December 31, 2017
, as a result of rising interest rates. Our fixed income portfolio duration as at
December 31, 2018
was
3.54
years compared to
3.90
as at
December 31, 2017
. As at
December 31, 2018
, the average credit quality of our fixed income portfolio was “
AA-
,” with
88.3%
of the portfolio being rated “A” or higher. The average rating of our mortgage-backed securities was
AA+
. As at
December 31, 2017
, the average credit quality of our fixed income portfolio was “
AA-
,” with
88.9%
of the portfolio being rated “A” or higher. Where the credit ratings were split between the two main rating agencies, S&P and Moody’s, the lowest rating was used.
Unrealized
losses
in the available for sale investment portfolio, net of taxes, were
$66.8 million
as at
December 31, 2018
, a reduction of
$76.5 million
from the net
$9.7 million
unrealized gain as at
December 31, 2017
.
As at
December 31, 2018
, we had investments in four entities classified as other investments, equity method: a micro-insurance incubator (“MVI”), Bene Assicurazioni (“Bene”), Digital Risk Resources, LLC (“Digital Re”) and Crop Re Services LLC (“Crop Re”). For further information regarding these investments, see Note 6 of our consolidated financial statements, “Investments.” On December 20, 2017, the Company committed to, and during 2018 invested $100.0 million as a limited partner to a real estate fund, classified as other investments. The investment objective of the fund is to achieve attractive risk-adjusted returns through
100
the acquisition of income producing, high quality assets in gateway cities located in the U.S. and Canada in the office, retail, industrial and multifamily sectors of the real estate market. On May 1, 2018, the Company received a demand for an initial capital call of
$86.2 million
and paid the capital call on May 10, 2018. On September 19, 2018, the Company received a demand for the final capital call of
$13.8 million
and paid the capital on September 28, 2018.
The composition of our cash and investments as at December 31,
2018
and
2017
is summarized below:
|
|
As at December 31, 2018
|
As at December 31, 2017
|
||||||||||||
|
|
Estimated
Fair Value
|
Percentage of
Total Cash and
Investments
|
Estimated
Fair Value
|
Percentage of
Total Cash and
Investments
|
||||||||||
|
|
($ in millions except for percentages)
|
|||||||||||||
|
Fixed Income Securities — Available for Sale
|
||||||||||||||
|
U.S. government
|
$
|
1,404.2
|
|
17.9
|
%
|
$
|
1,159.4
|
|
13.3
|
%
|
||||
|
U.S. agency
|
47.4
|
|
0.6
|
|
52.1
|
|
0.6
|
|
||||||
|
Municipal
|
47.2
|
|
0.6
|
|
54.9
|
|
0.6
|
|
||||||
|
Corporate
|
2,206.2
|
|
28.3
|
|
2,415.7
|
|
27.8
|
|
||||||
|
Non-U.S. government-backed corporate
|
93.2
|
|
1.2
|
|
91.3
|
|
1.1
|
|
||||||
|
Foreign government
|
402.6
|
|
5.1
|
|
484.9
|
|
5.6
|
|
||||||
|
Asset-backed
|
17.3
|
|
0.2
|
|
26.2
|
|
0.3
|
|
||||||
|
Agency mortgage-backed
|
1,012.6
|
|
12.9
|
|
946.5
|
|
10.9
|
|
||||||
|
Total Fixed Income Securities — Available for Sale
|
$
|
5,230.7
|
|
66.8
|
%
|
$
|
5,231.0
|
|
60.2
|
%
|
||||
|
Fixed Income Securities — Trading
|
||||||||||||||
|
U.S. government
|
147.7
|
|
1.9
|
%
|
161.9
|
|
1.9
|
%
|
||||||
|
Municipal
|
2.7
|
|
—
|
|
32.2
|
|
0.4
|
|
||||||
|
Corporate
|
720.2
|
|
9.2
|
|
1,046.3
|
|
12.0
|
|
||||||
|
Non-U.S. government-backed corporate
|
—
|
|
—
|
|
1.0
|
|
—
|
|
||||||
|
Foreign government
|
265.4
|
|
3.4
|
|
202.5
|
|
2.3
|
|
||||||
|
Asset-backed
|
2.4
|
|
—
|
|
9.9
|
|
0.1
|
|
||||||
|
Agency mortgage-backed securities
|
49.4
|
|
0.6
|
|
195.5
|
|
2.3
|
|
||||||
|
Total Fixed Income Securities — Trading
|
$
|
1,187.8
|
|
15.1
|
%
|
$
|
1,649.3
|
|
19.0
|
%
|
||||
|
Total other investments, equity method
|
67.1
|
|
0.9
|
|
66.4
|
|
0.8
|
|
||||||
|
Total other investments
(1)
|
102.5
|
|
1.3
|
|
—
|
|
—
|
|
||||||
|
Total catastrophe bonds — trading
|
36.2
|
|
0.5
|
|
32.4
|
|
0.4
|
|
||||||
|
Total equity securities — trading
|
—
|
|
—
|
|
491.0
|
|
5.7
|
|
||||||
|
Total short-term investments — available for sale
|
105.6
|
|
1.3
|
|
89.9
|
|
1.0
|
|
||||||
|
Total short-term investments — trading
|
9.5
|
|
0.1
|
|
73.0
|
|
0.8
|
|
||||||
|
Total cash and cash equivalents
|
1,083.7
|
|
14.0
|
|
1,054.8
|
|
12.1
|
|
||||||
|
Total Cash and Investments
|
$
|
7,823.1
|
|
100.0
|
%
|
$
|
8,687.8
|
|
100.0
|
%
|
||||
__________________
|
(1)
|
Total other investments represents our investment in a real estate fund. For further information refer to Note 6 our consolidated financial statements, “Investments.”
|
101
Our mortgage-backed portfolio is supported by loans diversified across a number of geographic and economic sectors. The following table summarizes the fair value of our mortgage-backed securities by rating and class as at
December 31, 2018
:
|
AAA
|
AA and Below
|
Total
|
||||||||||
|
|
($ in millions)
|
|||||||||||
|
Agency
|
$
|
—
|
|
$
|
1,062.0
|
|
$
|
1,062.0
|
|
|||
|
Non-agency commercial
|
—
|
|
—
|
|
—
|
|
||||||
|
Total mortgage-backed securities
|
$
|
—
|
|
$
|
1,062.0
|
|
$
|
1,062.0
|
|
|||
The average rating of our mortgage-backed portfolio was AA+.
Sub-prime securities
. We define sub-prime related investments as those supported by, or containing, sub-prime collateral based on creditworthiness. We do not invest directly in sub-prime related securities.
Equity securities.
Equity securities consisted of U.S. and foreign equity securities and after rebalancing equity investments across subsidiary company balance sheets in 2015 were all classified as trading. In the fourth quarter of 2016 and the third quarter of 2017, we took advantage of rising equity markets and sold $200.0 million and $208.1 million respectively, of our equity portfolio. Similarly, in the first quarter of 2018, we sold the remainder of our equity portfolio. The total investment return from trading equity portfolios for the twelve months ended
December 31, 2018
,
2017
and
2016
were as follows:
|
For the Twelve Months Ended
|
||||||||||||
|
Trading Equity Portfolio
|
December 31, 2018
|
December 31, 2017
|
December 31, 2016
|
|||||||||
|
|
($ in millions)
|
|||||||||||
|
Dividend income
|
$
|
2.1
|
|
$
|
13.6
|
|
$
|
20.4
|
|
|||
|
Realized investment gains
|
69.5
|
|
47.0
|
|
31.7
|
|
||||||
|
Change in net unrealized gains, gross of tax
|
(75.7
|
)
|
21.2
|
|
9.6
|
|
||||||
|
Realized foreign exchange gains/(losses)
|
4.9
|
|
(1.7
|
)
|
(24.1
|
)
|
||||||
|
Net unrealized foreign exchange (losses)/gains
|
(0.6
|
)
|
24.8
|
|
7.8
|
|
||||||
|
Total investment return from the trading equity portfolio
|
$
|
0.2
|
|
$
|
104.9
|
|
$
|
45.4
|
|
|||
Valuation of Investments
Fair Value Measurements.
Our estimates of fair value for financial assets and liabilities are based on the framework established in the fair value accounting guidance included in ASC Topic 820,
Fair Value Measurements and Disclosures
. For a description of the framework, see Note 8 of our consolidated financial statements, “Fair Value Measurements.”
Valuation of Investments, Equity Method.
The value of our investments in
MVI, Chaspark, Bene, Digital Re and Crop Re
are based on our share of the capital position of the entities which includes income and expenses reported in quarterly management accounts. Each of
MVI, Chaspark, Bene, Digital Re and Crop Re
is subject to annual audit evaluating the financial statements of the entities. We periodically review the management accounts of
MVI, Chaspark, Bene, Digital Re and Crop Re
and evaluate the reasonableness of the valuation of our investment.
Valuation of Other Investments.
The Company’s other investments represent our investment in a real estate fund. Adjustments to the fair value are made based on the net asset value of the investment. The net valuation criteria established by the manager of such investments are established in accordance with the governing documents and the asset manager’s valuation guidelines, which consider a two part approach: the discounted cash flows approach and the performance multiple approach, which uses a multiple/capitalization rate derived from market metrics from comparable companies or assets to produce operating performance metrics. Alternative valuation methodologies may be employed for investments with unusual characteristics.
Other-than-temporary Impairment of Investments.
We review all our available for sale fixed income and equity investments on an individual security basis for potential OTTI each quarter based on criteria including issuer-specific circumstances, credit ratings actions and general macro-economic conditions. There was a $
Nil
OTTI charge for the
twelve months ended
December 31, 2018
(
2017
—
$0.7 million
).
For further discussion, see Note 2(c) of our consolidated financial statements, “Basis of Preparation and Significant Accounting Policies — Accounting for Investments, Cash and Cash Equivalents.”
102
Reserves for Losses and Loss Adjustment Expenses
Provision is made at the end of each year for the estimated ultimate cost of claims incurred but not settled at the balance sheet date, including the cost of IBNR claims and development of existing reported claims. The estimated cost of claims includes expenses to be incurred in settling claims and a deduction for the expected value of salvage and other recoveries. Estimated amounts recoverable from reinsurers on unpaid losses and loss adjustment expenses are calculated to arrive at a net claims reserve.
Reserves by segment.
As at
December 31, 2018
, we had total net loss and loss adjustment expense reserves of
$4,996.6 million
(
December 31, 2017
—
$5,234.3 million
). This amount represented our best estimate of the ultimate liability for payment of losses and loss adjustment expenses. Of the total gross reserves for unpaid losses of
$7,074.2 million
at the balance sheet date of
December 31, 2018
, a total of
$3,969.8 million
, or
56.1%
, represented IBNR claims (
December 31, 2017
—
$3,720.8 million
and
55.1%
, respectively). The following tables analyze gross and net loss and loss adjustment expense reserves by business segment as at
December 31, 2018
and
2017
, respectively:
|
|
As at December 31, 2018
|
|||||||||||
|
Business Segment
|
Gross
|
Reinsurance
Recoverable
|
Net
|
|||||||||
|
|
($ in millions)
|
|||||||||||
|
Reinsurance
|
$
|
3,309.8
|
|
$
|
(466.2
|
)
|
$
|
2,843.6
|
|
|||
|
Insurance
|
3,764.4
|
|
(1,611.4
|
)
|
2,153.0
|
|
||||||
|
Total losses and loss expense reserves
|
$
|
7,074.2
|
|
$
|
(2,077.6
|
)
|
$
|
4,996.6
|
|
|||
|
|
At December 31, 2017
|
|||||||||||
|
Business Segment
|
Gross
|
Reinsurance
Recoverable
|
Net
|
|||||||||
|
|
($ in millions)
|
|||||||||||
|
Reinsurance
|
$
|
3,186.4
|
|
$
|
(269.3
|
)
|
$
|
2,917.1
|
|
|||
|
Insurance
|
3,563.1
|
|
(1,245.9
|
)
|
2,317.2
|
|
||||||
|
Total losses and loss expense reserves
|
$
|
6,749.5
|
|
$
|
(1,515.2
|
)
|
$
|
5,234.3
|
|
|||
The increase in reinsurance recoverables in
2018
was due predominantly to additional reinsurance purchased to reduce earnings volatility. The recoveries in the reinsurance segment are generally associated with catastrophes and levels of recoveries fluctuate based on the type of catastrophe.
The gross reserves may be further analyzed between outstanding claims and IBNR as at
December 31, 2018
and
2017
as follows:
|
|
As at December 31, 2018
|
||||||||||||||
|
|
Gross
Outstandings
|
Gross
IBNR
|
Gross
Reserve
|
% IBNR
|
|||||||||||
|
|
($ in millions, except for percentages)
|
||||||||||||||
|
Reinsurance
|
$
|
1,349.9
|
|
$
|
1,959.9
|
|
$
|
3,309.8
|
|
59.2
|
%
|
||||
|
Insurance
|
1,786.4
|
|
1,978.0
|
|
3,764.4
|
|
52.5
|
%
|
|||||||
|
Total losses and loss expense reserves
|
$
|
3,136.3
|
|
$
|
3,969.8
|
|
$
|
7,074.2
|
|
56.1
|
%
|
||||
|
|
As at December 31, 2017
|
||||||||||||||
|
|
Gross
Outstandings
|
Gross
IBNR
|
Gross
Reserve
|
% IBNR
|
|||||||||||
|
|
($ in millions, except for percentages)
|
||||||||||||||
|
Reinsurance
|
$
|
1,440.0
|
|
$
|
1,746.4
|
|
$
|
3,186.4
|
|
54.8
|
%
|
||||
|
Insurance
|
1,588.7
|
|
1,974.4
|
|
3,563.1
|
|
55.4
|
%
|
|||||||
|
Total losses and loss expense reserves
|
$
|
3,028.7
|
|
$
|
3,720.8
|
|
$
|
6,749.5
|
|
55.1
|
%
|
||||
103
Prior year loss reserves
. For the
twelve
months ended
December 31, 2018
, there was an overall reduction in our estimate of ultimate net claims to be paid in respect of prior accident years. An analysis of this reduction by business segment is as follows for each of the
twelve months ended
December 31, 2018
,
2017
and
2016
:
|
|
For the Twelve Months Ended
|
|||||||||||
|
Business Segment
|
December 31, 2018
|
December 31, 2017
|
December 31, 2016
|
|||||||||
|
|
($ in millions)
|
|||||||||||
|
Reinsurance
|
$
|
68.4
|
|
$
|
81.8
|
|
$
|
87.0
|
|
|||
|
Insurance
|
42.7
|
|
23.6
|
|
42.3
|
|
||||||
|
Total losses and loss expense reserves reductions
|
$
|
111.1
|
|
$
|
105.4
|
|
$
|
129.3
|
|
|||
For the
twelve
months ended
December 31, 2018
. The analysis of the development by each segment is as follows:
Reinsurance.
Net reserve releases of
$68.4 million
in
2018
were mainly as a result of favorable development in property catastrophe reinsurance, other property reinsurance and specialty reinsurance lines. The property catastrophe and other property reinsurance business lines reported favorable development due to reductions in estimated losses from 2017 catastrophes. The specialty reinsurance business lines reported net reserve releases due primarily to favorable development on marine reinsurance lines.
Insurance.
Net reserve releases of
$42.7 million
in
2018
were mainly as a result of favorable development in property and casualty and marine, aviation and energy lines with only modest reserves releases for financial and professional lines. The property and casualty business lines reported favorable development due to reductions in estimated losses from 2017 catastrophes. The marine, aviation and energy business lines reported net reserve releases due primarily to favorable development on U.S energy lines.
For the
twelve
months ended
December 31, 2017
. The analysis of the development by each segment is as follows:
Reinsurance.
Net reserve releases of $81.8 million in
2017
were mainly as a result of favorable development across our property catastrophe and other property reinsurance lines. The specialty reinsurance business lines reported favorable development and the recognition of additional prior year ceded recoveries in respect of an offshore energy-related loss that occurred in Africa. The casualty reinsurance business line reported a net reserve release due to favorable development despite our exposure to the Ogden rate change from reinsurance of U.K. employer’s liability and U.K. public liability business and, to a lesser degree, U.K. motor liability reinsurance.
Insurance.
Net reserve releases of $23.6 million in
2017
were mainly as a result of favorable development and the recognition of additional prior year ceded recoveries in our marine, aviation and energy business line in respect of an offshore energy-related loss that occurred in Africa. Net reserves were strengthened in property and casualty lines due to adverse development in our casualty lines following the change in the Ogden rate which impacted our U.K. employer’s liability and U.K. public liability business and increases in loss reserves associated with the purchase of an adverse development cover. Financial and professional lines reported an increase in prior year reserves due to adverse development in the management liability account.
For the
twelve
months ended December 31,
2016
. The analysis of the development by each segment is as follows:
Reinsurance.
Net reserve releases of $87.0 million in
2016
were attributable to all lines of business. The largest releases in the period were $39.7 million from other property reinsurance lines, $18.9 million from specialty reinsurance lines and $14.9 million from casualty reinsurance lines due to better than expected claims development.
Insurance.
Net reserve releases of $42.3 million in
2016
were attributable to net reserve releases of $38.9 million from marine, aviation and energy lines and $15.3 million from financial and professional lines due to better than expected development partially offset by an $11.9 million net reserve strengthening in property and casualty lines.
We did not make any significant changes in methodologies used in our reserving process.
104
Capital Management
We maintain our capital at an appropriate level as determined by our internal risk appetite and the financial strength required by our customers, regulators and rating agencies. We monitor and review our group and operating entities’ capital and liquidity positions on an ongoing basis. The following table shows our capital structures as at
December 31, 2018
compared to
December 31, 2017
:
|
As at December 31, 2018
|
At December 31, 2017
|
|||||||
|
|
($ in millions)
|
|||||||
|
Share capital, additional paid-in capital, retained income and accumulated other comprehensive income attributable to ordinary shareholders
|
$
|
2,144.1
|
|
$
|
2,416.6
|
|
||
|
Preference shares (liquidation preferences net of issue costs)
|
511.9
|
|
511.9
|
|
||||
|
Long-term debt
|
424.7
|
|
549.5
|
|
||||
|
Loan Notes issued by Silverton
(1)
|
4.6
|
|
86.6
|
|
||||
|
Total capital
|
$
|
3,085.3
|
|
$
|
3,564.6
|
|
||
____________________
|
(1)
|
We do not consider the Loan Notes issued by Silverton to be part of our permanent capital as the noteholders have no recourse to the other assets of the Company.
|
As at
December 31, 2018
, total shareholders’ equity was
$2,656.0 million
compared to
$2,928.5 million
as at
December 31, 2017
. Our total shareholders’ equity as at
December 31, 2018
includes two classes of preference shares with a total value as measured by their respective liquidation preferences of
$511.9 million
net of share issuance costs (
December 31, 2017
—
$511.9 million
, two classes of preference shares).
Our preference shares are classified in our balance sheet as equity but may receive a different treatment in some cases under the capital adequacy assessments made by certain rating agencies. Such securities are often referred to as “hybrids” as they have certain attributes of both debt and equity. Management monitors the ratio of the total of debt and hybrids to total capital which was
30.4%
as of
December 31, 2018
(
December 31, 2017
—
30.5%
). Total capital is defined as being shareholders’ equity plus outstanding debt and excluding loan notes issued by variable interest entities.
Our senior notes are the only material debt issued by Aspen Holdings currently outstanding. As at
December 31, 2018
and
2017
, the value of debt less amortization expenses was
$424.7 million
and
$549.5 million
, respectively. In addition to the senior notes issued by Aspen Holdings, we have also reported
$4.6 million
of debt issued by Silverton. For further information relating to Silverton, refer to Note 7 of our consolidated financial statements, “Variable Interest Entities.”
Management monitors the ratio of debt to total capital which was
13.8%
as at
December 31, 2018
(December 31,
2017
—
15.8%
).
The principal capital management transactions during 2018 were as follows:
|
•
|
On June 18, 2018, we redeemed
$125.0 million
of our 6.00% Senior Notes due 2020 resulting in a realized loss, or make-whole payment, of
$8.6 million
.
|
|
•
|
Under the terms of the Merger Agreement we are restricted from declaring or paying any dividends on our ordinary shares other than the quarterly dividends on our ordinary shares that were previously declared and publicly announced prior to the date of the Merger Agreement.
|
The principal capital management transactions during 2017 were as follows:
|
•
|
On January 3, 2017, we elected to redeem all of the outstanding 7.401% Preference Shares. Each holder of a 7.401% Preference Share received $25 per 7.401% Preference Share, plus any declared and unpaid dividends.
|
|
•
|
On February 8, 2017, we replaced our existing share repurchase authorization with a new authorization of
$250.0 million
. The share repurchase authorization, which is effective through February 8, 2019, permits us to effect repurchases from time to time through a combination of transactions, including open market repurchases, privately negotiated transactions and accelerated share repurchase transactions. Under the Merger Agreement, we agreed not to redeem, purchase or otherwise acquire any outstanding ordinary shares unless Highlands consents in writing, except as otherwise set forth in the Merger Agreement.
|
|
•
|
On April 26, 2017, we announced a
9%
increase in our quarterly dividend to our ordinary shareholders from
$0.22
per ordinary share to
$0.24
per ordinary share.
|
105
|
•
|
On July 3, 2017, we elected to redeem all of the outstanding 7.250% Preference Shares. Each holder of a 7.250% Preference Share received $25 per 7.250% Preference Share, plus any declared and unpaid dividends.
|
|
•
|
For the
twelve months ended
December 31, 2017
, we acquired and canceled a total of
648,941
ordinary shares in open market repurchases. We paid a total consideration of
$30.0 million
and an average price of
$46.23
per ordinary share for the twelve months ended
December 31, 2017
. As at
December 31, 2017
, we had
$220.0 million
remaining under our then existing
$500.0 million
share repurchase authorization program.
|
On April 16, 2018, Kendall Re Ltd. (“Kendall Re”), a Bermuda-exempted company was licensed and registered as a special purpose insurer under the Bermuda Insurance Act 1978 and related regulations, each as amended. On April 25, 2018 Kendall Re issued $225.0 million Series 2018-1 Class A Principal At-Risk Variable Rate Notes due May 6, 2021 under a variable rate note program from which the proceeds have been used to provide Aspen Bermuda Limited with fully-collateralized retrocessional reinsurance protections against losses from a range of international perils, which include: U.S. named storms, U.S. and Canada earthquakes, U.S. severe thunderstorms, U.S. wildfires, U.S. winter storms and European windstorms. The results and balance sheet of Kendall Re is not included within the consolidated financial statements of the Company because the Company holds no variable or voting interest in Kendall Re.
Access to capital
. Our business operations are in part dependent on our financial strength, the opinions of the independent rating agencies thereof as discussed elsewhere in this report and the market’s perception thereof, as measured by total shareholders’ equity, which was
$2,656.0 million
as at
December 31, 2018
(
December 31, 2017
—
$2,928.5 million
). We believe our financial strength provides us with the flexibility and capacity to obtain funds through debt or equity financing. Our continuing ability to access the capital markets is dependent on, among other things, our operating results, market conditions and our perceived financial strength. Refer to Part I, Item 1A, “Risk Factors — We may repurchase additional capital in the future, which may not be available or may only be available on unfavorable terms.” We regularly monitor our capital and financial position, as well as investment and securities market conditions, both in general and with respect to Aspen Holdings’ securities. Our ordinary shares and all our preference shares are listed on the NYSE.
Liquidity
Liquidity is a measure of a company’s ability to generate cash flows sufficient to meet short-term and long-term cash requirements of its business operations. Management monitors the liquidity of Aspen Holdings and of each of its Operating Subsidiaries and arranges credit facilities to enhance short-term liquidity resources on a stand-by basis. As a holding company, Aspen Holdings relies on dividends and other distributions from its Operating Subsidiaries to provide cash flow to meet ongoing cash requirements, including any future debt service payments and other expenses, and to pay dividends, if any, to our preference and ordinary shareholders.
During the year ended
December 31, 2018
, Aspen Holdings received dividends of
$338.2 million
(
2017
—
$360.0 million
) from Aspen Bermuda and
$2.1 million
(
2017
— $
Nil
) from Aspen Managing Agency Limited.
As at
December 31, 2018
, Aspen Holdings held
$59.3 million
(
December 31, 2017
—
$111.4 million
) of cash, cash equivalents and investments. Management considers the current cash and cash equivalents, together with dividends declared or expected to be declared by subsidiary companies and our credit facilities, sufficient to appropriately satisfy the liquidity requirements of Aspen Holdings. Aspen Holdings’ liquidity depends on dividends, capital distributions and interest payments from our Operating Subsidiaries. The liquidity requirements of Aspen Holdings have reduced given that, under the Merger Agreement, Aspen is restricted from declaring or paying any dividends other than the quarterly dividends on Aspen’s ordinary shares that were previously declared and publicly announced prior to the date of the Merger Agreement and periodic cash dividends on the Preference Shares in accordance with the terms of the applicable certificate of designation. Aspen Holdings also has recourse to the credit facility described under “Letter of Credit Facilities” below.
The ability of our Operating Subsidiaries to pay us dividends or other distributions is subject to the laws and regulations applicable to each jurisdiction, as well as the Operating Subsidiaries’ need to maintain capital requirements adequate to maintain their insurance and reinsurance operations and their financial strength ratings issued by independent rating agencies. In line with common market practice for regulated institutions, the PRA previously requested that it be afforded with the opportunity to provide a “non-objection” prior to all future dividend payments made by Aspen U.K. In 2017, the PRA stated that they no longer routinely require Aspen U.K. to apply for a non-objection to dividends provided that such dividend payment and Aspen U.K.’s subsequent capital position are within Aspen U.K.’s board-approved solvency capital risk appetite. We do not expect to suffer tax on foreign earnings since our significant source of earnings outside of Bermuda is the U.K. and no taxes are imposed on profits repatriated from the U.K. to Bermuda. For a further discussion of the various restrictions on our ability and our Operating Subsidiaries’ ability to pay dividends, refer to Part I, Item 1 “Business — Regulatory Matters.” For a discussion of the volatility and liquidity of our other investments, refer to Part I, Item 1A, “Risk Factors — Market and Liquidity Risks,” and for a discussion of the impact of
106
insurance losses on our liquidity, refer to Part I, Item 1A, “Risk Factors — Insurance Risks” and Note 15 of our consolidated financial statements, “Statutory Requirements and Dividend Restrictions.”
Operating Subsidiaries.
As at
December 31, 2018
, the Operating Subsidiaries held
$930.4 million
(
December 31, 2017
—
$821.7 million
) in cash and short-term investments that are readily realizable securities. The
increase
is largely due the balance held at 2017 year end being lower than in previous years due to costs associated with the increase in ceded reinsurance and the significant level of claims activity in 2017. Management monitors the value, currency and duration of cash and investments held by the Operating Subsidiaries to ensure they are able to meet their insurance and other liabilities as they become due and was satisfied that there was a comfortable margin of liquidity as at
December 31, 2018
and for the foreseeable future.
On an ongoing basis, our Operating Subsidiaries’ sources of funds primarily consist of premiums written, investment income and proceeds from sales and redemptions of investments. Cash is used primarily to pay reinsurance premiums, losses and loss adjustment expenses, brokerage commissions, general and administrative expenses, taxes, interest and dividends and to purchase new investments. The potential for individual large claims and for accumulations of claims from single events means that substantial and unpredictable payments may need to be made within relatively short periods of time.
For all material currencies in which our underwriting activities are written we ensure that sufficient cash and short-term investments are held in such currencies to enable us to meet potential claims without liquidating long-term investments and adversely affecting our investment return. This follows the matching principle which matches our assets and liabilities in currency to mitigate foreign currency risk whenever possible.
We manage these risks by making regular forecasts of the timing and amount of expected cash outflows and ensuring that we maintain sufficient balances in cash and short-term investments to meet these estimates. Notwithstanding this policy, if these cash flow forecasts are incorrect, we could be forced to liquidate investments prior to maturity, potentially at a significant loss. Historically, we have not had to liquidate investments at a significant loss to maintain sufficient levels of liquidity.
Where we incur losses in currencies which are not normally held we will convert funds into the appropriate currencies to mitigate our currency risk and also make funds available to settle claims in local currencies as and when they become due. Recent examples of this have been where we have converted funds to Mexican Peso, Chilean Peso and Chinese Yuan to cover earthquake and other losses in these countries. For local regulatory reasons, we hold assets in trusts which limits our liquidity to some degree. The process of matching assets with liabilities in currency means, however, that at any one time we will hold cash and short-term assets in all major currencies which are available to settle claims.
The liquidity of our Operating Subsidiaries is also affected by the terms of our contractual obligations to policyholders and by undertakings to certain regulatory authorities to facilitate the issue of letters of credit or maintain certain balances in trust funds for the benefit of policyholders, or restricted for other reasons. The following table shows the forms of collateral or other security provided in respect of these obligations and undertakings as at
December 31, 2018
and
December 31, 2017
:
|
As at December 31, 2018
|
At December 31, 2017
|
|||||||
|
|
($ in millions, except percentages)
|
|||||||
|
Regulatory trusts and deposits:
|
||||||||
|
Affiliated transactions
|
$
|
1,033.9
|
|
$
|
1,455.0
|
|
||
|
Third party
|
2,511.7
|
|
2,425.3
|
|
||||
|
Letters of credit / guarantees
|
771.1
|
|
658.5
|
|
||||
|
Investment commitment — real estate fund
|
—
|
|
100.0
|
|
||||
|
Other investments — real estate fund
|
$
|
102.5
|
|
$
|
—
|
|
||
|
Total restricted assets
|
$
|
4,419.2
|
|
$
|
4,638.8
|
|
||
|
Total as percent of investable assets
|
56.4
|
%
|
53.4
|
%
|
||||
See Note 19(a), “Commitments and Contingencies — Restricted Assets” of our consolidated financial statements for further detail on our trust fund balances which we are required to maintain in accordance with contractual obligations to policyholders and in compliance with regulatory requirements.
Consolidated cash flows for the
twelve months ended
December 31, 2018
.
Total net cash flow used in operations for the twelve months ended
December 31, 2018
was
$304.5 million
, a
$193.0 million
increase in cash used from the equivalent period in
2017
. The increase in cash used in operations for the twelve months ended
December 31, 2018
is mainly attributable to ceded reinsurance costs, an increase in paid claims and payments of accrued expenses. For the twelve months ended
December 31, 2018
, the cash flow used in operations required funds to be realized from the investment portfolio. We paid net claims of
$1,726.7 million
in
2018
and generated cash inflows of
$657.3 million
from investing and net purchases and sales of equipment during the period.
107
We paid ordinary share and preference share dividends of
$73.4 million
and
$125.0 million
was used to redeem a portion of our 6.00% Senior Notes due 2020. At
December 31, 2018
, we had a balance of cash and cash equivalents of
$1,083.7 million
.
Consolidated cash flows for the twelve months ended December 31,
2017
.
Total net cash flow used in operations for the twelve months ended December 31,
2017
was
$111.5 million
, a
decrease
of
$564.7 million
from the equivalent period in
2016
. The negative cash flows for the twelve months ended December 31,
2017
, were due to the significant increase in ceded reinsurance costs and claims activity in 2017. We paid net claims of
$1,555.1 million
in
2017
, and generated cash inflows of
$419.0 million
from investing and net purchases and sales of equipment during the period. We paid ordinary and preference share dividends of
$92.4 million
, and
$30.0 million
was used to repurchase ordinary shares. At December 31,
2017
, we had a balance of cash and cash equivalents of
$1,054.8 million
.
Consolidated cash flows for the twelve months ended December 31,
2016
.
Total net cash flow from operations for the twelve months ended December 31,
2016
was
$453.2 million
, a
decrease
of
$121.0 million
from the equivalent period in
2015
. For the twelve months ended December 31,
2016
, our cash flows from operations provided us with sufficient liquidity to meet our operating requirements. We paid net claims of
$1,222.8 million
in
2016
, and used
$350.9 million
in investing and net purchases and sales of equipment during the period. We paid ordinary and preference share dividends of
$94.5 million
, and
$75.0 million
was used to repurchase ordinary shares. At December 31,
2016
, we had a balance of cash and cash equivalents of
$1,273.8 million
.
Letter of Credit Facilities.
See Note 22, “Credit Facility and Long-term Debt” of our consolidated financial statements for discussion of our credit agreements and letter of credit facilities.
Contractual Obligations and Commitments
The following table summarizes our contractual obligations (other than our obligations to employees and our Preference Shares) under long-term debt, operating leases (net of subleases) and reserves relating to insurance and reinsurance contracts as at
December 31, 2018
:
|
2019
|
2020
|
2021
|
2022
|
2023
|
Later
Years |
Total
|
|||||||||||||||||||||
|
|
($ in millions)
|
||||||||||||||||||||||||||
|
Operating lease obligations
|
$
|
17.5
|
|
$
|
16.0
|
|
$
|
14.6
|
|
$
|
9.9
|
|
$
|
8.8
|
|
$
|
74.6
|
|
$
|
141.4
|
|
||||||
|
Long-term debt obligations
(1)
|
—
|
|
125.0
|
|
—
|
|
—
|
|
300.0
|
|
—
|
|
425.0
|
|
|||||||||||||
|
Reserves for losses and LAE
(2)
|
1,853.7
|
|
1,343.3
|
|
963.5
|
|
699.4
|
|
514.8
|
|
1,699.5
|
|
7,074.2
|
|
|||||||||||||
|
Total
|
$
|
1,871.2
|
|
$
|
1,484.3
|
|
$
|
978.1
|
|
$
|
709.3
|
|
$
|
823.6
|
|
$
|
1,774.1
|
|
$
|
7,640.6
|
|
||||||
__________________
|
(1)
|
The long-term debt obligations disclosed above do not include the
$21.5 million
annual interest payments on our outstanding senior notes or dividends payable to holders of our preference shares or the loan notes issued by Silverton in the amount of
$4.6 million
.
|
|
(2)
|
In estimating the time intervals into which payments of our reserves for losses and loss adjustment expenses fall, as set out above, we have utilized actuarially assessed payment patterns. By the nature of the insurance and reinsurance contracts under which these liabilities are assumed, there can be no certainty that actual payments will fall in the periods shown and there could be a material acceleration or deceleration of claims payments depending on factors outside our control. The total amount of payments in respect of our reserves, as well as the timing of such payments, may differ materially from our current estimates for the reasons set out under “ — Critical Accounting Policies — Reserves for Losses and Loss Expenses” above.
|
For a detailed description of our operating lease obligations, refer to Part I, Item 2, “Properties.”
Off-Balance Sheet Arrangements
As at
December 31, 2018
, we were not party to any off-balance sheet arrangements, as defined by Item 303(a)(4) of Regulation S-K, to which an entity unconsolidated with us is a party that management believes is reasonably likely to have a current or future effect on our financial condition, revenues or expenses, results of operations, liquidity, capital expenditures or capital resources that we believe is material to investors.
In November 2016, Peregrine, a subsidiary of the Company, was registered as a segregated accounts company under the Bermuda Segregated Accounts Companies Act 2000, as amended. As at
December 31, 2018
, Peregrine had formed four segregated
108
accounts which were funded by a third party investor. The segregated accounts have not been consolidated as part of the Company’s consolidated financial statements.
Effects of Inflation
Inflation may have a material effect on our consolidated results of operations by its effect on interest rates and on the cost of settling claims. The potential exists after a catastrophe or other large property loss, such as the hurricanes in 2017, for the development of inflationary pressures in a local economy as the demand for services, such as construction, typically surges. The cost of settling claims may also be increased by global commodity price inflation. We seek to take both these factors into account when setting reserves for any events where we think they may be material.
Our calculation of reserves for losses and loss expenses in respect of casualty business includes assumptions about future payments for settlement of claims and claims-handling expenses, such as medical treatments and litigation costs. We write casualty business in the United States, the United Kingdom and Australia and certain other territories, where claims inflation has in many years run at higher rates than general inflation. To the extent inflation causes these costs to increase above reserves established for these claims, we will be required to increase our loss reserves with a corresponding reduction in earnings. The actual effects of inflation on our results cannot be accurately known until claims are ultimately settled.
In addition to general price inflation, we are exposed to a persisting long-term upwards trend in the cost of judicial awards for damages. We seek to take this into account in our pricing and reserving of casualty business.
We also seek to take into account the projected impact of inflation on the likely actions of central banks in the setting of short-term interest rates and consequent effects on the yields and prices of fixed interest securities. As at February
2019
, although inflation is currently low, we consider that in the medium-term there is a risk that inflation, interest rates and bond yields may rise, resulting in a decrease in the market value of certain of our fixed interest investments. Refer to Part I, Item 1A, “Risk Factors — Market and Liquidity Risks — Our results of operations and investment portfolio may be materially affected by conditions impacting the level of interest rates in the global capital markets and major economies, such as central bank policies in interest rates and the rate of inflation.”
Reconciliation of Non-U.S. GAAP Financial Measures
Basic book value per ordinary share is calculated by dividing net assets available to holders of Aspen Holdings’ ordinary shares by the number of ordinary shares outstanding. Diluted book value per ordinary share is calculated by dividing net assets available to holders of Aspen Holdings’ ordinary shares by the number of ordinary shares and dilutive potential ordinary shares outstanding using the treasury stock method.
Adjusted diluted book value per ordinary share, a non-U.S. GAAP measure, is calculated by deducting from total shareholders’ equity the total of: accumulated other comprehensive income; the value of preference shares less issue expenses; the share of equity due to non-controlling interests; and adding back ordinary dividends. The resulting balance is then divided by the diluted number of ordinary shares as at the year end. We believe that adding back ordinary dividends provides a more consistent and useful measurement of total shareholder value, which supplements U.S. GAAP information. We have excluded accumulated other comprehensive income, net of taxes, as unrealized appreciation (depreciation) on investments is primarily the result of interest rate movements and the resultant impact on fixed income securities, and unrealized appreciation (depreciation) on foreign exchange is the result of exchange rate movements between the U.S. Dollar and the functional currencies of our Operating Subsidiaries. Therefore, we believe that excluding these unrealized appreciations (depreciations) provides a more consistent and useful measurement of operating performance, which supplements U.S. GAAP information.
109
|
|
As at December 31, 2018
|
As at December 31, 2017
|
||||||
|
|
($ in millions, except for share amounts)
|
|||||||
|
Total shareholders’ equity
|
$
|
2,656.0
|
|
$
|
2,928.5
|
|
||
|
Accumulated other comprehensive income, net of taxes
|
121.9
|
|
55.9
|
|
||||
|
Preference shares less issue expenses
|
(511.9
|
)
|
(511.9
|
)
|
||||
|
Non-controlling interest
|
(3.7
|
)
|
(2.7
|
)
|
||||
|
Ordinary dividends
|
42.9
|
|
56.2
|
|
||||
|
Adjusted total shareholders’ equity
|
$
|
2,305.2
|
|
$
|
2,526.0
|
|
||
|
Ordinary shares
|
59,743,156
|
|
59,474,085
|
|
||||
|
Diluted ordinary shares
|
60,320,879
|
|
60,202,409
|
|
||||
|
Book Value Per Share
|
||||||||
|
Basic
|
$
|
35.83
|
|
$
|
40.59
|
|
||
|
Diluted
|
$
|
35.48
|
|
$
|
40.10
|
|
||
|
Adjusted Diluted
|
$
|
38.22
|
|
$
|
41.96
|
|
||
Average equity, a non-U.S. GAAP financial measure, is used in calculating ordinary shareholders return on average equity. Average equity is calculated by taking the arithmetic average of total shareholders’ equity on a monthly basis for the stated periods excluding (i) the average share of equity due to non-controlling interests and (ii) the average value of preference shares less issue expenses.
|
|
As at December 31, 2018
|
As at December 31, 2017
|
||||||
|
|
($ in millions)
|
|||||||
|
Total shareholders’ equity
|
$
|
2,656.0
|
|
$
|
2,928.5
|
|
||
|
Non-controlling interest
|
(3.7
|
)
|
(2.7
|
)
|
||||
|
Preference shares less issue expenses
|
(511.9
|
)
|
(511.9
|
)
|
||||
|
Average adjustment
|
156.8
|
|
386.0
|
|
||||
|
Average equity
|
$
|
2,297.2
|
|
$
|
2,799.9
|
|
||
Operating income, a non-U.S. GAAP financial measure, is an internal performance measure used by us in the management of our operations. It represents after-tax operational results excluding, as applicable, after-tax: net realized and unrealized gains or losses on investments, net realized and unrealized foreign exchange gains or losses, changes to the fair value of derivatives and amortization of intangible assets and other non-recurring income or expenses which includes adviser fees associated with the Merger Agreement. In 2018 we also excluded expenses related to the make-whole payment associated with the partial redemption of the 2020 Senior Notes. We exclude after-tax net realized and unrealized capital gains or losses, after-tax net foreign exchange gains or losses and changes in the fair value of derivatives from our calculation of operating income because the amount of these gains or losses is heavily influenced by, and fluctuates in part, according to the availability of market opportunities. We believe these amounts are largely independent of our business and underwriting process and including them distorts the analysis of trends in our operations. In addition to presenting net income determined in accordance with U.S. GAAP, we believe that showing operating income enables investors, analysts, rating agencies and other users of our financial information to more easily analyze our results of operations in a manner similar to how management analyzes our underlying business performance. Operating income should not be viewed as a substitute for U.S. GAAP net income.
110
|
|
As at December 31, 2018
|
As at December 31, 2017
|
||||||
|
|
($ in millions)
|
|||||||
|
Net income/(loss) after tax
|
$
|
(145.8
|
)
|
$
|
(266.4
|
)
|
||
|
Add (deduct) after tax income:
|
|
|
|
|
||||
|
Net realized and unrealized investment losses/(gains)
|
64.1
|
|
(115.8
|
)
|
||||
|
Net realized and unrealized exchange losses
|
3.1
|
|
20.5
|
|
||||
|
Realized loss on the debt extinguishment
|
8.6
|
|
—
|
|
||||
|
Changes to the fair value of derivatives
|
26.6
|
|
(22.0
|
)
|
||||
|
Amortization and other non-operating expenses
(1)
|
75.2
|
|
28.0
|
|
||||
|
Proportion due to non-controlling interest
|
(1.0
|
)
|
(1.3
|
)
|
||||
|
Operating income/(loss) after tax and non-controlling interest
|
$
|
30.8
|
|
$
|
(357.0
|
)
|
||
|
Preference Shares dividends
|
$
|
(30.5
|
)
|
$
|
(36.2
|
)
|
||
|
Operating income/(loss) available to ordinary shareholders
|
$
|
0.3
|
|
$
|
(393.2
|
)
|
||
_______________
|
(1)
|
Non-operating expenses in 2018 includes
$37.5 million
of expenses related to the Effectiveness and Efficiency Program,
$39.0 million
of advisor fees related to the Merger and
$11.3 million
of retention costs, offset by the write back of a
$14.1 million
buy out provision.
|
Item 7A. Quantitative and Qualitative Disclosures about Market Risk
We believe we are principally exposed to four types of market risk: interest rate risk, equity risk, foreign currency risk and credit risk.
Interest rate risk.
Our investment portfolio consists primarily of fixed income securities. Fluctuations in interest rates have a direct impact on the market valuation of these securities. Accordingly, our primary market risk exposure is to changes in interest rates. As interest rates rise, the market value of our fixed-income portfolio falls and the converse is also true. We manage interest rate risk by maintaining a short to medium duration to reduce the effect of interest rate changes on book value. Refer to Note 23 of our consolidated financial statements, “Subsequent Events” for information on the interest rate swaps we executed in January 2019.
As at
December 31, 2018
, our fixed income portfolio had an approximate duration of
3.54
years. The table below depicts interest rate change scenarios and the effect on our interest rate sensitive invested assets:
|
Effect of Changes in Interest Rates on Portfolio Given a Parallel Shift in the Yield Curve
|
||||||||||||||||||||
|
Movement in Rates in Basis Points
|
-100
|
-50
|
0
|
50
|
100
|
|||||||||||||||
|
|
($ in millions, except percentages)
|
|||||||||||||||||||
|
Market Value
|
$
|
7,071.8
|
|
$
|
6,950.9
|
|
$
|
6,830.0
|
|
$
|
6,709.1
|
|
$
|
6,588.2
|
|
|||||
|
Gain/Loss
|
$
|
241.8
|
|
$
|
120.9
|
|
$
|
—
|
|
$
|
(120.9
|
)
|
$
|
(241.8
|
)
|
|||||
|
Percentage of Portfolio
|
3.5
|
%
|
1.8
|
%
|
—
|
|
(1.8
|
)%
|
(3.5
|
)%
|
||||||||||
|
Corresponding percentage at December 31, 2016
|
3.9
|
%
|
1.9
|
%
|
—
|
|
(1.9
|
)%
|
(3.9
|
)%
|
||||||||||
Equity risk.
In the first quarter of 2018, we sold the remainder of our equity portfolio and we are therefore no longer exposed to equity price risk, defined as the potential for loss in market value due to a decline in equity prices, in our investment portfolio.
Foreign currency risk.
Our reporting currency is the U.S. Dollar. The functional currencies of our operations are U.S. Dollars, British Pounds, Euros, Swiss Francs, Australian Dollars, Canadian Dollars and Singaporean Dollars. As at
December 31, 2018
, approximately
88.3%
of our cash and investments was held in U.S. Dollars (
2017
—
88.5%
), approximately
5.3%
were in British Pounds (
2017
—
5.7%
) and approximately
6.5%
were in currencies other than the U.S. Dollar and the British Pound (
2017
—
5.9%
). For the twelve months ended
December 31, 2018
,
16.7%
of our gross premiums were written in currencies other than the U.S. Dollar and the British Pound (
2017
—
17.3%
) and we expect that a similar proportion will be written in currencies other than the U.S. Dollar and the British Pound in
2019
.
Other foreign currency amounts are remeasured to the appropriate functional currency and the resulting foreign exchange gains or losses are reflected in the statement of operations. Functional currency amounts of assets and liabilities are then translated into U.S. Dollars. The unrealized gain or loss from this translation, net of tax, is recorded as part of ordinary shareholders’ equity. The change in unrealized foreign currency translation gain or loss during the year, net of tax, is a component of comprehensive income. Both the remeasurement and translation are calculated using current exchange rates for the balance sheets and average
111
exchange rates for the statement of operations. We may experience exchange losses to the extent that our foreign currency exposure is not properly managed or otherwise hedged which would in turn adversely affect our results of operations and financial condition. Management estimates that a 10% change in the exchange rate between British Pounds and U.S. Dollars as at
December 31, 2018
would have impacted reported net comprehensive income by approximately
$15.9 million
(
2017
—
$3.6 million
).
We will continue to manage our foreign currency risk by seeking to match our liabilities under insurance and reinsurance policies that are payable in foreign currencies with investments that are denominated in these currencies. This may involve the use of forward exchange contracts from time to time. A foreign exchange contract involves an obligation to purchase or sell a specified currency at a future date at a price set at the time of the contract. Foreign exchange contracts will not eliminate fluctuations in the value of our assets and liabilities denominated in foreign currencies but rather allow us to establish a rate of exchange for a future point in time.
As at
December 31, 2018
, we held foreign exchange contracts that were not designated as hedging under ASC 815 - “
Derivatives and Hedging”
with an aggregate notional value of
$1,257.3 million
(
2017
—
$751.6 million
). The foreign exchange contracts are recorded as derivatives at fair value in the balance sheet with changes recorded as a change in fair value of derivatives in the statement of operations. For the
twelve months ended
December 31, 2018
, the impact of foreign exchange contracts on net income was a
loss
of
$31.8 million
(
December 31, 2017
—
gain
of
$27.7 million
).
As at
December 31, 2018
, we held foreign exchange contracts that were designated as hedging under ASC 815 with an aggregate notional value of
$94.3 million
(
2017
—
$60.6 million
). The foreign exchange contracts are recorded as derivatives at fair value in the balance sheet with the effective portion recorded in other comprehensive income and the ineffective portion recorded as a change in fair value of derivatives in the statement of operations. The contracts are considered to be effective and the movement in other comprehensive income representing the effective portion was a
loss
of
$2.1 million
for the
twelve months ended
December 31, 2018
(
December 31, 2017
—
gain
of
$3.0 million
).
As the foreign exchange contracts settle, the realized gain or loss is reclassified from other comprehensive income into general, administration and corporate expenses of the statement of operations and other comprehensive income. For the
twelve months ended
December 31, 2018
, the amount recognized within general, administration and corporate expenses for settled foreign exchange contracts was a realized
loss
of
$1.2 million
(
December 31, 2017
—
gain
of
$4.4 million
).
Credit risk.
We have exposure to credit risk primarily as a holder of fixed income securities. Our risk management strategy and investment policy is to invest in debt instruments of high credit quality issuers and to limit the amount of credit exposure with respect to particular ratings categories, business sectors and any one issuer. As at
December 31, 2018
, the average rating of fixed income securities in our investment portfolio was “
AA-
” (
December 31, 2017
— “
AA-
”).
In addition, we are exposed to the credit risk of our insurance and reinsurance brokers to whom we make claims payments for our policyholders, as well as to the credit risk of our reinsurers and retrocessionaires who assume business from us. Other than fully collateralized reinsurance, the substantial majority of our reinsurers have a rating of “A” (Excellent), the third highest of fifteen rating levels, or better by A.M. Best and the minimum rating of any of our material reinsurers is “A-” (Excellent), the fourth highest of fifteen rating levels, by A.M. Best. The total amount recoverable by the Company from reinsurers as at
December 31, 2018
was
$2,077.6 million
(
2017
—
$1,515.2 million
) of which
$1,497.8 million
was uncollateralized (
2017
—
$1,001.9 million
). As at
December 31, 2018
, of the Company’s uncollateralized reinsurance recoverables,
15.7%
(
2017
—
17.0%
) were with Munich Re which is rated A+ by A.M. Best and AA- by S&P,
10.2%
(
2017
—
13.8%
) were with Lloyd’s of London Syndicates which are rated A by A.M. Best and A+ by S&P and
10.2%
(
2017
—
7.7%
) with Everest Re which is rated A+ by A.M Best and A+ by S&P. These are the Company’s largest exposures to individual reinsurers. The Company has made no provision for doubtful debts from any of its reinsurers as at
December 31, 2018
.
|
Item 8.
|
Financial Statements and Supplementary Data
|
Reference is made to Part IV, Item 15(a) of this report, commencing on page F-1, for the Consolidated Financial Statements and Reports of the Company and the Notes thereto, as well as the Schedules to the Consolidated Financial Statements.
Item 9. Changes in and Disagreements with Accountants on Accounting and Financial Disclosure
There were no disagreements with our public accounting firms on accounting and financial disclosure during the period covered by this report.
112
|
Item 9A.
|
Controls and Procedures
|
Evaluation of Disclosure Controls and Procedures
The Company, under the supervision and with the participation of the Company’s management, including the Company’s Chief Executive Officer and Chief Financial Officer, has evaluated the design and operation of the Company’s disclosure controls and procedures as of the end of the period of this report. Our management does not expect that our disclosure controls will prevent all errors and all fraud. A control system, no matter how well conceived and operated, can provide only reasonable, not absolute, assurance that the objectives of the control system are met. Further, the design of a control system must reflect the fact that there are resource constraints, and the benefits of controls must be considered relative to their costs. As a result of the inherent limitations in all control systems, no evaluation of controls can provide absolute assurance that all control issues and instances of fraud, if any, within the Company have been detected. These inherent limitations include the realities that judgments in decision-making can be faulty, and that breakdowns can occur because of a simple error or mistake. Additionally, controls can be circumvented by the individual acts of some persons or by collusion of two or more people. The design of any system of controls also is based in part upon certain assumptions about the likelihood of future events, and there can be no assurance that any design will succeed in achieving its stated goals under all potential future conditions. Over time, controls may become inadequate because of changes in conditions, or the degree of compliance with the policies or procedures may deteriorate. As a result of the inherent limitations in a cost-effective control system, misstatement due to error or fraud may occur and not be detected. Accordingly, our disclosure controls and procedures are designed to provide reasonable, not absolute, assurance that the disclosure requirements are met. Based on the evaluation of the disclosure controls and procedures, the Company’s Chief Executive Officer and Chief Financial Officer have concluded that the Company’s disclosure controls and procedures were effective in ensuring that information required to be disclosed in the reports filed or submitted to the SEC under the Exchange Act by the Company is recorded, processed, summarized and reported in a timely fashion, and is accumulated and communicated to management, including the Company’s Chief Executive Officer and Chief Financial Officer, to allow timely decisions regarding required disclosure.
Changes in Internal Control Over Financial Reporting
As part of the Effectiveness and Efficiency Program, Aspen UK Services, Aspen U.S. Services and Aspen Bermuda entered into an outsourcing agreement, dated April 1, 2018, with Genpact (UK) Limited, a company registered in England and Wales. Under the outsourcing agreement, Genpact will provide Aspen with a range of operational business processes, primarily from their offshore service center in Guragaon, India to enable Aspen to deliver greater operating effectiveness and efficiencies. On August 31, 2018, Aspen UK Services, Aspen U.S. Services and Aspen Bermuda entered into an outsourcing agreement with Cognizant Worldwide Limited, a company registered in England, on August 31, 2018 for the provision of information technology services also to enable Aspen to deliver greater operating effectiveness and efficiencies. Management has assessed the impact from the outsourcing agreements and has concluded that the outsourcing agreements do not have a material impact on the internal controls over financial reporting.
Management’s assessment of the overall effectiveness of our internal controls over financial reporting was based on the criteria set forth in
Internal Control — Integrated Framework (2013)
issued by the Committee of Sponsoring Organizations (“COSO”) of the Treadway Commission. Based upon that evaluation, the Company’s management is not aware of any change in its internal control over financial reporting that occurred during the year ended
December 31, 2018
that has materially affected, or is reasonably likely to materially affect, the Company’s internal control over financial reporting.
For management’s report on internal control over financial reporting, as well as the independent registered public accounting firm’s report thereon, see pages F-2 and F-3 of this report.
113
|
Item 9B.
|
Other Information
|
Section 219 of the Iran Threat Reduction and Syria Human Rights Act (“TRA”) added to Section 13(r) to the Securities Exchange Act of 1934 (15 U.S.C. § 78m) to require all issuers that file annual or quarterly reports with the Securities and Exchange Commission to disclose certain activities relating to Iran. Many of the activities that Section 13(r) requires be reported were previously subject to U.S. sanctions or prohibited by applicable local law. On January 16, 2016, the United States and the European Union eased sanctions against Iran pursuant to the Joint Comprehensive Plan of Action and many of the reportable activities are no longer subject to U.S. sanctions and no longer prohibited by applicable local law.
Certain of our operations located outside the United States underwrite marine, energy, and aviation treaties on a worldwide basis and, as a result, underlying insurance portfolios may have exposure to the Iranian petroleum resources, refined petroleum, and petrochemical industries. For example, certain of our operations underwrite global marine hull and cargo policies that provide coverage for vessels navigating into and out of ports worldwide, including Iran. We do not believe that any coverage we provided has directly and significantly facilitated or contributed to the Iranian petroleum resources, refined petroleum, or petrochemical industry.
Except as otherwise stated above, we are not aware of any premium apportionment with respect to underwriting insurance or reinsurance activities reportable under Section 13(r) during the quarter ended December 31, 2018. Should any other such risks have entered into the stream of commerce covered by the insurance and reinsurance portfolios underlying our treaties, we believe that the premiums associated with such business would be immaterial.
114
PART III
Item 10. Directors, Executive Officers and Corporate Governance
The information required by Item 10 is incorporated herein by reference to our definitive proxy statement or amendment to this Form 10-K to be filed with the SEC no later than April 30, 2019.
Our Board of Directors has adopted a code of ethics entitled “Code of Business Conduct and Ethics” which applies to all of our employees, officers and directors. Copies of our Code of Business Conduct and Ethics can be found on our website at
www.aspen.co
and may be obtained in print, without cost, by writing to Aspen Insurance Holdings Limited, Attention: Company Secretary, 141 Front Street, Hamilton HM19, Bermuda. We intend to satisfy applicable disclosure requirements regarding amendments to, or waivers from, provisions of our Code of Conduct by posting such information on our website.
Item 11. Executive Compensation
The information required by Item 11 is incorporated herein by reference to our definitive proxy statement or amendment to this Form 10-K to be filed with the SEC no later than April 30, 2019.
Item 12. Security Ownership of Certain Beneficial Owners and Management and Related Stockholder Matters
The information required by Item 12 relating to the security ownership of certain beneficial owners and management is incorporated herein by reference to our definitive proxy statement or amendment to this Form 10-K to be filed with the SEC no later than April 30, 2019.
Information required by Item 12 relating to securities authorized for issuance under the equity compensation plans is included in the following table as at
December 31, 2018
:
Equity Compensation Plan Information
The table below includes securities to be issued upon exercise of outstanding options and other awards granted pursuant to our 2013 Share Incentive Plan, as amended, Amended 2006 Stock Option Plan, 2008 Employee Share Purchase Plan (the “2008 Employee Share Purchase Plan”) and 2008 Sharesave Scheme (the “2008 Sharesave Scheme” and, together with the 2008 Employee Share Purchase Plan, the “2008 Employee Purchase Plans”) as at
December 31, 2018
and shares reserved for future issuance under the foregoing plans. Under the Merger Agreement, the 2008 Employee Purchase Plans will be terminated immediately prior to the consummation of the Merger, subject to and contingent upon the consummation of the Merger.
|
|
A
|
B
|
C
|
|||||||
|
Plan Category
|
Number of Securities to
Be Issued Upon Exercise
of Outstanding Options,
Warrants and Rights
|
Weighted-Average
Exercise Price of
Outstanding
Options, Warrants and
Rights
(2)
|
Number of Securities
Remaining Available for
Future Issuance Under
Equity Compensation
Plans (Excluding
Securities Reflected in
Column A)
|
|||||||
|
Equity compensation plans approved by security
holders
(1)
|
576,792
|
|
—
|
|
1,770,063
|
|
(3) (4)
|
|||
|
Equity compensation plans not approved by security holders
|
—
|
|
—
|
|
—
|
|
||||
|
Total
|
576,792
|
|
—
|
|
1,770,063
|
|
(3) (4)
|
|||
____________________
|
(1)
|
In respect of performance shares, this includes (i)
28,566
performance shares that have been earned based on applicable performance testing prior to
December 31, 2018
and (ii)
178,666
performance shares that are subject to performance testing after
December 31, 2018
which we have assumed will vest at 100.0% of target performance (the actual number of performance shares earned can range from 0.0% to 200.0% of target based on applicable performance testing).
|
|
(2)
|
The weighted average exercise price of outstanding options, warrants and rights is $Nil as there are no outstanding options.
|
|
(3)
|
The number of ordinary shares that may be issued under the 2013 Share Incentive Plan will be reduced by (i) the gross number of ordinary shares for which options or ordinary share appreciation rights are exercised, regardless of whether any of the ordinary shares underlying such awards are not actually issued to the participant as a result of a net settlement, and (ii) any ordinary shares withheld to satisfy any tax withholding obligation with respect to any award. In addition, the maximum aggregate number of ordinary shares that may be issued under the 2013 Share Incentive Plan will be cumulatively increased from time to time by the number of ordinary shares that are subject to awards outstanding pursuant to the 2003
|
115
Share Inventive Plan as of the effective date of the 2013 Share Incentive Plan, on or after such date, are forfeited, canceled, expire, terminate or lapse without payment of consideration.
|
(4)
|
Includes
588,037
ordinary shares authorized and remaining available for issuance under the 2008 Employee Purchase Plans as at
December 31, 2018
. Of these,
4,376
ordinary shares under the 2008 Employee Purchase Plans were subject to purchase rights as at
December 31, 2018
.
|
Item 13. Certain Relationships and Related Transactions, and Director Independence
The information required by Item 13 is incorporated herein by reference to our definitive proxy statement or amendment to this Form 10-K to be filed with the SEC no later than April 30, 2019.
Item 14. Principal Accounting Fees and Services
The information required by Item 14 is incorporated herein by reference to our definitive proxy statement or amendment to this Form 10-K to be filed with the SEC no later than April 30, 2019.
116
PART IV
|
Item 15.
|
Exhibits, Financial Statement Schedules
|
(a) Financial Statements, Financial Statement Schedules and Exhibits
1.
Financial Statements:
The Consolidated Financial Statements of Aspen Insurance Holdings Limited and related Notes thereto are listed in the accompanying Index to Consolidated Financial Statements and Reports on page F-1 and are filed as part of this Report.
2.
Financial Statement Schedules:
The Schedules to the Consolidated Financial Statements of Aspen Insurance Holdings Limited are listed in the accompanying Index to Schedules to Consolidated Financial Statements on page S-1 and are filed as part of this Report.
3.
Exhibits:
|
Exhibit
Number
|
Description
|
|
|
2.1
|
||
|
3.1
|
||
|
3.2
|
||
|
3.3
|
||
|
4.1
|
||
|
4.2
|
||
|
4.3
|
||
|
4.4
|
||
|
4.5
|
||
|
4.6
|
||
|
4.7
|
||
|
4.8
|
||
|
4.9
|
||
|
10.1
|
||
117
118
|
10.19
|
||
|
10.20
|
||
|
10.21
|
||
|
10.22
|
||
|
10.23
|
||
|
10.24
|
||
|
10.25
|
||
|
10.26
|
||
|
10.27
|
||
|
10.28
|
||
|
10.29
|
||
|
10.30
|
||
|
10.31
|
||
|
10.32
|
||
|
10.33
|
||
|
10.34
|
||
|
10.35
|
||
|
10.36
|
||
|
10.37
|
||
119
|
10.38
|
||
|
10.39
|
||
|
10.40
|
||
|
10.41
|
||
|
10.42
|
||
|
10.43
|
||
|
10.44
|
||
|
10.45
|
||
|
10.46
|
||
|
10.47
|
||
|
10.48
|
||
|
10.49
|
||
|
10.50
|
||
|
10.51
|
||
|
10.52
|
||
|
10.53
|
||
|
10.54
|
||
|
10.55
|
||
|
10.56
|
||
|
10.57
|
||
|
10.58
|
||
120
|
10.59
|
||
|
10.60
|
||
|
10.61
|
||
|
10.62
|
||
|
10.63
|
||
|
10.64
|
||
|
10.65
|
||
|
10.66
|
||
|
10.67
|
||
|
10.68
|
||
|
14.1
|
||
|
21.1
|
||
|
23.2
|
||
|
24.1
|
||
|
31.1
|
||
|
31.2
|
||
|
32.1
|
||
|
101
|
The following financial information from Aspen Insurance Holdings Limited’s annual report on Form 10-K for the year ended December 31, 2018 formatted in XBRL: (i) Consolidated Statements of Operations and Comprehensive Income for the twelve months ended December 31, 2018, 2017 and 2016; (ii) Consolidated Balance Sheets at December 31, 2018 and December 31, 2017; (iii) Consolidated Statements of Shareholders’ Equity for the twelve months ended December 31, 2018, 2017 and 2016; (iv) Consolidated Statements of Cash Flows for the twelve months ended December 31, 2018, 2017 and 2016; and (v) Notes to the Audited Consolidated Financial Statements, tagged as blocks of text and in detail***
|
|
|
*
|
This exhibit is a management contract or compensatory plan or arrangement.
|
|
**
|
Confidential treatment has been requested with respect to certain portions of this exhibit. Omitted portions have been separately filed with the SEC.
|
121
|
***
|
As provided in Rule 406T of Regulation S-T, this information is “furnished” herewith and not “filed” for the purposes of Sections 11 and 12 of the Securities Act and Section 18 of the Exchange Act. Such exhibit will not be deemed to be incorporated by reference into any filing under the Securities Act or the Exchange Act unless Aspen Insurance Holdings Limited specifically incorporates it by reference.
|
|
Item 16.
|
Form
10-K Summary
|
None.
122
SIGNATURES
Pursuant to the requirements of Section 13 or 15(d) of the Securities Exchange Act of 1934, this Registrant has duly caused this report to be signed on its behalf by the undersigned, thereunto duly authorized.
|
ASPEN INSURANCE HOLDINGS LIMITED
|
|||||
|
By:
|
/s/ Christopher O’Kane
|
||||
|
|
Name: Christopher O’Kane
|
||||
|
|
Title: Chief Executive Officer
|
||||
Date: February 13, 2019
POWER OF ATTORNEY
Know all men by these presents, that the undersigned directors and officers of the Company, a Bermuda limited liability company, which is filing a Form 10-K with the Securities and Exchange Commission, Washington, D.C. 20549 under the provisions of the Securities Act of 1934 hereby constitute and appoint Christopher O’Kane and Scott Kirk, and each of them, the individual’s true and lawful attorneys-in-fact and agents, with full power of substitution and resubstitution, for the person and in his or her name, place and stead, in any and all capacities, to sign such Form 10-K therewith and any and all amendments thereto to be filed with the Securities and Exchange Commission, granting unto said attorneys-in-fact and agents, and each of them full power and authority to do and perform each and every act and thing requisite and necessary to be done in and about the premises, as fully to all intents and purposes as he might or could do in person, hereby ratifying and confirming all that said attorneys-in-fact as agents or any of them, or their substitute or substitutes, may lawfully do or cause to be done by virtue hereof.
123
Pursuant to the requirements of the Securities Act of 1934, this Form 10-K has been signed by the following persons in the capacities indicated on
February 13, 2019
.
|
Signature
|
Title
|
|
|
/s/ Glyn Jones
|
Chairman and Director
|
|
|
Glyn Jones
|
|
|
|
/s/ Christopher O’Kane
|
Chief Executive Officer
(Principal Executive Officer)
|
|
|
Christopher O’Kane
|
||
|
/s/ Scott Kirk
|
Chief Financial Officer
(Principal Financial Officer)
|
|
|
Scott Kirk
|
||
|
/s/ Grahame Dawe
|
Chief Accounting Officer
(Principal Accounting Officer)
|
|
|
Grahame Dawe
|
||
|
/s/ Albert Beer
|
Director
|
|
|
Albert Beer
|
|
|
|
/s/ Matthew Botein
|
Director
|
|
|
Matthew Botein
|
|
|
|
/s/ John Cavoores
|
Director
|
|
|
John Cavoores
|
|
|
|
/s/ Gary Gregg
|
Director
|
|
|
Gary Gregg
|
|
|
|
/s/ Heidi Hutter
|
Director
|
|
|
Heidi Hutter
|
|
|
|
/s/ Gordon Ireland
|
Director
|
|
|
Gordon Ireland
|
|
|
|
/s/ Karl Mayr
|
Director
|
|
|
Karl Mayr
|
||
|
/s/ Bret Pearlman
|
Director
|
|
|
Bret Pearlman
|
|
|
|
/s/ Ronald Pressman
|
Director
|
|
|
Ronald Pressman
|
|
|
124
ASPEN INSURANCE HOLDINGS LIMITED
INDEX TO CONSOLIDATED FINANCIAL STATEMENTS AND REPORT
|
|
Page
|
|
Management’s Report on Internal Control over Financial Reporting
|
|
|
Report of Independent Registered Public Accounting Firm
|
|
|
Consolidated Financial Statements for the
Twelve Months Ended
December 31, 2018, December 31, 2017 and December 2016
|
|
|
Consolidated Statements of Operations and Comprehensive Income for the Twelve Months Ended December 31, 2018, December 31, 2017 and December 2016
|
|
|
Consolidated Balance Sheets as at December 31, 2018 and December 31, 2017
|
|
|
Consolidated Statements of Shareholders’ Equity for the Twelve Months Ended December 31, 2018, December 31, 2017 and December 2016
|
|
|
Consolidated Statements of Cash Flows for the Twelve Months Ended December 31, 2018, December 31, 2017 and December 2016
|
|
|
Notes to the Audited Consolidated Financial Statements for the Twelve Months Ended December 31, 2018, December 31, 2017 and December 2016
|
|
F-1
ASPEN INSURANCE HOLDINGS LIMITED
MANAGEMENT’S REPORT ON INTERNAL CONTROL OVER FINANCIAL REPORTING
Our management is responsible for establishing and maintaining adequate internal control over financial reporting, as is defined in Exchange Act Rule 13a-15(f) and as contemplated by Section 404 of the Sarbanes-Oxley Act. Our internal control system was designed to provide reasonable assurance regarding the reliability of financial reporting and the preparation of financial statements for external purposes in accordance with generally accepted accounting principles. All internal control systems, no matter how well designed, have inherent limitations. These limitations include the possibility that judgments in decision-making can be faulty and that breakdowns can occur because of error or mistake. Therefore, any internal control system can provide only reasonable assurance and may not prevent or detect all misstatements or omissions. In addition, our evaluation of effectiveness is as of a particular point in time and there can be no assurance that any system will succeed in achieving its goals under all future conditions.
Management assessed the effectiveness of the Company’s internal control over financial reporting as at
December 31, 2018
. In making this assessment, management used the criteria set forth by the Committee of Sponsoring Organizations of the Treadway Commission (COSO) in
Internal Control - Integrated Framework (2013).
Based on our assessment in accordance with the criteria, we believe that our internal control over financial reporting is effective as at
December 31, 2018
.
The Company’s internal control over financial reporting as at
December 31, 2018
has been audited by KPMG LLP, an independent registered public accounting firm, who also audited our consolidated financial statements. KPMG LLP’s attestation report on internal control over financial reporting appears on page F-3.
F-2
REPORT OF THE INDEPENDENT REGISTERED PUBLIC ACCOUNTING FIRM
To the Board of Directors and Stockholders of Aspen Insurance Holdings Limited
Opinions on the Consolidated Financial Statements and Internal Control Over Financial Reporting
We have audited the accompanying consolidated balance sheets of Aspen Insurance Holdings Limited and subsidiaries (the “Company”) as of December 31, 2018 and 2017, the related consolidated statements of operations and other comprehensive income, changes in shareholders’ equity and cash flows for each of the years in the three-year period ended December 31, 2018 and the related notes and financial schedules I - V (collectively, the “consolidated financial statements”). We also have audited the Company’s internal control over financial reporting as of December 31, 2018, based on criteria established in
Internal Control - Integrated Framework
(2013)
issued by the Committee of Sponsoring Organizations of the Treadway Commission.
In our opinion, the consolidated financial statements referred to above present fairly, in all material respects, the financial position of the Company as of December 31, 2018 and 2017, and the results of its operations and its cash flows for each of the years in the three-year period ended December 31, 2018, in conformity with U.S. generally accepted accounting principles. Also in our opinion, the Company maintained, in all material respects, effective internal control over financial reporting as of December 31, 2018, based on criteria established in
Internal Control - Integrated Framework (2013)
issued by the Committee of Sponsoring Organizations of the Treadway Commission.
Basis for Opinion
The Company’s management is responsible for these consolidated financial statements, for maintaining effective internal control over financial reporting, and for its assessment of the effectiveness of internal control over financial reporting, included in the accompanying Managements Report on Internal Control over Financial Reporting. Our responsibility is to express an opinion on the Company’s consolidated financial statements and an opinion on the Company’s internal control over financial reporting based on our audits. We are a public accounting firm registered with the Public Company Accounting Oversight Board (United States) (“PCAOB”) and are required to be independent with respect to the Company in accordance with the U.S. federal securities laws and the applicable rules and regulations of the Securities and Exchange Commission and the PCAOB.
We conducted our audits in accordance with the standards of the PCAOB. Those standards require that we plan and perform the audits to obtain reasonable assurance about whether the consolidated financial statements are free of material misstatement, whether due to error or fraud, and whether effective internal control over financial reporting was maintained in all material respects.
Our audits of the consolidated financial statements included performing procedures to assess the risks of material misstatement of the consolidated financial statements, whether due to error or fraud, and performing procedures that respond to those risks. Such procedures included examining, on a test basis, evidence regarding the amounts and disclosures in the consolidated financial statements. Our audits also included evaluating the accounting principles used and significant estimates made by management, as well as evaluating the overall presentation of the consolidated financial statements. Our audit of internal control over financial reporting included obtaining an understanding of internal control over financial reporting, assessing the risk that a material weakness exists, and testing and evaluating the design and operating effectiveness of internal control based on the assessed risk. Our audits also included performing such other procedures as we considered necessary in the circumstances. We believe that our audits provide a reasonable basis for our opinions.
Definition and Limitations of Internal Control Over Financial Reporting
A company’s internal control over financial reporting is a process designed to provide reasonable assurance regarding the reliability of financial reporting and the preparation of financial statements for external purposes in accordance with generally accepted accounting principles. A company’s internal control over financial reporting includes those policies and procedures that (1) pertain to the maintenance of records that, in reasonable detail, accurately and fairly reflect the transactions and dispositions of the assets of the company; (2) provide reasonable assurance that transactions are recorded as necessary to permit preparation of financial statements in accordance with generally accepted accounting principles, and that receipts and expenditures of the company are being made only in accordance with authorizations of management and directors of the company; and (3) provide reasonable assurance regarding prevention or timely detection of unauthorized acquisition, use, or disposition of the company’s assets that could have a material effect on the financial statements.
F-3
Because of its inherent limitations, internal control over financial reporting may not prevent or detect misstatements. Also, projections of any evaluation of effectiveness to future periods are subject to the risk that controls may become inadequate because of changes in conditions, or that the degree of compliance with the policies or procedures may deteriorate.
/s/ KPMG LLP
KPMG LLP
We have served as the Company’s auditor since 2002.
London, United Kingdom
February 13, 2019
F-4
ASPEN INSURANCE HOLDINGS LIMITED
CONSOLIDATED STATEMENTS OF OPERATIONS AND OTHER COMPREHENSIVE INCOME
For The
Twelve Months Ended
December 31,
2018
,
2017
and
2016
($ in millions, except share and per share amounts)
|
|
Twelve Months Ended December 31,
|
|||||||||||
|
|
2018
|
2017
|
2016
|
|||||||||
|
Revenues
|
||||||||||||
|
Net earned premium
|
$
|
2,214.7
|
|
$
|
2,306.6
|
|
$
|
2,637.3
|
|
|||
|
Net investment income
|
198.2
|
|
189.0
|
|
187.1
|
|
||||||
|
Realized and unrealized investment gains
|
110.0
|
|
148.9
|
|
108.4
|
|
||||||
|
Other income
|
9.0
|
|
8.9
|
|
5.7
|
|
||||||
|
Total revenues
|
2,531.9
|
|
2,653.4
|
|
2,938.5
|
|
||||||
|
Expenses
|
||||||||||||
|
Losses and loss adjustment expenses
|
1,573.0
|
|
1,994.7
|
|
1,576.1
|
|
||||||
|
Amortization of deferred policy acquisition costs
|
371.6
|
|
400.5
|
|
528.9
|
|
||||||
|
General, administrative and corporate expenses
|
491.7
|
|
502.2
|
|
490.1
|
|
||||||
|
Interest on long-term debt
|
25.9
|
|
29.5
|
|
29.5
|
|
||||||
|
Change in fair value of derivatives
|
31.8
|
|
(27.7
|
)
|
24.6
|
|
||||||
|
Change in fair value of loan notes issued by variable interest entities
|
4.4
|
|
(21.2
|
)
|
17.1
|
|
||||||
|
Realized and unrealized investment losses
|
174.7
|
|
28.4
|
|
63.2
|
|
||||||
|
Realized loss on debt extinguishment
|
8.6
|
|
—
|
|
—
|
|
||||||
|
Net realized and unrealized foreign exchange losses/(gains)
|
3.5
|
|
23.9
|
|
(1.8
|
)
|
||||||
|
Other expenses
|
2.7
|
|
4.9
|
|
1.3
|
|
||||||
|
Total expenses
|
2,687.9
|
|
2,935.2
|
|
2,729.0
|
|
||||||
|
(Loss)/income from operations before income tax
|
(156.0
|
)
|
(281.8
|
)
|
209.5
|
|
||||||
|
Income tax benefit/(expense)
|
10.2
|
|
15.4
|
|
(6.1
|
)
|
||||||
|
Net (loss)/income
|
$
|
(145.8
|
)
|
$
|
(266.4
|
)
|
$
|
203.4
|
|
|||
|
Amount attributable to non-controlling interest
|
(1.0
|
)
|
(1.3
|
)
|
(0.1
|
)
|
||||||
|
Net (loss)/income attributable to Aspen Insurance Holdings Limited’s ordinary shareholders
|
$
|
(146.8
|
)
|
$
|
(267.7
|
)
|
$
|
203.3
|
|
|||
|
Other Comprehensive (Loss)/Income:
|
||||||||||||
|
Available for sale investments:
|
||||||||||||
|
Reclassification adjustment for net realized gains/(losses) on investments included in net income
|
$
|
5.2
|
|
$
|
(4.0
|
)
|
$
|
(9.9
|
)
|
|||
|
Change in net unrealized gains on available for sale securities held
|
(86.5
|
)
|
(10.8
|
)
|
(29.1
|
)
|
||||||
|
Net change from current period hedged transactions
|
(2.1
|
)
|
3.0
|
|
0.6
|
|
||||||
|
Change in foreign currency translation adjustment
|
21.5
|
|
(56.4
|
)
|
(28.0
|
)
|
||||||
|
Other comprehensive (loss), gross of tax
|
(61.9
|
)
|
(68.2
|
)
|
(66.4
|
)
|
||||||
|
Tax thereon:
|
||||||||||||
|
Reclassification adjustment for net realized losses on investments included in net income
|
(0.7
|
)
|
0.4
|
|
1.0
|
|
||||||
|
Change in net unrealized gains on available for sale securities held
|
5.5
|
|
1.6
|
|
0.3
|
|
||||||
|
Net change from current period hedged transactions
|
0.3
|
|
(0.4
|
)
|
0.1
|
|
||||||
|
Change in foreign currency translation adjustment
|
(9.2
|
)
|
15.8
|
|
0.3
|
|
||||||
|
Total tax on other comprehensive (loss)/income
|
(4.1
|
)
|
17.4
|
|
1.7
|
|
||||||
|
Other comprehensive (loss), net of tax
|
(66.0
|
)
|
(50.8
|
)
|
(64.7
|
)
|
||||||
|
Total comprehensive (loss)/income attributable to Aspen Insurance Holdings Limited’s ordinary shareholders
|
$
|
(212.8
|
)
|
$
|
(318.5
|
)
|
$
|
138.6
|
|
|||
|
Per Share Data
|
||||||||||||
|
Weighted average number of ordinary share and share equivalents
(1)
|
||||||||||||
|
Basic
|
59,655,507
|
|
59,753,886
|
|
60,478,740
|
|
||||||
|
Diluted
|
59,655,507
|
|
59,753,886
|
|
61,860,689
|
|
||||||
|
Basic (loss)/earnings per ordinary share adjusted for preference share dividends
|
$
|
(2.97
|
)
|
$
|
(5.22
|
)
|
$
|
2.67
|
|
|||
|
Diluted (loss)/earnings per ordinary share adjusted for preference share dividends
|
$
|
(2.97
|
)
|
$
|
(5.22
|
)
|
$
|
2.61
|
|
|||
____________________
|
(1)
|
The basic and diluted number of ordinary shares for the twelve months ended December 31, 2018 and 2017 is the same as the inclusion of dilutive securities in a loss making period would be anti-dilutive.
|
See accompanying notes to the consolidated financial statements.
F-5
ASPEN INSURANCE HOLDINGS LIMITED
CONSOLIDATED BALANCE SHEETS
As at
December 31, 2018
and
December 31, 2017
($ in millions, except share and per share amounts)
|
As at December 31, 2018
|
As at December 31, 2017
|
|||||||
|
ASSETS
|
||||||||
|
Investments:
|
||||||||
|
Fixed income maturities, available for sale (amortized cost — $5,282.3 and $5,201.2)
|
$
|
5,230.7
|
|
$
|
5,231.0
|
|
||
|
Fixed income maturities, trading at fair value (amortized cost — $1,205.0 and $1,634.9)
|
1,187.8
|
|
1,649.3
|
|
||||
|
Equity securities, trading at fair value (cost — $0 and $414.8)
|
—
|
|
491.0
|
|
||||
|
Short-term investments, available for sale (amortized cost — $105.6 and $90.0)
|
105.6
|
|
89.9
|
|
||||
|
Short-term investments, trading at fair value (amortized cost — $9.5 and $73.0)
|
9.5
|
|
73.0
|
|
||||
|
Catastrophe bonds, trading at fair value ( cost — $37.9 and $33.5)
|
36.2
|
|
32.4
|
|
||||
|
Investments, equity method
|
67.1
|
|
66.4
|
|
||||
|
Other investments
|
102.5
|
|
—
|
|
||||
|
Total investments
|
6,739.4
|
|
7,633.0
|
|
||||
|
Cash and cash equivalents (including cash within consolidated variable interest entities of — $26.9 and $166.6)
|
1,083.7
|
|
1,054.8
|
|
||||
|
Reinsurance recoverables:
|
||||||||
|
Unpaid losses
|
2,077.6
|
|
1,515.2
|
|
||||
|
Ceded unearned premiums
|
558.8
|
|
515.5
|
|
||||
|
Receivables:
|
||||||||
|
Underwriting premiums
|
1,459.3
|
|
1,496.5
|
|
||||
|
Other
|
121.2
|
|
151.1
|
|
||||
|
Funds withheld
|
91.8
|
|
99.8
|
|
||||
|
Deferred policy acquisition costs
|
248.5
|
|
294.3
|
|
||||
|
Derivatives at fair value
|
14.6
|
|
6.4
|
|
||||
|
Receivables for securities sold
|
3.2
|
|
5.3
|
|
||||
|
Office properties and equipment
|
73.1
|
|
75.5
|
|
||||
|
Tax recoverable
|
—
|
|
2.3
|
|
||||
|
Deferred tax assets
|
35.4
|
|
28.3
|
|
||||
|
Other assets
|
—
|
|
0.5
|
|
||||
|
Intangible assets and goodwill
|
26.3
|
|
27.9
|
|
||||
|
Total assets
|
$
|
12,532.9
|
|
$
|
12,906.4
|
|
||
See accompanying notes to the consolidated financial statements.
F-6
ASPEN INSURANCE HOLDINGS LIMITED
CONSOLIDATED BALANCE SHEETS
As at
December 31, 2018
and
December 31, 2017
($ in millions, except share and per share amounts)
|
As at December 31, 2018
|
At December 31, 2017
|
|||||||
|
LIABILITIES
|
||||||||
|
Insurance reserves
|
||||||||
|
Losses and loss adjustment expenses
|
$
|
7,074.2
|
|
$
|
6,749.5
|
|
||
|
Unearned premiums
|
1,709.1
|
|
1,820.8
|
|
||||
|
Total insurance reserves
|
8,783.3
|
|
8,570.3
|
|
||||
|
Payables
|
||||||||
|
Reinsurance premiums
|
405.6
|
|
357.5
|
|
||||
|
Income taxes payable
|
0.1
|
|
—
|
|
||||
|
Accrued expenses and other payables
|
248.1
|
|
455.4
|
|
||||
|
Liabilities under derivative contracts
|
15.1
|
|
1.0
|
|
||||
|
Total payables
|
668.9
|
|
813.9
|
|
||||
|
Loan notes issued by variable interest entities, at fair value
|
—
|
|
44.2
|
|
||||
|
Long-term debt
|
424.7
|
|
549.5
|
|
||||
|
Total liabilities
|
$
|
9,876.9
|
|
$
|
9,977.9
|
|
||
|
Commitments and contingent liabilities (see Note 19)
|
—
|
|
—
|
|
||||
|
SHAREHOLDERS’ EQUITY
|
||||||||
|
Ordinary shares:
|
||||||||
|
59,743,156 shares of par value 0.15144558¢ each
(December 31, 2017 — 59,474,085) |
$
|
0.1
|
|
$
|
0.1
|
|
||
|
Preference shares:
|
||||||||
|
11,000,000 5.950% shares of par value 0.15144558¢ each
(December 31, 2017 — 11,000,000) |
—
|
|
—
|
|
||||
|
10,000,000 5.625% shares of par value 0.15144558¢ each
(December 31, 2017 —10,000,000) |
—
|
|
—
|
|
||||
|
Non-controlling interest
|
3.7
|
|
2.7
|
|
||||
|
Additional paid-in capital
|
967.5
|
|
954.7
|
|
||||
|
Retained earnings
|
1,806.6
|
|
2,026.9
|
|
||||
|
Accumulated other comprehensive (loss), net of taxes
|
(121.9
|
)
|
(55.9
|
)
|
||||
|
Total shareholders’ equity
|
2,656.0
|
|
2,928.5
|
|
||||
|
Total liabilities and shareholders’ equity
|
$
|
12,532.9
|
|
$
|
12,906.4
|
|
||
See accompanying notes to the consolidated financial statements.
F-7
ASPEN INSURANCE HOLDINGS LIMITED
CONSOLIDATED STATEMENTS OF CHANGES IN SHAREHOLDERS’ EQUITY
For The
Twelve Months Ended
December 31,
2018
,
2017
and
2016
($ in millions)
|
|
Twelve Months Ended December 31,
|
|||||||||||
|
|
2018
|
2017
|
2016
|
|||||||||
|
Ordinary shares
|
||||||||||||
|
Beginning and end of the year
|
$
|
0.1
|
|
$
|
0.1
|
|
$
|
0.1
|
|
|||
|
Preference shares
|
||||||||||||
|
Beginning and end of the year
|
—
|
|
—
|
|
—
|
|
||||||
|
Non-controlling interest
|
||||||||||||
|
Beginning of the year
|
2.7
|
|
1.4
|
|
1.3
|
|
||||||
|
Net change attributable to non-controlling interest for the year
|
1.0
|
|
1.3
|
|
0.1
|
|
||||||
|
End of the year
|
3.7
|
|
2.7
|
|
1.4
|
|
||||||
|
Additional paid-in capital
|
||||||||||||
|
Beginning of the year
|
954.7
|
|
1,259.6
|
|
1,075.3
|
|
||||||
|
New ordinary shares issued
|
2.7
|
|
0.5
|
|
2.5
|
|
||||||
|
Ordinary shares repurchased and canceled
|
—
|
|
(30.0
|
)
|
(75.0
|
)
|
||||||
|
Preference shares issued
|
—
|
|
—
|
|
241.3
|
|
||||||
|
Preference shares redeemed and canceled
|
—
|
|
(293.2
|
)
|
—
|
|
||||||
|
Preference share redemption costs
(1)
|
—
|
|
8.0
|
|
—
|
|
||||||
|
Share-based compensation
(2)
|
10.1
|
|
9.8
|
|
15.5
|
|
||||||
|
End of the year
|
967.5
|
|
954.7
|
|
1,259.6
|
|
||||||
|
Retained earnings
|
||||||||||||
|
Beginning of the year
|
2,026.9
|
|
2,392.3
|
|
2,283.6
|
|
||||||
|
Net (loss)/income for the year
|
(145.8
|
)
|
(266.4
|
)
|
203.4
|
|
||||||
|
Dividends on ordinary shares
|
(42.9
|
)
|
(56.2
|
)
|
(52.7
|
)
|
||||||
|
Dividends on preference shares
|
(30.5
|
)
|
(36.2
|
)
|
(41.8
|
)
|
||||||
|
Preference share redemption costs
(1)
|
—
|
|
(8.0
|
)
|
—
|
|
||||||
|
Net change attributable to non-controlling interest for the year
|
(1.0
|
)
|
(1.3
|
)
|
(0.1
|
)
|
||||||
|
Dividends due to non-controlling interest
|
(0.1
|
)
|
(0.1
|
)
|
(0.1
|
)
|
||||||
|
Share-based payment
(3)
|
—
|
|
2.8
|
|
—
|
|
||||||
|
End of the year
|
1,806.6
|
|
2,026.9
|
|
2,392.3
|
|
||||||
|
Accumulated other comprehensive income:
|
||||||||||||
|
Cumulative foreign currency translation adjustments, net of taxes:
|
||||||||||||
|
Beginning of the year
|
(67.7
|
)
|
(27.1
|
)
|
0.6
|
|
||||||
|
Change for the year, net of income tax
|
12.3
|
|
(40.6
|
)
|
(27.7
|
)
|
||||||
|
End of the year
|
(55.4
|
)
|
(67.7
|
)
|
(27.1
|
)
|
||||||
|
Gain/(loss) on derivatives, net of taxes:
|
||||||||||||
|
Beginning of the year
|
2.1
|
|
(0.5
|
)
|
(1.2
|
)
|
||||||
|
Net change from current period hedged transactions
|
(1.8
|
)
|
2.6
|
|
0.7
|
|
||||||
|
End of the year
|
0.3
|
|
2.1
|
|
(0.5
|
)
|
||||||
|
Unrealized appreciation on available for sale investments, net of taxes:
|
||||||||||||
|
Beginning of the year
|
9.7
|
|
22.5
|
|
60.2
|
|
||||||
|
Change for the year, net of taxes
|
(76.5
|
)
|
(12.8
|
)
|
(37.7
|
)
|
||||||
|
End of the year
|
(66.8
|
)
|
9.7
|
|
22.5
|
|
||||||
|
Total accumulated other comprehensive (loss), net of taxes
|
(121.9
|
)
|
(55.9
|
)
|
(5.1
|
)
|
||||||
|
Total shareholders’ equity
|
$
|
2,656.0
|
|
$
|
2,928.5
|
|
$
|
3,648.3
|
|
|||
____________________
|
(1)
|
The
$8.0 million
deduction from net income in 2017 is attributable to the reclassification from additional paid-in capital to retained earnings representing the difference between the capital raised upon issuance of the
7.401%
and
7.250%
Perpetual Non-Cumulative Preference Shares, net of issuance costs, and the final redemption costs of
$293.2 million
.
|
|
(2)
|
The balance in 2017 includes
$7.9 million
reclassification from accrued expenses and other payable as a result of the classification of restricted share units as equity following the adoption of ASU 2016-09 -“
Compensation — Stock Compensation
”.
|
|
(3)
|
The
$2.8 million
relates to the cumulative effect-adjustment to opening retained earnings as a result of the classification of restricted share units as equity following the adoption of ASU 2016-09. The adjustment has been applied using a modified retrospective approach.
|
See accompanying notes to the consolidated financial statements.
F-8
ASPEN INSURANCE HOLDINGS LIMITED
CONSOLIDATED STATEMENTS OF CASH FLOWS
For The
Twelve Months Ended
December 31,
2018
,
2017
and
2016
($ in millions)
|
|
Twelve Months Ended December 31,
|
|||||||||||
|
|
2018
|
2017
|
2016
|
|||||||||
|
Cash flows (used in)/from operating activities:
|
||||||||||||
|
Net (loss)/income
|
$
|
(145.8
|
)
|
$
|
(266.4
|
)
|
$
|
203.4
|
|
|||
|
Proportion due to non-controlling interest
|
(1.0
|
)
|
(1.3
|
)
|
(0.1
|
)
|
||||||
|
Adjustments to reconcile net income to net cash flows from operating activities:
|
||||||||||||
|
Depreciation and amortization
|
43.4
|
|
62.2
|
|
51.5
|
|
||||||
|
Share-based compensation
|
10.1
|
|
9.8
|
|
15.5
|
|
||||||
|
Realized and unrealized investment (gains)
|
(110.0
|
)
|
(148.9
|
)
|
(108.4
|
)
|
||||||
|
Realized and unrealized investment losses
|
174.7
|
|
28.4
|
|
63.2
|
|
||||||
|
Deferred tax (benefit)/expenses
|
(7.1
|
)
|
(32.5
|
)
|
9.4
|
|
||||||
|
Change in fair value of loan notes issued by variable interest entities
|
4.4
|
|
(21.2
|
)
|
17.1
|
|
||||||
|
Net realized and unrealized investment foreign exchange (gains)/losses
|
(0.8
|
)
|
(15.0
|
)
|
1.4
|
|
||||||
|
Net change from current period hedged transactions
|
(1.8
|
)
|
2.6
|
|
0.7
|
|
||||||
|
Changes in:
|
||||||||||||
|
Insurance reserves:
|
||||||||||||
|
Losses and loss adjustment expenses
|
402.5
|
|
1,292.2
|
|
466.2
|
|
||||||
|
Unearned premiums
|
(91.6
|
)
|
174.1
|
|
23.9
|
|
||||||
|
Reinsurance recoverables:
|
||||||||||||
|
Unpaid losses
|
(575.8
|
)
|
(943.7
|
)
|
(219.9
|
)
|
||||||
|
Ceded unearned premiums
|
(44.8
|
)
|
(257.6
|
)
|
(87.6
|
)
|
||||||
|
Other receivables
|
29.9
|
|
(48.2
|
)
|
1.4
|
|
||||||
|
Deferred policy acquisition costs
|
41.7
|
|
69.4
|
|
2.4
|
|
||||||
|
Reinsurance premiums payable
|
52.1
|
|
23.8
|
|
234.0
|
|
||||||
|
Funds withheld
|
8.0
|
|
(26.7
|
)
|
(37.1
|
)
|
||||||
|
Premiums receivable
|
31.6
|
|
(88.7
|
)
|
(271.1
|
)
|
||||||
|
Income tax payable
|
1.6
|
|
15.9
|
|
(20.1
|
)
|
||||||
|
Accrued expenses and other payable
|
(88.2
|
)
|
147.0
|
|
75.7
|
|
||||||
|
Fair value of derivatives and settlement of liabilities under derivatives
|
5.9
|
|
(16.6
|
)
|
16.4
|
|
||||||
|
Long-term debt and loan notes issued by variable interest entities
|
(44.0
|
)
|
(70.6
|
)
|
12.2
|
|
||||||
|
Other assets
|
0.5
|
|
0.5
|
|
3.1
|
|
||||||
|
Net cash (used in)/generated by operating activities
|
$
|
(304.5
|
)
|
$
|
(111.5
|
)
|
$
|
453.2
|
|
|||
See accompanying notes to the consolidated financial statements.
F-9
ASPEN INSURANCE HOLDINGS LIMITED
CONSOLIDATED STATEMENTS OF CASH FLOWS
For The
Twelve Months Ended
December 31,
2018
,
2017
and
2016
($ in millions)
|
|
Twelve Months Ended December 31,
|
|||||||||||
|
|
2018
|
2017
|
2016
|
|||||||||
|
Cash flows from/(used in) investing activities:
|
|
|||||||||||
|
(Purchases) of fixed income securities — Available for sale
|
$
|
(1,785.6
|
)
|
$
|
(1,573.2
|
)
|
$
|
(2,236.7
|
)
|
|||
|
(Purchases) of fixed income securities — Trading
|
(1,260.9
|
)
|
(1,312.9
|
)
|
(973.3
|
)
|
||||||
|
Proceeds from sales and maturities of fixed income securities — Available for sale
|
1,647.1
|
|
2,018.8
|
|
2,307.9
|
|
||||||
|
Proceeds from sales and maturities of fixed income securities — Trading
|
1,661.0
|
|
957.6
|
|
593.7
|
|
||||||
|
(Purchases) of equity securities — Trading
|
(16.5
|
)
|
(131.3
|
)
|
(195.3
|
)
|
||||||
|
Net proceeds of catastrophe bonds — Trading
|
(4.1
|
)
|
7.4
|
|
12.8
|
|
||||||
|
Proceeds from sales of equity securities — Trading
|
505.6
|
|
316.3
|
|
372.0
|
|
||||||
|
(Purchases) of short-term investments — Available for sale
|
(130.8
|
)
|
(130.7
|
)
|
(224.6
|
)
|
||||||
|
Proceeds from sale of short-term investments — Available for sale
|
113.2
|
|
189.5
|
|
242.9
|
|
||||||
|
(Purchases) of short-term investments — Trading
|
(16.4
|
)
|
(96.0
|
)
|
(190.6
|
)
|
||||||
|
Proceeds from sale of short-term investments — Trading
|
78.9
|
|
212.0
|
|
14.1
|
|
||||||
|
Net change in (payable)/receivable for securities (purchased)/sold
|
(5.5
|
)
|
(9.9
|
)
|
12.7
|
|
||||||
|
(Purchases) of other investments — real estate fund
|
(100.0
|
)
|
—
|
|
—
|
|
||||||
|
Net proceeds in (purchases)/sales from other investments
|
—
|
|
(0.5
|
)
|
—
|
|
||||||
|
(Net) purchases of equipment
|
(27.3
|
)
|
(35.0
|
)
|
(23.7
|
)
|
||||||
|
Sale of investment
|
—
|
|
9.3
|
|
—
|
|
||||||
|
Net (purchases) of investments, equity method
|
(1.4
|
)
|
(2.4
|
)
|
(3.3
|
)
|
||||||
|
Payments for acquisitions and investments, net of cash acquired
|
—
|
|
—
|
|
(59.5
|
)
|
||||||
|
Net cash from/(used in) investing activities
|
657.3
|
|
419.0
|
|
(350.9
|
)
|
||||||
|
Cash flows (used in)/from financing activities:
|
||||||||||||
|
Proceeds from the issuance of ordinary shares, net of issuance costs
|
2.7
|
|
0.5
|
|
2.5
|
|
||||||
|
Ordinary shares repurchased
|
—
|
|
(30.0
|
)
|
(75.0
|
)
|
||||||
|
Proceeds from the issuance of preference shares, net of issuance costs
|
—
|
|
—
|
|
241.3
|
|
||||||
|
Preference share redemption
|
—
|
|
(293.2
|
)
|
—
|
|
||||||
|
Proceeds from loan notes issued by Silverton
|
—
|
|
—
|
|
105.0
|
|
||||||
|
Repayment of long-term debt issued by Silverton
|
(86.4
|
)
|
(115.6
|
)
|
(89.3
|
)
|
||||||
|
Dividends paid on ordinary shares
|
(42.9
|
)
|
(56.2
|
)
|
(52.7
|
)
|
||||||
|
Dividends paid on preference shares
|
(30.5
|
)
|
(36.2
|
)
|
(41.8
|
)
|
||||||
|
Dividends paid to non-controlling interest
|
(0.1
|
)
|
(0.1
|
)
|
—
|
|
||||||
|
Contingent consideration - earn out provision settlement
|
(11.7
|
)
|
—
|
|
—
|
|
||||||
|
Long-term debt redeemed
|
(125.0
|
)
|
—
|
|
—
|
|
||||||
|
Make-whole payment
|
(8.6
|
)
|
—
|
|
—
|
|
||||||
|
Cash paid for tax withholding purposes
(1)
|
(4.7
|
)
|
(9.6
|
)
|
—
|
|
||||||
|
Net cash (used in)/from financing activities
|
(307.2
|
)
|
(540.4
|
)
|
90.0
|
|
||||||
|
Effect of exchange rate movements on cash and cash equivalents
|
(16.7
|
)
|
13.9
|
|
(18.0
|
)
|
||||||
|
Increase/(decrease) in cash and cash equivalents
|
28.9
|
|
(219.0
|
)
|
174.3
|
|
||||||
|
Cash and cash equivalents at beginning of period
|
1,054.8
|
|
1,273.8
|
|
1,099.5
|
|
||||||
|
Cash and cash equivalents at end of period
|
$
|
1,083.7
|
|
$
|
1,054.8
|
|
$
|
1,273.8
|
|
|||
|
Supplemental disclosure of cash flow information:
|
||||||||||||
|
Net cash (received)/paid during the period for income tax
|
$
|
(0.3
|
)
|
$
|
3.4
|
|
$
|
7.0
|
|
|||
|
Cash paid during the period for interest
|
$
|
25.3
|
|
$
|
29.0
|
|
$
|
29.0
|
|
|||
____________________
|
(1)
|
The cash paid to the tax authority when withholding shares from employees’ awards for tax-withholding purposes has been reclassified from operating activity to financing activity following the adoption of ASU 2016-09 -“
Compensation — Stock Compensation
”.
|
See accompanying notes to the consolidated financial statements.
F-10
ASPEN INSURANCE HOLDINGS LIMITED
NOTES TO THE AUDITED CONSOLIDATED FINANCIAL STATEMENTS
For The
Twelve Months Ended
December 31,
2018
,
2017
and
2016
($ in millions, except share and per share amounts)
|
1.
|
History, Organization and Business Combination
|
History and Organization.
Aspen Insurance Holdings Limited (“Aspen Holdings”) was incorporated on May 23, 2002 as a holding company headquartered in Bermuda. We underwrite specialty insurance and reinsurance on a global basis through our Operating Subsidiaries (as defined below) based in Bermuda, the United States and the United Kingdom: Aspen Insurance UK Limited (“Aspen U.K.”) and Aspen Underwriting Limited (corporate member of Lloyd’s Syndicate 4711, “AUL” and managed by Aspen Managing Agency Limited (“AMAL”)) (United Kingdom), Aspen Bermuda Limited (“Aspen Bermuda”) (Bermuda), Aspen Specialty Insurance Company (“Aspen Specialty”) and Aspen American Insurance Company (“AAIC”) (United States) (collectively, the “Operating Subsidiaries”). We also have branches in Australia, Canada, Ireland, Singapore, Switzerland and the United Arab Emirates. We established Aspen Capital Management, Ltd. and other related entities (collectively, “ACM”) to leverage our existing underwriting franchise, increase our operational flexibility in the capital markets and provide investors direct access to our underwriting expertise. References to the “Company,” the “Aspen Group,” “we,” “us” or “our” refer to Aspen Holdings or Aspen Holdings and its subsidiaries.
Business Combination.
On August 27, 2018, the Company entered into a definitive Agreement and Plan of Merger (the “Merger Agreement”) with Highlands Holdings, Ltd., a Bermuda exempted company (“Highlands”), and Highlands Merger Sub, Ltd., a Bermuda exempted company and wholly owned subsidiary of Highlands (“Merger Sub”). Under the Merger Agreement, subject to the satisfaction or waiver of certain conditions set forth therein, and in the related statutory merger agreement, the Company will merge with and into Merger Sub in accordance with the Bermuda Companies Act (the “Merger”), with the Company surviving the Merger as a wholly-owned subsidiary of Highlands. Highlands and Merger Sub are affiliates of certain investment funds managed by affiliates of Apollo Global Management, LLC, a leading global alternative investment manager. As previously announced, Christopher O’Kane will step down from his position as Group Chief Executive Officer and director of the Board of Directors of the Company (the “Board”) on or shortly after the completion of the Merger and, subject to and contingent upon the Merger, will be replaced by Mark Cloutier.
Pursuant to the Merger Agreement, at the effective time of the Merger, each ordinary share of the Company issued and outstanding immediately prior to such time (other than ordinary shares owned by Aspen as treasury shares, owned by any subsidiary of the Company or owned by Highlands, Merger Sub or any of their respective subsidiaries, which will be canceled as set forth in the Merger Agreement) will be converted into the right to receive
$42.75
in cash, without interest and less any required withholding taxes. At the effective time of the Merger, each of the Company’s issued and outstanding
5.95%
Fixed-to-Floating Rate Perpetual Non-Cumulative Preference Shares and
5.625%
Perpetual Non-Cumulative Preference Shares (collectively, the “Preference Shares”) will remain issued and outstanding. The Merger Agreement restricts the Company from declaring or paying any dividends other than the quarterly dividends on Aspen’s ordinary shares that were previously declared and publicly announced prior to the date of the Merger Agreement and periodic cash dividends on the Preference Shares in accordance with the terms of the applicable certificate of designation.
All required regulatory approvals in connection with the Merger have been obtained and we anticipate that the Merger will be completed shortly. The Merger is subject to the satisfaction or waiver of a number of conditions, including, among others, the maintenance of certain financial strength ratings of the Operating Subsidiaries. The Merger Agreement also contains certain termination rights, including Highlands’ right to terminate if we suffered aggregate net losses exceeding
$350 million
resulting from certain catastrophic events occurring between July 1, 2018 and January 31, 2019. We do not believe that the net catastrophe losses arising from such catastrophic events during the specified period exceeded
$350 million
. For further details on the potential risks related to the Merger, refer to Part I, Item 1A, “Risk Factors — Risks Relating to the Merger.” For further details on the Merger, refer to Part II, Item 7, “Management’s Discussion and Analysis of Financial Condition and Results of Operations — Aspen’s Year In Review” and Note 19(d) of our consolidated financial statements, “Commitments and Contingencies — Contingent Liabilities.”
|
2.
|
Basis of Presentation and Significant Accounting Policies
|
The consolidated financial statements of Aspen Holdings are prepared in accordance with United States Generally Accepted Accounting Principles (“U.S. GAAP”) and are presented on a consolidated basis including the transactions of all operating subsidiaries (voting interest entity’s or “VOE”) in which the Company has a controlling financial interest and variable interest entity’s (“VIE”) in which the Company is considered to be the primary beneficiary. Transactions between Aspen Holdings and its subsidiaries are eliminated within the consolidated financial statements.
F-11
|
(a)
|
Use of Estimates
|
Assumptions and estimates made by management have a significant effect on the amounts reported within the consolidated financial statements. The most significant of these relate to losses and loss adjustment expenses, reinsurance recoverables, gross written premiums and commissions which have not been reported to the Company such as those relating to proportional treaty reinsurance contracts, unrecognized tax benefits, the fair value of derivatives and the fair value of other investments. All material assumptions and estimates are regularly reviewed and adjustments made as necessary but actual results could be significantly different from those expected when the assumptions or estimates were made.
|
(b)
|
Accounting for Insurance and Reinsurance Operations
|
Premiums Earned.
Premiums are recorded as written on the inception date of a policy. Premiums are primarily recognized as revenues proportionately over the coverage period. Premiums earned are recorded in the statements of operations, net of the cost of purchased reinsurance. Premiums written which are not yet recognized as earned premium are recorded in the consolidated balance sheet as unearned premiums, gross of any ceded unearned premiums. Written and earned premiums and the related costs include estimates for premiums which have not been finally determined. These relate mainly to contractual provisions for the payment of adjustment or additional premiums, premiums payable under proportional treaties and delegated underwriting authorities, and reinstatement premiums.
Adjustment and additional premiums are premiums charged which relate to experience during the policy term. The proportion of adjustable premiums included in the premium estimates varies between business lines with the largest adjustment premiums being in property and casualty reinsurance, marine, aviation and energy insurance and the smallest in property and casualty insurance.
Premiums payable under proportional treaty contracts and delegated underwriting authorities are generally not reported to the Company until after the reinsurance coverage is in force. As a result, an estimate of these “pipeline” premiums is recorded. The Company estimates pipeline premiums based on projections of ultimate premium taking into account reported premiums and expected development patterns.
Reinstatement premiums on assumed excess of loss reinsurance contracts are provided based on experience under such contracts. Reinstatement premiums are the premiums charged for the restoration of the reinsurance limit of an excess of loss contract to its full amount after payment by the reinsurer of losses as a result of an occurrence. Reinstatement premiums are recognized as revenue in full at the date of loss, triggering the payment of the reinstatement premiums. The payment of reinstatement premiums provides future insurance cover for the remainder of the initial policy term. An allowance for uncollectible premiums is established for possible non-payment of premium receivables, as deemed necessary.
Outward reinsurance premiums, which are paid when the Company purchases reinsurance or retrocessional coverage, are accounted for using the same accounting methodology as the Company uses for inwards premiums. Premiums payable under reinsurance contracts that operate on a “losses occurring during” basis are accounted for in full over the period of coverage while those arising from “risks attaching during” policies are expensed over the earnings period of the premiums receivable from the reinsured business. Premiums payable for retroactive reinsurance coverage and meeting the conditions of reinsurance accounting, are reported as reinsurance recoverables to the extent that those amounts do not exceed recorded liabilities relating to underlying reinsurance contracts. To the extent that recorded liabilities on an underlying reinsurance contract exceed premiums payable for retroactive coverage, a deferred gain is recognized.
Losses and Loss Adjustment Expenses.
Losses represent the amount paid or expected to be paid to claimants in respect of events that have occurred on or before the balance sheet date. The costs of investigating, resolving and processing these claims are known as loss adjustment expenses (“LAE”). The statement of operations records these losses net of reinsurance, meaning that gross losses and loss adjustment expenses incurred are reduced by the amounts recovered or expected to be recovered under reinsurance contracts.
Reinsurance.
Written premiums, earned premiums, incurred claims, LAE and the amortization of deferred policy acquisition costs all reflect the net effect of assumed and ceded reinsurance transactions. Assumed reinsurance refers to the Company’s acceptance of certain insurance risks that other insurance companies have underwritten. Ceded reinsurance arises from contracts under which other insurance companies agree to share certain risks with the Company.
Reinsurance accounting is followed when there is significant timing risk, significant underwriting risk and a reasonable possibility of significant loss. Reinsurance and retrocession does not isolate the ceding company from its obligations to policyholders. In the event that a reinsurer or retrocessionaire fails to meet its obligations, the ceding company’s obligations remain. The Company regularly evaluates the financial condition of its reinsurers and retrocessionaires and monitors the concentration of credit risk to minimize its exposure to financial loss from reinsurers’ and retrocessionaires’ insolvency. Where it is considered required, appropriate provision is made for balances deemed irrecoverable from reinsurers.
F-12
Reserves.
Insurance reserves are established for the total unpaid cost of claims and LAE in respect of events that have occurred by the balance sheet date, including the Company’s estimates of the total cost of claims incurred but not yet reported (“IBNR”). Claim reserves are reduced for estimated amounts of salvage and subrogation recoveries. Estimated amounts recoverable from reinsurers on unpaid losses and LAE are reflected as assets.
For reported claims, reserves are established on a case-by-case basis within the parameters of coverage provided in the insurance policy or reinsurance agreement. For IBNR claims, reserves are estimated using a number of established actuarial methods to establish a range of estimates from which a management best estimate is selected. Both case and IBNR reserve estimates consider variables such as past loss experience, changes in legislative conditions, changes in judicial interpretation of legal liability, policy coverages and inflation.
As many of the coverages underwritten involve claims that may not be ultimately settled for many years after they are incurred, subjective judgments as to the ultimate exposure to losses are an integral and necessary component of the loss reserving process. The Company regularly reviews its reserves, using a variety of statistical and actuarial techniques to analyze current claims costs, frequency and severity data, and prevailing economic, social and legal factors. Reserves established in prior periods are adjusted as claim experience develops and new information becomes available. Adjustments to previously estimated reserves are reflected in the financial results of the period in which the adjustments are made.
The process of estimating required reserves does, by its very nature, involve considerable uncertainty. The level of uncertainty can be influenced by factors such as the existence of coverage with long duration payment patterns and changes in claims handling practices, as well as the factors noted above. Ultimate actual payments for claims and LAE could turn out to be significantly different from the Company’s estimates.
Amortization of Deferred Policy Acquisition Costs.
The costs directly related to writing an insurance policy are referred to as policy acquisition expenses and include commissions, premium taxes and profit commissions. With the exception of profit commissions, these expenses are incurred when a policy is issued, and only the costs directly related to the successful acquisition of new and renewal insurance and reinsurance contracts are deferred and amortized over the same period as the corresponding premiums are recorded as revenues. Profit commissions are estimated based on the related performance criteria evaluated at the balance sheet date, with subsequent changes to those estimates recognized when they occur.
On a regular basis a recoverability analysis is performed of the deferred policy acquisition costs in relation to the expected recognition of revenues, including anticipated investment income, and adjustments, if any, are reflected as period costs. Should the analysis indicate that the acquisition costs are unrecoverable, further analyses are performed to determine if a reserve is required to provide for losses which may exceed the related unearned premium.
General, Administrative and Corporate Expenses.
These costs represent the expenses incurred in running the business and include, but are not limited to compensation costs for employees, rental costs, IT development and operating costs and professional and consultancy fees. General, policy and administrative costs directly attributable to the successful acquisition of business are deferred and amortized over the same period as the corresponding premiums are recorded as revenues. When reporting the results for its business segments, the Company includes expenses which are directly attributable to the segment plus an allocation of central administrative costs. Corporate expenses are not allocated to the Company’s business segments as they typically do not fluctuate with the levels of premium written and are related to the Company’s operations which include group executive costs, group finance costs, group legal and actuarial costs and certain strategic and non-recurring costs.
|
(c)
|
Accounting for Investments, Cash and Cash Equivalents
|
Fixed Income Securities.
The fixed income securities portfolio comprises securities issued by governments and government agencies, corporate bonds, mortgage and other asset-backed securities and bank loans. Investments in fixed income securities are classified as available for sale or trading and are reported at estimated fair value in the consolidated balance sheet. Investment transactions are recorded on the trade date with balances pending settlement reflected in the consolidated balance sheet under receivables for securities sold and accrued expenses and other payables for securities purchased, respectively. Fair values are based on quoted market prices and other data provided by third-party pricing services and index providers.
Equity Securities.
The Company’s equity securities comprise U.S. and foreign equity securities. They are classified as trading and are carried on the consolidated balance sheet at estimated fair value. The fair values are based on quoted market prices in active markets from independent pricing sources.
Short-term Investments.
Short-term investments primarily comprise highly liquid debt securities with a maturity greater than three months but less than one year from the date of purchase and are held as part of the investment portfolio of the Company. Short-term investments are classified as either trading or available for sale and carried at estimated fair value.
F-13
Gains and Losses.
Realized gains or losses on the sale of investments are determined on the basis of the first in first out cost method and, for fixed income available for sale securities, include adjustments to the cost basis of investments for declines in value that are considered to be other-than-temporary. Unrealized gains and losses represent the difference between the cost, or the cost as adjusted by amortization of any difference between its cost and its redemption value (“amortized cost”), of the security and its fair value at the reporting date and are included within other comprehensive income for securities classified as available for sale and in realized and unrealized investment gains or losses in the consolidated statement of operations for securities classified as trading.
Other Investments, Equity Method.
Other investments represent the Company’s investments that are recorded using the equity method of accounting. Adjustments to the fair value of these investments are made based on the net asset value of the investment.
Other investments.
Other investments represent the Company’s investment in a real estate fund. Adjustments to the fair value are made based on the net asset value of the investment.
Catastrophe Bonds.
Investments in catastrophe bonds are classified as trading and are carried on the consolidated balance sheet at estimated fair value. The fair values are based on independent broker-dealer quotes.
Cash and Cash Equivalents.
Cash and cash equivalents are carried at fair value. Cash and cash equivalents comprise cash on hand, deposits held on call with banks and other short-term highly liquid investments due to mature within three months from the date of purchase and which are subject to insignificant risk of change in fair value.
Other-than-temporary Impairment of Investments.
A security is impaired when its fair value is below its cost or amortized cost. The Company reviews its investment portfolio each quarter on an individual security basis for potential other-than-temporary impairment (“OTTI”) based on criteria including issuer-specific circumstances, credit ratings actions and general macro-economic conditions.
OTTI is deemed to occur when there is no objective evidence to support recovery in value of a security and (i) the Company intends to sell the security or more likely than not will be required to sell the security before recovery of its cost or adjusted amortized cost basis or (ii) it is deemed probable that the Company will be unable to collect all amounts due according to the contractual terms of the individual security. In the first case, the entire unrealized loss position is taken as an OTTI charge to realized losses in earnings. In the second case, the unrealized loss is separated into the amount related to credit loss and the amount related to all other factors. The OTTI charge related to credit loss is recognized in realized losses in earnings and the amount related to all other factors is recognized in other comprehensive income. The cost basis of the investment is reduced accordingly and no adjustments to the cost basis are made for subsequent recoveries in value.
Although the Company reviews each security on a case by case basis, it has also established parameters focusing on the extent and duration of impairment to help identify securities in an unrealized loss position which are other-than-temporarily impaired. For fixed income securities in the available for sale portfolio, the Company considers securities which have been in an unrealized loss position for
12 months
or more which currently have a market value of more than
20%
below cost should be other-than-temporarily impaired.
Investment Income.
Investment income includes amounts received and accrued in respect of periodic interest (“coupons”) payable to the Company by the issuer of fixed income securities, equity dividends and interest credited on cash and cash equivalents. It also includes amortization of premium and accretion of discount in respect of fixed income securities. Investment management and custody fees are charged against net investment income reported in the consolidated statement of operations.
|
(d)
|
Accounting for Derivative Financial Instruments
|
The Company enters into derivative instruments such as interest rate swaps and forward exchange contracts in order to manage certain market and credit risks. The Company records derivative instruments at fair value on the Company’s balance sheet as either assets or liabilities, depending on their rights and obligations.
The accounting for the gain or loss due to the changes in the fair value of these instruments is dependent on whether the derivative qualifies as a hedge. If the derivative does not qualify as a hedge, the gains or losses are reported in earnings when they occur. If the derivative does qualify as a hedge, the accounting treatment varies based on the type of risk being hedged.
|
(e)
|
Accounting for Intangible Assets
|
Intangible assets are held in the consolidated balance sheet at cost less amortization and impairment. Amortization applies on a straight-line basis in respect of assets having a finite estimated useful economic life. The Company performs a qualitative assessment annually to determine whether it is more likely than not that an intangible asset considered to have an indefinite life
F-14
is impaired. Goodwill is assessed annually for impairment or more frequently if circumstances indicate an impairment may have occurred.
|
(f)
|
Accounting for Office Properties and Equipment
|
Office properties and equipment are carried at cost less accumulated depreciation. These assets are depreciated on a straight-line basis over the estimated useful lives of the assets. Computer equipment and software is depreciated between
three
and
five
years with depreciation for software commencing on the date the software is brought into use. Furniture and fittings are depreciated over
four
years and leasehold improvements are depreciated over the lesser of
15 years
or the lease term.
|
(g)
|
Accounting for Foreign Currencies Translation
|
The reporting currency of the Company is the U.S. Dollar. The functional currencies of the Company’s foreign operations and branches are the currencies in which the majority of their business is transacted.
Transactions in currencies other than the functional currency are measured in the functional currency of that operation at the exchange rate prevailing at the date of the transaction. Monetary assets and liabilities denominated in non-functional currencies are remeasured at the exchange rate prevailing at the balance sheet date and any resulting foreign exchange gains or losses are reflected in the statement of operations.
Monetary and non-monetary assets and liabilities of the Company’s functional currency operations are translated into U.S. Dollars at the exchange rate prevailing at the balance sheet date. Income and expenses of these operations are translated at the exchange rate prevailing at the date of the transaction. Unrealized gains or losses arising from the translation of functional currencies are recorded net of tax as a component of other comprehensive income.
|
(h)
|
Accounting for Earnings per Ordinary Share
|
Basic earnings per ordinary share is determined by dividing net income available to ordinary shareholders by the weighted average number of ordinary shares outstanding during the period. Net income available to ordinary shareholders is calculated by deducting preference share dividends and net income/(loss) attributable to non-controlling interest from net income after tax for the period. Diluted earnings per share reflect the effect on earnings of the average number of ordinary shares outstanding associated with dilutive securities. The dilutive effect of potentially dilutive securities is calculated using the treasury stock method.
|
(i)
|
Accounting for Income Taxes
|
Income taxes are accounted for under the asset and liability method. Deferred tax assets and liabilities are recognized for the future tax consequences attributable to differences between the financial statement carrying amounts of existing assets and liabilities and their respective tax bases and operating loss and tax credit carryforwards. Deferred tax assets and liabilities are measured using enacted tax rates expected to apply to taxable income in the years in which those temporary differences are expected to be recovered or settled. When the Company does not believe that, on the basis of available information, it is more likely than not that deferred tax assets will be fully recovered, it recognizes a valuation allowance against its deferred tax assets to reduce the deferred tax assets to the amount more likely than not to be realized. The effect on deferred tax assets and liabilities of a change in tax rates is recognized in income in the period that includes the enactment date.
Furthermore, a tax benefit from a tax position may be recognized in the financial statements only if it is more-likely-than-not that the position is sustainable, based solely on its technical merits and consideration of the relevant tax authority’s widely understood administrative practices and precedents.
The tax benefit recognized, when the likelihood of realization is more likely-than-not (i.e. greater than 50 percent), is measured at the largest amount that is greater than 50 percent likely of being realized upon settlement.
|
(j)
|
Accounting for Preference Shares
|
The Company had at the balance sheet date in issue two classes of preference shares. The Company has no obligation to pay interest on these securities but they carry entitlements to dividends payable at the discretion of the Board of Directors. In the event of non-payment of dividends for
six
consecutive periods, holders of preference shares have director appointment rights. The preference shares are therefore accounted for as equity instruments and included within total shareholders’ equity.
|
(k)
|
Accounting for Long-term Incentive Plans
|
The Company operates an employee share incentive plan, a non-executive director stock incentive plan and employee share purchase plans, the terms and conditions of which are described in Note 17. The Company applies a fair-value based measurement method including estimates for future forfeitures in the calculation of the compensation costs of stock options, performance shares, phantom shares and restricted share units.
F-15
|
(l)
|
Accounting for Long-term Debt Issued by Variable Interest Entities
|
Silverton, a consolidated variable interest entity, has issued debt instruments which are due to mature on September 16, 2019 as further described in Note 7, “Variable Interest Entities” of these consolidated financial statements. This debt is separately identified on the Company’s balance sheet and the Company has elected to record the debt at fair value due to the potential variability over the ultimate settlement value of the debt instruments.
|
(m)
|
Accounting for Business Combinations
|
The Company accounts for a transaction as a business combination where the assets acquired and liabilities assumed following a transaction constitute a business. An acquired entity must have inputs and processes that make it capable of generating a return or economic benefit to be considered a business. If the assets acquired are not a business, the Company accounts the transaction as an asset acquisition. The Company recognizes and measures at fair value 100 percent of the assets and liabilities of any acquired business. Goodwill is recognized and measured as the difference between the consideration paid or payable less the fair value of assets acquired.
The Company accounts for the disposal of subsidiary undertakings when it ceases to control the subsidiary’s assets and liabilities or the group of assets. A gain or loss is recognized and measured as the difference between the fair value of consideration received or receivable and the value of assets, liabilities and equity components de-recognized, related to that subsidiary or group of assets when deconsolidated.
Costs that are directly related to a business combination transaction are expensed in the periods in with the costs are incurred and the services are received.
|
(n)
|
Accounting Pronouncements
|
Accounting Pronouncements Adopted in 2018
On August 12, 2015, the Financial Standards Accounting Board (“FASB”) issued ASU 2015-14, “
Revenue from Contracts with Customers (Topic 606)”
which delayed the effective date of ASU 2014-09 by one year. This ASU is effective for annual periods beginning after December 15, 2017. Adoption of this ASU did not have a material impact on the Company’s consolidated financial statements because insurance contracts accounted for within the scope of Topic 944, Financial Services are exempt from this ASU and the Company has immaterial other revenue.
On January 5, 2016, the FASB issued ASU 2016-1, “
Financial Instruments - Overall (Subtopic 825-10)”
which enhances the reporting model for financial instruments. Included within the requirements of this ASU are the following: a) equity investments to be measured at fair value with changes in fair value recognized in net income; b) a simplification of the impairment assessment of equity investments without readily determinable fair values; c) public business entities to use the exit price concept when measuring the fair value of financial instruments for disclosure purposes; and d) clarifies that an entity should evaluate the need for a valuation allowance on a deferred tax asset related to available-for-sale securities in combination with the entity’s other deferred tax assets. The amendments required as a result of this ASU are effective for fiscal years beginning after December 15, 2017. Adoption of this ASU did not have a material impact on the Company’s consolidated financial statements because the Company’s equity portfolio, prior to being sold, was classified as held for trading with changes in fair value recognized through net income and no valuation allowance was required in relation to deferred tax asset related to available-for-sale securities.
On August 26, 2016, the FASB issued ASU 2016-15, “
Statement of Cash Flows (Topic 230): Classification of Certain Cash Receipts and Cash Payments (a consensus of the Emerging Issues Task Force)
” which standardizes the presentation and classification of certain cash receipts and cash payments in the statement of cash flows under Topic 230 Statement of Cash Flows. This ASU is effective for fiscal years beginning after December 15, 2017, including interim periods within those fiscal years. Adoption of this ASU did not have a material impact on the Company’s consolidated statement of cash flows. The 2018 year end consolidated statement of cash flows has been prepared in conformity with the presentation guidance in this ASU.
On October 24, 2016, the FASB issued ASU 2016-16, “
Income Taxes (Topic 740): Intra-Entity Transfers of Assets Other Than Inventory
” which will require companies to account for the income tax effects of intercompany transfers of assets other than inventory (e.g., intangible assets) when the transfer occurs. This ASU is effective for fiscal years beginning after December 15, 2017, including interim periods within those fiscal years. Adoption of this ASU did not have a material impact on the Company’s consolidated financial statements and disclosures.
On March 10, 2017, FASB issued ASU 2017-7, “
Improving the Presentation of Net Periodic Pension Cost and Net Periodic Post Retirement Benefit Cost
” which changes how employers report defined benefit pension and/or other post-retirement benefit costs in their financial statements. This ASU is effective for fiscal years beginning after December 15, 2017 and interim periods beginning after December 15, 2017. As the Company does not operate a defined benefit pension scheme, the adoption of this ASU did not have a material impact on Company’s consolidated financial statements and disclosures.
F-16
On February 28, 2018, the FASB issued ASU 2018-03, “
Technical Corrections and Improvements to Financial Instruments - Overall (Subtopic 825-10)”
which amends multiple areas in Subtopic 825-10 via improvements to clarify the Codification or to correct unintended application of guidance. This ASU is effective for fiscal years beginning after December 15, 2017 and for interim periods within those fiscal years beginning after June 15, 2018. Adoption of this ASU did not have a material impact on the Company’s consolidated financial statements.
Accounting Pronouncements Not Yet Adopted
On February 25, 2016, the FASB issued ASU 2016-2, “
Leases (Topic 842)
” which supersedes the leases requirements in Topic 840 and establishes the principles that lessees and lessors shall apply to report useful information to users of financial statements about the amount, timing, and uncertainty of cash flows arising from a lease. The amendments of this ASU are effective for fiscal years beginning after December 15, 2018. This ASU is expected to have a material impact on the Company’s consolidated financial statements, specifically increasing the Company’s assets and liabilities by
$76.4 million
and
$82.0 million
, respectively as all leases greater than twelve months will be recognized on the balance sheet as a right of use asset and lease liability, together with a cumulative effect adjustment of
$5.6 million
through opening retained earnings.
On June 16, 2016, the FASB issued ASU 2016-13, “
Financial Instruments - Credit Losses (Topic 326)
” which introduces a new impairment model, known as the current expected credit loss model, which is based on expected losses rather than incurred losses. Under the new credit loss model, the Company would recognize an allowance for its estimate of expected credit losses and this would apply to most debt instruments (other than those measured at fair value), trade receivables, lease receivables, reinsurance receivables, financial guarantee contracts and loan commitments. Available-for-sale debt securities are outside the model’s scope and this ASU made limited amendments to the impairment model for available-for-sale debt securities. There are other amendments required as a result of this ASU that are effective for fiscal years beginning after December 15, 2019. The Company is currently assessing the impact the adoption of this ASU will have on future financial statements and disclosures.
On August 28, 2017, the FASB issued ASU 2017-12,
“Derivatives and Hedging (Topic 815)”
enabling entities to better align their hedge accounting and risk management activities, while also simplifying the application of hedge accounting in certain situations. This ASU is effective for fiscal years beginning after 15 December, 2018 using a modified retrospective approach for cash flow and net investment hedge relationships that exist on the date of adoption. The Company has evaluated the provisions of ASU 2017-12 to determine how it will be affected, and no material impact is expected on the consolidated financial statements.
On February 14, 2018, the FASB issued ASU 2018-02, “
Income Statement - Reporting Comprehensive Income (Topic 220)”
which allows a reclassification from accumulated other comprehensive income to retained earnings for stranded tax effects resulting from the Tax Cuts and Jobs Act. This ASU will be effective for fiscal years beginning after December 15, 2018 and interim periods within those fiscal years. The Company has evaluated the provisions of ASU 2018-02 to determine how it will be affected, and no material impact is expected on the consolidated financial statements.
On June 20, 2018, the FASB issued ASU 2018-07, “
Compensation - Stock Compensation (Topic 718)”
which amends the scope of Topic 718 via improvements to non-employee share-based payment accounting. Amendments include allowing companies to account for share-based payment transactions with non-employees in the same way as share-based payment transactions with employees and includes elections that offer relief to non-public companies when measuring non-employee equity share options. This ASU will be effective for fiscal years beginning after December 15, 2018 and interim periods within those fiscal years. The Company has evaluated the provisions of ASU 2018-07 to determine how it will be affected, and no material impact is expected on the consolidated financial statements.
On October 31, 2018, the FASB issued ASU 2018-17, “
Consolidation (Topic 810)”
which makes targeted improvements to related party guidance for variable interest entities, requiring the reporting entity to consider indirect interests held through related parties under common control on a proportionate basis when evaluating whether a decision-makers fee is a variable interest in the primary beneficiary test. This ASU will be effective for fiscal years beginning after December 15, 2019 and interim periods within those fiscal years. The Company is currently evaluating the provisions of ASU 2018-17 to determine how it will be affected, but no material impact is expected on the consolidated financial statements.
Other accounting pronouncements were issued during the year ended
December 31, 2018
which were either not relevant to the Company or did not impact the Company’s consolidated financial statements.
|
3.
|
Related Party Transactions
|
There were no related party transactions for the twelve months ended
December 31, 2018
or December 31,
2017
.
F-17
|
4.
|
Earnings per Ordinary Share
|
Basic earnings per ordinary share are calculated by dividing net income available to holders of Aspen Holdings’ ordinary shares by the weighted average number of ordinary shares outstanding. Net income available to ordinary shareholders is calculated by deducting preference share dividends and net income/(loss) attributable to non-controlling interest from net income/(loss) after tax for the period. Diluted earnings per ordinary share are based on the weighted average number of ordinary shares and dilutive potential ordinary shares outstanding during the period of calculation using the treasury stock method. The following table sets forth the computation of basic and diluted earnings per share for the
twelve months ended
December 31, 2018
,
2017
, and
2016
, respectively:
|
|
Twelve Months Ended December 31,
|
|||||||||||
|
2018
|
2017
|
2016
|
||||||||||
|
Net (loss)/income
|
$
|
(145.8
|
)
|
$
|
(266.4
|
)
|
$
|
203.4
|
|
|||
|
Preference share dividends
|
(30.5
|
)
|
(36.2
|
)
|
(41.8
|
)
|
||||||
|
Preference share redemption costs
(1)
|
—
|
|
(8.0
|
)
|
—
|
|
||||||
|
Net profit attributable to non-controlling interest
|
(1.0
|
)
|
(1.3
|
)
|
(0.1
|
)
|
||||||
|
Basic and diluted net (loss)/income available to ordinary shareholders
|
$
|
(177.3
|
)
|
$
|
(311.9
|
)
|
$
|
161.5
|
|
|||
|
Ordinary shares:
|
||||||||||||
|
Basic weighted average ordinary shares
|
59,655,507
|
|
59,753,886
|
|
60,478,740
|
|
||||||
|
Weighted average effect of dilutive securities
(2) (3)
|
—
|
|
—
|
|
1,381,949
|
|
||||||
|
Total diluted weighted average ordinary shares
|
59,655,507
|
|
59,753,886
|
|
61,860,689
|
|
||||||
|
(Loss) Earnings per ordinary share:
|
|
|||||||||||
|
Basic
|
$
|
(2.97
|
)
|
$
|
(5.22
|
)
|
$
|
2.67
|
|
|||
|
Diluted
(3)
|
$
|
(2.97
|
)
|
$
|
(5.22
|
)
|
$
|
2.61
|
|
|||
_______________
|
(1)
|
The
$8.0 million
deduction from net income in 2017 is attributable to the reclassification from additional paid-in capital to retained earnings representing the difference between the capital raised upon issuance of the
7.401%
Preference Shares and
7.250%
Preference Shares, net of issuance costs, and the final redemption costs of
$293.2 million
.
|
|
(2)
|
Dilutive securities consist of employee restricted share units and performance shares associated with the Company’s long term incentive plan, employee share purchase plans and director restricted stock units and options as described in Note 17.
|
|
(3)
|
The basic and diluted number of ordinary shares is the same in 2018 and 2017 because the inclusion of dilutive securities in a loss making period would be anti-dilutive.
|
Dividends.
On February 6, 2019, the Company’s Board of Directors declared the following dividends:
|
Dividend
|
Payable on:
|
Record Date:
|
||||||
|
5.95% Preference Shares
|
$
|
0.3719
|
|
April 1, 2019
|
March 15, 2019
|
|||
|
5.625% Preference Shares
|
$
|
0.3516
|
|
April 1, 2019
|
March 15, 2019
|
|||
The Merger Agreement, dated August 27, 2018, restricts the Company from declaring or paying any dividends other than the quarterly dividends on Aspen’s ordinary shares that were previously declared and publicly announced prior to the date of the Merger Agreement and periodic cash dividends on the Preference Shares in accordance with the terms of the applicable certificate of designation.
|
5.
|
Segment Reporting
|
The Company is organized into
two
business segments, namely Aspen Re and Aspen Insurance. The Company has determined its reportable segments, Aspen Re and Aspen Insurance, by taking into account the manner in which management makes operating decisions and assesses operating performance. Profit or loss for each of the Company’s business segments is measured by underwriting profit or loss. Underwriting profit is the excess of net earned premiums over the sum of losses and loss expenses, amortization of deferred policy acquisition costs and general and administrative expenses. Underwriting profit or loss provides a basis for management to evaluate the segment’s underwriting performance.
Reinsurance Segment.
The reinsurance segment consists of property catastrophe reinsurance, other property reinsurance, casualty reinsurance and specialty reinsurance. In addition, Aspen Capital Markets forms part of property catastrophe reinsurance
F-18
as it focuses primarily on property catastrophe business through the use of alternative capital. Aspen Capital Markets leverages the Company’s underwriting and analytical expertise and earns management and performance fees from the Company and other third party investors primarily through the management of ILS funds. For a more detailed description of this business segment, refer to Part I, Item 1, “Business — Business Segments — Reinsurance” above.
Insurance Segment.
The insurance segment consists of property and casualty insurance, marine, aviation and energy insurance and financial and professional lines insurance. For a more detailed description of this segment, refer to Part I, Item 1 “Business — Business Segments — Insurance” above.
Non-underwriting Disclosures.
The Company provides additional disclosures for corporate and other (non-operating) income and expenses. Corporate and other income and expenses include net investment income, net realized and unrealized investment gains or losses, expenses associated with managing the Aspen Group, certain strategic and non-recurring costs, changes in fair value of derivatives or the loan notes issued by variable interest entities, interest expenses, net realized and unrealized foreign exchange gains or losses, and income taxes, none of which are allocated to the business segments. Corporate expenses are not allocated to the Company’s business segments as they typically do not fluctuate with the levels of premiums written and are not directly related to the Company’s business segment operations. The Company does not allocate its assets by business segment as it evaluates underwriting results of each business segment separately from the results of the Company’s investment portfolio.
F-19
The Company uses underwriting ratios as measures of performance. The loss ratio is the ratio of losses and loss adjustment expenses to net earned premiums. The policy acquisition expense ratio is the ratio of amortization of deferred policy acquisition costs to net earned premiums. The general and administrative expense ratio is the ratio of general, administrative and corporate expenses to net earned premiums. The combined ratio is the sum of the loss ratio, the policy acquisition expense ratio and the general and administrative expense ratio.
The following tables provide a summary of gross and net written and earned premiums, underwriting results, ratios and reserves for each of the Company’s business segments for
the twelve months
ended
December 31, 2018
,
2017
and
2016
:
|
|
Twelve Months Ended December 31, 2018
|
|||||||||||
|
|
Reinsurance
|
Insurance
|
Total
|
|||||||||
|
|
($ in millions)
|
|||||||||||
|
Underwriting Revenues
|
||||||||||||
|
Gross written premiums
|
$
|
1,495.7
|
|
$
|
1,951.2
|
|
$
|
3,446.9
|
|
|||
|
Net written premiums
|
1,182.9
|
|
899.1
|
|
2,082.0
|
|
||||||
|
Gross earned premiums
|
1,593.9
|
|
1,940.5
|
|
3,534.4
|
|
||||||
|
Net earned premiums
|
1,256.4
|
|
958.3
|
|
2,214.7
|
|
||||||
|
Underwriting Expenses
|
||||||||||||
|
Losses and loss adjustment expenses
|
927.0
|
|
646.0
|
|
1,573.0
|
|
||||||
|
Amortization of deferred policy acquisition costs
|
260.9
|
|
110.7
|
|
371.6
|
|
||||||
|
General and administrative expenses
|
118.5
|
|
239.2
|
|
357.7
|
|
||||||
|
Underwriting (loss)
|
(50.0
|
)
|
(37.6
|
)
|
(87.6
|
)
|
||||||
|
Corporate expenses
|
(56.8
|
)
|
||||||||||
|
Non-operating expenses
|
(77.2
|
)
|
(1)
|
|||||||||
|
Net investment income
|
198.2
|
|
||||||||||
|
Realized and unrealized investment gains
|
110.0
|
|
||||||||||
|
Realized and unrealized investment losses
|
(174.7
|
)
|
||||||||||
|
Realized loss on debt extinguishment
|
(8.6
|
)
|
||||||||||
|
Change in fair value of loan notes issued by variable interest entities
|
(4.4
|
)
|
||||||||||
|
Change in fair value of derivatives
|
(31.8
|
)
|
||||||||||
|
Interest expense on long term debt
|
(25.9
|
)
|
||||||||||
|
Net realized and unrealized foreign exchange (losses)
|
(3.5
|
)
|
||||||||||
|
Other income
|
9.0
|
|
||||||||||
|
Other expenses
|
(2.7
|
)
|
||||||||||
|
(Loss) before tax
|
(156.0
|
)
|
||||||||||
|
Income tax benefit
|
10.2
|
|
||||||||||
|
Net (loss)
|
$
|
(145.8
|
)
|
|||||||||
|
Net reserves for loss and loss adjustment expenses
|
$
|
2,843.6
|
|
$
|
2,153.0
|
|
$
|
4,996.6
|
|
|||
|
Ratios
|
||||||||||||
|
Loss ratio
|
73.8
|
%
|
67.4
|
%
|
71.0
|
%
|
||||||
|
Policy acquisition expense ratio
|
20.8
|
|
11.6
|
|
16.8
|
|
||||||
|
General and administrative expense ratio
|
9.4
|
|
25.0
|
|
22.2
|
|
(2)
|
|||||
|
Expense ratio
|
30.2
|
|
36.6
|
|
39.0
|
|
||||||
|
Combined ratio
|
104.0
|
%
|
104.0
|
%
|
110.0
|
%
|
||||||
_______________
|
(1)
|
Non-operating expenses includes
$37.5 million
of expenses related to the Company’s operating effectiveness and efficiency program (the “Effectiveness and Efficiency Program”),
$39.0 million
of advisor fees related to the Merger and
$11.3 million
of retention costs, partially offset by the write back of a
$14.1 million
buy out provision.
|
|
(2)
|
The general and administrative expense ratio in the total column includes corporate and non-operating expenses.
|
F-20
|
|
Twelve Months Ended December 31, 2017
|
|||||||||||
|
|
Reinsurance
|
Insurance
|
Total
|
|||||||||
|
|
( $ in millions)
|
|||||||||||
|
Underwriting Revenues
|
||||||||||||
|
Gross written premiums
|
$
|
1,548.5
|
|
$
|
1,812.4
|
|
$
|
3,360.9
|
|
|||
|
Net written premiums
|
1,250.0
|
|
962.5
|
|
2,212.5
|
|
||||||
|
Gross earned premiums
|
1,451.8
|
|
1,757.4
|
|
3,209.2
|
|
||||||
|
Net earned premiums
|
1,206.1
|
|
1,100.5
|
|
2,306.6
|
|
||||||
|
Underwriting Expenses
|
||||||||||||
|
Losses and loss adjustment expenses
|
1,116.4
|
|
878.3
|
|
1,994.7
|
|
||||||
|
Amortization of deferred policy acquisition costs
|
235.5
|
|
165.0
|
|
400.5
|
|
||||||
|
General and administrative expenses
|
157.3
|
|
253.9
|
|
411.2
|
|
||||||
|
Underwriting (loss)
|
(303.1
|
)
|
(196.7
|
)
|
(499.8
|
)
|
||||||
|
Corporate expenses
|
(58.3
|
)
|
||||||||||
|
Non-operating expenses
|
(32.7
|
)
|
(1)
|
|||||||||
|
Net investment income
|
189.0
|
|
||||||||||
|
Realized and unrealized investment gains
|
148.9
|
|
||||||||||
|
Realized and unrealized investment losses
|
(28.4
|
)
|
||||||||||
|
Change in fair value of loan notes issued by variable interest entities
|
21.2
|
|
||||||||||
|
Change in fair value of derivatives
|
27.7
|
|
||||||||||
|
Interest expense on long term debt
|
(29.5
|
)
|
||||||||||
|
Net realized and unrealized foreign exchange (losses)
|
(23.9
|
)
|
||||||||||
|
Other income
|
8.9
|
|
||||||||||
|
Other expenses
|
(4.9
|
)
|
||||||||||
|
(Loss) before tax
|
(281.8
|
)
|
||||||||||
|
Income tax benefit
|
15.4
|
|
||||||||||
|
Net (loss)
|
$
|
(266.4
|
)
|
|||||||||
|
Net reserves for loss and loss adjustment expenses
|
$
|
2,917.1
|
|
$
|
2,317.2
|
|
$
|
5,234.3
|
|
|||
|
Ratios
|
||||||||||||
|
Loss ratio
|
92.6
|
%
|
79.8
|
%
|
86.5
|
%
|
||||||
|
Policy acquisition expense ratio
|
19.5
|
|
15.0
|
|
17.4
|
|
||||||
|
General and administrative expense ratio
|
13.0
|
|
23.1
|
|
21.8
|
|
(2)
|
|||||
|
Expense ratio
|
32.5
|
|
38.1
|
|
39.2
|
|
||||||
|
Combined ratio
|
125.1
|
%
|
117.9
|
%
|
125.7
|
%
|
||||||
________________
|
(1)
|
Non-operating expenses includes
$15.2 million
of expenses related to the Company’s Effectiveness and Efficiency Program.
|
|
(2)
|
The general and administrative expense ratio in the total column includes corporate and non-operating expenses.
|
F-21
|
|
Twelve Months Ended December 31, 2016
|
|||||||||||
|
|
Reinsurance
|
Insurance
|
Total
|
|||||||||
|
|
($ in millions)
|
|||||||||||
|
Underwriting Revenues
|
||||||||||||
|
Gross written premiums
|
$
|
1,413.2
|
|
$
|
1,733.8
|
|
$
|
3,147.0
|
|
|||
|
Net written premiums
|
1,269.2
|
|
1,324.5
|
|
2,593.7
|
|
||||||
|
Gross earned premiums
|
1,317.9
|
|
1,768.4
|
|
3,086.3
|
|
||||||
|
Net earned premiums
|
1,181.9
|
|
1,455.4
|
|
2,637.3
|
|
||||||
|
Underwriting Expenses
|
||||||||||||
|
Losses and loss adjustment expenses
|
657.9
|
|
918.2
|
|
1,576.1
|
|
||||||
|
Amortization of deferred policy acquisition costs
|
226.4
|
|
302.5
|
|
528.9
|
|
||||||
|
General and administrative expenses
|
178.2
|
|
228.4
|
|
406.6
|
|
||||||
|
Underwriting income
|
119.4
|
|
6.3
|
|
125.7
|
|
||||||
|
Corporate expenses
|
(73.8
|
)
|
||||||||||
|
Non-operating expenses
|
(9.7
|
)
|
(1)
|
|||||||||
|
Net investment income
|
187.1
|
|
||||||||||
|
Realized and unrealized investment gains
|
108.4
|
|
||||||||||
|
Realized and unrealized investment losses
|
(63.2
|
)
|
||||||||||
|
Change in fair value of loan notes issued by variable interest entities
|
(17.1
|
)
|
||||||||||
|
Change in fair value of derivatives
|
(24.6
|
)
|
||||||||||
|
Interest expense on long term debt
|
(29.5
|
)
|
||||||||||
|
Net realized and unrealized foreign exchange gains
|
1.8
|
|
||||||||||
|
Other income
|
5.7
|
|
||||||||||
|
Other expenses
|
(1.3
|
)
|
||||||||||
|
Income before tax
|
209.5
|
|
||||||||||
|
Income tax expense
|
(6.1
|
)
|
||||||||||
|
Net income
|
$
|
203.4
|
|
|||||||||
|
Net reserves for loss and loss adjustment expenses
|
$
|
2,462.1
|
|
$
|
2,297.1
|
|
$
|
4,759.2
|
|
|||
|
Ratios
|
||||||||||||
|
Loss ratio
|
55.7
|
%
|
63.1
|
%
|
59.8
|
%
|
||||||
|
Policy acquisition expense ratio
|
19.2
|
|
20.8
|
|
20.1
|
|
||||||
|
General and administrative expense ratio
|
15.1
|
|
15.7
|
|
18.6
|
|
(2)
|
|||||
|
Expense ratio
|
34.3
|
|
36.5
|
|
38.7
|
|
||||||
|
Combined ratio
|
90.0
|
%
|
99.6
|
%
|
98.5
|
%
|
||||||
_______________
|
(1)
|
Non-operating expenses includes amortization of intangibles acquired from the acquisition of AgriLogic.
|
|
(2)
|
The general and administrative expense ratio in the total column includes corporate and non-operating expenses.
|
F-22
Geographical Areas
. The following summary presents the Company’s gross written premiums based on the location of the insured risk for
the twelve months
ended
December 31, 2018
,
2017
and
2016
.
|
For the Twelve Months Ended
|
||||||||||||
|
|
December 31, 2018
|
December 31, 2017
|
December 31, 2016
|
|||||||||
|
|
($ in millions)
|
|||||||||||
|
Australia/Asia
|
$
|
175.9
|
|
$
|
167.3
|
|
$
|
140.5
|
|
|||
|
Caribbean
|
7.7
|
|
17.6
|
|
14.3
|
|
||||||
|
Europe
|
92.6
|
|
94.5
|
|
109.7
|
|
||||||
|
United Kingdom
|
290.1
|
|
258.3
|
|
231.4
|
|
||||||
|
United States & Canada
(1)
|
1,875.9
|
|
1,729.3
|
|
1,597.0
|
|
||||||
|
Worldwide excluding United States
(2)
|
70.1
|
|
88.1
|
|
90.7
|
|
||||||
|
Worldwide including United States
(3)
|
775.8
|
|
868.6
|
|
837.2
|
|
||||||
|
Others
|
158.8
|
|
137.2
|
|
126.2
|
|
||||||
|
Total
|
$
|
3,446.9
|
|
$
|
3,360.9
|
|
$
|
3,147.0
|
|
|||
______________
|
(1)
|
“United States and Canada” comprises individual policies that insure risks specifically in the United States and/or Canada, but not elsewhere.
|
|
(2)
|
“Worldwide excluding the United States” comprises individual policies that insure risks wherever they may be across the world but specifically excludes the United States.
|
|
(3)
|
“Worldwide including the United States” comprises individual policies that insure risks wherever they may be across the world but specifically includes the United States.
|
6. Investments
Income Statement
Investment Income.
The following table summarizes investment income for the
twelve months ended
December 31, 2018
,
2017
and
2016
:
|
For the Twelve Months Ended
|
||||||||||||
|
December 31, 2018
|
December 31, 2017
|
December 31, 2016
|
||||||||||
|
|
($ in millions)
|
|||||||||||
|
Fixed income securities — Available for sale
|
$
|
134.1
|
|
$
|
133.3
|
|
$
|
141.3
|
|
|||
|
Fixed income securities — Trading
|
49.6
|
|
44.0
|
|
31.6
|
|
||||||
|
Short-term investments — Available for sale
|
1.4
|
|
0.4
|
|
0.6
|
|
||||||
|
Short-term investments — Trading
|
0.4
|
|
0.8
|
|
0.2
|
|
||||||
|
Fixed term deposits (included in cash and cash equivalents)
|
14.2
|
|
6.2
|
|
3.4
|
|
||||||
|
Equity securities — Trading
|
2.1
|
|
13.6
|
|
20.4
|
|
||||||
|
Catastrophe bonds — Trading
|
2.8
|
|
1.8
|
|
1.6
|
|
||||||
|
Other investments, at fair value
|
2.5
|
|
—
|
|
—
|
|
||||||
|
Total
|
207.1
|
|
200.1
|
|
199.1
|
|
||||||
|
Investment expenses
|
(8.9
|
)
|
(11.1
|
)
|
(12.0
|
)
|
||||||
|
Net investment income
|
$
|
198.2
|
|
$
|
189.0
|
|
$
|
187.1
|
|
|||
F-23
The following table summarizes the net realized and unrealized investment gains and losses recorded in the statement of operations and the change in unrealized gains and losses on investments recorded in other comprehensive income for the
twelve months ended
December 31, 2018
,
2017
and
2016
:
|
For the Twelve Months Ended
|
||||||||||||
|
December 31, 2018
|
December 31, 2017
|
December 31, 2016
|
||||||||||
|
($ in millions)
|
||||||||||||
|
Available for sale:
|
||||||||||||
|
Fixed income securities — gross realized gains
|
$
|
6.4
|
|
$
|
10.2
|
|
$
|
18.6
|
|
|||
|
Fixed income securities — gross realized (losses)
|
(11.4
|
)
|
(6.6
|
)
|
(8.3
|
)
|
||||||
|
Short-term investments — gross realized gains
|
—
|
|
0.1
|
|
—
|
|
||||||
|
Short-term investments — gross realized (losses)
|
—
|
|
—
|
|
—
|
|
||||||
|
Cash and cash equivalents — gross realized gains
|
0.3
|
|
0.4
|
|
0.2
|
|
||||||
|
Cash and cash equivalents — gross realized (losses)
|
(0.5
|
)
|
(0.1
|
)
|
(0.6
|
)
|
||||||
|
Other-than-temporary impairments
|
—
|
|
(0.7
|
)
|
—
|
|
||||||
|
Trading:
|
||||||||||||
|
Fixed income securities — gross realized gains
|
4.6
|
|
9.7
|
|
12.6
|
|
||||||
|
Fixed income securities — gross realized (losses)
|
(25.0
|
)
|
(4.5
|
)
|
(7.3
|
)
|
||||||
|
Short-term investments — gross realized gains
|
0.1
|
|
2.7
|
|
—
|
|
||||||
|
Short-term investments — gross realized (losses)
|
(4.2
|
)
|
—
|
|
—
|
|
||||||
|
Cash and cash equivalents — gross realized gains
|
1.5
|
|
1.3
|
|
0.1
|
|
||||||
|
Cash and cash equivalents — gross realized (losses)
|
(0.3
|
)
|
—
|
|
(0.3
|
)
|
||||||
|
Equity securities — gross realized gains
|
94.5
|
|
59.0
|
|
54.1
|
|
||||||
|
Equity securities — gross realized (losses)
|
(20.1
|
)
|
(13.7
|
)
|
(46.3
|
)
|
||||||
|
Catastrophe bonds — net unrealized gains (losses)
|
2.2
|
|
(2.4
|
)
|
—
|
|
||||||
|
Net change in gross unrealized (losses) gains
|
(112.1
|
)
|
60.3
|
|
22.5
|
|
||||||
|
Other investments, equity method:
|
||||||||||||
|
Gross realized and unrealized (loss) in MVI
|
(0.2
|
)
|
(0.1
|
)
|
(0.3
|
)
|
||||||
|
Gross unrealized gain in Chaspark
|
—
|
|
0.9
|
|
0.3
|
|
||||||
|
Gross realized and unrealized gain in Digital Risk
|
0.4
|
|
—
|
|
—
|
|
||||||
|
Gross realized and unrealized (loss) in Bene
|
(0.9
|
)
|
(0.3
|
)
|
(0.1
|
)
|
||||||
|
Gross realized gain on sale of AgriLogic
|
—
|
|
4.3
|
|
—
|
|
||||||
|
Total net realized and unrealized investment (losses)/gains recorded in the statement of operations
|
$
|
(64.7
|
)
|
$
|
120.5
|
|
$
|
45.2
|
|
|||
|
Change in available for sale net unrealized (losses):
|
||||||||||||
|
Fixed income securities
|
(81.3
|
)
|
(14.8
|
)
|
(39.0
|
)
|
||||||
|
Change in taxes
|
4.8
|
|
2.0
|
|
1.3
|
|
||||||
|
Total change in net unrealized (losses), net of taxes recorded in other comprehensive income
|
$
|
(76.5
|
)
|
$
|
(12.8
|
)
|
$
|
(37.7
|
)
|
|||
F-24
Balance Sheet
Fixed Income Securities and Short-Term Investments
—
Available For Sale.
The following tables present the cost or amortized cost, gross unrealized gains and losses and estimated fair market value of available for sale investments in fixed income securities and short-term investments as at
December 31, 2018
and
December 31, 2017
:
|
|
As at December 31, 2018
|
|||||||||||||||
|
|
Cost or
Amortized Cost
|
Gross
Unrealized
Gains
|
Gross
Unrealized
Losses
|
Fair Market
Value
|
||||||||||||
|
|
($ in millions)
|
|||||||||||||||
|
U.S. government
|
$
|
1,413.5
|
|
$
|
6.8
|
|
$
|
(16.1
|
)
|
$
|
1,404.2
|
|
||||
|
U.S. agency
|
47.7
|
|
0.1
|
|
(0.4
|
)
|
47.4
|
|
||||||||
|
Municipal
|
46.7
|
|
1.3
|
|
(0.8
|
)
|
47.2
|
|
||||||||
|
Corporate
|
2,238.9
|
|
7.8
|
|
(40.5
|
)
|
2,206.2
|
|
||||||||
|
Non-U.S. government-backed corporate
|
93.2
|
|
0.2
|
|
(0.2
|
)
|
93.2
|
|
||||||||
|
Non-U.S government
|
399.8
|
|
3.6
|
|
(0.8
|
)
|
402.6
|
|
||||||||
|
Asset-backed
|
17.4
|
|
—
|
|
(0.1
|
)
|
17.3
|
|
||||||||
|
Agency mortgage-backed
|
1,025.1
|
|
6.5
|
|
(19.0
|
)
|
1,012.6
|
|
||||||||
|
Total fixed income securities — Available for sale
|
5,282.3
|
|
26.3
|
|
(77.9
|
)
|
5,230.7
|
|
||||||||
|
Total short-term investments — Available for sale
|
105.6
|
|
—
|
|
—
|
|
105.6
|
|
||||||||
|
Total
|
$
|
5,387.9
|
|
$
|
26.3
|
|
$
|
(77.9
|
)
|
$
|
5,336.3
|
|
||||
|
|
As at December 31, 2017
|
|||||||||||||||
|
|
Cost or
Amortized Cost
|
Gross
Unrealized
Gains
|
Gross
Unrealized
Losses
|
Fair Market
Value
|
||||||||||||
|
|
($ in millions)
|
|||||||||||||||
|
U.S. government
|
$
|
1,166.5
|
|
$
|
4.5
|
|
$
|
(11.6
|
)
|
$
|
1,159.4
|
|
||||
|
U.S. agency
|
51.8
|
|
0.5
|
|
(0.2
|
)
|
52.1
|
|
||||||||
|
Municipal
|
53.0
|
|
2.1
|
|
(0.2
|
)
|
54.9
|
|
||||||||
|
Corporate
|
2,391.4
|
|
36.1
|
|
(11.8
|
)
|
2,415.7
|
|
||||||||
|
Non-U.S. government-backed corporate
|
91.5
|
|
0.3
|
|
(0.5
|
)
|
91.3
|
|
||||||||
|
Non-U.S government
|
479.7
|
|
6.4
|
|
(1.2
|
)
|
484.9
|
|
||||||||
|
Asset-backed
|
26.3
|
|
—
|
|
(0.1
|
)
|
26.2
|
|
||||||||
|
Agency mortgage-backed
|
941.0
|
|
13.7
|
|
(8.2
|
)
|
946.5
|
|
||||||||
|
Total fixed income securities — Available for sale
|
5,201.2
|
|
63.6
|
|
(33.8
|
)
|
5,231.0
|
|
||||||||
|
Total short-term investments — Available for sale
|
90.0
|
|
—
|
|
(0.1
|
)
|
89.9
|
|
||||||||
|
Total
|
$
|
5,291.2
|
|
$
|
63.6
|
|
$
|
(33.9
|
)
|
$
|
5,320.9
|
|
||||
F-25
Fixed Income Securities, Short Term Investments, Equities and Catastrophe Bonds — Trading
. The following tables present the cost or amortized cost, gross unrealized gains and losses, and estimated fair market value of trading investments in fixed income securities, short-term investments, equity securities and catastrophe bonds as at
December 31, 2018
and
December 31, 2017
:
|
|
As at December 31, 2018
|
|||||||||||||||
|
|
Cost or
Amortized Cost
|
Gross
Unrealized
Gains
|
Gross
Unrealized
Losses
|
Fair Market
Value
|
||||||||||||
|
|
($ in millions)
|
|||||||||||||||
|
U.S. government
|
$
|
146.6
|
|
$
|
1.6
|
|
$
|
(0.5
|
)
|
$
|
147.7
|
|
||||
|
Municipal
|
2.8
|
|
—
|
|
(0.1
|
)
|
2.7
|
|
||||||||
|
Corporate
|
734.2
|
|
2.6
|
|
(16.6
|
)
|
720.2
|
|
||||||||
|
Non-U.S. government
|
268.7
|
|
1.9
|
|
(5.2
|
)
|
265.4
|
|
||||||||
|
Asset-backed
|
2.4
|
|
—
|
|
—
|
|
2.4
|
|
||||||||
|
Agency mortgage-backed
|
50.3
|
|
0.2
|
|
(1.1
|
)
|
49.4
|
|
||||||||
|
Total fixed income securities — Trading
|
1,205.0
|
|
6.3
|
|
(23.5
|
)
|
1,187.8
|
|
||||||||
|
Total short-term investments — Trading
|
9.5
|
|
—
|
|
—
|
|
9.5
|
|
||||||||
|
Total catastrophe bonds — Trading
|
37.9
|
|
0.1
|
|
(1.8
|
)
|
36.2
|
|
||||||||
|
Total
|
$
|
1,252.4
|
|
$
|
6.4
|
|
$
|
(25.3
|
)
|
$
|
1,233.5
|
|
||||
|
|
As at December 31, 2017
|
|||||||||||||||
|
|
Cost or
Amortized Cost
|
Gross
Unrealized
Gains
|
Gross
Unrealized
Losses
|
Fair Market
Value
|
||||||||||||
|
|
($ in millions)
|
|||||||||||||||
|
U.S. government
|
$
|
162.3
|
|
$
|
0.4
|
|
$
|
(0.8
|
)
|
$
|
161.9
|
|
||||
|
Municipal
|
32.4
|
|
—
|
|
(0.2
|
)
|
32.2
|
|
||||||||
|
Corporate
|
1,036.5
|
|
14.0
|
|
(4.2
|
)
|
1,046.3
|
|
||||||||
|
Non-U.S government
|
196.1
|
|
6.9
|
|
(0.5
|
)
|
202.5
|
|
||||||||
|
Asset-backed
|
9.9
|
|
—
|
|
—
|
|
9.9
|
|
||||||||
|
Agency mortgage-backed
|
196.7
|
|
0.2
|
|
(1.4
|
)
|
195.5
|
|
||||||||
|
Total fixed income securities — Trading
|
1,634.9
|
|
21.5
|
|
(7.1
|
)
|
1,649.3
|
|
||||||||
|
Total short-term investments — Trading
|
73.0
|
|
—
|
|
—
|
|
73.0
|
|
||||||||
|
Total equity securities — Trading
|
414.8
|
|
83.5
|
|
(7.3
|
)
|
491.0
|
|
||||||||
|
Total catastrophe bonds — Trading
|
33.5
|
|
—
|
|
(1.1
|
)
|
32.4
|
|
||||||||
|
Total
|
$
|
2,156.2
|
|
$
|
105.0
|
|
$
|
(15.5
|
)
|
$
|
2,245.7
|
|
||||
The Company classifies the financial instruments listed above as held for trading because this most closely reflects the facts and circumstances of the investments held.
As at
December 31, 2018
, the Company had a
4.5%
position in BBB Emerging Market Debt and a
1.3%
position in a real estate fund totaling
5.8%
of our Managed Portfolio (
December 31, 2017
—
10.0%
).
Catastrophe bonds.
The Company has invested in catastrophe bonds with a total value of
$36.2 million
as at
December 31, 2018
(
December 31, 2017
—
$32.4 million
). The bonds are either zero-coupon notes or receive quarterly interest payments based on variable interest rates with scheduled maturities ranging from 2019 to 2022. The redemption value of the bonds will adjust based on the occurrence or aggregate occurrence of a covered event, such as windstorms and earthquakes in the United States, Canada, the North Atlantic, South America, Europe, Japan or Australia.
Other Investments.
On December 20, 2017, the Company committed
$100.0 million
as a limited partner to a real estate fund. The investment objective of the fund is to achieve attractive risk-adjusted returns through the acquisition of income producing, high quality assets in gateway cities located in the U.S. and Canada in the office, retail, industrial and multifamily sectors of the real estate market. On May 1, 2018, the Company received a demand for an initial capital call of
$86.2 million
and paid the capital call on May 10, 2018. On September 19, 2018, the Company received a demand for the final capital call of
$13.8 million
and paid the capital on September 28, 2018. For further information on the real estate fund, refer to Note 19 in these consolidated financial statements, “Commitments and Contingencies.”
F-26
Investments — Equity Method.
In January 2015, the Company, along with seven other insurance companies, established a micro-insurance venture consortium and micro-insurance incubator (“MVI”) domiciled in Bermuda. The MVI is a social impact organization that provides micro-insurance products to assist global emerging consumers. The Company’s initial investment in the MVI was
$0.8 million
. The Company made an additional investment of
$0.1 million
in the
twelve months ended
December 31, 2017 and a further investment of
$0.2 million
in the
twelve months ended
December 31, 2018.
On September 25, 2012, the Company established a subsidiary, Aspen Recoveries Limited, to take ownership of a
58.5%
shareholding in Chaspark Maritime Holdings Ltd., a Singaporean registered company (“Chaspark”), with the remaining shareholding owned by other insurers. The shareholding in Chaspark represented the interest in subrogation rights arising on a contract frustration claim settlement. On March 10, 2017, Aspen Recoveries Limited received cash of
$9.3 million
as settlement of its share of subrogation assets held by Chaspark. In the
twelve months ended
December 31, 2017, the change in the value of the Company’s investment in Chaspark was an unrealized gain of
$0.9 million
.
On July 26, 2016, the Company purchased through its wholly-owned subsidiary, Acorn Limited (“Acorn”), a
20.0%
share of Bene Assicurazioni (“Bene”), an Italian-based motor insurer for a total consideration of
$3.3 million
. The investment is accounted for under the equity method and adjustments to the carrying value of this investment are made based on the Company’s share of capital, including share of income and expenses. The Company made an additional investment of
$1.2 million
in the
twelve months ended
December 31, 2018.
On January 1, 2017, the Company purchased through its wholly-owned subsidiary, Aspen U.S. Holdings, Inc. (“Aspen U.S. Holdings”), a
49%
share of Digital Risk Resources, LLC (“Digital Re”), a U.S.-based enterprise engaged in the business of developing, marketing and servicing turnkey information security and privacy liability insurance products for a total consideration of
$2.3 million
. The investment is accounted for under the equity method and adjustments to the carrying value of this investment are made based on the Company’s share of capital, including share of income and expenses.
On December 18, 2017, the Company acquired through its wholly-owned subsidiary, Aspen U.S. Holdings, a
23.2%
share of Crop Re Services LLC (“Crop Re”), a newly formed U.S.-based subsidiary of CGB Diversified Services, Inc (“CGB DS”) in exchange for the sale of AG Logic Holdings, LLC (“AgriLogic”), the Company’s U.S. crop insurance business. Total consideration for the sale of AgriLogic consisted of the
23.2%
share of Crop Re valued at
$62.5 million
and cash in the amount of
$5.9 million
. Crop Re is responsible for directing the placement of reinsurance on behalf of CGB DS and CGB Insurance Company (“CGBIC”), an Indiana insurance company affiliate of CGB DS and an RMA licensed crop insurer. The remaining
76.8%
of Crop Re is owned by CGB DS. AAIC’s primary crop insurance coverage will be run-off and AAIC, or an affiliate of AAIC, will provide quota share reinsurance to CGBIC for both federal and state regulated crop insurance as part of Aspen’s ownership in Crop Re. The investment in Crop Re represents the Company’s share of the net assets of Crop Re plus a basis difference which represents the difference between the cost of the investment and the amount of underlying equity in net assets. The Company has determined that this basis difference of
$62.5 million
represents the value attributable to the ability of Crop Re to direct the placement of reinsurance business under the reinsurance commitment contained within the operating agreement between Crop Re and the Company. The investment in Crop Re is accounted for under the equity method and adjustments to the carrying value of this investment are made based on the Company’s share of capital, including share of income and expenses.
On September 18, 2018, Aspen U.S. Holdings sold a
60%
interest in AgriLogic Consulting, LLC, its agricultural consulting business, to CGB DS and an individual investor. The Company’s residual
40%
interest in AgriLogic Consulting, LLC is valued at $
Nil
.
F-27
The table below shows the Company’s investments in MVI, Chaspark, Bene, Digital Re and Crop Re for the
twelve
months ended
December 31, 2018
and
2017
:
|
MVI
|
Chaspark
|
Bene
|
Digital Re
|
Crop Re
|
Total
|
|||||||||||||||||||
|
|
||||||||||||||||||||||||
|
Opening undistributed value of investment as at January 1, 2018
|
$
|
0.5
|
|
$
|
—
|
|
$
|
2.9
|
|
$
|
0.5
|
|
$
|
62.5
|
|
$
|
66.4
|
|
||||||
|
Investment in the period
|
0.2
|
|
—
|
|
1.2
|
|
—
|
|
—
|
|
1.4
|
|
||||||||||||
|
Unrealized (loss)/gain for the twelve months to December 31, 2018
|
(0.2
|
)
|
—
|
|
(0.9
|
)
|
0.4
|
|
—
|
|
(0.7
|
)
|
||||||||||||
|
Closing value of investment as at December 31, 2018
|
$
|
0.5
|
|
$
|
—
|
|
$
|
3.2
|
|
$
|
0.9
|
|
$
|
62.5
|
|
$
|
67.1
|
|
||||||
|
Opening undistributed value of investment as at January 1, 2017
|
$
|
0.5
|
|
$
|
8.4
|
|
$
|
3.2
|
|
$
|
—
|
|
$
|
—
|
|
$
|
12.1
|
|
||||||
|
Investment in the period
|
0.1
|
|
—
|
|
—
|
|
2.3
|
|
62.5
|
|
64.9
|
|
||||||||||||
|
Goodwill
|
—
|
|
—
|
|
—
|
|
(1.8
|
)
|
—
|
|
(1.8
|
)
|
||||||||||||
|
Distribution received
|
—
|
|
(9.3
|
)
|
—
|
|
—
|
|
—
|
|
(9.3
|
)
|
||||||||||||
|
Unrealized (loss)/gain for the twelve months to December 31, 2017
|
(0.1
|
)
|
0.9
|
|
(0.3
|
)
|
—
|
|
—
|
|
0.5
|
|
||||||||||||
|
Closing value of investment as at December 31, 2017
|
$
|
0.5
|
|
$
|
—
|
|
$
|
2.9
|
|
$
|
0.5
|
|
$
|
62.5
|
|
$
|
66.4
|
|
||||||
Fixed Income Securities.
The scheduled maturity distribution of the Company’s available for sale fixed income securities as at
December 31, 2018
and
December 31, 2017
is set forth below. Actual maturities may differ from contractual maturities because issuers of securities may have the right to call or prepay obligations with or without call or prepayment penalties.
|
|
As at December 31, 2018
|
|||||||||
|
|
Amortized
Cost or Cost
|
Fair Market
Value
|
Average
S&P Ratings by
Maturity
|
|||||||
|
|
($ in millions)
|
|||||||||
|
Due one year or less
|
$
|
464.3
|
|
$
|
463.5
|
|
AA-
|
|||
|
Due after one year through five years
|
2,605.7
|
|
2,582.0
|
|
AA-
|
|||||
|
Due after five years through ten years
|
1,047.9
|
|
1,028.3
|
|
AA-
|
|||||
|
Due after ten years
|
121.9
|
|
127.0
|
|
AA-
|
|||||
|
Total — Government and corporate
|
4,239.8
|
|
4,200.8
|
|
||||||
|
Agency mortgage-backed
|
1,025.1
|
|
1,012.6
|
|
AA+
|
|||||
|
Asset-backed
|
17.4
|
|
17.3
|
|
AAA
|
|||||
|
Total fixed income securities — Available for sale
|
$
|
5,282.3
|
|
$
|
5,230.7
|
|
||||
|
|
At December 31, 2017
|
|||||||||
|
|
Amortized
Cost or Cost
|
Fair Market
Value
|
Average
S&P Ratings by
Maturity
|
|||||||
|
|
($ in millions)
|
|||||||||
|
Due one year or less
|
$
|
561.7
|
|
$
|
562.4
|
|
AA
|
|||
|
Due after one year through five years
|
2,486.7
|
|
2,492.2
|
|
AA-
|
|||||
|
Due after five years through ten years
|
1,092.2
|
|
1,097.4
|
|
A+
|
|||||
|
Due after ten years
|
93.3
|
|
106.3
|
|
A
|
|||||
|
Total — Government and corporate
|
4,233.9
|
|
4,258.3
|
|
||||||
|
Agency mortgage-backed
|
941.0
|
|
946.5
|
|
AA+
|
|||||
|
Asset-backed
|
26.3
|
|
26.2
|
|
AAA
|
|||||
|
Total fixed income securities — Available for sale
|
$
|
5,201.2
|
|
$
|
5,231.0
|
|
||||
F-28
Guaranteed Investments.
As at
December 31, 2018
and
December 31, 2017
, the Company held
no
investments which are guaranteed by mono-line insurers, excluding those with explicit government guarantees. The Company’s exposure to other third-party guaranteed debt is primarily to investments backed by non-U.S. government guaranteed issuers.
Gross Unrealized Losses.
The following tables summarize, by type of security, the aggregate fair value and gross unrealized loss by length of time the security has been in an unrealized loss position for the Company’s available for sale portfolio as at
December 31, 2018
and
December 31, 2017
:
|
|
December 31, 2018
|
|||||||||||||||||||||||||
|
|
0-12 months
|
Over 12 months
|
Total
|
|||||||||||||||||||||||
|
|
Fair
Market
Value
|
Gross
Unrealized
Losses
|
Fair
Market
Value
|
Gross
Unrealized
Losses
|
Fair
Market
Value
|
Gross
Unrealized
Losses
|
Number of
Securities
|
|||||||||||||||||||
|
|
($ in millions)
|
|||||||||||||||||||||||||
|
U.S. government
|
$
|
180.2
|
|
$
|
(0.7
|
)
|
$
|
740.6
|
|
$
|
(15.4
|
)
|
$
|
920.8
|
|
$
|
(16.1
|
)
|
103
|
|||||||
|
U.S. agency
|
13.5
|
|
(0.2
|
)
|
18.4
|
|
(0.2
|
)
|
31.9
|
|
(0.4
|
)
|
12
|
|||||||||||||
|
Municipal
|
3.1
|
|
(0.1
|
)
|
25.0
|
|
(0.7
|
)
|
28.1
|
|
(0.8
|
)
|
9
|
|||||||||||||
|
Corporate
|
999.1
|
|
(15.2
|
)
|
762.2
|
|
(25.3
|
)
|
1,761.3
|
|
(40.5
|
)
|
667
|
|||||||||||||
|
Non-U.S. government-backed corporate
|
14.5
|
|
—
|
|
25.8
|
|
(0.2
|
)
|
40.3
|
|
(0.2
|
)
|
12
|
|||||||||||||
|
Non-U.S government
|
64.0
|
|
(0.3
|
)
|
91.0
|
|
(0.5
|
)
|
155.0
|
|
(0.8
|
)
|
57
|
|||||||||||||
|
Asset-backed
|
6.3
|
|
—
|
|
10.8
|
|
(0.1
|
)
|
17.1
|
|
(0.1
|
)
|
8
|
|||||||||||||
|
Agency mortgage-backed
|
245.7
|
|
(2.6
|
)
|
447.3
|
|
(16.4
|
)
|
693.0
|
|
(19.0
|
)
|
253
|
|||||||||||||
|
Total fixed income securities — Available for sale
|
1,526.4
|
|
(19.1
|
)
|
2,121.1
|
|
(58.8
|
)
|
3,647.5
|
|
(77.9
|
)
|
1,121
|
|||||||||||||
|
Total short-term investments — Available for sale
|
34.5
|
|
—
|
|
—
|
|
—
|
|
34.5
|
|
—
|
|
12
|
|||||||||||||
|
Total
|
$
|
1,560.9
|
|
$
|
(19.1
|
)
|
$
|
2,121.1
|
|
$
|
(58.8
|
)
|
$
|
3,682.0
|
|
$
|
(77.9
|
)
|
1,133
|
|||||||
|
|
December 31, 2017
|
|||||||||||||||||||||||||
|
|
0-12 months
|
Over 12 months
|
Total
|
|||||||||||||||||||||||
|
|
Fair
Market
Value
|
Gross
Unrealized
Losses
|
Fair
Market
Value
|
Gross
Unrealized
Losses
|
Fair
Market
Value
|
Gross
Unrealized
Losses
|
Number of
Securities
|
|||||||||||||||||||
|
|
($ in millions)
|
|||||||||||||||||||||||||
|
U.S. government
|
$
|
652.1
|
|
$
|
(5.1
|
)
|
$
|
259.8
|
|
$
|
(6.5
|
)
|
$
|
911.9
|
|
$
|
(11.6
|
)
|
101
|
|||||||
|
U.S. agency
|
20.1
|
|
(0.2
|
)
|
6.1
|
|
—
|
|
26.2
|
|
(0.2
|
)
|
10
|
|||||||||||||
|
Municipal
|
28.5
|
|
(0.2
|
)
|
—
|
|
—
|
|
28.5
|
|
(0.2
|
)
|
9
|
|||||||||||||
|
Corporate
|
699.3
|
|
(3.4
|
)
|
360.7
|
|
(8.4
|
)
|
1,060.0
|
|
(11.8
|
)
|
412
|
|||||||||||||
|
Non-U.S. government-backed corporate
|
43.5
|
|
(0.3
|
)
|
13.3
|
|
(0.2
|
)
|
56.8
|
|
(0.5
|
)
|
15
|
|||||||||||||
|
Non-U.S government
|
206.2
|
|
(0.8
|
)
|
32.0
|
|
(0.4
|
)
|
238.2
|
|
(1.2
|
)
|
47
|
|||||||||||||
|
Asset-backed
|
11.1
|
|
—
|
|
10.5
|
|
(0.1
|
)
|
21.6
|
|
(0.1
|
)
|
11
|
|||||||||||||
|
Agency mortgage-backed
|
257.6
|
|
(1.9
|
)
|
301.9
|
|
(6.3
|
)
|
559.5
|
|
(8.2
|
)
|
156
|
|||||||||||||
|
Total fixed income securities — Available for sale
|
1,918.4
|
|
(11.9
|
)
|
984.3
|
|
(21.9
|
)
|
2,902.7
|
|
(33.8
|
)
|
761
|
|||||||||||||
|
Total short-term investments — Available for sale
|
46.9
|
|
(0.1
|
)
|
—
|
|
—
|
|
46.9
|
|
(0.1
|
)
|
8
|
|||||||||||||
|
Total
|
$
|
1,965.3
|
|
$
|
(12.0
|
)
|
$
|
984.3
|
|
$
|
(21.9
|
)
|
$
|
2,949.6
|
|
$
|
(33.9
|
)
|
769
|
|||||||
F-29
Other-than-temporary Impairments.
A security is potentially impaired when its fair value is below its cost or amortized cost. The Company reviews its available for sale fixed income and equity portfolios on an individual security basis for potential OTTI each quarter based on criteria including issuer-specific circumstances, credit ratings actions and general macro-economic conditions. The total OTTI charge for the
twelve months ended
December 31, 2018
was $
Nil
(
2017
—
$0.7 million
). For a more detailed description of accounting policies for OTTI, refer to Note 2(c), “Basis of Preparation and Significant Accounting Policies — Accounting for Investments, Cash and Cash Equivalents” of these consolidated financial statements.
|
7.
|
Variable Interest Entities
|
As at
December 31, 2018
, the Company had investments in
two
(
December 31, 2017
—
two
) variable interest entities (“VIE”), namely Peregrine Reinsurance Ltd (“Peregrine”) and Silverton Re Ltd (“Silverton”). On March 10, 2017, Aspen Recoveries Limited received cash of
$9.3 million
as settlement of its share of subrogation assets held by Chaspark, discussed further in Note 6, “Investments” in these consolidated financial statements.
Peregrine.
In November 2016, Peregrine, a subsidiary of the Company, was registered as a segregated accounts company under the Segregated Accounts Companies Act 2000, as amended. As at
December 31, 2018
, Peregrine had four segregated accounts which were funded by third party investors.
The Company has determined that Peregrine has the characteristics of a VIE as addressed by the guidance in ASC 810,
Consolidation
. The four segregated accounts have not been consolidated as part of the Company’s consolidated financial statements because the Company is not the primary beneficiary of those accounts. The Company has, however, concluded that it is the primary beneficiary of the Peregrine general fund and, similar to prior reporting periods, the results of the Peregrine general fund are included in the Company’s consolidated financial statements. The Company’s exposure to Peregrine’s general fund is not material.
Silverton.
On September 10, 2013, the Company established Silverton, a Bermuda domiciled special purpose insurer
formed to provide additional collateralized capacity to support Aspen Re’s business through retrocession agreements which are collateralized and funded by Silverton through the issuance of one or more series of participating loan notes (collectively, the “Loan Notes”). Silverton is a non-rated insurer and the risks are fully collateralized by way of funds held in trust for the benefit of Aspen Bermuda and Aspen U.K., the ceding reinsurers. Silverton has not issued any Loan Notes since 2017 given that, in the future, any such quota share support for Aspen Re will be provided by a separate cell of Peregrine.
All proceeds from the issuance of the Loan Notes were deposited into separate collateral accounts for each series of Loan Notes to fund Silverton’s obligations under a retrocession property quota share agreement entered into with Aspen Bermuda or Aspen Bermuda and Aspen U.K, as the case may be. The holders of the Loan Notes participate in any profit or loss generated by Silverton attributable to the operations of the respective Silverton segregated account. Any existing value of the Loan Notes will be returned to the noteholders in installments after the expiration of the risk period of the retrocession agreement issued by Silverton for the related series of Loan Notes with the final payment being contractually due on the respective maturity dates.
The following tables show the total liability balance of the Loan Notes for the twelve months ended
December 31, 2018
and
2017
:
|
For the Twelve Months Ended December 31, 2018
|
||||||||||||
|
Third Party
|
Aspen Holdings
|
Total
|
||||||||||
|
($ in millions)
|
||||||||||||
|
Opening balance
|
$
|
86.6
|
|
$
|
20.6
|
|
$
|
107.2
|
|
|||
|
Total change in fair value for the period
|
4.4
|
|
1.1
|
|
5.5
|
|
||||||
|
Total distributed in the period
|
(86.4
|
)
|
(20.6
|
)
|
(107.0
|
)
|
||||||
|
Closing balance as at December 31, 2018
|
$
|
4.6
|
|
$
|
1.1
|
|
$
|
5.7
|
|
|||
|
Liability
|
||||||||||||
|
Loan notes (long-term liabilities)
|
$
|
—
|
|
$
|
—
|
|
$
|
—
|
|
|||
|
Accrued expenses (current liabilities)
|
4.6
|
|
1.1
|
|
5.7
|
|
||||||
|
Total aggregate unpaid balance as at December 31, 2018
|
$
|
4.6
|
|
$
|
1.1
|
|
$
|
5.7
|
|
|||
F-30
|
For the Twelve Months Ended December 31, 2017
|
||||||||||||
|
Third Party
|
Aspen Holdings
|
Total
|
||||||||||
|
($ in millions)
|
||||||||||||
|
Opening balance
|
$
|
223.4
|
|
$
|
54.5
|
|
$
|
277.9
|
|
|||
|
Total change in fair value for the period
|
(21.2
|
)
|
(5.3
|
)
|
(26.5
|
)
|
||||||
|
Total distributed in the period
|
(115.6
|
)
|
(28.6
|
)
|
(144.2
|
)
|
||||||
|
Closing balance as at December 31, 2017
|
$
|
86.6
|
|
$
|
20.6
|
|
$
|
107.2
|
|
|||
|
Liability
|
||||||||||||
|
Loan notes (long-term liabilities)
|
$
|
44.2
|
|
$
|
10.5
|
|
$
|
54.7
|
|
|||
|
Accrued expenses (current liabilities)
|
42.4
|
|
10.1
|
|
52.5
|
|
||||||
|
Total aggregate unpaid balance as at December 31, 2017
|
$
|
86.6
|
|
$
|
20.6
|
|
$
|
107.2
|
|
|||
The Company has determined that Silverton has the characteristics of a VIE that are addressed by the guidance in ASC 810,
Consolidation.
The Company concluded that it is the primary beneficiary of Silverton as it owns all of Silverton’s voting shares and issued share capital, and has a significant financial interest in, and the power to control, Silverton. As a result, the Company consolidated Silverton upon its formation. The Company has no other obligation to provide financial support to Silverton and neither the creditors nor beneficial interest holders of Silverton have recourse to the Company’s general credit.
In the event of an extreme catastrophic property reinsurance event or severe credit-related event, there is a risk that Aspen Bermuda and Aspen U.K. would be unable to recover losses from Silverton. These two risks are mitigated as follows:
|
i.
|
Silverton has collateralized the aggregate limit provided to Aspen Bermuda and Aspen U.K. by way of a trust in favor of Aspen Bermuda and Aspen U.K. as beneficiaries;
|
|
ii.
|
the trustee is a large, well-established regulated entity; and
|
|
iii.
|
all funds within the trust account are bound by investment guidelines restricting investments to one of the institutional class money market funds run by large international investment managers.
|
For further information regarding the Loan Notes attributable to the third-party investments in Silverton, refer to Note 8, “Fair Value Measurements” of these consolidated financial statements.
|
8.
|
Fair Value Measurements
|
The Company’s estimates of fair value for financial assets and liabilities are based on the framework established in the fair value accounting guidance included in ASC Topic 820, “
Fair Value Measurements and Disclosures
.” The framework prioritizes the inputs, which refer broadly to assumptions market participants would use in pricing an asset or liability, into three levels.
The Company considers prices for actively traded securities to be derived based on quoted prices in an active market for identical assets, which are Level 1 inputs in the fair value hierarchy. The majority of these securities are valued using prices supplied by index providers.
The Company considers prices for other securities that may not be as actively traded which are priced via pricing services, index providers, vendors and broker-dealers, or with reference to interest rates and yield curves, to be derived based on inputs that are observable for the asset, either directly or indirectly, which are Level 2 inputs in the fair value hierarchy. The majority of these securities are also valued using prices supplied by index providers.
The Company considers securities, other financial instruments and derivative insurance contracts subject to fair value measurement whose valuation is derived by internal valuation models to be based largely on unobservable inputs, which are Level 3 inputs in the fair value hierarchy.
F-31
The following tables present the level within the fair value hierarchy at which the Company’s financial assets and liabilities are measured on a recurring basis as at
December 31, 2018
and
December 31, 2017
:
|
|
As at December 31, 2018
|
|||||||||||||||
|
|
Level 1
|
Level 2
|
Level 3
|
Total
|
||||||||||||
|
|
($ in millions)
|
|||||||||||||||
|
Available for sale financial assets, at fair value
|
||||||||||||||||
|
U.S. government
|
$
|
1,404.2
|
|
$
|
—
|
|
$
|
—
|
|
$
|
1,404.2
|
|
||||
|
U.S. agency
|
—
|
|
47.4
|
|
—
|
|
47.4
|
|
||||||||
|
Municipal
|
—
|
|
47.2
|
|
—
|
|
47.2
|
|
||||||||
|
Corporate
|
—
|
|
2,206.2
|
|
—
|
|
2,206.2
|
|
||||||||
|
Non-U.S. government-backed corporate
|
—
|
|
93.2
|
|
—
|
|
93.2
|
|
||||||||
|
Non-U.S. government
|
268.0
|
|
134.6
|
|
—
|
|
402.6
|
|
||||||||
|
Asset-backed
|
—
|
|
17.3
|
|
—
|
|
17.3
|
|
||||||||
|
Agency mortgage-backed
|
—
|
|
1,012.6
|
|
—
|
|
1,012.6
|
|
||||||||
|
Total fixed income securities available for sale, at fair value
|
1,672.2
|
|
3,558.5
|
|
—
|
|
5,230.7
|
|
||||||||
|
Short-term investments available for sale, at fair value
|
93.7
|
|
11.9
|
|
—
|
|
105.6
|
|
||||||||
|
Held for trading financial assets, at fair value
|
||||||||||||||||
|
U.S. government
|
147.7
|
|
—
|
|
—
|
|
147.7
|
|
||||||||
|
Municipal
|
—
|
|
2.7
|
|
—
|
|
2.7
|
|
||||||||
|
Corporate
|
—
|
|
720.2
|
|
—
|
|
720.2
|
|
||||||||
|
Non-U.S. government-backed corporate
|
—
|
|
—
|
|
—
|
|
—
|
|
||||||||
|
Non-U.S. government
|
68.2
|
|
197.2
|
|
—
|
|
265.4
|
|
||||||||
|
Asset-backed
|
—
|
|
2.4
|
|
—
|
|
2.4
|
|
||||||||
|
Agency Mortgage-Backed
|
—
|
|
49.4
|
|
—
|
|
49.4
|
|
||||||||
|
Total fixed income securities trading, at fair value
|
215.9
|
|
971.9
|
|
—
|
|
1,187.8
|
|
||||||||
|
Short-term investments trading, at fair value
|
4.5
|
|
5.0
|
|
—
|
|
9.5
|
|
||||||||
|
Equity investments trading, at fair value
|
—
|
|
—
|
|
—
|
|
—
|
|
||||||||
|
Catastrophe bonds trading, at fair value
|
—
|
|
36.2
|
|
—
|
|
36.2
|
|
||||||||
|
Other investments
(1)
|
—
|
|
—
|
|
—
|
|
102.5
|
|
||||||||
|
Other financial assets and liabilities, at fair value
|
||||||||||||||||
|
Derivatives at fair value — foreign exchange contracts
|
—
|
|
14.6
|
|
—
|
|
14.6
|
|
||||||||
|
Liabilities under derivative contracts — foreign exchange contracts
|
—
|
|
(15.1
|
)
|
—
|
|
(15.1
|
)
|
||||||||
|
Loan notes issued by variable interest entities, at fair value
|
—
|
|
—
|
|
—
|
|
—
|
|
||||||||
|
Loan notes issued by variable interest entities, at fair value (included within accrued expenses and other payables)
|
—
|
|
—
|
|
(4.6
|
)
|
(4.6
|
)
|
||||||||
|
Total
|
$
|
1,986.3
|
|
$
|
4,583.0
|
|
$
|
(4.6
|
)
|
$
|
6,667.2
|
|
||||
______________
|
(1)
|
Other investments represents our investment in a real estate fund and is measured at fair value using the net asset value per share practical expedient. As a result this has not been classified in the fair value hierarchy. The fair value amounts presented in the table above are intended to permit reconciliation of the fair value hierarchy to the amounts presented in the condensed consolidated balance sheets. The investment in the real estate fund is subject to restrictions as detailed in Note 19, “Commitments and Contingencies.”
|
Transfers of assets into or out of a particular level are recorded at their fair values as of the end of each reporting period consistent with the date of the determination of fair value. During the twelve months ended
December 31, 2018
, the Company transferred
$6.4 million
of non-U.S. government securities from Level 1 to Level 2. There were no transfers between Level 2 and Level 3 during the twelve months ended
December 31, 2018
.
The Company settled
$86.4 million
Level 3 liabilities in respect of the Loan Notes issued by Silverton for the
twelve months ended
December 31, 2018
. As at
December 31, 2018
, there were no assets classified as Level 3 and the Company’s Level 3 liabilities consisted solely of the Loan Notes issued by Silverton.
F-32
|
|
At December 31, 2017
|
||||||||||||||
|
|
Level 1
|
Level 2
|
Level 3
|
Total
|
|||||||||||
|
|
($ in millions)
|
||||||||||||||
|
Available for sale financial assets, at fair value
|
|||||||||||||||
|
U.S. government
|
$
|
1,159.4
|
|
$
|
—
|
|
$
|
—
|
|
$
|
1,159.4
|
|
|||
|
U.S. agency
|
—
|
|
52.1
|
|
—
|
|
52.1
|
|
|||||||
|
Municipal
|
—
|
|
54.9
|
|
—
|
|
54.9
|
|
|||||||
|
Corporate
|
—
|
|
2,415.7
|
|
—
|
|
2,415.7
|
|
|||||||
|
Non-U.S. government-backed corporate
|
—
|
|
91.3
|
|
—
|
|
91.3
|
|
|||||||
|
Non-U.S. government
|
341.2
|
|
143.7
|
|
—
|
|
484.9
|
|
|||||||
|
Asset-backed
|
—
|
|
26.2
|
|
—
|
|
26.2
|
|
|||||||
|
Agency mortgage-backed
|
—
|
|
946.5
|
|
—
|
|
946.5
|
|
|||||||
|
Total fixed income securities available for sale, at fair value
|
1,500.6
|
|
3,730.4
|
|
—
|
|
5,231.0
|
|
|||||||
|
Short-term investments available for sale, at fair value
|
87.3
|
|
2.6
|
|
—
|
|
89.9
|
|
|||||||
|
Held for trading financial assets, at fair value
|
|||||||||||||||
|
U.S. government
|
161.9
|
|
—
|
|
—
|
|
161.9
|
|
|||||||
|
Municipal
|
—
|
|
32.2
|
|
—
|
|
32.2
|
|
|||||||
|
Corporate
|
—
|
|
1,046.3
|
|
—
|
|
1,046.3
|
|
|||||||
|
Non-U.S. government-backed corporate
|
—
|
|
1.0
|
|
—
|
|
1.0
|
|
|||||||
|
Non-U.S. government
|
24.5
|
|
178.0
|
|
—
|
|
202.5
|
|
|||||||
|
Asset-backed
|
—
|
|
9.9
|
|
—
|
|
9.9
|
|
|||||||
|
Agency mortgage-backed
|
—
|
|
195.5
|
|
—
|
|
195.5
|
|
|||||||
|
Total fixed income securities trading, at fair value
|
186.4
|
|
1,462.9
|
|
—
|
|
1,649.3
|
|
|||||||
|
Short-term investments trading, at fair value
|
73.0
|
|
—
|
|
—
|
|
73.0
|
|
|||||||
|
Equity investments trading, at fair value
|
491.0
|
|
—
|
|
—
|
|
491.0
|
|
|||||||
|
Catastrophe bonds trading, at fair value
|
—
|
|
32.4
|
|
—
|
|
32.4
|
|
|||||||
|
Other financial assets and liabilities, at fair value
|
|||||||||||||||
|
Derivatives at fair value — foreign exchange contracts
|
—
|
|
6.4
|
|
—
|
|
6.4
|
|
|||||||
|
Liabilities under derivative contracts — foreign exchange contracts
|
—
|
|
(1.0
|
)
|
—
|
|
(1.0
|
)
|
|||||||
|
Loan notes issued by variable interest entities, at fair value
|
—
|
|
—
|
|
(44.2
|
)
|
(44.2
|
)
|
|||||||
|
Loan notes issued by variable interest entities, at fair value (included within accrued expenses and other payables)
|
—
|
|
—
|
|
(42.4
|
)
|
(42.4
|
)
|
|||||||
|
Total
|
$
|
2,338.3
|
|
$
|
5,233.7
|
|
$
|
(86.6
|
)
|
$
|
7,485.4
|
|
|||
Transfers of assets into or out of a particular level are recorded at their fair values as of the end of each reporting period consistent with the date of the determination of fair value. During the twelve months ended
December 31, 2017
, there were no transfers between Level 1, Level 2 and Level 3.
The Company settled
$115.6 million
Level 3 liabilities in respect to the Loan Notes issued by Silverton for the
twelve months ended
December 31, 2017
. As at
December 31, 2017
, there were no the assets classified as Level 3 and the Company’s Level 3 liabilities consisted solely of the Loan Notes issued by Silverton.
F-33
The following table presents a reconciliation of the beginning and ending balances for all assets and liabilities measured at fair value on a recurring basis using Level 3 inputs for the twelve months ended
December 31, 2018
and
December 31, 2017
:
|
Reconciliation of Liabilities Using Level 3 Inputs
|
Twelve Months Ended December 31, 2018
|
Twelve Months Ended December 31, 2017
|
|||||||
|
($ in millions)
|
|||||||||
|
Balance at the beginning of the period
(1)
|
$
|
86.6
|
|
$
|
223.4
|
|
|||
|
Distributed to third party
|
(86.4
|
)
|
(115.6
|
)
|
|||||
|
Total change in fair value included in the statement of operations
|
4.4
|
|
(21.2
|
)
|
|||||
|
Balance at the end of the period
(1)
|
$
|
4.6
|
|
$
|
86.6
|
|
|||
______________
|
(1)
|
The amount classified as other payables was
$4.6 million
and
$42.4 million
as at
December 31, 2018
and
December 31, 2017
, respectively.
|
Valuation of Fixed Income Securities
. The Company’s fixed income securities are classified as either available for sale or trading and are carried at fair value. As at
December 31, 2018
and
December 31, 2017
, the Company’s fixed income securities were valued by pricing services, index providers or broker-dealers using standard market conventions. The market conventions utilize market quotations, market transactions in comparable instruments and various relationships between instruments including, but not limited to, yield to maturity, dollar prices and spread prices in determining value.
Independent Pricing Services and Index Providers.
The underlying methodology used to determine the fair value of securities in the Company’s available for sale and trading portfolios by the pricing services and index providers the Company uses is very similar. Pricing services will gather observable pricing inputs from multiple external sources, including buy and sell-side contacts and broker-dealers, in order to develop their internal prices. Index providers are those firms which provide prices for a range of securities within one or more asset classes, typically using their own in-house market makers (traders) as the primary pricing source for the indices, although ultimate valuations may also rely on other observable data inputs to derive a dollar price for all index-eligible securities. Index providers without in-house trading desks will function similarly to a pricing service in that they will gather their observable pricing inputs from multiple external sources. All prices for the Company’s securities attributed to index providers are for an individual security within the respective indices.
Pricing services and index providers provide pricing for less complex, liquid securities based on market quotations in active markets. Pricing services and index providers supply prices for a broad range of securities including those for actively traded securities, such as Treasury and other Government securities, in addition to those that trade less frequently or where valuation includes reference to credit spreads, pay down and pre-pay features and other observable inputs. These securities include Government agency, municipals, corporate and asset-backed securities.
For securities that may trade less frequently or do not trade on a listed exchange, these pricing services and index providers may use matrix pricing consisting of observable market inputs to estimate the fair value of a security. These observable market inputs include: reported trades, benchmark yields, broker-dealer quotes, issuer spreads, two-sided markets, benchmark securities, bids, offers, reference data, and industry and economic factors. Additionally, pricing services and index providers may use a valuation model such as an option adjusted spread model commonly used for estimating fair values of mortgage-backed and asset-backed securities. Neither the Company, nor its index providers, derives dollar prices using an index as a pricing input for any individual security.
Broker-Dealers.
The Company obtains quotes from broker-dealers who are active in the corresponding markets when prices are unavailable from independent pricing services or index providers. Generally, broker-dealers value securities through their trading desks based on observable market inputs. Their pricing methodologies include mapping securities based on trade data, bids or offers, observed spreads and performance of newly issued securities. They may also establish pricing through observing secondary trading of similar securities. Quotes from broker-dealers are non-binding.
The Company obtains prices for all of its fixed income investment securities via its third-party accounting service provider, and in the majority of cases receiving a number of quotes so as to obtain the most comprehensive information available to determine a security’s fair value. A single valuation is applied to each security based on the vendor hierarchy maintained by the Company’s third-party accounting service provider.
F-34
As at
December 31, 2018
, the Company obtained an average of
2.2
quotes per fixed income investment compared to
2.0
quotes at
December 31, 2017
. Pricing sources used in pricing fixed income investments as at
December 31, 2018
and
December 31, 2017
were as follows:
|
|
As at December 31, 2018
|
At December 31, 2017
|
||||
|
Index providers
|
84
|
%
|
84
|
%
|
||
|
Pricing services
|
13
|
|
11
|
|
||
|
Broker-dealers
|
3
|
|
5
|
|
||
|
Total
|
100
|
%
|
100
|
%
|
||
Summary Pricing Information Table.
A summary of securities priced using pricing information from index providers as at
December 31, 2018
and
December 31, 2017
is provided below:
|
|
As at December 31, 2018
|
At December 31, 2017
|
||||||||||
|
|
Fair Market
Value Determined
using Prices from
Index Providers
|
% of Total
Fair Value from
Index Providers
|
Fair Market
Value Determined
using Prices from
Index Providers
|
% of Total
Fair Value from
Index Providers
|
||||||||
|
|
($ in millions, except for percentages)
|
|||||||||||
|
U.S. government
|
$
|
1,551.9
|
|
100%
|
$
|
1,321.3
|
|
100%
|
||||
|
U.S. agency
|
45.7
|
|
96%
|
43.4
|
|
83%
|
||||||
|
Municipal
|
14.7
|
|
30%
|
37.4
|
|
43%
|
||||||
|
Corporate
|
2,775.7
|
|
95%
|
3,299.6
|
|
83%
|
||||||
|
Non-U.S. government-backed corporate
|
43.3
|
|
47%
|
44.0
|
|
48%
|
||||||
|
Non-U.S. government
|
366.1
|
|
56%
|
399.4
|
|
58%
|
||||||
|
Asset-backed
|
7.7
|
|
39%
|
13.5
|
|
37%
|
||||||
|
Agency mortgage-backed
|
567.5
|
|
53%
|
605.0
|
|
53%
|
||||||
|
Total fixed income securities
|
$
|
5,372.6
|
|
84%
|
$
|
5,763.6
|
|
84%
|
||||
|
Equities
|
$
|
—
|
|
—%
|
$
|
491.0
|
|
100%
|
||||
|
Total fixed income securities and equity investments
|
$
|
5,372.6
|
|
84%
|
$
|
6,254.6
|
|
85%
|
||||
The Company, in conjunction with its third-party accounting service provider, obtains an understanding of the methods, models and inputs used by the third-party pricing service and index providers to assess the ongoing appropriateness of vendors’ prices. The Company and its third-party accounting service provider also have controls in place to validate that amounts provided represent fair values. Processes to validate and review pricing include, but are not limited to:
|
•
|
quantitative analysis (e.g., comparing the quarterly return for each managed portfolio to its target benchmark, with significant differences identified and investigated);
|
|
•
|
comparison of market values obtained from pricing services, index providers and broker-dealers against alternative price sources for each security where further investigation is completed when significant differences exist for pricing of individual securities between pricing sources;
|
|
•
|
initial and ongoing evaluation of methodologies used by outside parties to calculate fair value; and
|
|
•
|
comparison of the fair value estimates to the Company’s knowledge of the current market.
|
Prices obtained from pricing services, index providers and broker-dealers are not adjusted by us; however, prices provided by a pricing service, index provider or broker-dealer in certain instances may be challenged based on market or information available from internal sources, including those available to the Company’s third-party investment accounting service provider. Subsequent to any challenge, revisions made by the pricing service, index provider or broker-dealer to the quotes are supplied to the Company’s investment accounting service provider.
Management reviews the vendor hierarchy maintained by the Company’s third-party accounting service provider in order to determine which price source provides the most appropriate fair value (i.e., a price obtained from a pricing service with more seniority in the hierarchy will be used over a less senior one in all cases). The hierarchy level assigned to each security in the Company’s available for sale and trading portfolios is based upon its assessment of the transparency and reliability of the inputs used in the valuation as of the measurement date. The hierarchy of index providers and pricing services is determined using various qualitative and quantitative points arising from reviews of the vendors conducted by the Company’s third-party accounting service
F-35
provider. Vendor reviews include annual onsite due diligence meetings with index providers and pricing services vendors covering valuation methodology, operational walkthroughs and legal and compliance updates. Index providers are assigned the highest priority in the pricing hierarchy due primarily to availability and reliability of pricing information.
Fixed Income Securities
. Fixed income securities are traded on the over-the-counter (“OTC”) market based on prices provided by one or more market makers in each security. Securities such as U.S. Government, U.S. Agency, Foreign Government and investment grade corporate bonds have multiple market makers in addition to readily observable market value indicators such as expected credit spread, except for Treasury securities, over the yield curve. The Company uses a variety of pricing sources to value fixed income securities including those securities that have pay down/prepay features such as mortgage-backed securities and asset-backed securities in order to ensure fair and accurate pricing. The fair value estimates for the investment grade securities in the Company’s portfolio do not use significant unobservable inputs or modeling techniques.
U.S. Government and Agency Securities.
U.S. government and agency securities consist primarily of bonds issued by the U.S. Treasury and corporate debt issued by agencies such as the Federal National Mortgage Association (“FNMA”), the Federal Home Loan Mortgage Corporation (“FHLMC”) and the Federal Home Loan Bank. As the fair values of U.S. Treasury securities are based on unadjusted market prices in active markets, they are classified within Level 1. The fair values of U.S. government agency securities are priced using the spread above the risk-free yield curve. As the yields for the risk-free yield curve and the spreads for these securities are observable market inputs, the fair values of U.S. government agency securities are classified within Level 2.
Municipal Securities.
The Company’s municipal portfolio consist of bonds issued by U.S. domiciled state and municipality entities. The fair value of these securities is determined using spreads obtained from broker-dealers, trade prices and the new issue market which are Level 2 inputs in the fair value hierarchy. Consequently, these securities are classified within Level 2.
Non-U.S. Government.
The issuers for securities in this category are non-U.S. governments and their agents including, but not limited to, the U.K., Australia, Canada, France and Germany. The fair values of certain non-U.S. government bonds, primarily sourced from international indices, are based on unadjusted market prices in active markets and are therefore classified within Level 1. The remaining non-U.S government bonds are classified within level 2 as they are not actively traded. The fair values of the non-U.S. agency securities, again primarily sourced from international indices, are priced using the spread above the risk-free yield curve. As the yields for the risk-free yield curve and the spreads for these securities are observable market inputs, the fair values of non-U.S. agency securities are classified within Level 2. In addition, foreign government securities include a portion of the Emerging Market Debt (“EMD”) portfolio which is also classified within Level 2.
Corporate.
Corporate securities consist primarily of short-term, medium-term and long-term debt issued by U.S. and foreign corporations covering a variety of industries and are generally priced by index providers and pricing vendors. Some issuers may participate in government programs which guarantee timely payment of principal and interest in the event of a default. The fair values of these securities are generally determined using the spread above the risk-free yield curve. Inputs used in the evaluation of these securities include credit data, interest rate data, market observations and sector news, broker-dealer quotes and trade volumes. In addition, corporate securities include a portion of the EMD portfolio. The Company classifies all of these securities within Level 2.
Mortgage-backed Securities.
Residential and commercial mortgage-backed securities consist of bonds issued by the Government National Mortgage Association, the FNMA and the FHLMC as well as private non-agency issuers. The fair values of these securities are determined through the use of a pricing model (including Option Adjusted Spread) which uses prepayment speeds and spreads to determine the appropriate average life of the mortgage-backed security. These spreads are generally obtained from broker-dealers, trade prices and the new issue market. As the significant inputs used to price mortgage-backed securities are observable market inputs, these securities are classified within Level 2.
Asset-backed Securities.
Asset-backed securities are securities backed by notes or receivables against assets other than real estate. The underlying collateral for the Company’s asset-backed securities consists mainly of student loans, automobile loans and credit card receivables. These securities are primarily priced by index providers and pricing vendors. Inputs to the valuation process include broker-dealer quotes and other available trade information, prepayment speeds, interest rate data and credit spreads. The Company classifies these securities within Level 2.
Short-term Investments.
Short-term investments consist of highly liquid debt securities with a maturity greater than three months but less than one year from the date of purchase. Short-term investments are classified as either trading or available for sale according to the facts and circumstances of the investment held. Short-term investments are valued in a manner similar to the Company’s fixed maturity investments and are classified within Levels 1 and 2.
Equity Securities.
Equity securities consisted of U.S. and foreign common stocks and were classified as trading and carried at fair value. These securities were classified within Level 1 as their fair values were based on quoted market prices in active markets from independent pricing sources. As at
December 31, 2017
, the Company obtained an average of
4.0
quotes per equity investment. Pricing sources used in pricing equities as at
December 31, 2017
were all provided by index providers.
F-36
Catastrophe Bonds.
Catastrophe bonds are variable rate fixed income instruments with redemption values adjusted based on the occurrence of a covered event, usually windstorms and earthquakes. Catastrophe bonds are classified as trading and carried at fair value. Catastrophe bonds are priced using an average of multiple broker-dealer quotes and as such, are considered Level 2.
Foreign Exchange Contracts.
The foreign exchange contracts which the Company uses to mitigate currency risk are characterized as OTC due to their customized nature and the fact that they do not trade on a major exchange. These instruments trade in a very deep liquid market, providing substantial price transparency and accordingly are classified as Level 2.
Other investments.
The Company’s other investments represent our investment in a real estate fund. Adjustments to the fair value are made based on the net asset value of the investment. The net valuation criteria established by the manager of such investments are established in accordance with the governing documents and the asset manager’s valuation guidelines, which consider a two part approach: the discounted cash flows approach and the performance multiple approach, which uses a multiple/capitalization rate derived from market metrics from comparable companies or assets to produce operating performance metrics. Alternative valuation methodologies may be employed for investments with unusual characteristics.
Loan Notes Issued by Variable Interest Entities
. Silverton, a licensed special purpose insurer, is consolidated into the Company’s group accounts as a VIE. In the fourth quarter of 2014, Silverton issued
$85.0 million
(
$70.0 million
third-party funded) of Loan Notes with a maturity date of September 18, 2017. During the fourth quarter of 2015, Silverton issued
$125.0 million
(
$100.0 million
third-party funded) of Loan Notes with a maturity date of September 17, 2018. In the fourth quarter of 2016, Silverton issued
$130.0 million
(
$105.0 million
third-party funded) of Loan Notes with a maturity date of September 16, 2019. Silverton has not issued any Loan Notes since 2017 and, in the future, any such quota share support for Aspen Re will be provided by a separate cell of Peregrine. The Company elected to account for the Loan Notes at fair value using the guidance as prescribed under ASC 825,
Financial Instruments
as the Company believes it represents the most meaningful measurement basis for these liabilities. The Loan Notes are recorded at fair value at each reporting period and, given they are not quoted on an active market and contain significant unobservable inputs, they have been classified as Level 3 instruments in the Company’s fair value hierarchy. The Loan Notes are unique because they are linked to the specific risks of the Company’s property catastrophe book.
To determine the fair value of the Loan Notes the Company runs an internal model which considers the seasonality of the risk assumed under the retrocessional agreement between Aspen Bermuda or a combination of Aspen Bermuda and Aspen U.K., as ceding reinsurers, and Silverton. The seasonality used in the model is determined by applying the percentage of property catastrophe losses planned by the Company’s actuaries to the estimated written premium to determine earned premium for each quarter. The inputs to the internal valuation model are based on Company specific data due to the lack of observable market inputs. Reserves for losses are the most significant unobservable input. An increase in reserves for losses would normally result in a decrease in the fair value of the Loan Notes while a decrease in reserves would normally result in an increase in the fair value of the Loan Notes. The observable and unobservable inputs used to determine the fair value of the Loan Notes as at
December 31, 2018
and
December 31, 2017
, respectively, are presented in the tables below:
|
At December 31, 2018
|
Fair Value
Level 3
|
Valuation Method
|
Observable (O) and
Unobservable (U) inputs
|
Low
|
High
|
|||||||||||
|
($ in millions)
|
($ in millions)
|
|||||||||||||||
|
Loan Notes
|
$
|
4.6
|
|
(1)
|
Internal Valuation Model
|
Gross premiums written (O)
|
$
|
50.1
|
|
$
|
61.1
|
|
||||
|
Reserve for losses (U)
|
$
|
4.2
|
|
$
|
61.9
|
|
||||||||||
|
Contract period (O)
|
N/A
|
|
365 days
|
|
||||||||||||
|
Initial value of issuance (O)
|
$
|
325.0
|
|
$
|
325.0
|
|
||||||||||
|
At December 31, 2017
|
Fair Value
Level 3
|
Valuation Method
|
Observable (O) and
Unobservable (U) inputs
|
Low
|
High
|
|||||||||||
|
($ in millions)
|
($ in millions)
|
|||||||||||||||
|
Loan Notes
|
$
|
86.6
|
|
(1)
|
Internal Valuation Model
|
Gross premiums written (O)
|
$
|
50.1
|
|
$
|
61.1
|
|
||||
|
Reserve for losses (U)
|
$
|
4.2
|
|
$
|
61.9
|
|
||||||||||
|
Contract period (O)
|
N/A
|
|
365 days
|
|
||||||||||||
|
Initial value of issuance (O)
|
$
|
325.0
|
|
$
|
325.0
|
|
||||||||||
______________
|
(1)
|
The amount classified as other payables was
$4.6 million
and
$42.4 million
as at
December 31, 2018
and
December 31, 2017
, respectively.
|
F-37
The observable and unobservable inputs represent the potential variation around the inputs used in the valuation model. The contract period is defined in the respective Loan Notes agreement and the initial value represents the funds received from third parties.
|
9.
|
Reinsurance
|
The Company purchases retrocession and reinsurance to limit and diversify the Company’s risk exposure and to increase its own insurance and reinsurance underwriting capacity. These agreements provide for recovery of a portion of losses and loss adjustment expenses from reinsurers. As is the case with most reinsurance contracts, the Company remains liable to the extent that reinsurers do not meet their obligations under these agreements. In line with its risk management objectives, the Company evaluates the financial condition of its reinsurers and monitors concentrations of credit risk.
Balances pertaining to reinsurance transactions are reported “gross” on the consolidated balance sheet, meaning that reinsurance recoverable on unpaid losses and ceded unearned premiums are not deducted from insurance reserves but are recorded as assets. For more information on reinsurance recoverables, refer to Note 20, “Concentrations of Credit Risk — Reinsurance recoverables” and Note 12, “Reserves for Losses and Loss Adjustment Expenses” of these consolidated financial statements.
The effect of assumed and ceded reinsurance on premiums written, premiums earned and insurance losses and loss adjustment expenses for the
twelve months ended
December 31,
2018
,
2017
and
2016
was as follows:
|
|
Twelve Months Ended December 31,
|
|||||||||||
|
|
2018
|
2017
|
2016
|
|||||||||
|
|
($ in millions)
|
|||||||||||
|
Premiums written
:
|
|
|
|
|||||||||
|
Direct
|
$
|
1,951.2
|
|
$
|
1,812.4
|
|
$
|
1,733.8
|
|
|||
|
Assumed
|
1,495.7
|
|
1,548.5
|
|
1,413.2
|
|
||||||
|
Ceded
|
(1,364.9
|
)
|
(1,148.4
|
)
|
(553.3
|
)
|
||||||
|
Net premiums written
|
$
|
2,082.0
|
|
$
|
2,212.5
|
|
$
|
2,593.7
|
|
|||
|
|
|
|
|
|
|
|
||||||
|
Premiums earned:
|
|
|
|
|
|
|
||||||
|
Direct
|
$
|
1,940.5
|
|
$
|
1,757.4
|
|
$
|
1,768.4
|
|
|||
|
Assumed
|
1,593.9
|
|
1,451.8
|
|
1,317.9
|
|
||||||
|
Ceded
|
(1,319.7
|
)
|
(902.6
|
)
|
(449.0
|
)
|
||||||
|
Net premiums earned
|
$
|
2,214.7
|
|
$
|
2,306.6
|
|
$
|
2,637.3
|
|
|||
|
|
|
|
|
|
|
|
||||||
|
Insurance losses and loss adjustment expenses:
|
|
|
|
|
|
|
||||||
|
Direct
|
$
|
1,458.9
|
|
$
|
1,673.6
|
|
$
|
1,091.9
|
|
|||
|
Assumed
|
1,196.1
|
|
1,399.9
|
|
699.6
|
|
||||||
|
Ceded
|
(1,082.0
|
)
|
(1,078.8
|
)
|
(215.4
|
)
|
||||||
|
Net insurance losses and loss adjustment expenses
|
$
|
1,573.0
|
|
$
|
1,994.7
|
|
$
|
1,576.1
|
|
|||
The Company acquired retrospective reinsurance coverage during the
twelve
months ended
December 31, 2017
as part of a loss portfolio transfer in the amount of
$125.5 million
which has been recognized within ceded insurance losses. For more information on the loss portfolio transfer, refer to Note 12, “Reserves for Losses and Loss Adjustment Expenses” of these consolidated financial statements.
F-38
|
10.
|
Derivative Contracts
|
The following table summarizes information on the location and amounts of derivative fair values on the consolidated balance sheet as at
December 31, 2018
and
2017
:
|
|
|
As at December 31, 2018
|
|
As at December 31, 2017
|
|
||||||||||||||
|
Derivatives Not Designated as Hedging Instruments
Under ASC 815
|
Balance Sheet Location
|
Notional
Amount
|
Fair
Value
|
|
Notional
Amount
|
Fair
Value
|
|
||||||||||||
|
|
|
($ in millions)
|
|
($ in millions)
|
|
||||||||||||||
|
Foreign Exchange Contracts
|
Derivatives at Fair Value
|
$
|
496.5
|
|
$
|
14.6
|
|
(1)
|
$
|
577.7
|
|
$
|
5.0
|
|
|
||||
|
Foreign Exchange Contracts
|
Liabilities under Derivative Contracts
|
$
|
760.8
|
|
$
|
(13.9
|
)
|
$
|
173.9
|
|
$
|
(1.0
|
)
|
||||||
______________
|
(1)
|
Net of
$2.3 million
of cash collateral (December 31, 2017 —
$0.6 million
).
|
|
|
|
As at December 31, 2018
|
|
As at December 31, 2017
|
|
||||||||||||||
|
Derivatives Designated as Hedging Instruments Under ASC 815
|
Balance Sheet Location
|
Notional
Amount
|
Fair
Value
|
|
Notional
Amount
|
Fair
Value
|
|
||||||||||||
|
|
|
($ in millions)
|
|
($ in millions)
|
|
||||||||||||||
|
Foreign Exchange Contracts
|
Derivatives at Fair Value
|
$
|
—
|
|
$
|
—
|
|
$
|
60.6
|
|
$
|
1.4
|
|
(1)
|
|||||
|
Foreign Exchange Contracts
|
Liabilities under Derivative Contracts
|
$
|
94.3
|
|
$
|
(1.2
|
)
|
$
|
—
|
|
$
|
—
|
|
||||||
______________
|
(1)
|
Net of $
Nil
cash collateral (December 31, 2017 — $
Nil
).
|
The following table provides the unrealized and realized gains/(losses) recorded in the statements of operations and other comprehensive income for derivatives that are not designated or designated as hedging instruments under ASC 815 — “
Derivatives and Hedging”
for the
twelve months ended
December 31, 2018
and
2017
:
|
Amount of (Loss)/Gain Recognized on Derivatives
|
||||||||||
|
For the Twelve Months Ended
|
||||||||||
|
Location of Gain/(Loss)
Recognized on Derivatives
|
December 31, 2018
|
December 31, 2017
|
||||||||
|
Derivatives not designated as hedges
|
($ in millions)
|
|||||||||
|
Foreign Exchange Contracts
|
Change in Fair Value of Derivatives
|
(31.8
|
)
|
27.7
|
|
|||||
|
Derivatives designated as hedges
|
||||||||||
|
Foreign Exchange Contracts
|
General, administrative and corporate expenses
|
(1.2
|
)
|
4.4
|
|
|||||
|
Foreign Exchange Contracts
|
Net change from current period hedged transactions
|
(2.1
|
)
|
3.0
|
|
|||||
Foreign Exchange Contracts.
The Company uses foreign exchange contracts to manage foreign currency risk associated with our operating expenses but also foreign exchange risk associated with net assets or liabilities in currencies other than the U.S. dollar. A foreign exchange contract involves an obligation to purchase or sell a specified currency at a future date at a price set at the time of the contract. Foreign exchange contracts will not eliminate fluctuations in the value of the Company’s assets and liabilities denominated in foreign currencies but rather allow it to establish a rate of exchange for a future point in time.
As at
December 31, 2018
, the Company held foreign exchange contracts that were not designated as hedging under ASC 815 with an aggregate nominal amount of
$1,257.3 million
(
2017
—
$751.6 million
). The foreign exchange contracts are recorded as derivatives at fair value in the balance sheet with changes recorded as a change in fair value of derivatives in the statement of operations. For the
twelve months ended
December 31, 2018
, the impact of foreign exchange contracts on net income was a
loss
of
$31.8 million
(
December 31, 2017
—
gain
of
$27.7 million
).
As at
December 31, 2018
, the Company held foreign exchange contracts that were designated as hedging under ASC 815 with an aggregate nominal amount of
$94.3 million
(
2017
—
$60.6 million
). The foreign exchange contracts are recorded as derivatives at fair value in the balance sheet with the effective portion recorded in other comprehensive income and the ineffective portion recorded as a change in fair value of derivatives in the statement of operations. The contracts are considered to be effective and therefore the movement in other comprehensive income representing the effective portion for the
twelve months ended
December 31, 2018
was a
loss
of
$2.1 million
(
December 31, 2017
—
gain
of
$3.0 million
).
F-39
As the foreign exchange contracts settle, the realized gain or loss is reclassified from other comprehensive income into general, administration and corporate expenses of the statement of operations and other comprehensive income. For the
twelve months ended
December 31, 2018
, the amount recognized within general, administration and corporate expenses for settled foreign exchange contracts was a realized
loss
of
$1.2 million
(
December 31, 2017
—
gain
of
$4.4 million
).
|
11.
|
Deferred Policy Acquisition Costs
|
The following table represents a reconciliation of beginning and ending deferred policy acquisition costs for the
twelve
months ended
December 31, 2018
and
2017
:
|
Twelve Months Ended
December 31, 2018 |
Twelve Months Ended December 31, 2017
|
||||||||
|
($ in millions)
|
|||||||||
|
Balance at the beginning of the period
|
$
|
294.3
|
|
$
|
358.4
|
|
|||
|
Acquisition costs deferred
|
325.8
|
|
336.4
|
|
|||||
|
Amortization of deferred policy acquisition costs
|
(371.6
|
)
|
(400.5
|
)
|
|||||
|
Balance at the end of the period
|
$
|
248.5
|
|
$
|
294.3
|
|
|||
12. Reserves for Losses and Loss Adjustment Expenses
The following table represents a reconciliation of beginning and ending consolidated loss and LAE reserves for
the twelve months
ended
December 31, 2018
,
2017
and
2016
:
|
As at December 31,
|
||||||||||||
|
2018
|
2017
|
2016
|
||||||||||
|
|
($ in millions)
|
|||||||||||
|
Provision for losses and LAE at the start of the year
|
$
|
6,749.5
|
|
$
|
5,319.9
|
|
$
|
4,938.2
|
|
|||
|
Less reinsurance recoverable
|
(1,515.2
|
)
|
(560.7
|
)
|
(354.8
|
)
|
||||||
|
Net loss and LAE at the start of the year
|
5,234.3
|
|
4,759.2
|
|
4,583.4
|
|
||||||
|
Net loss and LAE expenses (disposed)
|
—
|
|
(125.5
|
)
|
(80.1
|
)
|
||||||
|
Movement in provision for losses and LAE for claims incurred:
|
||||||||||||
|
Current year
|
1,684.1
|
|
2,100.1
|
|
1,705.4
|
|
||||||
|
Prior years
|
(111.1
|
)
|
(105.4
|
)
|
(129.3
|
)
|
||||||
|
Total incurred
|
1,573.0
|
|
1,994.7
|
|
1,576.1
|
|
||||||
|
Losses and LAE payments for claims incurred:
|
||||||||||||
|
Current year
|
(285.7
|
)
|
(397.5
|
)
|
(241.0
|
)
|
||||||
|
Prior years
|
(1,441.0
|
)
|
(1,157.6
|
)
|
(981.8
|
)
|
||||||
|
Total paid
|
(1,726.7
|
)
|
(1,555.1
|
)
|
(1,222.8
|
)
|
||||||
|
Foreign exchange losses/(gains)
|
(84.0
|
)
|
161.0
|
|
(97.4
|
)
|
||||||
|
Net losses and LAE reserves at the end of the year
|
4,996.6
|
|
5,234.3
|
|
4,759.2
|
|
||||||
|
Plus reinsurance recoverable on unpaid losses at the end of the year
|
2,077.6
|
|
1,515.2
|
|
560.7
|
|
||||||
|
Provision for losses and LAE at the end of the year
|
$
|
7,074.2
|
|
$
|
6,749.5
|
|
$
|
5,319.9
|
|
|||
For the
twelve
months ended
December 31, 2018
, there was a reduction of
$111.1 million
in the Company’s estimate of the ultimate claims to be paid in respect of prior accident years compared to
$105.4 million
for
the twelve months
ended
December 31, 2017
. In
the twelve months
ended
December 31, 2017
, the Company ceded
$125.5 million
of reserves as part of a loss portfolio transfer agreement. In the twelve months ended December 31,
2016
, the Company ceded
$85.8 million
in relation to the purchase of an adverse development cover partially offset by
$5.7 million
of reserves assumed as part of the acquisition of AgriLogic.
For additional information on reserve releases, refer to Part II, Item 7, “Management’s Discussion and Analysis of Financial Condition and Results of Operations — Reserves for Losses and Loss Adjustment Expenses” above.
F-40
The following tables show an analysis of incurred claims and allocated loss adjustment expenses, net of reinsurance and cumulative paid claims and allocated claim adjustment expenses, net of reinsurance as at December 31,
2018
,
2017
,
2016
,
2015
2014
,
2013
and
2012
. The loss development triangles are derived from all business written by the Company as although a limited number of contracts are written which have durations of greater than one year the contracts do not meet the definition of a long duration contract.
|
Property Insurance Lines
|
||||||||||||||||||||||||||||
|
Incurred Claims, IBNR and Loss Adjustment Expenses, Net of Reinsurance
|
As at December 31, 2018
|
|||||||||||||||||||||||||||
|
Total of IBNR Plus Expected Development on Reported Claims
|
Cumulative Number of Reported Claims
|
|||||||||||||||||||||||||||
|
|
For the Years Ended December 31,
|
|||||||||||||||||||||||||||
|
Unaudited Prior Years
|
||||||||||||||||||||||||||||
|
Accident
Year
|
2012
|
2013
|
2014
|
2015
|
2016
|
2017
|
2018
|
|||||||||||||||||||||
|
|
$ (in millions)
|
|||||||||||||||||||||||||||
|
2012
|
168.5
|
|
166.8
|
|
165.6
|
|
164.4
|
|
158.8
|
|
152.9
|
|
151.9
|
|
—
|
|
6,141
|
|
||||||||||
|
2013
|
128.7
|
|
116.1
|
|
115.8
|
|
111.5
|
|
112.5
|
|
110.6
|
|
0.6
|
|
4,992
|
|
||||||||||||
|
2014
|
164.3
|
|
156.3
|
|
133.5
|
|
134.2
|
|
133.4
|
|
1.7
|
|
8,740
|
|
||||||||||||||
|
2015
|
237.4
|
|
203.0
|
|
197.7
|
|
200.0
|
|
9.1
|
|
10,319
|
|
||||||||||||||||
|
2016
|
236.7
|
|
247.7
|
|
242.6
|
|
12.4
|
|
9,431
|
|
||||||||||||||||||
|
2017
|
293.9
|
|
257.0
|
|
23.6
|
|
7,722
|
|
||||||||||||||||||||
|
2018
|
201.1
|
|
31.4
|
|
5,694
|
|
||||||||||||||||||||||
|
|
|
|
|
|
|
Total
|
|
$
|
1,296.6
|
|
||||||||||||||||||
|
Property Insurance Lines
|
||||||||||||||||||||||
|
Cumulative Paid Claims and Allocated Loss Adjustment Expenses, Net of Reinsurance
|
||||||||||||||||||||||
|
For the Years Ended December 31,
|
||||||||||||||||||||||
|
|
Unaudited Prior Years
|
|||||||||||||||||||||
|
Accident Year
|
2012
|
2013
|
2014
|
2015
|
2016
|
2017
|
2018
|
|||||||||||||||
|
|
($ in millions)
|
|||||||||||||||||||||
|
2012
|
41.1
|
|
128.5
|
|
137.9
|
|
151.7
|
|
155.7
|
|
153.1
|
|
152.5
|
|
||||||||
|
2013
|
38.3
|
|
75.0
|
|
88.2
|
|
100.1
|
|
104.6
|
|
107.4
|
|
||||||||||
|
2014
|
40.2
|
|
86.1
|
|
113.5
|
|
123.1
|
|
127.1
|
|
||||||||||||
|
2015
|
56.9
|
|
141.0
|
|
168.4
|
|
177.5
|
|
||||||||||||||
|
2016
|
66.5
|
|
167.8
|
|
200.2
|
|
||||||||||||||||
|
2017
|
96.0
|
|
212.3
|
|
||||||||||||||||||
|
2018
|
69.3
|
|
||||||||||||||||||||
|
Total
|
|
$
|
1,046.3
|
|
||||||||||||||||||
|
All outstanding liabilities for 2012 and subsequent years, net of reinsurance
|
$
|
250.3
|
|
|||||||||||||||||||
|
All outstanding liabilities before 2012, net of reinsurance
|
3.1
|
|
||||||||||||||||||||
|
Liabilities for claims and claim adjustment expenses, net of reinsurance
|
$
|
253.4
|
|
|||||||||||||||||||
F-41
|
Casualty Insurance Lines
|
||||||||||||||||||||||||||||
|
Incurred Claims, IBNR and Loss Adjustment Expenses, Net of Reinsurance
|
As at December 31, 2018
|
|||||||||||||||||||||||||||
|
Total of IBNR Plus Expected Development on Reported Claims
|
Cumulative Number of Reported Claims
|
|||||||||||||||||||||||||||
|
|
For the Years Ended December 31,
|
|||||||||||||||||||||||||||
|
Unaudited Prior Years
|
||||||||||||||||||||||||||||
|
Accident
Year
|
2012
|
2013
|
2014
|
2015
|
2016
|
2017
|
2018
|
|||||||||||||||||||||
|
|
$ (in millions)
|
|||||||||||||||||||||||||||
|
2012
|
77.1
|
|
61.8
|
|
69.0
|
|
60.1
|
|
68.0
|
|
65.7
|
|
67.6
|
|
7.9
|
|
2,869
|
|
||||||||||
|
2013
|
131.2
|
|
115.0
|
|
113.6
|
|
119.0
|
|
102.0
|
|
103.2
|
|
11.6
|
|
3,161
|
|
||||||||||||
|
2014
|
142.9
|
|
125.4
|
|
137.2
|
|
127.2
|
|
134.3
|
|
23.4
|
|
3,628
|
|
||||||||||||||
|
2015
|
201.5
|
|
221.5
|
|
184.1
|
|
201.6
|
|
33.6
|
|
4,463
|
|
||||||||||||||||
|
2016
|
215.3
|
|
186.3
|
|
181.6
|
|
81.8
|
|
4,388
|
|
||||||||||||||||||
|
2017
|
179.6
|
|
173.1
|
|
82.7
|
|
4,815
|
|
||||||||||||||||||||
|
2018
|
121.8
|
|
103.7
|
|
3,918
|
|
||||||||||||||||||||||
|
|
|
|
|
|
|
Total
|
|
$
|
983.2
|
|
||||||||||||||||||
|
Casualty Insurance Lines
|
||||||||||||||||||||||
|
Cumulative Paid Claims and Allocated Loss Adjustment Expenses, Net of Reinsurance
|
||||||||||||||||||||||
|
For the Years Ended December 31,
|
||||||||||||||||||||||
|
|
Unaudited Prior Years
|
|||||||||||||||||||||
|
Accident Year
|
2012
|
2013
|
2014
|
2015
|
2016
|
2017
|
2018
|
|||||||||||||||
|
|
($ in millions)
|
|||||||||||||||||||||
|
2012
|
1.3
|
|
6.5
|
|
13.9
|
|
29.3
|
|
40.2
|
|
48.5
|
|
49.3
|
|
||||||||
|
2013
|
2.2
|
|
25.5
|
|
39.0
|
|
52.3
|
|
67.4
|
|
79.7
|
|
||||||||||
|
2014
|
2.6
|
|
13.1
|
|
32.2
|
|
58.8
|
|
71.9
|
|
||||||||||||
|
2015
|
3.1
|
|
16.8
|
|
56.0
|
|
91.8
|
|
||||||||||||||
|
2016
|
4.1
|
|
22.5
|
|
39.6
|
|
||||||||||||||||
|
2017
|
3.5
|
|
24.7
|
|
||||||||||||||||||
|
2018
|
4.0
|
|
||||||||||||||||||||
|
|
|
|
|
|
|
Total
|
|
$
|
361.0
|
|
||||||||||||
|
All outstanding liabilities for 2012 and subsequent years, net of reinsurance
|
$
|
622.2
|
|
|||||||||||||||||||
|
All outstanding liabilities before 2012, net of reinsurance
|
43.3
|
|
||||||||||||||||||||
|
Liabilities for claims and claim adjustment expenses, net of reinsurance
|
$
|
665.5
|
|
|||||||||||||||||||
F-42
|
Marine, Aviation and Energy Insurance Lines
|
||||||||||||||||||||||||||||
|
Incurred Claims, IBNR and Loss Adjustment Expenses, Net of Reinsurance
|
As at December 31, 2018
|
|||||||||||||||||||||||||||
|
Total of IBNR Plus Expected Development on Reported Claims
|
Cumulative Number of Reported Claims
|
|||||||||||||||||||||||||||
|
|
For the Years Ended December 31,
|
|||||||||||||||||||||||||||
|
Unaudited Prior Years
|
||||||||||||||||||||||||||||
|
Accident
Year
|
2012
|
2013
|
2014
|
2015
|
2016
|
2017
|
2018
|
|||||||||||||||||||||
|
|
$ (in millions)
|
|||||||||||||||||||||||||||
|
2012
|
268.5
|
|
306.0
|
|
325.5
|
|
346.1
|
|
331.6
|
|
327.8
|
|
316.1
|
|
2.7
|
|
3,807
|
|
||||||||||
|
2013
|
320.6
|
|
333.4
|
|
342.0
|
|
325.5
|
|
332.6
|
|
346.2
|
|
6.0
|
|
4,171
|
|
||||||||||||
|
2014
|
309.6
|
|
313.8
|
|
298.7
|
|
310.3
|
|
305.8
|
|
9.5
|
|
4,001
|
|
||||||||||||||
|
2015
|
297.1
|
|
299.8
|
|
281.9
|
|
285.8
|
|
17.6
|
|
4,001
|
|
||||||||||||||||
|
2016
|
260.9
|
|
230.5
|
|
229.6
|
|
32.7
|
|
4,373
|
|
||||||||||||||||||
|
2017
|
210.6
|
|
200.9
|
|
44.5
|
|
5,939
|
|
||||||||||||||||||||
|
2018
|
171.4
|
|
85.3
|
|
3,212
|
|
||||||||||||||||||||||
|
|
|
|
|
|
|
Total
|
|
$
|
1,855.8
|
|
||||||||||||||||||
|
Marine, Aviation and Energy Insurance Lines
|
||||||||||||||||||||||
|
Cumulative Paid Claims and Allocated Loss Adjustment Expenses, Net of Reinsurance
|
||||||||||||||||||||||
|
For the Years Ended December 31,
|
||||||||||||||||||||||
|
|
Unaudited Prior Years
|
|||||||||||||||||||||
|
Accident Year
|
2012
|
2013
|
2014
|
2015
|
2016
|
2017
|
2018
|
|||||||||||||||
|
|
($ in millions)
|
|||||||||||||||||||||
|
2012
|
51.5
|
|
132.2
|
|
174.6
|
|
210.9
|
|
239.6
|
|
250.5
|
|
273.3
|
|
||||||||
|
2013
|
41.5
|
|
131.4
|
|
204.7
|
|
235.0
|
|
264.4
|
|
284.1
|
|
||||||||||
|
2014
|
53.4
|
|
116.6
|
|
189.1
|
|
209.7
|
|
232.4
|
|
||||||||||||
|
2015
|
44.9
|
|
123.3
|
|
174.0
|
|
193.7
|
|
||||||||||||||
|
2016
|
30.9
|
|
82.6
|
|
142.8
|
|
||||||||||||||||
|
2017
|
40.2
|
|
108.1
|
|
||||||||||||||||||
|
2018
|
28.7
|
|
||||||||||||||||||||
|
|
|
|
|
|
|
Total
|
|
$
|
1,263.1
|
|
||||||||||||
|
All outstanding liabilities for 2012 and subsequent years, net of reinsurance
|
$
|
592.7
|
|
|||||||||||||||||||
|
All outstanding liabilities before 2012, net of reinsurance
|
29.1
|
|
||||||||||||||||||||
|
Liabilities for claims and claim adjustment expenses, net of reinsurance
|
$
|
621.8
|
|
|||||||||||||||||||
F-43
|
Financial and Professional Insurance Lines
|
||||||||||||||||||||||||||||
|
Incurred Claims, IBNR and Loss Adjustment Expenses, Net of Reinsurance
|
As at December 31, 2018
|
|||||||||||||||||||||||||||
|
Total of IBNR Plus Expected Development on Reported Claims
|
Cumulative Number of Reported Claims
|
|||||||||||||||||||||||||||
|
|
For the Years Ended December 31,
|
|||||||||||||||||||||||||||
|
Unaudited Prior Years
|
||||||||||||||||||||||||||||
|
Accident
Year
|
2012
|
2013
|
2014
|
2015
|
2016
|
2017
|
2018
|
|||||||||||||||||||||
|
|
$ (in millions)
|
|||||||||||||||||||||||||||
|
2012
|
87.5
|
|
89.0
|
|
92.6
|
|
95.8
|
|
92.8
|
|
88.4
|
|
99.8
|
|
6.6
|
|
573
|
|
||||||||||
|
2013
|
105.2
|
|
99.8
|
|
104.0
|
|
100.7
|
|
99.7
|
|
90.8
|
|
12.0
|
|
571
|
|
||||||||||||
|
2014
|
134.5
|
|
130.3
|
|
129.0
|
|
119.3
|
|
130.5
|
|
17.3
|
|
795
|
|
||||||||||||||
|
2015
|
173.5
|
|
174.9
|
|
184.9
|
|
189.0
|
|
60.3
|
|
1,080
|
|
||||||||||||||||
|
2016
|
190.3
|
|
211.1
|
|
215.6
|
|
83.4
|
|
1,303
|
|
||||||||||||||||||
|
2017
|
205.9
|
|
181.9
|
|
102.1
|
|
1,760
|
|
||||||||||||||||||||
|
2018
|
156.4
|
|
124.7
|
|
4,221
|
|
||||||||||||||||||||||
|
|
|
|
|
|
|
Total
|
|
$
|
1,064.0
|
|
||||||||||||||||||
|
Financial and Professional Insurance Lines
|
||||||||||||||||||||||
|
Cumulative Paid Claims and Allocated Loss Adjustment Expenses, Net of Reinsurance
|
||||||||||||||||||||||
|
For the Years Ended December 31,
|
||||||||||||||||||||||
|
|
Unaudited Prior Years
|
|||||||||||||||||||||
|
Accident Year
|
2012
|
2013
|
2014
|
2015
|
2016
|
2017
|
2018
|
|||||||||||||||
|
|
($ in millions)
|
|||||||||||||||||||||
|
2012
|
22.8
|
|
39.4
|
|
50.3
|
|
58.7
|
|
64.5
|
|
69.7
|
|
79.0
|
|
||||||||
|
2013
|
8.0
|
|
21.0
|
|
31.1
|
|
65.3
|
|
63.6
|
|
72.0
|
|
||||||||||
|
2014
|
2.9
|
|
30.6
|
|
53.4
|
|
72.0
|
|
86.3
|
|
||||||||||||
|
2015
|
13.7
|
|
43.4
|
|
69.9
|
|
89.2
|
|
||||||||||||||
|
2016
|
15.2
|
|
71.2
|
|
94.9
|
|
||||||||||||||||
|
2017
|
27.1
|
|
57.6
|
|
||||||||||||||||||
|
2018
|
23.8
|
|
||||||||||||||||||||
|
|
|
|
|
|
|
Total
|
|
$
|
502.8
|
|
||||||||||||
|
All outstanding liabilities for 2012 and subsequent years, net of reinsurance
|
$
|
561.2
|
|
|||||||||||||||||||
|
All outstanding liabilities before 2012, net of reinsurance
|
20.0
|
|
||||||||||||||||||||
|
Liabilities for claims and claim adjustment expenses, net of reinsurance
|
$
|
581.2
|
|
|||||||||||||||||||
F-44
|
Property Catastrophe and Other Property Reinsurance
|
||||||||||||||||||||||||||||
|
Incurred Claims, IBNR and Loss Adjustment Expenses, Net of Reinsurance
|
As at December 31, 2018
|
|||||||||||||||||||||||||||
|
Total of IBNR Plus Expected Development on Reported Claims
|
Cumulative Number of Reported Claims
|
|||||||||||||||||||||||||||
|
|
For the Years Ended December 31,
|
|||||||||||||||||||||||||||
|
Unaudited Prior Years
|
||||||||||||||||||||||||||||
|
Accident
Year
|
2012
|
2013
|
2014
|
2015
|
2016
|
2017
|
2018
|
|||||||||||||||||||||
|
|
$ (in millions)
|
|||||||||||||||||||||||||||
|
2012
|
280.1
|
|
303.4
|
|
286.6
|
|
279.1
|
|
282.5
|
|
279.5
|
|
271.9
|
|
11.2
|
|
669
|
|
||||||||||
|
2013
|
216.8
|
|
198.8
|
|
188.9
|
|
177.7
|
|
176.2
|
|
172.9
|
|
2.1
|
|
806
|
|
||||||||||||
|
2014
|
190.2
|
|
177.5
|
|
161.7
|
|
150.4
|
|
150.7
|
|
4.7
|
|
863
|
|
||||||||||||||
|
2015
|
214.9
|
|
187.8
|
|
177.6
|
|
156.9
|
|
4.6
|
|
991
|
|
||||||||||||||||
|
2016
|
269.9
|
|
269.8
|
|
268.2
|
|
23.2
|
|
1,211
|
|
||||||||||||||||||
|
2017
|
557.8
|
|
534.8
|
|
47.5
|
|
1,846
|
|
||||||||||||||||||||
|
2018
|
348.5
|
|
182.8
|
|
1,182
|
|
||||||||||||||||||||||
|
|
|
|
|
|
|
Total
|
|
$
|
1,903.9
|
|
||||||||||||||||||
|
Property Catastrophe and Other Property Reinsurance
|
||||||||||||||||||||||
|
Cumulative Paid Claims and Allocated Loss Adjustment Expenses, Net of Reinsurance
|
||||||||||||||||||||||
|
|
For the Years Ended December 31,
|
|||||||||||||||||||||
|
Unaudited Prior Years
|
||||||||||||||||||||||
|
Accident Year
|
2012
|
2013
|
2014
|
2015
|
2016
|
2017
|
2018
|
|||||||||||||||
|
|
($ in millions)
|
|||||||||||||||||||||
|
2012
|
35.6
|
|
135.8
|
|
188.9
|
|
209.1
|
|
216.7
|
|
227.8
|
|
232.3
|
|
||||||||
|
2013
|
34.4
|
|
98.0
|
|
146.0
|
|
158.0
|
|
162.6
|
|
164.2
|
|
||||||||||
|
2014
|
37.6
|
|
101.0
|
|
127.6
|
|
137.7
|
|
141.6
|
|
||||||||||||
|
2015
|
35.9
|
|
95.2
|
|
126.6
|
|
139.4
|
|
||||||||||||||
|
2016
|
56.3
|
|
163.3
|
|
204.3
|
|
||||||||||||||||
|
2017
|
123.4
|
|
374.7
|
|
||||||||||||||||||
|
2018
|
124.8
|
|
||||||||||||||||||||
|
|
|
|
|
|
Total
|
|
$
|
1,381.3
|
|
|||||||||||||
|
All outstanding liabilities for 2012 and subsequent years, net of reinsurance
|
522.6
|
|
||||||||||||||||||||
|
All outstanding liabilities before 2012, net of reinsurance
|
20.0
|
|
||||||||||||||||||||
|
Liabilities for claims and claim adjustment expenses, net of reinsurance
|
$
|
542.6
|
|
|||||||||||||||||||
F-45
|
Casualty Reinsurance
|
||||||||||||||||||||||||||||
|
Incurred Claims, IBNR and Loss Adjustment Expenses, Net of Reinsurance
|
As at December 31, 2018
|
|||||||||||||||||||||||||||
|
Total of IBNR Plus Expected Development on Reported Claims
|
Cumulative Number of Reported Claims
|
|||||||||||||||||||||||||||
|
|
For the Years Ended December 31,
|
|||||||||||||||||||||||||||
|
Unaudited Prior Years
|
||||||||||||||||||||||||||||
|
Accident
Year
|
2012
|
2013
|
2014
|
2015
|
2016
|
2017
|
2018
|
|||||||||||||||||||||
|
|
$ (in millions)
|
|||||||||||||||||||||||||||
|
2012
|
232.9
|
|
231.1
|
|
242.2
|
|
233.5
|
|
230.6
|
|
231.7
|
|
240.7
|
|
42.9
|
|
1,735
|
|
||||||||||
|
2013
|
213.8
|
|
229.0
|
|
224.3
|
|
221.7
|
|
204.7
|
|
199.9
|
|
44.8
|
|
1,605
|
|
||||||||||||
|
2014
|
204.4
|
|
207.3
|
|
215.8
|
|
209.1
|
|
202.5
|
|
56.1
|
|
1,636
|
|
||||||||||||||
|
2015
|
193.8
|
|
200.9
|
|
210.4
|
|
212.8
|
|
74.7
|
|
1,664
|
|
||||||||||||||||
|
2016
|
232.6
|
|
245.2
|
|
244.9
|
|
115.0
|
|
1,416
|
|
||||||||||||||||||
|
2017
|
|
|
|
|
244.7
|
|
242.7
|
|
158.7
|
|
1,085
|
|
||||||||||||||||
|
2018
|
229.1
|
|
195.4
|
|
481
|
|
||||||||||||||||||||||
|
|
|
|
|
|
|
Total
|
|
$
|
1,572.6
|
|
||||||||||||||||||
|
Casualty Reinsurance
|
||||||||||||||||||||||
|
Cumulative Paid Claims and Allocated Loss Adjustment Expenses, Net of Reinsurance
|
||||||||||||||||||||||
|
|
For the Years Ended December 31,
|
|||||||||||||||||||||
|
Unaudited Prior Years
|
||||||||||||||||||||||
|
Accident Year
|
2012
|
2013
|
2014
|
2015
|
2016
|
2017
|
2018
|
|||||||||||||||
|
|
($ in millions)
|
|||||||||||||||||||||
|
2012
|
2.2
|
|
17.5
|
|
41.7
|
|
65.1
|
|
95.7
|
|
116.9
|
|
133.6
|
|
||||||||
|
2013
|
3.4
|
|
15.8
|
|
42.5
|
|
64.7
|
|
92.4
|
|
114.3
|
|
||||||||||
|
2014
|
2.5
|
|
13.8
|
|
37.8
|
|
60.2
|
|
86.3
|
|
||||||||||||
|
2015
|
3.5
|
|
18.0
|
|
38.4
|
|
65.5
|
|
||||||||||||||
|
2016
|
9.1
|
|
33.5
|
|
63.9
|
|
||||||||||||||||
|
2017
|
8.9
|
|
30.8
|
|
||||||||||||||||||
|
2018
|
7.2
|
|
||||||||||||||||||||
|
|
|
|
|
|
Total
|
|
$
|
501.6
|
|
|||||||||||||
|
All outstanding liabilities for 2012 and subsequent years, net of reinsurance
|
1,071.0
|
|
||||||||||||||||||||
|
All outstanding liabilities before 2012, net of reinsurance
|
485.1
|
|
||||||||||||||||||||
|
Liabilities for claims and claim adjustment expenses, net of reinsurance
|
$
|
1,556.1
|
|
|||||||||||||||||||
F-46
|
Specialty Reinsurance
|
||||||||||||||||||||||||||||
|
Incurred Claims, IBNR and Loss Adjustment Expenses, Net of Reinsurance
|
As at December 31, 2018
|
|||||||||||||||||||||||||||
|
Total of IBNR Plus Expected Development on Reported Claims
|
Cumulative Number of Reported Claims
|
|||||||||||||||||||||||||||
|
|
For the Years Ended December 31,
|
|||||||||||||||||||||||||||
|
Unaudited Prior Years
|
||||||||||||||||||||||||||||
|
Accident
Year
|
2012
|
2013
|
2014
|
2015
|
2016
|
2017
|
2018
|
|||||||||||||||||||||
|
|
$ (in millions)
|
|||||||||||||||||||||||||||
|
2012
|
176.4
|
|
199.7
|
|
188.9
|
|
174.6
|
|
172.9
|
|
173.5
|
|
169.9
|
|
8.4
|
|
628
|
|
||||||||||
|
2013
|
144.6
|
|
139.8
|
|
131.9
|
|
120.2
|
|
119.5
|
|
115.6
|
|
5.5
|
|
568
|
|
||||||||||||
|
2014
|
152.4
|
|
140.7
|
|
132.6
|
|
123.6
|
|
126.4
|
|
10.9
|
|
610
|
|
||||||||||||||
|
2015
|
166.9
|
|
170.9
|
|
165.4
|
|
159.8
|
|
18.8
|
|
761
|
|
||||||||||||||||
|
2016
|
239.8
|
|
240.7
|
|
238.7
|
|
37.9
|
|
902
|
|
||||||||||||||||||
|
2017
|
380.5
|
|
393.0
|
|
81.1
|
|
1,191
|
|
||||||||||||||||||||
|
2018
|
398.6
|
|
327.7
|
|
914
|
|
||||||||||||||||||||||
|
|
|
|
|
|
|
Total
|
|
$
|
1,602.0
|
|
||||||||||||||||||
|
Specialty Reinsurance
|
||||||||||||||||||||||
|
Cumulative Paid Claims and Allocated Loss Adjustment Expenses, Net of Reinsurance
|
||||||||||||||||||||||
|
|
For the Years Ended December 31,
|
|||||||||||||||||||||
|
Unaudited Prior Years
|
||||||||||||||||||||||
|
Accident Year
|
2012
|
2013
|
2014
|
2015
|
2016
|
2017
|
2018
|
|||||||||||||||
|
|
($ in millions)
|
|||||||||||||||||||||
|
2012
|
25.1
|
|
93.9
|
|
129.0
|
|
139.1
|
|
144.5
|
|
149.8
|
|
151.1
|
|
||||||||
|
2013
|
25.1
|
|
71.3
|
|
87.3
|
|
94.6
|
|
101.6
|
|
101.6
|
|
||||||||||
|
2014
|
16.6
|
|
56.7
|
|
81.6
|
|
89.6
|
|
100.1
|
|
||||||||||||
|
2015
|
17.7
|
|
56.8
|
|
104.6
|
|
122.6
|
|
||||||||||||||
|
2016
|
58.9
|
|
151.4
|
|
166.2
|
|
||||||||||||||||
|
2017
|
95.0
|
|
250.2
|
|
||||||||||||||||||
|
2018
|
27.9
|
|
||||||||||||||||||||
|
|
|
|
|
|
Total
|
|
$
|
919.7
|
|
|||||||||||||
|
All outstanding liabilities for 2012 and subsequent years, net of reinsurance
|
682.3
|
|
||||||||||||||||||||
|
All outstanding liabilities before 2012, net of reinsurance
|
41.5
|
|
||||||||||||||||||||
|
Liabilities for claims and claim adjustment expenses, net of reinsurance
|
$
|
723.8
|
|
|||||||||||||||||||
F-47
Reconciliation of Incurred and Paid Claims Development to total Provision for Losses and LAE
|
Twelve Months Ended
December 31, 2018 |
||
|
|
($ in millions)
|
|
|
Net outstanding liabilities:
|
||
|
Insurance lines
|
||
|
- Property insurance lines
|
253.4
|
|
|
- Casualty insurance lines
|
665.5
|
|
|
- Marine, aviation and energy insurance lines
|
621.8
|
|
|
- Financial and professional insurance lines
|
581.2
|
|
|
Total insurance lines
|
2,121.9
|
|
|
Reinsurance lines
|
||
|
- Property catastrophe and other property reinsurance
|
542.6
|
|
|
- Casualty reinsurance
|
1,556.1
|
|
|
- Specialty reinsurance
|
723.8
|
|
|
Total reinsurance lines
|
2,822.5
|
|
|
Net loss and LAE
|
4,944.4
|
|
|
Reinsurance recoverable on unpaid losses:
|
||
|
Insurance lines
|
1,611.4
|
|
|
Reinsurance lines
|
466.2
|
|
|
Total reinsurance recoverable on unpaid losses
|
2,077.6
|
|
|
Insurance lines other than short-duration
|
—
|
|
|
Unallocated claims incurred
|
43.7
|
|
|
Other
|
8.5
|
|
|
52.2
|
|
|
|
Provision for losses and LAE at the end of the year
|
7,074.2
|
|
Average Annual Percentage Payout of Incurred Claims by Age, Net of Reinsurance
|
Years
|
1
|
2
|
3
|
4
|
5
|
6
|
7
|
||||||||||||||
|
Insurance
|
16.2
|
%
|
25.7
|
%
|
16.0
|
%
|
11.4
|
%
|
7.6
|
%
|
5.0
|
%
|
5.1
|
%
|
|||||||
|
Reinsurance
|
13.9
|
%
|
27.3
|
%
|
16.2
|
%
|
8.9
|
%
|
7.6
|
%
|
5.2
|
%
|
3.3
|
%
|
|||||||
F-48
|
13.
|
Income Taxes
|
Aspen Holdings and Aspen Bermuda are incorporated under the laws of Bermuda. Under Bermuda law, the corporate tax rate is zero and, as a result, Aspen Holdings and Aspen Bermuda are not taxed on any Bermudian income or capital gains. In the event of any Bermudian income or capital gains taxes being imposed, Aspen Holdings and Aspen Bermuda have received an undertaking from the Bermudian Minister of Finance that such entities will be exempt from those taxes until March 31, 2035.
The Company’s U.S. operating companies were subject to a U.S. federal income tax rate of
34%
prior to January 1, 2018. Effective January 1, 2018, the Company’s U.S. operating companies are subject to a U.S. federal income tax rate of
21%
. The reduction in U.S. federal income tax has been reflected in measuring the Company’s deferred taxes.
The Company’s U.K. operating companies are taxed at the U.K. corporate tax rate of
19%
, which reduced from
20%
effective April 1, 2017. The U.K. corporate tax rate will decrease further to
17%
effective April 1, 2020. The reduction in the U.K. corporate tax rate has been reflected in measuring the Company’s deferred taxes.
Total income tax (benefit)/expense for the
twelve months ended
December 31, 2018
,
2017
and
2016
was allocated as follows:
|
|
Twelve Months Ended December 31,
|
|||||||||||
|
|
2018
|
2017
|
2016
|
|||||||||
|
|
($ in millions)
|
|||||||||||
|
Income tax (benefit)/expense allocated to net income
|
$
|
(10.2
|
)
|
$
|
(15.4
|
)
|
$
|
6.1
|
|
|||
|
Income tax expense/(benefit) allocated to other comprehensive income
|
4.1
|
|
(17.4
|
)
|
(1.7
|
)
|
||||||
|
Income tax (benefit) allocated directly to shareholders’ equity
|
—
|
|
—
|
|
(1.0
|
)
|
||||||
|
Total income tax (benefit)/expense
|
$
|
(6.1
|
)
|
$
|
(32.8
|
)
|
$
|
3.4
|
|
|||
F-49
(Loss)/income from operations before income tax and income tax expense/(benefit) attributable to that income/(loss) for the
twelve months ended
December 31, 2018
,
2017
and
2016
is provided in the tables below:
|
|
Twelve Months Ended December 31, 2018
|
|||||||||||||||
|
|
(Loss)/income
before tax
|
Current
income tax
(benefit)/expense
|
Deferred
income tax
(benefit)/expense
|
Total
income tax
(benefit)/expense
|
||||||||||||
|
|
($ in millions)
|
|||||||||||||||
|
Bermuda
|
$
|
(72.1
|
)
|
$
|
—
|
|
$
|
—
|
|
$
|
—
|
|
||||
|
U.S.
(1)
|
(81.0
|
)
|
6.1
|
|
(8.1
|
)
|
(2.0
|
)
|
||||||||
|
U.K.
(2)
|
(4.7
|
)
|
(12.2
|
)
|
(0.1
|
)
|
(12.3
|
)
|
||||||||
|
Other
(3) (4)
|
1.8
|
|
4.4
|
|
(0.3
|
)
|
4.1
|
|
||||||||
|
Total
|
$
|
(156.0
|
)
|
$
|
(1.7
|
)
|
$
|
(8.5
|
)
|
$
|
(10.2
|
)
|
||||
|
|
Twelve Months Ended December 31, 2017
|
|||||||||||||||
|
|
(Loss)/income
before tax
|
Current
income tax (benefit)/expense |
Deferred
income tax (benefit)/expense |
Total
income tax (benefit)/expense |
||||||||||||
|
|
($ in millions)
|
|||||||||||||||
|
Bermuda
|
$
|
(130.0
|
)
|
$
|
—
|
|
$
|
—
|
|
$
|
—
|
|
||||
|
U.S.
|
(140.3
|
)
|
—
|
|
1.1
|
|
1.1
|
|
||||||||
|
U.K.
|
15.3
|
|
14.1
|
|
(33.3
|
)
|
(19.2
|
)
|
||||||||
|
Other
(3) (4)
|
(26.8
|
)
|
3.0
|
|
(0.3
|
)
|
2.7
|
|
||||||||
|
Total
|
$
|
(281.8
|
)
|
$
|
17.1
|
|
$
|
(32.5
|
)
|
$
|
(15.4
|
)
|
||||
|
Twelve Months Ended December 31, 2016
|
||||||||||||||||
|
(Loss)/income
before tax |
Current
income tax (benefit)/expense |
Deferred
income tax (benefit)/expense |
Total
income tax (benefit)/expense |
|||||||||||||
|
($ in millions)
|
||||||||||||||||
|
Bermuda
|
$
|
259.5
|
|
$
|
—
|
|
$
|
—
|
|
$
|
—
|
|
||||
|
U.S.
|
(70.2
|
)
|
—
|
|
2.5
|
|
2.5
|
|
||||||||
|
U.K.
|
43.7
|
|
(3.2
|
)
|
5.4
|
|
2.2
|
|
||||||||
|
Other
(3)
|
(23.5
|
)
|
1.1
|
|
0.3
|
|
1.4
|
|
||||||||
|
Total
|
$
|
209.5
|
|
$
|
(2.1
|
)
|
$
|
8.2
|
|
$
|
6.1
|
|
||||
______________
|
(1)
|
The
$6.1 million
current income tax expense relates to the base erosion and anti-abuse tax (“BEAT”) which applies to premiums ceded by U.S. subsidiaries to non-U.S. related parties.
|
|
(2)
|
In 2018, the current income tax benefit includes the release of a
$12.8 million
provision held against the potential disallowance of a prior period adjustment following the successful conclusion of a U.K. tax inquiry.
|
|
(3)
|
Beginning from the twelve months ended December 31, 2017, the total income tax (benefit)/expense allocation table has been re-presented to show the branches of Aspen U.K. under the “Other” category with the exception of the U.S. branch which is reported under the “U.S.” category.
|
|
(4)
|
Included within “Other” is
$4.4 million
(
December 31, 2017
—
$0.9 million
) withholding tax payable in Australia in respect of reinsurance premiums payable to Aspen Bermuda by the Australian branch of Aspen U.K.
|
F-50
As noted above, the tax rate in Bermuda, the Company’s country of domicile, is
zero
. Application of the statutory tax rate for operations in other jurisdictions produces a differential to the expected tax (benefit)/expense as shown in the table below. The reconciliation between the income tax (benefit)/expense and the statutory rate for the Company for the
twelve months ended
December 31, 2018
,
2017
and
2016
is provided in the table below:
|
|
Twelve Months Ended December 31,
|
|||||||||||
|
|
2018
|
2017
|
2016
|
|||||||||
|
Income Tax Reconciliation
|
($ in millions)
|
|||||||||||
|
Expected tax (benefit)/expense
|
$
|
—
|
|
$
|
—
|
|
$
|
—
|
|
|||
|
Overseas statutory tax rates differential
|
(17.1
|
)
|
(41.5
|
)
|
(19.3
|
)
|
||||||
|
Base erosion and anti-abuse tax expense
|
6.0
|
|
—
|
|
—
|
|
||||||
|
Prior year adjustments
(1)
|
1.4
|
|
1.3
|
|
3.3
|
|
||||||
|
Valuation allowance
|
7.1
|
|
(37.9
|
)
|
21.0
|
|
||||||
|
Impact of unrecognized tax benefits
(2)
|
(12.8
|
)
|
0.1
|
|
(1.9
|
)
|
||||||
|
Restricted foreign tax credits
|
—
|
|
0.7
|
|
1.9
|
|
||||||
|
Australian non-resident withholding tax
|
4.4
|
|
0.9
|
|
—
|
|
||||||
|
Share-based payments
|
0.2
|
|
(0.9
|
)
|
—
|
|
||||||
|
Foreign exchange
|
0.1
|
|
(2.1
|
)
|
0.2
|
|
||||||
|
Non-deductible expenses
|
0.7
|
|
0.4
|
|
0.8
|
|
||||||
|
Non-taxable items
|
(0.3
|
)
|
(0.9
|
)
|
(0.9
|
)
|
||||||
|
Impact of changes in statutory tax rates
|
0.1
|
|
64.5
|
|
1.0
|
|
||||||
|
Total income tax (benefit)/expense
|
$
|
(10.2
|
)
|
$
|
(15.4
|
)
|
$
|
6.1
|
|
|||
(1)
The submission dates for filing income tax returns for the Company’s U.S. and U.K. operating subsidiaries are after the submission date of this report. Accordingly, the final tax liabilities may differ from the estimated tax expense included in this report and may result in prior year adjustments being reported. The prior period adjustments for the twelve months ended December 31,
2018
,
2017
and
2016
predominantly relate to the determination of results under U.K. GAAP upon which the U.K. tax returns are based. These items can only be ultimately determined on an accurate basis after this report is filed.
(2)
For
2018
, the
$12.8 million
benefit relates to the successful conclusion of a U.K. tax inquiry which enabled the release of a provision we had been holding against the potential disallowance of a prior period adjustment. For
2017
, the
$0.1 million
charge relates to a
$0.3 million
benefit following the conclusion of a tax examination in respect of tax deductions for certain interest payments and accrued interest of
$0.4 million
in respect of the adjustment to equity reserves. For
2016
, there was a
$1.9 million
credit primarily relating to the conclusion of a tax examination in respect of tax deductions for certain interest payments.
Unrecognized tax benefits
.
As illustrated in the table below, unrecognized tax benefits were $
Nil
as at December 31,
2018
. An unrecognized tax benefit of
$11.0 million
relating to U.K. prior period tax positions for the year 2011 was released during the year ended December 31,
2018
following the successful conclusion of a U.K. tax inquiry. An unrecognized tax benefit of
$0.3 million
relating to tax deductions for certain expenses was released during the year ended December 31,
2017
following the completion of the U.K. tax authority review.
|
|
Twelve Months Ended December 31,
|
|||||||
|
|
2018
|
2017
|
||||||
|
|
($ in millions)
|
|||||||
|
Unrecognized tax benefits balance at January 1
|
$
|
11.2
|
|
$
|
10.5
|
|
||
|
Foreign exchange re-translation
|
(0.2
|
)
|
1.0
|
|
||||
|
Prior year reductions
|
$
|
(11.0
|
)
|
(0.3
|
)
|
|||
|
Unrecognized tax benefits balance at December 31
|
$
|
—
|
|
$
|
11.2
|
|
||
The Company accrues interest and penalties related to an underpayment of income taxes, if applicable, as income tax expenses. The Company does not believe it will be subject to any penalties in any open tax years and has not accrued any such amounts for the
twelve months ended
December 31, 2018
(
December 31, 2017
— $
Nil
). During the year, interest of
$1.8 million
was released in respect of the tax positions for the year 2011 (
December 31, 2017
— accrued
$0.4 million
). Cumulative interest accrued as at
December 31, 2018
was $
Nil
(
December 31, 2017
—
$1.7 million
)
F-51
Income tax returns that have been filed by the Company’s U.S. operating subsidiaries are subject to examination for 2015 and later tax years. The Company’s U.K. operating subsidiaries’ income tax returns are subject to examination for
2017
and later tax years.
The tax effects of temporary differences and carryforwards that give rise to deferred tax assets and deferred tax liabilities are presented in the following table as at December 31,
2018
and
2017
:
|
|
As at December 31,
|
|||||||
|
|
2018
|
2017
|
||||||
|
|
($ in millions)
|
|||||||
|
Deferred tax assets:
|
||||||||
|
Share-based payments
|
$
|
2.2
|
|
$
|
4.0
|
|
||
|
Operating loss carryforwards
|
126.4
|
|
102.5
|
|
||||
|
Loss reserves
|
5.0
|
|
4.3
|
|
||||
|
Unrealized losses on investments
|
0.8
|
|
—
|
|
||||
|
Accrued expenses
|
7.9
|
|
7.9
|
|
||||
|
Foreign tax credit carryforwards
|
3.8
|
|
4.0
|
|
||||
|
Unearned premiums
|
15.5
|
|
11.8
|
|
||||
|
Deferred policy acquisition costs
|
—
|
|
5.9
|
|
||||
|
Office properties and equipment
|
11.1
|
|
8.0
|
|
||||
|
Other temporary differences
|
3.3
|
|
2.9
|
|
||||
|
Total gross deferred tax assets
|
176.0
|
|
151.3
|
|
||||
|
Less valuation allowance
|
(111.9
|
)
|
(104.8
|
)
|
||||
|
Net deferred tax assets
|
$
|
64.1
|
|
$
|
46.5
|
|
||
|
Deferred tax liabilities:
|
|
|
|
|
||||
|
Intangible assets (other)
|
(2.5
|
)
|
(2.0
|
)
|
||||
|
Deferred policy acquisition costs
|
(18.5
|
)
|
(14.5
|
)
|
||||
|
Quota share losses
|
(0.6
|
)
|
—
|
|
||||
|
Loss portfolio transfer costs
|
(6.1
|
)
|
—
|
|
||||
|
Other temporary differences
|
(1.0
|
)
|
(1.7
|
)
|
||||
|
Total gross deferred tax (liabilities)
|
(28.7
|
)
|
(18.2
|
)
|
||||
|
Net deferred tax assets
|
$
|
35.4
|
|
$
|
28.3
|
|
||
Deferred tax liabilities and assets represent the tax effect of temporary differences between the value of assets and liabilities for financial statement purposes and such values as measured by U.K. and U.S. tax laws and regulations. Deferred tax assets and liabilities from the same tax jurisdiction have been netted off resulting in assets and liabilities being recorded under the deferred taxation captions on the consolidated balance sheet.
In assessing the realizability of deferred tax assets, management considers whether it is more likely than not that some portion or all of the deferred tax assets will not be realized. The ultimate realization of deferred tax assets is dependent upon the generation of future taxable income during the periods in which those temporary differences and carryforwards become deductible or creditable. Management considers the scheduled reversal of existing taxable temporary differences, projected future taxable income, and tax-planning strategies in making this assessment.
As at
December 31, 2018
, the Company had net operating losses carried forward for U.S. federal income tax purposes of
$599.4 million
(
2017
—
$482.7 million
) and net operating losses carried forward for U.K. corporate tax purposes of
$59.3 million
(
2017
—
$84.9 million
). Of the U.S. net operating losses,
$547.7 million
are available to offset future U.S. federal taxable income, if any, with expiry periods between
2026
and
2038
and
$51.7 million
are available to offset future U.S. federal taxable income over an indefinite period. The U.K. net operating losses are available to offset future U.K. corporate income over an indefinite period. For U.S. federal income tax purposes, the Company also has capital loss carryforwards of
$0.3 million
(
2017
—
$0.5 million
) which will expire in
2023
and charitable contribution carryforwards of
$0.8 million
(
2017
—
$0.7 million
) with expiry
F-52
periods between
2019
and
2023
. For U.K. corporate tax purposes, the Company has capital loss carryforwards of
$3.8 million
which is available to offset future U.K. capital gains over an indefinite period.
A full valuation allowance of
$108.2 million
(
2017
—
$101.1 million
) on U.S. deferred tax assets (which includes these loss carryforwards) has been recognized at
December 31, 2018
as management believes that it is more likely than not that a tax benefit will not be realized. The increase in this portion of the valuation allowance totals
$7.1 million
(
2017
—
$38.4 million
decrease) with
$7.1 million
(
2017
—
$38.4 million
decrease) recorded in the consolidated income statement and $
Nil
(
2017
—$
Nil
) recorded in other comprehensive income.
A valuation allowance of
$3.7 million
(
2017
—
$3.7 million
) has been established against U.K. deferred tax assets. The increase in this portion of the valuation allowance totals $
Nil
(
2017
—
$0.4 million
increase) with $
Nil
(
2017
—
$0.4 million
increase) recorded in the consolidated income statement and $
Nil
(
2017
— $
Nil
) recorded in other comprehensive income. The U.K. and U.S. valuation allowance combined total is
$111.9 million
(
2017
—
$104.8 million
).
Included within the foreign tax credits totaling
$3.8 million
carried forward as at
December 31, 2018
,
$1.2 million
is due to expire in 2021. The remainder will continue to be available to carry forward indefinitely.
At the effective time of the Merger, restrictions will apply to the Company’s ability to utilize net operating losses carried forward for U.S. federal income tax purposes.
Aspen U.K. business includes income connected with a U.S. trade or business and therefore Aspen U.K has a branch for U.S. tax purposes (“U.S. Branch”). The U.S. Branch could become subject to an additional branch profits tax if earnings are repatriated to the Aspen U.K. head office or upon termination of the U.S. branch. However, based on the plans currently in place, the U.S. Branch profits are being, and Aspen U.K. intends they will continue to be, indefinitely reinvested in the U.S. Branch such that there is no branch profits tax liability arising in the current period or in the foreseeable future. Furthermore, based on the cumulative earnings position as at
December 31, 2018
, $
Nil
(
2017
— $
Nil
) branch profits tax liability would be expected to arise. Accordingly, the Company has determined that no deferred tax liability for branch profits tax has been recognized as permitted by ASC 740.
|
14.
|
Capital Structure
|
The following table provides a summary of the Company’s authorized and issued share capital as at
December 31, 2018
and
2017
:
|
|
As at December 31, 2018
|
At December 31, 2017
|
||||||||||
|
|
Number
|
$ in
Thousands
|
Number
|
$ in
Thousands
|
||||||||
|
Authorized share capital:
|
||||||||||||
|
Ordinary Shares 0.15144558¢ per share
|
969,629,030
|
|
1,469
|
|
969,629,030
|
|
1,469
|
|
||||
|
Non-Voting Shares 0.15144558¢ per share
|
6,787,880
|
|
10
|
|
6,787,880
|
|
10
|
|
||||
|
Preference Shares 0.15144558¢ per share
|
100,000,000
|
|
152
|
|
100,000,000
|
|
152
|
|
||||
|
Total authorized share capital
|
1,631
|
|
1,631
|
|
||||||||
|
Issued share capital:
|
||||||||||||
|
Issued ordinary shares of 0.15144558¢ per share
|
59,743,156
|
|
90
|
|
59,474,085
|
|
90
|
|
||||
|
Issued 5.95% Preference Shares of 0.15144558¢ each with a liquidation preference of $25 per share
|
11,000,000
|
|
17
|
|
11,000,000
|
|
17
|
|
||||
|
Issued 5.625% Preference Shares of 0.15144558¢ each with a liquidation preference of $25 per share
|
10,000,000
|
|
15
|
|
10,000,000
|
|
15
|
|
||||
|
Total issued share capital
|
122
|
|
122
|
|
||||||||
Additional paid-in capital as at
December 31, 2018
was
$967.5 million
(
December 31, 2017
—
$954.7 million
). Included within additional paid-in capital is the aggregate liquidation preferences of the Company’s preference shares of
$525.0 million
(
December 31, 2017
—
$525.0 million
) less issue costs of
$13.1 million
(
December 31, 2017
—
$13.1 million
).
F-53
(a) Ordinary Shares
The following table summarizes transactions in the Company’s ordinary shares during the years ended
December 31, 2018
and
2017
:
|
|
Number of Ordinary Shares
|
|||||
|
2018
|
2017
|
|||||
|
Ordinary shares in issue at the beginning of the year
|
59,474,085
|
|
59,774,464
|
|
||
|
Ordinary shares issued to employees under the 2013 share incentive plan and/or 2008 share purchase plan
|
229,318
|
|
309,727
|
|
||
|
Ordinary shares issued to non-employee directors
|
39,753
|
|
38,835
|
|
||
|
Ordinary shares repurchased
|
—
|
|
(648,941
|
)
|
||
|
Ordinary shares in issue at the end of the year
|
59,743,156
|
|
59,474,085
|
|
||
Ordinary Share Repurchases in 2017
. On
February 8, 2017
, the Board of Directors approved a share repurchase authorization program of
$250.0 million
. The share repurchase authorization program, which was effective immediately and expired on February 8, 2019, permitted the Company to effect the repurchases of ordinary shares from time to time through a combination of transactions, including open market repurchases, privately negotiated transactions and accelerated share repurchase transactions. During 2017, the Company repurchased
648,941
ordinary shares for a total consideration of
$30.0 million
at an average price of
$46.23
per ordinary share. The Company had
$220.0 million
remaining under its
$250.0 million
share repurchase authorization program in effect as at December 31, 2017.
Ordinary Share Repurchases in 2018.
During the course of
2018
, the Company did not repurchase any ordinary shares. The Company had
$220.0 million
remaining under its
$250.0 million
share repurchase authorization program in effect as at
December 31, 2018
. Under the Merger Agreement, the Company may not redeem, purchase or otherwise acquire any outstanding ordinary shares unless Highlands consents in writing, except as otherwise set forth in the Merger Agreement.
(b) Preference Shares
Preference Shares Issuance.
On September 20, 2016, the Company issued
10,000,000
shares of
5.625%
Perpetual Non-Cumulative Preference Shares (the “
5.625%
Preference Shares”). The
5.625%
Preference Shares have a liquidation preference of
$25
per share. Net proceeds were
$293.2 million
, consisting of
$250.0 million
of total liquidation preference less
$8.7 million
of issuance expenses. The Company used
$133.2 million
of the net proceeds from the offering to redeem all of the Company’s outstanding
7.401%
Preference Shares (defined below) and the remainder were used in the redemption of the Company’s
7.250%
Preference Shares (defined below) for
$160.0 million
. The
5.625%
Preference Shares rank equally with preference shares previously issued by the Company and have no fixed maturity date. The Company may redeem all or a portion of the
5.625%
Preference Shares at a redemption price of
$25
per share on or after January 1, 2027. The
5.625%
Preference Shares are listed on the NYSE under the symbol “AHLPRD”.
Preference Shares Redemption.
On November 3, 2016, the Company issued a notice of redemption in connection with all of its issued and outstanding
7.401%
Perpetual Non-Cumulative Preference Shares (the “
7.401%
Preference Shares”) (NYSE: AHLPRA). The redemption took place on January 3, 2017 and was conducted pursuant to the terms of the certificate of designation, dated November 15, 2006, governing the
7.401%
Preference Shares. Each holder of a
7.401%
Preference Share received
$25
per
7.401%
Preference Share, representing an aggregate amount of
$133.2 million
, plus all declared and unpaid dividends to the date of redemption.
On May 8, 2017, the Company issued a notice of redemption in connection with all of its issued and outstanding
7.250%
Perpetual Non-Cumulative Preference Shares (the “
7.250%
Preference Shares”) (NYSE: AHLPRB). The redemption took place on July 3, 2017 and was conducted pursuant to the terms of the certificate of designation, dated April 11, 2012, governing the
7.250%
Preference Shares. Each holder of a
7.250%
Preference Share received
$25
per
7.250%
Preference Share, representing an aggregate amount of
$160.0 million
, plus all declared and unpaid dividends to the date of redemption.
F-54
|
15.
|
Statutory Requirements and Dividends Restrictions
|
As a holding company, Aspen Holdings relies on dividends and other distributions from its Operating Subsidiaries to provide cash flow to meet ongoing cash requirements, including any future debt service payments and other expenses, and to pay dividends, if any, to our preference and ordinary shareholders. Aspen Holdings must comply with the provisions of the Bermuda Companies Act 1981, as amended, (the “Companies Act”) regulating the payment of dividends and distributions. As at
December 31, 2018
, there were no restrictions under Bermuda law or the law of any other jurisdiction on the payment of dividends from retained earnings by Aspen Holdings. Under the Merger Agreement, however, the Company is restricted from declaring or paying any dividends on its ordinary shares other than the quarterly dividends on the ordinary shares that were previously declared and publicly announced prior to the date of the Merger Agreement. The Company is not restricted under the Merger Agreement from declaring or paying periodic cash dividends on the Preference Shares in accordance with the terms of the applicable certificate of designation.
The ability of the Company’s Operating Subsidiaries to pay the Company dividends or other distributions is subject to the laws and regulations applicable to each jurisdiction, as well as the Operating Subsidiaries’ need to maintain capital requirements adequate to maintain their insurance and reinsurance operations and their financial strength ratings issued by independent rating agencies.
The company law of England and Wales prohibits Aspen U.K. or AUL from declaring a dividend to its shareholders unless it has “profits available for distribution.” The determination of whether a company has profits available for distribution is based on its accumulated realized profits and other distributable reserves less its accumulated realized losses. While the U.K. insurance regulatory laws impose no statutory restrictions on a general insurer’s ability to declare a dividend, the rules of the Prudential Regulation Authority (the “PRA”) require each insurance company within its jurisdiction to maintain its solvency margin at all times. In line with common market practice for regulated institutions, the PRA previously requested that it be afforded with the opportunity to provide a “non-objection” prior to all future dividend payments made by Aspen U.K. In 2017, the PRA stated that they no longer routinely require Aspen U.K. to apply for a non-objection to dividends provided such dividend payment and Aspen U.K.’s resulting capital position are within Aspen U.K.’s board-approved solvency capital risk appetite. As at
December 31, 2018
, Aspen U.K. had an accumulated balance of retained
losses
of approximately
$227.0 million
and AUL had an accumulated balance of retained
losses
of approximately
£71.3 million
. Aspen U.K. held a capital contribution reserve of
$470.0 million
as at
December 31, 2018
which, under certain circumstances, could be distributable.
Aspen Bermuda
must comply with the provisions of the Companies Act regulating the payment of dividends and distributions. There were no significant restrictions under company law on the ability of Aspen Bermuda to pay dividends funded from its accumulated balances of retained income as at
December 31, 2018
. Aspen Bermuda may not in any financial year pay dividends which would exceed
25%
of its total statutory capital and surplus, as shown on its statutory balance sheet in relation to the previous financial year, unless it files with the BMA a solvency affidavit at least seven days in advance. As at
December 31, 2018
,
25%
of Aspen Bermuda’s statutory capital and surplus amounted to
$393.9 million
. Aspen Bermuda must also obtain the prior approval of the BMA before reducing its total statutory capital as set out in its previous year’s financial statements by
15%
or more.
Under both North Dakota and Texas law, insurance companies may only pay dividends out of earned surplus as distinguished from contributed surplus. As such, Aspen Specialty and AAIC could not pay a dividend as at
December 31, 2018
.
Actual and required statutory capital and surplus for the principal operating subsidiaries of the Company, excluding its Lloyd’s syndicate, as at
December 31, 2018
and
December 31, 2017
were estimated as follows:
|
|
As at December 31, 2018
|
|||||||||||
|
|
U.S.
|
Bermuda
|
U.K.
|
|||||||||
|
|
($ in millions)
|
|||||||||||
|
Required statutory capital and surplus
|
$
|
351.0
|
|
$
|
801.9
|
|
$
|
772.1
|
|
|||
|
Actual statutory capital and surplus
|
$
|
543.0
|
|
$
|
1,575.5
|
|
$
|
857.9
|
|
|||
|
|
As at December 31, 2017
|
|||||||||||
|
|
U.S.
|
Bermuda
|
U.K.
|
|||||||||
|
|
($ in millions)
|
|||||||||||
|
Required statutory capital and surplus
|
$
|
383.7
|
|
$
|
1,146.7
|
|
$
|
745.8
|
|
|||
|
Actual statutory capital and surplus
|
$
|
506.3
|
|
$
|
1,793.0
|
|
$
|
888.6
|
|
|||
F-55
As the sole corporate member of our Lloyd’s Syndicate, AUL was required to maintain Funds at Lloyd’s of
$499.2 million
as at
December 31, 2018
. As at
December 31, 2018
, AUL had total funds at Lloyd’s of
$503.2 million
of which
$423.6 million
was provided by Aspen Bermuda.
The Bermuda Monetary Authority is the group supervisor of the Company. The laws and regulations of Bermuda require that the Company maintain a minimum amount of group statutory capital and surplus based on the enhanced capital requirement using the group standardized risk-based capital model of the Bermuda Monetary Authority. The Company is also subject to an early-warning level based on
120%
of the enhanced capital requirement which may trigger additional reporting requirements or other enhanced oversight. The statutory capital requirements of our Operating Subsidiaries are set out above. To the extent that these requirements are met, we do not anticipate any dividend restrictions arising as a result of the Company’s enhanced capital requirement. For more information on the Company’s regulatory requirements, refer to Item 1 “Regulatory Matters” above.
|
16.
|
Retirement Plans
|
The Company operates defined contribution retirement plans for the majority of its employees at varying rates of their salaries up to a maximum of
20.0%
. Total contributions by the Company to the retirement plans were
$16.0 million
in the
twelve months ended
December 31, 2018
(
2017
—
$16.3 million
,
2016
—
$15.4 million
).
|
17.
|
Share-Based Payments
|
The Company has issued options and other equity incentives under
three
arrangements: the employee share incentive plan, the employee share purchase plans and the non-employee director stock incentive plan. When options are exercised or other equity awards (excluding phantom shares) vest, new ordinary shares are issued as the Company does not hold treasury shares. Phantom shares are settled in cash in lieu of ordinary shares upon vesting.
|
(a)
|
Employee Equity Incentives
|
Employee equity awards were granted under the Company’s 2003 Share Incentive Plan prior to April 24, 2013 and thereafter under the Company’s 2013 Share Incentive Plan. The total number of ordinary shares that may be issued under the 2013 Share Incentive Plan is
2,845,683
shares, which includes
595,683
shares available to grant under the 2003 Share Incentive Plan as of February 25, 2013. The number of ordinary shares that may be issued under the 2013 Share Incentive Plan is adjusted per the number of awards that may be forfeited under the 2003 Share Incentive Plan.
In accordance with the Merger Agreement, the 2013 Share Incentive Plan will be terminated following the accelerated vesting and cancellation of restricted share units, performance shares and phantom shares (as described further below) immediately prior to the consummation of the Merger.
Restricted Share Units.
Restricted share units (“RSUs”) granted to employees vest over a
three
-year period subject to the employee’s continued service. RSUs granted to employees vest on the anniversary of the date of grant or when the Compensation Committee of the Board of Directors agrees to deliver them. Holders of RSUs will be paid one ordinary share for each RSU that vests as soon as practicable following the vesting date. Holders of RSUs generally will not be entitled to any rights of a holder of ordinary shares, including the right to vote, unless and until their RSUs vest and ordinary shares are issued but they are entitled to receive dividend equivalents. Dividend equivalents are denominated in cash and paid in cash if and when the underlying RSUs vest.
At the effective time of the Merger, all outstanding RSUs, whether vested or unvested, will become fully vested and will be converted into the right to receive
$42.75
in cash, without interest and less any required withholding taxes, plus a cash amount for any accrued but unpaid dividends in respect of such awards prior to the effective time of the Merger.
The following table summarizes information about RSUs as at
December 31, 2018
by year of grant:
|
|
As at December 31, 2018
|
||||||||||||
|
|
Restricted Share Units
|
||||||||||||
|
RSU Holder
|
Amount
Granted
|
Amount
Vested
|
Amount
Forfeited
|
Amount
Outstanding
|
|||||||||
|
2016 Grants
|
328,550
|
|
186,862
|
|
82,728
|
|
58,960
|
|
|||||
|
2017 Grants
|
200,021
|
|
62,433
|
|
37,035
|
|
100,553
|
|
|||||
|
2018 Grants
|
228,251
|
|
—
|
|
25,192
|
|
203,059
|
|
|||||
|
Total
|
362,572
|
|
|||||||||||
The fair value of RSUs is based on the closing price on the date of the grant less a deduction for illiquidity. The fair value is expensed through the consolidated income statement evenly over the vesting period. Compensation cost in respect of RSUs charged against income was
$8.9 million
for the twelve months ended
December 31, 2018
(
2017
—
$9.4 million
;
2016
—
$9.8
F-56
million
). The total tax credit recognized by the Company in relation to RSUs for the twelve months ended
December 31, 2018
was
$2.2 million
(
2017
—
$2.3 million
;
2016
—
$2.4 million
) excluding excess tax benefits.
A summary of RSU activity for the twelve months ended
December 31, 2018
,
2017
and
2016
is presented below:
|
Twelve Months Ended
|
|||||||||||||
|
|
December 31, 2018
|
December 31, 2017
|
December 31, 2016
|
||||||||||
|
Restricted share unit activity
|
Number of Shares
|
Weighted
Average Grant Date FV
|
Number of Shares
|
Weighted
Average Grant Date FV
|
Number of Shares
|
Weighted
Average Grant Date FV
|
|||||||
|
Outstanding restricted stock, beginning of period
|
439,576
|
|
$43.22
|
530,340
|
|
$39.28
|
504,234
|
|
$40.45
|
||||
|
Granted
|
228,251
|
|
33.22
|
200,021
|
|
49.20
|
328,550
|
|
37.63
|
||||
|
Vested
|
(222,669
|
)
|
39.67
|
(245,704
|
)
|
39.63
|
(246,489
|
)
|
34.26
|
||||
|
Forfeited
|
(82,586
|
)
|
40.04
|
(45,081
|
)
|
41.84
|
(55,955
|
)
|
39.51
|
||||
|
Outstanding restricted stock, end of period
|
362,572
|
|
$38.29
|
439,576
|
|
$43.22
|
530,340
|
|
$39.28
|
||||
As at
December 31, 2018
, unrecognized compensation cost related to non-vested RSUs was
$7.9 million
, which is expected to be recognized over a weighted-average period of
1.6 years
.
Performance Shares
. Performance share awards are subject to a
three
-year service vesting period with a separate annual growth in diluted BVPS test for each calendar year during the vesting period. Accordingly, one-third of the award may be earned in each calendar year. Performance share awards are not entitled to dividends before they vest and are subject to the employee’s continued employment. If performance goals are achieved, the performance shares will vest up to a maximum of
200%
of target.
Notwithstanding the vesting criteria for each given year, if in any given year the shares eligible for vesting are greater than
100%
or the portion of such year’s grant and the average diluted BVPS growth over such year and the preceding year is less than the average of the minimum vesting thresholds for such year and the preceding year, then only
100%
(and no more) of the shares that are eligible for vesting in such year shall vest. Notwithstanding the foregoing, if in the judgment of the Compensation Committee the main reason for the BVPS metric in the earlier year falling below the minimum threshold is due to the impact of rising interest rates and bond yields, then the Compensation Committee may, in its discretion, disapply the limitation on
100%
vesting. For information on the impact of the Merger Agreement on vesting criteria, please refer to Note 19(d), “Commitments and Contingencies — Contingent liabilities” of these consolidated financial statements.
At the effective time of the Merger, all outstanding performance shares, whether vested or unvested, will become fully vested (with respect to any performance period that has been completed, determined based on actual level of performance achieved, and, with respect to any performance period that has not been completed, determined based on achievement of performance-based vesting requirements at target payout levels) and will be converted into the right to receive
$42.75
in cash, without interest and less any required withholding taxes.
The following table summarizes information about performance shares as at
December 31, 2018
by year of grant:
|
|
As at December 31, 2018
|
|||||||||||
|
|
Performance Share Awards
|
|||||||||||
|
|
Amount
Granted
|
Amount
Vested
|
Amount
Forfeited
|
Amount Outstanding
|
||||||||
|
2016 Grants
|
278,477
|
|
28,566
|
|
249,911
|
|
—
|
|
||||
|
2017 Grants
|
216,878
|
|
—
|
|
163,114
|
|
53,764
|
|
||||
|
2018 Grants
|
215,273
|
|
—
|
|
90,371
|
|
124,902
|
|
||||
|
Total
|
178,666
|
|
||||||||||
F-57
The fair value of performance share awards is based on the value of the closing share price on the date of the grant less a deduction for illiquidity and expected dividends which would not accrue during the vesting period. Net compensation costs charged against income in the
twelve months ended
December 31, 2018
in respect of performance shares was a credit of
$0.5 million
(
2017
—
$0.4 million
credit;
2016
—
$2.2 million
debit). The total tax charge recognized by the Company in relation to performance share awards in the twelve months ended
December 31, 2018
was
$0.1 million
(
2017
—
$0.1 million
charge;
2016
—
$0.5 million
credit) excluding excess tax benefits.
A summary of performance share activity for the twelve months ended
December 31, 2018
,
2017
and
2016
is presented below:
|
Twelve Months Ended
|
|||||||||||||||
|
|
December 31, 2018
|
December 31, 2017
|
December 31, 2016
|
||||||||||||
|
Performance Share Activity
|
Number of Shares
|
Weighted
Average Grant Date FV
|
Number of Shares
|
Weighted
Average Grant Date FV
|
Number of Shares
|
Weighted
Average Grant Date FV
|
|||||||||
|
Outstanding performance shares, beginning of period
|
208,922
|
|
$38.71
|
254,988
|
|
$36.92
|
266,424
|
|
$24.17
|
||||||
|
Granted
|
215,273
|
|
30.20
|
216,878
|
|
47.30
|
278,477
|
|
34.44
|
||||||
|
Vested
|
—
|
|
—
|
|
—
|
|
—
|
|
(87,059
|
)
|
37.30
|
||||
|
Forfeited
|
(245,529
|
)
|
36.73
|
(262,944
|
)
|
40.32
|
(202,854
|
)
|
36.93
|
||||||
|
Outstanding performance shares, end of period
|
178,666
|
|
$38.71
|
208,922
|
|
$38.71
|
254,988
|
|
$36.92
|
||||||
As at
December 31, 2018
, unrecognized compensation cost related to non-vested performance shares was
$6.8 million
, which is expected to be recognized over a weighted-average period of
1.7 years
.
Phantom Shares
. Phantom share awards are subject to a
three
-year service vesting period with a separate annual growth in diluted BVPS test for each calendar year during the vesting period. One-third of the award may be earned in each calendar year with the vested amount being paid in cash in lieu of ordinary shares. As ordinary shares are not issued, phantom shares have no dilutive effect.
At the effective time of the Merger, all outstanding phantom shares, whether vested or unvested, will become fully vested (with respect to any performance period that has been completed, determined based on actual level of performance achieved, and, with respect to any performance period that has not been completed, determined based on achievement of performance-based vesting requirements at target payout levels) and will be converted into the right to receive
$42.75
in cash, without interest and less any required withholding taxes.
The following table summarizes information about phantom shares as at
December 31, 2018
by year of grant:
|
|
As at December 31, 2018
|
|||||||||||
|
|
Phantom Share Awards
|
|||||||||||
|
|
Amount
Granted
|
Amount
Vested
|
Amount
Forfeited
|
Amount Outstanding
|
||||||||
|
2016 Grants
|
147,513
|
|
15,132
|
|
132,381
|
|
—
|
|
||||
|
2017 Grants
|
173,619
|
|
—
|
|
131,980
|
|
41,639
|
|
||||
|
2018 Grants
|
150,185
|
|
—
|
|
78,097
|
|
72,088
|
|
||||
|
Total
|
113,727
|
|
||||||||||
The fair value of the phantom shares is based on the closing share price on the date of the grant less a deduction for illiquidity. The fair value is expensed through the consolidated income statement evenly over the vesting period. As the payment to beneficiaries will ultimately be in cash rather than ordinary shares, an adjustment is required each quarter to revalue the accumulated liability to the balance sheet date fair value.
Compensation costs charged against income in the
twelve months ended
December 31, 2018
in respect of phantom shares was
$Nil
(
2017
—
$0.7 million
;
2016
—
$0.7 million
) with a fair value adjustment for the twelve months ended
December 31, 2018
of
$0.8 million
(
2017
—
$1.7 million
;
2016
—
$2.9 million
). The total tax benefit recognized by the Company in relation to phantom share awards in the twelve months ended
December 31, 2018
was
$0.2 million
(
2017
—
$0.2 million
;
2016
—
$0.7 million
) excluding excess tax benefits.
F-58
A summary of phantom share activity for the twelve months ended
December 31, 2018
,
2017
and
2016
is presented below:
|
Twelve Months Ended
|
|||||||||||||||
|
|
December 31, 2018
|
December 31, 2017
|
December 31, 2016
|
||||||||||||
|
Phantom Share Activity
|
Number of Shares
|
Weighted
Average Grant Date FV
|
Number of Shares
|
Weighted
Average Grant Date FV
|
Number of Shares
|
Weighted
Average Grant Date FV
|
|||||||||
|
Outstanding performance shares, beginning of period
|
118,680
|
|
$38.71
|
131,464
|
|
$35.90
|
130,319
|
|
$38.75
|
||||||
|
Granted
|
150,185
|
|
30.20
|
173,619
|
|
47.30
|
147,513
|
|
34.44
|
||||||
|
Vested
|
—
|
|
—
|
|
—
|
|
—
|
|
(36,159
|
)
|
36.96
|
||||
|
Forfeited
|
(155,138
|
)
|
35.76
|
(186,403
|
)
|
40.32
|
(110,209
|
)
|
36.96
|
||||||
|
Outstanding performance shares, end of period
|
113,727
|
|
$36.46
|
118,680
|
|
$38.71
|
131,464
|
|
$35.90
|
||||||
As at
December 31, 2018
, unrecognized compensation cost related to non-vested phantom shares was
$5.2 million
, which is expected to be recognized over a weighted-average period of
1.8 years
.
Vesting Criteria Performance and Phantom Shares.
Both performance share and phantom share awards are subject to a
three
-year vesting period with a separate BVPS growth test each year, adjusted to add back ordinary shares and movements in AOCI to shareholders’ equity at the end of the relevant year.
One-third
of the grant will be eligible for vesting each year based on a formula and will only be issuable at the end of the
three
-year period. A summary of the increases in adjusted BVPS is presented below:
|
Year ended December 31,
|
Increase in BVPS
|
||
|
2014
|
13.3
|
%
|
|
|
2015
|
10.7
|
%
|
|
|
2016
|
5.9
|
%
|
|
|
2017
|
—
|
%
|
|
|
2018
|
—
|
%
|
|
Options.
Stock options were last granted in 2007 with an exercise price equivalent to fair value of the share on the grant date. Stock options vested over a
three
-year period with a
ten
-year contract period, with vesting dependent on time and performance conditions established at the time of grant. During the twelve months ended
December 31, 2018
no
options were exercised (
2017
—
no
options;
2016
—
29,222
). No charges against income were made in respect of employee options for the twelve months ended
December 31, 2018
,
2017
and
2016
. The intrinsic value of options exercised in the twelve months ended
December 31, 2018
was $
Nil
(
2017
— $
Nil
;
2016
—
$0.6 million
).
|
(b)
|
Employee Share Purchase Plans
|
Employee Share Purchase Plans.
On April 30, 2008, the shareholders of the Company approved the Employee Share Purchase Plan, the 2008 Sharesave Scheme, as amended, and the International Employee Share Purchase Plan (collectively, the “ESPP”), which are implemented by a series of consecutive offering periods as determined by the Board of Directors. In respect of the ESPP, employees can save up to
$500
per month over a
two
-year period at the end of which they will be eligible to purchase ordinary shares at a discounted price. In respect of the 2008 Sharesave Scheme, employees can save up to
£500
per month over a
three
-year period at the end of which they will be eligible to purchase ordinary shares at a discounted price. The purchase price will be eighty-five percent
85%
of the fair market value of an ordinary share on the offering date which may be adjusted upon changes in capitalization of the Company.
In accordance with the Merger Agreement, the Company did not commence any offering period to purchase the Company’s ordinary shares that would begin after the end of any offering period in effect as of the date of the Merger Agreement or accept payroll deductions to be used to purchase ordinary shares under the ESPP after the end of any offering period in effect as of the date of the Merger Agreement. In addition, the Company did not permit new participants to participate in the ESPP or allow existing participants to increase their elections with respect to any offering period in effect as of the date of the Merger Agreement.
Immediately prior to the Merger, the Company will take all actions necessary to enable and require participants in the ESPP to utilize their accumulated payroll deductions to purchase newly issued ordinary shares in accordance with the terms of the ESPP and, immediately after such purchases are completed, the Company will take all actions necessary to cause the ESPP to terminate. At the effective time of the Merger, the newly issued ordinary shares will be converted into the right to receive
$42.75
in cash, without interest and less any required withholding taxes.
F-59
Under the ESPP,
38,280
ordinary shares were issued during the
twelve months ended
December 31, 2018
(
2017
—
46,866
shares;
2016
—
21,285
). Compensation costs charged against income in the
twelve months ended
December 31, 2018
in respect of the ESPP was
$0.2 million
(
2017
—
$0.4 million
;
2016
—
$0.4 million
). The total tax benefit recognized by the Company in relation to the ESPP in the
twelve months ended
December 31, 2018
was
$0.1 million
(
2017
—
$0.1 million
;
2016
— $
Nil
).
The fair value of the employee options granted under the ESPP was estimated on the date of grant using a modified Black-Scholes option pricing model under the following assumptions:
|
Grant Date
|
Per share
weighted
average
fair value
|
Risk free
interest rate
|
Dividend yield
|
Expected life
|
Share price
volatility
|
||||||||
|
|
($)
|
(%)
|
(%)
|
(in years)
|
(%)
|
||||||||
|
March 25, 2015
|
8.17
|
0.94
|
|
1.78
|
|
3
|
16.00
|
|
|||||
|
March 25, 2015
|
7.08
|
0.60
|
|
1.78
|
|
2
|
16.00
|
|
|||||
|
March 25, 2016
|
7.97
|
1.04
|
|
1.88
|
|
3
|
4.21
|
|
|||||
|
March 25, 2016
|
7.00
|
0.87
|
|
1.88
|
|
2
|
2.44
|
|
|||||
|
April 28, 2017
|
6.69
|
1.44
|
|
1.83
|
|
3
|
3.67
|
|
|||||
|
April 28, 2017
|
8.70
|
1.44
|
|
1.83
|
|
3
|
3.67
|
|
|||||
|
April 28, 2017
|
8.70
|
1.26
|
|
1.83
|
|
2
|
3.52
|
|
|||||
(c)
Non-Employee Director Plan
On April 21, 2016, the shareholders of the Company approved the 2016 Stock Incentive Plan for Non-Employee Directors which provides for the granting of options, restricted share units or other share-based awards. In accordance with the Merger Agreement, the 2016 Stock Incentive Plan for Non-Employee Directors will be terminated following the accelerated vesting and cancellation of restricted share units (as described further below) immediately prior to the consummation of the Merger.
Options.
No options were granted during the twelve months ended
December 31, 2018
,
2017
and
2016
and
no
options were exercised and shares issued in the twelve months ended
December 31, 2018
and
2017
(
2016
—
4,447
).
No
charges or tax charges against income were made in respect of non-employee directors options for the twelve months ended
December 31, 2018
(
2017
— $
Nil
;
2016
— $
Nil
).
Restricted Share Units.
RSUs granted to non-employee directors, including the Chairman, vest
one-twelfth
on each one month anniversary of the date of grant with
100%
of the restricted share units becoming vested and issued on the first anniversary of the grant date or on the date of departure of a director for the amount vested through such date. The shares that are eligible to vest following final vesting date in the calendar year of the date of grant is delivered as soon as practical thereafter and the remaining shares under the RSUs are delivered on the first anniversary of the grant date. If a director leaves the Board of Directors for any reason other than “cause” (as defined in the award agreement), then the director would receive shares under the restricted share units that had vested through the date the director leaves the Board.
RSUs entitle the holder to receive one ordinary share unit for each unit that vests. Holders of RSUs are not entitled to any of the rights of a holder of ordinary shares, including the right to vote, unless and until their units vest and ordinary shares are issued but they are entitled to receive dividend equivalents with respect to their units. Dividend equivalents will be denominated in cash and paid in cash if and when the underlying units vest.
At the effective time of the Merger, all outstanding RSUs, whether vested or unvested, will become fully vested and will be converted into the right to receive
$42.75
in cash, without interest and less any required withholding taxes, plus a cash amount for any accrued but unpaid dividends in respect of such awards prior to the effective time of the Merger.
F-60
The following table summarizes information about RSUs issued to non-employee directors by year of grant as at
December 31, 2018
.
|
|
As at December 31, 2018
|
|||||||||||
|
|
Restricted Share Units
|
|||||||||||
|
|
Amount
Granted
|
Amount
Vested
|
Amount
Forfeited
|
Amount
Outstanding
|
||||||||
|
Non-Employee Directors
|
||||||||||||
|
2016
|
24,456
|
|
21,352
|
|
3,104
|
|
—
|
|
||||
|
2017
|
22,230
|
|
20,377
|
|
1,853
|
|
—
|
|
||||
|
2018
|
29,025
|
|
24,187
|
|
—
|
|
4,838
|
|
||||
|
Chairman
|
||||||||||||
|
2016
|
10,952
|
|
10,952
|
|
—
|
|
—
|
|
||||
|
2017
|
8,892
|
|
8,892
|
|
—
|
|
—
|
|
||||
|
2018
|
12,900
|
|
10,750
|
|
—
|
|
2,150
|
|
||||
|
Total
|
108,455
|
|
96,510
|
|
4,957
|
|
6,988
|
|
||||
The fair value of the RSUs is based on the closing price on the date of the grant. Compensation cost charged against income was
$1.5 million
for the twelve months ended
December 31, 2018
(
2017
—
$1.5 million
;
2016
—
$1.4 million
). The total tax charge recognized by the Company in relation to non-employee RSUs in the twelve months ended
December 31, 2018
was $
Nil
(
2017
— $
Nil
;
2016
— $
Nil
).
A summary of RSU activity relating to non-employee directors under the Company’s 2013 Share Incentive Plan for the twelve months ended
December 31, 2018
,
2017
and
2016
is presented below:
|
Twelve Months Ended
|
|||||||||||||
|
|
December 31, 2018
|
December 31, 2017
|
December 31, 2016
|
||||||||||
|
Restricted share unit activity
|
Number of Shares
|
Weighted
Average Grant Date FV
|
Number of Shares
|
Weighted
Average Grant Date FV
|
Number of Shares
|
Weighted
Average Grant Date FV
|
|||||||
|
Outstanding restricted stock, beginning of period
|
4,816
|
|
$50.19
|
5,171
|
|
$41.07
|
6,636
|
|
$45.28
|
||||
|
Granted
|
41,925
|
|
33.08
|
31,122
|
|
50.18
|
35,408
|
|
41.07
|
||||
|
Vested
|
(39,753
|
)
|
35.15
|
(29,624
|
)
|
48.59
|
(33,769
|
)
|
41.89
|
||||
|
Forfeited
|
—
|
|
0.00
|
(1,853
|
)
|
50.18
|
(3,104
|
)
|
41.07
|
||||
|
Outstanding restricted stock, end of period
|
6,988
|
|
$33.08
|
4,816
|
|
$50.19
|
5,171
|
|
$41.07
|
||||
As at
December 31, 2018
, unrecognized compensation cost related to non-vested RSUs relating to non-employee directors was
$0.1 million
, which is expected to be recognized over a weighted-average period of
0.1 years
.
F-61
|
18.
|
Intangible Assets and Goodwill
|
The following table provides a summary of the Company’s intangible assets for the
twelve months ended
December 31, 2018
and
2017
:
|
|
Twelve Months Ended December 31, 2018
|
|||||||||||||||||||
|
|
Beginning of the Year
|
Additions/(Disposals)
|
Amortization
|
Impairment
|
End of the Year
|
|||||||||||||||
|
|
($ in millions)
|
|||||||||||||||||||
|
Intangible Assets
|
||||||||||||||||||||
|
Trademarks
|
$
|
2.9
|
|
$
|
—
|
|
$
|
(0.4
|
)
|
$
|
—
|
|
$
|
2.5
|
|
|||||
|
Insurance Licenses
|
16.7
|
|
—
|
|
—
|
|
—
|
|
16.7
|
|
||||||||||
|
Agency Relationships
|
2.3
|
|
—
|
|
(0.5
|
)
|
—
|
|
1.8
|
|
||||||||||
|
Non-compete Agreements
|
0.7
|
|
—
|
|
(0.3
|
)
|
—
|
|
0.4
|
|
||||||||||
|
Goodwill
|
3.9
|
|
—
|
|
—
|
|
—
|
|
3.9
|
|
||||||||||
|
Renewal Rights
|
1.4
|
|
—
|
|
(0.4
|
)
|
—
|
|
1.0
|
|
||||||||||
|
Total
|
$
|
27.9
|
|
$
|
—
|
|
$
|
(1.6
|
)
|
$
|
—
|
|
$
|
26.3
|
|
|||||
|
|
Twelve Months Ended December 31, 2017
|
|||||||||||||||||||
|
|
Beginning of the Year
|
Additions/(Disposals)
|
Amortization
|
Impairment
|
End of the Year
|
|||||||||||||||
|
|
($ in millions)
|
|||||||||||||||||||
|
Intangible Assets
|
||||||||||||||||||||
|
Trademarks
|
$
|
6.6
|
|
$
|
(3.1
|
)
|
$
|
(0.5
|
)
|
$
|
(0.1
|
)
|
$
|
2.9
|
|
|||||
|
Insurance Licenses
|
16.7
|
|
—
|
|
—
|
|
—
|
|
16.7
|
|
||||||||||
|
Agency Relationships
|
26.2
|
|
(21.8
|
)
|
(2.1
|
)
|
—
|
|
2.3
|
|
||||||||||
|
Non-compete Agreements
|
3.3
|
|
(0.9
|
)
|
(0.7
|
)
|
(1.0
|
)
|
0.7
|
|
||||||||||
|
Consulting Relationships
|
0.9
|
|
—
|
|
(0.1
|
)
|
(0.8
|
)
|
—
|
|
||||||||||
|
Goodwill
|
24.2
|
|
(18.8
|
)
|
—
|
|
(1.5
|
)
|
3.9
|
|
||||||||||
|
Renewal Rights
|
1.7
|
|
—
|
|
(0.3
|
)
|
—
|
|
1.4
|
|
||||||||||
|
Total
|
$
|
79.6
|
|
$
|
(44.6
|
)
|
$
|
(3.7
|
)
|
$
|
(3.4
|
)
|
$
|
27.9
|
|
|||||
Crop Re and AgriLogic
On January 19, 2016, Aspen U.S. Holdings acquired
100%
of the equity voting interest of AgriLogic, a specialist U.S. crop managing general agency business with an integrated agricultural consultancy, for an initial purchase price of
$53.0 million
. In addition, the Company recognized
$14.1 million
of contingent consideration, with a total maximum payable of
$22.8 million
, subject to the future performance of the business and
$2.0 million
of ceding commission. The total consideration for the acquisition was
$69.1 million
.
A significant proportion of the acquired business was represented by intangible assets, specifically
$25.0 million
for agency relationships,
$4.0 million
for the right to use the AgriLogic trademark,
$2.9 million
for non-compete agreements,
$1.8 million
for the value of business acquired and
$1.0 million
for consultancy relationships. In addition,
$12.0 million
of software was acquired and recognized in the balance sheet under office properties and equipment along with
$0.3 million
of residual net assets. The total net assets acquired of
$47.0 million
resulted in the Company recognizing a total of
$22.1 million
in goodwill for the acquisition of AgriLogic,
$34.0 million
of intangible assets and
$21.0 million
of goodwill were eligible for tax deduction over the next
15
years.
License to use the “AgriLogic” Trademark.
The Company acquired the right to use the AgriLogic trademark in the United States. The Company valued the trademark at
$4.0 million
with an estimated economic useful life of
10
years. The Company planned to amortize the estimated value of the trademark over its estimated useful life.
Agency Relationships.
The Company valued the agency relationships at
$25.0 million
with an estimated economic useful life of
15
years. The Company amortized the estimated value of the agency relationships over their estimated useful life.
Non-compete Agreements.
The Company valued the non-compete agreements at
$2.9 million
with an estimated economic useful life of
5
years. The Company amortized the estimated value of the non-compete agreements over their estimated useful life.
F-62
Value of Business Acquired.
The Company recognized a
$1.8 million
asset for value of business acquired (“VOBA”) consisting of the inforce unearned premium reserve and claims reserves at fair value. The Company amortized the VOBA in line with the unwinding of the acquired unearned premium balances and loss reserves. Given the short tail nature of the book, the VOBA was fully amortized in 2016.
Consulting Relationships.
The Company valued the consulting relationships at
$1.0 million
with an estimated economic useful life of
10
years. The Company amortized the estimated value of the consulting relationships over their estimated useful life.
Goodwill.
The Company valued the goodwill at
$22.1 million
. The goodwill was deemed to have an indefinite useful life and was planned to be assessed for impairment annually.
On December 18, 2017, Aspen U.S. Holdings sold its interest in specialist U.S. crop managing general agency business, AgriLogic, to CGB DS in exchange for a
23.2%
equity interest in Crop Re Services LLC. Aspen U.S. Holdings retained the agricultural consulting business previously integrated within AgriLogic. Intangible assets disposed of as part of the AgriLogic sale included
$21.8 million
for agency relationships,
$3.1 million
for the right to use the AgriLogic trademark,
$0.9 million
for non-compete agreements and
$20.6 million
for goodwill.
Following the sale the Company performed its annual qualitative assessment on the residual intangible assets of the agricultural consulting business and determined that it was more likely than not that the intangible assets were impaired. The Company therefore recognized an impairment charge of
$3.4 million
in the year ending December 31, 2017.
On September 18, 2018, Aspen U.S. Holdings sold a
60%
interest in AgriLogic Consulting, LLC, its agricultural consulting business, to CGB DS and an individual investor, recognizing no gain or loss on disposal and de-consolidation. Intangible assets of the consulting business had previously been fully impaired.
Blue Waters
On October 31, 2016, Acorn acquired
100%
of the equity voting interest of Blue Waters, a specialist marine insurance agency. The total consideration for the acquisition was
$8.0 million
.
A significant proportion of the acquired business was represented by intangible assets, specifically
$3.1 million
for agency relationships,
$1.5 million
for the right to use the Blue Waters trademark,
$1.0 million
for non-compete agreements and
$0.05 million
for the value of trading licenses. In addition,
$0.3 million
of residual net assets were acquired. The total net assets acquired of
$5.75 million
resulted in the Company recognizing a total of
$2.1 million
in goodwill for the acquisition of Blue Waters.
Agency Relationships
. The Company valued the agency relationships at
$3.1 million
with an estimated economic useful life of
5
years. The Company will amortize the estimated value of the agency relationships over their estimated useful life.
License to use the “Blue Waters” Trademark
. The Company acquired the right to use the Blue Waters trademark in the United States. The Company valued the trademark at
$1.5 million
with an estimated economic useful life of
5
years. The Company will amortize the estimated value of the trademark over its estimated useful life.
Non-compete Agreements
. The Company valued the non-compete agreements at
$1.0 million
with an estimated economic useful life of
5
years. The Company will amortize the estimated value of the non-compete agreements over their estimated useful life.
Insurance Licenses
. The Company valued the insurance licenses at
$0.05 million
. The insurance licenses are considered to have an indefinite useful life and are not amortized. The licenses are tested annually for impairment.
Goodwill
. The Company valued the goodwill at
$2.1 million
. The goodwill is deemed to have an indefinite useful life and will be assessed for impairment annually.
Other Intangible Assets
Renewal Rights.
On September 22, 2016, the Company entered into a renewal rights agreement with Liberty Specialty Markets Limited (“LSML“). The Company valued the renewal rights at
$1.9 million
with an estimated economic useful life of
5
years. The Company will amortize the estimated value of the renewal rights over the estimated useful life.
In addition to the intangible assets and goodwill associated with the AgriLogic and Blue Waters acquisitions and the renewal rights agreement with LSML, the Company has the following intangible assets from prior transactions.
License to use the “Aspen” Trademark.
On April 5, 2005, the Company entered into an agreement with Aspen (Actuaries and Pension Consultants) Plc to acquire the right to use the Aspen trademark in the United Kingdom. The consideration paid was approximately
$1.6 million
. As at
December 31, 2018
, the value of the license to use the Aspen trademark was
$1.6 million
(
December 31, 2017
—
$1.6 million
). The trademark has an indefinite useful life and is tested for impairment annually or when events or changes in circumstances indicate that the asset might be impaired. The Company performed its annual qualitative assessment and determined that it was not more likely than not that the Aspen trademark was impaired as at
December 31, 2018
.
F-63
Insurance Licenses.
The value of the licenses as at
December 31, 2018
was
$16.6 million
(
December 31, 2017
—
$16.6 million
), including
$10.0 million
of acquired licenses held by AAIC,
$4.5 million
of acquired licenses held by Aspen Specialty and
$2.1 million
of acquired licenses held by Aspen U.K. The insurance licenses are considered to have an indefinite life and are not being amortized. The Company performed its annual qualitative assessment and determined that it was not more likely than not that the insurance licenses were impaired as at
December 31, 2018
.
Goodwill.
On January 1, 2017, the Company purchased through its wholly-owned subsidiary, Aspen U.S. Holdings, a
49%
share of Digital Re. The Company valued the goodwill at
$1.8 million
. The goodwill is deemed to have an indefinite useful life and will be assessed for impairment annually.
|
19.
|
Commitments and Contingent Liabilities
|
|
(a)
|
Restricted assets
|
The Company’s subsidiaries are obliged by the terms of its contractual obligations to U.S. policyholders and by obligations to certain regulatory authorities to facilitate issue of letters of credit or maintain certain balances in trust funds for the benefit of policyholders.
The following table details the forms and value of Company’s material restricted assets as at
December 31, 2018
and
2017
:
|
As at December 31, 2018
|
At December 31, 2017
|
|||||||
|
|
($ in millions, except percentages)
|
|||||||
|
Regulatory trusts and deposits:
|
||||||||
|
Affiliated transactions
|
$
|
1,033.9
|
|
$
|
1,455.0
|
|
||
|
Third party
|
2,511.7
|
|
2,425.3
|
|
||||
|
Letters of credit / guarantees
(1)
|
771.1
|
|
658.5
|
|
||||
|
Investment commitment — real estate fund
|
—
|
|
100.0
|
|
||||
|
Other investments — real estate fund
|
102.5
|
|
—
|
|
||||
|
Total restricted assets
|
$
|
4,419.2
|
|
$
|
4,638.8
|
|
||
|
Total as percent of investable assets
(2)
|
56.4
|
%
|
53.4
|
%
|
||||
_______________
|
(1)
|
As at
December 31, 2018
, the Company had pledged funds of
$771.1 million
(
December 31, 2017
—
$658.5 million
) as collateral for the secured letters of credit.
|
|
(2)
|
Investable assets comprise total investments, cash and cash equivalents, accrued interest, receivables for securities sold and payables for securities purchased.
|
Real Estate Fund.
On December 20, 2017, the Company committed
$100.0 million
as a limited partner to a real estate fund. The investment objective of the fund is to achieve attractive risk-adjusted returns through the acquisition of income producing, high quality assets in gateway cities located in the U.S. and Canada in the office, retail, industrial and multifamily sectors of the real estate market. On May 1, 2018, the Company received a demand for an initial capital call of
$86.2 million
and the capital call on May 10, 2018. On September 19, 2018, the Company received a demand for the final capital call of
$13.8 million
and paid the capital on September 28, 2018.
Investments in the real estate fund may be redeemed on a quarterly basis with 90 days’ notice subject to available cash in the fund once the lock-up period ends two years after the capital call. If sufficient cash is not available then all requested redemptions will be made on a pro rata basis. If a redemption request has not been met in full, as of such calendar quarter, the remaining portion of the request will be redeemed in subsequent quarters. There are no assurances as to when the Company may be able to withdraw, in whole or in part, its redemption request from the fund. A lock-up period is the initial amount of time an investor is contractually required to remain invested before having the ability to redeem.
The Company’s current arrangements with our bankers for the issue of letters of credit require us to provide collateral in the form of cash and investments for the full amount of all secured and undrawn letters of credit that are outstanding. We monitor the proportion of our otherwise liquid assets that are committed to trust funds or to the collateralization of letters of credit. As at
December 31, 2018
and
2017
, these funds amounted to approximately
56.4%
of the
$7.8 billion
and approximately
53.4%
of the
$8.7 billion
of investable assets held by the Company, respectively. We do not consider that this unduly restricts our liquidity at this time. For more information on our credit facilities and long-term debt arrangements, please refer to Note 22, “Credit Facility and Long-term Debt” of these consolidated financial statements.
F-64
Funds at Lloyd’s.
AUL operates at Lloyd’s as the corporate member for Syndicate 4711. Lloyd’s determines Syndicate 4711’s required regulatory capital principally through the syndicate’s annual business plan. Such capital, called Funds at Lloyd’s, consists of investable assets as at
December 31, 2018
in the amount of
$503.2 million
(
2017
—
$458.7 million
).
The amounts provided as Funds at Lloyd’s will be drawn upon and become a liability of the Company in the event of Syndicate 4711 declaring a loss at a level that cannot be funded from other resources, or if Syndicate 4711 requires funds to cover a short term liquidity gap. The amount which the Company provides as Funds at Lloyd’s is not available for distribution to the Company for the payment of dividends. Aspen Managing Agency Limited, the managing agent to Syndicate 4711, is also required by Lloyd’s to maintain a minimum level of capital which as at
December 31, 2018
was
£0.4 million
(
December 31, 2017
—
£0.4 million
). This is not available for distribution by the Company for the payment of dividends.
U.S. Reinsurance Trust Fund.
For its U.S. reinsurance activities, Aspen U.K. has established and must retain a multi-beneficiary U.S. trust fund for the benefit of its U.S. cedants so that they may take financial statement credit without the need to post cedant-specific security. The minimum trust fund amount is
$20.0 million
plus an amount equal to
100%
of Aspen U.K.’s U.S. reinsurance liabilities, which were
$1,311.4 million
as at
December 31, 2018
and
$1,268.4 million
as at
December 31, 2017
. As at
December 31, 2018
, the balance (including applicable letter of credit facilities) held in the trust was
$1,336.4 million
(
2017
—
$1,350.9 million
).
Aspen Bermuda has also established and must retain a multi-beneficiary U.S. trust fund for the benefit of its U.S. cedants so that they may take financial statement credit without the need to post cedant-specific security. The minimum trust fund amount is
$20.0 million
plus an amount equal to
100%
of Aspen Bermuda’s liabilities to its U.S. cedants which was
$647.8 million
and
$895.5 million
as at
December 31, 2018
and
2017
, respectively. As at
December 31, 2018
, the balance held in the U.S. trust fund and other Aspen Bermuda trusts was
$1,112.4 million
(
2017
—
$1,333.6 million
).
U.S. Surplus Lines Trust Fund.
Aspen U.K. and Syndicate 4711 have also established a U.S. surplus lines trust fund with a U.S. bank to secure liabilities under U.S. surplus lines policies. The balance held in trust as at
December 31, 2018
was
$198.8 million
(
2017
—
$195.0 million
).
U.S. Regulatory Deposits.
As at
December 31, 2018
, Aspen Specialty had a total of
$6.0 million
(
2017
—
$6.0 million
) on deposit with six U.S. states in order to satisfy state regulations for writing business in those states. AAIC had a further
$6.1 million
(
2017
—
$6.1 million
) on deposit with twelve U.S. states.
Canadian Trust Fund.
Aspen U.K. has established a Canadian trust fund with a Canadian bank to secure a Canadian insurance license. As at
December 31, 2018
, the balance held in trust was CAD
$152.7 million
(
2017
— CAD
$169.9 million
).
Australian Trust Fund.
Aspen U.K. has established an Australian trust fund with an Australian bank to secure policyholder liabilities and as a condition for maintaining an Australian insurance license. As at
December 31, 2018
, the balance held in trust was AUD
$209.3 million
(
2017
— AUD
$198.7 million
).
Swiss Trust Fund.
Aspen U.K. has established a Swiss trust fund with a Swiss bank to secure policyholder liabilities and as a condition for maintaining a Swiss insurance license. As at
December 31, 2018
, the balance held in trust was CHF
9.0 million
(
2017
— CHF
9.8 million
).
Singapore Fund.
Aspen U.K. has established a segregated Singaporean bank account to secure policyholder liabilities and as a condition for maintaining a Singaporean insurance license and meet local solvency requirements. As at
December 31, 2018
, the balance in the account was SGD
$135.9 million
(
2017
— SGD
$120.6 million
).
(b)
Operating leases
Amounts outstanding under operating leases net of subleases as at
December 31, 2018
and
2017
were:
|
As at December 31, 2018
|
2019
|
2020
|
2021
|
2022
|
2023
|
Later
Years |
Total
|
|||||||||||||||||||||
|
|
($ in millions)
|
|||||||||||||||||||||||||||
|
Operating Lease Obligations
|
$
|
17.5
|
|
$
|
16.0
|
|
$
|
14.6
|
|
$
|
9.9
|
|
$
|
8.8
|
|
$
|
74.6
|
|
$
|
141.4
|
|
|||||||
|
As at December 31, 2017
|
2018
|
2019
|
2020
|
2021
|
2022
|
Later
Years |
Total
|
|||||||||||||||||||||
|
|
($ in millions)
|
|||||||||||||||||||||||||||
|
Operating Lease Obligations
|
$
|
16.2
|
|
$
|
16.1
|
|
$
|
15.3
|
|
$
|
11.0
|
|
$
|
8.7
|
|
$
|
78.7
|
|
$
|
146.0
|
|
|||||||
F-65
Total rental and premises expenses for
2018
was
$27.3 million
(
2017
—
$26.3 million
). For all leases, rent incentives, including reduced-rent and rent-free periods, are spread on a straight-line basis over the term of the lease. The Company believes that our office space is sufficient for us to conduct our operations for the foreseeable future in these locations.
The total depreciation for fixed assets was
$29.7 million
for the twelve months ended
December 31, 2018
(
2017
—
$34.6 million
). Accumulated depreciation as at
December 31, 2018
was
$175.8 million
(
2017
—
$146.2 million
).
|
(c)
|
Variable interest entities
|
As at
December 31, 2018
, the Company had investments in
two
(
December 31, 2017
—
two
) variable interest entities, Peregrine Reinsurance Ltd and Silverton Re Ltd.
Peregrine Reinsurance Ltd.
For further information regarding the Company’s investment in Peregrine Reinsurance Ltd, please refer to Note 7, “Variable Interest Entities” of these consolidated financial statements.
Silverton Re Ltd.
For further information regarding the Company’s investment in Silverton Re Ltd., please refer to Note 7, “Variable Interest Entities” of these consolidated financial statements.
|
(d)
|
Contingent liabilities
|
In common with the rest of the insurance and reinsurance industry, the Company is also subject to litigation and arbitration in the ordinary course of business. The Company’s Operating Subsidiaries are regularly engaged in the investigation, conduct and defense of disputes, or potential disputes, resulting from questions of insurance or reinsurance coverage or claims activities. Pursuant to insurance and reinsurance arrangements, many of these disputes are resolved by arbitration or other forms of alternative dispute resolution. Such legal proceedings are considered in connection with estimating the Company’s Insurance Reserves — Loss and Loss Adjustment Expenses, as provided on the Company’s consolidated balance sheet.
In some jurisdictions, noticeably the U.S., a failure to deal with such disputes or potential disputes in an appropriate manner could result in an award of “bad faith” punitive damages against the Company’s Operating Subsidiaries. In accordance with ASC 450-20-50-4b, for (a) reasonably possible losses for which no accrual is made because any of the conditions for accrual in ASC 450-20-25-2 are not met and (b) reasonably possible losses in excess of the amounts accrued pursuant to ASC 450-20-30-1, the Company will provide an estimate of the possible loss or range of possible loss or state that such an estimate cannot be made.
As at
December 31, 2018
, it was the opinion of the Company’s management based on available information that the probability of the ultimate resolution of pending or threatened litigation or arbitrations having a material effect on the Company’s financial condition, results of operations or liquidity would be remote.
If the Merger is consummated, each RSU, performance share and phantom share that is outstanding immediately prior to the Merger will, to the extent not vested, become fully vested, and will be canceled and converted into the right to receive
$42.75
without interest in accordance to the Merger Agreement. In addition, if the Merger is consummated it could trigger certain changes in control agreements with members of management which could result in potential change in control and transaction payments to those members of management. Consummation of the Merger will also trigger the payment of transaction bonuses to certain executive officers and key employees who contributed significantly to the proposed Merger, such bonuses to be paid no later than 60 days following the consummation of the Merger subject to, with the exception of the Group Chief Executive Officer, the recipient’s continued employment unless terminated without cause.
|
20.
|
Concentrations of Credit Risk
|
The Company is potentially exposed to concentrations of credit risk in respect of amounts recoverable from reinsurers, investments and cash and cash equivalents, and insurance and reinsurance balances owed by the brokers with whom the Company transacts business.
The Company’s Reinsurance Credit Committee defines credit risk tolerances in line with the risk appetite set by our Board and they, together with the group’s risk management function, monitor exposures to individual counterparties. Any exceptions are reported to senior management and the Risk Committee of the Board of Directors.
Reinsurance recoverables
The total amount recoverable by the Company from reinsurers as at
December 31, 2018
was
$2,077.6 million
(
2017
—
$1,515.2 million
) of which
$1,497.8 million
was uncollateralized (
2017
—
$1,001.9 million
). As at
December 31, 2018
, of the Company’s uncollateralized reinsurance recoverables
15.7%
(
2017
—
17.0%
) were with Munich Re which is rated A+ by A.M. Best and AA- by S&P,
10.2%
(
2017
—
13.8%
) were with Lloyd’s of London Syndicates which are rated A by A.M. Best and A+ by S&P and
10.2%
(
2017
—
7.7%
) were with Everest Re which is rated A+ by A.M Best and A+ by S&P. These are the Company’s
F-66
largest exposures to individual reinsurers. The Company has made no provision for doubtful debts from any of its reinsurers as at
December 31, 2018
.
Underwriting premium receivables
The total underwriting premium receivable by the Company as at
December 31, 2018
was
$1,459.3 million
(
2017
—
$1,496.5 million
). As at
December 31, 2018
,
$12.4 million
of the total underwriting premium receivable balance has been due for settlement for more than one year. The Company assesses the recoverability of premium receivables through a review of policies and the concentration of receivables by broker. A bad debt provision was included of
$16.2 million
as at
December 31, 2018
(
2017
—
$5.2 million
) for underwriting premiums unlikely to be collected.
Investments and cash and cash equivalents
The Company’s investment policies include specific provisions that limit the allowable holdings of a single issue and issuer. As at
December 31, 2018
, there were no investments in any single issuer, other than the U.S. government, U.S. government agencies, U.S. government sponsored enterprises, the Canadian government and the U.K. government in excess of
2%
of the aggregate investment portfolio.
Balances owed by brokers
The Company underwrites a significant amount of its business through brokers and a credit risk exists should any of these brokers be unable to fulfill their contractual obligations in respect of insurance or reinsurance balances due to the Company. The following table shows the largest brokers that the Company transacted business within the three years ended
December 31, 2018
and the proportion of gross written premiums from each of those brokers.
|
|
Twelve Months Ended December 31,
|
||||||||||||
|
|
2018
|
2017
|
2016
|
||||||||||
|
(in percentages)
|
|||||||||||||
|
Aon Corporation
|
15.8
|
%
|
16.4
|
%
|
18.4
|
%
|
|||||||
|
Marsh & McLennan Companies, Inc.
|
15.8
|
|
16.0
|
|
14.7
|
|
|||||||
|
Willis Group Holdings, Ltd.
|
12.4
|
|
13.1
|
|
13.7
|
|
|||||||
|
Other brokers/non-broker sources
(1)
|
56.0
|
|
54.5
|
|
53.2
|
|
|||||||
|
Total
|
100.0
|
%
|
100.0
|
%
|
100.0
|
%
|
|||||||
|
Gross written premiums ($ millions)
|
$
|
3,446.9
|
|
$
|
3,360.9
|
|
$
|
3,147.0
|
|
||||
______________
|
(1)
|
No other individual broker accounted for more than
10%
of total gross written premiums.
|
F-67
|
21.
|
Reclassifications from Accumulated Other Comprehensive Income
|
The following table sets out the components of the Company’s AOCI that are reclassified into the audited condensed consolidated statement of operations for the
twelve months ended
December 31, 2018
and
2017
:
|
Amount Reclassified from AOCI
|
||||||||||
|
Details about the AOCI Components
|
Twelve Months Ended December 31, 2018
|
Twelve Months Ended December 31, 2017
|
Affected Line Item in the
Consolidated Statement of Operations
|
|||||||
|
|
($ in millions)
|
|
||||||||
|
Available for sale securities:
|
||||||||||
|
Realized gain on sale of securities
|
$
|
6.7
|
|
$
|
10.7
|
|
Realized and unrealized investment gains
|
|||
|
Realized (losses) on sale of securities
|
(11.9
|
)
|
(6.7
|
)
|
Realized and unrealized investment losses
|
|||||
|
(5.2
|
)
|
4.0
|
|
(Loss)/income from operations before income tax
|
||||||
|
Tax on net realized gains of securities
|
0.7
|
|
(0.4
|
)
|
Income tax benefit/(expense)
|
|||||
|
$
|
(4.5
|
)
|
$
|
3.6
|
|
Net (loss)/income
|
||||
|
Realized derivatives:
|
||||||||||
|
Net realized (losses)/gains on settled derivatives
|
(1.2
|
)
|
4.4
|
|
General, administrative and corporate expenses
|
|||||
|
Tax on settled derivatives
|
0.2
|
|
(0.8
|
)
|
Income tax benefit/(expense)
|
|||||
|
$
|
(1.0
|
)
|
$
|
3.6
|
|
Net (loss)/income
|
||||
|
Total reclassifications from AOCI to the statement of operations, net of income tax
|
$
|
(5.5
|
)
|
$
|
7.2
|
|
Net (loss)/income
|
|||
|
22.
|
Credit Facility and Long-term Debt
|
Credit Agreement.
On March 27, 2017, Aspen Holdings and certain of its direct or indirect subsidiaries (collectively, the “Borrowers”) entered into a Second Amended and Restated Credit Agreement (the “Credit Agreement”) with various lenders and Barclays Bank plc, as administrative agent, which amends and restates the Amended and Restated Credit Agreement, dated as of June 12, 2013, among the Company, certain subsidiaries thereof, various lenders and Barclays Bank plc, as administrative agent. The credit facility will be used by the Borrowers to finance the working capital needs of the Company and its subsidiaries, for letters of credit in connection with the insurance and reinsurance businesses of the Company and its subsidiaries and for other general corporate purposes. Initial availability under the credit facility is
$200,000,000
and the Company has the option (subject to obtaining commitments from acceptable lenders) to increase the credit facility by up to
$100,000,000
. The credit facility will expire on March 27, 2022.
As at
December 31, 2018
,
no
borrowings were outstanding under the Credit Agreement. The fees and interest rates on the loans and the fees on the letters of credit payable by the Borrowers under the Credit Agreement are based upon the credit ratings for the Company’s long-term unsecured senior debt by S&P and Moody’s. In addition, the fees for a letter of credit vary based upon whether the applicable Borrower has provided collateral (in the form of cash or qualifying debt securities) to secure its reimbursement obligations with respect to such letter of credit.
Under the Credit Agreement, the Company must not permit (a) consolidated tangible net worth to be less than approximately
$2,323,100,000
plus
25%
of consolidated net income and
25%
of aggregate net cash proceeds from the issuance by the Company of its capital stock, in each case after January 1, 2017, (b) the ratio of its total consolidated debt to the sum of such debt plus our consolidated tangible net worth to exceed
35%
or (c) any material insurance subsidiary to have a financial strength rating of less than “B++” from A.M. Best. The Credit Agreement contains other customary affirmative and negative covenants, including (subject to various exceptions) restrictions on the ability of the Company and its subsidiaries to incur indebtedness, create or permit liens on their assets, engage in mergers or consolidations, dispose of assets, pay dividends or other distributions, purchase or redeem the Company’s equity securities, make investments and enter into transactions with affiliates. In addition, the Credit Agreement has customary events of default, including (subject to certain materiality thresholds and grace periods) payment default, failure to comply with covenants, material inaccuracy of representation or warranty, bankruptcy or insolvency proceedings, change of control and cross-default to other debt agreements.
F-68
On August 28, 2018, the Borrowers entered into a Waiver to Credit Agreement with various lenders and Barclays Bank plc, as administrative agent, to waive any Default or Event of Default that would result from any Change of Control caused by the Merger.
Other Credit Facilities.
On June 29, 2018, Aspen Bermuda and Citibank Europe plc (“Citi Europe”) amended the committed letter of credit facility, dated June 30, 2012, as amended on June 30, 2014 and June 30, 2016, (the “LOC Facility”). The amendment to the LOC facility extends the term of the LOC Facility to June 30, 2020 and provides a maximum aggregate amount of up to
$550.0 million
. Under the LOC Facility, Aspen Bermuda will pay to Citi Europe (a) a letter of credit fee based on the available amounts of each letter of credit and (b) a commitment fee, which varies based upon usage, on the unutilized portion of the LOC Facility. Aspen Bermuda will also pay interest on the amount drawn by any beneficiary under the LOC Facility at a rate per annum of LIBOR plus
1%
(plus reserve asset costs, if any) from the date of drawing until the date of reimbursement by Aspen Bermuda. In addition, Aspen Bermuda and Citi Europe entered into an uncommitted letter of credit facility whereby Aspen Bermuda has the ability to request letters of credit under this facility subject to the prior approval of Citi Europe. The fee associated with the uncommitted facility is a letter of credit fee based on the available amounts of each letter of credit issued under the uncommitted facility. Both the LOC Facility and the uncommitted facility are used to secure obligations of Aspen Bermuda to its policyholders. In addition to these facilities, we also use regulatory trusts to secure our obligations to policyholders.
The terms of a pledge agreement between Aspen Bermuda and Citi Europe (pursuant to an assignment agreement dated October 11, 2006) dated January 17, 2006, as amended, were also amended on June 30, 2014 to change the types of securities or other assets that are acceptable as collateral under the New LOC Facility. All other agreements relating to Aspen Bermuda’s LOC Facility, which now apply to the LOC Facility with Citi Europe, as previously filed with the SEC, remain in full force and effect. As at
December 31, 2018
, we had
$444.2 million
of outstanding collateralized letters of credit under the LOC Facility (
December 31, 2017
—
$449.4 million
).
Long-term Debt.
On December 15, 2010, the Company closed its offering of
$250.0 million
6.00%
coupon Senior Notes due December 15, 2020. The net proceeds from this offering, before offering expenses, were
$247.5 million
. On June 18, 2018, we redeemed
$125.0 million
of our
6.00%
Senior Notes due 2020 resulting in a realized loss, or make-whole payment, of
$8.6 million
.
On November 13, 2013, the Company closed its offering of
$300.0 million
4.65%
Senior Notes due November 15, 2023 (the “2023 Senior Notes”). The net proceeds from the 2023 Senior Notes offering, before offering expenses, were
$299.7 million
and a portion of the proceeds was used to redeem the then outstanding 2014 Senior Notes. Subject to applicable law, the 2023 Senior Notes will be the senior unsecured obligations of Aspen Holdings and will rank equally in right of payment with all of our other senior unsecured indebtedness from time to time outstanding.
Subject to certain exceptions, so long as any of the senior notes described above remain outstanding, the Company has agreed that neither the Company nor any of its subsidiaries will (i) create a lien on any shares of capital stock of any designated subsidiary (currently Aspen U.K. and Aspen Bermuda, as defined in the Indenture), or (ii) issue, sell, assign, transfer or otherwise dispose of any shares of capital stock of any designated subsidiary. Certain events will constitute an event of default under the Indenture, including default in payment at maturity of any of our other indebtedness in excess of
$50.0 million
.
Silverton, our Bermuda-domiciled special purpose insurer, was established in December 2013 to provide additional collateralized capacity to support Aspen Re’s global reinsurance business. On December 23, 2014, Silverton issued
$85.0 million
of participating notes (of which
$70.0 million
was issued to third parties), which will provide quota share support for Aspen Re’s global property catastrophe excess of loss reinsurance business. The 2015 Loan Notes matured on September 18, 2017.
In the fourth quarter of 2015, Silverton issued
$125.0 million
of participating notes (of which
$100.0 million
was issued to third parties), which will provide quota share support for Aspen Re’s global property catastrophe excess of loss reinsurance business. The 2016 Loan Notes matured on September 17, 2018.
In the fourth quarter of 2016, Silverton issued
$130.0 million
of participating notes (of which
$105.0 million
was issued to third parties), which will provide quota share support for Aspen Re’s global property catastrophe excess of loss reinsurance business. The Company’s maximum loss exposure to Silverton in relation to the 2017 Loan Notes is its
$1.1 million
note holdings as at
December 31, 2018
due to mature on September 16, 2019.
F-69
The following table summarizes our contractual obligations under the long-term debts as at
December 31, 2018
.
|
|
Payments Due By Period
|
||||||||||||||||||||
|
Contractual Basis
|
Less than
1 year |
1-3 years
|
3-5 years
|
More than 5 years
|
Total
|
||||||||||||||||
|
|
($ in millions)
|
||||||||||||||||||||
|
Long-term Debt Obligations
|
$
|
—
|
|
$
|
125.0
|
|
$
|
300.0
|
|
$
|
—
|
|
$
|
425.0
|
|
||||||
The Senior Notes obligation disclosed above does not include the
$21.5 million
annual interest payable associated with the Senior Notes or the loan notes issued by Silverton. For more information on Silverton, refer to Note 7, “Variable Interest Entities” of these consolidated financial statements.
|
23.
|
Subsequent Events
|
On January 16, 2019, Aspen Bermuda entered into a number of standard fixed for floating interest rate swaps with a total notional amount of
$3,318.0 million
due to mature between January 18, 2021 and January 18, 2034. Aspen Bermuda entered into the swaps in the ordinary course of its investment activities to partially mitigate any negative impact of rises in interest rates on the market value of our fixed income portfolio.
F-70
|
24.
|
Unaudited Quarterly Financial Data
|
The following is a summary of the quarterly financial data for the twelve months ended
December 31, 2018
,
2017
and
2016
.
|
|
2018
|
|||||||||||||||||||
|
|
Quarter Ended
March 31
|
Quarter Ended
June 30
|
Quarter Ended September 30
|
Quarter Ended December 31
|
Year Ended December 31
|
|||||||||||||||
|
Revenues
|
($ in millions)
|
|||||||||||||||||||
|
Net earned premium
|
$
|
533.5
|
|
$
|
519.5
|
|
$
|
623.2
|
|
$
|
538.5
|
|
$
|
2,214.7
|
|
|||||
|
Net investment income
|
47.3
|
|
50.4
|
|
48.0
|
|
52.5
|
|
198.2
|
|
||||||||||
|
Realized and unrealized investment gains
|
100.6
|
|
3.5
|
|
1.8
|
|
4.1
|
|
110.0
|
|
||||||||||
|
Other income
|
2.1
|
|
2.1
|
|
1.4
|
|
3.4
|
|
9.0
|
|
||||||||||
|
Total revenues
|
683.5
|
|
575.5
|
|
674.4
|
|
598.5
|
|
2,531.9
|
|
||||||||||
|
Expenses
|
||||||||||||||||||||
|
Losses and loss adjustment expenses
|
310.2
|
|
310.4
|
|
431.1
|
|
521.3
|
|
1,573.0
|
|
||||||||||
|
Amortization of deferred policy acquisition costs
|
90.8
|
|
85.9
|
|
101.0
|
|
93.9
|
|
371.6
|
|
||||||||||
|
General, administrative and corporate expenses
|
121.0
|
|
110.2
|
|
160.4
|
|
100.1
|
|
491.7
|
|
||||||||||
|
Interest on long-term debt
|
7.4
|
|
7.6
|
|
5.4
|
|
5.5
|
|
25.9
|
|
||||||||||
|
Change in fair value of derivatives
|
(23.5
|
)
|
46.1
|
|
(7.2
|
)
|
16.4
|
|
31.8
|
|
||||||||||
|
Change in fair value of loan notes issued by variable interest entities
|
(1.0
|
)
|
3.4
|
|
1.7
|
|
0.3
|
|
4.4
|
|
||||||||||
|
Realized and unrealized investment losses
|
138.3
|
|
24.2
|
|
2.7
|
|
9.5
|
|
174.7
|
|
||||||||||
|
Realized loss on debt extinguishment
|
—
|
|
8.6
|
|
—
|
|
—
|
|
8.6
|
|
||||||||||
|
Net realized and unrealized foreign exchange losses/(gains)
|
4.7
|
|
(5.2
|
)
|
9.5
|
|
(5.5
|
)
|
3.5
|
|
||||||||||
|
Other expenses
|
1.2
|
|
0.5
|
|
0.4
|
|
0.6
|
|
2.7
|
|
||||||||||
|
Total expenses
|
649.1
|
|
591.7
|
|
705.0
|
|
742.1
|
|
2,687.9
|
|
||||||||||
|
Income from operations before income tax
|
34.4
|
|
(16.2
|
)
|
(30.6
|
)
|
(143.6
|
)
|
(156.0
|
)
|
||||||||||
|
Income tax (expense)/benefit
|
(3.6
|
)
|
1.5
|
|
15.5
|
|
(3.2
|
)
|
10.2
|
|
||||||||||
|
Net income
|
$
|
30.8
|
|
$
|
(14.7
|
)
|
$
|
(15.1
|
)
|
$
|
(146.8
|
)
|
$
|
(145.8
|
)
|
|||||
|
Per Share Data
|
||||||||||||||||||||
|
Weighted average number of ordinary share and share equivalents
(1)
|
||||||||||||||||||||
|
Basic
|
59,546,165
|
|
59,671,684
|
|
59,692,623
|
|
59,431,469
|
|
59,655,507
|
|
||||||||||
|
Diluted
|
60,513,147
|
|
59,671,684
|
|
59,692,623
|
|
59,431,469
|
|
59,655,507
|
|
||||||||||
|
Basic earnings/(loss) per ordinary share adjusted for preference share dividends
|
$
|
0.39
|
|
$
|
(0.38
|
)
|
$
|
(0.38
|
)
|
$
|
(2.60
|
)
|
$
|
(2.97
|
)
|
|||||
|
Diluted earnings/(loss) per ordinary share adjusted for preference share dividends
|
$
|
0.38
|
|
$
|
(0.38
|
)
|
$
|
(0.38
|
)
|
$
|
(2.60
|
)
|
$
|
(2.97
|
)
|
|||||
_______________
|
(1)
|
The basic and diluted number of ordinary shares for the three months ended June 30, 2018, September 30, 2018 and the three and twelve months ended December 31, 2018 is the same, as the inclusion of dilutive securities in a loss-making period would be anti-dilutive.
|
F-71
|
|
2017
|
|||||||||||||||||||
|
|
Quarter Ended
March 31 |
Quarter Ended
June 30 |
Quarter Ended September 30
|
Quarter Ended December 31
|
Year Ended December 31
|
|||||||||||||||
|
Revenues
|
($ in millions)
|
|||||||||||||||||||
|
Net earned premium
|
$
|
581.1
|
|
$
|
562.0
|
|
$
|
652.5
|
|
$
|
511.0
|
|
$
|
2,306.6
|
|
|||||
|
Net investment income
|
47.7
|
|
47.4
|
|
46.4
|
|
47.5
|
|
189.0
|
|
||||||||||
|
Realized and unrealized investment gains
|
51.2
|
|
49.0
|
|
29.9
|
|
18.8
|
|
148.9
|
|
||||||||||
|
Other income
|
3.6
|
|
3.6
|
|
(2.2
|
)
|
3.9
|
|
8.9
|
|
||||||||||
|
Total revenues
|
683.6
|
|
662.0
|
|
726.6
|
|
581.2
|
|
2,653.4
|
|
||||||||||
|
Expenses
|
||||||||||||||||||||
|
Losses and loss adjustment expenses
|
328.2
|
|
346.1
|
|
776.2
|
|
544.2
|
|
1,994.7
|
|
||||||||||
|
Amortization of deferred policy acquisition costs
|
113.7
|
|
96.3
|
|
105.4
|
|
85.1
|
|
400.5
|
|
||||||||||
|
General, administrative and corporate expenses
|
121.3
|
|
119.9
|
|
110.9
|
|
150.1
|
|
502.2
|
|
||||||||||
|
Interest on long-term debt
|
7.4
|
|
7.4
|
|
7.4
|
|
7.3
|
|
29.5
|
|
||||||||||
|
Change in fair value of derivatives
|
(3.1
|
)
|
(17.6
|
)
|
(4.5
|
)
|
(2.5
|
)
|
(27.7
|
)
|
||||||||||
|
Change in fair value of loan notes issued by variable interest entities
|
2.9
|
|
3.3
|
|
(9.8
|
)
|
(17.6
|
)
|
(21.2
|
)
|
||||||||||
|
Realized and unrealized investment losses
|
5.0
|
|
7.0
|
|
12.4
|
|
4.0
|
|
28.4
|
|
||||||||||
|
Net realized and unrealized foreign exchange losses/(gains)
|
8.9
|
|
20.6
|
|
(8.4
|
)
|
2.8
|
|
23.9
|
|
||||||||||
|
Other expenses
|
—
|
|
2.0
|
|
—
|
|
2.9
|
|
4.9
|
|
||||||||||
|
Total expenses
|
584.3
|
|
585.0
|
|
989.6
|
|
776.3
|
|
2,935.2
|
|
||||||||||
|
Income from operations before income tax
|
99.3
|
|
77.0
|
|
(263.0
|
)
|
(195.1
|
)
|
(281.8
|
)
|
||||||||||
|
Income tax (expense)/benefit
|
(2.8
|
)
|
(1.2
|
)
|
9.2
|
|
10.2
|
|
15.4
|
|
||||||||||
|
Net income/(loss)
|
$
|
96.5
|
|
$
|
75.8
|
|
$
|
(253.8
|
)
|
$
|
(184.9
|
)
|
$
|
(266.4
|
)
|
|||||
|
Per Share Data
|
||||||||||||||||||||
|
Weighted average number of ordinary share and share equivalents
(1)
|
||||||||||||||||||||
|
Basic
|
59,862,662
|
|
59,966,358
|
|
59,759,730
|
|
59,431,469
|
|
59,753,886
|
|
||||||||||
|
Diluted
|
61,196,772
|
|
61,022,981
|
|
59,795,730
|
|
59,431,469
|
|
59,753,886
|
|
||||||||||
|
Basic earnings/(loss) per ordinary share adjusted for preference share dividends
|
$
|
1.39
|
|
$
|
1.09
|
|
$
|
(4.48
|
)
|
$
|
(3.25
|
)
|
$
|
(5.22
|
)
|
|||||
|
Diluted earnings/(loss) per ordinary share adjusted for preference share dividends
|
$
|
1.36
|
|
$
|
1.07
|
|
$
|
(4.48
|
)
|
$
|
(3.25
|
)
|
$
|
(5.22
|
)
|
|||||
_______________
|
(1)
|
The basic and diluted number of ordinary shares for the three months ended September 30, 2017 and the three and twelve months ended December 31, 2017 is the same, as the inclusion of dilutive securities in a loss-making period would be anti-dilutive.
|
F-72
|
|
2016
|
|||||||||||||||||||
|
|
Quarter Ended
March 31 |
Quarter Ended
June 30 |
Quarter Ended September 30
|
Quarter Ended December 31
|
Year Ended December 31
|
|||||||||||||||
|
Revenues
|
($ in millions)
|
|||||||||||||||||||
|
Net earned premium
|
$
|
663.1
|
|
$
|
680.8
|
|
$
|
681.0
|
|
$
|
612.4
|
|
$
|
2,637.3
|
|
|||||
|
Net investment income
|
49.5
|
|
48.0
|
|
46.4
|
|
43.2
|
|
187.1
|
|
||||||||||
|
Realized and unrealized investment gains/(losses)
(1)
|
65.6
|
|
45.1
|
|
26.7
|
|
(29.0
|
)
|
108.4
|
|
||||||||||
|
Other income
|
1.4
|
|
(0.5
|
)
|
1.5
|
|
3.3
|
|
5.7
|
|
||||||||||
|
Total revenues
|
779.6
|
|
773.4
|
|
755.6
|
|
629.9
|
|
2,938.5
|
|
||||||||||
|
Expenses
|
||||||||||||||||||||
|
Losses and loss adjustment expenses
|
357.4
|
|
442.2
|
|
389.2
|
|
387.3
|
|
1,576.1
|
|
||||||||||
|
Amortization of deferred policy acquisition costs
|
130.2
|
|
126.7
|
|
130.9
|
|
141.1
|
|
528.9
|
|
||||||||||
|
General, administrative and corporate expenses
|
119.8
|
|
116.4
|
|
125.0
|
|
128.9
|
|
490.1
|
|
||||||||||
|
Interest on long-term debt
|
7.4
|
|
7.4
|
|
7.3
|
|
7.4
|
|
29.5
|
|
||||||||||
|
Change in fair value of derivatives
|
7.2
|
|
0.4
|
|
(0.6
|
)
|
17.6
|
|
24.6
|
|
||||||||||
|
Change in fair value of loan notes issued by variable interest entities
|
4.4
|
|
(0.5
|
)
|
9.8
|
|
3.4
|
|
17.1
|
|
||||||||||
|
Realized and unrealized investment losses
|
20.6
|
|
8.3
|
|
5.2
|
|
29.1
|
|
63.2
|
|
||||||||||
|
Net realized and unrealized foreign exchange (gains)/losses
|
15.7
|
|
5.3
|
|
(10.8
|
)
|
(12.0
|
)
|
(1.8
|
)
|
||||||||||
|
Other expenses
|
—
|
|
1.0
|
|
(0.9
|
)
|
1.2
|
|
1.3
|
|
||||||||||
|
Total expenses
|
662.7
|
|
707.2
|
|
655.1
|
|
704.0
|
|
2,729.0
|
|
||||||||||
|
Income from operations before income tax
|
116.9
|
|
66.2
|
|
100.5
|
|
(74.1
|
)
|
209.5
|
|
||||||||||
|
Income tax (expense)/benefit
|
(2.5
|
)
|
(1.3
|
)
|
(4.9
|
)
|
2.6
|
|
(6.1
|
)
|
||||||||||
|
Net income
|
$
|
114.4
|
|
$
|
64.9
|
|
$
|
95.6
|
|
$
|
(71.5
|
)
|
$
|
203.4
|
|
|||||
|
Per Share Data
|
||||||||||||||||||||
|
Weighted average number of ordinary share and share equivalents
(1)
|
||||||||||||||||||||
|
Basic
|
60,867,815
|
|
60,705,028
|
|
60,225,705
|
|
60,152,420
|
|
60,478,740
|
|
||||||||||
|
Diluted
|
62,483,938
|
|
62,192,142
|
|
61,577,018
|
|
60,152,420
|
|
61,860,689
|
|
||||||||||
|
Basic earnings/(loss) per ordinary share adjusted for preference share dividends
|
$
|
1.73
|
|
$
|
0.91
|
|
$
|
1.43
|
|
$
|
(1.41
|
)
|
$
|
2.67
|
|
|||||
|
Diluted earnings/(loss) per ordinary share adjusted for preference share dividends
|
$
|
1.68
|
|
$
|
0.89
|
|
$
|
1.40
|
|
$
|
(1.41
|
)
|
$
|
2.61
|
|
|||||
_______________
(1)
The basic and diluted number of ordinary shares for the three months ended December 31, 2016 is the same, as the inclusion of dilutive securities in a loss-making period would be anti-dilutive.
F-73
INDEX OF FINANCIAL STATEMENT SCHEDULES
S-1
ASPEN INSURANCE HOLDINGS LIMITED
SCHEDULE I - INVESTMENTS
For the Twelve Months Ended
December 31, 2018
,
2017
and
2016
The Company’s investments comprise investments in subsidiaries.
S-2
ASPEN INSURANCE HOLDINGS LIMITED
SCHEDULE II - CONDENSED FINANCIAL INFORMATION OF REGISTRANT
BALANCE SHEETS
As at
December 31, 2018
and
2017
|
|
As at December 31, 2018
|
As at December 31, 2017
|
||||||
|
|
($ in millions, except per share amounts)
|
|||||||
|
ASSETS
|
|
|||||||
|
Short-term investments (available for sale)
|
$
|
—
|
|
$
|
—
|
|
||
|
Fixed income maturities (trading)
|
—
|
|
79.4
|
|
||||
|
Cash and cash equivalents
|
55.6
|
|
32.0
|
|
||||
|
Investments in subsidiaries
(1)
|
3,178.7
|
|
3,394.7
|
|
||||
|
Other investments (equity method)
|
3.7
|
|
3.4
|
|
||||
|
Eurobond issued by subsidiary
|
—
|
|
—
|
|
||||
|
Long-term debt issued by Silverton
|
1.1
|
|
20.6
|
|
||||
|
Intercompany funds due from affiliates
|
—
|
|
5.2
|
|
||||
|
Other assets
|
9.0
|
|
8.8
|
|
||||
|
Total assets
|
$
|
3,248.1
|
|
$
|
3,544.1
|
|
||
|
LIABILITIES
|
|
|
|
|
||||
|
Accrued expenses and other payables
|
47.3
|
|
4.7
|
|
||||
|
Intercompany funds due to affiliates
|
120.1
|
|
61.4
|
|
||||
|
Long-term debt
|
424.7
|
|
549.5
|
|
||||
|
Total liabilities
|
$
|
592.1
|
|
$
|
615.6
|
|
||
|
SHAREHOLDERS’ EQUITY
|
|
|
|
|
||||
|
Ordinary Shares:
|
||||||||
|
59,743,156 shares of par value 0.15144558¢ each
(December 31, 2017 — 59,474,085) |
$
|
0.1
|
|
$
|
0.1
|
|
||
|
Preference Shares:
|
||||||||
|
11,000,000 5.950% shares of par value 0.15144558¢ each
(December 31, 2017 — 11,000,000) |
—
|
|
—
|
|
||||
|
10,000,000 5.625% shares of par value 0.15144558¢ each
(December 31, 2017 — 10,000,000) |
—
|
|
—
|
|
||||
|
Additional paid in capital
|
967.5
|
|
954.7
|
|
||||
|
Retained earnings
|
1,806.6
|
|
2,026.9
|
|
||||
|
Non-controlling interest
|
3.7
|
|
2.7
|
|
||||
|
Accumulated other comprehensive income, net of taxes:
|
|
|
|
|
||||
|
Unrealized gains on investments
|
(66.8
|
)
|
9.7
|
|
||||
|
Gain/(loss) on derivatives
|
0.3
|
|
2.1
|
|
||||
|
Gains on foreign currency translation
|
(55.4
|
)
|
(67.7
|
)
|
||||
|
Total accumulated other comprehensive (loss)/income
|
(121.9
|
)
|
(55.9
|
)
|
||||
|
Total shareholders’ equity
|
2,656.0
|
|
2,928.5
|
|
||||
|
Total liabilities and shareholders’ equity
|
$
|
3,248.1
|
|
$
|
3,544.1
|
|
||
____________________
|
(1)
|
The Company’s investment in subsidiaries are accounted for under the equity method and adjustments to the carrying value of these investments are made based on the Company’s share of capital, including share of income and expenses. Changes in the value were recognized in realized and unrealized investment gains and losses in the statement of operations.
|
S-3
ASPEN INSURANCE HOLDINGS LIMITED
SCHEDULE II - CONDENSED FINANCIAL INFORMATION OF REGISTRANT - Continued
STATEMENTS OF OPERATIONS AND COMPREHENSIVE INCOME
For the
Twelve Months Ended December 31, 2018
,
2017
and
2016
|
|
Twelve Months Ended December 31, 2018
|
Twelve Months Ended December 31, 2017
|
Twelve Months Ended December 31, 2016
|
|||||||||
|
|
($ in millions)
|
|||||||||||
|
Operating Activities:
|
|
|||||||||||
|
Equity in net earnings of subsidiaries and other investments, equity method
|
$
|
(371.3
|
)
|
$
|
(590.7
|
)
|
$
|
(85.2
|
)
|
|||
|
Dividend income
|
340.3
|
|
373.6
|
|
331.3
|
|
||||||
|
Interest income on Eurobond
|
—
|
|
18.7
|
|
21.1
|
|
||||||
|
Net realized and unrealized investment gains/(losses)
|
(5.1
|
)
|
(2.3
|
)
|
3.8
|
|
||||||
|
Other income
|
—
|
|
—
|
|
—
|
|
||||||
|
Total revenues
|
(36.1
|
)
|
(200.7
|
)
|
271.0
|
|
||||||
|
Expenses:
|
|
|
|
|
|
|
||||||
|
General, administrative and corporate expenses
|
(83.8
|
)
|
(36.2
|
)
|
(38.1
|
)
|
||||||
|
Interest expense
|
(25.9
|
)
|
(29.5
|
)
|
(29.5
|
)
|
||||||
|
Income from operations before income tax
|
(145.8
|
)
|
(266.4
|
)
|
203.4
|
|
||||||
|
Income tax
|
—
|
|
—
|
|
—
|
|
||||||
|
Net income
|
(145.8
|
)
|
(266.4
|
)
|
203.4
|
|
||||||
|
Amount attributable to non-controlling interest
|
(1.0
|
)
|
(1.3
|
)
|
(0.1
|
)
|
||||||
|
Net (loss)/income attributable to Aspen Insurance Holdings Limited ordinary shareholders
|
(146.8
|
)
|
(267.7
|
)
|
203.3
|
|
||||||
|
Other comprehensive (loss)/income, net of taxes:
|
|
|
|
|
|
|
||||||
|
Change in unrealized gains on investments
|
(76.5
|
)
|
(12.8
|
)
|
(37.7
|
)
|
||||||
|
Net change from current period hedged transactions
|
(1.8
|
)
|
2.6
|
|
0.7
|
|
||||||
|
Change in foreign currency translation adjustment
|
12.3
|
|
(40.6
|
)
|
(27.7
|
)
|
||||||
|
Other comprehensive (loss)/income, net of tax
|
(66.0
|
)
|
(50.8
|
)
|
(64.7
|
)
|
||||||
|
Comprehensive (loss)/income
|
$
|
(212.8
|
)
|
$
|
(318.5
|
)
|
$
|
138.6
|
|
|||
S-4
ASPEN INSURANCE HOLDINGS LIMITED
SCHEDULE II - CONDENSED FINANCIAL INFORMATION OF REGISTRANT - Continued
STATEMENTS OF CASH FLOWS
For the
Twelve Months Ended December 31, 2018
,
2017
and
2016
|
|
Twelve Months Ended December 31, 2018
|
Twelve Months Ended December 31, 2017
|
Twelve Months Ended December 31, 2016
|
|||||||||
|
|
($ in millions)
|
|||||||||||
|
Cash Flows From/(Used In) Operating Activities:
|
|
|
|
|||||||||
|
Net income
(1)
(excluding equity in net earnings of subsidiaries)
|
$
|
224.5
|
|
$
|
323.0
|
|
$
|
289.3
|
|
|||
|
Adjustments:
|
|
|
|
|
|
|
||||||
|
Share-based compensation expenses
|
10.1
|
|
9.8
|
|
15.5
|
|
||||||
|
Realized and unrealized losses/(gains)
|
(0.7
|
)
|
(2.0
|
)
|
(3.2
|
)
|
||||||
|
Loss on derivative contracts
|
1.8
|
|
(2.6
|
)
|
0.5
|
|
||||||
|
Change in other receivables
|
—
|
|
—
|
|
—
|
|
||||||
|
Change in other assets
|
(0.2
|
)
|
(0.2
|
)
|
0.4
|
|
||||||
|
Change in accrued expenses and other payables
|
51.1
|
|
7.0
|
|
(9.3
|
)
|
||||||
|
Change in intercompany activities
|
63.9
|
|
(27.5
|
)
|
(40.7
|
)
|
||||||
|
Net cash generated by operating activities
|
350.5
|
|
307.5
|
|
252.5
|
|
||||||
|
Cash Flows From/(Used in) Investing Activities:
|
|
|
|
|
|
|
||||||
|
Proceeds/(purchases) of short term investments
|
—
|
|
25.1
|
|
(0.1
|
)
|
||||||
|
Proceeds/(purchases) of fixed income securities
|
79.4
|
|
66.3
|
|
(145.7
|
)
|
||||||
|
Investment in subsidiaries
|
(215.9
|
)
|
(111.9
|
)
|
(126.1
|
)
|
||||||
|
Investment in long-term debt issued by Silverton
|
—
|
|
—
|
|
(25.0
|
)
|
||||||
|
Repayment of loan notes issued by Silverton
|
18.6
|
|
13.5
|
|
19.2
|
|
||||||
|
Investment in Micro-insurance
|
—
|
|
(0.1
|
)
|
—
|
|
||||||
|
Investment in Bene
|
—
|
|
—
|
|
(3.3
|
)
|
||||||
|
Net proceeds from other investments, equity method
|
—
|
|
—
|
|
—
|
|
||||||
|
Net cash (used in) investing activities
|
(117.9
|
)
|
(7.1
|
)
|
(281.0
|
)
|
||||||
|
Cash Flows From/(Used in) Financing Activities:
|
|
|
|
|
|
|
||||||
|
Proceeds from issuance of ordinary shares, net of issuance costs
|
2.7
|
|
0.5
|
|
2.5
|
|
||||||
|
Proceeds from issuance of preference shares, net of issuance costs
|
—
|
|
—
|
|
241.3
|
|
||||||
|
Preference shares redeemed
|
—
|
|
(293.2
|
)
|
—
|
|
||||||
|
Ordinary share repurchase
|
—
|
|
(30.0
|
)
|
(75.0
|
)
|
||||||
|
Long term debt redemption
|
(125.0
|
)
|
—
|
|
—
|
|
||||||
|
Ordinary and preference share dividends paid
|
(73.4
|
)
|
(92.4
|
)
|
(94.5
|
)
|
||||||
|
Proceeds from maturity of Eurobond
|
—
|
|
—
|
|
—
|
|
||||||
|
Eurobond purchased from subsidiary
|
—
|
|
—
|
|
—
|
|
||||||
|
Make-whole payment
|
(8.6
|
)
|
—
|
|
—
|
|
||||||
|
Cash paid for tax withholding purposes
|
(4.7
|
)
|
(9.6
|
)
|
—
|
|
||||||
|
Net cash (used in)/from financing activities
|
(209.0
|
)
|
(424.7
|
)
|
74.3
|
|
||||||
|
Increase/(decrease) in cash and cash equivalents
|
23.6
|
|
(124.3
|
)
|
45.8
|
|
||||||
|
Cash and cash equivalents — beginning of period
|
32.0
|
|
156.3
|
|
110.5
|
|
||||||
|
Cash and cash equivalents — end of period
|
$
|
55.6
|
|
$
|
32.0
|
|
$
|
156.3
|
|
|||
_________
(1)
Net income has been adjusted for the proportion due to non-controlling interest.
S-5
ASPEN INSURANCE HOLDINGS LIMITED
SCHEDULE III - SUPPLEMENTARY INSURANCE INFORMATION
For the
Twelve Months Ended December 31, 2018
,
2017
and
2016
Supplementary Information
($ in millions)
|
Year Ended December 31, 2018
|
Deferred
Policy
Acquisition
Costs
|
Net
Reserves
for Losses
and LAE
|
Net
Reserves
for
Unearned
Premiums
|
Net
Premiums
Earned
|
Net
Investment
Income
|
Losses and
LAE
Expenses
|
Policy
Acquisition
Expenses
|
Net
Premium
Written
|
General
and
Administrative
Expenses
|
|||||||||||||||||||||||||||
|
Reinsurance
|
$
|
208.3
|
|
$
|
2,843.6
|
|
$
|
616.0
|
|
$
|
1,256.4
|
|
|
|
$
|
927.0
|
|
$
|
260.9
|
|
$
|
1,182.9
|
|
$
|
118.5
|
|
||||||||||
|
Insurance
|
40.2
|
|
2,153.0
|
|
534.3
|
|
958.3
|
|
|
|
646.0
|
|
110.7
|
|
899.1
|
|
239.2
|
|
||||||||||||||||||
|
Total
|
$
|
248.5
|
|
$
|
4,996.6
|
|
$
|
1,150.3
|
|
$
|
2,214.7
|
|
$
|
198.2
|
|
$
|
1,573.0
|
|
$
|
371.6
|
|
$
|
2,082.0
|
|
$
|
357.7
|
|
|||||||||
|
Year to date December 31, 2017
|
Deferred
Policy
Acquisition
Costs
|
Net
Reserves
for Losses
and LAE
|
Net
Reserves
for
Unearned
Premiums
|
Net
Premiums Earned |
Net
Investment
Income
|
Losses and
LAE
Expenses
|
Policy
Acquisition
Expenses
|
Net
Premium
Written
|
General
and
Administrative
Expenses
|
|||||||||||||||||||||||||||
|
Reinsurance
|
$
|
263.0
|
|
$
|
2,917.1
|
|
$
|
1,067.3
|
|
$
|
1,206.1
|
|
$
|
1,116.4
|
|
$
|
235.5
|
|
$
|
1,250.0
|
|
$
|
157.3
|
|
||||||||||||
|
Insurance
|
31.3
|
|
2,317.2
|
|
268.0
|
|
1,100.5
|
|
878.3
|
|
165.0
|
|
962.5
|
|
253.9
|
|
||||||||||||||||||||
|
Total
|
$
|
294.3
|
|
$
|
5,234.3
|
|
$
|
1,335.3
|
|
$
|
2,306.6
|
|
$
|
189.0
|
|
$
|
1,994.7
|
|
$
|
400.5
|
|
$
|
2,212.5
|
|
$
|
411.2
|
|
|||||||||
|
Year to date December 31, 2016
|
Deferred
Policy
Acquisition
Costs
|
Net
Reserves
for Losses
and LAE
|
Net
Reserves
for
Unearned
Premiums
|
Net
Premiums
Earned
|
Net
Investment
Income
|
Losses and
LAE
Expenses
|
Policy
Acquisition
Expenses
|
Net
Premium
Written
|
General
and
Administrative
Expenses
|
|||||||||||||||||||||||||||
|
Reinsurance
|
$
|
239.6
|
|
$
|
2,462.1
|
|
$
|
813.3
|
|
$
|
1,181.9
|
|
|
|
$
|
657.9
|
|
$
|
226.4
|
|
$
|
1,269.2
|
|
$
|
178.2
|
|
||||||||||
|
Insurance
|
118.8
|
|
2,297.1
|
|
550.1
|
|
1,455.4
|
|
|
|
918.2
|
|
302.5
|
|
1,324.5
|
|
228.4
|
|
||||||||||||||||||
|
Total
|
$
|
358.4
|
|
$
|
4,759.2
|
|
$
|
1,363.4
|
|
$
|
2,637.3
|
|
$
|
187.1
|
|
$
|
1,576.1
|
|
$
|
528.9
|
|
$
|
2,593.7
|
|
$
|
406.6
|
|
|||||||||
S-6
ASPEN INSURANCE HOLDINGS LIMITED
SCHEDULE IV - REINSURANCE
For the
Twelve Months Ended December 31, 2018
,
2017
and
2016
Premiums Written
|
|
Direct
|
Assumed
|
Ceded
|
Net Amount
|
||||||||||||
|
|
($ in millions)
|
|||||||||||||||
|
2018
|
$
|
1,951.2
|
|
$
|
1,495.7
|
|
$
|
(1,364.9
|
)
|
$
|
2,082.0
|
|
||||
|
2017
|
$
|
1,812.4
|
|
$
|
1,548.5
|
|
$
|
(1,148.4
|
)
|
$
|
2,212.5
|
|
||||
|
2016
|
$
|
1,733.8
|
|
$
|
1,413.2
|
|
$
|
(553.3
|
)
|
$
|
2,593.7
|
|
||||
Premiums Earned
|
|
Gross Amount
|
Ceded to Other
Companies
|
Assumed From
Other
Companies
|
Net Amount
|
Percentage of
Amount
Assumed
to Net
|
||||||||||||||
|
|
($ in millions, except for percentages)
|
||||||||||||||||||
|
2018
|
$
|
1,940.5
|
|
$
|
(1,319.7
|
)
|
$
|
1,593.9
|
|
$
|
2,214.7
|
|
72.0
|
%
|
|||||
|
2017
|
$
|
1,757.4
|
|
$
|
(902.6
|
)
|
$
|
1,451.8
|
|
$
|
2,306.6
|
|
62.9
|
%
|
|||||
|
2016
|
$
|
1,768.4
|
|
$
|
(449.0
|
)
|
$
|
1,317.9
|
|
$
|
2,637.3
|
|
50.0
|
%
|
|||||
S-7
ASPEN INSURANCE HOLDINGS LIMITED
SCHEDULE V - VALUATION AND QUALIFYING ACCOUNTS
For the
Twelve Months Ended December 31, 2018
,
2017
and
2016
The following table shows the movement in the Company’s bad debt provision during
the twelve months ended
December 31,
2018
,
2017
and
2016
:
|
|
Balance at
Beginning of
Year
|
Charged to
Costs and
Expenses
|
Charged to
Other
Accounts
|
Deductions
|
Balance at
End of Year
|
|||||||||||||||
|
Provisions for Bad Debt
|
($ in millions)
|
|||||||||||||||||||
|
2018
|
|
|
|
|
|
|||||||||||||||
|
Premiums receivable from underwriting activities
|
$
|
5.2
|
|
$
|
11.0
|
|
$
|
—
|
|
$
|
—
|
|
$
|
16.2
|
|
|||||
|
Reinsurance
|
$
|
—
|
|
$
|
—
|
|
$
|
—
|
|
$
|
—
|
|
$
|
—
|
|
|||||
|
2017
|
|
|
|
|
|
|
|
|
|
|
||||||||||
|
Premiums receivable from underwriting activities
|
$
|
5.0
|
|
$
|
0.2
|
|
$
|
—
|
|
$
|
—
|
|
$
|
5.2
|
|
|||||
|
Reinsurance
|
$
|
—
|
|
$
|
—
|
|
$
|
—
|
|
$
|
—
|
|
$
|
—
|
|
|||||
|
2016
|
|
|
|
|
|
|
|
|
|
|
||||||||||
|
Premiums receivable from underwriting activities
|
$
|
2.6
|
|
$
|
2.4
|
|
$
|
—
|
|
$
|
—
|
|
$
|
5.0
|
|
|||||
|
Reinsurance
|
$
|
—
|
|
$
|
—
|
|
$
|
—
|
|
$
|
—
|
|
$
|
—
|
|
|||||
S-8
TABLE OF CONTENTS
Part IItem 1. BusinessItem 1A. Risk FactorsItem 1B. Unresolved Staff CommentsItem 2. PropertiesItem 3. Legal ProceedingsItem 4. Mine Safety DisclosuresPart IIItem 5. Market For The Registrant S Common Equity, Related Stockholder Matters and Issuer Purchases Of Equity SecuritiesItem 6. Selected Financial DataItem 7. Management S Discussion and Analysis Of Financial Condition and Results Of OperationsItem 7A. Quantitative and Qualitative Disclosures About Market RiskItem 8. Financial Statements and Supplementary DataItem 9. Changes in and Disagreements with Accountants on Accounting and Financial DisclosureItem 9A. Controls and ProceduresItem 9B. Other InformationPart IIIItem 10. Directors, Executive Officers and Corporate GovernanceItem 11. Executive CompensationItem 12. Security Ownership Of Certain Beneficial Owners and Management and Related Stockholder MattersItem 13. Certain Relationships and Related Transactions, and Director IndependenceItem 14. Principal Accounting Fees and ServicesPart IVItem 15. Exhibits, Financial Statement SchedulesItem 16. Form 10-k Summary