ASHFORD HOSPITALITY TRUST INC
10-Ks and 10-Qs
|
|
|
|
|
|
|
|
|
|
|
|
|
|
|
|
|
|
|
|
|
|
|
|
|
|
|
|
|
|
|
|
|
|
|
|
|
|
|
|
|
|
|
|
|
|
|
|
|
|
|
|
|
|
|
|
|
|
|
UNITED STATES
SECURITIES AND EXCHANGE COMMISSION
WASHINGTON, D.C. 20549
FORM 10-K
|
þ
|
ANNUAL REPORT PURSUANT TO SECTION 13 OR 15(d) OF THE SECURITIES EXCHANGE ACT OF 1934
|
For the fiscal year ended
December 31, 2017
OR
|
¨
|
TRANSITION REPORT PURSUANT TO SECTION 13 OR 15(d) OF THE SECURITIES EXCHANGE ACT OF 1934
|
For the transition period from
to
Commission file number: 001-31775
ASHFORD HOSPITALITY TRUST, INC.
(Exact name of registrant as specified in its charter)
|
Maryland
|
86-1062192
|
|
|
(State or other jurisdiction of incorporation or organization)
|
(IRS employer identification number)
|
|
|
14185 Dallas Parkway, Suite 1100
Dallas, Texas
|
75254
|
|
|
(Address of principal executive offices)
|
(Zip code)
|
|
(972) 490-9600
(Registrant’s telephone number, including area code)
Securities registered pursuant to Section 12(b) of the Act:
|
Title of each class
|
Name of each exchange on which registered
|
|
|
Common Stock
|
New York Stock Exchange
|
|
|
Preferred Stock, Series D
|
New York Stock Exchange
|
|
|
Preferred Stock, Series F
|
New York Stock Exchange
|
|
|
Preferred Stock, Series G
|
New York Stock Exchange
|
|
|
Preferred Stock, Series H
|
New York Stock Exchange
|
|
|
Preferred Stock, Series I
|
New York Stock Exchange
|
|
Securities registered pursuant to Section 12(g) of the Act:
None
Indicate by check mark if the registrant is a well-known seasoned issuer, as defined in Rule 405 of the Securities Act.
þ
Yes
¨
No
Indicate by check mark if the registrant is not required to file reports pursuant to Section 13 or Section 15(d) of the Act.
¨
Yes
þ
No
Indicate by check mark whether the registrant (1) has filed all reports required to be filed by Section 13 or 15(d) of the Securities Exchange Act of 1934 during the preceding 12 months (or for such shorter period that the registrant was required to file such reports), and (2) has been subject to such filing requirements for the past 90 days.
þ
Yes
¨
No
Indicate by check mark whether the registrant has submitted electronically and posted on its corporate Web site, if any, every Interactive Data File required to be submitted and posted pursuant to Rule 405 of Regulation S-T (§232.405 of this chapter) during the preceding 12 months (or for such shorter period that the registrant was required to submit and post such files)
þ
Yes
¨
No
Indicate by check mark if disclosure of delinquent filers pursuant to Item 405 of Regulation S-K (§229.405 of this chapter) is not contained herein, and will not be contained, to the best of registrant’s knowledge, in definitive proxy or information statements incorporated by reference in Part III of this Form 10-K or any amendment to this Form 10-K.
¨
Indicate by check mark whether the registrant is a large accelerated filer, an accelerated filer, a non-accelerated filer, a smaller reporting company, or an emerging growth company. See the definitions of “large accelerated filer,” “accelerated filer,” “small reporting company,” and “emerging growth company” in Rule 12b-2 of the Exchange Act.
|
Large accelerated filer
|
o
|
Accelerated filer
|
þ
|
|
|
Non-accelerated filer
|
o
|
(Do not check if a smaller reporting company)
|
Smaller reporting company
|
o
|
|
Emerging growth company
|
o
|
|||
If an emerging growth company, indicate by check mark if the registrant has elected not to use the extended transition period for complying with any new or revised financial accounting standards provided pursuant to Section 13(a) if the Exchange Act. ¨
Indicate by check mark whether the registrant is a shell company (as defined in Rule 12b-2 of the Exchange Act).
¨
Yes
þ
No
As of
June 30, 2017
, the aggregate market value of
91,538,835
shares of the registrant’s common stock held by non-affiliates was approximately
$556,556,000
.
As of
March 12, 2018
, the registrant had
97,379,879
shares of common stock issued and outstanding.
DOCUMENTS INCORPORATED BY REFERENCE
Portions of the registrant’s definitive Proxy Statement pertaining to the
2018
Annual Meeting of Stockholders are incorporated herein by reference into Part III of this Form 10-K.
ASHFORD HOSPITALITY TRUST, INC.
YEAR ENDED DECEMBER 31,
2017
INDEX TO FORM 10-K
|
Page
|
||
|
PART I
|
||
|
Item 1.
|
||
|
Item 1A.
|
||
|
Item 1B.
|
||
|
Item 2.
|
||
|
Item 3.
|
||
|
Item 4.
|
||
|
PART II
|
||
|
Item 5.
|
||
|
Item 6.
|
||
|
Item 7.
|
||
|
Item 7A.
|
||
|
Item 8.
|
||
|
Item 9.
|
||
|
Item 9A.
|
||
|
Item 9B.
|
||
|
PART III
|
||
|
Item 10.
|
||
|
Item 11.
|
||
|
Item 12.
|
||
|
Item 13.
|
||
|
Item 14.
|
||
|
PART IV
|
||
|
Item 15.
|
||
|
Item 16.
|
||
This Annual Report is filed by Ashford Hospitality Trust, Inc., a Maryland corporation (the “Company”). Unless the context otherwise requires, all references to the Company include those entities owned or controlled by the Company. In this report, the terms “the Company,” “Ashford Trust,” “we,” “us” or “our” mean Ashford Hospitality Trust, Inc. and all entities included in its consolidated financial statements.
FORWARD-LOOKING STATEMENTS
Throughout this Form 10-K and documents incorporated herein by reference, we make forward-looking statements that are subject to risks and uncertainties. These forward-looking statements include information about possible, estimated or assumed future results of our business, financial condition and liquidity, results of operations, plans, and objectives. Statements regarding the following subjects are forward-looking by their nature:
|
•
|
our business and investment strategy, including our ability to complete proposed business transactions described herein or the expected benefit of any such transactions;
|
|
•
|
anticipated or expected purchases or sales of assets;
|
|
•
|
our projected operating results;
|
|
•
|
completion of any pending transactions;
|
|
•
|
our ability to obtain future financing arrangements;
|
|
•
|
our understanding of our competition;
|
|
•
|
market trends;
|
|
•
|
projected capital expenditures; and
|
|
•
|
the impact of technology on our operations and business.
|
Such forward-looking statements are based on our beliefs, assumptions, and expectations of our future performance taking into account all information currently known to us. These beliefs, assumptions, and expectations can change as a result of many potential events or factors, not all of which are known to us. If a change occurs, our business, financial condition, liquidity, results of operations, plans, and other objectives may vary materially from those expressed in our forward-looking statements. Additionally, the following factors could cause actual results to vary from our forward-looking statements:
|
•
|
factors discussed in this Form 10-K, including those set forth under the sections titled “Risk Factors,” “Management’s Discussion and Analysis of Financial Condition and Results of Operations,” “Business,” and “Properties;”
|
|
•
|
general volatility of the capital markets and the market price of our common and preferred stock;
|
|
•
|
changes in our business or investment strategy;
|
|
•
|
availability, terms, and deployment of capital;
|
|
•
|
availability of qualified personnel;
|
|
•
|
changes in our industry and the market in which we operate, interest rates, or local economic conditions;
|
|
•
|
the degree and nature of our competition;
|
|
•
|
actual and potential conflicts of interest with our advisor, Remington Lodging & Hospitality, LLC, our executive officers and our non-independent directors;
|
|
•
|
changes in governmental regulations, accounting rules, tax rates and similar matters;
|
|
•
|
legislative and regulatory changes, including changes to the Internal Revenue Code of 1986, as amended (the “Internal Revenue Code”), and related rules, regulations and interpretations governing the taxation of REITs; and
|
|
•
|
limitations imposed on our business and our ability to satisfy complex rules in order for us to qualify as a REIT for federal income tax purposes.
|
When we use words or phrases such as “will likely result,” “may,” “anticipate,” “estimate,” “should,” “expect,” “believe,” “intend,” or similar expressions, we intend to identify forward-looking statements. You should not place undue reliance on these forward-looking statements. We are not obligated to publicly update or revise any forward-looking statements, whether as a result of new information, future events, or otherwise.
2
|
Item 1.
|
Business
|
GENERAL
Ashford Hospitality Trust, Inc., together with its subsidiaries, is an externally-advised real estate investment trust (“REIT”) focused on investing opportunistically in the hospitality industry with a focus predominantly on full-service upscale and upper upscale hotels in the U.S. that have a revenue per available room (“RevPAR”) generally less than two times the U.S. national average. Additional information can be found on our website at www.ahtreit.com. We were formed as a Maryland corporation in May 2003 and commenced operations in August 2003, as a self-advised REIT. In November 2014, we completed the spin-off of our asset management business, forming Ashford Inc. as a separate publicly traded company, and we became advised by Ashford Hospitality Advisors LLC (“Ashford LLC”), a subsidiary of Ashford Inc. We continue to own our lodging investments and conduct our business through Ashford Hospitality Limited Partnership (“Ashford Trust OP”), our operating partnership. Ashford OP General Partner LLC, a wholly-owned subsidiary of the Company, serves as the sole general partner of our operating partnership.
We are advised by Ashford LLC through an advisory agreement. All of the hotel properties in our portfolio are currently asset-managed by Ashford LLC.
We do not have any employees. All of the services that might be provided by employees are provided to us by Ashford LLC.
Our hotel properties are primarily branded under the widely recognized upscale and upper upscale brands of Hilton, Hyatt, Marriott and Intercontinental Hotels Group. Currently, all of our hotel properties are located in the United States. As of
December 31, 2017
, we owned interests in the following:
|
•
|
120
consolidated hotel properties, including
118
(two which are held for sale) directly owned and
two
owned through a majority-owned investment in a consolidated entity, which represent
25,058
total rooms (or
25,031
net rooms excluding those attributable to our partner);
|
|
•
|
89
hotel condominium units at WorldQuest Resort in Orlando, Florida;
|
|
•
|
a
28.6%
ownership in Ashford Inc. common stock with a carrying value of
$437,000
and a fair value of
$55.6 million
; and
|
|
•
|
a
16.2%
ownership in OpenKey with a carrying value of
$2.5 million
.
|
For federal income tax purposes, we have elected to be treated as a REIT, which imposes limitations related to operating hotels. As of
December 31, 2017
, all of our
120
hotel properties were leased or owned by our wholly-owned and majority-owned subsidiaries that are treated as taxable REIT subsidiaries for federal income tax purposes (collectively, these subsidiaries are referred to as “Ashford TRS”). Ashford TRS then engages eligible independent contractors to operate the hotel properties under management contracts. Hotel operating results related to these properties are included in the consolidated statements of operations.
We do not operate any of our hotel properties directly; instead we employ hotel management companies to operate them for us under management contracts. Remington Lodging & Hospitality, LLC, together with its affiliates (“Remington Lodging”), is one of our property managers, and is beneficially wholly-owned by Mr. Monty J. Bennett, our Chairman, and Mr. Archie Bennett, Jr., our Chairman Emeritus. As of
December 31, 2017
, Remington Lodging managed
82
of our
120
hotel properties and the WorldQuest Resort.
BUSINESS STRATEGIES
Based on our primary business objectives and forecasted operating conditions, our current key priorities and financial strategies include, among other things:
|
•
|
acquisition of hotel properties that will be accretive to our portfolio;
|
|
•
|
disposition of non-core hotel properties;
|
|
•
|
pursuing capital market activities to enhance long-term stockholder value;
|
|
•
|
preserving capital, enhancing liquidity, and continuing current cost saving measures;
|
|
•
|
implementing selective capital improvements designed to increase profitability and to maintain the quality of our assets;
|
|
•
|
implementing effective asset management strategies to minimize operating costs and increase revenues;
|
|
•
|
financing or refinancing hotels on competitive terms;
|
|
•
|
utilizing hedges and derivatives to mitigate risks; and
|
|
•
|
making other investments or divestitures that our board of directors deems appropriate.
|
3
Our current investment strategy is to focus on owning predominantly full-service hotels in the upscale and upper upscale segments in domestic and international markets that have RevPAR generally less than twice the national average. We believe that as supply, demand, and capital market cycles change, we will be able to shift our investment strategy to take advantage of new lodging-related investment opportunities as they may develop. Our board of directors may change our investment strategy at any time without stockholder approval or notice.
While our current investment strategy is focused on direct hotel investments, as the business cycle changes and the hotel markets continue to improve, we may invest in a variety of lodging-related assets based upon our evaluation of diverse market conditions including our cost of capital and the expected returns from those investments. Our investments may include: (i) direct hotel investments; (ii) mezzanine financing through origination or acquisition; (iii) first-lien mortgage financing through origination or acquisition; (iv) sale-leaseback transactions; and (v) other hospitality transactions.
Our strategy is designed to take advantage of lodging industry conditions and adjust to changes in market circumstances over time. Our assessment of market conditions will determine asset reallocation strategies. While we seek to capitalize on favorable market fundamentals, conditions beyond our control may have an impact on overall profitability and our investment returns. We will continue to seek ways to benefit from the cyclical nature of the hotel industry.
Our strategy of combining lodging-related equity and debt investments seeks, among other things, to:
|
•
|
capitalize on both current yield and price appreciation, while simultaneously offering diversification of types of assets within the hospitality industry; and
|
|
•
|
vary investments across an array of hospitality assets to take advantage of market cycles for each asset class.
|
To take full advantage of future investment opportunities in the lodging industry, we intend to invest according to the asset allocation strategies described below. However, due to ongoing changes in market conditions, we will continually evaluate the appropriateness of our investment strategies. Our board of directors may change any or all of these strategies at any time without stockholder approval or notice.
Direct Hotel Investments
—In selecting hotels to acquire, we target hotels that offer either a high current return or the opportunity to increase in value through repositioning, capital investments, market-based recovery, or improved management practices. Our direct hotel acquisition strategy primarily targets full-service upscale and upper upscale hotels with RevPAR less than twice the national average in primary, secondary, and resort markets, typically throughout the United States and will seek to achieve both current income and appreciation. In addition, we will continue to assess our existing hotel portfolio and make strategic decisions to sell certain under-performing or non-strategic hotels that do not fit our investment strategy or criteria due to micro or macro market changes or other reasons.
Mezzanine Financing
—Subordinated loans, or mezzanine loans, that we acquire or originate may relate to a diverse segment of hotels that are located across the U.S. These mezzanine loans are secured by junior mortgages on hotels or pledges of equity interests in entities owning hotels. As the global economic environment improves and the hotel industry stabilizes, we may refocus our efforts on the acquisition or origination of mezzanine loans. Given the greater repayment risks of these types of loans, to the extent we acquire or originate them in the future, we will have a more conservative approach in underwriting these assets. Mezzanine loans that we acquire in the future may be secured by individual assets as well as cross-collateralized portfolios of assets.
First Mortgage Financing
—From time to time, we may acquire or originate first mortgages. As the dynamics in the capital markets and the hotel industry make first-mortgage investments more attractive, we may acquire, potentially at a discount to par, or originate loans secured by first priority mortgages on hotels. We may be subject to certain state-imposed licensing regulations related to commercial mortgage lenders, with which we intend to comply. However, because we are not a bank or a federally chartered lending institution, we are not subject to state and federal regulatory constraints imposed on such entities.
Sale-Leaseback Transactions
—To date, we have not participated in any sale-leaseback transactions. However, if the lodging industry fundamentals shift such that sale-leaseback transactions become more attractive investments, we may purchase hotels and lease them back to their existing hotel owners.
Other Transactions
—We may also invest in other lodging related assets or businesses that offer diversification, attractive risk adjusted returns, and/or capital allocation benefits.
BUSINESS SEGMENTS
We currently operate in one business segment within the hotel lodging industry: direct hotel investments. A discussion of our operating segment is incorporated by reference to note 20 to our consolidated financial statements set forth in Part II, Item 8. Financial Statements and Supplementary Data.
4
FINANCING STRATEGY
We utilize debt to increase equity returns. When evaluating our future level of indebtedness and making decisions regarding the incurrence of indebtedness, our board of directors considers a number of factors, including:
|
•
|
our leverage levels across the portfolio;
|
|
•
|
the purchase price of our investments to be acquired with debt financing;
|
|
•
|
impact on financial covenants;
|
|
•
|
cost of debt;
|
|
•
|
loan maturity schedule;
|
|
•
|
the estimated market value of our investments upon refinancing;
|
|
•
|
the ability of particular investments, and our Company as a whole, to generate cash flow to cover expected debt service; and
|
|
•
|
trailing twelve months net operating income of the hotel to be financed.
|
We may incur debt in the form of purchase money obligations to the sellers of properties, publicly or privately placed debt instruments, or financing from banks, institutional investors, or other lenders. Any such indebtedness may be secured or unsecured by mortgages or other interests in our properties. This indebtedness may be recourse, non-recourse, or cross-collateralized. If recourse, such recourse may include our general assets or be limited to the particular investment to which the indebtedness relates. In addition, we may invest in properties or loans subject to existing loans secured by mortgages or similar liens on the properties, or we may refinance properties acquired on a leveraged basis. We may also from time to time receive additional capital from our advisor in the form of key money.
We may use the proceeds from any borrowings for working capital, consistent with industry practice, to:
|
•
|
purchase interests in partnerships or joint ventures;
|
|
•
|
finance the origination or purchase of debt investments; or
|
|
•
|
finance acquisitions, expand, redevelop or improve existing properties, or develop new properties or other uses.
|
In addition, if we do not have sufficient cash available, we may need to borrow to meet taxable income distribution requirements under the Internal Revenue Code. No assurances can be given that we will obtain additional financings or, if we do, what the amount and terms will be. Our failure to obtain future financing under favorable terms could adversely impact our ability to execute our business strategy. In addition, we may selectively pursue debt financing on our individual properties and debt investments.
DISTRIBUTION POLICY
In December
2016
, the board of directors approved our dividend policy for
2017
with an annualized target of $0.48 per share. For the year ended
December 31, 2017
, we declared annual dividends of $0.48 per share. We may incur indebtedness to meet distribution requirements imposed on REITs under the Internal Revenue Code to the extent that working capital and cash flow from our investments are insufficient to fund required distributions. We may elect to pay dividends on our common stock in cash or a combination of cash and shares of securities as permitted under federal income tax laws governing REIT distribution requirements. We may pay dividends in excess of our cash flow.
Distributions are authorized by our board of directors and declared by us based upon a variety of factors deemed relevant by our directors. No assurance can be given that our dividend policy will not change in the future. In December
2017
, the board of directors approved our dividend policy for
2018
and we expect to pay a quarterly dividend of
$0.12
per share during
2018
. The adoption of a dividend policy does not commit our board of directors to declare future dividends or the amount thereof. The board of directors will continue to review our dividend policy on a quarterly basis. Our ability to pay distributions to our stockholders will depend, in part, upon our receipt of distributions from our operating partnership. This, in turn, may depend upon receipt of lease payments with respect to our properties from indirect, wholly-owned subsidiaries of our operating partnership and the management of our properties by our property managers. Distributions to our stockholders are generally taxable to our stockholders as ordinary income. However, since a portion of our investments are equity ownership interests in hotels, which result in depreciation and non-cash charges against our income, a portion of our distributions may constitute a non-taxable return of capital, to the extent of a stockholder’s tax basis in the stock. To the extent that it is consistent with maintaining our REIT status, we may maintain accumulated earnings of Ashford TRS in that entity.
Our charter allows us to issue preferred stock with a preference on distributions, such as our Series D, Series F, Series G, Series H and Series I preferred stock. The partnership agreement of our operating partnership also allows the operating partnership to issue units with a preference on distributions. The issuance of these series of preferred stock and units together with any similar
5
issuance in the future, given the dividend preference on such stock or units, could limit our ability to make a dividend distribution to our common stockholders.
COMPETITION
The hotel industry is highly competitive and the hotels in which we invest are subject to competition from other hotels for guests. Competition is based on a number of factors, most notably convenience of location, availability of rooms, brand affiliation, price, range of services, guest amenities or accommodations offered and quality of customer service. Competition is often specific to the individual markets in which our properties are located and includes competition from existing and new hotels. Increased competition could have a material adverse effect on the occupancy rate, average daily room rate and room revenue per available room of our hotels or may require us to make capital improvements that we otherwise would not have to make, which may result in decreases in our profitability.
Our principal competitors include other hotel operating companies, ownership companies (including hotel REITs) and national and international hotel brands. We face increased competition from providers of less expensive accommodations, such as select-service hotels or independent owner-managed hotels, during periods of economic downturn when leisure and business travelers become more sensitive to room rates. We may also experience competition from alternative types of accommodations such as Airbnb.
EMPLOYEES
We have no employees. Our appointed officers and employees are provided by Ashford Hospitality Advisors LLC (“Ashford LLC”), a subsidiary of Ashford Inc. (collectively, our “advisor”). Services which would otherwise be provided by employees are provided by Ashford LLC and by our executive officers. Ashford LLC has approximately
102
full-time employees. These employees directly or indirectly perform various acquisition, development, asset management, capital markets, accounting, tax, risk management, legal, redevelopment, and corporate management functions pursuant to the terms of our advisory agreement.
ENVIRONMENTAL MATTERS
Under various federal, state, and local laws and regulations, an owner or operator of real estate may be liable for the costs of removal or remediation of certain hazardous or toxic substances on such property. These laws often impose liability without regard to whether the owner knew of, or was responsible for, the presence of hazardous or toxic substances. Furthermore, a person who arranges for the disposal of a hazardous substance or transports a hazardous substance for disposal or treatment from property owned by another may be liable for the costs of removal or remediation of hazardous substances released into the environment at that property. The costs of remediation or removal of such substances may be substantial, and the presence of such substances, or the failure to promptly remediate such substances, may adversely affect the owner’s ability to sell the affected property or to borrow using the affected property as collateral. In connection with the ownership and operation of our properties, we, our operating partnership, or Ashford TRS may be potentially liable for any such costs. In addition, the value of any lodging property loan we originate or acquire would be adversely affected if the underlying property contained hazardous or toxic substances.
Phase I environmental assessments, which are intended to identify potential environmental contamination for which our properties may be responsible, have been obtained on substantially all of our properties. Such Phase I environmental assessments included:
|
•
|
historical reviews of the properties;
|
|
•
|
reviews of certain public records;
|
|
•
|
preliminary investigations of the sites and surrounding properties;
|
|
•
|
screening for the presence of hazardous substances, toxic substances, and underground storage tanks; and
|
|
•
|
the preparation and issuance of a written report.
|
Such Phase I environmental assessments did not include invasive procedures, such as soil sampling or ground water analysis. Such Phase I environmental assessments have not revealed any environmental liability that we believe would have a material adverse effect on our business, assets, results of operations, or liquidity, and we are not aware of any such liability. To the extent Phase I environmental assessments reveal facts that require further investigation, we would perform a Phase II environmental assessment. However, it is possible that these environmental assessments will not reveal all environmental liabilities. There may be material environmental liabilities of which we are unaware, including environmental liabilities that may have arisen since the environmental assessments were completed or updated. No assurances can be given that (i) future laws, ordinances, or regulations will not impose any material environmental liability, or (ii) the current environmental condition of our properties will not be affected by the condition of properties in the vicinity (such as the presence of leaking underground storage tanks) or by third parties unrelated to us.
6
We believe our properties are in compliance in all material respects with all federal, state, and local ordinances and regulations regarding hazardous or toxic substances and other environmental matters. Neither we nor, to our knowledge, any of the former owners of our properties have been notified by any governmental authority of any material noncompliance, liability, or claim relating to hazardous or toxic substances or other environmental matters in connection with any of our properties.
INSURANCE
We maintain comprehensive insurance, including liability, property, workers’ compensation, rental loss, environmental, terrorism, and, when available on commercially reasonable terms, flood, wind and earthquake insurance, with policy specifications, limits, and deductibles customarily carried for similar properties. Certain types of losses (for example, matters of a catastrophic nature such as acts of war or substantial known environmental liabilities) are either uninsurable or require substantial premiums that are not economically feasible to maintain. Certain types of losses, such as those arising from subsidence activity, are insurable only to the extent that certain standard policy exceptions to insurability are waived by agreement with the insurer. We believe, however, that our properties are adequately insured, consistent with industry standards.
FRANCHISE LICENSES
We believe that the public’s perception of quality associated with a franchisor can be an important feature in the operation of a hotel. Franchisors provide a variety of benefits for franchisees, which include national advertising, publicity, and other marketing programs designed to increase brand awareness, training of personnel, continuous review of quality standards, and centralized reservation systems.
As of
December 31, 2017
, we owned interests in
120
hotel properties,
113
of which operated under the following franchise licenses or brand management agreements:
Embassy Suites is a registered trademark of Hilton Hospitality, Inc.
Hilton is a registered trademark of Hilton Hospitality, Inc.
Hilton Garden Inn is a registered trademark of Hilton Hospitality, Inc.
Hampton Inn is a registered trademark of Hilton Hospitality, Inc.
Homewood Suites is a registered trademark of Hilton Hospitality, Inc.
Marriott is a registered trademark of Marriott International, Inc.
SpringHill Suites is a registered trademark of Marriott International, Inc.
Residence Inn by Marriott is a registered trademark of Marriott International, Inc.
Courtyard by Marriott is a registered trademark of Marriott International, Inc.
Fairfield Inn by Marriott is a registered trademark of Marriott International, Inc.
TownePlace Suites is a registered trademark of Marriott International, Inc.
Renaissance is a registered trademark of Marriott International, Inc.
Ritz-Carlton is a registered trademark of Marriott International, Inc.
Hyatt Regency is a registered trademark of Hyatt Hotels Corporation.
Le Meridien is a registered trademark of Marriott International, Inc.
Sheraton is a registered trademark of Marriott International, Inc.
W is a registered trademark of Marriott International, Inc.
Westin is a registered trademark of Marriott International, Inc.
Crowne Plaza is a registered trademark of InterContinental Hotels Group.
Hotel Indigo is a registered trademark of InterContinental Hotels Group.
One Ocean is a registered trademark of Remington Hotels LP.
Our management companies, including Remington Lodging, must operate each hotel pursuant to the terms of the related franchise or brand management agreement and must use their best efforts to maintain the right to operate each hotel pursuant to such terms. In the event of termination of a particular franchise or brand management agreement, our management companies
7
must operate any affected hotels under another franchise or brand management agreement, if any, that we enter into. We anticipate that many of the additional hotels we acquire could be operated under franchise licenses or brand management agreements as well.
Our franchise licenses and brand management agreements generally specify certain management, operational, recordkeeping, accounting, reporting, and marketing standards and procedures with which the franchisee or brand operator must comply, including requirements related to:
|
•
|
training of operational personnel;
|
|
•
|
safety;
|
|
•
|
maintaining specified insurance;
|
|
•
|
types of services and products ancillary to guestroom services that may be provided;
|
|
•
|
display of signage; and
|
|
•
|
type, quality, and age of furniture, fixtures, and equipment included in guestrooms, lobbies, and other common areas.
|
SEASONALITY
Our properties’ operations historically have been seasonal as certain properties maintain higher occupancy rates during the summer months, while certain other properties maintain higher occupancy rates during the winter months. This seasonality pattern can cause fluctuations in our quarterly lease revenue under our percentage leases. We anticipate that our cash flows from the operations of our properties will be sufficient to enable us to make quarterly distributions to maintain our REIT status. To the extent that cash flows from operations are insufficient during any quarter due to temporary or seasonal fluctuations in lease revenue, we expect to utilize other cash on hand or borrowings to fund required distributions. However, we cannot make any assurances that we will make distributions in the future.
ACCESS TO REPORTS AND OTHER INFORMATION
We maintain a website at www.ahtreit.com. On our website, we make available free-of-charge our annual reports on Form 10-K, quarterly reports on Form 10-Q, current reports on Form 8-K, and other reports filed or furnished pursuant to Section 13(a) or 15(d) of the Securities Exchange Act of 1934, as amended (the “Exchange Act”), as soon as reasonably practicable after we electronically file or furnish such material with the Securities and Exchange Commission (the “SEC”). In addition, our Code of Business Conduct and Ethics, Code of Ethics for the Chief Executive Officer, Chief Financial Officer, and Chief Accounting Officer, Corporate Governance Guidelines, and Board Committee Charters are also available free-of-charge on our website or can be made available in print upon request.
All reports filed with the SEC may also be read and copied at the SEC’s Public Reference Room at 100 F Street, N.E. Washington, DC 20549-1090. Further information regarding the operation of the Public Reference Room may be obtained by calling 1-800-SEC-0330. In addition, all of our filed reports can be obtained at the SEC’s website at www.sec.gov.
|
Item 1A.
|
Risk Factors
|
RISKS RELATED TO OUR BUSINESS
A financial crisis or economic slowdown may harm the operating performance of the hotel industry generally. If such events occur, we may be harmed by declines in occupancy, average daily room rates and/or other operating revenues.
The performance of the lodging industry has been closely linked with the performance of the general economy and, specifically, growth in the U.S. gross domestic product. A majority of our hotels are classified as upscale and upper upscale. In an economic downturn, these types of hotels may be more susceptible to a decrease in revenue, as compared to hotels in other categories that have lower room rates. This characteristic may result from the fact that upscale and upper upscale hotels generally target business and high-end leisure travelers. In periods of economic difficulties, business and leisure travelers may seek to reduce travel costs by limiting travel or seeking to reduce costs on their trips. Any economic recession will likely have an adverse effect on us.
Continued or renewed economic weakness in the U.S. economy, generally, or a new recession would likely adversely affect our financial condition.
Failure of the hotel industry to exhibit sustained improvement or to improve as expected may adversely affect us.
A substantial part of our business plan is based on our belief that the lodging markets in which we invest will experience improving economic fundamentals in the future, despite that fundamentals have already substantially improved over the last several years. In particular, our business strategy is dependent on our expectation that key industry performance indicators, especially RevPAR, will continue to improve. There can be no assurance as to whether or to what extent, hotel industry fundamentals will
8
continue to improve. In the event conditions in the industry do not sustain improvement or improve as we expect, or deteriorate, we may be adversely affected.
The hotel industry is highly competitive and the hotels in which we invest are subject to competition from other hotels for guests.
The hotel business is highly competitive. Our hotel properties will compete on the basis of location, room rates, quality, amenities, reputation and reservations systems, among many factors. There are many competitors in the hotel industry, and many of these competitors may have substantially greater marketing and financial resources than we have. This competition could reduce occupancy levels and room revenue at our hotels. Over-building in the lodging industry may increase the number of rooms available and may decrease occupancy and room rates. In addition, in periods of weak demand, as may occur during a general economic recession, profitability is negatively affected by the fixed costs of operating hotels. We may also face competition from services such as Airbnb.
Because we depend upon our advisor and its affiliates to conduct our operations, any adverse changes in the financial condition of our advisor or its affiliates or our relationship with them could hinder our operating performance.
We depend on our advisor to manage our assets and operations. Any adverse changes in the financial condition of our advisor or its affiliates or our relationship with our advisor could hinder its ability to manage us successfully.
We depend on our advisor’s key personnel with long-standing business relationships. The loss of our advisor’s key personnel could threaten our ability to operate our business successfully.
Our future success depends, to a significant extent, upon the continued services of our advisor’s management team and the extent and nature of the relationships they have developed with hotel franchisors, operators, and owners and hotel lending and other financial institutions. The loss of services of one or more members of our advisor’s management team could harm our business and our prospects.
The aggregate amount of fees and expense reimbursements paid to our advisor will exceed the average of internalized expenses of our industry peers (as provided in our advisory agreement), as a percentage of total market capitalization. As a part of these fees, we must pay a minimum advisory fee to our advisor regardless of our performance.
Pursuant to the advisory agreement between us and our advisor, we must pay our advisor a quarterly base management fee (subject to a minimum fee described below), that is based on a declining scale percentage of our total market capitalization (as defined in our advisory agreement) plus the Key Money Asset Management Fee (as defined in our advisory agreement), an annual incentive fee that will be based on our achievement of certain minimum performance thresholds and certain expense reimbursements. For each quarter, the minimum base management fee will be equal to the greater of (i) 90% of the base fee paid for the same quarter in the prior year; and (ii) the “G&A Ratio” multiplied by our total market capitalization for such quarter. The “G&A Ratio” will be calculated as the simple average of the ratios of total general and administrative expenses paid, less any non-cash expenses but including any dead-deal costs, in the applicable quarter by each member of a select peer group, divided by the total market capitalization of such peer group member (as provided in our advisory agreement.) Since the base management fee is subject to this minimum amount and because a portion of such fees are contingent on our performance, the fees we pay to our advisor may fluctuate over time. However, regardless of our advisor’s performance, the total amount of fees and reimbursements paid to our advisor as a percentage of market capitalization will never be less than the average of internalized expenses of our industry peers (as provided in our advisory agreement), and there may be times when the total amount of fees and incentives paid to our advisor greatly exceeds the average of internalized expenses of our industry peers.
Our advisor’s entitlement to non-performance-based compensation, including the minimum base management fee, might reduce its incentive to devote its time and effort to seeking investments that provide attractive risk-adjusted returns for our portfolio. Further, our incentive fee structure may induce our advisor to encourage us to acquire certain assets, including speculative or high risk assets, or to acquire assets with increased leverage, which could increase the risk to our portfolio.
Our joint venture investments could be adversely affected by our lack of sole decision-making authority, our reliance on a co-venturer’s financial condition and disputes between us and our co-venturers.
We have in the past and may continue to co-invest with third parties through partnerships, joint ventures or other entities, acquiring controlling or non-controlling interests in, or sharing responsibility for, managing the affairs of a property, partnership, joint venture or other entity. In such event, we may not be in a position to exercise sole decision-making authority regarding the property, partnership, joint venture or other entity. Investments in partnerships, joint ventures or other entities may, under certain circumstances, involve risks not present were a third party not involved, including the possibility that partners or co-venturers might become bankrupt, suffer a deterioration in their financial condition or fail to fund their share of required capital contributions.
9
Partners or co-venturers may have economic or other business interests or goals which are inconsistent with our business interests or goals, and may be in a position to take actions contrary to our policies or objectives. Such investments may also have the potential risk of impasses on decisions, such as a sale, budgets, or financing, if neither we nor the partner or co-venturer has full control over the partnership or joint venture. Disputes between us and partners or co-venturers may result in litigation or arbitration that would increase our expenses and prevent our officers or directors from focusing their time and effort on our business. Consequently, actions by, or disputes with, partners or co-venturers might result in subjecting properties owned by the partnership or joint venture to additional risk. In addition, we may in certain circumstances be liable for the actions of our third-party partners or co-venturers.
Our business strategy depends on our continued growth. We may fail to integrate recent and additional investments into our operations or otherwise manage our planned growth, which may adversely affect our operating results.
Our business plan contemplates a period of continued growth in the next several years. We cannot assure you that we will be able to adapt our management, administrative, accounting, and operational systems, or our advisor will be able to hire and retain sufficient operational staff to successfully integrate and manage any future acquisitions of additional assets without operating disruptions or unanticipated costs. Acquisitions of any additional portfolios of properties or mortgages would generate additional operating expenses for us. Any future acquisitions may also require us to enter into property improvement plans that will increase our operating expenses. As we acquire additional assets, we will be subject to the operational risks associated with owning those assets. Our failure to successfully integrate any future acquisitions into our portfolio could have a material adverse effect on our results of operations and financial condition and our ability to pay dividends to our stockholders.
Because our board of directors and our advisor have broad discretion to make future investments, we may make investments that result in returns that are substantially below expectations or that result in net operating losses.
Our board of directors and our advisor have broad discretion, within the investment criteria established by our board of directors, to make additional investments and to determine the timing of such investments. In addition, our investment policies may be revised from time to time at the discretion of our board of directors, without a vote of our stockholders. Such discretion could result in investments with yield returns inconsistent with expectations.
We may be unable to identify additional investments that meet our investment criteria or to acquire the properties we have under contract.
We cannot assure you that we will be able to identify real estate investments that meet our investment criteria, that we will be successful in completing any investment we identify, or that any investment we complete will produce a return on our investment. Moreover, we have broad authority to invest in any real estate investments that we may identify in the future. We also cannot assure you that we will acquire properties we currently have under firm purchase contracts, if any, or that the acquisition terms we have negotiated will not change.
Hotel franchise or license requirements or the loss of a franchise could adversely affect us.
We must comply with operating standards, terms, and conditions imposed by the franchisors of the hotel brands under which our hotels operate. Franchisors periodically inspect their licensed hotels to confirm adherence to their operating standards. The failure of a hotel to maintain standards could result in the loss or cancellation of a franchise license. With respect to operational standards, we rely on our property managers to conform to such standards. Franchisors may also require us to make certain capital improvements to maintain the hotel in accordance with system standards, the cost of which can be substantial. It is possible that a franchisor could condition the continuation of a franchise based on the completion of capital improvements that our advisor or board of directors determines is not economically feasible in light of general economic conditions, the operating results or prospects of the affected hotel or other circumstances. In that event, our advisor or board of directors may elect to allow the franchise to lapse or be terminated, which could result in a termination charge as well as a change in brand franchising or operation of the hotel as an independent hotel. In addition, when the term of a franchise expires, the franchisor has no obligation to issue a new franchise.
The loss of a franchise could have a material adverse effect on the operations and/or the underlying value of the affected hotel because of the loss of associated name recognition, marketing support and centralized reservation systems provided by the franchisor.
Our investments are concentrated in particular segments of a single industry.
Nearly all of our business is hotel related. Our current strategy is predominantly to acquire upscale to upper upscale hotels, as well as when conditions are favorable acquire first mortgages on hotel properties, invest in other mortgage-related instruments such as mezzanine loans to hotel owners and operators, and participate in hotel sale-leaseback transactions. Adverse conditions
10
in the hotel industry will have a material adverse effect on our operating and investment revenues and cash available for distribution to our stockholders.
Our reliance on third party property managers, including Remington Lodging, to operate our hotels and for a substantial majority of our cash flow may adversely affect us.
Because U.S. federal income tax laws restrict REITs and their subsidiaries from operating or managing hotels, third parties must operate our hotels. A REIT may lease its hotels to taxable REIT subsidiaries in which the REIT can own up to a 100% interest. A taxable REIT subsidiary (“TRS”) pays corporate-level income tax and may retain any after-tax income. A REIT must satisfy certain conditions to use the TRS structure. One of those conditions is that the TRS must hire, to manage the hotels, an “eligible independent contractor” (“EIC”) that is actively engaged in the trade or business of managing hotels for parties other than the REIT. An EIC cannot (i) own more than 35% of the REIT, (ii) be owned more than 35% by persons owning more than 35% of the REIT, or (iii) provide any income to the REIT (
i.e.
, the EIC cannot pay fees to the REIT, and the REIT cannot own any debt or equity securities of the EIC). Accordingly, while we may lease hotels to a TRS that we own, the TRS must engage a third-party operator to manage the hotels. Thus, our ability to direct and control how our hotels are operated is less than if we were able to manage our hotels directly.
We have entered into management agreements with Remington Lodging, which is owned 100% by Messrs. Archie and Monty J. Bennett, to manage
82
of our
120
hotel properties and the WorldQuest condominium properties as of
December 31, 2017
. We have hired unaffiliated third-party property managers to manage our remaining properties. We do not supervise any of the property managers or their respective personnel on a day-to-day basis, and we cannot assure you that the property managers will manage our properties in a manner that is consistent with their respective obligations under the applicable management agreement or our obligations under our hotel franchise agreements. We also cannot assure you that our property managers will not be negligent in their performance, will not engage in criminal or fraudulent activity, or will not otherwise default on their respective management obligations to us. If any of the foregoing occurs, our relationships with any franchisors may be damaged, we may be in breach of our franchise agreement, and we could incur liabilities resulting from loss or injury to our property or to persons at our properties. In addition, from time to time, disputes may arise between us and our third-party managers regarding their performance or compliance with the terms of the hotel management agreements, which in turn could adversely affect us. We generally will attempt to resolve any such disputes through discussions and negotiations; however, if we are unable to reach satisfactory results through discussions and negotiations, we may choose to terminate our management agreement, litigate the dispute or submit the matter to third-party dispute resolution, the expense of which may be material and the outcome of which may adversely affect us.
Our cash flow from the hotels may be adversely affected if our managers fail to provide quality services and amenities or if they or their affiliates fail to maintain a quality brand name. In addition, our managers or their affiliates may manage, and in some cases may own, invest in or provide credit support or operating guarantees, to hotels that compete with hotel properties that we own or acquire, which may result in conflicts of interest and decisions regarding the operation of our hotels that are not in our best interests. Any of these circumstances could adversely affect us.
Our management agreements could adversely affect our sale or financing of hotel properties.
We have entered into management agreements, and acquired properties subject to management agreements, that do not allow us to replace hotel managers on relatively short notice or with limited cost or contain other restrictive covenants, and we may enter into additional such agreements or acquire properties subject to such agreements in the future. For example, the terms of a management agreement may restrict our ability to sell a property unless the purchaser is not a competitor of the manager, assumes the management agreement and meets other conditions. Also, the terms of a long-term management agreement encumbering our property may reduce the value of the property. When we enter into or acquire properties subject to any such management agreements, we may be precluded from taking actions in our best interest and could incur substantial expense as a result of the agreements.
If we cannot obtain additional capital, our growth will be limited.
We are required to distribute to our stockholders at least 90% of our REIT taxable income, excluding net capital gains, each year to maintain our qualification as a REIT. As a result, our retained earnings available to fund acquisitions, development, or other capital expenditures are nominal. As such, we rely upon the availability of additional debt or equity capital to fund these activities. Our long-term ability to grow through acquisitions or development, which is an important strategy for us, will be limited if we cannot obtain additional financing or equity capital. Market conditions may make it difficult to obtain financing or equity capital, and we cannot assure you that we will be able to obtain additional debt or equity financing or that we will be able to obtain it on favorable terms.
11
We compete with other hotels for guests and face competition for acquisitions and sales of hotel properties and of desirable debt investments.
The hotel business is competitive. Our hotels compete on the basis of location, room rates, quality, service levels, amenities, loyalty programs, reputation and reservation systems, among many other factors. New hotels may be constructed and these additions to supply create new competitors, in some cases without corresponding increases in demand for hotel rooms. The result in some cases may be lower revenue, which would result in lower cash available to meet debt service obligations, operating expenses and requisite distributions to our stockholders.
We compete for hotel acquisitions with entities that have similar investment objectives as we do. This competition could limit the number of suitable investment opportunities offered to us. It may also increase the bargaining power of property owners seeking to sell to us, making it more difficult for us to acquire new properties on attractive terms or on the terms contemplated in our business plan. In addition, we compete to sell hotel properties. Availability of capital, the number of hotels available for sale and market conditions all affect prices. We may not be able to sell hotel assets at our targeted price.
We also compete for mortgage asset investments with numerous public and private real estate investment vehicles, such as mortgage banks, pension funds, other REITs, institutional investors, and individuals. Mortgages and other investments are often obtained through a competitive bidding process. In addition, competitors may seek to establish relationships with the financial institutions and other firms from which we intend to purchase such assets. Competition may result in higher prices for mortgage assets, lower yields, and a narrower spread of yields over our borrowing costs.
Some of our competitors are larger than us, may have access to greater capital, marketing, and other financial resources, may have personnel with more experience than our officers, may be able to accept higher levels of debt or otherwise may tolerate more risk than us, may have better relations with hotel franchisors, sellers or lenders, and may have other advantages over us in conducting certain business and providing certain services.
We face risks related to changes in the global and political economic environment, including capital and credit markets.
Our business may be impacted by global economic conditions, which recently have been volatile. Political crises in individual countries or regions, including sovereign risk related to a deterioration in the credit worthiness or a default by local governments, has contributed to this volatility. If the global economy experiences continued volatility or significant disruptions, such disruptions or volatility could hurt the U.S. economy and our business could be negatively impacted by reduced demand for business and leisure travel related to a slow-down in the general economy, by disruptions resulting from tighter credit markets, and by liquidity issues resulting from an inability to access credit markets to obtain cash to support operations. Our objective is to maintain access to capital and credit markets.
We are increasingly dependent on information technology, and potential cyber-attacks, security problems or other disruption and expanding social media vehicles present new risks.
As do most companies, our advisor and our various hotel managers rely on information technology networks and systems, including the Internet, to process, transmit and store electronic information, and to manage or support a variety of business processes, including financial transactions and records, personal identifying information, reservations, billing and operating data. Our advisor and our hotel managers purchase some of our information technology from vendors, on whom our systems depend, and our advisor relies on commercially available systems, software, tools and monitoring to provide security for processing, transmission and storage of confidential operator and other customer information, such as individually identifiable information, including information relating to financial accounts.
We often depend upon the secure transmission of this information over public networks. Our advisor’s and our hotel managers' networks and storage applications are subject to unauthorized access by hackers or others (through cyber-attacks, which are rapidly evolving and becoming increasingly sophisticated, or by other means) or may be breached due to operator error, malfeasance or other system disruptions. In some cases, it is difficult to anticipate or immediately detect such incidents and the damage caused thereby. Any significant breakdown, invasion, destruction, interruption or leakage of our advisor’s or our hotel managers’ systems could harm us.
In addition, the use of social media could cause us to suffer brand damage or information leakage. Negative posts or comments about us, our hotel managers or our hotels on any social networking website could damage our or our hotels’ reputations. In addition, employees or others might disclose non-public sensitive information relating to our business through external media channels. The continuing evolution of social media will present us with new challenges and risks.
12
Changes in laws, regulations, or policies may adversely affect our business.
The laws and regulations governing our business or the regulatory or enforcement environment at the federal level or in any of the states in which we operate may change at any time and may have an adverse effect on our business. For example, the Patient Protection and Affordable Care Act of 2010, as it is phased in over time, will significantly affect the administration of health care services and could significantly impact our cost of providing employees with health care insurance. We are unable to predict how this or any other future legislative or regulatory proposals or programs will be administered or implemented or in what form, or whether any additional or similar changes to statutes or regulations, including the interpretation or implementation thereof, will occur in the future. Any such action could affect us in substantial and unpredictable ways and could have an adverse effect on our results of operations and financial condition. Our inability to remain in compliance with regulatory requirements in a particular jurisdiction could have a material adverse effect on our operations in that market and on our reputation generally. No assurance can be given that applicable laws or regulations will not be amended or construed differently or that new laws and regulations will not be adopted, either of which could materially adversely affect our business, financial condition or results of operations.
Our business could be adversely impacted if there are deficiencies in our disclosure controls and procedures or internal control over financial reporting.
The design and effectiveness of our disclosure controls and procedures and internal control over financial reporting may not prevent all errors, misstatements or misrepresentations. While management will continue to review the effectiveness of our disclosure controls and procedures and internal control over financial reporting, there can be no guarantee that our internal control over financial reporting will be effective in accomplishing all control objectives all of the time. Deficiencies, including any material weakness, in our internal control over financial reporting could result in misstatements of our results of operations, restatements of our financial statements or could otherwise materially adversely affect our business, reputation, results of operations, financial condition or liquidity.
The Company faces possible risks associated with the physical effects of climate change.
The Company cannot predict with certainty any impact, rate or timing related to possible changes in the climate. However, the physical effects of climate change could have a material adverse effect on the Company. For example, a number of the Company’s hotels are located along the Gulf and East coasts. To the extent climate change causes changes in weather patterns, its markets could experience increases in storm intensity and rising sea-levels. Over time, these conditions could result in declining hotel demand or the Company’s inability to operate the affected hotels at all. Climate change also may have indirect effects on its business by increasing the cost of (or making unavailable) property insurance on terms the Company finds acceptable, increasing the cost of energy and increasing the cost of snow removal at its properties. There can be no assurance that climate change will not have a material adverse effect on the Company.
We are subject to various risks related to our use of, and dependence on, debt.
As of
December 31, 2017
, we had aggregated borrowings of approximately
$3.7 billion
outstanding, including
$3.4 billion
of variable interest rate debt. The interest we pay on variable-rate debt increases as interest rates increase above any floor rates, which may decrease cash available for distribution to our stockholders. We are also subject to the risk that we may not be able to meet our debt service obligations or refinance our debt as it becomes due. If we do not meet our debt service obligations, we risk the loss of some or all of our assets to foreclosure. Changes in economic conditions or our financial results or prospects could (i) result in higher interest rates on variable-rate debt, (ii) reduce the availability of debt financing generally or debt financing at favorable rates, (iii) reduce cash available for distribution to our stockholders, (iv) increase the risk that we could be forced to liquidate assets or repay debt, either of which could have a material adverse effect on us, and (v) create other challenging situations for us.
Some of our debt agreements contain financial and other covenants. If we violate covenants in any debt agreements, including as a result of impairments of our hotel or mezzanine loan assets, we could be required to repay all or a portion of our indebtedness before maturity at a time when we might be unable to arrange financing for such repayment on attractive terms, if at all. Violations of certain debt covenants may also prohibit us from borrowing unused amounts under our lines of credit, even if repayment of some or all the borrowings is not required. In any event, financial covenants under our current or future debt obligations could impair our planned business strategies by limiting our ability to borrow beyond certain amounts or for certain purposes. Our governing instruments do not contain any limitation on our ability to incur indebtedness.
13
Mortgage debt obligations expose us to increased risk of property losses, which could harm our financial condition, cash flow, and ability to satisfy our other debt obligations and pay dividends.
Incurring mortgage debt increases our risk of property losses because defaults on indebtedness secured by properties may result in foreclosure actions initiated by lenders and ultimately our loss of the property securing any loans for which we are in default. For tax purposes, a foreclosure of any of our properties would be treated as a sale of the property for a purchase price equal to the outstanding balance of the debt secured by the mortgage. If the outstanding balance of the debt secured by the mortgage exceeds our tax basis in the property, we would recognize taxable income on the foreclosure but would not receive any cash proceeds. As a result, we may be required to identify and utilize other sources of cash for distributions to our stockholders of that income.
In addition, our default under any one of our mortgage debt obligations may result in a default on our other indebtedness. If this occurs, our financial condition, cash flow, and ability to satisfy our other debt obligations or ability to pay dividends may be impaired.
We voluntarily elected to cease making payments on the mortgages securing four of our hotels during the last economic downturn, and we may voluntarily elect to cease making payments on additional mortgages in the future, which could reduce the number of hotels we own as well as our revenues and could affect our ability to raise equity or debt financing in the future or violate covenants in our debt agreements.
During the past economic crisis, we undertook a series of actions to manage the sources and uses of our funds in an effort to navigate through challenging market conditions while still pursuing opportunities to create long-term stockholder value. In this effort, we attempted to proactively address value and cash flow deficits among certain of our mortgaged hotels, with a goal of enhancing stockholder value through loan amendments, or in certain instances, consensual transfers of hotel properties to the lenders in satisfaction of the related debt, some of which resulted in impairment charges. The loans secured by these hotels, subject to certain customary exceptions, were non-recourse to us. We may continue to proactively address value and cash flow deficits in a similar manner as necessary and appropriate.
We had approximately
$3.7 billion
of mortgage debt outstanding as of
December 31, 2017
. We may face issues with these loans or with other loans or borrowings that we incur in the future, some of which issues may be beyond our control, including our ability to service payment obligations from the cash flow of the applicable hotel, or the inability to refinance existing debt at the applicable maturity date. In such event, we may elect to default on the applicable loan and, as a result, the lenders would have the right to exercise various remedies under the loan documents, which would include foreclosure on the applicable hotels. Any such defaults, whether voluntary or involuntary, could result in a default under our other debt agreements, could have an adverse effect on our ability to raise equity or debt capital, could increase the cost of such capital or could otherwise have an adverse effect on our business, results of operations or financial condition.
Covenants, “cash trap” provisions or other terms in our loan agreements could limit our flexibility and adversely affect our financial condition or our qualification as a REIT.
Some of our loan agreements contain financial and other covenants. If we violate covenants in any debt agreements, we could be required to repay all or a portion of our indebtedness before maturity at a time when we might be unable to arrange financing for such repayment on attractive terms, if at all. In any event, financial covenants under our current or future debt obligations could impair our planned business strategies by limiting our ability to borrow beyond certain amounts or for certain purposes.
Some of our loan agreements also contain cash trap provisions triggered if the performance of our hotels decline. When these provisions are triggered, substantially all of the profit generated by our hotels is deposited directly into lockbox accounts and then swept into cash management accounts for the benefit of our various lenders. Cash is not distributed to us at any time after the cash trap provisions have been triggered until we have cured performance issues. This could affect our liquidity and our ability to make distributions to our stockholders.
Our hedging strategies may not be successful in mitigating our risks associated with interest rates and could reduce the overall returns on your investment.
We use various derivative financial instruments to provide a level of protection against interest rate risks, but no hedging strategy can protect us completely. These instruments involve risks, such as the risk that the counterparties may fail to honor their obligations under these arrangements, that these arrangements may not be effective in reducing our exposure to interest rate changes and that a court could rule that such agreements are not legally enforceable. These instruments may also generate income that may not be treated as qualifying REIT income. In addition, the nature and timing of hedging transactions may influence the effectiveness of our hedging strategies. Poorly designed strategies or improperly executed transactions could actually increase our risk and losses. Moreover, hedging strategies involve transaction and other costs. We cannot assure you that our hedging strategy and the
14
derivatives that we use will adequately offset the risk of interest rate volatility or that our hedging transactions will not result in losses that may reduce the overall return on your investment.
RISKS RELATED TO HOTEL INVESTMENTS
We are subject to general risks associated with operating hotels.
Our hotels and hotels underlying our mortgage and mezzanine loans are subject to various operating risks common to the hotel industry, many of which are beyond our control, including, among others, the following:
|
•
|
competition from other hotel properties in our markets;
|
|
•
|
over-building of hotels in our markets, which results in increased supply and adversely affects occupancy and revenues at our hotels;
|
|
•
|
dependence on business and commercial travelers and tourism;
|
|
•
|
increases in operating costs due to inflation, increased energy costs and other factors that may not be offset by increased room rates;
|
|
•
|
changes in interest rates and in the availability, cost and terms of debt financing;
|
|
•
|
increases in assessed property taxes from changes in valuation or real estate tax rates;
|
|
•
|
increases in the cost of property insurance;
|
|
•
|
changes in governmental laws and regulations, fiscal policies and zoning ordinances and the related costs of compliance with laws and regulations, fiscal policies and ordinances;
|
|
•
|
unforeseen events beyond our control, such as terrorist attacks, travel related health concerns which could reduce travel, including pandemics and epidemics such as H1N1 influenza (swine flu), avian flu, SARS and the Zika virus, imposition of taxes or surcharges by regulatory authorities, travel-related accidents, travel infrastructure interruptions and unusual weather patterns, including natural disasters such as hurricanes, tsunamis or earthquakes;
|
|
•
|
adverse effects of international, national, regional and local economic and market conditions and increases in energy costs or labor costs and other expenses affecting travel, which may affect travel patterns and reduce the number of business and commercial travelers and tourists;
|
|
•
|
adverse effects of a downturn in the lodging industry; and
|
|
•
|
risks generally associated with the ownership of hotel properties and real estate, as we discuss in more detail below.
|
These factors could adversely affect our hotel revenues and expenses, as well as the hotels underlying our mortgage and mezzanine loans, which in turn could adversely affect our financial condition, results of operations, the market price of our common stock and our ability to make distributions to our stockholders.
Four of our hotels are subject to ground leases; if we are found to be in breach of a ground lease or are unable to renew a ground lease, our business could be materially and adversely affected.
Four of our hotels are on land subject to ground leases. Accordingly, we only own a long-term leasehold or similar interest in those four hotels. If we are found to be in breach of a ground lease, we could lose the right to use the hotel. In addition, unless we can purchase a fee interest in the underlying land and improvements or extend the terms of these leases before their expiration, we will lose our right to operate these properties and our interest in the improvements upon expiration of the leases. We may not be able to renew any ground lease upon its expiration or if renewed, the terms may not be favorable. Our ability to exercise any extension options relating to our ground leases is subject to the condition that we are not in default under the terms of the ground lease at the time that we exercise such options. If we lose the right to use a hotel due to a breach or non-renewal of the ground lease, we would be unable to derive income from such hotel and would be required to purchase an interest in another hotel to attempt to replace that income, which could materially and adversely affect our business, operating results and prospects.
We may have to make significant capital expenditures to maintain our hotel properties, and any development activities we undertake may be more costly than we anticipate.
Our hotels have an ongoing need for renovations and other capital improvements, including replacements, from time to time, of furniture, fixtures and equipment. Managers or franchisors of our hotels also will require periodic capital improvements pursuant to the management agreements or as a condition of maintaining franchise licenses. Generally, we are responsible for the cost of these capital improvements. We may also develop hotel properties, timeshare units or other alternate uses of portions of our existing properties, including the development of retail, office or apartments, including through joint ventures. Such renovation and development involves substantial risks, including:
|
•
|
construction cost overruns and delays;
|
15
|
•
|
the disruption of operations and displacement of revenue at operating hotels, including revenue lost while rooms, restaurants or meeting space under renovation are out of service;
|
|
•
|
the cost of funding renovations or developments and inability to obtain financing on attractive terms;
|
|
•
|
the return on our investment in these capital improvements or developments failing to meet expectations;
|
|
•
|
governmental restrictions on the nature or size of a project;
|
|
•
|
inability to obtain all necessary zoning, land use, building, occupancy, and construction permits;
|
|
•
|
loss of substantial investment in a development project if a project is abandoned before completion;
|
|
•
|
acts of God such as earthquakes, hurricanes, floods or fires that could adversely affect a project;
|
|
•
|
environmental problems; and
|
|
•
|
disputes with franchisors or property managers regarding compliance with relevant franchise agreements or management agreements.
|
If we have insufficient cash flow from operations to fund needed capital expenditures, then we will need to obtain additional debt or equity financing
to fund future capital improvements, and we may not be able to meet the loan covenants in any financing obtained to fund the new development, creating default risks.
In addition, to the extent that developments are conducted through joint ventures, this creates additional risks, including the possibility that our partners may not meet their financial obligations or could have or develop business interests, policies or objectives that are inconsistent with ours. See “Our joint venture investments could be adversely affected by our lack of sole decision-making authority, our reliance on a co-venturer’s financial condition and disputes between us and our co-venturers.”
Any of the above factors could affect adversely our and our partners’ ability to complete the developments on schedule and along the scope that currently is contemplated, or to achieve the intended value of these projects. For these reasons, there can be no assurances as to the value to be realized by the company from these transactions or any future similar transactions.
The hotel business is seasonal, which affects our results of operations from quarter to quarter.
The hotel industry is seasonal in nature. This seasonality can cause quarterly fluctuations in our financial condition and operating results, including in any distributions on our common stock. Our quarterly operating results may be adversely affected by factors outside our control, including weather conditions and poor economic factors in certain markets in which we operate. We can provide no assurances that our cash flows will be sufficient to offset any shortfalls that occur as a result of these fluctuations. As a result, we may have to reduce distributions or enter into short-term borrowings in certain quarters in order to make distributions to our stockholders, and we can provide no assurances that such borrowings will be available on favorable terms, if at all.
The cyclical nature of the lodging industry may cause fluctuations in our operating performance, which could have a material adverse effect on us.
The lodging industry historically has been highly cyclical in nature. Fluctuations in lodging demand and, therefore, hotel operating performance, are caused largely by general economic and local market conditions, which subsequently affect levels of business and leisure travel. In addition to general economic conditions, new hotel room supply is an important factor that can affect the lodging industry’s performance, and overbuilding has the potential to further exacerbate the negative impact of an economic recession. Room rates and occupancy, and thus RevPAR, tend to increase when demand growth exceeds supply growth. We can provide no assurances regarding whether, or the extent to which, lodging demand will rebound or whether any such rebound will be sustained. An adverse change in lodging fundamentals could result in returns that are substantially below our expectations or result in losses, which could have a material adverse effect on us.
Many real estate costs are fixed, even if revenue from our hotels decreases.
Many costs, such as real estate taxes, insurance premiums and maintenance costs, generally are not reduced even when a hotel is not fully occupied, room rates decrease or other circumstances cause a reduction in revenues. In addition, newly acquired or renovated hotels may not produce the revenues we anticipate immediately, or at all, and the hotel's operating cash flow may be insufficient to pay the operating expenses and debt service associated with these new hotels. If we are unable to offset real estate costs with sufficient revenues across our portfolio, we may be adversely affected.
16
Our operating expenses may increase in the future which could cause us to raise our room rates, which may deplete room occupancy, or cause us to realize lower net operating income as a result of increased expenses that are not offset by increased room rates, in either case decreasing our cash flow and our operating results.
Operating expenses, such as expenses for fuel, utilities, labor and insurance, are not fixed and may increase in the future. To the extent such increases affect our room rates and therefore our room occupancy at our lodging properties, our cash flow and operating results may be negatively affected.
The increasing use of Internet travel intermediaries by consumers may adversely affect our profitability.
Some of our hotel rooms are booked through Internet travel intermediaries, including, but not limited to, Travelocity.com, Expedia.com and Priceline.com. As Internet bookings increase, these intermediaries may be able to obtain higher commissions, reduced room rates or other significant contract concessions from our management companies. Moreover, some of these Internet travel intermediaries are attempting to offer hotel rooms as a commodity, by increasing the importance of price and general indicators of quality (such as “three-star downtown hotel”) at the expense of brand identification. These intermediaries hope that consumers will eventually develop brand loyalties to their reservations system rather than to the brands under which our properties are franchised. Although most of the business for our hotels is expected to be derived from traditional channels, if the amount of sales made through Internet intermediaries increases significantly, room revenues may be lower than expected, and we may be adversely affected.
We may be adversely affected by increased use of business-related technology, which may reduce the need for business-related travel.
The increased use of teleconference and video-conference technology by businesses could result in decreased business travel as companies increase the use of technologies that allow multiple parties from different locations to participate at meetings without traveling to a centralized meeting location. To the extent that such technologies play an increased role in day-to-day business and the necessity for business-related travel decreases, hotel room demand may decrease and we may be adversely affected.
Our hotels may be subject to unknown or contingent liabilities which could cause us to incur substantial costs.
The hotel properties that we own or may acquire are or may be subject to unknown or contingent liabilities for which we may have no recourse, or only limited recourse, against the sellers. In general, the representations and warranties provided under the transaction agreements related to the sales of the hotel properties may not survive the closing of the transactions. While we will seek to require the sellers to indemnify us with respect to breaches of representations and warranties that survive, such indemnification may be limited and subject to various materiality thresholds, a significant deductible or an aggregate cap on losses. As a result, there is no guarantee that we will recover any amounts with respect to losses due to breaches by the sellers of their representations and warranties. In addition, the total amount of costs and expenses that may be incurred with respect to liabilities associated with these hotels may exceed our expectations, and we may experience other unanticipated adverse effects, all of which may adversely affect our financial condition, results of operations, the market price of our common stock and our ability to make distributions to our stockholders.
Future terrorist attacks or changes in terror alert levels could materially and adversely affect us.
Previous terrorist attacks and subsequent terrorist alerts have adversely affected the U.S. travel and hospitality industries since 2001, often disproportionately to the effect on the overall economy. The extent of the impact that actual or threatened terrorist attacks in the U.S. or elsewhere could have on domestic and international travel and our business in particular cannot be determined, but any such attacks or the threat of such attacks could have a material adverse effect on travel and hotel demand, our ability to finance our business and our ability to insure our hotels, which could materially adversely affect us.
During
2017
, approximately
10%
of our total hotel revenue was generated from
nine
hotels located in the Washington D.C. areas, areas considered vulnerable to terrorist attack. Our financial and operating performance may be adversely affected by potential terrorist attacks. Terrorist attacks in the future may cause our results to differ materially from anticipated results. Hotels we own in other market locations may be subject to this risk as well.
We are subject to risks associated with the employment of hotel personnel, particularly with hotels that employ unionized labor.
Our third-party managers are responsible for hiring and maintaining the labor force at each of our hotels. Although we do not directly employ or manage employees at our hotels, we still are subject to many of the costs and risks generally associated with the hotel labor force, particularly those hotels with unionized labor. From time to time, hotel operations may be disrupted as a result of strikes, lockouts, public demonstrations or other negative actions and publicity. We also may incur increased legal costs and indirect labor costs as a result of contract disputes or other events. The resolution of labor disputes or re-negotiated labor
17
contracts could lead to increased labor costs, either by increases in wages or benefits or by changes in work rules that raise hotel operating costs. We do not have the ability to affect the outcome of these negotiations.
RISKS RELATED TO CONFLICTS OF INTEREST
Our agreements with our external advisor, as well as our mutual exclusivity agreement and management agreements with Remington Lodging were not negotiated on an arm’s-length basis, and we may pursue less vigorous enforcement of their terms because of conflicts of interest with certain of our executive officers and directors and key employees of our advisor.
Because each of our executive officers are also key employees of our advisor or its affiliates and have ownership interests in our advisor and because our chairman of our board has an ownership interest in Remington Lodging, our advisory agreement as well as our mutual exclusivity agreement and master management agreement with Remington Lodging were not negotiated on an arm’s-length basis, and we did not have the benefit of arm’s-length negotiations of the type normally conducted with an unaffiliated third party. As a result, the terms, including fees and other amounts payable, may not be as favorable to us as an arm’s-length agreement. Furthermore, we may choose not to enforce, or to enforce less vigorously, our rights under these agreements because of our desire to maintain our ongoing relationship with our advisor and Remington Lodging.
The termination fee payable to our advisor significantly increases the cost to us of terminating our advisory agreement, thereby effectively limiting our ability to terminate our advisor without cause and could make a change of control transaction less likely or the terms thereof less attractive to us and to our stockholders.
The initial term of our advisory agreement with our advisor is 10 years from the effective date of the advisory agreement, with automatic five-year renewal terms thereafter unless previously terminated. Our board will review our advisor’s performance and fees annually and, following the 10 year initial term the advisory agreement may be terminated by us with the payment of the termination fee described below and 180 days’ prior notice upon the affirmative vote of at least two-thirds of our independent directors based upon a good faith finding that either: (1) there has been unsatisfactory performance by our advisor that is materially detrimental to us and our subsidiaries taken as a whole, or (2) the base fee and/or incentive fee is not fair (and our advisor does not offer to negotiate a lower fee that a majority of our independent directors determines is fair). Additionally, if there is a change of control transaction, we will have the right to terminate the advisory agreement with the payment of the termination fee described below. If we terminate or do not renew the advisory agreement without cause, including pursuant to clauses (1) or (2) above (following a contractual renegotiation process in the case of clause (2) above) or upon a change of control, we will be required to pay our advisor a termination fee equal to:
•
(A) 1.1 multiplied by the greater of (i) 12 times the net earnings of our advisor for the 12 month period preceding the termination date of the advisory agreement or (ii) the earnings multiple (calculated as our advisor’s total enterprise value on the trading day immediately preceding the day the termination notice is given to our advisor divided by our advisor’s most recently reported adjusted EBITDA) for our advisor’s common stock for the 12 month period preceding the termination date of the advisory agreement multiplied by the net earnings of our advisor for the 12 month period preceding the termination date of the advisory agreement; or (iii) the simple average of the earnings multiples for each of the three fiscal years preceding the termination of the advisory agreement (calculated as our advisor’s total enterprise value on the last trading day of each of the three preceding fiscal years divided by, in each case, our advisor’s adjusted EBITDA for the same periods), multiplied by the net earnings of our advisor for the 12 month period preceding the termination date of the advisory agreement, plus
•
(B) an additional amount such that the total net amount received by our advisor after the reduction by state and federal income taxes at an assumed combined rate of 40% on the sum of the amounts described in (A) and (B) shall equal the amount described in (A).
Any such termination fee will be payable on or before the termination date. The termination fee makes it more difficult for us to terminate our advisory agreement even if our board determines that there has been unsatisfactory performance or unfair fees. These provisions significantly increase the cost to us of terminating our advisory agreement, thereby limiting our ability to terminate our advisor without cause.
Our advisor manages other entities and may direct attractive investment opportunities away from us. If we change our investment guidelines, our advisor is not restricted from advising clients with similar investment guidelines.
Certain of our executive officers also serve as key employees and as officers of our advisor and Ashford Prime, and will continue to do so. Furthermore, Mr. Monty J. Bennett, our chairman, is also the chief executive officer and chairman of our advisor and chairman of Ashford Prime. Our advisory agreement requires our advisor to present investments that satisfy our investment guidelines to us before presenting them to Ashford Prime or any future client of our advisor. Additionally, in the future our advisor may advise other clients, some of which may have investment guidelines substantially similar to ours.
18
Some portfolio investment opportunities may include hotels that satisfy our investment objectives as well as hotels that satisfy the investment objectives of Ashford Prime or other entities advised by our advisor. If the portfolio cannot be equitably divided, our advisor will necessarily have to make a determination as to which entity will be presented with the opportunity. In such a circumstance, our advisory agreement requires our advisor to allocate portfolio investment opportunities between us, Ashford Prime or other entities advised by our advisor in a fair and equitable manner, consistent with our, Ashford Prime’s and such other entities’ investment objectives. In making this determination, our advisor, using substantial discretion, will consider the investment strategy and guidelines of each entity with respect to acquisition of properties, portfolio concentrations, tax consequences, regulatory restrictions, liquidity requirements and other factors deemed appropriate. In making the allocation determination, our advisor has no obligation to make any such investment opportunity available to us. Further, our advisor and Ashford Prime have agreed that any new investment opportunities that satisfy our investment guidelines will be presented to our board of directors; however, our board will have only ten business days to make a determination with respect to such opportunity prior to it being available to Ashford Prime. The above mentioned dual responsibilities may create conflicts of interest for our officers which could result in decisions or allocations of investments that may benefit one entity more than the other.
Our advisor and its key employees, who are Ashford Prime’s, Ashford Inc.’s and our executive officers, face competing demands relating to their time and this may adversely affect our operations.
We rely on our advisor and its employees for the day-to-day operation of our business. Certain key employees of our advisor are executive officers of Ashford Prime and Ashford Inc. Because our advisor’s key employees have duties to Ashford Prime and Ashford Inc., as well as to our company, we do not have their undivided attention and they face conflicts in allocating their time and resources between our company, Ashford Prime and Ashford Inc. Our advisor may also manage other entities in the future. During turbulent market conditions or other times when we need focused support and assistance from our advisor, other entities for which our advisor also acts as an external advisor will likewise require greater focus and attention as well, placing competing high levels of demand on the limited time and resources of our advisor’s key employees. Additionally, activist investors have, and in the future, may commence campaigns seeking to influence other entities advised by our advisor to take particular actions favored by the activist or gain representation on the board of directors of such entities, which could result in additional disruption and diversion of management's attention. We may not receive the necessary support and assistance we require or would otherwise receive if we were internally managed by persons working exclusively for us.
Our business could be negatively affected as a result of actions by activist stockholders.
Campaigns by stockholders to effect changes in publicly traded companies are sometimes led by activist investors through various corporate actions, including proxy contests. Responding to actions by activist investors can be costly and time-consuming, disrupting our operations and diverting the attention of management and our employees. Stockholder activism could create perceived uncertainties as to our future direction, which could result in the loss of potential business opportunities and make it more difficult to attract and retain qualified personnel and business partners. Furthermore, the election of individuals to our board of directors with a specific agenda could adversely affect our ability to effectively and timely implement our strategic plans.
Conflicts of interest could result in our management acting other than in our stockholders’ best interest.
Conflicts of interest in general and specifically relating to Remington Lodging may lead to management decisions that are not in the stockholders’ best interest. The Chairman of our board of directors, Mr. Monty J. Bennett, serves as the Chief Executive Officer of Remington Lodging and Mr. Archie Bennett, Jr., who is our Chairman Emeritus, serves as Chairman of the board of directors of Remington Lodging. Messrs. Archie and Monty J. Bennett beneficially own 100% of Remington Lodging, which, as of
December 31, 2017
, managed
82
of our
120
hotel properties and the WorldQuest condominium properties; and provides related services, including property management services and project management services.
Messrs. Archie and Monty J. Bennett’s ownership interests in and management obligations to Remington Lodging present them with conflicts of interest in making management decisions related to the commercial arrangements between us and Remington Lodging, and Mr. Monty J. Bennett's management obligations to Remington Lodging reduces the time and effort he spends on Ashford. Our board of directors has adopted a policy that requires all material approvals, actions or decisions to which we have the right to make under the management agreements with Remington Lodging be approved by a majority or, in certain circumstances, all of our independent directors. However, given the authority and/or operational latitude to Remington Lodging under the management agreements to which we are a party, Messrs. Archie and Monty J. Bennett, as officers of Remington Lodging, could take actions or make decisions that are not in our stockholders’ best interest or that are otherwise inconsistent with their obligations under the management agreement or our obligations under the applicable franchise agreements.
Holders of units in our operating partnership, including members of our management team, may suffer adverse tax consequences upon our sale of certain properties. Therefore, holders of units, either directly or indirectly, including Messrs. Archie and Monty J. Bennett, Mr. David Brooks, our Chief Transaction Officer and General Counsel, or Mr. Mark Nunneley, our Chief Accounting Officer, may have different objectives regarding the appropriate pricing and timing of a particular property’s sale.
19
These officers and directors of ours may influence us to sell, not sell, or refinance certain properties, even if such actions or inactions might be financially advantageous to our stockholders, or to enter into tax deferred exchanges with the proceeds of such sales when such a reinvestment might not otherwise be in our best interest.
We are a party to a master hotel management agreement and an exclusivity agreement with Remington Lodging, which describes the terms of Remington Lodging’s services to our hotels, as well as any future hotels we may acquire that may or may not be managed by Remington Lodging. The exclusivity agreement requires us to engage Remington Lodging, unless our independent directors either (i) unanimously vote to hire a different manager or developer, or (ii) by a majority vote, elect not to engage Remington Lodging because they have determined that special circumstances exist or that, based on Remington Lodging’s prior performance, another manager or developer could perform the duties materially better. As the sole owners of Remington Lodging, which would receive any development, management, and management termination fees payable by us under the management agreement, Mr. Monty Bennett, and to a lesser extent, Mr. Archie Bennett, Jr., in his role as Chairman Emeritus, may influence our decisions to sell, acquire, or develop hotels when it is not in the best interests of our stockholders to do so.
Remington’s ability to exercise significant influence over the determination of the competitive set for any hotels managed by Remington could artificially enhance the perception of the performance of a hotel, making it more difficult to use managers other than Remington for future properties.
Our mutual exclusivity agreement with Remington requires us to engage Remington to manage all future properties that we acquire, to the extent we have the right or control the right to direct such matters, unless our independent directors either (i) unanimously vote not to hire Remington or (ii) based on special circumstances or past performance, by a majority vote, elect not to engage Remington because they have determined, in their reasonable business judgment, that it would be in our best interest not to engage Remington or that another manager or developer could perform the duties materially better. Under our master management agreement with Remington, we have the right to terminate Remington based on the performance of the applicable hotel, subject to the payment of a termination fee. The determination of performance is based on the applicable hotel’s gross operating profit margin and its RevPAR penetration index, which provides the relative revenue per room generated by a specified property as compared to its competitive set. For each hotel managed by Remington, its competitive set will consist of a small group of hotels in the relevant market that we and Remington believe are comparable for purposes of benchmarking the performance of such hotel. Remington will have significant influence over the determination of the competitive set for any of our hotels managed by Remington, and as such could artificially enhance the perception of the performance of a hotel by selecting a competitive set that is not performing well or is not comparable to the Remington-managed hotel, thereby making it more difficult for us to elect not to use Remington for future hotel management.
Under the terms of our mutual exclusivity agreement with Remington, Remington may be able to pursue lodging investment opportunities that compete with us.
Pursuant to the terms of our mutual exclusivity agreement with Remington, if investment opportunities that satisfy our investment criteria are identified by Remington or its affiliates, Remington will give us a written notice and description of the investment opportunity. We will have 10 business days to either accept or reject the investment opportunity. If we reject the opportunity, Remington may then pursue such investment opportunity, subject to a right of first refusal in favor of Ashford Prime, pursuant to an existing agreement between Ashford Prime and Remington, on materially the same terms and conditions as offered to us. If we were to reject such an investment opportunity, either Ashford Prime or Remington could pursue the opportunity and compete with us. In such a case, Mr. Monty J. Bennett, our chairman, in his capacity as chairman of Ashford Prime or chief executive officer of Remington could be in a position of directly competing with us.
Our fiduciary duties as the general partner of our operating partnership could create conflicts of interest, which may impede business decisions that could benefit our stockholders.
We, as the general partner of our operating partnership, have fiduciary duties to the other limited partners in our operating partnership, the discharge of which may conflict with the interests of our stockholders. The limited partners of our operating partnership have agreed that, in the event of a conflict in the fiduciary duties owed by us to our stockholders and, in our capacity as general partner of our operating partnership, to such limited partners, we are under no obligation to give priority to the interests of such limited partners. In addition, those persons holding common units will have the right to vote on certain amendments to the operating partnership agreement (which require approval by a majority in interest of the limited partners, including us) and individually to approve certain amendments that would adversely affect their rights. These voting rights may be exercised in a manner that conflicts with the interests of our stockholders. For example, we are unable to modify the rights of limited partners to receive distributions as set forth in the operating partnership agreement in a manner that adversely affects their rights without their consent, even though such modification might be in the best interest of our stockholders.
In addition, conflicts may arise when the interests of our stockholders and the limited partners of our operating partnership diverge, particularly in circumstances in which there may be an adverse tax consequence to the limited partners. Tax consequences
20
to holders of common units upon a sale or refinancing of our properties may cause the interests of the key employees of our advisor (who are also our executive officers and have ownership interests in our operating partnership) to differ from our stockholders.
Our conflicts of interest policy may not adequately address all of the conflicts of interest that may arise with respect to our activities.
In order to avoid any actual or perceived conflicts of interest with our directors or officers or our advisor’s employees, we adopted a conflicts of interest policy to address specifically some of the conflicts relating to our activities. Although under this policy the approval of a majority of our disinterested directors is required to approve any transaction, agreement or relationship in which any of our directors or officers or our advisor or it has an interest, there is no assurance that this policy will be adequate to address all of the conflicts that may arise or will address such conflicts in a manner that is favorable to us.
RISKS RELATED TO DERIVATIVE TRANSACTIONS
We have engaged in and may continue to engage in derivative transactions, which can limit our gains and expose us to losses.
We have entered into and may continue to enter into hedging transactions to (i) attempt to take advantage of changes in prevailing interest rates, (ii) protect our portfolio of mortgage assets from interest rate fluctuations, (iii) protect us from the effects of interest rate fluctuations on floating-rate debt, (iv) protect us from the risk of fluctuations in the financial and capital markets, or (v) preserve net cash in the event of a major downturn in the economy. Our hedging transactions may include entering into interest rate swap agreements, interest rate cap or floor agreements or flooridor and corridor agreements, credit default swaps and purchasing or selling futures contracts, purchasing or selling put and call options on securities or securities underlying futures contracts, or entering into forward rate agreements. Hedging activities may not have the desired beneficial impact on our results of operations or financial condition. Volatile fluctuations in market conditions could cause these instruments to become ineffective. Any gains or losses associated with these instruments are reported in our earnings each period. No hedging activity can completely insulate us from the risks inherent in our business.
Credit default hedging could fail to protect us or adversely affect us because if a swap counterparty cannot perform under the terms of our credit default swap, we may not receive payments due under such agreement and, thus, we may lose any potential benefit associated with such credit default swap. Additionally, we may also risk the loss of any cash collateral we have pledged to secure our obligations under such credit default swaps if the counterparty becomes insolvent or files for bankruptcy.
Moreover, interest rate hedging could fail to protect us or adversely affect us because, among other things:
|
•
|
available interest rate hedging may not correspond directly with the interest rate risk for which protections is sought;
|
|
•
|
the duration of the hedge may not match the duration of the related liability;
|
|
•
|
the party owing money in the hedging transaction may default on its obligation to pay;
|
|
•
|
the credit quality of the party owing money on the hedge may be downgraded to such an extent that it impairs our ability to sell or assign our side of the hedging transaction; and
|
|
•
|
the value of derivatives used for hedging may be adjusted from time to time in accordance with generally accepted accounting principles ("GAAP") to reflect changes in fair value and such downward adjustments, or “mark-to-market loss,” would reduce our stockholders’ equity.
|
Hedging involves both risks and costs, including transaction costs, which may reduce our overall returns on our investments. These costs increase as the period covered by the hedging relationship increases and during periods of rising and volatile interest rates. These costs will also limit the amount of cash available for distributions to stockholders. We generally intend to hedge to the extent management determines it is in our best interest given the cost of such hedging transactions as compared to the potential economic returns or protections offered. The REIT qualification rules may limit our ability to enter into hedging transactions by requiring us to limit our income and assets from hedges. If we are unable to hedge effectively because of the REIT rules, we will face greater interest rate exposure than may be commercially prudent.
We are subject to the risk of default or insolvency by the hospitality entities underlying our investments.
The leveraged capital structure of the hospitality entities underlying our investments will increase their exposure to adverse economic factors (such as rising interest rates, competitive pressures, downturns in the economy or deterioration in the condition of the real estate industry) and to the risk of unforeseen events. If an underlying entity cannot generate adequate cash flow to meet such entity’s debt obligations (which may include leveraged obligations in excess of its aggregate assets), it may default on its loan agreements or be forced into bankruptcy. As a result, we may suffer a partial or total loss of the capital we have invested in the securities and other investments of such entity.
21
The derivatives provisions of the Dodd-Frank Act and related rules could have an adverse effect on our ability to use derivative instruments to reduce the negative effect of interest rate fluctuations on our results of operations and liquidity, credit default risks and other risks associated with our business.
The Dodd-Frank Wall Street Reform and Consumer Protection Act (the “Dodd-Frank Act”) establishes federal oversight and regulation of the over-the-counter derivatives market and entities, including us, that participate in that market. As required by the Dodd-Frank Act, the Commodities Futures Trading Commission (the “CFTC”), the SEC and other regulators have adopted certain rules implementing the swaps regulatory provisions of the Dodd-Frank Act and are in the process of adopting other rules to implement those provisions. Numerous provisions of the Dodd-Frank Act and the CFTC’s rules relating to derivatives that qualify as “swaps” thereunder apply or may apply to the derivatives to which we are or may become a counterparty. Under such statutory provisions and the CFTC’s rules, we must clear on a derivatives clearing organization any over-the-counter swap we enter into that is within a class of swaps designated for clearing by CFTC rule and execute trades in such cleared swap on an exchange if the swap is accepted for trading on the exchange unless such swap is exempt from such mandatory clearing and trade execution requirements. We may qualify for and intend to elect the end-user exception from those requirements for swaps we enter to hedge our commercial risks and that are subject to the mandatory clearing and trade execution requirements. If we are required to clear or voluntarily elect to clear any swaps we enter into, those swaps will be governed by standardized agreements and we will have to post margin with respect to such swaps. To date, the CFTC has designated only certain types of interest rate swaps and credit default swaps for clearing and trade execution. Although we believe that none of the interest rate swaps and credit default swaps to which we are currently party fall within those designated types of swaps, we may enter into swaps in the future that will be subject to the mandatory clearing and trade execution requirements and subject to the risks described.
Rules recently adopted by banking regulators and the CFTC in accordance with a requirement of the Dodd-Frank Act require regulated financial institutions and swap dealers and major swap participants that are not regulated financial institutions to collect margin with respect to uncleared swaps to which they are parties and to which financial end users, among others, are their counterparties. We will qualify as a financial end user for purposes of such margin rules. We will not have to post initial margin with respect to our uncleared swaps under the new rules because we do not have material swaps exposure as defined in the new rules. However, we will be required to post variation margin (most likely in the form of cash collateral) with respect to each of our uncleared swaps subject to the new margin rules in an amount equal to the cumulative decrease in the mark-to-market value of such swap to our counterparty as of any date of determination from the value of such swap as of the date of the swap’s execution. The SEC has proposed margin rules for security-based swaps to which regulated financial institutions are not counterparties. Those proposed rules differ from the CFTC’s margin rules, but the final form that those rules will take and their effect is uncertain at this time.
The Dodd-Frank Act has caused certain market participants, and may cause other market participants, including the counterparties to our derivative instruments, to spin off some of their derivatives activities to separate entities. Those entities may not be as creditworthy as the historical counterparties to our derivatives.
Some of the rules required to implement the swaps-related provisions of the Dodd-Frank Act remain to be adopted, and the CFTC has, from time to time, issued and may in the future issue interpretations and no-action letters interpreting, and clarifying the application of, those provisions and the related rules or delaying compliance with those provisions and rules. As a result, it is not possible at this time to predict with certainty the full effects of the Dodd-Frank Act, the CFTC’s rules and the SEC’s rules on us and the timing of such effects.
The Dodd-Frank Act and the rules adopted thereunder could significantly increase the cost of derivative contracts (including from swap recordkeeping and reporting requirements and through requirements to post margin with respect to our swaps, which could adversely affect our available liquidity), materially alter the terms of derivative contracts, reduce the availability of derivatives to protect against risks we encounter, reduce our ability to monetize or restructure our existing derivative contracts, and increase our exposure to less creditworthy counterparties. If we reduce our use of derivatives as a result of the Dodd-Frank Act and the related rules, our results of operations may become more volatile and our cash flows may be less predictable, which could adversely affect our ability to plan for and fund capital expenditures and to pay dividends to our stockholders. Any of these consequences could have a material adverse effect on our consolidated financial position, results of operations and cash flows.
RISKS RELATED TO INVESTMENTS IN SECURITIES, MORTGAGES AND MEZZANINE LOANS
Our earnings are dependent, in part, upon the performance of our investment portfolio.
To the extent permitted by the Internal Revenue Code, we may invest in and own securities of other public companies and REITs (including Ashford Inc. and Ashford Prime). To the extent that the value of those investments declines or those investments do not provide an attractive return, our earnings and cash flow could be adversely affected.
22
Debt investments that are not United States government insured involve risk of loss.
As part of our business strategy, we may originate or acquire lodging-related uninsured and mortgage assets, including mezzanine loans. While holding these interests, we are subject to risks of borrower defaults, bankruptcies, fraud and related losses, and special hazard losses that are not covered by standard hazard insurance. Also, costs of financing the mortgage loans could exceed returns on the mortgage loans. In the event of any default under mortgage loans held by us, we will bear the risk of loss of principal and non-payment of interest and fees to the extent of any deficiency between the value of the mortgage collateral and the principal amount of the mortgage loan. We suffered significant impairment charges with respect to our investments in mortgage loans in 2009 and 2010. The value and the price of our securities may be adversely affected.
We may invest in non-recourse loans, which will limit our recovery to the value of the mortgaged property.
Our mortgage and mezzanine loan assets have typically been non-recourse. With respect to non-recourse mortgage loan assets, in the event of a borrower default, the specific mortgaged property and other assets, if any, pledged to secure the relevant mortgage loan, may be less than the amount owed under the mortgage loan. As to those mortgage loan assets that provide for recourse against the borrower and its assets generally, we cannot assure you that the recourse will provide a recovery in respect of a defaulted mortgage loan greater than the liquidation value of the mortgaged property securing that mortgage loan.
Investment yields affect our decision whether to originate or purchase investments and the price offered for such investments.
In making any investment, we consider the expected yield of the investment and the factors that may influence the yield actually obtained on such investment. These considerations affect our decision whether to originate or purchase an investment and the price offered for that investment. No assurances can be given that we can make an accurate assessment of the yield to be produced by an investment. Many factors beyond our control are likely to influence the yield on the investments, including, but not limited to, competitive conditions in the local real estate market, local and general economic conditions, and the quality of management of the underlying property. Our inability to accurately assess investment yields may result in our purchasing assets that do not perform as well as expected, which may adversely affect the price of our securities.
Volatility of values of mortgaged properties may adversely affect our mortgage loans.
Lodging property values and net operating income derived from lodging properties are subject to volatility and may be affected adversely by a number of factors, including the risk factors described herein relating to general economic conditions, operating lodging properties, and owning real estate investments. In the event its net operating income decreases, one of our borrowers may have difficulty paying our mortgage loan, which could result in losses to us. In addition, decreases in property values will reduce the value of the collateral and the potential proceeds available to our borrowers to repay our mortgage loans, which could also cause us to suffer losses.
Mezzanine loans involve greater risks of loss than senior loans secured by income-producing properties.
We may continue to make and acquire mezzanine loans. These types of loans are considered to involve a higher degree of risk than long-term senior mortgage lending secured by income-producing real property due to a variety of factors, including the loan being entirely unsecured or, if secured, becoming unsecured as a result of foreclosure by the senior lender. We may not recover some or all of our investment in these loans. In addition, mezzanine loans may have higher loan-to-value ratios than conventional mortgage loans resulting in less equity in the property and increasing the risk of loss of principal.
The assets associated with certain of our derivative transactions do not constitute qualified REIT assets and the related income will not constitute qualified REIT income. Significant fluctuations in the value of such assets or the related income could jeopardize our REIT status or result in additional tax liabilities.
We have entered into certain derivative transactions to protect against interest rate risks and credit default risks not specifically associated with debt incurred to acquire qualified REIT assets. The REIT provisions of the Internal Revenue Code limit our income and assets in each year from such derivative transactions. Failure to comply with the asset or income limitation within the REIT provisions of the Internal Revenue Code could result in penalty taxes or loss of our REIT status. If we elect to contribute the non-qualifying derivatives into a taxable REIT subsidiary to preserve our REIT status, such an action would result in any income from such transactions being subject to federal income taxation.
Our prior investment performance is not indicative of future results.
The performance of our prior investments is not necessarily indicative of the results that can be expected for the investments to be made by our investment subsidiary. On any given investment, total loss of the investment is possible. Although our management team has experience and has had success in making investments in real estate-related lodging debt and hotel assets, the past performance of these investments is not necessarily indicative of the results of our future investments.
23
Our investment portfolio will contain investments concentrated in a single industry and will not be fully diversified.
Our investment subsidiary was formed for the primary purpose of acquiring public securities and other investments of lodging-related entities. As such, our investment portfolio will contain investments concentrated in a single industry and may not be fully diversified by asset class, geographic region or other criteria, which will expose us to significant loss due to concentration risk. Investors have no assurance that the degree of diversification in our investment portfolio will increase at any time in the future.
The values of our investments are affected by the U.S. credit and financial markets and, as such, may fluctuate.
The U.S. credit and financial markets may experience severe dislocations and liquidity disruptions. The values of our investments are likely to be sensitive to the volatility of the U.S. credit and financial markets, and, to the extent that turmoil in the U.S. credit and financial markets continues or intensifies, such volatility has the potential to materially affect the value of our investment portfolio.
We may invest in securities for which there is no liquid market, and we may be unable to dispose of such securities at the time or in the manner that may be most favorable to us, which may adversely affect our business.
We may invest in securities for which there is no liquid market or which may be subject to legal and other restrictions on resale or otherwise be less liquid than publicly traded securities generally. The relative illiquidity of these investments may make it difficult for us to sell these investments when desired. In addition, if we are required to liquidate all or a portion of our portfolio quickly, we may realize significantly less than the value at which we had previously recorded these investments. Our investments may occasionally be subject to contractual or legal restrictions on resale or will be otherwise illiquid due to the fact that there is no established trading market for such securities, or such trading market is thinly traded. The relative illiquidity of such investments may make it difficult for us to dispose of them at a favorable price, and, as a result, we may suffer losses.
RISKS RELATED TO THE REAL ESTATE INDUSTRY
Illiquidity of real estate investments could significantly impede our ability to respond to adverse changes in the performance of our hotel properties and harm our financial condition.
Because real estate investments are relatively illiquid, our ability to sell promptly one or more hotel properties or mortgage loans in our portfolio for reasonable prices in response to changing economic, financial, and investment conditions is limited.
The real estate market is affected by many factors that are beyond our control, including:
|
•
|
adverse changes in international, national, regional and local economic and market conditions;
|
|
•
|
changes in interest rates and in the availability, cost, and terms of debt financing;
|
|
•
|
the ongoing need for capital improvements, particularly in older structures;
|
|
•
|
changes in operating expenses; and
|
|
•
|
civil unrest, acts of war or terrorism, and acts of God, including earthquakes, floods and other natural disasters, which may result in uninsured and underinsured losses.
|
We may decide to sell hotel properties or loans in the future. We cannot predict whether we will be able to sell any hotel property or loan for the price or on the terms set by us, or whether any price or other terms offered by a prospective purchaser would be acceptable to us. We may sell a property at a loss as compared to carrying value. We also cannot predict the length of time needed to find a willing purchaser and to close the sale of a hotel property or loan. Because we intend to offer more flexible terms on our mortgage loans than some providers of commercial mortgage loans, we may have more difficulty selling or participating our loans to secondary purchasers than would these more traditional lenders.
We may be required to expend funds to correct defects or to make improvements before a property can be sold. We cannot assure you that we will have funds available to correct those defects or to make those improvements. In acquiring a hotel property, we may agree to lock-out provisions that materially restrict us from selling that property for a period of time or impose other restrictions, such as a limitation on the amount of debt that can be placed or repaid on that property. These and other factors could impede our ability to respond to adverse changes in the performance of our hotel properties or a need for liquidity.
Increases in property taxes would increase our operating costs, reduce our income and adversely affect our ability to make distributions to our stockholders.
Each of our hotel properties will be subject to real and personal property taxes. These taxes may increase as tax rates change and as the properties are assessed or reassessed by taxing authorities. If property taxes increase, our financial condition, results
24
of operations and our ability to make distributions to our stockholders could be materially and adversely affected and the market price of our common stock could decline.
The costs of compliance with or liabilities under environmental laws may harm our operating results.
Operating expenses at our hotels could be higher than anticipated due to the cost of complying with existing or future environmental laws and regulations. In addition, our hotel properties and properties underlying our loan assets may be subject to environmental liabilities. An owner of real property, or a lender with respect to a property that exercises control over the property, can face liability for environmental contamination created by the presence or discharge of hazardous substances on the property. We may face liability regardless of:
|
•
|
our knowledge of the contamination;
|
|
•
|
the timing of the contamination;
|
|
•
|
the cause of the contamination; or
|
|
•
|
the party responsible for the contamination.
|
There may be environmental problems associated with our hotel properties or properties underlying our loan assets of which we are unaware. Some of our hotel properties or the properties underlying our loan assets use, or may have used in the past, underground tanks for the storage of petroleum-based or waste products that could create a potential for release of hazardous substances. If environmental contamination exists on a hotel property, we could become subject to strict, joint and several liabilities for the contamination if we own the property or if we foreclose on the property or otherwise have control over the property.
The presence of hazardous substances on a property we own or have made a loan with respect to may adversely affect our ability to sell, on favorable terms or at all, or foreclose on the property, and we may incur substantial remediation costs. The discovery of material environmental liabilities at our properties or properties underlying our loan assets could subject us to unanticipated significant costs.
We generally have environmental insurance policies on each of our owned properties, and we intend to obtain environmental insurance for any other properties that we may acquire. However, if environmental liabilities are discovered during the underwriting of the insurance policies for any property that we may acquire in the future, we may be unable to obtain insurance coverage for the liabilities at commercially reasonable rates or at all, and we may experience losses. In addition, we generally do not require our borrowers to obtain environmental insurance on the properties they own that secure their loans from us.
Numerous treaties, laws and regulations have been enacted to regulate or limit carbon emissions. Changes in the regulations and legislation relating to climate change, and complying with such laws and regulations, may require us to make significant investments in our hotels and could result in increased energy costs at our properties.
Our properties and the properties underlying our mortgage loans may contain or develop harmful mold, which could lead to liability for adverse health effects and costs of remediating the problem.
When excessive moisture accumulates in buildings or on building materials, mold growth may occur, particularly if the moisture problem remains undiscovered or is not addressed over a period of time. Some molds may produce airborne toxins or irritants. Concern about indoor exposure to mold has been increasing as exposure to mold may cause a variety of adverse health effects and symptoms, including allergic or other reactions. Some of the properties in our portfolio may contain microbial matter such as mold and mildew. As a result, the presence of significant mold at any of our properties or the properties underlying our loan assets could require us or our borrowers to undertake a costly remediation program to contain or remove the mold from the affected property. In addition, the presence of significant mold could expose us or our borrowers to liability from hotel guests, hotel employees, and others if property damage or health concerns arise.
Compliance with the Americans with Disabilities Act and fire, safety, and other regulations may require us or our borrowers to incur substantial costs.
All of our properties and properties underlying our mortgage loans are required to comply with the Americans with Disabilities Act of 1990, as amended (the “ADA”). The ADA requires that “public accommodations” such as hotels be made accessible to people with disabilities. Compliance with the ADA’s requirements could require removal of access barriers and non-compliance could result in imposition of fines by the U.S. government or an award of damages to private litigants, or both. In addition, we and our borrowers are required to operate our properties in compliance with fire and safety regulations, building codes, and other land use regulations as they may be adopted by governmental agencies and bodies and become applicable to our properties. Any requirement to make substantial modifications to our hotel properties, whether to comply with the ADA or other changes in governmental rules and regulations, could be costly.
25
We may obtain only limited warranties when we purchase a property and would have only limited recourse if our due diligence did not identify any issues that lower the value of our property, which could adversely affect our financial condition and ability to make distributions to our stockholders.
The seller of a property may sell such property in its “as is” condition on a “where is” basis and “with all faults,” without any warranties of merchantability or fitness for a particular use or purpose. In addition, purchase agreements may contain only limited warranties, representations and indemnifications that will only survive for a limited period after the closing. The purchase of properties with limited warranties increases the risk that we may lose some or all our invested capital in the property as well as the loss of income from that property.
We may experience uninsured or underinsured losses.
We have property and casualty insurance with respect to our hotel properties and other insurance, in each case, with loss limits and coverage thresholds deemed reasonable by our management team (and with the intent to satisfy the requirements of lenders and franchisors). In doing so, we have made decisions with respect to what deductibles, policy limits, and terms are reasonable based on management’s experience, our risk profile, the loss history of our property managers and our properties, the nature of our properties and our businesses, our loss prevention efforts, and the cost of insurance.
Various types of catastrophic losses may not be insurable or may not be economically insurable. In the event of a substantial loss, our insurance coverage may not cover the full current market value or replacement cost of our lost investment. Inflation, changes in building codes and ordinances, environmental considerations, and other factors might cause insurance proceeds to be insufficient to fully replace or renovate a hotel after it has been damaged or destroyed. Accordingly, there can be no assurance that:
|
•
|
the insurance coverage thresholds that we have obtained will fully protect us against insurable losses (i.e., losses may exceed coverage limits);
|
|
•
|
we will not incur large deductibles that will adversely affect our earnings;
|
|
•
|
we will not incur losses from risks that are not insurable or that are not economically insurable; or
|
|
•
|
current coverage thresholds will continue to be available at reasonable rates.
|
In the future, we may choose not to maintain terrorism insurance on any of our properties. As a result, one or more large uninsured or underinsured losses could have a material adverse effect on us.
Each of our current lenders requires us to maintain certain insurance coverage thresholds, and we anticipate that future lenders will have similar requirements. We believe that we have complied with the insurance maintenance requirements under the current governing loan documents and we intend to comply with any such requirements in any future loan documents. However, a lender may disagree, in which case the lender could obtain additional coverage thresholds and seek payment from us, or declare us in default under the loan documents. In the former case, we could spend more for insurance than we otherwise deem reasonable or necessary or, in the latter case, subject us to a foreclosure on hotels collateralizing one or more loans. In addition, a material casualty to one or more hotels collateralizing loans may result in the insurance company applying to the outstanding loan balance insurance proceeds that otherwise would be available to repair the damage caused by the casualty, which would require us to fund the repairs through other sources, or the lender foreclosing on the hotels if there is a material loss that is not insured.
RISKS RELATED TO OUR STATUS AS A REIT
If we do not qualify as a REIT, we will be subject to tax as a regular corporation and could face substantial tax liability.
We conduct operations so as to qualify as a REIT under the Internal Revenue Code. However, qualification as a REIT involves the application of highly technical and complex Internal Revenue Code provisions for which only a limited number of judicial or administrative interpretations exist. Even a technical or inadvertent mistake could jeopardize our REIT status. Due to the gain we recognized as a result of the spin-off of Ashford Prime, if Ashford Prime were to fail to qualify as a REIT for 2013, we may have failed to qualify as a REIT for 2013 and subsequent taxable years. Furthermore, new tax legislation, administrative guidance, or court decisions, in each instance potentially with retroactive effect, could make it more difficult or impossible for us to qualify as a REIT. The Protecting Americans from Tax Hikes Act of 2015 (the “PATH Act”) contained a number of changes to the Internal Revenue Code provisions applicable to REITs (with various effective dates), including, among others, (1) a reduction from 25% to 20% of the maximum permitted value of a REIT’s assets that can consist of stock or securities of one or more TRSs, (2) treatment of debt instruments issued by publicly offered REITs as “real estate assets” (however, unless such a debt instrument is secured by a mortgage or otherwise would have qualified as a real estate asset under prior law, (i) interest income and gain from such a debt instrument is not qualifying income for purposes of one of the REIT gross income tests, the 75% gross income test, and (ii) all such debt instruments may represent no more than 25% of the value of a REIT’s assets), and (3) a new 100% excise tax that applies
26
to the extent it is determined that a REIT has been undercharged for certain services provided by a taxable REIT subsidiary. We expect that the changes will not materially impact our operations, but will continue to monitor as regulatory guidance is issued.
If we fail to qualify as a REIT in any tax year, then:
|
•
|
we would be taxed as a regular domestic corporation, which, among other things, means being unable to deduct distributions to our stockholders in computing taxable income and being subject to U.S. federal income tax on our taxable income at regular corporate rates;
|
|
•
|
we would also be subject to federal alternative minimum tax for taxable years beginning before January 1, 2018, and, possibly, increased state and local income taxes;
|
|
•
|
any resulting tax liability could be substantial and would reduce the amount of cash available for distribution to stockholders; and
|
|
•
|
unless we were entitled to relief under applicable statutory provisions, we would be disqualified from treatment as a REIT for the subsequent four taxable years following the year that we lost our qualification, and, thus, our cash available for distribution to stockholders could be reduced for each of the years during which we did not qualify as a REIT.
|
If we fail to qualify as a REIT, we will not be required to make distributions to stockholders to maintain our tax status. As a result of all of these factors, our failure to qualify as a REIT could impair our ability to raise capital, expand our business, and make distributions to our stockholders and could adversely affect the value of our securities.
Even if we qualify and remain qualified as a REIT, we may face other tax liabilities that reduce our cash flow.
Even if we qualify and remain qualified for taxation as a REIT, we may be subject to certain federal, state, and local taxes on our income and assets. For example:
|
•
|
We will be required to pay tax on undistributed REIT taxable income.
|
|
•
|
If we have net income from the disposition of foreclosure property held primarily for sale to customers in the ordinary course of business or other non-qualifying income from foreclosure property, we must pay tax on that income at the highest corporate rate.
|
|
•
|
If we sell a property in a “prohibited transaction,” our gain from the sale would be subject to a 100% penalty tax.
|
|
•
|
Each of our taxable REIT subsidiaries is a fully taxable corporation and will be subject to federal and state taxes on its income.
|
|
•
|
We may continue to experience increases in our state and local income tax burden. Over the past several years, certain state and local taxing authorities have significantly changed their income tax regimes in order to raise revenues. The changes enacted that have increased our state and local income tax burden include the taxation of modified gross receipts (as opposed to net taxable income), the suspension of and/or limitation on the use of net operating loss deductions, increases in tax rates and fees, the addition of surcharges, and the taxation of our partnership income at the entity level. Facing mounting budget deficits, more state and local taxing authorities have indicated that they are going to revise their income tax regimes in this fashion and/or eliminate certain federally allowed tax deductions such as the REIT dividends paid deduction.
|
Failure to make required distributions would subject us to U.S. federal corporate income tax.
We intend to operate in a manner so as to allow us to continue to qualify as a REIT for U.S. federal income tax purposes. In order to continue to qualify as a REIT, we generally are required to distribute at least 90% of our REIT taxable income, determined without regard to the dividends paid deduction and excluding any net capital gain, each year to our stockholders. To the extent that we satisfy this distribution requirement, but distribute less than 100% of our REIT taxable income, we will be subject to U.S. federal corporate income tax on our undistributed taxable income. In addition, we will be subject to a 4% nondeductible excise tax if the actual amount that we pay out to our stockholders in a calendar year is less than a minimum amount specified under the Internal Revenue Code.
Our TRS lessee structure increases our overall tax liability.
Our TRS lessees are subject to federal, state and local income tax on their taxable income, which consists of the revenues from the hotel properties leased by our TRS lessees, net of the operating expenses for such hotel properties and rent payments to us. Accordingly, although our ownership of our TRS lessees allows us to participate in the operating income from our hotel properties in addition to receiving fixed rent, the net operating income is fully subject to income tax. The after-tax net income of our TRS lessees is available for distribution to us.
27
If our leases with our TRS lessees are not respected as true leases for federal income tax purposes, we would fail to qualify as a REIT.
To qualify as a REIT, we are required to satisfy two gross income tests, pursuant to which specified percentages of our gross income must be passive income, such as rent. For the rent paid pursuant to the hotel leases with our TRS lessees, which constitutes substantially all of our gross income, to qualify for purposes of the gross income tests, the leases must be respected as true leases for federal income tax purposes and must not be treated as service contracts, joint ventures or some other type of arrangement. We have structured our leases, and intend to structure any future leases, so that the leases will be respected as true leases for federal income tax purposes, but the IRS may not agree with this characterization. If the leases were not respected as true leases for federal income tax purposes, we would not be able to satisfy either of the two gross income tests applicable to REITs and likely would fail to qualify as a REIT.
Our ownership of TRSs is limited and our transactions with our TRSs will cause us to be subject to a 100% penalty tax on certain income or deductions if those transactions are not conducted on arm’s-length terms.
A REIT may own up to 100% of the stock of one or more TRSs. A TRS may hold assets and earn income that would not be qualifying assets or income if held or earned directly by a REIT, including gross operating income from hotels that are operated by eligible independent contractors pursuant to hotel management agreements. Both the subsidiary and the REIT must jointly elect to treat the subsidiary as a TRS. A corporation of which a TRS directly or indirectly owns more than 35% of the voting power or value of the stock will automatically be treated as a TRS. Overall, no more than 25% (20% with respect to taxable years beginning after December 31, 2017) of the value of a REIT’s assets may consist of stock or securities of one or more TRSs. In addition, the TRS rules limit the deductibility of interest paid or accrued by a TRS to its parent REIT to assure that the TRS is subject to an appropriate level of corporate taxation. The rules also impose a 100% excise tax on certain transactions between a TRS and its parent REIT that are not conducted on an arm’s-length basis. Finally, for taxable years ending after December 31, 2015, the 100% excise tax also applies to the underpricing of services by a TRS to its parent REIT in contexts where the services are unrelated to services for REIT tenants.
Our TRSs are subject to federal, foreign, state and local income tax on their taxable income, and their after-tax net income is available for distribution to us but is not required to be distributed to us. We believe that the aggregate value of the stock and securities of our TRSs is less than 20% of the value of our total assets (including our TRS stock and securities).
We monitor the value of our respective investments in our TRSs for the purpose of ensuring compliance with TRS ownership limitations. In addition, we scrutinize all of our transactions with our TRSs to ensure that they are entered into on arm’s-length terms to avoid incurring the 100% excise tax described above. For example, in determining the amounts payable by our TRSs under our leases, we engaged a third party to prepare transfer pricing studies to ascertain whether the lease terms we established are on an arm’s-length basis as required by applicable Treasury Regulations. However the receipt of a transfer pricing study does not prevent the IRS from challenging the arm’s length nature of the lease terms between a REIT and its TRS lessees. Consequently, there can be no assurance that we will be able to avoid application of the 100% excise tax discussed above.
If our hotel managers do not qualify as “eligible independent contractors,” we would fail to qualify as a REIT.
Rent paid by a lessee that is a “related party tenant” of ours is not qualifying income for purposes of the two gross income tests applicable to REITs. We lease all of our hotels to our TRS lessees. A TRS lessee will not be treated as a “related party tenant,” and will not be treated as directly operating a lodging facility, which is prohibited, to the extent the TRS lessee leases properties from us that are managed by an “eligible independent contractor.”
We believe that the rent paid by our TRS lessees is qualifying income for purposes of the REIT gross income tests and that our TRSs qualify to be treated as TRSs for U.S. federal income tax purposes, but there can be no assurance that the IRS will not challenge this treatment or that a court would not sustain such a challenge. If the IRS were successful in challenging this treatment, it is possible that we would fail to meet the asset tests applicable to REITs and substantially all of our income would fail to qualify for the gross income tests. If we failed to meet either the asset or gross income tests, we would likely lose our REIT qualification for U.S. federal income tax purposes, unless certain relief provisions applied.
If our hotel managers do not qualify as “eligible independent contractors,” we would fail to qualify as a REIT. Each of the hotel management companies that enters into a management contract with our TRS lessees must qualify as an “eligible independent contractor” under the REIT rules in order for the rent paid to us by our TRS lessees to be qualifying income for our REIT income test requirements. Among other requirements, in order to qualify as an eligible independent contractor a manager must not own more than 35% of our outstanding shares (by value) and no person or group of persons can own more than 35% of our outstanding shares and the ownership interests of the manager, taking into account only owners of more than 5% of our shares and, with respect to ownership interests in such managers that are publicly-traded, only holders of more than 5% of such ownership interests.
28
Complex ownership attribution rules apply for purposes of these 35% thresholds. Although we intend to monitor ownership of our shares by our property managers and their owners, there can be no assurance that these ownership levels will not be exceeded.
Dividends payable by REITs do not qualify for the reduced tax rates available for some dividends.
The maximum U.S. federal income tax rate applicable to “qualified dividend income” payable to U.S. stockholders that are taxed at individual rates is 20%. Dividends payable by REITs, however, generally are not eligible for this reduced maximum rate on qualified dividend income. However, under the Tax Cuts and Jobs Act a non-corporate taxpayer may deduct 20% of ordinary REIT dividends that are not “capital gain dividends” or “qualified dividend income” resulting in an effective maximum federal income tax rate of 29.6%. Individuals, trusts and estates whose income exceeds certain thresholds are also subject to a 3.8% Medicare tax on dividends received from us. The more favorable rates applicable to regular corporate qualified dividends could cause investors who are taxed at individual rates to perceive investments in REITs to be relatively less attractive than investments in the stocks of non-REIT corporations that pay dividends, which could adversely affect the value of the shares of REITs, including our stock.
If our operating partnership failed to qualify as a partnership for federal income tax purposes, we would cease to qualify as a REIT and would be subject to higher taxes and have less cash available for distribution to our stockholders and suffer other adverse consequences.
We believe that our operating partnership qualifies to be treated as a partnership for federal income tax purposes. As a partnership, our operating partnership is not subject to federal income tax on its income. Instead, each of its partners, including us, is required to pay tax on its allocable share of the operating partnership's income. No assurance can be provided, however, that the IRS will not challenge its status as a partnership for federal income tax purposes, or that a court would not sustain such a challenge. If the IRS were successful in treating our operating partnership as a corporation for tax purposes, we would fail to meet the gross income tests and certain of the asset tests applicable to REITs and, accordingly, cease to qualify as a REIT. Also, the failure of our operating partnership to qualify as a partnership would cause it to become subject to federal and state corporate income tax, which would reduce significantly the amount of cash available for debt service and for distribution to its partners, including us.
Note that although partnerships have traditionally not been subject to federal income tax at the entity level as described above, new audit rules, currently scheduled to become effective for tax years ending after December 31, 2017, will generally apply to the partnership. Under the new rules, unless an entity elects otherwise, taxes arising from audit adjustments are required to be paid by the entity rather than by its partners or members. We may utilize exceptions available under the new provisions (including any changes) and Treasury Regulations so that the partners, to the fullest extent possible, rather than the partnership itself, will be liable for any taxes arising from audit adjustments to the issuing entity’s taxable income. It is unclear to what extent these elections will be available to the partnership and how any such elections may affect the procedural rules available to challenge any audit adjustment that would otherwise be available in the absence of any such elections. Proposed temporary and final Treasury Regulations have been promulgated implementing portions of these new partnership audit rules, but questions remain as to the application of the rules.
Investors are urged to consult with their tax advisors regarding the possible effect of the new rules.
Complying with REIT requirements may cause us to forego otherwise attractive opportunities.
To qualify as a REIT for federal income tax purposes, we must continually satisfy tests concerning, among other things, the sources of our income, the nature and diversification of our assets, the amounts we distribute to our stockholders, and the ownership of our stock. We may be required to make distributions to stockholders at disadvantageous times or when we do not have funds readily available for distribution. We may elect to pay dividends on our common stock in cash or a combination of cash and shares of securities as permitted under federal income tax laws governing REIT distribution requirements. Thus, compliance with the REIT requirements may hinder our ability to operate solely on the basis of maximizing profits.
Complying with REIT requirements may limit our ability to hedge effectively.
The REIT provisions of the Internal Revenue Code may limit our ability to hedge mortgage securities and related borrowings by requiring us to limit our income and assets in each year from certain hedges, together with any other income not generated from qualified real estate assets, to no more than 25% of our gross income. In addition, we must limit our aggregate income from nonqualified hedging transactions, from our provision of services, and from other non-qualifying sources to no more than 5% of our annual gross income. As a result, we may have to limit our use of advantageous hedging techniques. This could result in greater risks associated with changes in interest rates than we would otherwise want to incur. However, for transactions that we enter into to protect against interest rate risks on debt incurred to acquire qualified REIT assets and for which we identify as hedges for tax purposes, any associated hedging income is excluded from the 95% income test and the 75% income test applicable to a REIT.
29
In addition, for taxable years ending after December 31, 2015, similar rules apply to income from positions that primarily manage risk with respect to a prior hedge entered into by a REIT in connection with the extinguishment or disposal (in whole or in part) of the liability or asset related to such prior hedge, to the extent the new position qualifies as a hedge or would so qualify if the hedged position were ordinary property. If we were to violate the 25% or 5% limitations, we may have to pay a penalty tax equal to the amount of income in excess of those limitations multiplied by a fraction intended to reflect our profitability. If we fail to satisfy the REIT gross income tests, unless our failure was due to reasonable cause and not due to willful neglect, we could lose our REIT status for federal income tax purposes.
Complying with REIT requirements may force us to liquidate otherwise attractive investments.
To qualify as a REIT, we must also ensure that at the end of each calendar quarter at least 75% of the value of our assets consists of cash, cash items, government securities, and qualified REIT real estate assets. The remainder of our investment in securities (other than government securities and qualified real estate assets) generally cannot include more than 10% of the outstanding voting securities of any one issuer or more than 10% of the total value of the outstanding securities of any one issuer. In addition, in general, no more than 5% of the value of our assets (other than government securities and qualified real estate assets) can consist of the securities of any one issuer, and no more than 25% (20% with respect to taxable years beginning after December 31, 2017) of the value of our total assets can be represented by securities of one or more taxable REIT subsidiaries, no more than 25% of the value of our total assets can be represented by certain publicly offered REIT debt instruments.
If we fail to comply with these requirements at the end of any calendar quarter, we must correct such failure within 30 days after the end of the calendar quarter to avoid losing our REIT status and suffering adverse tax consequences. As a result, we may be required to liquidate otherwise attractive investments.
Complying with REIT requirements may force us to borrow to make distributions to our stockholders.
As a REIT, we must distribute at least 90% of our annual REIT taxable income, excluding net capital gains, (subject to certain adjustments) to our stockholders. To the extent that we satisfy the distribution requirement, but distribute less than 100% of our taxable income, we will be subject to federal corporate income tax on our undistributed taxable income. In addition, we will be subject to a 4% nondeductible excise tax if the actual amount that we pay out to our stockholders in a calendar year is less than a minimum amount specified under federal tax laws.
From time to time, we may generate taxable income greater than our net income for financial reporting purposes or our taxable income may be greater than our cash flow available for distribution to our stockholders. If we do not have other funds available in these situations, we could be required to borrow funds, sell investments at disadvantageous prices, or find another alternative source of funds to make distributions sufficient to enable us to pay out enough of our taxable income to satisfy the distribution requirement and to avoid corporate income tax and the 4% excise tax in a particular year. These alternatives could increase our costs or reduce the value of our equity. We may elect to pay dividends on our common stock in cash or a combination of cash and shares of securities as permitted under U.S. federal income tax laws governing REIT distribution requirements. To the extent that we make distributions in excess of our current and accumulated earnings and profits (as determined for U.S. federal income tax purposes), such distributions would generally be considered a return of capital for U.S. federal income tax purposes to the extent of the holder's adjusted tax basis in its shares. A return of capital is not taxable, but it has the effect of reducing the holder's adjusted tax basis in its investment. To the extent that distributions exceed the adjusted tax basis of a holder's shares, they will be treated as gain from the sale or exchange of such stock.
We may in the future choose to pay taxable dividends in our shares of our common stock instead of cash, in which case stockholders may be required to pay income taxes in excess of the cash dividends they receive.
We may distribute taxable dividends that are payable in cash and common stock at the election of each stockholder, subject to certain limitations, including that the cash portion be at least 20% of the total distribution.
If we made a taxable dividend payable in cash and common stock, taxable stockholders receiving such dividends will be required to include the full amount of the dividend as ordinary income to the extent of our current and accumulated earnings and profits, as determined for U.S. federal income tax purposes. As a result, stockholders may be required to pay income taxes with respect to such dividends in excess of the cash dividends received. If a U.S. stockholder sells the shares of common stock that it receives as a dividend in order to pay this tax, the sales proceeds may be less than the amount included in income with respect to the dividend, depending on the market price of our shares at the time of the sale. Furthermore, with respect to certain non-U.S. stockholders, we may be required to withhold U.S. federal income tax with respect to such dividends, including in respect of all or a portion of such dividend that is payable in shares of common stock. In addition, if we made a taxable dividend payable in cash and our common stock and a significant number of our stockholders determine to sell shares of our common stock in order to pay taxes owed on dividends, it may put downward pressure on the trading price of our common stock. We do not currently intend to pay taxable dividends of our common stock and cash, although we may choose to do so in the future.
30
The prohibited transactions tax may limit our ability to dispose of our properties.
A REIT’s net income from prohibited transactions is subject to a 100% tax. In general, prohibited transactions are sales or other dispositions of property, other than foreclosure property, held primarily for sale to customers in the ordinary course of business. We may be subject to the prohibited transaction tax equal to 100% of net gain upon a disposition of real property. Although a safe harbor to the characterization of the sale of real property by a REIT as a prohibited transaction is available, we cannot assure you that we can comply with the safe harbor or that we will avoid owning property that may be characterized as held primarily for sale to customers in the ordinary course of business. Consequently, we may choose not to engage in certain sales of our properties or may conduct such sales through our TRS, which would be subject to federal and state income taxation.
The ability of our board of directors to revoke our REIT qualification without stockholder approval may cause adverse consequences to our stockholders
Our charter provides that our board of directors may revoke or otherwise terminate our REIT election, without the approval of our stockholders, if it determines that it is no longer in our best interest to continue to qualify as a REIT. If we cease to qualify as a REIT, we would become subject to U.S. federal and state and local income taxes on our taxable income and would no longer be required to distribute most of our taxable income to our stockholders, which may have adverse consequences on the total stockholder return received by our stockholders.
We may be subject to adverse legislative or regulatory tax changes that could reduce the market price of our securities.
At any time, the U.S. federal income tax laws governing REITs or the administrative interpretations of those laws may be amended. We cannot predict when or if any new U.S. federal income tax law, regulation or administrative interpretation, or any amendment to any existing U.S. federal income tax law, regulation or administrative interpretation, will be adopted, promulgated or become effective and any such law, regulation, or interpretation may take effect retroactively. We and our stockholders could be adversely affected by any such change in the U.S. federal income tax laws, regulations or administrative interpretations. The Tax Cuts and Jobs Act signed into law by the President on December 22, 2017 made significant changes to the U.S. federal income tax rules for taxation of individuals and corporations. The Tax Cuts and Jobs Act makes numerous other changes to the tax rules that do not affect REITs directly but may affect our shareholders and may indirectly affect us. These changes could have an adverse effect on an investment in our shares or on the market value or the resale potential of our assets. It is possible that future legislation would result in a REIT having fewer advantages, and it could become more advantageous for a company that invests in real estate to elect to be taxed, for federal income tax purposes, as a corporation.
If Ashford Prime failed to qualify as a REIT for 2013, it would significantly affect our ability to maintain our REIT status.
For federal income tax purposes, we recorded a gain of approximately $145.7 million as a result of the spin-off of Ashford Prime in November 2013. If Ashford Prime qualified for taxation as a REIT for 2013, that gain was qualifying income for purposes of our 2013 REIT income tests. If, however, Ashford Prime failed to qualify as a REIT for 2013, that gain would be non-qualifying income for purposes of the 75% gross income test. Although Ashford Prime covenanted in the Separation and Distribution Agreement to use reasonable best efforts to qualify as a REIT in 2013, no assurance can be given that it so qualified. If Ashford Prime failed to qualify, we would have failed our 2013 REIT income tests, which would either result in our loss of our REIT status for 2013 and the following 4 taxable years or result in a significant tax in 2013 that has not been accrued or paid and thereby would materially negatively impact our business, financial condition and potentially impair our ability to continue operating in the future.
Your investment in our securities has various federal, state, and local income tax risks that could affect the value of your investment.
We strongly urge you to consult your own tax advisor concerning the effects of federal, state, and local income tax law on an investment in our securities because of the complex nature of the tax rules applicable to REITs and their stockholders.
Our failure to qualify as a REIT would potentially give rise to a claim for damages from Ashford Prime.
In connection with the spin-off of Ashford Prime, which was completed in November 2013, we represented in the Separation and Distribution Agreement with Ashford Prime that we have no knowledge of any fact or circumstance that would cause us to fail to qualify as a REIT. In the event of a breach of this representation, Ashford Prime may be able to seek damages from us, which could have a significantly negative effect on our liquidity and results of operations.
Declines in the values of our investments may make it more difficult for us to maintain our qualification as a REIT or exemption from the Investment Company Act.
If the market value or income potential of real estate-related investments declines as a result of increased interest rates or other factors, we may need to increase our real estate-related investments and income or liquidate our non-qualifying assets in
31
order to maintain our REIT qualification or exemption from the Investment Company Act of 1940 (the “Investment Company Act”). If the decline in real estate asset values and/or income occurs quickly, this may be especially difficult to accomplish. This difficulty may be exacerbated by the illiquid nature of any non-qualifying assets that we may own. We may have to make investment decisions that we otherwise would not make absent the REIT and Investment Company Act considerations.
RISKS RELATED TO OUR CORPORATE STRUCTURE
Our charter, the partnership agreement of our operating partnership and Maryland law contain provisions that may delay or prevent a change of control transaction.
Our charter contains 9.8% ownership limits. For the purpose of preserving our REIT qualification, our charter prohibits direct or constructive ownership by any person of more than (i) 9.8% of the lesser of the total number or value (whichever is more restrictive) of the outstanding shares of our common stock or (ii) 9.8% of the total number or value (whichever is more restrictive) of the outstanding shares of any class or series of our preferred stock or any other stock of our company, unless our board of directors grants a waiver.
Our charter’s constructive ownership rules are complex and may cause stock owned actually or constructively by a group of related individuals and/or entities to be deemed to be constructively owned by one individual or entity. As a result, the acquisition of less than 9.8% of any class or series of our stock by an individual or entity could nevertheless cause that individual or entity to own constructively in excess of 9.8% of a class or series of outstanding stock, and thus be subject to our charter’s ownership limit. Any attempt to own or transfer shares of our stock in excess of the ownership limit without the consent of our board of directors will be void, and could result in the shares being automatically transferred to a charitable trust.
Our board of directors may create and issue a class or series of preferred stock without stockholder approval.
Our charter authorizes our board of directors to issue preferred stock in one or more classes and to establish the preferences and rights of any class of preferred stock issued. These actions can be taken without soliciting stockholder approval. Our preferred stock issuances could have the effect of delaying or preventing someone from taking control of us, even if a change in control were in our stockholders’ best interests.
Certain provisions in the partnership agreement for our operating partnership may delay or prevent unsolicited acquisitions of us.
Provisions in the partnership agreement for our operating partnership may delay or make more difficult unsolicited acquisitions of us or changes in our control. These provisions could discourage third parties from making proposals involving an unsolicited acquisition of us or change of our control, although some stockholders might consider such proposals, if made, desirable. These provisions include, among others:
|
•
|
redemption rights of qualifying parties;
|
|
•
|
transfer restrictions on our common units;
|
|
•
|
the ability of the general partner in some cases to amend the partnership agreement without the consent of the limited partners; and
|
|
•
|
the right of the limited partners to consent to transfers of the general partnership interest and mergers under specified circumstances.
|
Because provisions contained in Maryland law and our charter may have an anti-takeover effect, investors may be prevented from receiving a “control premium” for their shares.
Provisions contained in our charter and Maryland general corporation law may have effects that delay, defer, or prevent a takeover attempt, which may prevent stockholders from receiving a “control premium” for their shares. For example, these provisions may defer or prevent tender offers for our common stock or purchases of large blocks of our common stock, thereby limiting the opportunities for our stockholders to receive a premium for their common stock over then-prevailing market prices.
These provisions include the following:
|
•
|
Ownership limit: The ownership limit in our charter limits related investors, including, among other things, any voting group, from acquiring over 9.8% of our common stock without our permission.
|
|
•
|
Classification of preferred stock: Our charter authorizes our board of directors to issue preferred stock in one or more classes and to establish the preferences and rights of any class of preferred stock issued. These actions can be taken without soliciting stockholder approval. Our preferred stock issuances could have the effect of delaying or preventing someone from taking control of us, even if a change in control were in our stockholders’ best interests.
|
32
Maryland statutory law provides that an act of a director relating to or affecting an acquisition or a potential acquisition of control of a corporation may not be subject to a higher duty or greater scrutiny than is applied to any other act of a director. Hence, directors of a Maryland corporation are not required to act in certain takeover situations under the same standards as apply in Delaware and other corporate jurisdictions.
We depend on our operating partnership and its subsidiaries for cash flow and are effectively structurally subordinated in right of payment to the obligations of our operating partnership and its subsidiaries, which could adversely affect our ability to make distributions to our stockholders.
We have no business operations of our own. Our only significant asset is and will be the general and limited partnership interests of our operating partnership. We conduct, and intend to continue to conduct, all of our business operations through our operating partnership. Accordingly, our only source of cash to pay our obligations is distributions from our operating partnership and its subsidiaries of their net earnings and cash flows. We cannot assure our stockholders that our operating partnership or its subsidiaries will be able to, or be permitted to, make distributions to us that will enable us to make distributions to our stockholders from cash flows from operations. Each of our operating partnership’s subsidiaries is a distinct legal entity and, under certain circumstances, legal and contractual restrictions may limit our ability to obtain cash from such entities. Therefore, in the event of our bankruptcy, liquidation or reorganization, our assets and those of our operating partnership and its subsidiaries will be able to satisfy the claims of our stockholders only after all of our and our operating partnership and its subsidiaries liabilities and obligations have been paid in full.
Offerings of debt securities, which would be senior to our common stock and any preferred stock upon liquidation, or equity securities, which would dilute our existing stockholders’ holdings and could be senior to our common stock for the purposes of dividend distributions, may adversely affect the market price of our common stock and any preferred stock.
We may attempt to increase our capital resources by making additional offerings of debt or equity securities, including commercial paper, medium-term notes, senior or subordinated notes, convertible securities, and classes of preferred stock or common stock or classes of preferred units. Upon liquidation, holders of our debt securities or preferred units and lenders with respect to other borrowings will receive a distribution of our available assets prior to the holders of shares of preferred stock or common stock. Furthermore, holders of our debt securities and preferred stock or preferred units and lenders with respect to other borrowings will receive a distribution of our available assets prior to the holders of our common stock. Additional equity offerings may dilute the holdings of our existing stockholders or reduce the market price of our common or preferred stock or both. Our preferred stock or preferred units could have a preference on liquidating distributions or a preference on dividend payments that could limit our ability to make a dividend distribution to the holders of our common stock. Because our decision to issue securities in any future offering will depend on market conditions and other factors beyond our control, we cannot predict or estimate the amount, timing, or nature of our future offerings. Thus, our stockholders bear the risk of our future offerings reducing the market price of our securities and diluting their securities holdings in us.
Securities eligible for future sale may have adverse effects on the market price of our securities.
We cannot predict the effect, if any, of future sales of securities, or the availability of securities for future sales, on the market price of our outstanding securities. Sales of substantial amounts of common stock, or the perception that these sales could occur, may adversely affect prevailing market prices for our securities.
We also may issue from time to time additional shares of our securities or units of our operating partnership in connection with the acquisition of properties and we may grant additional demand or piggyback registration rights in connection with these issuances. Sales of substantial amounts of our securities or the perception that such sales could occur may adversely affect the prevailing market price for our securities or may impair our ability to raise capital through a sale of additional debt or equity securities.
An increase in market interest rates may have an adverse effect on the market price of our securities.
A factor investors may consider in deciding whether to buy or sell our securities is our dividend rate as a percentage of our share or unit price relative to market interest rates. If market interest rates increase, prospective investors may desire a higher dividend or interest rate on our securities or seek securities paying higher dividends or interest. The market price of our securities is likely based on the earnings and return that we derive from our investments, income with respect to our properties, and our related distributions to stockholders and not from the market value or underlying appraised value of the properties or investments themselves. As a result, interest rate fluctuations and capital market conditions can affect the market price of our securities. For instance, if interest rates rise without an increase in our dividend rate, the market price of our common or preferred stock could decrease because potential investors may require a higher dividend yield on our common or preferred stock as market rates on interest-bearing securities, such as bonds, rise. In addition, rising interest rates would result in increased interest expense on our variable-rate debt, thereby adversely affecting cash flow and our ability to service our indebtedness and pay dividends.
33
Our board of directors can take many actions without stockholder approval.
Our board of directors has overall authority to oversee our operations and determine our major corporate policies. This authority includes significant flexibility. For example, our board of directors can do the following:
|
•
|
terminate our advisor under certain conditions pursuant to advisory agreement, subject to the payment of a termination fee;
|
|
•
|
amend or revise at any time and from time to time our investment, financing, borrowing and dividend policies and our policies with respect to all other activities, including growth, debt, capitalization and operations, subject to the limitations and restrictions provided in our advisory agreement and mutual exclusivity agreement;
|
|
•
|
amend our policies with respect to conflicts of interest provided that such changes are consistent with applicable legal requirements;
|
|
•
|
subject to the terms of our charter, prevent the ownership, transfer and/or accumulation of shares in order to protect our status as a REIT or for any other reason deemed to be in the best interests of us and our stockholders;
|
|
•
|
issue additional shares without obtaining stockholder approval, which could dilute the ownership of our then-current stockholders;
|
|
•
|
amend our charter to increase or decrease the aggregate number of shares of stock or the number of shares of stock of any class or series, without obtaining stockholder approval;
|
|
•
|
classify or reclassify any unissued shares of our common stock or preferred stock and set the preferences, rights and other terms of such classified or reclassified shares, without obtaining stockholder approval;
|
|
•
|
employ and compensate affiliates;
|
|
•
|
direct our resources toward investments that do not ultimately appreciate over time; and
|
|
•
|
determine that it is not in our best interests to attempt to qualify, or to continue to qualify, as a REIT.
|
Any of these actions could increase our operating expenses, impact our ability to make distributions or reduce the value of our assets without giving you, as a stockholder, the right to vote.
The ability of our board of directors to change our major policies without the consent of stockholders may not be in our stockholders’ interest.
Our board of directors determines our major policies, including policies and guidelines relating to our acquisitions, leverage, financing, growth, operations and distributions to stockholders. Our board of directors may amend or revise these and other policies and guidelines from time to time without the vote or consent of our stockholders, subject to certain limitations and restrictions provided in our advisory agreement. Accordingly, our stockholders will have limited control over changes in our policies and those changes could adversely affect our financial condition, results of operations, the market price of our stock and our ability to make distributions to our stockholders.
Our rights and the rights of our stockholders to take action against our directors and officers are limited.
Maryland law provides that a director or officer has no liability in that capacity if he or she performs his or her duties in good faith, in a manner he or she reasonably believes to be in our best interests and with the care that an ordinarily prudent person in a like position would use under similar circumstances. In addition, our charter eliminates our directors’ and officers’ liability to us and our stockholders for money damages except for liability resulting from actual receipt of an improper benefit or profit in money, property or services or active and deliberate dishonesty established by a final judgment to have been material to the cause of action. Our charter requires us to indemnify our directors and officers to the maximum extent permitted by Maryland law for liability actually incurred in connection with any proceeding to which they may be made, or threatened to be made, a party, except to the extent that the act or omission of the director or officer was material to the matter giving rise to the proceeding and was either committed in bad faith or was the result of active and deliberate dishonesty, the director or officer actually received an improper personal benefit in money, property or services, or, in the case of any criminal proceeding, the director or officer had reasonable cause to believe that the act or omission was unlawful. As a result, we and our stockholders may have more limited rights against our directors and officers than might otherwise exist under common law. In addition, we may be obligated to fund the defense costs incurred by our directors and officers.
Item 1B.
Unresolved Staff Comments
None.
34
|
Item 2.
|
Properties
|
OFFICES.
We lease our headquarters located at 14185 Dallas Parkway, Suite 1100, Dallas, Texas 75254.
HOTEL PROPERTIES.
As of
December 31, 2017
, we had ownership interests in
120
hotel properties that were included in our consolidated operations, which included direct ownership in
118
hotel properties and 85% ownership in
two
hotel properties through equity investments with joint venture partners. Currently, all of our hotel properties are located in the United States. The following table presents certain information related to our hotel properties:
|
Hotel Property
|
Location
|
Service Type
|
Total Rooms
|
% Owned
|
Owned Rooms
|
Year Ended December 31, 2017
|
||||||||||||||||||
|
Occupancy
|
ADR
|
RevPAR
|
||||||||||||||||||||||
|
Fee Simple Properties
|
||||||||||||||||||||||||
|
Embassy Suites
|
Austin, TX
|
Full service
|
150
|
|
100
|
%
|
150
|
|
84.96
|
%
|
$
|
159.53
|
|
$
|
135.54
|
|
||||||||
|
Embassy Suites
|
Dallas, TX
|
Full service
|
150
|
|
100
|
|
150
|
|
81.27
|
%
|
$
|
135.47
|
|
$
|
110.09
|
|
||||||||
|
Embassy Suites
|
Herndon, VA
|
Full service
|
150
|
|
100
|
|
150
|
|
82.17
|
%
|
$
|
157.73
|
|
$
|
129.60
|
|
||||||||
|
Embassy Suites
|
Las Vegas, NV
|
Full service
|
220
|
|
100
|
|
220
|
|
92.30
|
%
|
$
|
133.02
|
|
$
|
122.78
|
|
||||||||
|
Embassy Suites
|
Flagstaff, AZ
|
Full service
|
119
|
|
100
|
|
119
|
|
85.54
|
%
|
$
|
150.70
|
|
$
|
128.91
|
|
||||||||
|
Embassy Suites
|
Houston, TX
|
Full service
|
150
|
|
100
|
|
150
|
|
81.01
|
%
|
$
|
154.11
|
|
$
|
124.84
|
|
||||||||
|
Embassy Suites
|
West Palm Beach, FL
|
Full service
|
160
|
|
100
|
|
160
|
|
85.50
|
%
|
$
|
146.17
|
|
$
|
124.98
|
|
||||||||
|
Embassy Suites
|
Philadelphia, PA
|
Full service
|
263
|
|
100
|
|
263
|
|
82.33
|
%
|
$
|
148.10
|
|
$
|
121.93
|
|
||||||||
|
Embassy Suites
|
Walnut Creek, CA
|
Full service
|
249
|
|
100
|
|
249
|
|
82.04
|
%
|
$
|
172.34
|
|
$
|
141.39
|
|
||||||||
|
Embassy Suites
|
Arlington, VA
|
Full service
|
267
|
|
100
|
|
267
|
|
89.62
|
%
|
$
|
198.16
|
|
$
|
177.59
|
|
||||||||
|
Embassy Suites
|
Portland, OR
|
Full service
|
276
|
|
100
|
|
276
|
|
88.59
|
%
|
$
|
220.17
|
|
$
|
195.06
|
|
||||||||
|
Embassy Suites
|
Santa Clara, CA
|
Full service
|
257
|
|
100
|
|
257
|
|
84.67
|
%
|
$
|
231.32
|
|
$
|
195.86
|
|
||||||||
|
Embassy Suites
|
Orlando, FL
|
Full service
|
174
|
|
100
|
|
174
|
|
91.12
|
%
|
$
|
151.05
|
|
$
|
137.64
|
|
||||||||
|
Hilton Garden Inn
|
Jacksonville, FL
|
Select service
|
119
|
|
100
|
|
119
|
|
73.15
|
%
|
$
|
123.99
|
|
$
|
90.69
|
|
||||||||
|
Hilton Garden Inn
|
Austin, TX
|
Select service
|
254
|
|
100
|
|
254
|
|
79.33
|
%
|
$
|
188.67
|
|
$
|
149.67
|
|
||||||||
|
Hilton Garden Inn
|
Baltimore, MD
|
Select service
|
158
|
|
100
|
|
158
|
|
82.37
|
%
|
$
|
117.51
|
|
$
|
96.79
|
|
||||||||
|
Hilton Garden Inn
|
Virginia Beach, VA
|
Select service
|
176
|
|
100
|
|
176
|
|
84.63
|
%
|
$
|
136.00
|
|
$
|
115.10
|
|
||||||||
|
Hilton Garden Inn
|
Wisconsin Dells, WI
|
Select service
|
128
|
|
100
|
|
128
|
|
69.07
|
%
|
$
|
120.89
|
|
$
|
83.50
|
|
||||||||
|
Hilton
|
Houston, TX
|
Full service
|
242
|
|
100
|
|
242
|
|
76.23
|
%
|
$
|
128.89
|
|
$
|
98.25
|
|
||||||||
|
Hilton
|
St. Petersburg, FL
|
Full service
|
333
|
|
100
|
|
333
|
|
78.57
|
%
|
$
|
152.18
|
|
$
|
119.57
|
|
||||||||
|
Hilton
|
Santa Fe, NM
|
Full service
|
158
|
|
100
|
|
158
|
|
84.46
|
%
|
$
|
159.55
|
|
$
|
134.76
|
|
||||||||
|
Hilton
|
Bloomington, MN
|
Full service
|
300
|
|
100
|
|
300
|
|
82.98
|
%
|
$
|
132.01
|
|
$
|
109.54
|
|
||||||||
|
Hilton
|
Costa Mesa, CA
|
Full service
|
486
|
|
100
|
|
486
|
|
82.92
|
%
|
$
|
136.59
|
|
$
|
113.25
|
|
||||||||
|
Hilton
|
Boston, MA
|
Full service
|
390
|
|
100
|
|
390
|
|
85.05
|
%
|
$
|
247.06
|
|
$
|
210.12
|
|
||||||||
|
Hilton
|
Parsippany, NJ
|
Full service
|
353
|
|
100
|
|
353
|
|
67.45
|
%
|
$
|
156.92
|
|
$
|
105.84
|
|
||||||||
|
Hilton
|
Tampa, FL
|
Full service
|
238
|
|
100
|
|
238
|
|
80.95
|
%
|
$
|
131.41
|
|
$
|
106.37
|
|
||||||||
|
Hampton Inn
|
Lawrenceville, GA
|
Select service
|
85
|
|
100
|
|
85
|
|
81.81
|
%
|
$
|
108.62
|
|
$
|
88.86
|
|
||||||||
|
Hampton Inn
|
Evansville, IN
|
Select service
|
140
|
|
100
|
|
140
|
|
57.09
|
%
|
$
|
112.08
|
|
$
|
63.99
|
|
||||||||
|
Hampton Inn
|
Parsippany, NJ
|
Select service
|
152
|
|
100
|
|
152
|
|
70.26
|
%
|
$
|
137.84
|
|
$
|
96.85
|
|
||||||||
|
Hampton Inn
|
Buford, GA
|
Select service
|
92
|
|
100
|
|
92
|
|
78.96
|
%
|
$
|
119.23
|
|
$
|
94.14
|
|
||||||||
|
Hampton Inn
|
Phoenix, AZ
|
Select service
|
106
|
|
100
|
|
106
|
|
76.07
|
%
|
$
|
126.66
|
|
$
|
96.35
|
|
||||||||
|
Hampton Inn - Waterfront
|
Pittsburgh, PA
|
Select service
|
113
|
|
100
|
|
113
|
|
75.09
|
%
|
$
|
124.77
|
|
$
|
93.68
|
|
||||||||
|
Hampton Inn - Washington
|
Pittsburgh, PA
|
Select service
|
103
|
|
100
|
|
103
|
|
60.85
|
%
|
$
|
96.25
|
|
$
|
58.57
|
|
||||||||
|
Hampton Inn
|
Columbus, OH
|
Select service
|
145
|
|
100
|
|
145
|
|
74.57
|
%
|
$
|
143.44
|
|
$
|
106.97
|
|
||||||||
|
Marriott
|
Beverly Hills, CA
|
Full service
|
260
|
|
100
|
|
260
|
|
87.49
|
%
|
$
|
256.88
|
|
$
|
224.75
|
|
||||||||
|
Marriott
|
Durham, NC
|
Full service
|
225
|
|
100
|
|
225
|
|
70.67
|
%
|
$
|
136.70
|
|
$
|
96.60
|
|
||||||||
|
Marriott
|
Arlington, VA
|
Full service
|
701
|
|
100
|
|
701
|
|
78.53
|
%
|
$
|
188.67
|
|
$
|
148.16
|
|
||||||||
|
Marriott
|
Bridgewater, NJ
|
Full service
|
347
|
|
100
|
|
347
|
|
70.17
|
%
|
$
|
212.45
|
|
$
|
149.07
|
|
||||||||
|
Marriott
|
Dallas, TX
|
Full service
|
265
|
|
100
|
|
265
|
|
75.75
|
%
|
$
|
133.23
|
|
$
|
100.92
|
|
||||||||
|
Marriott
|
Fremont, CA
|
Full service
|
357
|
|
100
|
|
357
|
|
82.94
|
%
|
$
|
183.85
|
|
$
|
152.49
|
|
||||||||
|
Marriott
|
Memphis, TN
|
Full service
|
232
|
|
100
|
|
232
|
|
79.54
|
%
|
$
|
152.23
|
|
$
|
121.08
|
|
||||||||
|
Marriott
|
Irving, TX
|
Full service
|
491
|
|
100
|
|
491
|
|
76.24
|
%
|
$
|
143.04
|
|
$
|
109.06
|
|
||||||||
|
Marriott
|
Omaha, NE
|
Full service
|
300
|
|
100
|
|
300
|
|
56.11
|
%
|
$
|
125.55
|
|
$
|
70.44
|
|
||||||||
35
|
Hotel Property
|
Location
|
Service Type
|
Total Rooms
|
% Owned
|
Owned Rooms
|
Year Ended December 31, 2017
|
||||||||||||||||||
|
Occupancy
|
ADR
|
RevPAR
|
||||||||||||||||||||||
|
Marriott
|
San Antonio, TX
|
Full service
|
251
|
|
100
|
|
251
|
|
70.33
|
%
|
$
|
140.45
|
|
$
|
98.78
|
|
||||||||
|
Marriott
|
Sugarland, TX
|
Full service
|
300
|
|
100
|
|
300
|
|
77.48
|
%
|
$
|
146.76
|
|
$
|
113.71
|
|
||||||||
|
SpringHill Suites by Marriott
|
Jacksonville, FL
|
Select service
|
102
|
|
100
|
|
102
|
|
86.26
|
%
|
$
|
111.95
|
|
$
|
96.56
|
|
||||||||
|
SpringHill Suites by Marriott
|
Baltimore, MD
|
Select service
|
133
|
|
100
|
|
133
|
|
84.05
|
%
|
$
|
110.15
|
|
$
|
92.58
|
|
||||||||
|
SpringHill Suites by Marriott
|
Kennesaw, GA
|
Select service
|
90
|
|
100
|
|
90
|
|
73.78
|
%
|
$
|
120.92
|
|
$
|
89.22
|
|
||||||||
|
SpringHill Suites by Marriott
|
Buford, GA
|
Select service
|
97
|
|
100
|
|
97
|
|
83.56
|
%
|
$
|
109.32
|
|
$
|
91.34
|
|
||||||||
|
SpringHill Suites by Marriott
(5)
|
Centreville, VA
|
Select service
|
136
|
|
100
|
|
136
|
|
67.62
|
%
|
$
|
98.83
|
|
$
|
66.83
|
|
||||||||
|
SpringHill Suites by Marriott
|
Charlotte, NC
|
Select service
|
136
|
|
100
|
|
136
|
|
71.33
|
%
|
$
|
111.82
|
|
$
|
79.76
|
|
||||||||
|
SpringHill Suites by Marriott
|
Durham, NC
|
Select service
|
120
|
|
100
|
|
120
|
|
78.56
|
%
|
$
|
101.91
|
|
$
|
80.07
|
|
||||||||
|
SpringHill Suites by Marriott
|
Manhattan Beach, CA
|
Select service
|
164
|
|
100
|
|
164
|
|
87.27
|
%
|
$
|
149.02
|
|
$
|
130.05
|
|
||||||||
|
SpringHill Suites by Marriott
|
Plymouth Meeting, PA
|
Select service
|
199
|
|
100
|
|
199
|
|
72.54
|
%
|
$
|
114.66
|
|
$
|
83.17
|
|
||||||||
|
SpringHill Suites by Marriott
(5)
|
Glen Allen, VA
|
Select service
|
136
|
|
100
|
|
136
|
|
71.43
|
%
|
$
|
99.54
|
|
$
|
71.10
|
|
||||||||
|
Fairfield Inn by Marriott
|
Kennesaw, GA
|
Select service
|
86
|
|
100
|
|
86
|
|
72.55
|
%
|
$
|
111.70
|
|
$
|
81.04
|
|
||||||||
|
Courtyard by Marriott
|
Bloomington, IN
|
Select service
|
117
|
|
100
|
|
117
|
|
72.68
|
%
|
$
|
133.67
|
|
$
|
97.16
|
|
||||||||
|
Courtyard by Marriott - Tremont
|
Boston, MA
|
Select service
|
315
|
|
100
|
|
315
|
|
80.76
|
%
|
$
|
227.57
|
|
$
|
183.78
|
|
||||||||
|
Courtyard by Marriott
|
Columbus, IN
|
Select service
|
90
|
|
100
|
|
90
|
|
75.60
|
%
|
$
|
110.04
|
|
$
|
83.19
|
|
||||||||
|
Courtyard by Marriott
|
Denver, CO
|
Select service
|
202
|
|
100
|
|
202
|
|
83.94
|
%
|
$
|
133.88
|
|
$
|
112.38
|
|
||||||||
|
Courtyard by Marriott
|
Louisville, KY
|
Select service
|
150
|
|
100
|
|
150
|
|
77.62
|
%
|
$
|
136.65
|
|
$
|
106.07
|
|
||||||||
|
Courtyard by Marriott
|
Gaithersburg, MD
|
Select service
|
210
|
|
100
|
|
210
|
|
68.10
|
%
|
$
|
147.94
|
|
$
|
100.74
|
|
||||||||
|
Courtyard by Marriott
|
Crystal City, VA
|
Select service
|
272
|
|
100
|
|
272
|
|
79.48
|
%
|
$
|
150.61
|
|
$
|
119.70
|
|
||||||||
|
Courtyard by Marriott
|
Ft. Lauderdale, FL
|
Select service
|
174
|
|
100
|
|
174
|
|
81.61
|
%
|
$
|
127.74
|
|
$
|
104.25
|
|
||||||||
|
Courtyard by Marriott
|
Overland Park, KS
|
Select service
|
168
|
|
100
|
|
168
|
|
72.88
|
%
|
$
|
116.53
|
|
$
|
84.93
|
|
||||||||
|
Courtyard by Marriott
|
Savannah, GA
|
Select service
|
156
|
|
100
|
|
156
|
|
82.07
|
%
|
$
|
142.28
|
|
$
|
116.77
|
|
||||||||
|
Courtyard by Marriott
|
Foothill Ranch, CA
|
Select service
|
156
|
|
100
|
|
156
|
|
79.52
|
%
|
$
|
132.71
|
|
$
|
105.53
|
|
||||||||
|
Courtyard by Marriott
|
Alpharetta, GA
|
Select service
|
154
|
|
100
|
|
154
|
|
74.43
|
%
|
$
|
145.19
|
|
$
|
108.06
|
|
||||||||
|
Courtyard by Marriott
|
Oakland, CA
|
Select service
|
156
|
|
100
|
|
156
|
|
88.61
|
%
|
$
|
163.67
|
|
$
|
145.04
|
|
||||||||
|
Courtyard by Marriott
|
Scottsdale, AZ
|
Select service
|
180
|
|
100
|
|
180
|
|
77.84
|
%
|
$
|
119.90
|
|
$
|
93.33
|
|
||||||||
|
Courtyard by Marriott
|
Plano, TX
|
Select service
|
153
|
|
100
|
|
153
|
|
72.49
|
%
|
$
|
134.80
|
|
$
|
97.71
|
|
||||||||
|
Courtyard by Marriott
|
Newark, CA
|
Select service
|
181
|
|
100
|
|
181
|
|
82.01
|
%
|
$
|
164.24
|
|
$
|
134.68
|
|
||||||||
|
Courtyard by Marriott
|
Manchester, CT
|
Select service
|
90
|
|
85
|
|
77
|
|
76.58
|
%
|
$
|
135.37
|
|
$
|
103.66
|
|
||||||||
|
Courtyard by Marriott
|
Basking Ridge, NJ
|
Select service
|
235
|
|
100
|
|
235
|
|
66.94
|
%
|
$
|
198.59
|
|
$
|
132.93
|
|
||||||||
|
Courtyard by Marriott
|
Wichita, KS
|
Select service
|
128
|
|
100
|
|
128
|
|
75.26
|
%
|
$
|
124.19
|
|
$
|
93.47
|
|
||||||||
|
Courtyard by Marriott - Billerica
|
Boston, MA
|
Select service
|
210
|
|
100
|
|
210
|
|
70.80
|
%
|
$
|
141.50
|
|
$
|
100.18
|
|
||||||||
|
Homewood Suites
|
Pittsburgh, PA
|
Select service
|
148
|
|
100
|
|
148
|
|
62.27
|
%
|
$
|
126.77
|
|
$
|
78.94
|
|
||||||||
|
Marriott Residence Inn
|
Lake Buena Vista, FL
|
Select service
|
210
|
|
100
|
|
210
|
|
83.12
|
%
|
$
|
135.01
|
|
$
|
112.23
|
|
||||||||
|
Marriott Residence Inn
|
Evansville, IN
|
Select service
|
78
|
|
100
|
|
78
|
|
75.16
|
%
|
$
|
114.41
|
|
$
|
86.00
|
|
||||||||
|
Marriott Residence Inn
|
Orlando, FL
|
Select service
|
350
|
|
100
|
|
350
|
|
79.33
|
%
|
$
|
125.42
|
|
$
|
99.49
|
|
||||||||
|
Marriott Residence Inn
|
Falls Church, VA
|
Select service
|
159
|
|
100
|
|
159
|
|
78.88
|
%
|
$
|
146.09
|
|
$
|
115.23
|
|
||||||||
|
Marriott Residence Inn
|
San Diego, CA
|
Select service
|
150
|
|
100
|
|
150
|
|
84.96
|
%
|
$
|
164.43
|
|
$
|
139.71
|
|
||||||||
|
Marriott Residence Inn
|
Salt Lake City, UT
|
Select service
|
144
|
|
100
|
|
144
|
|
74.91
|
%
|
$
|
121.17
|
|
$
|
90.77
|
|
||||||||
|
Marriott Residence Inn
|
Las Vegas, NV
|
Select service
|
256
|
|
100
|
|
256
|
|
85.89
|
%
|
$
|
126.12
|
|
$
|
108.32
|
|
||||||||
|
Marriott Residence Inn
|
Phoenix, AZ
|
Select service
|
200
|
|
100
|
|
200
|
|
78.75
|
%
|
$
|
116.66
|
|
$
|
91.87
|
|
||||||||
|
Marriott Residence Inn
|
Plano, TX
|
Select service
|
126
|
|
100
|
|
126
|
|
82.32
|
%
|
$
|
114.28
|
|
$
|
94.08
|
|
||||||||
|
Marriott Residence Inn
|
Newark, CA
|
Select service
|
168
|
|
100
|
|
168
|
|
85.63
|
%
|
$
|
180.24
|
|
$
|
154.34
|
|
||||||||
|
Marriott Residence Inn
|
Manchester, CT
|
Select service
|
96
|
|
85
|
|
82
|
|
83.94
|
%
|
$
|
139.11
|
|
$
|
116.77
|
|
||||||||
|
Marriott Residence Inn
|
Jacksonville, FL
|
Select service
|
120
|
|
100
|
|
120
|
|
85.49
|
%
|
$
|
127.93
|
|
$
|
109.36
|
|
||||||||
|
Marriott Residence Inn
|
Stillwater, OK
|
Select service
|
101
|
|
100
|
|
101
|
|
55.80
|
%
|
$
|
110.21
|
|
$
|
61.50
|
|
||||||||
|
Marriott Residence Inn
|
Tampa, FL
|
Select service
|
109
|
|
100
|
|
109
|
|
76.03
|
%
|
$
|
159.55
|
|
$
|
121.31
|
|
||||||||
|
TownePlace Suites by Marriott
|
Manhattan Beach, CA
|
Select service
|
143
|
|
100
|
|
143
|
|
87.74
|
%
|
$
|
139.30
|
|
$
|
122.22
|
|
||||||||
|
One Ocean
|
Atlantic Beach, FL
|
Full service
|
193
|
|
100
|
|
193
|
|
71.29
|
%
|
$
|
209.93
|
|
$
|
149.66
|
|
||||||||
|
Sheraton Hotel
|
Ann Arbor, MI
|
Full service
|
197
|
|
100
|
|
197
|
|
73.89
|
%
|
$
|
149.17
|
|
$
|
110.22
|
|
||||||||
|
Sheraton Hotel
|
Langhorne, PA
|
Full service
|
186
|
|
100
|
|
186
|
|
69.41
|
%
|
$
|
120.71
|
|
$
|
83.78
|
|
||||||||
36
|
Hotel Property
|
Location
|
Service Type
|
Total Rooms
|
% Owned
|
Owned Rooms
|
Year Ended December 31, 2017
|
||||||||||||||||||
|
Occupancy
|
ADR
|
RevPAR
|
||||||||||||||||||||||
|
Sheraton Hotel
|
Minneapolis, MN
|
Full service
|
220
|
|
100
|
|
220
|
|
66.11
|
%
|
$
|
127.50
|
|
$
|
84.29
|
|
||||||||
|
Sheraton Hotel
|
Indianapolis, IN
|
Full service
|
378
|
|
100
|
|
378
|
|
78.21
|
%
|
$
|
131.63
|
|
$
|
102.95
|
|
||||||||
|
Sheraton Hotel
|
Anchorage, AK
|
Full service
|
370
|
|
100
|
|
370
|
|
70.30
|
%
|
$
|
136.02
|
|
$
|
95.62
|
|
||||||||
|
Sheraton Hotel
|
San Diego, CA
|
Full service
|
260
|
|
100
|
|
260
|
|
83.27
|
%
|
$
|
131.53
|
|
$
|
109.53
|
|
||||||||
|
Hyatt Regency
|
Coral Gables, FL
|
Full service
|
253
|
|
100
|
|
253
|
|
85.26
|
%
|
$
|
189.43
|
|
$
|
161.50
|
|
||||||||
|
Hyatt Regency
|
Hauppauge, NY
|
Full service
|
358
|
|
100
|
|
358
|
|
72.86
|
%
|
$
|
139.07
|
|
$
|
101.33
|
|
||||||||
|
Hyatt Regency
|
Savannah, GA
|
Full service
|
351
|
|
100
|
|
351
|
|
88.06
|
%
|
$
|
177.04
|
|
$
|
155.90
|
|
||||||||
|
Renaissance
|
Nashville, TN
|
Full service
|
673
|
|
100
|
|
673
|
|
85.95
|
%
|
$
|
239.34
|
|
$
|
205.71
|
|
||||||||
|
Annapolis Historic Inn
|
Annapolis, MD
|
Full service
|
124
|
|
100
|
|
124
|
|
63.86
|
%
|
$
|
160.12
|
|
$
|
102.26
|
|
||||||||
|
Lakeway Resort & Spa
|
Austin, TX
|
Full service
|
168
|
|
100
|
|
168
|
|
65.48
|
%
|
$
|
173.29
|
|
$
|
113.47
|
|
||||||||
|
Silversmith
|
Chicago, IL
|
Full service
|
144
|
|
100
|
|
144
|
|
74.78
|
%
|
$
|
182.29
|
|
$
|
136.31
|
|
||||||||
|
The Churchill
|
Washington, DC
|
Full service
|
173
|
|
100
|
|
173
|
|
69.39
|
%
|
$
|
193.50
|
|
$
|
134.26
|
|
||||||||
|
The Melrose
|
Washington, DC
|
Full service
|
240
|
|
100
|
|
240
|
|
82.32
|
%
|
$
|
207.57
|
|
$
|
170.88
|
|
||||||||
|
Le Pavillon
|
New Orleans, LA
|
Full service
|
226
|
|
100
|
|
226
|
|
63.77
|
%
|
$
|
158.50
|
|
$
|
101.07
|
|
||||||||
|
The Ashton
|
Ft. Worth, TX
|
Full service
|
39
|
|
100
|
|
39
|
|
79.33
|
%
|
$
|
198.30
|
|
$
|
157.32
|
|
||||||||
|
Westin
|
Princeton, NJ
|
Full service
|
296
|
|
100
|
|
296
|
|
66.16
|
%
|
$
|
155.81
|
|
$
|
103.09
|
|
||||||||
|
W
|
Atlanta, GA
|
Full service
|
237
|
|
100
|
|
237
|
|
75.89
|
%
|
$
|
215.28
|
|
$
|
163.37
|
|
||||||||
|
W
|
Minneapolis, MN
|
Full service
|
229
|
|
100
|
|
229
|
|
83.68
|
%
|
$
|
198.81
|
|
$
|
166.37
|
|
||||||||
|
Le Meridien
|
Minneapolis, MN
|
Full service
|
60
|
|
100
|
|
60
|
|
78.89
|
%
|
$
|
201.85
|
|
$
|
159.23
|
|
||||||||
|
Hotel Indigo
|
Atlanta, GA
|
Full service
|
140
|
|
100
|
|
140
|
|
71.84
|
%
|
$
|
141.29
|
|
$
|
101.50
|
|
||||||||
|
Ritz-Carlton
|
Atlanta, GA
|
Full service
|
444
|
|
100
|
|
444
|
|
75.41
|
%
|
$
|
224.56
|
|
$
|
169.34
|
|
||||||||
|
Ground Lease Properties
|
||||||||||||||||||||||||
|
Crowne Plaza
(1)
|
Key West, FL
|
Full service
|
160
|
|
100
|
|
160
|
|
83.16
|
%
|
$
|
278.50
|
|
$
|
231.60
|
|
||||||||
|
Crowne Plaza
(2)
|
Annapolis, MD
|
Full service
|
196
|
|
100
|
|
196
|
|
53.05
|
%
|
$
|
113.23
|
|
$
|
60.07
|
|
||||||||
|
Hilton
(3)
|
Ft. Worth, TX
|
Full service
|
294
|
|
100
|
|
294
|
|
77.76
|
%
|
$
|
164.53
|
|
$
|
127.94
|
|
||||||||
|
Renaissance
(4)
|
Palm Springs, CA
|
Full service
|
410
|
|
100
|
|
410
|
|
67.19
|
%
|
$
|
155.47
|
|
$
|
104.46
|
|
||||||||
|
Total
|
25,058
|
|
25,031
|
|
77.53
|
%
|
$
|
159.26
|
|
$
|
123.47
|
|
||||||||||||
________
(1)
The ground lease expires in 2084.
(2)
The ground lease expires in 2114.
(3)
The ground lease expires in 2040.
(4)
The ground lease expires in 2059 with one 25-year extension option.
(5)
These hotel properties were held for sale as of December 31, 2017. See note 5 to our consolidated financial statements.
37
|
Item 3.
|
Legal Proceedings
|
Litigation
—
Palm Beach Florida Hotel and Office Building Limited Partnership, et al. v. Nantucket Enterprises, Inc.
This litigation involves a landlord tenant dispute from 2008 in which the landlord, Palm Beach Florida Hotel and Office Building Limited Partnership, a subsidiary of the Company, claimed that the tenant had violated various lease provisions of the lease agreement and was therefore in default. The tenant counterclaimed and asserted multiple claims including that it had been wrongfully evicted. The litigation was instituted by the plaintiff in November 2008 in the Circuit Court of the Fifteenth Judicial Circuit, in and for Palm Beach County, Florida and proceeded to a jury trial on June 30, 2014. The jury entered its verdict awarding the tenant total claims of $10.8 million and ruling against the landlord on its claim of breach of contract. In 2016, the Court of Appeals reduced the original $10.8 million judgment to $8.8 million and added pre-judgment interest on the wrongful eviction judgment. The case was further appealed to the Florida Supreme Court. On May 23, 2017, the trial court issued an order compelling the company that issued the supersedeas bond, RLI, to pay approximately $10.0 million. On June 1, 2017, RLI paid Nantucket this amount and sought reimbursement from the Company. On June 27, 2017, the Florida Supreme Court denied the Company's petition for review. As a result, all of the appeals were exhausted and the judgment was final with the determination and reimbursement of attorney's fees being the only remaining dispute. On June 29, 2017, the balance of the judgment was paid to Nantucket by the Company. The amount of potential legal fees that could be owed cannot be predicted with any certainty.
The Company estimates its total loss including post judgment interest and reimbursement of the plaintiff’s legal fees to be approximately $17.3 million as of December 31, 2017, resulting in additional expense of $4.1 million for the year ended December 31, 2017.
On June 29, 2017, RLI filed suit in Federal District Court in Dallas seeking to recover the amounts previously paid to Nantucket. On July 19, 2017, the Company paid approximately
$10.0 million
to RLI mooting RLI's claim subject only to the alleged claim for attorneys fee. The Company paid the negotiated settlement of RLI's attorney fees in the amount of
$100,000
, on November 2, 2017, and a Stipulation for Dismissal was filed concluding the litigation.
We are engaged in other various legal proceedings which have arisen but have not been fully adjudicated. The likelihood of loss from these legal proceedings, based on definitions within contingency accounting literature, ranges from remote to reasonably possible and to probable. Based on estimates of the range of potential losses associated with these matters, management does not believe the ultimate resolution of these proceedings, either individually or in the aggregate, will have a material adverse effect on our consolidated financial position or results of operations. However, the final results of legal proceedings cannot be predicted with certainty and if we fail to prevail in one or more of these legal matters, and the associated realized losses exceed our current estimates of the range of potential losses, our consolidated financial position or results of operations could be materially adversely affected in future periods.
|
Item 4.
|
Mine Safety Disclosures
|
Not Applicable
|
Item 5.
|
Market for Registrant’s Common Equity, Related Stockholder Matters, and Issuer Purchases of Equity Securities
|
(a) Market Price of and Dividends on Registrant’s Common Equity and Related Stockholder Matters
Market Price and Dividend Information
Our common stock is listed and traded on the New York Stock Exchange under the symbol “AHT.” On
March 12, 2018
, there were
361
registered holders of record of our common stock. In order to comply with certain requirements related to our qualification as a REIT, our charter limits the number of shares of capital stock that may be owned by any single person or affiliated group without our permission to 9.8% of the outstanding shares of any class of our capital stock. We are aware of one Section 13G filer that presently holds in excess of 9.8% of our outstanding common shares, but our board of directors has granted a waiver which provides this holder with an exception to our ownership restrictions.
38
The following table sets forth, for the indicated periods, the high and low sales prices for our common stock as traded on that exchange and cash distributions declared per share of common stock. See Item 7.
Management’s Discussion and Analysis of Financial Condition and Results of Operations
for additional information on the spin-off transaction.
|
First
Quarter
|
Second
Quarter
|
Third
Quarter
|
Fourth
Quarter
|
||||||||||||
|
2017
|
|||||||||||||||
|
High
|
$
|
8.23
|
|
$
|
6.82
|
|
$
|
6.73
|
|
$
|
7.20
|
|
|||
|
Low
|
5.68
|
|
5.81
|
|
5.86
|
|
6.16
|
|
|||||||
|
Close
|
6.37
|
|
6.08
|
|
6.67
|
|
6.73
|
|
|||||||
|
Cash dividends declared per share
|
0.12
|
|
0.12
|
|
0.12
|
|
0.12
|
|
|||||||
|
2016
|
|||||||||||||||
|
High
|
$
|
6.40
|
|
$
|
6.40
|
|
$
|
7.16
|
|
$
|
7.91
|
|
|||
|
Low
|
4.15
|
|
4.79
|
|
5.10
|
|
5.35
|
|
|||||||
|
Close
|
6.38
|
|
5.37
|
|
5.89
|
|
7.76
|
|
|||||||
|
Cash dividends declared per share
|
0.12
|
|
0.12
|
|
0.12
|
|
0.12
|
|
|||||||
For the years ended
December 31, 2017
and
2016
, we declared and paid dividends of
$0.48
per share, paid at a rate of $0.12 per share per quarter. In December
2017
, the board of directors approved our dividend policy for
2018
, and we expect to pay a quarterly dividend of
$0.12
per share for
2018
. The adoption of a dividend policy does not commit our board of directors to declare future dividends or the amount thereof. The board of directors will continue to review our dividend policy on a quarterly basis. We may incur indebtedness to meet distribution requirements imposed on REITs under the Internal Revenue Code to the extent that working capital and cash flow from our investments are insufficient to fund required distributions. We may elect to pay dividends on our common stock in cash or a combination of cash and shares of securities as permitted under federal income tax laws governing REIT distribution requirements. To maintain our qualification as a REIT, we intend to make annual distributions to our stockholders of at least 90% of our REIT taxable income, excluding net capital gains (which does not necessarily equal net income as calculated in accordance with GAAP). Distributions will be authorized by our board of directors and declared by us based upon a variety of factors deemed relevant by our directors. Our ability to pay distributions to our stockholders will depend, in part, upon our receipt of distributions from our operating partnership. This, in turn, may depend upon receipt of lease payments with respect to our properties from indirect, wholly-owned subsidiaries of our operating partnership and the management of our properties by our property managers.
39
Characterization of Distributions
For income tax purposes, distributions paid consist of ordinary income, capital gains, return of capital or a combination thereof. Distributions paid per share were characterized as follows for the following fiscal years:
|
2017
|
2016
|
2015
|
|||||||||||||||||||||
|
Amount
|
%
|
Amount
|
%
|
Amount
|
%
|
||||||||||||||||||
|
Common Stock (cash):
|
|||||||||||||||||||||||
|
Ordinary income
|
$
|
—
|
|
—
|
%
|
$
|
—
|
|
—
|
%
|
$
|
—
|
|
—
|
%
|
||||||||
|
Capital gain
|
—
|
|
—
|
|
—
|
|
—
|
|
—
|
|
—
|
|
|||||||||||
|
Return of capital
|
0.4800
|
|
(1)
|
100.0000
|
|
0.4800
|
|
(1)
|
100.0000
|
|
0.4800
|
|
(1)
|
100.0000
|
|
||||||||
|
Total
|
$
|
0.4800
|
|
100.0000
|
%
|
$
|
0.4800
|
|
100.0000
|
%
|
$
|
0.4800
|
|
100.0000
|
%
|
||||||||
|
Common Stock (stock):
|
|||||||||||||||||||||||
|
Ordinary income
|
$
|
—
|
|
—
|
%
|
$
|
—
|
|
—
|
%
|
$
|
—
|
|
—
|
%
|
||||||||
|
Capital gain
|
—
|
|
—
|
|
—
|
|
—
|
|
—
|
|
—
|
%
|
|||||||||||
|
Return of capital
|
—
|
|
—
|
|
—
|
|
—
|
|
0.6099
|
|
100.0000
|
%
|
|||||||||||
|
Total
|
$
|
—
|
|
—
|
%
|
$
|
—
|
|
—
|
%
|
$
|
0.6099
|
|
100.0000
|
%
|
||||||||
|
Preferred Stock – Series A:
|
|||||||||||||||||||||||
|
Ordinary income
|
$
|
—
|
|
—
|
%
|
$
|
—
|
|
—
|
%
|
$
|
—
|
|
—
|
%
|
||||||||
|
Capital gain
|
0.8605
|
|
(1)
|
53.6739
|
|
—
|
|
—
|
|
1.8277
|
|
(1)
|
85.5064
|
|
|||||||||
|
Return of capital
|
0.7427
|
|
(1)
|
46.3261
|
|
2.1376
|
|
(1)
|
100.0000
|
|
0.3098
|
|
(1)
|
14.4936
|
|
||||||||
|
Total
|
$
|
1.6032
|
|
100.0000
|
%
|
$
|
2.1376
|
|
100.0000
|
%
|
$
|
2.1375
|
|
100.0000
|
%
|
||||||||
|
Preferred Stock – Series D:
|
|||||||||||||||||||||||
|
Ordinary income
|
$
|
—
|
|
—
|
%
|
$
|
—
|
|
—
|
%
|
$
|
—
|
|
—
|
%
|
||||||||
|
Capital gain
|
1.1338
|
|
(1)
|
53.6735
|
|
—
|
|
—
|
|
1.8064
|
|
(1)
|
85.5101
|
|
|||||||||
|
Return of capital
|
0.9786
|
|
(1)
|
46.3265
|
|
2.1124
|
|
(1)
|
100.0000
|
|
0.3061
|
|
(1)
|
14.4899
|
|
||||||||
|
Total
|
$
|
2.1124
|
|
100.0000
|
%
|
$
|
2.1124
|
|
100.0000
|
%
|
$
|
2.1125
|
|
100.0000
|
%
|
||||||||
|
Preferred Stock – Series E:
|
|||||||||||||||||||||||
|
Ordinary income
|
$
|
—
|
|
—
|
%
|
$
|
—
|
|
—
|
%
|
$
|
—
|
|
—
|
%
|
||||||||
|
Capital gain
|
—
|
|
—
|
|
—
|
|
—
|
|
1.9239
|
|
(1)
|
85.5067
|
|
||||||||||
|
Return of capital
|
—
|
|
—
|
|
1.6875
|
|
(1)
|
100.0000
|
|
0.3261
|
|
(1)
|
14.4933
|
|
|||||||||
|
Total
|
$
|
—
|
|
—
|
%
|
$
|
1.6875
|
|
100.0000
|
%
|
$
|
2.2500
|
|
100.0000
|
%
|
||||||||
|
Preferred Stock – Series F:
|
|||||||||||||||||||||||
|
Ordinary income
|
$
|
—
|
|
—
|
%
|
$
|
—
|
|
—
|
%
|
$
|
—
|
|
—
|
%
|
||||||||
|
Capital gain
|
0.9895
|
|
(1)
|
53.6722
|
|
—
|
|
—
|
|
—
|
|
—
|
|
||||||||||
|
Return of capital
|
0.8541
|
|
(1)
|
46.3278
|
|
0.3995
|
|
(1)
|
100.0000
|
|
—
|
|
—
|
|
|||||||||
|
Total
|
$
|
1.8436
|
|
100.0000
|
%
|
$
|
0.3995
|
|
100.0000
|
%
|
$
|
—
|
|
—
|
%
|
||||||||
|
Preferred Stock – Series G:
|
|||||||||||||||||||||||
|
Ordinary income
|
$
|
—
|
|
—
|
%
|
$
|
—
|
|
—
|
%
|
$
|
—
|
|
—
|
%
|
||||||||
|
Capital gain
|
0.9428
|
|
(1)
|
53.6719
|
|
—
|
|
—
|
|
—
|
|
—
|
|
||||||||||
|
Return of capital
|
0.8138
|
|
(1)
|
46.3281
|
|
—
|
|
—
|
|
—
|
|
—
|
|
||||||||||
|
Total
|
$
|
1.7566
|
|
100.0000
|
%
|
$
|
—
|
|
—
|
%
|
$
|
—
|
|
—
|
%
|
||||||||
|
Preferred Stock – Series H:
|
|
|
|
||||||||||||||||||||
|
Ordinary income
|
$
|
—
|
|
—
|
%
|
$
|
—
|
|
—
|
%
|
$
|
—
|
|
—
|
%
|
||||||||
|
Capital gain
|
0.1006
|
|
(1)
|
53.6533
|
|
—
|
|
—
|
|
—
|
|
—
|
|
||||||||||
|
Return of capital
|
0.0869
|
|
(1)
|
46.3467
|
|
—
|
|
—
|
|
—
|
|
—
|
|
||||||||||
|
Total
|
$
|
0.1875
|
|
100.0000
|
%
|
$
|
—
|
|
—
|
%
|
$
|
—
|
|
—
|
%
|
||||||||
____________________
|
(1)
|
The fourth quarter
2015
preferred and common distributions paid January 15,
2016
are treated as
2016
distributions for tax purposes. The fourth quarter
2016
preferred and common distributions paid January 17,
2017
are treated as
2017
distributions for tax purposes. The fourth quarter
2017
preferred and common distributions paid January 16,
2018
are treated as
2018
distributions for tax purposes.
|
40
Equity Compensation Plan Information
The following table sets forth certain information with respect to securities authorized and available for issuance under our equity compensation plans as of December 31,
2017
:
|
Number of Securities to be Issued Upon Exercise of
Outstanding Options, Warrants and Rights |
Weighted-Average
Exercise Price Of Outstanding Options, Warrants, And Rights |
Number of
Securities Remaining Available for Future Issuance
|
||||||
|
Equity compensation plans approved by security holders
|
None
|
N/A
|
4,032,250
|
|
(1)
|
|||
|
Equity compensation plans not approved by security holders
|
None
|
N/A
|
None
|
|
||||
|
Total
|
None
|
N/A
|
4,032,250
|
|
||||
____________________
|
(1)
|
As of
December 31, 2017
, there were
4,032,250
shares of our common stock, or securities convertible into
4,032,250
shares of our common stock that remained available for issuance under our Amended and Restated 2011 Stock Incentive Plan.
|
Performance Graph
The following graph compares the percentage change in the cumulative total stockholder return on our common stock with the cumulative total return of the S&P 500 Stock Index and the FTSE NAREIT Lodging & Resorts Index for the period from December 31,
2012
through
December 31, 2017
, assuming an initial investment of $100 in stock on December 31,
2012
with reinvestment of dividends. The NAREIT Lodging Resorts Index is not a published index; however, we believe the companies included in this index provide a representative example of enterprises in the lodging resort line of business in which we engage. Stockholders who wish to request a list of companies in the FTSE NAREIT Lodging & Resorts Index may send written requests to Ashford Hospitality Trust, Inc., Attention: Stockholder Relations, 14185 Dallas Parkway, Suite 1100, Dallas, Texas 75254.
41
The stock price performance shown below on the graph is not necessarily indicative of future price performance.
COMPARISON OF 5 YEAR CUMULATIVE TOTAL RETURN
Among Ashford Hospitality Trust, Inc., the S&P Index and the FTSE NAREIT Lodging & Resorts Index
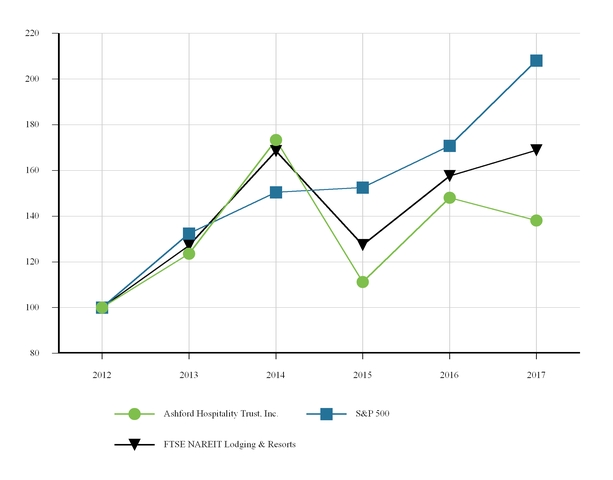
Purchases of Equity Securities by the Issuer
The following table provides the information with respect to purchases of shares of our common stock during each of the months in the fourth quarter of
2017
:
|
Period
|
Total
Number of Shares Purchased |
Average
Price Paid Per Share |
Total Number of
Shares Purchased as Part of Publicly Announced Plan (2) |
Maximum Dollar
Value of Shares That May Yet Be Purchased Under the Plan |
||||||||||
|
Common stock:
|
||||||||||||||
|
October 1 to October 31
|
2,082
|
|
(1)
|
$
|
—
|
|
(3)
|
—
|
|
$
|
200,000,000
|
|
||
|
November 1 to November 30
|
3,549
|
|
(1)
|
—
|
|
(3)
|
—
|
|
200,000,000
|
|
||||
|
December 1 to December 31
|
1,351
|
|
(1)
|
—
|
|
(3)
|
—
|
|
200,000,000
|
|
||||
|
Total
|
6,982
|
|
$
|
—
|
|
—
|
|
|||||||
____________________
|
(1)
|
Includes shares that were repurchased when former employees of Ashford LLC, who held restricted shares of our common stock, forfeited the shares upon termination of employment.
|
|
(2)
|
On December 5, 2017, the board of directors reapproved a stock repurchase program (the “Repurchase Program”) pursuant to which the Board granted a repurchase authorization to acquire shares of the Company’s common stock, par value $0.01 per share (the “Common Stock”) having an aggregate value of up to $200 million. The Board’s authorization replaced any previous repurchase authorizations.
|
|
(3)
|
There is no cost associated with the forfeiture of restricted shares of our common stock.
|
42
|
Item 6.
|
Selected Financial Data
|
The following sets forth our selected consolidated financial and operating information on a historical basis and should be read together with “Item 7. Management’s Discussion and Analysis of Financial Condition and Results of Operations” and our consolidated financial statements and notes thereto, which are included in “Item 8. Financial Statements and Supplementary Data.”
|
Year Ended December 31,
|
|||||||||||||||||||
|
2017
|
2016
|
2015
|
2014
|
2013
|
|||||||||||||||
|
(in thousands, except per share amounts)
|
|||||||||||||||||||
|
Statements of Operations Data:
|
|||||||||||||||||||
|
Total revenue
|
$
|
1,439,270
|
|
$
|
1,492,043
|
|
$
|
1,336,966
|
|
$
|
794,849
|
|
$
|
939,527
|
|
||||
|
Total operating expenses
|
1,304,265
|
|
1,336,339
|
|
1,199,051
|
|
718,157
|
|
822,630
|
|
|||||||||
|
Operating income (loss)
|
135,005
|
|
155,704
|
|
137,915
|
|
76,692
|
|
116,897
|
|
|||||||||
|
Income (loss) from continuing operations
|
(88,760
|
)
|
(58,782
|
)
|
305,813
|
|
(41,731
|
)
|
(48,460
|
)
|
|||||||||
|
Income (loss) from discontinued operations
|
—
|
|
—
|
|
—
|
|
33
|
|
(98
|
)
|
|||||||||
|
Net income (loss) attributable to the Company
|
(67,008
|
)
|
(46,285
|
)
|
270,939
|
|
(31,401
|
)
|
(41,283
|
)
|
|||||||||
|
Net income (loss) attributable to common stockholders
|
(122,568
|
)
|
(88,681
|
)
|
236,977
|
|
(65,363
|
)
|
(75,245
|
)
|
|||||||||
|
Diluted income (loss) per common share:
|
|||||||||||||||||||
|
Income (loss) from continuing operations attributable to common stockholders
|
$
|
(1.30
|
)
|
$
|
(0.95
|
)
|
$
|
2.35
|
|
$
|
(0.75
|
)
|
$
|
(1.00
|
)
|
||||
|
Income (loss) from discontinued operations attributable to common stockholders
|
—
|
|
—
|
|
—
|
|
—
|
|
—
|
|
|||||||||
|
Net income (loss) attributable to common stockholders
|
$
|
(1.30
|
)
|
$
|
(0.95
|
)
|
$
|
2.35
|
|
$
|
(0.75
|
)
|
$
|
(1.00
|
)
|
||||
|
Weighted average diluted common shares
|
95,207
|
|
94,426
|
|
114,881
|
|
87,622
|
|
75,155
|
|
|||||||||
|
December 31,
|
|||||||||||||||||||
|
2017
|
2016
|
2015
|
2014
|
2013
|
|||||||||||||||
|
(in thousands)
|
|||||||||||||||||||
|
Balance Sheets Data:
|
|||||||||||||||||||
|
Investments in hotel properties, net
|
$
|
4,035,915
|
|
$
|
4,160,563
|
|
$
|
2,128,611
|
|
$
|
2,128,611
|
|
$
|
2,164,389
|
|
||||
|
Cash and cash equivalents
|
354,805
|
|
347,091
|
|
215,063
|
|
215,063
|
|
128,780
|
|
|||||||||
|
Restricted cash
|
116,787
|
|
144,014
|
|
85,830
|
|
85,830
|
|
61,498
|
|
|||||||||
|
Notes receivable
|
—
|
|
—
|
|
3,553
|
|
3,553
|
|
3,384
|
|
|||||||||
|
Total assets
|
4,669,850
|
|
4,891,544
|
|
2,770,110
|
|
2,770,110
|
|
2,668,973
|
|
|||||||||
|
Indebtedness, net
|
3,696,300
|
|
3,723,559
|
|
1,943,133
|
|
1,943,133
|
|
1,810,900
|
|
|||||||||
|
Total stockholders’ equity of the Company
|
632,500
|
|
791,621
|
|
531,633
|
|
531,633
|
|
617,789
|
|
|||||||||
|
Year Ended December 31,
|
|||||||||||||||||||
|
2017
|
2016
|
2015
|
2014
|
2013
|
|||||||||||||||
|
(in thousands, except per share amounts)
|
|||||||||||||||||||
|
Other Data:
|
|||||||||||||||||||
|
Cash provided by (used in) operating activities
|
$
|
207,382
|
|
$
|
179,723
|
|
$
|
203,577
|
|
$
|
111,319
|
|
$
|
145,457
|
|
||||
|
Cash provided by (used in) investing activities
|
(63,881
|
)
|
(21,858
|
)
|
(780,316
|
)
|
(207,245
|
)
|
(353,998
|
)
|
|||||||||
|
Cash provided by (used in) financing activities
|
(163,902
|
)
|
(34,150
|
)
|
644,604
|
|
182,209
|
|
151,386
|
|
|||||||||
|
Cash dividends declared per common share
|
0.48
|
|
0.48
|
|
0.48
|
|
0.48
|
|
0.48
|
|
|||||||||
|
EBITDA (unaudited)
(1)
|
379,667
|
|
410,825
|
|
732,550
|
|
290,469
|
|
314,526
|
|
|||||||||
|
Funds From Operations (FFO) (unaudited)
(1)
|
98,406
|
|
129,532
|
|
132,863
|
|
85,097
|
|
95,523
|
|
|||||||||
____________________
|
(1)
|
A more detailed description and computation of FFO and EBITDA is contained in the “Non-GAAP Financial Measures” section of Management’s Discussion and Analysis of Financial Condition and Results of Operations in Item 7.
|
43
|
Item 7.
|
Management’s Discussion and Analysis of Financial Condition and Results of Operations
|
EXECUTIVE OVERVIEW
General
As of
December 31, 2017
, we owned
120
consolidated hotel properties, including
118
hotel properties directly owned, and
two
hotel properties owned through a majority-owned investment in a consolidated entity, which represents
25,058
total rooms, or
25,031
net rooms excluding those attributable to our partner. Currently, all of our hotel properties are located in the United States.
Based on our primary business objectives and forecasted operating conditions, our current key priorities and financial strategies include, among other things:
|
•
|
acquisition of hotel properties that will be accretive to our portfolio;
|
|
•
|
disposition of non-core hotel properties;
|
|
•
|
pursuing capital market activities to enhance long-term stockholder value;
|
|
•
|
preserving capital, enhancing liquidity, and continuing current cost-saving measures;
|
|
•
|
implementing selective capital improvements designed to increase profitability;
|
|
•
|
implementing effective asset management strategies to minimize operating costs and increase revenues;
|
|
•
|
financing or refinancing hotels on competitive terms;
|
|
•
|
utilizing hedges and derivatives to mitigate risks; and
|
|
•
|
making other investments or divestitures that our board of directors deems appropriate.
|
Our current investment strategy is to focus on owning predominantly full-service hotels in the upscale and upper upscale segments in domestic and international markets that have revenue per available room (“RevPAR”) generally less than twice the national average. We believe that as supply, demand, and capital market cycles change, we will be able to shift our investment strategy to take advantage of new lodging-related investment opportunities as they may develop. Our board of directors may change our investment strategy at any time without stockholder approval or notice.
RECENT DEVELOPMENTS
On January 19, 2017, AHT SMA, LP, a Delaware limited partnership and a wholly-owned subsidiary of Ashford Trust entered into an Investment Management Agreement (the “Agreement”) with Ashford Investment Management, LLC (“AIM”), a subsidiary of Ashford Inc., to manage all or a portion of Ashford Trust’s excess cash (the “Account”). Pursuant to the Agreement, the Company retained and appointed AIM as the investment manager for us. The Agreement will govern the relationship between Ashford Trust and AIM, as well as grant AIM certain rights, powers and duties to act on behalf of the Company. AIM will not be compensated by us for its services under the Agreement. We bear all costs and expenses of the establishment and ongoing maintenance of the Account as well as all costs and expenses of AIM.
On February 1, 2017,
the Company sold the Renaissance hotel in Portsmouth, Virginia (“Renaissance Portsmouth”) for approximately
$9.2 million
in cash. The sale resulted in a loss of
$43,000
for the year ended
December 31, 2017
and is included in “gain (loss) on acquisition of PIM Highland JV and sale of hotel properties” in the consolidated statements of operations. We repaid
$20.2 million
of principal on our mortgage loan that was partially secured by the Renaissance Portsmouth.
On February 20, 2017, the board of directors of the Company appointed Mr. Douglas A. Kessler as Chief Executive Officer of the Company, effective February 21, 2017. Also on February 20, 2017, Mr. Monty J. Bennett ceased to serve as the Company’s Chief Executive Officer. Mr. Bennett remains the Chairman of the Board. In order to provide greater focus to the Company, on April 27, 2017, Mr. Kessler resigned from the Board of Directors of Ashford Prime and no longer is President of Ashford Prime.
In connection with the appointment of Mr. Kessler as Chief Executive Officer of the Company, the Company and Mr. Kessler entered into a Restricted Stock Award Agreement (the “Award Agreement”), pursuant to which Mr. Kessler received 359,477 shares of Restricted Stock (as defined in the Award Agreement).
On March 2, 2017, we invested an additional
$650,000
in OpenKey.
On March 6, 2017, the Company sold the Embassy Suites in Syracuse, New York (“Embassy Suites Syracuse”) for approximately
$8.8 million
in cash. The sale resulted in a loss of
$40,000
for the year ended
December 31, 2017
and is included in “gain (loss) on acquisition of PIM Highland JV and sale of hotel properties” in the consolidated statements of operations. We repaid
$20.6 million
of principal on our mortgage loan that was partially secured by the Embassy Suites Syracuse.
44
On March 7, 2017, AIM REHE Funds GP, LP (“AIM GP”), the general partner of the AQUA U.S. Fund, provided written notice to Ashford Trust of its election to dissolve the AQUA U.S. Fund pursuant to Section 6.1(a) of the Second Amended and Restated Limited Partnership Agreement of the AQUA U.S. Fund as of March 31, 2017. Pursuant to this election, we liquidated our investment in the AQUA U.S. Fund subject to a
5%
hold back of
$2.6 million
which was received during the second quarter of 2017 upon completion of the audit of the AQUA U.S. Fund’s financial statements.
On May 10, 2017, we refinanced a
$105.0 million
mortgage loan, secured by the Renaissance Nashville in Nashville, Tennessee and the Westin in Princeton, New Jersey. The new mortgage loan totals
$181.0 million
, of which our initial advance was
$164.7 million
with future advances totaling
$16.3 million
as reimbursement for capital expenditures. The mortgage loan is interest only and provides for a floating interest rate of LIBOR + 3.00%. Beginning on July 1, 2020, quarterly principal payments of $750,000 are due.
The stated maturity is June 2022, with no extension options.
On May 23, 2017, the trial court, in the matter of
Palm Beach Florida Hotel and Office Building Limited Partnership, et al. v. Nantucket Enterprises, Inc.
, issued an order compelling the company that issued the supersedeas bond, RLI Insurance Company (“RLI”), to pay approximately $10.0 million. On June 1, 2017, RLI paid Nantucket this amount and sought reimbursement from the Company. On June 27, 2017, the Florida Supreme Court denied the Company's petition for review. As a result, all of the appeals were exhausted and the judgment was final with the determination and reimbursement of attorney's fees being the only remaining dispute. On June 29, 2017, the balance of the judgment was paid to Nantucket by the Company.
The Company estimates its total loss including post judgment interest and reimbursement of the plaintiff’s legal fees to be approximately $17.3 million as of December 31, 2017, resulting in additional expense of $4.1 million for the year ended December 31, 2017, respectively.
On May 24, 2017, we refinanced a
$15.7 million
mortgage loan, secured by the Hotel Indigo (“Hotel Indigo Atlanta”) in Atlanta, Georgia. The new loan totals
$16.1 million
. The mortgage loan is interest only and provides for a floating interest rate of LIBOR + 2.90% for the first two years with a 30-year amortization schedule based on a 6% interest rate starting in the third year. The stated maturity is May 2020, with two one-year extension options.
On June 29, 2017, RLI filed suit in Federal District Court in Dallas seeking to recover the amounts previously paid to Nantucket. On July 19, 2017, the Company paid approximately
$10.0 million
to RLI mooting RLI's claim subject only to the alleged claim for attorney fees. The Company paid the negotiated settlement of RLI's attorney fees in the amount of
$100,000
, on November 2, 2017, and a Stipulation for Dismissal was filed concluding the litigation.
On June 29, 2017, the Company sold the Crowne Plaza Ravinia in Atlanta, Georgia for approximately
$88.7 million
in cash. The sale resulted in a gain of
$14.1 million
for the
year ended
December 31, 2017
and is included in “gain (loss) on acquisition of PIM Highland JV and sale of hotel properties” in the consolidated statements of operations. The Company also repaid approximately
$78.7 million
of debt associated with the hotel property.
On August 25, 2017, the Company issued
3.4 million
shares of
7.50%
Series H cumulative preferred stock. The Series H cumulative preferred stock ranks senior to all classes or series of the Company’s common stock and future junior securities, on a parity with each series of the Company’s outstanding preferred stock (the Series A cumulative preferred stock (all shares redeemed on September 18, 2017), Series D cumulative preferred stock (7.1 million shares redeemed in 2017), Series F cumulative preferred stock, Series G cumulative preferred stock and Series I cumulative preferred stock (discussed below)) and with any future parity securities and junior to future senior securities and to all of the Company’s existing and future indebtedness, with respect to the payment of dividends and the distribution of amounts upon liquidation, dissolution or winding up of the Company’s affairs. On September 8, 2017, we issued 400,000 additional shares of 7.50% Series H cumulative preferred stock pursuant to the over-allotment option.
On August 31, 2017, we invested an additional $333,000 in OpenKey, resulting in a 16.2% total ownership interest.
On September 18, 2017, the Company redeemed its 8.55% Series A cumulative preferred stock at a redemption price of $25.00 per share, plus accrued and unpaid dividends through the redemption date, in an amount equal to $0.4631 per share, for a total redemption price of $25.4631 per share.
On September 18, 2017, the Company redeemed approximately 1.6 million shares of its 8.45% Series D cumulative preferred stock at a redemption price of $25.00 per share, plus accrued and unpaid dividends through the redemption date, in an amount equal to $0.4577 per share, for a total redemption price of $25.4577 per share.
On October 4, 2017, the Company redeemed 379,036 shares of 8.45% Series D cumulative preferred shares at a redemption price of
$25.00
per share, plus accrued and unpaid dividends through the redemption date, in an amount equal to
$0.5516
per share, for a total redemption price of
$25.5516
per share.
45
On October 30, 2017, we refinanced our $94.7 million mortgage loan, with an outstanding balance of $94.5 million, secured by the Hilton Boston Back Bay in Boston, Massachusetts. The new mortgage loan totals $97.0 million, provides for a floating interest rate of LIBOR + 2.00%, a five-year term with
no
extension options and is secured by the Hilton Boston Back Bay.
On October 31, 2017, we refinanced our $412.5 million mortgage loan, secured by seventeen hotels. The new mortgage loan totals $427.0 million, is interest only, provides for a floating interest rate of LIBOR + 3.00% and has a two-year initial term with five one-year extension options. The new mortgage loan is secured by the following seventeen hotels: the Courtyard Alpharetta, Courtyard Bloomington, Courtyard Crystal City, Courtyard Foothill Ranch, Embassy Suites Austin, Embassy Suites Dallas, Embassy Suites Houston, Embassy Suites Las Vegas, Embassy Suites Palm Beach, Hampton Inn Evansville, Hilton Garden Inn Jacksonville, Hilton Nassau Bay, Hilton St. Petersburg, Residence Inn Evansville, Residence Inn Falls Church, Residence Inn San Diego and Sheraton Indianapolis.
On November 17, 2017, the Company issued
5.4 million
shares of
7.50%
Series I cumulative preferred stock. The Series I cumulative preferred stock ranks senior to all classes or series of the Company’s common stock and future junior securities, on a parity with each series of the Company’s outstanding preferred stock (the Series D cumulative preferred stock (7.1 million shares redeemed in 2017), Series F cumulative preferred stock, Series G cumulative preferred stock and Series H cumulative preferred stock) and with any future parity securities and junior to future senior securities and to all of the Company’s existing and future indebtedness, with respect to the payment of dividends and the distribution of amounts upon liquidation, dissolution or winding up of the Company’s affairs.
On December 5, 2017, the board of directors reapproved a stock repurchase program (the “Repurchase Program”) pursuant to which the Board granted a repurchase authorization to acquire shares of the Company’s common stock, par value $0.01 per share (the “Common Stock”) having an aggregate value of up to $200 million. The Board’s authorization replaced any previous repurchase authorizations. On December 11, 2017, we entered into equity distribution agreements with UBS Securities LLC, Morgan Stanley & Co. LLC, B. Riley FBR, Inc., Robert W. Baird & Co. Incorporated, D.A. Davidson & Co., Deutsche Bank Securities Inc. and Janney Montgomery Scott LLC, each acting as a sales agent (the “Equity Distribution Agreements”). Pursuant to the Equity Distribution Agreements, we may sell from time to time through the sales agents shares of our common stock having an aggregate offering price of up to $100.0 million. Sales of shares of our common stock, if any, may be made in negotiated transactions or transactions that are deemed to be “at-the-market” offerings as defined in Rule 415 of the Securities Act, including sales made directly on the New York Stock Exchange, the existing trading market for our common stock, or sales made to or through a market maker other than on an exchange or through an electronic communications network. We will pay each of the sales agents a commission, which in each case shall not be more than 2.0% of the gross sales price of the shares of our common stock sold through such sales agent. As of December 31, 2017, no shares of our common stock have been sold under this program.
On December 8, 2017, the Company redeemed approximately 5.1 million shares of its 8.45% Series D cumulative preferred stock at a redemption price of $25.00 per share, plus accrued and unpaid dividends through the redemption date, in an amount equal to $0.3990 per share, for a total redemption price of $25.3990 per share.
On January 17, 2018, we refinanced our $376.8 million mortgage loan. The new mortgage loan totaled $395.0 million. The new mortgage loan has a two-year initial term and five one-year extension options, subject to the satisfaction of certain conditions. The mortgage loan is interest only and provides for a floating interest rate of LIBOR + 2.92%. The Mortgage loan is secured by eight hotels: Embassy Suites Portland, Embassy Suites Crystal City, Embassy Suites Orlando, Embassy Suites Santa Clara, Crowne Plaza Key West, Hilton Costa Mesa, Sheraton Minneapolis, and Historic Inns of Annapolis.
On February 20, 2018, we completed the sale of the SpringHill Suites Glen Allen for approximately
$10.9 million
.
RESULTS OF OPERATIONS
RevPAR is a commonly used measure within the hotel industry to evaluate hotel operations. RevPAR is defined as the product of the ADR charged and the average daily occupancy achieved. RevPAR does not include revenues from food and beverage or parking, telephone, or other guest services generated by the property. Although RevPAR does not include these ancillary revenues, it is generally considered the leading indicator of core revenues for many hotels. We also use RevPAR to compare the results of our hotels between periods and to analyze results of our comparable hotels (comparable hotels represent hotels we have owned for the entire year). RevPAR improvements attributable to increases in occupancy are generally accompanied by increases in most categories of variable operating costs. RevPAR improvements attributable to increases in ADR are generally accompanied by increases in limited categories of operating costs, such as management fees and franchise fees.
46
The following table summarizes the changes in key line items from our consolidated statements of operations for the years ended
December 31, 2017
,
2016
and
2015
(in thousands):
|
Year Ended December 31,
|
Favorable (Unfavorable)
Change |
||||||||||||||||||
|
2017
|
2016
|
2015
|
2017 to 2016
|
2016 to 2015
|
|||||||||||||||
|
Total revenue
|
$
|
1,439,270
|
|
$
|
1,492,043
|
|
$
|
1,336,966
|
|
$
|
(52,773
|
)
|
$
|
155,077
|
|
||||
|
Total hotel expenses
|
(907,301
|
)
|
(938,399
|
)
|
(840,244
|
)
|
31,098
|
|
(98,155
|
)
|
|||||||||
|
Property taxes, insurance and other
|
(73,579
|
)
|
(73,457
|
)
|
(65,301
|
)
|
(122
|
)
|
(8,156
|
)
|
|||||||||
|
Depreciation and amortization
|
(246,731
|
)
|
(243,863
|
)
|
(210,410
|
)
|
(2,868
|
)
|
(33,453
|
)
|
|||||||||
|
Impairment charges
|
(10,153
|
)
|
(17,816
|
)
|
(19,511
|
)
|
7,663
|
|
1,695
|
|
|||||||||
|
Transaction costs
|
(14
|
)
|
(77
|
)
|
(6,252
|
)
|
63
|
|
6,175
|
|
|||||||||
|
Advisory service fee
|
(53,199
|
)
|
(54,361
|
)
|
(43,023
|
)
|
1,162
|
|
(11,338
|
)
|
|||||||||
|
Corporate general and administrative
|
(13,288
|
)
|
(8,366
|
)
|
(14,310
|
)
|
(4,922
|
)
|
5,944
|
|
|||||||||
|
Operating income (loss)
|
135,005
|
|
155,704
|
|
137,915
|
|
(20,699
|
)
|
17,789
|
|
|||||||||
|
Equity in earnings (loss) of unconsolidated entities
|
(5,866
|
)
|
(6,110
|
)
|
(6,831
|
)
|
244
|
|
721
|
|
|||||||||
|
Interest income
|
2,202
|
|
331
|
|
90
|
|
1,871
|
|
241
|
|
|||||||||
|
Gain (loss) on acquisition of PIM Highland JV and sale of hotel properties
|
14,030
|
|
31,599
|
|
380,752
|
|
(17,569
|
)
|
(349,153
|
)
|
|||||||||
|
Other income (expense)
|
(3,422
|
)
|
(4,517
|
)
|
(864
|
)
|
1,095
|
|
(3,653
|
)
|
|||||||||
|
Interest expense and amortization of loan costs
|
(222,631
|
)
|
(223,967
|
)
|
(187,514
|
)
|
1,336
|
|
(36,453
|
)
|
|||||||||
|
Write-off of premiums, loan costs and exit fees
|
(2,845
|
)
|
(12,702
|
)
|
(5,750
|
)
|
9,857
|
|
(6,952
|
)
|
|||||||||
|
Unrealized gain (loss) on marketable securities
|
(4,649
|
)
|
4,946
|
|
127
|
|
(9,595
|
)
|
4,819
|
|
|||||||||
|
Unrealized gain (loss) on derivatives
|
(2,802
|
)
|
(2,534
|
)
|
(7,402
|
)
|
(268
|
)
|
4,868
|
|
|||||||||
|
Income tax benefit (expense)
|
2,218
|
|
(1,532
|
)
|
(4,710
|
)
|
3,750
|
|
3,178
|
|
|||||||||
|
Income (loss) from continuing operations
|
(88,760
|
)
|
(58,782
|
)
|
305,813
|
|
(29,978
|
)
|
(364,595
|
)
|
|||||||||
|
Gain (loss) on sale of hotel property, net of tax
|
—
|
|
—
|
|
599
|
|
—
|
|
(599
|
)
|
|||||||||
|
Net income (loss)
|
(88,760
|
)
|
(58,782
|
)
|
306,412
|
|
(29,978
|
)
|
(365,194
|
)
|
|||||||||
|
(Income) loss from consolidated entities attributable to noncontrolling interests
|
110
|
|
14
|
|
30
|
|
96
|
|
(16
|
)
|
|||||||||
|
Net (income) loss attributable to redeemable noncontrolling interests in operating partnership
|
21,642
|
|
12,483
|
|
(35,503
|
)
|
9,159
|
|
47,986
|
|
|||||||||
|
Net income (loss) attributable to the Company
|
$
|
(67,008
|
)
|
$
|
(46,285
|
)
|
$
|
270,939
|
|
$
|
(20,723
|
)
|
$
|
(317,224
|
)
|
||||
47
Comparison of Year Ended
December 31, 2017
with Year Ended
December 31, 2016
All hotel properties owned during the years ended
December 31, 2017
and
2016
have been included in our results of operations during the respective periods in which they were owned. Based on when a hotel property was acquired or disposed, operating results for certain hotel properties are not comparable for the years ended
December 31, 2017
and
2016
. The hotel properties listed below are not comparable hotel properties for the periods indicated and all other hotel properties are considered comparable hotel properties. The following acquisitions and dispositions affect reporting comparability related to our consolidated financial statements:
|
Hotel Properties
|
Location
|
Type
|
Date
|
|||
|
5-hotel portfolio
(1)
|
Various
|
Disposition
|
June 1, 2016
|
|||
|
Hampton Inn & Suites
(1)
|
Gainesville, FL
|
Disposition
|
September 1, 2016
|
|||
|
SpringHill Suites Gaithersburg
(1)
|
Gaithersburg, MD
|
Disposition
|
October 1, 2016
|
|||
|
2-hotel portfolio
(1)
|
Palm Desert, CA
|
Disposition
|
October 7, 2016
|
|||
|
Renaissance
(1)
|
Portsmouth, VA
|
Disposition
|
February 1, 2017
|
|||
|
Embassy Suites
(1)
|
Syracuse, NY
|
Disposition
|
March 6, 2017
|
|||
|
Crowne Plaza Ravinia
(1)
|
Atlanta, GA
|
Disposition
|
June 29, 2017
|
|||
____________________________________
(1)
Collectively referred to as “Hotel Dispositions”
The following table illustrates the key performance indicators of the hotel properties and WorldQuest included in our results of operations:
|
Year Ended December 31,
|
|||||||
|
2017
|
2016
|
||||||
|
RevPAR (revenue per available room)
|
$
|
122.48
|
|
$
|
118.44
|
|
|
|
Occupancy
|
77.36
|
%
|
77.00
|
%
|
|||
|
ADR (average daily rate)
|
$
|
158.33
|
|
$
|
153.83
|
|
|
The following table illustrates the key performance indicators of the 120 hotel properties and WorldQuest that were included for the full years ended December 31,
2017
and
2016
, respectively:
|
Year Ended December 31,
|
|||||||
|
2017
|
2016
|
||||||
|
RevPar
|
$
|
122.96
|
|
$
|
120.77
|
|
|
|
Occupancy
|
77.46
|
%
|
77.14
|
%
|
|||
|
ADR
|
$
|
158.74
|
|
$
|
156.56
|
|
|
Net Income (Loss) Attributable to the Company.
Net loss attributable to the Company increased
$20.7 million
, from
$46.3 million
for the
year ended
December 31, 2016
(“
2016
”) to
$67.0 million
for the
year ended
December 31, 2017
(“
2017
”) as a result of the factors discussed below.
Revenue.
Rooms revenue from our hotel properties and WorldQuest
de
creased
$37.1 million
, or
3.1%
, to
$1.1 billion
during
2017
compared to
2016
. This decrease is primarily attributable to lower rooms revenue of $54.3 million related to our Hotel Dispositions, partially offset by higher rooms revenue of $17.3 million from our comparable hotel properties and WorldQuest, which experienced a
1.4%
increase in room rates and a
32
basis point increase in occupancy.
Food and beverage revenue
de
creased
$18.4 million
, or
7.3%
, to
$234.8 million
during
2017
compared to
2016
. This decrease is attributable to lower food and beverage revenue of $9.4 million from our Hotel Dispositions and $9.0 million from our comparable hotel properties and WorldQuest. The decrease in our comparable hotel properties and WorldQuest is primarily attributable to approximately $1.6 million associated with the renovation of the DFW Airport Marriott in Irving, Texas and unfavorable year over year changes in the July 4th holiday calendar moving from the weekend to midweek.
Other hotel revenue, which consists mainly of Internet access, parking, and spa,
in
creased
$1.3 million
, or
2.3%
, to
$58.2 million
during
2017
compared to
2016
. This
in
crease is primarily attributable to higher other revenue of $3.0 million from our
48
comparable hotel properties and WorldQuest, partially offset by lower other revenue of $1.6 million from our Hotel Dispositions. Other non-hotel revenue
in
creased
$1.4 million
, or
81.1%
, to $3.2 million in
2017
.
Hotel Operating Expenses.
Hotel operating expenses
de
creased
$31.1 million
, or
3.3%
, to
$907.3 million
during
2017
compared to
2016
. Hotel operating expenses consist of direct expenses from departments associated with revenue streams and indirect expenses associated with support departments and management fees. Direct expenses decreased
$18.2 million
in
2017
as compared to
2016
, which was comprised of a decrease of $20.1 million related to our Hotel Dispositions, partially offset by an increase of $1.9 million from our comparable hotel properties and WorldQuest. Direct expenses were
30.1%
of total hotel revenue for both
2017
and
2016
. Indirect expenses and management fees decreased
$12.9 million
in
2017
as compared to
2016
, which was comprised of a decrease of $21.6 million from our Hotel Dispositions, partially offset by an increase of $8.7 million from our comparable hotel properties and WorldQuest. The increase from our comparable hotel properties was primarily attributable to uninsured hurricane related costs of $2.8 million and $4.2 million from an additional accrual related to the final judgment in the lawsuit captioned
Palm Beach Florida Hotel and Office Building Limited Partnership, et al. v. Nantucket Enterprises, Inc.
See note 12 to our consolidated financial statements.
Property Taxes, Insurance, and Other.
Property taxes, insurance, and other
in
creased
$122,000
or
0.2%
, to
$73.6 million
during
2017
compared to
2016
. The
in
crease was primarily due to $3.3 million from our comparable hotel properties and WorldQuest, partially offset by a decrease of $3.2 million from our Hotel Dispositions.
Depreciation and Amortization.
Depreciation and amortization
in
creased
$2.9 million
or
1.2%
, to
$246.7 million
during
2017
compared to
2016
. The
in
crease was primarily due to $12.2 million of depreciation and amortization at our comparable hotel properties and WorldQuest, partially offset by a decrease of $9.3 million from our Hotel Dispositions.
Impairment Charges.
We recorded impairment charges of
$10.2 million
and
$17.8 million
in
2017
and
2016
, respectively. We recorded an impairment charge of
$2.0 million
in
2017
for damages to hotel properties from Hurricanes Harvey and Irma and an impairment charge totaling $8.2 million at the SpringHill Suites in Centreville, Virginia and the SpringHill Suites in Glen Allen, Virginia. We recorded an impairment charge of
$17.8 million
in
2016
comprised of impairment charges totaling $18.3 million on SpringHill Suites Gaithersburg, Embassy Suites Syracuse and Renaissance Portsmouth, partially offset by an impairment credit of $500,000 related to a valuation adjustment on a previously impaired mezzanine loan.
Transaction Costs.
Transaction costs
de
creased
$63,000
or
81.8%
, to
$14,000
in
2017
compared to
2016
.
Advisory Service Fee.
The advisory services fee decreased
$1.2 million
or
2.1%
, to
$53.2 million
in
2017
compared to
2016
, which represents a fee paid in connection with our advisory agreement with Ashford Inc. In
2017
, the advisory services fee was comprised of a base advisory fee of $34.7 million, equity-based compensation of $11.1 million from equity grants of our common stock and LTIP units awarded to the officers and employees of Ashford Inc. and reimbursable expenses of $7.5 million. In
2016
, the advisory services fee was comprised of a base advisory fee of $34.6 million, reimbursable expenses of $5.9 million, an incentive fee of $5.4 million and equity-based compensation of $8.4 million associated with equity grants of our common stock and LTIP units awarded to the officers and employees of Ashford Inc.
Corporate, General, and Administrative.
Corporate, general, and administrative expenses
in
creased
$4.9 million
, or
58.8%
, to
$13.3 million
during
2017
compared to
2016
. The
in
crease was primarily attributable to higher transaction, acquisition and management conversion costs of $2.5 million and higher public company costs, office expenses, professional fees and other miscellaneous expenses of $2.5 million in
2017
compared to
2016
.
Equity in Earnings (Loss) of Unconsolidated Entities.
We recorded equity in loss of unconsolidated entities of
$5.9 million
and
$6.1 million
in
2017
and
2016
, respectively. In
2017
we recorded equity in loss of $5.4 million from Ashford Inc. and $481,000 from OpenKey, partially offset by equity in earnings of $52,000 from the AQUA U.S. Fund. In
2016
we recorded equity in loss of $5.1 million from the AQUA U.S. Fund, $743,000 from Ashford Inc. and $305,000 from OpenKey.
Interest Income.
Interest income was
$2.2 million
and
$331,000
in
2017
and
2016
, respectively.
Gain (Loss) on Acquisition of PIM Highland JV and Sale of Hotel Properties.
Gain on acquisition of PIM Highland JV and sale of hotel properties was
$14.0 million
and
$31.6 million
in
2017
and
2016
, respectively. The gain in
2017
was related to a gain of $14.1 million on the sale of the Crowne Plaza Ravinia, slightly offset by losses from the sales of the Renaissance Portsmouth and Embassy Suites Syracuse. The gain in
2016
was primarily related to our Hotel Dispositions, slightly offset by a loss on the sale of a vacant lot associated with the Le Pavillon Hotel in New Orleans, Louisiana.
Other Income (Expense).
Other expense decreased
$1.1 million
, or
24.2%
, to
$3.4 million
in
2017
compared to
2016
. In
2017
, we recognized realized losses of $4.2 million related to the termination of CMBX tranches, $543,000 on the maturities of options on futures contracts and $1.0 million of CMBX premiums and usage fees. These realized losses were partially offset by
49
dividend income of $1.1 million, a realized gain of $971,000 on marketable securities and other miscellaneous income of $250,000. In 2016, we recognized realized losses of $3.3 million related to the termination of CMBX tranches, $313,000 related to the maturity of options on futures contracts, $150,000 from an investment write-off and $872,000 of CMBX premiums and usage fees.
Interest Expense and Amortization of Loan Costs.
Interest expense and amortization of loan costs
de
creased
$1.3 million
or
0.6%
, to
$222.6 million
during
2017
compared to
2016
. The
de
crease is primarily due to lower interest expense and amortization of loan costs of $8.1 million from our Hotel Dispositions, partially offset by an increase of $6.8 million from higher interest expense and amortization of loan costs as a result of refinances and an increase in LIBOR rates. The average LIBOR rates in
2017
and
2016
were 1.11% and 0.45%, respectively.
Write-off of Loan Costs and Exit Fees.
Write-off of loan costs and exit fees was
$2.8 million
and
$12.7 million
in
2017
and
2016
, respectively. In
2017
, we incurred write-off of premiums and loan costs of $324,000 and exit fees of $2.5 million from refinancing a mortgage loan secured by the Nashville Renaissance and Princeton Westin as well as the refinance of a mortgage loan secured by 17 hotel properties. In
2016
, we incurred write-off of loan costs and exit fees of $12.7 million resulting from the write-off of unamortized loan costs of $897,000 and other exit fees of $11.8 million related to the sale of a five-hotel portfolio and the Hampton Inn Gainesville.
Unrealized Gain (Loss) on Marketable Securities.
Unrealized gain (loss) on marketable securities was a loss of
$4.6 million
in
2017
and a gain of
$4.9 million
in
2016
, which are based on changes in closing market prices during the period.
Unrealized Gain (Loss) on Derivatives.
Unrealized loss on derivatives
in
creased
$268,000
or
10.6%
, to
$2.8 million
during
2017
compared to
2016
. In
2017
, we recognized unrealized losses of $4.2 million, $2.4 million and $758,000 associated with the remaining CMBX tranches, interest rate floors, and interest rate caps, respectively, partially offset by unrealized gains of $4.2 million associated with the reclassification to other income (expense) for the recognition of realized losses from CMBX tranche terminations and $427,000 associated with the reclassification to other income (expense) for maturities of options on futures contracts. In
2016
, we recorded an unrealized gain of $611,000 related to interest rate floors, a $3.3 million unrealized gain associated with the reclassification to other income (expense) for the recognition of the realized loss from CMBX tranche terminations and a $313,000 unrealized gain associated with the reclassification to other income (expense) for the maturity of options on futures contracts, partially offset by unrealized losses of $5.8 million, $348,000 and $536,000 on the remaining CMBX tranches, options on futures contracts and interest rate derivatives, respectively. The fair value of interest rate floors and interest rate derivatives are primarily based on movements in the LIBOR forward curve and the passage of time. The fair value of options on futures contracts is determined based on the last reported settlement price as of the measurement date. The fair value of credit default swaps is based on the change in value of CMBX indices.
Income Tax (Expense) Benefit.
Income tax (expense) benefit changed
$3.8 million
, from expense of
$1.5 million
in 2016 to a benefit of
$2.2 million
in 2017. The change in income tax benefit (expense) is primarily due to a decrease in the profitability of the Company’s taxable REIT subsidiaries in 2017 compared to 2016 as well as the estimated benefit related to the Tax Cuts and Jobs Act of 2017.
(Income) Loss from Consolidated Entities Attributable to Noncontrolling Interests.
Our noncontrolling interest partner in consolidated entities was allocated losses of
$110,000
and
$14,000
during
2017
and
2016
, respectively.
Net (Income) Loss Attributable to Redeemable Noncontrolling Interests in Operating Partnership.
Noncontrolling interests in our operating partnership were allocated their proportionate share of net loss of
$21.6 million
and
$12.5 million
in
2017
and
2016
, respectively. Redeemable noncontrolling interests represented ownership interests of
15.52%
and
14.48%
in the operating partnership at
December 31, 2017
and
2016
, respectively.
50
Comparison of Year Ended December 31,
2016
with Year Ended December 31,
2015
All hotel properties owned for the years ended
December 31, 2016
and
2015
have been included in our results of operations during the respective periods. Based on when a hotel property was acquired or disposed, operating results for certain hotel properties are not comparable for the years ended
December 31, 2016
and
2015
. The hotel properties listed below are not comparable hotel properties for the periods indicated and all other hotel properties are considered comparable hotel properties. The following acquisitions and dispositions affect reporting comparability related to our consolidated financial statements:
|
Hotel Properties
|
Location
|
Type
|
Date
|
|||
|
Lakeway Resort & Spa
(1)
|
Austin, TX
|
Acquisition
|
February 6, 2015
|
|||
|
Memphis Marriott East
(1)
|
Memphis, TN
|
Acquisition
|
February 25, 2015
|
|||
|
PIM Highland JV (28.26% interest) (28 hotels)
|
Various
|
Acquisition
|
March 6, 2015
|
|||
|
Hampton Inn & Suites
(1)
|
Gainesville, FL
|
Acquisition
|
April 29, 2015
|
|||
|
Le Pavillon Hotel
(1)
|
New Orleans, LA
|
Acquisition
|
June 3, 2015
|
|||
|
9-hotel portfolio
(1)
|
Various
|
Acquisition
|
June 17, 2015
|
|||
|
W Atlanta Downtown
(1)
|
Atlanta, GA
|
Acquisition
|
July 1, 2015
|
|||
|
Le Meridien Minneapolis
(1)
|
Minneapolis, MN
|
Acquisition
|
July 23, 2015
|
|||
|
Hilton Garden Inn - Wisconsin Dells
(1)
|
Wisconsin Dells, WI
|
Acquisition
|
August 5, 2015
|
|||
|
Hotel Indigo Atlanta
(1)
|
Atlanta, GA
|
Acquisition
|
October 15, 2015
|
|||
|
W Minneapolis Foshay
(1)
|
Minneapolis, MI
|
Acquisition
|
November 10, 2015
|
|||
|
5-hotel portfolio
(2)
|
Various
|
Disposition
|
June 1, 2016
|
|||
|
Hampton Inn & Suites
(2)
|
Gainesville, FL
|
Disposition
|
September 1, 2016
|
|||
|
SpringHill Suites Gaithersburg
(2)
|
Gaithersburg, MD
|
Disposition
|
October 1, 2016
|
|||
|
2-hotel portfolio
(2)
|
Palm Desert, CA
|
Disposition
|
October 7, 2016
|
|||
____________________________________
(1)
Collectively reported as (“2015 Hotel Acquisitions”)
(2)
Collectively reported as (“2016 Hotel Dispositions”)
The following table illustrates the key performance indicators of the hotel properties and WorldQuest included in our results of operations:
|
Year Ended December 31,
|
|||||||
|
2016
|
2015
|
||||||
|
RevPAR (revenue per available room)
|
$
|
118.44
|
|
$
|
114.25
|
|
|
|
Occupancy
|
77.00
|
%
|
77.27
|
%
|
|||
|
ADR (average daily rate)
|
$
|
153.83
|
|
$
|
147.85
|
|
|
The following table illustrates the key performance indicators of the 78 hotel properties and WorldQuest that were included for the full years ended
2016
and
2015
, respectively:
|
Year Ended December 31,
|
|||||||
|
2016
|
2015
|
||||||
|
RevPar (revenue per available room)
|
$
|
118.21
|
|
$
|
113.52
|
|
|
|
Occupancy
|
78.86
|
%
|
78.21
|
%
|
|||
|
ADR (average daily rate)
|
$
|
149.91
|
|
$
|
145.15
|
|
|
Net Income (Loss) Attributable to the Company.
Net income (loss) attributable to the Company changed
$317.2 million
, from net income of
$270.9 million
for the
year ended
December 31,
2015
(“
2015
”) to net loss of
$46.3 million
for the
year ended
December 31,
2016
(“
2016
”) as a result of the factors discussed below.
Revenue.
Rooms revenue from our hotel properties increased $121.2 million, or 11.4%, to $1.2 billion during 2016 compared to 2015. We experienced an increase in rooms revenue of $66.6 million as a result of the PIM Highland JV acquisition, $53.5
51
million associated with the 2015 Hotel Acquisitions and $27.1 million from our comparable hotel properties and WorldQuest, which experienced an increase of 65 basis points in occupancy and an increase of 3.3% in room rates. This increase was offset by lower revenue of $26.0 million resulting from our 2016 Hotel Dispositions.
Food and beverage revenue experienced an increase of $26.1 million, or 11.5%, to $253.2 million during 2016 compared to 2015. This increase is a result of $20.2 million from the PIM Highland JV acquisition, $10.0 million associated with the 2015 Hotel Acquisitions, offset by lower revenue of $2.2 million from our comparable hotel properties and WorldQuest and $1.5 million resulting from our 2016 Hotel Dispositions.
Other hotel revenue, which consists mainly of Internet access, parking, and spa, experienced an increase of $8.2 million, or 16.8%, to $56.9 million during 2016 compared to 2015. This increase is a result of $3.3 million from the PIM Highland JV acquisition, $5.4 million associated with the 2015 Hotel Acquisitions and $270,000 from our comparable hotel properties and WorldQuest, offset by lower revenue of $815,000 from our 2016 Hotel Dispositions. Other non-hotel revenue decreased $414,000, or 19.2% to $1.7 million during 2016 compared to 2015. The decrease in other non-hotel revenue is primarily attributable to the acquisition of the PIM Highland JV. Prior to the acquisition, we received expense reimbursements related to our managing the day-to-day operations and providing corporate administrative services such as accounting, insurance, marketing support, asset management, and other services.
Hotel Operating Expenses.
Hotel operating expenses increased $98.2 million, or 11.7%, to $938.4 million during 2016 compared to 2015. Hotel operating expenses consist of direct expenses from departments associated with revenue streams and indirect expenses associated with support departments and management fees. We experienced an increase in direct expenses of $44.9 million in 2016 compared to 2015. The increase in direct expenses was comprised of $29.5 million from the PIM Highland JV acquisition, $20.0 million as a result of the 2015 Hotel Acquisitions and $4.5 million from our comparable hotel properties and WorldQuest, offset by a decrease of $9.1 million from our 2016 Hotel Dispositions. Direct expenses were 30.2% and 30.4% of total hotel revenue in 2016 and 2015, respectively. We experienced an increase in indirect expenses and management fees of $53.3 million in 2016 compared to 2015, which was comprised of $31.1 million from the PIM Highland JV acquisition, $23.2 million from the 2015 Hotel Acquisitions and $8.3 million from our comparable hotel properties and WorldQuest, offset by a decrease of $9.4 million from our 2016 Hotel Dispositions. The increases from our comparable hotel properties and WorldQuest are attributable to higher hotel revenues at those properties.
Property Taxes, Insurance, and Other.
Property taxes, insurance, and other increased $8.2 million or 12.5%, to $73.5 million during 2016 compared to 2015. The increase was comprised of $3.7 million of property taxes, insurance, and other associated with the PIM Highland JV acquisition, $5.0 million associated with the 2015 Hotel Acquisitions and $1.6 million from our comparable hotel properties and WorldQuest. This increase was partially offset by $1.7 million from our 2016 Hotel Dispositions.
Depreciation and Amortization.
Depreciation and amortization increased $33.5 million or 15.9%, to $243.9 million during 2016 compared to 2015. The increase was primarily due to $12.8 million of depreciation and amortization associated with the PIM Highland JV acquisition and $14.7 million associated with the 2015 Hotel Acquisitions. The remaining increase of $11.6 million is attributable to capital expenditures at our comparable hotel properties that have occurred since December 31, 2015. These increases were offset by a decrease of $5.6 million from our 2016 Hotel Dispositions.
Impairment Charges.
We recorded impairment charges of $17.8 million and $19.5 million in 2016 and 2015, respectively. We recorded impairment charges on the SpringHill Suites Gaithersburg, Embassy Suites Syracuse and Renaissance Portsmouth totaling $18.3 million, offset by an impairment credit of $500,000 in 2016 and on the SpringHill Suites Gaithersburg and Residence Inn Las Vegas totaling $19.9 million, offset by an impairment credit of $439,000 in 2015.
Transaction Costs.
Transaction costs decreased $6.2 million or 98.8%, to $77,000 in 2016 compared to 2015. The decrease is primarily attributable to the costs related to the acquisitions of the PIM Highland JV, Lakeway Resort, Memphis Marriott, Hampton Inn Gainesville, Le Pavillon, Rockbridge Portfolio, W Atlanta, Le Meridien Minneapolis, Hilton Garden Inn - Wisconsin Dells, Hotel Indigo Atlanta and W Minneapolis in 2015.
Advisory Service Fee.
Advisory services fees increased $11.3 million or 26.4%, to $54.4 million in 2016 compared to 2015, which represent fees paid in connection with our advisory agreement with Ashford Inc. For 2016, the advisory services fee comprised of a base advisory fee of $34.6 million, reimbursable expenses of $5.9 million, an incentive fee of $5.4 million and equity-based compensation of $8.4 million associated with equity grants of our common stock and LTIP units awarded to the officers and employees of Ashford Inc. in connection with providing advisory services. For 2015, the advisory services fee comprised of a base advisory fee of $33.8 million, reimbursable expenses of $6.5 million and equity-based compensation of $2.7 million associated with equity grants of our common stock and LTIP units awarded to the officers and employees of Ashford Inc.
Corporate, General, and Administrative.
Corporate, general, and administrative expenses decreased $5.9 million, or 41.5%, to $8.4 million during 2016 compared to 2015. The decrease was primarily attributable to $5.4 million of transaction, acquisition
52
and management conversion costs in the 2015, as well as lower public company costs, office expenses, professional fees and other miscellaneous expenses of approximately $502,000 in 2016.
Equity in Earnings (Loss) of Unconsolidated Entities.
We recorded equity in loss of unconsolidated entities of $6.1 million and $6.8 million in 2016 and 2015, respectively. In 2016, we recorded equity in loss of $5.1 million in AQUA U.S. Fund, $743,000 in Ashford Inc. and $305,000 in OpenKey. In 2015, we recorded equity in loss of $3.4 million in the AQUA U.S. Fund, $3.8 million in PIM Highland JV and $483,000 in Ashford Inc., offset by equity in earnings in Ashford Prime of $874,000.
Interest Income.
Interest income was $331,000 and $90,000 in 2016 and 2015, respectively.
Gain (Loss) on Acquisition of PIM Highland JV and Sale of Hotel Properties.
Gain on acquisition of PIM Highland JV and sale of hotel properties was $31.6 million and $380.8 million for 2016 and 2015, respectively. The gain in 2016 was primarily related to our 2016 Hotel Dispositions, offset by a loss on the sale of a vacant lot associated with the Le Pavillon Hotel in New Orleans, Louisiana. See note 5 to our consolidated financial statements. The gain in 2015 was primarily related to the acquisition of the remaining interest in the PIM Highland JV in March 2015.
Other Income (Expense).
Other income (expense) increased $3.7 million, or 422.8%, from a loss of $864,000 during 2015 to a loss of $4.5 million during 2016. In 2016 we recognized a realized loss of $3.3 million related to the termination of CMBX tranches, $313,000 related to the maturity of options on futures contracts, $150,000 as a result of an investment write-off and $872,000 related to CMBX premiums and usage fees. As a result of the contribution of certain marketable securities in consideration for an ownership interest in the AQUA U.S. Fund we no longer have realized gain or loss on marketable securities and dividend income. In 2015 prior to our contribution to the AQUA U.S. Fund we recognized a realized gain on marketable securities of $1.9 million and dividend income of $255,000.
Interest Expense and Amortization of Loan Costs.
Interest expense and amortization of loan costs increased $36.5 million or 19.4%, to $224.0 million during 2016 compared to 2015. The increase is primarily due to $14.8 million of higher interest expense and amortization associated with the PIM Highland JV acquisition and refinance, higher interest expense and loan cost amortization as a result of new financings on the majority of the 2015 Hotel Acquisitions of $12.5 million and higher interest expense and loan cost amortization of $12.6 million as a result of refinances on our comparable hotel properties, offset by lower interest expense and amortization of loan costs of $3.4 million resulting from our 2016 Hotel Dispositions. The average LIBOR rates in 2016 and 2015 were 0.45% and 0.20%, respectively.
Write-off of Loan Costs and Exit Fees.
Write-off of loan costs and exit fees was $12.7 million and $5.8 million in 2016 and 2015, respectively. For 2016, we wrote-off unamortized loan costs of $897,000 and incurred defeasance and other exit fees of $11.8 million. For 2015, we wrote-off unamortized loan costs of $122,000 and incurred defeasance and other exit fees of $5.6 million.
Unrealized Gain (Loss) on Marketable Securities.
Unrealized gain (loss) on marketable securities was a gain of $4.9 million and $127,000 in 2016 and 2015, respectively, which are based on changes in closing market prices during the period.
Unrealized Gain (Loss) on Derivatives.
Unrealized gain (loss) on derivatives decreased $4.9 million or 65.8%, to a loss of $2.5 million during 2016 compared to 2015. In 2016, we had an unrealized gain of $611,000 related to interest rate floors, a $3.3 million unrealized gain associated with the recognition of the realized loss from CMBX tranche terminations and a $313,000 unrealized gain associated with the maturity of an option on futures contract, offset by unrealized losses of $5.8 million, $348,000 and $536,000 on the remaining CMBX tranches, options on futures contracts and interest rate caps, respectively. In 2015, we had unrealized losses consisting of $7.6 million, $2.0 million and $391,000 related to interest rate floors, interest rate caps and options on futures contracts, respectively, offset by an unrealized gain of $2.6 million on credit default swaps. The fair values of interest rate floors and interest rate derivatives are primarily based on movements in the LIBOR forward curve and the passage of time. The fair value of options on futures contracts is determined based on the last reported settlement price as of the measurement date. The fair value of credit default swaps is based on the change in value of CMBX indices.
Income Tax Benefit (Expense).
Income tax benefit (expense) decreased $3.2 million, or 67.5% from expense of $4.7 million in 2015 to $1.5 million during 2016. The decrease in income tax expense is primarily due to a decrease in profitability for our wholly owned TRS entities.
Gain (Loss) on Sale of Hotel Property, net of tax.
Gain (loss) on sale of hotel properties, net of tax, was a gain of $599,000 in 2015. We recognized a previously deferred gain of $599,000 on the sale of the Pier House Resort as a result of the distribution of Ashford Prime OP common units to our stockholders and OP unitholders that eliminated our equity investment in Ashford Prime OP. See note 4 to our consolidated financial statements.
53
(Income) Loss from Consolidated Entities Attributable to Noncontrolling Interests.
Our noncontrolling interest partner in consolidated entities was allocated losses of $14,000 and $30,000 during 2016 and 2015, respectively.
Net (Income) Loss Attributable to Redeemable Noncontrolling Interests in Operating Partnership.
Noncontrolling interests in our operating partnership were allocated their proportionate share of net loss of $12.5 million and net income of $35.5 million in 2016 and 2015, respectively. Redeemable noncontrolling interests represented ownership interests of 14.48% and 13.36% in the operating partnership at December 31, 2016 and 2015, respectively.
LIQUIDITY AND CAPITAL RESOURCES
Our cash position from operations is affected primarily by macro industry movements in occupancy and rate as well as our ability to control costs. Further, interest rates can greatly affect the cost of our debt service as well as the value of any financial hedges we may put in place. We monitor industry fundamentals and interest rates very closely. Capital expenditures above our reserves will affect cash flow as well.
Certain of our loan agreements contain cash trap provisions that may get triggered if the performance of our hotels decline. When these provisions are triggered, substantially all of the profit generated by our hotels is deposited directly into lockbox accounts and then swept into cash management accounts for the benefit of our various lenders. This could affect our liquidity and our ability to make distributions to our stockholders.
Also, we have entered into certain customary guaranty agreements pursuant to which we guaranty payment of any recourse liabilities of our subsidiaries or joint ventures that may result from non-recourse carve-outs, which include, but are not limited to fraud, misrepresentation, willful misconduct resulting in waste, misappropriations of rents following an event of default, voluntary bankruptcy filings, unpermitted transfers of collateral, and certain environmental liabilities. Certain of these guarantees represent a guaranty of material amounts, and if we are required to make payments under those guarantees, our liquidity could be adversely affected.
On February 1, 2017, we repaid
$20.2 million
of principal on our mortgage loan that was partially secured by the Renaissance Portsmouth. This hotel property was sold on February 1, 2017.
On March 6, 2017, we repaid
$20.6 million
of principal on our mortgage loan that was partially secured by the Embassy Suites Syracuse. This hotel property was sold on March 6, 2017.
On May 10, 2017, we refinanced a
$105.0 million
mortgage loan, secured by the Renaissance Nashville in Nashville, Tennessee and the Westin in Princeton, New Jersey. The new mortgage loan totals
$181.0 million
, of which our initial advance was
$164.7 million
with future advances totaling
$16.3 million
as reimbursement for capital expenditures. The mortgage loan is interest only and provides for a floating interest rate of LIBOR + 3.00%. Beginning on July 1, 2020, quarterly principal payments of $750,000 are due.
The stated maturity is June 2022, with no extension options.
On May 24, 2017, we refinanced a
$15.7 million
mortgage loan, secured by the Hotel Indigo Atlanta. The new loan totals
$16.1 million
. The mortgage loan is interest only and provides for a floating interest rate of LIBOR + 2.90% for the first two years with a 30-year amortization schedule based on a 6% interest rate starting in the third year. The stated maturity is May 2020, with two one-year extension options.
On June 29, 2017, we repaid
$78.7 million
of principal on our mortgage loan partially secured by the Crowne Plaza Ravinia. This hotel property was sold on June 29, 2017.
On August 25, 2017, the Company issued
3.4 million
shares of
7.50%
Series H cumulative preferred stock. The Series H cumulative preferred stock ranks senior to all classes or series of the Company’s common stock and future junior securities, on a parity with each series of the Company’s outstanding preferred stock (the Series A cumulative preferred stock (all shares redeemed on September 18, 2017), Series D cumulative preferred stock (7.1 million shares redeemed in 2017), Series F cumulative preferred stock, Series G cumulative preferred stock and Series I cumulative preferred stock (discussed below)) and with any future parity securities and junior to future senior securities and to all of the Company’s existing and future indebtedness, with respect to the payment of dividends and the distribution of amounts upon liquidation, dissolution or winding up of the Company’s affairs. On September 8, 2017, we issued 400,000 additional shares of 7.50% Series H cumulative preferred stock pursuant to the over-allotment option. Series H cumulative preferred stock has no maturity date, and we are not required to redeem the shares at any time. Series H cumulative preferred stock is redeemable at our option for cash (on or after August 25, 2022), in whole or from time to time in part, at a redemption price of
$25.00
per share plus accrued and unpaid dividends, if any, at the redemption date. Series H cumulative preferred stock may be converted into shares of our common stock, at the option of the holder, in certain limited circumstances such as a change of control. Each share of Series H cumulative preferred stock is convertible into a maximum
8.25083
shares of our common stock. The actual number is based on a formula as defined in the Series H cumulative
54
preferred stock agreement (unless the Company exercises its right to redeem the Series H cumulative preferred shares for cash, for a limited period upon a change in control). The necessary conditions to convert the Series H cumulative preferred stock to common stock have not been met as of period end. Therefore, Series H cumulative preferred stock will not impact our earnings per share.
Dividends on the Series H cumulative preferred stock accrue in the amount of
$1.8750
per share each year, which is equivalent to
7.50%
of the
$25.00
liquidation preference per share of Series H cumulative preferred stock. Dividends on the Series H cumulative preferred stock are payable quarterly in arrears on the 15th day of January, April, July and October of each year (or, if not on a business day, on the next succeeding business day). The first dividend on the Series H cumulative preferred stock was paid on October 16, 2017 in the amount of
$0.1875
per share.
On September 18, 2017, the Company redeemed its 8.55% Series A cumulative preferred stock at a redemption price of $25.00 per share, plus accrued and unpaid dividends through the redemption date, in an amount equal to $0.4631 per share, for a total redemption price of $25.4631 per share.
On September 18, 2017, the Company redeemed approximately 1.6 million shares of its 8.45% Series D cumulative preferred stock at a redemption price of $25.00 per share, plus accrued and unpaid dividends through the redemption date, in an amount equal to $0.4577 per share, for a total redemption price of $25.4577 per share.
On October 4, 2017, the Company redeemed 379,036 shares of 8.45% Series D cumulative preferred shares at a redemption price of
$25.00
per share, plus accrued and unpaid dividends through the redemption date, in an amount equal to
$0.5516
per share, for a total redemption price of
$25.5516
per share.
On October 30, 2017, we refinanced our $94.7 million mortgage loan, with an outstanding balance of $94.5 million, secured by the Hilton Boston Back Bay in Boston, Massachusetts. The new mortgage loan totals $97.0 million, provides for a floating interest rate of LIBOR + 2.00%, a five-year term with
no
extension options and is secured by the Hilton Boston Back Bay.
On October 31, 2017, we refinanced our $412.5 million mortgage loan, secured by seventeen hotels. The new mortgage loan totals $427.0 million, is interest only, provides for a floating interest rate of LIBOR + 3.00% and has a two-year initial term with five one-year extension options. The new mortgage loan is secured by the following seventeen hotels: the Courtyard Alpharetta, Courtyard Bloomington, Courtyard Crystal City, Courtyard Foothill Ranch, Embassy Suites Austin, Embassy Suites Dallas, Embassy Suites Houston, Embassy Suites Las Vegas, Embassy Suites Palm Beach, Hampton Inn Evansville, Hilton Garden Inn Jacksonville, Hilton Nassau Bay, Hilton St. Petersburg, Residence Inn Evansville, Residence Inn Falls Church, Residence Inn San Diego and Sheraton Indianapolis.
On November 17, 2017, the Company issued
5.4 million
shares of
7.50%
Series I cumulative preferred stock. The Series I cumulative preferred stock ranks senior to all classes or series of the Company’s common stock and future junior securities, on a parity with each series of the Company’s outstanding preferred stock (the Series D cumulative preferred stock (7.1 million shares redeemed in 2017), Series F cumulative preferred stock, Series G cumulative preferred stock and Series H cumulative preferred stock) and with any future parity securities and junior to future senior securities and to all of the Company’s existing and future indebtedness, with respect to the payment of dividends and the distribution of amounts upon liquidation, dissolution or winding up of the Company’s affairs. Series I cumulative preferred stock has no maturity date, and we are not required to redeem the shares at any time. Series I cumulative preferred stock is redeemable at our option for cash (on or after November 17, 2022), in whole or from time to time in part, at a redemption price of
$25.00
per share plus accrued and unpaid dividends, if any, at the redemption date. Series I cumulative preferred stock may be converted into shares of our common stock, at the option of the holder, in certain limited circumstances such as a change of control. Each share of Series I cumulative preferred stock is convertible into a maximum
8.06452
shares of our common stock. The actual number is based on a formula as defined in the Series I cumulative preferred stock agreement (unless the Company exercises its right to redeem the Series I cumulative preferred shares for cash, for a limited period upon a change in control). The necessary conditions to convert the Series I cumulative preferred stock to common stock have not been met as of period end. Therefore, Series I cumulative preferred stock will not impact our earnings per share.
Dividends on the Series I cumulative preferred stock accrue in the amount of
$1.8750
per share each year, which is equivalent to
7.50%
of the
$25.00
liquidation preference per share of Series I cumulative preferred stock. Dividends on the Series I cumulative preferred stock are payable quarterly in arrears on the 15th day of January, April, July and October of each year (or, if not on a business day, on the next succeeding business day). The first dividend on the Series I cumulative preferred stock sold in this offering was paid on January 16, 2018 in the amount of
$0.2292
per share.
On December 5, 2017, the board of directors reapproved a stock repurchase program (the “Repurchase Program”) pursuant to which the Board granted a repurchase authorization to acquire shares of the Company’s common stock, par value $0.01 per share (the “Common Stock”) having an aggregate value of up to $200 million. The Board’s authorization replaced any previous repurchase authorizations. On December 11, 2017, we entered into equity distribution agreements with UBS Securities LLC,
55
Morgan Stanley & Co. LLC, B. Riley FBR, Inc., Robert W. Baird & Co. Incorporated, D.A. Davidson & Co., Deutsche Bank Securities Inc. and Janney Montgomery Scott LLC, each acting as a sales agent (the “Equity Distribution Agreements”). Pursuant to the Equity Distribution Agreements, we may sell from time to time through the sales agents shares of our common stock having an aggregate offering price of up to $100.0 million. Sales of shares of our common stock, if any, may be made in negotiated transactions or transactions that are deemed to be “at-the-market” offerings as defined in Rule 415 of the Securities Act, including sales made directly on the New York Stock Exchange, the existing trading market for our common stock, or sales made to or through a market maker other than on an exchange or through an electronic communications network. We will pay each of the sales agents a commission, which in each case shall not be more than 2.0% of the gross sales price of the shares of our common stock sold through such sales agent. As of December 31, 2017, no shares of our common stock have been sold under this program.
On December 8, 2017, the Company redeemed approximately 5.1 million shares of its 8.45% Series D cumulative preferred stock at a redemption price of $25.00 per share, plus accrued and unpaid dividends through the redemption date, in an amount equal to $0.3990 per share, for a total redemption price of $25.3990 per share.
On January 17, 2018, we refinanced our $376.8 million mortgage loan. The new mortgage loan totaled $395.0 million. The new mortgage loan has a two-year initial term and five one-year extension options, subject to the satisfaction of certain conditions. The mortgage loan is interest only and provides for a floating interest rate of LIBOR + 2.92%. The Mortgage loan is secured by eight hotels: Embassy Suites Portland, Embassy Suites Crystal City, Embassy Suites Orlando, Embassy Suites Santa Clara, Crowne Plaza Key West, Hilton Costa Mesa, Sheraton Minneapolis, and Historic Inns of Annapolis.
Sources and Uses of Cash
Our principal sources of funds to meet our cash requirements include: cash on hand, positive cash flow from operations, capital market activities, property refinancing proceeds and asset sales. Additionally, our principal uses of funds are expected to include possible operating shortfalls, owner-funded capital expenditures, dividends, new investments, and debt interest and principal payments. Items that impacted our cash flow and liquidity during the periods indicated are summarized as follows:
Net Cash Flows Provided by (Used in) Operating Activities.
Net cash flows provided by operating activities, pursuant to our consolidated statements of cash flows, which includes changes in balance sheet items, were
$207.4 million
and
$179.7 million
for the years ended
December 31, 2017
and
2016
, respectively. Cash flows from operations were impacted by changes in hotel operations, the operating results of our 2017 and 2016 hotel dispositions as well as the timing of collecting receivables from hotel guests, paying vendors, settling with related parties and settling with hotel managers.
Net Cash Flows Provided by (Used in) Investing Activities.
For the
year ended
December 31, 2017
, investing activities used net cash flows of
$63.9 million
, which primarily consisted of cash outflows of
$222.0 million
for capital improvements made to various hotel properties,
$3.4 million
of proceeds from property insurance and an additional
$984,000
investment in OpenKey. Cash outflows were partially offset by cash inflows of
$105.3 million
from proceeds received from the sales of the Renaissance Portsmouth, Embassy Suites Syracuse and Crowne Plaza Ravinia and
$50.9 million
from the liquidation of our interest in the AQUA U.S. Fund. For the
year ended
December 31, 2016
, investing activities used net cash flows of
$21.9 million
which primarily consisted of cash outflows of
$204.0 million
for capital improvements made to various hotel properties,
$3.3 million
for (i) the purchase of the land underlying the San Antonio Marriott; (ii) an interest in a permanent exclusive docking easement, a leasehold interest and certain floating docks on riverfront land located in front of the Hyatt Savannah; and (iii) a WorldQuest condominium unit and a
$2.3 million
investment in OpenKey. These outflows were partially offset by inflows of
$181.8 million
attributable to net cash proceeds received from the sale of the Noble Five Hotels, the Hampton Inn Gainesville, SpringHill Suites Gaithersburg, the Palm Desert hotel properties and a vacant lot associated with Le Pavillon,
$4.2 million
of cash payments received on a previously impaired mezzanine loan and
$1.9 million
of proceeds from property insurance.
Net Cash Flows Provided by (Used in) Financing Activities.
For the
year ended
December 31, 2017
, net cash flows used in financing activities were
$163.9 million
. Cash outflows consisted of
$754.8 million
for repayments of indebtedness,
$218.4 million
for the redemption of preferred stock,
$101.6 million
for dividend and distribution payments to common and preferred stockholders and unitholders,
$13.9 million
for payments of loan costs and exit fees,
$1.3 million
for the repurchase of common stock and
$871,000
of payments for derivatives. Cash outflows were partially offset by cash inflows of
$704.8 million
in borrowings on indebtedness and
$222.1 million
from issuance of preferred stock. For the
year ended
December 31, 2016
, net cash flows provided by financing activities were
$34.2 million
. Cash inflows consisted primarily of
$487.5 million
in borrowings on indebtedness and proceeds of
$265.6 million
from issuance of preferred stock. Cash inflows were partially offset by cash outlays primarily consisting of
$559.0 million
for repayments of indebtedness,
$115.8 million
for redemption of preferred stock,
$91.5 million
for dividend payments to common and preferred stockholders and unitholders,
$20.2 million
for payments of loan costs and exit fees and
$729,000
for the repurchase of common stock.
We are required to maintain certain financial ratios under various debt and derivative agreements. If we violate covenants in any debt or derivative agreement, we could be required to repay all or a portion of our indebtedness before maturity at a time when
56
we might be unable to arrange financing for such repayment on attractive terms, if at all. Presently, our existing financial debt covenants primarily relate to maintaining minimum net worth and leverage ratios and liquidity. As of
December 31, 2017
, we were in compliance in all material respects with all covenants or other requirements set forth in our debt and related agreements.
Mortgage and mezzanine loans are nonrecourse to the borrowers, except for customary exceptions or carve-outs that trigger recourse liability to the borrowers in certain limited instances. Recourse obligations typically include only the payment of costs and liabilities suffered by lenders as a result of the occurrence of certain bad acts on the part of the borrower. However, in certain cases, carve-outs could trigger recourse obligations on the part of the borrower with respect to repayment of all or a portion of the outstanding principal amount of the loans. We have entered into customary guaranty agreements pursuant to which we guaranty payment of any recourse liabilities of the borrowers that result from non-recourse carve-outs (which include, but are not limited to, fraud, misrepresentation, willful conduct resulting in waste, misappropriations of rents following an event of default, voluntary bankruptcy filings, unpermitted transfers of collateral, and certain environmental liabilities). In the opinion of management, none of these guaranty agreements, either individually or in the aggregate, are likely to have a material adverse effect on our business, results of operations, or financial condition.
Based on our current level of operations, management believes that our cash flow from operations and our existing cash balances will be adequate to meet upcoming anticipated requirements for interest and principal payments on debt, working capital, and capital expenditures for the next 12 months. With respect to upcoming maturities, we will continue to proactively address our 2019 and 2020 maturities. No assurances can be given that we will obtain additional financings or, if we do, what the amount and terms will be. Our failure to obtain future financing under favorable terms could adversely impact our ability to execute our business strategy. In addition, we may selectively pursue debt financing on individual properties.
We are committed to an investment strategy where we will opportunistically pursue hotel-related investments as suitable situations arise. Funds for future hotel-related investments are expected to be derived, in whole or in part, from cash on hand, future borrowings under a credit facility or other loans, or proceeds from additional issuances of common stock, preferred stock, or other securities, asset sales, and joint ventures. However, we have no formal commitment or understanding to invest in additional assets, and there can be no assurance that we will successfully make additional investments. We may, when conditions are suitable, consider additional capital raising opportunities.
Our existing hotel properties are mostly located in developed areas with competing hotel properties. Future occupancy, ADR, and RevPAR of any individual hotel could be materially and adversely affected by an increase in the number or quality of competitive hotel properties in its market area. Competition could also affect the quality and quantity of future investment opportunities.
Dividend Policy
.
During each of the years ended
December 31, 2017
,
2016
and
2015
our board of directors declared quarterly dividends of $0.12 per share of outstanding common stock. In December
2017
, the board of directors approved our
2018
dividend policy which anticipates a quarterly dividend payment of $0.12 per share for
2018
. However, the adoption of a dividend policy does not commit our board of directors to declare future dividends. The board of directors will continue to review our dividend policy on a quarterly basis. We may incur indebtedness to meet distribution requirements imposed on REITs under the Internal Revenue Code to the extent that working capital and cash flow from our investments are insufficient to fund required distributions. Alternatively, we may elect to pay dividends on our common stock in cash or a combination of cash and shares of securities as permitted under federal income tax laws governing REIT distribution requirements. We may pay dividends in excess of our cash flow.
INFLATION
We rely entirely on the performance of our properties and the ability of the properties’ managers to increase revenues to keep pace with inflation. Hotel operators can generally increase room rates rather quickly, but competitive pressures may limit their ability to raise rates faster than inflation. Our general and administrative costs, real estate and personal property taxes, property and casualty insurance, and utilities are subject to inflation as well.
SEASONALITY
Our properties’ operations historically have been seasonal as certain properties maintain higher occupancy rates during the summer months, while certain other properties maintain higher occupancy rates during the winter months. This seasonality pattern can cause fluctuations in our quarterly lease revenue under our percentage leases. We anticipate that our cash flows from the operations of our properties will be sufficient to enable us to make quarterly distributions to maintain our REIT status. To the extent that cash flows from operations are insufficient during any quarter due to temporary or seasonal fluctuations in lease revenue, we expect to utilize other cash on hand or borrowings to fund required distributions. However, we cannot make any assurances that we will make distributions in the future.
57
OFF-BALANCE SHEET ARRANGEMENTS
In the normal course of business, we form partnerships or joint ventures that operate certain hotels. We evaluate each partnership and joint venture to determine whether the entity is a Variable Interest Entity (“VIE”). If the entity is determined to be a VIE, we assess whether we are the primary beneficiary and need to consolidate the entity. For further discussion of the company’s VIEs, see note 2 to our consolidated financial statements.
CONTRACTUAL OBLIGATIONS AND COMMITMENTS
The table below summarizes our future obligations for principal and estimated interest payments on our debt, future minimum lease payments on our operating and capital leases with regard to our continuing operations and capital commitments, each as of
December 31, 2017
(in thousands):
|
Payments Due by Period
|
|||||||||||||||||||
|
< 1 Year
|
1-3 Years
|
3-5 Years
|
> 5 Years
|
Total
|
|||||||||||||||
|
Contractual obligations excluding extension options:
|
|||||||||||||||||||
|
Long-term debt obligations
|
$
|
2,671,185
|
|
$
|
552,426
|
|
$
|
270,363
|
|
$
|
229,594
|
|
$
|
3,723,568
|
|
||||
|
Estimated interest obligations
(1)
|
110,865
|
|
77,073
|
|
41,488
|
|
16,371
|
|
245,797
|
|
|||||||||
|
Operating lease obligations
|
2,529
|
|
4,673
|
|
4,340
|
|
112,184
|
|
123,726
|
|
|||||||||
|
Capital commitments
|
44,368
|
|
—
|
|
—
|
|
—
|
|
44,368
|
|
|||||||||
|
Total contractual obligations
|
$
|
2,828,947
|
|
$
|
634,172
|
|
$
|
316,191
|
|
$
|
358,149
|
|
$
|
4,137,459
|
|
||||
_________________________
|
(1)
|
For variable interest rate indebtedness, interest obligations are estimated based on the LIBOR interest rate as of
December 31, 2017
.
|
In addition to the amounts discussed above, we also have management agreements which require us to pay monthly management fees, market service fees and other general fees, if required. These management agreements expire from
2020
through
2038
. See note 12 to our consolidated financial statements.
CRITICAL ACCOUNTING POLICIES
Our accounting policies are fully described in note 2 to our consolidated financial statements included in Item 8. Financial Statements and Supplementary Data. We believe that the following discussion addresses our most critical accounting policies, representing those policies considered most vital to the portrayal of our financial condition and results of operations and require management’s most difficult, subjective, and complex judgments.
Investments in Hotel Properties, net
—Hotel properties are generally stated at cost. However,
four
hotel properties contributed upon Ashford Trust’s formation in 2003 are stated at the predecessor’s historical cost, net of impairment charges, if any, plus a partial step-up related to the acquisition of noncontrolling interests from third parties associated with certain of these properties. For hotel properties owned through our majority-owned entities, the carrying basis attributable to the partners’ minority ownership is recorded at the predecessor’s historical cost, net of any impairment charges, while the carrying basis attributable to our majority ownership is recorded based on the allocated purchase price of our ownership interests in the entities. All improvements and additions that extend the useful life of the hotel properties are capitalized.
Impairment of Investments in Hotel Properties
—Hotel properties are reviewed for impairment whenever events or changes in circumstances indicate that their carrying amounts may not be recoverable. Recoverability of the hotel is measured by comparison of the carrying amount of the hotel to the estimated future undiscounted cash flows, which take into account current market conditions and our intent with respect to holding or disposing of the hotel. If our analysis indicates that the carrying value of the hotel is not recoverable on an undiscounted cash flow basis, we recognize an impairment charge for the amount by which the property’s net book value exceeds its estimated fair value, or fair value, less cost to sell. In evaluating impairment of hotel properties, we make many assumptions and estimates, including projected cash flows, expected holding period, and expected useful life. Fair value is determined through various valuation techniques, including internally developed discounted cash flow models, comparable market transactions and third-party appraisals, where considered necessary. Asset write-downs resulting from property damage are recorded up to the amount of the allocable property insurance deductible in the period that the property damage occurs. We recorded impairment charges of
$10.2 million
,
$1.8 million
and
$4.7 million
for the years ended December 31,
2017
,
2016
and
2015
, respectively. See note 5 to our consolidated financial statements.
58
Depreciation and Amortization Expense
—Depreciation expense is based on the estimated useful life of the assets, while amortization expense for leasehold improvements is based on the shorter of the lease term or the estimated useful life of the related assets. Presently, hotel properties are depreciated using the straight-line method over lives which range from 7.5 to 39 years for buildings and improvements and 1.5 to 5 years for furniture, fixtures and equipment. While we believe our estimates are reasonable, a change in estimated lives could affect depreciation expense and net income (loss) as well as resulting gains or losses on potential hotel sales.
Hotel Dispositions
—D
iscontinued operations are defined as the disposal of components of an entity that represents strategic shifts that have (or will have) a major effect on an entity’s operations and financial results. We believe that individual dispositions of hotel properties do not represent a strategic shift that has (or will have) a major effect on our operations and financial results as most will not fit the definition. See note 5
to our consolidated financial statements
.
Assets Held for Sale
—We classify assets as held for sale when we have obtained a firm commitment from a buyer, and consummation of the sale is considered probable and expected within one year. The related operations of assets held for sale are reported as discontinued if the disposal is a component of an entity that represents a strategic shift that has (or will have) a major effect on our operations and cash flows. Depreciation and amortization will cease as of the date assets have met the criteria to be deemed held for sale.
Income Taxes
—At
December 31, 2017
and
2016
, we recorded a valuation allowance of
$6.2 million
and
$15.4 million
, respectively. At each reporting date, we evaluate whether it is more likely than not that we will utilize all or a portion of our deferred tax assets. We consider all available positive and negative evidence, including historical results of operations, projected future taxable income, carryback potential and scheduled reversals of deferred tax liabilities. At
December 31, 2017
, we had net operating loss carryforwards for federal income tax purposes of
$17.4 million
, which begin to expire in 2029, and are available to offset future taxable income, if any, through 2034. Approximately
$10.1 million
of the
$17.4 million
of net operating loss carryforwards is attributable to acquired subsidiaries and subject to substantial limitation on their use. Management determined that it is more likely than not that as of
December 31, 2017
,
$6.2 million
of our net deferred tax assets will not be realized, and a valuation allowance has been recorded accordingly. At
December 31, 2017
, Ashford Hospitality Trust, Inc., our REIT, had net operating loss carryforwards for federal income tax purposes of
$425.0 million
, which begin to expire in 2023, and are available to offset future taxable income, if any, through 2035.
The “Income Taxes” topic of the Financial Accounting Standards Board’s (“FASB”) Accounting Standards Codification addresses the accounting for uncertainty in income taxes recognized in an enterprise’s financial statements. The guidance requires us to determine whether tax positions we have taken or expect to take in a tax return are more likely than not to be sustained upon examination by the appropriate taxing authority based on the technical merits of the positions. Tax positions that do not meet the more likely than not threshold would be recorded as additional tax expense in the current period. We analyze all open tax years, as defined by the statute of limitations for each jurisdiction, which includes the federal jurisdiction and various states. We classify interest and penalties related to underpayment of income taxes as income tax expense. We and our subsidiaries file income tax returns in the U.S. federal jurisdiction and various states and cities. Tax years 2013 through 2017 remain subject to potential examination by certain federal and state taxing authorities.
On December 22, 2017, President Trump signed the Tax Cuts and Jobs Act (“Tax Reform”) into legislation. Under ASC 740, the effects of changes in tax rates and laws are recognized in the period in which the new legislation is enacted. In the case of U.S. federal income taxes, the enactment date is the date the bill becomes law (i.e., upon presidential signature). With respect to this legislation, we expect a one-time tax benefit of approximately $1 million, due to a re-measurement of deferred tax assets and liabilities resulting from the decrease in the corporate Federal income tax rate from 35% to 21% as well as the refund of existing credits against Alternative Minimum Tax. We are in the process of analyzing certain other provisions of this legislation which may impact our effective tax rate. Additionally on December 22, 2017, the SEC staff issued Staff Accounting Bulletin No. 118 (“SAB 118”) to address the application of U.S. GAAP in situations when a registrant does not have the necessary information available, prepared, or analyzed (including computations) in reasonable detail to complete the accounting for certain income tax effects of the Tax Reform Act. The Company has recognized the estimated tax impacts related to the revaluation of deferred tax assets and liabilities as well as tax refunds and included these amounts in its consolidated financial statements for the year ended December 31, 2017. The ultimate impact may differ from these estimated amounts, due to, among other things, additional analysis, changes in interpretations and assumptions the Company has made, additional regulatory guidance that may be issued, and actions the Company may take as a result of the Tax Reform Act. The accounting is expected to be complete on or before the date the 2017 U.S. income tax returns are filed in 2018.
59
Investments in Unconsolidated Entities
—Investments in entities in which we have ownership interests ranging from
16.2%
to
28.6%
at
December 31, 2017
, are accounted for under the equity method of accounting by recording the initial investment and our percentage of interest in the entities’ net income/loss. We review the investments in our unconsolidated entities for impairment in each reporting period pursuant to the applicable authoritative accounting guidance. An investment is impaired when its estimated fair value is less than the carrying amount of our investment. Any impairment is recorded in equity earnings (loss) in unconsolidated entities.
No
such impairment was recorded for the years ended December 31,
2017
,
2016
and
2015
.
Our investments in certain unconsolidated entities are considered to be variable interests in the underlying entities. VIE’s, as defined by authoritative accounting guidance, must be consolidated by a reporting entity if the reporting entity is the primary beneficiary because it has (i) the power to direct the VIE’s activities that most significantly impact the VIE’s economic performance, (ii) an implicit financial responsibility to ensure that a VIE operates as designed, and (iii) the obligation to absorb losses of the VIE or the right to receive benefits from the VIE. Because we do not have the power and financial responsibility to direct the unconsolidated entities’ activities and operations, we are not considered to be the primary beneficiary of these entities on an ongoing basis and therefore such entities should not be consolidated. In evaluating VIEs, our analysis involves considerable management judgment and assumptions.
Derivative Instruments and Hedges
—We use interest rate derivatives to hedge our risks and to capitalize on the historical correlation between changes in LIBOR (London Interbank Offered Rate) and RevPAR. Interest rate derivatives could include swaps, caps, floors and flooridors. We assess the effectiveness of each hedging relationship by comparing the changes in fair value or cash flows of the derivative hedging instrument with the changes in fair value or cash flows of the designated hedged item or transaction. We also use credit default swaps to hedge financial and capital market risk. All of our derivatives are subject to master- netting settlement arrangements and the credit default swaps are subject to credit support annexes. For credit default swaps, cash collateral is posted by us as well as our counterparty. We offset the fair value of the derivative and the obligation/right to return/reclaim cash collateral. We also purchase options on Eurodollar futures as a hedge against our cash flows. Eurodollar futures prices reflect market expectations for interest rates on three month Eurodollar deposits for specific dates in the future, and the final settlement price is determined by three month LIBOR on the last trading day. Options on Eurodollar futures provide the ability to limit losses while maintaining the possibility of profiting from favorable changes in the futures prices. As the purchaser, our maximum potential loss is limited to the initial premium paid for the Eurodollar option contracts, while our potential gain has no limit. These exchange-traded options are centrally cleared, and a clearinghouse stands in between all trades to ensure that the obligations involved in the trades are made good.
All derivatives are recorded at fair value in accordance with the applicable authoritative accounting guidance. Interest rate derivatives, credit default swaps and options on futures contracts are reported as “derivative assets, net” in the consolidated balance sheets. For interest rate derivatives, credit default swaps and options on futures contracts, changes in fair value and realized gains and losses are recognized in earnings as “unrealized gain (loss) on derivatives” and “other income (expense)”, respectively, in the consolidated statements of operations. Accrued interest on interest rate derivatives is included in “accounts receivable, net” in the consolidated balance sheets.
RECENTLY ADOPTED ACCOUNTING STANDARDS
In March 2016, the Financial Accounting Standards Board (“FASB”) issued ASU 2016-07,
Simplifying the Transition to the Equity Method of Accounting
(“ASU 2016-07”), which simplifies the equity method of accounting by eliminating the requirement to retrospectively apply the equity method to an investment that subsequently qualifies for such accounting as a result of an increase in the level of ownership interest or degree of influence. ASU 2016-07 is effective for fiscal years beginning after December 15, 2016, including interim periods within those fiscal years. Early adoption is permitted. We adopted this standard effective January 1, 2017, and the adoption of this standard did not have any impact on our financial position, results of operations or cash flows.
In November 2016, the FASB issued ASU 2016-18,
Statement of Cash Flows (Topic 230): Restricted Cash
(“ASU 2016-18”), which clarifies the presentation of restricted cash and restricted cash equivalents in the statements of cash flows. Under ASU 2016-18 restricted cash and restricted cash equivalents are included with cash and cash equivalents when reconciling the beginning-of-period and end-of-period total amounts shown on the statements of cash flows. ASU 2016-18 is effective for fiscal years beginning after December 15, 2017, and interim periods within those fiscal years. Early adoption is permitted. We adopted this standard effective January 1, 2017 on a retrospective basis. The adoption of this standard resulted in the inclusion of restricted cash with cash and cash equivalents when reconciling the beginning-of-period and end-of-period total amounts shown on the statements of cash flows for all periods presented. As a result, for the years ended December 31, 2016 and 2015, net cash provided by operating activities increased $4.7 million and $5.4 million, respectively. Net cash used in investing activities increased $13.9 million for the year ended December 31, 2016 and decreased $73.2 million for the year ended December 31, 2015. Our beginning-of-period cash, cash equivalents and restricted cash increased $144.0 million, $153.7 million and $85.8 million in 2017, 2016 and 2015, respectively.
60
RECENTLY ISSUED ACCOUNTING STANDARDS
In May 2014, the FASB issued ASU 2014-09,
Revenue from Contracts with Customers
(“ASU 2014-09”). ASU 2014-09 is a comprehensive new revenue recognition model, which requires a company to recognize revenue to depict the transfer of promised goods or services to a customer in an amount that reflects the consideration the company expects to receive in exchange for those goods or services. The update will replace most existing revenue recognition guidance in U.S. GAAP when it becomes effective. In August 2015, the FASB issued ASU 2015-14,
Revenue From Contracts With Customers (Topic 606): Deferral of the Effective Date
, which defers the effective date to fiscal periods beginning after December 15, 2017. The standard permits the use of either the full retrospective or cumulative effect (modified retrospective) transition method. Based on our assessment of this standard, it will not materially affect the amount or timing of revenue recognition for revenues from room, food and beverage, and other hotel level sales. Additionally, we have historically disposed of hotel properties for cash sales with no contingencies and no future involvement in the hotel operations, therefore, ASU No. 2014-09 will not impact the recognition of hotel sales. We have selected the modified retrospective method. We continue to evaluate the related disclosure requirements.
In January 2016, the FASB issued ASU 2016-01,
Recognition and Measurement of Financial Assets and Financial Liabilities
(“ASU 2016-01”), which requires an entity to: (i) measure equity investments at fair value through net income, with certain exceptions; (ii) present in OCI the changes in instrument-specific credit risk for financial liabilities measured using the fair value option; (iii) present financial assets and financial liabilities by measurement category and form of financial asset; (iv) calculate the fair value of financial instruments for disclosure purposes based on an exit price and; (v) assess a valuation allowance on deferred tax assets related to unrealized losses of AFS debt securities in combination with other deferred tax assets. ASU 2016-01 provides an election to subsequently measure certain nonmarketable equity investments at cost less any impairment and adjusted for certain observable price changes. It also requires a qualitative impairment assessment of such equity investments and amends certain fair value disclosure requirements. ASU 2016-01 is effective for fiscal years beginning after December 15, 2017, including interim periods within those fiscal years. Certain provisions of ASU 2016-01 are eligible for early adoption. We do not expect that ASU 2016-01 will have a material impact on our consolidated financial statements and related disclosures.
In February 2016, the FASB issued ASU 2016-02,
Leases
(“ASU 2016-02”). The new standard establishes a right-of-use (“ROU”) model that requires a lessee to record a ROU asset and a lease liability on the balance sheet for all leases with terms longer than 12 months. Leases will be classified as either finance or operating, with classification affecting the pattern of expense recognition in the income statement. ASU 2016-02 is effective for fiscal years beginning after December 15, 2018, including interim periods within those fiscal years. Early adoption is permitted. A modified retrospective transition approach is required for lessees for capital and operating leases existing at, or entered into after, the beginning of the earliest comparative period presented in the financial statements, with certain practical expedients available. The accounting for leases under which we are the lessor remains largely unchanged. While we are currently in the initial stages of assessing the impact that ASU 2016-02 will have on our consolidated financial statements, we expect the primary impact to our consolidated financial statements upon adoption will be the recognition, on a discounted basis, of our future minimum rentals due under our hotel ground leases and other noncancelable leases on our consolidated balance sheets resulting in the recording of ROU assets and lease obligations.
In June 2016, the FASB issued ASU 2016-13,
Financial Instruments -
Credit Losses (Topic 326): Measurement of Credit Losses on Financial Instruments
("ASU 2016-13"). The ASU sets forth an “expected credit loss” impairment model to replace the current “incurred loss” method of recognizing credit losses. The standard requires measurement and recognition of expected credit losses for most financial assets held. The ASU is effective for fiscal years beginning after December 15, 2019, including interim periods within those fiscal years. Early adoption is permitted for periods beginning after December 15, 2018. We are currently evaluating the impact that ASU 2016-13 will have on the consolidated financial statements and related disclosures.
In August 2016, the FASB issued ASU 2016-15,
Statement of Cash Flows (Topic 230): Classification of Certain Cash Receipts and Cash Payments - a consensus of the Emerging Issues Task Force
(“ASU 2016-15”). The new guidance is intended to reduce diversity in practice in how certain transactions are classified in the statement of cash flows. Certain issues addressed in this guidance include - debt payments or debt extinguishment costs, contingent consideration payments made after a business combination, proceeds from the settlement of insurance claims, distributions received from equity method investments and beneficial interests in securitization transactions. ASU 2016-15 is effective for fiscal years beginning after December 15, 2017, and interim periods within those fiscal years. Early adoption is permitted. We are currently evaluating the impact that ASU 2016-15 will have on our consolidated financial statements and related disclosures.
In January 2017, the FASB issued ASU 2017-01,
Business Combinations (Topic 805) - Clarifying the Definition of a Business
(“ASU 2017-01”), which clarifies the definition of a business with the objective of adding guidance to assist entities with evaluating whether a transaction should be accounted for as an acquisition (or disposal) of an asset or a business. ASU 2017-01 is effective for fiscal years beginning after December 15, 2017. Early adoption is permitted. While we are currently evaluating the potential impact of the standard, we currently expect that certain future hotel acquisitions may be considered asset acquisitions
61
rather than business combinations, which would affect capitalization of acquisitions costs (such costs are expensed for business combinations and capitalized for asset acquisitions).
In February 2017, the FASB issued ASU 2017-05,
Other Income-Gains and Losses from the Derecognition of Nonfinancial Assets (Subtopic 610-20): Clarifying the Scope of Asset Derecognition Guidance and Accounting for Partial Sales of Nonfinancial Assets
(ASU “2017-05”), which clarifies the scope of
Accounting Standard Codification (“
ASC”) Subtopic 610-20,
Other Income-Gains and Losses from the Derecognition of Nonfinancial Assets
and adds guidance for partial sales of nonfinancial assets.
ASU 2017-05 is effective for fiscal years beginning after December 15, 2017.
Early adoption is permitted. An entity may elect to apply ASU 2017-05 under a retrospective or modified retrospective approach. We are evaluating the impact that ASU 2017-05 will have on our consolidated financial statements and related disclosures.
NON-GAAP FINANCIAL MEASURES
The following non-GAAP presentations of EBITDA, Adjusted EBITDA, FFO and Adjusted FFO are made to help our investors in evaluating our operating performance.
EBITDA is defined as net income (loss) attributable to the Company before interest expense and amortization of premiums and loan costs, net, interest income other than interest income from mezzanine loans, income taxes, depreciation and amortization, and noncontrolling interests in the operating partnership and after adjustments for unconsolidated joint ventures. We adjust EBITDA to exclude certain additional items such as gain/loss on acquisition of PIM Highland JV and sale of hotel properties, impairment and uninsured hurricane related costs, write-off of loan costs and exit fees, other income/expense, transaction, acquisition and management conversion costs, legal judgment and related legal costs, dead deal costs, software implementation costs, compensation adjustment related to modified employment terms and non-cash items such as amortization of unfavorable contract liabilities, gain /loss on insurance settlements, non-cash stock/unit-based compensation, unrealized gains/losses on marketable securities, derivative instruments, investment in securities investment fund, as well as our portion of adjustments to EBITDA of unconsolidated entities. We exclude items from Adjusted EBITDA that are either non-cash or are not part of our core operations in order to provide a period-over-period comparison of our operations. We present EBITDA and Adjusted EBITDA because we believe these measurements a) more accurately reflect the ongoing performance of our hotel assets and other investments, b) provide more useful information to investors as indicators of our ability to meet our future debt payment and working capital requirements, and c) provide an overall evaluation of our financial condition. EBITDA and Adjusted EBITDA as calculated by us may not be comparable to EBITDA and Adjusted EBITDA reported by other companies that do not define EBITDA and Adjusted EBITDA exactly as we define the terms. EBITDA and Adjusted EBITDA do not represent cash generated from operating activities determined in accordance with GAAP and should not be considered as an alternative to a) GAAP net income or loss as an indication of our financial performance or b) GAAP cash flows from operating activities as a measure of our liquidity.
62
The following table reconciles net income (loss) to EBITDA and Adjusted EBITDA (in thousands) (unaudited):
|
Year Ended December 31,
|
|||||||||||
|
2017
|
2016
|
2015
|
|||||||||
|
Net income (loss)
|
$
|
(88,760
|
)
|
$
|
(58,782
|
)
|
$
|
306,412
|
|
||
|
Loss from consolidated entities attributable to noncontrolling interests
|
110
|
|
14
|
|
30
|
|
|||||
|
Net (income) loss attributable to redeemable noncontrolling interests in operating partnership
|
21,642
|
|
12,483
|
|
(35,503
|
)
|
|||||
|
Net income (loss) attributable to the Company
|
(67,008
|
)
|
(46,285
|
)
|
270,939
|
|
|||||
|
Interest income
|
(2,202
|
)
|
(331
|
)
|
(90
|
)
|
|||||
|
Interest expense and amortization of premiums and loan costs, net
|
222,516
|
|
223,850
|
|
187,396
|
|
|||||
|
Depreciation and amortization
|
246,490
|
|
243,617
|
|
210,197
|
|
|||||
|
Income tax (benefit) expense
|
(2,241
|
)
|
1,532
|
|
4,710
|
|
|||||
|
Net (income) loss attributable to redeemable noncontrolling interests in operating partnership
|
(21,642
|
)
|
(12,483
|
)
|
35,503
|
|
|||||
|
Equity in (earnings) loss of unconsolidated entities
|
5,918
|
|
1,048
|
|
3,445
|
|
|||||
|
Company’s portion of EBITDA of unconsolidated entities (Ashford Inc.)
|
(1,666
|
)
|
180
|
|
828
|
|
|||||
|
Company’s portion of EBITDA of unconsolidated entities (OpenKey)
|
(498
|
)
|
(303
|
)
|
—
|
|
|||||
|
Company’s portion of EBITDA of unconsolidated entities (Ashford Prime OP)
|
—
|
|
—
|
|
7,640
|
|
|||||
|
Company’s portion of EBITDA of unconsolidated entities (PIM Highland JV)
|
—
|
|
—
|
|
11,982
|
|
|||||
|
EBITDA available to the Company and OP unitholders
|
379,667
|
|
410,825
|
|
732,550
|
|
|||||
|
Amortization of unfavorable contract liabilities
|
(1,535
|
)
|
(2,101
|
)
|
(1,975
|
)
|
|||||
|
Impairment and uninsured hurricane related costs
|
12,982
|
|
17,816
|
|
19,511
|
|
|||||
|
(Gain) loss on acquisition of PIM Highland JV and sale of hotel properties
|
(14,030
|
)
|
(31,599
|
)
|
(381,351
|
)
|
|||||
|
(Gain) loss on insurance settlements
|
(192
|
)
|
(456
|
)
|
—
|
|
|||||
|
Write-off of premiums, loan costs and exit fees
|
2,845
|
|
12,702
|
|
5,750
|
|
|||||
|
Other (income) expense, net
|
3,422
|
|
4,517
|
|
864
|
|
|||||
|
Transaction, acquisition and management conversion costs
|
4,299
|
|
1,778
|
|
12,348
|
|
|||||
|
Legal judgment and related legal costs
|
4,199
|
|
1,176
|
|
95
|
|
|||||
|
Unrealized (gain) loss on marketable securities
|
4,649
|
|
(4,946
|
)
|
(127
|
)
|
|||||
|
Unrealized (gain) loss on derivatives
|
2,802
|
|
2,534
|
|
7,402
|
|
|||||
|
Dead deal costs
|
9
|
|
391
|
|
769
|
|
|||||
|
Software implementation costs
|
1,034
|
|
—
|
|
—
|
|
|||||
|
Non-cash stock/unit-based compensation
|
12,287
|
|
9,672
|
|
3,470
|
|
|||||
|
Company’s portion of unrealized loss of AQUA U.S. Fund
|
(52
|
)
|
5,062
|
|
3,386
|
|
|||||
|
Company’s portion of adjustments to EBITDA of unconsolidated entities (Ashford Inc.)
|
6,790
|
|
3,729
|
|
3,652
|
|
|||||
|
Company’s portion of adjustments to EBITDA of unconsolidated entities (OpenKey)
|
13
|
|
8
|
|
—
|
|
|||||
|
Company’s portion of adjustments to EBITDA of unconsolidated entities (Ashford Prime OP)
|
—
|
|
—
|
|
738
|
|
|||||
|
Adjusted EBITDA available to the Company and OP unitholders
|
$
|
419,189
|
|
$
|
431,108
|
|
$
|
407,082
|
|
||
63
We calculate FFO and AFFO in the following table. FFO is calculated on the basis defined by NAREIT, which is net income (loss) attributable to common stockholders, computed in accordance with GAAP, excluding gains or losses on properties, and extraordinary items as defined by GAAP, plus depreciation and amortization of real estate assets, impairment charges on real estate assets, and after adjustments for unconsolidated entities and noncontrolling interests in the operating partnership. Adjustments for unconsolidated entities are calculated to reflect FFO on the same basis. NAREIT developed FFO as a relative measure of performance of an equity REIT to recognize that income-producing real estate historically has not depreciated on the basis determined by GAAP. Our calculation of AFFO excludes extinguishment of issuance costs upon redemption of preferred stock, write-off of loan costs and exit fees, other impairment charges, uninsured hurricane related costs, other income/expense, transaction, acquisition and management conversion costs, legal judgment and related legal costs, dead deal costs, software implementation costs, compensation adjustment related to modified employment terms and non-cash items such as gain/loss on insurance settlements, non-cash stock/unit-based compensation, unrealized gains/losses on marketable securities, derivative instruments, investment in securities investment fund, as well as our portion of adjustments to FFO related to unconsolidated entities. We exclude items from AFFO that are either non-cash or are not part of our core operations in order to provide a period-over-period comparison of our operating results. We consider FFO and AFFO to be appropriate measures of our ongoing normalized operating performance as a REIT. We compute FFO in accordance with our interpretation of standards established by NAREIT, which may not be comparable to FFO reported by other REITs that either do not define the term in accordance with the current NAREIT definition or interpret the NAREIT definition differently than us. FFO and AFFO do not represent cash generated from operating activities as determined by GAAP and should not be considered as an alternative to a) GAAP net income or loss as an indication of our financial performance or b) GAAP cash flows from operating activities as a measure of our liquidity, nor is it indicative of funds available to satisfy our cash needs, including our ability to make cash distributions. However, to facilitate a clear understanding of our historical operating results, we believe that FFO and AFFO should be considered along with our net income or loss and cash flows reported in the consolidated financial statements.
64
The following table reconciles net income (loss) to FFO and Adjusted FFO (in thousands) (unaudited):
|
Year Ended December 31,
|
|||||||||||
|
2017
|
2016
|
2015
|
|||||||||
|
Net income (loss)
|
$
|
(88,760
|
)
|
$
|
(58,782
|
)
|
$
|
306,412
|
|
||
|
(Income) loss from consolidated entities attributable to noncontrolling interests
|
110
|
|
14
|
|
30
|
|
|||||
|
Net (income) loss attributable to redeemable noncontrolling interests in operating partnership
|
21,642
|
|
12,483
|
|
(35,503
|
)
|
|||||
|
Preferred dividends
|
(44,761
|
)
|
(36,272
|
)
|
(33,962
|
)
|
|||||
|
Extinguishment of issuance costs upon redemption of Series E preferred stock
|
(10,799
|
)
|
(6,124
|
)
|
—
|
|
|||||
|
Net income (loss) available to common stockholders
|
(122,568
|
)
|
(88,681
|
)
|
236,977
|
|
|||||
|
Depreciation and amortization on real estate
|
246,490
|
|
243,617
|
|
210,197
|
|
|||||
|
(Gain) loss on acquisition of PIM Highland JV and sale of hotel properties
|
(14,030
|
)
|
(31,599
|
)
|
(381,351
|
)
|
|||||
|
Net income (loss) attributable to redeemable noncontrolling interests in operating partnership
|
(21,642
|
)
|
(12,483
|
)
|
35,503
|
|
|||||
|
Equity in (income) loss of unconsolidated entities
|
5,918
|
|
1,048
|
|
3,445
|
|
|||||
|
Impairment charges on real estate
|
10,153
|
|
18,316
|
|
19,949
|
|
|||||
|
Company’s portion of FFO of unconsolidated entities (Ashford Inc.)
|
(5,410
|
)
|
(380
|
)
|
(19
|
)
|
|||||
|
Company’s portion of FFO of unconsolidated entities (OpenKey)
|
(505
|
)
|
(306
|
)
|
—
|
|
|||||
|
Company’s portion of FFO of unconsolidated entities (Ashford Prime OP)
|
—
|
|
—
|
|
4,371
|
|
|||||
|
Company’s portion of FFO of unconsolidated entities (PIM Highland JV)
|
—
|
|
—
|
|
3,791
|
|
|||||
|
FFO available to common stockholders and OP unitholders
|
98,406
|
|
129,532
|
|
132,863
|
|
|||||
|
Extinguishment of issuance costs upon redemption of preferred stock
|
10,799
|
|
6,124
|
|
—
|
|
|||||
|
(Gain) loss on insurance settlements
|
(192
|
)
|
(456
|
)
|
—
|
|
|||||
|
Write-off of premiums, loan costs and exit fees
|
2,845
|
|
12,702
|
|
5,750
|
|
|||||
|
Other impairment charges
|
—
|
|
(500
|
)
|
(438
|
)
|
|||||
|
Uninsured hurricane related costs
|
2,829
|
|
—
|
|
—
|
|
|||||
|
Other (income) expense, net
|
3,422
|
|
4,517
|
|
864
|
|
|||||
|
Transaction, acquisition and management conversion costs
|
4,299
|
|
1,778
|
|
12,348
|
|
|||||
|
Legal judgment and related legal costs
|
4,199
|
|
1,176
|
|
95
|
|
|||||
|
Unrealized (gain) loss on marketable securities
|
4,649
|
|
(4,946
|
)
|
(127
|
)
|
|||||
|
Unrealized (gain) loss on derivatives
|
2,802
|
|
2,534
|
|
7,402
|
|
|||||
|
Dead deal costs
|
9
|
|
391
|
|
769
|
|
|||||
|
Software implementation costs
|
1,034
|
|
—
|
|
—
|
|
|||||
|
Non-cash stock/unit-based compensation
|
12,287
|
|
9,672
|
|
3,470
|
|
|||||
|
Tax reform
|
(1,080
|
)
|
—
|
|
—
|
|
|||||
|
Company’s portion of unrealized loss of AQUA U.S. Fund
|
(52
|
)
|
5,062
|
|
3,386
|
|
|||||
|
Company’s portion of adjustments to FFO of unconsolidated entities (Ashford Inc.)
|
9,374
|
|
3,729
|
|
(1,032
|
)
|
|||||
|
Company’s portion of adjustments to FFO of unconsolidated entities (OpenKey)
|
13
|
|
8
|
|
—
|
|
|||||
|
Company’s portion of adjustments to FFO of unconsolidated entities (Ashford Prime OP)
|
—
|
|
—
|
|
593
|
|
|||||
|
Adjusted FFO available to common stockholders and OP unitholders
|
$
|
155,643
|
|
$
|
171,323
|
|
$
|
165,943
|
|
||
65
|
Item 7A.
|
Quantitative and Qualitative Disclosures About Market Risk
|
Our primary market risk exposure consists of changes in interest rates on borrowings under our debt instruments. The analysis below presents the sensitivity of the market value of our financial instruments to selected changes in market interest rates.
At
December 31, 2017
, our total indebtedness of
$3.7 billion
included
$3.4 billion
of variable-rate debt. The impact on our results of operations of a 25-basis point change in interest rate on the outstanding balance of variable-rate debt at
December 31, 2017
would be approximately
$8.4 million
annually. Interest rate changes have no impact on the remaining
$353.5 million
of fixed-rate debt.
The above amounts were determined based on the impact of hypothetical interest rates on our borrowings and assume no changes in our capital structure. As the information presented above includes only those exposures that existed at
December 31, 2017
and does not consider exposures or positions that could arise after that date. Accordingly, the information presented herein has limited predictive value. As a result, the ultimate realized gain or loss with respect to interest rate fluctuations will depend on exposures that arise during the period, the hedging strategies at the time, and the related interest rates.
We use credit default swaps, tied to the CMBX index, to hedge financial and capital market risk. We have entered into credit default swap transactions, excluding those that have terminated, for notional amounts totaling
$212.5 million
, to hedge financial and capital market risk. A credit default swap is a derivative contract that functions like an insurance policy against the credit risk of an entity or obligation. The seller of protection assumes the credit risk of the reference obligation from the buyer (us) of protection in exchange for annual premium payments. If a default or a loss, as defined in the credit default swap agreements, occurs on the underlying bonds, then the buyer of protection is protected against those losses. The only liability for us, the buyer, is the annual premium and any change in value of the underlying CMBX index (if the trade is terminated prior to maturity). For all CMBX trades completed to date, we were the buyer of protection. Credit default swaps are subject to master-netting settlement arrangements and credit support annexes. Assuming the underlying bonds pay off at par over their remaining average life, our total exposure for these trades was approximately
$7.7 million
at
December 31, 2017
.
We hold interest rate floors with notional amounts totaling
$16.8 billion
and strike rates ranging from
(0.25)%
to
1.50%
. Our total exposure is capped at our initial upfront costs totaling
$9.8 million
. These instruments have termination dates ranging from
March 2019
to
July 2020
.
66
|
Item 8.
|
Financial Statements and Supplementary Data
|
Index to Consolidated Financial Statements
67
Report of Independent Registered Public Accounting Firm
The Board of Directors and Stockholders of
Ashford Hospitality Trust, Inc. and subsidiaries
Dallas, Texas
Opinion on the Consolidated Financial Statements
We have audited the accompanying consolidated balance sheets of Ashford Hospitality Trust, Inc. (the “Company”) and subsidiaries as of December 31, 2017 and 2016, the related consolidated statements of operations, comprehensive income (loss), equity, and cash flows for each of the three years in the period ended December 31, 2017, and the related notes and financial statement schedule listed in the accompanying index (collectively referred to as the “consolidated financial statements”). In our opinion, the consolidated financial statements present fairly, in all material respects, the financial position of the Company and subsidiaries at December 31, 2017 and 2016, and the results of their operations and their cash flows for each of the three years in the period ended December 31, 2017
,
in conformity with accounting principles generally accepted in the United States of America.
We also have audited, in accordance with the standards of the Public Company Accounting Oversight Board (United States) (“PCAOB”), the Company's internal control over financial reporting as of December 31, 2017, based on criteria established in
Internal Control - Integrated Framework (2013)
issued by the Committee of Sponsoring Organizations of the Treadway Commission (“COSO”) and our report dated March 14, 2018 expressed an unqualified opinion thereon.
Basis for Opinion
These consolidated financial statements are the responsibility of the Company’s management. Our responsibility is to express an opinion on the Company’s consolidated financial statements based on our audits. We are a public accounting firm registered with the PCAOB and are required to be independent with respect to the Company in accordance with the U.S. federal securities laws and the applicable rules and regulations of the Securities and Exchange Commission and the PCAOB.
We conducted our audits in accordance with the standards of the PCAOB. Those standards require that we plan and perform the audit to obtain reasonable assurance about whether the consolidated financial statements are free of material misstatement, whether due to error or fraud.
Our audits included performing procedures to assess the risks of material misstatement of the consolidated financial statements, whether due to error or fraud, and performing procedures that respond to those risks. Such procedures included examining, on a test basis, evidence regarding the amounts and disclosures in the consolidated financial statements. Our audits also included evaluating the accounting principles used and significant estimates made by management, as well as evaluating the overall presentation of the consolidated financial statements. We believe that our audits provide a reasonable basis for our opinion.
/s/ BDO USA LLP
We have served as the Company's auditor since 2015.
Dallas, Texas
March 14, 2018
68
ASHFORD HOSPITALITY TRUST, INC. AND SUBSIDIARIES
(in thousands, except share and per share amounts)
|
December 31,
|
|||||||
|
2017
|
2016
|
||||||
|
Assets
|
|||||||
|
Investments in hotel properties, net
|
$
|
4,035,915
|
|
$
|
4,160,563
|
|
|
|
Cash and cash equivalents
|
354,805
|
|
347,091
|
|
|||
|
Restricted cash
|
116,787
|
|
144,014
|
|
|||
|
Marketable securities
|
26,926
|
|
53,185
|
|
|||
|
Accounts receivable, net of allowance of $770 and $690, respectively
|
44,257
|
|
44,629
|
|
|||
|
Inventories
|
4,244
|
|
4,530
|
|
|||
|
Investment in unconsolidated entities
|
2,955
|
|
58,779
|
|
|||
|
Deferred costs, net
|
2,777
|
|
2,846
|
|
|||
|
Prepaid expenses
|
19,269
|
|
17,578
|
|
|||
|
Derivative assets, net
|
2,010
|
|
3,614
|
|
|||
|
Other assets
|
14,152
|
|
11,718
|
|
|||
|
Intangible asset, net
|
9,943
|
|
10,061
|
|
|||
|
Due from third-party hotel managers
|
17,387
|
|
13,348
|
|
|||
|
Assets held for sale
|
18,423
|
|
19,588
|
|
|||
|
Total assets
|
$
|
4,669,850
|
|
$
|
4,891,544
|
|
|
|
Liabilities and Equity
|
|||||||
|
Liabilities:
|
|||||||
|
Indebtedness, net
|
$
|
3,696,300
|
|
$
|
3,723,559
|
|
|
|
Accounts payable and accrued expenses
|
132,401
|
|
126,986
|
|
|||
|
Dividends payable
|
25,045
|
|
24,765
|
|
|||
|
Unfavorable management contract liabilities
|
—
|
|
1,380
|
|
|||
|
Due to Ashford Inc., net
|
15,146
|
|
15,716
|
|
|||
|
Due to Ashford Prime OP, net
|
—
|
|
488
|
|
|||
|
Due to related party, net
|
1,067
|
|
1,001
|
|
|||
|
Due to third-party hotel managers
|
2,431
|
|
2,714
|
|
|||
|
Intangible liabilities, net
|
15,839
|
|
16,195
|
|
|||
|
Other liabilities
|
18,376
|
|
16,548
|
|
|||
|
Liabilities related to assets held for sale
|
13,977
|
|
37,047
|
|
|||
|
Total liabilities
|
3,920,582
|
|
3,966,399
|
|
|||
|
Commitments and contingencies (note 12)
|
|
|
|||||
|
Redeemable noncontrolling interests in operating partnership
|
116,122
|
|
132,768
|
|
|||
|
Equity:
|
|||||||
|
Preferred stock, $0.01 par value, 50,000,000 shares authorized:
|
|||||||
|
Series A Cumulative Preferred Stock, 0 and 1,657,206 shares issued and outstanding at December 31, 2017 and 2016, respectively
|
—
|
|
17
|
|
|||
|
Series D Cumulative Preferred Stock, 2,389,393 and 9,468,706 shares issued and outstanding at December 31, 2017 and 2016, respectively
|
24
|
|
95
|
|
|||
|
Series F Cumulative Preferred Stock, 4,800,000 shares issued and outstanding at December 31, 2017 and 2016
|
48
|
|
48
|
|
|||
|
Series G Cumulative Preferred Stock, 6,200,000 shares issued and outstanding at December 31, 2017 and 2016
|
62
|
|
62
|
|
|||
|
Series H Cumulative Preferred Stock, 3,800,000 and 0 shares issued and outstanding at December 31, 2017 and 2016, respectively
|
38
|
|
—
|
|
|||
|
Series I Cumulative Preferred Stock, 5,400,000 and 0 shares issued and outstanding at December 31, 2017 and 2016, respectively
|
54
|
|
—
|
|
|||
|
Common stock, $0.01 par value, 400,000,000 shares authorized, 97,409,113 and 96,376,827 shares issued and outstanding at December 31, 2017 and 2016, respectively
|
974
|
|
964
|
|
|||
|
Additional paid-in capital
|
1,784,997
|
|
1,764,450
|
|
|||
|
Accumulated deficit
|
(1,153,697
|
)
|
(974,015
|
)
|
|||
|
Total stockholders’ equity of the Company
|
632,500
|
|
791,621
|
|
|||
|
Noncontrolling interests in consolidated entities
|
646
|
|
756
|
|
|||
|
Total equity
|
633,146
|
|
792,377
|
|
|||
|
Total liabilities and equity
|
$
|
4,669,850
|
|
$
|
4,891,544
|
|
|
See Notes to Consolidated Financial Statements.
69
ASHFORD HOSPITALITY TRUST, INC. AND SUBSIDIARIES
(in thousands, except per share amounts)
|
|
Year Ended December 31,
|
||||||||||
|
|
2017
|
2016
|
2015
|
||||||||
|
Revenue
|
|||||||||||
|
Rooms
|
$
|
1,143,135
|
|
$
|
1,180,199
|
|
$
|
1,059,012
|
|
||
|
Food and beverage
|
234,777
|
|
253,211
|
|
227,099
|
|
|||||
|
Other
|
58,204
|
|
56,891
|
|
48,699
|
|
|||||
|
Total hotel revenue
|
1,436,116
|
|
1,490,301
|
|
1,334,810
|
|
|||||
|
Other
|
3,154
|
|
1,742
|
|
2,156
|
|
|||||
|
Total revenue
|
1,439,270
|
|
1,492,043
|
|
1,336,966
|
|
|||||
|
Expenses
|
|||||||||||
|
Hotel operating expenses:
|
|||||||||||
|
Rooms
|
248,643
|
|
255,317
|
|
231,614
|
|
|||||
|
Food and beverage
|
161,683
|
|
172,530
|
|
153,340
|
|
|||||
|
Other expenses
|
444,322
|
|
455,818
|
|
405,896
|
|
|||||
|
Management fees
|
52,653
|
|
54,734
|
|
49,394
|
|
|||||
|
Total hotel expenses
|
907,301
|
|
938,399
|
|
840,244
|
|
|||||
|
Property taxes, insurance and other
|
73,579
|
|
73,457
|
|
65,301
|
|
|||||
|
Depreciation and amortization
|
246,731
|
|
243,863
|
|
210,410
|
|
|||||
|
Impairment charges
|
10,153
|
|
17,816
|
|
19,511
|
|
|||||
|
Transaction costs
|
14
|
|
77
|
|
6,252
|
|
|||||
|
Advisory services fee
|
53,199
|
|
54,361
|
|
43,023
|
|
|||||
|
Corporate, general and administrative
|
13,288
|
|
8,366
|
|
14,310
|
|
|||||
|
Total expenses
|
1,304,265
|
|
1,336,339
|
|
1,199,051
|
|
|||||
|
Operating income (loss)
|
135,005
|
|
155,704
|
|
137,915
|
|
|||||
|
Equity in earnings (loss) of unconsolidated entities
|
(5,866
|
)
|
(6,110
|
)
|
(6,831
|
)
|
|||||
|
Interest income
|
2,202
|
|
331
|
|
90
|
|
|||||
|
Gain (loss) on acquisition of PIM Highland JV and sale of hotel properties
|
14,030
|
|
31,599
|
|
380,752
|
|
|||||
|
Other income (expense)
|
(3,422
|
)
|
(4,517
|
)
|
(864
|
)
|
|||||
|
Interest expense and amortization of premiums and loan costs
|
(222,631
|
)
|
(223,967
|
)
|
(187,514
|
)
|
|||||
|
Write-off of loan costs and exit fees
|
(2,845
|
)
|
(12,702
|
)
|
(5,750
|
)
|
|||||
|
Unrealized gain (loss) on marketable securities
|
(4,649
|
)
|
4,946
|
|
127
|
|
|||||
|
Unrealized gain (loss) on derivatives
|
(2,802
|
)
|
(2,534
|
)
|
(7,402
|
)
|
|||||
|
Income (loss) from continuing operations before income taxes
|
(90,978
|
)
|
(57,250
|
)
|
310,523
|
|
|||||
|
Income tax benefit (expense)
|
2,218
|
|
(1,532
|
)
|
(4,710
|
)
|
|||||
|
Income (loss) from continuing operations
|
(88,760
|
)
|
(58,782
|
)
|
305,813
|
|
|||||
|
Gain (loss) on sale of hotel properties, net of tax
|
—
|
|
—
|
|
599
|
|
|||||
|
Net income (loss)
|
(88,760
|
)
|
(58,782
|
)
|
306,412
|
|
|||||
|
(Income) loss from consolidated entities attributable to noncontrolling interests
|
110
|
|
14
|
|
30
|
|
|||||
|
Net (income) loss attributable to redeemable noncontrolling interests in operating partnership
|
21,642
|
|
12,483
|
|
(35,503
|
)
|
|||||
|
Net income (loss) attributable to the Company
|
(67,008
|
)
|
(46,285
|
)
|
270,939
|
|
|||||
|
Preferred dividends
|
(44,761
|
)
|
(36,272
|
)
|
(33,962
|
)
|
|||||
|
Extinguishment of issuance costs upon redemption of preferred stock
|
(10,799
|
)
|
(6,124
|
)
|
—
|
|
|||||
|
Net income (loss) available to common stockholders
|
$
|
(122,568
|
)
|
$
|
(88,681
|
)
|
$
|
236,977
|
|
||
|
Income (loss) per share – basic and diluted:
|
|||||||||||
|
Basic:
|
|||||||||||
|
Income (loss) from continuing operations attributable to common stockholders
|
$
|
(1.30
|
)
|
$
|
(0.95
|
)
|
$
|
2.43
|
|
||
|
Income (loss) from discontinued operations attributable to common stockholders
|
—
|
|
—
|
|
—
|
|
|||||
|
Net income (loss) attributable to common stockholders
|
$
|
(1.30
|
)
|
$
|
(0.95
|
)
|
$
|
2.43
|
|
||
|
Weighted average common shares outstanding – basic
|
95,207
|
|
94,426
|
|
96,290
|
|
|||||
|
Diluted:
|
|||||||||||
|
Income (loss) from continuing operations attributable to common stockholders
|
$
|
(1.30
|
)
|
$
|
(0.95
|
)
|
$
|
2.35
|
|
||
|
Income (loss) from discontinued operations attributable to common stockholders
|
—
|
|
—
|
|
—
|
|
|||||
|
Net income (loss) attributable to common stockholders
|
$
|
(1.30
|
)
|
$
|
(0.95
|
)
|
$
|
2.35
|
|
||
|
Weighted average common shares outstanding – diluted
|
95,207
|
|
94,426
|
|
114,881
|
|
|||||
|
Dividends declared per common share
|
$
|
0.48
|
|
$
|
0.48
|
|
$
|
0.48
|
|
||
See Notes to Consolidated Financial Statements.
70
ASHFORD HOSPITALITY TRUST, INC. AND SUBSIDIARIES
CONSOLIDATED STATEMENTS OF COMPREHENSIVE INCOME (LOSS)
(in thousands)
|
|
Year Ended December 31,
|
||||||||||
|
|
2017
|
2016
|
2015
|
||||||||
|
Net income (loss)
|
$
|
(88,760
|
)
|
$
|
(58,782
|
)
|
$
|
306,412
|
|
||
|
Other comprehensive income (loss), net of tax:
|
|||||||||||
|
Reclassification to interest expense
|
—
|
|
—
|
|
—
|
|
|||||
|
Total other comprehensive income (loss)
|
—
|
|
—
|
|
—
|
|
|||||
|
Total comprehensive income (loss)
|
(88,760
|
)
|
(58,782
|
)
|
306,412
|
|
|||||
|
Comprehensive (income) loss attributable to noncontrolling interests in consolidated entities
|
110
|
|
14
|
|
30
|
|
|||||
|
Comprehensive (income) loss attributable to redeemable noncontrolling interests in operating partnership
|
21,642
|
|
12,483
|
|
(35,503
|
)
|
|||||
|
Comprehensive income (loss) attributable to the Company
|
$
|
(67,008
|
)
|
$
|
(46,285
|
)
|
$
|
270,939
|
|
||
See Notes to Consolidated Financial Statements.
71
ASHFORD HOSPITALITY TRUST, INC. AND SUBSIDIARIES
CONSOLIDATED STATEMENTS OF EQUITY
(in thousands)
|
Preferred Stock
|
Additional
Paid-in
Capital
|
Accumulated
Deficit
|
Noncontrolling Interests in Consolidated Entities
|
Total
|
Redeemable Noncontrolling Interest in Operating Partnership
|
||||||||||||||||||||||||||||||||||||||||||||||||||||||||||||||||||||||
|
Series A
|
Series D
|
Series E
|
Series F
|
Series G
|
Series H
|
Series I
|
Common Stock
|
||||||||||||||||||||||||||||||||||||||||||||||||||||||||||||||||||||
|
Shares
|
Amount
|
Shares
|
Amount
|
Shares
|
Amount
|
Shares
|
Amount
|
Shares
|
Amount
|
Shares
|
Amount
|
Shares
|
Amount
|
Shares
|
Amount
|
||||||||||||||||||||||||||||||||||||||||||||||||||||||||||||
|
Balance at January 1, 2015
|
1,657
|
|
$
|
17
|
|
9,469
|
|
$
|
95
|
|
4,630
|
|
$
|
46
|
|
—
|
|
$
|
—
|
|
—
|
|
$
|
—
|
|
—
|
|
$
|
—
|
|
—
|
|
$
|
—
|
|
89,440
|
|
$
|
894
|
|
$
|
1,580,904
|
|
$
|
(1,050,323
|
)
|
$
|
800
|
|
$
|
532,433
|
|
$
|
177,064
|
|
||||||||||||||||||||
|
Purchases of common stock
|
—
|
|
—
|
|
—
|
|
—
|
|
—
|
|
—
|
|
—
|
|
—
|
|
—
|
|
—
|
|
—
|
|
—
|
|
—
|
|
—
|
|
(5,803
|
)
|
(57
|
)
|
(52,235
|
)
|
—
|
|
—
|
|
(52,292
|
)
|
—
|
|
|||||||||||||||||||||||||||||||||
|
Equity-based compensation
|
—
|
|
—
|
|
—
|
|
—
|
|
—
|
|
—
|
|
—
|
|
—
|
|
—
|
|
—
|
|
—
|
|
—
|
|
—
|
|
—
|
|
—
|
|
—
|
|
2,054
|
|
—
|
|
—
|
|
2,054
|
|
1,416
|
|
|||||||||||||||||||||||||||||||||
|
Forfeitures of restricted shares
|
—
|
|
—
|
|
—
|
|
—
|
|
—
|
|
—
|
|
—
|
|
—
|
|
—
|
|
—
|
|
—
|
|
—
|
|
—
|
|
—
|
|
(20
|
)
|
—
|
|
17
|
|
—
|
|
—
|
|
17
|
|
—
|
|
|||||||||||||||||||||||||||||||||
|
Issuance of restricted shares/units
|
—
|
|
—
|
|
—
|
|
—
|
|
—
|
|
—
|
|
—
|
|
—
|
|
—
|
|
—
|
|
—
|
|
—
|
|
—
|
|
—
|
|
1,183
|
|
12
|
|
(12
|
)
|
—
|
|
—
|
|
—
|
|
35
|
|
|||||||||||||||||||||||||||||||||
|
Issuance of common stock
|
—
|
|
—
|
|
—
|
|
—
|
|
—
|
|
—
|
|
—
|
|
—
|
|
—
|
|
—
|
|
—
|
|
—
|
|
—
|
|
—
|
|
10,530
|
|
105
|
|
110,765
|
|
—
|
|
—
|
|
110,870
|
|
—
|
|
|||||||||||||||||||||||||||||||||
|
Dividends declared - common shares
|
—
|
|
—
|
|
—
|
|
—
|
|
—
|
|
—
|
|
—
|
|
—
|
|
—
|
|
—
|
|
—
|
|
—
|
|
—
|
|
—
|
|
—
|
|
—
|
|
—
|
|
(47,190
|
)
|
—
|
|
(47,190
|
)
|
—
|
|
|||||||||||||||||||||||||||||||||
|
Dividends declared - preferred shares- Series A
|
—
|
|
—
|
|
—
|
|
—
|
|
—
|
|
—
|
|
—
|
|
—
|
|
—
|
|
—
|
|
—
|
|
—
|
|
—
|
|
—
|
|
—
|
|
—
|
|
—
|
|
(3,542
|
)
|
—
|
|
(3,542
|
)
|
—
|
|
|||||||||||||||||||||||||||||||||
|
Dividends declared - preferred shares- Series D
|
—
|
|
—
|
|
—
|
|
—
|
|
—
|
|
—
|
|
—
|
|
—
|
|
—
|
|
—
|
|
—
|
|
—
|
|
—
|
|
—
|
|
—
|
|
—
|
|
—
|
|
(20,002
|
)
|
—
|
|
(20,002
|
)
|
—
|
|
|||||||||||||||||||||||||||||||||
|
Dividends declared - preferred shares- Series E
|
—
|
|
—
|
|
—
|
|
—
|
|
—
|
|
—
|
|
—
|
|
—
|
|
—
|
|
—
|
|
—
|
|
—
|
|
—
|
|
—
|
|
—
|
|
—
|
|
—
|
|
(10,418
|
)
|
—
|
|
(10,418
|
)
|
—
|
|
|||||||||||||||||||||||||||||||||
|
Distributions to noncontrolling interests
|
—
|
|
—
|
|
—
|
|
—
|
|
—
|
|
—
|
|
—
|
|
—
|
|
—
|
|
—
|
|
—
|
|
—
|
|
—
|
|
—
|
|
—
|
|
—
|
|
—
|
|
—
|
|
—
|
|
—
|
|
(10,919
|
)
|
|||||||||||||||||||||||||||||||||
|
Redemption/conversion of operating partnership units
|
—
|
|
—
|
|
—
|
|
—
|
|
—
|
|
—
|
|
—
|
|
—
|
|
—
|
|
—
|
|
—
|
|
—
|
|
—
|
|
—
|
|
141
|
|
1
|
|
1,544
|
|
—
|
|
—
|
|
1,545
|
|
(1,545
|
)
|
|||||||||||||||||||||||||||||||||
|
Distribution of Ashford Prime OP units
|
—
|
|
—
|
|
—
|
|
—
|
|
—
|
|
—
|
|
—
|
|
—
|
|
—
|
|
—
|
|
—
|
|
—
|
|
—
|
|
—
|
|
—
|
|
—
|
|
(45,843
|
)
|
—
|
|
—
|
|
(45,843
|
)
|
(9,790
|
)
|
|||||||||||||||||||||||||||||||||
|
Redemption value adjustment
|
—
|
|
—
|
|
—
|
|
—
|
|
—
|
|
—
|
|
—
|
|
—
|
|
—
|
|
—
|
|
—
|
|
—
|
|
—
|
|
—
|
|
—
|
|
—
|
|
—
|
|
73,315
|
|
—
|
|
73,315
|
|
(73,315
|
)
|
|||||||||||||||||||||||||||||||||
|
Net income (loss)
|
—
|
|
—
|
|
—
|
|
—
|
|
—
|
|
—
|
|
—
|
|
—
|
|
—
|
|
—
|
|
—
|
|
—
|
|
—
|
|
—
|
|
—
|
|
—
|
|
—
|
|
270,939
|
|
(30
|
)
|
270,909
|
|
35,503
|
|
|||||||||||||||||||||||||||||||||
|
Balance at December 31, 2015
|
1,657
|
|
$
|
17
|
|
9,469
|
|
$
|
95
|
|
4,630
|
|
$
|
46
|
|
—
|
|
$
|
—
|
|
—
|
|
$
|
—
|
|
—
|
|
$
|
—
|
|
—
|
|
$
|
—
|
|
95,471
|
|
$
|
955
|
|
$
|
1,597,194
|
|
$
|
(787,221
|
)
|
$
|
770
|
|
$
|
811,856
|
|
$
|
118,449
|
|
||||||||||||||||||||
|
Purchases of common shares
|
—
|
|
—
|
|
—
|
|
—
|
|
—
|
|
—
|
|
—
|
|
—
|
|
—
|
|
—
|
|
—
|
|
—
|
|
—
|
|
—
|
|
(124
|
)
|
(1
|
)
|
(728
|
)
|
—
|
|
—
|
|
(729
|
)
|
—
|
|
|||||||||||||||||||||||||||||||||
|
Equity-based compensation
|
—
|
|
—
|
|
—
|
|
—
|
|
—
|
|
—
|
|
—
|
|
—
|
|
—
|
|
—
|
|
—
|
|
—
|
|
—
|
|
—
|
|
—
|
|
—
|
|
5,746
|
|
—
|
|
—
|
|
5,746
|
|
3,926
|
|
|||||||||||||||||||||||||||||||||
|
Forfeitures of restricted shares
|
—
|
|
—
|
|
—
|
|
—
|
|
—
|
|
—
|
|
—
|
|
—
|
|
—
|
|
—
|
|
—
|
|
—
|
|
—
|
|
—
|
|
(47
|
)
|
—
|
|
—
|
|
—
|
|
—
|
|
—
|
|
—
|
|
|||||||||||||||||||||||||||||||||
|
Issuance of restricted shares/units
|
—
|
|
—
|
|
—
|
|
—
|
|
—
|
|
—
|
|
—
|
|
—
|
|
—
|
|
—
|
|
—
|
|
—
|
|
—
|
|
—
|
|
862
|
|
8
|
|
(8
|
)
|
—
|
|
—
|
|
—
|
|
66
|
|
|||||||||||||||||||||||||||||||||
|
Redemption of preferred shares
|
—
|
|
—
|
|
—
|
|
—
|
|
(4,630
|
)
|
(46
|
)
|
—
|
|
—
|
|
—
|
|
—
|
|
—
|
|
—
|
|
—
|
|
—
|
|
—
|
|
—
|
|
(109,580
|
)
|
(6,124
|
)
|
—
|
|
(115,750
|
)
|
—
|
|
|||||||||||||||||||||||||||||||||
|
Issuances of preferred shares
|
—
|
|
—
|
|
—
|
|
—
|
|
—
|
|
—
|
|
4,800
|
|
48
|
|
6,200
|
|
62
|
|
—
|
|
—
|
|
—
|
|
—
|
|
—
|
|
—
|
|
265,510
|
|
—
|
|
—
|
|
265,620
|
|
—
|
|
|||||||||||||||||||||||||||||||||
|
Dividends declared - common shares
|
—
|
|
—
|
|
—
|
|
—
|
|
—
|
|
—
|
|
—
|
|
—
|
|
—
|
|
—
|
|
—
|
|
—
|
|
—
|
|
—
|
|
—
|
|
—
|
|
—
|
|
(46,292
|
)
|
—
|
|
(46,292
|
)
|
—
|
|
|||||||||||||||||||||||||||||||||
|
Dividends declared - preferred shares- Series A
|
—
|
|
—
|
|
—
|
|
—
|
|
—
|
|
—
|
|
—
|
|
—
|
|
—
|
|
—
|
|
—
|
|
—
|
|
—
|
|
—
|
|
—
|
|
—
|
|
—
|
|
(3,542
|
)
|
—
|
|
(3,542
|
)
|
—
|
|
|||||||||||||||||||||||||||||||||
|
Dividends declared - preferred shares- Series D
|
—
|
|
—
|
|
—
|
|
—
|
|
—
|
|
—
|
|
—
|
|
—
|
|
—
|
|
—
|
|
—
|
|
—
|
|
—
|
|
—
|
|
—
|
|
—
|
|
—
|
|
(20,002
|
)
|
—
|
|
(20,002
|
)
|
—
|
|
|||||||||||||||||||||||||||||||||
|
Dividends declared – preferred shares- Series E
|
—
|
|
—
|
|
—
|
|
—
|
|
—
|
|
—
|
|
—
|
|
—
|
|
—
|
|
—
|
|
—
|
|
—
|
|
—
|
|
—
|
|
—
|
|
—
|
|
—
|
|
(6,280
|
)
|
—
|
|
(6,280
|
)
|
—
|
|
|||||||||||||||||||||||||||||||||
|
Dividends declared – preferred shares- Series F
|
—
|
|
—
|
|
—
|
|
—
|
|
—
|
|
—
|
|
—
|
|
—
|
|
—
|
|
—
|
|
—
|
|
—
|
|
—
|
|
—
|
|
—
|
|
—
|
|
—
|
|
(4,130
|
)
|
—
|
|
(4,130
|
)
|
—
|
|
|||||||||||||||||||||||||||||||||
|
Dividends declared – preferred shares- Series G
|
—
|
|
—
|
|
—
|
|
—
|
|
—
|
|
—
|
|
—
|
|
—
|
|
—
|
|
—
|
|
—
|
|
—
|
|
—
|
|
—
|
|
—
|
|
—
|
|
—
|
|
(2,318
|
)
|
—
|
|
(2,318
|
)
|
—
|
|
|||||||||||||||||||||||||||||||||
|
Distributions to noncontrolling interests
|
—
|
|
—
|
|
—
|
|
—
|
|
—
|
|
—
|
|
—
|
|
—
|
|
—
|
|
—
|
|
—
|
|
—
|
|
—
|
|
—
|
|
—
|
|
—
|
|
—
|
|
—
|
|
—
|
|
—
|
|
(10,988
|
)
|
|||||||||||||||||||||||||||||||||
72
|
Preferred Stock
|
Additional
Paid-in
Capital
|
Accumulated
Deficit
|
Noncontrolling Interests in Consolidated Entities
|
Total
|
Redeemable Noncontrolling Interest in Operating Partnership
|
||||||||||||||||||||||||||||||||||||||||||||||||||||||||||||||||||||||
|
Series A
|
Series D
|
Series E
|
Series F
|
Series G
|
Series H
|
Series I
|
Common Stock
|
||||||||||||||||||||||||||||||||||||||||||||||||||||||||||||||||||||
|
Shares
|
Amount
|
Shares
|
Amount
|
Shares
|
Amount
|
Shares
|
Amount
|
Shares
|
Amount
|
Shares
|
Amount
|
Shares
|
Amount
|
Shares
|
Amount
|
||||||||||||||||||||||||||||||||||||||||||||||||||||||||||||
|
Redemption of operating partnership units for sale of hotel property
|
—
|
|
—
|
|
—
|
|
—
|
|
—
|
|
—
|
|
—
|
|
—
|
|
—
|
|
—
|
|
—
|
|
—
|
|
—
|
|
—
|
|
—
|
|
—
|
|
4,718
|
|
—
|
|
—
|
|
4,718
|
|
(16,423
|
)
|
|||||||||||||||||||||||||||||||||
|
Redemption/conversion of operating partnership units
|
—
|
|
—
|
|
—
|
|
—
|
|
—
|
|
—
|
|
—
|
|
—
|
|
—
|
|
—
|
|
—
|
|
—
|
|
—
|
|
—
|
|
215
|
|
2
|
|
1,598
|
|
(2,571
|
)
|
—
|
|
(971
|
)
|
971
|
|
|||||||||||||||||||||||||||||||||
|
Redemption value adjustment
|
—
|
|
—
|
|
—
|
|
—
|
|
—
|
|
—
|
|
—
|
|
—
|
|
—
|
|
—
|
|
—
|
|
—
|
|
—
|
|
—
|
|
—
|
|
—
|
|
—
|
|
(49,250
|
)
|
—
|
|
(49,250
|
)
|
49,250
|
|
|||||||||||||||||||||||||||||||||
|
Net income (loss)
|
—
|
|
—
|
|
—
|
|
—
|
|
—
|
|
—
|
|
—
|
|
—
|
|
—
|
|
—
|
|
—
|
|
—
|
|
—
|
|
—
|
|
—
|
|
—
|
|
—
|
|
(46,285
|
)
|
(14
|
)
|
(46,299
|
)
|
(12,483
|
)
|
|||||||||||||||||||||||||||||||||
|
Balance at December 31, 2016
|
1,657
|
|
$
|
17
|
|
9,469
|
|
$
|
95
|
|
—
|
|
$
|
—
|
|
4,800
|
|
$
|
48
|
|
6,200
|
|
$
|
62
|
|
—
|
|
$
|
—
|
|
—
|
|
$
|
—
|
|
96,377
|
|
$
|
964
|
|
$
|
1,764,450
|
|
$
|
(974,015
|
)
|
$
|
756
|
|
$
|
792,377
|
|
$
|
132,768
|
|
||||||||||||||||||||
|
Purchases of common stock
|
—
|
|
—
|
|
—
|
|
—
|
|
—
|
|
—
|
|
—
|
|
—
|
|
—
|
|
—
|
|
—
|
|
—
|
|
—
|
|
—
|
|
(203
|
)
|
(2
|
)
|
(1,270
|
)
|
—
|
|
—
|
|
(1,272
|
)
|
—
|
|
|||||||||||||||||||||||||||||||||
|
Equity-based compensation
|
—
|
|
—
|
|
—
|
|
—
|
|
—
|
|
—
|
|
—
|
|
—
|
|
—
|
|
—
|
|
—
|
|
—
|
|
—
|
|
—
|
|
—
|
|
—
|
|
7,227
|
|
—
|
|
—
|
|
7,227
|
|
5,060
|
|
|||||||||||||||||||||||||||||||||
|
Forfeitures of restricted shares
|
—
|
|
—
|
|
—
|
|
—
|
|
—
|
|
—
|
|
—
|
|
—
|
|
—
|
|
—
|
|
—
|
|
—
|
|
—
|
|
—
|
|
(56
|
)
|
—
|
|
—
|
|
—
|
|
—
|
|
—
|
|
—
|
|
|||||||||||||||||||||||||||||||||
|
Issuance of restricted shares/units
|
—
|
|
—
|
|
—
|
|
—
|
|
—
|
|
—
|
|
—
|
|
—
|
|
—
|
|
—
|
|
—
|
|
—
|
|
—
|
|
—
|
|
1,271
|
|
12
|
|
(12
|
)
|
—
|
|
—
|
|
—
|
|
94
|
|
|||||||||||||||||||||||||||||||||
|
Redemption of preferred shares
|
(1,657
|
)
|
(17
|
)
|
(7,080
|
)
|
(71
|
)
|
—
|
|
—
|
|
—
|
|
—
|
|
—
|
|
—
|
|
—
|
|
—
|
|
—
|
|
—
|
|
—
|
|
—
|
|
(207,538
|
)
|
(10,799
|
)
|
—
|
|
(218,425
|
)
|
—
|
|
|||||||||||||||||||||||||||||||||
|
Issuances of preferred shares
|
—
|
|
—
|
|
—
|
|
—
|
|
—
|
|
—
|
|
—
|
|
—
|
|
—
|
|
—
|
|
3,800
|
|
38
|
|
5,400
|
|
54
|
|
—
|
|
—
|
|
221,979
|
|
—
|
|
—
|
|
222,071
|
|
—
|
|
|||||||||||||||||||||||||||||||||
|
Dividends declared - common shares
|
—
|
|
—
|
|
—
|
|
—
|
|
—
|
|
—
|
|
—
|
|
—
|
|
—
|
|
—
|
|
—
|
|
—
|
|
—
|
|
—
|
|
—
|
|
—
|
|
—
|
|
(47,104
|
)
|
—
|
|
(47,104
|
)
|
—
|
|
|||||||||||||||||||||||||||||||||
|
Dividends declared - preferred shares- Series A
|
—
|
|
—
|
|
—
|
|
—
|
|
—
|
|
—
|
|
—
|
|
—
|
|
—
|
|
—
|
|
—
|
|
—
|
|
—
|
|
—
|
|
—
|
|
—
|
|
—
|
|
(2,539
|
)
|
—
|
|
(2,539
|
)
|
—
|
|
|||||||||||||||||||||||||||||||||
|
Dividends declared - preferred shares- Series D
|
—
|
|
—
|
|
—
|
|
—
|
|
—
|
|
—
|
|
—
|
|
—
|
|
—
|
|
—
|
|
—
|
|
—
|
|
—
|
|
—
|
|
—
|
|
—
|
|
—
|
|
(18,211
|
)
|
—
|
|
(18,211
|
)
|
—
|
|
|||||||||||||||||||||||||||||||||
|
Dividends declared – preferred shares- Series F
|
—
|
|
—
|
|
—
|
|
—
|
|
—
|
|
—
|
|
—
|
|
—
|
|
—
|
|
—
|
|
—
|
|
—
|
|
—
|
|
—
|
|
—
|
|
—
|
|
—
|
|
(8,849
|
)
|
—
|
|
(8,849
|
)
|
—
|
|
|||||||||||||||||||||||||||||||||
|
Dividends declared – preferred shares- Series G
|
—
|
|
—
|
|
—
|
|
—
|
|
—
|
|
—
|
|
—
|
|
—
|
|
—
|
|
—
|
|
—
|
|
—
|
|
—
|
|
—
|
|
—
|
|
—
|
|
—
|
|
(11,430
|
)
|
—
|
|
(11,430
|
)
|
—
|
|
|||||||||||||||||||||||||||||||||
|
Dividends declared – preferred shares- Series H
|
—
|
|
—
|
|
—
|
|
—
|
|
—
|
|
—
|
|
—
|
|
—
|
|
—
|
|
—
|
|
—
|
|
—
|
|
—
|
|
—
|
|
—
|
|
—
|
|
—
|
|
(2,494
|
)
|
—
|
|
(2,494
|
)
|
—
|
|
|||||||||||||||||||||||||||||||||
|
Dividends declared – preferred shares- Series I
|
—
|
|
—
|
|
—
|
|
—
|
|
—
|
|
—
|
|
—
|
|
—
|
|
—
|
|
—
|
|
—
|
|
—
|
|
—
|
|
—
|
|
—
|
|
—
|
|
—
|
|
(1,238
|
)
|
—
|
|
(1,238
|
)
|
—
|
|
|||||||||||||||||||||||||||||||||
|
Distributions to noncontrolling interests
|
—
|
|
—
|
|
—
|
|
—
|
|
—
|
|
—
|
|
—
|
|
—
|
|
—
|
|
—
|
|
—
|
|
—
|
|
—
|
|
—
|
|
—
|
|
—
|
|
—
|
|
—
|
|
—
|
|
—
|
|
(10,007
|
)
|
|||||||||||||||||||||||||||||||||
|
Redemption/conversion of operating partnership units
|
—
|
|
—
|
|
—
|
|
—
|
|
—
|
|
—
|
|
—
|
|
—
|
|
—
|
|
—
|
|
—
|
|
—
|
|
—
|
|
—
|
|
20
|
|
—
|
|
161
|
|
—
|
|
—
|
|
161
|
|
(161
|
)
|
|||||||||||||||||||||||||||||||||
|
Redemption value adjustment
|
—
|
|
—
|
|
—
|
|
—
|
|
—
|
|
—
|
|
—
|
|
—
|
|
—
|
|
—
|
|
—
|
|
—
|
|
—
|
|
—
|
|
—
|
|
—
|
|
—
|
|
(10,010
|
)
|
—
|
|
(10,010
|
)
|
10,010
|
|
|||||||||||||||||||||||||||||||||
|
Net income (loss)
|
—
|
|
—
|
|
—
|
|
—
|
|
—
|
|
—
|
|
—
|
|
—
|
|
—
|
|
—
|
|
—
|
|
—
|
|
—
|
|
—
|
|
—
|
|
—
|
|
—
|
|
(67,008
|
)
|
(110
|
)
|
(67,118
|
)
|
(21,642
|
)
|
|||||||||||||||||||||||||||||||||
|
Balance at December 31, 2017
|
—
|
|
$
|
—
|
|
2,389
|
|
$
|
24
|
|
—
|
|
$
|
—
|
|
4,800
|
|
$
|
48
|
|
6,200
|
|
$
|
62
|
|
3,800
|
|
$
|
38
|
|
5,400
|
|
$
|
54
|
|
97,409
|
|
$
|
974
|
|
$
|
1,784,997
|
|
$
|
(1,153,697
|
)
|
$
|
646
|
|
$
|
633,146
|
|
$
|
116,122
|
|
||||||||||||||||||||
See Notes to Consolidated Financial Statements.
73
ASHFORD HOSPITALITY TRUST, INC. AND SUBSIDIARIES
(in thousands)
|
|
Year Ended December 31,
|
||||||||||
|
|
2017
|
2016
|
2015
|
||||||||
|
Cash Flows from Operating Activities
|
|||||||||||
|
Net income (loss)
|
$
|
(88,760
|
)
|
$
|
(58,782
|
)
|
$
|
306,412
|
|
||
|
Adjustments to reconcile net income (loss) to net cash provided by operating activities:
|
|||||||||||
|
Depreciation and amortization
|
246,731
|
|
243,863
|
|
210,410
|
|
|||||
|
Impairment charges
|
10,153
|
|
17,816
|
|
19,511
|
|
|||||
|
Amortization of intangibles
|
(238
|
)
|
(156
|
)
|
(167
|
)
|
|||||
|
Recognition of deferred income
|
(869
|
)
|
—
|
|
—
|
|
|||||
|
Write-off of intangibles
|
—
|
|
564
|
|
—
|
|
|||||
|
Deferred tax expense (benefit)
|
2,324
|
|
—
|
|
—
|
|
|||||
|
Bad debt expense
|
2,185
|
|
1,185
|
|
1,059
|
|
|||||
|
Equity in (earnings) loss of unconsolidated entities
|
5,866
|
|
6,110
|
|
6,831
|
|
|||||
|
Distributions of earnings from unconsolidated entities
|
—
|
|
—
|
|
996
|
|
|||||
|
(Gain) loss on acquisition of PIM Highland JV and sale of properties, net
|
(14,030
|
)
|
(31,599
|
)
|
(381,351
|
)
|
|||||
|
Realized and unrealized (gain) loss on trading securities
|
3,678
|
|
(4,946
|
)
|
(1,776
|
)
|
|||||
|
Purchases of marketable securities
|
(54,793
|
)
|
(48,239
|
)
|
(96,322
|
)
|
|||||
|
Sales of marketable securities
|
77,374
|
|
—
|
|
95,963
|
|
|||||
|
(Gain) loss on insurance settlement
|
—
|
|
(456
|
)
|
—
|
|
|||||
|
Net settlement of trading derivatives
|
(5,035
|
)
|
(5,866
|
)
|
(1,106
|
)
|
|||||
|
Payments for derivatives
|
—
|
|
(230
|
)
|
(9,975
|
)
|
|||||
|
Realized and unrealized (gains) losses on derivatives
|
7,510
|
|
6,116
|
|
9,861
|
|
|||||
|
Amortization of loan costs and premiums, write-off of loan costs, premiums and exit fees
|
14,190
|
|
34,696
|
|
23,059
|
|
|||||
|
Equity-based compensation
|
12,287
|
|
9,672
|
|
3,470
|
|
|||||
|
Changes in operating assets and liabilities, exclusive of effect of acquisitions and dispositions of hotel properties:
|
|||||||||||
|
Accounts receivable and inventories
|
2,037
|
|
(880
|
)
|
5,325
|
|
|||||
|
Prepaid expenses and other assets
|
(4,762
|
)
|
(7,453
|
)
|
(1,042
|
)
|
|||||
|
Accounts payable and accrued expenses
|
(5,316
|
)
|
1,670
|
|
(1,373
|
)
|
|||||
|
Due to/from affiliates
|
—
|
|
—
|
|
3,473
|
|
|||||
|
Due to/from related party
|
944
|
|
(610
|
)
|
(2,624
|
)
|
|||||
|
Due to/from third-party hotel managers
|
(4,353
|
)
|
9,731
|
|
8,858
|
|
|||||
|
Due to/from Ashford Prime OP, net
|
(488
|
)
|
1,016
|
|
136
|
|
|||||
|
Due to/from Ashford Inc., net
|
(570
|
)
|
5,860
|
|
1,654
|
|
|||||
|
Other liabilities
|
1,317
|
|
641
|
|
2,295
|
|
|||||
|
Net cash provided by (used in) operating activities
|
207,382
|
|
179,723
|
|
203,577
|
|
|||||
|
Cash Flows from Investing Activities
|
|||||||||||
|
Investment in unconsolidated entity
|
(984
|
)
|
(2,321
|
)
|
—
|
|
|||||
|
Proceeds from payments on notes receivable
|
—
|
|
4,246
|
|
245
|
|
|||||
|
Proceeds from franchise agreement extensions
|
—
|
|
—
|
|
7,500
|
|
|||||
|
Acquisition of hotel properties and assets, net of cash and restricted cash acquired
|
(363
|
)
|
(3,339
|
)
|
(620,369
|
)
|
|||||
|
Improvements and additions to hotel properties
|
(221,960
|
)
|
(204,040
|
)
|
(175,159
|
)
|
|||||
|
Net proceeds from sale of assets/properties
|
105,267
|
|
181,754
|
|
7,650
|
|
|||||
|
Payments for initial franchise fees
|
(225
|
)
|
(30
|
)
|
(568
|
)
|
|||||
|
Liquidation of U.S. AQUA Fund
|
50,942
|
|
—
|
|
—
|
|
|||||
|
Proceeds from property insurance
|
3,442
|
|
1,872
|
|
385
|
|
|||||
|
Net cash provided by (used in) investing activities
|
(63,881
|
)
|
(21,858
|
)
|
(780,316
|
)
|
|||||
|
Cash Flows from Financing Activities
|
|||||||||||
|
Borrowings on indebtedness
|
704,800
|
|
487,500
|
|
2,277,782
|
|
|||||
|
Repayments of indebtedness
|
(754,836
|
)
|
(559,037
|
)
|
(1,550,299
|
)
|
|||||
|
Payments for loan costs and exit fees
|
(13,871
|
)
|
(20,156
|
)
|
(47,993
|
)
|
|||||
|
Payments for dividends and distributions
|
(101,592
|
)
|
(91,465
|
)
|
(91,282
|
)
|
|||||
|
Purchases of common stock
|
(1,272
|
)
|
(729
|
)
|
(52,292
|
)
|
|||||
|
Redemption of preferred stock
|
(218,425
|
)
|
(115,750
|
)
|
—
|
|
|||||
|
Payments for derivatives
|
(871
|
)
|
(199
|
)
|
(2,217
|
)
|
|||||
|
Proceeds from common stock offering
|
—
|
|
—
|
|
110,870
|
|
|||||
|
Proceeds from preferred stock offerings
|
222,071
|
|
265,620
|
|
—
|
|
|||||
|
Other
|
94
|
|
66
|
|
35
|
|
|||||
|
Net cash provided by (used in) financing activities
|
(163,902
|
)
|
(34,150
|
)
|
644,604
|
|
|||||
|
Net change in cash and cash equivalents
|
(20,401
|
)
|
123,715
|
|
67,865
|
|
|||||
|
Cash, cash equivalents and restricted cash at beginning of year
|
492,473
|
|
368,758
|
|
300,893
|
|
|||||
|
Cash, cash equivalents and restricted cash at end of year
|
$
|
472,072
|
|
$
|
492,473
|
|
$
|
368,758
|
|
||
74
|
|
Year Ended December 31,
|
||||||||||
|
|
2017
|
2016
|
2015
|
||||||||
|
Supplemental Cash Flow Information
|
|||||||||||
|
Interest paid
|
$
|
210,644
|
|
$
|
201,895
|
|
$
|
165,809
|
|
||
|
Income taxes paid (received), net
|
(253
|
)
|
1,882
|
|
8,730
|
|
|||||
|
Supplemental Disclosure of Investing and Financing Activities
|
|||||||||||
|
Accrued but unpaid capital expenditures
|
$
|
19,456
|
|
$
|
11,402
|
|
$
|
7,525
|
|
||
|
Dividends and distributions declared but not paid
|
25,045
|
|
24,765
|
|
22,678
|
|
|||||
|
Investment in unconsolidated entity
|
—
|
|
—
|
|
59,338
|
|
|||||
|
Assumption of debt
|
—
|
|
—
|
|
74,320
|
|
|||||
|
Acquisition of land
|
—
|
|
—
|
|
3,100
|
|
|||||
|
Transfer of debt upon sale of hotel property
|
—
|
|
23,850
|
|
—
|
|
|||||
|
Redemption of operating partnership units for sale of hotel property
|
—
|
|
11,705
|
|
—
|
|
|||||
|
Supplemental Disclosure of Cash, Cash Equivalents and Restricted Cash
|
|||||||||||
|
Cash and cash equivalents at beginning of period
|
$
|
347,091
|
|
$
|
215,078
|
|
$
|
215,063
|
|
||
|
Cash and cash equivalents at beginning of period included in assets held for sale
|
976
|
|
—
|
|
—
|
|
|||||
|
Restricted cash at beginning of period
|
144,014
|
|
153,680
|
|
85,830
|
|
|||||
|
Restricted cash at beginning of period included in assets held for sale
|
392
|
|
—
|
|
—
|
|
|||||
|
Cash, cash equivalents and restricted cash at beginning of period
|
$
|
492,473
|
|
$
|
368,758
|
|
$
|
300,893
|
|
||
|
Cash and cash equivalents at end of period
|
$
|
354,805
|
|
$
|
347,091
|
|
$
|
215,078
|
|
||
|
Cash and cash equivalents at end of period included in assets held for sale
|
78
|
|
976
|
|
—
|
|
|||||
|
Restricted cash at end of period
|
116,787
|
|
144,014
|
|
153,680
|
|
|||||
|
Restricted cash at end of period included in assets held for sale
|
402
|
|
392
|
|
—
|
|
|||||
|
Cash, cash equivalents and restricted cash at end of period
|
$
|
472,072
|
|
$
|
492,473
|
|
$
|
368,758
|
|
||
See Notes to Consolidated Financial Statements.
75
ASHFORD HOSPITALITY TRUST, INC. AND SUBSIDIARIES
NOTES TO CONSOLIDATED FINANCIAL STATEMENTS
For the Years Ended
December 31, 2017
,
2016
and
2015
1. Organization and Description of Business
Ashford Hospitality Trust, Inc., together with its subsidiaries (“Ashford Trust”), is a real estate investment trust (“REIT”) focused on investing in full-service hotels in the upscale and upper upscale segments in domestic and international markets that have revenue per available room (“RevPAR”) generally less than twice the national average, and in all methods including direct real estate, equity, and debt. Other than Ashford Hospitality Trust, Inc.’s investment in Ashford Inc. common stock, we own our lodging investments and conduct our business through Ashford Hospitality Limited Partnership (“Ashford Trust OP”), our operating partnership. Ashford OP General Partner LLC, a wholly-owned subsidiary of Ashford Trust, serves as the sole general partner of our operating partnership. In this report, terms such as the “Company,” “we,” “us,” or “our” refer to Ashford Hospitality Trust, Inc. and all entities included in its consolidated financial statements.
We are advised by Ashford Hospitality Advisors LLC (“Ashford LLC”), a subsidiary of Ashford Inc., through an advisory agreement. All of the hotel properties in our portfolio are currently asset-managed by Ashford LLC.
We do not have any employees. All of the services that might be provided by employees are provided to us by Ashford LLC.
As of
December 31, 2017
, we owned interests in the following assets:
|
•
|
120
consolidated hotel properties, including
118
(
two
which are held for sale) directly owned and
two
owned through a majority-owned investment in a consolidated entity, which represent
25,058
total rooms (or
25,031
net rooms excluding those attributable to our partner);
|
|
•
|
89
hotel condominium units at WorldQuest Resort in Orlando, Florida;
|
|
•
|
a
28.6%
ownership in Ashford Inc. common stock with a carrying value of
$437,000
and a fair value of
$55.6 million
; and
|
|
•
|
a
16.2%
ownership in OpenKey with a carrying value of
$2.5 million
.
|
For federal income tax purposes, we have elected to be treated as a REIT, which imposes limitations related to operating hotels. As of
December 31, 2017
, our
120
hotel properties were leased or owned by our wholly owned subsidiaries that are treated as taxable REIT subsidiaries for federal income tax purposes (collectively, these subsidiaries are referred to as “Ashford TRS”). Ashford TRS then engages third-party or affiliated hotel management companies to operate the hotels under management contracts. Hotel operating results related to these properties are included in the consolidated statements of operations.
As of
December 31, 2017
, Remington Lodging & Hospitality, LLC, together with its affiliates (“Remington Lodging”), which is beneficially wholly owned by Mr. Monty J. Bennett, our Chairman, and Mr. Archie Bennett, Jr., our Chairman Emeritus, managed
82
of our
120
hotel properties and WorldQuest Resort. Third-party management companies managed the remaining hotel properties.
2. Significant Accounting Policies
Basis of Presentation
—The accompanying consolidated financial statements include the accounts of Ashford Hospitality Trust, Inc., its majority-owned subsidiaries and its majority-owned joint ventures in which it has a controlling interest. All significant inter-company accounts and transactions between consolidated entities have been eliminated in these consolidated financial statements.
Ashford Trust OP is considered to be a variable interest entity (“VIE”), as defined by authoritative accounting guidance. A VIE must be consolidated by a reporting entity if the reporting entity is the primary beneficiary because it has (i) the power to direct the VIE’s activities that most significantly impact the VIE’s economic performance, (ii) an implicit financial responsibility to ensure that a VIE operates as designed, and (iii) the obligation to absorb losses of the VIE or the right to receive benefits from the VIE. All major decisions related to Ashford Trust OP that most significantly impact its economic performance, including but not limited to operating procedures with respect to business affairs and any acquisitions, dispositions, financings, restructurings or other transactions with sellers, purchasers, lenders, brokers, agents and other applicable representatives, are subject to the approval of our wholly-owned subsidiary, Ashford Trust OP General Partner LLC, its general partner. As such, we consolidate Ashford Trust OP.
76
ASHFORD HOSPITALITY TRUST, INC. AND SUBSIDIARIES
NOTES TO CONSOLIDATED FINANCIAL STATEMENTS (continued)
The following acquisitions/dispositions affect reporting comparability related to our consolidated financial statements:
|
Hotel Property
|
Location
|
Type
|
Date
|
|||
|
Lakeway Resort & Spa
|
Austin, Texas
|
Acquisition
|
February 6, 2015
|
|||
|
Memphis Marriott East
|
Memphis, Tennessee
|
Acquisition
|
February 25, 2015
|
|||
|
PIM Highland JV (28.26% interest)
|
Various
|
Acquisition
|
March 6, 2015
|
|||
|
Hampton Inn & Suites
|
Gainesville, Florida
|
Acquisition
|
April 29, 2015
|
|||
|
Le Pavillon Hotel
|
New Orleans, Louisiana
|
Acquisition
|
June 3, 2015
|
|||
|
9-hotel portfolio
|
Various
|
Acquisition
|
June 17, 2015
|
|||
|
W Atlanta Downtown
|
Atlanta, Georgia
|
Acquisition
|
July 1, 2015
|
|||
|
Le Meridien Minneapolis
|
Minneapolis, Minnesota
|
Acquisition
|
July 23, 2015
|
|||
|
Hilton Garden Inn - Wisconsin Dells
|
Wisconsin Dells, Wisconsin
|
Acquisition
|
August 5, 2015
|
|||
|
Hotel Indigo Atlanta
|
Atlanta, Georgia
|
Acquisition
|
October 15, 2015
|
|||
|
W Minneapolis Foshay
|
Minneapolis, Minnesota
|
Acquisition
|
November 10, 2015
|
|||
|
5-hotel portfolio
|
Various
|
Disposition
|
June 1, 2016
|
|||
|
Hampton Inn & Suites
|
Gainesville, Florida
|
Disposition
|
September 1, 2016
|
|||
|
SpringHill Suites Gaithersburg
|
Gaithersburg, Maryland
|
Disposition
|
October 1, 2016
|
|||
|
2-hotel portfolio
|
Palm Desert, California
|
Disposition
|
October 7, 2016
|
|||
|
Renaissance
|
Portsmouth, VA
|
Disposition
|
February 1, 2017
|
|||
|
Embassy Suites
|
Syracuse, NY
|
Disposition
|
March 6, 2017
|
|||
|
Crowne Plaza Ravinia
|
Atlanta, GA
|
Disposition
|
June 29, 2017
|
|||
Use of Estimates
—The preparation of these consolidated financial statements in accordance with accounting principles generally accepted in the United States requires management to make estimates and assumptions that affect the reported amounts of assets and liabilities and disclosure of contingent assets and liabilities at the date of the financial statements and the reported amounts of revenue and expenses during the reporting period. Actual results could differ from those estimates.
Cash and Cash Equivalents
—Cash and cash equivalents include cash on hand or held in banks and short-term investments with an initial maturity of three months or less at the date of purchase.
Restricted Cash
—Restricted cash includes reserves for debt service, real estate taxes, and insurance, as well as excess cash flow deposits and reserves for furniture, fixtures, and equipment replacements of approximately
4%
to
6%
of property revenue for certain hotels, as required by certain management or mortgage debt agreement restrictions and provisions. We early adopted Accounting Standards Updates (“ASU”) 2016-18,
Statement of Cash Flows (Topic 230): Restricted Cash
effective January 1, 2017. See discussion in recently adopted accounting standards below.
Accounts Receivable
—Accounts receivable consists primarily of meeting and banquet room rental and hotel guest receivables. We generally do not require collateral. We maintain an allowance for doubtful accounts for estimated losses resulting from the inability of guests to make required payments for services. The allowance is maintained at a level believed adequate to absorb estimated receivable losses. The estimate is based on past receivable loss experience, known and inherent credit risks, current economic conditions, and other relevant factors, including specific reserves for certain accounts.
Inventories
—Inventories, which primarily consist of food, beverages, and gift store merchandise, are stated at the lower of cost or market value. Cost is determined using the first-in, first-out method.
Investments in Hotel Properties, net
—Hotel properties are generally stated at cost. However,
four
hotel properties contributed upon Ashford Trust’s formation in 2003 are stated at the predecessor’s historical cost, net of impairment charges, if any, plus a partial step-up related to the acquisition of noncontrolling interests from third parties associated with certain of these properties. For hotel properties owned through our majority-owned entities, the carrying basis attributable to the partners’ minority ownership is recorded at the predecessor’s historical cost, net of any impairment charges, while the carrying basis attributable to our majority ownership is recorded based on the allocated purchase price of our ownership interests in the entities. All improvements and additions that extend the useful life of the hotel properties are capitalized.
77
ASHFORD HOSPITALITY TRUST, INC. AND SUBSIDIARIES
NOTES TO CONSOLIDATED FINANCIAL STATEMENTS (continued)
Impairment of Investments in Hotel Properties
—Hotel properties are reviewed for impairment whenever events or changes in circumstances indicate that their carrying amounts may not be recoverable. Recoverability of the hotel is measured by comparison of the carrying amount of the hotel to the estimated future undiscounted cash flows, which take into account current market conditions and our intent with respect to holding or disposing of the hotel. If our analysis indicates that the carrying value of the hotel is not recoverable on an undiscounted cash flow basis, we recognize an impairment charge for the amount by which the property’s net book value exceeds its estimated fair value, or fair value, less cost to sell. In evaluating impairment of hotel properties, we make many assumptions and estimates, including projected cash flows, expected holding period, and expected useful life. Fair value is determined through various valuation techniques, including internally developed discounted cash flow models, comparable market transactions and third-party appraisals, where considered necessary. Asset write-downs resulting from property damage are recorded up to the amount of the allocable property insurance deductible in the period that the property damage occurs. See note 5.
Hotel Dispositions
—D
iscontinued operations are defined as the disposal of components of an entity that represents strategic shifts that have (or will have) a major effect on an entity’s operations and financial results. We believe that individual dispositions of hotel properties do not represent a strategic shift that has (or will have) a major effect on our operations and financial results as most will not fit the definition. See note 5.
Assets Held for Sale
—We classify assets as held for sale when we have obtained a firm commitment from a buyer, and consummation of the sale is considered probable and expected within one year. The related operations of assets held for sale are reported as discontinued if the disposal is a component of an entity that represents a strategic shift that has (or will have) a major effect on our operations and cash flows. Depreciation and amortization will cease as of the date assets have met the criteria to be deemed held for sale. See note 5.
Investments in Unconsolidated Entities
—Investments in entities in which we have ownership interests ranging from
16.2%
to
28.6%
, at
December 31, 2017
, are accounted for under the equity method of accounting by recording the initial investment and our percentage of interest in the entities’ net income/loss. We review the investments in our unconsolidated entities for impairment in each reporting period pursuant to the applicable authoritative accounting guidance. An investment is impaired when its estimated fair value is less than the carrying amount of our investment. Any impairment is recorded in equity earnings (loss) in unconsolidated entities.
No
such impairment was recorded for the years ended December 31,
2017
,
2016
and
2015
.
Our investments in certain unconsolidated entities are considered to be variable interests in the underlying entities. VIE’s, as defined by authoritative accounting guidance, must be consolidated by a reporting entity if the reporting entity is the primary beneficiary because it has (i) the power to direct the VIE’s activities that most significantly impact the VIE’s economic performance, (ii) an implicit financial responsibility to ensure that a VIE operates as designed, and (iii) the obligation to absorb losses of the VIE or the right to receive benefits from the VIE. Because we do not have the power and financial responsibility to direct the unconsolidated entities’ activities and operations, we are not considered to be the primary beneficiary of these entities on an ongoing basis and therefore such entities should not be consolidated. In evaluating VIEs, our analysis involves considerable management judgment and assumptions.
Note Receivable
—Mezzanine loan financing, classified as note receivable, represented a loan held for investment and intended to be held to maturity. Note receivable was recorded at cost, net of unamortized loan origination costs and fees, loan purchase discounts, and allowance for losses when a loan is deemed to be impaired. Premiums, discounts, and net origination fees are amortized or accreted as an adjustment to interest income using the effective interest method over the life of the loan. We discontinue recording interest and amortizing discounts/premiums when the contractual payment of interest and/or principal is not received when contractually due. Payments received on impaired nonaccrual loans are recorded as adjustments to impairment charges.
No
interest income was recorded for the years ended December 31,
2017
,
2016
and
2015
. Our note receivable was paid in full on December 2, 2016.
VIEs, as defined by authoritative accounting guidance, must be consolidated by their controlling interest beneficiaries if the VIE does not effectively disperse risks among the parties involved. We no longer hold the mezzanine note receivable at
December 31, 2017
, which was secured by a hotel property and was subordinate to the controlling interest in the secured hotel property. Although the note receivable was considered to be a variable interest in the entity that owns the related hotel, we were not considered to be the primary beneficiary of the hotel property as a result of holding the loan. Therefore, we did not consolidate the hotel property for which we had provided financing. We will evaluate the interests in entities acquired or created in the future to determine whether such entities should be consolidated. In evaluating VIEs, our analysis involves considerable management judgment and assumptions.
78
ASHFORD HOSPITALITY TRUST, INC. AND SUBSIDIARIES
NOTES TO CONSOLIDATED FINANCIAL STATEMENTS (continued)
Impairment of Notes Receivable
—We reviewed notes receivable for impairment each reporting period. A loan is impaired when, based on current information and events, collection of all amounts recorded as assets on the balance sheet is no longer considered probable. We apply normal loan review and underwriting procedures (as may be implemented or modified from time to time) in making that judgment.
When a loan is impaired, we measure impairment based on the present value of expected cash flows discounted at the loan’s effective interest rate against the value of the asset recorded on the balance sheet. We may also measure impairment based on a loan’s observable market price or the fair value of collateral if the loan is collateral-dependent. Loan impairments are recorded as a valuation allowance and a charge to earnings. Our assessment of impairment is based on considerable management judgment and assumptions. Our note receivable was paid in full on December 2, 2016.
No
impairment charges were recorded for the years ended December 31,
2016
and
2015
. Valuation adjustments of
$500,000
and
$439,000
on previously impaired notes were credited to impairment charges for the years ended December 31,
2016
and
2015
, respectively.
Marketable Securities
—Marketable securities include U.S. treasury bills and publicly traded equity securities. All of these investments are recorded at fair value. Prior to our investment in the AQUA U.S. Fund, it also included put and call options in certain publicly traded equity securities. Put and call options are considered derivatives. The fair value of these investments has been determined based on the closing price as of the balance sheet date and is reported as “marketable securities” or “liabilities associated with marketable securities and other” in the consolidated balance sheets. The cost of securities sold is determined by using the high cost method. Net investment income, including interest income (expense), dividends, realized gains and losses and costs of investment, is reported as a component of “other income (expense).” Unrealized gains and losses on these investments are reported as “unrealized gain (loss) on marketable securities” in the consolidated statements of operations.
Deferred Costs, net
—Debt issuance costs are reflected as a direct reduction to the related debt obligation on our consolidated balance sheets. Prior to its expiration, debt issuance costs associated with our secured revolving credit facility were presented as an asset on our consolidated balance sheets. Deferred loan costs are recorded at cost and amortized over the terms of the related indebtedness using the effective interest method. Deferred franchise fees are amortized on a straight line basis over the terms of the related franchise agreements and are presented as an asset on our consolidated balance sheets. See notes 6 and 8.
Intangible Assets and Liabilities
—Intangible assets and liabilities represent the assets and liabilities recorded on certain hotel properties’ ground lease contracts that were below or above market rates at the date of acquisition. These assets and liabilities are amortized using the straight line method over the remaining terms of the respective lease contracts. See note 7.
Derivative Instruments and Hedging
—We use interest rate derivatives to hedge our risks and to capitalize on the historical correlation between changes in LIBOR (London Interbank Offered Rate) and RevPAR. Interest rate derivatives could include swaps, caps, floors, flooridors. We assess the effectiveness of each hedging relationship by comparing the changes in fair value or cash flows of the derivative hedging instrument with the changes in fair value or cash flows of the designated hedged item or transaction. We also use credit default swaps to hedge financial and capital market risk. All of our derivatives are subject to master- netting settlement arrangements and the credit default swaps are subject to credit support annexes. For credit default swaps, cash collateral is posted by us as well as our counterparty. We offset the fair value of the derivative and the obligation/right to return/reclaim cash collateral. We also purchase options on Eurodollar futures as a hedge against our cash flows. Eurodollar futures prices reflect market expectations for interest rates on three month Eurodollar deposits for specific dates in the future, and the final settlement price is determined by three month LIBOR on the last trading day. Options on Eurodollar futures provide the ability to limit losses while maintaining the possibility of profiting from favorable changes in the futures prices. As the purchaser, our maximum potential loss is limited to the initial premium paid for the Eurodollar option contracts, while our potential gain has no limit. These exchange-traded options are centrally cleared, and a clearinghouse stands in between all trades to ensure that the obligations involved in the trades are made good.
All derivatives are recorded at fair value in accordance with the applicable authoritative accounting guidance. Interest rate derivatives, credit default swaps and options on futures contracts are reported as “derivative assets, net” in the consolidated balance sheets. Interest rate derivatives and futures, changes in fair value are recognized in earnings as “unrealized gain (loss) on derivatives” in the consolidated statements of operations. Accrued interest on non-hedge designated interest rate derivatives is included in “accounts receivable, net” in the consolidated balance sheets.
For non-hedge designated interest rate derivatives, credit default swaps and options on futures contracts, changes in fair value and realized gains and losses are recognized in earnings as “unrealized gain (loss) on derivatives” and “other income (expense)”, respectively, in the consolidated statements of operations.
79
ASHFORD HOSPITALITY TRUST, INC. AND SUBSIDIARIES
NOTES TO CONSOLIDATED FINANCIAL STATEMENTS (continued)
Due to/from Related Party
—Due to/from related party represents current receivables and payables resulting from transactions related to hotel management, project management and market services with a related party. Due to/from related party is generally settled within a period not exceeding
one year
.
Due to/from Ashford Prime OP, net
—Due to/from Ashford Prime OP represents receivables and payables resulting from certain expenses. Due to/from Ashford Prime OP is generally settled within a period not exceeding
one year
.
Due to/from Ashford Inc.
—Due to/from Ashford Inc. represents current receivables and payables resulting primarily from advisory services fee, including reimbursable expenses. Due to/from Ashford Inc., is generally settled within a period not exceeding
one year
.
Due to/from Third-Party Hotel Managers
—Due from third-party hotel managers primarily consists of amounts due from Marriott related to cash reserves held at the Marriott corporate level related to operating, real estate taxes and other items. Due to/from third-party hotel managers also represents current receivables and payables resulting from transactions related to hotel management.
Unfavorable Management Contract Liabilities
—Certain management agreements assumed in previous acquisitions had terms that were more favorable to the respective managers than typical market management agreements at the acquisition dates. As a result, we initially recorded unfavorable contract liabilities related to those management agreements totaling
$23.4 million
based on the present value of expected cash outflows over the initial terms of the related agreements. The unfavorable contract liabilities are amortized as reductions to incentive management fees on a straight-line basis over the initial terms of the related agreements. In evaluating unfavorable contract liabilities, our analysis involves considerable management judgment and assumptions.
Noncontrolling Interests
—The redeemable noncontrolling interests in the operating partnership represent the limited partners’ proportionate share of equity in earnings/losses of the operating partnership, which is an allocation of net income attributable to the common unit holders based on the weighted average ownership percentage of these limited partners’ common unit holdings throughout the period. The redeemable noncontrolling interests in our operating partnership is classified in the mezzanine section of the consolidated balance sheets as these redeemable operating partnership units do not meet the requirements for permanent equity classification prescribed by the authoritative accounting guidance because these redeemable operating partnership units may be redeemed by the holder as described in note 13. The carrying value of the noncontrolling interests in the operating partnership is based on the greater of the accumulated historical cost or the redemption value.
The noncontrolling interests in consolidated entities represent ownership interests of
15%
in
two
hotel properties held by
one
joint venture at
December 31, 2017
and
2016
, and is reported in equity in the consolidated balance sheets.
Net income/loss attributable to redeemable noncontrolling interests in the operating partnership and income/loss from consolidated entities attributable to noncontrolling interests in our consolidated entities are reported as deductions/additions from/to net income/loss. Comprehensive income/loss attributable to these noncontrolling interests is reported as reductions/additions from/to comprehensive income/loss.
Revenue Recognition
—Hotel revenues, including room, food, beverage, and ancillary revenues such as long-distance telephone service, laundry, parking and space rentals, are recognized when services have been rendered. Taxes collected from customers and submitted to taxing authorities are not recorded in revenue. Interest income is recognized when earned. We discontinue recording interest and amortizing discounts/premiums when the contractual payment of interest and/or principal is not received when contractually due.
Other Hotel Expenses
—Other hotel expenses include Internet, telephone charges, guest laundry, valet parking, and hotel-level general and administrative fees, sales and marketing expenses, repairs and maintenance, franchise fees and utility costs. They are expensed as incurred.
Advertising Costs
—Advertising costs are charged to expense as incurred. For the years ended December 31,
2017
,
2016
and
2015
, our continuing operations incurred advertising costs of
$7.5 million
,
$6.4 million
and
$5.6 million
, respectively. Advertising costs related to continuing operations are included in “other” hotel expenses in the accompanying consolidated statements of operations.
Equity-Based Compensation
—Stock/unit-based compensation for non-employees is accounted for at fair value based on the market price of the shares at period end in accordance with applicable authoritative accounting guidance that results in recording expense, included in “advisory services fee,” and “management fees” equal to the fair value of the award in proportion to the requisite service period satisfied during the period. Performance stock units (“PSUs”) and performance-based Long-Term Incentive
80
ASHFORD HOSPITALITY TRUST, INC. AND SUBSIDIARIES
NOTES TO CONSOLIDATED FINANCIAL STATEMENTS (continued)
Plan (“Performance LTIP”) units granted to certain executive officers are accounted for at fair value at period end based on a Monte Carlo simulation valuation model that results in recording expense, included in “advisory services fee,” equal to the fair value of the award in proportion to the requisite service period satisfied during the period. Stock/unit grants to independent directors are recorded at fair value based on the market price of the shares at grant date, which amount is fully expensed as the grants of stock/units are fully vested on the date of grant.
Depreciation and Amortization
—Owned hotel properties are depreciated over the estimated useful life of the assets and leasehold improvements are amortized over the shorter of the lease term or the estimated useful life of the related assets. Presently, hotel properties are depreciated using the straight-line method over lives ranging from
7.5
to
39
years for buildings and improvements and
1.5
to
5
years for furniture, fixtures and equipment. While we believe our estimates are reasonable, a change in estimated useful lives could affect depreciation and amortization expense and net income (loss) as well as resulting gains or losses on potential hotel sales.
Income Taxes
—As a REIT, we generally are not subject to federal corporate income tax on the portion of our net income (loss) that does not relate to taxable REIT subsidiaries. However, Ashford TRS is treated as a taxable REIT subsidiary for federal income tax purposes. In accordance with authoritative accounting guidance, we account for income taxes related to Ashford TRS using the asset and liability method under which deferred tax assets and liabilities are recognized for future tax consequences attributable to differences between the financial statement carrying amounts of existing assets and liabilities and their respective tax bases. In addition, the analysis utilized by us in determining our deferred tax asset valuation allowance involves considerable management judgment and assumptions.
The “Income Taxes” topic of the Financial Accounting Standards Board’s (“FASB”) Accounting Standards Codification addresses the accounting for uncertainty in income taxes recognized in an enterprise’s financial statements. The guidance requires us to determine whether tax positions we have taken or expect to take in a tax return are more likely than not to be sustained upon examination by the appropriate taxing authority based on the technical merits of the positions. Tax positions that do not meet the more likely than not threshold would be recorded as additional tax expense in the current period. We analyze all open tax years, as defined by the statute of limitations for each jurisdiction, which includes the federal jurisdiction and various states. We classify interest and penalties related to underpayment of income taxes as income tax expense. We and our subsidiaries file income tax returns in the U.S. federal jurisdiction and various states and cities. Tax years 2013 through 2017 remain subject to potential examination by certain federal and state taxing authorities.
Income (Loss) Per Share
—Basic income (loss) per common share is calculated by dividing net income (loss) attributable to common stockholders by the weighted average common shares outstanding during the period using the two-class method prescribed by applicable authoritative accounting guidance. Diluted income (loss) per common share is calculated using the two-class method, or the treasury stock method, if more dilutive. Diluted income (loss) per common share reflects the potential dilution that could occur if securities or other contracts to issue common shares were exercised or converted into common shares, whereby such exercise or conversion would result in lower income per share.
Recently Adopted Accounting Standards
—In March 2016, the FASB issued ASU 2016-07,
Simplifying the Transition to the Equity Method of Accounting
(“ASU 2016-07”), which simplifies the equity method of accounting by eliminating the requirement to retrospectively apply the equity method to an investment that subsequently qualifies for such accounting as a result of an increase in the level of ownership interest or degree of influence. ASU 2016-07 is effective for fiscal years beginning after December 15, 2016, including interim periods within those fiscal years. Early adoption is permitted. We adopted this standard effective January 1, 2017, and the adoption of this standard did not have any impact on our financial position, results of operations or cash flows.
In November 2016, the FASB issued ASU 2016-18,
Statement of Cash Flows (Topic 230): Restricted Cash
(“ASU 2016-18”), which clarifies the presentation of restricted cash and restricted cash equivalents in the statements of cash flows. Under ASU 2016-18 restricted cash and restricted cash equivalents are included with cash and cash equivalents when reconciling the beginning-of-period and end-of-period total amounts shown on the statements of cash flows. ASU 2016-18 is effective for fiscal years beginning after December 15, 2017, and interim periods within those fiscal years. Early adoption is permitted. We adopted this standard effective January 1, 2017 on a retrospective basis. The adoption of this standard resulted in the inclusion of restricted cash with cash and cash equivalents when reconciling the beginning-of-period and end-of-period total amounts shown on the statements of cash flows for all periods presented. As a result, for the years ended December 31, 2016 and 2015, net cash provided by operating activities increased
$4.7 million
and
$5.4 million
, respectively. Net cash used in investing activities increased
$13.9 million
for the year ended December 31, 2016 and decreased
$73.2 million
for the year ended December 31, 2015. Our beginning-of-period cash, cash equivalents and restricted cash increased
$144.0 million
,
$153.7 million
and
$85.8 million
in 2017, 2016 and 2015, respectively.
81
ASHFORD HOSPITALITY TRUST, INC. AND SUBSIDIARIES
NOTES TO CONSOLIDATED FINANCIAL STATEMENTS (continued)
Recently Issued Accounting Standards
—In May 2014, the FASB issued ASU 2014-09,
Revenue from Contracts with Customers
(“ASU 2014-09”). ASU 2014-09 is a comprehensive new revenue recognition model, which requires a company to recognize revenue to depict the transfer of promised goods or services to a customer in an amount that reflects the consideration the company expects to receive in exchange for those goods or services. The update will replace most existing revenue recognition guidance in U.S. GAAP when it becomes effective. In August 2015, the FASB issued ASU 2015-14,
Revenue From Contracts With Customers (Topic 606): Deferral of the Effective Date
, which defers the effective date to fiscal periods beginning after December 15, 2017. The standard permits the use of either the full retrospective or cumulative effect (modified retrospective) transition method. Based on our assessment of this standard, it will not materially affect the amount or timing of revenue recognition for revenues from room, food and beverage, and other hotel level sales. Additionally, we have historically disposed of hotel properties for cash sales with no contingencies and no future involvement in the hotel operations, therefore, ASU No. 2014-09 will not impact the recognition of hotel sales. We have selected the modified retrospective method. We continue to evaluate the related disclosure requirements.
In January 2016, the FASB issued ASU 2016-01,
Recognition and Measurement of Financial Assets and Financial Liabilities
(“ASU 2016-01”), which requires an entity to: (i) measure equity investments at fair value through net income, with certain exceptions; (ii) present in OCI the changes in instrument-specific credit risk for financial liabilities measured using the fair value option; (iii) present financial assets and financial liabilities by measurement category and form of financial asset; (iv) calculate the fair value of financial instruments for disclosure purposes based on an exit price and; (v) assess a valuation allowance on deferred tax assets related to unrealized losses of AFS debt securities in combination with other deferred tax assets. ASU 2016-01 provides an election to subsequently measure certain nonmarketable equity investments at cost less any impairment and adjusted for certain observable price changes. It also requires a qualitative impairment assessment of such equity investments and amends certain fair value disclosure requirements. ASU 2016-01 is effective for fiscal years beginning after December 15, 2017, including interim periods within those fiscal years. Certain provisions of ASU 2016-01 are eligible for early adoption. We do not expect that ASU 2016-01 will have a material impact on our consolidated financial statements and related disclosures.
In February 2016, the FASB issued ASU 2016-02,
Leases
(“ASU 2016-02”). The new standard establishes a right-of-use (“ROU”) model that requires a lessee to record a ROU asset and a lease liability on the balance sheet for all leases with terms longer than 12 months. Leases will be classified as either finance or operating, with classification affecting the pattern of expense recognition in the income statement. ASU 2016-02 is effective for fiscal years beginning after December 15, 2018, including interim periods within those fiscal years. Early adoption is permitted. A modified retrospective transition approach is required for lessees for capital and operating leases existing at, or entered into after, the beginning of the earliest comparative period presented in the financial statements, with certain practical expedients available. The accounting for leases under which we are the lessor remains largely unchanged. While we are currently in the initial stages of assessing the impact that ASU 2016-02 will have on our consolidated financial statements, we expect the primary impact to our consolidated financial statements upon adoption will be the recognition, on a discounted basis, of our future minimum rentals due under our hotel ground leases and other noncancelable leases on our consolidated balance sheets resulting in the recording of ROU assets and lease obligations.
In June 2016, the FASB issued ASU 2016-13,
Financial Instruments -
Credit Losses (Topic 326): Measurement of Credit Losses on Financial Instruments
("ASU 2016-13"). The ASU sets forth an “expected credit loss” impairment model to replace the current “incurred loss” method of recognizing credit losses. The standard requires measurement and recognition of expected credit losses for most financial assets held. The ASU is effective for fiscal years beginning after December 15, 2019, including interim periods within those fiscal years. Early adoption is permitted for periods beginning after December 15, 2018. We are currently evaluating the impact that ASU 2016-13 will have on the consolidated financial statements and related disclosures.
In August 2016, the FASB issued ASU 2016-15,
Statement of Cash Flows (Topic 230): Classification of Certain Cash Receipts and Cash Payments - a consensus of the Emerging Issues Task Force
(“ASU 2016-15”). The new guidance is intended to reduce diversity in practice in how certain transactions are classified in the statement of cash flows. Certain issues addressed in this guidance include - debt payments or debt extinguishment costs, contingent consideration payments made after a business combination, proceeds from the settlement of insurance claims, distributions received from equity method investments and beneficial interests in securitization transactions. ASU 2016-15 is effective for fiscal years beginning after December 15, 2017, and interim periods within those fiscal years. Early adoption is permitted. We are currently evaluating the impact that ASU 2016-15 will have on our consolidated financial statements and related disclosures.
In January 2017, the FASB issued ASU 2017-01,
Business Combinations (Topic 805) - Clarifying the Definition of a Business
(“ASU 2017-01”), which clarifies the definition of a business with the objective of adding guidance to assist entities with evaluating whether a transaction should be accounted for as an acquisition (or disposal) of an asset or a business. ASU 2017-01 is effective for fiscal years beginning after December 15, 2017. Early adoption is permitted. While we are currently evaluating the potential impact of the standard, we currently expect that certain future hotel acquisitions may be considered asset acquisitions
82
ASHFORD HOSPITALITY TRUST, INC. AND SUBSIDIARIES
NOTES TO CONSOLIDATED FINANCIAL STATEMENTS (continued)
rather than business combinations, which would affect capitalization of acquisitions costs (such costs are expensed for business combinations and capitalized for asset acquisitions).
In February 2017, the FASB issued ASU 2017-05,
Other Income-Gains and Losses from the Derecognition of Nonfinancial Assets (Subtopic 610-20): Clarifying the Scope of Asset Derecognition Guidance and Accounting for Partial Sales of Nonfinancial Assets
(ASU “2017-05”), which clarifies the scope of
Accounting Standard Codification (“
ASC”) Subtopic 610-20,
Other Income-Gains and Losses from the Derecognition of Nonfinancial Assets
and adds guidance for partial sales of nonfinancial assets.
ASU 2017-05 is effective for fiscal years beginning after December 15, 2017.
Early adoption is permitted. An entity may elect to apply ASU 2017-05 under a retrospective or modified retrospective approach. We are evaluating the impact that ASU 2017-05 will have on our consolidated financial statements and related disclosures.
3. Investments in Hotel Properties
Investments in hotel properties consisted of the following (in thousands):
|
December 31,
|
|||||||
|
2017
|
2016
|
||||||
|
Land
|
$
|
653,293
|
|
$
|
663,013
|
|
|
|
Buildings and improvements
|
3,895,112
|
|
3,913,377
|
|
|||
|
Furniture, fixtures and equipment
|
468,420
|
|
434,091
|
|
|||
|
Construction in progress
|
35,273
|
|
32,525
|
|
|||
|
Condominium properties
|
12,196
|
|
11,558
|
|
|||
|
Total cost
|
5,064,294
|
|
5,054,564
|
|
|||
|
Accumulated depreciation
|
(1,028,379
|
)
|
(894,001
|
)
|
|||
|
Investments in hotel properties, net
|
$
|
4,035,915
|
|
$
|
4,160,563
|
|
|
The cost of land and depreciable property, net of accumulated depreciation, for federal income tax purposes was approximately
$4.1 billion
and
$3.4 billion
as of
December 31, 2017
and
2016
.
For the years ended
December 31, 2017
,
2016
and
2015
, we recognized depreciation expense of
$246.0 million
,
$243.6 million
and
$210.1 million
, respectively.
4. Investment in Unconsolidated Entities
Ashford Inc.
As of
December 31, 2017
, we held approximately
598,000
shares of Ashford Inc. common stock, which represented an approximate
28.6%
ownership interest, with a carrying value of approximately
$437,000
and a fair value of
$55.6 million
.
83
ASHFORD HOSPITALITY TRUST, INC. AND SUBSIDIARIES
NOTES TO CONSOLIDATED FINANCIAL STATEMENTS (continued)
The following tables summarize the condensed balance sheets and our ownership interest in Ashford Inc. as of
December 31, 2017
and
2016
, and the condensed statements of operations and our equity in earnings (loss) of Ashford Inc. for the years ended
December 31, 2017
,
2016
and
2015
(in thousands):
Ashford Inc.
Condensed Balance Sheets
|
December 31, 2017
|
December 31, 2016
|
||||||
|
Total assets
|
$
|
114,810
|
|
$
|
129,797
|
|
|
|
Total liabilities
|
78,742
|
|
38,168
|
|
|||
|
Redeemable noncontrolling interests
|
5,111
|
|
1,480
|
|
|||
|
Total stockholders’ equity of Ashford Inc.
|
30,185
|
|
37,377
|
|
|||
|
Noncontrolling interests in consolidated entities
|
772
|
|
52,772
|
|
|||
|
Total equity
|
30,957
|
|
90,149
|
|
|||
|
Total liabilities and equity
|
$
|
114,810
|
|
$
|
129,797
|
|
|
|
Our ownership interest in Ashford Inc.
|
$
|
437
|
|
$
|
5,873
|
|
|
Ashford Inc.
Condensed Statements of Operations
|
Year Ended December 31,
|
|||||||||||
|
2017
|
2016
|
2015
|
|||||||||
|
Total revenue
|
$
|
81,573
|
|
$
|
67,607
|
|
$
|
58,981
|
|
||
|
Total expenses
|
(92,095
|
)
|
(70,064
|
)
|
(60,332
|
)
|
|||||
|
Operating income (loss)
|
(10,522
|
)
|
(2,457
|
)
|
(1,351
|
)
|
|||||
|
Realized and unrealized gain (loss) on investment in unconsolidated entity, net
|
—
|
|
(1,460
|
)
|
(2,141
|
)
|
|||||
|
Realized and unrealized gain (loss) on investments, net
|
(91
|
)
|
(7,787
|
)
|
(7,600
|
)
|
|||||
|
Other income (expense)
|
142
|
|
81
|
|
1,114
|
|
|||||
|
Income tax benefit (expense)
|
(9,723
|
)
|
(780
|
)
|
(2,066
|
)
|
|||||
|
Net income (loss)
|
(20,194
|
)
|
(12,403
|
)
|
(12,044
|
)
|
|||||
|
(Income) loss from consolidated entities attributable to noncontrolling interests
|
358
|
|
8,860
|
|
10,852
|
|
|||||
|
Net (income) loss attributable to redeemable noncontrolling interests
|
1,484
|
|
1,147
|
|
2
|
|
|||||
|
Net income (loss) attributable to Ashford Inc.
|
$
|
(18,352
|
)
|
$
|
(2,396
|
)
|
$
|
(1,190
|
)
|
||
|
Our equity in earnings (loss) of Ashford Inc.
|
$
|
(5,437
|
)
|
$
|
(743
|
)
|
$
|
(483
|
)
|
||
AQUA U.S. Fund
In June 2015, for consideration of certain marketable securities, we obtained a
52.4%
ownership interest in the AQUA U.S. Fund. The AQUA U.S. Fund was managed by Ashford Investment Management, LLC (“AIM”), an indirect subsidiary of Ashford Inc. The AQUA U.S. Fund was consolidated by Ashford Inc. During the first quarter of 2017, we liquidated our investment in the AQUA U.S. Fund subject to a
5%
hold back of
$2.6 million
, which was received during the second quarter of 2017. Our ownership interest in the AQUA U.S. Fund was
$50.9 million
at December 31, 2016. For the years ended
December 31, 2017
,
2016
and
2015
our equity in earnings (loss) was
$52,000
,
$(5.1) million
and
$(3.4) million
, respectively.
84
ASHFORD HOSPITALITY TRUST, INC. AND SUBSIDIARIES
NOTES TO CONSOLIDATED FINANCIAL STATEMENTS (continued)
OpenKey
During the years ended December 31, 2017 and 2016, the Company made investments totaling
$1.0 million
and
$2.3 million
, respectively, in OpenKey, which is controlled and consolidated by Ashford Inc., for a
13.3%
ownership interest. Our investment is recorded as a component of “investment in unconsolidated entities” in our consolidated balance sheet and is accounted for under the equity method of accounting as we have been deemed to have significant influence over the entity under the applicable accounting guidance. As of
December 31, 2017
, our
16.2%
ownership interest had a carrying value of
$2.5 million
. For the years ended
December 31, 2017
and
2016
, our equity in loss of the unconsolidated entity was
$481,000
and
$305,000
, respectively.
Ashford Prime
In July 2015, we announced that our board of directors declared the distribution (1) to our stockholders of approximately
4.1 million
shares of common stock of Ashford Hospitality Prime, Inc. (“Ashford Prime”) to be received by us upon redemption of common units of Ashford Hospitality Prime Limited Partnership, the operating partnership of Ashford Prime (“Ashford Prime OP”) and (2) to the common unitholders of Ashford Trust OP of our remaining common units of Ashford Prime OP. The distribution occurred on July 27, 2015. As a result of the distribution, we no longer retain an interest in Ashford Prime. The previously deferred gain of
$599,000
from the sale of the Pier House Resort in March 2014 was recognized during the year ended December 31, 2015.
5. Hotel Dispositions, Assets Held for Sale and Impairment Charges
Hotel Dispositions
On June 1, 2016,
the Company sold the Noble Five Hotels, a
5
-hotel portfolio of select-service hotel properties for approximately
$142.0 million
in cash. The sale resulted in a gain of
$22.8 million
for the
year ended
December 31, 2016 and is included in “gain (loss) on acquisition of PIM Highland JV and sale of hotel properties” in the consolidated statements of operations. The portfolio is comprised of the Courtyard Edison in Edison, New Jersey; the Residence Inn Buckhead in Atlanta, Georgia; the Courtyard Lake Buena Vista, the Fairfield Inn Lake Buena Vista and the SpringHill Suites Lake Buena Vista in Orlando, Florida.
On September 1, 2016, the Company sold the Hampton Inn Gainesville for approximately
$26.5 million
in cash. The sale resulted in a gain of
$1.6 million
for the
year ended
December 31, 2016 and is included in “gain (loss) on acquisition of PIM Highland JV and sale of hotel properties” in the consolidated statements of operations.
On October 1, 2016, the Company sold the SpringHill Suites in Gaithersburg, Maryland for approximately
$13.2 million
. The consideration received from the sale was a combination of cash and approximately
2.0 million
Class B common units of the Company’s operating partnership. The Class B operating partnership units were redeemed at a price of
$5.74
per unit, or a price of
$6.05
per common share after taking into account the current conversion factor. The Company also paid off approximately
$10.4 million
of debt associated with the hotel property. The sale resulted in a loss of
$223,000
for the
year ended
December 31, 2016 and is included in “gain (loss) on acquisition of PIM Highland JV and sale of hotel properties” in the consolidated statements of operations (see impairment discussion below).
On October 7, 2016, the Company sold the Courtyard and Residence Inn in Palm Desert, California for
$36.0 million
. The consideration received from the sale was a combination of cash and assumption of approximately
$23.8 million
of mortgage debt associated with the hotel properties. The sale resulted in a gain of
$7.5 million
for the
year ended
December 31, 2017
and is included in “gain (loss) on acquisition of PIM Highland JV and sale of hotel properties” in the consolidated statements of operations.
On February 1, 2017,
the Company sold the Renaissance hotel in Portsmouth, Virginia (“Renaissance Portsmouth”) for approximately
$9.2 million
in cash. The sale resulted in a loss of
$43,000
for the
year ended
December 31, 2017
and is included in “gain (loss) on acquisition of PIM Highland JV and sale of hotel properties” in the consolidated statements of operations. The Company also repaid approximately
$20.2 million
of debt associated with the hotel property. See note 8.
On March 6, 2017, the Company sold the Embassy Suites in Syracuse, New York (“Embassy Suites Syracuse”) for approximately
$8.8 million
in cash. The sale resulted in a loss of
$40,000
for the
year ended
December 31, 2017
and is included in “gain (loss) on acquisition of PIM Highland JV and sale of hotel properties” in the consolidated statements of operations. The Company also repaid approximately
$20.6 million
of debt associated with the hotel property. See note 8.
On June 29, 2017, the Company sold the Crowne Plaza Ravinia in Atlanta, Georgia for approximately
$88.7 million
in cash. The sale resulted in a gain of
$14.1 million
for the
year ended
December 31, 2017
and is included in “gain (loss) on acquisition of PIM Highland JV and sale of hotel properties” in the consolidated statements of operations. The Company also repaid approximately
$78.7 million
of debt associated with the hotel property. See note 8.
85
ASHFORD HOSPITALITY TRUST, INC. AND SUBSIDIARIES
NOTES TO CONSOLIDATED FINANCIAL STATEMENTS (continued)
We included the results of operations for these hotel properties through the date of disposition in net income (loss) as shown in the consolidated statements of operations for the years ended
December 31, 2017
,
2016
and
2015
, respectively
.
The following table includes condensed financial information from these hotel properties (in thousands):
|
Year Ended December 31,
|
|||||||||||
|
2017
|
2016
|
2015
|
|||||||||
|
Total hotel revenue
|
$
|
12,447
|
|
$
|
77,808
|
|
$
|
100,973
|
|
||
|
Total hotel operating expenses
|
(10,064
|
)
|
(51,750
|
)
|
(65,874
|
)
|
|||||
|
Operating income (loss)
|
2,383
|
|
26,058
|
|
35,099
|
|
|||||
|
Property taxes, insurance and other
|
(616
|
)
|
(3,805
|
)
|
(5,278
|
)
|
|||||
|
Depreciation and amortization
|
(2,588
|
)
|
(11,891
|
)
|
(17,008
|
)
|
|||||
|
Impairment charges
|
—
|
|
(18,316
|
)
|
(2,817
|
)
|
|||||
|
Gain (loss) on sale of hotel properties
|
14,030
|
|
31,713
|
|
—
|
|
|||||
|
Interest expense and amortization of loan costs
|
(2,361
|
)
|
(10,456
|
)
|
(13,150
|
)
|
|||||
|
Write-off of loan costs and exit fees
|
(98
|
)
|
(5,076
|
)
|
—
|
|
|||||
|
Income (loss) before income taxes
|
10,750
|
|
8,227
|
|
(3,154
|
)
|
|||||
|
(Income) loss before income taxes attributable to redeemable noncontrolling interests in operating partnership
|
(1,668
|
)
|
(1,153
|
)
|
421
|
|
|||||
|
Income (loss) before income taxes attributable to the Company
|
$
|
9,082
|
|
$
|
7,074
|
|
$
|
(2,733
|
)
|
||
Impairment Charges and Insurance Recoveries
In August and September 2017,
twenty-four
of our hotel properties in Texas and Florida were impacted by the effects of Hurricanes Harvey and Irma. The Company holds insurance policies that provide coverage for property damage and business interruption after meeting certain deductibles at all of its hotel properties. During 2017, the Company recognized impairment charges, net of anticipated insurance recoveries of
$2.0 million
. Additionally, the Company recognized remediation and other costs, net of anticipated insurance recoveries of
$2.8 million
, included primarily in other hotel operating expenses. As of December 31, 2017, the Company has recorded an insurance receivable of
$267,000
, net of deductibles of
$4.8 million
, included in “accounts receivable, net” on our consolidated balance sheet, related to the anticipated insurance recoveries. During the year ended December 31, 2017, the Company received proceeds of
$612,000
for business interruption losses associated with lost profits, which has been recorded as “other” hotel revenue in our consolidated statement of operations, in excess of the deductible of
$366,000
. The Company will not record an insurance recovery receivable for business interruption losses associated with lost profits until the amount for such recoveries is known and the amount is realizable.
Additionally, in 2017 we recorded impairment charges of
$8.2 million
related to
two
hotel properties. The impairment charges occurred at the SpringHill Suites in Centreville, Virginia (“SpringHill Suites Centreville”) and the SpringHill Suites in Glen Allen, Virginia (“SpringHill Suites Glen Allen”) in the amounts of
$4.7 million
and
$3.5 million
, respectively. The impairment charges were based on methodologies discussed in note 2, which are considered Level 3 valuation techniques. The hotel properties are currently held for sale. See discussion below.
In 2016 we recorded impairment charges of
$18.3 million
related to
three
hotel properties. The impairment charges occurred at the SpringHill Suites Gaithersburg, Embassy Suites Syracuse and the Renaissance Portsmouth in the amounts of
$5.0 million
,
$4.1 million
and
$9.2 million
, respectively. The impairment charges were based on methodologies discussed in note 2, which are considered Level 3 valuation techniques. On October 1, 2016, the Company completed the sale of the SpringHill Suites Gaithersburg for approximately
$13.2 million
.
We recorded an impairment charge of
$19.9 million
related to
two
hotel properties in the second quarter of 2015. The impairment charges occurred at the Residence Inn in Las Vegas, Nevada and the SpringHill Suites in Gaithersburg, Maryland, in the amounts of
$17.1 million
and
$2.8 million
, respectively. The impairment charges were based on methodologies discussed in note 2, which are considered Level 3 valuation techniques. Our estimates of fair value reduced the respective carrying values of the Residence Inn in Las Vegas, Nevada and the SpringHill Suites in Gaithersburg, Maryland to
$37.5 million
and
$15.3 million
, respectively.
86
ASHFORD HOSPITALITY TRUST, INC. AND SUBSIDIARIES
NOTES TO CONSOLIDATED FINANCIAL STATEMENTS (continued)
Assets Held For Sale
At
December 31, 2017
, the SpringHill Suites Centreville and the SpringHill Suites Glen Allen were classified as held for sale in the consolidated balance sheet based on methodologies discussed in note 2. Since the sale of the hotel properties does not represent a strategic shift that has (or will have) a major effect on our operations or financial results, their results of operation were not reported as discontinued operations in the consolidated financial statements. Depreciation and amortization were ceased as of the date the assets were deemed held for sale. For the year ended December 31, 2017, total revenue of
$7.0 million
, and net loss (excluding impairment charges discussed above) of
$154,000
, are included in our consolidated statements of operations. On February 20, 2018, we completed the sale of the SpringHill Suites Glen Allen for approximately
$10.9 million
. We expect to complete the sale of the SpringHill Suites Centreville on or about May 1, 2018.
At
December 31, 2016
, the Renaissance hotel in Portsmouth, Virginia (“Renaissance Portsmouth”) and the Embassy Suites in Syracuse, New York (“Embassy Suites Syracuse”) were classified as held for sale in the consolidated balance sheet based on methodologies discussed in note 2. Since the sale of the properties does not represent a strategic shift that has (or will have) a major effect on our operations or financial results, their results of operation were not reported as discontinued operations in the consolidated financial statements. Depreciation and amortization were ceased as of the date the assets were deemed held for sale. For the year ended
December 31, 2016
, total revenue of
$18.7 million
, and net income (excluding impairment charges discussed above) of
$499,000
, are included in our consolidated statements of operations. On
February 1, 2017
, we completed the sale of the Renaissance Portsmouth for approximately
$9.2 million
. On
March 6, 2017
, we completed the sale of the Embassy Suites Syracuse for approximately
$8.8 million
.
The major classes of assets and liabilities related to the assets held for sale included in the consolidated balance sheets were as follows (in thousands):
|
December 31, 2017
|
December 31, 2016
|
||||||
|
Assets
|
|||||||
|
Investments in hotel properties, net
|
$
|
17,732
|
|
$
|
17,232
|
|
|
|
Cash and cash equivalents
|
78
|
|
976
|
|
|||
|
Restricted cash
|
402
|
|
392
|
|
|||
|
Accounts receivable
|
127
|
|
305
|
|
|||
|
Inventories
|
1
|
|
96
|
|
|||
|
Deferred costs, net
|
—
|
|
4
|
|
|||
|
Prepaid expenses
|
21
|
|
309
|
|
|||
|
Other assets
|
31
|
|
274
|
|
|||
|
Due from third-party hotel managers
|
31
|
|
—
|
|
|||
|
Assets held for sale
|
$
|
18,423
|
|
$
|
19,588
|
|
|
|
Liabilities
|
|||||||
|
Indebtedness, net
|
$
|
13,221
|
|
$
|
35,679
|
|
|
|
Accounts payable and accrued expenses
|
662
|
|
1,323
|
|
|||
|
Due to related party, net
|
94
|
|
45
|
|
|||
|
Liabilities related to assets held for sale
|
$
|
13,977
|
|
$
|
37,047
|
|
|
6. Deferred Costs, net
Deferred costs, net consist of the following (in thousands):
|
December 31,
|
|||||||
|
2017
|
2016
|
||||||
|
Deferred franchise fees
|
$
|
4,400
|
|
$
|
4,602
|
|
|
|
Accumulated amortization
|
(1,623
|
)
|
(1,752
|
)
|
|||
|
$
|
2,777
|
|
$
|
2,850
|
|
||
|
Deferred costs related to assets held for sale
|
—
|
|
4
|
|
|||
|
Deferred costs, net
|
$
|
2,777
|
|
$
|
2,846
|
|
|
87
ASHFORD HOSPITALITY TRUST, INC. AND SUBSIDIARIES
NOTES TO CONSOLIDATED FINANCIAL STATEMENTS (continued)
7. Intangible Assets, net and Intangible Liabilities, net
Intangible assets, net and intangible liabilities, net consisted of the following (in thousands):
|
Intangible Assets, net
|
Intangible Liability, net
|
||||||||||||||
|
December 31,
|
December 31,
|
||||||||||||||
|
2017
|
2016
|
2017
|
2016
|
||||||||||||
|
Cost
|
$
|
10,276
|
|
$
|
10,276
|
|
$
|
16,846
|
|
$
|
16,846
|
|
|||
|
Accumulated amortization
|
(333
|
)
|
(215
|
)
|
(1,007
|
)
|
(651
|
)
|
|||||||
|
$
|
9,943
|
|
$
|
10,061
|
|
$
|
15,839
|
|
$
|
16,195
|
|
||||
The intangible assets and intangible liabilities noted above represent the above-market rate leases (liability) and below-market rate leases (asset) that were determined based on the comparison of rent due under the ground lease contracts assumed in the acquisitions to market rates for the remaining duration of the lease contracts and are amortized over their respective ground lease terms with expiration dates ranging from 2024 to 2114. For the years ended
December 31, 2017
,
2016
and
2015
, net amortization related to intangibles was a reduction in lease expense of
$238,000
,
$156,000
and
$167,000
, respectively.
In connection with the acquisition of the permanent exclusive docking easement for riverfront land located in front of the Hyatt Savannah hotel in Savannah, Georgia we recorded an intangible asset of approximately
$797,000
. This intangible asset is not subject to amortization and has a carrying value of
$797,000
as of December 31, 2017.
Estimated future net amortization expense for intangible assets and intangible liabilities for each of the next five years is as follows (in thousands):
|
Intangible Assets
|
Intangible Liabilities
|
||||||
|
2018
|
$
|
118
|
|
$
|
356
|
|
|
|
2019
|
118
|
|
356
|
|
|||
|
2020
|
118
|
|
356
|
|
|||
|
2021
|
118
|
|
356
|
|
|||
|
2022
|
118
|
|
356
|
|
|||
|
Thereafter
|
9,353
|
|
14,059
|
|
|||
|
Total
|
$
|
9,943
|
|
$
|
15,839
|
|
|
88
ASHFORD HOSPITALITY TRUST, INC. AND SUBSIDIARIES
NOTES TO CONSOLIDATED FINANCIAL STATEMENTS (continued)
8. Indebtedness, net
Indebtedness of our continuing operations and the carrying values of related collateral were as follows at
December 31, 2017
and
2016
(in thousands):
|
December 31, 2017
|
December 31, 2016
|
|||||||||||||||||||||
|
Indebtedness
|
Collateral
|
|
Maturity
|
|
Interest Rate
|
Debt
Balance |
Book Value
of Collateral
|
Debt
Balance
|
Book Value
of Collateral
|
|||||||||||||
|
Mortgage loan
(2)
|
1 hotel
|
|
June 2017
|
|
5.98%
|
$
|
—
|
|
$
|
—
|
|
$
|
15,729
|
|
$
|
25,714
|
|
|||||
|
Mortgage loan
(3)
|
17 hotels
|
|
December 2017
|
|
LIBOR
(1)
+ 5.52%
|
—
|
|
—
|
|
412,500
|
|
302,417
|
|
|||||||||
|
Mortgage loan
(4)
|
2 hotels
|
|
January 2018
|
|
4.44%
|
—
|
|
—
|
|
105,047
|
|
228,433
|
|
|||||||||
|
Mortgage loan
(5)
|
1 hotel
|
|
January 2018
|
|
4.38%
|
—
|
|
—
|
|
96,169
|
|
195,768
|
|
|||||||||
|
Mortgage loan
(6)
|
8 hotels
|
|
January 2018
|
|
LIBOR
(1)
+ 4.95%
|
376,800
|
|
346,609
|
|
376,800
|
|
355,707
|
|
|||||||||
|
Mortgage loan
(7)
|
5 hotels
|
|
February 2018
|
|
LIBOR
(1)
+ 4.75%
|
200,000
|
|
208,338
|
|
200,000
|
|
205,111
|
|
|||||||||
|
Mortgage loan
(8)
|
1 hotel
|
|
April 2018
|
|
LIBOR
(1)
+ 4.95%
|
33,300
|
|
39,298
|
|
33,300
|
|
40,738
|
|
|||||||||
|
Mortgage loan
(9) (10) (11) (12)
|
22 hotels
|
|
April 2018
|
|
LIBOR
(1)
+ 4.39%
|
971,654
|
|
1,206,994
|
|
1,070,560
|
|
1,278,932
|
|
|||||||||
|
Mortgage loan
(13)
|
1 hotel
|
|
May 2018
|
|
LIBOR
(1)
+ 5.10%
|
25,100
|
|
32,188
|
|
25,100
|
|
33,801
|
|
|||||||||
|
Mortgage loan
(14)
|
1 hotel
|
|
June 2018
|
|
LIBOR
(1)
+ 5.10%
|
43,750
|
|
62,348
|
|
43,750
|
|
60,260
|
|
|||||||||
|
Mortgage loan
(15)
|
1 hotel
|
|
July 2018
|
|
LIBOR
(1)
+ 4.15%
|
35,200
|
|
36,220
|
|
35,200
|
|
37,375
|
|
|||||||||
|
Mortgage loan
(15)
|
1 hotel
|
|
July 2018
|
|
LIBOR
(1)
+ 5.10%
|
40,500
|
|
52,038
|
|
40,500
|
|
53,526
|
|
|||||||||
|
Mortgage loan
(15)
|
8 hotels
|
|
July 2018
|
|
LIBOR
(1)
+ 4.09%
|
144,000
|
|
174,676
|
|
144,000
|
|
178,738
|
|
|||||||||
|
Mortgage loan
(16)
|
1 hotel
|
|
August 2018
|
|
LIBOR
(1)
+ 4.95%
|
12,000
|
|
15,279
|
|
12,000
|
|
15,010
|
|
|||||||||
|
Mortgage loan
(17) (18)
|
4 hotels
|
|
August 2018
|
|
LIBOR
(1)
+ 4.38%
|
52,530
|
|
61,358
|
|
52,530
|
|
66,725
|
|
|||||||||
|
Mortgage loan
(17) (19) (20)
|
6 hotels
|
|
August 2018
|
|
LIBOR
(1)
+ 4.35%
|
280,421
|
|
162,938
|
|
301,000
|
|
185,804
|
|
|||||||||
|
Mortgage loan
(21) (22)
|
18 hotels
|
|
October 2018
|
|
LIBOR
(1)
+ 4.55%
|
450,000
|
|
442,394
|
|
450,000
|
|
457,040
|
|
|||||||||
|
Mortgage loan
|
1 hotel
|
|
July 2019
|
|
4.00%
|
5,336
|
|
8,056
|
|
5,436
|
|
8,326
|
|
|||||||||
|
Mortgage loan
(3)
|
17 hotels
|
|
November 2019
|
|
LIBOR
(1)
+ 3.00%
|
427,000
|
|
290,973
|
|
—
|
|
—
|
|
|||||||||
|
Mortgage loan
(2)
|
1 hotel
|
|
May 2020
|
|
LIBOR
(1)
+ 2.90%
|
16,100
|
|
25,654
|
|
—
|
|
—
|
|
|||||||||
|
Mortgage loan
|
1 hotel
|
|
November 2020
|
|
6.26%
|
95,207
|
|
126,462
|
|
96,873
|
|
124,654
|
|
|||||||||
|
Mortgage loan
(4)
|
2 hotels
|
|
June 2022
|
|
LIBOR
(1)
+ 3.00%
|
164,700
|
|
234,253
|
|
—
|
|
—
|
|
|||||||||
|
Mortgage loan
(5)
|
1 hotel
|
|
November 2022
|
|
LIBOR
(1)
+ 2.00%
|
97,000
|
|
196,365
|
|
—
|
|
—
|
|
|||||||||
|
Mortgage loan
|
1 hotel
|
|
May 2023
|
|
5.46%
|
53,789
|
|
81,854
|
|
54,685
|
|
84,854
|
|
|||||||||
|
Mortgage loan
|
1 hotel
|
|
January 2024
|
|
5.49%
|
7,000
|
|
9,392
|
|
7,111
|
|
10,092
|
|
|||||||||
|
Mortgage loan
|
1 hotel
|
|
January 2024
|
|
5.49%
|
10,216
|
|
17,533
|
|
10,378
|
|
15,229
|
|
|||||||||
|
Mortgage loan
|
1 hotel
|
|
May 2024
|
|
4.99%
|
6,530
|
|
7,438
|
|
6,641
|
|
7,922
|
|
|||||||||
|
Mortgage loan
|
2 hotels
|
|
August 2024
|
|
4.85%
|
12,242
|
|
11,135
|
|
12,427
|
|
8,910
|
|
|||||||||
|
Mortgage loan
|
3 hotels
|
|
August 2024
|
|
4.90%
|
24,471
|
|
15,693
|
|
24,836
|
|
16,647
|
|
|||||||||
|
Mortgage loan
|
3 hotels
|
|
August 2024
|
|
5.20%
|
66,224
|
|
51,393
|
|
67,164
|
|
51,659
|
|
|||||||||
|
Mortgage loan
|
2 hotels
|
|
February 2025
|
|
4.45%
|
20,214
|
|
10,516
|
|
20,575
|
|
10,952
|
|
|||||||||
|
Mortgage loan
|
3 hotels
|
|
February 2025
|
|
4.45%
|
52,284
|
|
72,112
|
|
53,293
|
|
69,036
|
|
|||||||||
|
3,723,568
|
|
|
3,999,507
|
|
|
$
|
3,773,604
|
|
4,129,380
|
|
||||||||||||
|
Premiums, net
|
1,570
|
|
|
|
3,523
|
|
|
|||||||||||||||
|
Deferred loan costs, net
|
(15,617
|
)
|
(17,889
|
)
|
||||||||||||||||||
|
$
|
3,709,521
|
|
|
$
|
3,759,238
|
|
||||||||||||||||
|
Indebtedness related to assets held for sale
(11)
|
1 hotel
|
April 2017
|
LIBOR
(1)
+ 4.39%
|
—
|
|
|
|
16,080
|
|
|
||||||||||||
|
Indebtedness related to assets held for sale
(20)
|
1 hotel
|
August 2017
|
LIBOR
(1)
+ 4.35%
|
—
|
|
19,599
|
|
|||||||||||||||
|
Indebtedness related to assets held for sale
(18)
|
1 hotel
|
August 2018
|
LIBOR
(1)
+ 4.38%
|
5,992
|
|
—
|
|
|||||||||||||||
|
Indebtedness related to assets held for sale
(22)
|
1 hotel
|
October 2018
|
LIBOR
(1)
+ 4.55%
|
7,229
|
|
—
|
|
|||||||||||||||
|
Indebtedness, net
|
$
|
3,696,300
|
|
|
$
|
3,723,559
|
|
|||||||||||||||
____________________________________
89
ASHFORD HOSPITALITY TRUST, INC. AND SUBSIDIARIES
NOTES TO CONSOLIDATED FINANCIAL STATEMENTS (continued)
|
(1)
|
LIBOR rates were
1.564%
and
0.772%
at
December 31, 2017
and December 31,
2016
, respectively.
|
|
(2)
|
On May 24, 2017, we refinanced this mortgage loan totaling
$15.7 million
set to mature in June 2017 with a new
$16.1 million
mortgage loan with a
three
-year initial term and
two
one
-year extension options subject to the satisfaction of certain conditions. Through May 2019, the new mortgage loan is interest only and bears interest at a rate of LIBOR +
2.90%
. Beginning on June 1, 2019, monthly principal payments based on a
thirty
-year amortization and a
6.00%
interest rate are due.
|
|
(3)
|
On October 31, 2017, we refinanced this mortgage loan totaling
$412.5 million
set to mature in December 2017 with a new
$427.0 million
mortgage loan with a
two
-year initial term and
five
one
-year extension options subject to the satisfaction of certain conditions. The new mortgage loan is interest only and bears interest at a rate of LIBOR +
3.00%
.
|
|
(4)
|
On May 10, 2017, we refinanced this mortgage loan totaling
$104.3 million
set to mature in January 2018 with a new
$181.0 million
mortgage loan, of which our initial advance was
$164.7 million
. The new mortgage loan is interest only and bears interest at a rate of LIBOR +
3.00%
. Beginning on July 1, 2020, quarterly principal payments of
$750,000
are due.
|
|
(5)
|
On October 30, 2017, we refinanced this mortgage loan totaling
$94.7 million
set to mature in January 2018 with a new
$97.0 million
mortgage loan with a
five
-year term. The new mortgage loan is interest only and bears interest at a rate of LIBOR +
2.00%
.
|
|
(6)
|
On January 17, 2018, we refinanced this mortgage loan with a new
$395.0 million
mortgage loan with a
two
-year initial term and
five
one
-year extension options, subject to the satisfaction of certain conditions. The mortgage loan is interest only and bears interest at a rate of LIBOR +
2.92%
.
|
|
(7)
|
This mortgage loan has
three
one
-year extension options, subject to satisfaction of certain conditions and a LIBOR floor of
0.20%
. The second
one
-year extension period began in February 2017.
|
|
(8)
|
This mortgage loan has
three
one
-year extension options, subject to satisfaction of certain conditions. The first
one
-year extension period began in April 2017.
|
|
(9)
|
This mortgage loan has
four
one
-year extension options subject to satisfaction of certain conditions. The first
one
-year extension period began in April 2017.
|
|
(10)
|
This mortgage loan had a
$20.2 million
pay down of principal related to the Renaissance Portsmouth that was sold on February 1, 2017.
|
|
(11)
|
A portion of this mortgage loan at December 31, 2016 relates to the Renaissance Portsmouth that was sold on February 1, 2017. See note 5.
|
|
(12)
|
This mortgage loan had a
$78.7 million
pay down of principal related to the Crowne Plaza Ravinia that was sold on June 29, 2017. See note 5.
|
|
(13)
|
This mortgage loan has
three
one
-year extension options, subject to satisfaction of certain conditions. The first
one
-year extension period began in May 2017.
|
|
(14)
|
This mortgage loan has
three
one
-year extension options, subject to satisfaction of certain conditions. The first
one
-year extension period began in June 2017.
|
|
(15)
|
This mortgage loan has
three
one
-year extension options, subject to satisfaction of certain conditions. The first
one
-year extension period began in July 2017.
|
|
(16)
|
This mortgage loan has
two
one
-year extension options subject to satisfaction of certain conditions.
|
|
(17)
|
This mortgage loan has
three
one
-year extension options, subject to satisfaction of certain conditions. The second
one
-year extension period began in August 2017.
|
|
(18)
|
A portion of this mortgage loan at December 31, 2017 relates to the SpringHill Suites Centerville. See note 5.
|
|
(19)
|
This mortgage loan had a
$20.6 million
pay down of principal related to the Embassy Suites Syracuse that was sold on March 6, 2017. See note 5.
|
|
(20)
|
A portion of this mortgage loan at December 31, 2016 relates to the Embassy Suites Syracuse that was sold on March 6, 2017. See note 5.
|
|
(21)
|
This mortgage loan has
four
one
-year extension options subject to satisfaction of certain conditions.
|
|
(22)
|
A portion of this mortgage loan at December 31, 2017 relates to the SpringHill Suites Glen Allen. See note 5.
|
On February 1, 2017, we repaid
$20.2 million
of principal on our mortgage loan partially secured by the Renaissance Portsmouth. This hotel property was sold on February 1, 2017. See note 5.
On March 6, 2017, we repaid
$20.6 million
of principal on our mortgage loan partially secured by the Embassy Suites Syracuse. This hotel property was sold on March 6, 2017. See note 5.
On May 10, 2017, we refinanced a
$105.0 million
mortgage loan, secured by the Renaissance Nashville in Nashville, Tennessee and the Westin in Princeton, New Jersey. The new mortgage loan totals
$181.0 million
, of which our initial advance was
$164.7 million
with future advances totaling
$16.3 million
as reimbursement for capital expenditures. The mortgage loan is interest only and provides for a floating interest rate of LIBOR +
3.00%
. Beginning on July 1, 2020, quarterly principal payments of
$750,000
are due.
The stated maturity is June 2022, with
no
extension options.
On May 24, 2017, we refinanced a
$15.7 million
mortgage loan, secured by the Hotel Indigo Atlanta. The new mortgage loan totals
$16.1 million
. The mortgage loan is interest only and provides for a floating interest rate of LIBOR +
2.90%
for the first two years with a
30
-year amortization schedule based on a
6%
interest rate starting in the third year. The stated maturity is May 2020, with
two
one
-year extension options.
On June 29, 2017, we repaid
$78.7 million
of principal on our mortgage loan partially secured by the Crowne Plaza Ravinia. This hotel property was sold on June 29, 2017.
On October 30, 2017, we refinanced our
$94.7 million
mortgage loan, with an outstanding balance of
$94.5 million
, secured by the Hilton Boston Back Bay. The new mortgage loan totals
$97.0 million
. The mortgage loan is non-recourse interest only and provides for a floating interest rate of LIBOR +
2.00%
. The stated maturity is November 2022, with
no
extension options.
On October 31, 2017, we refinanced a
$412.5 million
mortgage loan, secured by
seventeen
hotels. The new mortgage loan totals
$427.0 million
. The mortgage loan is interest only and provides for a floating interest rate of LIBOR +
3.00%
. The stated
90
ASHFORD HOSPITALITY TRUST, INC. AND SUBSIDIARIES
NOTES TO CONSOLIDATED FINANCIAL STATEMENTS (continued)
maturity is November 2019, with
five
one
-year extension options. The new mortgage loan is secured by the following
seventeen
hotels: the Courtyard Alpharetta, Courtyard Bloomington, Courtyard Crystal City, Courtyard Foothill Ranch, Embassy Suites Austin, Embassy Suites Dallas, Embassy Suites Houston, Embassy Suites Las Vegas, Embassy Suites Palm Beach, Hampton Inn Evansville, Hilton Garden Inn Jacksonville, Hilton Nassau Bay, Hilton St. Petersburg, Residence Inn Evansville, Residence Inn Falls Church, Residence Inn San Diego and Sheraton Indianapolis.
On September 30, 2016, we repaid
$10.4 million
of principal on our mortgage loan partially secured by the SpringHill Suites Gaithersburg. This hotel property was sold on October 1, 2016. See note 5.
On October 7, 2016, we refinanced
four
mortgage loans with existing outstanding balances totaling approximately
$415.1 million
with a new loan totaling
$450.0 million
. The mortgage loans were refinanced through
one
new mortgage loan with a
two
-year initial term and
four
one
-year extension options, subject to the satisfaction of certain conditions. The mortgage loan is interest only, provides for a floating interest rate of LIBOR +
4.55%
, and contains flexible release provisions for the potential sale of assets. The mortgage loan is secured by
eighteen
hotel properties: Courtyard Basking Ridge, Courtyard Newark, Courtyard Oakland, Courtyard Plano, Courtyard Scottsdale, Residence Inn Newark, Residence Inn Phoenix, Residence Inn Plano, SpringHill Suites Glen Allen, SpringHill Suites Manhattan Beach, SpringHill Suites Plymouth Meeting, TownePlace Suites Manhattan Beach, Embassy Suites Flagstaff, Marriott Bridgewater, Marriott Raleigh Durham, Marriott Suites Dallas, Sheraton Bucks County, and Marriott Fremont.
During the years ended
December 31, 2017
,
2016
, and
2015
we recognized premium amortization of
$2.0 million
,
$2.1 million
and
$1.4 million
respectively. The amortization of the premium is computed using a method that approximates the effective interest method, which is included in interest expense and amortization of premiums and loan costs in the consolidated statements of operations.
We are required to maintain certain financial ratios under various debt and related agreements. If we violate covenants in any debt or related agreement, we could be required to repay all or a portion of our indebtedness before maturity at a time when we might be unable to arrange financing for such repayment on attractive terms, if at all. The assets of certain of our subsidiaries are pledged under non-recourse indebtedness and are not available to satisfy the debts and other obligations of Ashford Trust or Ashford Trust OP, our operating partnership, and the liabilities of such subsidiaries do not constitute the obligations of Ashford Trust or Ashford Trust OP. As of
December 31, 2017
, we were in compliance in all material respects with all covenants or other requirements set forth in our debt and related agreements as amended.
Maturities and scheduled amortizations of indebtedness as of
December 31, 2017
for each of the five following years and thereafter are as follows (in thousands):
|
2018
|
$
|
2,671,185
|
|
|
2019
|
438,723
|
|
|
|
2020
|
113,703
|
|
|
|
2021
|
7,953
|
|
|
|
2022
|
262,410
|
|
|
|
Thereafter
|
229,594
|
|
|
|
Total
|
$
|
3,723,568
|
|
9. Derivative Instruments and Hedging
Interest Rate Derivatives
—We are exposed to risks arising from our business operations, economic conditions and financial markets. To manage these risks, we primarily use interest rate derivatives to hedge our debt and our cash flows. The interest rate derivatives currently include interest rate caps and interest rate floors. These derivatives are subject to master netting settlement arrangements. To mitigate the nonperformance risk, we routinely use a third party’s analysis of the creditworthiness of the counterparties, which supports our belief that the counterparties’ nonperformance risk is limited. All derivatives are recorded at fair value.
During the year ended
December 31, 2017
, we entered into interest rate caps with notional amounts totaling
$2.5 billion
and strike rates ranging from
1.50%
to
5.84%
. These interest rate caps had effective dates from
February 2017
to
October 2017
, maturity dates from
February 2018
to
November 2019
, and a total cost of
$871,000
. We also entered into interest rate floors with notional amounts of
$10.8 billion
and strike rates ranging from
1.00%
to
1.50%
. These interest rate floors had effective dates from
September
91
ASHFORD HOSPITALITY TRUST, INC. AND SUBSIDIARIES
NOTES TO CONSOLIDATED FINANCIAL STATEMENTS (continued)
2017
to
December 2017
and termination dates from
March 2019
to
June 2019
and a total cost of
$388,000
. These instruments were not designated as cash flow hedges.
During the year ended December 31, 2016, we entered into interest rate caps with notional amounts totaling
$1.5 billion
and strike rates ranging from
2.00%
to
4.50%
. These interest rate caps had effective dates from
February 2016
to
January 2017
, maturity dates from
February 2017
to
October 2018
, and a total cost of
$199,000
. We also entered into interest rate floors with notional amounts totaling
$10.0 billion
and strike rates ranging from
(0.25)%
to
1.0%
. These interest rate floors had effective dates from
April 2015
to
July 2015
, maturity dates from
April 2020
to
July 2020
, and a total cost of
$9.8 million
. These instruments were not designated as cash flow hedges.
As of
December 31, 2017
, we held interest rate caps with notional amounts totaling
$3.4 billion
and strike rates ranging from
1.50%
to
5.84%
. These instruments had maturity dates ranging from
January 2018
to
November 2019
. These instruments cap the interest rates on our mortgage loans with principal balances of
$3.4 billion
and maturity dates from
January 2018
to
November 2022
. As of
December 31, 2017
, we held interest rate floors with notional amounts totaling
$16.8 billion
and strike rates ranging from
(0.25)%
to
1.50%
. These instruments had termination dates ranging from
March 2019
to
July 2020
.
Credit Default Swap Derivatives
—We use credit default swaps, tied to the CMBX index, to hedge financial and capital market risk. A credit default swap is a derivative contract that functions like an insurance policy against the credit risk of an entity or obligation. The seller of protection assumes the credit risk of the reference obligation from the buyer (us) of protection in exchange for annual premium payments. If a default or a loss, as defined in the credit default swap agreements, occurs on the underlying bonds, then the buyer of protection is protected against those losses. The only liability for us, the buyer, is the annual premium and any change in value of the underlying CMBX index (if the trade is terminated prior to maturity). For all CMBX trades completed to date, we were the buyer of protection. Credit default swaps are subject to master-netting settlement arrangements and credit support annexes. As of
December 31, 2017
, we held credit default swaps with notional amounts totaling
$212.5 million
. These credit default swaps had effective dates from February 2015 to August 2017 and expected maturity dates from October 2023 to October 2026. Assuming the underlying bonds pay off at par over their remaining average life, our total exposure for these trades was approximately
$7.7 million
as of
December 31, 2017
. Cash collateral is posted by us as well as our counterparties. We offset the fair value of the derivative and the obligation/right to return/reclaim cash collateral. The change in market value of credit default swaps is settled net through posting cash collateral or reclaiming cash collateral between us and our counterparties when the change in market value is over
$250,000
.
Futures Contracts
—During the year ended December 31, 2016, we purchased an option on Eurodollar futures for a total cost of
$250,000
, and maturity date of
June 2017
. There were
no
purchases during the year ended December 31, 2017.
10. Fair Value Measurements
Fair Value Hierarchy
—For disclosure purposes, financial instruments, whether measured at fair value on a recurring or nonrecurring basis or not measured at fair value, are classified in a hierarchy consisting of three levels based on the observability of valuation inputs in the market place as discussed below:
|
•
|
Level 1: Fair value measurements that are quoted prices (unadjusted) in active markets that we have the ability to access for identical assets or liabilities. Market price data generally is obtained from exchange or dealer markets.
|
|
•
|
Level 2: Fair value measurements based on inputs other than quoted prices included in Level 1 that are observable for the asset or liability, either directly or indirectly. Level 2 inputs include quoted prices for similar assets and liabilities in active markets and inputs other than quoted prices that are observable for the asset or liability, such as interest rates and yield curves that are observable at commonly quoted intervals.
|
|
•
|
Level 3: Fair value measurements based on valuation techniques that use significant inputs that are unobservable. The circumstances for using these measurements include those in which there is little, if any, market activity for the asset or liability.
|
Fair values of interest rate swaps are determined using the market standard methodology of netting the discounted future fixed cash receipts/payments and the discounted expected variable cash payments/receipts. Fair values of interest rate caps, floors, flooridors, and corridors are determined using the market standard methodology of discounting the future expected cash receipts that would occur if variable interest rates fell below the strike rates of the floors or rise above the strike rates of the caps. Variable interest rates used in the calculation of projected receipts and payments on the swaps, caps, and floors are based on an expectation of future interest rates derived from observable market interest rate curves (LIBOR forward curves) and volatilities (Level 2 inputs). We also incorporate credit valuation adjustments (Level 3 inputs) to appropriately reflect both our own nonperformance risk and the respective counterparty’s nonperformance risk.
92
ASHFORD HOSPITALITY TRUST, INC. AND SUBSIDIARIES
NOTES TO CONSOLIDATED FINANCIAL STATEMENTS (continued)
Fair values of credit default swaps are obtained from a third party who publishes various information including the index composition and price data (Level 2 inputs). The fair value of credit default swaps does not contain credit-risk-related adjustments as the change in fair value is settled net through posting cash collateral or reclaiming cash collateral between us and our counterparty.
Fair values of interest rate floors are calculated using a third-party discounted cash flow model based on future cash flows that are expected to be received over the remaining life of the floor. These expected future cash flows are probability-weighted projections based on the contract terms, accounting for both the magnitude and likelihood of potential payments, which are both computed using the appropriate LIBOR forward curve and market implied volatilities as of the valuation date (Level 2 inputs).
Fair value of options on futures contracts is determined based on the last reported settlement price as of the measurement date (Level 1 inputs). These exchange-traded options are centrally cleared, and a clearinghouse stands in between all trades to ensure that the obligations involved in the trades are satisfied.
Fair values of marketable securities and liabilities associated with marketable securities, including public equity securities, equity put and call options, and other investments, are based on their quoted market closing prices (Level 1 inputs).
When a majority of the inputs used to value our derivatives fall within Level 2 of the fair value hierarchy, the derivative valuations in their entirety are classified in Level 2 of the fair value hierarchy. However, when valuation adjustments associated with our derivatives utilize Level 3 inputs, such as estimates of current credit spreads to evaluate the likelihood of default by us and our counterparties, which we consider significant (
10%
or more) to the overall valuation of our derivatives, the derivative valuations in their entirety are classified in Level 3 of the fair value hierarchy. Transfers of inputs between levels are determined at the end of each reporting period. In determining the fair values of our derivatives at
December 31, 2017
, the
LIBOR
interest rate forward curve (Level 2 inputs) assumed an uptrend from
1.56%
to
2.18%
for the remaining term of our derivatives. Credit spreads (Level 3 inputs) used in determining the fair values of hedge and non-hedge designated derivatives assumed an uptrend in nonperformance risk for us and all of our counterparties through the maturity dates.
93
ASHFORD HOSPITALITY TRUST, INC. AND SUBSIDIARIES
NOTES TO CONSOLIDATED FINANCIAL STATEMENTS (continued)
Assets and Liabilities Measured at Fair Value on a Recurring Basis
The following table presents our assets and liabilities measured at fair value on a recurring basis aggregated by the level within which measurements fall in the fair value hierarchy (in thousands):
|
Quoted Market Prices (Level 1)
|
Significant Other Observable Inputs (Level 2)
|
Significant Unobservable Inputs (Level 3)
|
Counter-party and Cash Collateral Netting
(1)
|
Total
|
||||||||||||||||
|
December 31, 2017:
|
||||||||||||||||||||
|
Assets
|
||||||||||||||||||||
|
Derivative assets:
|
||||||||||||||||||||
|
Interest rate derivatives – floors
|
$
|
—
|
|
$
|
311
|
|
$
|
—
|
|
$
|
32
|
|
$
|
343
|
|
(2)
|
||||
|
Interest rate derivatives – caps
|
—
|
|
137
|
|
—
|
|
—
|
|
137
|
|
(2)
|
|||||||||
|
Credit default swaps
|
—
|
|
(469
|
)
|
—
|
|
1,999
|
|
1,530
|
|
(2)
|
|||||||||
|
—
|
|
(21
|
)
|
—
|
|
2,031
|
|
2,010
|
|
|||||||||||
|
Non-derivative assets:
|
||||||||||||||||||||
|
Equity securities
|
26,926
|
|
—
|
|
—
|
|
—
|
|
26,926
|
|
(3)
|
|||||||||
|
Total
|
$
|
26,926
|
|
$
|
(21
|
)
|
$
|
—
|
|
$
|
2,031
|
|
$
|
28,936
|
|
|||||
|
December 31, 2016:
|
||||||||||||||||||||
|
Assets
|
||||||||||||||||||||
|
Derivative assets:
|
||||||||||||||||||||
|
Interest rate derivatives – floors
|
$
|
—
|
|
$
|
2,358
|
|
$
|
—
|
|
$
|
—
|
|
$
|
2,358
|
|
(2)
|
||||
|
Interest rate derivatives – caps
|
—
|
|
24
|
|
—
|
|
—
|
|
24
|
|
(2)
|
|||||||||
|
Credit default swaps
|
—
|
|
2,867
|
|
—
|
|
(1,751
|
)
|
1,116
|
|
(2)
|
|||||||||
|
Options on futures contracts
|
116
|
|
—
|
|
—
|
|
—
|
|
116
|
|
(2)
|
|||||||||
|
116
|
|
5,249
|
|
—
|
|
(1,751
|
)
|
3,614
|
|
|||||||||||
|
Non-derivative assets:
|
||||||||||||||||||||
|
Equity securities
|
53,185
|
|
—
|
|
—
|
|
—
|
|
53,185
|
|
(3)
|
|||||||||
|
Total
|
$
|
53,301
|
|
$
|
5,249
|
|
$
|
—
|
|
$
|
(1,751
|
)
|
$
|
56,799
|
|
|||||
_________________________
|
(1)
|
Represents net cash collateral posted between us and our counterparties.
|
|
(2)
|
Reported net as “derivative assets, net” in the consolidated balance sheets.
|
|
(3)
|
Reported as “marketable securities” in the consolidated balance sheets.
|
94
ASHFORD HOSPITALITY TRUST, INC. AND SUBSIDIARIES
NOTES TO CONSOLIDATED FINANCIAL STATEMENTS (continued)
Effect of Fair Value Measured Assets and Liabilities on Consolidated Statements of Operations
The following table summarizes the effect of fair value measured assets and liabilities on the consolidated statement of operations (in thousands):
|
Gain or (Loss)
Recognized in Income
|
||||||||||||
|
Year Ended December 31,
|
||||||||||||
|
2017
|
2016
|
2015
|
||||||||||
|
Assets
|
||||||||||||
|
Derivative assets:
|
||||||||||||
|
Interest rate derivatives - floors
|
$
|
(2,435
|
)
|
$
|
611
|
|
$
|
(7,603
|
)
|
|||
|
Interest rate derivatives - caps
|
(758
|
)
|
(535
|
)
|
(2,038
|
)
|
||||||
|
Credit default swaps
|
(4,201
|
)
|
(4)
|
(5,843
|
)
|
(4)
|
171
|
|
(4)
|
|||
|
Options on futures contracts
|
(116
|
)
|
(348
|
)
|
(391
|
)
|
||||||
|
Equity put options
|
—
|
|
—
|
|
26
|
|
||||||
|
Equity call options
|
—
|
|
—
|
|
(1,717
|
)
|
||||||
|
Non-derivative assets:
|
||||||||||||
|
Equity - American Depositary Receipt
|
—
|
|
—
|
|
(150
|
)
|
||||||
|
Equity
|
(3,678
|
)
|
4,946
|
|
1,072
|
|
||||||
|
U.S. Treasury
|
—
|
|
—
|
|
314
|
|
||||||
|
Total
|
(11,188
|
)
|
(1,169
|
)
|
(10,316
|
)
|
||||||
|
Liabilities
|
||||||||||||
|
Derivative liabilities:
|
||||||||||||
|
Credit default swaps
|
—
|
|
—
|
|
—
|
|
||||||
|
Short-equity put options
|
—
|
|
—
|
|
1,002
|
|
||||||
|
Short-equity call options
|
—
|
|
|
—
|
|
1,470
|
|
|||||
|
Non-derivative liabilities:
|
||||||||||||
|
Short-equity securities
|
—
|
|
—
|
|
78
|
|
||||||
|
Total
|
—
|
|
—
|
|
2,550
|
|
||||||
|
Net
|
$
|
(11,188
|
)
|
$
|
(1,169
|
)
|
$
|
(7,766
|
)
|
|||
|
Total combined
|
||||||||||||
|
Interest rate derivatives - floors
|
$
|
(2,435
|
)
|
$
|
611
|
|
$
|
(7,603
|
)
|
|||
|
Interest rate derivatives - caps
|
(758
|
)
|
(535
|
)
|
(2,038
|
)
|
||||||
|
Credit default swaps
|
(36
|
)
|
(2,574
|
)
|
2,630
|
|
||||||
|
Options on futures contracts
|
427
|
|
(36
|
)
|
(391
|
)
|
||||||
|
Total derivatives
|
(2,802
|
)
|
(1)
|
(2,534
|
)
|
(1)
|
(7,402
|
)
|
(1)
|
|||
|
Realized gain (loss) on credit default swaps
|
(4,165
|
)
|
(2) (4)
|
(3,269
|
)
|
(2) (4)
|
(2,459
|
)
|
(2) (4)
|
|||
|
Realized gain (loss) on options on futures contracts
|
(543
|
)
|
(2)
|
(312
|
)
|
—
|
|
|||||
|
Unrealized gain (loss) on marketable securities
|
(4,649
|
)
|
(3)
|
4,946
|
|
(3)
|
127
|
|
(3)
|
|||
|
Realized gain (loss) on marketable securities
|
971
|
|
(2)
|
—
|
|
(2)
|
1,968
|
|
(2)
|
|||
|
Net
|
$
|
(11,188
|
)
|
$
|
(1,169
|
)
|
$
|
(7,766
|
)
|
|||
_________________________
|
(1)
|
Reported as “unrealized gain (loss) on derivatives” in the consolidated statements of operations.
|
|
(2)
|
Included in “other income (expense)” in the consolidated statements of operations.
|
|
(3)
|
Reported as “unrealized gain (loss) on marketable securities” in the consolidated statements of operations.
|
|
(4)
|
Excludes costs of
$1,036
,
$873
and
$486
in
2017
,
2016
and
2015
, respectively, included in “other income (expense)” associated with credit default swaps.
|
95
ASHFORD HOSPITALITY TRUST, INC. AND SUBSIDIARIES
NOTES TO CONSOLIDATED FINANCIAL STATEMENTS (continued)
11. Summary of Fair Value of Financial Instruments
Determining estimated fair values of our financial instruments such as notes receivable and indebtedness requires considerable judgment to interpret market data. Market assumptions and/or estimation methodologies used may have a material effect on estimated fair value amounts. Accordingly, estimates presented are not necessarily indicative of amounts at which these instruments could be purchased, sold, or settled. Carrying amounts and estimated fair values of financial instruments, for periods indicated, were as follows (in thousands):
|
December 31, 2017
|
December 31, 2016
|
||||||||||||||
|
Carrying
Value
|
Estimated
Fair Value
|
Carrying
Value
|
Estimated
Fair Value
|
||||||||||||
|
Financial assets and liabilities measured at fair value:
|
|||||||||||||||
|
Derivative assets, net
|
$
|
2,010
|
|
$
|
2,010
|
|
$
|
3,614
|
|
$
|
3,614
|
|
|||
|
Marketable securities
|
26,926
|
|
26,926
|
|
53,185
|
|
53,185
|
|
|||||||
|
Financial assets not measured at fair value:
|
|||||||||||||||
|
Cash and cash equivalents
(1)
|
$
|
354,883
|
|
$
|
354,883
|
|
$
|
348,067
|
|
$
|
348,067
|
|
|||
|
Restricted cash
(1)
|
117,189
|
|
117,189
|
|
144,406
|
|
144,406
|
|
|||||||
|
Accounts receivable, net
(1)
|
44,384
|
|
44,384
|
|
44,934
|
|
44,934
|
|
|||||||
|
Due from third-party hotel managers
(1)
|
17,418
|
|
17,418
|
|
13,348
|
|
13,348
|
|
|||||||
|
Financial liabilities not measured at fair value:
|
|||||||||||||||
|
Indebtedness
(1)
|
$
|
3,725,138
|
|
$3,559,993 to $3,934,727
|
|
$
|
3,777,127
|
|
$3,600,691 to $3,979,713
|
|
|||||
|
Accounts payable and accrued expenses
(1)
|
133,063
|
|
133,063
|
|
128,309
|
|
128,309
|
|
|||||||
|
Dividends and distributions payable
|
25,045
|
|
25,045
|
|
24,765
|
|
24,765
|
|
|||||||
|
Due to Ashford Inc., net
|
15,146
|
|
15,146
|
|
15,716
|
|
15,716
|
|
|||||||
|
Due to Ashford Prime OP, net
|
—
|
|
—
|
|
488
|
|
488
|
|
|||||||
|
Due to related party, net
(1)
|
1,161
|
|
1,161
|
|
1,046
|
|
1,046
|
|
|||||||
|
Due to third-party hotel managers
|
2,431
|
|
2,431
|
|
2,714
|
|
2,714
|
|
|||||||
_________________________
(1)
Includes balances associated with assets held for sale and liabilities associated with assets held for sale as of December 31, 2017 and/or 2016. See note 5.
Cash, cash equivalents, and restricted cash
. These financial assets bear interest at market rates and have original maturities of less than
90
days. The carrying value approximates fair value due to their short-term nature. This is considered a Level 1 valuation technique.
Accounts receivable, net, accounts payable and accrued expenses, dividends payable, due to Ashford Prime OP, due to related party, net, due to Ashford Inc. and due to/from third-party hotel managers.
The carrying values of these financial instruments approximate their fair values due to their short-term nature. This is considered a Level 1 valuation technique.
Marketable securities.
Marketable securities consist of U.S. treasury bills, publicly traded equity securities, and put and call options on certain publicly traded equity securities. The fair value of these investments is based on quoted market closing prices at the balance sheet date. See notes 2 and 10 for a complete description of the methodology and assumptions utilized in determining the fair values.
Indebtedness.
Fair value of indebtedness is determined using future cash flows discounted at current replacement rates for these instruments. Cash flows are determined using a forward interest rate yield curve. Current replacement rates are determined by using the U.S. Treasury yield curve or the index to which these financial instruments are tied and adjusted for credit spreads. Credit spreads take into consideration general market conditions, maturity, and collateral. We estimated the fair value of total indebtedness to be approximately
95.6%
to
105.6%
of the carrying value of
$3.7 billion
at
December 31, 2017
and approximately
95.3%
to
105.4%
of the carrying value of
$3.8 billion
at
December 31, 2016
. This is considered a Level 2 valuation technique.
Derivative assets, net and derivative liabilities, net.
Fair value of interest rate derivatives is determined using the net present value of the expected cash flows of each derivative based on the market-based interest rate curve and adjusted for credit spreads of us and our counterparties. Fair values of credit default swap derivatives are obtained from a third party who publishes the CMBX index composition and price data. Fair values of interest rate floors are calculated using a third-party discounted cash flow model
96
ASHFORD HOSPITALITY TRUST, INC. AND SUBSIDIARIES
NOTES TO CONSOLIDATED FINANCIAL STATEMENTS (continued)
based on future cash flows that are expected to be received over the remaining life of the floor. Fair values of options on futures contracts are valued at their last reported settlement price as of the measurement date. See notes 2, 9 and 10 for a complete description of the methodology and assumptions utilized in determining fair values.
12. Commitments and Contingencies
Restricted Cash
—Under certain management and debt agreements for our hotel properties existing at
December 31, 2017
, escrow payments are required for insurance, real estate taxes and debt service. In addition, for certain properties based on the terms of the underlying debt and management agreements, we escrow
4%
to
6%
of gross revenues for capital improvements.
Franchise Fees
—Under franchise agreements for our hotel properties existing at
December 31, 2017
, we pay franchisor royalty fees between
1%
and
6%
of gross rooms revenue and, in some cases, food and beverage revenues. Additionally, we pay fees for marketing, reservations, and other related activities aggregating between
1%
and
4%
of gross rooms revenue and, in some cases, food and beverage revenues. These franchise agreements expire on varying dates between
2018
and
2047
. When a franchise term expires, the franchisor has no obligation to renew the franchise. A franchise termination could have a material adverse effect on the operations or the underlying value of the affected hotel due to loss of associated name recognition, marketing support, and centralized reservation systems provided by the franchisor. A franchise termination could also have a material adverse effect on cash available for distribution to stockholders. In addition, if we breach the franchise agreement and the franchisor terminates a franchise prior to its expiration date, we may be liable for up to three times the average annual fees incurred for that property.
Our continuing operations incurred franchise fees of
$69.3 million
,
$70.5 million
and
$62.8 million
, respectively, for the years ended
December 31, 2017
,
2016
and
2015
, which are included in “other” hotel expenses.
Management Fees
—Under management agreements for our hotel properties existing at
December 31, 2017
, we pay a) monthly property management fees equal to the greater of approximately
$13,000
(increased annually based on consumer price index adjustments) or
3%
of gross revenues, or in some cases
2%
to
7%
of gross revenues, as well as annual incentive management fees, if applicable, b) market service fees on approved capital improvements, including project management fees of up to
4%
of project costs, for certain hotels, and c) other general fees at current market rates as approved by our independent directors, if required. These management agreements expire from
2020
through
2038
, with renewal options. If we terminate a management agreement prior to its expiration, we may be liable for estimated management fees through the remaining term and liquidated damages or, in certain circumstances, we may substitute a new management agreement.
Leases
—We lease land and facilities under non-cancelable operating leases, which expire between
2040
and
2114
, including
four
ground leases related to our hotel properties. Several of these leases are subject to base rent plus contingent rent based on the related property’s financial results and escalation clauses. For the years ended
December 31, 2017
,
2016
and
2015
, our continuing operations recognized rent expense of
$4.3 million
,
$5.3 million
and
$3.8 million
, respectively, which included contingent rent of
$1.1 million
,
$1.7 million
and
$1.3 million
, respectively. Rent expense related to continuing operations is included in “other” hotel expenses in the consolidated statements of operations.
Future minimum rentals due under non-cancelable leases are as follows for each of the five following years and thereafter are as follows (in thousands):
|
2018
|
$
|
2,529
|
|
|
2019
|
2,377
|
|
|
|
2020
|
2,296
|
|
|
|
2021
|
2,248
|
|
|
|
2022
|
2,092
|
|
|
|
Thereafter
|
112,184
|
|
|
|
Total
|
$
|
123,726
|
|
At
December 31, 2017
, we had capital commitments of
$44.4 million
relating to general capital improvements that are expected to be paid in the next
twelve months
.
Litigation
—
Palm Beach Florida Hotel and Office Building Limited Partnership, et al. v. Nantucket Enterprises, Inc.
This litigation involves a landlord tenant dispute from 2008 in which the landlord, Palm Beach Florida Hotel and Office Building Limited Partnership, a subsidiary of the Company, claimed that the tenant had violated various lease provisions of the lease agreement and was therefore in default. The tenant counterclaimed and asserted multiple claims including that it had been wrongfully
97
ASHFORD HOSPITALITY TRUST, INC. AND SUBSIDIARIES
NOTES TO CONSOLIDATED FINANCIAL STATEMENTS (continued)
evicted. The litigation was instituted by the plaintiff in November 2008 in the Circuit Court of the Fifteenth Judicial Circuit, in and for Palm Beach County, Florida and proceeded to a jury trial on June 30, 2014. The jury entered its verdict awarding the tenant total claims of
$10.8 million
and ruling against the landlord on its claim of breach of contract. In 2016, the Court of Appeals reduced the original
$10.8 million
judgment to
$8.8 million
and added pre-judgment interest on the wrongful eviction judgment. The case was further appealed to the Florida Supreme Court. On May 23, 2017, the trial court issued an order compelling the company that issued the supersedeas bond, RLI Insurance Company (“RLI”), to pay approximately
$10.0 million
. On June 1, 2017, RLI paid Nantucket this amount and sought reimbursement from the Company. On June 27, 2017, the Florida Supreme Court denied the Company's petition for review. As a result, all of the appeals were exhausted and the judgment was final with the determination and reimbursement of attorney's fees being the only remaining dispute. On June 29, 2017, the balance of the judgment was paid to Nantucket by the Company. The amount of potential legal fees that could be owed cannot be predicted with any certainty.
The Company estimates its total loss including post judgment interest and reimbursement of the plaintiff’s legal fees to be approximately
$17.3 million
as of December 31, 2017, resulting in additional expense of
$4.1 million
for the year ended December 31, 2017.
On June 29, 2017, RLI filed suit in Federal District Court in Dallas seeking to recover the amounts previously paid to Nantucket. On July 19, 2017, the Company paid approximately
$10.0 million
to RLI mooting RLI's claim subject only to the alleged claim for attorney fees. The Company paid the negotiated settlement of RLI's attorney fees in the amount of
$100,000
, on November 2, 2017, and a Stipulation for Dismissal was filed concluding the litigation.
We are engaged in other various legal proceedings which have arisen but have not been fully adjudicated. The likelihood of loss from these legal proceedings, based on definitions within contingency accounting literature, ranges from remote to reasonably possible and to probable. Based on estimates of the range of potential losses associated with these matters, management does not believe the ultimate resolution of these proceedings, either individually or in the aggregate, will have a material adverse effect on our consolidated financial position or results of operations. However, the final results of legal proceedings cannot be predicted with certainty and if we fail to prevail in one or more of these legal matters, and the associated realized losses exceed our current estimates of the range of potential losses, our consolidated financial position or results of operations could be materially adversely affected in future periods.
Income Taxes
—We and our subsidiaries file income tax returns in the federal jurisdiction and various states. Tax years 2013 through 2017 remain subject to potential examination by certain federal and state taxing authorities.
Potential Pension Liabilities
—Upon our 2006 acquisition of a hotel property, certain employees of such hotel were unionized and covered by a multi-employer defined benefit pension plan. At that time,
no
unfunded pension liabilities existed. Subsequent to our acquisition, a majority of employees, who are employees of the hotel manager, Remington Lodging, petitioned the employer to withdraw recognition of the union. As a result of the decertification petition, Remington Lodging withdrew recognition of the union. At the time of the withdrawal, the National Retirement Fund, the union’s pension fund, indicated unfunded pension liabilities existed. The National Labor Relations Board (“NLRB”) filed a complaint against Remington Lodging seeking, among other things, that Remington Lodging’s withdrawal of recognition was unlawful. Pending the final determination of the NLRB complaint, including appeals, the pension fund entered into a settlement agreement with Remington Lodging on November 1, 2011, providing that (a) Remington Lodging will continue to make monthly pension fund payments pursuant to the collective bargaining agreement, and (b) if the withdrawal of recognition is ultimately deemed lawful, Remington Lodging will have an unfunded pension liability equal to
$1.7 million
, minus the monthly pension payments made by Remington Lodging since the settlement agreement. To illustrate, if Remington Lodging - as of the date a final determination occurs - has made monthly pension payments equaling
$100,000
, Remington Lodging’s remaining withdrawal liability shall be the unfunded pension liability of
$1.7 million
, minus
$100,000
(or
$1.6 million
). This remaining unfunded pension liability shall be paid to the pension fund in annual installments of
$84,000
(but may be made monthly or quarterly, at Remington Lodging’s election), which shall continue for the remainder of the
twenty
-(
20
)-year capped period, unless Remington Lodging elects to pay the unfunded pension liability amount earlier. We agreed to indemnify Remington Lodging for the payment of the unfunded pension liability, if any, as set forth in the settlement agreement.
13. Redeemable Noncontrolling Interests in Operating Partnership
Redeemable noncontrolling interests in the operating partnership represents the limited partners’ proportionate share of equity in earnings/losses of the operating partnership, which is an allocation of net income/loss attributable to the common unit holders based on the weighted average ownership percentage of these limited partners’ common units of limited partnership interest in the operating partnership (“common units”) and the units issued under our Long-Term Incentive Plan (the “LTIP units”) that are vested throughout the period plus distributions paid to the limited partners with regard to the Class B common units. Class B common units had a fixed dividend rate of
7.2%
and had priority in payment of cash dividends over common units but otherwise had no
98
ASHFORD HOSPITALITY TRUST, INC. AND SUBSIDIARIES
NOTES TO CONSOLIDATED FINANCIAL STATEMENTS (continued)
preference over common units. During the fourth quarter of 2016, the Class B common units were converted, at the Company’s election, to common units. Beginning
one year
after issuance, each common unit may be redeemed for either cash or, at our sole discretion, up to
one
share of our REIT common stock, which is either (i) issued pursuant to an effective registration statement, (ii) included in an effective registration statement providing for the resale of such common stock or (iii) issued subject to a registration rights agreement. As a result of the Ashford Inc. spin-off, holders of our common stock were distributed one share of Ashford Inc. common stock for every
87
shares of our common stock, while our unitholders received one common unit of the operating limited liability company subsidiary of Ashford Inc. for each common unit of our operating partnership the holder held, and such holder then had the opportunity to exchange up to
99%
of those units for shares of Ashford Inc. common stock at the rate of one share of Ashford Inc. common stock for every
55
common units of the operating limited liability company subsidiary of Ashford Inc. Following the spin-off, Ashford Hospitality Trust, Inc. continues to hold
598,000
shares of Ashford Inc. common stock, and all of our remaining lodging investments are owned by Ashford Trust OP. Therefore, each common unit and LTIP unit was worth a fractional amount of one share of our common stock. On December 13, 2017, Ashford Hospitality Trust, Inc. completed a capital contribution of
598,000
shares of Ashford Inc. common stock to Ashford Trust OP which in turn contributed two-thirds of the shares, in the amount of one-third each to two TRS entities. As a result the number of outstanding OP units was reduced to approximately
92%
of the prior outstanding common units returning the ratio of common stock to common units to 1 to 1. Each common unit was worth approximately
94%
of one share of our common stock at December 31, 2016.
LTIP units, which are issued to certain executives and employees of Ashford LLC as compensation, have vesting periods ranging from
three
to
five
years. Additionally, certain independent members of the board of directors have elected to receive LTIP units as part of their compensation, which are fully vested upon grant. Upon reaching economic parity with common units, each vested LTIP unit can be converted by the holder into
one
common unit which can then be redeemed for cash or, at our election, settled in our common stock. An LTIP unit will achieve parity with the common units upon the sale or deemed sale of all or substantially all of the assets of the operating partnership at a time when our stock is trading at a level in excess of the price it was trading on the date of the LTIP issuance. More specifically, LTIP units will achieve full economic parity with common units in connection with (i) the actual sale of all or substantially all of the assets of the operating partnership or (ii) the hypothetical sale of such assets, which results from a capital account revaluation, as defined in the partnership agreement, for the operating partnership.
The compensation committee of the board of directors of the Company approved Performance LTIP units to certain executive officers. The award agreements provide for the grant of a target number of performance-based LTIP units that will be settled in common units of Ashford Trust OP, if and when the applicable vesting criteria have been achieved following the end of the performance and service period. The target number of performance-based LTIP units may be adjusted from
0%
to
200%
of the target number based on achievement of specified absolute and relative total stockholder returns based on the formulas determined by the Company’s Compensation Committee on the grant date. As of December 31, 2017, there are approximately
1.8 million
performance-based LTIP units, representing
200%
of the target, outstanding. The performance criteria for the Performance LTIP units are based on market conditions under the relevant literature, and the Performance LTIP units were granted to non-employees. The Performance LTIP units unamortized fair value of
$4.4 million
at
December 31, 2017
will be expensed over a period of
2.2
years, subject to future mark to market adjustments. Compensation expense of
$1.8 million
and
$1.2 million
was recorded for the years ended
December 31, 2017
and
2016
, respectively.
As of
December 31, 2017
, we have issued a total of
11.9 million
LTIP and Performance LTIP units, all of which, other than approximately
609,000
units issued in
March 2015
, have reached full economic parity with, and are convertible into, common units. Expense of
$3.3 million
,
$2.8 million
, and
$1.4 million
was recognized for the years ended
December 31, 2017
,
2016
and
2015
, respectively, which was associated with LTIP units issued to Ashford LLC’s employees and Ashford Trust’s directors and is included in “advisory services fee” and “corporate, general and administrative,” respectively, in our consolidated statements of operations. As the LTIP units are issued to non-employees, the compensation expense was determined based on the share price as of the end of the period. The fair value of the unrecognized cost of LTIP units, which was
$4.3 million
at
December 31, 2017
, will be expensed over a period of
2.3
years.
During the
year ended
December 31, 2017
,
21,000
common units with an aggregate fair value of
$161,000
, were redeemed by the holders and, at our election, we issued shares of our common stock to satisfy the redemption price.
During the
year ended
December 31, 2016,
224,000
common units with an aggregate fair value of
$1.6 million
were redeemed by the holder and, at our election, we issued shares of our common stock to satisfy the redemption price. Also during 2016, as discussed in note 5,
2.0 million
Class B common units were redeemed as part of the sale of the SpringHill Suites Gaithersburg. The Class B units had a fair value of
11.7 million
as of the date of conversion.
During the
year ended
December 31, 2015,
152,000
common units with an aggregate fair value of
$1.5 million
were redeemed by the holder and, at our election, we issued shares of our common stock to satisfy the redemption price.
99
ASHFORD HOSPITALITY TRUST, INC. AND SUBSIDIARIES
NOTES TO CONSOLIDATED FINANCIAL STATEMENTS (continued)
Redeemable noncontrolling interests in our operating partnership as of
December 31, 2017
and
2016
were
$116.1 million
and
$132.8 million
, which represented ownership of our operating partnership of
15.52%
and
14.48%
respectively. The carrying value of redeemable noncontrolling interests as of
December 31, 2017
and
2016
included adjustments of
$154.3 million
and
$144.3 million
, respectively, to reflect the excess of redemption value over the accumulated historical costs. Redeemable noncontrolling interests were allocated net loss of
$21.6 million
, net loss of
$12.5 million
and net income of
$35.5 million
for the years ended
December 31, 2017
,
2016
and
2015
, respectively. We declared aggregate cash distributions to holders of common units and holders of LTIP units of
$10.0 million
,
$11.0 million
and
$10.9 million
for the years ended
December 31, 2017
,
2016
and
2015
respectively.
A summary of the activity of the units in our operating partnership is as follow (in thousands):
|
Year Ended December 31,
|
||||||||
|
2017
|
2016
|
2015
|
||||||
|
Outstanding at beginning of year
|
19,443
|
|
20,388
|
|
19,836
|
|
||
|
LTIP units issued
|
701
|
|
515
|
|
704
|
|
||
|
Performance LTIP units issued
|
1,179
|
|
803
|
|
—
|
|
||
|
Common units converted for sale of hotel property
|
—
|
|
(2,039
|
)
|
—
|
|
||
|
Common units converted to common shares
|
(21
|
)
|
(224
|
)
|
(152
|
)
|
||
|
Conversion factor adjustment
|
(1,700
|
)
|
—
|
|
—
|
|
||
|
Outstanding at end of year
|
19,602
|
|
19,443
|
|
20,388
|
|
||
|
Common units convertible/redeemable at end of year
|
18,993
|
|
17,531
|
|
16,918
|
|
||
14. Equity
Equity Offering
—On January 29, 2015, we commenced a follow-on public offering of
9.5 million
shares of common stock. The offering priced on January 30, 2015, at
$10.65
per share for gross proceeds of
$101.2 million
. We granted the underwriters a 30-day option to purchase up to an additional
1.425 million
shares of common stock. On February 10, 2015, the underwriters partially exercised their option and purchased an additional
1.03 million
shares of our common stock at a price of
$10.65
per share. The net proceeds from the offering after underwriting discount and offering expenses were approximately
$110.9 million
.
Common Stock Repurchases
—For the years ended
December 31, 2017
,
2016
and
2015
,
no
shares of our common stock have been repurchased under the share repurchase program.
In addition, we acquired
203,299
shares,
124,463
shares and
52,661
shares of our common stock in
2017
,
2016
and
2015
, respectively, to satisfy employees’ statutory minimum federal income tax obligations in connection with vesting of equity grants issued under our stock-based compensation plan.
Preferred Stock
—In accordance with Ashford Trust’s charter, we are authorized to issue
50 million
shares of preferred stock, which currently includes Series D cumulative preferred stock, Series E cumulative preferred stock, Series F cumulative preferred stock, Series G cumulative preferred stock, Series H cumulative preferred stock and Series I cumulative preferred stock.
8.55%
Series A Cumulative Preferred Stock.
At December 31, 2016, there were
1.7 million
shares of Series A cumulative preferred stock outstanding. Series A cumulative preferred stock had no maturity date and we were not required to redeem these shares at any time. Series A cumulative preferred stock was redeemable at our option for cash, in whole or from time to time in part, at a redemption price of
$25.00
per share plus accrued and unpaid dividends, if any, at the redemption date. On September 18, 2017, the Company redeemed its Series A cumulative preferred stock at a redemption price of
$25.00
per share, plus accrued and unpaid dividends through the redemption date, in an amount equal to
$0.4631
per share, for a total redemption price of
$25.4631
per share.
8.45%
Series D Cumulative Preferred Stock.
At
December 31, 2017
and
2016
, there were
2.4 million
and
9.5 million
shares, respectively of Series D cumulative preferred stock outstanding. Series D cumulative preferred stock has no maturity date, and we are not required to redeem the shares at any time. Series D cumulative preferred stock is redeemable at our option for cash, in whole or from time to time in part, at a redemption price of
$25.00
per share plus accrued and unpaid dividends, if any, at the redemption date. Series D cumulative preferred stock quarterly dividends are set at the rate of
8.45%
per annum of the
$25.00
liquidation preference (equivalent to an annual dividend rate of
$2.1125
per share). The dividend rate increases to
9.45%
per annum if these shares are no longer traded on a major stock exchange. In general,
Series D cumulative preferred stock holders have no voting rights
. On September 18, 2017, the Company redeemed approximately
1.6 million
shares of its Series D cumulative preferred
100
ASHFORD HOSPITALITY TRUST, INC. AND SUBSIDIARIES
NOTES TO CONSOLIDATED FINANCIAL STATEMENTS (continued)
stock at a redemption price of
$25.00
per share, plus accrued and unpaid dividends through the redemption date, in an amount equal to
$0.4577
per share, for a total redemption price of
$25.4577
per share. On October 4, 2017, the Company redeemed
379,036
shares of Series D cumulative preferred shares at a redemption price of
$25.00
per share, plus accrued and unpaid dividends through the redemption date, in an amount equal to
$0.5516
per share, for a total redemption price of
$25.5516
per share. On December 8, 2017, the Company redeemed approximately
5.1 million
shares of its Series D cumulative preferred stock at a redemption price of
$25.00
per share, plus accrued and unpaid dividends through the redemption date, in an amount equal to
$0.3990
per share, for a total redemption price of
$25.3990
per share.
7.375%
Series F Cumulative Preferred Stock.
On July 15, 2016, the Company issued
4.8 million
shares of
7.375%
Series F cumulative preferred stock. The Series F cumulative preferred stock ranks senior to all classes or series of the Company’s common stock and future junior securities, on a parity with each series of the Company’s outstanding preferred stock (the Series A cumulative preferred stock, Series D cumulative preferred stock, Series G cumulative preferred stock (noted below), Series H cumulative preferred stock (noted below) and Series I cumulative preferred stock (noted below)) and with any future parity securities and junior to future senior securities and to all of the Company’s existing and future indebtedness, with respect to the payment of dividends and the distribution of amounts upon liquidation, dissolution or winding up of the Company’s affairs. Series F cumulative preferred stock has no maturity date, and we are not required to redeem the shares at any time. Series F cumulative preferred stock is redeemable at our option for cash (on or after July 15, 2021), in whole or from time to time in part, at a redemption price of
$25.00
per share plus accrued and unpaid dividends, if any, at the redemption date. Series F cumulative preferred stock may be converted into shares of our common stock, at the option of the holder, in certain limited circumstances such as a change of control. Each share of Series F cumulative preferred stock is convertible into a maximum
9.68992
shares of our common stock. The actual number is based on a formula as defined in the Series F cumulative preferred stock agreement (unless the Company exercises its right to redeem the Series F cumulative preferred shares for cash, for a limited period upon a change in control). The necessary conditions to convert the Series F cumulative preferred stock to common stock have not been met as of period end. Therefore, Series F cumulative preferred stock will not impact our earnings per share calculations. Series F cumulative preferred stock quarterly dividends are set at the rate of
7.375%
of the
$25.00
liquidation preference (equivalent to an annual dividend rate of
$1.8438
per share). In general, Series F cumulative preferred stock holders have no voting rights.
7.375%
Series G Cumulative Preferred Stock.
On October 18, 2016, the Company issued
6.0 million
shares of
7.375%
Series G cumulative preferred stock. On October 17, 2016, the underwriters exercised the over-allotment option to purchase an additional
200,000
shares of the Series G cumulative preferred stock. The
6.2 million
of Series G cumulative preferred stock ranks senior to all classes or series of the Company’s common stock and future junior securities, on a parity with each series of the Company’s outstanding preferred stock (the Series A cumulative preferred stock (all shares redeemed on September 18, 2017), Series D cumulative preferred stock (
7.1 million
shares redeemed in 2017), Series F cumulative preferred stock, Series H cumulative preferred stock (noted below) and Series I cumulative preferred stock (noted below)) and with any future parity securities and junior to future senior securities and to all of the Company’s existing and future indebtedness, with respect to the payment of dividends and the distribution of amounts upon liquidation, dissolution or winding up of the Company’s affairs. Series G cumulative preferred stock has no maturity date, and we are not required to redeem the shares at any time. Series G cumulative preferred stock is redeemable at our option for cash (on or after October 18, 2021), in whole or from time to time in part, at a redemption price of
$25.00
per share plus accrued and unpaid dividends, if any, at the redemption date. Series G cumulative preferred stock may be converted into shares of our common stock, at the option of the holder, in certain limited circumstances such as a change of control. Each share of Series G cumulative preferred stock is convertible into a maximum
8.33333
shares of our common stock. The actual number is based on a formula as defined in the Series G cumulative preferred stock agreement (unless the Company exercises its right to redeem the Series G cumulative preferred shares for cash, for a limited period upon a change in control). The necessary conditions to convert the Series G cumulative preferred stock to common stock have not been met as of period end. Therefore, Series G cumulative preferred stock will not impact our earnings per share calculations. Series G cumulative preferred stock quarterly dividends are set at the rate of
7.375%
of the
$25.00
liquidation preference (equivalent to an annual dividend rate of
$1.8438
per share). In general, Series G cumulative preferred stock holders have no voting rights.
7.50%
Series H Cumulative Preferred Stock.
On August 25, 2017, the Company issued
3.4 million
shares of
7.50%
Series H cumulative preferred stock. The Series H cumulative preferred stock ranks senior to all classes or series of the Company’s common stock and future junior securities, on a parity with each series of the Company’s outstanding preferred stock (the Series A cumulative preferred stock (all shares redeemed on September 18, 2017), Series D cumulative preferred stock (
7.1 million
shares redeemed in 2017), Series F cumulative preferred stock, Series G cumulative preferred stock and Series I cumulative preferred stock (discussed below)) and with any future parity securities and junior to future senior securities and to all of the Company’s existing and future indebtedness, with respect to the payment of dividends and the distribution of amounts upon liquidation, dissolution or winding up of the Company’s affairs. On September 8, 2017, we issued
400,000
additional shares of
7.50%
Series H cumulative preferred stock pursuant to the over-allotment option. Series H cumulative preferred stock has no maturity date, and we are not required to redeem the shares at any time. Series H cumulative preferred stock is redeemable at our option for cash (on or after August 25,
101
ASHFORD HOSPITALITY TRUST, INC. AND SUBSIDIARIES
NOTES TO CONSOLIDATED FINANCIAL STATEMENTS (continued)
2022), in whole or from time to time in part, at a redemption price of
$25.00
per share plus accrued and unpaid dividends, if any, at the redemption date. Series H cumulative preferred stock may be converted into shares of our common stock, at the option of the holder, in certain limited circumstances such as a change of control. Each share of Series H cumulative preferred stock is convertible into a maximum
8.25083
shares of our common stock. The actual number is based on a formula as defined in the Series H cumulative preferred stock agreement (unless the Company exercises its right to redeem the Series H cumulative preferred shares for cash, for a limited period upon a change in control). The necessary conditions to convert the Series H cumulative preferred stock to common stock have not been met as of period end. Therefore, Series H cumulative preferred stock will not impact our earnings per share.
Dividends on the Series H cumulative preferred stock accrue in the amount of
$1.8750
per share each year, which is equivalent to
7.50%
of the
$25.00
liquidation preference per share of Series H cumulative preferred stock. Dividends on the Series H cumulative preferred stock are payable quarterly in arrears on the 15th day of January, April, July and October of each year (or, if not on a business day, on the next succeeding business day). The first dividend on the Series H cumulative preferred stock was paid on October 16, 2017 in the amount of
$0.1875
per share.
7.50%
Series I Cumulative Preferred Stock.
On November 17, 2017, the Company issued
5.4 million
shares of
7.50%
Series I cumulative preferred stock. The Series I cumulative preferred stock ranks senior to all classes or series of the Company’s common stock and future junior securities, on a parity with each series of the Company’s outstanding preferred stock (the Series D cumulative preferred stock (
7.1 million
shares redeemed in 2017), Series F cumulative preferred stock, Series G cumulative preferred stock and Series H cumulative preferred stock) and with any future parity securities and junior to future senior securities and to all of the Company’s existing and future indebtedness, with respect to the payment of dividends and the distribution of amounts upon liquidation, dissolution or winding up of the Company’s affairs. Series I cumulative preferred stock has no maturity date, and we are not required to redeem the shares at any time. Series I cumulative preferred stock is redeemable at our option for cash (on or after November 17, 2022), in whole or from time to time in part, at a redemption price of
$25.00
per share plus accrued and unpaid dividends, if any, at the redemption date. Series I cumulative preferred stock may be converted into shares of our common stock, at the option of the holder, in certain limited circumstances such as a change of control. Each share of Series I cumulative preferred stock is convertible into a maximum
8.06452
shares of our common stock. The actual number is based on a formula as defined in the Series I cumulative preferred stock agreement (unless the Company exercises its right to redeem the Series I cumulative preferred shares for cash, for a limited period upon a change in control). The necessary conditions to convert the Series I cumulative preferred stock to common stock have not been met as of period end. Therefore, Series I cumulative preferred stock will not impact our earnings per share.
Dividends on the Series I cumulative preferred stock accrue in the amount of
$1.8750
per share each year, which is equivalent to
7.50%
of the
$25.00
liquidation preference per share of Series I cumulative preferred stock. Dividends on the Series I cumulative preferred stock are payable quarterly in arrears on the 15th day of January, April, July and October of each year (or, if not on a business day, on the next succeeding business day). The first dividend on the Series I cumulative preferred stock sold in this offering was paid on January 16, 2018 in the amount of
$0.2292
per share.
Dividends
—A summary of dividends declared is as follows (in thousands):
|
Year Ended December 31,
|
|||||||||||
|
2017
|
2016
|
2015
|
|||||||||
|
Common stock
|
$
|
47,104
|
|
$
|
46,292
|
|
$
|
47,190
|
|
||
|
Preferred stocks:
|
|||||||||||
|
Series A cumulative preferred stock
|
2,539
|
|
3,542
|
|
3,542
|
|
|||||
|
Series D cumulative preferred stock
|
18,211
|
|
20,002
|
|
20,002
|
|
|||||
|
Series E cumulative preferred stock
|
—
|
|
6,280
|
|
10,418
|
|
|||||
|
Series F cumulative preferred stock
|
8,849
|
|
4,130
|
|
—
|
|
|||||
|
Series G cumulative preferred stock
|
11,430
|
|
2,318
|
|
—
|
|
|||||
|
Series H cumulative preferred stock
|
2,494
|
|
—
|
|
—
|
|
|||||
|
Series I cumulative preferred stock
|
1,238
|
|
—
|
|
—
|
|
|||||
|
Total dividends declared
|
$
|
91,865
|
|
$
|
82,564
|
|
$
|
81,152
|
|
||
102
ASHFORD HOSPITALITY TRUST, INC. AND SUBSIDIARIES
NOTES TO CONSOLIDATED FINANCIAL STATEMENTS (continued)
Noncontrolling Interests in Consolidated Entities
—Our noncontrolling entity partner had an ownership interest of
15%
in
two
hotel properties and a total carrying value of
$646,000
and
$756,000
at
December 31, 2017
and
2016
, respectively. Our ownership interest is reported in equity in the consolidated balance sheets. Noncontrolling interests in consolidated entities were allocated losses of
$110,000
,
$14,000
and
$30,000
for the years ended
December 31, 2017
,
2016
and
2015
, respectively.
15. Stock-Based Compensation
Under the Amended and Restated 2011 Stock Incentive Plan approved by stockholders, we are authorized to grant
17.3 million
restricted stock units and performance stock units of our common stock as incentive stock awards. At
December 31, 2017
,
4.0 million
shares were available for future issuance under the Amended and Restated 2011 Stock Incentive Plan.
Restricted Stock Units
—Stock-based compensation expense of
$5.4 million
,
$4.5 million
and
$1.9 million
was recognized for the years ended
December 31, 2017
,
2016
and
2015
in connection with equity awards granted to employees of Ashford LLC and certain employees of Remington Lodging and is included in “advisory services fee” and “management fees,” respectively, in our consolidated statements of operations. Additionally,
$90,000
,
$247,000
and
$180,000
of stock-based compensation expense was recognized for the years ended
December 31, 2017
,
2016
and
2015
, respectively, in connection with common stock issued to Ashford Trust’s directors, which vested immediately, and is included in “corporate general and administrative” expense on our consolidated statements of operations. At
December 31, 2017
, the unamortized cost of the unvested shares of restricted stock was
$8.7 million
which will be amortized over a period of
2.3
years, subject to future mark to market adjustments, and had vesting schedules between February
2018
and March
2021
.
A summary of our restricted stock unit activity is as follows (shares in thousands):
|
Year Ended December 31,
|
||||||||||||||||||||
|
2017
|
2016
|
2015
|
||||||||||||||||||
|
Restricted Shares
|
Weighted Average Price at Grant
|
Restricted Shares
|
Weighted Average Price at Grant
|
Restricted Shares
|
Weighted Average Price at Grant
|
|||||||||||||||
|
Outstanding at beginning of year
|
1,627
|
|
$
|
8.30
|
|
1,459
|
|
$
|
10.21
|
|
595
|
|
$
|
10.92
|
|
|||||
|
Restricted shares granted
|
1,272
|
|
6.46
|
|
862
|
|
6.26
|
|
1,183
|
|
9.93
|
|
||||||||
|
Restricted shares vested
|
(759
|
)
|
8.82
|
|
(647
|
)
|
9.92
|
|
(299
|
)
|
10.53
|
|
||||||||
|
Restricted shares forfeited
|
(55
|
)
|
6.73
|
|
(47
|
)
|
7.95
|
|
(20
|
)
|
10.13
|
|
||||||||
|
Outstanding at end of year
|
2,085
|
|
7.03
|
|
1,627
|
|
8.30
|
|
1,459
|
|
10.21
|
|
||||||||
Performance Stock Units
—The compensation committee of the board of directors of the Company approved PSUs to certain executive officers, which have a
three
year cliff vesting. The award agreements provide for the grant of a target number of PSUs that will be settled in shares of common stock of the Company, if and when the applicable vesting criteria have been achieved following the end of the performance and service period. The target number of PSUs may be adjusted from
0%
to
200%
based on achievement of specified absolute and relative total stockholder returns based on the formulas determined by the Company’s Compensation Committee on the grant date. The performance criteria for the PSUs are based on market conditions under the relevant literature, and the PSUs were granted to non-employees. Compensation expense of
$1.7 million
and
$982,000
was recorded for the years ended
December 31, 2017
and
2016
, respectively. The fair value of the unrecognized cost of PSUs, which was
$4.0 million
at
December 31, 2017
, will be expensed over a period of approximately
2.2
years.
A summary of our PSU activity is as follows (shares in thousands):
|
Year Ended December 31,
|
|||||||||||||
|
2017
|
2016
|
||||||||||||
|
PSUs
|
Weighted Average Price at Grant
|
PSUs
|
Weighted Average Price at Grant
|
||||||||||
|
Outstanding at beginning of year
|
336
|
|
$
|
6.38
|
|
—
|
|
$
|
—
|
|
|||
|
PSUs granted
|
484
|
|
5.85
|
|
336
|
|
6.38
|
|
|||||
|
Outstanding at end of year
|
820
|
|
6.07
|
|
336
|
|
6.38
|
|
|||||
103
ASHFORD HOSPITALITY TRUST, INC. AND SUBSIDIARIES
NOTES TO CONSOLIDATED FINANCIAL STATEMENTS (continued)
16. Income Taxes
For federal income tax purposes, we elected to be treated as a REIT under the Internal Revenue Code. To qualify as a REIT, we must meet certain organizational and operational stipulations, including a requirement that we distribute at least
90%
of our REIT taxable income, excluding net capital gains, to our stockholders. We currently intend to adhere to these requirements and maintain our REIT status. If we fail to qualify as a REIT in any taxable year, we will be subject to federal income taxes at regular corporate rates (including any applicable alternative minimum tax) and may not qualify as a REIT for
four
subsequent taxable years. Even if we qualify for taxation as a REIT, we may be subject to certain state and local taxes as well as to federal income and excise taxes on our undistributed taxable income.
At
December 31, 2017
, all of our
120
hotel properties were leased or owned by Ashford TRS (our taxable REIT subsidiaries). Ashford TRS recognized net book income of
$4.2 million
,
$13.6 million
and
$23.4 million
for the years ended
December 31, 2017
,
2016
and
2015
, respectively.
The following table reconciles the income tax expense at statutory rates to the actual income tax (expense) benefit recorded (in thousands):
|
Year Ended December 31,
|
|||||||||||
|
2017
|
2016
|
2015
|
|||||||||
|
Income tax (expense) benefit at federal statutory income tax rate of 35%
|
$
|
(1,478
|
)
|
$
|
(4,764
|
)
|
$
|
(8,205
|
)
|
||
|
State income tax (expense) benefit, net of federal income tax benefit
|
160
|
|
(742
|
)
|
(827
|
)
|
|||||
|
Permanent differences
|
(338
|
)
|
(798
|
)
|
(388
|
)
|
|||||
|
Revaluation of deferred tax assets and liabilities related to the 2017 Tax Act
(1)
|
(5,242
|
)
|
—
|
|
—
|
|
|||||
|
Provision to return adjustment entirely offset by change in valuation allowance
|
957
|
|
—
|
|
—
|
|
|||||
|
Gross receipts and margin taxes
|
(913
|
)
|
(692
|
)
|
(886
|
)
|
|||||
|
Interest and penalties
|
(49
|
)
|
(7
|
)
|
(14
|
)
|
|||||
|
Valuation allowance
|
9,121
|
|
5,471
|
|
5,610
|
|
|||||
|
Total income tax (expense) benefit
|
$
|
2,218
|
|
$
|
(1,532
|
)
|
$
|
(4,710
|
)
|
||
________
(1)
Partially offset within change in valuation allowance.
The components of income tax (expense) benefit from continuing operations are as follows (in thousands):
|
Year Ended December 31,
|
|||||||||||
|
2017
|
2016
|
2015
|
|||||||||
|
Current:
|
|||||||||||
|
Federal
|
$
|
5,264
|
|
$
|
(605
|
)
|
$
|
(3,377
|
)
|
||
|
State
|
(722
|
)
|
(1,229
|
)
|
(1,225
|
)
|
|||||
|
Total current
|
4,542
|
|
(1,834
|
)
|
(4,602
|
)
|
|||||
|
Deferred:
|
|||||||||||
|
Federal
|
(2,192
|
)
|
278
|
|
(30
|
)
|
|||||
|
State
|
(132
|
)
|
24
|
|
(78
|
)
|
|||||
|
Total deferred
|
(2,324
|
)
|
302
|
|
(108
|
)
|
|||||
|
Total income tax (expense) benefit
|
$
|
2,218
|
|
$
|
(1,532
|
)
|
$
|
(4,710
|
)
|
||
For the years ended
December 31, 2017
,
2016
and
2015
income tax expense includes interest and penalties paid to taxing authorities of
$49,000
,
$7,000
and
$14,000
, respectively. At
December 31, 2017
and
2016
, we determined that there were
no
amounts to accrue for interest and penalties due to taxing authorities.
104
ASHFORD HOSPITALITY TRUST, INC. AND SUBSIDIARIES
NOTES TO CONSOLIDATED FINANCIAL STATEMENTS (continued)
At
December 31, 2017
and
2016
, our deferred tax asset (liability) and related valuation allowance consisted of the following (in thousands):
|
December 31,
|
|||||||
|
2017
|
2016
|
||||||
|
Allowance for doubtful accounts
|
$
|
168
|
|
$
|
260
|
|
|
|
Unearned income
|
1,926
|
|
2,764
|
|
|||
|
Unfavorable management contract liability
|
—
|
|
516
|
|
|||
|
Federal and state net operating losses
|
4,153
|
|
10,841
|
|
|||
|
Accrued expenses
|
1,693
|
|
2,582
|
|
|||
|
Prepaid expenses
|
(4,666
|
)
|
(4,591
|
)
|
|||
|
Alternative minimum tax credit
|
—
|
|
2,005
|
|
|||
|
Tax property basis less than book basis
|
(846
|
)
|
(1,379
|
)
|
|||
|
Tax derivatives basis greater than book basis
|
2,034
|
|
2,851
|
|
|||
|
Other
|
623
|
|
681
|
|
|||
|
Deferred tax asset (liability)
|
5,085
|
|
16,530
|
|
|||
|
Valuation allowance
|
(6,232
|
)
|
(15,353
|
)
|
|||
|
Net deferred tax asset (liability)
|
$
|
(1,147
|
)
|
$
|
1,177
|
|
|
At
December 31, 2017
, Ashford TRS had net operating loss carryforwards for federal income tax purposes of
$17.4 million
, which begin to expire in 2029, and are available to offset future taxable income, if any, through 2034. Approximately
$10.1 million
of the
$17.4 million
of net operating loss carryforwards is attributable to acquired subsidiaries and subject to substantial limitation on their use. At
December 31, 2017
, Ashford Hospitality Trust, Inc., our REIT, had net operating loss carryforwards for federal income tax purposes of
$425.0 million
, which begin to expire in 2023, and are available to offset future taxable income, if any, through 2035.
At
December 31, 2017
and
2016
, we maintained a valuation allowance of
$6.2 million
and
$15.4 million
, respectively. At
December 31, 2017
and
2016
, we fully reserved the deferred tax assets of several of our TRS’s as we believe it is more likely than not that these deferred tax assets will not be realized. We considered all available evidence, both positive and negative. We concluded that the objectively verifiable negative evidence of a history of consolidated losses and the limitations imposed by the Internal Revenue Code on the utilization of net operating losses of acquired subsidiaries outweigh the positive evidence. We believe this treatment is appropriate considering the nature of the intercompany transactions and leases between the REIT and its subsidiaries and that the current level of taxable income at the TRS is primarily attributable by our current transfer pricing arrangements. The transfer pricing arrangements are updated upon the expiration and renewal of the intercompany leases starting in 2017 and 2018. The intercompany rents are determined in accordance with the arms' length transfer pricing standard, taking into account the cost of ownership to the REIT among other factors. We do not recognize deferred tax assets and a valuation allowance for the REIT since the REIT distributes its taxable income as dividends to stockholders, and in turn, the stockholders incur income taxes on those dividends.
The following table summarizes the changes in the valuation allowance (in thousands):
|
Year Ended December 31,
|
|||||||||||
|
2017
|
2016
|
2015
|
|||||||||
|
Balance at beginning of year
|
$
|
15,353
|
|
$
|
20,670
|
|
$
|
29,335
|
|
||
|
Additions
|
2,053
|
|
2,169
|
|
4,774
|
|
|||||
|
Deductions
|
(11,174
|
)
|
(7,486
|
)
|
(13,439
|
)
|
|||||
|
Balance at end of year
|
$
|
6,232
|
|
$
|
15,353
|
|
$
|
20,670
|
|
||
105
ASHFORD HOSPITALITY TRUST, INC. AND SUBSIDIARIES
NOTES TO CONSOLIDATED FINANCIAL STATEMENTS (continued)
On December 22, 2017, President Trump signed the Tax Cuts and Jobs Act (“Tax Reform”) into legislation. Under ASC 740, the effects of changes in tax rates and laws are recognized in the period in which the new legislation is enacted. In the case of U.S. federal income taxes, the enactment date is the date the bill becomes law (i.e., upon presidential signature). With respect to this legislation, we expect a one-time tax benefit of approximately
$1.1 million
, due to a re-measurement of deferred tax assets and liabilities resulting from the decrease in the corporate Federal income tax rate from 35% to 21% as well as the refund of existing credits against Alternative Minimum Tax. We are in the process of analyzing certain other provisions of this legislation which may impact our effective tax rate. Additionally on December 22, 2017, the SEC staff issued Staff Accounting Bulletin No. 118 (“SAB 118”) to address the application of U.S. GAAP in situations when a registrant does not have the necessary information available, prepared, or analyzed (including computations) in reasonable detail to complete the accounting for certain income tax effects of the Tax Reform Act. The Company has recognized the estimated tax impacts related to the revaluation of deferred tax assets and liabilities as well as tax refunds and included these amounts in its consolidated financial statements for the year ended December 31, 2017. The ultimate impact may differ from these estimated amounts, due to, among other things, additional analysis, changes in interpretations and assumptions the Company has made, additional regulatory guidance that may be issued, and actions the Company may take as a result of the Tax Reform Act. The accounting is expected to be complete on or before the date the 2017 U.S. income tax returns are filed in 2018.
17. Income (Loss) Per Share
The following table reconciles the amounts used in calculating basic and diluted income (loss) per share (in thousands, except per share amounts):
|
Year Ended December 31,
|
|||||||||||
|
2017
|
2016
|
2015
|
|||||||||
|
Income (loss) attributable to common stockholders – Basic and diluted:
|
|||||||||||
|
Income (loss) from continuing operations attributable to the Company
|
$
|
(67,008
|
)
|
$
|
(46,285
|
)
|
$
|
270,939
|
|
||
|
Less: Dividends on preferred stocks
|
(44,761
|
)
|
(36,272
|
)
|
(33,962
|
)
|
|||||
|
Less: Extinguishment of issuance costs upon redemption of Series E preferred stock
|
(10,799
|
)
|
(6,124
|
)
|
—
|
|
|||||
|
Less: Dividends on common stock
|
(45,752
|
)
|
(45,388
|
)
|
(46,498
|
)
|
|||||
|
Less: Dividends on unvested performance stock units
|
(393
|
)
|
(161
|
)
|
—
|
|
|||||
|
Less: Dividends on unvested restricted shares
|
(959
|
)
|
(743
|
)
|
(692
|
)
|
|||||
|
Less: Undistributed (income) from continuing operations allocated to unvested shares
|
—
|
|
—
|
|
(2,390
|
)
|
|||||
|
Undistributed income (loss)
|
(169,672
|
)
|
(134,973
|
)
|
187,397
|
|
|||||
|
Add back: Dividends on common stock
|
45,752
|
|
45,388
|
|
46,498
|
|
|||||
|
Distributed and undistributed income (loss) from continuing operations - basic
|
$
|
(123,920
|
)
|
$
|
(89,585
|
)
|
$
|
233,895
|
|
||
|
Add back: Income from continuing operations allocated to operating partnership units
|
—
|
|
—
|
|
35,503
|
|
|||||
|
Distributed and undistributed net income (loss) from continuing operations - diluted
|
$
|
(123,920
|
)
|
$
|
(89,585
|
)
|
$
|
269,398
|
|
||
|
Weighted average common shares outstanding:
|
|||||||||||
|
Weighted average common shares outstanding - basic
|
95,207
|
|
94,426
|
|
96,290
|
|
|||||
|
Effect of assumed conversion of operating partnership units
|
—
|
|
—
|
|
18,591
|
|
|||||
|
Weighted average common shares outstanding - diluted
|
95,207
|
|
94,426
|
|
114,881
|
|
|||||
|
Basic income (loss) per share:
|
|||||||||||
|
Net income (loss) allocated to common stockholders per share
|
$
|
(1.30
|
)
|
$
|
(0.95
|
)
|
$
|
2.43
|
|
||
|
Diluted income (loss) per share:
|
|||||||||||
|
Net income (loss) allocated to common stockholders per share
|
$
|
(1.30
|
)
|
$
|
(0.95
|
)
|
$
|
2.35
|
|
||
106
ASHFORD HOSPITALITY TRUST, INC. AND SUBSIDIARIES
NOTES TO CONSOLIDATED FINANCIAL STATEMENTS (continued)
Due to their anti-dilutive effect, the computation of diluted income (loss) per share does not reflect the adjustments for the following items (in thousands):
|
Year Ended December 31,
|
|||||||||||
|
2017
|
2016
|
2015
|
|||||||||
|
Income (loss) from continuing operations allocated to common stockholders is not adjusted for:
|
|||||||||||
|
Income (loss) allocated to unvested restricted shares
|
$
|
959
|
|
$
|
743
|
|
$
|
3,082
|
|
||
|
Income (loss) allocated to unvested performance stock units
|
393
|
|
161
|
|
—
|
|
|||||
|
Income (loss) attributable to redeemable noncontrolling interests in operating partnership
|
(21,642
|
)
|
(12,483
|
)
|
—
|
|
|||||
|
Total
|
$
|
(20,290
|
)
|
$
|
(11,579
|
)
|
$
|
3,082
|
|
||
|
Weighted average diluted shares are not adjusted for:
|
|||||||||||
|
Effect of unvested restricted shares
|
376
|
|
373
|
|
485
|
|
|||||
|
Effect of unvested performance stock units
|
258
|
|
102
|
|
—
|
|
|||||
|
Effect of assumed conversion of operating partnership units
|
17,342
|
|
18,727
|
|
—
|
|
|||||
|
Total
|
17,976
|
|
19,202
|
|
485
|
|
|||||
18. Segment Reporting
We operate in
one
business segment within the hotel lodging industry: direct hotel investments. Direct hotel investments refer to owning hotel properties through either acquisition or new development. We report operating results of direct hotel investments on an aggregate basis as substantially all of our hotel investments have similar economic characteristics and exhibit similar long-term financial performance. As of
December 31, 2017
and
2016
, all of our hotel properties were domestically located.
19. Related Party Transactions
As of
December 31, 2017
, we have management agreements with parties owned by our Chairman and our Chairman Emeritus. Under the agreements, we pay Remington Lodging a) monthly property management fees equal to the greater of
$13,000
(increased annually based on consumer price index adjustments) or
3%
of gross revenues as well as annual incentive management fees, if certain operational criteria are met, b) project management fees of up to
4%
of project costs, c) market service fees including purchasing, design and construction management not to exceed
16.5%
of project budget cumulatively, including project management fees, and d) other general and administrative expense reimbursements primarily related to accounting services. This related party allocates such charges to us based on various methodologies, including headcount and actual amounts incurred.
At
December 31, 2017
, the related party managed
82
of our
120
hotel properties and the WorldQuest condominium properties included in continuing operations and we incurred the following fees (including discontinued operations) related to the management agreements with the related party (in thousands):
|
Year Ended December 31,
|
|||||||||||
|
2017
|
2016
|
2015
|
|||||||||
|
Property management fees, including incentive property management fees
|
$
|
30,629
|
|
$
|
31,164
|
|
$
|
29,004
|
|
||
|
Market service fees
|
21,315
|
|
18,751
|
|
14,291
|
|
|||||
|
Corporate general and administrative and fixed asset reimbursements
|
5,652
|
|
5,435
|
|
4,677
|
|
|||||
|
Total
|
$
|
57,596
|
|
$
|
55,350
|
|
$
|
47,972
|
|
||
Management agreements with the related party include exclusivity clauses that require us to engage such related party, unless our independent directors either (i) unanimously vote to hire a different manager or developer or (ii) by a majority vote elect not to engage such related party because either special circumstances exist such that it would be in the best interest of our Company not to engage such related party, or, based on the related party’s prior performance, it is believed that another manager or developer could perform the management, development or other duties materially better.
Upon formation, we also agreed to indemnify certain related parties, including our Chairman and our Chairman Emeritus, who contributed hotel properties in connection with our initial public offering in exchange for operating partnership units, against
107
ASHFORD HOSPITALITY TRUST, INC. AND SUBSIDIARIES
NOTES TO CONSOLIDATED FINANCIAL STATEMENTS (continued)
the income tax such related parties may incur if we dispose of
one
or more of those contributed properties under the terms of the agreement.
Ashford LLC, a subsidiary of Ashford Inc., acts as our advisor, and as a result, we pay advisory fees to Ashford LLC. We are required to pay Ashford LLC a quarterly base fee that is a percentage of our total market capitalization on a declining sliding scale plus the Key Money Asset Management Fee (defined in our advisory agreement as the aggregate gross asset value of all key money assets multiplied by
0.70%
), subject to a minimum quarterly base fee, as payment for managing our day-to-day operations in accordance with our investment guidelines. Total market capitalization includes the aggregate principal amount of our consolidated indebtedness (including our proportionate share of debt of any entity that is not consolidated but excluding our joint venture partners’ proportionate share of consolidated debt). The range of base fees on the scale are between
0.70%
and
0.50%
per annum for total market capitalization that ranges from less than
$6.0 billion
to greater than
$10.0 billion
. At
December 31, 2017
, the quarterly base fee was
0.70%
based on our current market capitalization. We are also required to pay Ashford LLC an incentive fee that is measured annually. Each year that our annual total stockholder return exceeds the average annual total stockholder return for our peer group we will pay Ashford LLC an incentive fee over the following three years, subject to the FCCR Condition, as defined in the advisory agreement. We also reimburse Ashford LLC for certain reimbursable overhead and internal audit, insurance claims advisory and asset management services, as specified in the advisory agreement. We also record equity-based compensation expense for equity grants of common stock and LTIP units awarded to our officers and employees of Ashford LLC in connection with providing advisory services equal to the fair value of the award in proportion to the requisite service period satisfied during the period.
The following table summarizes the advisory services fees incurred (in thousands):
|
Year Ended December 31,
|
|||||||||||
|
2017
|
2016
|
2015
|
|||||||||
|
Advisory services fee
|
|||||||||||
|
Base advisory fee
|
$
|
34,650
|
|
$
|
34,589
|
|
$
|
33,833
|
|
||
|
Reimbursable expenses
(1)
|
7,472
|
|
5,917
|
|
6,471
|
|
|||||
|
Equity-based compensation
(2)
|
11,077
|
|
8,429
|
|
2,719
|
|
|||||
|
Incentive fee
|
—
|
|
5,426
|
|
—
|
|
|||||
|
Total advisory services fee
|
$
|
53,199
|
|
$
|
54,361
|
|
$
|
43,023
|
|
||
________
|
(1)
|
Reimbursable expenses include overhead, internal audit, insurance claims advisory and asset management services.
|
|
(2)
|
Equity-based compensation is associated with equity grants of Ashford Trust’s common stock, LTIP units and Performance LTIP units awarded to officers and employees of Ashford LLC.
|
In connection with our
acquisition of the Le Pavillon in 2015 and Ashford Inc.’s
engagement to provide hotel advisory services to us, Ashford Inc. agreed to provide
$4.0 million
of key money
consideration to purchase furniture, fixtures and equipment (“FF&E”)
. During the fourth quarter of 2016, the
$4.0 million
of key money consideration was invested in FF&E by Ashford Inc. to be used by Ashford Trust, which represented all of the key money consideration for Le Pavillon. The hotel advisory services and the lease are considered a multiple element arrangement, in accordance with the applicable accounting guidance. As such, a portion of the base advisory fee is allocated to lease expense equal to the estimated fair value of the lease payments that would have been made. Lease expense of
$633,000
and
$112,000
was recognized for the years ended
December 31, 2017
and
2016
, respectively, and was included in “other” hotel expense in the consolidated statements of operations.
In accordance with our advisory agreement, our advisor, or entities in which our advisor has an interest, have a right to provide products or services to our hotel properties, provided such transactions are evaluated and approved by our independent directors. The following table summarizes the entities in which our advisor has an interest with which we or our hotel properties contracted for products and services, the fees paid by us for those services, the applicable classification on our consolidated financial statements and the amount payable to each entity (included in “due to Ashford Inc.”) (in thousands):
108
ASHFORD HOSPITALITY TRUST, INC. AND SUBSIDIARIES
NOTES TO CONSOLIDATED FINANCIAL STATEMENTS (continued)
|
Year Ended December 31, 2017
|
As of December 31, 2017
|
||||||||||||||||||||||||||
|
Company
|
Product or Service
|
Transaction Amount
|
Investments in Hotel Properties, net
(1)
|
Indebtedness, net
(2)
|
Other Revenue
|
Other Hotel Expenses
|
Corporate, General and Administrative
|
Due to (from) Ashford Inc.
|
|||||||||||||||||||
|
OpenKey
|
Mobile key app
|
$
|
60
|
|
$
|
—
|
|
$
|
—
|
|
$
|
—
|
|
$
|
60
|
|
$
|
—
|
|
$
|
8
|
|
|||||
|
Pure Rooms
|
“Allergy friendly” premium rooms
|
1,309
|
|
1,309
|
|
—
|
|
—
|
|
—
|
|
—
|
|
296
|
|
||||||||||||
|
Lismore Capital
|
Mortgage placement services
|
913
|
|
—
|
|
(913
|
)
|
—
|
|
—
|
|
—
|
|
—
|
|
||||||||||||
|
J&S Audio Visual
|
Commissions from audio visual services
|
66
|
|
—
|
|
—
|
|
66
|
|
—
|
|
—
|
|
(52
|
)
|
||||||||||||
|
AIM
|
Cash management services
|
1,976
|
|
—
|
|
—
|
|
—
|
|
—
|
|
1,976
|
|
347
|
|
||||||||||||
________
|
(1)
|
Recorded in furniture, fixtures and equipment and depreciated over the estimated useful life.
|
|
(2)
|
Recorded as deferred loan costs, which are included in “indebtedness, net” on our consolidated balance sheets and amortized over the initial term of the applicable loan agreement.
|
At
December 31, 2017
and
2016
, we had payables of
$14.5 million
and
$15.7 million
, respectively, included in due to Ashford Inc., net, associated with advisory services and hotel services fees payable.
On July 31, 2015, we entered into a block trade with an unaffiliated third party, pursuant to a sale arrangement between the Company, Ashford Inc. and Ashford Prime. The block trade included the repurchase and retirement of approximately
5.8 million
shares of our common stock at a price of
$9.00
per share for a total cost of approximately
$51.8 million
. The sale arrangement and block trade were evaluated and approved by the independent members of our board of directors. The block trade purchase price and other terms of the sale arrangement were the result of negotiations with the third party. We did not receive any concessions or economic benefits from Ashford Inc. pertaining to our current contractual arrangements with Ashford Inc. in connection with this block trade. The block trade settled on August 4, 2015.
Certain employees of Remington Lodging, who perform work on behalf of Ashford Trust, were granted approximately
131,000
,
173,000
and
147,000
shares of restricted stock under the Ashford Trust Stock Plan during
2017
,
2016
and
2015
, respectively. These share grants were accounted for under the applicable accounting guidance related to share-based payments granted to non-employees and are recorded as a component of “management fees” in our consolidated statements of operations. Expense of
$645,000
,
$639,000
and
$213,000
was recognized for the year ended
December 31, 2017
,
2016
and
2015
, respectively. The unamortized fair value of the grants was
$1.1 million
as of
December 31, 2017
, which will be recognized over a period of
2.3
years, subject to future mark to market adjustments.
20. Concentration of Risk
Our investments are primarily concentrated within the hotel industry. Our investment strategy is to acquire full service hotels in the upscale and upper upscale segments in domestic and international markets that have RevPAR generally less than twice the national average. During
2017
, approximately
10%
of our total hotel revenue was generated from
nine
hotel properties located in the Washington D.C. area. In addition, all hotel properties securing our mortgage loans are located domestically at
December 31, 2017
. Accordingly, adverse conditions in the hotel industry will have a material adverse effect on our operating and investment revenues and cash available for distribution to stockholders.
Financial instruments that potentially subject us to significant concentrations of credit risk consist principally of cash and cash equivalents. We are exposed to credit risk with respect to cash held at various financial institutions, U.S. government treasury bill holdings and amounts due or payable under our derivative contracts. At
December 31, 2017
, we have exposure risk related to our derivative contracts. Our counterparties are investment grade financial institutions.
109
ASHFORD HOSPITALITY TRUST, INC. AND SUBSIDIARIES
NOTES TO CONSOLIDATED FINANCIAL STATEMENTS (continued)
21. Selected Quarterly Financial Data (Unaudited)
The following is a summary of the quarterly results of operations for the years ended
December 31, 2017
and
2016
(in thousands, except per share data):
|
First
Quarter
|
Second
Quarter
|
Third
Quarter
|
Fourth
Quarter
|
Full
Year
|
|||||||||||||||||
|
2017
|
|||||||||||||||||||||
|
Total revenue
|
$
|
353,709
|
|
$
|
390,670
|
|
$
|
353,325
|
|
$
|
341,566
|
|
$
|
1,439,270
|
|
||||||
|
Total operating expenses
|
325,447
|
|
332,185
|
|
323,709
|
|
322,924
|
|
1,304,265
|
|
|||||||||||
|
Operating income (loss)
|
$
|
28,262
|
|
$
|
58,485
|
|
$
|
29,616
|
|
$
|
18,642
|
|
$
|
135,005
|
|
||||||
|
Income (loss) from continuing operations
|
$
|
(31,937
|
)
|
$
|
10,428
|
|
$
|
(28,726
|
)
|
$
|
(38,525
|
)
|
$
|
(88,760
|
)
|
||||||
|
Income (loss) from continuing operations attributable to the Company
|
$
|
(25,413
|
)
|
$
|
10,184
|
|
$
|
(21,808
|
)
|
$
|
(29,971
|
)
|
$
|
(67,008
|
)
|
||||||
|
Income (loss) from continuing operations attributable to common stockholders
|
$
|
(36,369
|
)
|
$
|
(772
|
)
|
$
|
(37,755
|
)
|
$
|
(47,672
|
)
|
$
|
(122,568
|
)
|
||||||
|
Diluted income (loss) from continuing operations attributable to common stockholders per share
|
$
|
(0.39
|
)
|
$
|
(0.01
|
)
|
$
|
(0.40
|
)
|
$
|
(0.50
|
)
|
$
|
(1.30
|
)
|
(1
|
)
|
||||
|
Weighted average diluted common shares
|
94,840
|
|
95,320
|
|
95,332
|
|
95,328
|
|
95,207
|
|
|||||||||||
|
2016
|
|||||||||||||||||||||
|
Total revenue
|
$
|
367,772
|
|
$
|
410,670
|
|
$
|
371,931
|
|
$
|
341,670
|
|
$
|
1,492,043
|
|
||||||
|
Total operating expenses
|
326,369
|
|
341,203
|
|
330,857
|
|
337,910
|
|
1,336,339
|
|
|||||||||||
|
Operating income (loss)
|
$
|
41,403
|
|
$
|
69,467
|
|
$
|
41,074
|
|
$
|
3,760
|
|
$
|
155,704
|
|
||||||
|
Income (loss) from continuing operations
|
$
|
(12,139
|
)
|
$
|
35,135
|
|
$
|
(25,138
|
)
|
$
|
(56,640
|
)
|
$
|
(58,782
|
)
|
||||||
|
Income (loss) from continuing operations attributable to the Company
|
$
|
(9,989
|
)
|
$
|
30,753
|
|
$
|
(20,145
|
)
|
$
|
(46,904
|
)
|
$
|
(46,285
|
)
|
||||||
|
Income (loss) from continuing operations attributable to common stockholders
|
$
|
(18,479
|
)
|
$
|
22,262
|
|
$
|
(35,144
|
)
|
$
|
(57,320
|
)
|
$
|
(88,681
|
)
|
||||||
|
Diluted income (loss) from continuing operations attributable to common stockholders per share
|
$
|
(0.20
|
)
|
$
|
0.23
|
|
$
|
(0.37
|
)
|
$
|
(0.61
|
)
|
$
|
(0.95
|
)
|
(1
|
)
|
||||
|
Weighted average diluted common shares
|
94,136
|
|
94,474
|
|
94,531
|
|
94,585
|
|
94,426
|
|
|||||||||||
_________________
(1)
The sum of the diluted income (loss) from continuing operations attributable to common stockholders per share for the four quarters in
2017
and
2016
differs from the annual diluted income (loss) from continuing operations attributable to common stockholders per share due to the required method of computing the weighted average diluted common shares in the respective periods.
22. Subsequent Event
On January 17, 2018, we refinanced our
$376.8 million
mortgage loan. The new mortgage loan totaled
$395.0 million
. The new mortgage loan has a
two
-year initial term and
five
one
-year extension options, subject to the satisfaction of certain conditions. The mortgage loan is interest only and provides for a floating interest rate of LIBOR +
2.92%
. The Mortgage loan is secured by
eight
hotels: Embassy Suites Portland, Embassy Suites Crystal City, Embassy Suites Orlando, Embassy Suites Santa Clara, Crowne Plaza Key West, Hilton Costa Mesa, Sheraton Minneapolis, and Historic Inns of Annapolis.
On February 20, 2018, we completed the sale of the SpringHill Suites Glen Allen for approximately
$10.9 million
.
110
|
Item 9.
|
Changes in and Disagreements with Accountants on Accounting and Financial Disclosure
|
None.
|
Item 9A.
|
Controls and Procedures
|
EVALUATION OF DISCLOSURE CONTROLS AND PROCEDURES
Under the supervision and with the participation of our Chief Executive Officer and Chief Financial Officer, our management has evaluated the effectiveness of the design and operation of our disclosure controls and procedures (as defined in Rules 13a-15(e) and 15d-15(e) under the Exchange Act) as of
December 31, 2017
(“Evaluation Date”). Based upon that evaluation, the Chief Executive Officer and Chief Financial Officer concluded that, as of the Evaluation Date, our disclosure controls and procedures were effective (i) to ensure that information required to be disclosed in reports that we file or submit under the Exchange Act is recorded, processed, summarized and reported within the time periods specified in the SEC rules and forms; and (ii) to ensure that information required to be disclosed in the reports that we file or submit under the Exchange Act is accumulated and communicated to management, including our Chief Executive Officer and Chief Financial Officer, to allow timely decisions regarding required disclosures.
MANAGEMENT’S REPORT ON INTERNAL CONTROL OVER FINANCIAL REPORTING
Management is responsible for establishing and maintaining adequate internal control over financial reporting and for the assessment of the effectiveness of our internal control over financial reporting. The internal control over financial reporting is a process designed to provide reasonable assurance regarding the reliability of financial reporting and the preparation of financial statements for external purposes in accordance with GAAP. Our internal control over financial reporting includes those policies and procedures that (i) pertain to the maintenance of records that, in reasonable detail, accurately and fairly reflect the transactions and dispositions of our assets; (ii) provide reasonable assurance that transactions are recorded as necessary to permit preparation of financial statements in accordance with GAAP, and that receipts and our expenditures are being made only in accordance with authorizations of management and our directors and (iii) provide reasonable assurance regarding prevention or timely detection of unauthorized acquisition, use, or disposition of our assets that could have a material effect on the financial statements.
Management assessed the effectiveness of our internal control over financial reporting as of
December 31, 2017
. In making the assessment of the effectiveness of our internal control over financial reporting, management has utilized the criteria established in Internal Control — Integrated Framework issued by the Committee of Sponsoring Organizations of the Treadway Commission, (2013 framework) (“COSO”).
Based on management’s assessment of these criteria, we concluded that, as of
December 31, 2017
, our internal control over financial reporting was effective. The effectiveness of our internal control over financial reporting as of
December 31, 2017
has been audited by BDO USA LLP, an independent registered public accounting firm, as stated in their report which appears in this Annual Report on Form 10-K.
CHANGES IN INTERNAL CONTROL OVER FINANCIAL REPORTING
There were no changes in our internal controls over financial reporting that occurred during the fiscal quarter ended
December 31, 2017
, that have materially affected, or are reasonably likely to materially affect, our internal controls over financial reporting.
111
Report of Independent Registered Public Accounting Firm
The Board of Directors and Stockholders
Ashford Hospitality Trust, Inc. and subsidiaries
Dallas, Texas
Opinion on Internal Control over Financial Reporting
We have audited Ashford Hospitality Trust, Inc. (the “Company’s”) internal control over financial reporting as of December 31, 2017, based on criteria established in
Internal Control - Integrated Framework (2013)
issued by the Committee of Sponsoring Organizations of the Treadway Commission (the “COSO criteria”). In our opinion, the Company maintained, in all material respects, effective internal control over financial reporting as of December 31, 2017, based on the COSO criteria
.
We also have audited, in accordance with the standards of the Public Company Accounting Oversight Board (United States) (“PCAOB”), the consolidated balance sheets of the Company and subsidiaries as of December 31, 2017 and 2016, the related consolidated statements of operations, comprehensive income (loss), equity, and cash flows for each of the three years in the period ended December 31, 2017, and the related notes and financial statement schedule and our report dated March 14, 2018 expressed an unqualified opinion thereon.
Basis for Opinion
The Company’s management is responsible for maintaining effective internal control over financial reporting and for its assessment of the effectiveness of internal control over financial reporting, included in the accompanying Item 9A, Management’s Report on Internal Control over Financial Reporting. Our responsibility is to express an opinion on the Company’s internal control over financial reporting based on our audit. We are a public accounting firm registered with the PCAOB and are required to be independent with respect to the Company in accordance with U.S. federal securities laws and the applicable rules and regulations of the Securities and Exchange Commission and the PCAOB.
We conducted our audit of internal control over financial reporting in accordance with the standards of the PCAOB. Those standards require that we plan and perform the audit to obtain reasonable assurance about whether effective internal control over financial reporting was maintained in all material respects. Our audit included obtaining an understanding of internal control over financial reporting, assessing the risk that a material weakness exists, and testing and evaluating the design and operating effectiveness of internal control based on the assessed risk. Our audit also included performing such other procedures as we considered necessary in the circumstances. We believe that our audit provides a reasonable basis for our opinion.
Definition and Limitations of Internal Control over Financial Reporting
A company’s internal control over financial reporting is a process designed to provide reasonable assurance regarding the reliability of financial reporting and the preparation of financial statements for external purposes in accordance with generally accepted accounting principles. A company’s internal control over financial reporting includes those policies and procedures that (1) pertain to the maintenance of records that, in reasonable detail, accurately and fairly reflect the transactions and dispositions of the assets of the company; (2) provide reasonable assurance that transactions are recorded as necessary to permit preparation of financial statements in accordance with generally accepted accounting principles, and that receipts and expenditures of the company are being made only in accordance with authorizations of management and directors of the company; and (3) provide reasonable assurance regarding prevention or timely detection of unauthorized acquisition, use, or disposition of the company’s assets that could have a material effect on the financial statements.
Because of its inherent limitations, internal control over financial reporting may not prevent or detect misstatements. Also, projections of any evaluation of effectiveness to future periods are subject to the risk that controls may become inadequate because of changes in conditions, or that the degree of compliance with the policies or procedures may deteriorate.
/s/ BDO USA LLP
Dallas, Texas
March 14, 2018
112
|
Item 9B.
|
Other Information
|
None.
|
Item 10.
|
Directors, Executive Officer, and Corporate Governance
|
The required information is incorporated by reference from the Proxy Statement pertaining to our
2018
Annual Meeting of Stockholders, to be filed with the SEC pursuant to Regulation 14A promulgated under the Exchange Act not later than 120 days after the end of the fiscal year covered by this Annual Report on Form 10-K.
|
Item 11.
|
Executive Compensation
|
The required information is incorporated by reference from the Proxy Statement pertaining to our
2018
Annual Meeting of Stockholders, to be filed with the SEC pursuant to Regulation 14A promulgated under the Exchange Act not later than 120 days after the end of the fiscal year covered by this Annual Report on Form 10-K.
|
Item 12.
|
Security Ownership of Certain Beneficial Owners and Management and Related Stockholder Matters
|
The required information is incorporated by reference from the Proxy Statement pertaining to our
2018
Annual Meeting of Stockholders, to be filed with the SEC pursuant to Regulation 14A promulgated under the Exchange Act not later than 120 days after the end of the fiscal year covered by this Annual Report on Form 10-K.
|
Item 13.
|
Certain Relationships and Related Transactions, and Director Independence
|
The required information is incorporated by reference from the Proxy Statement pertaining to our
2018
Annual Meeting of Stockholders, to be filed with the SEC pursuant to Regulation 14A promulgated under the Exchange Act not later than 120 days after the end of the fiscal year covered by this Annual Report on Form 10-K.
|
Item 14.
|
Principal Accountant Fees and Services
|
The required information is incorporated by reference from the Proxy Statement pertaining to our
2018
Annual Meeting of Stockholders, to be filed with the SEC pursuant to Regulation 14A promulgated under the Exchange Act not later than 120 days after the end of the fiscal year covered by this Annual Report on Form 10-K.
|
Item 15.
|
Exhibits, Financial Statement and Schedules
|
|
(a)
|
Financial Statements and Schedules
|
See Item 8, “Financial Statements and Supplementary Data,” on pages 67 through 110 hereof, for a list of our consolidated financial statements and report of independent registered public accounting firm.
The following financial statement schedule is included herein on pages 115 through 119 hereof.
Schedule III – Real Estate and Accumulated Depreciation
All other financial statement schedules have been omitted because such schedules are not required under the related instructions, such schedules are not significant, or the required information has been disclosed elsewhere in the consolidated financial statements and related notes thereto.
|
(b)
|
Exhibits
|
Exhibits required by Item 601 of Regulation S-K: The exhibits filed in response to this item are listed in the Exhibit Index on pages 120 through 126.
Item 16.
Form 10-K Summary
None.
113
SIGNATURES
Pursuant to the requirements of Section 13 or 15(d) of the Securities Exchange Act of 1934, the Registrant has duly caused this report to be signed on its behalf by the undersigned, thereunto duly authorized, on
March 14, 2018
.
|
ASHFORD HOSPITALITY TRUST, INC.
|
||
|
By:
|
/s/ DOUGLAS A. KESSLER
|
|
|
Douglas A. Kessler
|
||
|
President and Chief Executive Officer
|
||
Pursuant to the requirements of the Securities Exchange Act of 1934, this report has been signed below on behalf of the Registrant in the capacities and on the dates indicated.
|
Signature
|
Title
|
Date
|
||
|
/s/
MONTY J. BENNETT
|
Chairman of the Board of Directors
|
March 14, 2018
|
||
|
Monty J. Bennett
|
||||
|
/s/ DOUGLAS A. KESSLER
|
President and Chief Executive Officer (Principal Executive Officer)
|
March 14, 2018
|
||
|
Douglas A. Kessler
|
||||
|
/s/
DERIC S. EUBANKS
|
Chief Financial Officer (Principal Financial Officer)
|
March 14, 2018
|
||
|
Deric S. Eubanks
|
||||
|
/s/
MARK L. NUNNELEY
|
Chief Accounting Officer (Principal Accounting Officer)
|
March 14, 2018
|
||
|
Mark L. Nunneley
|
||||
|
/s/
BENJAMIN J. ANSELL, M.D.
|
Director
|
March 14, 2018
|
||
|
Benjamin J. Ansell, M.D.
|
||||
|
/s/
FREDERICK J. KLEISNER
|
Director
|
March 14, 2018
|
||
|
Frederick J. Kleisner
|
||||
|
/s/
AMISH GUPTA
|
Director
|
March 14, 2018
|
||
|
Amish Gupta
|
||||
|
/s/
KAMAL JAFARNIA
|
Director
|
March 14, 2018
|
||
|
Kamal Jafarnia
|
||||
|
/s/
PHILLIP S. PAYNE
|
Director
|
March 14, 2018
|
||
|
Philip S. Payne
|
||||
|
/s/
ALAN L. TALLIS
|
Director
|
March 14, 2018
|
||
|
Alan L. Tallis
|
||||
114
SCHEDULE III
ASHFORD HOSPITALITY TRUST, INC.
AND SUBSIDIARIES
REAL ESTATE AND ACCUMULATED DEPRECIATION
December 31, 2017
(dollars in thousands)
|
Column A
|
Column B
|
Column C
|
Column D
|
Column E
|
Column F
|
Column G
|
Column H
|
Column I
|
||||||||||||||||||||||||||||||||||||
|
|
|
Initial Cost
|
Costs Capitalized
Since Acquisition
|
Gross Carrying Amount At Close of Period
|
|
|
|
|
||||||||||||||||||||||||||||||||||||
|
Hotel Property
|
Location
|
Encumbrances
|
Land
|
FF&E,
Buildings and
improvements
|
Land
|
FF&E,
Buildings and
improvements
|
Land
|
FF&E,
Buildings and
improvements
|
Total
|
Accumulated
Depreciation
|
Construction
Date
|
Acquisition
Date
|
Income
Statement
|
|||||||||||||||||||||||||||||||
|
Embassy Suites
|
Austin, TX
|
$
|
23,810
|
|
$
|
1,204
|
|
$
|
9,388
|
|
$
|
193
|
|
$
|
7,000
|
|
$
|
1,397
|
|
$
|
16,388
|
|
$
|
17,785
|
|
$
|
7,643
|
|
08/1998
|
(1),(2),(3)
|
||||||||||||||
|
Embassy Suites
|
Dallas, TX
|
15,760
|
|
1,878
|
|
8,907
|
|
238
|
|
7,277
|
|
2,116
|
|
16,184
|
|
18,300
|
|
8,183
|
|
12/1998
|
(1),(2),(3)
|
|||||||||||||||||||||||
|
Embassy Suites
|
Herndon, VA
|
17,639
|
|
1,303
|
|
9,836
|
|
277
|
|
9,460
|
|
1,580
|
|
19,296
|
|
20,876
|
|
8,826
|
|
12/1998
|
(1),(2),(3)
|
|||||||||||||||||||||||
|
Embassy Suites
|
Las Vegas, NV
|
30,860
|
|
3,307
|
|
16,952
|
|
397
|
|
14,909
|
|
3,704
|
|
31,861
|
|
35,565
|
|
13,565
|
|
05/1999
|
(1),(2),(3)
|
|||||||||||||||||||||||
|
Embassy Suites
|
Flagstaff, AZ
|
14,814
|
|
1,267
|
|
4,278
|
|
—
|
|
4,887
|
|
1,267
|
|
9,165
|
|
10,432
|
|
4,701
|
|
10/2003
|
(1),(2),(3)
|
|||||||||||||||||||||||
|
Embassy Suites
|
Houston, TX
|
18,150
|
|
1,799
|
|
10,404
|
|
—
|
|
7,120
|
|
1,799
|
|
17,524
|
|
19,323
|
|
6,290
|
|
03/2005
|
(1),(2),(3)
|
|||||||||||||||||||||||
|
Embassy Suites
|
West Palm Beach, FL
|
20,180
|
|
3,277
|
|
13,949
|
|
—
|
|
9,630
|
|
3,277
|
|
23,579
|
|
26,856
|
|
10,033
|
|
03/2005
|
(1),(2),(3)
|
|||||||||||||||||||||||
|
Embassy Suites
|
Philadelphia, PA
|
34,513
|
|
5,791
|
|
34,819
|
|
—
|
|
14,928
|
|
5,791
|
|
49,747
|
|
55,538
|
|
15,962
|
|
12/2006
|
(1),(2),(3)
|
|||||||||||||||||||||||
|
Embassy Suites
|
Walnut Creek, CA
|
36,342
|
|
7,452
|
|
25,334
|
|
—
|
|
16,224
|
|
7,452
|
|
41,558
|
|
49,010
|
|
12,016
|
|
12/2006
|
(1),(2),(3)
|
|||||||||||||||||||||||
|
Embassy Suites
|
Arlington, VA
|
44,802
|
|
36,065
|
|
41,588
|
|
—
|
|
8,954
|
|
36,065
|
|
50,542
|
|
86,607
|
|
16,468
|
|
04/2007
|
(1),(2),(3)
|
|||||||||||||||||||||||
|
Embassy Suites
|
Portland, OR
|
75,360
|
|
11,110
|
|
60,048
|
|
—
|
|
8,927
|
|
11,110
|
|
68,975
|
|
80,085
|
|
21,672
|
|
04/2007
|
(1),(2),(3)
|
|||||||||||||||||||||||
|
Embassy Suites
|
Santa Clara, CA
|
62,473
|
|
8,948
|
|
46,239
|
|
—
|
|
9,158
|
|
8,948
|
|
55,397
|
|
64,345
|
|
15,162
|
|
04/2007
|
(1),(2),(3)
|
|||||||||||||||||||||||
|
Embassy Suites
|
Orlando, FL
|
15,373
|
|
5,674
|
|
21,593
|
|
—
|
|
10,148
|
|
5,674
|
|
31,741
|
|
37,415
|
|
8,991
|
|
04/2007
|
(1),(2),(3)
|
|||||||||||||||||||||||
|
Hilton Garden Inn
|
Jacksonville, FL
|
11,980
|
|
1,751
|
|
9,164
|
|
—
|
|
5,295
|
|
1,751
|
|
14,459
|
|
16,210
|
|
4,599
|
|
11/2003
|
(1),(2),(3)
|
|||||||||||||||||||||||
|
Hilton Garden Inn
|
Austin, TX
|
44,963
|
|
7,605
|
|
48,725
|
|
—
|
|
7,734
|
|
7,605
|
|
56,459
|
|
64,064
|
|
8,855
|
|
03/2015
|
(1),(2),(3)
|
|||||||||||||||||||||||
|
Hilton Garden Inn
|
Baltimore, MD
|
19,337
|
|
4,027
|
|
20,199
|
|
—
|
|
65
|
|
4,027
|
|
20,264
|
|
24,291
|
|
1,709
|
|
03/2015
|
(1),(2),(3)
|
|||||||||||||||||||||||
|
Hilton Garden Inn
|
Virginia Beach, VA
|
24,289
|
|
4,101
|
|
26,329
|
|
—
|
|
(68
|
)
|
4,101
|
|
26,261
|
|
30,362
|
|
2,101
|
|
03/2015
|
(1),(2),(3)
|
|||||||||||||||||||||||
|
Hilton Garden Inn
|
Wisconsin Dells, WI
|
12,000
|
|
867
|
|
14,318
|
|
—
|
|
1,678
|
|
867
|
|
15,996
|
|
16,863
|
|
1,584
|
|
08/2015
|
(1),(2),(3)
|
|||||||||||||||||||||||
|
Hilton
|
Ft. Worth, TX
|
51,023
|
|
4,538
|
|
13,922
|
|
—
|
|
18,649
|
|
4,538
|
|
32,571
|
|
37,109
|
|
15,597
|
|
03/2005
|
(1),(2),(3)
|
|||||||||||||||||||||||
|
Hilton
|
Houston, TX
|
20,330
|
|
2,200
|
|
13,247
|
|
—
|
|
9,764
|
|
2,200
|
|
23,011
|
|
25,211
|
|
10,012
|
|
03/2005
|
(1),(2),(3)
|
|||||||||||||||||||||||
|
Hilton
|
St. Petersburg, FL
|
49,660
|
|
2,991
|
|
13,907
|
|
—
|
|
20,367
|
|
2,991
|
|
34,274
|
|
37,265
|
|
15,702
|
|
03/2005
|
(1),(2),(3)
|
|||||||||||||||||||||||
|
Hilton
|
Santa Fe, NM
|
17,909
|
|
7,004
|
|
10,689
|
|
—
|
|
11,019
|
|
7,004
|
|
21,708
|
|
28,712
|
|
10,190
|
|
12/2006
|
(1),(2),(3)
|
|||||||||||||||||||||||
|
Hilton
|
Bloomington, MN
|
52,644
|
|
5,685
|
|
59,139
|
|
—
|
|
14,055
|
|
5,685
|
|
73,194
|
|
78,879
|
|
24,690
|
|
04/2007
|
(1),(2),(3)
|
|||||||||||||||||||||||
|
Hilton
|
Costa Mesa, CA
|
64,960
|
|
12,917
|
|
91,791
|
|
—
|
|
16,729
|
|
12,917
|
|
108,520
|
|
121,437
|
|
35,054
|
|
04/2007
|
(1),(2),(3)
|
|||||||||||||||||||||||
|
Hilton
|
Boston, MA
|
97,000
|
|
62,555
|
|
134,407
|
|
—
|
|
12,165
|
|
62,555
|
|
146,572
|
|
209,127
|
|
12,768
|
|
03/2015
|
(1),(2),(3)
|
|||||||||||||||||||||||
|
Hilton
|
Parsippany, NJ
|
52,195
|
|
7,293
|
|
58,098
|
|
—
|
|
10,358
|
|
7,293
|
|
68,456
|
|
75,749
|
|
14,022
|
|
03/2015
|
(1),(2),(3)
|
|||||||||||||||||||||||
|
Hilton
|
Tampa, FL
|
21,067
|
|
5,206
|
|
21,186
|
|
—
|
|
9,315
|
|
5,206
|
|
30,501
|
|
35,707
|
|
3,590
|
|
03/2015
|
(1),(2),(3)
|
|||||||||||||||||||||||
|
Hampton Inn
|
Lawrenceville, GA
|
5,628
|
|
697
|
|
3,808
|
|
—
|
|
3,069
|
|
697
|
|
6,877
|
|
7,574
|
|
2,543
|
|
11/2003
|
(1),(2),(3)
|
|||||||||||||||||||||||
|
Hampton Inn
|
Evansville, IN
|
11,330
|
|
1,301
|
|
5,034
|
|
—
|
|
2,638
|
|
1,301
|
|
7,672
|
|
8,973
|
|
3,577
|
|
09/2004
|
(1),(2),(3)
|
|||||||||||||||||||||||
|
Hampton Inn
|
Parsippany, NJ
|
22,010
|
|
3,268
|
|
24,306
|
|
—
|
|
2,828
|
|
3,268
|
|
27,134
|
|
30,402
|
|
3,065
|
|
03/2015
|
(1),(2),(3)
|
|||||||||||||||||||||||
|
Hampton Inn
|
Buford, GA
|
8,964
|
|
1,168
|
|
5,338
|
|
—
|
|
1,274
|
|
1,168
|
|
6,612
|
|
7,780
|
|
2,636
|
|
07/2004
|
(1),(2),(3)
|
|||||||||||||||||||||||
|
Hampton Inn
|
Phoenix, AZ
|
11,267
|
|
853
|
|
10,145
|
|
—
|
|
101
|
|
853
|
|
10,246
|
|
11,099
|
|
809
|
|
06/2015
|
(1),(2),(3)
|
|||||||||||||||||||||||
|
Hampton Inn - Waterfront
|
Pittsburgh, PA
|
12,786
|
|
2,335
|
|
18,663
|
|
—
|
|
(517
|
)
|
2,335
|
|
18,146
|
|
20,481
|
|
1,312
|
|
06/2015
|
(1),(2),(3)
|
|||||||||||||||||||||||
|
Hampton Inn - Washington
|
Pittsburgh, PA
|
17,341
|
|
2,760
|
|
19,739
|
|
—
|
|
1,351
|
|
2,760
|
|
21,090
|
|
23,850
|
|
2,987
|
|
06/2015
|
(1),(2),(3)
|
|||||||||||||||||||||||
|
Hampton Inn
|
Columbus, OH
|
21,017
|
|
1,789
|
|
27,210
|
|
—
|
|
2,126
|
|
1,789
|
|
29,336
|
|
31,125
|
|
4,195
|
|
06/2015
|
(1),(2),(3)
|
|||||||||||||||||||||||
115
|
Column A
|
Column B
|
Column C
|
Column D
|
Column E
|
Column F
|
Column G
|
Column H
|
Column I
|
||||||||||||||||||||||||||||||||||||
|
|
|
Initial Cost
|
Costs Capitalized
Since Acquisition
|
Gross Carrying Amount At Close of Period
|
|
|
|
|
||||||||||||||||||||||||||||||||||||
|
Hotel Property
|
Location
|
Encumbrances
|
Land
|
FF&E,
Buildings and
improvements
|
Land
|
FF&E,
Buildings and
improvements
|
Land
|
FF&E,
Buildings and
improvements
|
Total
|
Accumulated
Depreciation
|
Construction
Date
|
Acquisition
Date
|
Income
Statement
|
|||||||||||||||||||||||||||||||
|
Marriott
|
Beverly Hills, CA
|
97,898
|
|
6,510
|
|
22,061
|
|
—
|
|
31,305
|
|
6,510
|
|
53,366
|
|
59,876
|
|
22,959
|
|
03/2005
|
(1),(2),(3)
|
|||||||||||||||||||||||
|
Marriott
|
Durham, NC
|
23,714
|
|
1,794
|
|
25,056
|
|
—
|
|
12,513
|
|
1,794
|
|
37,569
|
|
39,363
|
|
11,181
|
|
02/2006
|
(1),(2),(3)
|
|||||||||||||||||||||||
|
Marriott
|
Arlington, VA
|
95,207
|
|
20,637
|
|
101,376
|
|
—
|
|
54,444
|
|
20,637
|
|
155,820
|
|
176,457
|
|
49,996
|
|
07/2006
|
(1),(2),(3)
|
|||||||||||||||||||||||
|
Marriott
|
Bridgewater, NJ
|
64,520
|
|
5,059
|
|
89,268
|
|
—
|
|
4,430
|
|
5,059
|
|
93,698
|
|
98,757
|
|
27,437
|
|
04/2007
|
(1),(2),(3)
|
|||||||||||||||||||||||
|
Marriott
|
Dallas, TX
|
24,624
|
|
2,701
|
|
30,893
|
|
—
|
|
14,693
|
|
2,701
|
|
45,586
|
|
48,287
|
|
13,292
|
|
04/2007
|
(1),(2),(3)
|
|||||||||||||||||||||||
|
Marriott
|
Fremont, CA
|
60,684
|
|
5,800
|
|
44,200
|
|
—
|
|
(1,675
|
)
|
5,800
|
|
42,525
|
|
48,325
|
|
5,697
|
|
8/2014
|
(1),(2),(3)
|
|||||||||||||||||||||||
|
Marriott
|
Memphis, TN
|
33,300
|
|
6,210
|
|
37,284
|
|
—
|
|
1,090
|
|
6,210
|
|
38,374
|
|
44,584
|
|
5,286
|
|
02/2015
|
(1),(2),(3)
|
|||||||||||||||||||||||
|
Marriott
|
Irving, TX
|
72,318
|
|
8,330
|
|
82,272
|
|
—
|
|
6,515
|
|
8,330
|
|
88,787
|
|
97,117
|
|
7,514
|
|
03/2015
|
(1),(2),(3)
|
|||||||||||||||||||||||
|
Marriott
|
Omaha, NE
|
45,120
|
|
6,641
|
|
49,887
|
|
—
|
|
8,112
|
|
6,641
|
|
57,999
|
|
64,640
|
|
5,873
|
|
03/2015
|
(1),(2),(3)
|
|||||||||||||||||||||||
|
Marriott
|
San Antonio, TX
|
33,329
|
|
9,764
|
|
31,384
|
|
2,024
|
|
1,955
|
|
11,788
|
|
33,339
|
|
45,127
|
|
3,306
|
|
03/2015
|
(1),(2),(3)
|
|||||||||||||||||||||||
|
Marriott
|
Sugarland, TX
|
78,606
|
|
9,047
|
|
84,043
|
|
—
|
|
(2,570
|
)
|
9,047
|
|
81,473
|
|
90,520
|
|
6,230
|
|
03/2015
|
(1),(2),(3)
|
|||||||||||||||||||||||
|
SpringHill Suites by Marriott
|
Jacksonville, FL
|
—
|
|
1,348
|
|
7,111
|
|
—
|
|
3,455
|
|
1,348
|
|
10,566
|
|
11,914
|
|
3,852
|
|
11/2003
|
(1),(2),(3)
|
|||||||||||||||||||||||
|
SpringHill Suites by Marriott
|
Baltimore, MD
|
14,164
|
|
2,502
|
|
13,206
|
|
—
|
|
4,521
|
|
2,502
|
|
17,727
|
|
20,229
|
|
6,961
|
|
05/2004
|
(1),(2),(3)
|
|||||||||||||||||||||||
|
SpringHill Suites by Marriott
|
Kennesaw, GA
|
6,861
|
|
1,106
|
|
5,021
|
|
—
|
|
3,223
|
|
1,106
|
|
8,244
|
|
9,350
|
|
2,200
|
|
07/2004
|
(1),(2),(3)
|
|||||||||||||||||||||||
|
SpringHill Suites by Marriott
|
Buford, GA
|
9,879
|
|
1,132
|
|
6,089
|
|
—
|
|
1,038
|
|
1,132
|
|
7,127
|
|
8,259
|
|
2,741
|
|
07/2004
|
(1),(2),(3)
|
|||||||||||||||||||||||
|
SpringHill Suites by Marriott
(5)
|
Centreville, VA
|
5,992
|
|
1,806
|
|
11,712
|
|
(1,806
|
)
|
(11,712
|
)
|
—
|
|
—
|
|
—
|
|
—
|
|
06/2005
|
(1),(2),(3),(4)
|
|||||||||||||||||||||||
|
SpringHill Suites by Marriott
|
Charlotte, NC
|
13,284
|
|
1,235
|
|
6,818
|
|
—
|
|
963
|
|
1,235
|
|
7,781
|
|
9,016
|
|
2,746
|
|
06/2005
|
(1),(2),(3)
|
|||||||||||||||||||||||
|
SpringHill Suites by Marriott
|
Durham, NC
|
6,929
|
|
1,090
|
|
3,991
|
|
—
|
|
1,097
|
|
1,090
|
|
5,088
|
|
6,178
|
|
1,932
|
|
06/2005
|
(1),(2),(3)
|
|||||||||||||||||||||||
|
SpringHill Suites by Marriott
|
Manhattan Beach, CA
|
24,430
|
|
5,726
|
|
21,187
|
|
—
|
|
1,484
|
|
5,726
|
|
22,671
|
|
28,397
|
|
6,776
|
|
04/2007
|
(1),(2),(3)
|
|||||||||||||||||||||||
|
SpringHill Suites by Marriott
|
Plymouth Meeting, PA
|
14,498
|
|
3,210
|
|
24,578
|
|
—
|
|
1,768
|
|
3,210
|
|
26,346
|
|
29,556
|
|
7,744
|
|
04/2007
|
(1),(2),(3)
|
|||||||||||||||||||||||
|
SpringHill Suites by Marriott
(5)
|
Glen Allen, VA
|
7,277
|
|
2,045
|
|
15,802
|
|
(2,045
|
)
|
(15,802
|
)
|
—
|
|
—
|
|
—
|
|
—
|
|
04/2007
|
(1),(2),(3),(4)
|
|||||||||||||||||||||||
|
Fairfield Inn by Marriott
|
Kennesaw, GA
|
5,382
|
|
840
|
|
4,359
|
|
—
|
|
865
|
|
840
|
|
5,224
|
|
6,064
|
|
2,079
|
|
07/2004
|
(1),(2),(3)
|
|||||||||||||||||||||||
|
Courtyard by Marriott
|
Bloomington, IN
|
14,520
|
|
900
|
|
10,741
|
|
—
|
|
4,303
|
|
900
|
|
15,044
|
|
15,944
|
|
5,617
|
|
09/2004
|
(1),(2),(3)
|
|||||||||||||||||||||||
|
Courtyard by Marriott - Tremont
|
Boston, MA
|
87,253
|
|
24,494
|
|
85,246
|
|
—
|
|
13,821
|
|
24,494
|
|
99,067
|
|
123,561
|
|
14,639
|
|
03/2015
|
(1),(2),(3)
|
|||||||||||||||||||||||
|
Courtyard by Marriott
|
Columbus, IN
|
4,981
|
|
673
|
|
4,804
|
|
—
|
|
3,984
|
|
673
|
|
8,788
|
|
9,461
|
|
3,236
|
|
09/2004
|
(1),(2),(3)
|
|||||||||||||||||||||||
|
Courtyard by Marriott
|
Denver, CO
|
31,128
|
|
9,342
|
|
29,656
|
|
—
|
|
3,049
|
|
9,342
|
|
32,705
|
|
42,047
|
|
5,219
|
|
03/2015
|
(1),(2),(3)
|
|||||||||||||||||||||||
|
Courtyard by Marriott
|
Louisville, KY
|
18,834
|
|
1,352
|
|
12,266
|
|
—
|
|
1,632
|
|
1,352
|
|
13,898
|
|
15,250
|
|
5,161
|
|
09/2004
|
(1),(2),(3)
|
|||||||||||||||||||||||
|
Courtyard by Marriott
|
Gaithersburg, MD
|
28,456
|
|
5,128
|
|
30,522
|
|
—
|
|
1,318
|
|
5,128
|
|
31,840
|
|
36,968
|
|
2,431
|
|
03/2015
|
(1),(2),(3)
|
|||||||||||||||||||||||
|
Courtyard by Marriott
|
Crystal City, VA
|
43,350
|
|
5,411
|
|
38,610
|
|
—
|
|
9,378
|
|
5,411
|
|
47,988
|
|
53,399
|
|
15,108
|
|
06/2005
|
(1),(2),(3)
|
|||||||||||||||||||||||
|
Courtyard by Marriott
|
Ft. Lauderdale, FL
|
21,264
|
|
2,244
|
|
18,520
|
|
—
|
|
6,463
|
|
2,244
|
|
24,983
|
|
27,227
|
|
8,260
|
|
06/2005
|
(1),(2),(3)
|
|||||||||||||||||||||||
|
Courtyard by Marriott
|
Overland Park, KS
|
9,144
|
|
1,868
|
|
14,030
|
|
—
|
|
5,486
|
|
1,868
|
|
19,516
|
|
21,384
|
|
7,458
|
|
06/2005
|
(1),(2),(3)
|
|||||||||||||||||||||||
|
Courtyard by Marriott
|
Savannah, GA
|
30,892
|
|
6,948
|
|
31,755
|
|
—
|
|
(499
|
)
|
6,948
|
|
31,256
|
|
38,204
|
|
2,414
|
|
03/2015
|
(1),(2),(3)
|
|||||||||||||||||||||||
|
Courtyard by Marriott
|
Foothill Ranch, CA
|
22,150
|
|
2,447
|
|
16,005
|
|
—
|
|
3,523
|
|
2,447
|
|
19,528
|
|
21,975
|
|
6,633
|
|
06/2005
|
(1),(2),(3)
|
|||||||||||||||||||||||
|
Courtyard by Marriott
|
Alpharetta, GA
|
20,040
|
|
2,244
|
|
12,345
|
|
—
|
|
4,071
|
|
2,244
|
|
16,416
|
|
18,660
|
|
6,005
|
|
06/2005
|
(1),(2),(3)
|
|||||||||||||||||||||||
|
Courtyard by Marriott
|
Oakland, CA
|
23,714
|
|
5,112
|
|
19,429
|
|
—
|
|
4,295
|
|
5,112
|
|
23,724
|
|
28,836
|
|
7,307
|
|
04/2007
|
(1),(2),(3)
|
|||||||||||||||||||||||
|
Courtyard by Marriott
|
Scottsdale, AZ
|
16,048
|
|
3,700
|
|
22,134
|
|
—
|
|
4,719
|
|
3,700
|
|
26,853
|
|
30,553
|
|
8,561
|
|
04/2007
|
(1),(2),(3)
|
|||||||||||||||||||||||
|
Courtyard by Marriott
|
Plano, TX
|
16,958
|
|
2,115
|
|
22,360
|
|
—
|
|
2,286
|
|
2,115
|
|
24,646
|
|
26,761
|
|
7,630
|
|
04/2007
|
(1),(2),(3)
|
|||||||||||||||||||||||
|
Courtyard by Marriott
|
Newark, CA
|
29,993
|
|
2,863
|
|
10,723
|
|
—
|
|
3,785
|
|
2,863
|
|
14,508
|
|
17,371
|
|
5,239
|
|
04/2007
|
(1),(2),(3)
|
|||||||||||||||||||||||
|
Courtyard by Marriott
|
Manchester, CT
|
6,530
|
|
1,301
|
|
7,430
|
|
—
|
|
2,187
|
|
1,301
|
|
9,617
|
|
10,918
|
|
3,480
|
|
04/2007
|
(1),(2),(3)
|
|||||||||||||||||||||||
|
Courtyard by Marriott
|
Basking Ridge, NJ
|
38,528
|
|
5,419
|
|
45,304
|
|
—
|
|
7,413
|
|
5,419
|
|
52,717
|
|
58,136
|
|
15,084
|
|
04/2007
|
(1),(2),(3)
|
|||||||||||||||||||||||
|
Courtyard by Marriott
|
Wichita, KS
|
18,380
|
|
291
|
|
23,090
|
|
—
|
|
505
|
|
291
|
|
23,595
|
|
23,886
|
|
3,191
|
|
06/2015
|
(1),(2),(3)
|
|||||||||||||||||||||||
116
|
Column A
|
Column B
|
Column C
|
Column D
|
Column E
|
Column F
|
Column G
|
Column H
|
Column I
|
||||||||||||||||||||||||||||||||||||
|
|
|
Initial Cost
|
Costs Capitalized
Since Acquisition
|
Gross Carrying Amount At Close of Period
|
|
|
|
|
||||||||||||||||||||||||||||||||||||
|
Hotel Property
|
Location
|
Encumbrances
|
Land
|
FF&E,
Buildings and
improvements
|
Land
|
FF&E,
Buildings and
improvements
|
Land
|
FF&E,
Buildings and
improvements
|
Total
|
Accumulated
Depreciation
|
Construction
Date
|
Acquisition
Date
|
Income
Statement
|
|||||||||||||||||||||||||||||||
|
Courtyard by Marriott - Billerica
|
Boston, MA
|
29,807
|
|
3,528
|
|
29,352
|
|
—
|
|
3,972
|
|
3,528
|
|
33,324
|
|
36,852
|
|
5,780
|
|
06/2015
|
(1),(2),(3)
|
|||||||||||||||||||||||
|
Homewood Suites
|
Pittsburgh, PA
|
25,492
|
|
1,906
|
|
28,093
|
|
—
|
|
1,762
|
|
1,906
|
|
29,855
|
|
31,761
|
|
2,473
|
|
06/2015
|
(1),(2),(3)
|
|||||||||||||||||||||||
|
Marriott Residence Inn
|
Lake Buena Vista, FL
|
26,125
|
|
2,555
|
|
20,367
|
|
—
|
|
9,280
|
|
2,555
|
|
29,647
|
|
32,202
|
|
9,876
|
|
03/2004
|
(1),(2),(3)
|
|||||||||||||||||||||||
|
Marriott Residence Inn
|
Evansville, IN
|
7,980
|
|
961
|
|
5,972
|
|
—
|
|
3,531
|
|
961
|
|
9,503
|
|
10,464
|
|
3,793
|
|
09/2004
|
(1),(2),(3)
|
|||||||||||||||||||||||
|
Marriott Residence Inn
|
Orlando, FL
|
26,712
|
|
6,554
|
|
40,539
|
|
—
|
|
11,868
|
|
6,554
|
|
52,407
|
|
58,961
|
|
15,376
|
|
06/2005
|
(1),(2),(3)
|
|||||||||||||||||||||||
|
Marriott Residence Inn
|
Falls Church, VA
|
26,650
|
|
2,752
|
|
34,979
|
|
—
|
|
6,167
|
|
2,752
|
|
41,146
|
|
43,898
|
|
13,671
|
|
06/2005
|
(1),(2),(3)
|
|||||||||||||||||||||||
|
Marriott Residence Inn
|
San Diego, CA
|
29,840
|
|
3,156
|
|
29,514
|
|
—
|
|
5,671
|
|
3,156
|
|
35,185
|
|
38,341
|
|
13,025
|
|
06/2005
|
(1),(2),(3)
|
|||||||||||||||||||||||
|
Marriott Residence Inn
|
Salt Lake City, UT
|
16,428
|
|
1,897
|
|
16,357
|
|
—
|
|
4,440
|
|
1,897
|
|
20,797
|
|
22,694
|
|
8,097
|
|
06/2005
|
(1),(2),(3)
|
|||||||||||||||||||||||
|
Marriott Residence Inn
|
Las Vegas, NV
|
27,394
|
|
18,177
|
|
39,568
|
|
(6,184
|
)
|
(11,655
|
)
|
11,993
|
|
27,913
|
|
39,906
|
|
5,269
|
|
04/2007
|
(1),(2),(3)
|
|||||||||||||||||||||||
|
Marriott Residence Inn
|
Phoenix, AZ
|
17,868
|
|
4,100
|
|
23,187
|
|
—
|
|
6,363
|
|
4,100
|
|
29,550
|
|
33,650
|
|
10,236
|
|
04/2007
|
(1),(2),(3)
|
|||||||||||||||||||||||
|
Marriott Residence Inn
|
Plano, TX
|
12,085
|
|
2,045
|
|
16,869
|
|
—
|
|
3,350
|
|
2,045
|
|
20,219
|
|
22,264
|
|
6,867
|
|
04/2007
|
(1),(2),(3)
|
|||||||||||||||||||||||
|
Marriott Residence Inn
|
Newark, CA
|
31,771
|
|
3,272
|
|
11,706
|
|
—
|
|
5,070
|
|
3,272
|
|
16,776
|
|
20,048
|
|
6,645
|
|
04/2007
|
(1),(2),(3)
|
|||||||||||||||||||||||
|
Marriott Residence Inn
|
Manchester, CT
|
7,000
|
|
1,462
|
|
8,306
|
|
—
|
|
4,244
|
|
1,462
|
|
12,550
|
|
14,012
|
|
4,622
|
|
04/2007
|
(1),(2),(3)
|
|||||||||||||||||||||||
|
Marriott Residence Inn
|
Jacksonville, FL
|
10,216
|
|
1,997
|
|
16,084
|
|
—
|
|
5,039
|
|
1,997
|
|
21,123
|
|
23,120
|
|
5,586
|
|
05/2007
|
(1),(2),(3)
|
|||||||||||||||||||||||
|
Marriott Residence Inn
|
Stillwater, OK
|
7,911
|
|
930
|
|
15,070
|
|
—
|
|
2,924
|
|
930
|
|
17,994
|
|
18,924
|
|
2,572
|
|
06/2015
|
(1),(2),(3)
|
|||||||||||||||||||||||
|
Marriott Residence Inn
|
Tampa, FL
|
17,293
|
|
2,175
|
|
19,491
|
|
—
|
|
3,426
|
|
2,175
|
|
22,917
|
|
25,092
|
|
1,824
|
|
03/2015
|
(1),(2),(3)
|
|||||||||||||||||||||||
|
TownePlace Suites by Marriott
|
Manhattan Beach, CA
|
18,168
|
|
4,805
|
|
17,543
|
|
—
|
|
4,606
|
|
4,805
|
|
22,149
|
|
26,954
|
|
6,695
|
|
04/2007
|
(1),(2),(3)
|
|||||||||||||||||||||||
|
Ritz-Carlton
|
Atlanta, GA
|
68,702
|
|
2,477
|
|
80,139
|
|
—
|
|
15,250
|
|
2,477
|
|
95,389
|
|
97,866
|
|
7,578
|
|
03/2015
|
(1),(2),(3)
|
|||||||||||||||||||||||
|
One Ocean
|
Atlantic Beach, FL
|
32,574
|
|
5,815
|
|
14,817
|
|
—
|
|
26,534
|
|
5,815
|
|
41,351
|
|
47,166
|
|
22,103
|
|
04/2004
|
(1),(2),(3)
|
|||||||||||||||||||||||
|
Renaissance
|
Nashville, TN
|
114,968
|
|
20,671
|
|
158,260
|
|
—
|
|
10,347
|
|
20,671
|
|
168,607
|
|
189,278
|
|
14,536
|
|
03/2015
|
(1),(2),(3)
|
|||||||||||||||||||||||
|
Renaissance
|
Palm Springs, CA
|
50,544
|
|
—
|
|
74,112
|
|
—
|
|
11,174
|
|
—
|
|
85,286
|
|
85,286
|
|
7,439
|
|
03/2015
|
(1),(2),(3)
|
|||||||||||||||||||||||
|
Sheraton Hotel
|
Ann Arbor, MI
|
35,200
|
|
4,158
|
|
35,042
|
|
—
|
|
(295
|
)
|
4,158
|
|
34,747
|
|
38,905
|
|
2,685
|
|
06/2015
|
(1),(2),(3)
|
|||||||||||||||||||||||
|
Sheraton Hotel
|
Langhorne, PA
|
10,306
|
|
2,037
|
|
12,424
|
|
—
|
|
12,837
|
|
2,037
|
|
25,261
|
|
27,298
|
|
12,030
|
|
07/2004
|
(1),(2),(3)
|
|||||||||||||||||||||||
|
Sheraton Hotel
|
Minneapolis, MN
|
21,591
|
|
2,953
|
|
14,280
|
|
—
|
|
10,538
|
|
2,953
|
|
24,818
|
|
27,771
|
|
11,211
|
|
03/2005
|
(1),(2),(3)
|
|||||||||||||||||||||||
|
Sheraton Hotel
|
Indianapolis, IN
|
60,410
|
|
3,100
|
|
22,041
|
|
—
|
|
26,023
|
|
3,100
|
|
48,064
|
|
51,164
|
|
21,396
|
|
03/2005
|
(1),(2),(3)
|
|||||||||||||||||||||||
|
Sheraton Hotel
|
Anchorage, AK
|
47,316
|
|
4,023
|
|
39,363
|
|
—
|
|
15,475
|
|
4,023
|
|
54,838
|
|
58,861
|
|
18,119
|
|
12/2006
|
(1),(2),(3)
|
|||||||||||||||||||||||
|
Sheraton Hotel
|
San Diego, CA
|
29,185
|
|
7,294
|
|
36,382
|
|
—
|
|
8,497
|
|
7,294
|
|
44,879
|
|
52,173
|
|
15,345
|
|
12/2006
|
(1),(2),(3)
|
|||||||||||||||||||||||
|
Hyatt Regency
|
Coral Gables, FL
|
63,379
|
|
4,805
|
|
50,820
|
|
—
|
|
15,203
|
|
4,805
|
|
66,023
|
|
70,828
|
|
20,464
|
|
04/2007
|
(1),(2),(3)
|
|||||||||||||||||||||||
|
Hyatt Regency
|
Hauppauge, NY
|
33,486
|
|
6,284
|
|
35,669
|
|
—
|
|
(2,062
|
)
|
6,284
|
|
33,607
|
|
39,891
|
|
4,934
|
|
03/2015
|
(1),(2),(3)
|
|||||||||||||||||||||||
|
Hyatt Regency
|
Savannah, GA
|
69,252
|
|
14,041
|
|
72,721
|
|
—
|
|
11,043
|
|
14,041
|
|
83,764
|
|
97,805
|
|
8,765
|
|
03/2015
|
(1),(2),(3)
|
|||||||||||||||||||||||
|
Crowne Plaza
|
Key West, FL
|
72,007
|
|
—
|
|
27,514
|
|
—
|
|
17,112
|
|
—
|
|
44,626
|
|
44,626
|
|
19,709
|
|
03/2005
|
(1),(2),(3)
|
|||||||||||||||||||||||
|
Crowne Plaza
|
Annapolis, MD
|
—
|
|
—
|
|
9,903
|
|
—
|
|
8,810
|
|
—
|
|
18,713
|
|
18,713
|
|
3,542
|
|
03/2015
|
(1),(2),(3)
|
|||||||||||||||||||||||
|
Annapolis Inn
|
Annapolis, MD
|
20,234
|
|
3,028
|
|
7,833
|
|
—
|
|
9,206
|
|
3,028
|
|
17,039
|
|
20,067
|
|
7,481
|
|
03/2005
|
(1),(2),(3)
|
|||||||||||||||||||||||
|
Lakeway Resort & Spa
|
Austin, TX
|
25,100
|
|
4,541
|
|
28,940
|
|
—
|
|
5,296
|
|
4,541
|
|
34,236
|
|
38,777
|
|
6,589
|
|
02/2015
|
(1),(2),(3)
|
|||||||||||||||||||||||
|
Silversmith
|
Chicago, IL
|
21,695
|
|
4,782
|
|
22,398
|
|
—
|
|
991
|
|
4,782
|
|
23,389
|
|
28,171
|
|
4,479
|
|
03/2015
|
(1),(2),(3)
|
|||||||||||||||||||||||
|
The Churchill
|
Washington, DC
|
46,456
|
|
25,898
|
|
32,304
|
|
—
|
|
12,266
|
|
25,898
|
|
44,570
|
|
70,468
|
|
6,013
|
|
03/2015
|
(1),(2),(3)
|
|||||||||||||||||||||||
|
The Melrose
|
Washington, DC
|
73,261
|
|
29,277
|
|
62,507
|
|
—
|
|
(1,283
|
)
|
29,277
|
|
61,224
|
|
90,501
|
|
4,871
|
|
03/2015
|
(1),(2),(3)
|
|||||||||||||||||||||||
117
|
Column A
|
Column B
|
Column C
|
Column D
|
Column E
|
Column F
|
Column G
|
Column H
|
Column I
|
||||||||||||||||||||||||||||||||||||
|
|
|
Initial Cost
|
Costs Capitalized
Since Acquisition
|
Gross Carrying Amount At Close of Period
|
|
|
|
|
||||||||||||||||||||||||||||||||||||
|
Hotel Property
|
Location
|
Encumbrances
|
Land
|
FF&E,
Buildings and
improvements
|
Land
|
FF&E,
Buildings and
improvements
|
Land
|
FF&E,
Buildings and
improvements
|
Total
|
Accumulated
Depreciation
|
Construction
Date
|
Acquisition
Date
|
Income
Statement
|
|||||||||||||||||||||||||||||||
|
Le Pavillon
|
New Orleans, LA
|
43,750
|
|
10,933
|
|
51,549
|
|
(2,600
|
)
|
7,084
|
|
8,333
|
|
58,633
|
|
66,966
|
|
4,630
|
|
06/2015
|
(1),(2),(3)
|
|||||||||||||||||||||||
|
The Ashton
|
Ft. Worth, TX
|
5,336
|
|
800
|
|
7,187
|
|
—
|
|
1,333
|
|
800
|
|
8,520
|
|
9,320
|
|
1,265
|
|
07/2014
|
(1),(2),(3)
|
|||||||||||||||||||||||
|
Westin
|
Princeton, NJ
|
49,732
|
|
6,475
|
|
52,195
|
|
—
|
|
6,260
|
|
6,475
|
|
58,455
|
|
64,930
|
|
5,419
|
|
03/2015
|
(1),(2),(3)
|
|||||||||||||||||||||||
|
W
|
Atlanta, GA
|
40,500
|
|
2,353
|
|
54,383
|
|
—
|
|
(629
|
)
|
2,353
|
|
53,754
|
|
56,107
|
|
4,068
|
|
07/2015
|
(1),(2),(3)
|
|||||||||||||||||||||||
|
W
|
Minneapolis, MN
|
53,789
|
|
8,430
|
|
79,713
|
|
—
|
|
806
|
|
8,430
|
|
80,519
|
|
88,949
|
|
7,095
|
|
11/2015
|
(1),(2),(3)
|
|||||||||||||||||||||||
|
Le Meridien
|
Minneapolis, MN
|
—
|
|
2,752
|
|
12,248
|
|
—
|
|
1,800
|
|
2,752
|
|
14,048
|
|
16,800
|
|
961
|
|
07/2015
|
(1),(2),(3)
|
|||||||||||||||||||||||
|
Hotel Indigo
|
Atlanta, GA
|
16,100
|
|
3,230
|
|
23,713
|
|
—
|
|
168
|
|
3,230
|
|
23,881
|
|
27,111
|
|
1,460
|
|
10/2015
|
(1),(2),(3)
|
|||||||||||||||||||||||
|
WorldQuest Resort
|
Orlando, FL
|
—
|
|
1,432
|
|
9,870
|
|
(49
|
)
|
1,136
|
|
1,383
|
|
11,006
|
|
12,389
|
|
2,201
|
|
03/2011
|
(1),(2),(3)
|
|||||||||||||||||||||||
|
Total
|
$
|
3,723,568
|
|
$
|
664,232
|
|
$
|
3,626,591
|
|
$
|
(9,555
|
)
|
$
|
783,026
|
|
$
|
654,677
|
|
$
|
4,409,617
|
|
$
|
5,064,294
|
|
$
|
1,028,379
|
|
|||||||||||||||||
_________________________
(1) Estimated useful life for buildings is
39 years
.
(2) Estimated useful life for building improvements is
7.5 years
.
(3) Estimated useful life for furniture and fixtures is
1.5
to
5
years.
(4) Amounts include impairment charges.
(5) These hotel properties were held for sale as of December 31, 2017.
118
|
|
Year Ended December 31,
|
|||||||||||
|
|
2017
|
2016
|
2015
|
|||||||||
|
Investment in Real Estate:
|
||||||||||||
|
Beginning balance
|
$
|
5,054,564
|
|
$
|
5,181,466
|
|
$
|
2,719,716
|
|
|||
|
Additions
|
225,461
|
|
206,022
|
|
2,531,312
|
|
||||||
|
Impairment/write-offs
|
(111,820
|
)
|
(85,338
|
)
|
(57,596
|
)
|
||||||
|
Sales/disposals
|
(85,709
|
)
|
(227,988
|
)
|
(11,966
|
)
|
||||||
|
Assets held for sale
|
(18,202
|
)
|
(19,598
|
)
|
—
|
|
||||||
|
Ending balance
|
5,064,294
|
|
5,054,564
|
|
5,181,466
|
|
||||||
|
Accumulated Depreciation:
|
||||||||||||
|
Beginning balance
|
894,001
|
|
761,782
|
|
591,105
|
|
||||||
|
Depreciation expense
|
247,220
|
|
245,953
|
|
211,434
|
|
||||||
|
Impairment/write-offs
|
(101,008
|
)
|
(67,022
|
)
|
(37,647
|
)
|
||||||
|
Sales/disposals
|
(11,364
|
)
|
(44,346
|
)
|
(3,110
|
)
|
||||||
|
Assets held for sale
|
(470
|
)
|
(2,366
|
)
|
—
|
|
||||||
|
Ending balance
|
1,028,379
|
|
894,001
|
|
761,782
|
|
||||||
|
Investment in Real Estate, net
|
$
|
4,035,915
|
|
$
|
4,160,563
|
|
$
|
4,419,684
|
|
|||
119
EXHIBIT INDEX
|
Exhibit
|
Description
|
|
|
2.1
|
||
|
3.1
|
||
|
3.2
|
||
|
3.3
|
||
|
4.1
|
||
|
4.1.1
|
||
|
4.1.2
|
||
|
4.2.1
|
||
|
4.2.2
|
||
|
4.3.1
|
||
|
4.3.2
|
||
|
4.4
|
||
|
4.5
|
||
|
4.6
|
||
|
4.7
|
||
|
10.1
|
||
|
10.1.2
|
||
|
10.1.3
|
||
|
10.1.4
|
||
|
10.1.5
|
||
|
10.1.6
|
||
|
10.2
|
||
120
|
Exhibit
|
Description
|
|
|
10.3.1†
|
||
|
10.3.1.1
†
|
||
|
10.3.2†
|
||
|
10.3.2.1†
|
||
|
10.3.2.2†
|
||
|
10.3.3†
|
||
|
10.3.4†
|
||
|
10.3.5†
|
||
|
10.3.6†
|
||
|
10.3.7†
|
||
|
10.4
|
||
|
10.5.1†
|
||
|
10.5.2
|
||
|
10.6
|
||
|
10.6.1
|
||
|
10.6.2
|
||
|
10.6.3
|
||
|
10.6.4
|
||
|
10.7
|
||
|
10.8.1
|
||
|
10.8.2
|
||
|
10.9
|
||
|
10.10
|
||
|
10.10.1
|
||
|
10.10.2
|
||
121
|
Exhibit
|
Description
|
|
|
10.10.3
|
||
|
10.10.4
|
||
|
10.10.5
|
||
|
10.10.6
|
||
|
10.10.7
|
||
|
10.10.8
|
||
|
10.10.9
|
||
|
10.11
|
||
|
10.11.1
|
||
|
10.11.2
|
||
|
10.11.3
|
||
|
10.11.4
|
||
|
10.11.5
|
||
|
10.12
|
||
|
10.13.1
|
||
|
10.13.2
|
||
|
10.14.1.1
|
||
|
10.14.1.1a
|
||
|
10.14.1.2
|
||
|
10.14.1.2a
|
||
|
10.14.1.3
|
||
|
10.14.1.4
|
||
122
|
Exhibit
|
Description
|
|
|
10.14.1.5
|
||
|
10.14.1.6
|
||
|
10.14.1.7
|
||
|
10.15
|
||
|
10.15.1
|
||
|
10.16.1
|
||
|
10.16.2
|
||
|
10.16.3
|
||
|
10.17
|
||
|
10.18
|
||
|
10.19
|
||
|
10.20.1
|
||
|
10.20.1.1
|
||
|
10.20.1.2
|
||
|
10.20.2
|
||
|
10.20.2.1
|
||
|
10.20.2.2
|
||
123
|
Exhibit
|
Description
|
|
|
10.20.3
|
||
|
10.20.3.1
|
||
|
10.20.3.2
|
||
|
10.20.4
|
||
|
10.20.4.1
|
||
|
10.20.4.2
|
||
|
10.20.5
|
||
|
10.21
|
||
|
10.22
|
||
|
10.23
|
||
|
10.24
|
||
|
10.25
|
||
|
10.26
|
||
|
10.27
|
||
|
10.28
|
||
|
10.29
|
||
124
|
Exhibit
|
Description
|
|
|
10.30
|
||
|
10.31
|
||
|
10.32
|
||
|
10.33
|
||
|
10.33.1
|
||
|
10.34
|
||
|
10.35
|
||
|
10.36
|
||
|
10.37
|
||
|
10.37.1
|
||
|
10.38
|
||
|
10.38.1
|
||
|
10.39
|
||
|
10.39.1
|
||
|
10.40
|
||
|
10.40.1
|
||
|
10.41
|
||
|
10.42
|
||
|
10.43
|
||
|
10.44
|
||
125
|
Exhibit
|
Description
|
|
|
10.45
|
||
|
10.46
|
||
|
10.47
|
||
|
10.48
|
||
|
10.49
|
||
|
10.50
|
||
|
12*
|
||
|
21.1*
|
||
|
21.2*
|
||
|
23.1*
|
||
|
31.1*
|
||
|
31.2*
|
||
|
32.1*
|
||
|
32.2*
|
||
The following materials from the Company’s Annual Report on Form 10-K for the year ended
December 31, 2017
are formatted in XBRL (Extensible Business Reporting Language): (i) Consolidated Balance Sheets; (ii) Consolidated Statements of Operations; (iii) Consolidated Statements of Comprehensive Income (Loss); (iii) Consolidated Statements of Equity;(iv) Consolidated Statements of Cash Flows; and (v) Notes to Consolidated Financial Statements. In accordance with Rule 402 of Regulation S-T, the XBRL related information in Exhibit 101 to this Annual Report on Form 10-K shall not be deemed to be “filed” for purposes of Section 18 of the Securities Exchange Act of 1934, as amended (the “Exchange Act”), or otherwise subject to the liability of that section, and shall not be part of any registration statement or other document filed under the Securities Act of 1933, as amended, or the Exchange Act, except as shall be expressly set forth by specific reference in such filing.
|
101.INS
|
XBRL Instance Document
|
Submitted electronically with this report.
|
||
|
101.SCH
|
XBRL Taxonomy Extension Schema Document.
|
Submitted electronically with this report.
|
||
|
101.CAL
|
XBRL Taxonomy Calculation Linkbase Document.
|
Submitted electronically with this report.
|
||
|
101.DEF
|
XBRL Taxonomy Extension Definition Linkbase Document.
|
Submitted electronically with this report.
|
||
|
101.LAB
|
XBRL Taxonomy Label Linkbase Document.
|
Submitted electronically with this report.
|
||
|
101.PRE
|
XBRL Taxonomy Presentation Linkbase Document.
|
Submitted electronically with this report.
|
||
_________________________
* Filed herewith.
† Management contract or compensatory plan or arrangement.
126
TABLE OF CONTENTS
Part IItem 1. BusinessItem 1A. Risk FactorsItem 1B. Unresolved Staff CommentsItem 2. PropertiesItem 3. Legal ProceedingsItem 4. Mine Safety DisclosuresPart IIItem 5. Market For Registrant S Common Equity, Related Stockholder Matters, and Issuer Purchases Of Equity SecuritiesItem 6. Selected Financial DataItem 7. Management S Discussion and Analysis Of Financial Condition and Results Of OperationsItem 7A. Quantitative and Qualitative Disclosures About Market RiskItem 8. Financial Statements and Supplementary DataItem 9. Changes in and Disagreements with Accountants on Accounting and Financial DisclosureItem 9A. Controls and ProceduresItem 9B. Other InformationPart IIIItem 10. Directors, Executive Officer, and Corporate GovernanceItem 11. Executive CompensationItem 12. Security Ownership Of Certain Beneficial Owners and Management and Related Stockholder MattersItem 13. Certain Relationships and Related Transactions, and Director IndependenceItem 14. Principal Accountant Fees and ServicesPart IVItem 15. Exhibits, Financial Statement and SchedulesItem 16. Form 10-k Summary