|
|
|
|
|
|
|
|
|
|
|
|
|
|
|
|
|
|
|
|
|
|
|
|
|
|
|
|
|
|
|
|
|
|
|
|
|
|
|
|
|
|
|
|
|
|
|
|
|
|
|
|
|
|
|
|
|
|
|
UNITED STATES
SECURITIES AND EXCHANGE COMMISSION
Washington, D.C. 20549
FORM 10-Q
QUARTERLY REPORT PURSUANT TO SECTION 13 OR 15(d) OF THE SECURITIES EXCHANGE ACT OF 1934
|
For the quarterly period ended March 31, 2013 |
Commission File Number 1-8787 |

American International Group, Inc.
(Exact name of registrant as specified in its charter)
|
Delaware
(State or other jurisdiction of incorporation or organization) |
13-2592361
(I.R.S. Employer Identification No.) |
|||||
|
|
|
180 Maiden Lane, New York, New York (Address of principal executive offices) |
|
10038 (Zip Code) |
|
|
Registrant's telephone number, including area code: (212) 770-7000
Indicate by check mark whether the registrant (1) has filed all reports required to be filed by Section 13 or 15(d) of the Securities Exchange Act of 1934 during the preceding 12 months (or for such shorter period that the registrant was required to file such reports), and (2) has been subject to such filing requirements for the past 90 days. Yes þ No o
Indicate by check mark whether the registrant has submitted electronically and posted on its corporate Web site, if any, every Interactive Data File required to be submitted and posted pursuant to Rule 405 of Regulation S-T (§232.405 of this chapter) during the preceding 12 months (or for such shorter period that the registrant was required to submit and post such files). Yes þ No o
Indicate by check mark whether the registrant is a large accelerated filer, an accelerated filer, a non-accelerated filer, or a smaller reporting company. See the definitions of "large accelerated filer," "accelerated filer" and "smaller reporting company" in Rule 12b-2 of the Exchange Act.
| Large accelerated filer þ | Accelerated filer o |
Non-accelerated filer
o
(Do not check if a smaller reporting company) |
Smaller reporting company o |
Indicate by check mark whether the registrant is a shell company (as defined in Rule 12b-2 of the Exchange Act). Yes o No þ
As of April 25, 2013, there were 1,476,345,165 shares outstanding of the registrant's common stock.
AMERICAN INTERNATIONAL GROUP, INC.
QUARTERLY REPORT ON FORM 10-Q FOR THE QUARTERLY PERIOD ENDED
MARCH 31, 2013
TABLE OF CONTENTS
1
ITEM 1. / FINANCIAL STATEMENTS
CONDENSED CONSOLIDATED BALANCE SHEET (unaudited)
|
|
|
|
|||||
|---|---|---|---|---|---|---|---|
|
(in millions, except for share data)
|
March 31,
|
December 31,
2012 |
|||||
|
Assets: |
|
|
|
||||
|
Investments: |
|
|
|
||||
|
Fixed maturity securities: |
|
|
|
||||
|
Bonds available for sale, at fair value (amortized cost: 2013 – $247,592; 2012 – $246,149) |
$
|
270,251
|
|
$ | 269,959 | ||
|
Bond trading securities, at fair value |
|
23,855
|
|
24,584 | |||
|
Equity securities: |
|
|
|
||||
|
Common and preferred stock available for sale, at fair value (cost: 2013 – $1,529; 2012 – $1,640) |
|
3,108
|
|
3,212 | |||
|
Common and preferred stock trading, at fair value |
|
696
|
|
662 | |||
|
Mortgage and other loans receivable, net of allowance (portion measured at fair value: 2013 – $58; 2012 – $134) |
|
19,488
|
|
19,482 | |||
|
Other invested assets (portion measured at fair value: 2013 – $7,317; 2012 – $7,056) |
|
28,965
|
|
29,117 | |||
|
Short-term investments (portion measured at fair value: 2013 – $6,412; 2012 – $8,056) |
|
23,336
|
|
28,808 | |||
|
Total investments |
|
369,699
|
|
375,824 | |||
|
|
|
|
|
||||
|
Cash |
|
1,227
|
|
1,151 | |||
|
Accrued investment income |
|
3,093
|
|
3,054 | |||
|
Premiums and other receivables, net of allowance |
|
15,310
|
|
13,989 | |||
|
Reinsurance assets, net of allowance |
|
27,604
|
|
25,595 | |||
|
Deferred income taxes |
|
17,741
|
|
17,466 | |||
|
Deferred policy acquisition costs |
|
7,972
|
|
8,182 | |||
|
Derivative assets, at fair value |
|
3,290
|
|
3,671 | |||
|
Other assets, including restricted cash of $1,886 in 2013 and $1,878 in 2012 |
|
|
|
||||
|
(portion measured at fair value: 2013 – $694; 2012 – $696) |
|
10,069
|
|
10,399 | |||
|
Separate account assets, at fair value |
|
61,059
|
|
57,337 | |||
|
Assets held for sale |
|
31,816
|
|
31,965 | |||
|
Total assets |
$
|
548,880
|
|
$ | 548,633 | ||
|
Liabilities: |
|
|
|
||||
|
Liability for unpaid claims and claims adjustment expense |
$
|
85,774
|
|
$ | 87,991 | ||
|
Unearned premiums |
|
24,200
|
|
22,537 | |||
|
Future policy benefits for life and accident and health insurance contracts |
|
40,443
|
|
40,523 | |||
|
Policyholder contract deposits (portion measured at fair value: 2013 – $1,047; 2012 – $1,257) |
|
121,856
|
|
122,980 | |||
|
Other policyholder funds |
|
5,728
|
|
6,267 | |||
|
Derivative liabilities, at fair value |
|
3,711
|
|
4,061 | |||
|
Other liabilities (portion measured at fair value: 2013 – $924; 2012 – $1,080) |
|
33,108
|
|
32,068 | |||
|
Long-term debt (portion measured at fair value: 2013 – $7,663; 2012 – $8,055) |
|
45,266
|
|
48,500 | |||
|
Separate account liabilities |
|
61,059
|
|
57,337 | |||
|
Liabilities held for sale |
|
27,164
|
|
27,366 | |||
|
Total liabilities |
|
448,309
|
|
449,630 | |||
|
Contingencies, commitments and guarantees (see Note 10) |
|
|
|
||||
|
|
|
|
|
||||
|
Redeemable noncontrolling interests (see Note 12) |
|
388
|
|
334 | |||
|
|
|
|
|
||||
|
AIG shareholders' equity: |
|
|
|
||||
|
Common stock, $2.50 par value; 5,000,000,000 shares authorized; shares issued: 2013 – |
|
|
|
||||
|
1,906,612,296 and 2012 – 1,906,611,680 |
|
4,766
|
|
4,766 | |||
|
Treasury stock, at cost; 2013 – 430,267,133; 2012 – 430,289,745 shares of common stock |
|
(13,923
|
)
|
(13,924 | ) | ||
|
Additional paid-in capital |
|
80,456
|
|
80,410 | |||
|
Retained earnings |
|
16,382
|
|
14,176 | |||
|
Accumulated other comprehensive income |
|
11,839
|
|
12,574 | |||
|
Total AIG shareholders' equity |
|
99,520
|
|
98,002 | |||
|
Non-redeemable noncontrolling interests (including $100 associated with businesses held for sale) |
|
663
|
|
667 | |||
|
Total equity |
|
100,183
|
|
98,669 | |||
|
Total liabilities and equity |
$
|
548,880
|
|
$ | 548,633 | ||
See accompanying Notes to Condensed Consolidated Financial Statements.
2
ITEM 1. / FINANCIAL STATEMENTS
CONDENSED CONSOLIDATED STATEMENT OF INCOME (unaudited)
|
|
|
|
|||||
|---|---|---|---|---|---|---|---|
|
Three Months Ended March 31,
(dollars in millions, except per share data) |
2013
|
2012
|
|||||
|
Revenues: |
|
|
|
||||
|
Premiums |
$
|
9,372
|
|
$ | 9,470 | ||
|
Policy fees |
|
615
|
|
584 | |||
|
Net investment income |
|
4,164
|
|
7,105 | |||
|
Net realized capital gains (losses): |
|
|
|
||||
|
Total other-than-temporary impairments on available for sale
|
|
(40
|
)
|
(168 | ) | ||
|
Portion of other-than-temporary impairments on available for sale |
|
|
|
||||
|
fixed maturity securities recognized in Other comprehensive
|
|
(1
|
)
|
(285 | ) | ||
|
Net other-than-temporary impairments on available for sale
|
|
(41
|
)
|
(453 | ) | ||
|
Other realized capital gains |
|
341
|
|
202 | |||
|
Total net realized capital gains (losses) |
|
300
|
|
(251 | ) | ||
|
Other income |
|
1,437
|
|
589 | |||
|
Total revenues |
|
15,888
|
|
17,497 | |||
|
Benefits, claims and expenses: |
|
|
|
||||
|
Policyholder benefits and claims incurred |
|
6,728
|
|
7,119 | |||
|
Interest credited to policyholder account balances |
|
1,017
|
|
1,062 | |||
|
Amortization of deferred acquisition costs |
|
1,286
|
|
1,347 | |||
|
Other acquisition and insurance expenses |
|
2,238
|
|
2,258 | |||
|
Interest expense |
|
577
|
|
565 | |||
|
Loss on extinguishment of debt |
|
340
|
|
– | |||
|
Other expenses |
|
870
|
|
680 | |||
|
Total benefits, claims and expenses |
|
13,056
|
|
13,031 | |||
|
Income from continuing operations before income tax expense |
|
2,832
|
|
4,466 | |||
|
Income tax expense |
|
694
|
|
1,081 | |||
|
Income from continuing operations |
|
2,138
|
|
3,385 | |||
|
Income from discontinued operations, net of income tax expense |
|
93
|
|
64 | |||
|
Net income |
|
2,231
|
|
3,449 | |||
|
Less: |
|
|
|
||||
|
Net income from continuing operations attributable to
|
|
|
|
||||
|
Nonvoting, callable, junior and senior preferred interests |
|
–
|
|
208 | |||
|
Other |
|
25
|
|
33 | |||
|
Total net income from continuing operations attributable to
|
|
25
|
|
241 | |||
|
Net income attributable to AIG |
$
|
2,206
|
|
$ | 3,208 | ||
|
Income per common share attributable to AIG: |
|
|
|
||||
|
Basic and diluted: |
|
|
|
||||
|
Income from continuing operations |
$
|
1.43
|
|
$ | 1.68 | ||
|
Income from discontinued operations |
$
|
0.06
|
|
$ | 0.03 | ||
|
Net Income attributable to AIG |
$
|
1.49
|
|
$ | 1.71 | ||
|
Weighted average shares outstanding: |
|
|
|
||||
|
Basic |
|
1,476,471,097
|
|
1,875,972,970 | |||
|
Diluted |
|
1,476,678,931
|
|
1,876,002,775 | |||
See accompanying Notes to Condensed Consolidated Financial Statements.
3
ITEM 1. / FINANCIAL STATEMENTS
AMERICAN INTERNATIONAL GROUP, INC.
CONDENSED CONSOLIDATED STATEMENT OF COMPREHENSIVE INCOME (unaudited)
|
|
|
|
|||||
|---|---|---|---|---|---|---|---|
|
Three Months Ended March 31,
(in millions) |
2013
|
2012
|
|||||
|
Net income |
$
|
2,231
|
|
$ | 3,449 | ||
|
Other comprehensive income (loss), net of tax |
|
|
|
||||
|
Change in unrealized appreciation of fixed maturity investments on which
|
|
282
|
|
613 | |||
|
Change in unrealized appreciation (depreciation) of all other investments |
|
(788
|
)
|
981 | |||
|
Change in foreign currency translation adjustments |
|
(273
|
)
|
91 | |||
|
Change in net derivative gains arising from cash flow hedging activities |
|
–
|
|
22 | |||
|
Change in retirement plan liabilities adjustment |
|
44
|
|
18 | |||
|
Other comprehensive income (loss) |
|
(735
|
)
|
1,725 | |||
|
Comprehensive income |
|
1,496
|
|
5,174 | |||
|
Comprehensive income attributable to noncontrolling nonvoting, callable, junior and senior
|
|
–
|
|
208 | |||
|
Comprehensive income attributable to other noncontrolling interests |
|
25
|
|
38 | |||
|
Total comprehensive income attributable to noncontrolling interests |
|
25
|
|
246 | |||
|
Comprehensive income attributable to AIG |
$
|
1,471
|
|
$ | 4,928 | ||
See accompanying Notes to Condensed Consolidated Financial Statements.
4
ITEM 1. / FINANCIAL STATEMENTS
AMERICAN INTERNATIONAL GROUP, INC.
CONDENSED CONSOLIDATED STATEMENT OF EQUITY (unaudited)
|
Three Months Ended
March 31, 2013 (in millions) |
Common
Stock |
Treasury
Stock |
Additional
Paid-in Capital |
Retained
Earnings |
Accumulated
Other Comprehensive Income |
Total AIG
Share- holders' Equity |
Non
redeemable Non- controlling Interests |
Total
Equity |
|||||||||||||||||
|---|---|---|---|---|---|---|---|---|---|---|---|---|---|---|---|---|---|---|---|---|---|---|---|---|---|
|
Balance, beginning of year |
$ | 4,766 | $ | (13,924 | ) | $ | 80,410 | $ | 14,176 | $ | 12,574 | $ | 98,002 | $ | 667 | $ | 98,669 | ||||||||
|
Net income attributable to
|
– | – | – | 2,206 | – | 2,206 | 10 | 2,216 | |||||||||||||||||
|
Other comprehensive loss |
– | – | – | – | (735 | ) | (735 | ) | (1 | ) | (736 | ) | |||||||||||||
|
Deferred income taxes |
– | – | (5 | ) | – | – | (5 | ) | – | (5 | ) | ||||||||||||||
|
Contributions from
|
– | – | – | – | – | – | 8 | 8 | |||||||||||||||||
|
Distributions to noncontrolling
|
– | – | – | – | – | – | (19 | ) | (19 | ) | |||||||||||||||
|
Other |
– | 1 | 51 | – | – | 52 | (2 | ) | 50 | ||||||||||||||||
|
Balance, end of period |
$ | 4,766 | $ | (13,923 | ) | $ | 80,456 | $ | 16,382 | $ | 11,839 | $ | 99,520 | $ | 663 | $ | 100,183 | ||||||||
* Excludes gains of $15 million for the three months ended March 31, 2013 attributable to redeemable noncontrolling interests. See Note 12 to the Condensed Consolidated Financial Statements.
See accompanying Notes to Condensed Consolidated Financial Statements.
5
ITEM 1. / FINANCIAL STATEMENTS
CONDENSED CONSOLIDATED STATEMENT OF CASH FLOWS (unaudited)
|
|
|
|
|||||
|---|---|---|---|---|---|---|---|
|
Three Months Ended March 31,
(in millions) |
2013
|
2012
|
|||||
|
Cash flows from operating activities: |
|
|
|
||||
|
Net income |
$
|
2,231
|
|
$ | 3,449 | ||
|
Income from discontinued operations |
|
(93
|
)
|
(64 | ) | ||
|
Adjustments to reconcile net income to net cash provided by (used in) operating activities: |
|
|
|
||||
|
Noncash revenues, expenses, gains and losses included in income: |
|
|
|
||||
|
Net gains on sales of securities available for sale and other assets |
|
(339
|
)
|
(925 | ) | ||
|
Net (gains) losses on extinguishment of debt |
|
340
|
|
– | |||
|
Unrealized gains in earnings — net |
|
(769
|
)
|
(3,425 | ) | ||
|
Equity in income from equity method investments, net of dividends or distributions |
|
(442
|
)
|
(225 | ) | ||
|
Depreciation and other amortization |
|
1,180
|
|
1,215 | |||
|
Impairments of assets |
|
139
|
|
687 | |||
|
Changes in operating assets and liabilities: |
|
|
|
||||
|
Property casualty and life insurance reserves |
|
643
|
|
271 | |||
|
Premiums and other receivables and payables — net |
|
(474
|
)
|
(51 | ) | ||
|
Reinsurance assets and funds held under reinsurance treaties |
|
(2,035
|
)
|
(1,059 | ) | ||
|
Capitalization of deferred policy acquisition costs |
|
(1,422
|
)
|
(1,417 | ) | ||
|
Current and deferred income taxes — net |
|
590
|
|
1,003 | |||
|
Other, net |
|
(326
|
)
|
47 | |||
|
Total adjustments |
|
(2,915
|
)
|
(3,879 | ) | ||
|
Net cash used in operating activities — continuing operations |
|
(777
|
)
|
(494 | ) | ||
|
Net cash provided by operating activities — discontinued operations |
|
628
|
|
588 | |||
|
Net cash provided by (used in) operating activities |
|
(149
|
)
|
94 | |||
|
Cash flows from investing activities: |
|
|
|
||||
|
Proceeds from (payments for) |
|
|
|
||||
|
Sales or distribution of: |
|
|
|
||||
|
Available for sale investments |
|
7,346
|
|
10,749 | |||
|
Trading securities |
|
1,728
|
|
3,080 | |||
|
Other invested assets |
|
1,740
|
|
6,781 | |||
|
Maturities of fixed maturity securities available for sale |
|
5,617
|
|
4,853 | |||
|
Principal payments received on and sales of mortgage and other loans receivable |
|
703
|
|
709 | |||
|
Purchases of: |
|
|
|
||||
|
Available for sale investments |
|
(15,290
|
)
|
(13,955 | ) | ||
|
Trading securities |
|
(822
|
)
|
(924 | ) | ||
|
Other invested assets |
|
(1,269
|
)
|
(1,196 | ) | ||
|
Mortgage and other loans receivable issued and purchased |
|
(788
|
)
|
(794 | ) | ||
|
Net change in restricted cash |
|
(8
|
)
|
(561 | ) | ||
|
Net change in short-term investments |
|
5,721
|
|
1,480 | |||
|
Other, net |
|
(291
|
)
|
(463 | ) | ||
|
Net cash provided by investing activities — continuing operations |
|
4,387
|
|
9,759 | |||
|
Net cash provided by (used in) investing activities — discontinued operations |
|
(423
|
)
|
222 | |||
|
Net cash provided by investing activities |
|
3,964
|
|
9,981 | |||
|
Cash flows from financing activities: |
|
|
|
||||
|
Proceeds from (payments for) |
|
|
|
||||
|
Policyholder contract deposits |
|
3,262
|
|
3,510 | |||
|
Policyholder contract withdrawals |
|
(4,458
|
)
|
(3,930 | ) | ||
|
Issuance of long-term debt |
|
131
|
|
2,230 | |||
|
Repayments of long-term debt |
|
(2,861
|
)
|
(1,994 | ) | ||
|
Repayment of Department of the Treasury SPV Preferred Interests |
|
–
|
|
(8,636 | ) | ||
|
Purchase of Common Stock |
|
–
|
|
(3,000 | ) | ||
|
Other, net |
|
430
|
|
1,345 | |||
|
Net cash used in financing activities — continuing operations |
|
(3,496
|
)
|
(10,475 | ) | ||
|
Net cash provided by (used in) financing activities — discontinued operations |
|
(222
|
)
|
243 | |||
|
Net cash used in financing activities |
|
(3,718
|
)
|
(10,232 | ) | ||
|
Effect of exchange rate changes on cash |
|
(36
|
)
|
(2 | ) | ||
|
Net increase (decrease) in cash |
|
61
|
|
(159 | ) | ||
|
Cash at beginning of period |
|
1,151
|
|
1,474 | |||
|
Change in cash of businesses held for sale |
|
15
|
|
– | |||
|
Cash at end of period |
$
|
1,227
|
|
$ | 1,315 | ||
6
Supplementary Disclosure of Condensed Consolidated Cash Flow Information
|
|
|
|
|||||
|---|---|---|---|---|---|---|---|
|
Three Months Ended March 31,
(in millions) |
2013
|
2012
|
|||||
|
Cash paid during the period for: |
|
|
|
||||
|
Interest |
$
|
983
|
|
$ | 939 | ||
|
Taxes |
$
|
103
|
|
$ | 97 | ||
|
Non-cash investing/financing activities: |
|
|
|
||||
|
Interest credited to policyholder contract deposits included in financing activities |
$
|
1,005
|
|
$ | 1,100 | ||
See accompanying Notes to Condensed Consolidated Financial Statements.
7
ITEM 1. / NOTE 1. BASIS OF PRESENTATION
NOTES TO CONDENSED CONSOLIDATED FINANCIAL STATEMENTS (unaudited)
1. BASIS OF PRESENTATION
American International Group, Inc. (AIG) is a leading international insurance organization serving customers in more than 130 countries. AIG companies serve commercial, institutional and individual customers through one of the most extensive worldwide property-casualty networks of any insurer. In addition, AIG companies are leading providers of life insurance and retirement services in the United States. AIG Common Stock, par value $2.50 per share (AIG Common Stock), is listed on the New York Stock Exchange and the Tokyo Stock Exchange. Unless the context indicates otherwise, the terms "AIG," "we," "us" or "our" mean American International Group, Inc. and its consolidated subsidiaries and the term "AIG Parent" means American International Group, Inc. and not any of its consolidated subsidiaries.
These unaudited condensed consolidated financial statements do not include all disclosures that are normally included in annual financial statements prepared in accordance with accounting principles generally accepted in the United States (GAAP) and should be read in conjunction with the audited consolidated financial statements and the related notes included in our Annual Report on Form 10-K for the year ended December 31, 2012 (2012 Annual Report). The condensed consolidated financial information as of December 31, 2012 included herein has been derived from audited consolidated financial statements in the 2012 Annual Report.
Certain of our foreign subsidiaries included in the condensed consolidated financial statements report on different fiscal-period bases. The effect on our condensed consolidated financial condition and results of operations of all material events occurring at these subsidiaries through the date of each of the periods presented in these condensed financial statements has been recorded. In the opinion of management, these condensed consolidated financial statements contain normal recurring adjustments, including eliminations of material intercompany accounts and transactions, necessary for a fair statement of the results presented herein.
Interim period operating results may not be indicative of the operating results for a full year. We evaluated the need to recognize or disclose events that occurred subsequent to March 31, 2013 and prior to the issuance of these consolidated financial statements.
Presentation Changes
Advisory fee income, and the related commissions and advisory fee expenses of AIG Life and Retirement's broker dealer business, are now being presented on a gross basis within Other income and Other expenses, respectively. Previously, these amounts were included on a net basis within Policy fees on AIG's Condensed Consolidated Statement of Income and in AIG Life and Retirement's segment results.
In addition, policyholder benefits related to certain payout annuities, primarily with life contingent features, are now being presented on the Condensed Consolidated Balance Sheet as Future policy benefits for life and accident and health insurance contracts instead of as Policyholder contract deposits.
Prior period amounts were conformed to the current period presentation. These changes did not affect Income from continuing operations before income tax expense, Net income attributable to AIG or Total liabilities.
Use of Estimates
The preparation of financial statements in accordance with GAAP requires the application of accounting policies that often involve a significant degree of judgment. We consider the accounting policies that are most dependent on the application of estimates and assumptions to be those relating to items considered by management in the determination of:
- •
-
classification of International Lease Finance Corporation (ILFC) as held for sale;
- •
-
insurance liabilities, including property casualty and mortgage guaranty unpaid claims and claims adjustment expenses and
future policy benefits for life and accident and health contracts;
- •
- income tax assets and liabilities, including recoverability of our net deferred tax asset and the predictability of future tax operating profitability of the character necessary to realize the net deferred tax asset;
8
NOTES TO CONDENSED CONSOLIDATED FINANCIAL STATEMENTS (unaudited)
- •
-
recoverability of assets including reinsurance assets;
- •
-
estimated gross profits for investment-oriented products;
- •
-
impairment charges, including other-than-temporary impairments of financial instruments and
goodwill impairments;
- •
-
liabilities for legal contingencies; and
- •
- fair value measurements of certain financial assets and liabilities.
These accounting estimates require the use of assumptions about matters, some of which are highly uncertain at the time of estimation. To the extent actual experience differs from the assumptions used, our consolidated financial condition, results of operations and cash flows could be materially affected.
2. SUMMARY OF SIGNIFICANT ACCOUNTING POLICIES
Accounting Standards Adopted During 2013
Testing Indefinite-Lived Intangible Assets for Impairment
In July 2012, the Financial Accounting Standards Board (FASB) issued an accounting standard that allows a company to first assess qualitatively whether it is more likely than not that an indefinite-lived intangible asset is impaired. We are not required to calculate the fair value of an indefinite-lived intangible asset and perform the quantitative impairment test unless we determine that it is more likely than not the asset is impaired.
The standard is effective for annual and interim impairment tests performed for fiscal years beginning after September 15, 2012. We adopted the standard on its required effective date of January 1, 2013. The adoption of this standard had no material effect on our consolidated financial condition, results of operations or cash flows.
Disclosures about Offsetting Assets and Liabilities
In February 2013, the FASB issued guidance that clarifies the scope of transactions subject to disclosures about offsetting assets and liabilities. The guidance applies to derivatives, repurchase agreements and reverse purchase agreements, and securities borrowing and securities lending transactions that are offset either in accordance with specific criteria contained in FASB Accounting Standards Codification or subject to a master netting arrangement or similar agreement.
The standard is effective for fiscal years and interim periods beginning on or after January 1, 2013, and was applied retrospectively to all comparative periods presented. The adoption of this standard had no material effect on our consolidated financial condition, results of operations or cash flows.
Presentation of Comprehensive Income
In February 2013, the FASB issued guidance on the presentation requirements for items reclassified out of Accumulated other comprehensive income. We are required to disclose the effect of significant items reclassified out of Accumulated other comprehensive income on the respective line items of net income or provide a cross-reference to other disclosures currently required under GAAP.
The standard is effective prospectively for annual and interim reporting periods beginning after December 15, 2012. The adoption of this standard had no effect on our consolidated financial condition, results of operations or cash flows.
9
NOTES TO CONDENSED CONSOLIDATED FINANCIAL STATEMENTS (unaudited)
Future Application of Accounting Standards
Certain Obligations Resulting from Joint and Several Liability Arrangements
In February 2013, the FASB issued an accounting standard that requires us to measure obligations resulting from joint and several liability arrangements for which the total amount of the obligation is fixed at the reporting date as the sum of (i) the amount we agreed to pay on the basis of our arrangement among our co-obligors and (ii) any additional amount we expect to pay on behalf of our co-obligors. The standard is effective for fiscal years and interim periods beginning after December 15, 2013, but earlier adoption is permitted. Upon adoption, the guidance should be applied retrospectively to all prior periods presented. We are assessing the effect of adopting this standard on our consolidated financial statements.
Parent's Accounting for the Cumulative Translation Adjustment upon Derecognition of an Investment within a Foreign Entity or of an Investment in a Foreign Entity
In March 2013, the FASB issued guidance about whether consolidation guidance or foreign currency guidance applies to the release of the cumulative translation adjustment into net income when a parent sells all or a part of its investment in a foreign entity or no longer holds a controlling financial interest in a subsidiary or net assets that are a business (other than a sale of in-substance real estate) within a foreign entity. The guidance also resolves the diversity in practice for the cumulative translation adjustment treatment in business combinations achieved in stages involving foreign entities.
Under this guidance, the entire amount of the cumulative translation adjustment associated with the foreign entity would be released into earnings when there has been: (i) a sale of a subsidiary or group of net assets within a foreign entity and the sale represents a complete or substantially complete liquidation of the foreign entity in which the subsidiary or the net assets had resided; (ii) a loss of a controlling financial interest in an investment in a foreign entity; or (iii) a change in accounting method from applying the equity method to an investment in a foreign entity to consolidating the foreign entity.
The standard is effective for fiscal years and interim periods beginning on or after January 1, 2014, and will be applied prospectively. We do not expect adoption of the standard to have a material effect on our consolidated financial condition, results of operations or cash flows.
3. SEGMENT INFORMATION
We report the results of our operations through two reportable segments: AIG Property Casualty and AIG Life and Retirement. We evaluate performance based on revenues and pre-tax income (loss), excluding results from discontinued operations, because we believe this provides more meaningful information on how our operations are performing.
AIG Property Casualty Investment Income Allocation
Investment income is allocated to the Commercial Insurance and Consumer Insurance operating segments based on an internal investment income allocation model. The model estimates investable funds based primarily on loss reserves and allocated capital. Starting with the first quarter of 2013, AIG Property Casualty began applying similar duration and risk-free yields (plus an illiquidity premium) to the allocated capital of Commercial Insurance and Consumer Insurance as is applied to reserves.
AIG Life and Retirement Operating Segment Change
In 2012, AIG Life and Retirement announced several key organizational structure and management changes intended to better serve the organization's distribution partners and customers. Key aspects of the new structure include distinct product manufacturing divisions, shared annuity and life operations platforms and a unified all-channel distribution organization with access to all AIG Life and Retirement products.
10
NOTES TO CONDENSED CONSOLIDATED FINANCIAL STATEMENTS (unaudited)
In addition, during the first quarter of 2013, AIG Life and Retirement completed its previously announced reporting structure changes and now presents its results in the following two operating segments:
Retail - product lines include life insurance and accident and health (A&H), fixed annuities, retirement income solutions (including variable and indexed annuities), brokerage services and retail mutual funds.
Institutional - product lines include group retirement, group benefits and institutional markets. The institutional markets product line consists of stable value wrap products, structured settlement and terminal funding annuities, private placement variable life and annuities, guaranteed investment contracts (GICs), and corporate and bank-owned life insurance.
Prior to the first quarter of 2013, AIG Life and Retirement was presented as two operating segments: Life Insurance and Retirement Services. These changes align financial reporting with the manner in which AIG's chief operating decision makers review the business to assess performance and to allocate resources. Prior periods have been revised to reflect the new structure, which did not affect previously reported pre-tax income from continuing operations for AIG Life and Retirement.
The following table presents AIG's operations by reportable segment:
|
|
|
|
|
||||||||||
|---|---|---|---|---|---|---|---|---|---|---|---|---|---|
|
|
2013 | 2012 | |||||||||||
|
Three Months Ended March 31,
(in millions) |
Total Revenues
|
Pre-tax Income from
|
Total Revenues
|
Pre-tax Income from
continuing operations |
|||||||||
|
AIG Property Casualty |
|
|
|
|
|
|
|||||||
|
Commercial Insurance |
$
|
5,773
|
|
$
|
1,041
|
|
$ | 5,893 | $ | 645 | |||
|
Consumer Insurance |
|
3,506
|
|
|
153
|
|
3,612 | 234 | |||||
|
Other |
|
680
|
|
|
410
|
|
293 | 31 | |||||
|
Total AIG Property Casualty |
$
|
9,959
|
|
$
|
1,604
|
|
$ | 9,798 | $ | 910 | |||
|
AIG Life and Retirement |
|
|
|
|
|
|
|||||||
|
Retail |
|
3,003
|
|
|
996
|
|
2,399 | 484 | |||||
|
Institutional |
|
1,737
|
|
|
574
|
|
1,503 | 378 | |||||
|
Total AIG Life and Retirement |
$
|
4,740
|
|
$
|
1,570
|
|
$ | 3,902 | $ | 862 | |||
|
Other Operations |
|
|
|
|
|
|
|||||||
|
Mortgage Guaranty |
|
231
|
|
|
44
|
|
200 | 8 | |||||
|
Global Capital Markets |
|
273
|
|
|
227
|
|
160 | 88 | |||||
|
Direct Investment Book |
|
411
|
|
|
312
|
|
344 | 248 | |||||
|
Retained Interests |
|
–
|
|
|
–
|
|
3,047 | 3,047 | |||||
|
Corporate & Other |
|
402
|
|
|
(998
|
)
|
262 | (658 | ) | ||||
|
Consolidation and Elimination |
|
(9
|
)
|
|
1
|
|
(10 | ) | 3 | ||||
|
Total Other Operations |
$
|
1,308
|
|
$
|
(414
|
)
|
$ | 4,003 | $ | 2,736 | |||
|
AIG Consolidation and Elimination |
|
(119
|
)
|
|
72
|
|
(206 | ) | (42 | ) | |||
|
Total AIG Consolidated |
$
|
15,888
|
|
$
|
2,832
|
|
$ | 17,497 | $ | 4,466 | |||
4. HELD-FOR-SALE CLASSIFICATION AND DISCONTINUED OPERATIONS
International Lease Finance Corporation Sale
On December 9, 2012, we entered into a definitive agreement with Jumbo Acquisition Limited for the sale of 80.1 percent of the common stock of ILFC for approximately $4.2 billion in cash (the ILFC Transaction). Jumbo Acquisition Limited may elect to purchase an additional 9.9 percent of the common stock of ILFC for $522.5 million (the Option) within ten days after approval of the ILFC Transaction and the Option by the Committee on Foreign Investment in the United States. We will retain a 10 percent ownership interest in ILFC if the Option is exercised, or a 19.9 percent ownership interest in ILFC if the Option is not exercised by Jumbo Acquisition Limited. If the Option is exercised, we expect our ownership at closing will be 9.4 percent due to immediate dilution from anticipated management issuances. The transaction is subject to required regulatory approvals and other customary closing conditions.
11
ITEM 1. / NOTE 4. HELD-FOR-SALE CLASSIFICATION AND DISCONTINUED OPERATIONS
NOTES TO CONDENSED CONSOLIDATED FINANCIAL STATEMENTS (unaudited)
We determined ILFC met the criteria for held for sale and discontinued operations accounting at March 31, 2013 and December 31, 2012. Depreciation and amortization expense is not recorded on the assets of a business after the business is classified as held for sale. At the closing of the transaction, AIG will return $1.1 billion to ILFC in connection with the termination of intercompany arrangements between AIG and ILFC.
The following table summarizes the components of assets and liabilities held-for-sale on the Condensed Consolidated Balance Sheet as of March 31, 2013 and December 31, 2012:
|
|
|
|
|||||
|---|---|---|---|---|---|---|---|
|
(in millions)
|
March 31,
|
December 31,
2012 |
|||||
|
Assets: |
|
|
|
||||
|
Equity securities |
$
|
2
|
|
$ | 1 | ||
|
Mortgage and other loans receivable, net |
|
118
|
|
117 | |||
|
Flight equipment primarily under operating leases, net of accumulated depreciation |
|
34,810
|
|
34,468 | |||
|
Short-term investments |
|
2,103
|
|
1,861 | |||
|
Cash |
|
48
|
|
63 | |||
|
Premiums and other receivables, net of allowance |
|
291
|
|
308 | |||
|
Other assets |
|
1,714
|
|
1,864 | |||
|
Assets of businesses held for sale |
|
39,086
|
|
38,682 | |||
|
Less: Loss accrual |
|
(7,270
|
)
|
(6,717 | ) | ||
|
Total assets held for sale |
$
|
31,816
|
|
$ | 31,965 | ||
|
Liabilities: |
|
|
|
||||
|
Other liabilities |
$
|
3,050
|
|
$ | 3,043 | ||
|
Other long-term debt |
|
24,114
|
|
24,323 | |||
|
Total liabilities held for sale |
$
|
27,164
|
|
$ | 27,366 | ||
The following table summarizes income from discontinued operations:
|
|
|
|
|||||
|---|---|---|---|---|---|---|---|
|
Three Months Ended March 31,
(in millions) |
2013
|
2012
|
|||||
|
Revenues: |
|
|
|
||||
|
Aircraft leasing revenue |
$
|
1,078
|
|
$ | 1,156 | ||
|
Net realized capital gains |
|
(1
|
)
|
1 | |||
|
Other income |
|
(3
|
)
|
(5 | ) | ||
|
Total revenues |
|
1,074
|
|
1,152 | |||
|
Benefits, claims and expenses, excluding Aircraft leasing expenses * |
|
388
|
|
409 | |||
|
Aircraft leasing expenses |
|
90
|
|
625 | |||
|
Income from discontinued operations |
|
596
|
|
118 | |||
|
Gain (loss) on sale |
|
(436
|
)
|
20 | |||
|
Income from discontinued operations, before tax income tax expense |
|
160
|
|
138 | |||
|
Income tax expense |
|
67
|
|
74 | |||
|
Income from discontinued operations, net of income tax |
$
|
93
|
|
$ | 64 | ||
We recorded a $4.4 billion after tax loss on the sale of ILFC for the year ended December 31, 2012. In the three month period ended March 31, 2013, we recorded an additional $553 million pre-tax loss on the sale of ILFC, largely offsetting ILFC operating results for the period. ILFC operating results did not include depreciation and amortization expense in the three month period ended March 31, 2013 as a result of its classification as held for sale.
12
NOTES TO CONDENSED CONSOLIDATED FINANCIAL STATEMENTS (unaudited)
We also recognized in the first quarter of 2013 a $117 million pre-tax gain in connection with the sale of American Life Insurance Company (ALICO) as a result of a refund of taxes, interest and penalties after a successful appeal to the Japanese tax authorities related to the deduction of unrealized foreign exchange losses on certain bond securities held by ALICO prior to its sale to MetLife, Inc. (MetLife) in 2010.
5. FAIR VALUE MEASUREMENTS
Fair Value Measurements on a Recurring Basis
We carry certain of our financial instruments at fair value. We define the fair value of a financial instrument as the amount that would be received from the sale of an asset or paid to transfer a liability in an orderly transaction between market participants at the measurement date. You should read the following in conjunction with Note 6 to the Consolidated Financial Statements in the 2012 Annual Report for a complete discussion of our accounting policies and procedures regarding fair value measurements.
Assets and liabilities recorded at fair value in the Condensed Consolidated Balance Sheet are measured and classified in accordance with a fair value hierarchy consisting of three "levels" based on the observability of inputs available in the marketplace used to measure the fair values as discussed below:
- •
-
Level 1:
Fair value
measurements that are quoted prices (unadjusted) in active markets that AIG has the ability to access for identical assets or liabilities. Market price data generally is obtained from exchange or
dealer markets. We do not adjust the quoted price for such instruments.
- •
-
Level 2:
Fair value
measurements based on inputs other than quoted prices included in Level 1, that are observable for the asset or liability, either directly or indirectly. Level 2 inputs include quoted
prices for similar assets and liabilities in active markets, quoted prices for identical or similar assets or liabilities in markets that are not active, and inputs other than quoted prices that are
observable for the asset or liability, such as interest rates and yield curves that are observable at commonly quoted intervals.
- •
- Level 3: Fair value measurements based on valuation techniques that use significant inputs that are unobservable. Both observable and unobservable inputs may be used to determine the fair values of positions classified in Level 3. The circumstances for using these measurements include those in which there is little, if any, market activity for the asset or liability. Therefore, we must make certain assumptions as to the inputs a hypothetical market participant would use to value that asset or liability. In certain cases, the inputs used to measure fair value may fall into different levels of the fair value hierarchy. In those cases, the level in the fair value hierarchy within which the fair value measurement in its entirety falls is determined based on the lowest level input that is significant to the fair value measurement in its entirety.
13
ITEM 1. / NOTE 5. FAIR VALUE MEASUREMENTS
NOTES TO CONDENSED CONSOLIDATED FINANCIAL STATEMENTS (unaudited)
Assets and Liabilities Measured at Fair Value on a Recurring Basis
The following table presents information about assets and liabilities measured at fair value on a recurring basis and indicates the level of the fair value measurement based on the observability of the inputs used:
|
March 31, 2013
(in millions) |
Level 1
|
Level 2
|
Level 3
|
Counterparty
Netting (a) |
Cash
Collateral (b) |
Total
|
|||||||||||||
|---|---|---|---|---|---|---|---|---|---|---|---|---|---|---|---|---|---|---|---|
|
Assets: |
|||||||||||||||||||
|
Bonds available for sale: |
|||||||||||||||||||
|
U.S. government and government sponsored entities |
$ | – | $ | 3,496 | $ | – | $ | – | $ | – | $ | 3,496 | |||||||
|
Obligations of states, municipalities and political subdivisions |
– | 34,092 | 1,019 | – | – | 35,111 | |||||||||||||
|
Non-U.S. governments |
690 | 24,667 | 18 | – | – | 25,375 | |||||||||||||
|
Corporate debt |
– | 148,857 | 1,449 | – | – | 150,306 | |||||||||||||
|
RMBS |
– | 24,030 | 12,096 | – | – | 36,126 | |||||||||||||
|
CMBS |
– | 5,096 | 5,315 | – | – | 10,411 | |||||||||||||
|
CDO/ABS |
– | 3,849 | 5,577 | – | – | 9,426 | |||||||||||||
|
Total bonds available for sale |
690 | 244,087 | 25,474 | – | – | 270,251 | |||||||||||||
|
Bond trading securities: |
|||||||||||||||||||
|
U.S. government and government sponsored entities |
174 | 6,165 | – | – | – | 6,339 | |||||||||||||
|
Obligations of states, municipalities and political subdivisions |
– | 183 | – | – | – | 183 | |||||||||||||
|
Non-U.S. governments |
– | 2 | – | – | – | 2 | |||||||||||||
|
Corporate debt |
– | 1,138 | – | – | – | 1,138 | |||||||||||||
|
RMBS |
– | 1,239 | 730 | – | – | 1,969 | |||||||||||||
|
CMBS |
– | 1,143 | 776 | – | – | 1,919 | |||||||||||||
|
CDO/ABS |
– | 3,463 | 8,842 | – | – | 12,305 | |||||||||||||
|
Total bond trading securities |
174 | 13,333 | 10,348 | – | – | 23,855 | |||||||||||||
|
Equity securities available for sale: |
|||||||||||||||||||
|
Common stock |
2,899 | 1 | 22 | – | – | 2,922 | |||||||||||||
|
Preferred stock |
– | 33 | 49 | – | – | 82 | |||||||||||||
|
Mutual funds |
81 | 23 | – | – | – | 104 | |||||||||||||
|
Total equity securities available for sale |
2,980 | 57 | 71 | – | – | 3,108 | |||||||||||||
|
Equity securities trading |
614 | 82 | – | – | – | 696 | |||||||||||||
|
Mortgage and other loans receivable |
– | 58 | – | – | – | 58 | |||||||||||||
|
Other invested assets |
129 | 1,721 | 5,467 | – | – | 7,317 | |||||||||||||
|
Derivative assets: |
|||||||||||||||||||
|
Interest rate contracts |
5 | 4,869 | 961 | – | – | 5,835 | |||||||||||||
|
Foreign exchange contracts |
– | 81 | – | – | – | 81 | |||||||||||||
|
Equity contracts |
132 | 51 | 69 | – | – | 252 | |||||||||||||
|
Commodity contracts |
– | 146 | 1 | – | – | 147 | |||||||||||||
|
Credit contracts |
– | – | 59 | – | – | 59 | |||||||||||||
|
Other contracts |
– | – | 38 | – | – | 38 | |||||||||||||
|
Counterparty netting and cash collateral |
– | – | – | (2,234 | ) | (888 | ) | (3,122 | ) | ||||||||||
|
Total derivative assets |
137 | 5,147 | 1,128 | (2,234 | ) | (888 | ) | 3,290 | |||||||||||
|
Short-term investments |
218 | 6,194 | – | – | – | 6,412 | |||||||||||||
|
Separate account assets |
58,111 | 2,948 | – | – | – | 61,059 | |||||||||||||
|
Other assets |
– | 694 | – | – | – | 694 | |||||||||||||
|
Total |
$ | 63,053 | $ | 274,321 | $ | 42,488 | $ | (2,234 | ) | $ | (888 | ) | $ | 376,740 | |||||
|
Liabilities: |
|||||||||||||||||||
|
Policyholder contract deposits |
$ | – | $ | – | $ | 1,047 | $ | – | $ | – | $ | 1,047 | |||||||
|
Derivative liabilities: |
|||||||||||||||||||
|
Interest rate contracts |
– | 5,190 | 205 | – | – | 5,395 | |||||||||||||
|
Foreign exchange contracts |
– | 128 | – | – | – | 128 | |||||||||||||
|
Equity contracts |
– | 109 | 3 | – | – | 112 | |||||||||||||
|
Commodity contracts |
– | 148 | – | – | – | 148 | |||||||||||||
|
Credit contracts |
– | – | 1,834 | – | – | 1,834 | |||||||||||||
|
Other contracts |
– | 6 | 177 | – | – | 183 | |||||||||||||
|
Counterparty netting and cash collateral |
– | – | – | (2,234 | ) | (1,855 | ) | (4,089 | ) | ||||||||||
|
Total derivative liabilities |
– | 5,581 | 2,219 | (2,234 | ) | (1,855 | ) | 3,711 | |||||||||||
|
Long-term debt |
– | 7,256 | 407 | – | – | 7,663 | |||||||||||||
|
Other liabilities |
5 | 919 | – | – | – | 924 | |||||||||||||
|
Total |
$ | 5 | $ | 13,756 | $ | 3,673 | $ | (2,234 | ) | $ | (1,855 | ) | $ | 13,345 | |||||
14
ITEM 1. / NOTE 5. FAIR VALUE MEASUREMENTS
NOTES TO CONDENSED CONSOLIDATED FINANCIAL STATEMENTS (unaudited)
|
December 31, 2012
(in millions) |
Level 1
|
Level 2
|
Level 3
|
Counterparty
Netting (a) |
Cash
Collateral (b) |
Total
|
|||||||||||||
|---|---|---|---|---|---|---|---|---|---|---|---|---|---|---|---|---|---|---|---|
|
Assets: |
|||||||||||||||||||
|
Bonds available for sale: |
|||||||||||||||||||
|
U.S. government and government sponsored entities |
$ | – | $ | 3,483 | $ | – | $ | – | $ | – | $ | 3,483 | |||||||
|
Obligations of states, municipalities and political subdivisions |
– | 34,681 | 1,024 | – | – | 35,705 | |||||||||||||
|
Non-U.S. governments |
1,004 | 25,782 | 14 | – | – | 26,800 | |||||||||||||
|
Corporate debt |
– | 149,625 | 1,487 | – | – | 151,112 | |||||||||||||
|
RMBS |
– | 22,730 | 11,662 | – | – | 34,392 | |||||||||||||
|
CMBS |
– | 5,010 | 5,124 | – | – | 10,134 | |||||||||||||
|
CDO/ABS |
– | 3,492 | 4,841 | – | – | 8,333 | |||||||||||||
|
Total bonds available for sale |
1,004 | 244,803 | 24,152 | – | – | 269,959 | |||||||||||||
|
Bond trading securities: |
|||||||||||||||||||
|
U.S. government and government sponsored entities |
266 | 6,528 | – | – | – | 6,794 | |||||||||||||
|
Non-U.S. governments |
– | 2 | – | – | – | 2 | |||||||||||||
|
Corporate debt |
– | 1,320 | – | – | – | 1,320 | |||||||||||||
|
RMBS |
– | 1,331 | 396 | – | – | 1,727 | |||||||||||||
|
CMBS |
– | 1,424 | 812 | – | – | 2,236 | |||||||||||||
|
CDO/ABS |
– | 3,969 | 8,536 | – | – | 12,505 | |||||||||||||
|
Total bond trading securities |
266 | 14,574 | 9,744 | – | – | 24,584 | |||||||||||||
|
Equity securities available for sale: |
|||||||||||||||||||
|
Common stock |
3,002 | 3 | 24 | – | – | 3,029 | |||||||||||||
|
Preferred stock |
– | 34 | 44 | – | – | 78 | |||||||||||||
|
Mutual funds |
83 | 22 | – | – | – | 105 | |||||||||||||
|
Total equity securities available for sale |
3,085 | 59 | 68 | – | – | 3,212 | |||||||||||||
|
Equity securities trading |
578 | 84 | – | – | – | 662 | |||||||||||||
|
Mortgage and other loans receivable |
– | 134 | – | – | – | 134 | |||||||||||||
|
Other invested assets |
125 | 1,542 | 5,389 | – | – | 7,056 | |||||||||||||
|
Derivative assets: |
|||||||||||||||||||
|
Interest rate contracts |
2 | 5,521 | 956 | – | – | 6,479 | |||||||||||||
|
Foreign exchange contracts |
– | 104 | – | – | – | 104 | |||||||||||||
|
Equity contracts |
104 | 63 | 54 | – | – | 221 | |||||||||||||
|
Commodity contracts |
– | 144 | 1 | – | – | 145 | |||||||||||||
|
Credit contracts |
– | – | 60 | – | – | 60 | |||||||||||||
|
Other contracts |
– | – | 38 | – | – | 38 | |||||||||||||
|
Counterparty netting and cash collateral |
– | – | – | (2,467 | ) | (909 | ) | (3,376 | ) | ||||||||||
|
Total derivative assets |
106 | 5,832 | 1,109 | (2,467 | ) | (909 | ) | 3,671 | |||||||||||
|
Short-term investments |
285 | 7,771 | – | – | – | 8,056 | |||||||||||||
|
Separate account assets |
54,430 | 2,907 | – | – | – | 57,337 | |||||||||||||
|
Other assets |
– | 696 | – | – | – | 696 | |||||||||||||
|
Total |
$ | 59,879 | $ | 278,402 | $ | 40,462 | $ | (2,467 | ) | $ | (909 | ) | $ | 375,367 | |||||
|
Liabilities: |
|||||||||||||||||||
|
Policyholder contract deposits |
$ | – | $ | – | $ | 1,257 | $ | – | $ | – | $ | 1,257 | |||||||
|
Derivative liabilities: |
|||||||||||||||||||
|
Interest rate contracts |
– | 5,582 | 224 | – | – | 5,806 | |||||||||||||
|
Foreign exchange contracts |
– | 174 | – | – | – | 174 | |||||||||||||
|
Equity contracts |
– | 114 | 7 | – | – | 121 | |||||||||||||
|
Commodity contracts |
– | 146 | – | – | – | 146 | |||||||||||||
|
Credit contracts |
– | – | 2,051 | – | – | 2,051 | |||||||||||||
|
Other contracts |
– | 6 | 200 | – | – | 206 | |||||||||||||
|
Counterparty netting and cash collateral |
– | – | – | (2,467 | ) | (1,976 | ) | (4,443 | ) | ||||||||||
|
Total derivative liabilities |
– | 6,022 | 2,482 | (2,467 | ) | (1,976 | ) | 4,061 | |||||||||||
|
Long-term debt |
– | 7,711 | 344 | – | – | 8,055 | |||||||||||||
|
Other liabilities |
30 | 1,050 | – | – | – | 1,080 | |||||||||||||
|
Total |
$ | 30 | $ | 14,783 | $ | 4,083 | $ | (2,467 | ) | $ | (1,976 | ) | $ | 14,453 | |||||
(a) Represents netting of derivative exposures covered by a qualifying master netting agreement.
(b) Represents cash collateral posted and received. Securities collateral posted for derivative transactions that is reflected in Fixed maturity securities in the Condensed Consolidated Balance Sheet, and collateral received, not reflected in the Condensed Consolidated Balance Sheet, was $1.7 billion and $163 million, respectively, at March 31, 2013 and $1.9 billion and $299 million, respectively, at December 31, 2012.
15
ITEM 1. / NOTE 5. FAIR VALUE MEASUREMENTS
NOTES TO CONDENSED CONSOLIDATED FINANCIAL STATEMENTS (unaudited)
Transfers of Level 1 and Level 2 Assets and Liabilities
Our policy is to record transfers of assets and liabilities between Level 1 and Level 2 at their fair values as of the end of each reporting period, consistent with the date of the determination of fair value. Assets are transferred out of Level 1 when they are no longer transacted with sufficient frequency and volume in an active market. Conversely, assets are transferred from Level 2 to Level 1 when transaction volume and frequency are indicative of an active market. During the three month period ended March 31, 2013, we transferred $239 million of securities issued by Non-U.S. government entities from Level 1 to Level 2, as they are no longer considered actively traded. For similar reasons, during the three month period ended March 31, 2013, we transferred $93 million of securities issued by the U.S. government and government-sponsored entities from Level 1 to Level 2. We had no material transfers from Level 2 to Level 1 during the three month period ended March 31, 2013.
16
ITEM 1. / NOTE 5. FAIR VALUE MEASUREMENTS
NOTES TO CONDENSED CONSOLIDATED FINANCIAL STATEMENTS (unaudited)
Changes in Level 3 Recurring Fair Value Measurements
The following tables present changes during the three month periods ended March 31, 2013 and 2012 in Level 3 assets and liabilities measured at fair value on a recurring basis, and the realized and unrealized gains (losses) related to the Level 3 assets and liabilities on the Condensed Consolidated Balance Sheet at March 31, 2013 and 2012:
|
(in millions)
|
Fair Value
Beginning of Period (a) |
Net
Realized and Unrealized Gains (Losses) Included in Income |
Accumulated
Other Comprehensive Income (Loss) |
Purchases,
Sales, Issues and Settlements, Net |
Gross
Transfers in |
Gross
Transfers out |
Fair Value
End of Period |
Changes in
Unrealized Gains (Losses) Included in Income on Instruments Held at End of Period |
|||||||||||||||||
|---|---|---|---|---|---|---|---|---|---|---|---|---|---|---|---|---|---|---|---|---|---|---|---|---|---|
|
March 31, 2013 |
|||||||||||||||||||||||||
|
Assets: |
|||||||||||||||||||||||||
|
Bonds available for
|
|||||||||||||||||||||||||
|
Obligations of states,
|
$ | 1,024 | $ | 1 | $ | (5 | ) | $ | 136 | $ | – | $ | (137 | ) | $ | 1,019 | $ | – | |||||||
|
Non-U.S.
|
14 | 1 | – | 2 | 1 | – | 18 | – | |||||||||||||||||
|
Corporate debt |
1,487 | (4 | ) | 6 | 22 | 77 | (139 | ) | 1,449 | – | |||||||||||||||
|
RMBS |
11,662 | 205 | 481 | (262 | ) | 10 | – | 12,096 | – | ||||||||||||||||
|
CMBS |
5,124 | 11 | 141 | (75 | ) | 154 | (40 | ) | 5,315 | – | |||||||||||||||
|
CDO/ABS |
4,841 | 24 | 76 | 639 | 180 | (183 | ) | 5,577 | – | ||||||||||||||||
|
Total bonds available for
|
24,152 | 238 | 699 | 462 | 422 | (499 | ) | 25,474 | – | ||||||||||||||||
|
Bond trading securities: |
|||||||||||||||||||||||||
|
RMBS |
396 | 22 | – | 74 | 238 | – | 730 | (17 | ) | ||||||||||||||||
|
CMBS |
812 | 12 | – | (99 | ) | 159 | (108 | ) | 776 | (25 | ) | ||||||||||||||
|
CDO/ABS |
8,536 | 284 | – | (436 | ) | 486 | (28 | ) | 8,842 | 82 | |||||||||||||||
|
Total bond trading
|
9,744 | 318 | – | (461 | ) | 883 | (136 | ) | 10,348 | 40 | |||||||||||||||
|
Equity securities
|
|||||||||||||||||||||||||
|
Common stock |
24 | 9 | (1 | ) | (10 | ) | – | – | 22 | – | |||||||||||||||
|
Preferred stock |
44 | – | 5 | – | – | – | 49 | – | |||||||||||||||||
|
Total equity securities
|
68 | 9 | 4 | (10 | ) | – | – | 71 | – | ||||||||||||||||
|
Other invested assets |
5,389 | 61 | (13 | ) | (3 | ) | 127 | (94 | ) | 5,467 | – | ||||||||||||||
|
Total |
$ | 39,353 | $ | 626 | $ | 690 | $ | (12 | ) | $ | 1,432 | $ | (729 | ) | $ | 41,360 | $ | 40 | |||||||
|
Liabilities: |
|||||||||||||||||||||||||
|
Policyholder contract
|
$ | (1,257 | ) | $ | 205 | $ | – | $ | 5 | $ | – | $ | – | $ | (1,047 | ) | $ | 28 | |||||||
|
Derivative liabilities,
|
|||||||||||||||||||||||||
|
Interest rate
|
732 | 11 | – | 13 | – | – | 756 | (3 | ) | ||||||||||||||||
|
Equity contracts |
47 | 28 | – | (7 | ) | (2 | ) | – | 66 | (12 | ) | ||||||||||||||
|
Commodity contracts |
1 | 1 | – | (1 | ) | – | – | 1 | – | ||||||||||||||||
|
Credit contracts |
(1,991 | ) | 175 | – | 41 | – | – | (1,775 | ) | (214 | ) | ||||||||||||||
|
Other contracts |
(162 | ) | 7 | – | 16 | – | – | (139 | ) | 13 | |||||||||||||||
|
Total derivative liabilities,
|
(1,373 | ) | 222 | – | 62 | (2 | ) | – | (1,091 | ) | (216 | ) | |||||||||||||
|
Long-term debt (b) |
(344 | ) | (80 | ) | – | 19 | (2 | ) | – | (407 | ) | 8 | |||||||||||||
|
Total |
$ | (2,974 | ) | $ | 347 | $ | – | $ | 86 | $ | (4 | ) | $ | – | $ | (2,545 | ) | $ | (180 | ) | |||||
17
ITEM 1. / NOTE 5. FAIR VALUE MEASUREMENTS
NOTES TO CONDENSED CONSOLIDATED FINANCIAL STATEMENTS (unaudited)
|
(in millions)
|
Fair value
Beginning of Period (a) |
Net
Realized and Unrealized Gains (Losses) Included in Income |
Accumulated
Other Comprehensive Income (Loss) |
Purchases,
Sales, Issues and Settlements, Net |
Gross
Transfers In |
Gross
Transfers Out |
Fair value
End of Period |
Changes in
Unrealized Gains (Losses) Included in Income on Instruments Held at End of Period |
|||||||||||||||||
|---|---|---|---|---|---|---|---|---|---|---|---|---|---|---|---|---|---|---|---|---|---|---|---|---|---|
|
March 31, 2012 |
|||||||||||||||||||||||||
|
Assets: |
|||||||||||||||||||||||||
|
Bonds available for
|
|||||||||||||||||||||||||
|
Obligations of states,
|
$ | 960 | $ | 1 | $ | 16 | $ | 100 | $ | – | $ | (23 | ) | $ | 1,054 | $ | – | ||||||||
|
Non-U.S.
|
9 | – | 8 | (2 | ) | – | – | 15 | – | ||||||||||||||||
|
Corporate debt |
1,935 | (16 | ) | 76 | (3 | ) | 291 | (960 | ) | 1,323 | – | ||||||||||||||
|
RMBS |
10,877 | (70 | ) | 793 | 1,326 | 348 | (34 | ) | 13,240 | – | |||||||||||||||
|
CMBS |
3,955 | (69 | ) | 287 | 11 | 31 | (42 | ) | 4,173 | – | |||||||||||||||
|
CDO/ABS |
4,220 | 14 | 177 | 70 | 438 | (37 | ) | 4,882 | – | ||||||||||||||||
|
Total bonds available for
|
21,956 | (140 | ) | 1,357 | 1,502 | 1,108 | (1,096 | ) | 24,687 | – | |||||||||||||||
|
Bond trading securities: |
|||||||||||||||||||||||||
|
Corporate debt |
7 | – | – | (2 | ) | – | – | 5 | – | ||||||||||||||||
|
RMBS |
303 | 33 | – | (19 | ) | – | (3 | ) | 314 | 39 | |||||||||||||||
|
CMBS |
554 | 33 | – | (135 | ) | 32 | (51 | ) | 433 | 85 | |||||||||||||||
|
CDO/ABS |
8,432 | 1,621 | – | (1,637 | ) | – | – | 8,416 | 2,122 | ||||||||||||||||
|
Total bond trading
|
9,296 | 1,687 | – | (1,793 | ) | 32 | (54 | ) | 9,168 | 2,246 | |||||||||||||||
|
Equity securities
|
|||||||||||||||||||||||||
|
Common stock |
57 | 14 | (12 | ) | (14 | ) | 5 | – | 50 | – | |||||||||||||||
|
Preferred stock |
99 | 2 | 8 | 8 | – | (11 | ) | 106 | – | ||||||||||||||||
|
Total equity securities
|
156 | 16 | (4 | ) | (6 | ) | 5 | (11 | ) | 156 | – | ||||||||||||||
|
Equity securities trading |
1 | – | – | – | – | – | 1 | – | |||||||||||||||||
|
Mortgage and other
|
– | – | – | – | – | – | – | – | |||||||||||||||||
|
Other invested assets |
6,618 | (147 | ) | 210 | 101 | 742 | (338 | ) | 7,186 | (4 | ) | ||||||||||||||
|
Total |
$ | 38,027 | $ | 1,416 | $ | 1,563 | $ | (196 | ) | $ | 1,887 | $ | (1,499 | ) | $ | 41,198 | $ | 2,242 | |||||||
|
Liabilities: |
|||||||||||||||||||||||||
|
Policyholder contract
|
$ | (918 | ) | $ | 139 | $ | – | $ | (3 | ) | $ | – | $ | – | $ | (782 | ) | $ | (144 | ) | |||||
|
Derivative liabilities, net: |
|||||||||||||||||||||||||
|
Interest rate contracts |
785 | – | – | (7 | ) | – | – | 778 | (23 | ) | |||||||||||||||
|
Foreign exchange
|
2 | – | – | (2 | ) | – | – | – | – | ||||||||||||||||
|
Equity contracts |
28 | 12 | – | 2 | (2 | ) | – | 40 | 10 | ||||||||||||||||
|
Commodity contracts |
2 | – | – | – | – | – | 2 | – | |||||||||||||||||
|
Credit contracts |
(3,273 | ) | (143 | ) | – | 711 | – | – | (2,705 | ) | (525 | ) | |||||||||||||
|
Other contracts |
33 | (410 | ) | 9 | 412 | (81 | ) | – | (37 | ) | 24 | ||||||||||||||
|
Total derivatives liabilities,
|
(2,423 | ) | (541 | ) | 9 | 1,116 | (83 | ) | – | (1,922 | ) | (514 | ) | ||||||||||||
|
Long-term debt (b) |
(508 | ) | (110 | ) | (77 | ) | 114 | – | 6 | (575 | ) | (104 | ) | ||||||||||||
|
Total |
$ | (3,849 | ) | $ | (512 | ) | $ | (68 | ) | $ | 1,227 | $ | (83 | ) | $ | 6 | $ | (3,279 | ) | $ | (762 | ) | |||
(a) Total Level 3 derivative exposures have been netted in these tables for presentation purposes only.
(b) Includes guaranteed investment agreements (GIAs), notes, bonds, loans and mortgages payable.
18
ITEM 1. / NOTE 5. FAIR VALUE MEASUREMENTS
NOTES TO CONDENSED CONSOLIDATED FINANCIAL STATEMENTS (unaudited)
Net realized and unrealized gains and losses related to Level 3 items shown above are reported in the Condensed Consolidated Statement of Income as follows:
|
(in millions)
|
Net
Investment Income |
Net Realized
Capital Gains (Losses) |
Other
Income |
Total
|
|||||||||
|---|---|---|---|---|---|---|---|---|---|---|---|---|---|
|
March 31, 2013 |
|||||||||||||
|
Bonds available for sale |
$ | 210 | $ | 7 | $ | 21 | $ | 238 | |||||
|
Bond trading securities |
33 | – | 285 | 318 | |||||||||
|
Equity securities |
– | 9 | – | 9 | |||||||||
|
Other invested assets |
47 | (7 | ) | 21 | 61 | ||||||||
|
Policyholder contract deposits |
– | 205 | – | 205 | |||||||||
|
Derivative liabilities, net |
– | 22 | 200 | 222 | |||||||||
|
Other long-term debt |
– | – | (80 | ) | (80 | ) | |||||||
|
March 31, 2012 |
|||||||||||||
|
Bonds available for sale |
$ | 231 | $ | (375 | ) | $ | 4 | $ | (140 | ) | |||
|
Bond trading securities |
1,549 | – | 138 | 1,687 | |||||||||
|
Equity securities |
– | 16 | – | 16 | |||||||||
|
Other invested assets |
(14 | ) | (132 | ) | (1 | ) | (147 | ) | |||||
|
Policyholder contract deposits |
– | 139 | – | 139 | |||||||||
|
Derivative liabilities, net |
(1 | ) | 19 | (559 | ) | (541 | ) | ||||||
|
Other long-term debt |
– | – | (110 | ) | (110 | ) | |||||||
19
ITEM 1. / NOTE 5. FAIR VALUE MEASUREMENTS
NOTES TO CONDENSED CONSOLIDATED FINANCIAL STATEMENTS (unaudited)
The following tables present the gross components of purchases, sales, issues and settlements, net, shown above:
|
(in millions)
|
Purchases
|
Sales
|
Settlements
|
Purchases,
Sales, Issues and Settlements, Net (a) |
|||||||||
|---|---|---|---|---|---|---|---|---|---|---|---|---|---|
|
March 31, 2013 |
|||||||||||||
|
Assets: |
|||||||||||||
|
Bonds available for sale: |
|||||||||||||
|
Obligations of states, municipalities and political
|
$ | 158 | $ | (22 | ) | $ | – | $ | 136 | ||||
|
Non-U.S. governments |
3 | – | (1 | ) | 2 | ||||||||
|
Corporate debt |
97 | – | (75 | ) | 22 | ||||||||
|
RMBS |
603 | (231 | ) | (634 | ) | (262 | ) | ||||||
|
CMBS |
373 | (146 | ) | (302 | ) | (75 | ) | ||||||
|
CDO/ABS |
798 | (159 | ) | – | 639 | ||||||||
|
Total bonds available for sale |
2,032 | (558 | ) | (1,012 | ) | 462 | |||||||
|
Bond trading securities: |
|||||||||||||
|
RMBS |
105 | – | (31 | ) | 74 | ||||||||
|
CMBS |
19 | (58 | ) | (60 | ) | (99 | ) | ||||||
|
CDO/ABS |
188 | – | (624 | ) | (436 | ) | |||||||
|
Total bond trading securities |
312 | (58 | ) | (715 | ) | (461 | ) | ||||||
|
Equity securities |
1 | (10 | ) | (1 | ) | (10 | ) | ||||||
|
Other invested assets |
243 | (30 | ) | (216 | ) | (3 | ) | ||||||
|
Total assets |
$ | 2,588 | $ | (656 | ) | $ | (1,944 | ) | $ | (12 | ) | ||
|
Liabilities: |
|||||||||||||
|
Policyholder contract deposits |
$ | – | $ | (6 | ) | $ | 11 | $ | 5 | ||||
|
Derivative liabilities, net |
3 | (4 | ) | 63 | 62 | ||||||||
|
Other long-term debt (b) |
– | – | 19 | 19 | |||||||||
|
Total liabilities |
$ | 3 | $ | (10 | ) | $ | 93 | $ | 86 | ||||
|
March 31, 2012 |
|||||||||||||
|
Assets: |
|||||||||||||
|
Bonds available for sale: |
|||||||||||||
|
Obligations of states, municipalities and political
|
$ | 108 | $ | (8 | ) | $ | – | $ | 100 | ||||
|
Non-U.S. governments |
– | (2 | ) | – | (2 | ) | |||||||
|
Corporate debt |
61 | (1 | ) | (63 | ) | (3 | ) | ||||||
|
RMBS |
1,912 | (94 | ) | (492 | ) | 1,326 | |||||||
|
CMBS |
126 | (64 | ) | (51 | ) | 11 | |||||||
|
CDO/ABS |
317 | (4 | ) | (243 | ) | 70 | |||||||
|
Total bonds available for sale |
2,524 | (173 | ) | (849 | ) | 1,502 | |||||||
|
Bond trading securities: |
|||||||||||||
|
Corporate debt |
– | – | (2 | ) | (2 | ) | |||||||
|
RMBS |
– | – | (19 | ) | (19 | ) | |||||||
|
CMBS |
113 | (57 | ) | (191 | ) | (135 | ) | ||||||
|
CDO/ABS |
– | (310 | ) | (1,327 | ) | (1,637 | ) | ||||||
|
Total bond trading securities |
113 | (367 | ) | (1,539 | ) | (1,793 | ) | ||||||
|
Equity securities |
11 | (14 | ) | (3 | ) | (6 | ) | ||||||
|
Other invested assets |
266 | (4 | ) | (161 | ) | 101 | |||||||
|
Total assets |
$ | 2,914 | $ | (558 | ) | $ | (2,552 | ) | $ | (196 | ) | ||
|
Liabilities: |
|||||||||||||
|
Policyholder contract deposits |
$ | – | $ | (6 | ) | $ | 3 | $ | (3 | ) | |||
|
Derivative liabilities, net |
2 | – | 1,114 | 1,116 | |||||||||
|
Other long-term debt (b) |
– | – | 114 | 114 | |||||||||
|
Total liabilities |
$ | 2 | $ | (6 | ) | $ | 1,231 | $ | 1,227 | ||||
(a) There were no issuances during the three month periods ended March 31, 2013 and 2012.
(b) Includes GIAs, notes, bonds, loans and mortgages payable.
20
ITEM 1. / NOTE 5. FAIR VALUE MEASUREMENTS
NOTES TO CONDENSED CONSOLIDATED FINANCIAL STATEMENTS (unaudited)
Both observable and unobservable inputs may be used to determine the fair values of positions classified in Level 3 in the tables above. As a result, the unrealized gains (losses) on instruments held at March 31, 2013 and 2012 may include changes in fair value that were attributable to both observable (e.g., changes in market interest rates) and unobservable inputs (e.g., changes in unobservable long-dated volatilities).
Transfers of Level 3 Assets and Liabilities
We record transfers of assets and liabilities into or out of Level 3 at their fair values as of the end of each reporting period, consistent with the date of the determination of fair value. As a result, the Net realized and unrealized gains (losses) included in income or other comprehensive income and as shown in the table above excludes $72 million of net losses related to assets and liabilities transferred into Level 3 during the three month period ended March 31, 2013, and includes $2 million of net gains related to assets and liabilities transferred out of Level 3 during the three month period ended March 31, 2013.
Transfers of Level 3 Assets
During the three month period ended March 31, 2013, transfers into Level 3 assets included certain residential mortgage-backed securities (RMBS), commercial mortgage-backed securities (CMBS), collateralized debt obligation (CDO)/asset-backed securities (ABS), and investments in certain hedge funds.
- •
-
The transfers of investments in certain RMBS, CMBS and CDO/ABS into Level 3 assets were due to decreases in market
transparency and liquidity for certain individual security types.
- •
- Certain hedge fund investments were transferred into Level 3 as a result of limited market activity due to fund-imposed redemption restrictions.
Assets are transferred out of Level 3 when circumstances change such that significant inputs can be corroborated with market observable data. This may be due to a significant increase in market activity for the asset, a specific event, one or more significant input(s) becoming observable or a long-term interest rate significant to a valuation becoming short-term and thus observable. In addition, transfers out of Level 3 assets also occur when investments are no longer carried at fair value as the result of a change in the applicable accounting methodology, given changes in the nature and extent of our ownership interest.
During the three month period ended March 31, 2013, transfers out of Level 3 assets primarily related to certain investments in municipal securities, private placement corporate debt, CMBS, CDO/ABS and hedge funds.
- •
-
Transfers of certain investments in municipal securities, CMBS and CDO/ABS out of Level 3 assets were based on
consideration of market liquidity as well as related transparency of pricing and associated observable inputs for these investments.
- •
-
Transfers of private placement corporate debt out of Level 3 assets were primarily the result of using observable
pricing information that reflects the fair value of those securities without the need for adjustment based on our own assumptions regarding the characteristics of a specific security or the current
liquidity in the market.
- •
- The removal of fund-imposed redemption restrictions resulted in the transfer of certain hedge fund investments out of Level 3 assets.
Transfers of Level 3 Liabilities
There were no significant transfers of derivative or other liabilities into or out of Level 3 for the three month period ended March 31, 2013.
We use various hedging techniques to manage risks associated with certain positions, including those classified within Level 3. Such techniques may include the purchase or sale of financial instruments that are classified within Level 1 and/or Level 2. As a result, the realized and unrealized gains (losses) for assets and liabilities classified within Level 3 presented in the table above do not reflect the related realized or unrealized gains (losses) on hedging instruments that are classified within Level 1 and/or Level 2.
21
ITEM 1. / NOTE 5. FAIR VALUE MEASUREMENTS
NOTES TO CONDENSED CONSOLIDATED FINANCIAL STATEMENTS (unaudited)
Quantitative Information About Level 3 Fair Value Measurements
The table below presents information about the significant unobservable inputs used for recurring fair value measurements for certain Level 3 instruments, and includes only those instruments for which information about the inputs is reasonably available to us, such as data from pricing vendors and from internal valuation models. Because input information with respect to certain Level 3 instruments may not be reasonably available to us, balances shown below may not equal total amounts reported for such Level 3 assets and liabilities:
|
(in millions)
|
Fair Value at
|
Valuation
Technique |
Unobservable Input
(a)
|
Range
(Weighted Average) (a) |
||||||
|---|---|---|---|---|---|---|---|---|---|---|
|
Assets: |
|
|
|
|||||||
|
|
|
|
|
|||||||
|
Corporate debt |
$
|
796
|
|
Discounted cash flow | Yield (b) | 2.81% – 9.59% (6.20%) | ||||
|
|
|
|
|
|||||||
|
RMBS |
|
11,241
|
|
Discounted cash flow | Constant prepayment rate (c) | 0.00% – 10.34% (4.84%) | ||||
|
|
|
|
|
Loss severity (c) | 41.70% – 79.63% (60.66%) | |||||
|
|
|
|
|
Constant default rate (c) | 4.04% – 13.20% (8.62%) | |||||
|
|
|
|
|
Yield (c) | 2.18% – 7.66% (4.92%) | |||||
|
|
|
|
|
|||||||
|
Certain CDO/ABS (d) |
|
5,869
|
|
Discounted cash flow | Constant prepayment rate (c) | 4.08% – 7.78% (5.93%) | ||||
|
|
|
|
|
Loss severity (c) | 56.61% – 67.23% (61.93%) | |||||
|
|
|
|
|
Constant default rate (c) | 6.42% – 14.10% (10.41%) | |||||
|
|
|
|
|
Yield (c) | 7.04% – 10.52% (8.78%) | |||||
|
|
|
|
|
|||||||
|
Commercial mortgage backed securities |
|
3,948
|
|
Discounted cash flow | Yield (b) | 0.00% – 17.12% (6.92%) | ||||
|
|
|
|
|
|||||||
|
CDO/ABS — Direct |
|
|
|
Binomial Expansion | Recovery rate (b) | 4% – 63% (27%) | ||||
|
Investment Book |
|
997
|
|
Technique (BET) | Diversity score (b) | 4 – 42 (14) | ||||
|
|
|
|
|
Weighted average life (b) | 1.28 – 9.76 years (4.99 years) | |||||
|
Liabilities: |
|
|
|
|||||||
|
|
|
|
|
|||||||
|
Policyholder contract deposits — GMWB |
|
1,047
|
|
Discounted cash flow | Equity implied volatility (b) | 6.0% – 39.0% | ||||
|
|
|
|
|
Base lapse rates (b) | 1.00% – 40.0% | |||||
|
|
|
|
|
Dynamic lapse rates (b) | 0.2% – 60.0% | |||||
|
|
|
|
|
Mortality rates (b) | 0.5% – 40.0% | |||||
|
|
|
|
|
Utilization rates (b) | 0.5% – 25.0% | |||||
|
|
|
|
|
|||||||
|
Derivative Liabilities — Credit contracts |
|
1,324
|
|
BET | Recovery rates (b) | 4% – 36% (18%) | ||||
|
|
|
|
|
Diversity score (b) | 9 – 41 (13) | |||||
|
|
|
|
|
Weighted average life (b) | 5.05 – 9.72 years (5.93 years) | |||||
(a) The unobservable inputs and ranges for the constant prepayment rate, loss severity and constant default rate relate to each of the individual underlying mortgage loans that comprise the entire portfolio of securities in the RMBS and CDO securitization vehicles and not necessarily to the securitization vehicle bonds (tranches) purchased by us. The ranges of these inputs do not directly correlate to changes in the fair values of the tranches purchased by us because there are other factors relevant to the specific tranches owned by us including, but not limited to, purchase price, position in the waterfall, senior versus subordinated position and attachment points.
(b) Represents discount rates, estimates and assumptions that we believe would be used by market participants when valuing these assets and liabilities.
(c) Information received from independent third-party valuation service providers.
(d) Yield was the only input available for $297 million of total fair value at March 31, 2013.
22
ITEM 1. / NOTE 5. FAIR VALUE MEASUREMENTS
NOTES TO CONDENSED CONSOLIDATED FINANCIAL STATEMENTS (unaudited)
The ranges of reported inputs for Corporate debt, RMBS, CDO/ABS, and CMBS valued using a discounted cash flow technique consist of plus/minus one standard deviation in either direction from the value-weighted average. The preceding table does not give effect to our risk management practices that might offset risks inherent in these investments.
Sensitivity to Changes in Unobservable Inputs
We consider unobservable inputs to be those for which market data is not available and that are developed using the best information available to us about the assumptions that market participants would use when pricing the asset or liability. Relevant inputs vary depending on the nature of the instrument being measured at fair value. The following is a general description of sensitivities of significant unobservable inputs along with interrelationships between and among the significant unobservable inputs and their impact on the fair value measurements. The effect of a change in a particular assumption in the sensitivity analysis below is considered independently of changes in any other assumptions. In practice, simultaneous changes in assumptions may not always have a linear effect on the inputs. Interrelationships may also exist between observable and unobservable inputs. Such relationships have not been included in the discussion below. For each of the individual relationships described below, the inverse relationship would also generally apply.
Corporate Debt
Corporate debt securities included in Level 3 are primarily private placement issuances that are not traded in active markets or that are subject to transfer restrictions. Fair value measurements consider illiquidity and non-transferability. When observable price quotations are not available, fair value is determined based on discounted cash flow models using discount rates based on credit spreads, yields or price levels of publicly-traded debt of the issuer or other comparable securities, considering illiquidity and structure. The significant unobservable input used in the fair value measurement of corporate debt is the yield. The yield is affected by the market movements in credit spreads and U.S. Treasury yields. In addition, the migration in credit quality of a given security generally has a corresponding effect on the fair value measurement of the securities. For example, a downward migration of credit quality would increase spreads. Holding U.S. Treasury rates constant, an increase in corporate credit spreads would decrease the fair value of corporate debt.
RMBS and Certain CDO/ABS
The significant unobservable inputs used in fair value measurements of RMBS and certain CDO/ABS valued by third-party valuation service providers are constant prepayment rates (CPR), constant default rates (CDR), loss severity, and yield. A change in the assumptions used for the probability of default will generally be accompanied by a corresponding change in the assumption used for the loss severity and an inverse change in the assumption used for prepayment rates. In general, increases in yield, CPR, CDR, and loss severity, in isolation, would result in a decrease in the fair value measurement. Changes in fair value based on variations in assumptions generally cannot be extrapolated because the relationship between the directional change of each input is not usually linear.
CMBS
The significant unobservable input used in fair value measurements for CMBS is the yield. Prepayment assumptions for each mortgage pool are factored into the yield. CMBS generally feature a lower degree of prepayment risk than RMBS because commercial mortgages generally contain a penalty for prepayment. In general, increases in the yield would decrease the fair value of CMBS.
23
ITEM 1. / NOTE 5. FAIR VALUE MEASUREMENTS
NOTES TO CONDENSED CONSOLIDATED FINANCIAL STATEMENTS (unaudited)
CDO/ABS — Direct Investment book
The significant unobservable inputs used for certain CDO/ABS securities valued using the BET are recovery rates, diversity score, and the weighted average life of the portfolio. An increase in recovery rates and diversity score will have a directionally similar corresponding impact on the fair value of the portfolio. An increase in the weighted average life will decrease the fair value.
Policyholder contract deposits
The significant unobservable inputs used for embedded derivatives in policyholder contract deposits measured at fair value, mainly guaranteed minimum withdrawal benefits (GMWB) for variable annuity products, are equity volatility, mortality rates, lapse rates and utilization rates. Mortality, lapse and utilization rates may vary significantly depending upon age groups and duration. In general, increases in volatility and utilization rates will increase the fair value of the liability associated with GMWB, while increases in lapse rates and mortality rates will decrease the fair value of the liability.
Derivative liabilities — credit contracts
The significant unobservable inputs used for Derivatives liabilities — credit contracts are recovery rates, diversity scores, and the weighted average life of the portfolio. Our non-performance risk is also considered in the measurement of those liabilities. See Note 6 to the Consolidated Financial Statements in the 2012 Annual Report for a discussion of our accounting policies and procedures regarding incorporation of our credit risk in fair value measurements.
An increase in recovery rates and diversity score will decrease the fair value of the liability. An increase in the weighted average life will have a directionally similar corresponding effect on the fair value measurement of the liability.
24
ITEM 1. / NOTE 5. FAIR VALUE MEASUREMENTS
NOTES TO CONDENSED CONSOLIDATED FINANCIAL STATEMENTS (unaudited)
Investments in Certain Entities Carried at Fair Value Using Net Asset Value Per Share
The following table includes information related to our investments in certain other invested assets, including private equity funds, hedge funds and other alternative investments that calculate net asset value per share (or its equivalent). For these investments, which are measured at fair value on a recurring basis, we use the net asset value per share as a practical expedient to measure fair value.
|
|
|
March 31, 2013 | December 31, 2012 | |||||||||||||
|---|---|---|---|---|---|---|---|---|---|---|---|---|---|---|---|---|
|
(in millions)
|
Investment Category Includes
|
Fair Value
|
Unfunded
|
Fair Value
Using Net Asset Value Per Share (or its equivalent) |
Unfunded
Commitments |
|||||||||||
|
Investment Category |
|
|
|
|
|
|
||||||||||
|
Private equity funds: |
|
|
|
|
|
|
||||||||||
|
Leveraged buyout |
Debt and/or equity investments made as part |
$
|
2,487
|
|
$
|
646
|
|
$ | 2,529 | $ | 669 | |||||
|
|
of a transaction in which assets of mature |
|
|
|
|
|
|
|||||||||
|
|
companies are acquired from the current |
|
|
|
|
|
|
|||||||||
|
|
shareholders, typically with the use of |
|
|
|
|
|
|
|||||||||
|
|
financial leverage |
|
|
|
|
|
|
|||||||||
|
|
|
|
|
|
|
|
||||||||||
|
Real Estate / |
Investments in real estate properties and |
|
263
|
|
|
51
|
|
251 | 52 | |||||||
|
Infrastructure |
infrastructure positions, including power plants |
|
|
|
|
|
|
|||||||||
|
|
and other energy generating facilities |
|
|
|
|
|
|
|||||||||
|
|
|
|
|
|
|
|
||||||||||
|
Venture capital |
Early-stage, high-potential, growth companies |
|
150
|
|
|
16
|
|
157 | 16 | |||||||
|
|
expected to generate a return through an |
|
|
|
|
|
|
|||||||||
|
|
eventual realization event, such as an initial |
|
|
|
|
|
|
|||||||||
|
|
public offering or sale of the company |
|
|
|
|
|
|
|||||||||
|
|
|
|
|
|
|
|
||||||||||
|
Distressed |
Securities of companies that are already in |
|
185
|
|
|
39
|
|
184 | 36 | |||||||
|
|
default, under bankruptcy protection, or |
|
|
|
|
|
|
|||||||||
|
|
troubled |
|
|
|
|
|
|
|||||||||
|
|
|
|
|
|
|
|
||||||||||
|
Other |
Includes multi-strategy and mezzanine |
|
123
|
|
|
184
|
|
112 | 100 | |||||||
|
|
strategies |
|
|
|
|
|
|
|||||||||
|
Total private equity |
|
3,208
|
|
|
936
|
|
3,233 | 873 | ||||||||
|
funds |
|
|
|
|
|
|
||||||||||
|
Hedge funds: |
|
|
|
|
|
|
||||||||||
|
Event-driven |
Securities of companies undergoing material |
|
899
|
|
|
2
|
|
788 | 2 | |||||||
|
|
structural changes, including mergers, |
|
|
|
|
|
|
|||||||||
|
|
acquisitions and other reorganizations |
|
|
|
|
|
|
|||||||||
|
|
|
|
|
|
|
|
||||||||||
|
Long-short |
Securities that the manager believes are |
|
1,405
|
|
|
–
|
|
1,318 | – | |||||||
|
|
undervalued, with corresponding short |
|
|
|
|
|
|
|||||||||
|
|
positions to hedge market risk |
|
|
|
|
|
|
|||||||||
|
|
|
|
|
|
|
|
||||||||||
|
Macro |
Investments that take long and short |
|
470
|
|
|
–
|
|
320 | – | |||||||
|
|
positions in financial instruments based on |
|
|
|
|
|
|
|||||||||
|
|
a top-down view of certain economic and |
|
|
|
|
|
|
|||||||||
|
|
capital market conditions |
|
|
|
|
|
|
|||||||||
|
|
|
|
|
|
|
|
||||||||||
|
Distressed |
Securities of companies that are already in |
|
342
|
|
|
–
|
|
316 | – | |||||||
|
|
default, under bankruptcy protection or |
|
|
|
|
|
|
|||||||||
|
|
troubled |
|
|
|
|
|
|
|||||||||
|
|
|
|
|
|
|
|
||||||||||
|
Other |
Includes multi-strategy and relative value |
|
55
|
|
|
–
|
|
66 | – | |||||||
|
|
strategies |
|
|
|
|
|
|
|||||||||
|
Total hedge funds |
|
3,171
|
|
|
2
|
|
2,808 | 2 | ||||||||
|
Total |
$
|
6,379
|
|
$
|
938
|
|
$ | 6,041 | $ | 875 | ||||||
25
ITEM 1. / NOTE 5. FAIR VALUE MEASUREMENTS
NOTES TO CONDENSED CONSOLIDATED FINANCIAL STATEMENTS (unaudited)
Private equity fund investments included above are not redeemable, as distributions from the funds will be received when underlying investments of the funds are liquidated. Private equity funds are generally expected to have 10-year lives at their inception, but these lives may be extended at the fund manager's discretion, typically in one or two-year increments. At March 31, 2013, assuming average original expected lives of 10 years for the funds, 63 percent of the total fair value using net asset value or its equivalent above would have expected remaining lives of less than three years, 35 percent between three and seven years and 2 percent between seven and 10 years.
At March 31, 2013, hedge fund investments included above are redeemable monthly (15 percent), quarterly (37 percent), semi-annually (26 percent) and annually (22 percent), with redemption notices ranging from one day to 180 days. More than 65 percent of these hedge fund investments require redemption notices of less than 90 days. Investments representing approximately 77 percent of the value of the hedge fund investments cannot be redeemed, either in whole or in part, because the investments include various restrictions. The majority of these restrictions have pre-defined end dates and are generally expected to be lifted by the end of 2015. The restrictions that do not have stated end dates were primarily put in place prior to 2009. The partial restrictions relate to certain hedge funds that hold at least one investment that the fund manager deems to be illiquid.
Fair Value Option
The following table presents the gains or losses recorded related to the eligible instruments for which AIG elected the fair value option:
|
|
Gain (Loss) | ||||||
|---|---|---|---|---|---|---|---|
|
Three Months Ended March 31,
(in millions) |
|||||||
|
2013
|
2012
|
||||||
|
Assets: |
|
|
|
||||
|
Mortgage and other loans receivable |
$
|
1
|
|
$ | 22 | ||
|
Bonds and equity securities |
|
376
|
|
644 | |||
|
Trading — ML II interest |
|
–
|
|
246 | |||
|
Trading — ML III interest |
|
–
|
|
1,252 | |||
|
Retained interest in AIA |
|
–
|
|
1,795 | |||
|
Alternative Investments (a) |
|
84
|
|
2 | |||
|
Other, including Short-term investments |
|
3
|
|
2 | |||
|
Liabilities: |
|
|
|
||||
|
Long-term debt (b) |
|
9
|
|
(446 | ) | ||
|
Other liabilities |
|
(4
|
)
|
(48 | ) | ||
|
Total gain (loss) (c) |
$
|
469
|
|
$ | 3,469 | ||
(a) Includes hedge funds, private equity funds, affordable housing partnerships and other investment partnerships.
(b) Includes GIAs, notes, bonds, loans and mortgages payable.
(c) Excludes discontinued operation gains or losses on instruments that were required to be carried at fair value. For instruments required to be carried at fair value, AIG recognized losses of $1 million for the three months ended March 31, 2013, and gains of $0.6 billion for the three months ended March 31, 2012, that were primarily due to changes in the fair value of derivatives, trading securities and certain other invested assets.
See Notes 6 and 7 to the Consolidated Financial Statements in the 2012 Annual Report for additional information about AIG's policies for electing the fair value option and for recognizing, measuring, and disclosing interest and dividend income and interest expense.
During the three month periods ended March 31, 2013 and 2012, we recognized losses of $34 million and $558 million, respectively, attributable to the observable effect of changes in credit spreads on our own liabilities for which the fair value option was elected. We calculate the effect of these credit spread changes using discounted cash flow techniques that incorporate current market interest rates, our observable credit spreads on these liabilities and other factors that mitigate the risk of nonperformance such as cash collateral posted.
26
NOTES TO CONDENSED CONSOLIDATED FINANCIAL STATEMENTS (unaudited)
The following table presents the difference between fair values and the aggregate contractual principal amounts of mortgage and other loans receivable and long-term borrowings for which the fair value option was elected:
|
|
March 31, 2013 | December 31, 2012 | |||||||||||||||||
|---|---|---|---|---|---|---|---|---|---|---|---|---|---|---|---|---|---|---|---|
|
(in millions)
|
Fair Value
|
Outstanding
|
Difference
|
Fair Value
|
Outstanding
Principal Amount |
Difference
|
|||||||||||||
|
Assets: |
|
|
|
|
|
|
|
|
|
||||||||||
|
Mortgage and other loans receivable |
$
|
58
|
|
$
|
58
|
|
$
|
–
|
|
$ | 134 | $ | 141 | $ | (7 | ) | |||
|
Liabilities: |
|
|
|
|
|
|
|
|
|
||||||||||
|
Long-term debt * |
$
|
7,663
|
|
$
|
5,727
|
|
$
|
1,936
|
|
$ | 8,055 | $ | 5,705 | $ | 2,350 | ||||
* Includes GIAs, notes, bonds, loans and mortgages payable.
There were no mortgage or other loans receivable for which the fair value option was elected that were 90 days or more past due or in non-accrual status at March 31, 2013 and December 31, 2012.
FAIR VALUE MEASUREMENTS ON A NON-RECURRING BASIS
The following table presents assets measured at fair value on a non-recurring basis at the time of impairment and the related impairment charges recorded during the periods presented:
|
|
Assets at Fair Value |
Impairment
Charges |
|||||||||||||||||
|---|---|---|---|---|---|---|---|---|---|---|---|---|---|---|---|---|---|---|---|
|
|
Non-Recurring Basis | March 31, | |||||||||||||||||
|
(in millions)
|
Level 1
|
Level 2
|
Level 3
|
Total
|
2013
|
2012
|
|||||||||||||
|
March 31, 2013 |
|||||||||||||||||||
|
Alternative investments |
$ | – | $ | – | $ | 1,843 | $ | 1,843 | $ | 79 | $ | 93 | |||||||
|
Other assets |
– | 8 | 7 | 15 | 13 | 8 | |||||||||||||
|
Total |
$ | – | $ | 8 | $ | 1,850 | $ | 1,858 | $ | 92 | $ | 101 | |||||||
|
December 31, 2012 |
|||||||||||||||||||
|
Alternative investments |
$ | – | $ | – | $ | 2,062 | $ | 2,062 | |||||||||||
|
Other assets |
– | 3 | 18 | 21 | |||||||||||||||
|
Total |
$ | – | $ | 3 | $ | 2,080 | $ | 2,083 | |||||||||||
FAIR VALUE INFORMATION ABOUT FINANCIAL INSTRUMENTS NOT MEASURED AT FAIR VALUE
The following table presents the carrying value and estimated fair value of our financial instruments not measured at fair value and indicates the level in the fair value hierarchy of the estimated fair value measurement based on the observability of the inputs used:
|
|
Estimated Fair Value |
|
||||||||||||||
|---|---|---|---|---|---|---|---|---|---|---|---|---|---|---|---|---|
|
|
Carrying
Value |
|||||||||||||||
|
(in millions)
|
Level 1
|
Level 2
|
Level 3
|
Total
|
||||||||||||
|
March 31, 2013 |
||||||||||||||||
|
Assets: |
||||||||||||||||
|
Mortgage and other loans receivable |
$ | – | $ | 572 | $ | 20,147 | $ | 20,719 | $ | 19,430 | ||||||
|
Other invested assets |
– | 57 | 3,746 | 3,803 | 4,927 | |||||||||||
|
Short-term investments |
– | 16,924 | – | 16,924 | 16,924 | |||||||||||
|
Cash |
1,227 | – | – | 1,227 | 1,227 | |||||||||||
|
Liabilities: |
||||||||||||||||
|
Policyholder contract deposits associated with investment-type contracts |
– | 233 | 122,844 | 123,077 | 105,680 | |||||||||||
|
Other liabilities |
– | 4,239 | 1,626 | 5,865 | 5,866 | |||||||||||
|
Long-term debt |
– | 40,991 | 1,957 | 42,948 | 37,603 | |||||||||||
|
December 31, 2012 |
||||||||||||||||
|
Assets: |
||||||||||||||||
|
Mortgage and other loans receivable |
$ | – | $ | 823 | $ | 19,396 | $ | 20,219 | $ | 19,348 | ||||||
|
Other invested assets |
– | 237 | 3,521 | 3,758 | 4,932 | |||||||||||
|
Short-term investments |
– | 20,752 | – | 20,752 | 20,752 | |||||||||||
|
Cash |
1,151 | – | 1,151 | 1,151 | ||||||||||||
|
Liabilities: |
||||||||||||||||
|
Policyholder contract deposits associated |
||||||||||||||||
|
with investment-type contracts |
– | 245 | 123,860 | 124,105 | 105,979 | |||||||||||
|
Other liabilities |
– | 3,981 | 818 | 4,799 | 4,800 | |||||||||||
|
Long-term debt |
– | 43,966 | 1,925 | 45,891 | 40,445 | |||||||||||
27
ITEM 1. / NOTE 6. INVESTMENTS
NOTES TO CONDENSED CONSOLIDATED FINANCIAL STATEMENTS (unaudited)
6. INVESTMENTS
Securities Available for Sale
The following table presents the amortized cost or cost and fair value of our available for sale securities:
|
(in millions)
|
Amortized
Cost or Cost |
Gross
Unrealized Gains |
Gross
Unrealized Losses |
Fair
Value |
Other-Than-
Temporary Impairments in AOCI (a) |
|||||||||||
|---|---|---|---|---|---|---|---|---|---|---|---|---|---|---|---|---|
|
March 31, 2013 |
||||||||||||||||
|
Bonds available for sale: |
||||||||||||||||
|
U.S. government and government sponsored entities |
$ | 3,194 | $ | 303 | $ | (1 | ) | $ | 3,496 | $ | – | |||||
|
Obligations of states, municipalities and political
|
32,683 | 2,473 | (45 | ) | 35,111 | 2 | ||||||||||
|
Non-U.S. governments |
24,251 | 1,222 | (98 | ) | 25,375 | – | ||||||||||
|
Corporate debt |
136,299 | 14,579 | (572 | ) | 150,306 | 107 | ||||||||||
|
Mortgage-backed, asset-backed and collateralized: |
||||||||||||||||
|
RMBS |
32,568 | 3,777 | (219 | ) | 36,126 | 1,708 | ||||||||||
|
CMBS |
9,841 | 785 | (215 | ) | 10,411 | 6 | ||||||||||
|
CDO/ABS |
8,756 | 819 | (149 | ) | 9,426 | 63 | ||||||||||
|
Total mortgage-backed, asset-backed and
|
51,165 | 5,381 | (583 | ) | 55,963 | 1,777 | ||||||||||
|
Total bonds available for sale (b) |
247,592 | 23,958 | (1,299 | ) | 270,251 | 1,886 | ||||||||||
|
Equity securities available for sale: |
||||||||||||||||
|
Common stock |
1,382 | 1,559 | (19 | ) | 2,922 | – | ||||||||||
|
Preferred stock |
55 | 27 | – | 82 | – | |||||||||||
|
Mutual funds |
92 | 12 | – | 104 | – | |||||||||||
|
Total equity securities available for sale |
1,529 | 1,598 | (19 | ) | 3,108 | – | ||||||||||
|
Total |
$ | 249,121 | $ | 25,556 | $ | (1,318 | ) | $ | 273,359 | $ | 1,886 | |||||
|
December 31, 2012 |
||||||||||||||||
|
Bonds available for sale: |
||||||||||||||||
|
U.S. government and government sponsored entities |
$ | 3,161 | $ | 323 | $ | (1 | ) | $ | 3,483 | $ | – | |||||
|
Obligations of states, municipalities and political
|
33,042 | 2,685 | (22 | ) | 35,705 | 2 | ||||||||||
|
Non-U.S. governments |
25,449 | 1,395 | (44 | ) | 26,800 | – | ||||||||||
|
Corporate debt |
135,728 | 15,848 | (464 | ) | 151,112 | 115 | ||||||||||
|
Mortgage-backed, asset-backed and collateralized: |
||||||||||||||||
|
RMBS |
31,330 | 3,379 | (317 | ) | 34,392 | 1,330 | ||||||||||
|
CMBS |
9,699 | 811 | (376 | ) | 10,134 | (54 | ) | |||||||||
|
CDO/ABS |
7,740 | 765 | (172 | ) | 8,333 | 57 | ||||||||||
|
Total mortgage-backed, asset-backed and
|
48,769 | 4,955 | (865 | ) | 52,859 | 1,333 | ||||||||||
|
Total bonds available for sale (b) |
246,149 | 25,206 | (1,396 | ) | 269,959 | 1,450 | ||||||||||
|
Equity securities available for sale: |
||||||||||||||||
|
Common stock |
1,492 | 1,574 | (37 | ) | 3,029 | – | ||||||||||
|
Preferred stock |
55 | 23 | – | 78 | – | |||||||||||
|
Mutual funds |
93 | 12 | – | 105 | – | |||||||||||
|
Total equity securities available for sale |
1,640 | 1,609 | (37 | ) | 3,212 | – | ||||||||||
|
Total |
$ | 247,789 | $ | 26,815 | $ | (1,433 | ) | $ | 273,171 | $ | 1,450 | |||||
(a) Represents the amount of other-than-temporary impairments recognized in Accumulated other comprehensive income. Amount includes unrealized gains and losses on impaired securities relating to changes in the value of such securities subsequent to the impairment measurement date.
(b) At March 31, 2013 and December 31, 2012, bonds available for sale held by us that were below investment grade or not rated totaled $30.7 billion and $29.6 billion, respectively.
28
ITEM 1. / NOTE 6. INVESTMENTS
NOTES TO CONDENSED CONSOLIDATED FINANCIAL STATEMENTS (unaudited)
Securities Available for Sale in a Loss Position
The following table summarizes the fair value and gross unrealized losses on our available for sale securities in a loss position, aggregated by major investment category and length of time that individual securities have been in a continuous unrealized loss position:
|
|
Less than 12 Months | 12 Months or More | Total | ||||||||||||||||
|---|---|---|---|---|---|---|---|---|---|---|---|---|---|---|---|---|---|---|---|
|
(in millions)
|
Fair
Value |
Gross
Unrealized Losses |
Fair
Value |
Gross
Unrealized Losses |
Fair
Value |
Gross
Unrealized Losses |
|||||||||||||
|
March 31, 2013 |
|||||||||||||||||||
|
Bonds available for sale: |
|||||||||||||||||||
|
U.S. government and government sponsored
|
$ | 130 | $ | 1 | $ | – | $ | – | $ | 130 | $ | 1 | |||||||
|
Obligations of states, municipalities and political
|
1,146 | 38 | 71 | 7 | 1,217 | 45 | |||||||||||||
|
Non-U.S. governments |
2,812 | 77 | 216 | 21 | 3,028 | 98 | |||||||||||||
|
Corporate debt |
13,205 | 374 | 2,465 | 198 | 15,670 | 572 | |||||||||||||
|
RMBS |
1,771 | 14 | 1,290 | 205 | 3,061 | 219 | |||||||||||||
|
CMBS |
1,524 | 33 | 1,227 | 182 | 2,751 | 215 | |||||||||||||
|
CDO/ABS |
563 | 5 | 1,387 | 144 | 1,950 | 149 | |||||||||||||
|
Total bonds available for sale |
21,151 | 542 | 6,656 | 757 | 27,807 | 1,299 | |||||||||||||
|
Equity securities available for sale: |
|||||||||||||||||||
|
Common stock |
129 | 19 | – | – | 129 | 19 | |||||||||||||
|
Total |
$ | 21,280 | $ | 561 | $ | 6,656 | $ | 757 | $ | 27,936 | $ | 1,318 | |||||||
|
December 31, 2012 |
|||||||||||||||||||
|
Bonds available for sale: |
|||||||||||||||||||
|
U.S. government and government sponsored
|
$ | 153 | $ | 1 | $ | – | $ | – | $ | 153 | $ | 1 | |||||||
|
Obligations of states, municipalities and political
|
692 | 11 | 114 | 11 | 806 | 22 | |||||||||||||
|
Non-U.S. governments |
1,555 | 19 | 442 | 25 | 1,997 | 44 | |||||||||||||
|
Corporate debt |
8,483 | 201 | 3,229 | 263 | 11,712 | 464 | |||||||||||||
|
RMBS |
597 | 28 | 1,661 | 289 | 2,258 | 317 | |||||||||||||
|
CMBS |
406 | 11 | 1,595 | 365 | 2,001 | 376 | |||||||||||||
|
CDO/ABS |
391 | 1 | 1,510 | 171 | 1,901 | 172 | |||||||||||||
|
Total bonds available for sale |
12,277 | 272 | 8,551 | 1,124 | 20,828 | 1,396 | |||||||||||||
|
Equity securities available for sale: |
|||||||||||||||||||
|
Common stock |
247 | 36 | 18 | 1 | 265 | 37 | |||||||||||||
|
Mutual funds |
3 | – | – | – | 3 | – | |||||||||||||
|
Total equity securities available for sale |
250 | 36 | 18 | 1 | 268 | 37 | |||||||||||||
|
Total |
$ | 12,527 | $ | 308 | $ | 8,569 | $ | 1,125 | $ | 21,096 | $ | 1,433 | |||||||
At March 31, 2013, we held 4,001 and 114 individual fixed maturity and equity securities, respectively, that were in an unrealized loss position, of which 931 individual fixed maturity securities were in a continuous unrealized loss position for longer than 12 months. We did not recognize the unrealized losses in earnings on these fixed maturity securities at March 31, 2013 because we neither intend to sell the securities nor do we believe that it is more likely than not that we will be required to sell these securities before recovery of their amortized cost basis. Furthermore, we expect to recover the entire amortized cost basis of these securities. In performing this evaluation, we considered the recovery periods for securities in previous periods of broad market declines. For fixed maturity securities with significant declines, we performed fundamental credit analyses on a security-by-security basis, which included
29
ITEM 1. / NOTE 6. INVESTMENTS
NOTES TO CONDENSED CONSOLIDATED FINANCIAL STATEMENTS (unaudited)
consideration of credit enhancements, expected defaults on underlying collateral, review of relevant industry analyst reports and forecasts and other available market data.
Contractual Maturities of Securities Available for Sale
The following table presents the amortized cost and fair value of fixed maturity securities available for sale by contractual maturity:
|
|
Total Fixed Maturity Securities
Available for Sale |
Fixed Maturity Securities
in a Loss Position Available for Sale |
|||||||||||
|---|---|---|---|---|---|---|---|---|---|---|---|---|---|
|
March 31, 2013
(in millions) |
|||||||||||||
|
Amortized Cost
|
Fair Value
|
Amortized Cost
|
Fair Value
|
||||||||||
|
Due in one year or less |
$ | 11,697 | $ | 11,910 | $ | 647 | $ | 642 | |||||
|
Due after one year through five years |
51,101 | 54,428 | 3,516 | 3,441 | |||||||||
|
Due after five years through ten years |
72,503 | 79,391 | 6,958 | 6,800 | |||||||||
|
Due after ten years |
61,126 | 68,559 | 9,640 | 9,162 | |||||||||
|
Mortgage-backed, asset-backed and collateralized |
51,165 | 55,963 | 8,345 | 7,762 | |||||||||
|
Total |
$ | 247,592 | $ | 270,251 | $ | 29,106 | $ | 27,807 | |||||
Actual maturities may differ from contractual maturities because certain borrowers have the right to call or prepay certain obligations with or without call or prepayment penalties.
The following table presents the gross realized gains and gross realized losses from sales or redemptions of our available for sale securities:
|
|
|
|
|
||||||||||
|---|---|---|---|---|---|---|---|---|---|---|---|---|---|
|
|
Three Months Ended March 31, | ||||||||||||
|
|
2013 | 2012 | |||||||||||
|
(in millions)
|
Gross
|
Gross
|
Gross
Realized Gains |
Gross
Realized Losses |
|||||||||
|
Fixed maturity securities |
$
|
371
|
|
$
|
71
|
|
$ | 490 | $ | 16 | |||
|
Equity securities |
|
37
|
|
|
3
|
|
451 | 3 | |||||
|
Total |
$
|
408
|
|
$
|
74
|
|
$ | 941 | $ | 19 | |||
For the three month periods ended March 31, 2013 and 2012, the aggregate fair value of available for sale securities sold was $7.0 billion and $10.9 billion, respectively, which resulted in net realized capital gains of $0.3 billion and $0.9 billion, respectively.
30
ITEM 1. / NOTE 6. INVESTMENTS
NOTES TO CONDENSED CONSOLIDATED FINANCIAL STATEMENTS (unaudited)
Trading Securities
The following table presents the fair value of our trading securities:
|
|
|
|
|
||||||||||
|---|---|---|---|---|---|---|---|---|---|---|---|---|---|
|
|
March 31, 2013 | December 31, 2012 | |||||||||||
|
(in millions)
|
Fair
|
Percent
|
Fair
Value |
Percent
of Total |
|||||||||
|
Fixed maturity securities: |
|
|
|
|
|
|
|||||||
|
U.S. government and government sponsored entities |
$
|
6,339
|
|
|
26
|
%
|
$ | 6,794 | 27 | % | |||
|
Obligations of states, territories and political subdivisions |
|
183
|
|
|
1
|
|
– | – | |||||
|
Non-U.S. governments |
|
2
|
|
|
–
|
|
2 | – | |||||
|
Corporate debt |
|
1,138
|
|
|
5
|
|
1,320 | 5 | |||||
|
Mortgage-backed, asset-backed and collateralized: |
|
|
|
|
|
|
|||||||
|
RMBS |
|
1,969
|
|
|
8
|
|
1,727 | 7 | |||||
|
CMBS |
|
1,919
|
|
|
8
|
|
2,236 | 9 | |||||
|
CDO/ABS and other collateralized * |
|
12,297
|
|
|
50
|
|
12,497 | 50 | |||||
|
Total mortgage-backed, asset-backed and collateralized |
|
16,185
|
|
|
66
|
|
16,460 | 66 | |||||
|
Other |
|
8
|
|
|
–
|
|
8 | – | |||||
|
Total fixed maturity securities |
|
23,855
|
|
|
98
|
|
24,584 | 98 | |||||
|
Equity securities |
|
696
|
|
|
2
|
|
662 | 2 | |||||
|
Total |
$
|
24,551
|
|
|
100
|
%
|
$ | 25,246 | 100 | % | |||
* Includes $0.8 billion of U.S. Government agency backed ABS.
Net Investment Income
The following table presents the components of Net investment income:
|
|
|
|
|||||
|---|---|---|---|---|---|---|---|
|
Three Months Ended March 31,
(in millions) |
2013
|
2012
|
|||||
|
Fixed maturity securities, including short-term investments |
$
|
3,045
|
|
$ | 3,104 | ||
|
Change in fair value of ML II |
|
–
|
|
246 | |||
|
Change in fair value of ML III |
|
–
|
|
1,252 | |||
|
Change in fair value of AIA securities including realized gain |
|
–
|
|
1,795 | |||
|
Equity securities |
|
37
|
|
11 | |||
|
Interest on mortgage and other loans |
|
280
|
|
265 | |||
|
Alternative investments * |
|
866
|
|
505 | |||
|
Real estate |
|
31
|
|
26 | |||
|
Other investments |
|
53
|
|
23 | |||
|
Total investment income |
|
4,312
|
|
7,227 | |||
|
Investment expenses |
|
148
|
|
122 | |||
|
Net investment income |
$
|
4,164
|
|
$ | 7,105 | ||
* Includes hedge funds, private equity funds, affordable housing partnerships and other investment partnerships.
31
ITEM 1. / NOTE 6. INVESTMENTS
NOTES TO CONDENSED CONSOLIDATED FINANCIAL STATEMENTS (unaudited)
Net Realized Capital Gains and Losses
The following table presents the components of Net realized capital gains (losses):
|
|
|
|
|||||
|---|---|---|---|---|---|---|---|
|
Three Months Ended March 31,
(in millions) |
2013
|
2012
|
|||||
|
Sales of fixed maturity securities |
$
|
300
|
|
$ | 474 | ||
|
Sales of equity securities |
|
34
|
|
448 | |||
|
Other-than-temporary impairments: |
|
|
|
||||
|
Severity |
|
(2
|
)
|
(4 | ) | ||
|
Change in intent |
|
(3
|
)
|
(20 | ) | ||
|
Foreign currency declines |
|
–
|
|
(5 | ) | ||
|
Issuer-specific credit events |
|
(63
|
)
|
(586 | ) | ||
|
Adverse projected cash flows |
|
(6
|
)
|
(3 | ) | ||
|
Provision for loan losses |
|
(3
|
)
|
2 | |||
|
Foreign exchange transactions |
|
329
|
|
(232 | ) | ||
|
Derivative instruments |
|
(271
|
)
|
(262 | ) | ||
|
Other |
|
(15
|
)
|
(63 | ) | ||
|
Net realized capital gains (losses) |
$
|
300
|
|
$ | (251 | ) | |
Change in Unrealized Appreciation of Investments
The following table presents the components of the increase (decrease) in unrealized appreciation of our available for sale securities:
|
|
|
|
|||||
|---|---|---|---|---|---|---|---|
|
Three Months Ended March 31,
(in millions) |
2013
|
2012
|
|||||
|
Increase (decrease) in unrealized appreciation of investments: |
|
|
|
||||
|
Fixed maturities |
$
|
(1,152
|
)
|
$ | 2,987 | ||
|
Equity securities |
|
7
|
|
(560 | ) | ||
|
Other investments |
|
(48
|
)
|
284 | |||
|
Total Increase (decrease) in unrealized appreciation of investments |
$
|
(1,193
|
)
|
$ | 2,711 | ||
Evaluating Investments for Other-Than-Temporary Impairments
For a discussion of our policy for evaluating investments for other-than-temporary impairments, see Note 7 to the Consolidated Financial Statements in the 2012 Annual Report.
32
ITEM 1. / NOTE 6. INVESTMENTS
NOTES TO CONDENSED CONSOLIDATED FINANCIAL STATEMENTS (unaudited)
Credit Impairments
The following table presents a rollforward of the cumulative credit loss component of other-than-temporary impairments recognized in earnings for our available for sale fixed maturity securities, and includes structured, corporate, municipal and sovereign fixed maturity securities:
|
|
|
|
|||||
|---|---|---|---|---|---|---|---|
|
Three Months Ended March 31,
(in millions) |
2013
|
2012
|
|||||
|
Balance, beginning of period |
$
|
5,164
|
|
$ | 6,504 | ||
|
Increases due to: |
|
|
|
||||
|
Credit impairments on new securities subject to impairment losses |
|
17
|
|
137 | |||
|
Additional credit impairments on previously impaired securities |
|
18
|
|
307 | |||
|
Reductions due to: |
|
|
|
||||
|
Credit impaired securities fully disposed for which there was no prior intent or requirement |
|
|
|
||||
|
to sell |
|
(391
|
)
|
(270 | ) | ||
|
Accretion on securities previously impaired due to credit * |
|
(205
|
)
|
(222 | ) | ||
|
Other |
|
–
|
|
8 | |||
|
Balance, end of period |
$
|
4,603
|
|
$ | 6,464 | ||
* Represents both accretion recognized due to changes in cash flows expected to be collected over the remaining expected term of the credit impaired securities and the accretion due to the passage of time.
Purchased Credit Impaired (PCI) Securities
Since 2011, we have purchased certain RMBS securities that have experienced deterioration in credit quality since their issuance. We determined, based on our expectations as to the timing and amount of cash flows expected to be received, that it was probable at the date of acquisition that we would not collect all contractually required payments for these PCI securities, including both principal and interest after considering the effects of prepayments. At acquisition, the timing and amount of the undiscounted future cash flows expected to be received on each PCI security was determined based on our best estimate using key assumptions, such as interest rates, default rates and prepayment speeds. At acquisition, the difference between the undiscounted expected future cash flows of the PCI securities and the recorded investment in the securities represents the initial accretable yield, which is to be accreted into net investment income over their remaining lives on a level-yield basis. Additionally, the difference between the contractually required payments on the PCI securities and the undiscounted expected future cash flows represents the non-accretable difference at acquisition. The accretable yield and the non-accretable difference will change over time, based on actual payments received and changes in estimates of undiscounted expected future cash flows, which are discussed further below.
On a quarterly basis, the undiscounted expected future cash flows associated with PCI securities are re-evaluated based on updates to key assumptions. Declines in undiscounted expected future cash flows due to further credit deterioration as well as changes in the expected timing of the cash flows can result in the recognition of an other-than-temporary impairment charge, as PCI securities are subject to our policy for evaluating investments for other-than-temporary impairment. Changes to undiscounted expected future cash flows due solely to the changes in the contractual benchmark interest rates on variable rate PCI securities will change the accretable yield prospectively. Significant increases in undiscounted expected future cash flows for reasons other than interest rate changes are recognized prospectively as adjustments to the accretable yield.
33
ITEM 1. / NOTE 6. INVESTMENTS
NOTES TO CONDENSED CONSOLIDATED FINANCIAL STATEMENTS (unaudited)
The following tables present information on our PCI securities, which are included in bonds available for sale:
|
(in millions)
|
At Date of Acquisition
|
|||
|---|---|---|---|---|
|
Contractually required payments (principal and interest) |
$ | 19,807 | ||
|
Cash flows expected to be collected * |
15,543 | |||
|
Recorded investment in acquired securities |
10,011 | |||
* Represents undiscounted expected cash flows, including both principal and interest.
|
|
|
|
|||||
|---|---|---|---|---|---|---|---|
|
(in millions)
|
March 31, 2013
|
December 31, 2012
|
|||||
|
Outstanding principal balance |
$
|
12,257
|
|
$ | 11,791 | ||
|
Amortized cost |
|
8,122
|
|
7,718 | |||
|
Fair value |
|
9,551
|
|
8,823 | |||
The following table presents activity for the accretable yield on PCI securities:
|
|
|
|
|||||
|---|---|---|---|---|---|---|---|
|
|
Three Months Ended
March 31, |
||||||
|
(in millions)
|
2013
|
2012
|
|||||
|
Balance, beginning of period |
$
|
4,766
|
|
$ | 4,135 | ||
|
Newly purchased PCI securities |
|
345
|
|
1,222 | |||
|
Disposals |
|
(60
|
)
|
(47 | ) | ||
|
Accretion |
|
(160
|
)
|
(168 | ) | ||
|
Effect of changes in interest rate indices |
|
84
|
|
(28 | ) | ||
|
Net reclassification from non-accretable difference, including effects of prepayments |
|
139
|
|
32 | |||
|
Balance, end of period |
$
|
5,114
|
|
$ | 5,146 | ||
Pledged Investments
Secured Financing and Similar Arrangements
We enter into financing transactions whereby certain securities are transferred to financial institutions in exchange for cash or other liquid collateral. Securities transferred by us under these financing transactions may be sold or repledged by the counterparties. As collateral for the securities transferred by us, counterparties transfer assets to us, such as cash or high quality fixed maturity securities. Collateral levels are monitored daily and are generally maintained at an agreed-upon percentage of the fair value of the transferred securities during the life of the transactions. Where we receive fixed maturity securities as collateral, we do not have the right to sell or repledge this collateral unless an event of default occurs by the counterparties. At the termination of the transactions, we and our counterparties are obligated to return the collateral provided and the securities transferred, respectively. We treat these transactions as secured financing arrangements.
Secured financing transactions also include securities sold under agreements to repurchase (repurchase agreements), in which we transfer securities in exchange for cash, with an agreement by us to repurchase the same or substantially similar securities. In the majority of these repurchase agreements, the securities transferred by us may be sold or repledged by the counterparties. Repurchase agreements entered into by our Direct Investment book (DIB) are carried at fair value based on market-observable interest rates. All other repurchase agreements are recorded at their contracted repurchase amounts plus accrued interest.
34
NOTES TO CONDENSED CONSOLIDATED FINANCIAL STATEMENTS (unaudited)
The following table presents the fair value of securities pledged to counterparties under secured financing transactions:
|
|
|
|
|||||
|---|---|---|---|---|---|---|---|
|
(in millions)
|
March 31, 2013
|
December 31, 2012
|
|||||
|
Securities available for sale |
$
|
5,289
|
|
$ | 8,180 | ||
|
Trading securities |
|
2,809
|
|
2,985 | |||
We also enter into agreements in which securities are purchased by us under agreements to resell (reverse repurchase agreements), which are accounted for as secured financing transactions and reported as short-term investments or other assets, depending on their terms. These agreements are recorded at their contracted resale amounts plus accrued interest, other than those that are accounted for at fair value. Such agreements entered into by the DIB are carried at fair value based on market observable interest rates. In all reverse repurchase transactions, we take possession of or obtain a security interest in the related securities, and we have the right to sell or repledge this collateral received.
The following table presents information on the fair value of securities pledged to us under reverse repurchase agreements:
|
|
|
|
|||||
|---|---|---|---|---|---|---|---|
|
(in millions)
|
March 31, 2013
|
December 31, 2012
|
|||||
|
Securities collateral pledged to us |
$
|
10,974
|
|
$ | 11,039 | ||
|
Amount repledged by us |
|
18
|
|
33 | |||
Insurance — Statutory and Other Deposits
Total carrying values of cash and securities deposited by our insurance subsidiaries under requirements of regulatory authorities or other insurance-related arrangements, including certain annuity-related obligations and certain reinsurance treaties, were $8.9 billion at both March 31, 2013 and December 31, 2012.
Other Pledges
Certain of our subsidiaries are members of Federal Home Loan Banks (FHLBs) and such membership requires the members to own stock in these FHLBs. These subsidiaries owned an aggregate of $60 million and $84 million of stock in FHLBs at March 31, 2013 and December 31, 2012, respectively. To the extent an AIG subsidiary borrows from the FHLB, its ownership interest in the stock of FHLBs will be pledged to the FHLB. In addition, our subsidiaries have pledged securities available for sale with a fair value of $76 million and $341 million at March 31, 2013 and December 31, 2012, respectively, associated with advances from the FHLBs.
Certain GIAs have provisions that require collateral to be posted or payments to be made by us upon a downgrade of our long-term debt ratings. The actual amount of collateral required to be posted to the counterparties in the event of such downgrades, and the aggregate amount of payments that we could be required to make, depend on market conditions, the fair value of outstanding affected transactions and other factors prevailing at and after the time of the downgrade. The fair value of securities pledged as collateral with respect to these obligations approximated $4.4 billion at both March 31, 2013 and December 31, 2012. This collateral primarily consists of securities of the U.S. government and government sponsored entities and generally cannot be repledged or resold by the counterparties.
35
NOTES TO CONDENSED CONSOLIDATED FINANCIAL STATEMENTS (unaudited)
7. LENDING ACTIVITIES
The following table presents the composition of Mortgage and other loans receivable:
|
|
|
|
|||||
|---|---|---|---|---|---|---|---|
|
(in millions)
|
March 31, 2013
|
December 31, 2012
|
|||||
|
Commercial mortgages * |
$
|
14,170
|
|
$ | 13,788 | ||
|
Life insurance policy loans |
|
2,900
|
|
2,952 | |||
|
Commercial loans, other loans and notes receivable |
|
2,803
|
|
3,147 | |||
|
Total mortgage and other loans receivable |
|
19,873
|
|
19,887 | |||
|
Allowance for losses |
|
(385
|
)
|
(405 | ) | ||
|
Mortgage and other loans receivable, net |
$
|
19,488
|
|
$ | 19,482 | ||
* Commercial mortgages primarily represent loans for office, retail and industrial properties, with exposures in California and New York representing the largest geographic concentrations (aggregating approximately 21 percent and 18 percent at March 31, 2013, respectively, and approximately 22 percent and 15 percent at December 31, 2012, respectively). Over 99 percent of the commercial mortgages held at such respective dates were current as to payments of principal and interest.
The following table presents the credit quality indicators for commercial mortgages:
|
|
Number
of Loans |
Class |
|
Percent
of Total $ |
||||||||||||||||||||||||
|---|---|---|---|---|---|---|---|---|---|---|---|---|---|---|---|---|---|---|---|---|---|---|---|---|---|---|---|---|
|
March 31, 2013
(dollars in millions) |
|
|||||||||||||||||||||||||||
|
Apartments
|
Offices
|
Retail
|
Industrial
|
Hotel
|
Others
|
Total
|
||||||||||||||||||||||
|
Credit Quality Indicator: |
||||||||||||||||||||||||||||
|
In good standing |
989 | $ | 1,948 | $ | 4,563 | $ | 2,646 | $ | 1,769 | $ | 1,141 | $ | 1,684 | $ | 13,751 | 97 | % | |||||||||||
|
Restructured (a) |
8 | 50 | 207 | 7 | 1 | – | 21 | 286 | 2 | |||||||||||||||||||
|
90 days or less delinquent |
2 | – | – | – | – | – | – | – | – | |||||||||||||||||||
|
>90 days delinquent or in process of foreclosure |
8 | – | 30 | 27 | – | – | 76 | 133 | 1 | |||||||||||||||||||
|
Total (b) |
1,007 | $ | 1,998 | $ | 4,800 | $ | 2,680 | $ | 1,770 | $ | 1,141 | $ | 1,781 | $ | 14,170 | 100 | % | |||||||||||
|
Valuation allowance |
$ | 4 | $ | 73 | $ | 26 | $ | 19 | $ | 1 | $ | 42 | $ | 165 | 1 | % | ||||||||||||
(a) Loans that have been modified in troubled debt restructurings and are performing according to their restructured terms. For additional discussion of troubled debt restructurings see Note 8 to the Consolidated Financial Statements in the 2012 Annual Report.
(b) Does not reflect valuation allowances.
Allowance for Credit Losses
See Note 8 to the Consolidated Financial Statements in the 2012 Annual Report for a discussion of our accounting policy for evaluating mortgage and other loans receivable for impairment.
The following table presents a rollforward of the changes in the allowance for losses on Mortgage and other loans receivable:
|
|
|
|
|
|
|||||||||||||||
|---|---|---|---|---|---|---|---|---|---|---|---|---|---|---|---|---|---|---|---|
|
|
2013 | 2012 | |||||||||||||||||
|
Three Months Ended March 31,
(in millions) |
Commercial
|
Other
|
Total
|
Commercial
Mortgages |
Other
Loans |
Total
|
|||||||||||||
|
Allowance, beginning of year |
$
|
159
|
|
$
|
246
|
|
$
|
405
|
|
$ | 305 | $ | 435 | $ | 740 | ||||
|
Loans charged off |
|
(1
|
)
|
|
(22
|
)
|
|
(23
|
)
|
(6 | ) | (5 | ) | (11 | ) | ||||
|
Recoveries of loans previously charged off |
|
|
|
|
1
|
|
|
1
|
|
2 | – | 2 | |||||||
|
Net charge-offs |
|
(1
|
)
|
|
(21
|
)
|
|
(22
|
)
|
(4 | ) | (5 | ) | (9 | ) | ||||
|
Provision for loan losses |
|
7
|
|
|
(4
|
)
|
|
3
|
|
(5 | ) | 7 | 2 | ||||||
|
Other |
|
–
|
|
|
(1
|
)
|
|
(1
|
)
|
– | (1 | ) | (1 | ) | |||||
|
Activity of discontinued operations |
|
–
|
|
|
–
|
|
|
–
|
|
– | (24 | ) | (24 | ) | |||||
|
Allowance, end of period |
$
|
165
|
*
|
$
|
220
|
|
$
|
385
|
|
$ | 296 | * | $ | 412 | $ | 708 | |||
* Of the total, $53 million and $60 million relates to individually assessed credit losses on $208 million and $442 million of commercial mortgage loans at March 31, 2013 and 2012, respectively.
No significant loans were modified in a troubled debt restructuring during the three month periods ended March 31, 2013 and 2012.
36
ITEM 1. / NOTE 8. VARIABLE INTEREST ENTITIES
NOTES TO CONDENSED CONSOLIDATED FINANCIAL STATEMENTS (unaudited)
8. VARIABLE INTEREST ENTITIES
We enter into various arrangements with variable interest entities (VIEs) in the normal course of business. Our involvement with VIEs is primarily through our insurance companies as a passive investor in debt securities (rated and unrated) and equity interests issued by VIEs. Our exposure is generally limited to those interests held.
For VIEs with attributes consistent with that of an investment company or a money market fund, the primary beneficiary is the party or group of related parties that absorbs a majority of the expected losses of the VIE, receives the majority of the expected residual returns of the VIE, or both.
For all other VIEs, the primary beneficiary is the entity that has both (1) the power to direct the activities of the VIE that most significantly affect the entity's economic performance and (2) the obligation to absorb losses or the right to receive benefits that could be potentially significant to the VIE. While also considering these factors, the consolidation conclusion depends on the breadth of our decision-making ability and our ability to influence activities that significantly affect the economic performance of the VIE.
Exposure to Loss
AIG's total off-balance sheet exposure associated with VIEs, primarily consisting of commitments to real estate and investment funds, was $0.2 billion at both March 31, 2013 and December 31, 2012.
The following table presents the total assets and total liabilities associated with our variable interests in consolidated VIEs:
|
|
|
|
|
|
|||||||||
|---|---|---|---|---|---|---|---|---|---|---|---|---|---|
|
|
VIE Assets (a) | VIE Liabilities | |||||||||||
|
(in billions)
|
March 31,
|
December 31,
2012 |
March 31,
|
December 31,
2012 |
|||||||||
|
ALICO SPV |
$
|
0.6
|
|
$ | 0.6 |
$
|
0.1
|
|
$ | 0.1 | |||
|
Real estate and investment funds (b) |
|
1.5
|
|
1.4 |
|
0.2
|
|
0.2 | |||||
|
Securitization vehicles |
|
3.0
|
|
2.4 |
|
0.1
|
|
– | |||||
|
Structured investment vehicles |
|
1.7
|
|
1.7 |
|
0.2
|
|
0.1 | |||||
|
Affordable housing partnerships |
|
2.3
|
|
2.3 |
|
0.3
|
|
0.2 | |||||
|
Other |
|
3.3
|
|
3.3 |
|
1.2
|
|
1.3 | |||||
|
Total |
$
|
12.4
|
|
$ | 11.7 |
$
|
2.1
|
|
$ | 1.9 | |||
(a) The assets of each VIE can be used only to settle specific obligations of that VIE.
(b) At March 31, 2013 and December 31, 2012, off-balance sheet exposure with respect to real estate and investment funds was $50.9 million and $48.7 million, respectively.
We calculate our maximum exposure to loss to be (i) the amount invested in the debt or equity of the VIE, (ii) the notional amount of VIE assets or liabilities where we have also provided credit protection to the VIE with the VIE as the referenced obligation, and (iii) other commitments and guarantees to the VIE. Interest holders in VIEs sponsored by us generally have recourse only to the assets and cash flows of the VIEs and do not have recourse to us, except in limited circumstances when we have provided a guarantee to the VIE's interest holders.
37
NOTES TO CONDENSED CONSOLIDATED FINANCIAL STATEMENTS (unaudited)
The following table presents total assets of unconsolidated VIEs in which we hold a variable interest, as well as our maximum exposure to loss associated with these VIEs:
|
|
|
Maximum Exposure to Loss | |||||||||||
|---|---|---|---|---|---|---|---|---|---|---|---|---|---|
|
(in billions)
|
Total VIE
Assets |
On-Balance
Sheet |
Off-Balance
Sheet |
Total
|
|||||||||
|
March 31, 2013 |
|||||||||||||
|
Real estate and investment funds |
$ | 16.7 | $ | 1.8 | $ | 0.2 | $ | 2.0 | |||||
|
Affordable housing partnerships |
0.5 | 0.5 | – | 0.5 | |||||||||
|
Other |
1.0 | 0.1 | – | 0.1 | |||||||||
|
Total |
$ | 18.2 | $ | 2.4 | $ | 0.2 | $ | 2.6 | |||||
|
December 31, 2012 |
|||||||||||||
|
Real estate and investment funds |
$ | 16.7 | $ | 1.8 | $ | 0.2 | $ | 2.0 | |||||
|
Affordable housing partnerships |
0.5 | 0.5 | – | 0.5 | |||||||||
|
Other |
1.0 | 0.1 | – | 0.1 | |||||||||
|
Total |
$ | 18.2 | $ | 2.4 | $ | 0.2 | $ | 2.6 | |||||
Balance Sheet Classification
AIG's interests in the assets and liabilities of consolidated and unconsolidated VIEs were classified in the Condensed Consolidated Balance Sheet as follows:
|
|
|
|
|
|
|||||||||
|---|---|---|---|---|---|---|---|---|---|---|---|---|---|
|
|
Consolidated VIEs | Unconsolidated VIEs | |||||||||||
|
(in billions)
|
March 31,
|
December 31,
2012 |
March 31,
|
December 31,
2012 |
|||||||||
|
Assets: |
|
|
|
|
|
|
|||||||
|
Available for sale securities |
$
|
3.6
|
|
$ | 2.9 |
$
|
–
|
|
$ | – | |||
|
Trading securities |
|
1.0
|
|
1.0 |
|
0.1
|
|
0.1 | |||||
|
Mortgage and other loans receivable |
|
0.3
|
|
0.4 |
|
–
|
|
– | |||||
|
Other invested assets |
|
4.3
|
|
4.4 |
|
2.3
|
|
2.3 | |||||
|
Other asset accounts |
|
3.2
|
|
3.0 |
|
–
|
|
– | |||||
|
Total assets |
$
|
12.4
|
|
$ | 11.7 |
$
|
2.4
|
|
$ | 2.4 | |||
|
Liabilities: |
|
|
|
|
|
|
|||||||
|
Long-term debt |
$
|
0.8
|
|
$ | 0.7 |
$
|
–
|
|
$ | – | |||
|
Other liability accounts |
|
1.3
|
|
1.2 |
|
–
|
|
– | |||||
|
Total liabilities |
$
|
2.1
|
|
$ | 1.9 |
$
|
–
|
|
$ | – | |||
See Note 11 to the Consolidated Financial Statements in the 2012 Annual Report for additional information on VIEs.
38
ITEM 1. / NOTE 9. DERIVATIVES AND HEDGE ACCOUNTING
NOTES TO CONDENSED CONSOLIDATED FINANCIAL STATEMENTS (unaudited)
9. DERIVATIVES AND HEDGE ACCOUNTING
We use derivatives and other financial instruments as part of our financial risk management programs and as part of our investment operations. See Note 12 to the Consolidated Financial Statements in the 2012 Annual Report for a discussion of our accounting policies and procedures regarding derivatives and hedge accounting.
The following table presents the notional amounts and fair values of AIG's derivative instruments:
|
|
|
|
|
|
|
||||||||||||||||||||
|---|---|---|---|---|---|---|---|---|---|---|---|---|---|---|---|---|---|---|---|---|---|---|---|---|---|
|
|
March 31, 2013 | December 31, 2012 | |||||||||||||||||||||||
|
|
Gross Derivative Assets | Gross Derivative Liabilities | Gross Derivative Assets | Gross Derivative Liabilities | |||||||||||||||||||||
|
(in millions)
|
Notional
|
Fair
|
Notional
|
Fair
|
Notional
Amount |
Fair
Value (a) |
Notional
Amount |
Fair
Value (a) |
|||||||||||||||||
|
Derivatives designated as hedging
|
|
|
|
|
|
|
|
|
|
|
|
|
|||||||||||||
|
Foreign exchange contracts |
$
|
344
|
|
$
|
5
|
|
$
|
298
|
|
$
|
25
|
|
$ | – | $ | – | $ | – | $ | – | |||||
|
Derivatives not designated as
|
|
|
|
|
|
|
|
|
|
|
|
|
|||||||||||||
|
Interest rate contracts (b) |
|
63,239
|
|
|
5,835
|
|
|
58,739
|
|
|
5,395
|
|
63,463 | 6,479 | 63,482 | 5,806 | |||||||||
|
Foreign exchange contracts |
|
3,275
|
|
|
76
|
|
|
2,825
|
|
|
103
|
|
8,325 | 104 | 10,168 | 174 | |||||||||
|
Equity contracts (c) |
|
5,596
|
|
|
252
|
|
|
24,714
|
|
|
1,160
|
|
4,990 | 221 | 25,626 | 1,377 | |||||||||
|
Commodity contracts |
|
620
|
|
|
147
|
|
|
615
|
|
|
148
|
|
625 | 145 | 622 | 146 | |||||||||
|
Credit contracts |
|
70
|
|
|
59
|
|
|
15,763
|
|
|
1,834
|
|
70 | 60 | 16,244 | 2,051 | |||||||||
|
Other contracts (d) |
|
20,796
|
|
|
38
|
|
|
1,385
|
|
|
183
|
|
20,449 | 38 | 1,488 | 206 | |||||||||
|
Total derivatives not designated as |
|
|
|
|
|
|
|
|
|
|
|
|
|||||||||||||
|
hedging instruments |
|
93,596
|
|
|
6,407
|
|
|
104,041
|
|
|
8,823
|
|
97,922 | 7,047 | 117,630 | 9,760 | |||||||||
|
Total derivatives, gross |
$
|
93,940
|
|
$
|
6,412
|
|
$
|
104,339
|
|
$
|
8,848
|
|
$ | 97,922 | $ | 7,047 | $ | 117,630 | $ | 9,760 | |||||
(a) Fair value amounts are shown before the effects of counterparty netting adjustments and offsetting cash collateral.
(b) Includes cross currency swaps.
(c) Notional amount of derivative liabilities and fair values of derivative liabilities include $22 billion and $1 billion, respectively, at March 31, 2013, and $23 billion and $1.3 billion, respectively, at December 31, 2012, related to bifurcated embedded derivatives. A bifurcated embedded derivative is generally presented with the host contract in the Condensed Consolidated Balance Sheet.
(d) Consists primarily of contracts with multiple underlying exposures.
The following table presents the fair values of derivative assets and liabilities on the Condensed Consolidated Balance Sheet:
|
|
|
|
|
|
|
||||||||||||||||||||
|---|---|---|---|---|---|---|---|---|---|---|---|---|---|---|---|---|---|---|---|---|---|---|---|---|---|
|
|
March 31, 2013 | December 31, 2012 | |||||||||||||||||||||||
|
|
Derivative Assets | Derivative Liabilities | Derivative Assets | Derivative Liabilities | |||||||||||||||||||||
|
(in millions)
|
Notional
|
Fair
|
Notional
|
Fair
|
Notional
Amount |
Fair
Value |
Notional
Amount |
Fair
Value |
|||||||||||||||||
|
Global Capital Markets derivatives: |
|
|
|
|
|
|
|
|
|
|
|
|
|||||||||||||
|
AIG Financial Products |
$
|
61,763
|
|
$
|
4,445
|
|
$
|
60,355
|
|
$
|
4,966
|
|
$ | 59,854 | $ | 4,725 | $ | 66,717 | $ | 5,506 | |||||
|
AIG Markets |
|
6,893
|
|
|
1,083
|
|
|
13,621
|
|
|
1,783
|
|
14,028 | 1,308 | 18,774 | 1,818 | |||||||||
|
Total Global Capital Markets
|
|
68,656
|
|
|
5,528
|
|
|
73,976
|
|
|
6,749
|
|
73,882 | 6,033 | 85,491 | 7,324 | |||||||||
|
Non-Global Capital Markets
|
|
25,284
|
|
|
884
|
|
|
30,363
|
|
|
2,099
|
|
24,040 | 1,014 | 32,139 | 2,436 | |||||||||
|
Total derivatives, gross |
$
|
93,940
|
|
|
6,412
|
|
$
|
104,339
|
|
|
8,848
|
|
$ | 97,922 | 7,047 | $ | 117,630 | 9,760 | |||||||
|
Counterparty netting (b) |
|
|
|
|
(2,234
|
)
|
|
|
|
|
(2,234
|
)
|
(2,467 | ) | (2,467 | ) | |||||||||
|
Cash collateral (c) |
|
|
|
|
(888
|
)
|
|
|
|
|
(1,855
|
)
|
(909 | ) | (1,976 | ) | |||||||||
|
Total derivatives, net |
|
|
|
|
3,290
|
|
|
|
|
|
4,759
|
|
3,671 | 5,317 | |||||||||||
|
Less: Bifurcated embedded
|
|
|
|
|
–
|
|
|
|
|
|
1,048
|
|
– | 1,256 | |||||||||||
|
Total derivatives on consolidated |
|
|
|
|
|
|
|
|
|
|
|
|
|||||||||||||
|
balance sheet |
|
|
|
$
|
3,290
|
|
|
|
|
$
|
3,711
|
|
$ | 3,671 | $ | 4,061 | |||||||||
(a) Represents derivatives used to hedge the foreign currency and interest rate risk associated with insurance as well as embedded derivatives included in insurance contracts. Liabilities include bifurcated embedded derivatives, which are recorded in Policyholder contract deposits.
(b) Represents netting of derivative exposures covered by a qualifying master netting agreement.
(c) Represents cash collateral posted and received that is eligible for netting.
39
ITEM 1. / NOTE 9. DERIVATIVES AND HEDGE ACCOUNTING
NOTES TO CONDENSED CONSOLIDATED FINANCIAL STATEMENTS (unaudited)
Collateral
We engage in derivative transactions directly with unaffiliated third parties in most cases under International Swaps and Derivatives Association, Inc. (ISDA) agreements. Many of the ISDA agreements also include Credit Support Annex (CSA) provisions, which generally provide for collateral postings at various ratings and threshold levels.
Collateral posted by us to third parties for derivative transactions was $4.1 billion and $4.5 billion at March 31, 2013 and December 31, 2012, respectively. This collateral can generally be repledged or resold by the counterparties. Collateral obtained by us from third parties for derivative transactions was $1.2 billion and $1.4 billion at March 31, 2013 and December 31, 2012, respectively. We generally can repledge or resell this collateral.
Offsetting
We have elected to present all derivative receivables and derivative payables, and the related cash collateral received and paid, on a net basis on our Condensed Consolidated Balance Sheet when a legally enforceable master netting agreement exists between us and our derivative counterparty. A master netting agreement is an agreement between two counterparties who have multiple derivative contracts with each other that provides for the net settlement of all contracts, as well as cash collateral, through a single payment, in a single currency, in the event of default on or upon termination of any one contract.
Hedge Accounting
We designated certain derivatives entered into by Global Capital Markets (GCM) with third parties as fair value hedges of available-for-sale investment securities held by our insurance subsidiaries. The fair value hedges include foreign currency forwards designated as hedges of the change in fair value of foreign currency denominated available-for-sale securities attributable to changes in foreign exchange rates.
We use foreign currency denominated debt and cross-currency swaps as hedging instruments in net investment hedge relationships to mitigate the foreign exchange risk associated with our non-U.S. dollar functional currency foreign subsidiaries. We assess the hedge effectiveness and measure the amount of ineffectiveness for these hedge relationships based on changes in spot exchange rates. For the three-month period ended March 31, 2013 and 2012 we recognized gains (losses) of $130 million and $(91) million, respectively, included in Foreign currency translation adjustment in Accumulated other comprehensive income related to the net investment hedge relationships.
A qualitative methodology is utilized to assess hedge effectiveness for net investment hedges, while regression analysis is employed for all other hedges.
The following table presents the gain (loss) recognized in earnings on our derivative instruments in fair value hedging relationships in the Condensed Consolidated Statement of Income:
|
|
|
|
|||||
|---|---|---|---|---|---|---|---|
|
Three Months Ended March 31,
(in millions) |
2013
|
2012
|
|||||
|
Interest rate contracts: (a) |
|
|
|
||||
|
Hedged items (b) |
$
|
30
|
|
$ | 30 | ||
|
Foreign exchange contracts: (a) |
|
|
|
||||
|
Derivatives |
|
(5
|
)
|
(2 | ) | ||
|
Hedged items |
|
4
|
|
2 | |||
|
Amount excluded from effectiveness testing |
|
(1
|
)
|
– | |||
(a) Gains and losses recognized in earnings for the ineffective portion and amounts excluded from effectiveness testing, if any, are recorded in Net realized capital gains (losses).
(b) Represents the amortization of debt basis adjustment recorded in Other income and Net realized capital gains (losses) following the discontinuation of hedge accounting.
40
ITEM 1. / NOTE 9. DERIVATIVES AND HEDGE ACCOUNTING
NOTES TO CONDENSED CONSOLIDATED FINANCIAL STATEMENTS (unaudited)
Derivatives Not Designated as Hedging Instruments
The following table presents the effect of AIG's derivative instruments not designated as hedging instruments in the Condensed Consolidated Statement of Income:
|
|
|
|
|||||
|---|---|---|---|---|---|---|---|
|
|
Gains (Losses) Recognized in Earnings | ||||||
|
Three Months Ended March 31,
(in millions) |
|||||||
|
2013
|
2012
|
||||||
|
By Derivative Type: |
|
|
|
||||
|
Interest rate contracts (a) |
$
|
(216
|
)
|
$ | (586 | ) | |
|
Foreign exchange contracts |
|
155
|
|
69 | |||
|
Equity contracts (b) |
|
44
|
|
(188 | ) | ||
|
Commodity contracts |
|
–
|
|
(1 | ) | ||
|
Credit contracts |
|
175
|
|
151 | |||
|
Other contracts |
|
44
|
|
30 | |||
|
Total |
$
|
202
|
|
$ | (525 | ) | |
|
By Classification: |
|
|
|
||||
|
Policy fees |
$
|
45
|
|
$ | 36 | ||
|
Net investment income |
|
24
|
|
1 | |||
|
Net realized capital gains (losses) |
|
(276
|
)
|
(290 | ) | ||
|
Other income (losses) |
|
412
|
|
(272 | ) | ||
|
Policyholder benefits and claims incurred |
|
(3
|
)
|
– | |||
|
Total |
$
|
202
|
|
$ | (525 | ) | |
(a) Includes cross currency swaps.
(b) Includes embedded derivative gains of $256 million and $175 million for the three month periods ended March 31, 2013 and 2012, respectively.
GLOBAL CAPITAL MARKETS DERIVATIVES
GCM enters into derivatives to mitigate market risk in its exposures (interest rates, currencies, commodities, credit and equities) arising from its transactions. At March 31, 2013, GCM has entered into credit derivative transactions with respect to $65 million of securities to economically hedge its credit risk. In most cases, GCM has not hedged its exposures related to the credit default swaps it has written.
GCM follows a policy of minimizing interest rate, currency, commodity, and equity risks associated with investment securities by entering into offsetting positions, thereby offsetting a significant portion of the unrealized appreciation and depreciation.
SUPER SENIOR CREDIT DEFAULT SWAPS
Credit default swap transactions were entered into with the intention of earning revenue on credit exposure. In the majority of these transactions, we sold credit protection on a designated portfolio of loans or debt securities. Generally, we provided such credit protection on a "second loss" basis, meaning we would incur credit losses only after a shortfall of principal and/or interest, or other credit events, in respect of the protected loans and debt securities, exceeded a specified threshold amount or level of "first losses."
41
ITEM 1. / NOTE 9. DERIVATIVES AND HEDGE ACCOUNTING
NOTES TO CONDENSED CONSOLIDATED FINANCIAL STATEMENTS (unaudited)
The following table presents the net notional amount, fair value of derivative (asset) liability and unrealized market valuation gain (loss) of the super senior credit default swap portfolio, including credit default swaps written on mezzanine tranches of certain regulatory capital relief transactions, by asset class:
|
|
|
|
|
|
|
|
|||||||||||||
|---|---|---|---|---|---|---|---|---|---|---|---|---|---|---|---|---|---|---|---|
|
|
Net Notional Amount at (a) |
Fair Value of
Derivative Liability at (b)(c) |
Unrealized Market
Valuation Gain (c) |
||||||||||||||||
|
|
|
|
|
|
Three Months Ended
March 31, |
||||||||||||||
|
|
March 31,
|
December 31,
2012 |
March 31,
|
December 31,
2012 |
|||||||||||||||
|
(in millions)
|
2013
|
2012
|
|||||||||||||||||
|
Regulatory Capital: |
|
|
|
|
|
|
|
|
|
||||||||||
|
Prime residential mortgages |
$
|
23
|
|
$ | 97 |
$
|
–
|
|
$ | – |
$
|
–
|
|
$ | – | ||||
|
Other |
|
–
|
|
– |
|
–
|
|
– |
|
–
|
|
6 | |||||||
|
Total |
|
23
|
|
97 |
|
–
|
|
– |
|
–
|
|
6 | |||||||
|
Arbitrage: |
|
|
|
|
|
|
|
|
|
||||||||||
|
Multi-sector CDOs (d) |
|
3,743
|
|
3,944 |
|
1,715
|
|
1,910 |
|
155
|
|
126 | |||||||
|
Corporate debt/CLOs (e) |
|
11,631
|
|
11,832 |
|
44
|
|
60 |
|
16
|
|
17 | |||||||
|
Total |
|
15,374
|
|
15,776 |
|
1,759
|
|
1,970 |
|
171
|
|
143 | |||||||
|
Mezzanine tranches |
|
–
|
|
– |
|
–
|
|
– |
|
–
|
|
(9 | ) | ||||||
|
Total |
$
|
15,397
|
|
$ | 15,873 |
$
|
1,759
|
|
$ | 1,970 |
$
|
171
|
|
$ | 140 | ||||
(a) Net notional amounts presented are net of all structural subordination below the covered tranches. The decrease in the total net notional amount from December 31, 2012 to March 31, 2013 was due primarily to foreign exchange rate gains of $222 million, amortization of $190 million and terminations of $59 million.
(b) Fair value amounts are shown before the effects of counterparty netting adjustments and offsetting cash collateral.
(c) Includes credit valuation adjustment losses of $2 million and $26 million for the three-month periods ended March 31, 2013 and 2012, respectively, representing the effect of changes in AIG's credit spreads on the valuation of the derivatives liabilities.
(d) During the three-month period ended March 31, 2013, we paid $40 million to counterparties with respect to multi-sector CDOs. Upon payment, a $40 million loss, which was previously included in the fair value of the derivative liability as an unrealized market valuation loss, was realized. Multi-sector CDOs also include $3.3 billion and $3.4 billion in net notional amount of credit default swaps written with cash settlement provisions at March 31, 2013 and December 31, 2012, respectively. Collateral postings with regards to multi-sector CDOs were $1.4 billion and $1.6 billion at March 31, 2013 and December 31, 2012, respectively.
(e) Corporate debt/CLOs include $1.1 billion and $1.2 billion in net notional amount of credit default swaps written on the super senior tranches of CLOs at March 31, 2013 and December 31, 2012, respectively. Collateral postings with regards to corporate debt/CLOs were $398 million and $420 million at March 31, 2013 and December 31, 2012, respectively.
The expected weighted average maturity of the super senior credit derivative portfolios as of March 31, 2013 was less than one year for the regulatory capital prime residential mortgage portfolio, 6 years for the multi-sector CDO arbitrage portfolio and 3 years for the corporate debt/CLO portfolio.
Given the current performance of the underlying portfolios, the level of subordination of the credit protection written and the assessment of the credit quality of the underlying portfolio, as well as the risk mitigants inherent in the transaction structures, we do not expect that we will be required to make payments pursuant to the contractual terms of those transactions providing regulatory relief.
Because of long-term maturities of the CDS in the arbitrage portfolio, we are unable to make reasonable estimates of the periods during which any payments would be made. However, the net notional amount represents the maximum exposure to loss on the super senior credit default swap portfolio.
Written Single Name Credit Default Swaps
We have also entered into credit default swap contracts referencing single-name exposures written on corporate, index and asset-backed credits with the intention of earning spread income on credit exposure. Some of these transactions were entered into as part of a long-short strategy to earn the net spread between CDS written and
42
ITEM 1. / NOTE 9. DERIVATIVES AND HEDGE ACCOUNTING
NOTES TO CONDENSED CONSOLIDATED FINANCIAL STATEMENTS (unaudited)
purchased. At March 31, 2013, the net notional amount of these written CDS contracts was $399 million, including ABS CDS transactions purchased from a liquidated multi-sector super senior CDS transaction. These exposures have been partially hedged by purchasing offsetting CDS contracts of $50 million in net notional amount. The net unhedged position of $349 million represents the maximum exposure to loss on these CDS contracts. The average maturity of the written CDS contracts is 4 years. At March 31, 2013, the fair value of derivative liability (which represents the carrying value) of the portfolio of CDS was $44 million.
Upon a triggering event (e.g., a default) with respect to the underlying credit, we would have the option to either settle the position through an auction process (cash settlement) or pay the notional amount of the contract to the counterparty in exchange for a bond issued by the underlying credit obligor (physical settlement).
These CDS contracts were written under ISDA Master Agreements. The majority of these ISDA Master Agreements include credit support annexes (CSAs) that provide for collateral postings at various ratings and threshold levels. At March 31, 2013, collateral posted by us under these contracts was $59 million prior to offsets for other transactions.
All Other Derivatives
Our businesses, other than GCM, also use derivatives and other instruments as part of their financial risk management. Interest rate derivatives (such as interest rate swaps) are used to manage interest rate risk associated with embedded derivatives contained in insurance contract liabilities, fixed maturity securities, outstanding medium- and long-term notes as well as other interest rate sensitive assets and liabilities. Foreign exchange derivatives (principally foreign exchange forwards and options) are used to economically mitigate risk associated with non-U.S. dollar denominated debt, net capital exposures, and foreign currency transactions. Equity derivatives are used to mitigate financial risk embedded in certain insurance liabilities. The derivatives are effective economic hedges of the exposures that they are meant to offset.
In addition to hedging activities, we also enter into derivative instruments with respect to investment operations, which include, among other things, credit default swaps and purchasing investments with embedded derivatives, such as equity-linked notes and convertible bonds.
Credit Risk-Related Contingent Features
The aggregate fair value of our derivative instruments that contain credit risk-related contingent features that were in a net liability position at March 31, 2013, was approximately $3.6 billion. The aggregate fair value of assets posted as collateral under these contracts at March 31, 2013, was $3.9 billion.
We estimate that at March 31, 2013, based on our outstanding financial derivative transactions, a one-notch downgrade of our long-term senior debt ratings to BBB+ by Standard & Poor's Financial Services LLC, a subsidiary of The McGraw-Hill Companies, Inc. (S&P), would permit counterparties to make additional collateral calls and permit certain counterparties to elect early termination of contracts, resulting in a negligible amount of corresponding collateral postings and termination payments; a one-notch downgrade to Baa2 by Moody's Investors' Service, Inc. (Moody's) and an additional one-notch downgrade to BBB by S&P would result in approximately $90 million in additional collateral postings and termination payments, and a further one-notch downgrade to Baa3 by Moody's and BBB- by S&P would result in approximately $228 million in additional collateral postings and termination payments.
Additional collateral postings upon downgrade are estimated based on the factors in the individual collateral posting provisions of the CSA with each counterparty and current exposure as of March 31, 2013. Factors considered in estimating the termination payments upon downgrade include current market conditions, the complexity of the derivative transactions, historical termination experience and other observable market events such as bankruptcy and downgrade events that have occurred at other companies. Our estimates are also based on the assumption that counterparties will terminate based on their net exposure to us. The actual termination payments could significantly differ from our estimates given market conditions at the time of downgrade and the level of uncertainty in estimating both the number of counterparties who may elect to exercise their right to terminate and the payment that may be triggered in connection with any such exercise.
43
NOTES TO CONDENSED CONSOLIDATED FINANCIAL STATEMENTS (unaudited)
HYBRID SECURITIES WITH EMBEDDED CREDIT DERIVATIVES
We invest in hybrid securities (such as credit-linked notes) with the intent of generating income, and not specifically to acquire exposure to embedded derivative risk. As is the case with our other investments in RMBS, CMBS, CDOs and ABS, our investments in these hybrid securities are exposed to losses only up to the amount of our initial investment in the hybrid security. Other than our initial investment in the hybrid securities, we have no further obligation to make payments on the embedded credit derivatives in the related hybrid securities.
We elect to account for our investments in these hybrid securities with embedded written credit derivatives at fair value, with changes in fair value recognized in Net investment income and Other income. Our investments in these hybrid securities are reported as Bond trading securities in the Condensed Consolidated Balance Sheet. The fair value of these hybrid securities was $6.6 billion at March 31, 2013. These securities have a current par amount of $14.6 billion and have remaining stated maturity dates that extend to 2052.
10. CONTINGENCIES, COMMITMENTS AND GUARANTEES
In the normal course of business, various contingent liabilities and commitments are entered into by AIG and certain of our subsidiaries. In addition, AIG guarantees various obligations of certain subsidiaries.
We recorded an increase in our estimated litigation liability of approximately $1.3 million for the three-month period ended March 31, 2013 based on developments in several actions.
Although we cannot currently quantify our ultimate liability for unresolved litigation and investigation matters, including those referred to below, it is possible that such liability could have a material adverse effect on our consolidated financial condition or our consolidated results of operations or consolidated cash flows for an individual reporting period.
Legal Contingencies
Overview. AIG and our subsidiaries, in common with the insurance and financial services industries in general, are subject to litigation, including claims for punitive damages, in the normal course of their business. In our insurance operations (including UGC), litigation arising from claims settlement activities is generally considered in the establishment of our liability for unpaid claims and claims adjustment expense. However, the potential for increasing jury awards and settlements makes it difficult to assess the ultimate outcome of such litigation. AIG is also subject to derivative, class action and other claims asserted by its shareholders and others alleging, among other things, breach of fiduciary duties by its directors and officers and violations of insurance laws and regulations, as well as federal and state securities laws. In the case of any derivative action brought on behalf of AIG, any recovery would accrue to the benefit of AIG.
Various regulatory and governmental agencies have been reviewing certain public disclosures, transactions and practices of AIG and our subsidiaries in connection with industry-wide and other inquiries into, among other matters, our liquidity, compensation paid to certain employees, payments made to counterparties, and certain business practices and valuations of current and former operating insurance subsidiaries. We have cooperated, and will continue to cooperate, in producing documents and other information in response to subpoenas and other requests.
AIG's Subprime Exposure, AIGFP Credit Default Swap Portfolio and Related Matters
AIG, AIGFP and certain directors and officers of AIG, AIGFP and other AIG subsidiaries have been named in various actions relating to our exposure to the U.S. residential subprime mortgage market, unrealized market valuation losses on AIGFP's super senior credit default swap portfolio, losses and liquidity constraints relating to our securities lending program and related disclosure and other matters (Subprime Exposure Issues).
Consolidated 2008 Securities Litigation. Between May 21, 2008 and January 15, 2009, eight purported securities class action complaints were filed against AIG and certain directors and officers of AIG and AIGFP, AIG's outside auditors, and the underwriters of various securities offerings in the United States District Court for the Southern District of New York (the Southern District of New York), alleging claims under the Securities Exchange Act of 1934, as amended (the Exchange Act), or claims under the Securities Act of 1933, as amended (the Securities Act). On March 20, 2009, the Court consolidated all eight of the purported securities class actions as In re American International Group, Inc. 2008 Securities Litigation (the Consolidated 2008 Securities Litigation).
44
ITEM 1. / NOTE 10. CONTINGENCIES, COMMITMENTS AND GUARANTEES
NOTES TO CONDENSED CONSOLIDATED FINANCIAL STATEMENTS (unaudited)
On May 19, 2009, lead plaintiff in the Consolidated 2008 Securities Litigation filed a consolidated complaint on behalf of purchasers of AIG Common Stock during the alleged class period of March 16, 2006 through September 16, 2008, and on behalf of purchasers of various AIG securities offered pursuant to AIG's shelf registration statements. The consolidated complaint alleges that defendants made statements during the class period in press releases, AIG's quarterly and year-end filings, during conference calls, and in various registration statements and prospectuses in connection with the various offerings that were materially false and misleading and that artificially inflated the price of AIG Common Stock. The alleged false and misleading statements relate to, among other things, the Subprime Exposure Issues. The consolidated complaint alleges violations of Sections 10(b) and 20(a) of the Exchange Act and Sections 11, 12(a)(2), and 15 of the Securities Act. On August 5, 2009, defendants filed motions to dismiss the consolidated complaint, and on September 27, 2010, the Court denied the motions to dismiss.
On April 1, 2011, the lead plaintiff in the Consolidated 2008 Securities Litigation filed a motion to certify a class of plaintiffs. On November 2, 2011, the Court terminated the motion without prejudice to an application for restoration. On March 30, 2012, the lead plaintiff filed a renewed motion to certify a class of plaintiffs.
On April 26, 2013, the Court granted a motion for judgment on the pleadings brought by the defendants. The Court's order dismissed all claims against the outside auditors in their entirety, and it also reduces the scope of the Securities Act claims against AIG and defendants other than the outside auditors. We have accrued our estimate of probable loss with respect to this litigation.
On November 18, 2011, January 20, 2012, June 11, 2012, and August 8, 2012, four separate, though similar, securities actions were brought against AIG and certain directors and officers of AIG and AIGFP by the Kuwait Investment Authority, various Oppenheimer Funds, eight foreign funds and investment entities led by the British Coal Staff Superannuation Scheme, and Pacific Life Funds and Pacific Select Fund. Discovery in these actions is stayed until the earlier of (i) the Court deciding the motion for class certification pending in the Consolidated 2008 Securities Litigation following 30 days' notice from any party, (ii) the preliminary approval of any settlement in the Consolidated 2008 Securities Litigation, or (iii) June 28, 2013, unless the Court orders an extension. As of May 2, 2013, no discussions concerning potential damages have occurred and the plaintiffs have not formally specified an amount of alleged damages in their respective actions. As a result, we are unable to reasonably estimate the possible loss or range of losses, if any, arising from these litigations.
ERISA Actions — Southern District of New York. Between June 25, 2008, and November 25, 2008, AIG, certain directors and officers of AIG, and members of AIG's Retirement Board and Investment Committee were named as defendants in eight purported class action complaints asserting claims on behalf of participants in certain pension plans sponsored by AIG or its subsidiaries. The Court subsequently consolidated these eight actions as In re American International Group, Inc. ERISA Litigation II. On September 4, 2012, lead plaintiffs' counsel filed a second consolidated amended complaint. The action purports to be brought as a class action under the Employee Retirement Income Security Act of 1974, as amended (ERISA), on behalf of all participants in or beneficiaries of certain benefit plans of AIG and its subsidiaries that offered shares of AIG Common Stock. In the consolidated amended complaint, plaintiffs allege, among other things, that the defendants breached their fiduciary responsibilities to plan participants and their beneficiaries under ERISA, by continuing to offer the AIG Stock Fund as an investment option in the plans after it allegedly became imprudent to do so. The alleged ERISA violations relate to, among other things, the defendants' purported failure to monitor and/or disclose certain matters, including the Subprime Exposure Issues.
On November 20, 2012, defendants filed motions to dismiss the consolidated amended complaint.
As of May 2, 2013, plaintiffs have not formally specified an amount of alleged damages, discovery is ongoing, and the Court has not determined if a class action is appropriate or the size or scope of any class. As a result, we are unable to reasonably estimate the possible loss or range of losses, if any, arising from the litigation.
Canadian Securities Class Action — Ontario Superior Court of Justice. On November 12, 2008, an application was filed in the Ontario Superior Court of Justice for leave to bring a purported class action against AIG, AIGFP, certain directors and officers of AIG and Joseph Cassano, the former Chief Executive Officer of AIGFP, pursuant to the Ontario Securities Act. If the Court grants the application, a class plaintiff will be permitted to file a statement of claim against defendants. The proposed statement of claim would assert a class period of March 16, 2006 through September 16, 2008 and would allege that during this period defendants made false and misleading
45
ITEM 1. / NOTE 10. CONTINGENCIES, COMMITMENTS AND GUARANTEES
NOTES TO CONDENSED CONSOLIDATED FINANCIAL STATEMENTS (unaudited)
statements and omissions in quarterly and annual reports and during oral presentations in violation of the Ontario Securities Act.
On April 17, 2009, defendants filed a motion record in support of their motion to stay or dismiss for lack of jurisdiction and forum non conveniens. On July 12, 2010, the Court adjourned a hearing on the motion pending a decision by the Supreme Court of Canada in a pair of actions captioned Club Resorts Ltd. v. Van Breda 2012 SCC 17 (Van Breda). On April 18, 2012, the Supreme Court of Canada clarified the standard for determining jurisdiction over foreign and out-of-province defendants, such as AIG, by holding that a defendant must have some form of "actual," as opposed to a merely "virtual," presence in order to be deemed to be "doing business" in the jurisdiction. The Supreme Court of Canada also suggested that in future cases, defendants may contest jurisdiction even when they are found to be doing business in a Canadian jurisdiction if their business activities in the jurisdiction are unrelated to the subject matter of the litigation. The matter has been stayed pending further developments in the Consolidated 2008 Securities Litigation.
In plaintiff's proposed statement of claim, plaintiff alleged general and special damages of $500 million and punitive damages of $50 million plus prejudgment interest or such other sums as the Court finds appropriate. As of May 2, 2013 the Court has not determined whether it has jurisdiction or granted plaintiff's application to file a statement of claim, no merits discovery has occurred and the action has been stayed. As a result, we are unable to reasonably estimate the possible loss or range of losses, if any, arising from the litigation.
Starr International Litigation
On November 21, 2011, Starr International Company, Inc. (SICO) filed a complaint against the United States in the United States Court of Federal Claims (the Court of Federal Claims), bringing claims, both individually and on behalf of all others similarly situated and derivatively on behalf of AIG (the SICO Treasury Action). The complaint challenges the government's assistance of AIG, pursuant to which AIG entered into a credit facility with the Federal Reserve Bank of New York (the FRBNY and such credit facility, the FRBNY Credit Facility) and the United States received an approximately 80 percent ownership in AIG. The complaint alleges that the interest rate imposed on AIG and the appropriation of approximately 80 percent of AIG's equity was discriminatory, unprecedented, and inconsistent with liquidity assistance offered by the government to other comparable firms at the time and violated the Equal Protection, Due Process, and Takings Clauses of the U.S. Constitution.
On November 21, 2011, SICO also filed a second complaint in the Southern District of New York against the FRBNY bringing claims, both individually and on behalf of all others similarly situated and derivatively on behalf of AIG (the SICO New York Action). This complaint also challenges the government's assistance of AIG, pursuant to which AIG entered into the FRBNY Credit Facility and the United States received an approximately 80 percent ownership in AIG. The complaint alleges that the FRBNY owed fiduciary duties to AIG as our controlling shareholder, and that the FRBNY breached these fiduciary duties by "divert[ing] the rights and assets of AIG and its shareholders to itself and favored third parties" through transactions involving Maiden Lane III LLC (ML III), an entity controlled by the FRBNY, and by "participating in, and causing AIG's officers and directors to participate in, the evasion of AIG's existing Common Stock shareholders' right to approve the massive issuance of the new Common Shares required to complete the government's taking of a nearly 80 percent interest in the Common Stock of AIG." SICO also alleges that the "FRBNY has asserted that in exercising its control over, and acting on behalf of, AIG it did not act in an official, governmental capacity or at the direction of the United States," but that "[t]o the extent the proof at or prior to trial shows that the FRBNY did in fact act in a governmental capacity, or at the direction of the United States, the improper conduct . . . constitutes the discriminatory takings of the property and property rights of AIG without due process or just compensation."
On January 31, 2012 and February 1, 2012, amended complaints were filed in the Court of Federal Claims and the Southern District of New York, respectively.
In rulings dated July 2, 2012, and September 17, 2012, the Court of Federal Claims largely denied the United States' motion to dismiss in the SICO Treasury Action. Discovery is proceeding.
On November 19, 2012, the Southern District of New York granted the FRBNY's motion to dismiss the SICO New York Action. On December 21, 2012, SICO filed a notice of appeal in the United States Court of Appeals for the Second Circuit.
46
ITEM 1. / NOTE 10. CONTINGENCIES, COMMITMENTS AND GUARANTEES
NOTES TO CONDENSED CONSOLIDATED FINANCIAL STATEMENTS (unaudited)
In both of the actions commenced by SICO, the only claims naming AIG as a party (nominal defendant) are derivative claims on behalf of AIG. On September 21, 2012, SICO made a pre-litigation demand on our Board demanding that we pursue the derivative claims in both actions or allow SICO to pursue the claims on our behalf. On January 9, 2013, our Board unanimously refused SICO's demand in its entirety and on January 23, 2013, counsel for the Board sent a letter to counsel for SICO describing the process by which our Board considered and refused SICO's demand and stating the reasons for our Board's determination. On March 11, 2013, SICO filed a second amended complaint in the SICO Treasury Action alleging that demand was excused and wrongfully refused. On April 5, 2013, AIG and the United States filed motions to dismiss such claims in SICO's second amended complaint.
On March 11, 2013, the Court of Federal Claims in the SICO Treasury Action granted SICO's motion for class certification of two classes: (1) persons and entities who held shares of AIG Common Stock on or before September 16, 2008 and who owned those shares on September 22, 2008; and (2) persons and entities who owned shares of AIG Common Stock on June 30, 2009 and were eligible to vote those shares at AIG's June 30, 2009 annual meeting of shareholders.
The United States has alleged, as an affirmative defense in its answer, that AIG is obligated to indemnify the FRBNY and its representatives, including the Federal Reserve Board of Governors and the United States (as the FRBNY's principal), for any recovery in the SICO Treasury Action, and seeks a contingent offset or recoupment for the value of net operating loss benefits the United States alleges that we received as a result of the government's assistance. The FRBNY has also requested indemnification under the FRBNY Credit Facility from AIG in connection with the SICO New York Action and from ML III under the Master Investment and Credit Agreement and the Amended and Restated Limited Liability Company Agreement of ML III.
Other Litigation Related to AIGFP
On September 30, 2009, Brookfield Asset Management, Inc. and Brysons International, Ltd. (together, Brookfield) filed a complaint against AIG and AIGFP in the Southern District of New York. Brookfield seeks a declaration that a 1990 interest rate swap agreement between Brookfield and AIGFP (guaranteed by AIG) terminated upon the occurrence of certain alleged events that Brookfield contends constituted defaults under the swap agreement's standard "bankruptcy" default provision. Brookfield claims that it is excused from all future payment obligations under the swap agreement on the basis of the purported termination. At March 31, 2013, the estimated present value of expected future cash flows discounted at LIBOR was $1.5 billion, which represents our maximum contractual loss from the alleged termination of the contract. It is our position that no termination event has occurred and that the swap agreement remains in effect. A determination that a termination event has occurred could result in a loss of our entitlement to all future payments under the swap agreement and result in a loss to us of the full value at which we are carrying the swap agreement.
Additionally, a determination that AIG triggered a "bankruptcy" event of default under the swap agreement could also, depending on the Court's precise holding, affect other AIG or AIGFP agreements that contain the same or similar default provisions. Such a determination could also affect derivative agreements or other contracts between third parties, such as credit default swaps under which AIG is a reference credit, which could affect the trading price of AIG securities. During the third quarter of 2011, beneficiaries of certain previously repaid AIGFP guaranteed investment agreements brought an action against AIG Parent and AIGFP making "bankruptcy" event of default allegations similar to those made by Brookfield. The Court subsequently issued a decision dismissing that action, which decision was affirmed on appeal by the Delaware Supreme Court on April 29, 2013.
Employment Litigation against AIG and AIG Global Real Estate Investment Corporation
On December 9, 2009, AIG Global Real Estate Investment Corporation's (AIGGRE) former President, Kevin P. Fitzpatrick, several entities he controls, and various other single purpose entities (the SPEs) filed a complaint in the Supreme Court of the State of New York, New York County against AIG and AIGGRE (the Defendants). The case was removed to the Southern District of New York, and an amended complaint was filed on March 8, 2010. The amended complaint asserts that the Defendants violated fiduciary duties to Fitzpatrick and his controlled entities and breached Fitzpatrick's employment agreement and agreements of SPEs that purportedly entitled him to carried interest arising out of the sale or disposition of certain real estate. Fitzpatrick has also brought derivative claims on behalf of the SPEs, purporting to allege that the Defendants breached contractual and fiduciary duties in failing to
47
ITEM 1. / NOTE 10. CONTINGENCIES, COMMITMENTS AND GUARANTEES
NOTES TO CONDENSED CONSOLIDATED FINANCIAL STATEMENTS (unaudited)
fund the SPEs with various amounts allegedly due under the SPE agreements. Fitzpatrick has also requested injunctive relief, an accounting, and that a receiver be appointed to manage the affairs of the SPEs. He has further alleged that the SPEs are subject to a constructive trust. Fitzpatrick also has alleged a violation of ERISA relating to retirement benefits purportedly due. Fitzpatrick has claimed that he is currently owed damages totaling approximately $196 million, and that potential future amounts owed to him are approximately $78 million, for a total of approximately $274 million. Fitzpatrick further claims unspecified amounts of carried interest on certain additional real estate assets of AIG and its affiliates. He also seeks punitive damages for the alleged breaches of fiduciary duties. Defendants assert that Fitzpatrick has been paid all amounts currently due and owing pursuant to the various agreements through which he seeks recovery. On February 26, 2013, the Court granted in part and denied in part the parties' cross-motions for partial summary judgment, reserving most issues for trial but finding that summary judgment was appropriate as to one group of properties and that those properties were potentially eligible for carried interest (subject to the resolution of other issues at trial). Defendants are seeking reconsideration of the Court's ruling on that matter and others. The Court also ruled that Fitzpatrick may amend his complaint to plead a claim for past due carried interest payments arising out of SPEs created for the purpose of allowing Fitzpatrick and others to invest their own capital in real estate ventures alongside AIG, its affiliates or co-venturers. On March 26, 2013, Fitzpatrick filed a motion for leave to amend his complaint to assert those claims, to add certain additional SPEs as derivative plaintiffs, to clarify and conform to his employment agreement allegations in support of an existing claim for declaratory judgment related to the vesting of carried interest and to assert a claim for declaratory judgment and specific performance, and the court granted that motion on April 25, 2013. As of May 2, 2013, no trial date has been set. As set forth above, the possible range of our loss is $0 to $274 million, although Fitzpatrick claims that he is also entitled to additional unspecified amounts of carried interest and punitive damages.
False Claims Act Complaint
On February 25, 2010, a complaint was filed in the United States District Court for the Southern District of California by two individuals (Relators) seeking to assert claims on behalf of the United States against AIG and certain other defendants, including Goldman Sachs and Deutsche Bank, under the False Claims Act. Relators filed a First Amended Complaint on September 30, 2010, adding certain additional defendants, including Bank of America and Société Générale. The amended complaint alleges that defendants engaged in fraudulent business practices in respect of their activities in the over-the-counter market for collateralized debt obligations, and submitted false claims to the United States in connection with the FRBNY Credit Facility and Maiden Lane II LLC (ML II) and ML III entities (the Maiden Lane Interests) through, among other things, misrepresenting AIG's ability and intent to repay amounts drawn on the FRBNY Credit Facility, and misrepresenting the value of the securities that the Maiden Lane Interests acquired from AIG and certain of its counterparties. The complaint seeks unspecified damages pursuant to the False Claims Act in the amount of three times the damages allegedly sustained by the United States as well as interest, attorneys' fees, costs and expenses. The complaint and amended complaints were initially filed and maintained under seal while the United States considered whether to intervene in the action. On or about April 28, 2011, after the United States declined to intervene, the District Court lifted the seal, and Relators served the amended complaint on us on July 11, 2011. On April 19, 2013, the Court granted AIG's motion to dismiss, dismissing the first amended complaint in its entirety, without prejudice, giving the Relators the opportunity to file an amended complaint. As of May 1, 2013, the Relators have not filed an amended complaint, nor have they specified an amount of alleged damages. As a result, we are unable to reasonably estimate the possible loss or range of losses, if any, arising from the litigation.
2006 Regulatory Settlements and Related Regulatory Matters
2006 Regulatory Settlements. In February 2006, AIG reached a resolution of claims and matters under investigation with the United States Department of Justice (DOJ), the Securities and Exchange Commission (SEC), the Office of the New York Attorney General (NYAG) and the New York State Department of Insurance (DOI). The settlements resolved investigations conducted by the SEC, NYAG and DOI in connection with the accounting, financial reporting and insurance brokerage practices of AIG and its subsidiaries, as well as claims relating to the underpayment of certain workers' compensation premium taxes and other assessments. These settlements did not, however, resolve investigations by regulators from other states into insurance brokerage practices related to
48
ITEM 1. / NOTE 10. CONTINGENCIES, COMMITMENTS AND GUARANTEES
NOTES TO CONDENSED CONSOLIDATED FINANCIAL STATEMENTS (unaudited)
contingent commissions and other broker-related conduct, such as alleged bid rigging. Nor did the settlements resolve any obligations that AIG may have to state guarantee funds in connection with any of these matters.
As a result of these settlements, AIG made payments or placed amounts in escrow in 2006 totaling approximately $1.64 billion, $225 million of which represented fines and penalties.
In addition to the escrowed funds, $800 million was deposited into, and subsequently disbursed by, a fund under the supervision of the SEC, to resolve claims asserted against AIG by investors, including the securities class action and shareholder lawsuits described below.
A portion of the total $1.64 billion originally placed in escrow was designated to satisfy certain regulatory and litigation liabilities related to workers' compensation premium reporting issues. The original workers' compensation escrow amount was approximately $338 million and was placed in an account established as part of the 2006 New York regulatory settlement and referred to as the Workers' Compensation Fund. Additional money was placed into escrow accounts as a result of subsequent litigation and regulatory settlements bringing the total workers' compensation escrow amount to approximately $597 million. Approximately $147 million was released from the workers' compensation escrow accounts in satisfaction of fines, penalties and premium tax obligations, which were imposed pursuant to a December 17, 2010 regulatory settlement agreement relating to workers' compensation premium reporting issues that was deemed final and effective on May 29, 2012. Following this disbursement, approximately $450 million remains in escrow and is specifically designated to satisfy class action liabilities related to workers' compensation premium reporting issues. This amount is included in Other assets at March 31, 2013.
Litigation Related to the Matters Underlying the 2006 Regulatory Settlements
AIG and certain present and former directors and officers of AIG have been named in various actions related to the matters underlying the 2006 Regulatory Settlements. These actions are described below.
The Consolidated 2004 Securities Litigation. Beginning in October 2004, a number of putative securities fraud class action suits were filed in the Southern District of New York against AIG and consolidated as In re American International Group, Inc. Securities Litigation (the Consolidated 2004 Securities Litigation). Subsequently, a separate, though similar, securities fraud action was also brought against AIG by certain Florida pension funds. The lead plaintiff in the Consolidated 2004 Securities Litigation is a group of public retirement systems and pension funds benefiting Ohio state employees, suing on behalf of themselves and all purchasers of AIG's publicly traded securities between October 28, 1999 and April 1, 2005. The named defendants are AIG and a number of present and former AIG officers and directors, as well as C.V. Starr & Co., Inc. (Starr), SICO, General Reinsurance Corporation, and PricewaterhouseCoopers, LLP, among others. The lead plaintiff alleges, among other things, that AIG: (i) concealed that it engaged in anti-competitive conduct through alleged payment of contingent commissions to brokers and participation in illegal bid-rigging; (ii) concealed that it used "income smoothing" products and other techniques to inflate its earnings; (iii) concealed that it marketed and sold "income smoothing" insurance products to other companies; and (iv) misled investors about the scope of government investigations. In addition, the lead plaintiff alleges that Maurice R. Greenberg, AIG's former Chief Executive Officer, manipulated our stock price. The lead plaintiff asserts claims for violations of Sections 11 and 15 of the Securities Act, Section 10(b) of the Exchange Act and Rule 10b-5 promulgated thereunder, and Sections 20(a) and 20A of the Exchange Act.
On July 14, 2010, AIG approved the terms of a settlement (the Settlement) with lead plaintiffs. The Settlement is conditioned on, among other things, court approval and a minimum level of shareholder participation. Under the terms of the Settlement, if consummated, AIG would pay an aggregate of $725 million. Only two shareholders objected to the Settlement, and 25 shareholders claiming to hold less than 1.5 percent of AIG's outstanding shares at the end of the class period submitted timely and valid requests to opt out of the class. Of those 25 shareholders, seven are investment funds controlled by the same investment group, and that investment group is the only opt-out who held more than 1,000 shares at the end of the class period. By order dated February 2, 2012, the District Court granted lead plaintiffs' motion for final approval of the Settlement. AIG has fully funded the amount of the Settlement into an escrow account.
On January 23, 2012, AIG and the Florida pension funds, who had brought a separate securities fraud action, executed a settlement agreement under which AIG paid $4 million.
49
ITEM 1. / NOTE 10. CONTINGENCIES, COMMITMENTS AND GUARANTEES
NOTES TO CONDENSED CONSOLIDATED FINANCIAL STATEMENTS (unaudited)
On February 17, 2012 and March 6, 2012, two objectors appealed the final approval of the Settlement. On September 27, 2012, the two objectors withdrew their appeals with prejudice.
The Multi-District Litigation. Commencing in 2004, policyholders brought multiple federal antitrust and Racketeer Influenced and Corrupt Organizations Act (RICO) class actions in jurisdictions across the nation against insurers and brokers, including AIG and a number of its subsidiaries, alleging that the insurers and brokers engaged in one or more broad conspiracies to allocate customers, steer business, and rig bids. These actions, including 24 complaints filed in different federal courts naming AIG or an AIG subsidiary as a defendant, were consolidated by the judicial panel on multi-district litigation and transferred to the United States District Court for the District of New Jersey (District of New Jersey) for coordinated pretrial proceedings. The consolidated actions have proceeded in that Court in two parallel actions, In re Insurance Brokerage Antitrust Litigation (the Commercial Complaint) and In re Employee Benefits Insurance Brokerage Antitrust Litigation (the Employee Benefits Complaint, and, together with the Commercial Complaint, the Multi-District Litigation).
The plaintiffs in the Commercial Complaint are a group of corporations, individuals and public entities that contracted with the broker defendants for the provision of insurance brokerage services for a variety of insurance needs. The broker defendants are alleged to have placed insurance coverage on the plaintiffs' behalf with a number of insurance companies named as defendants, including AIG subsidiaries. The Commercial Complaint also named various brokers and other insurers as defendants (three of which have since settled). The Commercial Complaint alleges that defendants engaged in a number of overlapping "broker-centered" conspiracies to allocate customers through the payment of contingent commissions to brokers and through purported "bid-rigging" practices. It also alleges that the insurer and broker defendants participated in a "global" conspiracy not to disclose to policyholders the payment of contingent commissions. Plaintiffs assert that the defendants violated the Sherman Antitrust Act, RICO, and the antitrust laws of 48 states and the District of Columbia, and are liable under common law breach of fiduciary duty and unjust enrichment theories. Plaintiffs seek treble damages plus interest and attorneys' fees as a result of the alleged RICO and Sherman Antitrust Act violations.
The plaintiffs in the Employee Benefits Complaint are a group of individual employees and corporate and municipal employers alleging claims on behalf of two separate nationwide purported classes: an employee class and an employer class that acquired insurance products from the defendants from January 1, 1998 to December 31, 2004. The Employee Benefits Complaint names AIG as well as various other brokers and insurers, as defendants. The activities alleged in the Employee Benefits Complaint, with certain exceptions, track the allegations of customer allocation through steering and bid-rigging made in the Commercial Complaint.
On August 16, 2010, the United States Court of Appeals for the Third Circuit (the Third Circuit) affirmed the dismissal of the Employee Benefits Complaint in its entirety, affirmed in part and vacated in part the District Court's dismissal of the Commercial Complaint, and remanded the case for further proceedings consistent with the opinion. On March 30, 2012, the District Court granted final approval of a settlement between AIG and certain other defendants on the one hand, and class plaintiffs on the other, which settled the claims asserted against those defendants in the Commercial Complaint. Pursuant to the settlement, AIG will pay approximately $7 million of a total aggregate settlement amount of approximately $37 million. On April 27, 2012, notices of appeal of the District Court order granting final approval were filed in the Third Circuit. As of December 5, 2012, the Third Circuit had dismissed all appeals from the District Court order granting final approval of the settlement. On February 15, 2013, the District Court issued an order authorizing distribution of the settlement fund to the class members.
A number of complaints making allegations similar to those in the Multi-District Litigation have been filed against AIG and other defendants in state and federal courts around the country. The defendants have thus far been successful in having the federal actions transferred to the District of New Jersey and consolidated into the Multi-District Litigation. Two consolidated actions naming AIG defendants are still pending in the District of New Jersey. In the consolidated action The Heritage Corp. of South Florida v. National Union Fire Ins. Co. (Heritage) , an individual plaintiff alleges damages "in excess of $75,000." Because the plaintiff has not actively pursued its claim since the settlement of the class action described in the preceding paragraph, AIG is unable to reasonably estimate the possible loss or range of losses, if any, arising from the Heritage litigation. The parties in Avery Dennison Corp. v. Marsh & McLennan Companies, Inc. (Avery) , the other remaining consolidated action, entered into a settlement agreement on April 4, 2013.
50
ITEM 1. / NOTE 10. CONTINGENCIES, COMMITMENTS AND GUARANTEES
NOTES TO CONDENSED CONSOLIDATED FINANCIAL STATEMENTS (unaudited)
Finally, the AIG defendants have settled the four state court actions filed in Florida, New Jersey, Texas, and Kansas state courts, where plaintiffs had made similar allegations as those asserted in the Multi-District Litigation.
Workers' Compensation Premium Reporting. On May 24, 2007, the National Council on Compensation Insurance (NCCI), on behalf of the participating members of the National Workers' Compensation Reinsurance Pool (the NWCRP), filed a lawsuit in the United States District Court for the Northern District of Illinois (the Northern District of Illinois) against us with respect to the underpayment by AIG of its residual market assessments for workers' compensation insurance. The complaint alleged claims for violations of RICO, breach of contract, fraud and related state law claims arising out of our alleged underpayment of these assessments between 1970 and the present and sought damages purportedly in excess of $1 billion.
On April 1, 2009, Safeco Insurance Company of America (Safeco) and Ohio Casualty Insurance Company (Ohio Casualty) filed a complaint in the Northern District of Illinois, on behalf of a purported class of all NWCRP participant members, against AIG and certain of its subsidiaries with respect to the underpayment by AIG of its residual market assessments for workers' compensation insurance. The complaint was styled as an "alternative complaint," should the Northern District of Illinois grant our motion to dismiss the NCCI lawsuit for lack of subject-matter jurisdiction, which motion to dismiss was ultimately granted on August 23, 2009. The allegations in the class action complaint are substantially similar to those filed by the NWCRP.
On February 28, 2012, the Northern District of Illinois entered a final order and judgment approving a class action settlement between us and a group of intervening plaintiffs, made up of seven participating members of the NWCRP, which would require AIG to pay $450 million to satisfy all liabilities to the class members arising out of the workers' compensation premium reporting issues, a portion of which would be funded out of the remaining amount held in the Workers' Compensation Fund. Liberty Mutual filed papers in opposition to approval of the proposed settlement and in opposition to certification of a settlement class, in which it alleged our actual exposure, should the class action continue through judgment, to be in excess of $3 billion. We dispute this allegation. Liberty Mutual and its subsidiaries Safeco and Ohio Casualty subsequently appealed the Northern District of Illinois' final order and judgment to the United States Court of Appeals for the Seventh Circuit (the Seventh Circuit). On January 10, 2013, AIG and Liberty Mutual entered into a settlement under which Liberty Mutual, Safeco and Ohio Casualty agreed voluntarily to withdraw their appeals, and AIG, the Liberty Mutual parties and the settlement class plaintiffs submitted an agreed stipulation of dismissal to the Seventh Circuit. On March 25, 2013, the Seventh Circuit dismissed the appeal.
The $450 million settlement amount, which is currently held in escrow pending administration of the class-action settlement, was funded in part from the approximately $191 million remaining in the Workers' Compensation Fund. As of March 31, 2013, we had an accrued liability equal to the amounts payable under the settlement.
Litigation Matters Relating to AIG's Insurance Operations
Caremark. AIG and certain of its subsidiaries have been named defendants in two putative class actions in state court in Alabama that arise out of the 1999 settlement of class and derivative litigation involving Caremark Rx, Inc. (Caremark). The plaintiffs in the second-filed action intervened in the first-filed action, and the second-filed action was dismissed. An excess policy issued by a subsidiary of AIG with respect to the 1999 litigation was expressly stated to be without limit of liability. In the current actions, plaintiffs allege that the judge approving the 1999 settlement was misled as to the extent of available insurance coverage and would not have approved the settlement had he known of the existence and/or unlimited nature of the excess policy. They further allege that AIG, its subsidiaries, and Caremark are liable for fraud and suppression for misrepresenting and/or concealing the nature and extent of coverage.
The complaints filed by the plaintiffs and the intervenors request compensatory damages for the 1999 class in the amount of $3.2 billion, plus punitive damages. AIG and its subsidiaries deny the allegations of fraud and suppression, assert that information concerning the excess policy was publicly disclosed months prior to the approval of the settlement, that the claims are barred by the statute of limitations, and that the statute cannot be tolled in light of the public disclosure of the excess coverage. The plaintiffs and intervenors, in turn, have asserted that the disclosure was insufficient to inform them of the nature of the coverage and did not start the running of the statute of limitations.
51
ITEM 1. / NOTE 10. CONTINGENCIES, COMMITMENTS AND GUARANTEES
NOTES TO CONDENSED CONSOLIDATED FINANCIAL STATEMENTS (unaudited)
On August 15, 2012, the trial court entered an order granting plaintiffs' motion for class certification. AIG and the other defendants have appealed that order to the Alabama Supreme Court, and the case in the trial court will be stayed until that appeal is resolved. General discovery has not commenced and AIG is unable to reasonably estimate the possible loss or range of losses, if any, arising from the litigation.
Regulatory and Related Matters
Our life insurance companies have received and responded to industry-wide regulatory inquiries, including a multi-state audit and market conduct examination covering compliance with unclaimed property laws and a directive from the New York Insurance Department regarding claims settlement practices and other related state regulatory inquiries. The inquiries concern the use of the Social Security Death Master File (SSDMF) to identify potential claims not yet presented to us in the normal course of business. In connection with the resolution of the multi-state examination relating to these matters in the third quarter of 2012, we paid an $11 million regulatory assessment to the various state insurance departments that are parties to the regulatory settlement to defray costs of their examinations and monitoring. Although we have enhanced our claims practices to include use of the SSDMF, it is possible that the settlement remediation requirements, remaining inquiries, other regulatory activity or litigation could result in the payment of additional amounts. AIG has also received a demand letter from a purported AIG shareholder requesting that the Board of Directors investigate these matters, and bring appropriate legal proceedings against any person identified by the investigation as engaging in misconduct. AIG believes it has adequately reserved for such claims, but there can be no assurance that the ultimate cost will not vary, perhaps materially, from its estimate.
In connection with the previously disclosed multi-state examination of certain accident and health products, including travel products, issued by National Union Fire Insurance Company of Pittsburgh, Pa. (National Union), Chartis Inc., on behalf of itself, National Union, and certain of Chartis Inc.'s insurance and non-insurance companies (collectively, the Chartis parties) entered into a Regulatory Settlement Agreement with regulators from 50 U.S. jurisdictions effective November 29, 2012. Under the agreement, and without admitting any liability for the issues raised in the examination, the Chartis parties (i) paid a civil penalty of $50 million, (ii) entered into a corrective action plan describing agreed-upon specific steps and standards for evaluating the Chartis parties' ongoing compliance with laws and regulations governing the issues identified in the examination, and (iii) agreed to pay a contingent fine in the event that the Chartis parties fail to satisfy certain terms of the corrective action plan. National Union and other AIG companies are also currently subject to civil litigation relating to the conduct of their accident and health business, and may be subject to additional litigation relating to the conduct of such business from time to time in the ordinary course. There can be no assurance that any regulatory action resulting from the issues identified will not have a material adverse effect on our ongoing operations of the business subject to the agreement, or on similar business written by other AIG carriers.
Industry-wide examinations conducted by the Minnesota Department of Insurance and the Department of Housing and Urban Development (HUD) on captive reinsurance practices by lenders and mortgage insurance companies, including UGC, have been ongoing for several years. In 2011, the Consumer Financial Protection Bureau (CFPB) assumed responsibility for violations of the Real Estate Settlement Procedures Act from HUD, and assumed HUD's aforementioned ongoing investigation. In June 2012, the CFPB issued a Civil Investigative Demand (CID) to UGC and other mortgage insurance companies, requesting the production of documents and answers to written questions. The CFPB agreed to toll the deadlines associated with the CID pending discussions that could resolve the investigation. UGC and the CFPB reached a settlement, entered on April 8, 2013 by the United States District Court for the Southern District of Florida, where UGC consented to discontinue its remaining captive reinsurance practices and to pay a civil monetary penalty of $4.5 million to the CFPB. The settlement includes a release for all liability related to UGC's captive reinsurance practices and resolves the CFPB's investigation. UGC has received a proposed consent order from the Minnesota Commissioner of Commerce (the MN Commissioner) which alleges that UGC violated the Real Estate Settlement Procedures Act, the Fair Credit Reporting Act and other state and federal laws in connection with its practices with captive reinsurance companies owned by lenders. UGC engaged in discussions with the MN Commissioner with respect to the terms of the proposed consent order. UGC cannot predict if or when a consent order may be entered into or, if entered into, what the terms of the final consent order will be. UGC is also currently subject to civil litigation relating to its placement of reinsurance with captives owned by lenders, and may be subject to additional litigation relating to the conduct of such business from time to time in the ordinary course.
52
ITEM 1. / NOTE 10. CONTINGENCIES, COMMITMENTS AND GUARANTEES
NOTES TO CONDENSED CONSOLIDATED FINANCIAL STATEMENTS (unaudited)
Other Contingencies
Liability for unpaid claims and claims adjustment expense
Although we regularly review the adequacy of the established Liability for unpaid claims and claims adjustment expense, there can be no assurance that our loss reserves will not develop adversely and have a material adverse effect on our results of operations. Estimation of ultimate net losses, loss expenses and loss reserves is a complex process, particularly for long-tail casualty lines of business, which include, but are not limited to, general liability, commercial automobile liability, environmental, workers' compensation, excess casualty and crisis management coverages, insurance and risk management programs for large corporate customers and other customized structured insurance products, as well as excess and umbrella liability, directors and officers and products liability. Generally, actual historical loss development factors are used to project future loss development. However, there can be no assurance that future loss development patterns will be the same as in the past. Moreover, any deviation in loss cost trends or in loss development factors might not be identified for an extended period of time subsequent to the recording of the initial loss reserve estimates for any accident year. There is the potential for reserves with respect to a number of years to be significantly affected by changes in loss cost trends or loss development factors that were relied upon in setting the reserves. These changes in loss cost trends or loss development factors could be attributable to changes in economic conditions in the United States and abroad, changes in the legal, regulatory, judicial and social environment, changes in medical cost trends (inflation, intensity and utilization of medical services), underlying policy pricing, terms and conditions, and claims handling practices.
Commitments
Flight Equipment Related to Business Held for Sale
At March 31, 2013, ILFC had committed to purchase 243 new aircraft with aggregate estimated total remaining payments of approximately $17.7 billion, including 18 aircraft through sale-leaseback transactions with airlines deliverable from 2013 through 2019. ILFC had also committed to purchase four used aircraft and nine new spare engines. ILFC also has the right to purchase an additional 50 Airbus A320neo family narrowbody aircraft. ILFC will be required to find lessees for any aircraft acquired and to arrange financing for a substantial portion of the purchase price. These commitments are related to discontinued operations and will not be retained by AIG upon closing of the sale. See Note 4 for a discussion of the ILFC Transaction.
Other Commitments
In the normal course of business, we enter into commitments to invest in limited partnerships, private equity funds, hedge funds and mutual funds and to purchase and develop real estate in the U.S. and abroad. These commitments totaled $2.2 billion at March 31, 2013.
Guarantees
Subsidiaries
We have issued unconditional guarantees with respect to the prompt payment, when due, of all present and future payment obligations and liabilities of AIG Financial Products Corp. and AIG Trading Group Inc. and their respective subsidiaries (collectively, AIGFP) and AIG Markets, Inc. (AIG Markets) arising from transactions entered into by AIGFP and AIG Markets.
In connection with AIGFP's business activities, AIGFP has issued, in a limited number of transactions, standby letters of credit or similar facilities to equity investors in an amount equal to the termination value owing to the equity investor by the lessee in the event of a lessee default (the equity termination value). The total amount outstanding at March 31, 2013 was $306 million. In those transactions, AIGFP has agreed to pay such amount if the lessee fails to pay. The amount payable by AIGFP is, in certain cases, partially offset by amounts payable under other instruments typically equal to the present value of scheduled payments to be made by AIGFP. In the event that AIGFP is required to make a payment to the equity investor, the lessee is unconditionally obligated to reimburse AIGFP. To the extent that the equity investor is paid the equity termination value from the standby letter of credit and/or other
53
NOTES TO CONDENSED CONSOLIDATED FINANCIAL STATEMENTS (unaudited)
sources, including payments by the lessee, AIGFP takes an assignment of the equity investor's rights under the lease of the underlying property. Because the obligations of the lessee under the lease transactions are generally economically defeased, lessee bankruptcy is the most likely circumstance in which AIGFP would be required to pay.
Asset Dispositions
General
We are subject to financial guarantees and indemnity arrangements in connection with the completed sales of businesses pursuant to our asset disposition plan. The various arrangements may be triggered by, among other things, declines in asset values, the occurrence of specified business contingencies, the realization of contingent liabilities, developments in litigation or breaches of representations, warranties or covenants provided by us. These arrangements are typically subject to various time limitations, defined by the contract or by operation of law, such as statutes of limitation. In some cases, the maximum potential obligation is subject to contractual limitations, while in other cases such limitations are not specified or are not applicable.
We are unable to develop a reasonable estimate of the maximum potential payout under certain of these arrangements. Overall, we believe that it is unlikely we will have to make any material payments related to completed sales under these arrangements, and no material liabilities related to these arrangements have been recorded in the Condensed Consolidated Balance Sheet.
ALICO Sale
Pursuant to the terms of the ALICO stock purchase agreement, we have agreed to provide MetLife with certain indemnities. The most significant remaining indemnities include:
- •
-
Indemnifications related to specific product, investment, litigation and other matters that are excluded from the general
representations and warranties indemnity. These indemnifications provide for various deductible amounts, which in certain cases are zero, and maximum exposures, which in certain cases are unlimited,
and may extend for various periods after the completion of the sale.
- •
- Tax indemnifications related to insurance reserves that extend for taxable periods ending on or before December 31, 2013 and that are limited to an aggregate of $200 million, and certain other tax-related representations and warranties that extend to the expiration of the statute of limitations and are subject to an aggregate deductible of $50 million.
In connection with the indemnity obligations described above, as of March 31, 2013, approximately $567 million of proceeds from the sale of ALICO were on deposit in an escrow arrangement. On May 1, 2013, approximately $547 million was released to us from this escrow.
Other
- •
-
See Note 7 for commitments and guarantees associated with VIEs.
- •
-
See Note 8 for disclosures about derivatives.
- •
- See Note 16 for additional disclosures about guarantees of outstanding debt.
54
ITEM 1. / NOTE 11. TOTAL EQUITY
NOTES TO CONDENSED CONSOLIDATED FINANCIAL STATEMENTS (unaudited)
11. TOTAL EQUITY
Shares Outstanding
The following table presents a rollforward of outstanding shares:
|
|
Common
Stock Issued |
Treasury
Stock |
Outstanding
Shares |
|||||||
|---|---|---|---|---|---|---|---|---|---|---|
|
Three Months Ended March 31, 2013 |
||||||||||
|
Shares, beginning of year |
1,906,611,680 | (430,289,745 | ) | 1,476,321,935 | ||||||
|
Issuances |
616 | 22,612 | 23,228 | |||||||
|
Shares, end of period |
1,906,612,296 | (430,267,133 | ) | 1,476,345,163 | ||||||
Dividends
Payment of future dividends to our shareholders depends in part on the regulatory framework that will ultimately be applicable to us, including our status as a savings and loan holding company under the Dodd-Frank Wall Street Reform and Consumer Protection Act (Dodd-Frank) and whether we are determined to be a non-bank systemically important financial institution (SIFI). In addition, dividends will be payable on AIG Common Stock only when, as and if declared by our Board of Directors in its discretion, from funds legally available therefor. In considering whether to pay a dividend or purchase shares of AIG Common Stock, our Board of Directors will take into account such matters as the performance of our businesses, our consolidated financial condition, results of operations and liquidity, available capital, the existence of investment opportunities, contractual, legal and regulatory restrictions on the payment of dividends by our subsidiaries, rating agency considerations, including the potential effect on our debt ratings, and such other factors as our Board may deem relevant. We did not pay any cash dividends in the first quarter of 2013.
See Note 20 to the Consolidated Financial Statements in the 2012 Annual Report for a discussion of restrictions on payments of dividends to AIG Parent by its subsidiaries.
55
ITEM 1. / NOTE 11. TOTAL EQUITY
NOTES TO CONDENSED CONSOLIDATED FINANCIAL STATEMENTS (unaudited)
Accumulated Other Comprehensive Income
The following table presents a rollforward of Accumulated other comprehensive income:
|
(in millions)
|
Unrealized Appreciation
(Depreciation) of Fixed Maturity Investments on Which Other-Than- Temporary Credit Impairments Were Recognized |
Unrealized
Appreciation (Depreciation) of All Other Investments |
Foreign
Currency Translation Adjustments |
Net Derivative
Gains (Losses) Arising from Cash Flow Hedging Activities |
Change in
Retirement Plan Liabilities Adjustment |
Total
|
|||||||||||||
|---|---|---|---|---|---|---|---|---|---|---|---|---|---|---|---|---|---|---|---|
|
Balance, December 31, 2012, net of tax |
$ | 575 | $ | 13,446 | $ | (403 | ) | $ | – | $ | (1,044 | ) | $ | 12,574 | |||||
|
Change in unrealized
|
414 | (1,607 | ) | – | – | – | (1,193 | ) | |||||||||||
|
Change in deferred acquisition
|
(2 | ) | (309 | ) | – | – | – | (311 | ) | ||||||||||
|
Change in future policy
|
13 | 411 | – | – | – | 424 | |||||||||||||
|
Change in foreign currency
|
– | – | (293 | ) | – | – | (293 | ) | |||||||||||
|
Net actuarial gain |
– | – | – | – | 57 | 57 | |||||||||||||
|
Prior service credit |
– | – | – | – | (14 | ) | (14 | ) | |||||||||||
|
Change in deferred tax asset
|
(143 | ) | 717 | 20 | – | 1 | 595 | ||||||||||||
|
Total other comprehensive
|
282 | (788 | ) | (273 | ) | – | 44 | (735 | ) | ||||||||||
|
Noncontrolling interests |
– | (1 | ) | 1 | – | – | – | ||||||||||||
|
Balance, March 31, 2013, net
|
$ | 857 | $ | 12,659 | $ | (677 | ) | $ | – | $ | (1,000 | ) | $ | 11,839 | |||||
56
ITEM 1. / NOTE 11. TOTAL EQUITY
NOTES TO CONDENSED CONSOLIDATED FINANCIAL STATEMENTS (unaudited)
The following table presents the other comprehensive income reclassification adjustments for the three-month periods ended March 31, 2013 and 2012:
|
(in millions)
|
Unrealized Appreciation
(Depreciation) of Fixed Maturity Investments on Which Other-Than- Temporary Credit Impairments Were Recognized |
Unrealized
Appreciation (Depreciation) of All Other Investments |
Foreign
Currency Translation Adjustments |
Net Derivative
Gains (Losses) Arising from Cash Flow Hedging Activities |
Change in
Retirement Plan Liabilities Adjustment |
Total
|
|||||||||||||
|---|---|---|---|---|---|---|---|---|---|---|---|---|---|---|---|---|---|---|---|
|
Three Months Ended March 31,
|
|||||||||||||||||||
|
Unrealized change arising during
|
$ | 474 | $ | (1,278 | ) | $ | (293 | ) | $ | – | $ | 18 | $ | (1,079 | ) | ||||
|
Less: Reclassification
|
49 | 227 | – | – | (25 | ) | 251 | ||||||||||||
|
Total other comprehensive
|
425 | (1,505 | ) | (293 | ) | – | 43 | (1,330 | ) | ||||||||||
|
Less: Income tax expense
|
143 | (717 | ) | (20 | ) | – | (1 | ) | (595 | ) | |||||||||
|
Total other comprehensive
|
$ | 282 | $ | (788 | ) | $ | (273 | ) | $ | – | $ | 44 | $ | (735 | ) | ||||
|
Three Months Ended March 31,
|
|||||||||||||||||||
|
Unrealized change arising during
|
$ | 1,001 | $ | 2,323 | $ | 87 | $ | (1 | ) | $ | – | $ | 3,410 | ||||||
|
Less: Reclassification
|
(2 | ) | 960 | – | (5 | ) | (29 | ) | 924 | ||||||||||
|
Total other comprehensive
|
1,003 | 1,363 | 87 | 4 | 29 | 2,486 | |||||||||||||
|
Less: Income tax expense
|
390 | 382 | (4 | ) | (18 | ) | 11 | 761 | |||||||||||
|
Total other comprehensive
|
$ | 613 | $ | 981 | $ | 91 | $ | 22 | $ | 18 | $ | 1,725 | |||||||
57
NOTES TO CONDENSED CONSOLIDATED FINANCIAL STATEMENTS (unaudited)
The following table presents the effect of the reclassification of significant items out of Accumulated other comprehensive income on the respective line items in the Condensed Consolidated Statement of Income:
|
Three Months Ended March 31, 2013
(in millions) |
Amount
Reclassified from Accumulated Other Comprehensive Income |
Affected Line Item in the Condensed
Consolidated Statement of Income |
||||
|---|---|---|---|---|---|---|
|
Unrealized appreciation (depreciation) of fixed
|
||||||
|
Investments |
$ | 49 | Other realized capital gains | |||
|
Unrealized appreciation (depreciation) of all other
|
||||||
|
Investments |
286 | Other realized capital gains | ||||
|
Deferred acquisition costs adjustment |
43 | Amortization of deferred acquisition costs | ||||
|
Future policy benefits |
(102 | ) | Policyholder benefits and claims incurred | |||
|
Total |
227 | |||||
|
Change in retirement plan liabilities adjustment |
||||||
|
Prior-service costs |
12 | * | ||||
|
Actuarial gains/(losses) |
(37 | ) | * | |||
|
Total |
(25 | ) | ||||
|
Total reclassifications for the period |
$ | 251 | ||||
* These Accumulated other comprehensive income components are included in the computation of net periodic pension cost. See Note 14.
58
NOTES TO CONDENSED CONSOLIDATED FINANCIAL STATEMENTS (unaudited)
12. NONCONTROLLING INTERESTS
The following table presents a rollforward of non-controlling interests:
|
|
Redeemable
Noncontrolling interests |
|
|||||||||||
|---|---|---|---|---|---|---|---|---|---|---|---|---|---|
|
(in millions)
|
Held by
Department of Treasury |
Other
|
Total
|
Non-redeemable
Noncontrolling interests |
|||||||||
|
Three Months Ended March 31, 2013 |
|||||||||||||
|
Balance, beginning of year |
$ | – | $ | 334 | $ | 334 | $ | 667 | |||||
|
Contributions from noncontrolling interests |
– | 22 | 22 | 8 | |||||||||
|
Distributions from noncontrolling interests |
– | (17 | ) | (17 | ) | (19 | ) | ||||||
|
Consolidation |
– | 32 | 32 | – | |||||||||
|
Comprehensive income: |
|||||||||||||
|
Net income |
– | 15 | 15 | 10 | |||||||||
|
Other comprehensive income (loss), net of tax: |
|||||||||||||
|
Unrealized losses on investments |
– | (1 | ) | (1 | ) | – | |||||||
|
Foreign currency translation adjustments |
– | 2 | 2 | (1 | ) | ||||||||
|
Total other comprehensive income (loss), net of tax |
– | 1 | 1 | (1 | ) | ||||||||
|
Total comprehensive income |
– | 16 | 16 | 9 | |||||||||
|
Other |
– | 1 | 1 | (2 | ) | ||||||||
|
Balance, end of period |
$ | – | $ | 388 | $ | 388 | $ | 663 | |||||
|
Three Months Ended March 31, 2012 |
|||||||||||||
|
Balance, beginning of year |
$ | 8,427 | $ | 96 | $ | 8,523 | $ | 855 | |||||
|
Repayment to Department of the Treasury |
(8,635 | ) | – | (8,635 | ) | – | |||||||
|
Contributions from noncontrolling interests |
– | 18 | 18 | 42 | |||||||||
|
Distributions from noncontrolling interests |
– | – | – | (14 | ) | ||||||||
|
Consolidation (deconsolidation) |
– | (5 | ) | (5 | ) | – | |||||||
|
Comprehensive income: |
|||||||||||||
|
Net income |
208 | 10 | 218 | 23 | |||||||||
|
Other comprehensive income, net of tax: |
|||||||||||||
|
Unrealized gains on investments |
– | 2 | 2 | 2 | |||||||||
|
Foreign currency translation adjustments |
– | – | – | 1 | |||||||||
|
Total other comprehensive income, net of tax |
– | 2 | 2 | 3 | |||||||||
|
Total comprehensive income |
208 | 12 | 220 | 26 | |||||||||
|
Other |
– | – | – | (16 | ) | ||||||||
|
Balance, end of period |
$ | – | $ | 121 | $ | 121 | $ | 893 | |||||
59
NOTES TO CONDENSED CONSOLIDATED FINANCIAL STATEMENTS (unaudited)
13. EARNINGS PER SHARE (EPS)
Basic and diluted earnings per share are based on the weighted average number of common shares outstanding, adjusted to reflect all stock dividends and stock splits. Diluted EPS is based on those shares used in basic EPS plus shares that would have been outstanding assuming issuance of common shares for all dilutive potential common shares outstanding, adjusted to reflect all stock dividends and stock splits.
The following table presents the computation of basic and diluted EPS:
|
|
|
|
|||||
|---|---|---|---|---|---|---|---|
|
Three Months Ended March 31,
(dollars in millions, except per share data) |
2013
|
2012
|
|||||
|
Numerator for EPS: |
|
|
|
||||
|
Income from continuing operations |
$
|
2,138
|
|
$ | 3,385 | ||
|
Less: Net income from continuing operations attributable to noncontrolling
|
|
|
|
||||
|
Nonvoting, callable, junior and senior preferred interests |
|
–
|
|
208 | |||
|
Other |
|
25
|
|
33 | |||
|
Total net income from continuing operations attributable to noncontrolling
|
|
25
|
|
241 | |||
|
Income attributable to AIG from continuing operations |
|
2,113
|
|
3,144 | |||
|
Income attributable to AIG from discontinued operations |
|
93
|
|
64 | |||
|
Net income attributable to AIG |
$
|
2,206
|
|
$ | 3,208 | ||
|
Denominator for EPS: |
|
|
|
||||
|
Weighted average shares outstanding — basic |
|
1,476,471,097
|
|
1,875,972,970 | |||
|
Dilutive shares |
|
207,834
|
|
29,805 | |||
|
Weighted average shares outstanding — diluted * |
|
1,476,678,931
|
|
1,876,002,775 | |||
|
Income per common share attributable to AIG: |
|
|
|
||||
|
Basic and diluted: |
|
|
|
||||
|
Income from continuing operations |
$
|
1.43
|
|
$ | 1.68 | ||
|
Income from discontinued operations |
$
|
0.06
|
|
$ | 0.03 | ||
|
Net Income attributable to AIG |
$
|
1.49
|
|
$ | 1.71 | ||
* Dilutive shares are calculated using the treasury stock method and include dilutive shares from share-based employee compensation plans, and a pro-rata portion of the warrants issued to the Department of the Treasury in 2008 and 2009, all of which were purchased by AIG in the first quarter of 2013. The number of shares excluded from diluted shares outstanding was 77 million and 78 million for the three month periods ended March 31, 2013, and 2012, respectively, because the effect of including those shares, warrants, and options in the calculation would have been anti-dilutive.
60
NOTES TO CONDENSED CONSOLIDATED FINANCIAL STATEMENTS (unaudited)
14. EMPLOYEE BENEFITS
The following table presents the components of net periodic benefit cost with respect to pensions and other postretirement benefits:
|
|
Pension | Postretirement | |||||||||||||||||
|---|---|---|---|---|---|---|---|---|---|---|---|---|---|---|---|---|---|---|---|
|
(in millions)
|
U.S. Plans
|
Non-U.S. Plans
|
Total
|
U.S. Plans
|
Non-U.S. Plans
|
Total
|
|||||||||||||
|
Three Months Ended March 31, 2013 |
|||||||||||||||||||
|
Components of net periodic benefit cost: |
|||||||||||||||||||
|
Service cost |
$ | 44 | $ | 13 | $ | 57 | $ | 1 | $ | 1 | $ | 2 | |||||||
|
Interest cost |
49 | 8 | 57 | 2 | – | 2 | |||||||||||||
|
Expected return on assets |
(65 | ) | (5 | ) | (70 | ) | – | – | – | ||||||||||
|
Amortization of prior service (credit) cost |
(8 | ) | (1 | ) | (9 | ) | (3 | ) | – | (3 | ) | ||||||||
|
Amortization of net (gain) loss |
33 | 3 | 36 | 1 | – | 1 | |||||||||||||
|
Curtailment (gain) loss |
– | (1 | ) | (1 | ) | – | – | – | |||||||||||
|
Other |
– | – | – | – | – | – | |||||||||||||
|
Net periodic benefit cost |
$ | 53 | $ | 17 | $ | 70 | $ | 1 | $ | 1 | $ | 2 | |||||||
|
Three Months Ended March 31, 2012 |
|||||||||||||||||||
|
Components of net periodic benefit cost: |
|||||||||||||||||||
|
Service cost |
$ | 37 | $ | 13 | $ | 50 | $ | 1 | $ | 1 | $ | 2 | |||||||
|
Interest cost |
50 | 8 | 58 | 3 | – | 3 | |||||||||||||
|
Expected return on assets |
(60 | ) | (5 | ) | (65 | ) | – | – | – | ||||||||||
|
Amortization of prior service (credit) cost |
(8 | ) | (1 | ) | (9 | ) | (3 | ) | – | (3 | ) | ||||||||
|
Amortization of net (gain) loss |
29 | 4 | 33 | – | – | – | |||||||||||||
|
Other |
– | – | – | – | – | – | |||||||||||||
|
Net periodic benefit cost |
$ | 48 | $ | 19 | $ | 67 | $ | 1 | $ | 1 | $ | 2 | |||||||
For the three-month period ended March 31, 2013, we contributed $37 million to our U.S. and non-U.S. pension plans and estimate that we will contribute an additional $63 million for the remainder of 2013. These estimates are subject to change because contribution decisions are affected by various factors, including our liquidity, market performance and management discretion.
15. INCOME TAXES
Interim Tax Calculation Method
We use the estimated annual effective tax rate method in computing our interim tax provision. Certain items, including those deemed to be unusual, infrequent or that cannot be reliably estimated, are excluded from the estimated annual effective tax rate. In these cases, the actual tax expense or benefit is reported in the same period as the related item. Certain tax effects are also not reflected in the estimated annual effective tax rate, primarily certain changes in the realizability of deferred tax assets and uncertain tax positions.
Interim Tax Expense (Benefit)
For the three month period ended March 31, 2013, the effective tax rate on pretax income from continuing operations was 24.5 percent. The effective tax rate for the three month period ended March 31, 2013, attributable to continuing operations differs from the statutory tax rate of 35 percent primarily due to tax effects associated with tax exempt interest income and a decrease in the life-insurance-business capital loss carryforward valuation allowance primarily attributable to the actual and projected gains on sales of AIG Life and Retirement's available-for-sale securities. These items were partially offset by changes in uncertain tax positions.
For the three month period ended March 31, 2012, the effective tax rate on pretax income from continuing operations was 24.2 percent. The effective tax rate for the three-month period ended March 31, 2012, attributable to continuing operations differs from the statutory tax rate of 35 percent primarily due to tax effects associated with tax exempt interest income and investments in partnerships, and a decrease in the life-insurance-business capital loss carryforward valuation allowance primarily attributable to the actual and projected gains on sales of AIG Life and Retirement's available-for-sale securities.
61
NOTES TO CONDENSED CONSOLIDATED FINANCIAL STATEMENTS (unaudited)
Assessment of Deferred Tax Asset Valuation Allowance
The evaluation of the recoverability of our deferred tax asset and the need for a valuation allowance requires us to weigh all positive and negative evidence to reach a conclusion that it is more likely than not that all or some portion of the deferred tax asset will not be realized. The weight given to the evidence is commensurate with the extent to which it can be objectively verified. The more negative evidence that exists, the more positive evidence is necessary and the more difficult it is to support a conclusion that a valuation allowance is not needed.
Our framework for assessing the recoverability of the deferred tax asset requires us to consider all available evidence, including:
- •
-
the nature, frequency, and amount of cumulative financial reporting income and losses in recent years;
- •
-
the sustainability of recent operating profitability of our subsidiaries;
- •
-
the predictability of future operating profitability of the character necessary to realize the net deferred tax asset;
- •
-
the carryforward period for the capital loss carryforwards, including the effect of reversing taxable temporary
differences; and
- •
- prudent and feasible actions and tax planning strategies that would be implemented, if necessary, to protect against the loss of the deferred tax asset.
As a result of sales in the ordinary course of business to manage the investment portfolio and the application of prudent and feasible tax planning strategies, during the three months ended March 31, 2013, we determined that an additional portion of the life insurance business capital loss carryforwards will more-likely-than-not be realized prior to their expiration.
We released an additional $836 million of the deferred tax asset valuation allowance associated with the life insurance business capital loss carryforwards during the three-month period ended March 31, 2013, of which $755 million was allocated to income from continuing operations and $81 million to other comprehensive income. Additional life insurance business capital loss carryforwards may be realized in the future if and when other prudent and feasible tax planning strategies are identified. Changes in market conditions, including rising interest rates above our projections, may result in a reduction in projected taxable gains and reestablishment of a valuation allowance.
Tax Examinations and Litigation
On March 29, 2013, the U.S. District Court for the Southern District of New York, denied our motion for partial summary judgment related to the disallowance of foreign tax credits associated with cross border financing transactions. On April 17, 2013, we initiated a request for certification of the court's decision for immediate appeal to the United States Court of Appeals for the Second Circuit. We will vigorously defend our position, and continue to believe that we have adequate reserves for any liability that could result from the IRS actions.
Accounting for Uncertainty in Income Taxes
At March 31, 2013 and December 31, 2012, our unrecognized tax benefits, excluding interest and penalties, were $4.9 billion and $4.4 billion, respectively. The increase in our unrecognized tax benefits, excluding interest and penalties, was primarily due to foreign tax credits associated with cross border financing transactions. At March 31, 2013 and December 31, 2012, our unrecognized tax benefits included $0.2 billion, related to tax positions that if recognized would not affect the effective tax rate because they relate to the timing, rather than the permissibility, of the deduction. Accordingly, at March 31, 2013 and December 31, 2012, the amounts of unrecognized tax benefits that, if recognized, would favorably affect the effective tax rate were $4.7 billion and $4.2 billion, respectively.
Interest and penalties related to unrecognized tax benefits are recognized in income tax expense. At March 31, 2013 and December 31, 2012, we accrued $1.1 billion and $935 million, respectively, for the payment of interest (net of the federal benefit) and penalties. For the three month periods ended March 31, 2013 and 2012, we recognized $156 million and $(37) million, respectively, of income tax expense (benefit) for interest net of the federal benefit (expense) and penalties.
Although it is reasonably possible that a change in the balance of unrecognized tax benefits may occur within the next 12 months, at this time it is not possible to estimate the range of the change due to the uncertainty of the potential outcomes.
62
ITEM 1. / NOTE 16. INFORMATION PROVIDED IN CONNECTION WITH OUTSTANDING DEBT
NOTES TO CONDENSED CONSOLIDATED FINANCIAL STATEMENTS (unaudited)
16. INFORMATION PROVIDED IN CONNECTION WITH OUTSTANDING DEBT
The following condensed consolidating financial statements reflect the results of AIG Life Holdings, Inc. (AIGLH), a holding company and a wholly owned subsidiary of AIG. AIG provides a full and unconditional guarantee of all outstanding debt of AIGLH.
Condensed Consolidating Balance Sheet
|
(in millions)
|
American
International Group, Inc. (As Guarantor) |
AIGLH
|
Other
Subsidiaries |
Reclassifications
and Eliminations |
Consolidated
AIG |
|||||||||||
|---|---|---|---|---|---|---|---|---|---|---|---|---|---|---|---|---|
|
March 31, 2013 |
||||||||||||||||
|
Assets: |
||||||||||||||||
|
Short-term investments |
$ | 11,804 | $ | – | $ | 17,267 | $ | (5,735 | ) | $ | 23,336 | |||||
|
Other investments (a) |
5,859 | – | 342,578 | (2,074 | ) | 346,363 | ||||||||||
|
Total investments |
17,663 | – | 359,845 | (7,809 | ) | 369,699 | ||||||||||
|
Cash |
58 | – | 1,169 | – | 1,227 | |||||||||||
|
Loans to subsidiaries (b) |
33,402 | – | 6,523 | (39,925 | ) | – | ||||||||||
|
Investment in consolidated subsidiaries (b) |
71,746 | 42,705 | (26,859 | ) | (87,592 | ) | – | |||||||||
|
Other assets, including current and deferred income taxes |
23,960 | 155 | 128,383 | (6,360 | ) | 146,138 | ||||||||||
|
Assets held for sale |
– | – | 31,818 | (2 | ) | 31,816 | ||||||||||
|
Total assets |
$ | 146,829 | $ | 42,860 | $ | 500,879 | $ | (141,688 | ) | $ | 548,880 | |||||
|
Liabilities: |
||||||||||||||||
|
Insurance liabilities |
$ | – | $ | – | $ | 278,241 | $ | (240 | ) | $ | 278,001 | |||||
|
Long-term debt |
33,764 | 1,393 | 11,861 | (1,752 | ) | 45,266 | ||||||||||
|
Other liabilities, including intercompany balances (a)(c) |
12,446 | 149 | 96,877 | (11,594 | ) | 97,878 | ||||||||||
|
Loans from subsidiaries (b) |
1,099 | 379 | 38,630 | (40,108 | ) | – | ||||||||||
|
Liabilities held for sale |
– | – | 27,164 | – | 27,164 | |||||||||||
|
Total liabilities |
47,309 | 1,921 | 452,773 | (53,694 | ) | 448,309 | ||||||||||
|
Redeemable noncontrolling interests (see Note 12) |
– | – | 260 | 128 | 388 | |||||||||||
|
Total AIG shareholders' equity |
99,520 | 40,939 | 47,191 | (88,130 | ) | 99,520 | ||||||||||
|
Non-redeemable noncontrolling interests |
– | – | 655 | 8 | 663 | |||||||||||
|
Total equity |
99,520 | 40,939 | 47,846 | (88,122 | ) | 100,183 | ||||||||||
|
Total liabilities and equity |
$ | 146,829 | $ | 42,860 | $ | 500,879 | $ | (141,688 | ) | $ | 548,880 | |||||
|
December 31, 2012 |
||||||||||||||||
|
Assets: |
||||||||||||||||
|
Short-term investments |
$ | 14,764 | $ | – | $ | 18,323 | $ | (4,279 | ) | $ | 28,808 | |||||
|
Other investments (a) |
3,902 | – | 345,706 | (2,592 | ) | 347,016 | ||||||||||
|
Total investments |
18,666 | – | 364,029 | (6,871 | ) | 375,824 | ||||||||||
|
Cash |
81 | 73 | 997 | – | 1,151 | |||||||||||
|
Loans to subsidiaries (b) |
35,064 | – | 5,169 | (40,233 | ) | – | ||||||||||
|
Investment in consolidated subsidiaries (b) |
70,781 | 43,891 | (28,239 | ) | (86,433 | ) | – | |||||||||
|
Other assets, including current and deferred income taxes |
23,153 | 150 | 121,345 | (4,955 | ) | 139,693 | ||||||||||
|
Assets held for sale |
– | – | 31,965 | – | 31,965 | |||||||||||
|
Total assets |
$ | 147,745 | $ | 44,114 | $ | 495,266 | $ | (138,492 | ) | $ | 548,633 | |||||
|
Liabilities: |
||||||||||||||||
|
Insurance liabilities |
$ | – | $ | – | $ | 280,533 | $ | (235 | ) | $ | 280,298 | |||||
|
Long-term debt |
36,366 | 1,638 | 10,197 | 299 | 48,500 | |||||||||||
|
Other liabilities, including intercompany balances (a)(c) |
12,375 | 261 | 89,976 | (9,146 | ) | 93,466 | ||||||||||
|
Loans from subsidiaries (b) |
1,002 | 472 | 41,754 | (43,228 | ) | – | ||||||||||
|
Liabilities held for sale |
– | – | 27,366 | – | 27,366 | |||||||||||
|
Total liabilities |
49,743 | 2,371 | 449,826 | (52,310 | ) | 449,630 | ||||||||||
|
Redeemable noncontrolling interests (see Note 12) |
– | – | 192 | 142 | 334 | |||||||||||
|
Total AIG shareholders' equity |
98,002 | 41,743 | 44,955 | (86,698 | ) | 98,002 | ||||||||||
|
Non-redeemable noncontrolling interests |
– | – | 293 | 374 | 667 | |||||||||||
|
Total equity |
98,002 | 41,743 | 45,248 | (86,324 | ) | 98,669 | ||||||||||
|
Total liabilities and equity |
$ | 147,745 | $ | 44,114 | $ | 495,266 | $ | (138,492 | ) | $ | 548,633 | |||||
(a) Includes intercompany derivative asset positions, which are reported at fair value before credit valuation adjustment.
(b) Eliminated in consolidation.
(c) For March 31, 2013 and December 31, 2012, includes intercompany tax payable of $5.5 billion and $6.1 billion, respectively, and intercompany derivative liabilities of $622 million and $602 million, respectively, for American International Group, Inc. (As Guarantor) and intercompany tax receivable of $85 million and $120 million, respectively, for AIGLH.
63
ITEM 1. / NOTE 16. INFORMATION PROVIDED IN CONNECTION WITH OUTSTANDING DEBT
NOTES TO CONDENSED CONSOLIDATED FINANCIAL STATEMENTS (unaudited)
Condensed Consolidating Statement of Income
|
(in millions)
|
American
International Group, Inc. (As Guarantor) |
AIGLH
|
Other
Subsidiaries |
Reclassifications
and Eliminations |
Consolidated
AIG |
|||||||||||
|---|---|---|---|---|---|---|---|---|---|---|---|---|---|---|---|---|
|
Three Months Ended March 31, 2013 |
||||||||||||||||
|
Revenues: |
||||||||||||||||
|
Equity in earnings of consolidated subsidiaries (a) |
$ | 1,891 | $ | 670 | $ | – | $ | (2,561 | ) | $ | – | |||||
|
Other income (b) |
294 | – | 15,663 | (69 | ) | 15,888 | ||||||||||
|
Total revenues |
2,185 | 670 | 15,663 | (2,630 | ) | 15,888 | ||||||||||
|
Expenses: |
||||||||||||||||
|
Interest expense (c) |
528 | 36 | 82 | (69 | ) | 577 | ||||||||||
|
Loss on extinguishment of debt |
269 | – | 71 | – | 340 | |||||||||||
|
Other expenses |
258 | 71 | 11,810 | – | 12,139 | |||||||||||
|
Total expenses |
1,055 | 107 | 11,963 | (69 | ) | 13,056 | ||||||||||
|
Income (loss) from continuing operations before
|
1,130 | 563 | 3,700 | (2,561 | ) | 2,832 | ||||||||||
|
Income tax expense (benefit) |
(1,080 | ) | (11 | ) | 1,785 | – | 694 | |||||||||
|
Income (loss) from continuing operations |
2,210 | 574 | 1,915 | (2,561 | ) | 2,138 | ||||||||||
|
Income (loss) from discontinued operations, net of
|
(4 | ) | – | 97 | – | 93 | ||||||||||
|
Net income (loss) |
2,206 | 574 | 2,012 | (2,561 | ) | 2,231 | ||||||||||
|
Less: |
||||||||||||||||
|
Net income from continuing operations attributable
|
– | – | 25 | – | 25 | |||||||||||
|
Net income (loss) attributable to AIG |
$ | 2,206 | $ | 574 | $ | 1,987 | $ | (2,561 | ) | $ | 2,206 | |||||
|
Three Months Ended March 31, 2012 |
||||||||||||||||
|
Revenues: |
||||||||||||||||
|
Equity in earnings of consolidated subsidiaries (a) |
$ | 2,820 | $ | 52 | $ | – | $ | (2,872 | ) | $ | – | |||||
|
Change in fair value of ML III |
651 | – | 601 | – | 1,252 | |||||||||||
|
Other income (b) |
651 | 49 | 15,749 | (204 | ) | 16,245 | ||||||||||
|
Total revenues |
4,122 | 101 | 16,350 | (3,076 | ) | 17,497 | ||||||||||
|
Expenses: |
||||||||||||||||
|
Interest expense (c) |
644 | 54 | 71 | (204 | ) | 565 | ||||||||||
|
Other expenses |
179 | – | 12,287 | – | 12,466 | |||||||||||
|
Total expenses |
823 | 54 | 12,358 | (204 | ) | 13,031 | ||||||||||
|
Income (loss) from continuing operations before
|
3,299 | 47 | 3,992 | (2,872 | ) | 4,466 | ||||||||||
|
Income tax expense |
91 | – | 990 | – | 1,081 | |||||||||||
|
Income (loss) from continuing operations |
3,208 | 47 | 3,002 | (2,872 | ) | 3,385 | ||||||||||
|
Income from discontinued operations, net of
|
– | – | 64 | – | 64 | |||||||||||
|
Net income (loss) |
3,208 | 47 | 3,066 | (2,872 | ) | 3,449 | ||||||||||
|
Less: |
||||||||||||||||
|
Net income from continuing operations attributable to
|
||||||||||||||||
|
Nonvoting, callable, junior and senior preferred
|
– | – | – | 208 | 208 | |||||||||||
|
Other |
– | – | 33 | – | 33 | |||||||||||
|
Net income from continuing operations attributable
|
– | – | 33 | 208 | 241 | |||||||||||
|
Net income (loss) attributable to AIG |
$ | 3,208 | $ | 47 | $ | 3,033 | $ | (3,080 | ) | $ | 3,208 | |||||
(a) Eliminated in consolidation.
(b) Includes intercompany income of $66 million and $71 million for the three month periods ended March 31, 2013 and 2012, respectively, for American International Group, Inc. (As Guarantor).
(c) Includes intercompany interest expense of $3 million and $133 million for the three month periods ended March 31, 2013 and 2012, respectively, for American International Group, Inc. (As Guarantor).
64
ITEM 1. / NOTE 16. INFORMATION PROVIDED IN CONNECTION WITH OUTSTANDING DEBT
NOTES TO CONDENSED CONSOLIDATED FINANCIAL STATEMENTS (unaudited)
Condensed Consolidating Statement of Comprehensive Income
|
(in millions)
|
American
International Group, Inc. (As Guarantor) |
AIGLH
|
Other
Subsidiaries |
Reclassifications
and Eliminations |
Consolidated
AIG |
|||||||||||
|---|---|---|---|---|---|---|---|---|---|---|---|---|---|---|---|---|
|
Three Months Ended March 31, 2013 |
||||||||||||||||
|
Net income (loss) |
$ | 2,206 | $ | 574 | $ | 2,012 | $ | (2,561 | ) | $ | 2,231 | |||||
|
Other comprehensive income (loss) |
(735 | ) | (639 | ) | (920 | ) | 1,559 | (735 | ) | |||||||
|
Comprehensive income (loss) |
1,471 | (65 | ) | 1,092 | (1,002 | ) | 1,496 | |||||||||
|
Total comprehensive income attributable to
|
– | – | 25 | – | 25 | |||||||||||
|
Comprehensive income (loss) attributable to AIG |
$ | 1,471 | $ | (65 | ) | $ | 1,067 | $ | (1,002 | ) | $ | 1,471 | ||||
|
Three Months Ended March 31, 2012 |
||||||||||||||||
|
Net income (loss) |
$ | 3,208 | $ | 47 | $ | 3,066 | $ | (2,872 | ) | $ | 3,449 | |||||
|
Other comprehensive income (loss) |
1,720 | 825 | 1,975 | (2,795 | ) | 1,725 | ||||||||||
|
Comprehensive income (loss) |
4,928 | 872 | 5,041 | (5,667 | ) | 5,174 | ||||||||||
|
Total comprehensive income attributable to
|
– | – | 38 | 208 | 246 | |||||||||||
|
Comprehensive income (loss) attributable to AIG |
$ | 4,928 | $ | 872 | $ | 5,003 | $ | (5,875 | ) | $ | 4,928 | |||||
65
ITEM 1. / NOTE 16. INFORMATION PROVIDED IN CONNECTION WITH OUTSTANDING DEBT
NOTES TO CONDENSED CONSOLIDATED FINANCIAL STATEMENTS (unaudited)
Condensed Consolidating Statement of Cash Flows
|
(in millions)
|
American
International Group, Inc. (As Guarantor) |
AIGLH
|
Other
Subsidiaries and Eliminations |
Consolidated
AIG |
|||||||||
|---|---|---|---|---|---|---|---|---|---|---|---|---|---|
|
Three Months Ended March 31, 2013 |
|||||||||||||
|
Net cash (used in) provided by operating activities — continuing operations |
$ | (951 | ) | $ | 1,243 | $ | (1,069 | ) | $ | (777 | ) | ||
|
Net cash provided by operating activities — discontinued operations |
– | – | 628 | 628 | |||||||||
|
Net cash (used in) provided by operating activities |
(951 | ) | 1,243 | (441 | ) | (149 | ) | ||||||
|
Cash flows from investing activities: |
|||||||||||||
|
Sales of investments |
556 | – | 16,578 | 17,134 | |||||||||
|
Purchase of investments |
(2,448 | ) | – | (15,721 | ) | (18,169 | ) | ||||||
|
Loans to subsidiaries — net |
1,710 | – | (1,710 | ) | – | ||||||||
|
Contributions to subsidiaries — net |
(30 | ) | – | 30 | – | ||||||||
|
Net change in restricted cash |
– | – | (8 | ) | (8 | ) | |||||||
|
Net change in short-term investments |
3,255 | – | 2,466 | 5,721 | |||||||||
|
Other, net |
180 | – | (471 | ) | (291 | ) | |||||||
|
Net cash provided by investing activities — continuing operations |
3,223 | – | 1,164 | 4,387 | |||||||||
|
Net cash (used in) investing activities — discontinued operations |
– | – | (423 | ) | (423 | ) | |||||||
|
Net cash provided by investing activities |
3,223 | – | 741 | 3,964 | |||||||||
|
Cash flows from financing activities: |
|||||||||||||
|
Issuance of long-term debt |
– | – | 131 | 131 | |||||||||
|
Repayments of long-term debt |
(2,149 | ) | (245 | ) | (467 | ) | (2,861 | ) | |||||
|
Intercompany loans — net |
97 | (93 | ) | (4 | ) | – | |||||||
|
Cash dividends paid |
– | (978 | ) | 978 | – | ||||||||
|
Other, net |
(243 | ) | – | (523 | ) | (766 | ) | ||||||
|
Net cash (used in) provided by financing activities — continuing operations |
(2,295 | ) | (1,316 | ) | 115 | (3,496 | ) | ||||||
|
Net cash (used in) financing activities — discontinued operations |
– | – | (222 | ) | (222 | ) | |||||||
|
Net cash (used in) financing activities |
(2,295 | ) | (1,316 | ) | (107 | ) | (3,718 | ) | |||||
|
Effect of exchange rate changes on cash |
– | – | (36 | ) | (36 | ) | |||||||
|
Change in cash |
(23 | ) | (73 | ) | 157 | 61 | |||||||
|
Cash at beginning of period |
81 | 73 | 997 | 1,151 | |||||||||
|
Reclassification to assets held for sale |
– | – | 15 | 15 | |||||||||
|
Cash at end of period |
$ | 58 | $ | – | $ | 1,169 | $ | 1,227 | |||||
|
Three Months Ended March 31, 2012 |
|||||||||||||
|
Net cash (used in) provided by operating activities — continuing operations |
$ | (1,012 | ) | $ | 1,352 | $ | (834 | ) | $ | (494 | ) | ||
|
Net cash provided by operating activities — discontinued operations |
– | – | 588 | 588 | |||||||||
|
Net cash (used in) provided by operating activities |
(1,012 | ) | 1,352 | (246 | ) | 94 | |||||||
|
Cash flows from investing activities: |
|||||||||||||
|
Sales of investments |
764 | – | 25,408 | 26,172 | |||||||||
|
Purchase of investments |
– | – | (16,869 | ) | (16,869 | ) | |||||||
|
Loans to subsidiaries — net |
3,866 | – | (3,866 | ) | – | ||||||||
|
Contributions to subsidiaries — net |
(168 | ) | – | 168 | – | ||||||||
|
Net change in restricted cash |
(560 | ) | – | (1 | ) | (561 | ) | ||||||
|
Net change in short-term investments |
1,450 | – | 30 | 1,480 | |||||||||
|
Other, net |
106 | – | (569 | ) | (463 | ) | |||||||
|
Net cash provided by investing activities — continuing operations |
5,458 | – | 4,301 | 9,759 | |||||||||
|
Net cash provided by investing activities — discontinued operations |
– | – | 222 | 222 | |||||||||
|
Net cash provided by investing activities |
5,458 | – | 4,523 | 9,981 | |||||||||
|
Cash flows from financing activities: |
|||||||||||||
|
Issuance of long-term debt |
1,996 | – | 234 | 2,230 | |||||||||
|
Repayments of long-term debt |
(1,339 | ) | – | (655 | ) | (1,994 | ) | ||||||
|
Intercompany loans — net |
(2,187 | ) | (1,365 | ) | 3,552 | – | |||||||
|
Purchase of common stock |
(3,000 | ) | – | – | (3,000 | ) | |||||||
|
Other, net |
(6 | ) | – | (7,705 | ) | (7,711 | ) | ||||||
|
Net cash (used in) financing activities — continuing operations |
(4,536 | ) | (1,365 | ) | (4,574 | ) | (10,475 | ) | |||||
|
Net cash provided by financing activities — discontinued operations |
– | – | 243 | 243 | |||||||||
|
Net cash (used in) financing activities |
(4,536 | ) | (1,365 | ) | (4,331 | ) | (10,232 | ) | |||||
|
Effect of exchange rate changes on cash |
– | – | (2 | ) | (2 | ) | |||||||
|
Change in cash |
(90 | ) | (13 | ) | (56 | ) | (159 | ) | |||||
|
Cash at beginning of period |
176 | 13 | 1,285 | 1,474 | |||||||||
|
Cash at end of period |
$ | 86 | $ | – | $ | 1,229 | $ | 1,315 | |||||
66
NOTES TO CONDENSED CONSOLIDATED FINANCIAL STATEMENTS (unaudited)
Supplementary Disclosure of Condensed Consolidating Cash Flow Information
|
Three Months Ended March 31,
(in millions) |
American
International Group, Inc. (As Guarantor) |
AIGLH
|
Other
Subsidiaries and Eliminations |
Consolidated
AIG |
||||||||||
|---|---|---|---|---|---|---|---|---|---|---|---|---|---|---|
|
Cash (paid) received during the 2013 period for: |
||||||||||||||
|
Interest: |
||||||||||||||
|
Third party |
$ | (434 | ) | $ | (44 | ) | $ | (505 | ) | $ | (983 | ) | ||
|
Intercompany |
(4 | ) | (13 | ) | 17 | – | ||||||||
|
Taxes: |
||||||||||||||
|
Income tax authorities |
$ | – | $ | – | $ | (103 | ) | $ | (103 | ) | ||||
|
Intercompany |
210 | (78 | ) | (132 | ) | – | ||||||||
|
Cash (paid) received during the 2012 period for: |
||||||||||||||
|
Interest: |
||||||||||||||
|
Third party |
$ | (398 | ) | $ | (44 | ) | $ | (497 | ) | $ | (939 | ) | ||
|
Intercompany |
(128 | ) | (32 | ) | 160 | – | ||||||||
|
Taxes: |
||||||||||||||
|
Income tax authorities |
$ | 2 | $ | – | $ | (99 | ) | $ | (97 | ) | ||||
|
Intercompany |
145 | – | (145 | ) | – | |||||||||
American International Group, Inc. (As Guarantor) supplementary disclosure of non-cash activities:
|
|
|
|
|||||
|---|---|---|---|---|---|---|---|
|
Three Months Ended March 31,
(in millions) |
2013
|
2012
|
|||||
|
Intercompany non-cash financing and investing activities: |
|
|
|
||||
|
Capital contributions in the form of bond available for sale securities |
$
|
–
|
|
$ | 959 | ||
|
Return of capital and dividend received in the form of cancellation of intercompany loan |
|
–
|
|
9,303 | |||
|
in the form of bond trading securities |
|
–
|
|
3,320 | |||
|
Other capital contributions — net |
|
118
|
|
187 | |||
67
GLOSSARY AND ACRONYMS OF SELECTED INSURANCE TERMS AND REFERENCES
Throughout this Management's Discussion and Analysis of Financial Condition and Results of Operations (MD&A), we use certain terms and abbreviations that are defined in the Glossary and Acronyms on pages 163 and 166, respectively.
American International Group, Inc. (AIG) has incorporated into this discussion a number of cross-references to additional information included elsewhere in this Quarterly Report on Form 10-Q to assist readers seeking additional information related to a particular subject.
In this Quarterly Report on Form 10-Q, unless otherwise mentioned or unless the context indicates otherwise, we use the terms "AIG," the "Company," "we," "us" and "our" to refer to American International Group, Inc., a Delaware corporation, and its consolidated subsidiaries. We use the term "AIG Parent" to refer solely to American International Group, Inc., and not to any of its consolidated subsidiaries.
CAUTIONARY STATEMENT REGARDING FORWARD-LOOKING INFORMATION
This Quarterly Report on Form 10-Q and other publicly available documents may include, and officers and representatives of AIG may from time to time make, projections, goals, assumptions and statements that may constitute "forward-looking statements" within the meaning of the Private Securities Litigation Reform Act of 1995. These projections, goals, assumptions and statements are not historical facts but instead represent only AIG's belief regarding future events, many of which, by their nature, are inherently uncertain and outside AIG's control. These projections, goals, assumptions and statements include statements preceded by, followed by or including words such as "believe," "anticipate," "expect," "intend," "plan," "view," "target" or "estimate." These projections, goals, assumptions and statements may address, among other things:
|
• the monetization of AIG's interests in International Lease Finance Corporation (ILFC), including whether AIG's proposed sale of up to 90 percent of ILFC will be completed and if completed, the timing and final terms of such sale; |
•
AIG's strategy for risk
management;
•
AIG's generation of deployable
capital;
• AIG's return on equity and earnings per share long-term aspirational goals; |
|
|
•
AIG's exposures to subprime
mortgages, monoline insurers, the residential and commercial real estate markets, state and municipal bond issuers and sovereign bond issuers;
• AIG's exposure to European governments and European financial institutions; |
•
AIG's strategies to grow net
investment income, efficiently manage capital and reduce expenses;
•
AIG's strategies for customer
retention, growth, product development, market position, financial results and reserves; and
• the revenues and combined ratios of AIG's subsidiaries. |
68
It is possible that AIG's actual results and financial condition will differ, possibly materially, from the results and financial condition indicated in these projections, goals, assumptions and statements. Factors that could cause AIG's actual results to differ, possibly materially, from those in the specific projections, goals, assumptions and statements include:
|
•
changes in market
conditions;
• the occurrence of catastrophic events, both natural and man-made; |
•
judgments concerning the
recognition of deferred tax assets; and
• such other factors discussed in: |
|
• significant legal proceedings; |
• this Part I, Item 2. MD&A; and |
|
|
• the timing and applicable requirements of any new regulatory framework to which AIG is subject as a savings and loan holding company (SLHC), and if such a determination is made, as a non-bank systemically important financial institution (SIFI); |
• Part II, Item 7. MD&A and Part I, Item 1A. Risk Factors in our Annual Report on Form 10-K for the year ended December 31, 2012 (2012 Annual Report). |
|
|
• concentrations in AIG's investment portfolios; |
||
|
• actions by credit rating agencies; |
||
|
• judgments concerning casualty insurance underwriting and insurance liabilities; |
AIG is not under any obligation (and expressly disclaims any obligation) to update or alter any projections, goals, assumptions or other statements, whether written or oral, that may be made from time to time, whether as a result of new information, future events or otherwise.
69
The MD&A is organized as follows:
INDEX TO ITEM 2
70
ITEM 2 / USE OF NON-GAAP MEASURES
Use of Non-GAAP Measures
Throughout this MD&A, we present AIG's financial condition and results of operations in the way we believe will be most meaningful, representative and most transparent. Some of the measurements we use are "non-GAAP financial measures" under SEC rules and regulations. GAAP is the acronym for "accounting principles generally accepted in the United States." The non-GAAP financial measures we present may not be comparable to similarly-named measures reported by other companies.
Book Value Per Common Share Excluding Accumulated Other Comprehensive Income (Loss) (AOCI) is used to show the amount of our net worth on a per-share basis. We believe Book Value Per Common Share Excluding AOCI is useful to investors because it eliminates the effect of non-cash items that can fluctuate significantly from period to period, including changes in fair value of our available for sale portfolio and foreign currency translation adjustments. Book Value Per Common Share Excluding AOCI is derived by dividing Total AIG shareholders' equity, excluding AOCI, by Total common shares outstanding. The reconciliation to book value per common share, the most comparable GAAP measure, is presented below in the Executive Overview section of this MD&A.
We use the following operating performance measures because we believe they enhance understanding of the underlying profitability of continuing operations and trends of AIG and our business segments. We believe they also allow for more meaningful comparisons with our insurance competitors. When we use these measures, reconciliations to the most comparable GAAP measure are provided in the Results of Operations section of this MD&A.
- •
-
AIG —
After-tax operating income (loss) attributable to
AIG
is derived by excluding the following items from net income: income (loss) from discontinued operations, net loss (gain) on sale of divested
businesses, income from divested businesses, legacy tax adjustments primarily related to certain changes in uncertain tax positions (FIN 48) and other tax adjustments, legal reserves
(settlements) related to "legacy crisis matters," deferred income tax valuation allowance (releases) charges, changes in fair value of AIG Life and Retirement securities designated to hedge living
benefit liabilities, change in benefit reserves and deferred policy acquisition costs (DAC), value of business acquired (VOBA), and sales inducement assets (SIA) related to net realized capital
(gains) losses, (gain) loss on extinguishment of debt, net realized capital (gains) losses, non-qualifying derivative hedging activities, excluding net realized capital (gains) losses,
bargain purchase gain and net income (loss) from continuing operations attributable to noncontrolling interests. "Legacy crisis matters" include favorable and unfavorable settlements related to events
leading up to and resulting from our September 2008 liquidity crisis and legal fees incurred by AIG as the plaintiff in connection with such legal matters.
- •
-
AIG Property Casualty
- •
-
Operating income (loss):
includes both underwriting income (loss) and net
investment income, but excludes net realized capital (gains) losses, other (income) expense, legal settlements related to legacy crisis matters described above and bargain purchase gain. Underwriting
income (loss) is derived by reducing net premiums earned by claims and claims adjustment expense, acquisition expense and general operating expense.
- •
-
Ratios:
AIG Property Casualty, along with most property and casualty
insurance companies, uses the loss ratio, the expense ratio and the combined ratio as measures of underwriting performance. These ratios are relative measurements that describe, for every $100 of net
premiums earned, the amount of claims and claims adjustment expense, and the amount of other underwriting expenses that would be incurred. A combined ratio of less than 100 indicates underwriting
income and a combined ratio of over 100 indicates an underwriting loss. The underwriting environment varies across countries and products, as does the degree of litigation activity, all of which
affect such ratios. In addition, investment returns, local taxes, cost of capital, regulation, product type and competition can have an effect on pricing and consequently on profitability as reflected
in underwriting income and associated ratios.
- •
- Accident year loss ratio, as adjusted: the loss ratio excluding catastrophe losses and related reinstatement premiums, prior year development, net of premium adjustments, and the impact of reserve discounting. Catastrophe losses are generally weather or seismic events having a net impact on AIG Property Casualty in excess of $10 million each.
71
- •
-
Accident year combined ratio, as adjusted:
the combined ratio excluding
catastrophe losses and related reinstatement premiums, prior year development, net of premium adjustments, and the impact of reserve discounting.
- •
-
AIG Life and Retirement
- •
-
Operating income (loss):
is derived by excluding the following items from
net income (loss): legal settlements related to legacy crisis matters described above, changes in fair values of fixed maturity securities designated to hedge living benefit liabilities, net realized
capital (gains) losses, and changes in benefit reserves and DAC, VOBA, and SIA related to net realized capital (gains) losses. We believe that Operating income (loss) is useful because excluding these
volatile items permits investors to better assess the operating performance of the underlying business by highlighting the results from ongoing operations.
- •
-
Premiums and deposits:
includes life insurance premiums and deposits on
annuity contracts, guaranteed investment contracts (GICs) and mutual funds.
- •
- Other Operations — Operating income (loss): income (loss) excluding certain legal reserves (settlements) related to legacy crisis matters described above, (gain) loss on extinguishment of debt, Net realized capital (gains) losses, net (gains) losses on sale of divested businesses and properties, and income from divested businesses.
Results from discontinued operations are excluded from all of these measures.
Executive Overview
This overview of management's discussion and analysis highlights selected information and may not contain all of the information that is important to current or potential investors in AIG's securities. You should read this Quarterly Report on Form 10-Q, together with the 2012 Annual Report, in its entirety for a complete description of events, trends, uncertainties, risks and critical accounting estimates affecting AIG and its subsidiaries.
We report our results of operations as follows:
- •
-
AIG Property Casualty
— AIG Property Casualty offers
property and casualty insurance products and services to businesses and individuals worldwide. Commercial insurance products for large and small businesses are primarily distributed through insurance
brokers. Major lines of business include casualty, property, financial and specialty (including aerospace, environmental, surety, marine, trade credit and political risk insurance). Consumer insurance
products are distributed to individual consumers or groups of consumers through insurance brokers, agents, and on a direct-to-consumer basis. Consumer insurance products
include accident & health (A&H) and personal insurance. In addition, Fuji Fire & Marine Insurance Company Limited (Fuji) in Japan offers life insurance products through Fuji Life
Insurance Company (Fuji Life), which are included in A&H.
- •
-
AIG Life and Retirement
— AIG Life and Retirement
offers a comprehensive suite of products and services to individuals and groups, including term life, universal life, A&H, fixed and variable deferred annuities, fixed payout annuities, mutual funds
and financial planning. AIG Life and Retirement offers its products and services through a diverse, multi-channel distribution network that includes banks, national, regional and independent
broker-dealers, affiliated financial advisors, independent marketing organizations, independent and career insurance agents, structured settlement brokers, benefit consultants and
direct-to-consumer platforms. During the first quarter of 2013, AIG Life and Retirement completed its previously announced reporting structure changes and now presents its
results in the following two operating segments: Retail and Institutional. See Segment Results — AIG Life and Retirement Operations for additional information.
- •
- Other Operations — AIG's Other operations include results from Mortgage Guaranty operations (conducted through United Guaranty Corporation (UGC)), Global Capital Markets (GCM) operations (consisting of the operations of AIG Markets, Inc. (AIG Markets) and the remaining derivatives portfolio of AIG Financial Products Corp. and AIG Trading Group Inc. and their respective subsidiaries (collectively, AIGFP)), Direct Investment book (including the Matched Investment Program (MIP) and certain non-derivative assets and liabilities of AIGFP), Retained Interests and Corporate & Other operations (after allocations to AIG's business segments).
72
ITEM 2 / EXECUTIVE OVERVIEW
Executive Summary
We continued our positive financial and operational performance during the first quarter of 2013 :
- •
-
AIG Property Casualty
reported improved operating income and has continued
to experience positive pricing trends.
- •
-
AIG Life and Retirement
assets under management grew from deposits, net
flows from individual variable annuities and retail mutual funds and appreciation due to higher equity markets. We continued to enhance spread income and actively manage the low interest rate
environment.
- •
-
Mortgage Guaranty
reported new insurance written of $10.6 billion
for the first quarter of 2013 compared to $6.6 billion in the first quarter of 2012 and has experienced improving credit trends.
- •
-
Our investment portfolio performance,
excluding gains recognized in the
first quarter of 2012 from our previous investments in Maiden Lane II LLC (ML II), Maiden Lane III LLC (ML III) and AIA Group Limited (AIA), improved through yield
enhancement initiatives, including the reduction of our concentration in lower-yielding tax-exempt municipal securities and the purchase of higher-yielding securities. The investment
portfolio performance also improved due to an increase in partnership income primarily as a result of favorable equity market performance.
- •
-
Realized capital gains
improved because of lower
other-than-temporary impairments and foreign exchange gains due to the strengthening of the U.S. dollar against the British pound, euro and Japanese yen.
- •
-
Our balance sheet is stronger
as a result of our maturities, repayments
and purchases of $2.9 billion of debt, including the redemption of $1.1 billion aggregate principal amount of our 7.70% Series A-5 Junior Subordinated
Debentures Due 2047 and our purchase, in cash tender offers, an aggregate principal amount of approximately $1.0 billion, for an aggregate purchase price of approximately $1.3 billion,
of our junior subordinated debentures, capital securities issued by three statutory trusts controlled by AIG Life Holdings, Inc. (AIGLH) and senior debentures we had assumed that were
originally issued by SunAmerica Inc. As a result of the redemption and cash tender offers, we expect annual interest expense to decrease by approximately $165 million.
- •
- We maintained financial flexibility through $1.3 billion in cash dividends and loan repayments from AIG Life and Retirement subsidiaries.
Our Performance — Selected Indicators
|
|
|
|
|||||
|---|---|---|---|---|---|---|---|
|
Three Months Ended March 31,
(in millions, except per share data and ratios) |
2013
|
2012
|
|||||
|
Results of operations data: |
|
|
|
||||
|
Total revenues |
$
|
15,888
|
|
$ | 17,497 | ||
|
Income from continuing operations |
|
2,138
|
|
3,385 | |||
|
Net income attributable to AIG |
|
2,206
|
|
3,208 | |||
|
Net income per common share attributable to AIG (basic and diluted) |
|
1.49
|
|
1.71 | |||
|
After-tax operating income attributable to AIG |
|
1,982
|
|
3,046 | |||
|
Key metrics: |
|
|
|
||||
|
AIG Property Casualty combined ratio |
|
97.3
|
|
102.1 | |||
|
AIG Property Casualty accident year combined ratio, as adjusted |
|
97.2
|
|
100.4 | |||
|
AIG Life and Retirement premiums and deposits |
$
|
5,580
|
|
$ | 5,560 | ||
|
|
|
|
|||||
|---|---|---|---|---|---|---|---|
|
(in millions, except per share data)
|
March 31,
|
December 31,
2012 |
|||||
|
Balance sheet data: |
|
|
|
||||
|
Total assets |
$
|
548,880
|
|
$ | 548,633 | ||
|
Long-term debt |
|
45,266
|
|
48,500 | |||
|
Total AIG shareholders' equity |
|
99,520
|
|
98,002 | |||
|
Book value per common share |
|
67.41
|
|
66.38 | |||
|
Book value per common share excluding AOCI |
|
59.39
|
|
57.87 | |||
73
ITEM 2 / EXECUTIVE OVERVIEW
The following table presents a reconciliation of book value per common share to book value per common share, excluding Accumulated other comprehensive income (loss), which is a non-GAAP measure. See Use of Non-GAAP Measures for additional information.
|
|
|
|
|||||
|---|---|---|---|---|---|---|---|
|
(in millions, except per share data)
|
March 31,
|
December 31,
2012 |
|||||
|
Total AIG shareholders' equity |
$
|
99,520
|
|
$ | 98,002 | ||
|
Accumulated other comprehensive income |
|
11,839
|
|
12,574 | |||
|
Total AIG shareholders' equity, excluding accumulated other comprehensive
|
$
|
87,681
|
|
$ | 85,428 | ||
|
Total common shares outstanding |
|
1,476,345,163
|
|
1,476,321,935 | |||
|
Book value per common share |
$
|
67.41
|
|
$ | 66.38 | ||
|
Book value per common share, excluding accumulated other comprehensive
|
$
|
59.39
|
|
$ | 57.87 | ||
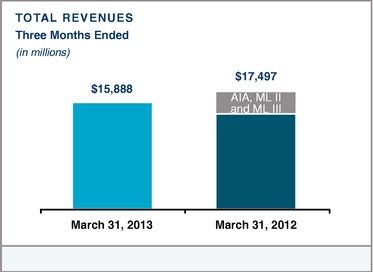
|
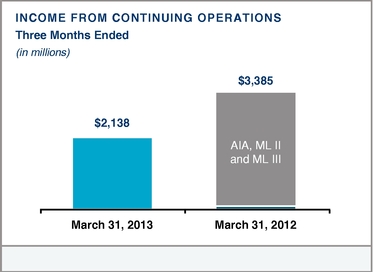
|
|
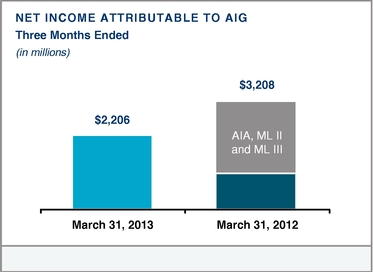
|

|
74
ITEM 2 / EXECUTIVE OVERVIEW
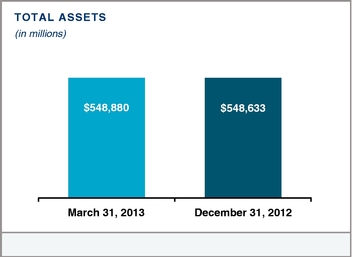
|
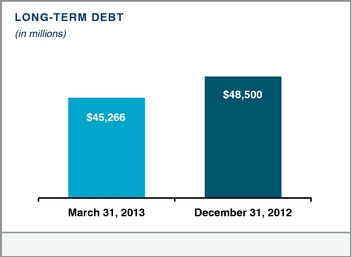
|
|
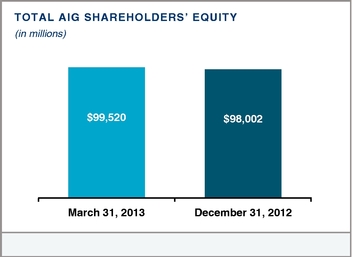
|
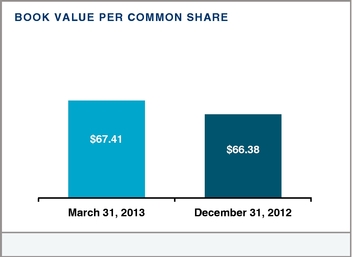
|
Presentation Changes
Prior period revenues and expenses were conformed to the current period presentation. These changes did not affect Income from continuing operations before income tax expense or Net income attributable to AIG. Also, the presentation of the operating segments within the AIG Life and Retirement segment was revised in the current period to reflect two new operating segments: Retail and Institutional. For further discussion, see Notes 1 and 3 to the Condensed Consolidated Financial Statements.
Investment Highlights
Net investment income decreased 41 percent to $4.2 billion in the first quarter of 2013 compared to the first quarter of 2012, primarily due to fair value gains in the first quarter of 2012 on our investments in ML II, ML III and AIA, which were liquidated during 2012. The overall credit rating of our fixed maturity portfolio was largely unchanged, and other-than- temporary impairments declined significantly compared to prior year levels, due in part to favorable developments in the housing sector which resulted in strong performance in our structured products portfolios.
- •
- Our insurance operations achieved a $110 million increase in net investment income in spite of the challenges presented by a continuing low interest rate environment. Net investment income improved due to higher partnership income, driven primarily by equity market gains, which was partially offset by the absence of ML II gains in the first quarter of 2013 compared to 2012. While corporate debt securities represented the core of new investment allocations, we continued to focus on risk-weighted opportunistic investments in residential mortgage-backed (RMBS) and other structured securities to improve yields.
75
ITEM 2 / EXECUTIVE OVERVIEW
- •
- Other-than-temporary Impairments were significantly lower than the prior year, in part driven by favorable developments in the housing sector which led to strong performance in our structured products portfolios.
Strategic Outlook
Industry Trends
Our business is affected by industry and economic factors such as interest rates, credit and equity market conditions, regulation, tax policy, competition, and general economic, market and political conditions. We continue to operate under difficult market conditions in 2013, characterized by factors such as low interest rates, instability in the global markets due to the European debt crisis, uncertainly in the Far East and slow growth in the U.S. economy.
Low interest rates in the U.S. fixed income market have significantly affected our industry by reducing investment returns. In addition, current market conditions may not necessarily permit insurance companies to increase pricing across all our product lines.
AIG Priorities for 2013
AIG is focused on the following priorities for 2013:
- •
-
Strengthen and improve the operating performance of our core businesses;
- •
-
Consummate the sale of up to 90 percent of our interest in ILFC;
- •
-
Enhance the yield on our investments while maintaining focus on credit quality;
- •
-
Manage our capital and interest expense more efficiently by improving our capital structure and redeploying excess capital
in areas that promote profitable growth;
- •
-
Work with the Board of Governors of the Federal Reserve System (the FRB) in its capacity as our principal regulator; and
- •
- Reduce operating expenses by leveraging our scale and driving increased standardization through investments in infrastructure.
Outlook for Our Operating Businesses
The outlook for each of our businesses and management initiatives to improve growth and performance in 2013 and over the longer term is summarized below. See our 2012 Annual Report for additional information concerning strategic initiatives and opportunities for each of our businesses.
AIG PROPERTY CASUALTY OUTLOOK
We expect that the current low interest rate environment and ongoing uncertainty in global economic conditions will continue to challenge the growth of net investment income and limit growth in some markets through at least the end of 2013. Due to these conditions, coupled with overcapacity in the property casualty insurance industry, we have sought to tighten terms and conditions, shed unprofitable business and develop advanced data analytics in order to improve profitability.
We have observed improving trends in certain key indicators that may offset the effect of current economic challenges. Commencing in the second quarter of 2011, and continuing since, we have benefitted from favorable pricing trends, particularly in our U.S. commercial business. The property casualty insurance industry is experiencing modest growth as a result of this positive rate trend and an increase in overall exposures in some markets. We expect that expansion in certain growth economies will occur at a faster pace than in developed countries, although at levels lower than those previously expected due to revised economic assumptions.
76
ITEM 2 / EXECUTIVE OVERVIEW
AIG Property Casualty Strategic Initiatives and Opportunities
- •
-
Business Mix
Shift
- •
-
Continue shifting toward higher value business to increase profitability.
- •
-
Expand in attractive growth economies, specifically in Asia Pacific, the Middle East and Latin America.
- •
-
Underwriting
Excellence
–
Enhance risk selection and pricing to earn returns commensurate to the risk assumed.
- •
-
Claims Best
Practices
–
Implement improved claims practices and advanced technology to lower the loss ratio.
- •
-
Operating Expense
Discipline
–
Apply operating expense discipline and increase efficiencies by taking full advantage of our global footprint.
- •
-
Capital
Efficiency
–
Continue to streamline our legal entity structure to enhance transparency with regulators and optimize capital
and tax efficiency.
- •
- Investment Strategy – Continue to execute our investment strategy, which includes increased asset diversification and yield-enhancement opportunities that meet our liquidity, risk and return objectives.
Capital Efficiency
We continue to execute capital management initiatives by enhancing broad-based risk tolerance guidelines for our operating units, implementing underwriting strategies to increase return on equity by line of business and reducing exposure to businesses with inadequate pricing and increased loss trends. In addition, we remain focused on enhancing our global reinsurance strategy to improve capital efficiency.
We continue to streamline our legal entity structure to enhance transparency with regulators and optimize capital and tax efficiency. In the first quarter of 2013, we completed six legal entity and branch restructuring transactions.
Effective March 29, 2013, we simplified the ownership structure of our surplus lines carriers in the U.S. to facilitate efficient capital allocation. Additionally, effective April 1, 2013, the Bermuda branch business of Chartis Excess Limited was transferred to American International Reinsurance Company (AIRCO) to simplify our business operations in Bermuda. AIRCO will be our primary insurance operation based in Bermuda. Our restructuring and capital management initiatives will enable AIRCO to make capital available to be used by AIG Property Casualty for general corporate purposes.
We made significant progress with respect to legal entity restructuring activities in the Asia Pacific region. On April 1, 2013, we completed the integration of most of our Japan operations under one licensed insurance holding company, AIG Japan Holdings KK, which holds the majority of our insurance companies and service companies that operate in Japan. The transaction is expected to enhance dividend capacity in the future.
We continue to implement restructuring plans in each region and the overall restructuring is expected to be mostly completed by the end of 2014, subject to regulatory approvals in various jurisdictions.
AIG LIFE AND RETIREMENT OUTLOOK
AIG Life and Retirement's businesses and the life and annuity industry continue to be affected by the current economic environment of low interest rates and volatile equity markets. Continued low interest rates put pressure on long-term investment returns, negatively affect sales of interest rate-sensitive products and reduce future profits on certain existing businesses. Products such as payout annuities and traditional life insurance that are not rate-adjustable may require increases in reserves if future investment yields fall to a level that results in expected future losses. Also, low interest rates can affect the recoverability and accelerate the amortization of DAC assets held with respect to our variable annuity, fixed annuity and universal life businesses. Equity market volatility may result in higher reserves for variable annuity guarantee features, and can affect the recoverability and amortization rate of DAC assets.
77
ITEM 2 / EXECUTIVE OVERVIEW
AIG Life and Retirement has implemented a number of actions to address the impact of low interest rates. These actions include a disciplined approach to pricing new business related to interest sensitive products (e.g. fixed annuities) and active management of renewal crediting rates. We have filed new life insurance and annuity products with reduced minimum rate guarantees.
AIG Life and Retirement Strategic Initiatives and Opportunities
- •
-
Assets Under
Management
–
Fully leverage our unified distribution organization to increase sales of profitable products across all
channels. Capitalize on the growing demand for income solutions and on AIG Life and Retirement's capital base, risk controls, innovative product designs, expanded distribution initiatives and
financial discipline to grow our variable annuity business. Pursue selected institutional market opportunities where AIG Life and Retirement's scale and capital base provide a competitive advantage.
- •
-
Increase Life Insurance in
Force
–
Develop innovative life offerings through consumer-focused research that delivers superior, differentiated product
solutions. Consolidate life insurance platforms, operations and systems to create a more efficient, cost-competitive and agile operating model.
- •
-
Enhance Return on
Equity
–
We completed the merger of six life insurance operating legal entities into American General Life Insurance
Company effective December 31, 2012. We expect to leverage our streamlined legal entity structure to enhance financial strength and durability, efficient capital allocation and the ease of
doing business.
- •
-
Investment
Strategy
–
Consistent with AIG's worldwide insurance investment policy, AIG Life and Retirement places primary emphasis on
investments in fixed maturity securities issued by corporations, municipalities and other governmental agencies, structured securities collateralized by, among others, residential and commercial real
estate, commercial mortgage loans and, to a lesser extent, private equity, hedge funds, other alternative investments, and common and preferred stocks.
Our fundamental investment strategy is to maintain primarily a diversified, high quality portfolio of fixed maturity securities with the intent to match the established duration targets based on the characteristics of its liabilities. In addition, AIG Life and Retirement enhances its returns through investments in a diversified portfolio of private equity funds, hedge funds and affordable housing partnerships. Although these investments are subject to periodic volatility, they have historically achieved yields in excess of the fixed income portfolio yields. AIG Life and Retirement's expectation is that these alternative investments will continue to outperform the fixed income portfolio yields over the long-term while providing important diversification to our investment portfolio.
AIG Life and Retirement continues to make investments in structured securities and fixed income securities with attractive and appropriate risk versus return characteristics to improve yields and increase net investment income.
78
OTHER OPERATIONS OUTLOOK
Mortgage Guaranty
Mortgage Guaranty Strategic Initiatives and Opportunities
- •
-
Underwriting
Discipline
–
The mortgage market continues to show signs of improvement with increasing levels of originations, house value
appreciation and tight mortgage underwriting standards. These trends, combined with the modest improvement of U.S. macroeconomic conditions, have had a favorable impact on our operating results, most
notably on the quality of business written since 2009. Our risk-based pricing strategy has positioned UGC to take advantage of these improving market conditions and has resulted in the
underwriting of a high quality book of business over the last four years. UGC plans to continue to execute this strategy during 2013 and to further enhance its risk-based pricing model.
UGC will continue to review its new business pricing relative to changes in the market to ensure that the price of coverage is commensurate with the level of risk being underwritten.
- •
- Increase New Business Production through competitor differentiation. Beginning in 2009, UGC has differentiated itself from competitors through its risk-based pricing model that is designed to identify high quality new business and competitively price the associated risks.
Global Capital Markets (GCM)
AIG Markets, Inc. (AIG Markets) acts as the derivatives intermediary between AIG and its subsidiaries and third parties to provide hedging services. The derivative portfolio of AIG Markets consists primarily of interest rate and currency derivatives.
The remaining derivatives portfolio of AIG Financial Products Corp. and AIG Trading Group, Inc. and their respective subsidiaries (collectively, AIGFP) consists primarily of hedges of the assets and liabilities of the DIB and a portion of the legacy hedges for AIG and its subsidiaries. AIGFP's derivative portfolio consists primarily of interest rate, currency, credit, commodity and equity derivatives. Additionally, AIGFP has a credit default swap portfolio being managed for economic benefit and with limited risk. The AIGFP portfolio continues to be wound down and is managed consistent with our risk management objectives. Although the portfolio may experience periodic fair value volatility, it consists predominantly of transactions that we believe are of low complexity, low risk or currently not economically appropriate to unwind based on a cost versus benefit analysis.
Direct Investment Book (DIB)
The DIB portfolio is being wound down and is managed with the objective of ensuring that at all times it maintains the liquidity we believe is necessary to meet all its liabilities, as they come due, even under stress scenarios, and to maximize return consistent with our risk management objectives. We are focused on meeting the DIB's liquidity needs, including the need for contingent liquidity arising from collateral posting for debt positions of the DIB without relying on resources beyond the DIB. As part of this program management, we may from time to time access the capital markets, subject to market conditions. In addition, we may seek to buy back debt or sell assets on an opportunistic basis, subject to market conditions.
From time to time, we may utilize cash allocated to the DIB that is not required to meet the risk target for general corporate purposes unrelated to the DIB.
Certain non-derivative assets and liabilities of the DIB are accounted for under the fair value option and thus operating results are subject to periodic market volatility. The overall hedging activity for the assets and liabilities of the DIB is executed by GCM. The value of hedges related to the non-derivative assets and liabilities of AIGFP in the DIB is included within the assets and liabilities and operating results of GCM and is not included within the DIB operating results, assets or liabilities.
79
ITEM 2. / RESULTS OF OPERATIONS
The following section provides a comparative discussion of our Results of Operations for the three-month periods ended March 31, 2013 and 2012. Factors that relate primarily to a specific business segment are discussed in more detail within that business segment. For a discussion of the Critical Accounting Estimates that affect the Results of Operations, see the Critical Accounting Estimates section herein and in Part II. Item 7. MD&A, in the 2012 Annual Report.
The following table presents AIG's condensed consolidated results of operations:
|
|
|
|
|
|||||||
|---|---|---|---|---|---|---|---|---|---|---|
|
Three Months Ended March 31,
(in millions) |
2013
|
2012
|
Percentage
Change |
|||||||
|
Revenues: |
|
|
|
|||||||
|
Premiums |
$
|
9,372
|
|
$ | 9,470 | (1 | )% | |||
|
Policy fees |
|
615
|
|
584 | 5 | |||||
|
Net investment income |
|
4,164
|
|
7,105 | (42 | ) | ||||
|
Net realized capital gains (losses) |
|
300
|
|
(251 | ) | NM | ||||
|
Other income |
|
1,437
|
|
589 | 152 | |||||
|
Total revenues |
|
15,888
|
|
17,497 | (9 | ) | ||||
|
Benefits, claims and expenses: |
|
|
|
|||||||
|
Policyholder benefits and claims incurred |
|
6,728
|
|
7,119 | (5 | ) | ||||
|
Interest credited to policyholder account balances |
|
1,017
|
|
1,062 | (4 | ) | ||||
|
Amortization of deferred acquisition costs |
|
1,286
|
|
1,347 | (5 | ) | ||||
|
Other acquisition and insurance expenses |
|
2,238
|
|
2,258 | (1 | ) | ||||
|
Interest expense |
|
577
|
|
565 | 2 | |||||
|
Net loss on extinguishment of debt |
|
340
|
|
– | NM | |||||
|
Other expenses |
|
870
|
|
680 | 28 | |||||
|
Total benefits, claims and expenses |
|
13,056
|
|
13,031 | – | |||||
|
Income from continuing operations before income tax expense |
|
2,832
|
|
4,466 | (37 | ) | ||||
|
Income tax expense |
|
694
|
|
1,081 | (36 | ) | ||||
|
Income from continuing operations |
|
2,138
|
|
3,385 | (37 | ) | ||||
|
Income from discontinued operations, net of income tax expense |
|
93
|
|
64 | 45 | |||||
|
Net income |
|
2,231
|
|
3,449 | (35 | ) | ||||
|
Less: Net income attributable to noncontrolling interests |
|
25
|
|
241 | (90 | ) | ||||
|
Net income attributable to AIG |
$
|
2,206
|
|
$ | 3,208 | (31 | )% | |||
80
ITEM 2. / RESULTS OF OPERATIONS
AIG First Quarter Comparison for 2013 and 2012
|
Income from continuing operations before income taxes for the first quarter of 2013 and 2012 reflected the following:
• pre-tax income from insurance operations of $3.2 billion and $1.8 billion in the first quarters of 2013 and 2012, respectively; • aggregate pre-tax income from GCM and DIB of $539 million and $336 million in the first quarters of 2013 and 2012, respectively; • loss on extinguishment of debt of $340 million resulting from the redemption of, and cash tender offers for, certain securities in the first quarter of 2013; • an increase in fair value of AIG's interest in AIA ordinary shares of $1.8 billion in the first quarter of 2012, including a gain of approximately $0.6 billion on the sale of AIA ordinary shares; and • an increase in fair value of AIG's interest in ML III of $1.3 billion in the first quarter of 2012. For the first quarter of 2013, the effective tax rate on pre-tax income from continuing operations was 24.5 percent. The effective tax rate attributable to continuing operations differs from the statutory tax rate of 35 percent primarily due to tax effects associated with tax exempt interest income and a decrease in the life-insurance-business capital loss carryforward valuation allowance, primarily attributable to the actual and projected gains on sales of AIG Life and Retirement's available-for-sale securities. These items were partially offset by changes in uncertain tax positions. For the first quarter of 2012, the effective tax rate on pre-tax income from continuing operations was 24.2 percent. The effective tax rate attributable to continuing operations differs from the statutory tax rate of 35 percent primarily due to tax effects associated with tax exempt interest income and investments in partnerships, and a decrease in the life-insurance-business capital loss carryforward valuation allowance primarily attributable to the actual and projected gains on sales of AIG Life and Retirement's available-for-sale securities. |
Results of Operations Highlights • AIG Property Casualty posted underwriting income and improved its accident year loss ratio, as adjusted, due to underwriting improvements and lower catastrophe losses. • AIG Life and Retirement continued to actively manage spread income through the low interest rate environment and realized higher returns on alternative investments. •
Our investment portfolio
performance, excluding gains recognized in the first quarter of 2012 from our previous investments in ML II, ML III and AIA, improved due to higher partnership income, driven primarily by equity market gains.
|
81
ITEM 2. / RESULTS OF OPERATIONS
The following table presents a reconciliation of income from continuing operations to after-tax operating income attributable to AIG:
|
|
|
|
|||||
|---|---|---|---|---|---|---|---|
|
Three Months Ended March 31,
(in millions) |
2013
|
2012
|
|||||
|
Net income |
$
|
2,231
|
|
$ | 3,449 | ||
|
Income from discontinued operations, net of income tax expense |
|
93
|
|
64 | |||
|
Income from continuing operations |
|
2,138
|
|
3,385 | |||
|
Net losses on sale of divested businesses |
|
–
|
|
2 | |||
|
Legacy FIN 48 and other tax adjustments |
|
626
|
|
– | |||
|
Legal reserves (settlements) related to legacy crisis matters |
|
(64
|
)
|
4 | |||
|
Deferred income tax valuation allowance releases |
|
(786
|
)
|
(293 | ) | ||
|
Changes in fair value of AIG Life and Retirement securities designated to hedge living benefit
|
|
19
|
|
12 | |||
|
Change in benefit reserves and DAC, VOBA and SIA related to net realized capital (gains)
|
|
54
|
|
(23 | ) | ||
|
Loss on extinguishment of debt |
|
221
|
|
– | |||
|
Net realized capital (gains) losses |
|
(201
|
)
|
199 | |||
|
Non-qualifying derivative hedging losses, excluding net realized capital losses |
|
–
|
|
1 | |||
|
After-tax operating income |
|
2,007
|
|
3,287 | |||
|
Net income from continuing operations attributable to noncontrolling interests |
|
25
|
|
241 | |||
|
After-tax operating income attributable to AIG |
$
|
1,982
|
|
$ | 3,046 | ||
After-tax operating income attributable to AIG decreased in the first quarter of 2013 compared to the first quarter of 2012 primarily due to fair value gains on AIG's previously held interests in AIA ordinary shares, ML II, and ML III, discussed above, partially offset by increases in income from insurance operations.
For the first quarters of 2013 and 2012, the effective tax rate on pre-tax operating income was 29.8 percent and 30.2 percent, respectively. The significant factors that contributed to the difference from the statutory rate included tax benefits resulting from tax exempt interest income.
AIG reports the results of its operations through two reportable segments: AIG Property Casualty and AIG Life and Retirement. The Other operations category consists of businesses and items not allocated to our reportable segments.
82
ITEM 2. / RESULTS OF OPERATIONS
The following table summarizes the operations of each reportable segment. See also Note 3 to the Condensed Consolidated Financial Statements.
|
|
|
|
|
|||||||
|---|---|---|---|---|---|---|---|---|---|---|
|
Three Months Ended March 31,
(in millions) |
2013
|
2012
|
Percentage
Change |
|||||||
|
Total revenues: |
|
|
|
|||||||
|
AIG Property Casualty |
$
|
9,959
|
|
$ | 9,798 | 2 | % | |||
|
AIG Life and Retirement |
|
4,740
|
|
3,902 | 21 | |||||
|
Total reportable segments |
|
14,699
|
|
13,700 | 7 | |||||
|
Other Operations |
|
1,308
|
|
4,003 | (67 | ) | ||||
|
Consolidation and eliminations |
|
(119
|
)
|
(206 | ) | 42 | ||||
|
Total |
$
|
15,888
|
|
$ | 17,497 | (9 | ) | |||
|
Pre-tax income (loss): |
|
|
|
|||||||
|
AIG Property Casualty |
$
|
1,604
|
|
$ | 910 | 76 | ||||
|
AIG Life and Retirement |
|
1,570
|
|
862 | 82 | |||||
|
Total reportable segments |
|
3,174
|
|
1,772 | 79 | |||||
|
Other Operations |
|
(414
|
)
|
2,736 | NM | |||||
|
Consolidation and eliminations |
|
72
|
|
(42 | ) | NM | ||||
|
Total |
$
|
2,832
|
|
$ | 4,466 | (37 | ) | |||
TOTAL REVENUES
Three Months Ended
(in millions)
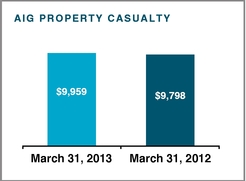
|
|

|
|
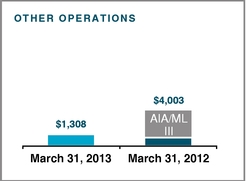
|
A discussion of significant items affecting pre-tax segment income follows. Factors that affect operating income for a specific business segment are discussed in the detailed business segment analysis.
First Quarter Pre-tax Income Comparison for 2013 and 2012
AIG Property Casualty — Pre-tax income increased in the first quarter of 2013 compared to the first quarter of 2012. The increase in pre-tax income was the result of underwriting income in the first quarter of 2013 compared to an underwriting loss in the first quarter of 2012 due to rate increases and enhanced risk selection, favorable reserve development, and lower catastrophe losses. Net investment income increased due to the strong performance of equity partnership investments.
AIG Life and Retirement — Pre-tax income increased in the first quarter of 2013 compared to the first quarter of 2012, due to lower mortality costs and higher returns on alternative investments, partially offset by fair value gains on ML II in the first quarter of 2012. Results benefitted from our efforts to actively manage spread income and increases in policy fees as a result of growth in variable annuity assets under management. Net realized capital gains were $156 million in the first quarter of 2013 compared to Net realized capital losses of $466 million in the first quarter of
83
2012. This improvement was due to lower other-than-temporary impairments and lower fair value losses on variable annuity embedded derivatives.
Other Operations — Other Operations recorded a pre-tax loss in the first quarter of 2013 compared to a pre-tax gain in the first quarter of 2012 due to a loss on extinguishment of debt resulting from the redemption of and cash tender offers for certain securities in the first quarter of 2013 and fair value and realized gains in 2012 from our previously held interests in AIA ordinary shares and ML III.
The following table presents reconciliations of pre-tax income (loss) to operating income (loss) by reportable segment and after-tax operating income attributable to AIG, which are non-GAAP measures. See Use of Non-GAAP Measures for additional information.
|
|
|
|
|||||
|---|---|---|---|---|---|---|---|
|
Three Months Ended March 31,
(in millions) |
2013
|
2012
|
|||||
|
AIG Property Casualty |
|
|
|
||||
|
Pre-tax income |
$
|
1,604
|
|
$ | 910 | ||
|
Net realized capital (gains) losses |
|
(12
|
)
|
135 | |||
|
Other (income) expense — net |
|
(3
|
)
|
(2 | ) | ||
|
Operating income |
$
|
1,589
|
|
$ | 1,043 | ||
|
AIG Life and Retirement |
|
|
|
||||
|
Pre-tax income |
$
|
1,570
|
|
$ | 862 | ||
|
Legal settlements * |
|
(108
|
)
|
– | |||
|
Changes in fair value of fixed maturity securities designated to hedge living benefit liabilities,
|
|
29
|
|
19 | |||
|
Net realized capital (gains) losses |
|
(156
|
)
|
466 | |||
|
Changes in benefit reserves and DAC, VOBA and SIA related to net realized capital (gains)
|
|
59
|
|
(36 | ) | ||
|
Operating income |
$
|
1,394
|
|
$ | 1,311 | ||
|
Other Operations |
|
|
|
||||
|
Pre-tax income (loss) |
$
|
(414
|
)
|
$ | 2,736 | ||
|
Net realized capital gains |
|
(87
|
)
|
(417 | ) | ||
|
Net losses on sale of divested businesses |
|
–
|
|
3 | |||
|
Legal reserves |
|
11
|
|
6 | |||
|
Legal settlements * |
|
(2
|
)
|
– | |||
|
Loss on extinguishment of debt |
|
340
|
|
– | |||
|
Operating income (loss) |
$
|
(152
|
)
|
$ | 2,328 | ||
|
Total |
|
|
|
||||
|
Operating income of reportable segments and other operations |
$
|
2,831
|
|
$ | 4,682 | ||
|
Consolidations, eliminations and other adjustments |
|
30
|
|
30 | |||
|
Income tax expense |
|
(854
|
)
|
(1,425 | ) | ||
|
Non-controlling interest |
|
(25
|
)
|
(241 | ) | ||
|
After-tax operating income attributable to AIG |
$
|
1,982
|
|
$ | 3,046 | ||
* Reflects income in the first quarter of 2013 from a settlement with a financial institution that participated in the creation, offering and sale of RMBS from which AIG and its subsidiaries realized losses during the financial crisis.
84
ITEM 2 / RESULTS OF OPERATIONS
PRE-TAX INCOME (LOSS)
Three Months Ended
(in millions)
|
|
|
|
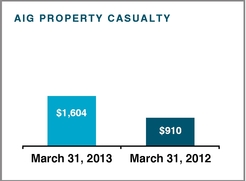

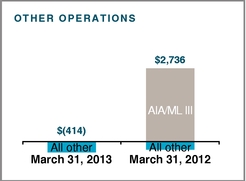
OPERATING INCOME (LOSS)
Three Months Ended
(in millions)
|
|
|
|
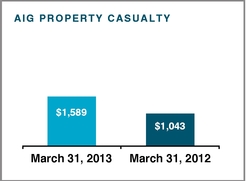
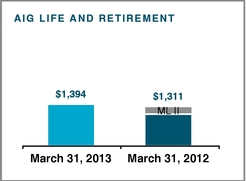

AIG Property Casualty presents its financial information in two operating segments — Commercial Insurance and Consumer Insurance — as well as an Other category.
Commercial Insurance provides insurance solutions for large and small businesses. Commercial lines products are distributed through a network of independent retail and wholesale brokers, branches, and through an independent agency network in the Asia Pacific and EMEA regions.
Consumer Insurance provides personal insurance solutions for individuals, organizations and families. Consumer Insurance products are distributed through agents and brokers, as well as through direct marketing, partner organizations and the internet.
The Other category consists primarily of certain run-off lines of business, including excess workers' compensation written on a stand-alone basis, asbestos and environmental (1986 and prior) and certain environmental liability businesses written prior to 2004. It also includes a portion of AIG Property Casualty expenses relating to global corporate initiatives, expense allocations from AIG Parent not attributable to the Commercial Insurance or Consumer Insurance operating segments, unallocated net investment income, net realized capital gains and losses, and other income (expense).
See Item 1. Business — AIG Property Casualty in AIG's 2012 Annual Report for further discussion of AIG Property Casualty's products and geographic regions where it distributes its products.
We assess the performance of our operating segments based on operating income (loss), loss ratio, acquisition ratio, general operating expense ratio and combined ratio.
85
ITEM 2 / RESULTS OF OPERATIONS
We are developing new value-based metrics that provide management with measures to evaluate our profitability, such as a risk-adjusted profitability model. Along with underwriting results, this risk-adjusted profitability model incorporates elements of capital allocations, costs of capital and net investment income. We believe that such performance measures will allow us to better assess the true economic returns of our business.
AIG Property Casualty First Quarter 2013 Highlights
Net premiums written decreased by four percent in the first quarter of 2013 compared to the same period in the prior year. We now recognize ceded premiums written under excess of loss reinsurance agreements at the inception of the contract rather than ratably over the contract period. In addition, the timing of the 2013 catastrophe bond issuance decreased net premiums written. Excluding the impact of these items, Commercial Insurance net premiums written increased by over four percent in the first quarter of 2013, partially offset by a two percent decrease in Consumer Insurance due to the strengthening of the U.S. dollar against the Japanese yen.
The loss ratio improved by 4.7 points in the first quarter of 2013 compared to the same period in the prior year, primarily due to the benefit from positive pricing trends, the continued effect of the execution of our strategic initiatives which we began implementing in the second half of 2011, as well as lower catastrophe losses. Favorable net prior year development, including related premium adjustments during the period, contributed approximately one point to the overall decrease in the loss ratio.
The acquisition ratio decreased by 0.5 points due to decreases in the Commercial Insurance acquisition ratio, which were partially offset by increases in the Consumer Insurance acquisition ratio.
The general operating expense ratio increased by 0.4 points due to an increase in personnel-related costs which was partially offset by a decrease in bad debt expense in the first quarter of 2013 compared to the same period in the prior year.
Net investment income increased by 11 percent in the first quarter of 2013 compared to the same period in the prior year, primarily due to the strong performance of equity partnership investments.
86
ITEM 2 / RESULTS OF OPERATIONS
AIG Property Casualty Results
The following table presents AIG Property Casualty results:
|
Three Months Ended March 31,
(in millions) |
2013
|
2012
|
Percentage
Change |
|||||||
|---|---|---|---|---|---|---|---|---|---|---|
|
Commercial Insurance |
|
|
|
|||||||
|
Underwriting results: |
|
|
|
|||||||
|
Net premiums written |
$
|
4,903
|
|
$ | 5,223 | (6 | )% | |||
|
(Increase) decrease in unearned premiums |
|
225
|
|
(61 | ) | NM | ||||
|
Net premiums earned |
|
5,128
|
|
5,162 | (1 | ) | ||||
|
Claims and claims adjustment expenses incurred |
|
3,329
|
|
3,730 | (11 | ) | ||||
|
Acquisition expenses |
|
838
|
|
928 | (10 | ) | ||||
|
General operating expense |
|
565
|
|
590 | (4 | ) | ||||
|
Underwriting income (loss) |
|
396
|
|
(86 | ) | NM | ||||
|
Net investment income |
|
645
|
|
731 | (12 | ) | ||||
|
Operating income |
$
|
1,041
|
|
$ | 645 | 61 | % | |||
|
Consumer Insurance |
|
|
|
|||||||
|
Underwriting results: |
|
|
|
|||||||
|
Net premiums written |
$
|
3,532
|
|
$ | 3,597 | (2 | )% | |||
|
Increase in unearned premiums |
|
(124
|
)
|
(101 | ) | (23 | ) | |||
|
Net premiums earned |
|
3,408
|
|
3,496 | (3 | ) | ||||
|
Claims and claims adjustment expenses incurred |
|
1,969
|
|
2,030 | (3 | ) | ||||
|
Acquisition expenses |
|
850
|
|
829 | 3 | |||||
|
General operating expense |
|
534
|
|
519 | 3 | |||||
|
Underwriting income |
|
55
|
|
118 | (53 | ) | ||||
|
Net investment income |
|
98
|
|
116 | (16 | ) | ||||
|
Operating income |
$
|
153
|
|
$ | 234 | (35 | )% | |||
|
Other |
|
|
|
|||||||
|
Underwriting results: |
|
|
|
|||||||
|
Net premiums written |
$
|
2
|
|
$ | — | NM | % | |||
|
Decrease in unearned premiums |
|
20
|
|
30 | (33 | ) | ||||
|
Net premiums earned |
|
22
|
|
30 | (27 | ) | ||||
|
Claims and claims adjustment expenses incurred |
|
115
|
|
149 | (23 | ) | ||||
|
General operating expense |
|
127
|
|
93 | 37 | |||||
|
Underwriting loss |
|
(220
|
)
|
(212 | ) | (4 | ) | |||
|
Net investment income |
|
615
|
|
376 | 64 | |||||
|
Operating income |
|
395
|
|
164 | 141 | |||||
|
Net realized capital gains (losses) |
|
12
|
|
(135 | ) | NM | ||||
|
Other income — net |
|
3
|
|
2 | 50 | |||||
|
Pre-tax income |
$
|
410
|
|
$ | 31 | NM | % | |||
|
Total AIG Property Casualty |
|
|
|
|||||||
|
Underwriting results: |
|
|
|
|||||||
|
Net premiums written |
$
|
8,437
|
|
$ | 8,820 | (4 | )% | |||
|
(Increase) decrease in unearned premiums |
|
121
|
|
(132 | ) | NM | ||||
|
Net premiums earned |
|
8,558
|
|
8,688 | (1 | ) | ||||
|
Claims and claims adjustment expenses incurred |
|
5,413
|
|
5,909 | (8 | ) | ||||
|
Acquisition expenses |
|
1,688
|
|
1,757 | (4 | ) | ||||
|
General operating expense |
|
1,226
|
|
1,202 | 2 | |||||
|
Underwriting income (loss) |
|
231
|
|
(180 | ) | NM | ||||
|
Net investment income |
|
1,358
|
|
1,223 | 11 | |||||
|
Operating income |
|
1,589
|
|
1,043 | 52 | |||||
|
Net realized capital gains (losses) |
|
12
|
|
(135 | ) | NM | ||||
|
Other income — net |
|
3
|
|
2 | 50 | |||||
|
Pre-tax income |
$
|
1,604
|
|
$ | 910 | 76 | % | |||
87
ITEM 2 / RESULTS OF OPERATIONS
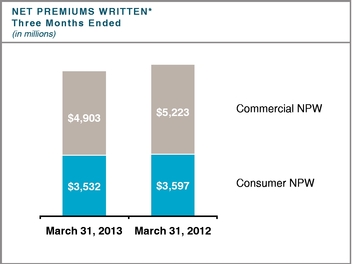
|
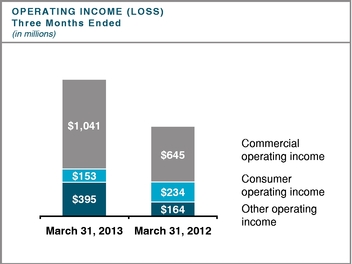
|
* The operations reported as part of Other do not have meaningful levels of Net premiums written.
AIG Property Casualty Results
Operating income increased in the first quarter of 2013 compared to the same period in the prior year, due to an increase in both underwriting income and net investment income. We generated underwriting income in the first quarter of 2013 compared to an underwriting loss in same period in the prior year reflecting improved current accident year losses, favorable prior year loss development, as well as lower catastrophe losses. Net investment income increased in the first quarter of 2013 compared to the same period in the prior year, due to the strong performance of equity partnership investments. The asset diversification strategies that we executed during 2012 enabled us to maintain similar yields in the remainder of the portfolio despite the continued low interest rate environment in 2013. Net prior year favorable (adverse) loss development including premium adjustments was $52 million and $(47) million for the first quarter of 2013 and 2012, respectively.
See Liability for Unpaid Claims and Claims Adjustment Expense for further discussion of prior year development.
Acquisition expenses decreased primarily due to the timing of certain guaranty funds and other assessments in Commercial Insurance, which were partially offset by higher commission rates in Consumer Insurance.
General operating expenses increased due to an increase in the cost of our employee incentive plans of $34 million, primarily as a result of accelerated vesting provisions for retirement-eligible individuals for the 2013 plan awards and increases in accruals for previously granted awards based on our stock price performance, as well as a $42 million increase due to the implementation of a voluntary early retirement plan in Japan. This was offset by decreases in bad debt expense, and lower expenses related to strategic initiatives. Bad debt expense and strategic initiatives expenses decreased in the first quarter of 2013 by $53 million and $9 million, respectively, compared to the same period in the prior year.
Commercial Insurance Results
Operating income increased in the first quarter of 2013 compared to the same period in the prior year, primarily due to an increase in underwriting income partially offset by a decrease in allocated net investment income due to a decrease in risk-free rates. Commercial Insurance generated underwriting income in the first quarter of 2013 compared to an underwriting loss in the same period of the prior year, primarily due to improved current accident year losses, rate increases and enhanced risk selection, favorable prior year loss development, and lower catastrophe losses.
Acquisition expenses decreased in the first quarter of 2013 compared to the same period in the prior year due to the timing of guaranty funds and other assessments.
General operating expenses decreased in the first quarter of 2013 compared to the same period in the prior year primarily due to a decrease in bad debt expense, which was partially offset by the employee incentive plan increases previously discussed.
88
ITEM 2 / RESULTS OF OPERATIONS
Consumer Insurance Results
Operating income decreased in the first quarter of 2013 compared to the same period in the prior year primarily due to a decrease in both underwriting income and allocated net investment income. Underwriting income decreased due to increases in acquisition expenses, investment in strategic business expansion in growth economy nations, and the change in business mix towards higher value products. Underwriting income for the first quarter of 2012 included a benefit of approximately $45 million from refinements to certain actuarial assumptions within the A&H line of business. Net investment income decreased due to a decrease in risk-free rates.
Acquisition expenses increased in the first quarter of 2013 compared to the same period in the prior year primarily due to an increase in commission expenses, reflecting new production growth in A&H products in Asia, which incur higher commission rates.
General operating expenses increased in the first quarter of 2013 compared to the same period in the prior year primarily due to the employee incentive plan increases previously discussed and the strategic expansion in growth economy nations.
AIG Property Casualty Net Premiums Written
The following table presents AIG Property Casualty net premiums written by major line of business:
|
Three Months Ended March 31,
(in millions) |
2013
|
2012
|
Percentage
Change |
|||||||
|---|---|---|---|---|---|---|---|---|---|---|
|
Commercial Insurance |
|
|
|
|||||||
|
Casualty |
$
|
2,244
|
|
$ | 2,352 | (5 | )% | |||
|
Property |
|
683
|
|
972 | (30 | ) | ||||
|
Specialty |
|
972
|
|
990 | (2 | ) | ||||
|
Financial lines |
|
1,004
|
|
909 | 10 | |||||
|
Total net premiums written |
$
|
4,903
|
|
$ | 5,223 | (6 | )% | |||
|
Consumer Insurance |
|
|
|
|||||||
|
Accident & Health |
$
|
1,793
|
|
$ | 1,807 | (1 | )% | |||
|
Personal lines |
|
1,739
|
|
1,790 | (3 | ) | ||||
|
Total net premiums written |
$
|
3,532
|
|
$ | 3,597 | (2 | )% | |||
|
Other |
|
2
|
|
– | NM | |||||
|
Total AIG Property Casualty net premiums written |
$
|
8,437
|
|
$ | 8,820 | (4 | )% | |||

89
ITEM 2 / RESULTS OF OPERATIONS
Commercial Insurance Net Premiums Written
During the first quarter of 2013, Commercial Insurance continued to focus on the execution of its strategic objectives.
Casualty net premiums written decreased in the first quarter of 2013 compared to the same period in the prior year, primarily due to the execution of our strategy to improve loss ratios. Our enhanced risk selection process, and adherence to pricing targets resulted in the non-renewal of approximately $80 million of net premiums written in the first quarter of 2013, primarily within the workers' compensation business in the Americas and within the Primary Casualty business in EMEA. We also entered into a quota share reinsurance agreement in the U.S. for the Excess Casualty business that decreased net premiums written by $72 million in 2013. We implemented rate increases in retained business, especially in the U.S., that partially offset these premium decreases.
Growth in Property new business and changes to our per-risk reinsurance program to retain more favorable risks, while continuing to manage aggregate exposure, was more than offset by additional ceded premiums written in the first quarter of 2013, as described below. Catastrophe-exposed business in the Americas also benefitted from rate increases.
Effective January 1, 2013, we recognize the annual ceded premiums written under excess of loss reinsurance agreements at the inception of the contract rather than ratably over the contract period. Previously, we recognized ceded premiums written on these agreements based on the quarterly contractual remittance requirements, and recorded an adjustment at the end of the contract term to reflect the actual ceded premiums written amounts. This change resulted in the acceleration of ceded premiums written to earlier quarters, but had only a de minimis effect on net premiums earned. For the first quarter of 2013, ceded premiums written increased by $398 million compared to the same period in the prior year as a result of this change. The impact on net premiums written from this change will reverse throughout the rest of 2013.
Net premiums written also reflected the timing of a 2013 catastrophe bond issuance. We have continued the strategy, adopted in 2010, to improve the allocation of our reinsurance between traditional reinsurance markets and capital markets. During the first quarter of 2013, as part of this strategy, we secured a three-year catastrophe bond providing for up to $400 million in protection on U.S. hurricanes and earthquakes to the extent both industry losses and our actual losses exceed specific thresholds. The bond transaction reduced net premiums written by $96 million in the first quarter of 2013. Our previous catastrophe bond issuance occurred in the fourth quarter of 2011.
Specialty net premiums written decreased in the first quarter of 2013 compared to the same period in the prior year primarily due to rate pressure in the European aerospace and marine markets. This decrease was slightly offset by rate increases in small-and medium-sized enterprises and environmental business. Additionally, we continue to restructure our reinsurance program to retain more favorable risks while continuing to manage aggregate exposure, which increased net premiums written by $40 million in the first quarter of 2013.
Financial lines net premiums written increased in the first quarter of 2013 compared to the same period in the prior year, reflecting growth in new business related to targeted growth products as well as an improved rate environment globally. Global professional indemnity net premiums written increased by $35 million due to the restructuring of our reinsurance program, as part of our decision to retain more favorable risks while continuing to manage aggregate exposure, as well as by improved rates and strong new business growth.
Consumer Insurance Net Premiums Written
Consumer Insurance net premiums written decreased in the first quarter of 2013 compared to the same period in the prior year, primarily due to the impact of foreign exchange as the U.S. dollar strengthened against the Japanese yen and the effect of the excess of loss reinsurance ceded written premiums discussed above. Excluding these items, net premiums written in the first quarter of 2013 increased compared to the same period in the prior year as the business continued to build momentum through multiple distribution channels and continuing focus on direct marketing. In the first quarter of 2013, net premiums written generated by direct marketing increased by approximately 8 percent compared to the same period in the prior year, and accounted for approximately 16 percent of Consumer Insurance business.
Excluding foreign exchange, A&H net premiums written increased as a result of our focus on the growth of Fuji Life products, direct marketing, and individual A&H in Asia. In addition, travel business continued to increase in most geographies across the globe, including in EMEA. Americas continued its strategy of repositioning U.S. direct
90
ITEM 2 / RESULTS OF OPERATIONS
marketing operations and maintaining our pricing discipline and underwriting targets. As a result, several programs in the group personal accident business were not renewed in the first quarter of 2013.
Excluding foreign exchange, Personal lines net premiums written increased as a result of growth in automobile products and the continued execution of our strategic initiative to grow higher value lines of business in non-automobile products. Automobile products reported growth in EMEA as our market share continued to improve over local competition in key countries. Non-automobile products also reported continued growth, including increases in Europe Personal lines specialty products and personal property in Asia due to our focus on diversifying the global product mix. These increases were partially offset by a $47 million increase in ceded premiums written under excess of loss reinsurance agreements previously discussed. In addition, the timing of the catastrophe bond issuance reduced net premiums written by $20 million.
AIG Property Casualty Net Premiums Written by Region
The following table presents AIG Property Casualty's net premiums written by region:
|
|
|
|
|
|
|||||||||
|---|---|---|---|---|---|---|---|---|---|---|---|---|---|
|
Three Months Ended March 31,
(in millions) |
2013
|
2012
|
Percentage
Change in U.S. dollars |
Percentage
Change in Original Currency |
|||||||||
|
Commercial Insurance: |
|
|
|
||||||||||
|
Americas |
$
|
2,878
|
|
$ | 3,079 | (7 | )% | (7 | )% | ||||
|
Asia Pacific |
|
501
|
|
452 | 11 | 16 | |||||||
|
EMEA |
|
1,524
|
|
1,692 | (10 | ) | (11 | ) | |||||
|
Total net premiums written |
$
|
4,903
|
|
$ | 5,223 | (6 | )% | (6 | )% | ||||
|
Consumer Insurance: |
|
|
|
||||||||||
|
Americas |
$
|
975
|
|
$ | 1,028 | (5 | )% | (4 | )% | ||||
|
Asia Pacific |
|
1,973
|
|
2,023 | (2 | ) | 5 | ||||||
|
EMEA |
|
584
|
|
546 | 7 | 6 | |||||||
|
Total net premiums written |
$
|
3,532
|
|
$ | 3,597 | (2 | )% | 3 | % | ||||
|
Other: |
|
|
|
||||||||||
|
Americas |
$
|
2
|
|
$ | – | NM | % | NM | % | ||||
|
Total net premiums written |
$
|
2
|
|
$ | – | NM | % | NM | % | ||||
|
Total AIG Property Casualty: |
|
|
|
||||||||||
|
Americas |
$
|
3,855
|
|
$ | 4,107 | (6 | )% | (6 | )% | ||||
|
Asia Pacific |
|
2,474
|
|
2,475 | – | 7 | |||||||
|
EMEA |
|
2,108
|
|
2,238 | (6 | ) | (7 | ) | |||||
|
Total net premiums written |
$
|
8,437
|
|
$ | 8,820 | (4 | )% | (3 | )% | ||||
91
ITEM 2 / RESULTS OF OPERATIONS
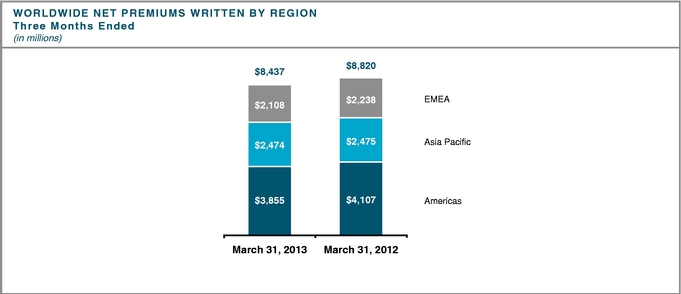
The Americas net premiums written decreased in the first quarter of 2013 compared to the same period in the prior year, primarily due to the effect of the increase in ceded premiums written under excess of loss reinsurance agreements discussed above of approximately $210 million, and approximately $120 million due to the timing of a catastrophe bond issuance. These items, which affected both Commercial Insurance and Consumer Insurance, were partially offset by rate increases in Commercial Insurance and by continued growth in the personal property and private client group in Consumer Insurance.
Asia Pacific net premiums written decreased slightly in the first quarter of 2013 compared to the same period in the prior year, primarily due to the strengthening of the U.S. dollar against the Japanese yen. Excluding foreign exchange, net premiums written increased primarily due to an increase in Consumer Insurance, reflecting growth of Fuji Life products and direct marketing business in Japan. The expansion in Asia Pacific countries outside of Japan also continued in the first quarter of 2013, supported by growth in individual personal accident insurance, direct marketing and personal lines products. Commercial Insurance increased in the region primarily due to organic growth and rate increases in Property, Specialty, and Casualty. In addition, retention in Property and Specialty increased during the first quarter of 2013.
EMEA net premiums written decreased in the first quarter of 2013 compared to the same period in the prior year, primarily due to the change in methodology for recognizing ceded premiums written under excess of loss reinsurance agreements discussed above of approximately $230 million, partially offset by Commercial Insurance growth due to new business growth, and rate improvements on retained business, as well as modest growth in Consumer Insurance travel, warranty, and specialty personal lines products.
92
ITEM 2 / RESULTS OF OPERATIONS
AIG Property Casualty Underwriting Ratios
The following table presents the AIG Property Casualty combined ratios based on GAAP data and reconciliation to the accident year combined ratio, as adjusted:
|
|
|
|
|
|||||||
|---|---|---|---|---|---|---|---|---|---|---|
|
Three Months Ended March 31,
|
2013
|
2012
|
Increase
(Decrease) |
|||||||
|
Commercial Insurance |
|
|
|
|||||||
|
Loss ratio |
|
64.9
|
|
72.3 | (7.4 | ) | ||||
|
Catastrophe losses and reinstatement premiums |
|
(0.6
|
)
|
(1.5 | ) | 0.9 | ||||
|
Prior year development net of premium adjustments |
|
1.1
|
|
(0.5 | ) | 1.6 | ||||
|
Accident year loss ratio, as adjusted |
|
65.4
|
|
70.3 | (4.9 | ) | ||||
|
Acquisition ratio |
|
16.3
|
|
18.0 | (1.7 | ) | ||||
|
General operating expense ratio |
|
11.0
|
|
11.4 | (0.4 | ) | ||||
|
Expense ratio |
|
27.3
|
|
29.4 | (2.1 | ) | ||||
|
Combined ratio |
|
92.2
|
|
101.7 | (9.5 | ) | ||||
|
Catastrophe losses and reinstatement premiums |
|
(0.6
|
)
|
(1.5 | ) | 0.9 | ||||
|
Prior year development net of premium adjustments |
|
1.1
|
|
(0.5 | ) | 1.6 | ||||
|
Accident year combined ratio, as adjusted |
|
92.7
|
|
99.7 | (7.0 | ) | ||||
|
Consumer Insurance |
|
|
|
|||||||
|
Loss ratio |
|
57.8
|
|
58.1 | (0.3 | ) | ||||
|
Catastrophe losses and reinstatement premiums |
|
(0.3
|
)
|
(0.1 | ) | (0.2 | ) | |||
|
Prior year development net of premium adjustments |
|
1.3
|
|
0.4 | 0.9 | |||||
|
Accident year loss ratio, as adjusted |
|
58.8
|
|
58.4 | 0.4 | |||||
|
Acquisition ratio |
|
24.9
|
|
23.7 | 1.2 | |||||
|
General operating expense ratio |
|
15.7
|
|
14.9 | 0.8 | |||||
|
Expense ratio |
|
40.6
|
|
38.6 | 2.0 | |||||
|
Combined ratio |
|
98.4
|
|
96.7 | 1.7 | |||||
|
Catastrophe losses and reinstatement premiums |
|
(0.3
|
)
|
(0.1 | ) | (0.2 | ) | |||
|
Prior year development net of premium adjustments |
|
1.3
|
|
0.4 | 0.9 | |||||
|
Accident year combined ratio, as adjusted |
|
99.4
|
|
97.0 | 2.4 | |||||
|
Total AIG Property Casualty |
|
|
|
|||||||
|
Loss ratio |
|
63.3
|
|
68.0 | (4.7 | ) | ||||
|
Catastrophe losses and reinstatement premiums |
|
(0.5
|
)
|
(0.9 | ) | 0.4 | ||||
|
Prior year development net of premium adjustments |
|
0.4
|
|
(0.6 | ) | 1.0 | ||||
|
Change in discount |
|
–
|
|
(0.2 | ) | 0.2 | ||||
|
Accident year loss ratio, as adjusted |
|
63.2
|
|
66.3 | (3.1 | ) | ||||
|
Acquisition ratio |
|
19.7
|
|
20.2 | (0.5 | ) | ||||
|
General operating expense ratio |
|
14.3
|
|
13.9 | 0.4 | |||||
|
Expense ratio |
|
34.0
|
|
34.1 | (0.1 | ) | ||||
|
Combined ratio |
|
97.3
|
|
102.1 | (4.8 | ) | ||||
|
Catastrophe losses and reinstatement premiums |
|
(0.5
|
)
|
(0.9 | ) | 0.4 | ||||
|
Prior year development net of premium adjustments |
|
0.4
|
|
(0.6 | ) | 1.0 | ||||
|
Change in discount |
|
–
|
|
(0.2 | ) | 0.2 | ||||
|
Accident year combined ratio, as adjusted |
|
97.2
|
|
100.4 | (3.2 | ) | ||||
93
ITEM 2 / RESULTS OF OPERATIONS
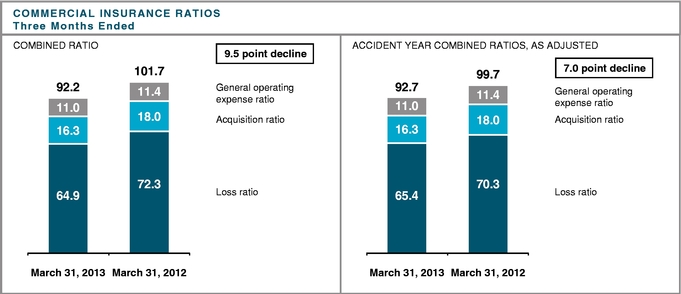
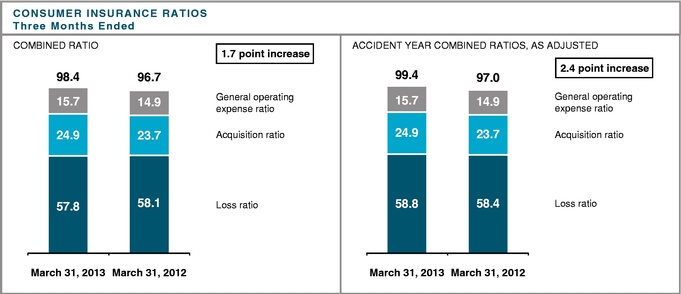
Given the nature of the lines of business and the expenses included in Other, we have determined that the traditional underwriting measures of loss ratio, acquisition ratio, general operating expense ratio and combined ratio do not provide an appropriate measure of underwriting performance. Therefore, these ratios are not separately presented for Other.
The following table presents AIG Property Casualty accident year catastrophe losses by major event, and severe losses:
|
|
2013 | 2012 | ||||||||||||||||||||||
|---|---|---|---|---|---|---|---|---|---|---|---|---|---|---|---|---|---|---|---|---|---|---|---|---|
|
Three Months Ended March 31,
(in millions) |
# of
|
Commercial
|
Consumer
|
Total
|
# of
Events |
Commercial
Insurance |
Consumer
Insurance |
Total
|
||||||||||||||||
|
Event: * |
|
|
|
|
|
|
|
|
|
|
|
|||||||||||||
|
U.S. Windstorms |
2
|
|
$
|
24
|
|
$
|
7
|
|
$
|
31
|
|
2 | $ | 76 | $ | 4 | $ | 80 | ||||||
|
Australia Flood |
1
|
|
|
9
|
|
|
1
|
|
|
10
|
|
– | – | – | – | |||||||||
|
Claims and claim expenses |
|
|
|
33
|
|
|
8
|
|
|
41
|
|
76 | 4 | 80 | ||||||||||
|
Reinstatement premiums |
|
|
|
–
|
|
|
–
|
|
|
–
|
|
– | – | – | ||||||||||
|
Total catastrophe-related charges |
3
|
|
$
|
33
|
|
$
|
8
|
|
$
|
41
|
|
2 | $ | 76 | $ | 4 | $ | 80 | ||||||
|
Total severe losses |
3
|
|
$
|
60
|
|
$
|
–
|
|
$
|
60
|
|
2 | $ | 42 | $ | – | $ | 42 | ||||||
* Events shown in the above table are catastrophic insured events having a net impact in excess of $10 million each. Severe losses are defined as non-catastrophe individual first party losses greater than $10 million, net of related reinsurance.
94
ITEM 2 / RESULTS OF OPERATIONS
Commercial Insurance Ratios
The improvement in the accident year loss ratio, as adjusted, for the first quarter of 2013, reflects the realization of benefits from the continued execution of our multi-faceted strategy to enhance risk selection, pricing discipline, exposure management and claims processing. Although the execution of these strategies resulted in a reduction of Casualty net premiums written, it also improved the accident year loss ratio as we remediated our primary and excess Casualty books in both the Americas and EMEA regions. Financial lines improved due to rate strengthening, restructuring and re-underwriting of certain products. Severe losses in the first quarter of 2013 totaled approximately $60 million, compared to $42 million in the first quarter of 2012, and are included in the accident year loss ratio, as adjusted.
The acquisition ratio decreased by 1.7 points in the first quarter of 2013 compared to the same period in the prior year, primarily due to insurance-related assessments.
The general operating expense ratio decreased by 0.4 points in the first quarter of 2013 compared to the same period in the prior year, primarily due to a decrease in bad debt expense of $55 million, slightly offset by the employee incentive compensation plan increases previously discussed of $26 million.
Consumer Insurance Ratios
The accident year loss ratio, as adjusted, increased in the first quarter of 2013 compared to the same period in the prior year. The underwriting income for the first quarter of 2012 included a benefit of approximately $45 million from refinements to certain actuarial assumptions within the A&H line of business. This was partially offset by improvements in Personal lines, primarily automobile, as a result of rate actions taken in prior years in Japan, as well as by improvements in Europe specialty business and in the U.S. private client group.
The acquisition ratio increased by 1.2 points in the first quarter of 2013 compared to the same period in the prior year, primarily due to higher commissions in lines of business targeted for growth and an increase in direct marketing expenses. Overall, net commissions increased by 1.2 percent, driven by higher growth in Fuji Life products and individual A&H. Direct marketing costs increased by approximately 22 percent in the first quarter of 2013 compared to the same period in the prior year.
The general operating expense ratio increased by 0.8 points primarily as a result of the employee incentive compensation increases previously discussed.
Other Category
We incurred higher costs in the first quarter of 2013 compared to the same period in the prior year, primarily related to our implementation of a voluntary early retirement plan in Japan, which contributed approximately 0.6 points to the AIG Property Casualty general operating expense ratio. We continue to invest in a number of strategic initiatives, including the implementation of global finance and information systems, compliance with the regulatory requirements of the FRB, legal entity restructuring, and underwriting and claims improvement initiatives. The costs of these initiatives, which are not specific to either Commercial Insurance or Consumer Insurance, are reported as part of the Other category. In the first quarter of 2013, such costs totaled $40 million, representing a decrease of approximately $12 million over the same period in 2012.
AIG Property Casualty Investing and Other Results
The following table presents AIG Property Casualty's investing and other results:
|
Three Months Ended March 31,
(in millions) |
2013
|
2012
|
Percentage
Change |
|||||||
|---|---|---|---|---|---|---|---|---|---|---|
|
Net investment income |
|
|
|
|||||||
|
Commercial Insurance |
$
|
645
|
|
$ | 731 | (12 | )% | |||
|
Consumer Insurance |
|
98
|
|
116 | (16 | ) | ||||
|
Other |
|
615
|
|
376 | 64 | |||||
|
Total net investment income |
|
1,358
|
|
1,223 | 11 | |||||
|
Net realized capital gains (losses) |
|
12
|
|
(135 | ) | NM | ||||
|
Other income — net |
|
3
|
|
2 | 50 | |||||
|
Investing and other results |
$
|
1,373
|
|
$ | 1,090 | 26 | % | |||
95
ITEM 2 / RESULTS OF OPERATIONS
We manage and account for our invested assets on a legal entity basis in conformity with regulatory requirements. Within a legal entity, invested assets are available to pay claims and expenses of both Commercial Insurance and Consumer Insurance operating segments as well as the Other category. Invested assets are not segregated or otherwise separately identified for the Commercial Insurance and Consumer Insurance operating segments.
Investment income is allocated to the Commercial Insurance and Consumer Insurance operating segments based on an internal investment income allocation model. The model estimates investable funds based primarily on loss reserves, unearned premium and a capital allocation for each segment. The investment income allocation is calculated based on the estimated investable funds and risk-free yields (plus an illiquidity premium) consistent with the approximate duration of the liabilities. The actual yields in excess of the allocated amounts and the investment income from the assets not attributable to the Commercial Insurance and the Consumer Insurance operating segments are assigned to the Other category. Commencing in the first quarter of 2013, we began applying similar duration and risk-free yields (plus an illiquidity premium) to the allocated capital of Commercial Insurance and Consumer Insurance as is applied to loss reserves.
Net realized capital gains (losses) and Other income (expense) — net are not allocated to Commercial Insurance and Consumer Insurance, but are reported as part of the Other category.
Net Investment Income
Net investment income is influenced by a number of factors, including the amounts and timing of inward and outward cash flows, the interest rate environment and changes in overall asset allocation. Certain of our structured securities are accounted for under the fair value option, which may also increase the volatility of our net investment income. The increase in the fair value of structured securities in the first quarter of 2013 was offset by a decrease in interest income from available for sale securities. Net investment income increased by $135 million or 11 percent, in the first quarter of 2013 compared to the same period in 2012, primarily due to the strong performance in equity partnership investments.
Corporate debt securities continues to be our largest asset category. We continued to reduce our concentration in lower yielding tax-exempt municipal bond holdings and focus on risk-weighted opportunistic investments in higher yielding assets such as structured securities. This asset diversification has achieved an increase in average yields while the overall credit ratings of our fixed maturity investments were largely unchanged. We expect to continue to execute our investment strategy in 2013 to meet our liquidity, duration and credit quality objectives as well as current risk-return and tax objectives.
Net investment income from investment categories other than debt securities increased by $133 million in the first quarter of 2013 compared to the same period in 2012. Approximately $125 million was attributed to the strong performance of equity partnership investments, following an 8 percent increase in the S&P 500 Index. Income from the life settlement portfolios also increased by approximately $35 million during the first quarter of 2013 compared to the same period in 2012.
Net Realized Capital Gains (Losses)
Net realized capital gains in the first quarter of 2013 were driven by gains recognized on the sale of fixed maturity and equity securities of $71 million, partially offset by impairment charges on life settlement contracts of approximately $49 million as a result of decreases in their estimated fair value and other-than-temporary impairment charges of $18 million.
Net realized capital losses in the first quarter of 2012 were driven by impairment charges of $58 million on life settlement contracts and other-than-temporary impairments of $94 million attributable to RMBS and $98 million attributable to partnership investments, which were offset in part by the gains on fixed maturity securities of $169 million.
96
ITEM 2 / RESULTS OF OPERATIONS
Liability for Unpaid Claims and Claims Adjustment Expense
The following discussion of the consolidated liability for unpaid claims and claims adjustment expenses (loss reserves) presents loss reserves for AIG Property Casualty as well as the loss reserves pertaining to the Mortgage Guaranty reporting unit, which is reported in Other operations.
The following table presents the components of AIG's gross loss reserves by major lines of business on a U.S. statutory basis*:
|
(in millions)
|
March 31,
|
December 31,
2012 |
|||||
|---|---|---|---|---|---|---|---|
|
Other liability occurrence |
$
|
20,865
|
|
$ | 21,533 | ||
|
International |
|
16,848
|
|
17,453 | |||
|
Workers' compensation (net of discount) |
|
17,441
|
|
17,319 | |||
|
Other liability claims made |
|
11,328
|
|
11,443 | |||
|
Property |
|
4,239
|
|
4,961 | |||
|
Auto liability |
|
3,043
|
|
3,060 | |||
|
Products liability |
|
2,185
|
|
2,195 | |||
|
Medical malpractice |
|
1,651
|
|
1,651 | |||
|
Mortgage guaranty / credit |
|
1,828
|
|
1,957 | |||
|
Accident and health |
|
1,545
|
|
1,518 | |||
|
Commercial multiple peril |
|
1,310
|
|
1,310 | |||
|
Aircraft |
|
1,142
|
|
1,065 | |||
|
Fidelity/surety |
|
615
|
|
647 | |||
|
Other |
|
1,734
|
|
1,879 | |||
|
Total |
$
|
85,774
|
|
$ | 87,991 | ||
* Presented by lines of business pursuant to statutory reporting requirements as prescribed by the National Association of Insurance Commissioners.
AIG's gross loss reserves represent the accumulation of estimates of ultimate losses, including estimates for IBNR and loss expenses, less applicable discount for future investment income. We regularly review and update the methods and assumptions used to determine loss reserve estimates and to establish the resulting reserves. Any adjustments resulting from this review are reflected in operating income. Because loss reserve estimates are subject to the outcome of future events, changes in estimates are unavoidable given that loss trends vary and time is often required for changes in trends to be recognized and confirmed. Reserve changes that increase prior years' estimates of ultimate cost are referred to as unfavorable or adverse development or reserve strengthening. Reserve changes that decrease prior years' estimates of ultimate cost are referred to as favorable development.
The net loss reserves represent loss reserves reduced by reinsurance recoverable, net of an allowance for unrecoverable reinsurance, less applicable discount for future investment income.
The following table classifies the components of net loss reserves by business unit:
|
(in millions)
|
March 31,
|
December 31,
2012 |
|||||
|---|---|---|---|---|---|---|---|
|
AIG Property Casualty: |
|
|
|
||||
|
Commercial Insurance |
$
|
54,853
|
|
$ | 56,462 | ||
|
Consumer Insurance |
|
5,465
|
|
5,592 | |||
|
Other |
|
4,796
|
|
4,895 | |||
|
Total AIG Property Casualty |
|
65,114
|
|
66,949 | |||
|
Other operations — Mortgage Guaranty |
|
1,711
|
|
1,833 | |||
|
Net liability for unpaid claims and claims adjustment expense |
$
|
66,825
|
|
$ | 68,782 | ||
97
ITEM 2 / RESULTS OF OPERATIONS
Discounting of Reserves
The following table presents the components of AIG Property Casualty's loss reserve discount included above:
|
(in millions)
|
March 31,
|
December 31,
2012 |
|||||
|---|---|---|---|---|---|---|---|
|
U.S. workers' compensation: |
|
|
|
||||
|
Tabular |
$
|
801
|
|
$ | 801 | ||
|
Non-tabular |
|
2,394
|
|
2,394 | |||
|
Asbestos |
|
46
|
|
51 | |||
|
Total |
$
|
3,241
|
|
$ | 3,246 | ||
The following table presents the net reserve discount benefit (charge):
|
Three Months Ended March 31,
(in millions) |
2013
|
2012
|
|||||
|---|---|---|---|---|---|---|---|
|
Change in loss reserve discount — current accident year |
$
|
71
|
|
$ | 85 | ||
|
Change in loss reserve discount — prior year development |
|
–
|
|
(13 | ) | ||
|
Accretion of reserve discount |
|
(76
|
)
|
(91 | ) | ||
|
Net reserve discount benefit (charge) |
$
|
(5
|
)
|
$ | (19 | ) | |
Quarterly Reserving Conclusion
AIG net loss reserves represent our best estimate of our liability for net losses and loss expenses as of March 31, 2013. While we regularly review the adequacy of established loss reserves, there can be no assurance that our ultimate loss reserves will not develop adversely and materially exceed our loss reserves as of March 31, 2013. In our opinion, such adverse development and resulting increase in reserves are not likely to have a material adverse effect on our consolidated financial condition, although such events could have a material adverse effect on our consolidated results of operations for an individual reporting period.
The following table presents the rollforward of net loss reserves:
|
|
|
|
|||||
|---|---|---|---|---|---|---|---|
|
Three Months Ended March 31,
(in millions) |
2013
|
2012
|
|||||
|
Net liability for unpaid claims and claims adjustment expense at beginning of year |
$
|
68,782
|
|
$ | 70,825 | ||
|
Foreign exchange effect |
|
(516
|
)
|
90 | |||
|
Change due to NICO reinsurance transaction |
|
44
|
|
9 | |||
|
Losses and loss expenses incurred: |
|
|
|
||||
|
Current year, undiscounted |
|
5,411
|
|
5,840 | |||
|
Prior years, undiscounted * |
|
(53
|
)
|
39 | |||
|
Change in discount |
|
5
|
|
19 | |||
|
Losses and loss expenses incurred |
|
5,363
|
|
5,898 | |||
|
Losses and loss expenses paid |
|
6,848
|
|
6,949 | |||
|
Net liability for unpaid claims and claims adjustment expense at end of period |
$
|
66,825
|
|
$ | 69,873 | ||
* See tables below for details of prior year development by business unit, accident year and major class of business.
98
ITEM 2 / RESULTS OF OPERATIONS
The following tables summarize development, (favorable) or unfavorable, of incurred losses and loss expenses for prior years, net of reinsurance:
|
Three Months Ended March 31,
(in millions) |
2013
|
2012
|
|||||
|---|---|---|---|---|---|---|---|
|
Prior accident year development by accident year: |
|
|
|
||||
|
Accident Year |
|
|
|
||||
|
2012 |
$
|
(38
|
)
|
$ | – | ||
|
2011 |
|
(27
|
)
|
(156 | ) | ||
|
2010 |
|
(19
|
)
|
(50 | ) | ||
|
2009 |
|
(31
|
)
|
5 | |||
|
2008 |
|
15
|
|
7 | |||
|
2007 |
|
(1
|
)
|
(6 | ) | ||
|
2006 |
|
8
|
|
(1 | ) | ||
|
2005 |
|
4
|
|
34 | |||
|
2004 |
|
(13
|
)
|
(33 | ) | ||
|
2003 and prior |
|
49
|
|
239 | |||
|
Total |
$
|
(53
|
)
|
$ | 39 | ||
For certain categories of claims (e.g., construction defect claims and environmental claims), losses may sometimes be reclassified to an earlier or later accident year as more information about the date of occurrence becomes available to AIG. These reclassifications are shown as development in the respective years in the table above.
|
Three Months Ended March 31,
(in millions) |
2013
|
2012
|
|||||
|---|---|---|---|---|---|---|---|
|
Prior accident year development by major class of business: |
|
|
|
||||
|
Commercial Insurance: |
|
|
|
||||
|
Excess casualty — U.S. |
$
|
(25
|
)
|
$ | 106 | ||
|
Environmental (post 1986 – ongoing) — U.S. |
|
–
|
|
44 | |||
|
Property — U.S. |
|
(54
|
)
|
(63 | ) | ||
|
Primary casualty — U.S. |
|
56
|
|
75 | |||
|
Natural catastrophes: |
|
|
|
||||
|
U.S. |
|
14
|
|
(84 | ) | ||
|
International |
|
(13
|
)
|
(51 | ) | ||
|
All other, net: |
|
|
|
||||
|
U.S. |
|
(37
|
)
|
42 | |||
|
International |
|
(2
|
)
|
(35 | ) | ||
|
Total all other, net |
|
(39
|
)
|
7 | |||
|
Total Commercial Insurance |
|
(61
|
)
|
34 | |||
|
Total Consumer Insurance |
|
(42
|
)
|
(15 | ) | ||
|
Other |
|
|
|
||||
|
Asbestos and environmental (1986 and prior) |
|
|
|
||||
|
U.S. |
|
15
|
|
25 | |||
|
International |
|
9
|
|
– | |||
|
Total asbestos and environmental |
|
24
|
|
25 | |||
|
Environmental (1987 – 2003) — U.S. |
|
37
|
|
21 | |||
|
All other, net |
|
–
|
|
(12 | ) | ||
|
Total Other |
|
61
|
|
34 | |||
|
Total AIG Property Casualty |
|
(42
|
)
|
53 | |||
|
Other operations — Mortgage Guaranty |
|
(11
|
)
|
(14 | ) | ||
|
Total |
$
|
(53
|
)
|
$ | 39 | ||
99
ITEM 2 / RESULTS OF OPERATIONS
Net Loss Development
In determining the loss development from prior accident years, we analyze and evaluate the change in estimated ultimate loss for each accident year by class of business. For example, if loss emergence for a class of business is different than expected for certain accident years, we examine the indicated effect such emergence would have on the reserves of that class of business. In some cases, the higher or lower than expected emergence may result in no clear change in the ultimate loss estimate for the accident years in question, and no adjustment would be made to the reserves for the class of business for prior accident years. In other cases, the higher or lower than expected emergence may result in a larger change, either favorable or unfavorable. As appropriate, we make adjustments for the difference between the actual and expected loss emergence. As part of our reserving process, we also consider notices of claims received with respect to emerging and/or evolving issues, such as those related to the U.S. mortgage and housing market.
For the three-month period ended March 31, 2013, the net favorable development was driven by reserve decreases on claims in the Commercial Insurance and Consumer Insurance operating segments that was partially offset by net adverse development in reserves in Other. The net favorable development in Commercial Insurance was primarily attributable to the reduction of reserves on large excess casualty cases and favorable development in domestic property exposures, and partially offset by adverse development in the primary Casualty lines. The favorable development in Consumer Insurance was due to lower than expected losses on natural catastrophe and non-catastrophe exposures in Personal lines. The adverse development in Other included adverse development on legacy asbestos and environmental exposures (1986 and prior), and adverse development on run-off environmental exposures (1987 – 2003).
For the three-month period ended March 31, 2012, the net adverse development was driven by reserve increases on claims in Commercial Insurance and Other, partially offset by net favorable development in reserves in Consumer Insurance. The net adverse development in Commercial Insurance was primarily attributable to the increase in reserves on large excess casualty cases, primarily casualty and environmental business (policies written after 1987), partially offset by favorable development in domestic property exposures and catastrophe losses. The favorable development in Consumer Insurance was due to lower than expected losses on natural catastrophe losses in Personal lines. The adverse development in Other included adverse development on run-off environmental exposures (1987 – 2003).
AIG Property Casualty recognized additional premiums on loss-sensitive business of $10 million and $6 million for the three-month period ended March 31, 2013 and 2012, respectively, and incurred reinstatement premiums of $14 million in 2013 associated with the development on prior years' catastrophes.
See AIG Property Casualty Results herein and Other Operations — Other Operations Results — Mortgage Guaranty for further discussion of net loss development.
Asbestos and Environmental Reserves
The estimation of loss reserves relating to asbestos and environmental claims on insurance policies written many years ago is subject to greater uncertainty than other types of claims due to inconsistent court decisions as well as judicial interpretations and legislative actions that in some cases have tended to broaden coverage beyond the original intent of such policies and in others have expanded theories of liability.
As described more fully in the 2012 Annual Report, AIG's reserves relating to asbestos and environmental claims reflect a comprehensive ground-up analysis performed periodically. In the first quarter of 2013, a minor amount of incurred loss pertaining to the asbestos loss reserve discount was recognized. In the first quarter of 2013, AIG increased its gross and net environmental reserves by $18 million. This development is primarily attributable to development on one large account expected to be settled in the near future.
In addition to the U.S. asbestos and environmental reserve amounts shown in the tables below, AIG Property Casualty also has asbestos reserves relating to foreign risks written by non-U.S. entities of $134 million gross and $111 million net as of March 31, 2013. The asbestos reserves relating to non-U.S. risks written by non-U.S. entities were $140 million gross and $116 million net as of December 31, 2012.
100
ITEM 2 / RESULTS OF OPERATIONS
The following table provides a summary of reserve activity, including estimates for applicable IBNR, relating to asbestos and environmental claims:
|
|
2013 | 2012 | |||||||||||
|---|---|---|---|---|---|---|---|---|---|---|---|---|---|
|
As of or for the Three Months Ended March 31,
(in millions) |
|||||||||||||
|
Gross
|
Net
|
Gross
|
Net
|
||||||||||
|
Asbestos: |
|
|
|
|
|
|
|||||||
|
Liability for unpaid claims and claims adjustment expense at beginning of year |
$
|
4,896
|
|
$
|
427
|
|
$ | 5,226 | $ | 537 | |||
|
Change in net loss reserves due to retroactive reinsurance: |
|
|
|
|
|
|
|||||||
|
Paid losses recoverable under retroactive reinsurance contracts |
|
–
|
|
|
45
|
|
– | 24 | |||||
|
Re-estimation of amounts recoverable under retroactive reinsurance contracts (a) |
|
–
|
|
|
(1
|
)
|
– | (15 | ) | ||||
|
Change in net loss reserves due to retroactive reinsurance |
|
–
|
|
|
44
|
|
– | 9 | |||||
|
Loss and loss expenses incurred: |
|
|
|
|
|
|
|||||||
|
Undiscounted |
|
–
|
|
|
6
|
|
– | – | |||||
|
Change in discount |
|
12
|
|
|
5
|
|
43 | 20 | |||||
|
Losses and loss expenses incurred (b) |
|
12
|
|
|
11
|
|
43 | 20 | |||||
|
Losses and loss expenses paid (b) |
|
(167
|
)
|
|
(80
|
)
|
(115 | ) | (57 | ) | |||
|
Liability for unpaid claims and claims adjustment expense at end of period |
$
|
4,741
|
|
$
|
402
|
|
$ | 5,154 | $ | 509 | |||
|
Environmental: |
|
|
|
|
|
|
|||||||
|
Liability for unpaid claims and claims adjustment expense at beginning of year |
$
|
309
|
|
$
|
163
|
|
$ | 204 | $ | 119 | |||
|
Losses and loss expenses incurred |
|
18
|
|
|
18
|
|
50 | 25 | |||||
|
Losses and loss expenses paid |
|
(18
|
)
|
|
(13
|
)
|
(13 | ) | (10 | ) | |||
|
Liability for unpaid claims and claims adjustment expense at end of period |
$
|
309
|
|
$
|
168
|
|
$ | 241 | $ | 134 | |||
|
Combined: |
|
|
|
|
|
|
|||||||
|
Liability for unpaid claims and claims adjustment expense at beginning of year |
$
|
5,205
|
|
$
|
590
|
|
$ | 5,430 | $ | 656 | |||
|
Change in net loss reserves due to retroactive reinsurance: |
|
|
|
|
|
|
|||||||
|
Paid losses recoverable under retroactive reinsurance contracts |
|
–
|
|
|
45
|
|
– | 24 | |||||
|
Re-estimation of amount recoverable under retroactive reinsurance contracts |
|
–
|
|
|
(1
|
)
|
– | (15 | ) | ||||
|
Change in net loss reserves due to retroactive reinsurance |
|
–
|
|
|
44
|
|
– | 9 | |||||
|
Losses and loss expenses incurred: |
|
|
|
|
|
|
|||||||
|
Undiscounted |
|
18
|
|
|
24
|
|
50 | 25 | |||||
|
Change in discount |
|
12
|
|
|
5
|
|
43 | 20 | |||||
|
Losses and loss expenses incurred |
|
30
|
|
|
29
|
|
93 | 45 | |||||
|
Losses and loss expenses paid |
|
(185
|
)
|
|
(93
|
)
|
(128 | ) | (67 | ) | |||
|
Liability for unpaid claims and claims adjustment expense at end of period |
$
|
5,050
|
|
$
|
570
|
|
$ | 5,395 | $ | 643 | |||
(a) Re-estimation of amounts recoverable under retroactive reinsurance contracts includes effect of changes in reserve estimates and changes in discount.
(b) These amounts exclude benefit from retroactive reinsurance.
101
ITEM 2 / RESULTS OF OPERATIONS
AIG Life and Retirement
AIG Life and Retirement First Quarter Highlights
The results of AIG Life and Retirement for the first quarter of 2013 reflected the following:
- •
-
Disciplined spread management, primarily through crediting rate changes and opportunistic investments to enhance yields
resulted in improvements in base net investment spreads for the first quarter of 2013. Private equity and hedge fund investment income in the first quarter of 2013 increased $199 million, or
86 percent, compared to the first quarter of 2012 primarily due to favorable equity market conditions and income recorded on several large redemptions from hedge funds in the quarter.
- •
- An increase in the fair value of our investment in The People's Insurance Company (Group) of China Limited (PICC) of $31 million.
AIG Life and Retirement Operations
In 2012, AIG Life and Retirement announced several key organizational structure and management changes intended to better serve the organization's distribution partners and customers. Key aspects of the new structure are distinct product divisions, shared annuity and life operations platforms and a unified all-channel distribution organization with access to all AIG Life and Retirement products. During the first quarter of 2013, AIG Life and Retirement fully implemented these changes to reflect its new structure and now presents its operating results in the two operating segments described below. All prior periods presented have been revised to reflect the new structure.
102
ITEM 2 / RESULTS OF OPERATIONS
Retail
Institutional
The Retail operating segment product lines include life insurance and accident and health (A&H), fixed annuities, retirement income solutions, brokerage services and retail mutual funds. These products are marketed under the following brands — American General, AGLA, Western National and SunAmerica.
Life Insurance and A&H: Primary products include term life insurance, universal life insurance and A&H products. Life insurance and A&H products are primarily distributed through independent marketing organizations and independent insurance agents under the American General brand. Career agents distribute Life Insurance and A&H products under the AGLA brand. AIG Direct is a proprietary direct-to-consumer distributor of term life insurance and A&H products. The Life Insurance and A&H product line will continue to focus on innovative product development and delivering differentiated life insurance solutions to producers and customers.
Fixed Annuities: Products are primarily marketed under the Western National brand and include single and flexible premium deferred fixed annuities and single premium immediate annuities. The Fixed Annuities business line maintains its leading industry position in the bank distribution channel by designing products in cooperation with banks and offering an efficient and flexible administration platform.
Retirement Income Solutions: Primary products include variable and fixed index annuities that provide asset accumulation and lifetime income through innovative design and hedging strategies. Marketed under the SunAmerica Retirement Markets brand, variable annuities are distributed through banks and national, regional and independent broker-dealer firms. Fixed index annuities are distributed through banks under the Western National brand and through career and independent insurance agents under the American General brand.
Brokerage Services: Includes the operations of Advisor Group, which is one of the largest networks of independent financial advisors in the U.S. Brands include Royal Alliance, SagePoint, FSC Securities and, since its acquisition in November 2012, Woodbury Financial Services, Inc. (Woodbury Financial).
Retail Mutual Funds: Includes the mutual fund and related administration and servicing operations of SunAmerica Asset Management.
The Institutional operating segment product lines include group retirement, group benefits and institutional markets. These products and services are marketed through a variety of brands described below.
Group Retirement: Products are marketed under the Variable Annuity Life Insurance Company (VALIC) brand and include fixed and variable group annuities, group mutual funds, and group administrative and compliance services. VALIC career financial advisors and independent financial advisors provide retirement plan participants with enrollment support and comprehensive financial planning services.
Group Benefits: In 2012, AIG Life and Retirement and AIG Property Casualty combined their U.S. group benefits businesses, and the combined business now operates as AIG Benefit Solutions. This business will continue to market a wide range of insurance and benefits products for employees (both employer-paid and voluntary) and affinity groups. Primary product offerings include life insurance, accidental death, business travel accident, disability income, medical excess (stop loss), dental, vision and worksite universal life, critical illness and accident.
Institutional Markets: Products primarily include stable value wrap products, structured settlement and terminal funding annuities, private placement variable life and annuities, corporate- and bank-owned life insurance and guaranteed investment contracts. These products are marketed under the American General brand through independent marketing organizations and structured settlement brokers. Institutional Markets has a disciplined and opportunistic approach to growth in these product lines.
103
ITEM 2 / RESULTS OF OPERATIONS
AIG Life and Retirement Results
The following table presents AIG Life and Retirement results:
|
|
|
|
|
|||||||
|---|---|---|---|---|---|---|---|---|---|---|
|
Three Months Ended March 31,
(in millions) |
2013
|
2012
|
Percentage
Change |
|||||||
|
Retail: |
|
|
|
|||||||
|
Revenue: |
|
|
|
|||||||
|
Premiums |
$
|
358
|
|
$ | 390 | (8 | )% | |||
|
Policy fees |
|
487
|
|
463 | 5 | |||||
|
Net investment income |
|
1,657
|
|
1,671 | (1 | ) | ||||
|
Other income |
|
365
|
|
279 | 31 | |||||
|
Operating expenses: |
|
|
|
|||||||
|
Policyholder benefits and claims incurred |
|
635
|
|
652 | (3 | ) | ||||
|
Interest credited to policyholder account balances |
|
611
|
|
651 | (6 | ) | ||||
|
Amortization of deferred acquisition costs |
|
163
|
|
178 | (8 | ) | ||||
|
Other acquisition and insurance expenses |
|
637
|
|
561 | 14 | |||||
|
Operating income |
|
821
|
|
761 | 8 | |||||
|
Legal settlements |
|
76
|
|
– | NM | |||||
|
Changes in fair value of fixed maturity securities designated to hedge living benefit liabilities |
|
(29
|
)
|
(19 | ) | (53 | ) | |||
|
Net realized capital gains (losses) |
|
89
|
|
(385 | ) | NM | ||||
|
Changes in benefit reserves and DAC, VOBA and SIA related to net realized capital gains (losses) |
|
39
|
|
127 | (69 | ) | ||||
|
Pre-tax income |
$
|
996
|
|
$ | 484 | 106 | % | |||
|
Institutional: |
|
|
|
|||||||
|
Revenue: |
|
|
|
|||||||
|
Premiums |
$
|
262
|
|
$ | 224 | 17 | % | |||
|
Policy fees |
|
128
|
|
121 | 6 | |||||
|
Net investment income |
|
1,220
|
|
1,214 | – | |||||
|
Other income |
|
28
|
|
25 | 12 | |||||
|
Operating expenses: |
|
|
|
|||||||
|
Policyholder benefits and claims incurred |
|
463
|
|
435 | 6 | |||||
|
Interest credited to policyholder account balances |
|
406
|
|
411 | (1 | ) | ||||
|
Amortization of deferred acquisition costs |
|
25
|
|
27 | (7 | ) | ||||
|
Other acquisition and insurance expenses |
|
171
|
|
161 | 6 | |||||
|
Operating income |
|
573
|
|
550 | 4 | |||||
|
Legal settlements |
|
32
|
|
– | NM | |||||
|
Net realized capital gains (losses) |
|
67
|
|
(81 | ) | NM | ||||
|
Changes in benefit reserves and DAC, VOBA and SIA related to net realized capital gains (losses) |
|
(98
|
)
|
(91 | ) | (8 | ) | |||
|
Pre-tax income |
$
|
574
|
|
$ | 378 | 52 | % | |||
|
Total AIG Life and Retirement: |
|
|
|
|||||||
|
Revenue: |
|
|
|
|||||||
|
Premiums |
$
|
620
|
|
$ | 614 | 1 | % | |||
|
Policy fees |
|
615
|
|
584 | 5 | |||||
|
Net investment income |
|
2,877
|
|
2,885 | – | |||||
|
Other income |
|
393
|
|
304 | 29 | |||||
|
Operating expenses: |
|
|
|
|||||||
|
Policyholder benefits and claims incurred |
|
1,098
|
|
1,087 | 1 | |||||
|
Interest credited to policyholder account balances |
|
1,017
|
|
1,062 | (4 | ) | ||||
|
Amortization of deferred acquisition costs |
|
188
|
|
205 | (8 | ) | ||||
|
Other acquisition and insurance expenses |
|
808
|
|
722 | 12 | |||||
|
Operating income |
|
1,394
|
|
1,311 | 6 | |||||
|
Legal settlements |
|
108
|
|
– | NM | |||||
|
Changes in fair value of fixed maturity securities designated to hedge living benefit liabilities, net of
|
|
(29
|
)
|
(19 | ) | (53 | ) | |||
|
Net realized capital gains (losses) |
|
156
|
|
(466 | ) | NM | ||||
|
Changes in benefit reserves and DAC, VOBA and SIA related to net realized capital gains (losses) |
|
(59
|
)
|
36 | NM | |||||
|
Pre-tax income |
$
|
1,570
|
|
$ | 862 | 82 | % | |||
104
ITEM 2 / RESULTS OF OPERATIONS
Prior period amounts were conformed to the current period presentation. These changes did not affect operating income or pre-tax income. See Note 1 to the Condensed Consolidated Financial Statements for further discussion.

AIG Life and Retirement Operating Income
Operating income increased in the first quarter of 2013 principally due to higher returns on alternative investments, benefits from our efforts to actively manage spread income, the impact of favorable separate account performance on policy fees, policyholder benefit expenses and DAC amortization and lower mortality costs. This increase was partially offset by the absence of fair value gains on ML II that were recognized in the first quarter of 2012.
Premiums were essentially unchanged in the first quarter of 2013 compared to the first quarter of 2012 as higher structured settlement and terminal funding annuity premiums were offset by lower term insurance and immediate annuity premiums.
Policy fees increased in the first quarter of 2013 compared to the first quarter of 2012 as a result of growth in variable annuity assets under management from higher net flows and separate account performance, driven in large part by higher equity markets.
Net investment income was essentially unchanged compared to the first quarter of 2012 as higher returns on alternative investments, higher call and tender income and a fair value gain of $31 million on the investment in PICC were offset by ML II fair value gains in the first quarter of 2012 and lower base yields of 20 basis points in the first quarter of 2013. Recent investment purchases have been made at yields lower than the weighted average yield of the existing portfolio.
Other income primarily consists of commission revenues earned by affiliated broker dealers from the sale of investments and variable annuities. The increase in the first quarter of 2013 was primarily as a result of the acquisition of Woodbury Financial in November 2012.
Policyholder benefits and claims incurred were essentially unchanged compared with the first quarter of 2012.
Interest credited decreased in the first quarter of 2013 due to active crediting rate management actions that included lowering renewal credited rates and maintaining disciplined new business pricing.
Amortization of deferred acquisition costs decreased in the first quarter of 2013 consistent with lower fixed annuity reserves.
Other acquisition and insurance expenses increased from the first quarter of 2012 due to higher commission expenses associated with brokerage activities as a result of the acquisition of Woodbury Financial.
105
ITEM 2 / RESULTS OF OPERATIONS
Retail Operating Income
Retail operating income increased in the first quarter of 2013 compared to the first quarter of 2012 due to lower mortality costs, higher returns on alternative investments and lower DAC amortization, partially offset by ML II fair value gains in the first quarter of 2012.
Premiums decreased in the first quarter of 2013 compared to the first quarter of 2012 due to lower term insurance and immediate annuity premiums.
Policy fees increased slightly in the first quarter of 2013 compared to the first quarter of 2012 as a result of growth in variable annuity assets under management due to higher net flows and separate account performance driven in large part by higher equity markets.
Net investment income was essentially unchanged in the first quarter of 2013 compared to the first quarter of 2012, as higher returns on alternative investments, fair value gains on trading securities, including PICC, and higher call and tender income in the first quarter of 2013 compared to the first quarter of 2012 were offset by fair value gains on ML II of $153 million in the first quarter of 2012.
The decrease in policyholder benefits and claims incurred reflected lower mortality costs for individual life insurance compared with the first quarter of 2012.
Amortization of deferred acquisition costs decreased slightly in the first quarter of 2013 compared to the first quarter of 2012 consistent with lower fixed annuity reserves. The favorable separate account returns did not result in unlocking assumptions of estimated gross profits used to amortize DAC, VOBA and SIA in the first quarter of 2013. An unlocking could occur if favorable equity market performance continues for the remainder of 2013; however, such positive unlocking is not expected to be significant to AIG Life and Retirement's operating results.
Institutional Operating Income
Institutional operating income increased in the first quarter of 2013 compared to the first quarter of 2012 due to higher returns on alternative investments and higher gains on trading securities, partially offset by ML II fair value gains recorded in the first quarter of 2012.
Premiums increased in the first quarter of 2013 compared to the first quarter of 2012 due to higher structured settlement and terminal funding annuity premiums.
Net investment income was essentially unchanged in the first quarter of 2013 compared to the first quarter of 2012 as higher returns on alternative investments were offset by fair value gains on ML II of $93 million in the first quarter of 2012.
Policyholder benefits and claims incurred increased primarily as a result of higher structured settlement and terminal funding annuity premiums.
Interest credited to policyholder account balances decreased slightly in the first quarter of 2013 as a result of ongoing actions to actively manage interest crediting rates on new and renewal Group Retirement business and maintaining disciplined new business pricing.
Amortization of deferred acquisition costs was essentially unchanged in the first quarter of 2013 compared to the first quarter of 2012.
Other acquisition and insurance expenses increased in the first quarter of 2013 compared to the first quarter of 2012 due to higher marketing and distribution expenses associated with growth initiatives related to group retirement products and institutional markets.
Legal Settlements
In the first quarter of 2013, we recorded income of $108 million from a settlement with a financial institution that participated in the creation, offering and sale of RMBS from which AIG and its subsidiaries realized losses during the financial crisis.
106
ITEM 2 / RESULTS OF OPERATIONS
Changes in Fair Value of Fixed Maturity Securities Designated to Hedge Living Benefit Liabilities
AIG Life and Retirement has a dynamic hedging program designed to manage economic risk exposure associated with changes in equity markets, interest rates and volatilities related to embedded derivative liabilities contained in guaranteed benefit features of variable annuities. We substantially hedge our exposure to equity markets. However, due to regulatory capital considerations, a portion of our interest rate exposure is unhedged. In the first quarter of 2012, we began purchasing U.S. Treasury bonds as a capital-efficient strategy to reduce our interest rate risk exposure over time. As a result of increases in interest rates on U.S. Treasury securities, the fair value of the U.S. Treasury securities used for hedging, net of financing costs, decreased by $29 million.
Net Realized Capital Gains (Losses)
Net realized capital gains were $156 million in the first quarter of 2013 compared to a loss of $466 million in the first quarter of 2012. While gains from sales activity were comparable to 2012, results were positively impacted by foreign currency transaction gains in the first quarter of 2013, lower other-than-temporary impairments and lower fair value losses on variable annuity embedded derivatives, net of hedges. The large embedded derivative losses in 2012 were primarily due to declining credit spreads in the first quarter of 2012.
Changes in Benefit Reserves and DAC, VOBA and SIA Related to Net Realized Capital Gains (Losses)
In conjunction with a program to utilize capital loss tax carryforwards, we sold investments in the first quarter of both 2013 and 2012. These and other sales with subsequent reinvestment at lower yields triggered loss recognition on certain long-term payout annuity contracts of $102 million in the first quarter of 2013, and $87 million in the same period of 2012, which effectively transferred shadow loss recognition from unrealized (included in AOCI) to actual loss recognition (included in Policyholder benefits and claims incurred) and, to a much lesser extent, transferred shadow DAC (included in AOCI) to Amortization of deferred acquisition costs. Additional sales of such securities are contemplated in the remainder of 2013, which could result in additional loss recognition. Assumptions related to investment yields, mortality experience and expenses are reviewed periodically and updated as appropriate, which could also result in additional loss recognition reserves. In addition, due to the reinvestment of the assets at lower yields, earnings related to this payout annuity block of business are expected to decline in the reminder of 2013.
The following table summarizes the major components of the changes in AIG Life and Retirement DAC/VOBA:
|
|
|
|
|||||
|---|---|---|---|---|---|---|---|
|
Three Months Ended March 31,
(in millions) |
2013
|
2012
|
|||||
|
Balance, beginning of year |
$
|
5,672
|
|
$ | 6,502 | ||
|
Acquisition costs deferred |
|
179
|
|
197 | |||
|
Amortization expense |
|
(153
|
)
|
(164 | ) | ||
|
Change in net unrealized gains on securities |
|
(259
|
)
|
(251 | ) | ||
|
Other |
|
(5
|
)
|
– | |||
|
Balance, end of period |
$
|
5,434
|
|
$ | 6,284 | ||
Because AIG Life and Retirement operates in various markets, the estimated gross profits used to amortize DAC and VOBA are subject to differing market returns and interest yield assumptions in any single period. The combination of market returns and interest rates may lead to acceleration of amortization in some products and simultaneous deceleration of amortization in other products.
DAC and VOBA for insurance-oriented, investment-oriented and group retirement products are reviewed for recoverability, which involves estimating the future profitability of current business. This review involves significant judgment. See Note 10 to the Consolidated Financial Statements in the 2012 Annual Report for additional information on DAC and VOBA recoverability.
107
ITEM 2 / RESULTS OF OPERATIONS
Premiums
Premiums represent amounts received on traditional life insurance policies, group benefit policies and deposits on life-contingent payout annuities. Premiums and deposits is a non-GAAP financial measure that includes life insurance premiums and deposits on annuity contracts, GICs and mutual funds.
The following table presents a reconciliation of premiums and deposits to GAAP premiums:
|
|
|
|
|||||
|---|---|---|---|---|---|---|---|
|
Three Months Ended March 31,
(in millions) |
2013
|
2012
|
|||||
|
Premiums and deposits |
$
|
5,580
|
|
$ | 5,560 | ||
|
Deposits |
|
(4,804
|
)
|
(4,794 | ) | ||
|
Other |
|
(156
|
)
|
(152 | ) | ||
|
Premiums |
$
|
620
|
|
$ | 614 | ||
The following table presents the components of premiums and deposits by line of business for AIG Life and Retirement:
|
|
|
|
|
|||||||
|---|---|---|---|---|---|---|---|---|---|---|
|
Three Months Ended March 31,
(in millions) |
2013
|
2012
|
Percentage
Change |
|||||||
|
Premiums and deposits: |
|
|
|
|||||||
|
Retail |
|
|
|
|||||||
|
Life Insurance & A&H |
$
|
835
|
|
$ | 832 | – | % | |||
|
Fixed Annuities |
|
376
|
|
584 | (36 | ) | ||||
|
Retirement Income Solutions |
|
1,413
|
|
1,159 | 22 | |||||
|
Retail Mutual Funds |
|
833
|
|
749 | 11 | |||||
|
Closed Blocks |
|
29
|
|
39 | (26 | ) | ||||
|
Total Retail |
$
|
3,486
|
|
$ | 3,363 | 4 | % | |||
|
Institutional |
|
|
|
|||||||
|
Group Retirement |
$
|
1,740
|
|
$ | 1,844 | (6 | )% | |||
|
Institutional Markets |
|
181
|
|
181 | – | |||||
|
Group Benefits |
|
173
|
|
172 | 1 | |||||
|
Total Institutional |
|
2,094
|
|
2,197 | (5 | ) | ||||
|
Total premiums and deposits |
$
|
5,580
|
|
$ | 5,560 | – | % | |||
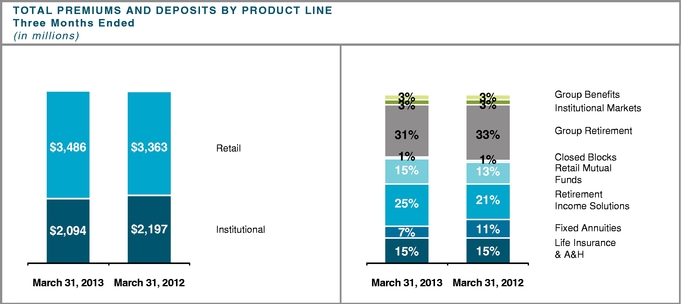
108
ITEM 2 / RESULTS OF OPERATIONS
Total premiums and deposits were essentially unchanged in the first quarter of 2013 compared to the first quarter of 2012, as significant increases in retirement income solutions were offset by substantial decreases in fixed annuities.
Retirement income solutions deposits increased due to innovative product enhancements and expanded distribution as well as a more favorable competitive environment. Retail mutual fund sales increased in the first quarter of 2013 compared to the first quarter of 2012, principally driven by SunAmerica Asset Management Corp.'s Focused Dividend Strategy product offering. Fixed annuity deposits continued to be negatively affected by the sustained low interest rate environment as consumers are reluctant to purchase these products at the relatively low crediting rates currently offered. Group retirement deposits (which include deposits into mutual funds and fixed options within variable annuities sold in group retirement markets) decreased due to lower levels of individual rollover deposits and periodic deposits in the first quarter of 2013 compared to the first quarter of 2012, partially offset by higher mutual fund deposits. The low interest rate environment has affected group retirement deposits, resulting in lower levels of deposits into fixed options. Premiums from life insurance products were unchanged in the first quarter of 2013 compared to the first quarter of 2012.
Net Flows
The following table summarizes net flows for fixed annuities, retirement income solutions, retail mutual funds and group retirement:
|
|
|
|
|||||
|---|---|---|---|---|---|---|---|
|
Three Months Ended March 31,
(in millions) |
2013
|
2012
|
|||||
|
Net flows* |
|
|
|
||||
|
Fixed annuities |
$
|
(999
|
)
|
$ | (818 | ) | |
|
Retirement income solutions |
|
571
|
|
335 | |||
|
Retail mutual funds |
|
301
|
|
370 | |||
|
Group retirement |
|
(117
|
)
|
227 | |||
|
Total net flows |
$
|
(244
|
)
|
$ | 114 | ||
* Annuities net flows represent premiums and deposits less death, surrender and other withdrawal benefits. Net flows on retail mutual funds are deposits less withdrawals. Net flows presented excludes net flows activity on certain closed blocks of fixed and variable annuities reserves totaling $6 billion.
Overall net flows were negative in the first quarter of 2013, primarily driven by lower deposits and higher surrenders for group retirement products driven by actions we took to mitigate a prolonged low interest rate environment. Net flows also declined due to lower fixed annuity deposits compared to the first quarter of 2012, resulting from the low interest rate environment. These decreases were offset by improvements in net flows for individual variable annuities due to both increases in deposits and favorable surrender experience.
109
ITEM 2 / RESULTS OF OPERATIONS
The following table presents AIG Life and Retirement insurance reserves and retail and group mutual funds:
|
|
|
|
|||||
|---|---|---|---|---|---|---|---|
|
Three Months Ended March 31,
(in millions) |
2013
|
2012
|
|||||
|
Retail |
|
|
|
||||
|
Balance at beginning of period, gross |
$
|
123,699
|
|
$ | 120,396 | ||
|
Premiums and deposits |
|
3,486
|
|
3,363 | |||
|
Surrenders and withdrawals |
|
(2,497
|
)
|
(2,371 | ) | ||
|
Death, and other contract benefits |
|
(795
|
)
|
(893 | ) | ||
|
Subtotal |
|
194
|
|
99 | |||
|
Change in fair value of underlying assets and reserve accretion, net of policy fees |
|
1,745
|
|
1,911 | |||
|
Cost of funds |
|
581
|
|
612 | |||
|
Other reserve changes |
|
486
|
|
(292 | ) | ||
|
Balance at end of period |
|
126,705
|
|
122,726 | |||
|
Reserves related to unrealized investment appreciation |
|
370
|
|
369 | |||
|
Reinsurance ceded |
|
(1,497
|
)
|
(1,535 | ) | ||
|
Total insurance reserves and mutual funds |
$
|
125,578
|
|
$ | 121,560 | ||
|
Institutional |
|
|
|
||||
|
Balance at beginning of period, gross |
$
|
110,494
|
|
$ | 103,315 | ||
|
Premiums and deposits |
|
2,094
|
|
2,197 | |||
|
Surrenders and withdrawals |
|
(3,012
|
)
|
(2,452 | ) | ||
|
Death, and other contract benefits |
|
(477
|
)
|
(498 | ) | ||
|
Subtotal |
|
(1,395
|
)
|
(753 | ) | ||
|
Change in fair value of underlying assets and reserve accretion, net of policy fees |
|
3,093
|
|
3,928 | |||
|
Cost of funds |
|
398
|
|
410 | |||
|
Other reserve changes |
|
12
|
|
(76 | ) | ||
|
Balance at end of period |
|
112,602
|
|
106,824 | |||
|
Reserves related to unrealized investment appreciation |
|
2,004
|
|
1,895 | |||
|
Reinsurance ceded |
|
(222
|
)
|
(269 | ) | ||
|
Total insurance reserves and mutual funds |
$
|
114,384
|
|
108,450 | |||
|
Total AIG Life and Retirement: |
|
|
|
||||
|
Balance at beginning of period, gross |
$
|
234,193
|
|
$ | 223,711 | ||
|
Premiums and deposits |
|
5,580
|
|
5,560 | |||
|
Surrenders and withdrawals |
|
(5,509
|
)
|
(4,823 | ) | ||
|
Death, and other contract benefits |
|
(1,272
|
)
|
(1,391 | ) | ||
|
Subtotal |
|
(1,201
|
)
|
(654 | ) | ||
|
Change in fair value of underlying assets and reserve accretion, net of policy fees |
|
4,838
|
|
5,839 | |||
|
Cost of funds |
|
979
|
|
1,022 | |||
|
Other reserve changes |
|
498
|
|
(368 | ) | ||
|
Balance at end of period |
|
239,307
|
|
229,550 | |||
|
Reserves related to unrealized investment appreciation |
|
2,374
|
|
2,264 | |||
|
Reinsurance ceded |
|
(1,719
|
)
|
(1,804 | ) | ||
|
Total insurance reserves and mutual funds |
$
|
239,962
|
|
$ | 230,010 | ||
110
ITEM 2 / RESULTS OF OPERATIONS
The following table presents selected reserves by surrender charge category and surrender rates:
|
|
2013 | 2012 | |||||||||||||||||
|---|---|---|---|---|---|---|---|---|---|---|---|---|---|---|---|---|---|---|---|
|
At March 31,
(in millions) |
Group
|
Individual
|
Retirement
|
Group
Retirement Products * |
Individual
Fixed Annuities |
Retirement
Income Solutions |
|||||||||||||
|
No surrender charge |
$
|
57,739
|
|
$
|
28,938
|
|
$
|
13,019
|
|
$ | 55,668 | $ | 24,097 | $ | 12,233 | ||||
|
0% – 2% |
|
1,356
|
|
|
2,688
|
|
|
4,656
|
|
1,369 | 3,735 | 4,490 | |||||||
|
Greater than 2% – 4% |
|
1,505
|
|
|
3,483
|
|
|
2,131
|
|
1,246 | 4,588 | 2,420 | |||||||
|
Greater than 4% |
|
5,097
|
|
|
20,153
|
|
|
12,941
|
|
4,367 | 25,295 | 9,354 | |||||||
|
Non-surrenderable |
|
664
|
|
|
2,921
|
|
|
860
|
|
480 | 3,292 | 527 | |||||||
|
Total reserves |
$
|
66,361
|
|
$
|
58,183
|
|
$
|
33,607
|
|
$ | 63,130 | $ | 61,007 | $ | 29,024 | ||||
|
Surrender rates |
|
9.0
|
%
|
|
6.6
|
%
|
|
8.9
|
%
|
8.4 | % | 6.3 | % | 11.6 | % | ||||
* Excludes mutual funds of $12.8 billion and $10.7 billion at March 31, 2013 and 2012, respectively.
Low Interest Rate Environment
A variety of factors affect AIG Life and Retirement's businesses, and the life insurance and annuity industry in general, during a prolonged low interest rate environment. Declining interest rates result in higher fair values of assets backing insurance and annuity liabilities and may result in improved persistency of certain lines of business. A sustained low interest rate environment may also result in lower sales of fixed annuities and other products and lower net investment spreads as portfolio cash flows are reinvested at lower rates (spread compression). We have taken a number of actions to mitigate these impacts, as discussed below.
AIG Life and Retirement has addressed the impact of sustained low interest rates with a number of actions taken on both the asset and liability sides of our balance sheet:
- •
-
Opportunistic investment in structured securities to increase yields
- •
-
Continued disciplined approach to new business pricing
- •
-
Active management of renewal credited rates
- •
-
Re-priced certain life insurance and annuity products to reflect current low rate environment
- •
-
Re-filed certain products to continue lowering minimum rate guarantees
- •
- Included product limits where appropriate to minimize exposure to low interest rates
As a result of these actions, we estimate that the effect of interest rates remaining at or near current levels through the end of 2013 on pre-tax operating income would not be material, and would be modestly more significant with respect to 2014 results.
Opportunistic Investments: The majority of assets backing insurance and annuity liabilities consists of intermediate- and long-term fixed maturity securities. We generally purchase assets with the intent of matching expected maturities of the insurance liabilities. An extended low interest rate environment may result in a lengthening of liability maturities from initial estimates, primarily due to lower lapses. Opportunistic investments in structured securities, private placement corporate debt securities and mortgage loans continue to be made to improve yields, increase net investment income and help to offset the impact of the lower interest rate environment.
Disciplined New Business Pricing: New fixed annuity sales have declined in the first quarter of 2013 relative to the first quarter of 2012, due to the relatively low crediting rates offered as a result of our disciplined approach to new business. However, even in the current interest rate environment, we continue to pursue new sales of life and annuity products at targeted net investment spreads. New sales of fixed annuity products generally have minimum interest rate guarantees of 1 percent. Universal life insurance interest rate guarantees are generally 2 to 3 percent on
111
ITEM 2 / RESULTS OF OPERATIONS
new non-indexed products and 1 percent on new indexed products, and are designed to be sufficient to meet targeted net investment spreads.
Active Management of Renewal Credited Rates: The contractual provisions for renewal of crediting rates and guaranteed minimum crediting rates included in our products may have the effect, in a continued low interest rate environment, of reducing our spreads and thus reducing future profitability. Although we partially mitigate this interest rate risk through our asset-liability management process, product design elements and crediting rate strategies, a prolonged low interest rate environment may negatively affect future profitability. Our annuity and universal life products were designed with contractual provisions that allow crediting rates to be reset at pre-established intervals subject to minimum crediting rate guarantees. We have adjusted, and will continue to adjust crediting rates to maintain targeted net investment spreads on both new business and in-force business where crediting rates are above minimum guarantees. In addition to annuity and universal life products, certain traditional long-duration products for which we do not have the ability to adjust interest rates, such as payout annuities, are exposed to reduced earnings and potential reserve increases in a prolonged low interest rate environment.
As indicated in the table below, approximately 73 percent of our annuity and universal life account values are at their minimum crediting rates as of March 31, 2013, an increase from 61 percent at December 31, 2012. These products have minimum guaranteed interest rates as of March 31, 2013 ranging from 1 percent to 5.5 percent, with the higher rates representing guarantees on older products.
|
|
Current Crediting Rates | ||||||||||||
|---|---|---|---|---|---|---|---|---|---|---|---|---|---|
|
March 31, 2013
Contractual Minimum Guaranteed Interest Rate Account Values (in millions) |
At Contractual
Minimum Guarantee |
1-50 Basis Points
Above Minimum Guarantee |
More than 50 Basis
Points Above Minimum Guarantee |
Total
|
|||||||||
|
Universal life insurance |
|||||||||||||
|
1% |
$ | 30 | $ | – | $ | 7 | $ | 37 | |||||
|
> 1% – 2% |
– | 33 | 239 | 272 | |||||||||
|
> 2% – 3% |
369 | 279 | 1,309 | 1,957 | |||||||||
|
> 3% – 4% |
2,131 | 325 | 1,413 | 3,869 | |||||||||
|
> 4% – 5% |
4,318 | 181 | 4 | 4,503 | |||||||||
|
> 5% – 5.5% |
322 | – | – | 322 | |||||||||
|
Subtotal |
$ | 7,170 | $ | 818 | $ | 2,972 | $ | 10,960 | |||||
|
Fixed annuities |
|||||||||||||
|
1% |
$ | 1,853 | $ | 3,808 | $ | 5,405 | $ | 11,066 | |||||
|
> 1% – 2% |
12,071 | 3,715 | 7,070 | 22,856 | |||||||||
|
> 2% – 3% |
32,471 | 315 | 4,433 | 37,219 | |||||||||
|
> 3% – 4% |
14,060 | 158 | 203 | 14,421 | |||||||||
|
> 4% – 5% |
8,163 | – | 7 | 8,170 | |||||||||
|
> 5% – 5.5% |
236 | – | 5 | 241 | |||||||||
|
Subtotal |
$ | 68,854 | $ | 7,996 | $ | 17,123 | $ | 93,973 | |||||
|
Total |
$ | 76,024 | $ | 8,814 | $ | 20,095 | $ | 104,933 | |||||
|
Percentage of total |
73 | % | 8 | % | 19 | % | 100 | % | |||||
Effective Product Management: AIG Life and Retirement has a dynamic product management process designed to ensure that new business product offerings appropriately reflect the current low interest rate environment. To the extent that we cannot achieve targeted net investment spreads on new business, products are re-priced or no longer sold. Additionally, current products with higher minimum rate guarantees have been re-filed with lower rates as permitted under state insurance product regulations.
Other Operations
AIG's Other operations include results from Mortgage Guaranty, GCM, DIB, Retained Interests and Corporate & Other (after allocations to AIG's business segments) as presented below.
112
ITEM 2 / RESULTS OF OPERATIONS
Mortgage Guaranty (United Guaranty Corporation or UGC) offers private residential mortgage guaranty insurance, which protects mortgage lenders and investors from loss due to borrower default and loan foreclosure. The coverage we provide — which is called mortgage guaranty insurance, mortgage insurance, or simply "MI" — enables borrowers to purchase a house with a modest down payment. This is because MI protects lenders against the increased risk of borrower default related to high loan-to-value (LTV) mortgages — those with less than 20 percent equity. In short, MI lets lenders provide more mortgage loans to more people.
Global Capital Markets (GCM) consists of the operations of AIG Markets and the remaining derivatives portfolio of AIGFP. AIG Markets acts as the derivatives intermediary between AIG and its subsidiaries and third parties to provide hedging services. The AIGFP portfolio continues to be wound down and is managed consistent with AIG's risk management objectives. Although the portfolio may experience periodic fair value volatility, it consists predominantly of transactions that AIG believes are of low complexity, low risk, or are currently not economically appropriate to unwind based on a cost versus benefit analysis.
Direct Investment Book (DIB) consists of a portfolio of assets and liabilities held directly by AIG Parent in the MIP and certain subsidiaries not related to AIG's core insurance operations (including certain non-derivative assets and liabilities of AIGFP). The management of the DIB portfolio is focused on an orderly wind down to maximize returns consistent with AIG's risk management objectives. Certain non-derivative assets and liabilities of the DIB are accounted for under the fair value option and thus operating results are subject to periodic market volatility.
Retained Interests includes the fair value gains or losses, prior to their sale in 2012, of the AIA ordinary shares retained following the AIA initial public offering and the fair value gains or losses, prior to the FRBNY liquidation of ML III assets in 2012, on the retained interest in ML III.
Corporate & Other consists primarily of interest expense, intercompany interest income that is eliminated in consolidation, expenses of corporate staff not attributable to specific reportable segments, certain expenses related to internal controls and the financial and operating platforms, corporate initiatives, certain compensation plan expenses, corporate level net realized capital gains and losses, certain litigation-related charges and credits, the results of AIG's real estate investment operations and net gains and losses on sale of divested businesses and properties that did not meet the criteria for discontinued operations accounting treatment.
Other Operations Results
The following table presents AIG's Other operations results:
|
Three Months Ended March 31,
(in millions) |
2013
|
2012
|
Percentage
Change |
|||||||
|---|---|---|---|---|---|---|---|---|---|---|
|
Mortgage Guaranty |
$
|
41
|
|
$ | 8 | 413 | % | |||
|
Global Capital Markets |
|
227
|
|
92 | 147 | |||||
|
Direct Investment book |
|
329
|
|
(156 | ) | NM | ||||
|
Retained interests: |
|
|
|
|||||||
|
Change in fair value of AIA securities, including realized gain in 2012 |
|
–
|
|
1,795 | NM | |||||
|
Change in fair value of ML III |
|
–
|
|
1,252 | NM | |||||
|
Corporate & Other: |
|
|
|
|||||||
|
Other interest expense |
|
(397
|
)
|
(381 | ) | (4 | ) | |||
|
Corporate expenses, net |
|
(261
|
)
|
(173 | ) | (51 | ) | |||
|
Real estate and other non-core businesses |
|
(92
|
)
|
(112 | ) | 18 | ||||
|
Total Corporate & Other operating loss |
|
(750
|
)
|
(666 | ) | (13 | ) | |||
|
Consolidation and eliminations |
|
1
|
|
3 | (67 | ) | ||||
|
Total Other operations operating income (loss) |
|
(152
|
)
|
2,328 | NM | |||||
|
Legal reserves |
|
(11
|
)
|
(6 | ) | (83 | ) | |||
|
Legal settlements |
|
2
|
|
– | NM | |||||
|
Loss on extinguishment of debt |
|
(340
|
)
|
– | NM | |||||
|
Net realized capital gains |
|
87
|
|
417 | (79 | ) | ||||
|
Net loss on sale of divested businesses |
|
–
|
|
(3 | ) | NM | ||||
|
Total Other operations pre-tax income (loss) |
$
|
(414
|
)
|
$ | 2,736 | NM | % | |||
113
ITEM 2 / RESULTS OF OPERATIONS

In the first quarter of 2013, we recorded income from a settlement with a financial institution that participated in the creation, offering and sale of RMBS from which AIG and its subsidiaries realized losses during the financial crisis.
Mortgage Guaranty
The following table presents Mortgage Guaranty results:
|
Three Months Ended March 31,
(dollars in millions) |
2013
|
2012
|
Percentage
Change |
|||||||
|---|---|---|---|---|---|---|---|---|---|---|
|
Underwriting results: |
|
|
|
|||||||
|
Net premiums written |
$
|
246
|
|
$ | 191 | 29 | % | |||
|
Increase in unearned premiums |
|
(52
|
)
|
(22 | ) | (136 | ) | |||
|
Net premiums earned |
|
194
|
|
169 | 15 | |||||
|
Claims and claims adjustment expenses incurred |
|
131
|
|
145 | (10 | ) | ||||
|
Underwriting expenses |
|
56
|
|
47 | 19 | |||||
|
Underwriting income (loss) |
|
7
|
|
(23 | ) | NM | ||||
|
Net investment income |
|
34
|
|
31 | 10 | |||||
|
Operating income |
|
41
|
|
8 | 413 | |||||
|
Net realized capital gains (losses) |
|
3
|
|
– | NM | |||||
|
Pre-tax income |
$
|
44
|
|
$ | 8 | 450 | % | |||
|
Key metrics: |
|
|
|
|||||||
|
New insurance written |
$
|
10,626
|
|
$ | 6,563 | 62 | % | |||
|
Domestic first-lien: |
|
|
|
|||||||
|
Risk in force |
$
|
30,138
|
|
$ | 25,886 | |||||
|
60+ day delinquency ratio on primary loans (a) |
|
7.9
|
%
|
11.4 | % | |||||
|
Domestic second-lien: |
|
|
|
|||||||
|
Risk in force (b) |
$
|
1,212
|
|
$ | 1,431 | |||||
(a) Based on number of policies.
(b) Represents the full amount of second-lien loans insured reduced for contractual aggregate loss limits on certain pools of loans, usually 10 percent of the full amount of loans insured in each pool. Certain second-lien pools have reinstatement provisions, which will expire as the loan balances are repaid.
114
ITEM 2 / RESULTS OF OPERATIONS
|
|
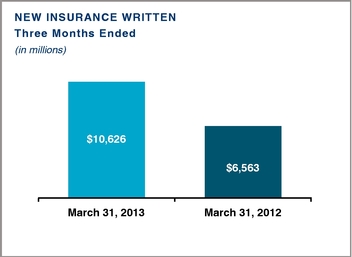
|
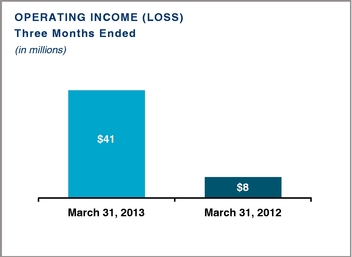
Mortgage Guaranty recorded an increase in operating income in the first quarter of 2013 compared to the first quarter of 2012 primarily due to:
- •
-
a $25 million increase in net premiums earned, due to an increase in first-lien premiums earned, of
which $37 million reflects the growth in first-lien insurance written over the last several quarters, partially offset by a decline on second-lien and international
businesses, both of which were placed into run-off during 2008;
- •
-
a $14 million decrease in claims and claims adjustment expenses incurred in the first quarter of 2013 compared to
the first quarter of 2012, primarily due to the following;
- •
-
a $24 million decline in second-lien and student loan business claims and claims adjustment expenses
that reflected a decrease in net claims and claims adjustment expenses paid in both lines of business as collections of recoveries on prior paid losses remained strong and more contracts reached their
respective stop loss limits; and
- •
- a partial offset due to a $12 million increase in first-lien claims and claims adjustment expenses in the first quarter of 2013 that reflected a 20 percent lower level of newly reported delinquencies.
New insurance written, which represents the original principal balance of the insured mortgages, was approximately $10.6 billion and $6.6 billion in the first quarters of 2013 and 2012, respectively. The increase in new insurance written is the result of the market acceptance of UGC's risk-based pricing model by an increasing number of lenders as well as the addition and expansion of distribution channels. See Outlook — Other Operations — Mortgage Guaranty for further discussion.
Global Capital Markets Operations
GCM's pre-tax and operating income increased in the first quarter of 2013 compared to the first quarter of 2012 primarily due to improvement in net credit valuation adjustments on the GCM derivative assets and liabilities, improvement in unrealized market valuations related to the super senior credit default swap (CDS) portfolio and a decrease in operating expenses.
Net credit valuation adjustment gains of $53 million and net credit valuation adjustment losses of $22 million were recognized for the first quarter of 2013 and 2012, respectively. The improvement resulted primarily from lower losses on derivative liabilities, partially offset by lower gains on derivative assets due to less significant tightening of both AIG's credit spreads and counterparty credit spreads in the first quarter of 2013 than in the first quarter of 2012.
Unrealized market valuation gains of $171 million and $140 million were recognized for the first quarter of 2013 and 2012, respectively. The improvement resulted primarily from CDS transactions written on multi-sector CDOs driven by amortization and price movements within the CDS portfolio.
115
ITEM 2 / RESULTS OF OPERATIONS
Direct Investment Book Results
The following table presents Direct Investment book results:
|
Three Months Ended March 31,
(in millions) |
2013
|
2012
|
Percentage
Change |
|||||||
|---|---|---|---|---|---|---|---|---|---|---|
|
Operating income (loss) |
$
|
329
|
|
$ | (156 | ) | NM | |||
|
Net realized capital gains (losses) |
|
(13
|
)
|
404 | NM | |||||
|
Loss on extinguishment of debt |
|
(4
|
)
|
– | NM | |||||
|
Pre-tax income |
$
|
312
|
|
$ | 248 | 26 | % | |||
Pre-tax income
Pre-tax income increased in the first quarter of 2013 compared to the first quarter of 2012 due to an improvement in net credit valuation adjustments on the DIB assets and liabilities for which the fair value option was elected and fair value appreciation on fair value option hybrid bonds that were acquired in the fourth quarter of 2012, partially offset by lower net realized capital gains (losses). Net credit valuation adjustment gains of $226 million and net credit valuation adjustment losses of $191 million were recognized for the first quarter of 2013 and 2012, respectively. The improvement resulted primarily from lower losses on liabilities, partially offset by lower gains on assets due to less significant tightening of both AIG's credit spreads and counterparty credit spreads in the first quarter of 2013 than in the first quarter of 2012.
The change in Net realized capital gains (losses) was driven by realized capital gains of $426 million on the sale of 35.7 million common units of The Blackstone Group L.P. in the first quarter of 2012.
Operating Income (Loss)
The DIB reported operating income in 2013 compared to an operating loss in 2012 primarily due to the improvement in net credit valuation adjustments and fair value appreciation discussed above.
The following table presents credit valuation adjustment gains (losses) for the DIB (excluding intercompany transactions):
|
Three Months Ended March 31,
(in millions) |
2013
|
2012
|
|||||
|---|---|---|---|---|---|---|---|
|
Counterparty Credit Valuation Adjustment on Assets: |
|
|
|
||||
|
Bond trading securities |
$
|
250
|
|
$ | 354 | ||
|
Loans and other assets |
|
10
|
|
13 | |||
|
Increase in assets |
|
260
|
|
367 | |||
|
AIG's Own Credit Valuation Adjustment on Liabilities: |
|
|
|
||||
|
Notes and bonds payable |
|
(22
|
)
|
(201 | ) | ||
|
Hybrid financial instrument liabilities |
|
(14
|
)
|
(242 | ) | ||
|
Guaranteed Investment Agreements |
|
5
|
|
(90 | ) | ||
|
Other liabilities |
|
(3
|
)
|
(25 | ) | ||
|
Decrease in liabilities |
|
(34
|
)
|
(558 | ) | ||
|
Net increase (decrease) to operating income |
$
|
226
|
|
$ | (191 | ) | |
Retained Interests
Change in Fair Value of AIA Securities Prior to Their Sale
On March 7, 2012, AIG sold approximately 1.72 billion ordinary shares of AIA and recognized a gain of $0.6 billion. The fair value of AIG's remaining interest in AIA securities increased $1.2 billion during the first quarter of 2012.
Change in Fair Value of ML III Prior to Liquidation
The gain attributable to AIG's interest in ML III for the first quarter of 2012 was generally due to tightening credit spreads.
116
ITEM 2 / RESULTS OF OPERATIONS
Corporate & Other
Corporate & Other reported higher operating losses in the first quarter of 2013 compared to the first quarter of 2012 due to an increase in compensation and restructuring expenses. Also, the first quarter of 2012 included a reduction in expense of $36 million resulting from settlements of the liability for the Department of the Treasury's underwriting fees for the sale of AIG Common Stock at amounts lower than had been estimated at the time the accrual was established.
Discontinued Operations
Income (loss) from Discontinued Operations is comprised of the following:
|
Three Months Ended March 31,
(in millions) |
2013
|
2012
|
|||||
|---|---|---|---|---|---|---|---|
|
ILFC |
$
|
596
|
|
$ | 118 | ||
|
Net gain (loss) on sale |
|
(436
|
)
|
20 | |||
|
Income from discontinued operations |
|
160
|
|
138 | |||
|
Income tax expense |
|
67
|
|
74 | |||
|
Income from discontinued operations, net of tax |
$
|
93
|
|
$ | 64 | ||
Significant items affecting the comparison of results from discontinued operations included pre-tax income of $596 million and a pre-tax loss of $553 million on the sale of ILFC, both reflecting the absence of depreciation and amortization expense because ILFC is classified as held for sale, and a pre-tax gain of $117 million in connection with the sale of American Life Insurance Company (ALICO) as a result of a refund of taxes, interest and penalties recognized in the first quarter of 2013.
See Note 4 to the Condensed Consolidated Financial Statements for further discussion of discontinued operations.
Consolidated Comprehensive Income (Loss)
The following table presents AIG's consolidated comprehensive income (loss):
|
|
|
|
|
|||||||
|---|---|---|---|---|---|---|---|---|---|---|
|
Three Months Ended March 31,
(in millions) |
2013
|
2012
|
Percentage
Change |
|||||||
|
Net income |
$
|
2,231
|
|
$ | 3,449 | (35 | )% | |||
|
Change in unrealized appreciation (depreciation) of investments |
|
(1,193
|
)
|
2,711 | NM | |||||
|
Change in deferred acquisition costs adjustment and other |
|
(311
|
)
|
(379 | ) | 18 | ||||
|
Change in future policy benefits |
|
424
|
|
34 | NM | |||||
|
Change in foreign currency translation adjustments |
|
(293
|
)
|
87 | NM | |||||
|
Change in net derivative gains arising from cash flow hedging activities |
|
–
|
|
4 | NM | |||||
|
Change in retirement plan liabilities adjustment |
|
43
|
|
29 | 48 | |||||
|
Deferred tax asset (liability) |
|
595
|
|
(761 | ) | NM | ||||
|
Other comprehensive income (loss) |
|
(735
|
)
|
1,725 | NM | |||||
|
Comprehensive income |
|
1,496
|
|
5,174 | (71 | ) | ||||
|
Total comprehensive income attributable to noncontrolling interests |
|
25
|
|
246 | (90 | ) | ||||
|
Comprehensive income attributable to AIG |
$
|
1,471
|
|
$ | 4,928 | (70 | )% | |||
Change in Unrealized Appreciation of Investments
The decrease for the first quarter of 2013 was primarily attributable to depreciation in bonds available for sale due to higher rates on investment grade fixed maturity securities partially offset by narrowing spreads of high yield securities.
117
The increase for the first quarter of 2012 was primarily attributable to appreciation in bonds available for sale due to continued improvements in financial market conditions and significant spread tightening partially offset by higher U.S. treasury rates.
Change in Deferred Acquisition Costs Adjustment and Other
The change in DAC in the first quarter of 2013 compared to the first quarter of 2012 is primarily the result of increases in the unrealized appreciation of investments supporting interest-sensitive products.
Change in Future Policy Benefits
The change in future policy benefits reserves in the first quarter of 2013 and first quarter 2012 is due to loss reserve recognition in net income resulting from sales of securities in unrealized gain positions as well as decreases in unrealized gains resulting from declines in long term rates. Changes in unrealized appreciation of investments results in changes to future policy benefits which are recorded through Other comprehensive income. This change in future policy benefits assumes that the securities underlying certain traditional long-duration products are sold at their stated aggregate fair value and reinvested at current yields.
Change in Foreign Currency Translation Adjustments
The net loss in the first quarter of 2013 was due to the strengthening of the U.S. dollar against the euro, British pound and Japanese yen.
Change in Net Derivative Gains (Losses) Arising from Cash Flow Hedging Activities
The decline primarily reflects the de-designation of all derivatives receiving cash flow hedging treatment in 2012.
Change in Retirement Plan Liabilities Adjustment
The increase for the first quarter of 2013 compared to the first quarter of 2012 was primarily due to the strengthening of the U.S. dollar.
Deferred Taxes on Other Comprehensive Income
In the first quarter of 2013, the effective tax rate on pre-tax Other comprehensive loss was 44.7 percent. The effective tax rate differs from the statutory 35 percent rate primarily due to tax effects associated with a decrease in the valuation allowance and the effect of foreign operations.
For the first quarter of 2012, the effective tax rate on pre-tax Other comprehensive income was 30.6 percent. The effective tax rate differs from the statutory 35 percent rate primarily due to the effect of foreign operations.
118
ITEM 2 / LIQUIDITY AND CAPITAL RESOURCES
Liquidity and Capital Resources
Liquidity refers to the ability to generate sufficient cash resources to meet our payment obligations. It is defined as cash and unencumbered assets that can be monetized in a short period of time at a reasonable cost. We manage our liquidity prudently through various risk committees, policies and procedures, and a stress testing and liquidity framework established by Enterprise Risk Management (ERM). Our liquidity framework is designed to measure both the amount and composition of our liquidity to meet financial obligations in both normal and stressed markets. See Part II, Item 7. MD&A — Enterprise Risk Management — Risk Appetite, Identification, and Measurement in the 2012 Annual Report and Enterprise Risk Management — Liquidity Risk Management below for additional information.
Capital refers to the long-term financial resources available to support the operation of our businesses, fund business growth, and cover financial and operational needs that arise from adverse circumstances. Our primary source of ongoing capital generation is the profitability of our insurance subsidiaries. We and our insurance subsidiaries must comply with numerous constraints on our minimum capital positions. These constraints drive the requirements for capital adequacy for both the consolidated company and the individual businesses and are based on internally-defined risk tolerances, regulatory requirements, rating agency and creditor expectations and business needs. Actual capital levels are monitored on a regular basis, and using ERM's stress testing methodology, we evaluate the capital impact of potential macroeconomic, financial and insurance stresses in relation to the relevant capital constraints of both the consolidated company and our insurance subsidiaries.
We believe that we have sufficient liquidity and capital resources to satisfy future requirements and meet our obligations to policyholders, customers, creditors and debt-holders, including reasonably foreseeable contingencies or events.
Nevertheless, some circumstances may cause our cash or capital needs to exceed projected liquidity or capital resources. Additional collateral calls, deterioration in investment portfolios or reserve strengthening affecting statutory surplus, higher surrenders of annuities and other policies, downgrades in credit ratings, or catastrophic losses may result in significant additional cash or capital needs, loss of some sources of liquidity or capital, or both. In addition, regulatory, and other legal restrictions could limit our ability to transfer funds freely, either to or from our subsidiaries.
Depending on market conditions, regulatory and rating agency considerations and other factors, we may take various liability and capital management actions. Liability management actions may include, but are not limited to repurchasing or redeeming outstanding debt, issuing new debt or engaging in debt exchange offers. Capital management actions may include, but are not limited to, paying dividends to our shareholders, share purchases and acquisitions.
119
ITEM 2 / LIQUIDITY AND CAPITAL RESOURCES
Liquidity and Capital Resources Management Highlights First Quarter 2013
Sources
- •
- AIG Parent Funding from Subsidiaries
During the first quarter of 2013, we collected approximately $1.3 billion in cash dividends and loan repayments from AIG Life and Retirement subsidiaries.
Uses
- •
-
Debt Reduction
We repaid an aggregate total of $2.9 billion of debt as follows:
We redeemed $1.1 billion aggregate principal amount of our 7.70% Series A-5 Junior Subordinated Debentures Due 2047 for a redemption price of 100 percent of the principal amount plus accrued interest.
We purchased, in cash tender offers, for an aggregate purchase price of approximately $1.3 billion (an aggregate principal amount of approximately $1.0 billion), junior subordinated debentures we issued, capital securities issued by three statutory trusts controlled by AIGLH and senior debentures we had assumed that were originally issued by SunAmerica Inc.
We also made other repayments of $0.8 billion which includes repayments by AIG Parent of $190 million.
- •
- Purchase of Warrants
We paid approximately $25 million to purchase warrants previously issued in 2008 and 2009 to the Department of the Treasury.
See Liquidity and Capital Resources of AIG Parent and Subsidiaries — AIG Parent — Sources and Uses of Liquidity and Capital Resources of AIG Parent herein for further discussion.
Analysis of Sources and Uses of Cash
The following table presents selected data from AIG's Consolidated Statement of Cash Flows:
|
|
|
|
|||||
|---|---|---|---|---|---|---|---|
|
Three Months Ended March 31,
(in millions) |
2013
|
2012
|
|||||
|
Sources: |
|
|
|
||||
|
Net cash used in operating activities — continuing operations |
$
|
(777
|
)
|
$ | (494 | ) | |
|
Net cash provided by operating activities — discontinued operations |
|
628
|
|
588 | |||
|
Net cash provided by other investing activities |
|
3,972
|
|
10,542 | |||
|
Issuance of other long-term debt |
|
131
|
|
2,230 | |||
|
Net cash provided by other financing activities |
|
208
|
|
1,588 | |||
|
Total sources |
|
4,162
|
|
14,454 | |||
|
Uses: |
|
|
|
||||
|
Changes in restricted cash |
|
(8
|
)
|
(561 | ) | ||
|
Changes in policyholder contract balances |
|
(1,196
|
)
|
(420 | ) | ||
|
Repayments of other long-term debt |
|
(2,861
|
)
|
(1,994 | ) | ||
|
Repayment of Department of Treasury SPV Preferred Interests |
|
–
|
|
(8,636 | ) | ||
|
Purchases of AIG Common Stock |
|
–
|
|
(3,000 | ) | ||
|
Total uses |
|
(4,065
|
)
|
(14,611 | ) | ||
|
Effect of exchange rate changes on cash |
|
(36
|
)
|
(2 | ) | ||
|
Increase (decrease) in cash |
$
|
61
|
|
$ | (159 | ) | |
120
ITEM 2 / LIQUIDITY AND CAPITAL RESOURCES
The following table presents a summary of AIG's Consolidated Statement of Cash Flows:
|
|
|
|
|||||
|---|---|---|---|---|---|---|---|
|
Three Months Ended March 31,
(in millions) |
2013
|
2012
|
|||||
|
Summary: |
|
|
|
||||
|
Net cash provided by (used in) operating activities |
$
|
(149
|
)
|
$ | 94 | ||
|
Net cash provided by (used in) investing activities |
|
3,964
|
|
9,981 | |||
|
Net cash provided by (used in) financing activities |
|
(3,718
|
)
|
(10,232 | ) | ||
|
Effect of exchange rate changes on cash |
|
(36
|
)
|
(2 | ) | ||
|
Increase (decrease) in cash |
|
61
|
|
(159 | ) | ||
|
Cash at beginning of year |
|
1,151
|
|
1,474 | |||
|
Change in cash of businesses held for sale |
|
15
|
|
– | |||
|
Cash at end of period |
$
|
1,227
|
|
$ | 1,315 | ||
Operating Cash Flow Activities
Interest payments totaled $1.0 billion in the first quarter of 2013 compared to $0.9 billion in the first quarter of 2012. Excluding interest payments, AIG generated positive operating cash flow of $0.8 billion and $1.0 billion in the first quarter of 2013 and 2012, respectively.
Insurance companies generally receive most premiums in advance of the payment of claims or policy benefits. The ability of insurance companies to generate positive cash flow is affected by the frequency and severity of losses under their insurance policies, policy retention rates and operating expenses.
Cash used in operating activities of AIG Property Casualty was $0.7 billion in the first quarter of 2013 compared to $0.2 billion in the first quarter of 2012, primarily reflecting the claim payments associated with Storm Sandy.
Cash provided by operating activities of AIG Life and Retirement was $0.4 billion in the first quarter of 2013 compared to $0.1 billion in the first quarter of 2012, primarily reflecting efforts to actively manage spread income.
Cash provided by operating activities of discontinued operations was $0.6 billion for both the first quarter of 2013 and 2012.
Investing Cash Flow Activities
Net cash provided by investing activities for the first quarter of 2013 includes approximately $1.1 billion of cash collateral received in connection with the securities lending program launched during 2012 by AIG Life and Retirement.
Net cash provided by investing activities in the first quarter of 2012 includes the following items:
- •
-
approximately $1.6 billion in distributions from the sale of the underlying assets held by ML II; and
- •
- approximately $6.0 billion in gross proceeds from the sale of 1.72 billion AIA ordinary shares.
Financing Cash Flow Activities
Net cash used in financing activities during the first quarter of 2013 includes:
- •
-
approximately $1.1 billion to redeem our 7.70% Series A-5 Junior Subordinated Debentures
Due 2047; and
- •
- approximately $1.3 billion in the aggregate to purchase, in cash tender offers, junior subordinated debentures we issued, capital securities issued by three statutory trusts controlled by AIGLH and senior debentures we had assumed that were originally issued by SunAmerica Inc.
121
ITEM 2 / LIQUIDITY AND CAPITAL RESOURCES
Net cash used in financing activities during the first quarter of 2012 includes:
- •
-
$8.6 billion pay down of the Department of the Treasury's AIA SPV preferred
interests;
- •
-
$3.0 billion payment for the purchase of 103 million shares of AIG Common
Stock;
- •
-
repayments of $1.2 billion of DIB long-term debt; and
- •
- issuances of $2.0 billion of AIG debt to fund the MIP.
Liquidity and Capital Resources of AIG Parent and Subsidiaries
AIG Parent
As of March 31, 2013, AIG Parent had approximately $15.0 billion in liquidity resources. AIG Parent's liquidity resources are held in the form of cash, short-term investments and publicly traded, investment grade rated fixed maturity securities. Fixed maturity securities consist of U.S. government and government sponsored entity securities, U.S. agency mortgage-backed securities, and corporate and municipal bonds. AIG Parent actively manages its assets and liabilities in terms of products, counterparties and tenor. During the first quarter of 2013, upon an assessment of its immediate and longer-term funding needs, AIG Parent purchased these publicly traded, intermediate term, investment grade rated fixed maturity securities that can be readily monetized through sales or repurchase agreements. These securities allow us to diversify sources of liquidity while reducing the cost of maintaining sufficient liquidity. AIG Parent liquidity resources are monitored through the use of various internal liquidity risk measures. AIG Parent's primary sources of liquidity are dividends, distributions, and other payments from subsidiaries, as well as credit and contingent liquidity facilities. AIG Parent's primary uses of liquidity are for debt service, capital and liability management, operating expenses and subsidiary capital needs.
AIG Parent's primary sources of capital are dividends and distributions from subsidiaries. AIG Parent has unconditional capital maintenance agreements (CMAs) in place with certain AIG Property Casualty and AIG Life and Retirement subsidiaries to facilitate the transfer of capital and liquidity within the consolidated company. We expect these CMAs to continue to enhance AIG's capital management practices, and help manage the flow of capital between AIG Parent and these subsidiaries. We have entered into and expect to enter into additional CMAs with certain other insurance companies in 2013. See AIG Property Casualty and AIG Life and Retirement below for additional information. Nevertheless, regulatory and other legal restrictions could limit our ability to transfer capital freely, either to or from our subsidiaries.
We believe that we have sufficient liquidity and capital resources to satisfy future requirements and meet our obligations to our creditors, debt-holders and insurance company subsidiaries. We expect to access the debt markets from time to time to meet funding requirements as needed.
The following table presents AIG Parent's liquidity:
|
(In millions)
|
As of
|
|||
|---|---|---|---|---|
|
Cash and short-term investments (a)(b) |
$
|
9,121
|
|
|
|
Unencumbered fixed maturity securities (c) |
|
2,329
|
|
|
|
Available capacity under syndicated credit facility (d) |
|
3,037
|
|
|
|
Available capacity under contingent liquidity facility (e) |
|
500
|
|
|
|
Total AIG Parent liquidity sources |
$
|
14,987
|
|
|
(a) Cash and short-term investments include reverse repurchase agreements totaling $7.5 billion as of March 31, 2013.
(b) $5.5 billion is allocated toward future maturities of liabilities and contingent liquidity stress needs of DIB and GCM as of March 31, 2013.
(c) Unencumbered securities consist of publicly traded intermediate-term investment grade rated fixed maturity securities. Fixed maturity securities consist of U.S. government and government sponsored entities securities, U.S. agency mortgage-backed securities, and corporate and municipal bonds.
(d) For additional information relating to this syndicated credit facility, see Credit Facilities below.
(e) For additional information relating to the contingent liquidity facility, see Contingent Liquidity Facilities below.
122
ITEM 2 / LIQUIDITY AND CAPITAL RESOURCES
Sources and Uses of Liquidity and Capital Resources of AIG Parent
Sources
During the first quarter of 2013, we collected approximately $1.3 billion in cash dividends and loan repayments from AIG Life and Retirement subsidiaries.
Uses
During the first quarter of 2013, we:
- •
-
redeemed $1.1 billion aggregate principal amount of our 7.70% Series A-5 Junior
Subordinated Debentures Due 2047 for a redemption price of 100 percent of the principal amount plus accrued and unpaid interest;
- •
-
purchased, in cash tender offers:
- •
-
for an aggregate purchase price of approximately $1 billion, approximately 77 million British pounds
aggregate principal amount of our 8.625% Series A-8 Junior Subordinated Debentures, approximately 182 million Euro aggregate principal amount of our 8.000%
Series A-7 Junior Subordinated Debentures, approximately $79 million aggregate principal amount of our 6.25% Series A-1 Junior Subordinated
Debentures and approximately $366 million aggregate principal amount of our 8.175% Series A-6 Junior Subordinated Debentures;
- •
-
for an aggregate purchase price of approximately $211 million, approximately $19 million liquidation amount
of 8
1
/
2
% Capital Trust Pass-Through Securities, approximately $114 million liquidation amount of 7.57% Capital Securities, Series A and approximately
$29 million liquidation amount of 8
1
/
8
% Capital Securities, Series B, all of which were issued by statutory trusts controlled by AIGLH; and
- •
-
for an aggregate purchase price of approximately $61 million, approximately $62 million aggregate principal
amount of 5.60% Senior Debentures we had assumed that were originally issued by SunAmerica Inc.;
- •
- repaid $190 million of debt, including $181 million of MIP long-term debt, and made interest payments totaling $434 million; and paid approximately $25 million in the aggregate to purchase a warrant issued to the Department of the Treasury in 2008 that provided the right to purchase approximately 2.7 million shares of AIG Common Stock at $50.00 per share and a warrant issued to the Department of Treasury in 2009 that provided the right to purchase up to 150 shares of AIG Common Stock at $0.00002 per share.
AIG Property Casualty
We expect that AIG Property Casualty subsidiaries will be able to continue to satisfy future liquidity requirements and meet their obligations, including those arising from reasonably foreseeable contingencies or events, through cash from operations and, to the extent necessary, dispositions of invested assets. AIG Property Casualty subsidiaries maintain substantial liquidity in the form of cash and short-term investments, totaling $6.3 billion as of March 31, 2013. Further, AIG Property Casualty subsidiaries maintain significant levels of investment-grade fixed maturity securities, including substantial holdings in government and corporate bonds, which could be monetized in the event liquidity levels are deemed insufficient.
AIG Property Casualty paid no dividends to AIG Parent in the first quarter of 2013. AIG Property Casualty paid cash and non-cash dividends totaling $1.0 billion to AIG Parent in the first quarter of 2012.
AIG Parent could be required to provide additional funding to AIG Property Casualty subsidiaries to meet capital or liquidity needs under certain circumstances, including:
- •
-
large catastrophes that may require AIG to provide additional support to our affected operations;
- •
- downgrades in AIG's credit ratings that could put pressure on the insurer financial strength ratings of AIG's subsidiaries which could result in non-renewals or cancellations by policyholders and adversely affect the subsidiary's ability to meet its own obligations;
123
ITEM 2 / LIQUIDITY AND CAPITAL RESOURCES
- •
-
increases in market interest rates that may adversely affect the financial strength ratings of our subsidiaries, as rating
agency capital models may reduce the amount of available capital relative to required capital; and
- •
- other potential events that could cause a liquidity strain, including economic collapse of a nation or region significant to our operations, nationalization, catastrophic terrorist acts, pandemics or other events causing economic or political upheaval.
In February 2012, AIG Parent, AIG Property Casualty Inc. (formerly known as Chartis Inc.) and certain AIG Property Casualty domestic insurance subsidiaries, entered into a consolidated CMA.
Among other things, the CMA provides that AIG Parent will maintain the total adjusted capital of these AIG Property Casualty insurance subsidiaries, measured as a group (the Fleet), at or above the specified minimum percentage of the Fleet's projected total authorized control level Risk-Based Capital (RBC) (as defined by NAIC guidelines and determined based on the subsidiaries' statutory financial statements). As a result, the CMA provides that if the total adjusted capital of the Fleet falls below the specified minimum percentage of the Fleet's total authorized control level RBC, AIG Parent will contribute cash or other instruments admissible under applicable regulations to AIG Property Casualty Inc., which will further contribute such funds to the AIG Property Casualty subsidiaries in the amount necessary to increase the Fleet's total adjusted capital to a level at least equal to such specified minimum percentage. Any required contribution under the CMA would generally be made during the second and fourth quarters of each year; however, AIG Parent may also make contributions in such amounts and at such times as it deems appropriate. In addition, the CMA provides that if the total adjusted capital of the Fleet exceeds that same specified minimum percentage of the Fleet's total authorized control level RBC, subject to approval by their respective boards, the AIG Property Casualty insurance subsidiaries would declare and pay ordinary dividends to their respective equity holders up to an amount that is the lesser of:
(i) the amount (to be determined by AIG Property Casualty Inc.) necessary to reduce the Fleet's projected or actual total adjusted capital to a level equal to or not materially greater than such specified minimum percentage or
(ii) the maximum amount of ordinary dividends permitted under applicable insurance law.
The CMA does not prohibit, however, the payment of extraordinary dividends, subject to board or regulatory approval, to reduce the Fleet's projected or actual total adjusted capital to a level equal to or not materially greater than the specified minimum percentage. Any required dividend under the CMA would generally be made on a quarterly basis. As structured, the CMA contemplates that the specified minimum percentage would be reviewed and agreed upon at least annually. On February 20, 2013, the CMA was amended to exclude deferred tax assets from the calculation of total adjusted capital. As a result, the specified minimum percentage decreased from 350 percent to 325 percent.
For the first quarter of 2013, no dividends were paid pursuant to the CMA and AIG Parent was not required to make any capital contributions pursuant to the CMA.
National Union Fire Insurance Company of Pittsburgh, Pa. (NUFI) is a member of the Federal Home Loan Bank (FHLB) of Pittsburgh and Chartis Specialty Insurance Company (CSI) is a member of the FHLB of Chicago. FHLB membership provides participants with access to various services, including access to low-cost advances through pledging of certain mortgage-backed securities, government and agency securities and other qualifying assets. These advances may be used to provide an additional source of liquidity for balance sheet management or contingency funding purposes. As of March 31, 2013, neither NUFI nor CSI had any advances outstanding under their respective FHLB facilities.
On April 29 2013, we entered into a new $625 million Ascot Corporate Name Limited (ACNL) letter of credit facility, which replaced the prior $725 million ACNL letter of credit facility. Under the new facility, AIG Parent replaced AIG Property Casualty Inc. as a direct obligor. ACNL, as a member of the Lloyd's of London insurance syndicate (Lloyd's), is required to hold capital at Lloyd's, known as Funds at Lloyds (FAL). Under the new facility, which supports the 2013, 2014 and 2015 years of account, the entire FAL requirement of $564 million, as of April 29, 2013, was satisfied with a letter of credit issued under the facility.
124
ITEM 2 / LIQUIDITY AND CAPITAL RESOURCES
AIG Life and Retirement
We believe that AIG Life and Retirement subsidiaries have liquidity sources adequate to satisfy future liquidity requirements and meet their obligations, including those arising from reasonably foreseeable contingencies or events, through cash from operations and, to the extent necessary, dispositions of invested assets. The AIG Life and Retirement subsidiaries maintain liquidity in the form of cash and short-term investments, totaling $7.6 billion as of March 31, 2013. In the first quarter of 2013, AIG Life and Retirement provided $1.3 billion of liquidity to AIG Parent which was funded by the payment of dividends from AIG Life and Retirement's insurance subsidiaries.
The need to fund product surrenders, withdrawals and maturities creates a significant potential liquidity requirement for AIG Life and Retirement's insurance subsidiaries. We believe that because of the size and liquidity of our investment portfolios, AIG Life and Retirement does not face a significant liquidity risk due to normal deviations from projected claim or surrender experience. As part of its risk management framework, AIG Life and Retirement continues to evaluate programs, including securities lending programs and other secured financings, to improve its liquidity position and facilitate AIG Life and Retirement's ability to maintain a fully invested asset portfolio.
During 2012, AIG Life and Retirement began utilizing programs that lend securities from its investment portfolio to supplement liquidity or for other uses as deemed appropriate by management. Under these programs, the AIG Life and Retirement insurance subsidiaries lend securities to financial institutions and receive collateral equal to 102 percent of the fair value of the loaned securities. Reinvestment of cash collateral received is restricted to highly liquid short-term investments. AIG Life and Retirement's liability to the borrower for collateral received was $4.1 billion as of March 31, 2013. In addition, certain AIG Life and Retirement insurance subsidiaries are members of the FHLBs in their respective districts. As of March 31, 2013, AIG Life and Retirement had outstanding borrowings of $50 million from the FHLBs. Borrowings from the FHLBs are used to supplement liquidity or for other general corporate purposes.
In March 2011, AIG Parent entered into CMAs with certain AIG Life and Retirement insurance subsidiaries. Among other things, the CMAs provide that AIG Parent will maintain the total adjusted capital of each of these AIG Life and Retirement insurance subsidiaries at or above a specified minimum percentage of the subsidiary's projected company action level RBC. As a result, the CMAs provide that if the total adjusted capital of these AIG Life and Retirement insurance subsidiaries falls below the specified minimum percentage of their respective company action level RBC, AIG Parent will contribute cash or instruments admissible under applicable regulations to these AIG Life and Retirement insurance subsidiaries in the amount necessary to increase total adjusted capital to a level at least equal to such specified minimum percentage. Any required contribution under the CMAs would generally be made during the second and fourth quarters of each year; however, AIG Parent may also make contributions in such amounts and at such times as it deems appropriate.
In addition, the CMAs provide that if the total adjusted capital of these AIG Life and Retirement insurance subsidiaries is in excess of that same specified minimum percentage of their respective total company action level RBC, subject to approval by their respective boards, the subsidiaries would declare and pay ordinary dividends to their respective equity holders up to an amount that is the lesser of:
- •
-
(i) the amount necessary to reduce projected or actual total adjusted capital to a level equal to or not materially
greater than such specified minimum percentage, or
- •
- (ii) the maximum amount of ordinary dividends permitted under applicable insurance law.
The CMAs do not prohibit, however, the payment of extraordinary dividends, subject to board and regulatory approval, to reduce projected or actual total adjusted capital to a level equal to or not materially greater than the specified minimum percentage. Any required dividend under the CMAs would generally be made on a quarterly basis. As structured, the CMAs contemplate that the specified minimum percentage would be reviewed and agreed upon at least annually. As a result of a reduction in rating agency minimum requirements and greater capital efficiency arising from the consolidation of legal entities, the specified minimum percentage decreased from 435 percent to 385 percent effective February 19, 2013, except for the CMA with AGC Life Insurance Company, where the specified minimum percentage remained at 250 percent.
In the first quarter of 2013, AIG Parent received a total of approximately $1.3 billion in distributions from AIG Life and Retirement subsidiaries funded by the payment of dividends from AIG Life and Retirement insurance subsidiaries, which were made under the CMAs. AIG Parent was not required to make any capital contributions to AIG Life and Retirement insurance subsidiaries in the first quarter of 2013 under the CMAs.
125
ITEM 2 / LIQUIDITY AND CAPITAL RESOURCES
Other Operations
Mortgage Guaranty
We currently expect that our Mortgage Guaranty subsidiaries will be able to continue to satisfy future liquidity requirements and meet their obligations, including requirements arising out of reasonably foreseeable contingencies or events, through cash from operations and, to the extent necessary, dispositions of invested assets. Mortgage Guaranty subsidiaries maintain substantial liquidity in the form of cash and short-term investments, totaling $419 million as of March 31, 2013. Mortgage Guaranty businesses also maintain significant levels of investment-grade fixed maturity securities, which could be monetized in the event liquidity levels are insufficient to meet obligations. These securities included substantial holdings in municipal and corporate bonds totaling $3.7 billion at March 31, 2013.
Global Capital Markets
GCM acts as the derivatives intermediary between AIG and its subsidiaries and third parties to provide hedging services. It executes its derivative trades under International Swaps and Derivatives Association, Inc. (ISDA) agreements. The agreements with third parties typically require collateral postings. Many of GCM's transactions with AIG and its subsidiaries also include collateral posting requirements. However, generally, no collateral is called under these contracts unless it is needed to satisfy posting requirements with third parties. Most of GCM's CDS are subject to collateral posting provisions. These provisions differ among counterparties and asset classes. The amount of future collateral posting requirements is a function of our credit ratings, the rating of the reference obligations and the market value of the relevant reference obligations, with the latter being the most significant factor. We estimate the amount of potential future collateral postings associated with the super senior CDS using various methodologies. The contingent liquidity requirements associated with such potential future collateral postings are incorporated into our liquidity planning assumptions.
As of March 31, 2013 and December 31, 2012, respectively, GCM had total assets of $8.6 billion and $8.0 billion and total liabilities of $4.2 billion and $4.9 billion. GCM's assets consist primarily of cash, short-term investments, other receivables, net of allowance, and unrealized gains on swaps, options and forwards. GCM's liabilities consist primarily of trade payables and unrealized losses on swaps, options and forwards. Collateral posted included in GCM to third parties was $3.9 billion and $4.2 billion at March 31, 2013 and December 31, 2012, respectively. GCM obtained collateral from third parties totaling $751 million and $846 million at March 31, 2013 and December 31, 2012, respectively. The collateral amounts reflect counterparty netting adjustments available under master netting agreements and are inclusive of collateral that exceeded the fair value of derivatives as of the reporting date.
Direct Investment Book
The DIB is managed so that it maintains the liquidity that we believe is necessary to meet all of the DIB liabilities as they come due, even under stress scenarios, without having to liquidate DIB assets or rely on additional liquidity from AIG Parent. If the DIB's risk target is breached, we expect to take appropriate actions to increase the DIB's liquidity sources or reduce liquidity requirements to maintain the risk target, although no assurance can be given that this can be achieved under then-prevailing market conditions. Any additional liquidity shortfalls would need to be funded by AIG Parent.
The DIB's assets consist primarily of cash, short term investments, fixed maturity securities issued by U.S. government and government sponsored entities, mortgage and asset backed securities and, to a lesser extent, bank loans and mortgage loans. The DIB's liabilities consist primarily of notes and other borrowings supported by assets as well as other short — term financing obligations. As of March 31, 2013 and December 31, 2012, respectively, the DIB had total assets of $26.4 billion and $28.5 billion and total liabilities of $22.7 billion and $23.8 billion.
The overall hedging activity for the assets and liabilities of the DIB is executed by GCM. The value of hedges related to the non-derivative assets and liabilities of AIGFP in the DIB is included within the assets and liabilities and operating results of GCM and are not included within the DIB operating results, assets or liabilities.
Collateral posted by operations included in the DIB to third parties was $4.3 billion at both March 31, 2013 and December 31, 2012. This collateral primarily consists of securities of the U.S. government and government sponsored entities and generally cannot be repledged or resold by the counterparties.
126
ITEM 2 / LIQUIDITY AND CAPITAL RESOURCES
We maintain a committed revolving four-year syndicated credit facility (the Four-Year Facility) as a potential source of liquidity for general corporate purposes. The Four-Year Facility also provides for the issuance of letters of credit. We currently expect to replace or extend the Four-Year Facility on or prior to its expiration in October 2016, although no assurance can be given that the Four-Year Facility will be replaced on favorable terms or at all.
The Four-Year Facility, entered into on October 5, 2012, provides for $4.0 billion of unsecured revolving loans, which includes a $2.0 billion letter of credit sublimit. As of March 31, 2013, a total of approximately $3.0 billion remains available under the Four-Year Facility, of which approximately $1.0 billion remains available for letters of credit. Our ability to borrow under the Four-Year Facility is not contingent on our credit ratings. However, our ability to borrow under the Four-Year Facility is conditioned on the satisfaction of certain legal, operating, administrative and financial covenants and other requirements contained in the Four-Year Facility. These include covenants relating to our maintenance of a specified total consolidated net worth and total consolidated debt to total consolidated capitalization. Failure to satisfy these and other requirements contained in the Four-Year Facility would restrict our access to the Four-Year Facility and could have a material adverse effect on our financial condition, results of operations and liquidity. We expect to borrow under the Four-Year Facility from time to time, and may use the proceeds for general corporate purposes.
Contingent Liquidity Facilities
AIG Parent has access to a contingent liquidity facility of up to $500 million as a potential source of liquidity for general corporate purposes. Under this facility, we have the unconditional right, prior to December 15, 2015, to issue up to $500 million in senior debt to the counterparty, based on a put option agreement between AIG Parent and the counterparty.
Our ability to borrow under this facility is not contingent on our credit ratings.
The following table summarizes contractual obligations in total, and by remaining maturity:
|
|
|
Payments due by Period | |||||||||||||||||
|---|---|---|---|---|---|---|---|---|---|---|---|---|---|---|---|---|---|---|---|
|
March 31, 2013
(in millions) |
Total
Payments |
Remainder
of 2013 |
2014-
2015 |
2016-
2017 |
2018
|
Thereafter
|
|||||||||||||
|
Insurance operations |
|||||||||||||||||||
|
Loss reserves |
$ | 89,016 | $ | 23,005 | $ | 25,475 | $ | 13,152 | $ | 4,275 | $ | 23,109 | |||||||
|
Insurance and investment contract liabilities |
232,785 | 12,469 | 26,084 | 24,854 | 11,314 | 158,064 | |||||||||||||
|
Borrowings |
1,603 | 8 | 47 | 9 | 3 | 1,536 | |||||||||||||
|
Interest payments on borrowings |
2,869 | 69 | 224 | 225 | 113 | 2,238 | |||||||||||||
|
Other long-term obligations |
34 | 7 | 14 | 8 | 5 | – | |||||||||||||
|
Total |
$ | 326,307 | $ | 35,558 | $ | 51,844 | $ | 38,248 | $ | 15,710 | $ | 184,947 | |||||||
|
Other and discontinued operations |
|||||||||||||||||||
|
Borrowings (a) |
$ | 65,927 | $ | 5,349 | $ | 11,523 | $ | 15,808 | $ | 9,989 | $ | 23,258 | |||||||
|
Interest payments on borrowings |
42,017 | 2,835 | 6,686 | 5,284 | 1,851 | 25,361 | |||||||||||||
|
Aircraft purchase commitments |
17,673 | 1,350 | 4,546 | 7,366 | 3,988 | 423 | |||||||||||||
|
Other long-term obligations |
210 | 30 | 90 | 2 | – | 88 | |||||||||||||
|
Total |
$ | 125,827 | $ | 9,564 | $ | 22,845 | $ | 28,460 | $ | 15,828 | $ | 49,130 | |||||||
|
Consolidated |
|||||||||||||||||||
|
Loss reserves |
$ | 89,016 | $ | 23,005 | $ | 25,475 | $ | 13,152 | $ | 4,275 | $ | 23,109 | |||||||
|
Insurance and investment contract liabilities |
232,785 | 12,469 | 26,084 | 24,854 | 11,314 | 158,064 | |||||||||||||
|
Borrowings (a) |
67,530 | 5,357 | 11,570 | 15,817 | 9,992 | 24,794 | |||||||||||||
|
Interest payments on borrowings |
44,886 | 2,904 | 6,910 | 5,509 | 1,964 | 27,599 | |||||||||||||
|
Aircraft purchase commitments |
17,673 | 1,350 | 4,546 | 7,366 | 3,988 | 423 | |||||||||||||
|
Other long-term obligations (b) |
244 | 37 | 104 | 10 | 5 | 88 | |||||||||||||
|
Total (c) |
$ | 452,134 | $ | 45,122 | $ | 74,689 | $ | 66,708 | $ | 31,538 | $ | 234,077 | |||||||
(a) Includes $24.1 billion of borrowings related to ILFC.
(b) Primarily includes contracts to purchase future services and other capital expenditures.
(c) Does not reflect unrecognized tax benefits of $4.9 billion ($4.6 billion excluding Aircraft Leasing), the timing of which is uncertain.
127
ITEM 2 / LIQUIDITY AND CAPITAL RESOURCES
Insurance and Investment Contract Liabilities
Insurance and investment contract liabilities, including GIC liabilities, relate to AIG Life and Retirement businesses. These liabilities include various investment-type products with contractually scheduled maturities, including periodic payments of a term certain nature. These liabilities also include benefit and claim liabilities, of which a significant portion represents policies and contracts that do not have stated contractual maturity dates and may not result in any future payment obligations. For these policies and contracts (i) we are currently not making payments until the occurrence of an insurable event, such as death or disability, (ii) payments are conditional on survivorship or (iii) payment may occur due to a surrender or other non-scheduled event out of our control.
We have made significant assumptions to determine the estimated undiscounted cash flows of these contractual policy benefits. These assumptions include mortality, morbidity, future lapse rates, expenses, investment returns and interest crediting rates, offset by expected future deposits and premiums on in-force policies. Due to the significance of the assumptions, the periodic amounts presented could be materially different from actual required payments. The amounts presented in this table are undiscounted and exceed the future policy benefits and policyholder contract deposits included in the Condensed Consolidated Balance Sheet.
We believe that AIG Life and Retirement subsidiaries have adequate financial resources to meet the payments actually required under these obligations. These subsidiaries have substantial liquidity in the form of cash and short-term investments. In addition, AIG Life and Retirement businesses maintain significant levels of investment-grade fixed income securities, including substantial holdings in government and corporate bonds, and could seek to monetize those holdings in the event operating cash flows are insufficient. We expect liquidity needs related to GIC liabilities to be funded through cash flows generated from maturities and sales of invested assets.
Loss reserves relate to the AIG Property Casualty and the Mortgage Guaranty businesses, and represent future loss and loss adjustment expense payments estimated based on historical loss development payment patterns. Due to the significance of the assumptions used, the payments by period presented above could be materially different from actual required payments. We believe that AIG Property Casualty and Mortgage Guaranty subsidiaries maintain adequate financial resources to meet the actual required payments under these obligations.
Borrowings
Our borrowings exclude those incurred by consolidated investments and include hybrid financial instrument liabilities recorded at fair value. We expect to repay the long-term debt maturities and interest accrued on borrowings by AIG and its subsidiaries through maturing investments and dispositions of invested assets, future cash flows from operations, cash flows generated from invested assets, future debt issuance and other financing arrangements.
128
ITEM 2 / LIQUIDITY AND CAPITAL RESOURCES
Off-Balance Sheet Arrangements and Commercial Commitments
The following table summarizes Off-Balance Sheet Arrangements and Commercial Commitments in total, and by remaining maturity:
|
|
|
Amount of Commitment Expiring | |||||||||||||||||
|---|---|---|---|---|---|---|---|---|---|---|---|---|---|---|---|---|---|---|---|
|
March 31, 2013
(in millions) |
Total Amounts
Committed |
Remainder
of 2013 |
2014-
2015 |
2016-
2017 |
2018
|
Thereafter
|
|||||||||||||
|
Insurance operations |
|||||||||||||||||||
|
Guarantees: |
|||||||||||||||||||
|
Standby letters of credit |
$ | 832 | $ | 262 | $ | – | $ | 565 | $ | – | $ | 5 | |||||||
|
Guarantees of indebtedness |
176 | – | – | – | – | 176 | |||||||||||||
|
All other guarantees (a) |
17 | 7 | 7 | 1 | – | 2 | |||||||||||||
|
Commitments: |
|||||||||||||||||||
|
Investment commitments (b) |
1,845 | 1,462 | 212 | 171 | – | – | |||||||||||||
|
Commitments to extend credit |
564 | 522 | 42 | – | – | – | |||||||||||||
|
Letters of credit |
10 | 3 | 7 | – | – | – | |||||||||||||
|
Other commercial commitments (c) |
699 | – | – | – | – | 699 | |||||||||||||
|
Total (e) |
$ | 4,143 | $ | 2,256 | $ | 268 | $ | 737 | $ | – | $ | 882 | |||||||
|
Other and discontinued operations |
|||||||||||||||||||
|
Guarantees: |
|||||||||||||||||||
|
Liquidity facilities (d) |
$ | 101 | $ | – | $ | – | $ | – | $ | – | $ | 101 | |||||||
|
Standby letters of credit |
307 | 299 | 6 | 2 | – | – | |||||||||||||
|
All other guarantees (a) |
392 | 6 | 180 | 79 | 31 | 96 | |||||||||||||
|
Commitments: |
|||||||||||||||||||
|
Investment commitments (b) |
393 | 302 | 65 | 26 | – | – | |||||||||||||
|
Commitments to extend credit |
91 | 87 | 3 | – | – | 1 | |||||||||||||
|
Letters of credit |
21 | 21 | – | – | – | – | |||||||||||||
|
Other commercial commitments (c) |
7 | 5 | 2 | – | – | – | |||||||||||||
|
Total (e) (f) |
$ | 1,312 | $ | 720 | $ | 256 | $ | 107 | $ | 31 | $ | 198 | |||||||
|
Consolidated |
|||||||||||||||||||
|
Guarantees: |
|||||||||||||||||||
|
Liquidity facilities (d) |
$ | 101 | $ | – | $ | – | $ | – | $ | – | $ | 101 | |||||||
|
Standby letters of credit |
1,139 | 561 | 6 | 567 | – | 5 | |||||||||||||
|
Guarantees of indebtedness |
176 | – | – | – | – | 176 | |||||||||||||
|
All other guarantees (a) |
409 | 13 | 187 | 80 | 31 | 98 | |||||||||||||
|
Commitments: |
|||||||||||||||||||
|
Investment commitments (b) |
2,238 | 1,764 | 277 | 197 | – | – | |||||||||||||
|
Commitments to extend credit |
655 | 609 | 45 | – | – | 1 | |||||||||||||
|
Letters of credit |
31 | 24 | 7 | – | – | – | |||||||||||||
|
Other commercial commitments (c) |
706 | 5 | 2 | – | – | 699 | |||||||||||||
|
Total (e) (f) |
$ | 5,455 | $ | 2,976 | $ | 524 | $ | 844 | $ | 31 | $ | 1,080 | |||||||
(a) Includes residual value guarantees associated with aircraft and AIG Life and Retirement construction guarantees connected to affordable housing investments. Excludes potential amounts for indemnification obligations included in asset sales agreements. See Note 10 to the Condensed Consolidated Financial Statements for further information on indemnification obligations.
(b) Includes commitments to invest in private equity funds, hedge funds and mutual funds and commitments to purchase and develop real estate in the United States and abroad. The commitments to invest in private equity funds, hedge funds and other funds are called at the discretion of each fund, as needed for funding new investments or expenses of the fund. The expiration of these commitments is estimated in the table above based on the expected life cycle of the related fund, consistent with past trends of requirements for funding. Investors under these commitments are primarily insurance and real estate subsidiaries.
(c) Excludes commitments with respect to pension plans. The remaining pension contribution for 2013 is expected to be approximately $63 million for U.S. and non-U.S. plans.
(d) Primarily represents liquidity facilities provided in connection with certain municipal swap transactions and collateralized bond obligations.
(e) Does not include guarantees, capital maintenance agreements or other support arrangements among AIG consolidated entities.
(f) Includes $338 million attributable to ILFC, which is reported as discontinued operations.
129
ITEM 2 / LIQUIDITY AND CAPITAL RESOURCES
Arrangements with Variable Interest Entities
While AIG enters into various arrangements with variable interest entities (VIEs) in the normal course of business, our involvement with VIEs is primarily as a passive investor in fixed maturity securities (rated and unrated) and equity interests issued by VIEs. We consolidate a VIE when we are the primary beneficiary of the entity. For a further discussion of our involvement with VIEs, see Note 8 to the Condensed Consolidated Financial Statements.
Indemnification Agreements
We are subject to financial guarantees and indemnity arrangements in connection with our sales of businesses. These arrangements may be triggered by declines in asset values, specified business contingencies, the realization of contingent liabilities, litigation developments, or breaches of representations, warranties or covenants provided by us. These arrangements are typically subject to time limitations, defined by the contract or by operation of law, such as by prevailing statutes of limitation. Depending on the specific terms of the arrangements, the maximum potential obligation may or may not be subject to contractual limitations. For additional information regarding our indemnification agreements, see Note 10 to the Condensed Consolidated Financial Statements.
We have recorded liabilities for certain of these arrangements where it is possible to estimate them. These liabilities are not material in the aggregate. We are unable to develop a reasonable estimate of the maximum potential payout under some of these arrangements. Overall, we believe that it is unlikely we will have to make any material payments related to completed sales under these arrangements.
The following table provides the rollforward of AIG's total debt outstanding:
|
|
|
|
|
|
|
|
|||||||||||||
|---|---|---|---|---|---|---|---|---|---|---|---|---|---|---|---|---|---|---|---|
|
Three Months Ended March 31, 2013
(in millions) |
Balance at
December 31, 2012 |
Issuances
|
Maturities
and Repayments |
Effect of
Foreign Exchange |
Other
Changes |
Balance at
|
|||||||||||||
|
Debt issued or guaranteed by AIG: |
|
|
|
||||||||||||||||
|
AIG general borrowings: |
|
|
|
||||||||||||||||
|
Notes and bonds payable |
$ | 14,084 | $ | – | $ | (62 | ) | $ | (165 | ) | $ | 13 |
$
|
13,870
|
|
||||
|
Subordinated debt |
250 | – | – | – | – |
|
250
|
|
|||||||||||
|
Junior subordinated debt |
9,416 | – | (1,904 | ) | (131 | ) | 2 |
|
7,383
|
|
|||||||||
|
Loans and mortgages payable |
79 | – | (1 | ) | – | – |
|
78
|
|
||||||||||
|
AIGLH notes and bonds payable |
298 | – | – | – | 1 |
|
299
|
|
|||||||||||
|
Liabilities connected to trust preferred stock |
1,339 | – | (245 | ) | – | – |
|
1,094
|
|
||||||||||
|
Total AIG general borrowings |
25,466 | – | (2,212 | ) | (296 | ) | 16 |
|
22,974
|
|
|||||||||
|
AIG borrowings supported by assets: (a) |
|
|
|
||||||||||||||||
|
MIP notes payable |
9,296 | – | (181 | ) | (158 | ) | (14 | ) |
|
8,943
|
|
||||||||
|
Series AIGFP matched notes and bonds
|
3,544 | – | (3 | ) | – | (8 | ) |
|
3,533
|
|
|||||||||
|
GIAs, at fair value |
6,501 | 95 | (152 | ) | – | (108 | ) (b) |
|
6,336
|
|
|||||||||
|
Notes and bonds payable, at fair value |
1,554 | 2 | (328 | ) | – | 99 | (b) |
|
1,327
|
|
|||||||||
|
Total AIG borrowings supported by assets |
20,895 | 97 | (664 | ) | (158 | ) | (31 | ) |
|
20,139
|
|
||||||||
|
Total debt issued or guaranteed by AIG |
46,361 | 97 | (2,876 | ) | (454 | ) | (15 | ) |
|
43,113
|
|
||||||||
|
Debt not guaranteed by AIG: |
|
|
|
||||||||||||||||
|
Other subsidiaries notes, bonds, loans and
|
325 | – | (32 | ) | (12 | ) | 23 |
|
304
|
|
|||||||||
|
Debt of consolidated investments (c) |
1,814 | 34 | (17 | ) | (27 | ) | 45 |
|
1,849
|
|
|||||||||
|
Total debt not guaranteed by AIG |
2,139 | 34 | (49 | ) | (39 | ) | 68 |
|
2,153
|
|
|||||||||
|
Total debt (d) |
$ | 48,500 | $ | 131 | $ | (2,925 | ) | $ | (493 | ) | $ | 53 |
$
|
45,266
|
|
||||
(a) AIG Parent guarantees all DIB debt, except for MIP notes payable and Series AIGFP matched notes and bonds payable, which are direct obligations of AIG Parent.
(b) Primarily represents adjustments to the fair value of debt.
(c) At March 31, 2013, includes debt of consolidated investments primarily held through AIG Global Real Estate Investment Corp., AIG Credit Corp. and AIG Life and Retirement of $1.5 billion, $164 million and $177 million, respectively.
(d) Excludes $24.1 billion related to ILFC as it is classified as a held for sale business at March 31, 2013.
130
ITEM 2 / LIQUIDITY AND CAPITAL RESOURCES
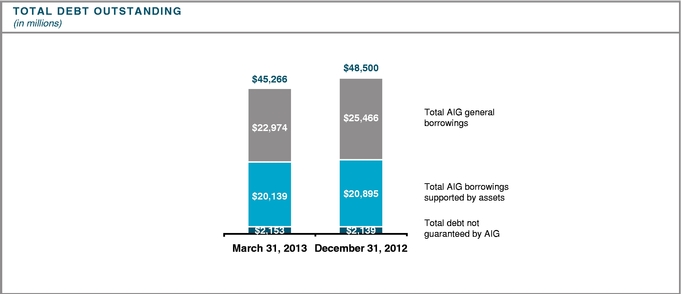
The decrease in total debt outstanding as of March 31, 2013, compared to December 31, 2012, was due to maturities and repayments of debt, including cash tender offers, a redemption and repurchases of certain securities discussed above.
Debt Maturities — AIG and Subsidiaries
The following table summarizes maturing debt at March 31, 2013 of AIG and its subsidiaries (excluding $1.8 billion of borrowings of consolidated investments) for the next four quarters:
|
(in millions)
|
Second
Quarter 2013 |
Third
Quarter 2013 |
Fourth
Quarter 2013 |
First
Quarter 2014 |
Total
|
|||||||||||
|---|---|---|---|---|---|---|---|---|---|---|---|---|---|---|---|---|
|
AIG general borrowings |
$ | 1,076 | $ | 1 | $ | 469 | $ | 500 | $ | 2,046 | ||||||
|
AIG borrowings supported by assets |
258 | 798 | 66 | 368 | 1,490 | |||||||||||
|
Other subsidiaries notes, bonds, loans and mortgages payable |
6 | 1 | 1 | 1 | 9 | |||||||||||
|
Total |
$ | 1,340 | $ | 800 | $ | 536 | $ | 869 | $ | 3,545 | ||||||
AIG borrowings supported by assets consisted of debt under the DIB. At March 31, 2013, all of the debt maturities in the DIB through March 31, 2014 are supported by short-term investments and maturing investments.
131
ITEM 2 / LIQUIDITY AND CAPITAL RESOURCES
The following table presents maturities of long-term debt (including unamortized original issue discount, hedge accounting valuation adjustments and fair value adjustments, when applicable), excluding $1.8 billion in borrowings of consolidated investments:
|
|
|
|
Year Ending | ||||||||||||||||||||||
|---|---|---|---|---|---|---|---|---|---|---|---|---|---|---|---|---|---|---|---|---|---|---|---|---|---|
|
March 31, 2013
(in millions) |
|
Remainder
of 2013 |
|||||||||||||||||||||||
|
Total
|
2014
|
2015
|
2016
|
2017
|
2018
|
Thereafter
|
|||||||||||||||||||
|
General borrowings: |
|||||||||||||||||||||||||
|
Notes and bonds payable |
$ | 13,870 | $ | 1,469 | $ | 500 | $ | 999 | $ | 1,710 | $ | 1,376 | $ | 2,493 | $ | 5,323 | |||||||||
|
Subordinated debt |
250 | – | – | 250 | – | – | – | – | |||||||||||||||||
|
Junior subordinated debt |
7,383 | – | – | – | – | – | – | 7,383 | |||||||||||||||||
|
Loans and mortgages payable |
78 | 77 | – | 1 | – | – | – | – | |||||||||||||||||
|
AIGLH notes and bonds
|
299 | – | – | – | – | – | – | 299 | |||||||||||||||||
|
Liabilities connected to trust
|
1,094 | – | – | – | – | – | – | 1,094 | |||||||||||||||||
|
AIG general borrowings |
22,974 | 1,546 | 500 | 1,250 | 1,710 | 1,376 | 2,493 | 14,099 | |||||||||||||||||
|
Borrowings supported by assets: |
|||||||||||||||||||||||||
|
MIP notes payable |
8,943 | 684 | 1,599 | 999 | 1,278 | 3,913 | 470 | – | |||||||||||||||||
|
Series AIGFP matched notes
|
3,533 | – | – | – | – | – | 3,241 | 292 | |||||||||||||||||
|
GIAs, at fair value |
6,336 | 257 | 577 | 596 | 317 | 254 | 665 | 3,670 | |||||||||||||||||
|
Notes and bonds payable, at
|
1,327 | 181 | 30 | 166 | 297 | 115 | 160 | 378 | |||||||||||||||||
|
AIG borrowings supported by
|
20,139 | 1,122 | 2,206 | 1,761 | 1,892 | 4,282 | 4,536 | 4,340 | |||||||||||||||||
|
Other subsidiaries notes, bonds,
|
304 | 8 | 3 | 45 | 3 | 6 | 4 | 235 | |||||||||||||||||
|
Total |
$ | 43,417 | $ | 2,676 | $ | 2,709 | $ | 3,056 | $ | 3,605 | $ | 5,664 | $ | 7,033 | $ | 18,674 | |||||||||
Credit ratings estimate a company's ability to meet its obligations and may directly affect the cost and availability of financing to that company. The following table presents the credit ratings of AIG and certain of its subsidiaries as of April 25, 2013. Figures in parentheses indicate the relative ranking of the ratings within the agency's rating categories; that ranking refers only to the major rating category and not to the modifiers assigned by the rating agencies.
|
|
Short-Term Debt | Senior Long-Term Debt | |||||||||
|---|---|---|---|---|---|---|---|---|---|---|---|
|
|
Moody's
|
S&P
|
Moody's
(a)
|
S&P
(b)
|
Fitch
(c)
|
||||||
|
AIG |
P-2 (2nd of 3) | A-2 (2nd of 8) | Baa 1 (4th of 9) | A- (3rd of 8) | BBB (4th of 9) | ||||||
|
|
Stable Outlook | Stable Outlook | Negative Outlook | Stable Outlook | |||||||
|
AIG Financial Products Corp. (d) |
P-2 | A-2 | Baa 1 | A- | – | ||||||
|
|
Stable Outlook | Stable Outlook | Negative Outlook | ||||||||
|
AIG Funding, Inc. (d) |
P-2 | A-2 | – | – | – | ||||||
|
|
Stable Outlook | ||||||||||
(a) Moody's appends numerical modifiers 1, 2 and 3 to the generic rating categories to show relative position within the rating categories.
(b) S&P ratings may be modified by the addition of a plus or minus sign to show relative standing within the major rating categories.
(c) Fitch ratings may be modified by the addition of a plus or minus sign to show relative standing within the major rating categories.
(d) AIG guarantees all obligations of AIG Financial Products Corp. and AIG Funding, Inc.
132
These credit ratings are current opinions of the rating agencies. They may be changed, suspended or withdrawn at any time by the rating agencies as a result of changes in, or unavailability of, information or based on other circumstances. Ratings may also be withdrawn at our request.
We are party to some agreements that contain "ratings triggers". Depending on the ratings maintained by one or more rating agencies, these triggers could result in (i) the termination or limitation of credit availability or require accelerated repayment, (ii) the termination of business contracts or (iii) requirement to post collateral for the benefit of counterparties.
In the event of adverse actions on our long-term debt ratings by the major rating agencies, AIGFP would be required to post additional collateral under some derivative transactions, or to permit termination of the transactions. Such transactions could adversely affect our business, our consolidated results of operations in a reporting period or our liquidity. In the event of a further downgrade of AIG's long-term senior debt ratings, AIGFP would be required to post additional collateral, and certain of AIGFP's counterparties would be permitted to terminate their contracts early.
The actual amount of collateral that we would be required to post to counterparties in the event of such downgrades, or the aggregate amount of payments that we could be required to make, depend on market conditions, the fair value of outstanding affected transactions and other factors prevailing at the time of the downgrade.
For a discussion of the effects of downgrades in the financial strength ratings of our insurance companies or our credit ratings, see Note 9 to the Condensed Consolidated Financial Statements herein and Part I, Item 1A. Risk Factors — Liquidity, Capital and Credit in the 2012 Annual Report.
Payment of future dividends to AIG shareholders depends in part on the regulatory framework that will ultimately be applicable to AIG, including AIG's status as a SLHC under Dodd-Frank and whether AIG is determined to be a non-bank SIFI. See Note 11 to the Condensed Consolidated Financial Statements for additional discussion of potential restrictions on payments of dividends to common shareholders.
Payments of dividends to AIG by its insurance subsidiaries are subject to certain restrictions imposed by regulatory authorities. See Note 20 to the Consolidated Financial Statements in the 2012 Annual Report for additional discussion of restrictions on payments of dividends by AIG and its subsidiaries.
133
ITEM 2 / INVESTMENTS
Investments
OVERVIEW
Our investment strategies are tailored to the specific business needs of each operating unit. The investment objectives are driven by the respective business models for AIG Property Casualty, AIG Life and Retirement, and the Direct Investment book. The primary objectives are generation of investment income, preservation of capital, liquidity management and growth of surplus to support the insurance products. The majority of assets backing our insurance liabilities consist of intermediate and long duration fixed maturity securities.
Our investments and investment strategies were affected by the following conditions in the first quarter of 2013:
- •
-
Central banks initiated actions intended to improve weakening economic conditions, including the European Central Bank's
commitment to further bond purchases and the U.S. Federal Reserve's commitment to maintain the Federal Funds Rate in the zero to a quarter percent range. The Federal Reserve also committed to support
the mortgage market via purchases of agency mortgage-backed securities, and extended "Operation Twist", a program of redeeming short-term U.S. Treasury securities and using the proceeds to
buy longer-term U.S. Treasury securities with the objective of putting downward pressure on longer-term interest rates.
- •
-
Equity markets experienced positive returns and reached record highs in the first quarter of 2013.
- •
-
Bond yields remained low, although the 10-Year U.S. Treasury rate temporarily increased above 2 percent
before retreating to 1.85 percent at the end of the quarter. Investment grade interest rates increased during the first quarter.
- •
- The U.S. dollar strengthened by 3 percent, 7 percent and 9 percent against the euro, British pound, and Japanese yen, respectively.
At the local operating unit level, investment strategies are based on considerations that include the local market, general market conditions, liability duration and cash flow characteristics, rating agency and regulatory capital considerations, legal investment limitations, tax optimization and diversification.
- •
-
In the case of AIG Life and Retirement, as well as in the DIB, our fundamental investment strategy is to match the
duration characteristics of the liabilities with assets of comparable duration, to the extent practicable.
- •
-
Fixed maturity securities held by the domestic insurance companies included in AIG Property Casualty historically have
consisted primarily of laddered holdings of tax-exempt municipal bonds, which provided attractive after-tax returns and limited credit risk. To meet the current
risk-return and tax objectives of AIG Property Casualty, cash flows from the investment portfolio and insurance operations are generally being reinvested by the domestic property and
casualty companies in taxable instruments which meet the companies' liquidity, duration and credit quality objectives as well as current risk-return and tax objectives.
- •
-
Outside of the U.S., fixed maturity securities held by AIG Property Casualty companies consist primarily of intermediate
duration high-grade securities generally denominated in the currencies of the countries in which we operate.
- •
- AIG Parent's liquidity resources are held in the form of cash, short-term investments and publicly traded, investment grade rated fixed maturity securities. AIG Parent actively manages its assets and liabilities in terms of products, counterparties and tenor. During the first quarter of 2013, upon an assessment of its immediate and longer-term funding needs, AIG Parent purchased publicly traded, intermediate term, investment grade rated fixed maturity securities that can be readily monetized through sales or repurchase agreements. These securities allow us to diversify sources of liquidity while reducing the cost of maintaining sufficient liquidity.
134
ITEM 2 / INVESTMENTS
The following is an overview of investment activities during the first quarter of 2013:
- •
-
We continued to make risk-weighted opportunistic investments in RMBS and other structured securities to
improve yields and increase net investment income.
- •
-
Blended investment yields on new AIG Life and Retirement and AIG Property Casualty investments were lower than blended
rates on investments that were sold, matured or called.
- •
-
An increase in rates in investment grade asset classes more than offset a continued narrowing of spreads on below
investment grade securities, resulting in net unrealized losses in the investment portfolio.
- •
- Other-than-temporary-impairments continued their downward trend, with structured securities experiencing only minor impairments in the quarter.
Credit Ratings
At March 31, 2013, approximately 88 percent of fixed maturity securities were held by our domestic entities. Approximately 18 percent of such securities were rated AAA by one or more of the principal rating agencies, and approximately 15 percent were rated below investment grade or not rated. Our investment decision process relies primarily on internally generated fundamental analysis and internal risk ratings. Third-party rating services' ratings and opinions provide one source of independent perspective for consideration in the internal analysis.
A significant portion of our foreign entities' fixed maturity securities portfolio is rated by Moody's, S&P or similar foreign rating services. Rating services are not available for some foreign issued securities. Our Credit Risk Management department closely reviews the credit quality of the foreign portfolio's non-rated fixed maturity securities. At March 31, 2013, approximately 15 percent of such investments were either rated AAA or, on the basis of our internal analysis, were equivalent from a credit standpoint to securities rated AAA, and approximately 4 percent were rated below investment grade or not rated. Approximately 47 percent of the foreign entities' fixed maturity securities portfolio is comprised of sovereign fixed maturity securities supporting policy liabilities in the country of issuance.
With respect to our fixed maturity investments, the credit ratings in the table below and in subsequent tables reflect: (a) a composite of the ratings of the three major rating agencies, or when agency ratings are not available, the rating assigned by the NAIC Securities Valuations Office (SVO) (over 99 percent of total fixed maturity investments), or (b) our equivalent internal ratings when these investments have not been rated by any of the major rating agencies or the NAIC. The "Non-rated" category in those tables consists of fixed maturity securities that have not been rated by any of the major rating agencies, the NAIC or us. For a further discussion of the NAIC designations of our fixed maturity securities, see NAIC Designations below.
See Enterprise Risk Management herein for a discussion of credit risks associated with Investments.
135
ITEM 2 / INVESTMENTS
The following table presents the composite AIG credit ratings of our fixed maturity securities calculated on the basis of their fair value:
|
|
|
|
|
|
|
|
|||||||||||||
|---|---|---|---|---|---|---|---|---|---|---|---|---|---|---|---|---|---|---|---|
|
|
Available for Sale | Trading | Total | ||||||||||||||||
|
|
March 31,
|
December 31,
2012 |
March 31,
|
December 31,
2012 |
March 31,
|
December 31,
2012 |
|||||||||||||
|
Rating: |
|
|
|
|
|
|
|
|
|
||||||||||
|
Other fixed maturity |
|
|
|
|
|
|
|
|
|
||||||||||
|
securities |
|
|
|
|
|
|
|
|
|
||||||||||
|
AAA |
$
|
19,892
|
|
$ | 21,433 |
$
|
6,177
|
|
$ | 6,047 |
$
|
26,068
|
|
$ | 27,480 | ||||
|
AA |
|
44,395
|
|
44,224 |
|
320
|
|
636 |
|
44,714
|
|
44,860 | |||||||
|
A |
|
63,436
|
|
62,824 |
|
446
|
|
588 |
|
63,882
|
|
63,412 | |||||||
|
BBB |
|
76,264
|
|
78,554 |
|
485
|
|
468 |
|
76,749
|
|
79,022 | |||||||
|
Below investment grade |
|
9,924
|
|
9,775 |
|
234
|
|
265 |
|
10,158
|
|
10,040 | |||||||
|
Non-rated |
|
377
|
|
290 |
|
–
|
|
112 |
|
379
|
|
402 | |||||||
|
Total |
$
|
214,288
|
|
$ | 217,100 |
$
|
7,662
|
|
$ | 8,116 |
$
|
221,950
|
|
$ | 225,216 | ||||
|
Mortgage-backed, asset- |
|
|
|
|
|
|
|
|
|
||||||||||
|
backed and collateralized |
|
|
|
|
|
|
|
|
|
||||||||||
|
AAA |
$
|
22,620
|
|
$ | 21,151 |
$
|
3,012
|
|
$ | 2,843 |
$
|
25,632
|
|
$ | 23,994 | ||||
|
AA |
|
3,320
|
|
3,162 |
|
2,701
|
|
2,889 |
|
6,021
|
|
6,051 | |||||||
|
A |
|
6,114
|
|
5,533 |
|
831
|
|
928 |
|
6,945
|
|
6,461 | |||||||
|
BBB |
|
3,508
|
|
3,497 |
|
799
|
|
807 |
|
4,306
|
|
4,304 | |||||||
|
Below investment grade |
|
20,346
|
|
19,390 |
|
8,795
|
|
8,957 |
|
29,140
|
|
28,347 | |||||||
|
Non-rated |
|
55
|
|
126 |
|
55
|
|
44 |
|
112
|
|
170 | |||||||
|
Total |
$
|
55,963
|
|
$ | 52,859 |
$
|
16,193
|
|
$ | 16,468 |
$
|
72,156
|
|
$ | 69,327 | ||||
|
Total |
|
|
|
|
|
|
|
|
|
||||||||||
|
AAA |
$
|
42,511
|
|
$ | 42,584 |
$
|
9,189
|
|
$ | 8,890 |
$
|
51,700
|
|
$ | 51,474 | ||||
|
AA |
|
47,715
|
|
47,386 |
|
3,020
|
|
3,525 |
|
50,735
|
|
50,911 | |||||||
|
A |
|
69,549
|
|
68,357 |
|
1,277
|
|
1,516 |
|
70,827
|
|
69,873 | |||||||
|
BBB |
|
79,771
|
|
82,051 |
|
1,284
|
|
1,275 |
|
81,056
|
|
83,326 | |||||||
|
Below investment grade |
|
30,270
|
|
29,165 |
|
9,029
|
|
9,222 |
|
39,299
|
|
38,387 | |||||||
|
Non-rated |
|
435
|
|
416 |
|
56
|
|
156 |
|
489
|
|
572 | |||||||
|
Total |
$
|
270,251
|
|
$ | 269,959 |
$
|
23,855
|
|
$ | 24,584 |
$
|
294,106
|
|
$ | 294,543 | ||||
136
ITEM 2 / INVESTMENTS
Investments by Segment
The following tables summarize the composition of AIG's investments by reportable segment:
|
|
Reportable Segment |
|
|
|
||||||||||||
|---|---|---|---|---|---|---|---|---|---|---|---|---|---|---|---|---|
|
|
|
Consolidation
and Eliminations |
|
|||||||||||||
|
(in millions)
|
AIG Property
Casualty |
AIG Life and
Retirement |
Other
Operations |
Total
|
||||||||||||
|
March 31, 2013 |
||||||||||||||||
|
Fixed maturity securities: |
||||||||||||||||
|
Bonds available for sale, at fair value |
$ | 103,478 | $ | 161,818 | $ | 9,412 | $ | (4,457 | ) | $ | 270,251 | |||||
|
Bond trading securities, at fair value |
2,059 | 2,499 | 19,764 | (467 | ) | 23,855 | ||||||||||
|
Equity securities: |
||||||||||||||||
|
Common and preferred stock available for sale, at fair value |
2,969 | 131 | 8 | – | 3,108 | |||||||||||
|
Common and preferred stock trading, at fair value |
– | 592 | 104 | – | 696 | |||||||||||
|
Mortgage and other loans receivable, net of allowance |
1,212 | 18,686 | 1,503 | (1,913 | ) | 19,488 | ||||||||||
|
Other invested assets |
12,754 | 12,741 | 3,069 | 401 | 28,965 | |||||||||||
|
Short-term investments |
5,658 | 7,272 | 11,185 | (779 | ) | 23,336 | ||||||||||
|
Total investments * |
128,130 | 203,739 | 45,045 | (7,215 | ) | 369,699 | ||||||||||
|
Cash |
671 | 332 | 224 | – | 1,227 | |||||||||||
|
Total invested assets |
$ | 128,801 | $ | 204,071 | $ | 45,269 | $ | (7,215 | ) | $ | 370,926 | |||||
|
December 31, 2012 |
||||||||||||||||
|
Fixed maturity securities: |
||||||||||||||||
|
Bonds available for sale, at fair value |
$ | 102,563 | $ | 163,550 | $ | 6,580 | $ | (2,734 | ) | $ | 269,959 | |||||
|
Bond trading securities, at fair value |
1,597 | 1,856 | 21,362 | (231 | ) | 24,584 | ||||||||||
|
Equity securities: |
||||||||||||||||
|
Common and preferred stock available for sale, at fair value |
3,093 | 111 | 8 | – | 3,212 | |||||||||||
|
Common and preferred stock trading, at fair value |
– | 562 | 100 | – | 662 | |||||||||||
|
Mortgage and other loans receivable, net of allowance |
2,839 | 18,755 | 2,015 | (4,127 | ) | 19,482 | ||||||||||
|
Other invested assets |
12,720 | 12,737 | 3,280 | 380 | 29,117 | |||||||||||
|
Short-term investments |
7,935 | 7,392 | 14,432 | (951 | ) | 28,808 | ||||||||||
|
Total investments * |
130,747 | 204,963 | 47,777 | (7,663 | ) | 375,824 | ||||||||||
|
Cash |
649 | 297 | 205 | – | 1,151 | |||||||||||
|
Total invested assets |
$ | 131,396 | $ | 205,260 | $ | 47,982 | $ | (7,663 | ) | $ | 376,975 | |||||
* At both March 31, 2013 and December 31, 2012, approximately 88 percent and 12 percent of investments were held by domestic and foreign entities, respectively.
AIG Property Casualty
In our property casualty business, the duration of liabilities for long-tail casualty lines is greater than that for other lines. As differentiated from the life insurance and retirement services companies, the focus is not on asset-liability matching, but on preservation of capital and growth of surplus.
Fixed maturity securities of AIG Property Casualty domestic operations, with an average duration of 4.3 years, are currently comprised primarily of tax-exempt securities, which provide attractive risk-adjusted after-tax returns as well as taxable municipal bonds, government and agency bonds, and corporate bonds . The majority of these high quality investments are rated A or higher based on composite ratings.
137
ITEM 2 / INVESTMENTS
Fixed maturity securities held in AIG Property Casualty foreign operations are of high quality and short to intermediate duration, averaging 4.4 years.
While invested assets backing reserves are primarily invested in conventional fixed maturity securities in AIG Property Casualty domestic operations, a modest portion of surplus is allocated to alternative investments, including private equity and hedge funds. These investments have provided a combination of added diversification and attractive long-term returns over time.
AIG Life and Retirement
With respect to AIG Life and Retirement, we use asset-liability management as a tool to determine the composition of the invested assets. Our objective is to maintain a matched asset-liability structure, although we may occasionally determine that it is economically advantageous to be temporarily in an unmatched position. To the extent that we have maintained a matched asset-liability structure, the economic effect of interest rate fluctuations is partially mitigated.
Our investment strategy for AIG Life and Retirement is to produce cash flows greater than maturing insurance liabilities. There exists a future investment risk associated with certain policies currently in-force which will have premium receipts in the future. That is, the investment of these future premium receipts may be at a yield below that required to meet future policy liabilities.
AIG Life and Retirement frequently reviews its interest rate assumptions and actively manages the crediting rates used for its new and in force business. Business strategies continue to evolve to maintain profitability of the overall business in a low interest rate environment.
The investment of insurance cash flows and reinvestment of the proceeds of matured securities and coupons requires active management of investment yields while maintaining satisfactory investment quality and liquidity.
A number of guaranteed benefits, such as living benefits and guaranteed minimum death benefits, are offered on certain variable and indexed annuity products. The fair value of these benefits is measured based on actuarial and capital market assumptions related to projected cash flows over the expected lives of the contracts. We manage our exposure resulting from these long-term guarantees through reinsurance or capital market hedging instruments. We actively review underlying assumptions of policyholder behavior and persistency related to these guarantees. We have taken positions in certain derivative financial instruments in order to hedge the impact of changes in equity markets and interest rates on these benefit guarantees. We execute listed futures and options contracts on equity indexes to hedge certain guarantees of variable and indexed annuity products. We also enter into various types of futures and options contracts, primarily to hedge changes in value of certain guarantees of variable and indexed annuities due to fluctuations in interest rates. We use several instruments to hedge interest rate exposure, including listed futures on government securities, listed options on government securities and the purchase of government securities.
With respect to over-the-counter derivatives, we deal with highly rated counterparties and do not expect the counterparties to fail to meet their obligations under the contracts. We have controls in place to monitor credit exposures by limiting transactions with specific counterparties within specified dollar limits and assessing the creditworthiness of counterparties periodically. We generally use ISDA Master Agreements and Credit Support Annexes (CSAs) with bilateral collateral provisions to reduce counterparty credit exposures.
Fixed maturity securities of AIG Life and Retirement, with an average duration of 6.4 years, are comprised of taxable corporate bonds, as well as municipal and government bonds, commercial mortgage loans, and agency and non-agency structured securities. The majority of these investments are held in the available for sale portfolio and are rated investment grade based on our composite ratings.
NAIC Designations
The SVO of the NAIC evaluates the investments of U.S. insurers for statutory reporting purposes and assigns fixed maturity securities to one of six categories called 'NAIC Designations.' In general, NAIC Designations of '1' highest quality, or '2' high quality, include fixed maturity securities considered investment grade, while NAIC Designations of '3' through '6' generally include fixed maturity securities referred to as below investment grade. The NAIC
138
ITEM 2 / INVESTMENTS
Designations for certain mortgaged-backed, asset-backed and collateralized securities are based on security level expected losses as modeled by an independent third party engaged by the NAIC.
The following table presents the NAIC Designations of the fixed maturity securities in AIG Life and Retirement's fixed maturity security portfolio based on fair value:
|
At March 31, 2013
(in millions) |
Rating Agency Designation
|
Other Fixed
Maturity Securities |
Mortgage Backed,
Asset Backed and Collateralized |
Total
|
||||||||
|---|---|---|---|---|---|---|---|---|---|---|---|---|
|
Investment grade: |
||||||||||||
|
1 |
Aaa/Aa/A | $ | 50,919 | $ | 37,428 | $ | 88,347 | |||||
|
2 |
Baa | 64,081 | 1,678 | 65,759 | ||||||||
|
Subtotal |
115,000 | 39,106 | 154,106 | |||||||||
|
Below investment grade: |
||||||||||||
|
3 |
Ba | 4,527 | 778 | 5,305 | ||||||||
|
4 |
B | 2,166 | 373 | 2,539 | ||||||||
|
5 |
Caa and Lower | 526 | 373 | 899 | ||||||||
|
6 |
In or near default | 162 | 616 | 778 | ||||||||
|
Subtotal |
7,381 | 2,140 | 9,521 | |||||||||
|
Total* |
$ | 122,381 | $ | 41,246 | $ | 163,627 | ||||||
* Excludes $690 million of fixed maturity securities that are not held in legal entities within AIG Life and Retirement that require a statutory filing, therefore no NAIC rating is available for these securities.
Available-for-Sale Investments
The following table presents the fair value of AIG's available-for-sale securities:
|
|
|
|
|||||
|---|---|---|---|---|---|---|---|
|
(in millions)
|
Fair Value at
|
Fair Value at
December 31, 2012 |
|||||
|
Bonds available for sale: |
|
|
|
||||
|
U.S. government and government sponsored entities |
$
|
3,496
|
|
$ | 3,483 | ||
|
Obligations of states, municipalities and political subdivisions |
|
35,111
|
|
35,705 | |||
|
Non-U.S. governments |
|
25,375
|
|
26,800 | |||
|
Corporate debt |
|
150,306
|
|
151,112 | |||
|
Mortgage-backed, asset-backed and collateralized: |
|
|
|
||||
|
RMBS |
|
36,126
|
|
34,392 | |||
|
CMBS |
|
10,411
|
|
10,134 | |||
|
CDO/ABS |
|
9,426
|
|
8,333 | |||
|
Total mortgage-backed, asset-backed and collateralized |
|
55,963
|
|
52,859 | |||
|
Total bonds available for sale * |
|
270,251
|
|
269,959 | |||
|
Equity securities available for sale: |
|
|
|
||||
|
Common stock |
|
2,922
|
|
3,029 | |||
|
Preferred stock |
|
82
|
|
78 | |||
|
Mutual funds |
|
104
|
|
105 | |||
|
Total equity securities available for sale |
|
3,108
|
|
3,212 | |||
|
Total |
$
|
273,359
|
|
$ | 273,171 | ||
* At March 31, 2013 and December 31, 2012, bonds available for sale held by us that were below investment grade or not rated totaled $30.7 billion and $29.6 billion, respectively.
139
ITEM 2 / INVESTMENTS
Investments in Municipal Bonds
At March 31, 2013, the U.S. municipal bond portfolio of AIG Property Casualty was composed primarily of essential service revenue bonds and high-quality tax-backed bonds with over 98 percent of the portfolio rated A or higher.
The following table presents the fair values of our available for sale U.S. municipal bond portfolio by state and municipal bond type:
|
March 31, 2013
(in millions) |
State
General Obligation |
Local
General Obligation |
Revenue
|
Total Fair
Value |
|||||||||
|---|---|---|---|---|---|---|---|---|---|---|---|---|---|
|
State: |
|||||||||||||
|
California |
$ | 705 | $ | 1,304 | $ | 3,272 | $ | 5,281 | |||||
|
Texas |
199 | 2,253 | 2,082 | 4,534 | |||||||||
|
New York |
55 | 839 | 3,622 | 4,516 | |||||||||
|
Washington |
712 | 276 | 796 | 1,784 | |||||||||
|
Massachusetts |
871 | – | 868 | 1,739 | |||||||||
|
Illinois |
158 | 667 | 731 | 1,556 | |||||||||
|
Florida |
506 | 9 | 1,010 | 1,525 | |||||||||
|
Virginia |
91 | 148 | 877 | 1,116 | |||||||||
|
Georgia |
476 | 154 | 382 | 1,012 | |||||||||
|
Arizona |
– | 161 | 821 | 982 | |||||||||
|
Ohio |
192 | 148 | 547 | 887 | |||||||||
|
Maryland |
439 | 97 | 169 | 705 | |||||||||
|
Pennsylvania |
427 | 74 | 197 | 698 | |||||||||
|
All other states |
1,610 | 1,212 | 5,954 | 8,776 | |||||||||
|
Total (a)(b) |
$ | 6,441 | $ | 7,342 | $ | 21,328 | $ | 35,111 | |||||
(a) Excludes certain university and not- for- profit entities that issue their bonds in the corporate debt market. Includes industrial revenue bonds.
(b) Includes $8.5 billion of pre-refunded municipal bonds.
Investments in Corporate Debt Securities
The following table presents the industry categories of our available for sale corporate debt securities:
|
|
|
|
|||||
|---|---|---|---|---|---|---|---|
|
Industry Category
(in millions) |
Fair Value at
|
Fair Value at
December 31, 2012 |
|||||
|
Financial institutions: |
|
|
|
||||
|
Money Center /Global Bank Groups |
$
|
12,449
|
|
$ | 12,300 | ||
|
Regional banks — other |
|
878
|
|
885 | |||
|
Life insurance |
|
4,172
|
|
4,180 | |||
|
Securities firms and other finance companies |
|
635
|
|
636 | |||
|
Insurance non-life |
|
5,512
|
|
5,429 | |||
|
Regional banks — North America |
|
7,387
|
|
7,729 | |||
|
Other financial institutions |
|
7,580
|
|
7,633 | |||
|
Utilities |
|
24,689
|
|
24,993 | |||
|
Communications |
|
11,727
|
|
11,744 | |||
|
Consumer noncyclical |
|
17,367
|
|
17,307 | |||
|
Capital goods |
|
9,744
|
|
9,697 | |||
|
Energy |
|
11,190
|
|
11,275 | |||
|
Consumer cyclical |
|
10,895
|
|
10,781 | |||
|
Basic |
|
9,656
|
|
9,753 | |||
|
Other |
|
16,425
|
|
16,770 | |||
|
Total* |
$
|
150,306
|
|
$ | 151,112 | ||
* At both March 31, 2013 and December 31, 2012, approximately 94 percent of these investments were rated investment grade.
140
ITEM 2 / INVESTMENTS
Investments in RMBS
The following table presents AIG's RMBS available for sale investments by year of vintage:
|
|
|
|
|||||
|---|---|---|---|---|---|---|---|
|
(in millions)
|
Fair Value at
|
Fair Value at
December 31, 2012 |
|||||
|
Total RMBS |
|
|
|
||||
|
2013 |
$
|
807
|
|
$ | – | ||
|
2012 |
|
2,787
|
|
1,630 | |||
|
2011 |
|
7,483
|
|
7,545 | |||
|
2010 |
|
2,497
|
|
2,951 | |||
|
2009 |
|
350
|
|
378 | |||
|
2008 and prior * |
|
22,202
|
|
21,888 | |||
|
Total RMBS |
$
|
36,126
|
|
$ | 34,392 | ||
|
Agency |
|
|
|
||||
|
2013 |
$
|
807
|
|
$ | – | ||
|
2012 |
|
2,555
|
|
1,395 | |||
|
2011 |
|
5,410
|
|
5,498 | |||
|
2010 |
|
2,404
|
|
2,812 | |||
|
2009 |
|
278
|
|
321 | |||
|
2008 and prior |
|
3,185
|
|
3,548 | |||
|
Total Agency |
$
|
14,639
|
|
$ | 13,574 | ||
|
Alt-A |
|
|
|
||||
|
2010 |
$
|
48
|
|
$ | 53 | ||
|
2008 and prior |
|
8,258
|
|
7,871 | |||
|
Total Alt-A |
$
|
8,306
|
|
$ | 7,924 | ||
|
Subprime |
|
|
|
||||
|
2008 and prior |
$
|
2,317
|
|
$ | 2,151 | ||
|
Total Subprime |
$
|
2,317
|
|
$ | 2,151 | ||
|
Prime non-agency |
|
|
|
||||
|
2012 |
$
|
232
|
|
$ | 235 | ||
|
2011 |
|
2,073
|
|
2,047 | |||
|
2010 |
|
44
|
|
86 | |||
|
2009 |
|
72
|
|
58 | |||
|
2008 and prior |
|
8,013
|
|
7,910 | |||
|
Total Prime non-agency |
$
|
10,434
|
|
$ | 10,336 | ||
|
Total Other housing related |
$
|
430
|
|
$ | 407 | ||
* Includes approximately $9.6 billion of Purchased Credit Impaired securities that were purchased at a significant discount to amortized cost commencing in the second quarter of 2011.
141
ITEM 2 / INVESTMENTS
The following table presents our RMBS available for sale investments by credit rating:
|
|
|
|
|||||
|---|---|---|---|---|---|---|---|
|
(in millions)
|
Fair Value at
|
Fair Value at
December 31, 2012 |
|||||
|
Rating: |
|
|
|
||||
|
Total RMBS |
|
|
|
||||
|
AAA |
$
|
17,208
|
|
$ | 16,048 | ||
|
AA |
|
488
|
|
795 | |||
|
A |
|
610
|
|
411 | |||
|
BBB |
|
724
|
|
744 | |||
|
Below investment grade (a) |
|
17,096
|
|
16,283 | |||
|
Non-rated |
|
–
|
|
111 | |||
|
Total RMBS (b) |
$
|
36,126
|
|
$ | 34,392 | ||
|
Agency RMBS |
|
|
|
||||
|
AAA |
$
|
14,603
|
|
$ | 13,464 | ||
|
AA |
|
36
|
|
110 | |||
|
Total Agency |
$
|
14,639
|
|
$ | 13,574 | ||
|
Alt-A RMBS |
|
|
|
||||
|
AAA |
$
|
41
|
|
$ | 57 | ||
|
AA |
|
90
|
|
195 | |||
|
A |
|
161
|
|
83 | |||
|
BBB |
|
281
|
|
314 | |||
|
Below investment grade (a) |
|
7,733
|
|
7,275 | |||
|
Total Alt-A |
$
|
8,306
|
|
$ | 7,924 | ||
|
Subprime RMBS |
|
|
|
||||
|
AAA |
$
|
34
|
|
$ | 38 | ||
|
AA |
|
85
|
|
170 | |||
|
A |
|
225
|
|
129 | |||
|
BBB |
|
188
|
|
185 | |||
|
Below investment grade (a) |
|
1,785
|
|
1,629 | |||
|
Total Subprime |
$
|
2,317
|
|
$ | 2,151 | ||
|
Prime non-agency |
|
|
|
||||
|
AAA |
$
|
2,518
|
|
$ | 2,487 | ||
|
AA |
|
273
|
|
317 | |||
|
A |
|
221
|
|
196 | |||
|
BBB |
|
209
|
|
208 | |||
|
Below investment grade (a) |
|
7,213
|
|
7,017 | |||
|
Non-rated |
|
–
|
|
111 | |||
|
Total prime non-agency |
$
|
10,434
|
|
$ | 10,336 | ||
|
Total Other housing related |
$
|
430
|
|
$ | 407 | ||
(a) Commencing in the second quarter of 2011, we began purchasing certain RMBS that had experienced deterioration in credit quality since their origination. See Note 6 to the Condensed Consolidated Financial Statements, Investments — Purchased Credit Impaired (PCI) Securities, for additional discussion.
(b) The weighted average expected life was 6 years at both March 31, 2013 and December 31, 2012.
Our underwriting practices for investing in RMBS, other asset-backed securities and CDOs take into consideration the quality of the originator, the manager, the servicer, security credit ratings, underlying characteristics of the mortgages, borrower characteristics, and the level of credit enhancement in the transaction.
142
ITEM 2 / INVESTMENTS
Investments in CMBS
The following table presents our CMBS available for sale investments:
|
|
|
|
|||||
|---|---|---|---|---|---|---|---|
|
(in millions)
|
Fair Value at
|
Fair Value at
December 31, 2012 |
|||||
|
CMBS (traditional) |
$
|
8,265
|
|
$ | 7,880 | ||
|
ReRemic/CRE CDO |
|
–
|
|
219 | |||
|
Agency |
|
1,607
|
|
1,486 | |||
|
Other |
|
539
|
|
549 | |||
|
Total |
$
|
10,411
|
|
$ | 10,134 | ||
The following table presents our CMBS available for sale investments by year of vintage:
|
|
|
|
|||||
|---|---|---|---|---|---|---|---|
|
(in millions)
|
Fair Value at
|
Fair Value at
December 31, 2012 |
|||||
|
Year: |
|
|
|
||||
|
2013 |
$
|
575
|
|
$ | – | ||
|
2012 |
|
1,439
|
|
1,427 | |||
|
2011 |
|
1,337
|
|
1,347 | |||
|
2010 |
|
736
|
|
807 | |||
|
2009 |
|
20
|
|
44 | |||
|
2008 and prior |
|
6,304
|
|
6,509 | |||
|
Total |
$
|
10,411
|
|
$ | 10,134 | ||
The following table presents our CMBS available for sale investments by credit rating:
|
|
|
|
|||||
|---|---|---|---|---|---|---|---|
|
(in millions)
|
Fair Value at
|
Fair Value at
December 31, 2012 |
|||||
|
Rating: |
|
|
|
||||
|
AAA |
$
|
4,577
|
|
$ | 4,278 | ||
|
AA |
|
1,655
|
|
1,591 | |||
|
A |
|
787
|
|
827 | |||
|
BBB |
|
1,228
|
|
1,266 | |||
|
Below investment grade |
|
2,149
|
|
2,156 | |||
|
Non-rated |
|
15
|
|
16 | |||
|
Total |
$
|
10,411
|
|
$ | 10,134 | ||
143
ITEM 2 / INVESTMENTS
The following table presents our CMBS available for sale investments by geographic region:
|
|
|
|
|||||
|---|---|---|---|---|---|---|---|
|
(in millions)
|
Fair Value at
|
Fair Value at
December 31, 2012 |
|||||
|
Geographic region: |
|
|
|
||||
|
New York |
$
|
1,938
|
|
$ | 1,710 | ||
|
California |
|
1,011
|
|
921 | |||
|
Texas |
|
600
|
|
590 | |||
|
Florida |
|
419
|
|
406 | |||
|
Virginia |
|
330
|
|
314 | |||
|
New Jersey |
|
316
|
|
266 | |||
|
Illinois |
|
306
|
|
265 | |||
|
Hawaii |
|
214
|
|
125 | |||
|
Pennsylvania |
|
213
|
|
205 | |||
|
Massachusetts |
|
199
|
|
182 | |||
|
Georgia |
|
192
|
|
186 | |||
|
Nevada |
|
177
|
|
176 | |||
|
All Other * |
|
4,496
|
|
4,788 | |||
|
Total |
$
|
10,411
|
|
$ | 10,134 | ||
* Includes Non-U.S. locations.
The following table presents our CMBS available for sale investments by industry:
|
|
|
|
|||||
|---|---|---|---|---|---|---|---|
|
(in millions)
|
Fair Value at
|
Fair Value at
December 31, 2012 |
|||||
|
Industry: |
|
|
|
||||
|
Office |
$
|
2,753
|
|
$ | 2,736 | ||
|
Multi-family * |
|
2,533
|
|
2,439 | |||
|
Retail |
|
2,589
|
|
2,489 | |||
|
Lodging |
|
1,334
|
|
1,269 | |||
|
Industrial |
|
561
|
|
560 | |||
|
Other |
|
641
|
|
641 | |||
|
Total |
$
|
10,411
|
|
$ | 10,134 | ||
* Includes Agency-backed CMBS.
The fair value of CMBS holdings remained stable during the first quarter of 2013. The majority of our investments in CMBS are in tranches that contain substantial protection features through collateral subordination. The majority of CMBS holdings are traditional conduit transactions, broadly diversified across property types and geographical areas.
144
ITEM 2 / INVESTMENTS
Investments in CDOs
The following table presents our CDO available for sale investments by collateral type:
|
|
|
|
|||||
|---|---|---|---|---|---|---|---|
|
(in millions)
|
Fair value at
|
Fair value at
December 31, 2012 |
|||||
|
Collateral Type: |
|
|
|
||||
|
Bank loans (CLO) |
$
|
3,200
|
|
$ | 2,579 | ||
|
Synthetic investment grade |
|
3
|
|
25 | |||
|
Other |
|
831
|
|
424 | |||
|
Subprime ABS |
|
–
|
|
10 | |||
|
Total |
$
|
4,034
|
|
$ | 3,038 | ||
The following table presents our CDO available for sale investments by credit rating:
|
|
|
|
|||||
|---|---|---|---|---|---|---|---|
|
(in millions)
|
Fair Value at
|
Fair Value at
December 31, 2012 |
|||||
|
Rating: |
|
|
|
||||
|
AAA |
$
|
148
|
|
$ | 144 | ||
|
AA |
|
897
|
|
542 | |||
|
A |
|
1,684
|
|
1,284 | |||
|
BBB |
|
543
|
|
485 | |||
|
Below investment grade |
|
762
|
|
583 | |||
|
Total |
$
|
4,034
|
|
$ | 3,038 | ||
Commercial Mortgage Loans
At March 31, 2013, we had direct commercial mortgage loan exposure of $14.2 billion. At that date, over 99 percent of the loans were current.
145
ITEM 2 / INVESTMENTS
The following table presents the commercial mortgage loan exposure by location and class of loan based on amortized cost:
|
March 31, 2013 (dollars in millions) |
Number
of Loans |
Class |
|
Percent
of Total |
||||||||||||||||||||||||
|---|---|---|---|---|---|---|---|---|---|---|---|---|---|---|---|---|---|---|---|---|---|---|---|---|---|---|---|---|
|
Apartments
|
Offices
|
Retails
|
Industrials
|
Hotels
|
Others
|
Total
|
||||||||||||||||||||||
|
State: |
||||||||||||||||||||||||||||
|
California |
152 | $ | 118 | $ | 938 | $ | 284 | $ | 635 | $ | 393 | $ | 651 | $ | 3,019 | 21 | % | |||||||||||
|
New York |
87 | 650 | 1,316 | 175 | 97 | 101 | 147 | 2,486 | 17 | |||||||||||||||||||
|
New Jersey |
56 | 475 | 281 | 305 | 6 | 18 | 66 | 1,151 | 8 | |||||||||||||||||||
|
Florida |
91 | 52 | 174 | 253 | 99 | 20 | 228 | 826 | 6 | |||||||||||||||||||
|
Texas |
55 | 37 | 284 | 152 | 206 | 101 | 27 | 807 | 6 | |||||||||||||||||||
|
Pennsylvania |
56 | 48 | 99 | 169 | 118 | 16 | 14 | 464 | 3 | |||||||||||||||||||
|
Ohio |
52 | 159 | 35 | 97 | 64 | 38 | 9 | 402 | 3 | |||||||||||||||||||
|
Maryland |
21 | 22 | 144 | 186 | 13 | 4 | 3 | 372 | 3 | |||||||||||||||||||
|
Colorado |
19 | 11 | 198 | – | – | 96 | 59 | 364 | 3 | |||||||||||||||||||
|
Arizona |
12 | 40 | 106 | 57 | 36 | – | 86 | 325 | 2 | |||||||||||||||||||
|
Other states |
344 | 385 | 1,225 | 1,002 | 431 | 354 | 376 | 3,773 | 27 | |||||||||||||||||||
|
Foreign |
62 | 1 | – | – | 65 | – | 115 | 181 | 1 | |||||||||||||||||||
|
Total * |
1,007 | $ | 1,998 | $ | 4,800 | $ | 2,680 | $ | 1,770 | $ | 1,141 | $ | 1,781 | $ | 14,170 | 100 | % | |||||||||||
* Excludes portfolio valuation losses.
See Note 7 to the Consolidated Financial Statements in the 2012 Annual Report for further discussion.
The following table presents impairments by investment type:
|
|
|
|
|||||
|---|---|---|---|---|---|---|---|
|
Three Months Ended March 31,
(in millions) |
2013
|
2012
|
|||||
|
Fixed maturity securities, available for sale |
$
|
36
|
|
$ | 449 | ||
|
Equity securities, available for sale |
|
5
|
|
4 | |||
|
Private equity funds and hedge funds |
|
33
|
|
165 | |||
|
Subtotal |
|
74
|
|
618 | |||
|
Life settlement contracts (a) |
|
49
|
|
58 | |||
|
Alternative investments |
|
1
|
|
– | |||
|
Real estate (b) |
|
5
|
|
7 | |||
|
Total |
$
|
129
|
|
$ | 683 | ||
(a) Impairments of investments in Life settlement contracts are recorded in Other realized losses.
(b) Impairments of investments in Real estate are recorded in Other income.
Other-Than-Temporary Impairments
To determine other-than-temporary impairments, we use fundamental credit analyses of individual securities without regard to rating agency ratings. Based on this analysis, we expect to receive cash flows sufficient to cover the amortized cost of all below investment grade securities for which credit impairments were not recognized.
The following tables present other-than-temporary impairment charges recorded in earnings on fixed maturity securities, equity securities, private equity funds and hedge funds.
146
ITEM 2 / INVESTMENTS
Other-than-temporary impairment charges by reportable segment and impairment type:
|
|
|||||||||||||
|---|---|---|---|---|---|---|---|---|---|---|---|---|---|
|
|
Reportable Segment |
|
|
||||||||||
|
(in millions)
|
AIG Property
Casualty |
AIG Life and
Retirement |
Other
Operations |
Total
|
|||||||||
|
Three Months Ended March 31, 2013 |
|||||||||||||
|
Impairment Type: |
|||||||||||||
|
Severity |
$ | 2 | $ | – | $ | – | $ | 2 | |||||
|
Change in intent |
2 | – | 1 | 3 | |||||||||
|
Foreign currency declines |
– | – | – | – | |||||||||
|
Issuer-specific credit events |
15 | 48 | – | 63 | |||||||||
|
Adverse projected cash flows |
– | 6 | – | 6 | |||||||||
|
Total |
$ | 19 | $ | 54 | $ | 1 | $ | 74 | |||||
|
Three Months Ended March 31, 2012 |
|||||||||||||
|
Impairment Type: |
|||||||||||||
|
Severity |
$ | 4 | $ | – | $ | – | $ | 4 | |||||
|
Change in intent |
2 | 18 | – | 20 | |||||||||
|
Foreign currency declines |
5 | – | – | 5 | |||||||||
|
Issuer-specific credit events |
191 | 373 | 22 | 586 | |||||||||
|
Adverse projected cash flows |
1 | 2 | – | 3 | |||||||||
|
Total |
$ | 203 | $ | 393 | $ | 22 | $ | 618 | |||||
Other-than-temporary impairment charges by investment type and impairment type:
|
|
|||||||||||||||||||
|---|---|---|---|---|---|---|---|---|---|---|---|---|---|---|---|---|---|---|---|
|
(in millions)
|
RMBS
|
CDO/ABS
|
CMBS
|
Other Fixed
Maturity |
Equities/Other
Invested Assets * |
Total
|
|||||||||||||
|
Three Months Ended March 31, 2013 |
|||||||||||||||||||
|
Impairment Type: |
|||||||||||||||||||
|
Severity |
$ | – | $ | – | $ | – | $ | – | $ | 2 | $ | 2 | |||||||
|
Change in intent |
– | – | – | 1 | 2 | 3 | |||||||||||||
|
Foreign currency declines |
– | – | – | – | – | – | |||||||||||||
|
Issuer-specific credit events |
4 | 3 | 13 | 9 | 34 | 63 | |||||||||||||
|
Adverse projected cash flows |
6 | – | – | – | – | 6 | |||||||||||||
|
Total |
$ | 10 | $ | 3 | $ | 13 | $ | 10 | $ | 38 | $ | 74 | |||||||
|
Three Months Ended March 31, 2012 |
|||||||||||||||||||
|
Impairment Type: |
|||||||||||||||||||
|
Severity |
$ | – | $ | – | $ | – | $ | – | $ | 4 | $ | 4 | |||||||
|
Change in intent |
– | – | – | – | 20 | 20 | |||||||||||||
|
Foreign currency declines |
– | – | – | 5 | – | 5 | |||||||||||||
|
Issuer-specific credit events |
330 | 3 | 89 | 19 | 145 | 586 | |||||||||||||
|
Adverse projected cash flows |
3 | – | – | – | – | 3 | |||||||||||||
|
Total |
$ | 333 | $ | 3 | $ | 89 | $ | 24 | $ | 169 | $ | 618 | |||||||
* Includes other-than-temporary impairment charges on private equity funds, hedge funds and direct private equity investments.
147
ITEM 2 / INVESTMENTS
Other-than-temporary impairment charges by investment type and credit rating:
|
|
|||||||||||||||||||
|---|---|---|---|---|---|---|---|---|---|---|---|---|---|---|---|---|---|---|---|
|
(in millions)
|
RMBS
|
CDO/ABS
|
CMBS
|
Other Fixed
Maturity |
Equities/Other
Invested Assets * |
Total
|
|||||||||||||
|
Three Months Ended March 31, 2013 |
|||||||||||||||||||
|
Rating: |
|||||||||||||||||||
|
AAA |
$ | – | $ | – | $ | – | $ | – | $ | – | $ | – | |||||||
|
AA |
– | – | – | – | – | – | |||||||||||||
|
A |
– | – | – | – | – | – | |||||||||||||
|
BBB |
– | – | – | – | – | – | |||||||||||||
|
Below investment grade |
10 | 3 | 13 | 9 | – | 35 | |||||||||||||
|
Non-rated |
– | – | – | 1 | 38 | 39 | |||||||||||||
|
Total |
$ | 10 | $ | 3 | $ | 13 | $ | 10 | $ | 38 | $ | 74 | |||||||
|
Three Months Ended March 31, 2012 |
|||||||||||||||||||
|
Rating: |
|||||||||||||||||||
|
AAA |
$ | – | $ | – | $ | – | $ | – | $ | – | $ | – | |||||||
|
AA |
1 | – | – | – | – | 1 | |||||||||||||
|
A |
1 | 1 | – | – | – | 2 | |||||||||||||
|
BBB |
2 | – | – | – | – | 2 | |||||||||||||
|
Below investment grade |
329 | 2 | 89 | 18 | – | 438 | |||||||||||||
|
Non-rated |
– | – | – | 6 | 169 | 175 | |||||||||||||
|
Total |
$ | 333 | $ | 3 | $ | 89 | $ | 24 | $ | 169 | $ | 618 | |||||||
* Includes other-than-temporary impairment charges on private equity funds, hedge funds and direct private equity investments.
We recorded other-than-temporary impairment charges in the three-months periods ended March 31, 2013 and 2012 related to:
- •
-
issuer-specific credit events;
- •
-
securities for which we have changed our intent from hold to sell;
- •
-
declines due to foreign exchange rates;
- •
-
adverse changes in estimated cash flows on certain structured securities;
- •
-
securities that experienced severe market valuation declines; and
- •
- other impairments, including equity securities, private equity funds, hedge funds, direct private equity investments, aircraft trusts and investments in life settlement contracts.
There was no significant impact to our consolidated financial condition or results of operations from other-than-temporary impairment charges for any one single credit. Also, no individual other-than-temporary impairment charge exceeded 0.01 percent and 0.10 percent of total equity at March 31, 2013 and 2012, respectively.
In periods subsequent to the recognition of an other-than-temporary impairment charge for available for sale fixed maturity securities that is not foreign-exchange related, we generally prospectively accrete into earnings the difference between the new amortized cost and the expected undiscounted recovery value over the remaining life of the security. The accretion that was recognized for these securities in earnings was $205 million and $218 million for the three-month periods ended March 31, 2013 and 2012, respectively. For a discussion of AIG's other-than-temporary impairment accounting policy, see Note 7 to the Consolidated Financial Statements in the 2012 Annual Report.
148
The following table shows the aging of the pre-tax unrealized losses of fixed maturity and equity securities, the extent to which the fair value is less than amortized cost or cost, and the number of respective items in each category:
|
March 31, 2013
|
Less Than or Equal
to 20% of Cost (b) |
Greater Than 20%
to 50% of Cost (b) |
Greater Than 50%
of Cost (b) |
Total | |||||||||||||||||||||||||||||||||
|---|---|---|---|---|---|---|---|---|---|---|---|---|---|---|---|---|---|---|---|---|---|---|---|---|---|---|---|---|---|---|---|---|---|---|---|---|---|
|
Aging
(a)
(dollars in millions) |
Cost
(c)
|
Unrealized
Loss |
Items
(e)
|
Cost
(c)
|
Unrealized
Loss |
Items
(e)
|
Cost
(c)
|
Unrealized
Loss |
Items
(e)
|
Cost
(c)
|
Unrealized
Loss (d) |
Items
(e)
|
|||||||||||||||||||||||||
|
Investment grade bonds |
|||||||||||||||||||||||||||||||||||||
|
0 – 6 months |
$ | 18,035 | $ | 336 | 2,345 | $ | – | $ | – | – | $ | – | $ | – | – | $ | 18,035 | $ | 336 | 2,345 | |||||||||||||||||
|
7 – 11 months |
1,780 | 97 | 228 | – | – | – | – | – | – | 1,780 | 97 | 228 | |||||||||||||||||||||||||
|
12 months or more |
3,637 | 211 | 398 | 352 | 95 | 25 | 12 | 10 | 2 | 4,001 | 316 | 425 | |||||||||||||||||||||||||
|
Total |
$ | 23,452 | $ | 644 | 2,971 | $ | 352 | $ | 95 | 25 | $ | 12 | $ | 10 | 2 | $ | 23,816 | $ | 749 | 2,998 | |||||||||||||||||
|
Below investment grade
|
|||||||||||||||||||||||||||||||||||||
|
0 – 6 months |
$ | 1,414 | $ | 39 | 426 | $ | 87 | $ | 24 | 14 | $ | – | $ | – | – | $ | 1,501 | $ | 63 | 440 | |||||||||||||||||
|
7 – 11 months |
325 | 31 | 46 | 50 | 13 | 8 | 2 | 2 | 3 | 377 | 46 | 57 | |||||||||||||||||||||||||
|
12 months or more |
2,729 | 218 | 399 | 575 | 159 | 88 | 108 | 64 | 19 | 3,412 | 441 | 506 | |||||||||||||||||||||||||
|
Total |
$ | 4,468 | $ | 288 | 871 | $ | 712 | $ | 196 | 110 | $ | 110 | $ | 66 | 22 | $ | 5,290 | $ | 550 | 1,003 | |||||||||||||||||
|
Total bonds |
|||||||||||||||||||||||||||||||||||||
|
0 – 6 months |
$ | 19,449 | $ | 375 | 2,771 | $ | 87 | $ | 24 | 14 | $ | – | $ | – | – | $ | 19,536 | $ | 399 | 2,785 | |||||||||||||||||
|
7 – 11 months |
2,105 | 128 | 274 | 50 | 13 | 8 | 2 | 2 | 3 | 2,157 | 143 | 285 | |||||||||||||||||||||||||
|
12 months or more |
6,366 | 429 | 797 | 927 | 254 | 113 | 120 | 74 | 21 | 7,413 | 757 | 931 | |||||||||||||||||||||||||
|
Total (e) |
$ | 27,920 | $ | 932 | 3,842 | $ | 1,064 | $ | 291 | 135 | $ | 122 | $ | 76 | 24 | $ | 29,106 | $ | 1,299 | 4,001 | |||||||||||||||||
|
Equity securities |
|||||||||||||||||||||||||||||||||||||
|
0 – 11 months |
$ | 109 | $ | 8 | 86 | $ | 39 | $ | 11 | 28 | $ | – | $ | – | – | $ | 148 | $ | 19 | 114 | |||||||||||||||||
|
12 months or more |
– | – | – | – | – | – | – | – | – | – | – | – | |||||||||||||||||||||||||
|
Total |
$ | 109 | $ | 8 | 86 | $ | 39 | $ | 11 | 28 | $ | – | $ | – | – | $ | 148 | $ | 19 | 114 | |||||||||||||||||
(a) Represents the number of consecutive months that fair value has been less than cost by any amount.
(b) Represents the percentage by which fair value is less than cost at March 31, 2013.
(c) For bonds, represents amortized cost.
(d) The effect on Net income of unrealized losses after taxes will be mitigated upon realization because certain realized losses will result in current decreases in the amortization of certain DAC.
(e) Item count is by CUSIP by subsidiary.
For the three-month period ended March 31, 2013, net unrealized gains related to fixed maturity and equity securities decreased by $1.1 billion primarily due to the increase in interest rates for investment grade fixed maturity securities, which more than offset the narrowing of credit spreads for high yield securities.
See also Note 6 to the Condensed Consolidated Financial Statements for further discussion of our investment portfolio.
149
ITEM 2 / ENTERPRISE RISK MANAGEMENT
Enterprise Risk Management
At AIG, risk management includes the identification and measurement of various forms of risk, the establishment of risk thresholds and the creation of processes intended to maintain risks within these thresholds while optimizing returns. We consider risk management an integral part of managing our core businesses and a key element of our approach to corporate governance.
|
OVERVIEW
At AIG, we have an integrated process for managing risks throughout our organization in accordance with our firm-wide risk appetite. Our Board of Directors has oversight responsibility for the management of risk. Our Enterprise Risk Management (ERM) Department supervises and integrates the risk management functions in each of our business units, providing senior management with a consolidated view of the firm's major risk positions. Within each business unit, senior leaders and executives approve risk-taking policies and targeted risk tolerance within the framework provided by ERM. ERM supports our businesses and management in the embedding of enterprise risk management in all of our key day to day business processes and in identifying, assessing, quantifying, managing and mitigating the risks taken by us and our businesses. For a complete discussion of AIG's risk management program, see Part II, Item 7. MD&A — Enterprise Risk Management in the 2012 Annual Report. |
Enterprise Risk Management (ERM) • Our ERM framework provides senior management with a consolidated view of our risk appetite and major risk positions. • In each of our business units, senior leaders and executives approve risk-taking policies and targeted risk tolerance within the ERM framework while working with ERM to mitigate risks across the firm. •
Risk management is an integral part of how we
manage our core businesses.
|
Overview
Credit risk is defined as the risk that our customers or counterparties are unable or unwilling to repay their contractual obligations when they become due. Credit risk may also result from a downgrade of counterparty's credit ratings.
We devote considerable resources to managing our direct and indirect credit exposures. These exposures may arise from fixed income investments, equity securities, deposits, reverse repurchase agreements and repurchase agreements, commercial paper, corporate and consumer loans, leases, reinsurance recoverables, counterparty risk arising from derivatives activities, collateral extended to counterparties, insurance risk cessions to third parties, financial guarantees and letters of credit.
Our credit risks are managed at the corporate level within ERM. ERM is assisted by credit functions headed by seasoned credit officers in all the business units, whose primary role is to assure appropriate credit risk management relative to our credit risk parameters. Our Chief Credit Officer (CCO) and credit executives are primarily responsible for the development and maintenance of credit risk policies and procedures.
Responsibilities of the CCO and credit executives include:
- •
-
developing and implementing our company-wide credit policies;
- •
- approving delegated credit authorities to our credit executives;
150
ITEM 2 / ENTERPRISE RISK MANAGEMENT
- •
-
managing the approval process for requests for credit limits, program limits and credit transactions above authorities or
where concentrations of risk may exist or be incurred;
- •
-
aggregating globally all credit exposure data by counterparty, country, sector and industry and reporting risk
concentrations regularly to and reviewing with senior management;
- •
-
administering regular portfolio credit reviews of investment, derivative and credit-incurring business units and
recommending corrective actions where required;
- •
-
conducting credit research on countries, sectors and asset classes where risk concentrations may exist;
- •
-
developing methodologies for quantification and assessment of credit risks, including the establishment and maintenance of
our internal risk rating process; and
- •
- approving appropriate credit reserves, credit-related other-than-temporary impairments and corresponding methodologies in all credit portfolios.
We monitor and control our company-wide credit risk concentrations and attempt to avoid unwanted or excessive risk accumulations, whether funded or unfunded. To minimize the level of credit risk in some circumstances, we may require third-party guarantees, reinsurance or collateral, such as letters of credit and trust collateral accounts. We treat these guarantees, reinsurance recoverables, letters of credit and trust collateral accounts as credit exposure and include them in our risk concentration exposure data. We identify our aggregate credit exposures to our underlying counterparty risks.
Largest Credit Concentrations
Our single largest credit exposure, the U.S. Government, was 25 percent of Total equity at March 31, 2013 compared to 25 percent at December 31, 2012. Exposure to the U.S. Government primarily includes credit exposure related to U.S. Treasury and government agency securities and to direct and guaranteed exposures to U.S. government-sponsored entities, primarily the Federal National Mortgage Association (Fannie Mae) and the Federal Home Loan Mortgage Corporation (Freddie Mac) based upon their U.S. Government conservatorship. Based on our internal risk ratings, at March 31, 2013, our largest below investment grade-rated credit exposure, apart from ILFC leasing arrangements secured by aircraft with airlines having below investment grade ratings, was related to a non-financial corporate counterparty. That exposure was 0.6 percent of Total equity, compared to 0.6 percent at December 31, 2012.
Government Credit Concentrations (non-U.S.)
Our total direct and guaranteed credit exposure to non-U.S. governments is $21.4 billion at March 31, 2013, compared to $22.9 billion in December 31, 2012. Our single largest concentration in this sector was to the government of Japan in the amount of $6.9 billion at March 31, 2013. Most of these securities were held in the investment portfolios of our Japanese insurance operations and are yen denominated.
151
ITEM 2 / ENTERPRISE RISK MANAGEMENT
The following table presents our aggregate credit exposures to non-U.S. governments and their agencies, dependent state-owned enterprises, financial institutions and local governments:
|
|
|
|
|||||
|---|---|---|---|---|---|---|---|
|
(in millions)
|
March 31,
|
December 31,
2012 |
|||||
|
Japan |
$
|
6,948
|
|
$ | 8,109 | ||
|
Canada |
|
2,704
|
|
2,718 | |||
|
Germany |
|
1,253
|
|
1,446 | |||
|
France |
|
1,148
|
|
1,207 | |||
|
China |
|
921
|
|
926 | |||
|
South Korea |
|
707
|
|
693 | |||
|
Singapore |
|
638
|
|
122 | |||
|
United Kingdom |
|
610
|
|
816 | |||
|
Mexico |
|
573
|
|
552 | |||
|
Australia |
|
539
|
|
601 | |||
|
Other |
|
5,320
|
|
5,732 | |||
|
Total |
$
|
21,361
|
|
$ | 22,922 | ||
Financial Institution Concentrations
Our single largest industry credit exposure at March 31, 2013 was to the global financial institutions sector as a whole, which includes banks and finance companies, securities firms, and insurance and reinsurance companies, many of which can be highly correlated at times of market stress. As of March 31, 2013, credit exposure to this sector was $77.1 billion, or 77 percent, of Total equity compared to 87 percent at December 31, 2012.
At March 31, 2013:
- •
-
$72.1 billion, or 94 percent, of these global financial institution credit exposures were considered
investment grade based on our internal ratings.
- •
-
$5.0 billion, or 6 percent, were considered non-investment grade based on our internal ratings.
Aggregate credit exposure to the ten largest below investment grade-rated financial institutions was $2.1 billion.
- •
-
Our aggregate credit exposure to fixed maturity securities of the financial institution sector amounted to
$33.7 billion.
- •
-
Short-term bank deposit placements, reverse repurchase agreements, repurchase agreements and commercial paper
issued by financial institutions (primarily commercial banks), operating account balances with banks and bank-issued commercial letters of credit supporting insurance credit exposures were
$13.3 billion, or 17 percent, of the total global financial institution credit exposure.
- •
- The remaining credit exposures to this sector were primarily related to reinsurance recoverables, collateral extended to counterparties mostly pursuant to derivative transactions, derivatives, and captive fronting risk management programs for these financial institutions.
European Concentrations
We actively monitor our European credit exposures, especially those exposures to issuers in the Euro-Zone periphery. We use various stress assumptions to identify issuers and securities warranting review by senior management and to determine the need for mitigating actions. As a mitigating action, we typically decide not to renew maturing exposures or, when the opportunity presents itself, to sell or to tender securities. To date, we have not actively used credit default protection. We periodically evaluate the financial condition of issuers and adjust internal risk ratings as warranted.
The result of these continuing reviews has led us to believe that our combined credit risk exposures in the Euro-Zone are manageable risks given the type and size of exposure and the credit quality and size of the issuers.
152
ITEM 2 / ENTERPRISE RISK MANAGEMENT
The following table presents our aggregate United Kingdom and European credit exposures (excluding ILFC) by major sector:
|
|
|
|
|||||||||||||||||
|---|---|---|---|---|---|---|---|---|---|---|---|---|---|---|---|---|---|---|---|
|
|
March 31, 2013 |
|
|||||||||||||||||
|
(in millions)
|
Sovereign
|
Financial
|
Non-
|
Structured
|
Total
|
December 31,
2012 Total |
|||||||||||||
|
Euro-Zone countries: |
|
|
|
|
|
|
|
|
|
|
|
|
|
|
|
||||
|
France |
$
|
1,148
|
|
$
|
2,426
|
|
$
|
7,147
|
|
$
|
169
|
|
$
|
10,890
|
|
$ | 10,533 | ||
|
Germany |
|
1,253
|
|
|
3,665
|
|
|
3,706
|
|
|
174
|
|
|
8,798
|
|
9,248 | |||
|
Netherlands |
|
254
|
|
|
4,228
|
|
|
2,197
|
|
|
1,480
|
|
|
8,159
|
|
8,333 | |||
|
Spain |
|
166
|
|
|
655
|
|
|
2,367
|
|
|
1,032
|
|
|
4,220
|
|
4,067 | |||
|
Italy |
|
87
|
|
|
333
|
|
|
1,964
|
|
|
222
|
|
|
2,606
|
|
2,848 | |||
|
Belgium |
|
132
|
|
|
203
|
|
|
921
|
|
|
–
|
|
|
1,256
|
|
1,174 | |||
|
Ireland |
|
–
|
|
|
91
|
|
|
880
|
|
|
–
|
|
|
971
|
|
1,018 | |||
|
Luxembourg |
|
–
|
|
|
27
|
|
|
603
|
|
|
36
|
|
|
666
|
|
666 | |||
|
Austria |
|
146
|
|
|
151
|
|
|
206
|
|
|
–
|
|
|
503
|
|
523 | |||
|
Finland |
|
127
|
|
|
30
|
|
|
296
|
|
|
–
|
|
|
453
|
|
432 | |||
|
Other Euro-Zone |
|
24
|
|
|
24
|
|
|
206
|
|
|
18
|
|
|
272
|
|
306 | |||
|
Total Euro-Zone |
|
3,337
|
|
|
11,833
|
|
|
20,493
|
|
|
3,131
|
|
|
38,794
|
|
39,148 | |||
|
Remainder of Europe |
|
|
|
|
|
|
|
|
|
|
|
|
|
|
|
||||
|
United Kingdom |
|
610
|
|
|
9,004
|
|
|
15,895
|
|
|
4,458
|
|
|
29,967
|
|
30,372 | |||
|
Switzerland |
|
59
|
|
|
4,817
|
|
|
2,880
|
|
|
–
|
|
|
7,756
|
|
7,290 | |||
|
Sweden |
|
127
|
|
|
2,835
|
|
|
545
|
|
|
–
|
|
|
3,507
|
|
3,643 | |||
|
Other remainder of Europe |
|
1,034
|
|
|
1,069
|
|
|
2,353
|
|
|
1,079
|
|
|
5,535
|
|
5,612 | |||
|
Total remainder of Europe |
|
1,830
|
|
|
17,725
|
|
|
21,673
|
|
|
5,537
|
|
|
46,765
|
|
46,917 | |||
|
Total |
$
|
5,167
|
|
$
|
29,558
|
|
$
|
42,166
|
|
$
|
8,668
|
|
$
|
85,559
|
|
$ | 86,065 | ||
(a) Other represents mortgage guaranty insurance ($1.3 billion), primarily in Spain ($935 million) and Italy ($174 million).
Aggregate credit exposure to European governments totaled $5.2 billion at March 31, 2013, compared to $6.0 billion at December 31, 2012. Many of the European governments' ratings have been downgraded by one or more of the major rating agencies, occurring mostly in countries in the Euro-Zone periphery where our government credit exposures (Spain, Italy and Portugal) totaled $256 million at March 31, 2013. The downgrades primarily reflect continued recessionary conditions, large government budget deficits, rising government debt-to-GDP ratios and large financing requirements of these countries. These credit exposures primarily included available-for-sale and trading securities (at fair value) issued by these governments. At March 31, 2013, we had no direct or guaranteed credit exposure to the governments of Greece, Ireland or Cyprus.
Our exposure to European financial institutions at March 31, 2013 included $18.7 billion of credit exposures to European banks, of which $17.3 billion were considered investment grade based on our internal ratings. Aggregate below investment grade rated credit exposures to European banks were $1.5 billion. Our credit exposures to banks domiciled in the Euro-Zone countries totaled $7.7 billion at March 31, 2013, of which $4.4 billion were fixed maturity securities. Credit exposures to banks based in the five countries of the Euro-Zone periphery (Spain, Italy, Ireland, Greece, and Portugal) totaled $989 million, of which $710 million were fixed maturity securities. These credit exposures were primarily to the largest banks in Spain and Italy. Credit exposures to banks based in France totaled $1.4 billion at March 31, 2013, of which $759 million were fixed maturity securities. Our credit exposures were predominantly to the largest banks in these countries.
In addition, our exposure at March 31, 2013 to European financial institutions included $10.8 billion of aggregate credit exposure to non-bank institutions, mostly insurers and reinsurers, with $8.3 billion, or 77 percent, of credit exposure representing reinsurance recoverable balances. Reinsurance recoverables were primarily to highly rated reinsurers based in Switzerland, the United Kingdom and Germany. At March 31, 2013, $1.4 billion of the aggregate credit exposure to non-banks was fixed maturity securities, of which 94 percent were considered investment grade based on our internal ratings.
153
ITEM 2 / ENTERPRISE RISK MANAGEMENT
Of the $20.5 billion of non-financial institution corporate exposure to Euro-Zone countries at March 31, 2013, 95 percent was to fixed maturity securities ($11.0 billion) and insurance-related products ($8.4 billion), with the majority of the insurance exposures being trade credit insurance ($3.3 billion), captive fronting programs ($3.1 billion), and surety bonds ($1.5 billion). Our exposure to France of $7.1 billion at March 31, 2013 represented the largest single non-financial corporate country exposure within the Euro-Zone, of which $2.7 billion were fixed maturity securities. Approximately two-thirds of the French exposures were to issuers in the utilities, oil and gas, and telecommunications industries. Euro-Zone periphery non-financial institution corporate exposures ($5.4 billion) at March 31, 2013 were heavily weighted towards large multinational corporations or issuers in relatively stable industries, such as regulated utilities (22 percent), telecommunications (16 percent), and oil and gas (9 percent).
Of the $7.4 billion at March 31, 2013 of United Kingdom and European structured product exposures (largely consisting of residential mortgage-backed, commercial mortgage-backed and other asset-backed securities), United Kingdom structured products accounted for 73 percent, while the Netherlands and Germany comprised 20 percent and 2 percent, respectively. Structured product exposures to the Euro-Zone periphery accounted for 2 percent of the total. Approximately 76 percent of the United Kingdom and European structured products exposures were rated A or better at March 31, 2013 based on external rating agency ratings.
In addition, we had commercial real estate-related net equity investments in Europe totaling $490 million at March 31, 2013 and related unfunded commitments of $92 million.
The following table presents our aggregate United Kingdom and European credit exposures (excluding ILFC) by product type:
|
|
March 31, 2013 |
|
||||||||||||||||||||
|---|---|---|---|---|---|---|---|---|---|---|---|---|---|---|---|---|---|---|---|---|---|---|
|
(in millions)
|
Fixed
|
Cash and
|
Insurance
|
Reinsurance
|
Other
(d)
|
Total
|
December 31,
2012 Total |
|||||||||||||||
|
Euro-Zone countries: |
|
|
|
|
|
|
|
|
|
|
|
|
|
|
|
|
|
|
||||
|
France |
$
|
4,847
|
|
$
|
428
|
|
$
|
3,833
|
|
$
|
541
|
|
$
|
1,241
|
|
$
|
10,890
|
|
$ | 10,533 | ||
|
Germany |
|
4,405
|
|
|
328
|
|
|
1,946
|
|
|
2,029
|
|
|
89
|
|
|
8,797
|
|
9,248 | |||
|
Netherlands |
|
5,702
|
|
|
70
|
|
|
1,792
|
|
|
570
|
|
|
27
|
|
|
8,161
|
|
8,333 | |||
|
Spain |
|
1,837
|
|
|
130
|
|
|
2,229
|
|
|
22
|
|
|
2
|
|
|
4,220
|
|
4,067 | |||
|
Italy |
|
1,569
|
|
|
2
|
|
|
966
|
|
|
61
|
|
|
10
|
|
|
2,608
|
|
2,848 | |||
|
Belgium |
|
890
|
|
|
1
|
|
|
358
|
|
|
3
|
|
|
3
|
|
|
1,255
|
|
1,174 | |||
|
Ireland |
|
725
|
|
|
48
|
|
|
197
|
|
|
–
|
|
|
–
|
|
|
970
|
|
1,018 | |||
|
Luxembourg |
|
332
|
|
|
8
|
|
|
326
|
|
|
–
|
|
|
–
|
|
|
666
|
|
666 | |||
|
Austria |
|
294
|
|
|
4
|
|
|
202
|
|
|
3
|
|
|
–
|
|
|
503
|
|
523 | |||
|
Finland |
|
316
|
|
|
12
|
|
|
122
|
|
|
3
|
|
|
–
|
|
|
453
|
|
432 | |||
|
Other Euro-Zone |
|
116
|
|
|
7
|
|
|
148
|
|
|
–
|
|
|
–
|
|
|
271
|
|
306 | |||
|
Total Euro-Zone |
|
21,033
|
|
|
1,038
|
|
|
12,119
|
|
|
3,232
|
|
|
1,372
|
|
|
38,794
|
|
39,148 | |||
|
Remainder of Europe |
|
|
|
|
|
|
|
|
|
|
|
|
|
|
|
|
|
|
||||
|
United Kingdom |
|
15,979
|
|
|
1,334
|
|
|
8,606
|
|
|
2,336
|
|
|
1,711
|
|
|
29,966
|
|
30,372 | |||
|
Switzerland |
|
3,150
|
|
|
367
|
|
|
1,077
|
|
|
3,162
|
|
|
–
|
|
|
7,756
|
|
7,290 | |||
|
Sweden |
|
1,545
|
|
|
1,628
|
|
|
329
|
|
|
3
|
|
|
–
|
|
|
3,505
|
|
3,643 | |||
|
Other remainder of
|
|
3,200
|
|
|
650
|
|
|
1,342
|
|
|
17
|
|
|
329
|
|
|
5,538
|
|
5,612 | |||
|
Total remainder of Europe |
|
23,874
|
|
|
3,979
|
|
|
11,354
|
|
|
5,518
|
|
|
2,040
|
|
|
46,765
|
|
46,917 | |||
|
Total |
$
|
44,907
|
|
$
|
5,017
|
|
$
|
23,473
|
|
$
|
8,750
|
|
$
|
3,412
|
|
$
|
85,559
|
|
$ | 86,065 | ||
(a) Fixed maturity securities primarily includes available-for-sale and trading securities reported at fair value of $42.0 billion ($42.0 billion amortized cost), and $2.9 billion ($2.9 billion amortized cost), respectively.
(b) Cash and short-term investments include bank deposit placements ($2.9 billion), collateral posted to counterparties against structured products ($1.8 billion), securities purchased under agreements to resell ($168 million), and operating accounts ($152 million).
(c) Insurance Credit Exposures primarily consist of captive fronting management programs ($10.3 billion), trade credit insurance ($6.8 billion), and surety bonds ($2.0 billion) and commercial letters of credit supporting insurance credit exposures ($783 million).
(d) Other primarily consists of derivative transactions reported at fair value.
154
ITEM 2 / ENTERPRISE RISK MANAGEMENT
At March 31, 2013, approximately 87 percent of fixed maturity securities in the United Kingdom and European exposures were considered investment grade based on our internal ratings. European financial institution fixed maturity securities exposure was $10.1 billion, of which $1.1 billion were covered bonds (debt securities secured by a pool of financial assets sufficient to cover any bondholder claims and that have full recourse to the issuing bank). During the first quarter of 2013, $4.4 billion of fixed maturity securities were issued by banks domiciled in the Euro-Zone countries. Our subordinated debt holdings and Tier 1 and preference share securities in these banks totaled $871 million and $308 million, respectively, at March 31, 2013. These exposures were predominantly to the largest banks in those countries.
Other Credit Concentrations
We have a risk concentration in the U.S. municipal sector, primarily through the investment portfolios of our insurance companies. A majority of these securities were held in available-for-sale portfolios of our domestic property and casualty insurance companies. See Investments — Available for Sale Investments herein for further details. We had $405 million of additional exposure to the municipal sector outside of our insurance company portfolios at March 31, 2013, compared to $464 million at December 31, 2012. These exposures consisted of derivatives and trading securities (at fair value), and exposure related to other insurance and financial services operations.
We have a risk concentration in the residential mortgage sector in the form of non-agency RMBS, CDO of RMBS as well as our mortgage guaranty insurance business. See Investments — Available for Sale Investments herein for further details on RMBS and CDO investments. The net risk-in-force for UGC was $34.7 billion at March 31, 2013, of which exposure in the United States was $31.5 billion. UGC has no concentration of exposure in any one state that exceeds 10 percent of UGC's total United States exposure.
We also have a risk concentration in the commercial real estate sector in the form of non-agency CMBS, CDO of CMBS as well as commercial mortgage whole loans. See Investments — Available for Sale Investments and Investments — Commercial Mortgage Loans herein for further details.
We also monitor our aggregate cross-border exposures by country and region. Cross-border exposure is defined as an underlying risk that is taken within a country or jurisdiction other than the country or jurisdiction in which an AIG business unit taking the risk is domiciled. These cross-border exposures include both aggregated cross-border credit exposures to unrelated third parties and cross-border investments in our own international subsidiaries. Five countries had cross-border exposures in excess of 10 percent of Total equity at both March 31, 2013 and December 31, 2012. Based on our internal risk ratings, at March 31, 2013, three countries were rated AAA and two were rated AA. The two largest cross-border exposures were to the United Kingdom and Bermuda.
We regularly review concentration reports in the categories listed above as well as credit trends by risk ratings and credit spreads. We periodically adjust limits and review exposures for risk mitigation to provide reasonable assurance that we do not incur excessive levels of credit risk and that our credit risk profile is properly calibrated across business units.
Market risk is defined as the potential loss arising from adverse fluctuations in interest rates, foreign currencies, equity and commodity prices, and their levels of volatility. Market risk includes credit spread risk, the potential loss arising from adverse fluctuations in credit spreads of securities or counterparties.
We are exposed to market risks, primarily within our insurance businesses and GCM. In our insurance operations, market risk results primarily from potential mismatches in our asset-liability exposures, rather than speculative positioning. Specifically, our life insurance and retirement businesses collect premiums or deposits from policyholders and invest the proceeds in predominantly long-term, fixed maturity securities. We earn a spread between the asset yield and the cost payable to policyholders. We manage the business so that the cash flows from invested assets are sufficient to meet policyholder obligations when they become due, without the need to sell assets prematurely into a potentially distressed market. In periods of severe market volatility, depressed and illiquid fair values on otherwise performing investments diminish shareholders' equity even without actual credit event related losses.
155
ITEM 2 / ENTERPRISE RISK MANAGEMENT
Our market exposures can be categorized as follows:
- •
-
Benchmark interest rates.
Benchmark interest rates are also known as
risk-free interest rates and are associated with either the government/treasury yield curve or the swap curve. The fair value of our significant fixed maturity securities portfolio changes
as benchmark interest rates change.
- •
-
Credit spread or risk premium.
Credit spread risk is the potential for
loss due to a change in an instrument's risk premium or yield relative to that of a comparable duration, default-free instrument.
- •
-
Equity and alternative investment prices.
We are exposed to equity and
alternative investment prices affecting a variety of instruments. These include direct investments in common stock and mutual funds, minimum benefit guarantees embedded in the structure of certain
variable annuity and variable life insurance products and other equity-like investments, such as hedge funds and private equity funds, private equity investments, commercial real estate
and real estate funds.
- •
- Foreign currency exchange rates. We are a globally diversified enterprise with significant income, assets and liabilities denominated in, and significant capital deployed in, a variety of currencies.
We use a number of measures and approaches to measure and quantify our market risk exposure, including:
- •
-
Duration/key rate duration.
Duration is the
measure of the sensitivities of a fixed-income instrument to the changes in the benchmark yield curve. Key rate duration measures sensitivities to the movement at a given term point on the yield
curve.
- •
-
Scenario analysis.
Scenario analysis uses
historical, hypothetical, or forward-looking macroeconomic scenarios to assess and report exposures. Examples of hypothetical scenarios include a 100 basis point parallel shift in the yield curve or a
10 percent immediate and simultaneous decrease in world-wide equity markets.
- •
-
Stress testing.
Stress testing is a special form
of scenario analysis in which the scenarios are designed to lead to a material adverse outcome. Examples of such scenarios include the stock market crash of October 1987 or the widening of yields or
spread of RMBS or CMBS during 2008.
- •
- VaR. Value at Risk (VaR) is a summary statistical measure that uses the estimated volatility and correlation of market factors, and a management-determined level of confidence, to estimate how frequently a portfolio of risk exposures could be expected to lose at least a specified amount.
Insurance Operations Portfolio Sensitivities
The following table provides estimates of our sensitivity to changes in yield curves, equity prices and foreign currency exchange rates:
|
|
|
|
|
|
|
||||||||||
|---|---|---|---|---|---|---|---|---|---|---|---|---|---|---|---|
|
|
Exposure |
|
Effect | ||||||||||||
|
(dollars in millions)
|
March 31,
|
December 31,
2012 |
Sensitivity Factor
|
March 31,
|
December 31,
2012 |
||||||||||
|
Yield sensitive assets |
$
|
301,502
|
|
$ | 305,809 | 100 bps parallel increase in all yield curves |
$
|
(16,504
|
)
|
$ | (16,005 | ) | |||
|
Equity and alternative |
|
|
|
20% decline in stock prices and value |
|
|
|
||||||||
|
investments exposure |
$
|
26,929
|
|
$ | 27,131 | of alternative investments |
$
|
(5,386
|
)
|
$ | (5,426 | ) | |||
|
Foreign currency exchange |
|
|
|
10% depreciation of all foreign currency |
|
|
|
||||||||
|
rates net exposure |
$
|
9,757
|
|
$ | 9,106 | exchange rates against the U.S. dollar |
$
|
(976
|
)
|
$ | (911 | ) | |||
Exposures to yield curve movements include fixed maturity securities, loans, finance receivables and short-term investments, but exclude consolidated separate account assets. Total yield-sensitive assets decreased 1.4 percent or
156
approximately $4.3 billion, compared to December 31, 2012, primarily due to a net decrease in fixed income securities and other fixed assets of $2.7 billion, and a decrease in cash equivalents of $1.6 billion.
Exposures to equity and alternative investment prices include investments in common stock, preferred stocks, mutual funds, hedge funds, private equity funds, commercial real estate and real estate funds, but exclude consolidated separate account assets and consolidated managed partnerships and funds. Total exposure in these areas decreased 0.7 percent, or approximately $202 million, compared to December 31, 2012, primarily due to a decrease of $80 million related to decreases in partnership investments, a decrease in common equity securities of $70 million and a decrease in other equity investments of $65 million. These decreases were partially offset by an increase in real estate investments of $11 million.
Exposures to foreign currency exchange rates reflect our consolidated non-U.S. dollar net capital investments on a GAAP basis. Foreign currency exchange rates net exposure increased 7.1 percent, or $651 million, compared to December 31, 2012. This was primarily due to an increase in Hong Kong dollar exposure of $562 million as a result of AIG Life and Retirement's investment in PICC, and an increase in Hong Kong dollar exposure of $143 million due to the increase in market value of AIG Property Casualty's investment in PICC Property and Casualty Company Limited.
For illustrative purposes, we modeled our sensitivities based on a 100 basis point increase in yield curves, a 20 percent decline in equities and alternative assets, and a 10 percent depreciation of all foreign currency exchange rates against the U.S. dollar. This should not be taken as a prediction, but only as a demonstration of the potential effects of such events.
Liquidity risk is defined as the risk that our financial condition will be adversely affected by the inability or perceived inability to meet our short-term cash, collateral or other financial obligations.
The failure to appropriately manage liquidity risk can result in reduced operating flexibility, increased costs, and reputational harm. Because liquidity is critically important, our liquidity governance includes a number of liquidity and funding policies and monitoring tools to address both AIG-specific, broader industry and market related liquidity events.
Sources of Liquidity risk can include, but are not limited to:
- •
-
financial market movements — significant changes in interest rates can provide incentives for
policyholders to surrender their policies. Changes in markets can impact collateral posting requirements or limit our ability to sell assets at reasonable values to meet liquidity needs due to
unfavorable market conditions, inadequate market depth, or other investors seeking to sell the same or similar assets;
- •
-
potential reputational events or credit downgrade — changes can have an impact on policyholder
cancellations and withdrawals or impact collateral posting requirements; and
- •
- catastrophic events, including natural and man-made disasters, that can increase policyholder claims.
The principal objective of ERM's liquidity risk framework is to protect AIG's liquidity position and identify a diversity of funding sources available to meet actual and contingent liabilities during both normal and stress periods.
We defined our risk appetite to include a liquidity target. AIG Parent liquidity risk tolerance levels are established for base and stress scenarios over a two-year time horizon designed to ensure that funding needs are met under varying market conditions. If we project that we will breach the tolerance, we will assess and determine the appropriate liquidity management actions. However, the market conditions in effect at that time may not permit us to achieve an increase in liquidity sources or a reduction in liquidity requirements.
Additionally, each business unit is responsible for managing liquidity within a framework designed for the measurement and monitoring of liquidity risks inherent to the business. Current cash and liquidity positions are reviewed for changes and against minimum liquidity levels. Future cash inflows and outflows are tracked through cash flow forecasting. If the business unit projects a breach of the minimum liquidity levels, the amount of required liquidity resources will be identified and we will determine any actions to be taken. Business unit level key indicators are assessed to provide advance warning of potential liquidity risks.
157
ITEM 2 / CRITICAL ACCOUNTING ESTIMATES
Critical Accounting Estimates
The preparation of financial statements in conformity with GAAP requires the application of accounting policies that often involve a significant degree of judgment.
The accounting policies that we believe are most dependent on the application of estimates and assumptions, which are critical accounting estimates, are related to the determination of:
- •
-
classification of ILFC as held for sale;
- •
-
insurance liabilities, including property casualty and mortgage guaranty unpaid claims and claims adjustment expenses and
future policy benefits for life and accident and health contracts;
- •
-
income tax assets and liabilities, including recoverability of our net deferred tax asset and the predictability of future
tax operating profitability of the character necessary to realize the net deferred tax asset;
- •
-
recoverability of assets including reinsurance assets;
- •
-
estimated gross profits for investment-oriented products;
- •
-
impairment charges, including other-than-temporary impairments of financial instruments and
goodwill impairments;
- •
-
liabilities for legal contingencies; and
- •
- fair value measurements of certain financial assets and liabilities.
See Note 1 to the Condensed Consolidated Financial Statements for additional information.
These accounting estimates require the use of assumptions about matters that may be highly uncertain at the time of estimation. To the extent actual experience differs from the assumptions used, our consolidated financial condition and results of operations could be materially affected. The following discussion updates critical accounting estimates included in the 2012 Annual Report. For a complete discussion of AIG's critical accounting estimates, you should read this section in conjunction with Part II, Item 7. MD&A — Critical Accounting Estimates in the 2012 Annual Report.
Classification of ILFC as Held for Sale
We report a business as held for sale when management has approved or received approval to sell the business and is committed to a formal plan, the business is available for immediate sale, the business is being actively marketed, the sale is anticipated to occur during the next 12 months, which may require significant judgment, and certain other specified criteria are met. A business classified as held for sale is recorded at the lower of its carrying amount or estimated fair value less cost to sell. If the carrying amount of the business exceeds its estimated fair value, a loss is recognized.
On December 9, 2012, we entered into a definitive agreement with Jumbo Acquisition Limited for the sale of 80.1 percent of the common stock of ILFC for approximately $4.23 billion in cash. Jumbo Acquisition Limited may elect to purchase an additional 9.9 percent of the common stock of ILFC for $522.5 million (the Option) within ten days after approval of the ILFC Transaction and the Option by the Committee on Foreign Investment in the United States. The transaction is subject to required regulatory approvals and other customary closing conditions. We determined ILFC met the criteria at December 31, 2012 for held for sale accounting and, consequently, we recorded a $4.4 billion after tax loss for the year ended December 31, 2012, which was reported in Income (loss) from discontinued operations in the Consolidated Statement of Operations in 2012.
158
ITEM 2 / CRITICAL ACCOUNTING ESTIMATES
Recoverability of Net Deferred Tax Asset
The evaluation of the recoverability of our net deferred tax asset and the need for a valuation allowance requires us to weigh all positive and negative evidence to reach a conclusion that it is more likely than not that all or some portion of the net deferred tax asset will not be realized. The weight given to the evidence is commensurate with the extent to which it can be objectively verified. The more negative evidence that exists, the more positive evidence is necessary and the more difficult it is to support a conclusion that a valuation allowance is not needed.
We consider a number of factors in order to reliably estimate future taxable income, so we can determine the extent of our ability to realize net operating losses (NOLs), foreign tax credits (FTCs) and nonlife capital loss carryforwards. These factors include forecasts of future income for each of our businesses and actual and planned business and operational changes, both of which include assumptions about future macroeconomic and AIG-specific conditions and events. We also subject the forecasts to stresses of key assumptions and evaluate the effect on tax attribute utilization. We also apply stresses to our assumptions about the effectiveness of relevant prudent and feasible tax planning strategies. Our income forecasts, coupled with our tax planning strategies and stress scenarios, all resulted in sufficient taxable income to achieve realization of the tax attributes (other than life-insurance-business capital loss carryforwards) prior to their expiration.
See Note 15 to the Condensed Consolidated Financial Statements for a discussion of AIG's framework for assessing the recoverability of its deferred tax asset.
Fair Value Measurements of Certain Financial Assets and Liabilities
See Note 5 to the Condensed Consolidated Financial Statements for additional information about the measurement of fair value of financial assets and financial liabilities and AIG's accounting policy regarding the incorporation of credit risk in fair value measurements.
The following table presents the fair value of fixed maturity and equity securities by source of value determination:
|
March 31, 2013
(in billions) |
Fair
Value |
Percent
of Total |
|||||
|---|---|---|---|---|---|---|---|
|
Fair value based on external sources (a) |
$ | 279 | 94 | % | |||
|
Fair value based on internal sources |
19 | 6 | |||||
|
Total fixed maturity and equity securities (b) |
$ | 298 | 100 | % | |||
(a) Includes $25 billion for which the primary source is broker quotes.
(b) Includes available for sale and trading securities.
Level 3 Assets and Liabilities
Assets and liabilities recorded at fair value in the Condensed Consolidated Balance Sheet are measured and classified in a hierarchy for disclosure purposes consisting of three "levels" based on the observability of inputs available in the marketplace used to measure the fair value. See Note 5 to the Condensed Consolidated Financial Statements for additional information.
The following table presents the amount of assets and liabilities measured at fair value on a recurring basis and classified as Level 3:
|
|
|
|
|
||||||||||
|---|---|---|---|---|---|---|---|---|---|---|---|---|---|
|
(in billions)
|
March 31,
|
Percentage
|
December 31,
2012 |
Percentage
of Total |
|||||||||
|
Assets |
$
|
42.5
|
|
|
7.7
|
%
|
$ | 40.5 | 7.4 | % | |||
|
Liabilities |
|
3.7
|
|
|
0.8
|
|
4.1 | 0.9 | |||||
Level 3 fair value measurements are based on valuation techniques that use at least one significant input that is unobservable. We consider unobservable inputs to be those for which market data is not available and that are
159
developed using the best information available about the assumptions that market participants would use when valuing the asset or liability. Our assessment of the significance of a particular input to the fair value measurement in its entirety requires judgment.
We classify fair value measurements for certain assets and liabilities as Level 3 when they require significant unobservable inputs in their valuation, including contractual terms, prices and rates, yield curves, credit curves, measures of volatility, prepayment rates, default rates, mortality rates and correlations of such inputs.
The following paragraphs describe the methods we use to measure fair value on a recurring basis for super senior credit default swaps classified in Level 3. See Note 6 to the Consolidated Financial Statements in the 2012 Annual Report for a discussion of the valuation methodologies for other assets classified in Level 3, including certain fixed maturity securities and certain other invested assets, and Note 5 to the Condensed Consolidated Financial Statements herein for a discussion of transfers of Level 3 assets and liabilities.
Super Senior Credit Default Swap Portfolio
The entities included in GCM wrote credit protection on the super senior risk layer of collateralized loan obligations (CLOs), multi-sector CDOs and diversified portfolios of corporate debt, and prime residential mortgages through 2006. In these transactions, AIG is at risk of credit performance on the super senior risk layer related to such assets.
See Notes 5 and 9 to the Condensed Consolidated Financial Statements for information about the Regulatory Capital, Multi-Sector CDO, Corporate Debt/Collateralized Debt Obligation (CLO) and other portfolios.
AIG utilizes sensitivity analyses that estimate the effects of using alternative pricing and other key inputs on our calculation of the unrealized market valuation loss related to the super senior credit default swap portfolio. For the purposes of estimating sensitivities for the super senior multi-sector CDO credit default swap portfolio, the change in valuation derived using the Binomial Expansion Technique (BET) model is used to estimate the change in the fair value of the derivative liability. Of the total $3.7 billion net notional amount of CDS written on multi-sector CDOs outstanding at March 31, 2013, a BET value is available for $2.5 billion net notional amount. No BET value is determined for $1.2 billion of CDS written on European multi-sector CDOs as prices on the underlying securities held by the CDOs are not provided by collateral managers; instead these CDS are valued using counterparty prices. Therefore, sensitivities disclosed below apply only to the net notional amount of $2.5 billion.
The following table presents key inputs used in the BET model, and the potential increase (decrease) to the fair value of the derivative liability by ABS category at March 31, 2013 corresponding to changes in these key inputs:
|
|
|
|
Increase (Decrease) to Fair Value of Derivative Liability | ||||||||||||||||||||||||||||||||||||||||||||||||
|---|---|---|---|---|---|---|---|---|---|---|---|---|---|---|---|---|---|---|---|---|---|---|---|---|---|---|---|---|---|---|---|---|---|---|---|---|---|---|---|---|---|---|---|---|---|---|---|---|---|---|---|
|
|
Average
Inputs Used at March 31, 2013 |
|
|||||||||||||||||||||||||||||||||||||||||||||||||
|
(dollars in millions)
|
Change
|
Entire
Portfolio |
RMBS
Prime |
RMBS
Alt-A |
RMBS
Subprime |
CMBS
|
CDOs
|
Other
|
|||||||||||||||||||||||||||||||||||||||||||
|
Bond prices |
44 points | Increase of 5 points | $ | (135 | ) | $ | (2 | ) | $ | (7 | ) | $ | (64 | ) | $ | (41 | ) | $ | (11 | ) | $ | (10 | ) | ||||||||||||||||||||||||||||
|
|
Decrease of 5 points | 138 | 2 | 7 | 57 | 42 | 15 | 15 | |||||||||||||||||||||||||||||||||||||||||||
|
Weighted |
Increase of 1 year | 12 | – | – | 8 | 3 | – | 1 | |||||||||||||||||||||||||||||||||||||||||||
|
average life |
5.93 years | Decrease of 1 year | (18 | ) | – | – | (14 | ) | (3 | ) | – | (1 | ) | ||||||||||||||||||||||||||||||||||||||
|
Recovery rates |
18% | Increase of 10% | (10 | ) | – | (2 | ) | (7 | ) | (1 | ) | – | – | ||||||||||||||||||||||||||||||||||||||
|
|
Decrease of 10% | 15 | – | 2 | 8 | 2 | 3 | – | |||||||||||||||||||||||||||||||||||||||||||
|
Diversity score (a) |
13 | Increase of 5 | (5 | ) | |||||||||||||||||||||||||||||||||||||||||||||||
|
|
Decrease of 5 | 11 | |||||||||||||||||||||||||||||||||||||||||||||||||
|
Discount curve (b) |
N/A | Increase of 100bps | 5 | ||||||||||||||||||||||||||||||||||||||||||||||||
(a) The diversity score is an input at the CDO level. A calculation of sensitivity to this input by type of security is not possible.
(b) The discount curve is an input at the CDO level. A calculation of sensitivity to this input by type of security is not possible. Furthermore, for this input it is not possible to disclose a weighted average input as a discount curve consists of a series of data points.
160
ITEM 2 / REGULATORY ENVIRONMENT
Our operations around the world are subject to regulation by many different types of regulatory authorities, including insurance, securities, investment advisory, banking and thrift regulators in the United States and abroad. Our insurance subsidiaries are subject to regulation and supervision by the states and jurisdictions in which they do business. The insurance and financial services industries generally have been subject to heightened regulatory scrutiny and supervision in recent years.
In addition to the information set forth in this Quarterly Report on Form 10-Q, AIG's regulatory status is also discussed in Part I, Item 1. Business — Regulation, Part I, Item 1A. Risk Factors — Regulation, Part II, Item 7. MD&A — Liquidity and Capital Resources — Regulation and Supervision and Note 20 to the Consolidated Financial Statements in the 2012 Annual Report.
Other Regulatory Developments
In addition to the adoption of Dodd-Frank in the United States, regulators and lawmakers around the world are actively reviewing the causes of the financial crisis and taking steps to avoid similar problems in the future. The Financial Stability Board (FSB), consisting of representatives of national financial authorities of the G20 nations, has issued a series of frameworks and recommendations intended to produce significant changes in how financial companies, particularly SIFIs, should be regulated. These frameworks and recommendations address such issues as financial group supervision, capital and solvency standards, systemic economic risk, corporate governance including compensation, and a number of related issues associated with responses to the financial crisis. The FSB has directed the International Association of Insurance Supervisors (the IAIS, headquartered in Basel, Switzerland) to create standards relative to these areas and incorporate them within that body's Insurance Core Principles (ICPs). IAIS's ICPs form the baseline threshold against which countries' financial services regulatory efforts in the insurance sector are measured. That measurement is made by periodic Financial Sector Assessment Program (FSAP) reviews conducted by the World Bank and the International Monetary Fund and the reports thereon spur the development of country-specific additional or amended regulatory changes. Lawmakers and regulatory authorities in a number of jurisdictions in which our subsidiaries conduct business have already begun implementing legislative and regulatory changes consistent with these recommendations, including proposals governing consolidated regulation of insurance holding companies by the Financial Services Agency in Japan, financial and banking regulation adopted in France and compensation regulations proposed or adopted by the financial regulators in Germany and the United Kingdom Financial Services Authority.
The FSB has also charged the IAIS with developing a template for measuring systemic risks posed by insurer groups. The IAIS has requested data from selected insurers around the world to determine which elements of the insurance sector, if any, could materially and adversely impact other parts of the global financial services sector (e.g., commercial and investment banking, securities trading, etc.). Ultimately, the IAIS will recommend its final assessment template to the FSB to determine whether any insurer groups should be designated as Globally Systemically Important Insurers (G-SIIs). The current timetable indicates preliminary designations to be announced by June 2013. AIG could be preliminarily designated a G-SII and, if a final designation is made, AIG could be then be subject to enhanced supervisory efforts, which could include enhanced capital requirements. Under the current timetable, insurer groups would expect to be definitively designated G-SIIs in 2017 and would then be subject to such enhanced capital requirements (currently termed High Loss Absorbance Capital requirements) in 2019.
The IAIS is developing a ComFrame, a Common Framework for the Supervision of Internationally Active Insurance Groups (IAIGs), which includes additional supervisory oversight based on its ICPs but also adds requirements and supervisory processes pertaining to the international business activities of IAIGs. As currently delineated under the ComFrame, AIG meets the parameters set forth to define an IAIG. While we currently do not know when any ComFrame directives will be finalized and become effective, the IAIS will undertake a field testing of the ComFrame, including the possibility of additional capital requirements for IAIGs, which is expected to commence in the latter part of 2013. It is expected that the ComFrame would be fully implemented by 2018.
Legislation in the European Union could also affect our international insurance operations. The Solvency II Directive (2009/138/EEC) (Solvency II), which was adopted on November 25, 2009 and is expected to become effective in January 2016 reforms the insurance industry's solvency framework, including minimum capital and solvency requirements, governance requirements, risk management and public reporting standards. The impact on us will
161
depend on whether the U.S. insurance regulatory regime is deemed "equivalent" to Solvency II; if the U.S. insurance regulatory regime is not equivalent, then we, along with other insurance companies, could be required to be supervised under Solvency II standards. Whether the U.S. insurance regulatory regime will be deemed "equivalent" is still under consideration by European authorities and remains uncertain, so we are not currently able to predict the impact of Solvency II.
We expect that the regulations applicable to us and our regulated entities will continue to evolve for the foreseeable future.
162
ITEM 2 / GLOSSARY
GLOSSARY
Accident year The annual calendar accounting period in which loss events occurred, regardless of when the losses are actually reported, booked or paid.
Accident year combined ratio, as adjusted the combined ratio excluding catastrophe losses and related reinstatement premiums, prior year development, net of premium adjustments, and the impact of reserve discounting. Catastrophe losses are generally weather or seismic events having a net impact on AIG Property Casualty in excess of $10 million each.
Accident year loss ratio, as adjusted the loss ratio excluding catastrophe losses and related reinstatement premiums, prior year development, net of premium adjustments, and the impact of reserve discounting.
Acquisition ratio acquisition costs divided by net premiums earned. Acquisition costs are those costs incurred to acquire new and renewal insurance contracts and also include the amortization of VOBA. Acquisition costs vary with sales and include, but are not limited to, commissions, premium taxes, direct marketing costs, certain costs of personnel engaged in sales support activities such as underwriting, and the change in deferred acquisition costs. Acquisition costs that are incremental and directly related to successful sales efforts are deferred and recognized over the coverage periods of related insurance contracts. Acquisition costs that are not incremental and directly related to successful sales efforts are recognized as incurred.
AIG — After-tax operating income (loss) is derived by excluding the following items from net income (loss): income (loss) from discontinued operations, net loss (gain) on sale of divested businesses, income from divested businesses, legacy tax adjustments primarily related to certain changes in uncertain tax positions (FIN 48) and other tax adjustments, legal reserves (settlements) related to "legacy crisis matters," deferred income tax valuation allowance (releases) charges, changes in fair value of AIG Life and Retirement securities designated to hedge living benefit liabilities, change in benefit reserves and deferred policy acquisition costs (DAC), value of business acquired (VOBA), and sales inducement assets (SIA) related to net realized capital (gains) losses, (gain) loss on extinguishment of debt, net realized capital (gains) losses, non-qualifying derivative hedging activities, excluding net realized capital (gains) losses, and bargain purchase gain. "Legacy crisis matters" include favorable and unfavorable settlements related to events leading up to and resulting from our September 2008 liquidity crisis and legal fees incurred by AIG as the plaintiff in connection with such legal matters.
AIG Life and Retirement — Operating income (loss) Operating income (loss) is derived by excluding the following items from net income (loss): legal settlements related to legacy crisis matters, changes in fair values of fixed maturity securities designated to hedge living benefit liabilities, net realized capital (gains) losses, and changes in benefit reserves and DAC, VOBA, and SIA related to net realized capital (gains) losses.
AIG Life and Retirement — Premiums and deposits includes life insurance premiums and deposits on annuity contracts, guaranteed investments contracts and mutual funds.
AIG Property Casualty — Net premiums written represent the sales of an insurer, adjusted for reinsurance premiums assumed and ceded, during a given period. Net premiums earned are the revenue of an insurer for covering risk during a given period. Net premiums written are a measure of performance for a sales period while Net premiums earned are a measure of performance for a coverage period. From the period in which the premiums are written until the period in which they are earned, the amount is presented as Unearned premium reserves in the Consolidated Balance Sheet.
AIG Property Casualty — Operating income (loss) includes both underwriting income (loss) and net investment income, but excludes net realized capital (gains) losses, other (income) expense, legal settlements related to legacy crisis matters and bargain purchase gain. Underwriting income (loss) is derived by reducing net premiums earned by claims and claims adjustment expense and underwriting expenses, acquisition expense and general operating expense.
BET Binomial Expansion Technique A model that generates expected loss estimates for CDO tranches and derives a credit rating for those tranches.
Book Value Per Common Share Excluding Accumulated Other Comprehensive Income (loss) (AOCI) is used to show the amount of our net worth on a per-share basis. Book Value Per Common Share Excluding AOCI is derived by dividing Total AIG shareholders' equity, excluding AOCI, by Total common shares outstanding.
163
ITEM 2 / GLOSSARY
Casualty insurance Insurance that is primarily associated with the losses caused by injuries to third persons, i.e., not the insured, and the legal liability imposed on the insured as a result.
Combined ratio Sum of the loss ratio and the acquisition and general operating expense ratios.
CSA Credit Support Annex A legal document that provides for collateral postings at various ratings and threshold levels.
DAC Deferred Policy Acquisition Costs Deferred costs that are incremental and directly related to the successful acquisition of new business or renewal of existing business.
Expense ratio Sum of acquisition expenses and general operating expenses, divided by net premiums earned.
First-Lien Priority over all other subordinate liens or claims on a property in the event of default on a mortgage.
General operating expense ratio general operating expenses divided by net premiums earned. General operating expenses are those costs that are generally attributed to the support infrastructure of the organization and include but are not limited to personnel costs, projects and bad debt expenses. General operating expenses exclude claims adjustment expenses, acquisition expenses, and investment expenses.
GIC/GIA Guaranteed Investment Contract/Guaranteed Investment Agreement A contract whereby the seller provides a guaranteed repayment of principal and a fixed or floating interest rate for a predetermined period of time.
IBNR Incurred But Not Reported Estimates of claims that have been incurred but not reported to us.
LAE Loss Adjustment Expenses The expenses of settling claims, including legal and other fees and the portion of general expenses allocated to claim settlement costs.
Loss Ratio Claims and claims adjustment expenses incurred divided by net premiums earned. Claims adjustment expenses are directly attributed to settling and paying claims of insureds and include, but are not limited to, legal fees, adjuster's fees, and claims department personnel costs.
Loss reserve development The increase or decrease in incurred claims and claim adjustment expenses as a result of the re-estimation of claims and claim adjustment expense reserves at successive valuation dates for a given group of claims.
Loss reserves Liability for unpaid claims and claims adjustment expense. The estimated ultimate cost of settling claims relating to insured events that have occurred on or before the balance sheet date, whether or not reported to the insurer at that date.
LTV Loan-to-Value Ratio Principal amount of loan amount divided by appraised value of collateral securing the loan.
Net premiums written Represent the sales of an insurer, adjusted for reinsurance premiums assumed and ceded, during a given period. Net premiums earned are the revenue of an insurer for covering risk during a given period. Net premiums written are a measure of performance for a sales period while Net premiums earned are a measure of performance for a coverage period. From the period in which the premiums are written until the period in which they are earned, the amount is presented as Unearned premium reserves in the Consolidated Balance Sheet.
Noncontrolling interest The portion of equity ownership in a consolidated subsidiary not attributable to the controlling parent company.
Other Operations — Operating income (loss): income (loss) excluding certain legal reserves (settlements) related to legacy crisis matters, (gain) loss on extinguishment of debt, amortization of the FRBNY prepaid commitment fee asset, Net realized capital (gains) losses, net (gains) losses on sale of divested businesses and properties, and income from divested businesses.
Policy fees An amount added to a policy premium, or deducted from a policy cash value or contract holder account, to reflect the cost of issuing a policy, establishing the required records, sending premium notices and other related expenses.
164
Prior year development Increase or decrease in estimates of losses and loss expenses for prior years that is included in earnings.
RBC Risk-Based Capital A formula designed to measure the adequacy of an insurer's statutory surplus compared to the risks inherent in its business.
Reinstatement premium Additional premiums payable to reinsurers to restore coverage limits that have been exhausted as a result of reinsured losses under certain excess of loss reinsurance treaties.
Reinsurance The practice whereby one insurer, the reinsurer, in consideration of a premium paid to that insurer, agrees to indemnify another insurer, the ceding company, for part or all of the liability of the ceding company under one or more policies or contracts of insurance which it has issued.
Rescission Denial of claims and termination of coverage on loans related to fraudulent or undocumented claims, underwriting guideline violations and other deviations from contractual terms.
Retained Interest Category within AIG's Other operations that includes the fair value gains or losses, prior to their sale, of the AIA ordinary shares retained following the AIA initial public offering and the MetLife, Inc. (MetLife) securities that were received as consideration from the sale of American Life Insurance Company (ALICO) and the fair value gains or losses, prior to the FRBNY liquidation of ML III assets in 2012, on the retained interest in ML III.
Second-lien Subordinate in ranking to the first-lien holder on a property in the event of default on a mortgage.
Severe losses Individual non-catastrophe first party losses greater than $10 million, net of related reinsurance.
SIA Sales Inducement Asset Represents amounts that are credited to policyholder account balances related to the enhanced crediting rates that a seller offers on certain of its annuity products.
SIFI Systemically Important Financial Institutions Financial institutions are deemed systemically important (that is, the failure of the financial institution could pose a threat to the financial stability of the United States) by the Financial Stability Oversight Council (FSOC) based on a three-stage analytical process.
Solvency II Legislation in the European Union which reforms the insurance industry's solvency framework, including minimum capital and solvency requirements, governance requirements, risk management and public reporting standards. The Solvency II Directive (2009/138/EEC), was adopted on November 25, 2009 and is expected to become effective in January 2016.
SSDMF Social Security Death Master File A database of deceased individuals, most of whom were issued a social security number during their lifetimes, maintained by the U.S. Social Security Administration.
Surrender charge A charge levied against an investor for the early withdrawal of funds from a life insurance or annuity contract, or for the cancellation of the agreement.
Unearned premium reserve Liabilities established by insurers and reinsurers to reflect unearned premiums which are usually refundable to policyholders if an insurance or reinsurance contract is canceled prior to expiration of the contract term.
VOBA Value of Business Acquired Present value of projected future gross profits from in-force policies from acquired businesses.
165
ACRONYMS
|
A&H Accident and Health Insurance ABS Asset-Backed Security CDO Collateralized Debt Obligation CDS Credit Default Swap CLO Collateralized Loan Obligations CMA Capital Maintenance Agreement CMBS Commercial Mortgage Backed Securities FASB Financial Accounting Standards Board FRBNY Federal Reserve Bank of New York GAAP Accounting principles generally accepted in the United States of America GMDB Guaranteed Minimum Death Benefits |
GMWB Guaranteed Minimum Withdrawal Benefits ISDA International Swaps and Derivatives Association, Inc. NAIC National Association of Insurance Commissioners NM Not Meaningful OTC Over-the-Counter OTTI Other-Than-Temporary Impairment RMBS Residential Mortgage Backed Securities S&P Standard & Poor's Financial Services LLC SEC Securities and Exchange Commission VIE Variable Interest Entity |
166
Included in Part I, Item 2. Management Discussion and Analysis of Financial Condition and Results of Operations — Enterprise Risk Management.
Disclosure controls and procedures are designed to ensure that information required to be disclosed in reports filed or submitted under the Securities Exchange Act of 1934 (the Exchange Act) is recorded, processed, summarized and reported within the time periods specified in SEC rules and forms and that such information is accumulated and communicated to management, including the Chief Executive Officer and Chief Financial Officer, to allow timely decisions regarding required disclosures. In connection with the preparation of this Quarterly Report on Form 10-Q, an evaluation was carried out by AIG's management, with the participation of AIG's Chief Executive Officer and Chief Financial Officer, of the effectiveness of AIG's disclosure controls and procedures (as defined in Rules 13a-15(e) and 15d-15(e) under the Exchange Act). Based on that evaluation, AIG's Chief Executive Officer and Chief Financial Officer have concluded that AIG's disclosure controls and procedures were effective as of March 31, 2013.
There has been no change in AIG's internal control over financial reporting (as defined in Rule 13a-15(f) under the Exchange Act) that occurred during the quarter ended March 31, 2013 that has materially affected, or is reasonably likely to materially affect, AIG's internal control over financial reporting.
167
For a discussion of legal proceedings, see Note 10 to the Condensed Consolidated Financial Statements, which is incorporated herein by reference.
In addition to the other information set forth in this Quarterly Report on Form 10-Q, you should carefully consider the factors discussed throughout Part I, Item 1A. Risk Factors in AIG's Annual Report on Form 10-K for the year ended December 31, 2012.
See accompanying Exhibit Index.
168
Pursuant to the requirements of the Securities Exchange Act of 1934, the registrant has duly caused this report to be signed on its behalf by the undersigned thereunto duly authorized.
|
|
AMERICAN INTERNATIONAL GROUP, INC. | |||
|
|
||||
|
|
(Registrant) | |||
|
|
||||
|
|
/s/ DAVID L. HERZOG
|
|||
|
|
David L. Herzog
Executive Vice President Chief Financial Officer Principal Financial Officer |
|||
|
|
||||
|
|
||||
|
|
||||
|
|
||||
|
|
/s/ JOSEPH D. COOK
|
|||
|
|
Joseph D. Cook
Vice President — Finance Principal Accounting Officer |
|||
|
|
||||
|
|
||||
|
|
||||
|
|
||||
|
|
||||
|
|
||||
|
|
||||
|
|
||||
Dated: May 2, 2013
169
EXHIBIT INDEX
|
Exhibit
Number |
Description
|
Location
|
|||
|---|---|---|---|---|---|
| 10 | Material Contracts | ||||
|
|
|
|
(1) American International Group, Inc. 2013 Long-Term Incentive Plan* |
|
Incorporated by reference to Exhibit 10.1 to AIG's Current Report on Form 8-K filed with the SEC on March 27, 2013 (File No. 1-8787). |
|
|
|
|
(2) Form of 2013 Long-Term Incentive Plan Performance Share Units Award Agreement* |
|
Incorporated by reference to Exhibit 10.2 to AIG's Current Report on Form 8-K filed with the SEC on March 27, 2013 (File No. 1-8787). |
|
|
|
|
(3) American International Group, Inc. Clawback Policy* |
|
Incorporated by reference to Exhibit 10.3 to AIG's Current Report on Form 8-K filed with the SEC on March 27, 2013 (File No. 1-8787). |
|
|
|
|
(4) American International Group, Inc. 2013 Short-Term Incentive Plan* |
|
Incorporated by reference to Exhibit 10.4 to AIG's Current Report on Form 8-K filed with the SEC on March 27, 2013 (File No. 1-8787). |
|
|
|
|
(5) Form of 2013 Short-Term Incentive Plan Award Letter* |
|
Incorporated by reference to Exhibit 10.5 to AIG's Current Report on Form 8-K filed with the SEC on March 27, 2013 (File No. 1-8787). |
|
|
|
|
(6) American International Group, Inc. 2012 Executive Severance Plan (as amended)* |
|
Filed herewith. |
|
|
|
|
(7) Description of Non-Management Director Compensation* |
|
Incorporated by reference to "Compensation of Directors" in AIG's Definitive Proxy Statement on Schedule 14A, dated April 4, 2013 (File No. 1-8787). |
|
|
|
|
(8) Description of Named Executive Officer Compensation* |
|
Incorporated by reference to AIG's Current Report on Form 8-K filed with the SEC on April 4, 2013 (File No. 1-8787). |
|
|
|
|
(9) Side Letter, dated as of February 19, 2013, to Unconditional Capital Maintenance Agreement, dated as of March 30, 2011, between AIG and American General Life Insurance Company |
|
Incorporated by reference to Exhibit 10.77 to AIG's Annual Report on Form 10-K for the year ended December 31, 2012 (File No. 1-8787). |
|
|
|
|
(10) Side Letter, dated as of February 19, 2013, to Unconditional Capital Maintenance Agreement, dated as of March 30, 2011, between AIG and The United States Life Insurance Company in the City of New York |
|
Incorporated by reference to Exhibit 10.79 to AIG's Annual Report on Form 10-K for the year ended December 31, 2012 (File No. 1-8787). |
|
|
|
|
(11) Amended and Restated Unconditional Capital Maintenance Agreement, dated as of February 20, 2013, among AIG, Chartis Inc., AIU Insurance Company, American Home Assurance Company, Chartis Casualty Company, Chartis Property Casualty Company, Chartis Specialty Insurance Company, Commerce and Industry Insurance Company, Granite State Insurance Company, Illinois National Insurance Co., Lexington Insurance Company, National Union Fire Insurance Company of Pittsburgh, Pa., New Hampshire Insurance Company and The Insurance Company of the State of Pennsylvania |
|
Incorporated by reference to Exhibit 10.80 to AIG's Annual Report on Form 10-K for the year ended December 31, 2012 (File No. 1-8787). |
|
|
|
|
(12) Side Letter, dated as of February 19, 2013, to Unconditional Capital Maintenance Agreement, dated as of March 30, 2011, between AIG and The Variable Annuity Life Insurance Company |
|
Incorporated by reference to Exhibit 10.83 to AIG's Annual Report on Form 10-K for the year ended December 31, 2012 (File No. 1-8787). |
|
|
11 |
|
Statement re: Computation of Per Share Earnings |
|
Included in Note 13 to the Condensed Consolidated Financial Statements. |
170
|
Exhibit
Number |
Description
|
Location
|
|||
|---|---|---|---|---|---|
| 12 | Computation of Ratios of Earnings to Fixed Charges | Filed herewith. | |||
|
|
31 |
|
Rule 13a-14(a)/15d-14(a) Certifications |
|
Filed herewith. |
|
|
32 |
|
Section 1350 Certifications** |
|
Filed herewith. |
|
|
101 |
|
Interactive data files pursuant to Rule 405 of Regulation S-T: (i) the Condensed Consolidated Balance Sheet as of March 31, 2013 and December 31, 2012, (ii) the Condensed Consolidated Statement of Income for the three months ended March 31, 2013 and 2012, (iii) the Condensed Consolidated Statement of Equity for the three months ended March 31, 2013, (iv) the Condensed Consolidated Statement of Cash Flows for the three months ended March 31, 2013 and 2012, (v) the Condensed Consolidated Statement of Comprehensive Income for the three months ended March 31, 2013 and 2012 and (vi) the Notes to the Condensed Consolidated Financial Statements. |
|
Filed herewith. |
* This exhibit is a management contract or compensatory plan or arrangement.
** This information is furnished and not filed for purposes of Sections 11 and 12 of the Securities Act of 1933 and Section 18 of the Securities Exchange Act of 1934.
171