AMERICAN INTERNATIONAL GROUP INC
10-Ks and 10-Qs
|
|
|
|
|
|
|
|
|
|
|
|
|
|
|
|
|
|
|
|
|
|
|
|
|
|
|
|
|
|
|
|
|
|
|
|
|
|
|
|
|
|
|
|
|
|
|
|
|
|
|
|
|
|
|
|
|
|
|
UNITED STATES
SECURITIES AND EXCHANGE COMMISSION
Washington, D.C. 20549
——————————
FORM
10-Q
For the quarterly period ended
June 30, 2022
OR
For the transition period from to
Commission File Number
1-8787

(Exact name of registrant as specified in its charter)
|
|
|
||||
|
(State or other jurisdiction of
incorporation or organization) |
(I.R.S. Employer
Identification No.) |
||||
|
|
|
||||
| (Address of principal executive offices) | (Zip Code) | ||||
Registrant’s telephone number, including area code: (
212
)
770-7000
——————————
Securities registered pursuant to Section 12(b) of the Securities Exchange Act of 1934:
| Title of each class | Trading Symbol | Name of each exchange on which registered | ||||||
|
|
|
|
||||||
|
|
|
|
||||||
|
|
|
|
||||||
|
Depositary Shares Each Representing a 1/1,000th Interest in a Share of
Series A 5.85% Non-Cumulative Perpetual Preferred Stock
|
|
|
||||||
Indicate by check mark whether the registrant (1) has filed all reports required to be filed by Section 13 or 15(d) of the Securities Exchange Act of 1934 during the preceding 12 months (or for such shorter period that the registrant was required to file such reports), and (2) has been subject to such filing requirements for the past 90 days.
Yes
☑ No ☐
Indicate by check mark whether the registrant has submitted electronically every Interactive Data File required to be submitted pursuant to Rule 405 of Regulation S-T (§232.405 of this chapter) during the preceding 12 months (or for such shorter period that the registrant was required to submit such files).
Yes
☑ No ☐
Indicate by check mark whether the registrant is a large accelerated filer, an accelerated filer, a non-accelerated filer, a smaller reporting company, or an emerging growth company. See the definitions of “large accelerated filer,” “accelerated filer,” “smaller reporting company” and “emerging growth company” in Rule 12b-2 of the Exchange Act.
|
|
Accelerated filer ☐ | |||||||||||||
| Non-accelerated filer ☐ |
Smaller reporting company
|
|||||||||||||
|
Emerging growth company
|
||||||||||||||
If an emerging growth company, indicate by check mark if the registrant has elected not to use the extended transition period for complying with any new or revised financial accounting standards provided pursuant to Section 13(a) of the Exchange Act. ☐
Indicate by check mark whether the registrant is a shell company (as defined in Rule 12b-2 of the Exchange Act). Yes ☐ No
☑
As of August 3, 2022, there were
760,416,143
shares outstanding of the registrant’s common stock.
AMERICAN INTERNATIONAL GROUP, INC.
QUARTERLY REPORT ON FORM 10-Q FOR THE QUARTERLY PERIOD ENDED JUNE 30, 2022
TABLE OF CONTENTS
FORM 10-Q
| Item Number | Description | Page | |||||||||
|
Part I – Financial Information
|
|||||||||||
|
Note 1
.
|
|||||||||||
|
Note 3
.
|
|||||||||||
|
•
Glossary
|
|||||||||||
|
•
Acronyms
|
|||||||||||
|
Part II – Other Information
|
|||||||||||
|
AIG | Second Quarter 2022 Form 10-Q
|
1
|
||||
|
Part I – Financial Information
|
||||||||||||||
Item 1. |
Financial Statements
American International Group, Inc.
Condensed Consolidated Balance Sheets
(unaudited)
| (in millions, except for share data) | June 30, 2022 | December 31, 2021 | ||||||||||||
| Assets: | ||||||||||||||
| Investments: | ||||||||||||||
| Fixed maturity securities: | ||||||||||||||
|
Bonds available for sale, at fair value, net of allowance for credit losses of $
|
$ |
|
$ |
|
||||||||||
|
Other bond securities, at fair value (See Note 5)*
|
|
|
||||||||||||
|
Equity securities, at fair value (See Note 5)*
|
|
|
||||||||||||
|
Mortgage and other loans receivable, net of allowance for credit losses of $
|
|
|
||||||||||||
|
Other invested assets (portion measured at fair value: 2022 - $
|
|
|
||||||||||||
|
Short-term investments, including restricted cash of $
|
|
|
||||||||||||
| Total investments |
|
|
||||||||||||
| Cash* |
|
|
||||||||||||
| Accrued investment income* |
|
|
||||||||||||
|
Premiums and other receivables, net of allowance for credit losses and disputes of $
|
|
|
||||||||||||
|
Reinsurance assets - Fortitude Re, net of allowance for credit losses and disputes of $
|
|
|
||||||||||||
|
Reinsurance assets - other, net of allowance for credit losses and disputes of $
|
|
|
||||||||||||
| Deferred income taxes |
|
|
||||||||||||
| Deferred policy acquisition costs |
|
|
||||||||||||
|
Other assets, net of allowance for credit losses of $
|
|
|
||||||||||||
| Separate account assets, at fair value |
|
|
||||||||||||
| Total assets | $ |
|
$ |
|
||||||||||
| Liabilities: | ||||||||||||||
|
Liability for unpaid losses and loss adjustment expenses, including allowance for credit losses of $
|
$ |
|
$ |
|
||||||||||
| Unearned premiums |
|
|
||||||||||||
| Future policy benefits for life and accident and health insurance contracts |
|
|
||||||||||||
|
Policyholder contract deposits (portion measured at fair value: 2022 - $
|
|
|
||||||||||||
| Other policyholder funds |
|
|
||||||||||||
|
Fortitude Re funds withheld payable (portion measured at fair value: 2022 - $(
|
|
|
||||||||||||
|
Other liabilities (portion measured at fair value: 2022 - $
|
|
|
||||||||||||
|
Long-term debt (portion measured at fair value: 2022 - $
|
|
|
||||||||||||
| Debt of consolidated investment entities* |
|
|
||||||||||||
| Separate account liabilities |
|
|
||||||||||||
| Total liabilities |
|
|
||||||||||||
|
Contingencies, commitments and guarantees (See Note 11)
|
|
|
||||||||||||
| AIG shareholders’ equity: | ||||||||||||||
|
Series A non-cumulative preferred stock and additional paid in capital, $
|
|
|
||||||||||||
|
Common stock, $
|
|
|
||||||||||||
|
Treasury stock, at cost; 2022 -
|
(
|
(
|
||||||||||||
| Additional paid-in capital |
|
|
||||||||||||
| Retained earnings |
|
|
||||||||||||
| Accumulated other comprehensive income (loss) |
(
|
|
||||||||||||
| Total AIG shareholders’ equity |
|
|
||||||||||||
| Non-redeemable noncontrolling interests |
|
|
||||||||||||
| Total equity |
|
|
||||||||||||
| Total liabilities and equity | $ |
|
$ |
|
||||||||||
*
See Note 8 for details of balances associated with variable interest entities.
See accompanying Notes to Condensed Consolidated Financial Statements.
|
2
|
AIG | Second Quarter 2022 Form 10-Q
|
||||
American International Group, Inc.
Condensed Consolidated Statements of Income (Loss)
(unaudited)
| Three Months Ended | Six Months Ended | ||||||||||||||||||||||||||||
| June 30, | June 30, | ||||||||||||||||||||||||||||
| (dollars in millions, except per common share data) | 2022 | 2021 | 2022 | 2021 | |||||||||||||||||||||||||
| Revenues: | |||||||||||||||||||||||||||||
| Premiums | $ |
|
$ |
|
$ |
|
$ |
|
|||||||||||||||||||||
| Policy fees |
|
|
|
|
|||||||||||||||||||||||||
| Net investment income: | |||||||||||||||||||||||||||||
| Net investment income - excluding Fortitude Re funds withheld assets |
|
|
|
|
|||||||||||||||||||||||||
| Net investment income - Fortitude Re funds withheld assets |
|
|
|
|
|||||||||||||||||||||||||
| Total net investment income |
|
|
|
|
|||||||||||||||||||||||||
| Net realized gains (losses): | |||||||||||||||||||||||||||||
| Net realized gains (losses) - excluding Fortitude Re funds withheld assets and embedded derivative |
|
(
|
|
|
|||||||||||||||||||||||||
| Net realized gains (losses) on Fortitude Re funds withheld assets |
(
|
|
(
|
|
|||||||||||||||||||||||||
| Net realized gains (losses) on Fortitude Re funds withheld embedded derivative |
|
(
|
|
|
|||||||||||||||||||||||||
| Total net realized gains (losses) |
|
(
|
|
|
|||||||||||||||||||||||||
| Other income |
|
|
|
|
|||||||||||||||||||||||||
| Total revenues |
|
|
|
|
|||||||||||||||||||||||||
| Benefits, losses and expenses: | |||||||||||||||||||||||||||||
| Policyholder benefits and losses incurred |
|
|
|
|
|||||||||||||||||||||||||
| Interest credited to policyholder account balances |
|
|
|
|
|||||||||||||||||||||||||
| Amortization of deferred policy acquisition costs |
|
|
|
|
|||||||||||||||||||||||||
| General operating and other expenses |
|
|
|
|
|||||||||||||||||||||||||
| Interest expense |
|
|
|
|
|||||||||||||||||||||||||
| Loss on extinguishment of debt |
|
|
|
|
|||||||||||||||||||||||||
| Net (gain) loss on divestitures |
|
|
(
|
(
|
|||||||||||||||||||||||||
| Total benefits, losses and expenses |
|
|
|
|
|||||||||||||||||||||||||
| Income from continuing operations before income tax expense (benefit) |
|
|
|
|
|||||||||||||||||||||||||
| Income tax expense (benefit) |
|
(
|
|
|
|||||||||||||||||||||||||
| Income from continuing operations |
|
|
|
|
|||||||||||||||||||||||||
| Loss from discontinued operations, net of income taxes |
(
|
|
(
|
|
|||||||||||||||||||||||||
| Net income |
|
|
|
|
|||||||||||||||||||||||||
| Less: | |||||||||||||||||||||||||||||
| Net income from continuing operations attributable to noncontrolling interests |
|
|
|
|
|||||||||||||||||||||||||
| Net income attributable to AIG |
|
|
|
|
|||||||||||||||||||||||||
| Less: Dividends on preferred stock |
|
|
|
|
|||||||||||||||||||||||||
| Net income attributable to AIG common shareholders | $ |
|
$ |
|
$ |
|
$ |
|
|||||||||||||||||||||
| Income per common share attributable to AIG common shareholders: | |||||||||||||||||||||||||||||
| Basic: | |||||||||||||||||||||||||||||
| Income from continuing operations | $ |
|
$ |
|
$ |
|
$ |
|
|||||||||||||||||||||
| Income from discontinued operations | $ |
|
$ |
|
$ |
|
$ |
|
|||||||||||||||||||||
| Net income attributable to AIG common shareholders | $ |
|
$ |
|
$ |
|
$ |
|
|||||||||||||||||||||
| Diluted: | |||||||||||||||||||||||||||||
| Income from continuing operations | $ |
|
$ |
|
$ |
|
$ |
|
|||||||||||||||||||||
| Income from discontinued operations | $ |
|
$ |
|
$ |
|
$ |
|
|||||||||||||||||||||
| Net income attributable to AIG common shareholders | $ |
|
$ |
|
$ |
|
$ |
|
|||||||||||||||||||||
| Weighted average shares outstanding: | |||||||||||||||||||||||||||||
| Basic |
|
|
|
|
|||||||||||||||||||||||||
| Diluted |
|
|
|
|
|||||||||||||||||||||||||
See accompanying Notes to Condensed Consolidated Financial Statements.
|
AIG | Second Quarter 2022 Form 10-Q
|
3
|
||||
American International Group, Inc.
Condensed Consolidated Statements of Comprehensive Income (Loss)
(unaudited)
| Three Months Ended | Six Months Ended | ||||||||||||||||||||||||||||
| June 30, | June 30, | ||||||||||||||||||||||||||||
| (in millions) | 2022 | 2021 | 2022 | 2021 | |||||||||||||||||||||||||
| Net income | $ |
|
$ |
|
$ |
|
$ |
|
|||||||||||||||||||||
| Other comprehensive income (loss), net of tax | |||||||||||||||||||||||||||||
| Change in unrealized appreciation (depreciation) of fixed maturity securities on which allowance for credit losses was taken |
|
|
(
|
|
|||||||||||||||||||||||||
| Change in unrealized appreciation (depreciation) of all other investments |
(
|
|
(
|
(
|
|||||||||||||||||||||||||
| Change in foreign currency translation adjustments |
(
|
|
(
|
|
|||||||||||||||||||||||||
| Change in retirement plan liabilities adjustment |
|
|
|
|
|||||||||||||||||||||||||
| Change in fair value of liabilities under fair value option attributable to changes in own credit risk |
(
|
|
(
|
(
|
|||||||||||||||||||||||||
| Other comprehensive income (loss) |
(
|
|
(
|
(
|
|||||||||||||||||||||||||
| Comprehensive income (loss) |
(
|
|
(
|
|
|||||||||||||||||||||||||
| Comprehensive income (loss) attributable to noncontrolling interests |
(
|
|
(
|
|
|||||||||||||||||||||||||
| Comprehensive income (loss) attributable to AIG | $ |
(
|
$ |
|
$ |
(
|
$ |
|
|||||||||||||||||||||
See accompanying Notes to Condensed Consolidated Financial Statements.
|
4
|
AIG | Second Quarter 2022 Form 10-Q
|
||||
Condensed Consolidated Statements of Equity
(unaudited)
| (in millions) |
Preferred
Stock and Additional Paid-in Capital |
Common
Stock |
Treasury
Stock |
Additional
Paid-in Capital |
Retained
Earnings |
Accumulated
Other Comprehensive Income (Loss) |
Total AIG
Share- holders' Equity |
Non- redeemable Non-
controlling Interests |
Total
Equity |
|||||||||||||||||||||||||||||||||||||||||||||||
| Three Months Ended June 30, 2022 | ||||||||||||||||||||||||||||||||||||||||||||||||||||||||
| Balance, beginning of period | $ |
|
$ |
|
$ |
(
|
$ |
|
$ |
|
$ |
(
|
$ |
|
$ |
|
$ |
|
||||||||||||||||||||||||||||||||||||||
| Common stock issued under stock plans | — | — |
|
(
|
— | — |
|
— |
|
|||||||||||||||||||||||||||||||||||||||||||||||
| Purchase of common stock | — | — |
(
|
— | — | — |
(
|
— |
(
|
|||||||||||||||||||||||||||||||||||||||||||||||
| Net income attributable to AIG or noncontrolling interests | — | — | — | — |
|
— |
|
|
|
|||||||||||||||||||||||||||||||||||||||||||||||
| Dividends on preferred stock | — | — | — | — |
(
|
— |
(
|
— |
(
|
|||||||||||||||||||||||||||||||||||||||||||||||
| Dividends on common stock | — | — | — | — |
(
|
— |
(
|
— |
(
|
|||||||||||||||||||||||||||||||||||||||||||||||
| Other comprehensive loss | — | — | — | — | — |
(
|
(
|
(
|
(
|
|||||||||||||||||||||||||||||||||||||||||||||||
| Contributions from noncontrolling interests | — | — | — | — | — | — | — |
|
|
|||||||||||||||||||||||||||||||||||||||||||||||
| Distributions to noncontrolling interests | — | — | — | — | — | — | — |
(
|
(
|
|||||||||||||||||||||||||||||||||||||||||||||||
| Other | — | — | — |
|
|
— |
|
|
|
|||||||||||||||||||||||||||||||||||||||||||||||
| Balance, end of period | $ |
|
$ |
|
$ |
(
|
$ |
|
$ |
|
$ |
(
|
$ |
|
$ |
|
$ |
|
||||||||||||||||||||||||||||||||||||||
| Three Months Ended June 30, 2021 | ||||||||||||||||||||||||||||||||||||||||||||||||||||||||
| Balance, beginning of period | $ |
|
$ |
|
$ |
(
|
$ |
|
$ |
|
$ |
|
$ |
|
$ |
|
$ |
|
||||||||||||||||||||||||||||||||||||||
| Common stock issued under stock plans | — | — |
|
(
|
— | — |
|
— |
|
|||||||||||||||||||||||||||||||||||||||||||||||
| Purchase of common stock | — | — |
(
|
— | — | — |
(
|
— |
(
|
|||||||||||||||||||||||||||||||||||||||||||||||
| Net income attributable to AIG or noncontrolling interests | — | — | — | — |
|
— |
|
|
|
|||||||||||||||||||||||||||||||||||||||||||||||
| Dividends on preferred stock | — | — | — | — |
(
|
— |
(
|
— |
(
|
|||||||||||||||||||||||||||||||||||||||||||||||
| Dividends on common stock | — | — | — | — |
(
|
— |
(
|
— |
(
|
|||||||||||||||||||||||||||||||||||||||||||||||
| Other comprehensive income (loss) | — | — | — | — | — |
|
|
(
|
|
|||||||||||||||||||||||||||||||||||||||||||||||
| Net decrease due to divestitures and acquisitions | — | — | — | — | — | — | — |
(
|
(
|
|||||||||||||||||||||||||||||||||||||||||||||||
| Contributions from noncontrolling interests | — | — | — | — | — | — | — |
|
|
|||||||||||||||||||||||||||||||||||||||||||||||
| Distributions to noncontrolling interests | — | — | — | — | — | — | — |
(
|
(
|
|||||||||||||||||||||||||||||||||||||||||||||||
| Other | — | — |
|
|
(
|
— |
|
— |
|
|||||||||||||||||||||||||||||||||||||||||||||||
| Balance, end of period | $ |
|
$ |
|
$ |
(
|
$ |
|
$ |
|
$ |
|
$ |
|
$ |
|
$ |
|
||||||||||||||||||||||||||||||||||||||
|
AIG | Second Quarter 2022 Form 10-Q
|
5
|
||||
Condensed Consolidated Statements of Equity (unaudited)(continued)
| (in millions) |
Preferred
Stock and Additional Paid-in Capital |
Common
Stock |
Treasury
Stock |
Additional
Paid-in Capital |
Retained
Earnings |
Accumulated
Other Comprehensive Income (Loss) |
Total AIG
Share- holders' Equity |
Non- redeemable Non-
controlling Interests |
Total
Equity |
|||||||||||||||||||||||||||||||||||||||||||||||
| Six Months Ended June 30, 2022 | ||||||||||||||||||||||||||||||||||||||||||||||||||||||||
| Balance, beginning of the year | $ |
|
$ |
|
$ |
(
|
$ |
|
$ |
|
$ |
|
$ |
|
$ |
|
$ |
|
||||||||||||||||||||||||||||||||||||||
| Common stock issued under stock plans | — | — |
|
(
|
— | — |
(
|
— |
(
|
|||||||||||||||||||||||||||||||||||||||||||||||
| Purchase of common stock | — | — |
(
|
— | — | — |
(
|
— |
(
|
|||||||||||||||||||||||||||||||||||||||||||||||
| Net income attributable to AIG or noncontrolling interests | — | — | — | — |
|
— |
|
|
|
|||||||||||||||||||||||||||||||||||||||||||||||
| Dividends on preferred stock | — | — | — | — |
(
|
— |
(
|
— |
(
|
|||||||||||||||||||||||||||||||||||||||||||||||
| Dividends on common stock | — | — | — | — |
(
|
— |
(
|
— |
(
|
|||||||||||||||||||||||||||||||||||||||||||||||
| Other comprehensive loss | — | — | — | — | — |
(
|
(
|
(
|
(
|
|||||||||||||||||||||||||||||||||||||||||||||||
| Contributions from noncontrolling interests | — | — | — | — | — | — | — |
|
|
|||||||||||||||||||||||||||||||||||||||||||||||
| Distributions to noncontrolling interests | — | — | — | — | — | — | — |
(
|
(
|
|||||||||||||||||||||||||||||||||||||||||||||||
| Other | — | — | — |
|
(
|
— |
|
|
|
|||||||||||||||||||||||||||||||||||||||||||||||
| Balance, end of period | $ |
|
$ |
|
$ |
(
|
$ |
|
$ |
|
$ |
(
|
$ |
|
$ |
|
$ |
|
||||||||||||||||||||||||||||||||||||||
| Six Months Ended June 30, 2021 | ||||||||||||||||||||||||||||||||||||||||||||||||||||||||
| Balance, beginning of year | $ |
|
$ |
|
$ |
(
|
$ |
|
$ |
|
$ |
|
$ |
|
$ |
|
$ |
|
||||||||||||||||||||||||||||||||||||||
| Common stock issued under stock plans | — | — |
|
(
|
— | — |
(
|
— |
(
|
|||||||||||||||||||||||||||||||||||||||||||||||
| Purchase of common stock | — | — |
(
|
— | — | — |
(
|
— |
(
|
|||||||||||||||||||||||||||||||||||||||||||||||
| Net income attributable to AIG or noncontrolling interests | — | — | — | — |
|
— |
|
|
|
|||||||||||||||||||||||||||||||||||||||||||||||
| Dividends on preferred stock | — | — | — | — |
(
|
— |
(
|
— |
(
|
|||||||||||||||||||||||||||||||||||||||||||||||
| Dividends on common stock | — | — | — | — |
(
|
— |
(
|
— |
(
|
|||||||||||||||||||||||||||||||||||||||||||||||
| Other comprehensive loss | — | — | — | — | — |
(
|
(
|
(
|
(
|
|||||||||||||||||||||||||||||||||||||||||||||||
| Net increase due to divestitures and acquisitions | — | — | — | — | — | — | — |
|
|
|||||||||||||||||||||||||||||||||||||||||||||||
| Contributions from noncontrolling interests | — | — | — | — | — | — | — |
|
|
|||||||||||||||||||||||||||||||||||||||||||||||
| Distributions to noncontrolling interests | — | — | — | — | — | — | — |
(
|
(
|
|||||||||||||||||||||||||||||||||||||||||||||||
| Other | — | — |
|
|
|
— |
|
— |
|
|||||||||||||||||||||||||||||||||||||||||||||||
| Balance, end of period | $ |
|
$ |
|
$ |
(
|
$ |
|
$ |
|
$ |
|
$ |
|
$ |
|
$ |
|
||||||||||||||||||||||||||||||||||||||
See accompanying Notes to Condensed Consolidated Financial Statements.
|
6
|
AIG | Second Quarter 2022 Form 10-Q
|
||||
American International Group, Inc.
Condensed Consolidated Statements of Cash Flows
(unaudited)
| Six Months Ended June 30, | |||||||||||||||||
| (in millions) | 2022 | 2021 | |||||||||||||||
| Cash flows from operating activities: | |||||||||||||||||
| Net income | $ |
|
$ |
|
|||||||||||||
| Loss from discontinued operations |
|
— | |||||||||||||||
| Adjustments to reconcile net income (loss) to net cash provided by operating activities: | |||||||||||||||||
| Noncash revenues, expenses, gains and losses included in income (loss): | |||||||||||||||||
| Net (gains) losses on sales of securities available for sale and other assets |
|
(
|
|||||||||||||||
| Net gain on divestitures |
(
|
(
|
|||||||||||||||
| Loss on extinguishment of debt |
|
|
|||||||||||||||
| Unrealized gains in earnings - net |
(
|
(
|
|||||||||||||||
| Equity in (income) loss from equity method investments, net of dividends or distributions |
(
|
|
|||||||||||||||
| Depreciation and other amortization |
|
|
|||||||||||||||
| Impairments of assets |
|
|
|||||||||||||||
| Changes in operating assets and liabilities: | |||||||||||||||||
| Insurance reserves |
|
|
|||||||||||||||
| Premiums and other receivables and payables - net |
(
|
(
|
|||||||||||||||
| Reinsurance assets, net |
|
(
|
|||||||||||||||
| Capitalization of deferred policy acquisition costs |
(
|
(
|
|||||||||||||||
| Current and deferred income taxes - net |
|
|
|||||||||||||||
| Other, net |
(
|
(
|
|||||||||||||||
| Total adjustments |
(
|
(
|
|||||||||||||||
| Net cash provided by operating activities |
|
|
|||||||||||||||
| Cash flows from investing activities: | |||||||||||||||||
| Proceeds from (payments for) | |||||||||||||||||
| Sales or distributions of: | |||||||||||||||||
| Available for sale securities |
|
|
|||||||||||||||
| Other securities |
|
|
|||||||||||||||
| Other invested assets |
|
|
|||||||||||||||
| Maturities of fixed maturity securities available for sale |
|
|
|||||||||||||||
| Principal payments received on and sales of mortgage and other loans receivable |
|
|
|||||||||||||||
| Purchases of: | |||||||||||||||||
| Available for sale securities |
(
|
(
|
|||||||||||||||
| Other securities |
(
|
(
|
|||||||||||||||
| Other invested assets |
(
|
(
|
|||||||||||||||
| Mortgage and other loans receivable |
(
|
(
|
|||||||||||||||
| Net change in short-term investments |
|
|
|||||||||||||||
| Other, net |
|
(
|
|||||||||||||||
| Net cash provided by (used in) investing activities |
|
(
|
|||||||||||||||
| Cash flows from financing activities: | |||||||||||||||||
| Proceeds from (payments for) | |||||||||||||||||
| Policyholder contract deposits |
|
|
|||||||||||||||
| Policyholder contract withdrawals |
(
|
(
|
|||||||||||||||
| Issuance of long-term debt |
|
|
|||||||||||||||
| Issuance of debt of consolidated investment entities |
|
|
|||||||||||||||
| Repayments of long-term debt |
(
|
(
|
|||||||||||||||
| Repayments of debt of consolidated investment entities |
(
|
(
|
|||||||||||||||
| Purchase of common stock |
(
|
(
|
|||||||||||||||
| Dividends paid on preferred stock |
(
|
(
|
|||||||||||||||
| Dividends paid on common stock |
(
|
(
|
|||||||||||||||
| Other, net |
(
|
(
|
|||||||||||||||
| Net cash used in financing activities |
(
|
(
|
|||||||||||||||
| Effect of exchange rate changes on cash and restricted cash |
(
|
(
|
|||||||||||||||
| Net increase (decrease) in cash and restricted cash |
|
(
|
|||||||||||||||
| Cash and restricted cash at beginning of year |
|
|
|||||||||||||||
| Cash and restricted cash at end of period | $ |
|
$ |
|
|||||||||||||
|
AIG | Second Quarter 2022 Form 10-Q
|
7
|
||||
American International Group, Inc.
Condensed Consolidated Statements of Cash Flows
(unaudited)(continued)
Supplementary Disclosure of Condensed Consolidated Cash Flow Information
| Six Months Ended June 30, | ||||||||||||||
| (in millions) | 2022 | 2021 | ||||||||||||
| Cash | $ |
|
$ |
|
||||||||||
| Restricted cash included in Short-term investments* |
|
|
||||||||||||
| Restricted cash included in Other assets* |
|
|
||||||||||||
| Total cash and restricted cash shown in the Condensed Consolidated Statements of Cash Flows | $ |
|
$ |
|
||||||||||
| Cash paid during the period for: | ||||||||||||||
| Interest | $ |
|
$ |
|
||||||||||
| Taxes | $ |
|
$ |
|
||||||||||
| Non-cash investing activities: | ||||||||||||||
| Fixed maturity securities available for sale received in connection with pension risk transfer transactions | $ |
|
$ |
|
||||||||||
| Fixed maturity securities received in connection with reinsurance transactions | $ |
|
$ |
|
||||||||||
| Fixed maturity securities transferred in connection with reinsurance transactions | $ |
(
|
$ |
(
|
||||||||||
| Non-cash financing activities: | ||||||||||||||
| Interest credited to policyholder contract deposits included in financing activities | $ |
|
$ |
|
||||||||||
| Fee income debited to policyholder contract deposits included in financing activities | $ |
(
|
$ |
(
|
||||||||||
*
Includes funds held for tax sharing payments to AIG Parent, security deposits, and replacement reserve deposits related to real estate.
See accompanying Notes to Condensed Consolidated Financial Statements.
|
8
|
AIG | Second Quarter 2022 Form 10-Q
|
||||
ITEM 1 |
Notes to Condensed Consolidated Financial Statements (unaudited) |
1. Basis of Presentation
American International Group, Inc. (AIG) is a leading global insurance organization serving customers in approximately
70
countries and jurisdictions. AIG companies serve commercial and individual customers through one of the most extensive worldwide property-casualty networks of any insurer. In addition, AIG companies are leading providers of life insurance and retirement services in the United States. AIG Common Stock, par value $
2.50
per share (AIG Common Stock), is listed on the New York Stock Exchange (NYSE: AIG). Unless the context indicates otherwise, the terms “AIG,” “we,” “us”, “our” or "the Company" mean American International Group, Inc. and its consolidated subsidiaries and the term “AIG Parent” means American International Group, Inc. and not any of its consolidated subsidiaries.
These unaudited Condensed Consolidated Financial Statements do not include all disclosures that are normally included in annual financial statements prepared in accordance with accounting principles generally accepted in the United States (GAAP) and should be read in conjunction with the audited Consolidated Financial Statements and the related notes included in our Annual Report on Form 10-K for the year ended December 31, 2021 (the 2021 Annual Report). The condensed consolidated financial information as of December 31, 2021 included herein has been derived from the audited Consolidated Financial Statements in the 2021 Annual Report.
Certain of our foreign subsidiaries included in the Condensed Consolidated Financial Statements report on the basis of a fiscal year ending November 30. The effect on our consolidated financial condition and results of operations of all material events occurring at these subsidiaries through the date of each of the periods presented in these Condensed Consolidated Financial Statements has been considered for adjustment and/or disclosure. In the opinion of management, these Condensed Consolidated Financial Statements contain normal recurring adjustments, including eliminations of material intercompany accounts and transactions, necessary for a fair statement of the results presented herein. Operating results for the six months ended June 30, 2022, are not necessarily indicative of the results that may be expected for the year ending December 31, 2022.
We evaluated the need to recognize or disclose events that occurred subsequent to June 30, 2022 and prior to the issuance of these Condensed Consolidated Financial Statements.
SALES/DISPOSALS OF ASSETS AND BUSINESSES
Separation of Life and Retirement Business and Relationship with Blackstone Inc.
On October 26, 2020, AIG announced its intention to separate its Life and Retirement business from AIG. On November 2, 2021, AIG and Blackstone Inc. (Blackstone) completed the acquisition by Blackstone of a
9.9
percent equity stake in Corebridge Financial, Inc., formerly known as SAFG Retirement Services, Inc. (Corebridge), which is the holding company for AIG’s Life and Retirement business. Pursuant to the definitive agreement, Blackstone will be required to hold its ownership interest in Corebridge following the completion of the separation of the Life and Retirement business, subject to exceptions permitting Blackstone to sell
25
%,
67
% and
75
% of its shares after the first, second and third anniversaries, respectively, of the initial public offering of Corebridge (the IPO), with the transfer restrictions terminating in full on the fifth anniversary of the IPO. In the event that the IPO of Corebridge is not completed prior to November 2, 2023, Blackstone will have the right to require AIG to undertake the IPO, and in the event that the IPO has not been completed prior to November 2, 2024, Blackstone will have the right to exchange all or a portion of its ownership interest in Corebridge for shares of AIG’s common stock on the terms set forth in the definitive agreement. On November 1, 2021, Corebridge declared a dividend payable to AIG Parent in the amount of $
8.3
billion. In connection with such dividend, Corebridge issued a promissory note to AIG Parent in the amount of $
8.3
billion, which is required to be paid to AIG Parent prior to the IPO of Corebridge. On April 5, 2022, Corebridge issued senior unsecured notes in the aggregate principal amount of $
6.5
billion, the proceeds of which were used to repay a portion of the $
8.3
billion promissory note previously issued by Corebridge to AIG. While we currently believe the IPO is the next step in the separation of the Life and Retirement business from AIG, no assurance can be given regarding the form that future separation transactions may take or the specific terms or timing thereof, or that a separation will in fact occur. Any separation transaction will be subject to the satisfaction of various conditions and approvals, including approval by the AIG Board of Directors, receipt of insurance and other required regulatory approvals, and satisfaction of any applicable requirements of the Securities and Exchange Commission.
On December 15, 2021, AIG and Blackstone Real Estate Income Trust (BREIT), a long-term, perpetual capital vehicle affiliated with Blackstone, completed the acquisition by BREIT of AIG’s interests in a U.S. affordable housing portfolio. The historical results of the U.S. affordable housing portfolio were reported in our Life and Retirement operating segments.
|
AIG | Second Quarter 2022 Form 10-Q
|
9
|
||||
ITEM 1 |
Notes to Condensed Consolidated Financial Statements (unaudited) |
1. Basis of Presentation
Sale of Certain AIG Life and Retirement Retail Mutual Funds Business
On February 8, 2021, AIG announced the execution of a definitive agreement with Touchstone Investments (Touchstone), an indirect wholly-owned subsidiary of Western & Southern Financial Group, to sell certain assets of Life and Retirement’s Retail Mutual Funds business. This sale consisted of the reorganization of
twelve
of the retail mutual funds managed by SunAmerica Asset Management, LLC (SAAMCo), a Life and Retirement entity, into certain Touchstone funds and was subject to certain conditions, including approval of the fund reorganizations by the retail mutual fund boards of directors/trustees and fund shareholders. The transaction closed on July 16, 2021, at which time we received initial proceeds and the
twelve
retail mutual funds managed by SAAMCo, with $
6.8
billion in assets, were reorganized into Touchstone funds. Additional consideration may be earned over a
three-year
period based on asset levels in certain reorganized funds.
Six
retail mutual funds managed by SAAMCo and not included in the transaction were liquidated. We will retain our fund management platform and capabilities dedicated to our variable annuity insurance products.
DEBT CASH TENDER OFFERS AND REDEMPTIONS
In the six months ended June 30, 2022, we repurchased, through cash tender offers, and redeemed $
7.6
billion aggregate principal amount of certain notes and debentures issued or guaranteed by AIG, for an aggregate purchase price of $
7.8
billion, resulting in a total loss on extinguishment of debt of $
299
million.
DEBT ISSUANCE
On April 5, 2022, Corebridge issued and sold $
6.5
billion of senior unsecured notes consisting of $
1.0
billion aggregate principal amount of its
3.50
% Senior Notes due 2025, $
1.25
billion aggregate principal amount of its
3.65
% Senior Notes due 2027, $
1.0
billion aggregate principal amount of its
3.85
% Senior Notes due 2029, $
1.5
billion aggregate principal amount of its
3.90
% Senior Notes due 2032, $
500
million aggregate principal amount of its
4.35
% Senior Notes due 2042 and $
1.25
billion aggregate principal amount of its
4.40
% Senior Notes due 2052.
CREDIT FACILITIES
On February 25, 2022, Corebridge entered into an
18
-Month Delayed Draw Term Loan Agreement (the
18
-Month DDTL Facility) among Corebridge, as borrower, the lenders party thereto and the administrative agent thereto, and a
3
-Year Delayed Draw Term Loan Agreement (the
3
-Year DDTL Facility) among Corebridge, as borrower, the lenders party thereto and the administrative agent thereto.
The
18
-Month DDTL Facility and
3
-Year DDTL Facility provided Corebridge with committed delayed draw term loan facilities in the aggregate principal amount of $
6
billion and $
3
billion, respectively. On April 6, 2022, in connection with the issuance of certain senior unsecured notes of Corebridge, (i) the commitments under the
18
-Month DDTL Facility were terminated in full and (ii) the commitments under the
3
-Year DDTL Facility were reduced from $
3.0
billion to $
2.5
billion. The ability to borrow under the
3
-Year DDTL Facility is subject to, among other conditions, Corebridge’s confirmation to the administrative agent that an initial public offering of Corebridge is expected to be consummated within
business days following such borrowing. Commitments under the
3
-Year DDTL Facility will remain available for borrowing until December 30, 2022, subject to the terms and conditions thereof.
As of June 30, 2022, a total of $
2.5
billion remained available for borrowing under the
3
-Year DDTL Facility.
On May 12, 2022, Corebridge entered into a revolving syndicated credit facility (the Corebridge Facility) as a potential source of liquidity for general corporate purposes. The Corebridge Facility provides for aggregate commitments by the bank syndicate to provide unsecured revolving loans and/or standby letters of credit of up to $
2.5
billion without any limits on the type of borrowings and is scheduled to expire on May 12, 2027 or if the IPO has not occurred on or prior to December 29, 2023, on such date. As of June 30, 2022, a total of $
2.5
billion remained available for borrowing under the Corebridge Facility.
|
10
|
AIG | Second Quarter 2022 Form 10-Q
|
||||
ITEM 1 |
Notes to Condensed Consolidated Financial Statements (unaudited) |
1. Basis of Presentation
USE OF ESTIMATES
The preparation of financial statements in accordance with U.S. GAAP requires the application of accounting policies that often involve a significant degree of judgment. Accounting policies that we believe are most dependent on the application of estimates and assumptions are considered our critical accounting estimates and are related to the determination of:
•
loss reserves;
•
future policy benefit reserves for life and accident and health insurance contracts;
•
liabilities for guaranteed benefit features of variable annuity, fixed annuity and fixed index annuity products;
•
embedded derivative liabilities for fixed index annuity and life products;
•
estimated gross profits to value deferred acquisition costs and unearned revenue for investment-oriented products;
•
reinsurance assets, including the allowance for credit losses and disputes;
•
goodwill impairment;
•
allowance for credit losses on certain investments, primarily on loans and available for sale fixed maturity securities;
•
legal contingencies;
•
fair value measurements of certain financial assets and financial liabilities; and
•
income taxes, in particular the recoverability of our deferred tax asset and establishment of provisions for uncertain tax positions.
These accounting estimates require the use of assumptions about matters, some of which are highly uncertain at the time of estimation. To the extent actual experience differs from the assumptions used, our consolidated financial condition, results of operations and cash flows could be materially affected.
2. Summary of Significant Accounting Policies
ACCOUNTING STANDARDS ADOPTED
Reference Rate Reform
On March 12, 2020, the FASB issued an accounting standard that provides temporary optional guidance to ease the potential burden in accounting for reference rate reform. The standard allows us to account for certain contract modifications that result from the discontinuation of the London Inter-Bank Offered Rate (LIBOR) or another reference rate as a continuation of the existing contract without additional analysis. This standard may be elected and applied prospectively over time from March 12, 2020 through December 31, 2022 as reference rate reform activities occur.
Where permitted by the guidance, we have accounted for contract modifications stemming from the discontinuation of LIBOR or another reference rate as a continuation of the existing contract. As part of our implementation efforts, we have and will continue to assess our operational readiness and current and alternative reference rates’ merits, limitations, risks and suitability for our investment and insurance processes. The adoption of the standard has not had, and is not expected to have, a material impact on our reported consolidated financial condition, results of operations, cash flows and required disclosures.
FUTURE APPLICATION OF ACCOUNTING STANDARDS
Targeted Improvements to the Accounting for Long-Duration Contracts
In August 2018, the FASB issued an accounting standard update with the objective of making targeted improvements to the existing recognition, measurement, presentation, and disclosure requirements for long-duration contracts issued by an insurance entity.
The Company will adopt the standard on January 1, 2023. We continue to evaluate and expect the adoption of this standard will impact our financial condition, results of operations, statement of cash flows and disclosures, as well as systems, processes and controls.
|
AIG | Second Quarter 2022 Form 10-Q
|
11
|
||||
ITEM 1 |
Notes to Condensed Consolidated Financial Statements (unaudited) |
2. Summary of Significant Accounting Policies
The Company will adopt the standard using the modified retrospective transition method relating to liabilities for traditional and limited payment contracts and deferred policy acquisition costs associated therewith. The Company will adopt the standard in relation to market risk benefits (MRBs) on a retrospective basis. Based upon this transition method, the Company currently estimates that the January 1, 2021 transition date (Transition Date) impact from adoption is likely to result in a decrease in AIG’s equity between approximately $
1.0
billion and $
3.0
billion in AIG’s Life and Retirement business. The most significant drivers of the transition adjustment are expected to be (1) changes related to market risk benefits in our Individual Retirement and Group Retirement segments, including the impact of non-performance adjustments (2) changes to the discount rate which will most significantly impact our Life Insurance and Institutional Markets segments and (3) the removal of balances recorded in accumulated other comprehensive income (loss) (AOCI) related to changes in unrealized appreciation (depreciation) on investments.
Market risk benefits:
The standard requires the measurement of all MRBs associated with deposit (or account balance) contracts at fair value at each reporting period. Changes in fair value compared to prior periods will be recorded and presented separately within the income statement, with the exception of instrument-specific credit risk changes (non-performance adjustments), which will be recognized in other comprehensive income. MRBs will impact both retained earnings and AOCI upon transition.
As MRBs are required to be accounted for at fair value, the quarterly valuation of these items will result in variability and volatility in the Company’s results following adoption.
Discount rate assumption:
The standard requires the discount rate assumption for the liability for future policy benefits to be updated at the end of each reporting period using an upper-medium grade (low credit risk) fixed income instrument yield that maximizes the use of observable market inputs. Upon transition, the Company currently estimates an adjustment to AOCI due to the fact that the market upper-medium grade (low credit risk) interest rates as of the Transition Date differ from reserve interest accretion rates. Lower interest rates result in a higher liability for future policy benefits, and are anticipated to more significantly impact our Life Insurance and Institutional Markets segments.
Following adoption, the impact of changes to discount rates will be recognized through other comprehensive income. Changes resulting from unlocking the discount rate each reporting period will primarily impact term life insurance and other traditional life insurance products, as well as pension risk transfer and structured settlement products.
Removal of balances related to changes in unrealized appreciation (depreciation) on investments:
Under the standard, the majority of balances recorded in AOCI related to changes in unrealized appreciation (depreciation) on investments will be eliminated.
In addition to the above, the standard also:
•
Requires the review and if necessary, update of future policy benefit assumptions at least annually for traditional and limited pay long duration contracts, with the recognition and separate presentation of any resulting re-measurement gain or loss (except for discount rate changes as noted above) in the income statement.
•
Simplifies the amortization of DAC to a constant level basis over the expected term of the related contracts with adjustments for unexpected terminations, but no longer requires an impairment test.
•
Increased disclosures of disaggregated roll-forwards of several balances, including: liabilities for future policy benefits, deferred acquisition costs, account balances, market risk benefits, separate account liabilities and information about significant inputs, judgments and methods used in measurement and changes thereto and impact of those changes.
We expect that the accounting for Fortitude Reinsurance Company Ltd. (Fortitude Re) will continue to remain largely unchanged. With respect to Fortitude Re, the reinsurance assets, including the discount rates, will continue to be calculated using the same methodology and assumptions as the direct policies. Accounting for modified coinsurance (modco) remains unchanged.
The Company has created a governance framework and a plan to support implementation of the updated standard. As part of its implementation plan, the Company has also advanced the modernization of its actuarial technology platform to enhance its modeling, data management, experience study and analytical capabilities, increase the end-to-end automation of key reporting and analytical processes and optimize its control framework. The Company has designed and begun implementation and testing of internal controls related to the new processes created as part of implementing the updated standard and will continue to refine these internal controls until the formal implementation in the first quarter of 2023.
Troubled Debt Restructuring and Vintage Disclosures
In March 2022, the FASB issued an accounting standard update that eliminates the accounting guidance for troubled debt restructurings for creditors and amends the guidance on “vintage disclosures” to require disclosure of current-period gross write-offs by year of origination. The standard also updates the requirements for accounting for credit losses by adding enhanced disclosures for creditors related to loan refinancings and restructurings for borrowers experiencing financial difficulty. Because the Company has already adopted the current expected credit loss (CECL) model, the amendments in this standard are effective for fiscal years beginning after December 15, 2022, including interim periods within those years. We do not expect the standard to have a material impact on our reported consolidated financial condition, results of operations, cash flows or required disclosures.
|
12
|
AIG | Second Quarter 2022 Form 10-Q
|
||||
ITEM 1 |
Notes to Condensed Consolidated Financial Statements (unaudited) |
2. Summary of Significant Accounting Policies
Fair Value Measurement
On June 30, 2022, the FASB issued an accounting standards update to address diversity in practice by clarifying that a contractual sale restriction should not be considered in the measurement of the fair value of an equity security. It also requires entities with investments in equity securities subject to contractual sale restrictions to disclose certain qualitative and quantitative information about such securities. The guidance is effective for public companies for fiscal years beginning after December 15, 2023 and interim period within those years, with early adoption permitted. For entities other than investment companies, the accounting standards update applies prospectively, with any adjustments resulting from adoption recognized in earnings on the date of adoption. We are assessing the impact of this standard.
3. Segment Information
We report our results of operations consistent with the manner in which our chief operating decision makers review the business to assess performance and allocate resources, as follows:
GENERAL INSURANCE
General Insurance business is presented as
two
operating segments:
•
North America –
consists of insurance businesses in the United States, Canada and Bermuda, and our global reinsurance business, AIG Re.
•
International –
consists of regional insurance businesses in Japan, the United Kingdom, Europe, Middle East and Africa (EMEA region), Asia Pacific, Latin America and Caribbean, and China. International also includes the results of Talbot Holdings, Ltd. as well as AIG’s Global Specialty business.
North America and International operating segments consist of the following products:
–
Commercial Lines – consists of Property, Liability, Financial Lines, and Specialty.
–
Personal Insurance – consists of Accident & Health and Personal Lines.
LIFE AND RETIREMENT
Life and Retirement business is presented as
four
operating segments:
•
Individual Retirement –
consists of fixed annuities, fixed index annuities, variable annuities and retail mutual funds.
•
Group Retirement –
consists of record-keeping, plan administrative and compliance services, financial planning and advisory solutions offered to employer-defined contribution plan participants, along with proprietary and non-proprietary annuities and advisory and brokerage products offered outside of plans.
•
Life Insurance –
primary products in the U.S. include term life and universal life insurance. International operations primarily include distribution of life and health products in the UK and Ireland.
•
Institutional Markets –
consists of stable value wrap products, structured settlement and pension risk transfer annuities, corporate- and bank-owned life insurance, high net worth products and guaranteed investment contracts (GICs).
OTHER OPERATIONS
Other Operations primarily consists of income from assets held by AIG Parent and other corporate subsidiaries, deferred tax assets related to tax attributes, corporate expenses and intercompany eliminations, our institutional asset management business and results of our consolidated investment entities, General Insurance portfolios in run-off as well as the historical results of our legacy insurance lines ceded to Fortitude Re.
|
AIG | Second Quarter 2022 Form 10-Q
|
13
|
||||
ITEM 1 |
Notes to Condensed Consolidated Financial Statements (unaudited) |
3. Segment Information
The following table presents AIG’s continuing operations by operating segment:
| Three Months Ended June 30, | 2022 | 2021 | |||||||||||||||||||||||||||||||||
| (in millions) |
Adjusted
Revenues |
Adjusted
Pre-tax Income (Loss) |
Adjusted
Revenues |
Adjusted
Pre-tax Income (Loss) |
|||||||||||||||||||||||||||||||
| General Insurance | |||||||||||||||||||||||||||||||||||
| North America | $ |
|
$ |
|
(a)
|
$ |
|
$ |
|
(a)
|
|||||||||||||||||||||||||
| International |
|
|
(a)
|
|
|
(a)
|
|||||||||||||||||||||||||||||
| Net investment income |
|
|
|
|
|||||||||||||||||||||||||||||||
| Total General Insurance |
|
|
|
|
|||||||||||||||||||||||||||||||
| Life and Retirement | |||||||||||||||||||||||||||||||||||
| Individual Retirement |
|
|
|
|
|||||||||||||||||||||||||||||||
| Group Retirement |
|
|
|
|
|||||||||||||||||||||||||||||||
| Life Insurance |
|
|
|
|
|||||||||||||||||||||||||||||||
| Institutional Markets |
|
|
|
|
|||||||||||||||||||||||||||||||
| Total Life and Retirement |
|
|
|
|
|||||||||||||||||||||||||||||||
| Other Operations | |||||||||||||||||||||||||||||||||||
| Other Operations before consolidation and eliminations |
|
(
|
|
(
|
|||||||||||||||||||||||||||||||
| Consolidation and eliminations |
(
|
(
|
(
|
(
|
|||||||||||||||||||||||||||||||
| Total Other Operations |
|
(
|
|
(
|
|||||||||||||||||||||||||||||||
| Total |
|
|
|
|
|||||||||||||||||||||||||||||||
| Reconciling items: | |||||||||||||||||||||||||||||||||||
| Changes in fair value of securities used to hedge guaranteed living benefits |
|
|
|
|
|||||||||||||||||||||||||||||||
| Changes in benefit reserves and DAC, VOBA and DSI related to net realized gains (losses) | — |
(
|
— |
|
|||||||||||||||||||||||||||||||
| Changes in the fair value of equity securities |
(
|
(
|
(
|
(
|
|||||||||||||||||||||||||||||||
| Other income (expense) - net |
(
|
— |
(
|
— | |||||||||||||||||||||||||||||||
| Loss on extinguishment of debt | — |
(
|
— |
(
|
|||||||||||||||||||||||||||||||
| Net investment income on Fortitude Re funds withheld assets |
|
|
|
|
|||||||||||||||||||||||||||||||
| Net realized gains (losses) on Fortitude Re funds withheld assets |
(
|
(
|
|
|
|||||||||||||||||||||||||||||||
| Net realized gains (losses) on Fortitude Re funds withheld embedded derivative |
|
|
(
|
(
|
|||||||||||||||||||||||||||||||
|
Net realized gains (losses)
(b)
|
|
|
(
|
(
|
|||||||||||||||||||||||||||||||
| Net loss on divestitures | — |
(
|
— |
(
|
|||||||||||||||||||||||||||||||
| Non-operating litigation reserves and settlements |
|
|
|
|
|||||||||||||||||||||||||||||||
| Favorable prior year development and related amortization changes ceded under retroactive reinsurance agreements | — |
|
— |
|
|||||||||||||||||||||||||||||||
| Net loss reserve discount charge | — |
(
|
— |
(
|
|||||||||||||||||||||||||||||||
| Integration and transaction costs associated with acquiring or divesting businesses | — |
(
|
— |
(
|
|||||||||||||||||||||||||||||||
| Restructuring and other costs | — |
(
|
— |
(
|
|||||||||||||||||||||||||||||||
| Non-recurring costs related to regulatory or accounting changes | — |
(
|
— |
(
|
|||||||||||||||||||||||||||||||
| Revenues and pre-tax income | $ |
|
$ |
|
$ |
|
$ |
|
|||||||||||||||||||||||||||
|
14
|
AIG | Second Quarter 2022 Form 10-Q
|
||||
ITEM 1 |
Notes to Condensed Consolidated Financial Statements (unaudited) |
3. Segment Information
| Six Months Ended June 30, | 2022 | 2021 | |||||||||||||||||||||||||||||||||
| (in millions) |
Adjusted
Revenues |
Adjusted
Pre-tax Income (Loss) |
Adjusted
Revenues |
Adjusted
Pre-tax Income (Loss) |
|||||||||||||||||||||||||||||||
| General Insurance | |||||||||||||||||||||||||||||||||||
| North America | $ |
|
$ |
|
(a)
|
$ |
|
$ |
(
|
(a)
|
|||||||||||||||||||||||||
| International |
|
|
(a)
|
|
|
(a)
|
|||||||||||||||||||||||||||||
| Net investment income |
|
|
|
|
|||||||||||||||||||||||||||||||
| Total General Insurance |
|
|
|
|
|||||||||||||||||||||||||||||||
| Life and Retirement | |||||||||||||||||||||||||||||||||||
| Individual Retirement |
|
|
|
|
|||||||||||||||||||||||||||||||
| Group Retirement |
|
|
|
|
|||||||||||||||||||||||||||||||
| Life Insurance |
|
|
|
(
|
|||||||||||||||||||||||||||||||
| Institutional Markets |
|
|
|
|
|||||||||||||||||||||||||||||||
| Total Life and Retirement |
|
|
|
|
|||||||||||||||||||||||||||||||
| Other Operations | |||||||||||||||||||||||||||||||||||
| Other Operations before consolidation and eliminations |
|
(
|
|
(
|
|||||||||||||||||||||||||||||||
| AIG consolidation and eliminations |
(
|
(
|
(
|
(
|
|||||||||||||||||||||||||||||||
| Total Other Operations |
|
(
|
|
(
|
|||||||||||||||||||||||||||||||
| Total |
|
|
|
|
|||||||||||||||||||||||||||||||
| Reconciling items: | |||||||||||||||||||||||||||||||||||
| Changes in fair value of securities used to hedge guaranteed living benefits |
|
|
|
|
|||||||||||||||||||||||||||||||
| Changes in benefit reserves and DAC, VOBA and DSI related to net realized gains (losses) | — |
(
|
— |
(
|
|||||||||||||||||||||||||||||||
| Changes in the fair value of equity securities |
(
|
(
|
|
|
|||||||||||||||||||||||||||||||
| Other income (expense) - net |
(
|
— |
(
|
— | |||||||||||||||||||||||||||||||
| Loss on extinguishment of debt | — |
(
|
— |
(
|
|||||||||||||||||||||||||||||||
| Net investment income on Fortitude Re funds withheld assets |
|
|
|
|
|||||||||||||||||||||||||||||||
| Net realized gains (losses) on Fortitude Re funds withheld assets |
(
|
(
|
|
|
|||||||||||||||||||||||||||||||
| Net realized gains on Fortitude Re funds withheld embedded derivative |
|
|
|
|
|||||||||||||||||||||||||||||||
|
Net realized gains
(b)
|
|
|
|
|
|||||||||||||||||||||||||||||||
| Net gain on divestitures | — |
|
— |
|
|||||||||||||||||||||||||||||||
| Non-operating litigation reserves and settlements |
|
|
|
|
|||||||||||||||||||||||||||||||
| Favorable prior year development and related amortization changes ceded under retroactive reinsurance agreements | — |
|
— |
|
|||||||||||||||||||||||||||||||
| Net loss reserve discount benefit | — |
|
— |
|
|||||||||||||||||||||||||||||||
| Integration and transaction costs associated with acquiring or divesting businesses | — |
(
|
— |
(
|
|||||||||||||||||||||||||||||||
| Restructuring and other costs | — |
(
|
— |
(
|
|||||||||||||||||||||||||||||||
| Non-recurring costs related to regulatory or accounting changes | — |
(
|
— |
(
|
|||||||||||||||||||||||||||||||
| Revenues and pre-tax income | $ |
|
$ |
|
$ |
|
$ |
|
|||||||||||||||||||||||||||
(a)
General Insurance North America’s and General Insurance International’s Adjusted pre-tax income does not include Net investment income as the investment portfolio results are managed at the General Insurance level. Net investment income is shown separately as a component of General Insurance’s total Adjusted pre-tax income results.
(b)
Includes all net realized gains and losses except earned income (periodic settlements and changes in settlement accruals) on derivative instruments used for non-qualifying (economic) hedging or for asset replication and net realized gains and losses on Fortitude Re funds withheld assets held by AIG in support of Fortitude Re’s reinsurance obligations to AIG (Fortitude Re funds withheld assets).
|
AIG | Second Quarter 2022 Form 10-Q
|
15
|
||||
ITEM 1 |
Notes to Condensed Consolidated Financial Statements (unaudited) |
4. Fair Value Measurements
4. Fair Value Measurements
FAIR VALUE MEASUREMENTS ON A RECURRING BASIS
Assets and liabilities recorded at fair value in the Condensed Consolidated Balance Sheets are measured and classified in accordance with a fair value hierarchy consisting of three “levels” based on the observability of valuation inputs:
•
Level 1:
Fair value measurements based on quoted prices (unadjusted) in active markets that we have the ability to access for identical assets or liabilities. Market price data generally is obtained from exchange or dealer markets. We do not adjust the quoted price for such instruments.
•
Level 2:
Fair value measurements based on inputs other than quoted prices included in Level 1 that are observable for the asset or liability, either directly or indirectly. Level 2 inputs include quoted prices for similar assets and liabilities in active markets, quoted prices for identical or similar assets or liabilities in markets that are not active, and inputs other than quoted prices that are observable for the asset or liability, such as interest rates and yield curves that are observable at commonly quoted intervals.
•
Level 3:
Fair value measurements based on valuation techniques that use significant inputs that are unobservable. Both observable and unobservable inputs may be used to determine the fair values of positions classified in Level 3. The circumstances for using these measurements include those in which there is little, if any, market activity for the asset or liability. Therefore, we must make certain assumptions about the inputs a hypothetical market participant would use to value that asset or liability.
In certain cases, the inputs used to measure fair value may fall into different levels of the fair value hierarchy. In such cases, the level in the fair value hierarchy within which the fair value measurement in its entirety falls is determined based on the lowest level input that is significant to the fair value measurement in its entirety.
|
16
|
AIG | Second Quarter 2022 Form 10-Q
|
||||
ITEM 1 |
Notes to Condensed Consolidated Financial Statements (unaudited) |
4. Fair Value Measurements
ASSETS AND LIABILITIES MEASURED AT FAIR VALUE ON A RECURRING BASIS
The following table presents information about assets and liabilities measured at fair value on a recurring basis and indicates the level of the fair value measurement based on the observability of the inputs used:
| June 30, 2022 | Level 1 | Level 2 | Level 3 |
Counterparty Netting
(a)
|
Cash Collateral | Total | ||||||||||||||||||||||||||||||||
| (in millions) | ||||||||||||||||||||||||||||||||||||||
| Assets: | ||||||||||||||||||||||||||||||||||||||
| Bonds available for sale: | ||||||||||||||||||||||||||||||||||||||
|
U.S. government and government sponsored entities
|
$ |
|
$ |
|
$ |
|
$ | — | $ | — | $ |
|
||||||||||||||||||||||||||
|
Obligations of states, municipalities and political subdivisions
|
|
|
|
— | — |
|
||||||||||||||||||||||||||||||||
| Non-U.S. governments |
|
|
|
— | — |
|
||||||||||||||||||||||||||||||||
| Corporate debt |
|
|
|
— | — |
|
||||||||||||||||||||||||||||||||
| RMBS |
|
|
|
— | — |
|
||||||||||||||||||||||||||||||||
| CMBS |
|
|
|
— | — |
|
||||||||||||||||||||||||||||||||
| CDO/ABS |
|
|
|
— | — |
|
||||||||||||||||||||||||||||||||
|
Total bonds available for sale
|
|
|
|
— | — |
|
||||||||||||||||||||||||||||||||
|
Other bond securities:
|
||||||||||||||||||||||||||||||||||||||
| U.S. government and government sponsored entities |
|
|
|
— | — |
|
||||||||||||||||||||||||||||||||
| Obligations of states, municipalities and political subdivisions |
|
|
|
— | — |
|
||||||||||||||||||||||||||||||||
| Non-U.S. governments |
|
|
|
— | — |
|
||||||||||||||||||||||||||||||||
| Corporate debt |
|
|
|
— | — |
|
||||||||||||||||||||||||||||||||
| RMBS |
|
|
|
— | — |
|
||||||||||||||||||||||||||||||||
| CMBS |
|
|
|
— | — |
|
||||||||||||||||||||||||||||||||
| CDO/ABS |
|
|
|
— | — |
|
||||||||||||||||||||||||||||||||
|
Total other bond securities
|
|
|
|
— | — |
|
||||||||||||||||||||||||||||||||
|
Equity securities
|
|
|
|
— | — |
|
||||||||||||||||||||||||||||||||
|
Other invested assets
(b)
|
|
|
|
— | — |
|
||||||||||||||||||||||||||||||||
|
Derivative assets
(c)
:
|
||||||||||||||||||||||||||||||||||||||
| Interest rate contracts |
|
|
|
— | — |
|
||||||||||||||||||||||||||||||||
|
Foreign exchange contracts
|
|
|
|
— | — |
|
||||||||||||||||||||||||||||||||
|
Equity contracts
|
|
|
|
— | — |
|
||||||||||||||||||||||||||||||||
|
Commodity contracts
|
|
|
|
— | — |
|
||||||||||||||||||||||||||||||||
|
Credit contracts
|
|
|
|
— | — |
|
||||||||||||||||||||||||||||||||
| Other contracts |
|
|
|
— | — |
|
||||||||||||||||||||||||||||||||
|
Counterparty netting and cash collateral
|
— | — | — |
(
|
(
|
(
|
||||||||||||||||||||||||||||||||
|
Total derivative assets
|
|
|
|
(
|
(
|
|
||||||||||||||||||||||||||||||||
|
Short-term investments
|
|
|
|
— | — |
|
||||||||||||||||||||||||||||||||
|
Other assets
(c)
|
|
|
|
— | — |
|
||||||||||||||||||||||||||||||||
|
Separate account assets
|
|
|
|
— | — |
|
||||||||||||||||||||||||||||||||
| Total | $ |
|
$ |
|
$ |
|
$ |
(
|
$ |
(
|
$ |
|
||||||||||||||||||||||||||
| Liabilities: | ||||||||||||||||||||||||||||||||||||||
| Policyholder contract deposits | $ |
|
$ |
|
$ |
|
$ | — | $ | — | $ |
|
||||||||||||||||||||||||||
|
Derivative liabilities
(c)
:
|
||||||||||||||||||||||||||||||||||||||
|
Interest rate contracts
|
|
|
|
— | — |
|
||||||||||||||||||||||||||||||||
|
Foreign exchange contracts
|
|
|
|
— | — |
|
||||||||||||||||||||||||||||||||
|
Equity contracts
|
|
|
|
— | — |
|
||||||||||||||||||||||||||||||||
|
Credit contracts
|
|
|
|
— | — |
|
||||||||||||||||||||||||||||||||
|
Counterparty netting and cash collateral
|
— | — | — |
(
|
(
|
(
|
||||||||||||||||||||||||||||||||
|
Total derivative liabilities
|
|
|
|
(
|
(
|
|
||||||||||||||||||||||||||||||||
|
Fortitude Re funds withheld payable
|
|
|
(
|
— | — |
(
|
||||||||||||||||||||||||||||||||
|
Long-term debt
|
|
|
|
— | — |
|
||||||||||||||||||||||||||||||||
| Total | $ |
|
$ |
|
$ |
|
$ |
(
|
$ |
(
|
$ |
|
||||||||||||||||||||||||||
|
AIG | Second Quarter 2022 Form 10-Q
|
17
|
||||
ITEM 1 |
Notes to Condensed Consolidated Financial Statements (unaudited) |
4. Fair Value Measurements
| December 31, 2021 | Level 1 | Level 2 | Level 3 |
Counterparty
Netting
(a)
|
Cash
Collateral |
Total | ||||||||||||||||||||||||||||||||
| (in millions) | ||||||||||||||||||||||||||||||||||||||
|
Assets:
|
||||||||||||||||||||||||||||||||||||||
| Bonds available for sale: | ||||||||||||||||||||||||||||||||||||||
|
U.S. government and government sponsored entities
|
$ |
|
$ |
|
$ |
|
$ | — | $ | — | $ |
|
||||||||||||||||||||||||||
|
Obligations of states, municipalities and political subdivisions
|
|
|
|
— | — |
|
||||||||||||||||||||||||||||||||
| Non-U.S. governments |
|
|
|
— | — |
|
||||||||||||||||||||||||||||||||
| Corporate debt |
|
|
|
— | — |
|
||||||||||||||||||||||||||||||||
| RMBS |
|
|
|
— | — |
|
||||||||||||||||||||||||||||||||
| CMBS |
|
|
|
— | — |
|
||||||||||||||||||||||||||||||||
| CDO/ABS |
|
|
|
— | — |
|
||||||||||||||||||||||||||||||||
|
Total bonds available for sale
|
|
|
|
— | — |
|
||||||||||||||||||||||||||||||||
|
Other bond securities:
|
||||||||||||||||||||||||||||||||||||||
| U.S. government and government sponsored entities |
|
|
|
— | — |
|
||||||||||||||||||||||||||||||||
| Obligations of states, municipalities and political subdivisions |
|
|
|
— | — |
|
||||||||||||||||||||||||||||||||
| Non-U.S. governments |
|
|
|
— | — |
|
||||||||||||||||||||||||||||||||
| Corporate debt |
|
|
|
— | — |
|
||||||||||||||||||||||||||||||||
| RMBS |
|
|
|
— | — |
|
||||||||||||||||||||||||||||||||
| CMBS |
|
|
|
— | — |
|
||||||||||||||||||||||||||||||||
| CDO/ABS |
|
|
|
— | — |
|
||||||||||||||||||||||||||||||||
|
Total other bond securities
|
|
|
|
— | — |
|
||||||||||||||||||||||||||||||||
|
Equity securities
|
|
|
|
— | — |
|
||||||||||||||||||||||||||||||||
|
Other invested assets
(b)
|
|
|
|
— | — |
|
||||||||||||||||||||||||||||||||
|
Derivative assets
(c)
:
|
||||||||||||||||||||||||||||||||||||||
| Interest rate contracts |
|
|
|
— | — |
|
||||||||||||||||||||||||||||||||
|
Foreign exchange contracts
|
|
|
|
— | — |
|
||||||||||||||||||||||||||||||||
|
Equity contracts
|
|
|
|
— | — |
|
||||||||||||||||||||||||||||||||
| Commodity contracts |
|
|
|
— | — |
|
||||||||||||||||||||||||||||||||
|
Credit contracts
|
|
|
|
— | — |
|
||||||||||||||||||||||||||||||||
| Other contracts |
|
|
|
— | — |
|
||||||||||||||||||||||||||||||||
|
Counterparty netting and cash collateral
|
— | — | — |
(
|
(
|
(
|
||||||||||||||||||||||||||||||||
|
Total derivative assets
|
|
|
|
(
|
(
|
|
||||||||||||||||||||||||||||||||
|
Short-term investments
|
|
|
|
— | — |
|
||||||||||||||||||||||||||||||||
|
Other assets
(c)
|
|
|
|
— | — |
|
||||||||||||||||||||||||||||||||
|
Separate account assets
|
|
|
|
— | — |
|
||||||||||||||||||||||||||||||||
| Total | $ |
|
$ |
|
$ |
|
$ |
(
|
$ |
(
|
$ |
|
||||||||||||||||||||||||||
| Liabilities: | ||||||||||||||||||||||||||||||||||||||
| Policyholder contract deposits | $ |
|
$ |
|
$ |
|
$ | — | $ | — | $ |
|
||||||||||||||||||||||||||
|
Derivative liabilities
(c)
:
|
||||||||||||||||||||||||||||||||||||||
|
Interest rate contracts
|
|
|
|
— | — |
|
||||||||||||||||||||||||||||||||
|
Foreign exchange contracts
|
|
|
|
— | — |
|
||||||||||||||||||||||||||||||||
|
Equity contracts
|
|
|
|
— | — |
|
||||||||||||||||||||||||||||||||
|
Credit contracts
|
|
|
|
— | — |
|
||||||||||||||||||||||||||||||||
|
Counterparty netting and cash collateral
|
— | — | — |
(
|
(
|
(
|
||||||||||||||||||||||||||||||||
|
Total derivative liabilities
|
|
|
|
(
|
(
|
|
||||||||||||||||||||||||||||||||
|
Fortitude Re funds withheld payable
|
|
|
|
— | — |
|
||||||||||||||||||||||||||||||||
|
Long-term debt
|
|
|
|
— | — |
|
||||||||||||||||||||||||||||||||
| Total | $ |
|
$ |
|
$ |
|
$ |
(
|
$ |
(
|
$ |
|
||||||||||||||||||||||||||
(a)
Represents netting of derivative exposures covered by qualifying master netting agreements.
(b)
Excludes investments that are measured at fair value using the net asset value (NAV) per share (or its equivalent), which totaled $
9.6
billion and $
8.4
billion as of
June 30, 2022
and December 31, 2021, respectively.
(c)
Presented as part of Other assets and Other liabilities on the Condensed Consolidated Balance Sheets.
|
18
|
AIG | Second Quarter 2022 Form 10-Q
|
||||
ITEM 1 |
Notes to Condensed Consolidated Financial Statements (unaudited) |
4. Fair Value Measurements
CHANGES IN LEVEL 3 RECURRING FAIR VALUE MEASUREMENTS
The following tables present changes during the three- and six-month periods ended June 30, 2022 and 2021 in Level 3 assets and liabilities measured at fair value on a recurring basis, and the realized and unrealized gains (losses) related to the Level 3 assets and liabilities in the Condensed Consolidated Balance Sheets at June 30, 2022 and 2021:
| (in millions) |
Fair Value
Beginning of Period |
Net Realized
and Unrealized Gains (Losses) Included in income |
Other
Comprehensive Income (Loss) |
Purchases,
Sales, Issuances and Settlements, Net |
Gross Transfers In | Gross Transfers Out | Other |
Fair Value
End of Period |
Changes in
Unrealized Gains (Losses) Included in Income on Instruments Held at End of Period |
Changes in
Unrealized Gains (Losses) Included in Other Comprehensive Income (Loss) for Recurring Level 3 Instruments Held at End of Period |
||||||||||||||||||||||||||||||||||||||||||||||||||||
| Three Months Ended June 30, 2022 | ||||||||||||||||||||||||||||||||||||||||||||||||||||||||||||||
|
Assets:
|
||||||||||||||||||||||||||||||||||||||||||||||||||||||||||||||
| Bonds available for sale: | ||||||||||||||||||||||||||||||||||||||||||||||||||||||||||||||
| Obligations of states, municipalities and political subdivisions | $ |
|
$ |
|
$ |
(
|
$ |
(
|
$ |
|
$ |
|
$ |
|
$ |
|
$ |
|
$ |
(
|
||||||||||||||||||||||||||||||||||||||||||
|
Non-U.S. governments
|
|
|
|
|
|
|
|
|
|
|
||||||||||||||||||||||||||||||||||||||||||||||||||||
|
Corporate debt
|
|
(
|
(
|
(
|
|
(
|
|
|
|
(
|
||||||||||||||||||||||||||||||||||||||||||||||||||||
|
RMBS
|
|
|
(
|
(
|
|
(
|
|
|
|
(
|
||||||||||||||||||||||||||||||||||||||||||||||||||||
|
CMBS
|
|
|
(
|
|
|
(
|
|
|
|
(
|
||||||||||||||||||||||||||||||||||||||||||||||||||||
|
CDO/ABS
|
|
|
(
|
|
|
(
|
|
|
|
(
|
||||||||||||||||||||||||||||||||||||||||||||||||||||
|
Total bonds available for sale
|
|
|
(
|
|
|
(
|
|
|
|
(
|
||||||||||||||||||||||||||||||||||||||||||||||||||||
|
Other bond securities:
|
||||||||||||||||||||||||||||||||||||||||||||||||||||||||||||||
| Corporate Debt |
|
(
|
|
|
|
(
|
|
|
(
|
|
||||||||||||||||||||||||||||||||||||||||||||||||||||
| RMBS |
|
(
|
|
|
|
|
|
|
(
|
|
||||||||||||||||||||||||||||||||||||||||||||||||||||
|
CMBS
|
|
(
|
|
|
|
|
|
|
(
|
|
||||||||||||||||||||||||||||||||||||||||||||||||||||
|
CDO/ABS
|
|
(
|
|
|
|
(
|
|
|
|
|
||||||||||||||||||||||||||||||||||||||||||||||||||||
|
Total other bond securities
|
|
(
|
|
|
|
(
|
|
|
(
|
|
||||||||||||||||||||||||||||||||||||||||||||||||||||
|
Equity securities
|
|
|
|
|
|
|
|
|
|
|
||||||||||||||||||||||||||||||||||||||||||||||||||||
|
Other invested assets
|
|
|
(
|
(
|
|
(
|
|
|
|
|
||||||||||||||||||||||||||||||||||||||||||||||||||||
|
Other assets
|
|
|
|
(
|
|
|
|
|
|
|
||||||||||||||||||||||||||||||||||||||||||||||||||||
|
Total
|
$ |
|
$ |
|
$ |
(
|
$ |
|
$ |
|
$ |
(
|
$ |
|
$ |
|
$ |
|
$ |
(
|
||||||||||||||||||||||||||||||||||||||||||
|
(in millions)
|
Fair Value Beginning of Period |
Net Realized
and Unrealized (Gains) Losses Included in Income |
Other Comprehensive Income (Loss) |
Purchases,
Sales, Issuances and Settlements, Net |
Gross Transfers In | Gross Transfers Out | Other | Fair Value End of Period |
Changes in
Unrealized Gains (Losses) Included in Income on Instruments Held at End of Period |
Changes in
Unrealized Gains (Losses) Included in Other Comprehensive Income (Loss) for Recurring Level 3 Instruments Held at End of Period |
||||||||||||||||||||||||||||||||||||||||||||||||||||
| Liabilities: | ||||||||||||||||||||||||||||||||||||||||||||||||||||||||||||||
|
Policyholder contract deposits
|
$ |
|
$ |
(
|
$ |
|
$ |
|
$ |
|
$ |
|
$ |
|
$ |
|
$ |
|
$ |
|
||||||||||||||||||||||||||||||||||||||||||
|
Derivative liabilities, net:
|
||||||||||||||||||||||||||||||||||||||||||||||||||||||||||||||
|
Interest rate contracts
|
(
|
|
|
(
|
(
|
|
|
(
|
(
|
|
||||||||||||||||||||||||||||||||||||||||||||||||||||
|
Foreign exchange contracts
|
|
|
|
|
|
|
|
|
(
|
|
||||||||||||||||||||||||||||||||||||||||||||||||||||
|
Equity contracts
|
(
|
|
|
(
|
|
(
|
|
(
|
(
|
|
||||||||||||||||||||||||||||||||||||||||||||||||||||
|
Credit contracts
|
|
|
|
|
|
|
|
|
(
|
|
||||||||||||||||||||||||||||||||||||||||||||||||||||
|
Other contracts
|
(
|
(
|
|
|
|
|
|
(
|
|
|
||||||||||||||||||||||||||||||||||||||||||||||||||||
|
Total derivative liabilities, net
(a)
|
(
|
|
|
(
|
(
|
(
|
|
(
|
(
|
|
||||||||||||||||||||||||||||||||||||||||||||||||||||
| Fortitude Re funds withheld payable |
|
(
|
|
(
|
|
|
|
(
|
|
|
||||||||||||||||||||||||||||||||||||||||||||||||||||
| Total | $ |
|
$ |
(
|
$ |
|
$ |
|
$ |
(
|
$ |
(
|
$ |
|
$ |
|
$ |
|
$ |
|
||||||||||||||||||||||||||||||||||||||||||
|
AIG | Second Quarter 2022 Form 10-Q
|
19
|
||||
ITEM 1 |
Notes to Condensed Consolidated Financial Statements (unaudited) |
4. Fair Value Measurements
| (in millions) | Fair Value Beginning of Period |
Net Realized
and Unrealized Gains (Losses) Included in Income |
Other Comprehensive Income (Loss) |
Purchases,
Sales, Issuances and Settlements, Net |
Gross Transfers In | Gross Transfers Out | Other |
Fair Value End
of Period |
Changes in
Unrealized Gains (Losses) Included in Income on Instruments Held at End of Period |
Changes in
Unrealized Gains (Losses) Included in Other Comprehensive Income (Loss) for Recurring Level 3 Instruments Held at End of Period |
||||||||||||||||||||||||||||||||||||||||||||||||||||
| Three Months Ended June 30, 2021 | ||||||||||||||||||||||||||||||||||||||||||||||||||||||||||||||
| Assets: | ||||||||||||||||||||||||||||||||||||||||||||||||||||||||||||||
| Bonds available for sale: | ||||||||||||||||||||||||||||||||||||||||||||||||||||||||||||||
| Obligations of states, municipalities and political subdivisions | $ |
|
$ |
|
$ |
|
$ |
(
|
$ |
|
$ |
(
|
$ |
|
$ |
|
$ |
|
$ |
|
||||||||||||||||||||||||||||||||||||||||||
| Non-U.S. governments |
|
|
(
|
|
|
|
|
|
|
|
||||||||||||||||||||||||||||||||||||||||||||||||||||
| Corporate debt |
|
|
|
|
|
(
|
|
|
|
|
||||||||||||||||||||||||||||||||||||||||||||||||||||
| RMBS |
|
|
(
|
(
|
|
(
|
|
|
|
|
||||||||||||||||||||||||||||||||||||||||||||||||||||
| CMBS |
|
|
|
|
|
(
|
|
|
|
|
||||||||||||||||||||||||||||||||||||||||||||||||||||
| CDO/ABS |
|
(
|
|
(
|
|
(
|
|
|
|
|
||||||||||||||||||||||||||||||||||||||||||||||||||||
| Total bonds available for sale |
|
|
|
(
|
|
(
|
|
|
|
|
||||||||||||||||||||||||||||||||||||||||||||||||||||
| Other bond securities: | ||||||||||||||||||||||||||||||||||||||||||||||||||||||||||||||
| RMBS |
|
|
|
(
|
|
|
|
|
|
|
||||||||||||||||||||||||||||||||||||||||||||||||||||
| CMBS |
|
|
|
|
|
|
|
|
|
|
||||||||||||||||||||||||||||||||||||||||||||||||||||
| CDO/ABS |
|
|
|
(
|
|
|
|
|
|
|
||||||||||||||||||||||||||||||||||||||||||||||||||||
| Total other bond securities |
|
|
|
(
|
|
|
|
|
|
|
||||||||||||||||||||||||||||||||||||||||||||||||||||
| Equity securities |
|
|
(
|
(
|
|
(
|
|
|
|
|
||||||||||||||||||||||||||||||||||||||||||||||||||||
| Other invested assets |
|
|
(
|
|
|
|
|
|
|
|
||||||||||||||||||||||||||||||||||||||||||||||||||||
| Other assets |
|
|
|
|
|
|
|
|
|
|
||||||||||||||||||||||||||||||||||||||||||||||||||||
| Total | $ |
|
$ |
|
$ |
|
$ |
(
|
$ |
|
$ |
(
|
$ |
|
$ |
|
$ |
|
$ |
|
||||||||||||||||||||||||||||||||||||||||||
| (in millions) | Fair Value Beginning of Period |
Net Realized
and Unrealized (Gains) Losses Included in Income |
Other Comprehensive Income (Loss) |
Purchases,
Sales, Issuances and Settlements, Net |
Gross Transfers In | Gross Transfers Out | Other |
Fair Value End
of Period |
Changes in
Unrealized Gains (Losses) Included in Income on Instruments Held at End of Period |
Changes in Unrealized Gains (Losses) Included in
Other Comprehensive Income (Loss) for Recurring Level 3 Instruments Held at End of Period |
||||||||||||||||||||||||||||||||||||||||||||||||||||
| Liabilities: | ||||||||||||||||||||||||||||||||||||||||||||||||||||||||||||||
| Policyholder contract deposits | $ |
|
$ |
|
$ |
|
$ |
|
$ |
|
$ |
|
$ |
|
$ |
|
$ |
(
|
$ |
|
||||||||||||||||||||||||||||||||||||||||||
| Derivative liabilities, net: | ||||||||||||||||||||||||||||||||||||||||||||||||||||||||||||||
| Interest rate contracts |
|
(
|
|
|
|
|
|
(
|
|
|
||||||||||||||||||||||||||||||||||||||||||||||||||||
| Foreign exchange contracts |
|
|
|
(
|
|
|
|
(
|
(
|
|
||||||||||||||||||||||||||||||||||||||||||||||||||||
| Equity contracts |
(
|
(
|
|
(
|
|
|
|
(
|
|
|
||||||||||||||||||||||||||||||||||||||||||||||||||||
| Credit contracts |
|
|
|
(
|
|
|
|
|
(
|
|
||||||||||||||||||||||||||||||||||||||||||||||||||||
| Other contracts |
(
|
(
|
|
|
|
|
|
(
|
|
|
||||||||||||||||||||||||||||||||||||||||||||||||||||
|
Total derivative liabilities, net
(a)
|
(
|
(
|
|
(
|
|
|
|
(
|
|
|
||||||||||||||||||||||||||||||||||||||||||||||||||||
| Fortitude Re funds withheld payable |
|
|
|
(
|
|
|
|
|
(
|
|
||||||||||||||||||||||||||||||||||||||||||||||||||||
| Total | $ |
|
$ |
|
$ |
|
$ |
(
|
$ |
|
$ |
|
$ |
|
$ |
|
$ |
(
|
$ |
|
||||||||||||||||||||||||||||||||||||||||||
|
20
|
AIG | Second Quarter 2022 Form 10-Q
|
||||
ITEM 1 |
Notes to Condensed Consolidated Financial Statements (unaudited) |
4. Fair Value Measurements
| (in millions) | Fair Value Beginning of Period |
Net Realized
and Unrealized Gains (Losses) Included in Income |
Other Comprehensive Income (Loss) |
Purchases,
Sales, Issuances and Settlements, Net |
Gross Transfers In | Gross Transfers Out | Other | Fair Value End of Period |
Changes in
Unrealized Gains (Losses) Included in Income on Instruments Held at End of Period |
Changes in
Unrealized Gains (Losses) Included in Other Comprehensive Income (Loss) for Recurring Level 3 Instruments Held at End of Period |
||||||||||||||||||||||||||||||||||||||||||||||||||||
| Six Months Ended June 30, 2022 | ||||||||||||||||||||||||||||||||||||||||||||||||||||||||||||||
| Assets: | ||||||||||||||||||||||||||||||||||||||||||||||||||||||||||||||
| Bonds available for sale: | ||||||||||||||||||||||||||||||||||||||||||||||||||||||||||||||
| Obligations of states, municipalities and political subdivisions | $ |
|
$ |
|
$ |
(
|
$ |
(
|
$ |
|
$ |
|
$ |
|
$ |
|
$ |
|
$ |
(
|
||||||||||||||||||||||||||||||||||||||||||
| Non-U.S. governments |
|
|
|
|
|
|
|
|
|
|
||||||||||||||||||||||||||||||||||||||||||||||||||||
| Corporate debt |
|
(
|
(
|
(
|
|
(
|
|
|
|
(
|
||||||||||||||||||||||||||||||||||||||||||||||||||||
| RMBS |
|
|
(
|
(
|
|
(
|
|
|
|
(
|
||||||||||||||||||||||||||||||||||||||||||||||||||||
| CMBS |
|
|
(
|
|
|
(
|
|
|
|
(
|
||||||||||||||||||||||||||||||||||||||||||||||||||||
| CDO/ABS |
|
|
(
|
|
|
(
|
|
|
|
(
|
||||||||||||||||||||||||||||||||||||||||||||||||||||
| Total bonds available for sale |
|
|
(
|
|
|
(
|
|
|
|
(
|
||||||||||||||||||||||||||||||||||||||||||||||||||||
| Other bond securities: | ||||||||||||||||||||||||||||||||||||||||||||||||||||||||||||||
| Corporate Debt |
|
(
|
|
|
|
(
|
|
|
(
|
|
||||||||||||||||||||||||||||||||||||||||||||||||||||
| RMBS |
|
(
|
|
|
|
|
|
|
(
|
|
||||||||||||||||||||||||||||||||||||||||||||||||||||
| CMBS |
|
(
|
|
|
|
|
|
|
(
|
|
||||||||||||||||||||||||||||||||||||||||||||||||||||
| CDO/ABS |
|
(
|
|
|
|
(
|
|
|
(
|
|
||||||||||||||||||||||||||||||||||||||||||||||||||||
| Total other bond securities |
|
(
|
|
|
|
(
|
|
|
(
|
|
||||||||||||||||||||||||||||||||||||||||||||||||||||
| Equity securities |
|
|
|
|
|
|
|
|
|
|
||||||||||||||||||||||||||||||||||||||||||||||||||||
| Other invested assets |
|
|
(
|
(
|
|
(
|
|
|
|
|
||||||||||||||||||||||||||||||||||||||||||||||||||||
| Other assets |
|
|
|
(
|
|
|
|
|
|
|
||||||||||||||||||||||||||||||||||||||||||||||||||||
| Total | $ |
|
$ |
|
$ |
(
|
$ |
|
$ |
|
$ |
(
|
$ |
|
$ |
|
$ |
|
$ |
(
|
||||||||||||||||||||||||||||||||||||||||||
| (in millions) | Fair Value Beginning of Period |
Net Realized
and Unrealized (Gains) Losses Included in Income |
Other Comprehensive Income (Loss) |
Purchases,
Sales, Issuances and Settlements, Net |
Gross Transfers In | Gross Transfers Out | Other | Fair Value End of Period |
Changes in
Unrealized Gains (Losses) Included in Income on Instruments Held at End of Period |
Changes in
Unrealized Gains (Losses) Included in Other Comprehensive Income (Loss) for Recurring Level 3 Instruments Held at End of Period |
||||||||||||||||||||||||||||||||||||||||||||||||||||
| Liabilities: | ||||||||||||||||||||||||||||||||||||||||||||||||||||||||||||||
| Policyholder contract deposits | $ |
|
$ |
(
|
$ |
|
$ |
|
$ |
|
$ |
|
$ |
|
$ |
|
$ |
|
$ |
|
||||||||||||||||||||||||||||||||||||||||||
| Derivative liabilities, net: | ||||||||||||||||||||||||||||||||||||||||||||||||||||||||||||||
| Interest rate contracts |
|
|
|
(
|
(
|
|
|
(
|
(
|
|
||||||||||||||||||||||||||||||||||||||||||||||||||||
| Foreign exchange contracts |
(
|
|
|
|
|
|
|
|
(
|
|
||||||||||||||||||||||||||||||||||||||||||||||||||||
| Equity contracts |
(
|
|
|
(
|
|
(
|
|
(
|
(
|
|
||||||||||||||||||||||||||||||||||||||||||||||||||||
| Credit contracts |
|
|
|
|
|
|
|
|
(
|
|
||||||||||||||||||||||||||||||||||||||||||||||||||||
| Other contracts |
(
|
(
|
|
|
|
|
|
(
|
|
|
||||||||||||||||||||||||||||||||||||||||||||||||||||
|
Total derivative liabilities, net
(a)
|
(
|
|
|
(
|
(
|
(
|
|
(
|
(
|
|
||||||||||||||||||||||||||||||||||||||||||||||||||||
| Fortitude Re funds withheld payable |
|
(
|
|
(
|
|
|
|
(
|
|
|
||||||||||||||||||||||||||||||||||||||||||||||||||||
| Total | $ |
|
$ |
(
|
$ |
|
$ |
(
|
$ |
(
|
$ |
(
|
$ |
|
$ |
|
$ |
|
$ |
|
||||||||||||||||||||||||||||||||||||||||||
|
AIG | Second Quarter 2022 Form 10-Q
|
21
|
||||
ITEM 1 |
Notes to Condensed Consolidated Financial Statements (unaudited) |
4. Fair Value Measurements
| (in millions) | Fair Value Beginning of Period |
Net Realized
and Unrealized Gains (Losses) Included in Income |
Other Comprehensive Income (Loss) |
Purchases,
Sales, Issuances and Settlements, Net |
Gross Transfers In | Gross Transfers Out | Other |
Fair Value End
of Period |
Changes in
Unrealized Gains (Losses) Included in Income on Instruments Held at End of Period |
Changes in
Unrealized Gains (Losses) Included in Other Comprehensive Income (Loss) for Recurring Level 3 Instruments Held at End of Period |
||||||||||||||||||||||||||||||||||||||||||||||||||||
| Six Months Ended June 30, 2021 | ||||||||||||||||||||||||||||||||||||||||||||||||||||||||||||||
|
Assets:
Bonds available for sale: |
||||||||||||||||||||||||||||||||||||||||||||||||||||||||||||||
| Obligations of states, municipalities and political subdivisions | $ |
|
$ |
|
$ |
(
|
$ |
(
|
$ |
|
$ |
(
|
$ |
|
$ |
|
$ |
|
$ |
|
||||||||||||||||||||||||||||||||||||||||||
| Non-U.S. governments |
|
|
(
|
|
|
|
|
|
|
|
||||||||||||||||||||||||||||||||||||||||||||||||||||
| Corporate debt |
|
|
|
|
|
(
|
|
|
|
(
|
||||||||||||||||||||||||||||||||||||||||||||||||||||
| RMBS |
|
|
|
(
|
|
(
|
|
|
|
|
||||||||||||||||||||||||||||||||||||||||||||||||||||
| CMBS |
|
|
(
|
|
|
(
|
|
|
|
(
|
||||||||||||||||||||||||||||||||||||||||||||||||||||
| CDO/ABS |
|
|
|
(
|
|
(
|
|
|
|
|
||||||||||||||||||||||||||||||||||||||||||||||||||||
| Total bonds available for sale |
|
|
(
|
(
|
|
(
|
|
|
|
|
||||||||||||||||||||||||||||||||||||||||||||||||||||
| Other bond securities: | ||||||||||||||||||||||||||||||||||||||||||||||||||||||||||||||
| RMBS |
|
|
|
(
|
|
|
|
|
(
|
|
||||||||||||||||||||||||||||||||||||||||||||||||||||
| CMBS |
|
(
|
|
(
|
|
|
|
|
|
|
||||||||||||||||||||||||||||||||||||||||||||||||||||
| CDO/ABS |
|
|
|
(
|
|
|
|
|
|
|
||||||||||||||||||||||||||||||||||||||||||||||||||||
| Total other bond securities |
|
|
|
(
|
|
|
|
|
|
|
||||||||||||||||||||||||||||||||||||||||||||||||||||
| Equity securities |
|
|
|
(
|
|
(
|
|
|
|
|
||||||||||||||||||||||||||||||||||||||||||||||||||||
| Other invested assets |
|
|
(
|
|
|
|
|
|
|
|
||||||||||||||||||||||||||||||||||||||||||||||||||||
| Other assets |
|
|
|
|
|
|
|
|
|
|
||||||||||||||||||||||||||||||||||||||||||||||||||||
| Total | $ |
|
$ |
|
$ |
(
|
$ |
(
|
$ |
|
$ |
(
|
$ |
|
$ |
|
$ |
|
$ |
|
||||||||||||||||||||||||||||||||||||||||||
| (in millions) | Fair Value Beginning of Period |
Net Realized
and Unrealized Gains (Losses) Included in Income |
Other Comprehensive Income (Loss) |
Purchases,
Sales, Issuances and Settlements, Net |
Gross Transfers In | Gross Transfers Out | Other |
Fair Value End
of Period |
Changes in
Unrealized Gains (Losses) Included in Income on Instruments Held at End of Period |
Changes in
Unrealized Gains (Losses) Included in Other Comprehensive Income (Loss) for Recurring Level 3 Instruments Held at End of Period |
||||||||||||||||||||||||||||||||||||||||||||||||||||
| Liabilities: | ||||||||||||||||||||||||||||||||||||||||||||||||||||||||||||||
| Policyholder contract deposits | $ |
|
$ |
(
|
$ |
|
$ |
|
$ |
|
$ |
|
$ |
|
$ |
|
$ |
|
$ |
|
||||||||||||||||||||||||||||||||||||||||||
| Derivative liabilities, net: | ||||||||||||||||||||||||||||||||||||||||||||||||||||||||||||||
| Interest rate contracts |
|
(
|
|
|
|
|
|
(
|
|
|
||||||||||||||||||||||||||||||||||||||||||||||||||||
| Foreign exchange contracts |
(
|
|
|
|
|
|
|
(
|
(
|
|
||||||||||||||||||||||||||||||||||||||||||||||||||||
| Equity contracts |
(
|
(
|
|
(
|
|
|
|
(
|
|
|
||||||||||||||||||||||||||||||||||||||||||||||||||||
| Credit contracts |
|
|
|
(
|
|
|
|
|
(
|
|
||||||||||||||||||||||||||||||||||||||||||||||||||||
| Other contracts |
(
|
(
|
|
|
|
|
|
(
|
|
|
||||||||||||||||||||||||||||||||||||||||||||||||||||
| Total derivative liabilities, net(a) |
(
|
(
|
|
(
|
|
|
|
(
|
|
|
||||||||||||||||||||||||||||||||||||||||||||||||||||
| Fortitude Re funds withheld payable |
|
(
|
|
(
|
|
|
|
|
|
|
||||||||||||||||||||||||||||||||||||||||||||||||||||
| Total | $ |
|
$ |
(
|
$ |
|
$ |
(
|
$ |
|
$ |
|
$ |
|
$ |
|
$ |
|
$ |
|
||||||||||||||||||||||||||||||||||||||||||
(a)
Total Level 3 derivative exposures have been netted in these tables for presentation purposes only.
|
22
|
AIG | Second Quarter 2022 Form 10-Q
|
||||
ITEM 1 |
Notes to Condensed Consolidated Financial Statements (unaudited) |
4. Fair Value Measurements
Net realized and unrealized gains and losses included in income related to Level 3 assets and liabilities shown above are reported in the Condensed Consolidated Statements of Income (Loss) as follows:
| (in millions) | Net Investment Income | Net Realized Gains (Losses) |
Other
Income |
Total | ||||||||||||||||||||||
| Three Months Ended June 30, 2022 | ||||||||||||||||||||||||||
| Assets: | ||||||||||||||||||||||||||
| Bonds available for sale | $ |
|
$ |
(
|
$ |
|
$ |
|
||||||||||||||||||
| Other bond securities |
(
|
|
|
(
|
||||||||||||||||||||||
| Other invested assets |
|
|
|
|
||||||||||||||||||||||
| Three Months Ended June 30, 2021 | ||||||||||||||||||||||||||
| Assets: | ||||||||||||||||||||||||||
| Bonds available for sale | $ |
|
$ |
|
$ |
|
$ |
|
||||||||||||||||||
| Other bond securities |
|
|
|
|
||||||||||||||||||||||
| Other invested assets |
|
|
|
|
||||||||||||||||||||||
| Six Months Ended June 30, 2022 | ||||||||||||||||||||||||||
| Assets: | ||||||||||||||||||||||||||
| Bonds available for sale | $ |
|
$ |
(
|
$ |
|
$ |
|
||||||||||||||||||
| Other bond securities |
(
|
|
|
(
|
||||||||||||||||||||||
| Other invested assets |
|
|
|
|
||||||||||||||||||||||
| Six Months Ended June 30, 2021 | ||||||||||||||||||||||||||
| Assets: | ||||||||||||||||||||||||||
| Bonds available for sale | $ |
|
$ |
|
$ |
|
$ |
|
||||||||||||||||||
| Other bond securities |
|
|
|
|
||||||||||||||||||||||
| Equity securities |
|
|
|
|
||||||||||||||||||||||
| Other invested assets |
|
|
|
|
||||||||||||||||||||||
| (in millions) | Net Investment Income | Net Realized (Gains) Losses |
Other
Income |
Total | ||||||||||||||||||||||
| Three Months Ended June 30, 2022 | ||||||||||||||||||||||||||
| Liabilities: | ||||||||||||||||||||||||||
| Policyholder contract deposits* | $ |
|
$ |
(
|
$ |
|
$ |
(
|
||||||||||||||||||
| Derivative liabilities, net |
|
|
(
|
|
||||||||||||||||||||||
| Fortitude Re funds withheld payable |
|
(
|
|
(
|
||||||||||||||||||||||
| Three Months Ended June 30, 2021 | ||||||||||||||||||||||||||
| Liabilities: | ||||||||||||||||||||||||||
| Policyholder contract deposits* | $ |
|
$ |
|
$ |
|
$ |
|
||||||||||||||||||
| Derivative liabilities, net |
|
(
|
(
|
(
|
||||||||||||||||||||||
| Fortitude Re funds withheld payable |
|
|
|
|
||||||||||||||||||||||
| Six Months Ended June 30, 2022 | ||||||||||||||||||||||||||
| Liabilities: | ||||||||||||||||||||||||||
| Policyholder contract deposits* | $ |
|
$ |
(
|
$ |
|
$ |
(
|
||||||||||||||||||
| Derivative liabilities, net |
|
|
(
|
|
||||||||||||||||||||||
| Fortitude Re funds withheld payable |
|
(
|
|
(
|
||||||||||||||||||||||
| Six Months Ended June 30, 2021 | ||||||||||||||||||||||||||
| Liabilities: | ||||||||||||||||||||||||||
| Policyholder contract deposits* | $ |
|
$ |
(
|
$ |
|
$ |
(
|
||||||||||||||||||
| Derivative liabilities, net |
|
(
|
(
|
(
|
||||||||||||||||||||||
| Fortitude Re funds withheld payable |
|
(
|
|
(
|
||||||||||||||||||||||
*
Primarily embedded derivatives.
|
AIG | Second Quarter 2022 Form 10-Q
|
23
|
||||
ITEM 1 |
Notes to Condensed Consolidated Financial Statements (unaudited) |
4. Fair Value Measurements
The following table presents the gross components of purchases, sales, issuances and settlements, net, shown above, for the three- and six-month periods ended June 30, 2022 and 2021 related to Level 3 assets and liabilities in the Condensed Consolidated Balance Sheets:
| (in millions) | Purchases | Sales |
Issuances
and
Settlements
(a)
|
Purchases, Sales,
Issuances and
Settlements, Net
(a)
|
||||||||||||||||||||||
| Three Months Ended June 30, 2022 | ||||||||||||||||||||||||||
| Assets: | ||||||||||||||||||||||||||
| Bonds available for sale: | ||||||||||||||||||||||||||
| Obligations of states, municipalities and political subdivisions | $ |
|
$ |
(
|
$ |
|
$ |
(
|
||||||||||||||||||
| Corporate debt |
|
|
(
|
(
|
||||||||||||||||||||||
| RMBS |
|
|
(
|
(
|
||||||||||||||||||||||
| CMBS |
|
|
|
|
||||||||||||||||||||||
| CDO/ABS |
|
|
(
|
|
||||||||||||||||||||||
| Total bonds available for sale |
|
(
|
(
|
|
||||||||||||||||||||||
| Other bond securities: | ||||||||||||||||||||||||||
| Corporate debt |
|
|
|
|
||||||||||||||||||||||
| RMBS |
|
|
(
|
|
||||||||||||||||||||||
| CDO/ABS |
|
|
(
|
|
||||||||||||||||||||||
| Total other bond securities |
|
|
(
|
|
||||||||||||||||||||||
| Equity securities |
|
|
|
|
||||||||||||||||||||||
| Other invested assets |
|
|
(
|
(
|
||||||||||||||||||||||
| Other assets |
|
|
(
|
(
|
||||||||||||||||||||||
| Total | $ |
|
$ |
(
|
$ |
(
|
$ |
|
||||||||||||||||||
| Liabilities: | ||||||||||||||||||||||||||
| Policyholder contract deposits | $ |
|
$ |
|
$ |
(
|
$ |
|
||||||||||||||||||
| Derivative liabilities, net |
(
|
|
|
(
|
||||||||||||||||||||||
| Fortitude Re funds withheld payable |
|
|
(
|
(
|
||||||||||||||||||||||
| Total | $ |
(
|
$ |
|
$ |
(
|
$ |
|
||||||||||||||||||
| Three Months Ended June 30, 2021 | ||||||||||||||||||||||||||
| Assets: | ||||||||||||||||||||||||||
| Bonds available for sale: | ||||||||||||||||||||||||||
| Obligations of states, municipalities and political subdivisions | $ |
|
$ |
(
|
$ |
(
|
$ |
(
|
||||||||||||||||||
| Non-U.S. governments |
|
|
|
|
||||||||||||||||||||||
| Corporate debt |
|
(
|
(
|
|
||||||||||||||||||||||
| RMBS |
|
(
|
(
|
(
|
||||||||||||||||||||||
| CMBS |
|
|
(
|
|
||||||||||||||||||||||
| CDO/ABS |
|
|
(
|
(
|
||||||||||||||||||||||
| Total bonds available for sale |
|
(
|
(
|
(
|
||||||||||||||||||||||
| Other bond securities: | ||||||||||||||||||||||||||
| RMBS |
|
(
|
(
|
(
|
||||||||||||||||||||||
| CDO/ABS |
|
|
(
|
(
|
||||||||||||||||||||||
| Total other bond securities |
|
(
|
(
|
(
|
||||||||||||||||||||||
| Equity securities |
|
(
|
(
|
(
|
||||||||||||||||||||||
| Other invested assets |
|
|
(
|
|
||||||||||||||||||||||
| Total | $ |
|
$ |
(
|
$ |
(
|
$ |
(
|
||||||||||||||||||
| Liabilities: | ||||||||||||||||||||||||||
| Policyholder contract deposits |
|
|
(
|
|
||||||||||||||||||||||
| Derivative liabilities, net |
(
|
|
|
(
|
||||||||||||||||||||||
| Fortitude Re funds withheld payable |
|
|
(
|
(
|
||||||||||||||||||||||
| Total | $ |
(
|
$ |
|
$ |
(
|
$ |
(
|
||||||||||||||||||
|
24
|
AIG | Second Quarter 2022 Form 10-Q
|
||||
ITEM 1 |
Notes to Condensed Consolidated Financial Statements (unaudited) |
4. Fair Value Measurements
| (in millions) | Purchases | Sales |
Issuances
and
Settlements
(a)
|
Purchases, Sales,
Issuances and
Settlements, Net
(a)
|
||||||||||||||||||||||
| Six Months Ended June 30, 2022 | ||||||||||||||||||||||||||
| Assets: | ||||||||||||||||||||||||||
| Bonds available for sale: | ||||||||||||||||||||||||||
| Obligations of states, municipalities and political subdivisions | $ |
|
$ |
(
|
$ |
(
|
$ |
(
|
||||||||||||||||||
| Corporate debt |
|
|
(
|
(
|
||||||||||||||||||||||
| RMBS |
|
|
(
|
(
|
||||||||||||||||||||||
| CMBS |
|
|
(
|
|
||||||||||||||||||||||
| CDO/ABS |
|
|
(
|
|
||||||||||||||||||||||
| Total bonds available for sale |
|
(
|
(
|
|
||||||||||||||||||||||
| Other bond securities: | ||||||||||||||||||||||||||
| Corporate debt |
|
|
|
|
||||||||||||||||||||||
| RMBS |
|
|
(
|
|
||||||||||||||||||||||
| CDO/ABS |
|
|
(
|
|
||||||||||||||||||||||
| Total other bond securities |
|
|
(
|
|
||||||||||||||||||||||
| Equity securities |
|
|
|
|
||||||||||||||||||||||
| Other invested assets |
|
|
(
|
(
|
||||||||||||||||||||||
| Other assets |
|
|
(
|
(
|
||||||||||||||||||||||
| Total | $ |
|
$ |
(
|
$ |
(
|
$ |
|
||||||||||||||||||
| Liabilities: | ||||||||||||||||||||||||||
| Policyholder contract deposits | $ |
|
$ |
|
$ |
(
|
$ |
|
||||||||||||||||||
| Derivative liabilities, net |
(
|
|
|
(
|
||||||||||||||||||||||
| Fortitude Re funds withheld payable |
|
|
(
|
(
|
||||||||||||||||||||||
| Total | $ |
(
|
$ |
|
$ |
(
|
$ |
(
|
||||||||||||||||||
| Six Months Ended June 30, 2021 | ||||||||||||||||||||||||||
| Assets: | ||||||||||||||||||||||||||
| Bonds available for sale: | ||||||||||||||||||||||||||
| Obligations of states, municipalities and political subdivisions | $ |
|
$ |
(
|
$ |
(
|
$ |
(
|
||||||||||||||||||
| Non-U.S. governments |
|
|
|
|
||||||||||||||||||||||
| Corporate Debt |
|
(
|
(
|
|
||||||||||||||||||||||
| RMBS |
|
(
|
(
|
(
|
||||||||||||||||||||||
| CMBS |
|
|
(
|
|
||||||||||||||||||||||
| CDO/ABS |
|
|
(
|
(
|
||||||||||||||||||||||
| Total bonds available for sale |
|
(
|
(
|
(
|
||||||||||||||||||||||
| Other bond securities: | ||||||||||||||||||||||||||
| RMBS |
|
(
|
(
|
(
|
||||||||||||||||||||||
| CMBS |
|
(
|
|
(
|
||||||||||||||||||||||
| CDO/ABS |
|
(
|
(
|
(
|
||||||||||||||||||||||
| Total other bond securities |
|
(
|
(
|
(
|
||||||||||||||||||||||
| Equity securities |
|
(
|
(
|
(
|
||||||||||||||||||||||
| Other invested assets |
|
|
(
|
|
||||||||||||||||||||||
| Total | $ |
|
$ |
(
|
$ |
(
|
$ |
(
|
||||||||||||||||||
|
Liabilities:
|
||||||||||||||||||||||||||
|
Policyholder contract deposits
|
$ |
|
|
(
|
|
|||||||||||||||||||||
| Derivative liabilities, net |
(
|
|
(
|
(
|
||||||||||||||||||||||
| Fortitude Re funds withheld payable |
|
|
(
|
(
|
||||||||||||||||||||||
| Total | $ |
(
|
$ |
|
$ |
(
|
$ |
(
|
||||||||||||||||||
(a)
There were
no
issuances during the three- and six-month periods ended June 30, 2022 and 2021.
|
AIG | Second Quarter 2022 Form 10-Q
|
25
|
||||
ITEM 1 |
Notes to Condensed Consolidated Financial Statements (unaudited) |
4. Fair Value Measurements
Both observable and unobservable inputs may be used to determine the fair values of positions classified in Level 3 in the tables above. As a result, the unrealized gains (losses) on instruments held at June 30, 2022 and 2021 may include changes in fair value that were attributable to both observable (e.g., changes in market interest rates) and unobservable inputs (e.g., changes in unobservable long-dated volatilities).
Transfers of Level 3 Assets and Liabilities
The Net realized and unrealized gains (losses) included in income (loss) or Other comprehensive income (loss) as shown in the table above excludes $(
38
) million and $(
72
) million of net gains (losses) related to assets and liabilities transferred into Level 3 during the three- and six-month periods ended June 30, 2022, respectively, and includes $(
38
) million and $(
79
) million of net gains (losses) related to assets and liabilities transferred out of Level 3 during the three- and six-month periods ended June 30, 2022, respectively.
The Net realized and unrealized gains (losses) included in income (loss) or Other comprehensive income (loss) as shown in the table above excludes $
9
million and $
28
million of net gains (losses) related to assets and liabilities transferred into Level 3 during the three- and six-month periods ended June 30, 2021, respectively, and includes $
1
million and $(
4
) million of net gains (losses) related to assets and liabilities transferred out of Level 3 during the three- and six-month periods ended June 30, 2021, respectively.
Transfers of Level 3 Assets
During the three- and six-month periods ended June 30, 2022 and 2021, transfers into Level 3 assets primarily included certain investments in private placement corporate debt, RMBS, CMBS and CDO/ABS. Transfers of private placement corporate debt and certain ABS into Level 3 assets were primarily the result of limited market pricing information that required us to determine fair value for these securities based on inputs that are adjusted to better reflect our own assumptions regarding the characteristics of a specific security or associated market liquidity. The transfers of investments in RMBS, CMBS and CDO and certain ABS into Level 3 assets were due to diminished market transparency and liquidity for individual security types.
During the three- and six-month periods ended June 30, 2022 and 2021, transfers out of Level 3 assets primarily included private placement and other corporate debt, CMBS, RMBS, CDO/ABS and certain investments in municipal securities. Transfers of corporate debt, RMBS, CMBS, CDO/ABS and certain investments in municipal securities out of Level 3 assets were based on consideration of market liquidity as well as related transparency of pricing and associated observable inputs for these investments. Transfers of certain investments in private placement corporate debt and certain ABS out of Level 3 assets were primarily the result of using observable pricing information that reflects the fair value of those securities without the need for adjustment based on our own assumptions regarding the characteristics of a specific security or the current liquidity in the market.
Transfers of Level 3 Liabilities
During the three- and six-month periods ended June 30, 2022, transfers of derivatives into Level 3 were primarily due to increased long-dated European swaption activity with Secured Overnight Financing Rate tenors. There were no significant transfers of derivative or other liabilities into or out of Level 3 for the three- and six-month periods ended June 30, 2021.
|
26
|
AIG | Second Quarter 2022 Form 10-Q
|
||||
ITEM 1 |
Notes to Condensed Consolidated Financial Statements (unaudited) |
4. Fair Value Measurements
QUANTITATIVE INFORMATION ABOUT LEVEL 3 FAIR VALUE MEASUREMENTS
The table below presents information about the significant unobservable inputs used for recurring fair value measurements for certain Level 3 instruments, and includes only those instruments for which information about the inputs is reasonably available to us, such as data from independent third-party valuation service providers. Because input information from third-parties with respect to certain Level 3 instruments (primarily CDO/ABS) may not be reasonably available to us, balances shown below may not equal total amounts reported for such Level 3 assets and liabilities:
| (in millions) |
Fair Value at
June 30, 2022 |
Valuation
Technique |
Unobservable Input
(b)
|
Range
(Weighted Average)
(c)
|
||||||||||||||||
| Assets: | ||||||||||||||||||||
| Obligations of states, municipalities and political subdivisions | $ |
|
Discounted cash flow | Yield |
|
|||||||||||||||
| Corporate debt |
|
Discounted cash flow | Yield |
|
||||||||||||||||
|
RMBS
(a)
|
|
Discounted cash flow | Constant prepayment rate |
|
||||||||||||||||
| Loss severity |
|
|||||||||||||||||||
| Constant default rate |
|
|||||||||||||||||||
| Yield |
|
|||||||||||||||||||
|
CDO/ABS
(a)
|
|
Discounted cash flow | Yield |
|
||||||||||||||||
| CMBS |
|
Discounted cash flow | Yield |
|
||||||||||||||||
|
Liabilities
(d)
:
|
||||||||||||||||||||
| Embedded derivatives within Policyholder contract deposits: | ||||||||||||||||||||
| Variable annuity guaranteed minimum withdrawal benefits (GMWB) |
|
Discounted cash flow | Equity volatility |
|
||||||||||||||||
| Base lapse rate |
|
|||||||||||||||||||
| Dynamic lapse multiplier |
|
|||||||||||||||||||
|
Mortality multiplier
(e)
|
|
|||||||||||||||||||
| Utilization |
|
|||||||||||||||||||
|
Equity / interest rate correlation
|
|
|||||||||||||||||||
|
NPA
(f)
|
|
|||||||||||||||||||
| Fixed Index annuities including certain GMWB |
|
Discounted cash flow | Base lapse rate |
|
||||||||||||||||
| Dynamic lapse multiplier |
|
|||||||||||||||||||
|
Mortality multiplier
(e)
|
|
|||||||||||||||||||
|
Utilization
(g)
|
|
|||||||||||||||||||
| Option budget |
|
|||||||||||||||||||
|
NPA
(f)
|
|
|||||||||||||||||||
| Indexed life |
|
Discounted cash flow | Base lapse rate |
|
||||||||||||||||
| Mortality rate |
|
|||||||||||||||||||
| Equity volatility |
|
|||||||||||||||||||
|
NPA
(f)
|
|
|||||||||||||||||||
|
AIG | Second Quarter 2022 Form 10-Q
|
27
|
||||
ITEM 1 |
Notes to Condensed Consolidated Financial Statements (unaudited) |
4. Fair Value Measurements
| (in millions) | Fair Value at December 31, 2021 |
Valuation
Technique |
Unobservable Input
(b)
|
Range
(Weighted Average)
(c)
|
||||||||||||||||
| Assets: | ||||||||||||||||||||
| Obligations of states, municipalities and political subdivisions | $ |
|
Discounted cash flow | Yield |
|
|||||||||||||||
| Corporate debt |
|
Discounted cash flow | Yield |
|
||||||||||||||||
|
RMBS
(a)
|
|
Discounted cash flow | Constant prepayment rate |
|
||||||||||||||||
| Loss severity |
|
|||||||||||||||||||
| Constant default rate |
|
|||||||||||||||||||
| Yield |
|
|||||||||||||||||||
|
CDO/ABS
(a)
|
|
Discounted cash flow | Yield |
|
||||||||||||||||
| CMBS |
|
Discounted cash flow | Yield |
|
||||||||||||||||
|
Liabilities
(d)
:
|
||||||||||||||||||||
| Embedded derivatives within Policyholder contract deposits: | ||||||||||||||||||||
| GMWB |
|
Discounted cash flow | Equity volatility |
|
||||||||||||||||
| Base lapse rate |
|
|||||||||||||||||||
| Dynamic lapse multiplier |
|
|||||||||||||||||||
|
Mortality multiplier
(e)
|
|
|||||||||||||||||||
| Utilization |
|
|||||||||||||||||||
| Equity / interest rate correlation |
|
|||||||||||||||||||
|
NPA
(f)
|
|
|||||||||||||||||||
| Fixed Index annuities including certain GMWB |
|
Discounted cash flow | Base lapse rate |
|
||||||||||||||||
| Dynamic lapse multiplier |
|
|||||||||||||||||||
|
Mortality multiplier
(e)
|
|
|||||||||||||||||||
|
Utilization
(g)
|
|
|||||||||||||||||||
| Option budget |
|
|||||||||||||||||||
|
NPA
(f)
|
|
|||||||||||||||||||
| Indexed life |
|
Discounted cash flow | Base lapse rate |
|
||||||||||||||||
| Mortality rate |
|
|||||||||||||||||||
| Equity volatility |
|
|||||||||||||||||||
|
NPA
(f)
|
|
|||||||||||||||||||
(a)
Information received from third-party valuation service providers. The ranges of the unobservable inputs for constant prepayment rate, loss severity and constant default rate relate to each of the individual underlying mortgage loans that comprise the entire portfolio of securities in the RMBS and CDO securitization vehicles and not necessarily to the securitization vehicle bonds (tranches) purchased by us. The ranges of these inputs do not directly correlate to changes in the fair values of the tranches purchased by us, because there are other factors relevant to the fair values of specific tranches owned by us including, but not limited to, purchase price, position in the waterfall, senior versus subordinated position and attachment points.
(b)
Represents discount rates, estimates and assumptions that we believe would be used by market participants when valuing these assets and liabilities.
(c)
The weighted averaging for fixed maturity securities is based on the estimated fair value of the securities. Because the valuation methodology for embedded derivatives within Policyholder contract deposits uses a range of inputs that vary at the contract level over the cash flow projection period, management believes that presenting a range, rather than weighted average, is a more meaningful representation of the unobservable inputs used in the valuation.
(d)
The Fortitude Re funds withheld payable has been excluded from the above table. As discussed in Note 7, the Fortitude Re funds withheld payable is created through modco and funds withheld reinsurance arrangements where the investments supporting the reinsurance agreements are withheld by, and continue to reside on AIG’s balance sheet. This embedded derivative is valued as a total return swap with reference to the fair value of the invested assets held by AIG. Accordingly, the unobservable inputs utilized in the valuation of the embedded derivative are a component of the invested assets supporting the reinsurance agreements that are held on AIG’s balance sheet.
(e)
Mortality inputs are shown as multipliers of the 2012 Individual Annuity Mortality Basic table.
(f)
The non-performance risk adjustment (NPA) applied as a spread over risk-free curve for discounting.
(g)
The partial withdrawal utilization unobservable input range shown applies only to policies with guaranteed minimum withdrawal benefit riders that are accounted for as an embedded derivative. The total embedded derivative liability at June 30, 2022 and December 31, 2021 was approximately $
943
million and $
1.2
billion, respectively. The remaining guaranteed minimum riders on the fixed index annuities are valued under the accounting guidance for certain nontraditional long-duration contracts.
The ranges of reported inputs for Obligations of states, municipalities and political subdivisions, Corporate debt, RMBS, CDO/ABS, and CMBS valued using a discounted cash flow technique consist of one standard deviation in either direction from the value-weighted average. The preceding table does not give effect to our risk management practices that might offset risks inherent in these Level 3 assets and liabilities.
|
28
|
AIG | Second Quarter 2022 Form 10-Q
|
||||
ITEM 1 |
Notes to Condensed Consolidated Financial Statements (unaudited) |
4. Fair Value Measurements
Interrelationships between Unobservable Inputs
We consider unobservable inputs to be those for which market data is not available and that are developed using the best information available to us about the assumptions that market participants would use when pricing the asset or liability. Relevant inputs vary depending on the nature of the instrument being measured at fair value. The following paragraphs provide a general description of significant unobservable inputs along with interrelationships between and among the significant unobservable inputs and their impact on the fair value measurements. In practice, simultaneous changes in assumptions may not always have a linear effect on the inputs discussed below. Interrelationships may also exist between observable and unobservable inputs. Such relationships have not been included in the discussion below. For each of the individual relationships described below, the inverse relationship would also generally apply.
Fixed Maturity Securities
The significant unobservable input used in the fair value measurement of fixed maturity securities is yield. The yield is affected by the market movements in credit spreads and U.S. Treasury yields. The yield may be affected by other factors including constant prepayment rates, loss severity, and constant default rates. In general, increases in the yield would decrease the fair value of investments, and conversely, decreases in the yield would increase the fair value of investments.
Embedded derivatives within Policyholder contract deposits
Embedded derivatives reported within Policyholder contract deposits include interest crediting rates based on market indices within fixed index annuities, indexed life, and GICs as well as GMWB within variable annuity and certain fixed index annuity products. For any given contract, assumptions for unobservable inputs vary throughout the period over which cash flows are projected for purposes of valuing the embedded derivative. The following unobservable inputs are used for valuing embedded derivatives measured at fair value:
•
Long-term equity volatilities represent equity volatility beyond the period for which observable equity volatilities are available. Increases in assumed volatility will generally increase the fair value of both the projected cash flows from rider fees as well as the projected cash flows related to benefit payments. Therefore, the net change in the fair value of the liability may be either a decrease or an increase, depending on the relative changes in projected rider fees and projected benefit payments.
•
Equity / interest rate correlation estimates the relationship between changes in equity returns and interest rates in the economic scenario generator used to value our GMWB embedded derivatives. In general, a higher positive correlation assumes that equity markets and interest rates move in a more correlated fashion, which generally increases the fair value of the liability.
•
Base lapse rate assumptions are determined by company experience and are adjusted at the contract level using a dynamic lapse function, which reduces the base lapse rate when the contract is in-the-money (when the contract holder’s guaranteed value, as estimated by the company, is worth more than their underlying account value). Lapse rates are also generally assumed to be lower in periods when a surrender charge applies. Increases in assumed lapse rates will generally decrease the fair value of the liability, as fewer policyholders would persist to collect guaranteed withdrawal amounts.
•
Mortality rate assumptions, which vary by age and gender, are based on company experience and include a mortality improvement assumption. Increases in assumed mortality rates will decrease the fair value of the liability, while lower mortality rate assumptions will generally increase the fair value of the liability, because guaranteed payments will be made for a longer period of time.
•
Utilization assumptions estimate the timing when policyholders with a GMWB will elect to utilize their benefit and begin taking withdrawals. The assumptions may vary by the type of guarantee, tax-qualified status, the contract’s withdrawal history and the age of the policyholder. Utilization assumptions are based on company experience and other factors, which includes partial withdrawal behavior. Increases in assumed utilization rates will generally increase the fair value of the liability.
•
Option budget estimates the expected long-term cost of options used to hedge exposures associated with equity price changes. The level of option budgets determines future costs of the options, which impacts the growth in account value and the valuation of embedded derivatives.
|
AIG | Second Quarter 2022 Form 10-Q
|
29
|
||||
ITEM 1 |
Notes to Condensed Consolidated Financial Statements (unaudited) |
4. Fair Value Measurements
Embedded derivatives within reinsurance contracts
The fair value of embedded derivatives associated with funds withheld reinsurance contracts is determined based upon a total return swap technique with reference to the fair value of the investments held by AIG related to AIG’s funds withheld payable. The fair value of the underlying assets is generally based on market observable inputs using industry standard valuation techniques. The valuation also requires certain significant inputs, which are generally not observable and accordingly, the valuation is considered Level 3 in the fair value hierarchy.
INVESTMENTS IN CERTAIN ENTITIES CARRIED AT FAIR VALUE USING NET ASSET VALUE PER SHARE
The following table includes information related to our investments in certain other invested assets, including private equity funds, hedge funds and other alternative investments that calculate net asset value per share (or its equivalent). For these investments, which are measured at fair value on a recurring basis, we use the net asset value per share to measure fair value.
| June 30, 2022 | December 31, 2021 | |||||||||||||||||||||||||||||||
| (in millions) | Investment Category Includes | Fair Value Using NAV Per Share (or its equivalent) | Unfunded Commitments | Fair Value Using NAV Per Share (or its equivalent) | Unfunded Commitments | |||||||||||||||||||||||||||
|
Investment Category
|
||||||||||||||||||||||||||||||||
| Private equity funds: | ||||||||||||||||||||||||||||||||
| Leveraged buyout | Debt and/or equity investments made as part of a transaction in which assets of mature companies are acquired from the current shareholders, typically with the use of financial leverage | $ |
|
$ |
|
$ |
|
$ |
|
|||||||||||||||||||||||
| Real assets | Investments in real estate properties, agricultural and infrastructure assets, including power plants and other energy producing assets |
|
|
|
|
|||||||||||||||||||||||||||
| Venture capital | Early-stage, high-potential, growth companies expected to generate a return through an eventual realization event, such as an initial public offering or sale of the company |
|
|
|
|
|||||||||||||||||||||||||||
| Growth equity | Funds that make investments in established companies for the purpose of growing their businesses |
|
|
|
|
|||||||||||||||||||||||||||
| Mezzanine | Funds that make investments in the junior debt and equity securities of leveraged companies |
|
|
|
|
|||||||||||||||||||||||||||
| Other | Includes distressed funds that invest in securities of companies that are in default or under bankruptcy protection, as well as funds that have multi- strategy, and other strategies |
|
|
|
|
|||||||||||||||||||||||||||
| Total private equity funds |
|
|
|
|
||||||||||||||||||||||||||||
| Hedge funds: | ||||||||||||||||||||||||||||||||
| Event-driven | Securities of companies undergoing material structural changes, including mergers, acquisitions and other reorganizations |
|
|
|
|
|||||||||||||||||||||||||||
| Long-short | Securities that the manager believes are undervalued, with corresponding short positions to hedge market risk |
|
|
|
|
|||||||||||||||||||||||||||
| Macro | Investments that take long and short positions in financial instruments based on a top-down view of certain economic and capital market conditions |
|
|
|
|
|||||||||||||||||||||||||||
| Other | Includes investments held in funds that are less liquid, as well as other strategies which allow for broader allocation between public and private investments |
|
|
|
|
|||||||||||||||||||||||||||
| Total hedge funds |
|
|
|
|
||||||||||||||||||||||||||||
| Total | $ |
|
$ |
|
$ |
|
$ |
|
||||||||||||||||||||||||
Private equity fund investments included above are not redeemable, because distributions from the funds will be received when underlying investments of the funds are liquidated. Private equity funds are generally expected to have
10
-year lives at their inception, but these lives may be extended at the fund manager’s discretion, typically in
or
two-year
increments.
The hedge fund investments included above, which are carried at fair value, are generally redeemable subject to the redemption notices period. The majority of our hedge fund investments are redeemable monthly or quarterly.
|
30
|
AIG | Second Quarter 2022 Form 10-Q
|
||||
ITEM 1 |
Notes to Condensed Consolidated Financial Statements (unaudited) |
4. Fair Value Measurements
FAIR VALUE OPTION
The following table presents the gains or losses recorded related to the eligible instruments for which we elected the fair value option:
| Gain (Loss) Three Months Ended June 30, | Gain (Loss) Six Months Ended June 30, | |||||||||||||||||||||||||
| (in millions) | 2022 | 2021 | 2022 | 2021 | ||||||||||||||||||||||
| Assets: | ||||||||||||||||||||||||||
|
Other bond securities
(a)
|
$ |
(
|
$ |
|
$ |
(
|
$ |
(
|
||||||||||||||||||
|
Alternative investments
(b)
|
(
|
|
|
|
||||||||||||||||||||||
| Liabilities: | ||||||||||||||||||||||||||
|
Long-term debt
(c)
|
|
(
|
|
|
||||||||||||||||||||||
| Total gain (loss) | $ |
(
|
$ |
|
$ |
|
$ |
|
||||||||||||||||||
(a)
Includes certain securities supporting the funds withheld arrangements with Fortitude Re.
For additional information regarding the gains and losses for Other bond securities, see Note 5. For additional information regarding the funds withheld arrangements with Fortitude Re, see Note 7.
(b)
Includes certain hedge funds, private equity funds and other investment partnerships.
(c)
Includes guaranteed investment agreements (GIAs), notes, bonds and mortgages payable.
We calculate the effect of these credit spread changes using discounted cash flow techniques that incorporate current market interest rates, our observable credit spreads on these liabilities and other factors that mitigate the risk of nonperformance such as cash collateral posted.
The following table presents the difference between fair value and the aggregate contractual principal amount of long-term debt for which the fair value option was elected:
| June 30, 2022 | December 31, 2021 | ||||||||||||||||||||||||||||||||||||||||
| (in millions) | Fair Value | Outstanding Principal Amount | Difference | Fair Value | Outstanding Principal Amount | Difference | |||||||||||||||||||||||||||||||||||
| Liabilities: | |||||||||||||||||||||||||||||||||||||||||
| Long-term debt* | $ |
|
$ |
|
$ |
|
$ |
|
$ |
|
$ |
|
|||||||||||||||||||||||||||||
•
Includes GIAs, notes, bonds, loans and mortgages payable.
FAIR VALUE MEASUREMENTS ON A NON-RECURRING BASIS
The following table presents assets measured at fair value on a non-recurring basis at the time of impairment and the related impairment charges recorded during the periods presented:
| Assets at Fair Value | Impairment Charges | ||||||||||||||||||||||||||||||||||||||||||||||||||||
| Non-Recurring Basis | Three Months Ended June 30, | Six Months Ended June 30, | |||||||||||||||||||||||||||||||||||||||||||||||||||
| (in millions) | Level 1 | Level 2 | Level 3 | Total | 2022 | 2021 | 2022 | 2021 | |||||||||||||||||||||||||||||||||||||||||||||
| June 30, 2022 | |||||||||||||||||||||||||||||||||||||||||||||||||||||
| Other investments | $ |
|
$ |
|
$ |
|
$ |
|
$ |
|
$ |
|
$ |
|
$ |
|
|||||||||||||||||||||||||||||||||||||
| Total | $ |
|
$ |
|
$ |
|
$ |
|
$ |
|
$ |
|
$ |
|
$ |
|
|||||||||||||||||||||||||||||||||||||
| December 31, 2021 | |||||||||||||||||||||||||||||||||||||||||||||||||||||
| Other investments | $ |
|
$ |
|
$ |
|
$ |
|
|||||||||||||||||||||||||||||||||||||||||||||
| Total | $ |
|
$ |
|
$ |
|
$ |
|
|||||||||||||||||||||||||||||||||||||||||||||
In addition to the assets presented in the table above, AIG had $
109
million of loans held for sale which are carried at fair value at June 30, 2022. There is no associated impairment charge.
|
AIG | Second Quarter 2022 Form 10-Q
|
31
|
||||
ITEM 1 |
Notes to Condensed Consolidated Financial Statements (unaudited) |
4. Fair Value Measurements
FAIR VALUE INFORMATION ABOUT FINANCIAL INSTRUMENTS NOT MEASURED AT FAIR VALUE
The following table presents the carrying amounts and estimated fair values of our financial instruments not measured at fair value and indicates the level in the fair value hierarchy of the estimated fair value measurement based on the observability of the inputs used:
| Estimated Fair Value |
Carrying
Value |
|||||||||||||||||||||||||||||||
| (in millions) | Level 1 | Level 2 | Level 3 | Total | ||||||||||||||||||||||||||||
| June 30, 2022 | ||||||||||||||||||||||||||||||||
| Assets: | ||||||||||||||||||||||||||||||||
| Mortgage and other loans receivable | $ |
|
$ |
|
$ |
|
$ |
|
$ |
|
||||||||||||||||||||||
| Other invested assets |
|
|
|
|
|
|||||||||||||||||||||||||||
| Short-term investments |
|
|
|
|
|
|||||||||||||||||||||||||||
| Cash |
|
|
|
|
|
|||||||||||||||||||||||||||
| Other assets |
|
|
|
|
|
|||||||||||||||||||||||||||
| Liabilities: | ||||||||||||||||||||||||||||||||
| Policyholder contract deposits associated with investment-type contracts |
|
|
|
|
|
|||||||||||||||||||||||||||
| Fortitude Re funds withheld payable |
|
|
|
|
|
|||||||||||||||||||||||||||
| Other liabilities |
|
|
|
|
|
|||||||||||||||||||||||||||
| Long-term debt |
|
|
|
|
|
|||||||||||||||||||||||||||
| Debt of consolidated investment entities |
|
|
|
|
|
|||||||||||||||||||||||||||
| Separate account liabilities - investment contracts |
|
|
|
|
|
|||||||||||||||||||||||||||
| December 31, 2021 | ||||||||||||||||||||||||||||||||
| Assets: | ||||||||||||||||||||||||||||||||
| Mortgage and other loans receivable | $ |
|
$ |
|
$ |
|
$ |
|
$ |
|
||||||||||||||||||||||
| Other invested assets |
|
|
|
|
|
|||||||||||||||||||||||||||
| Short-term investments |
|
|
|
|
|
|||||||||||||||||||||||||||
| Cash |
|
|
|
|
|
|||||||||||||||||||||||||||
| Other assets |
|
|
|
|
|
|||||||||||||||||||||||||||
| Liabilities: | ||||||||||||||||||||||||||||||||
| Policyholder contract deposits associated with investment-type contracts |
|
|
|
|
|
|||||||||||||||||||||||||||
| Fortitude Re funds withheld payable |
|
|
|
|
|
|||||||||||||||||||||||||||
| Other liabilities |
|
|
|
|
|
|||||||||||||||||||||||||||
| Long-term debt |
|
|
|
|
|
|||||||||||||||||||||||||||
| Debt of consolidated investment entities |
|
|
|
|
|
|||||||||||||||||||||||||||
| Separate account liabilities - investment contracts |
|
|
|
|
|
|||||||||||||||||||||||||||
|
32
|
AIG | Second Quarter 2022 Form 10-Q
|
||||
ITEM 1 |
Notes to Condensed Consolidated Financial Statements (unaudited) |
5. Investments
SECURITIES AVAILABLE FOR SALE
The following table presents the amortized cost and fair value of our available for sale securities:
| (in millions) |
Amortized
Cost
|
Allowance
for Credit
Losses
(a)
|
Gross
Unrealized
Gains
|
Gross
Unrealized
Losses
|
Fair
Value
|
|||||||||||||||||||||||||||
| June 30, 2022 | ||||||||||||||||||||||||||||||||
| Bonds available for sale: | ||||||||||||||||||||||||||||||||
| U.S. government and government sponsored entities | $ |
|
$ |
|
$ |
|
$ |
(
|
$ |
|
||||||||||||||||||||||
| Obligations of states, municipalities and political subdivisions |
|
|
|
(
|
|
|||||||||||||||||||||||||||
| Non-U.S. governments |
|
(
|
|
(
|
|
|||||||||||||||||||||||||||
| Corporate debt |
|
(
|
|
(
|
|
|||||||||||||||||||||||||||
| Mortgage-backed, asset-backed and collateralized: | ||||||||||||||||||||||||||||||||
| RMBS |
|
(
|
|
(
|
|
|||||||||||||||||||||||||||
| CMBS |
|
|
|
(
|
|
|||||||||||||||||||||||||||
| CDO/ABS |
|
(
|
|
(
|
|
|||||||||||||||||||||||||||
| Total mortgage-backed, asset-backed and collateralized |
|
(
|
|
(
|
|
|||||||||||||||||||||||||||
|
Total bonds available for sale
(b)
|
$ |
|
$ |
(
|
$ |
|
$ |
(
|
$ |
|
||||||||||||||||||||||
| December 31, 2021 | ||||||||||||||||||||||||||||||||
| Bonds available for sale: | ||||||||||||||||||||||||||||||||
| U.S. government and government sponsored entities | $ |
|
$ |
|
$ |
|
$ |
(
|
$ |
|
||||||||||||||||||||||
| Obligations of states, municipalities and political subdivisions |
|
|
|
(
|
|
|||||||||||||||||||||||||||
| Non-U.S. governments |
|
|
|
(
|
|
|||||||||||||||||||||||||||
| Corporate debt |
|
(
|
|
(
|
|
|||||||||||||||||||||||||||
| Mortgage-backed, asset-backed and collateralized: | ||||||||||||||||||||||||||||||||
| RMBS |
|
(
|
|
(
|
|
|||||||||||||||||||||||||||
| CMBS |
|
|
|
(
|
|
|||||||||||||||||||||||||||
| CDO/ABS |
|
|
|
(
|
|
|||||||||||||||||||||||||||
| Total mortgage-backed, asset-backed and collateralized |
|
(
|
|
(
|
|
|||||||||||||||||||||||||||
|
Total bonds available for sale
(b)
|
$ |
|
$ |
(
|
$ |
|
$ |
(
|
$ |
|
||||||||||||||||||||||
(a)
Represents the allowance for credit losses that has been recognized. Changes in the allowance for credit losses are recorded through Net realized gains (losses) and are not recognized in Other comprehensive income (loss).
(b)
At June 30, 2022 and December 31, 2021, bonds available for sale held by us that were below investment grade or not rated totaled $
22.9
billion or
10
percent and $
27.0
billion or
10
percent, respectively.
|
AIG | Second Quarter 2022 Form 10-Q
|
33
|
||||
ITEM 1 |
Notes to Condensed Consolidated Financial Statements (unaudited) |
5. Investments
Securities Available for Sale in a Loss Position for Which No Allowance for Credit Loss Has Been Recorded
The following table summarizes the fair value and gross unrealized losses on our available for sale securities, aggregated by major investment category and length of time that individual securities have been in a continuous unrealized loss position for which no allowance for credit loss has been recorded:
| Less than 12 Months | 12 Months or More | Total | ||||||||||||||||||||||||||||||||||||
| (in millions) |
Fair
Value |
Gross
Unrealized Losses |
Fair
Value |
Gross
Unrealized Losses |
Fair
Value |
Gross
Unrealized Losses |
||||||||||||||||||||||||||||||||
| June 30, 2022 | ||||||||||||||||||||||||||||||||||||||
| Bonds available for sale: | ||||||||||||||||||||||||||||||||||||||
| U.S. government and government sponsored entities | $ |
|
$ |
|
$ |
|
$ |
|
$ |
|
$ |
|
||||||||||||||||||||||||||
| Obligations of states, municipalities and political subdivisions |
|
|
|
|
|
|
||||||||||||||||||||||||||||||||
| Non-U.S. governments |
|
|
|
|
|
|
||||||||||||||||||||||||||||||||
| Corporate debt |
|
|
|
|
|
|
||||||||||||||||||||||||||||||||
| RMBS |
|
|
|
|
|
|
||||||||||||||||||||||||||||||||
| CMBS |
|
|
|
|
|
|
||||||||||||||||||||||||||||||||
| CDO/ABS |
|
|
|
|
|
|
||||||||||||||||||||||||||||||||
| Total bonds available for sale | $ |
|
$ |
|
$ |
|
$ |
|
$ |
|
$ |
|
||||||||||||||||||||||||||
| December 31, 2021 | ||||||||||||||||||||||||||||||||||||||
| Bonds available for sale: | ||||||||||||||||||||||||||||||||||||||
| U.S. government and government sponsored entities | $ |
|
$ |
|
$ |
|
$ |
|
$ |
|
$ |
|
||||||||||||||||||||||||||
| Obligations of states, municipalities and political subdivisions |
|
|
|
|
|
|
||||||||||||||||||||||||||||||||
| Non-U.S. governments |
|
|
|
|
|
|
||||||||||||||||||||||||||||||||
| Corporate debt |
|
|
|
|
|
|
||||||||||||||||||||||||||||||||
| RMBS |
|
|
|
|
|
|
||||||||||||||||||||||||||||||||
| CMBS |
|
|
|
|
|
|
||||||||||||||||||||||||||||||||
| CDO/ABS |
|
|
|
|
|
|
||||||||||||||||||||||||||||||||
| Total bonds available for sale | $ |
|
$ |
|
$ |
|
$ |
|
$ |
|
$ |
|
||||||||||||||||||||||||||
At June 30, 2022, we held
33,843
individual fixed maturity securities that were in an unrealized loss position and for which no allowance for credit losses has been recorded (including
4,273
individual fixed maturity securities that were in a continuous unrealized loss position for 12 months or more). At December 31, 2021, we held
15,029
individual fixed maturity securities that were in an unrealized loss position and for which no allowance for credit losses has been recorded (including
2,644
individual fixed maturity securities that were in a continuous unrealized loss position for 12 months or more). We did not recognize the unrealized losses in earnings on these fixed maturity securities at June 30, 2022 because it was determined that such losses were due to non-credit factors. Additionally, we neither intend to sell the securities nor do we believe that it is more likely than not that we will be required to sell these securities before recovery of their amortized cost basis. For fixed maturity securities with significant declines, we performed fundamental credit analyses on a security-by-security basis, which included consideration of credit enhancements, liquidity position, expected defaults, industry and sector analysis, forecasts and available market data.
|
34
|
AIG | Second Quarter 2022 Form 10-Q
|
||||
ITEM 1 |
Notes to Condensed Consolidated Financial Statements (unaudited) |
5. Investments
Contractual Maturities of Fixed Maturity Securities Available for Sale
The following table presents the amortized cost and fair value of fixed maturity securities available for sale by contractual maturity:
|
Total Fixed Maturity Securities
Available for Sale |
||||||||||||||
| (in millions) |
Amortized Cost,
Net of Allowance |
Fair Value | ||||||||||||
| June 30, 2022 | ||||||||||||||
| Due in one year or less | $ |
|
$ |
|
||||||||||
| Due after one year through five years |
|
|
||||||||||||
| Due after five years through ten years |
|
|
||||||||||||
| Due after ten years |
|
|
||||||||||||
| Mortgage-backed, asset-backed and collateralized |
|
|
||||||||||||
| Total | $ |
|
$ |
|
||||||||||
Actual maturities may differ from contractual maturities because certain borrowers have the right to call or prepay certain obligations with or without call or prepayment penalties.
The following table presents the gross realized gains and gross realized losses from sales or maturities of our available for sale securities:
| Three Months Ended June 30, | Six Months Ended June 30, | |||||||||||||||||||||||||||||||||||||||||||||||||||||||
| 2022 | 2021 | 2022 | 2021 | |||||||||||||||||||||||||||||||||||||||||||||||||||||
| (in millions) | Gross Realized Gains | Gross Realized Losses | Gross Realized Gains | Gross Realized Losses | Gross Realized Gains | Gross Realized Losses | Gross Realized Gains | Gross Realized Losses | ||||||||||||||||||||||||||||||||||||||||||||||||
| Fixed maturity securities | $ |
|
$ |
|
$ |
|
$ |
|
$ |
|
$ |
|
$ |
|
$ |
|
||||||||||||||||||||||||||||||||||||||||
For the three- and six-month periods ended June 30, 2022, the aggregate fair value of available for sale securities sold was $
9.2
billion and $
14.0
billion, respectively, which resulted in net realized gains (losses) of $(
604
) million and $(
743
) million, respectively. Included within the net realized gains (losses) are $(
122
) million and $(
154
) million of net realized gains (losses) for the three- and six-month periods ended June 30, 2022, respectively, which relate to Fortitude Re funds withheld assets. These net realized gains (losses) are included in Net realized gains (losses) on Fortitude Re funds withheld assets.
For the three- and six-month periods ended June 30, 2021, the aggregate fair value of available for sale securities sold was $
6.0
billion and $
12.4
billion, respectively, which resulted in net realized gains of $
135
million and $
524
million, respectively. Included within the net realized gains are $
95
million and $
390
million of net realized gains for the three- and six-month periods ended June 30, 2021, respectively, which relate to Fortitude Re funds withheld assets. These net realized gains are included in Net realized gains (losses) on Fortitude Re funds withheld assets.
|
AIG | Second Quarter 2022 Form 10-Q
|
35
|
||||
ITEM 1 |
Notes to Condensed Consolidated Financial Statements (unaudited) |
5. Investments
OTHER SECURITIES MEASURED AT FAIR VALUE
The following table presents the fair value of fixed maturity securities measured at fair value based on our election of the fair value option, which are reported in the other bond securities caption in the financial statements, and equity securities measured at fair value:
| (in millions) | June 30, 2022 | December 31, 2021 | ||||||||||||||||||||||||||||||||||||
|
Fair
Value |
Percent
of Total |
Fair
Value |
Percent
of Total |
|||||||||||||||||||||||||||||||||||
| Fixed maturity securities: | ||||||||||||||||||||||||||||||||||||||
| U.S. government and government sponsored entities | $ |
|
|
% | $ |
|
|
% | ||||||||||||||||||||||||||||||
| Obligations of states, municipalities and political subdivisions |
|
|
|
|
||||||||||||||||||||||||||||||||||
| Non-U.S. governments |
|
|
|
|
||||||||||||||||||||||||||||||||||
| Corporate debt |
|
|
|
|
||||||||||||||||||||||||||||||||||
| Mortgage-backed, asset-backed and collateralized: | ||||||||||||||||||||||||||||||||||||||
| RMBS |
|
|
|
|
||||||||||||||||||||||||||||||||||
| CMBS |
|
|
|
|
||||||||||||||||||||||||||||||||||
| CDO/ABS and other collateralized |
|
|
|
|
||||||||||||||||||||||||||||||||||
|
Total mortgage-backed, asset-backed and collateralized
|
|
|
|
|
||||||||||||||||||||||||||||||||||
| Total fixed maturity securities |
|
|
|
|
||||||||||||||||||||||||||||||||||
| Equity securities |
|
|
|
|
||||||||||||||||||||||||||||||||||
| Total | $ |
|
|
% | $ |
|
|
% | ||||||||||||||||||||||||||||||
OTHER INVESTED ASSETS
The following table summarizes the carrying amount of other invested assets:
| (in millions) | June 30, 2022 | December 31, 2021 | ||||||||||||
|
Alternative investments
(a)(b)
|
$ |
|
$ |
|
||||||||||
|
Investment real estate
(c)
|
|
|
||||||||||||
|
All other investments
(d)
|
|
|
||||||||||||
| Total | $ |
|
$ |
|
||||||||||
(a)
At June 30, 2022, included hedge funds of $
1.6
billion and private equity funds of $
9.9
billion. At December 31, 2021, included hedge funds of $
2.0
billion, private equity funds of $
8.9
billion.
(b)
At June 30, 2022, approximately
58
percent of our hedge fund portfolio is available for redemption in 2022. The remaining
42
percent will be available for redemption between 2023 and 2028.
(c)
Represents values net of accumulated depreciation. At June 30, 2022 and December 31, 2021, the accumulated depreciation was $
813
million and $
778
million, respectively.
(d)
Includes AIG's ownership interest in Fortitude Group Holdings, LLC (FRL), which is recorded using the measurement alternative for equity securities. Our investment in FRL totaled $
156
million and $
100
million at June 30, 2022 and December 31, 2021, respectively.
|
36
|
AIG | Second Quarter 2022 Form 10-Q
|
||||
ITEM 1 |
Notes to Condensed Consolidated Financial Statements (unaudited) |
5. Investments
NET INVESTMENT INCOME
The following table presents the components of Net investment income:
| Three Months Ended June 30, | 2022 | 2021 | |||||||||||||||||||||||||||||||||||||||
| (in millions) |
Excluding Fortitude
Re Funds Withheld Assets |
Fortitude Re
Funds Withheld Assets |
Total |
Excluding Fortitude
Re Funds Withheld Assets |
Fortitude Re
Funds Withheld Assets |
Total | |||||||||||||||||||||||||||||||||||
| Available for sale fixed maturity securities, including short-term investments | $ |
|
$ |
|
$ |
|
$ |
|
$ |
|
$ |
|
|||||||||||||||||||||||||||||
|
Other fixed maturity securities
(a)
|
(
|
(
|
(
|
|
|
|
|||||||||||||||||||||||||||||||||||
| Equity securities |
(
|
|
(
|
(
|
|
(
|
|||||||||||||||||||||||||||||||||||
| Interest on mortgage and other loans |
|
|
|
|
|
|
|||||||||||||||||||||||||||||||||||
|
Alternative investments
(b)
|
|
|
|
|
|
|
|||||||||||||||||||||||||||||||||||
| Real estate |
|
|
|
|
|
|
|||||||||||||||||||||||||||||||||||
|
Other investments
(c)
|
|
|
|
(
|
|
(
|
|||||||||||||||||||||||||||||||||||
| Total investment income |
|
|
|
|
|
|
|||||||||||||||||||||||||||||||||||
| Investment expenses |
|
|
|
|
|
|
|||||||||||||||||||||||||||||||||||
| Net investment income | $ |
|
$ |
|
$ |
|
$ |
|
$ |
|
$ |
|
|||||||||||||||||||||||||||||
| Six Months Ended June 30, | 2022 | 2021 | |||||||||||||||||||||||||||||||||||||||
| (in millions) |
Excluding Fortitude
Re Funds Withheld Assets |
Fortitude Re
Funds Withheld Assets |
Total |
Excluding Fortitude
Re Funds Withheld Assets |
Fortitude Re
Funds Withheld Assets |
Total | |||||||||||||||||||||||||||||||||||
| Available for sale fixed maturity securities, including short-term investments | $ |
|
$ |
|
$ |
|
$ |
|
$ |
|
$ |
|
|||||||||||||||||||||||||||||
|
Other fixed maturity securities
(a)
|
(
|
(
|
(
|
(
|
|
(
|
|||||||||||||||||||||||||||||||||||
| Equity securities |
(
|
|
(
|
|
|
|
|||||||||||||||||||||||||||||||||||
| Interest on mortgage and other loans |
|
|
|
|
|
|
|||||||||||||||||||||||||||||||||||
|
Alternative investments
(b)
|
|
|
|
|
|
|
|||||||||||||||||||||||||||||||||||
| Real estate |
|
|
|
|
|
|
|||||||||||||||||||||||||||||||||||
|
Other investments
(c)
|
|
|
|
|
|
|
|||||||||||||||||||||||||||||||||||
| Total investment income |
|
|
|
|
|
|
|||||||||||||||||||||||||||||||||||
| Investment expenses |
|
|
|
|
|
|
|||||||||||||||||||||||||||||||||||
| Net investment income | $ |
|
$ |
|
$ |
|
$ |
|
$ |
|
$ |
|
|||||||||||||||||||||||||||||
(a)
Included in the three- and six-month periods ended June 30, 2022 were income (loss) of $(
55
) million and $(
151
) million, respectively, related to fixed maturity securities measured at fair value that economically hedge liabilities described in (c) below. Included in the three- and six-month periods ended June 30, 2021 were income (loss) of $
35
million and $(
46
) million, respectively, related to fixed maturity securities measured at fair value that economically hedge liabilities described in (c) below.
(b)
Included income from hedge funds, private equity funds and affordable housing partnerships. Hedge funds are recorded as of the balance sheet date. Private equity funds are generally reported on a one-quarter lag.
|
AIG | Second Quarter 2022 Form 10-Q
|
37
|
||||
ITEM 1 |
Notes to Condensed Consolidated Financial Statements (unaudited) |
5. Investments
NET REALIZED GAINS AND LOSSES
The following table presents the components of Net realized gains (losses):
| Three Months Ended June 30, | 2022 | 2021 | |||||||||||||||||||||||||||||||||||||||
| (in millions) |
Excluding
Fortitude Re Funds Withheld Assets |
Fortitude Re
Funds Withheld Assets |
Total
|
Excluding
Fortitude Re Funds Withheld Assets |
Fortitude Re
Funds Withheld Assets |
Total
|
|||||||||||||||||||||||||||||||||||
| Sales of fixed maturity securities | $ |
(
|
$ |
(
|
$ |
(
|
$ |
|
$ |
|
$ |
|
|||||||||||||||||||||||||||||
| Change in allowance for credit losses on fixed maturity securities |
(
|
(
|
(
|
|
|
|
|||||||||||||||||||||||||||||||||||
| Change in allowance for credit losses on loans |
|
|
|
|
|
|
|||||||||||||||||||||||||||||||||||
| Foreign exchange transactions |
(
|
(
|
(
|
|
|
|
|||||||||||||||||||||||||||||||||||
| Variable annuity embedded derivatives, net of related hedges |
|
|
|
(
|
|
(
|
|||||||||||||||||||||||||||||||||||
| All other derivatives and hedge accounting |
|
|
|
(
|
|
(
|
|||||||||||||||||||||||||||||||||||
| Sales of alternative investments and real estate investments |
|
|
|
|
(
|
|
|||||||||||||||||||||||||||||||||||
| Other |
|
(
|
|
|
|
|
|||||||||||||||||||||||||||||||||||
| Net realized gains (losses) – excluding Fortitude Re funds withheld embedded derivative |
|
(
|
|
(
|
|
|
|||||||||||||||||||||||||||||||||||
| Net realized gains (losses) on Fortitude Re funds withheld embedded derivative |
|
|
|
|
(
|
(
|
|||||||||||||||||||||||||||||||||||
| Net realized gains (losses) | $ |
|
$ |
|
$ |
|
$ |
(
|
$ |
(
|
$ |
(
|
|||||||||||||||||||||||||||||
| Six Months Ended June 30, | 2022 | 2021 | |||||||||||||||||||||||||||||||||||||||
| (in millions) |
Excluding
Fortitude Re
Funds
Withheld Assets
|
Fortitude Re
Funds
Withheld
Assets
|
Total
|
Excluding
Fortitude Re Funds Withheld Assets |
Fortitude Re
Funds Withheld Assets |
Total
|
|||||||||||||||||||||||||||||||||||
| Sales of fixed maturity securities | $ |
(
|
$ |
(
|
$ |
(
|
$ |
|
$ |
|
$ |
|
|||||||||||||||||||||||||||||
| Change in allowance for credit losses on fixed maturity securities |
(
|
(
|
(
|
|
|
|
|||||||||||||||||||||||||||||||||||
| Change in allowance for credit losses on loans |
|
(
|
|
|
|
|
|||||||||||||||||||||||||||||||||||
| Foreign exchange transactions |
(
|
(
|
(
|
|
|
|
|||||||||||||||||||||||||||||||||||
| Variable annuity embedded derivatives, net of related hedges |
|
|
|
|
|
|
|||||||||||||||||||||||||||||||||||
| All other derivatives and hedge accounting |
|
(
|
|
|
(
|
(
|
|||||||||||||||||||||||||||||||||||
| Sales of alternative investments and real estate investments |
|
|
|
|
|
|
|||||||||||||||||||||||||||||||||||
| Other |
(
|
|
(
|
|
|
|
|||||||||||||||||||||||||||||||||||
| Net realized gains (losses) – excluding Fortitude Re funds withheld embedded derivative |
|
(
|
|
|
|
|
|||||||||||||||||||||||||||||||||||
| Net realized gains on Fortitude Re funds withheld embedded derivative |
|
|
|
|
|
|
|||||||||||||||||||||||||||||||||||
| Net realized gains | $ |
|
$ |
|
$ |
|
$ |
|
$ |
|
$ |
|
|||||||||||||||||||||||||||||
|
38
|
AIG | Second Quarter 2022 Form 10-Q
|
||||
ITEM 1 |
Notes to Condensed Consolidated Financial Statements (unaudited) |
5. Investments
CHANGE IN UNREALIZED APPRECIATION (DEPRECIATION) OF INVESTMENTS
The following table presents the increase (decrease) in unrealized appreciation (depreciation) of our available for sale securities and other investments:
| Three Months Ended June 30, | Six Months Ended June 30, | ||||||||||||||||||||||||||||
| (in millions) | 2022 | 2021 | 2022 | 2021 | |||||||||||||||||||||||||
| Increase (decrease) in unrealized appreciation (depreciation) of investments: | |||||||||||||||||||||||||||||
| Fixed maturity securities | $ |
(
|
$ |
|
$ |
(
|
$ |
(
|
|||||||||||||||||||||
| Other investments |
(
|
(
|
(
|
(
|
|||||||||||||||||||||||||
| Total increase (decrease) in unrealized appreciation (depreciation) of investments | $ |
(
|
$ |
|
$ |
(
|
$ |
(
|
|||||||||||||||||||||
The following table summarizes the unrealized gains and losses recognized in Net investment income during the reporting period on equity securities and other investments still held at the reporting date:
| Three Months Ended June 30, | 2022 | 2021 | |||||||||||||||||||||||||||||||||||||||
| (in millions) | Equities |
Other
Invested Assets |
Total | Equities |
Other
Invested Assets |
Total | |||||||||||||||||||||||||||||||||||
| Net gains (losses) recognized during the period on equity securities and other investments | $ |
(
|
$ |
(
|
$ |
(
|
$ |
(
|
$ |
|
$ |
|
|||||||||||||||||||||||||||||
| Less: Net losses recognized during the period on equity securities and other investments sold during the period |
(
|
(
|
(
|
(
|
(
|
(
|
|||||||||||||||||||||||||||||||||||
| Unrealized gains (losses) recognized during the reporting period on equity securities and other investments still held at the reporting date | $ |
(
|
$ |
(
|
$ |
(
|
$ |
|
$ |
|
$ |
|
|||||||||||||||||||||||||||||
| Six Months Ended June 30, | 2022 | 2021 | |||||||||||||||||||||||||||||||||||||||
| (in millions) | Equities |
Other
Invested Assets |
Total | Equities |
Other
Invested Assets |
Total | |||||||||||||||||||||||||||||||||||
| Net gains (losses) recognized during the period on equity securities and other investments | $ |
(
|
$ |
|
$ |
|
$ |
|
$ |
|
$ |
|
|||||||||||||||||||||||||||||
| Less: Net gains (losses) recognized during the period on equity securities and other investments sold during the period |
|
(
|
|
(
|
|
(
|
|||||||||||||||||||||||||||||||||||
|
Unrealized gains (losses) recognized during the reporting period on
equity securities and other investments still held at the reporting date
|
$ |
(
|
$ |
|
$ |
|
$ |
|
$ |
|
$ |
|
|||||||||||||||||||||||||||||
EVALUATING INVESTMENTS FOR AN ALLOWANCE FOR CREDIT LOSSES
For a discussion of our policy for evaluating investments for an allowance for credit losses, see Note 5 to the Consolidated Financial Statements in the 2021 Annual Report.
Credit Impairments
The following table presents a rollforward of the changes in allowance for credit losses on available for sale fixed maturity securities by major investment category:
| Three Months Ended June 30, | 2022 | 2021 | |||||||||||||||||||||||||||||||||||||||
| (in millions) | Structured | Non-Structured | Total | Structured |
Non-
Structured |
Total | |||||||||||||||||||||||||||||||||||
| Balance, beginning of period | $ |
|
$ |
|
$ |
|
$ |
|
$ |
|
$ |
|
|||||||||||||||||||||||||||||
| Additions: | |||||||||||||||||||||||||||||||||||||||||
| Securities for which allowance for credit losses were not previously recorded |
|
|
|
|
|
|
|||||||||||||||||||||||||||||||||||
| Reductions: | |||||||||||||||||||||||||||||||||||||||||
| Securities sold during the period |
(
|
(
|
(
|
(
|
(
|
(
|
|||||||||||||||||||||||||||||||||||
| Addition to (release of) the allowance for credit losses on securities that had an allowance recorded in a previous period, for which there was no intent to sell before recovery of amortized cost basis |
|
|
|
(
|
(
|
(
|
|||||||||||||||||||||||||||||||||||
| Write-offs charged against the allowance |
|
(
|
(
|
|
(
|
(
|
|||||||||||||||||||||||||||||||||||
| Other |
|
(
|
(
|
|
|
|
|||||||||||||||||||||||||||||||||||
| Balance, end of period | $ |
|
$ |
|
$ |
|
$ |
|
$ |
|
$ |
|
|||||||||||||||||||||||||||||
|
AIG | Second Quarter 2022 Form 10-Q
|
39
|
||||
ITEM 1 |
Notes to Condensed Consolidated Financial Statements (unaudited) |
5. Investments
| Six Months Ended June 30, | 2022 | 2021 | |||||||||||||||||||||||||||||||||||||||
| (in millions) | Structured | Non-Structured | Total | Structured |
Non-
Structured |
Total | |||||||||||||||||||||||||||||||||||
| Balance, beginning of period | $ |
|
$ |
|
$ |
|
$ |
|
$ |
|
$ |
|
|||||||||||||||||||||||||||||
| Additions: | |||||||||||||||||||||||||||||||||||||||||
| Securities for which allowance for credit losses were not previously recorded |
|
|
|
|
|
|
|||||||||||||||||||||||||||||||||||
| Reductions: | |||||||||||||||||||||||||||||||||||||||||
| Securities sold during the period |
(
|
(
|
(
|
(
|
(
|
(
|
|||||||||||||||||||||||||||||||||||
| Addition to (release of) the allowance for credit losses on securities that had an allowance recorded in a previous period, for which there was no intent to sell before recovery of amortized cost basis |
(
|
(
|
(
|
(
|
(
|
(
|
|||||||||||||||||||||||||||||||||||
| Write-offs charged against the allowance |
|
(
|
(
|
|
(
|
(
|
|||||||||||||||||||||||||||||||||||
| Other |
|
|
|
|
|
|
|||||||||||||||||||||||||||||||||||
| Balance, end of period | $ |
|
$ |
|
$ |
|
$ |
|
$ |
|
$ |
|
|||||||||||||||||||||||||||||
Purchased Credit Deteriorated (PCD) Securities
We purchase certain RMBS securities that have experienced more-than-insignificant deterioration in credit quality since origination. These are referred to as PCD assets. At the time of purchase an allowance is recognized for these PCD assets by adding it to the purchase price to arrive at the initial amortized cost. There is no credit loss expense recognized upon acquisition of a PCD asset. When determining the initial allowance for credit losses, management considers the historical performance of underlying assets and available market information as well as bond-specific structural considerations, such as credit enhancement and the priority of payment structure of the security. In addition, the process of estimating future cash flows includes, but is not limited to, the following critical inputs:
•
Current delinquency rates;
•
Expected default rates and the timing of such defaults;
•
Loss severity and the timing of any recovery; and
•
Expected prepayment speeds.
Subsequent to the acquisition date, the PCD assets follow the same accounting as other structured securities that are not high credit quality.
We did not purchase securities with more than insignificant credit deterioration since their origination during the six-month periods ended June 30, 2022 and 2021.
PLEDGED INVESTMENTS
Secured Financing and Similar Arrangements
We enter into secured financing transactions whereby certain securities are sold under agreements to repurchase (repurchase agreements), in which we transfer securities in exchange for cash, with an agreement by us to repurchase the same or substantially similar securities. Our secured financing transactions also include those that involve the transfer of securities to financial institutions in exchange for cash (securities lending agreements). In all of these secured financing transactions, the securities transferred by us (pledged collateral) may be sold or repledged by the counterparties. These agreements are recorded at their contracted amounts plus accrued interest, other than those that are accounted for at fair value.
Pledged collateral levels are monitored daily and are generally maintained at an agreed-upon percentage of the fair value of the amounts borrowed during the life of the transactions. In the event of a decline in the fair value of the pledged collateral under these secured financing transactions, we may be required to transfer cash or additional securities as pledged collateral under these agreements. At the termination of the transactions, we and our counterparties are obligated to return the amounts borrowed and the securities transferred, respectively.
The following table presents the fair value of securities pledged to counterparties under secured financing transactions, including repurchase and securities lending agreements:
| (in millions) | June 30, 2022 | December 31, 2021 | ||||||||||||
| Fixed maturity securities available for sale | $ |
|
$ |
|
||||||||||
At June 30, 2022 and December 31, 2021, amounts borrowed under repurchase and securities lending agreements totaled $
3.5
billion and $
3.7
billion, respectively.
|
40
|
AIG | Second Quarter 2022 Form 10-Q
|
||||
ITEM 1 |
Notes to Condensed Consolidated Financial Statements (unaudited) |
5. Investments
The following table presents the fair value of securities pledged under our repurchase agreements by collateral type and by remaining contractual maturity:
| Remaining Contractual Maturity of the Agreements | ||||||||||||||||||||||||||||||||||||||
| (in millions) | Overnight and Continuous |
up to
30 days |
31 - 90
days |
91 - 364
days |
365 days or greater | Total | ||||||||||||||||||||||||||||||||
| June 30, 2022 | ||||||||||||||||||||||||||||||||||||||
| Bonds available for sale: | ||||||||||||||||||||||||||||||||||||||
| Non-U.S. governments | $ |
|
$ |
|
$ |
|
$ |
|
$ |
|
$ |
|
||||||||||||||||||||||||||
| Corporate debt |
|
|
|
|
|
|
||||||||||||||||||||||||||||||||
| Total | $ |
|
$ |
|
$ |
|
$ |
|
$ |
|
$ |
|
||||||||||||||||||||||||||
| December 31, 2021 | ||||||||||||||||||||||||||||||||||||||
| Bonds available for sale: | ||||||||||||||||||||||||||||||||||||||
| Non-U.S. governments | $ |
|
$ |
|
$ |
|
$ |
|
$ |
|
$ |
|
||||||||||||||||||||||||||
| Corporate debt |
|
|
|
|
|
|
||||||||||||||||||||||||||||||||
| Total | $ |
|
$ |
|
$ |
|
$ |
|
$ |
|
$ |
|
||||||||||||||||||||||||||
The following table presents the fair value of securities pledged under our securities lending agreements by collateral type and by remaining contractual maturity:
| Remaining Contractual Maturity of the Agreements | ||||||||||||||||||||||||||||||||||||||
| (in millions) | Overnight and Continuous |
up to
30 days |
31 - 90
days |
91 - 364
days |
365 days or greater | Total | ||||||||||||||||||||||||||||||||
| June 30, 2022 | ||||||||||||||||||||||||||||||||||||||
| Bonds available for sale: | ||||||||||||||||||||||||||||||||||||||
| Obligations of states, municipalities and political subdivisions | $ |
|
$ |
|
$ |
|
$ |
|
$ |
|
$ |
|
||||||||||||||||||||||||||
| Non-U.S. governments |
|
|
|
|
|
|
||||||||||||||||||||||||||||||||
| Corporate debt |
|
|
|
|
|
|
||||||||||||||||||||||||||||||||
| Other bond securities: | ||||||||||||||||||||||||||||||||||||||
| Non-U.S. governments |
|
|
|
|
|
|
||||||||||||||||||||||||||||||||
| Corporate debt |
|
|
|
|
|
|
||||||||||||||||||||||||||||||||
| Total | $ |
|
$ |
|
$ |
|
$ |
|
$ |
|
$ |
|
||||||||||||||||||||||||||
| December 31, 2021 | ||||||||||||||||||||||||||||||||||||||
| Bonds available for sale: | ||||||||||||||||||||||||||||||||||||||
| Obligations of states, municipalities and political subdivisions | $ |
|
$ |
|
$ |
|
$ |
|
$ |
|
$ |
|
||||||||||||||||||||||||||
| Non-U.S. governments |
|
|
|
|
|
|
||||||||||||||||||||||||||||||||
| Corporate debt |
|
|
|
|
|
|
||||||||||||||||||||||||||||||||
| Total | $ |
|
$ |
|
$ |
|
$ |
|
$ |
|
$ |
|
||||||||||||||||||||||||||
We also enter into agreements in which securities are purchased by us under agreements to resell (reverse repurchase agreements), which are accounted for as secured financing transactions and reported as short-term investments or other assets, depending on their terms. These agreements are recorded at their contracted resale amounts plus accrued interest, other than those that are accounted for at fair value. In all reverse repurchase transactions, we take possession of or obtain a security interest in the related securities, and we have the right to sell or repledge this collateral received.
The following table presents information on the fair value of securities pledged to us under reverse repurchase agreements:
| (in millions) | June 30, 2022 | December 31, 2021 | ||||||||||||
| Securities collateral pledged to us | $ |
|
$ |
|
||||||||||
At June 30, 2022 and December 31, 2021, the carrying value of reverse repurchase agreements totaled $
409
million and $
1.9
billion, respectively.
We do not currently offset any secured financing transactions. All such transactions are collateralized and margined on a daily basis consistent with market standards and subject to enforceable master netting arrangements with rights of set off.
|
AIG | Second Quarter 2022 Form 10-Q
|
41
|
||||
ITEM 1 |
Notes to Condensed Consolidated Financial Statements (unaudited) |
5. Investments
Insurance – Statutory and Other Deposits
The total carrying value of cash and securities deposited by our insurance subsidiaries under requirements of regulatory authorities or other insurance-related arrangements, including certain annuity-related obligations and certain reinsurance contracts, was $
12.1
billion and $
13.5
billion at June 30, 2022 and December 31, 2021, respectively.
Other Pledges and Restrictions
Certain of our subsidiaries are members of Federal Home Loan Banks (FHLBs) and such membership requires the members to own stock in these FHLBs. We owned an aggregate of $
213
million and $
211
million of stock in FHLBs at June 30, 2022 and December 31, 2021, respectively. In addition, our subsidiaries have pledged securities available for sale and residential loans associated with borrowings and funding agreements from FHLBs, with a fair value of $
4.8
billion and $
2.0
billion, respectively, at June 30, 2022 and $
5.1
billion and $
1.5
billion, respectively, at December 31, 2021.
Certain GIAs have provisions that require collateral to be posted or payments to be made by us upon a downgrade of our long-term debt ratings. The actual amount of collateral required to be posted to the counterparties in the event of such downgrades, and the aggregate amount of payments that we could be required to make, depend on market conditions, the fair value of outstanding affected transactions and other factors prevailing at and after the time of the downgrade. The fair value of securities pledged as collateral with respect to these obligations was approximately $
1.5
billion and $
1.4
billion, at June 30, 2022 and December 31, 2021, respectively. This collateral primarily consists of securities of the U.S. government and government sponsored entities and generally cannot be repledged or resold by the counterparties.
Investments held in escrow accounts or otherwise subject to restriction as to their use were $
571
million and $
514
million, comprised of bonds available for sale and short-term investments at June 30, 2022 and December 31, 2021, respectively.
Reinsurance transactions between AIG and Fortitude Re were structured as modco and loss portfolio transfer arrangements with funds withheld.
6. Lending Activities
The following table presents the composition of Mortgage and other loans receivable, net:
| (in millions) | June 30, 2022 | December 31, 2021 | ||||||||||||
|
Commercial mortgages
(a)
|
$ |
|
$ |
|
||||||||||
| Residential mortgages |
|
|
||||||||||||
| Life insurance policy loans |
|
|
||||||||||||
|
Commercial loans, other loans and notes receivable
(b)
|
|
|
||||||||||||
| Total mortgage and other loans receivable |
|
|
||||||||||||
|
Allowance for credit losses
(c)
|
(
|
(
|
||||||||||||
| Mortgage and other loans receivable, net | $ |
|
$ |
|
||||||||||
(a)
Commercial mortgages primarily represent loans for apartments, offices and retail properties, with exposures in New York and California representing the largest geographic concentrations (aggregating approximately
20
percent and
12
percent, respectively, at June 30, 2022 and
21
percent and
10
percent, respectively, at December 31, 2021).
(b)
Includes loans held for sale which are carried at lower of cost or market and are collateralized primarily by apartments. As of June 30, 2022 and December 31, 2021, the net carrying value of these loans were $
186
million and $
15
million, respectively.
(c)
Does not include allowance for credit losses of $
89
million and $
71
million, respectively, at June 30, 2022 and December 31, 2021, in relation to off-balance-sheet commitments to fund commercial mortgage loans, which is recorded in Other liabilities.
Interest income is not accrued when payment of contractual principal and interest is not expected. Any cash received on impaired loans is generally recorded as a reduction of the current carrying amount of the loan. Accrual of interest income is generally resumed when delinquent contractual principal and interest is repaid or when a portion of the delinquent contractual payments are made and the ongoing required contractual payments have been made for an appropriate period. As of June 30, 2022, $
8
million and $
337
million of residential mortgage loans and commercial mortgage loans, respectively, were placed on nonaccrual status. As of December 31, 2021, $
7
million and $
226
million of residential mortgage loans and commercial mortgage loans, respectively, were placed on nonaccrual status.
|
42
|
AIG | Second Quarter 2022 Form 10-Q
|
||||
ITEM 1 |
Notes to Condensed Consolidated Financial Statements (unaudited)
| 6. Lending Activities
Accrued interest is presented separately and is included in Accrued investment income on the Condensed Consolidated Balance Sheets. As of June 30, 2022, accrued interest receivable was $
13
million and $
134
million associated with residential mortgage loans and commercial mortgage loans, respectively. As of December 31, 2021, accrued interest receivable was $
12
million and $
126
million associated with residential mortgage loans and commercial mortgage loans, respectively.
A significant majority of commercial mortgages in the portfolio are non-recourse loans and, accordingly, the only guarantees are for specific items that are exceptions to the non-recourse provisions. It is therefore extremely rare for us to have cause to enforce the provisions of a guarantee on a commercial real estate or mortgage loan.
Nonperforming loans are generally those loans where payment of contractual principal or interest is more than 90 days past due. Nonperforming loans were not significant for any of the periods presented.
CREDIT QUALITY OF COMMERCIAL MORTGAGES
The following table presents debt service coverage ratios
(a)
for commercial mortgages by year of vintage:
| June 30, 2022 | 2022 | 2021 | 2020 | 2019 | 2018 | Prior | Total | |||||||||||||||||||||||||||||||||||||
| (in millions) | ||||||||||||||||||||||||||||||||||||||||||||
| >1.2X | $ |
|
$ |
|
$ |
|
$ |
|
$ |
|
$ |
|
$ |
|
||||||||||||||||||||||||||||||
| 1.00 - 1.20X |
|
|
|
|
|
|
|
|||||||||||||||||||||||||||||||||||||
| <1.00X |
|
|
|
|
|
|
|
|||||||||||||||||||||||||||||||||||||
| Total commercial mortgages | $ |
|
$ |
|
$ |
|
$ |
|
$ |
|
$ |
|
$ |
|
||||||||||||||||||||||||||||||
| December 31, 2021 | 2021 | 2020 | 2019 | 2018 | 2017 | Prior | Total | |||||||||||||||||||||||||||||||||||||
| (in millions) | ||||||||||||||||||||||||||||||||||||||||||||
| >1.2X | $ |
|
$ |
|
$ |
|
$ |
|
$ |
|
$ |
|
$ |
|
||||||||||||||||||||||||||||||
| 1.00 - 1.20X |
|
|
|
|
|
|
|
|||||||||||||||||||||||||||||||||||||
| <1.00X |
|
|
|
|
|
|
|
|||||||||||||||||||||||||||||||||||||
| Total commercial mortgages | $ |
|
$ |
|
$ |
|
$ |
|
$ |
|
$ |
|
$ |
|
||||||||||||||||||||||||||||||
The following table presents loan-to-value ratios
(b)
for commercial mortgages by year of vintage:
| June 30, 2022 | 2022 | 2021 | 2020 | 2019 | 2018 | Prior | Total | |||||||||||||||||||||||||||||||||||||
| (in millions) | ||||||||||||||||||||||||||||||||||||||||||||
| Less than 65% | $ |
|
$ |
|
$ |
|
$ |
|
$ |
|
$ |
|
$ |
|
||||||||||||||||||||||||||||||
| 65% to 75% |
|
|
|
|
|
|
|
|||||||||||||||||||||||||||||||||||||
| 76% to 80% |
|
|
|
|
|
|
|
|||||||||||||||||||||||||||||||||||||
| Greater than 80% |
|
|
|
|
|
|
|
|||||||||||||||||||||||||||||||||||||
| Total commercial mortgages | $ |
|
$ |
|
$ |
|
$ |
|
$ |
|
$ |
|
$ |
|
||||||||||||||||||||||||||||||
| December 31, 2021 | 2021 | 2020 | 2019 | 2018 | 2017 | Prior | Total | |||||||||||||||||||||||||||||||||||||
| (in millions) | ||||||||||||||||||||||||||||||||||||||||||||
| Less than 65% | $ |
|
$ |
|
$ |
|
$ |
|
$ |
|
$ |
|
$ |
|
||||||||||||||||||||||||||||||
| 65% to 75% |
|
|
|
|
|
|
|
|||||||||||||||||||||||||||||||||||||
| 76% to 80% |
|
|
|
|
|
|
|
|||||||||||||||||||||||||||||||||||||
| Greater than 80% |
|
|
|
|
|
|
|
|||||||||||||||||||||||||||||||||||||
| Total commercial mortgages | $ |
|
$ |
|
$ |
|
$ |
|
$ |
|
$ |
|
$ |
|
||||||||||||||||||||||||||||||
(a)
The debt service coverage ratio compares a property’s net operating income to its debt service payments, including principal and interest. Our weighted average debt service coverage ratio was
1.9
X at both June 30, 2022 and December 31, 2021. The debt service coverage ratios have been updated within the last three months. The debt service coverage ratios are updated when additional relevant information becomes available.
(b)
The loan-to-value ratio compares the current unpaid principal balance of the loan to the estimated fair value of the underlying property collateralizing the loan. Our weighted average loan-to-value ratio was
57
percent at June 30, 2022 and was
57
percent at December 31, 2021. The loan-to-value ratios have been updated within the last three months.
|
AIG | Second Quarter 2022 Form 10-Q
|
43
|
||||
ITEM 1 |
Notes to Condensed Consolidated Financial Statements (unaudited)
| 6. Lending Activities
The following table presents the credit quality performance indicators for commercial mortgages:
|
Number
of Loans |
Class |
Percent
of Total |
|||||||||||||||||||||||||||||||||||||||||||||||||||
| (dollars in millions) | Apartments | Offices | Retail | Industrial | Hotel | Others | Total | ||||||||||||||||||||||||||||||||||||||||||||||
| June 30, 2022 | |||||||||||||||||||||||||||||||||||||||||||||||||||||
| Credit Quality Performance Indicator: | |||||||||||||||||||||||||||||||||||||||||||||||||||||
| In good standing |
|
$ |
|
$ |
|
$ |
|
$ |
|
$ |
|
$ |
|
$ |
|
|
% | ||||||||||||||||||||||||||||||||||||
|
Restructured
(a)
|
|
|
|
|
|
|
|
|
|
||||||||||||||||||||||||||||||||||||||||||||
| 90 days or less delinquent |
|
|
|
|
|
|
|
|
|
||||||||||||||||||||||||||||||||||||||||||||
| >90 days delinquent or in process of foreclosure |
|
|
|
|
|
|
|
|
|
||||||||||||||||||||||||||||||||||||||||||||
|
Total
(b)
|
|
$ |
|
$ |
|
$ |
|
$ |
|
$ |
|
$ |
|
$ |
|
|
% | ||||||||||||||||||||||||||||||||||||
| Allowance for credit losses | $ |
|
$ |
|
|
|
|
|
$ |
|
|
% | |||||||||||||||||||||||||||||||||||||||||
| December 31, 2021 | |||||||||||||||||||||||||||||||||||||||||||||||||||||
| Credit Quality Performance Indicator: | |||||||||||||||||||||||||||||||||||||||||||||||||||||
| In good standing |
|
$ |
|
$ |
|
$ |
|
$ |
|
$ |
|
$ |
|
$ |
|
|
% | ||||||||||||||||||||||||||||||||||||
|
Restructured
(a)
|
|
|
|
|
|
|
|
|
|
||||||||||||||||||||||||||||||||||||||||||||
| 90 days or less delinquent |
|
|
|
|
|
|
|
|
|
||||||||||||||||||||||||||||||||||||||||||||
| >90 days delinquent or in process of foreclosure |
|
|
|
|
|
|
|
|
|
||||||||||||||||||||||||||||||||||||||||||||
|
Total
(b)
|
|
$ |
|
$ |
|
$ |
|
$ |
|
$ |
|
$ |
|
$ |
|
|
% | ||||||||||||||||||||||||||||||||||||
| Allowance for credit losses | $ |
|
$ |
|
$ |
|
$ |
|
$ |
|
$ |
|
$ |
|
|
% | |||||||||||||||||||||||||||||||||||||
(a)
Loans that have been modified in troubled debt restructurings and are performing according to their restructured terms.
For additional discussion of troubled debt restructurings see Note 6 to the Consolidated Financial Statements in the 2021 Annual Report.
(b)
Does not reflect allowance for credit losses.
The following table presents credit quality performance indicators for residential mortgages by year of vintage:
| June 30, 2022 | 2022 | 2021 | 2020 | 2019 | 2018 | Prior | Total | ||||||||||||||||||||||||||||||||||||||||
| (in millions) | |||||||||||||||||||||||||||||||||||||||||||||||
| FICO*: | |||||||||||||||||||||||||||||||||||||||||||||||
| 780 and greater | $ |
|
$ |
|
$ |
|
$ |
|
$ |
|
$ |
|
$ |
|
|||||||||||||||||||||||||||||||||
| 720 - 779 |
|
|
|
|
|
|
|
||||||||||||||||||||||||||||||||||||||||
| 660 - 719 |
|
|
|
|
|
|
|
||||||||||||||||||||||||||||||||||||||||
| 600 - 659 |
|
|
|
|
|
|
|
||||||||||||||||||||||||||||||||||||||||
| Less than 600 |
|
|
|
|
|
|
|
||||||||||||||||||||||||||||||||||||||||
| Total residential mortgages | $ |
|
$ |
|
$ |
|
$ |
|
$ |
|
$ |
|
$ |
|
|||||||||||||||||||||||||||||||||
| December 31, 2021 | 2021 | 2020 | 2019 | 2018 | 2017 | Prior | Total | ||||||||||||||||||||||||||||||||||||||||
| (in millions) | |||||||||||||||||||||||||||||||||||||||||||||||
| FICO*: | |||||||||||||||||||||||||||||||||||||||||||||||
| 780 and greater | $ |
|
$ |
|
$ |
|
$ |
|
$ |
|
$ |
|
$ |
|
|||||||||||||||||||||||||||||||||
| 720 - 779 |
|
|
|
|
|
|
|
||||||||||||||||||||||||||||||||||||||||
| 660 - 719 |
|
|
|
|
|
|
|
||||||||||||||||||||||||||||||||||||||||
| 600 - 659 |
|
|
|
|
|
|
|
||||||||||||||||||||||||||||||||||||||||
| Less than 600 |
|
|
|
|
|
|
|
||||||||||||||||||||||||||||||||||||||||
| Total residential mortgages | $ |
|
$ |
|
$ |
|
$ |
|
$ |
|
$ |
|
$ |
|
|||||||||||||||||||||||||||||||||
*
Fair Isaac Corporation (FICO) is the credit quality indicator used to evaluate consumer credit risk for residential mortgage loan borrowers and have been updated within the last twelve months.
|
44
|
AIG | Second Quarter 2022 Form 10-Q
|
||||
ITEM 1 |
Notes to Condensed Consolidated Financial Statements (unaudited)
| 6. Lending Activities
METHODOLOGY USED TO ESTIMATE THE ALLOWANCE FOR CREDIT LOSSES
For a discussion of our accounting policy for evaluating Mortgage and other loans receivable for impairment see Note 6 to the Consolidated Financial Statements in the 2021 Annual Report.
The following table presents a rollforward of the changes in the allowance for credit losses on Mortgage and other loans receivable
(a)
:
| Three Months Ended June 30, | 2022 | 2021 | |||||||||||||||||||||||||||||||||||||||
| (in millions) |
Commercial
Mortgages |
Other
Loans |
Total |
Commercial
Mortgages |
Other
Loans |
Total | |||||||||||||||||||||||||||||||||||
| Allowance, beginning of period | $ |
|
$ |
|
$ |
|
$ |
|
$ |
|
$ |
|
|||||||||||||||||||||||||||||
| Loans charged off |
|
|
|
|
|
|
|||||||||||||||||||||||||||||||||||
| Net charge-offs |
|
|
|
|
|
|
|||||||||||||||||||||||||||||||||||
| Addition to (release of) allowance for loan losses |
(
|
(
|
(
|
(
|
(
|
(
|
|||||||||||||||||||||||||||||||||||
| Allowance, end of period | $ |
|
$ |
|
$ |
|
$ |
|
$ |
|
$ |
|
|||||||||||||||||||||||||||||
| Six Months Ended June 30, | 2022 | 2021 | |||||||||||||||||||||||||||||||||||||||
| (in millions) |
Commercial
Mortgages |
Other
Loans |
Total |
Commercial
Mortgages |
Other
Loans |
Total | |||||||||||||||||||||||||||||||||||
| Allowance, beginning of year | $ |
|
$ |
|
$ |
|
$ |
|
$ |
|
$ |
|
|||||||||||||||||||||||||||||
| Loans charged off |
(
|
|
(
|
|
|
|
|||||||||||||||||||||||||||||||||||
| Net charge-offs |
(
|
|
(
|
|
|
|
|||||||||||||||||||||||||||||||||||
| Addition to (release of) allowance for loan losses |
(
|
(
|
(
|
(
|
(
|
(
|
|||||||||||||||||||||||||||||||||||
| Allowance, end of period | $ |
|
$ |
|
$ |
|
$ |
|
$ |
|
$ |
|
|||||||||||||||||||||||||||||
(a)
Does not include allowance for credit losses of $
89
million and $
81
million, respectively, at June 30, 2022 and 2021 in relation to off-balance-sheet commitments to fund commercial mortgage loans, which is recorded in Other liabilities.
Our expectations and models used to estimate the allowance for losses on commercial and residential mortgage loans are regularly updated to reflect the current economic environment. The full impact of COVID-19 on real estate valuations remains uncertain and we will continue to review our valuations as further information becomes available.
TROUBLED DEBT RESTRUCTURINGS
We modify loans to optimize their returns and improve their collectability, among other things. When we undertake such a modification with a borrower that is experiencing financial difficulty and the modification involves us granting a concession to the troubled debtor, the modification is a troubled debt restructuring (TDR). We assess whether a borrower is experiencing financial difficulty based on a variety of factors, including the borrower’s current default on any of its outstanding debt, the probability of a default on any of its debt in the foreseeable future without the modification, the insufficiency of the borrower’s forecasted cash flows to service any of its outstanding debt (including both principal and interest), and the borrower’s inability to access alternative third-party financing at an interest rate that would be reflective of current market conditions for a non-troubled debtor. Concessions granted may include extended maturity dates, interest rate changes, principal or interest forgiveness, payment deferrals and easing of loan covenants.
During the six-month periods ended June 30, 2022 and 2021, loans with a carrying value of $
115
million and $
46
million, respectively, were modified in TDRs.
|
AIG | Second Quarter 2022 Form 10-Q
|
45
|
||||
ITEM 1 |
Notes to Condensed Consolidated Financial Statements (unaudited) |
7. Reinsurance
7. Reinsurance
FORTITUDE RE
Fortitude Re is the reinsurer of the majority of AIG’s run-off operations. The reinsurance transactions are structured as modco and loss portfolio transfer arrangements with funds withheld (funds withheld). In modco and funds withheld arrangements, the investments supporting the reinsurance agreements, and which reflect the majority of the consideration that would be paid to the reinsurer for entering into the transaction, are withheld by, and therefore continue to reside on the balance sheet of, the ceding company (i.e., AIG) thereby creating an obligation for the ceding company to pay the reinsurer (i.e., Fortitude Re) at a later date. Additionally, as AIG maintains ownership of these investments, AIG will maintain its existing accounting for these assets (e.g., the changes in fair value of available for sale securities will be recognized within Other comprehensive income (loss)). As a result of the deconsolidation resulting from the Majority Interest Fortitude Sale, AIG has established a funds withheld payable to Fortitude Re while simultaneously establishing a reinsurance asset representing reserves for the insurance coverage that Fortitude Re has assumed. The funds withheld payable contains an embedded derivative and changes in fair value of the embedded derivative related to the funds withheld payable are recognized in earnings through Net realized gains (losses). This embedded derivative is considered a total return swap with contractual returns that are attributable to various assets and liabilities associated with these reinsurance agreements.
For additional information on Fortitude Re see Note 7 to the Consolidated Financial Statements in the 2021 Annual Report.
There is a diverse pool of assets supporting the funds withheld arrangements with Fortitude Re. The following summarizes the composition of the pool of assets:
| June 30, 2022 | December 31, 2021 | |||||||||||||||||||||||||||||||
| (in millions) |
Carrying
Value |
Fair
Value |
Carrying
Value |
Fair
Value |
Corresponding Accounting Policy | |||||||||||||||||||||||||||
|
Fixed maturity securities - available for sale
(a)
|
$ |
|
$ |
|
$ |
|
$ |
|
Fair value through other comprehensive income (loss) | |||||||||||||||||||||||
| Fixed maturity securities - fair value option |
|
|
|
|
Fair value through net investment income | |||||||||||||||||||||||||||
| Commercial mortgage loans |
|
|
|
|
Amortized cost | |||||||||||||||||||||||||||
| Real estate investments |
|
|
|
|
Amortized cost | |||||||||||||||||||||||||||
| Private equity funds / hedge funds |
|
|
|
|
Fair value through net investment income | |||||||||||||||||||||||||||
| Policy loans |
|
|
|
|
Amortized cost | |||||||||||||||||||||||||||
| Short-term investments |
|
|
|
|
Fair value through net investment income | |||||||||||||||||||||||||||
| Funds withheld investment assets |
|
|
|
|
||||||||||||||||||||||||||||
|
Derivative assets, net
(b)
|
|
|
|
|
Fair value through net realized gains (losses) | |||||||||||||||||||||||||||
|
Other
(c)
|
|
|
|
|
Amortized cost | |||||||||||||||||||||||||||
| Total | $ |
|
$ |
|
$ |
|
$ |
|
||||||||||||||||||||||||
(a)
The change in the net unrealized gains (losses) on available for sale securities related to the Fortitude Re funds withheld assets was $(
6.1
) billion ($(
4.8
) billion after-tax) and $(
1.6
) billion ($(
1.3
) billion after-tax), respectively for the six months ended June 30, 2022 and 2021.
(b)
The derivative assets and liabilities have been presented net of cash collateral. The derivative assets and liabilities supporting the Fortitude Re funds withheld arrangements had a fair market value of $
369
million and $
20
million, respectively, as of June 30, 2022. The derivative assets and liabilities supporting the Fortitude Re funds withheld arrangements had a fair market value of $
389
million and $
10
million, respectively, as of December 31, 2021. These derivative assets and liabilities are fully collateralized either by cash or securities.
(c)
Primarily comprised of Cash and Accrued investment income.
|
46
|
AIG | Second Quarter 2022 Form 10-Q
|
||||
ITEM 1 |
Notes to Condensed Consolidated Financial Statements (unaudited) |
7. Reinsurance
The impact of the funds withheld arrangements with Fortitude Re was as follows:
|
Three Months Ended
June 30, |
Six Months Ended
June 30, |
||||||||||||||||||||||||||||
| (in millions) | 2022 | 2021 | 2022 | 2021 | |||||||||||||||||||||||||
|
Net underwriting income
|
$ |
|
$ |
|
$ |
|
$ |
|
|||||||||||||||||||||
| Net investment income - Fortitude Re funds withheld assets |
|
|
|
|
|||||||||||||||||||||||||
| Net realized gains (losses) on Fortitude Re funds withheld assets: | |||||||||||||||||||||||||||||
| Net realized gains (losses) - Fortitude Re funds withheld assets |
(
|
|
(
|
|
|||||||||||||||||||||||||
| Net realized gains (losses) - Fortitude Re embedded derivatives |
|
(
|
|
|
|||||||||||||||||||||||||
| Net realized gains (losses) on Fortitude Re funds withheld assets |
|
(
|
|
|
|||||||||||||||||||||||||
| Income (loss) from continuing operations before income tax expense (benefit) |
|
(
|
|
|
|||||||||||||||||||||||||
| Income tax expense (benefit) |
|
(
|
|
|
|||||||||||||||||||||||||
|
Income tax expense (benefit)
(a)
|
|
(
|
|
|
|||||||||||||||||||||||||
|
Change in unrealized appreciation (depreciation) of all other investments
(a)
|
(
|
|
(
|
(
|
|||||||||||||||||||||||||
| Comprehensive income (loss) | $ |
|
$ |
(
|
$ |
|
$ |
|
|||||||||||||||||||||
(a)
The income tax expense (benefit) and the tax impact in AOCI was computed using AIG’s U.S. statutory tax rate of 21 percent.
Various assets supporting the Fortitude Re funds withheld arrangements are reported at amortized cost, and as such, changes in the fair value of these assets are not reflected in the financial statements. However, changes in the fair value of these assets are included in the embedded derivative in the Fortitude Re funds withheld arrangements and the appreciation of these assets is the primary driver of the comprehensive income (loss) reflected above.
REINSURANCE – CREDIT LOSSES
The estimation of reinsurance recoverables involves a significant amount of judgment, particularly for latent exposures, such as asbestos, due to their long-tail nature. Reinsurance assets include reinsurance recoverables on unpaid losses and loss adjustment expenses that are estimated as part of our loss reserving process and, consequently, are subject to similar judgments and uncertainties as the estimation of gross loss reserves. Similarly, Other assets include reinsurance recoverables for contracts which are accounted for as deposits.
We assess the collectability of reinsurance recoverable balances in each reporting period, through either historical trends of disputes and credit events or financial analysis of the credit quality of the reinsurer. We record adjustments to reflect the results of these assessments through an allowance for credit losses and disputes that reduces the carrying amount of reinsurance and other assets on the consolidated balance sheets (collectively, reinsurance recoverables). This estimate requires significant judgment for which key considerations include:
•
paid and unpaid amounts recoverable;
•
whether the balance is in dispute or subject to legal collection;
•
the relative financial health of the reinsurer as determined by the Obligor Risk Ratings (ORRs) we assign to each reinsurer based upon our financial reviews; reinsurers that are financially troubled (i.e., in run-off, have voluntarily or involuntarily been placed in receivership, are insolvent, are in the process of liquidation or otherwise subject to formal or informal regulatory restriction) are assigned ORRs that will generate a significant allowance; and
•
whether collateral and collateral arrangements exist.
An estimate of the reinsurance recoverables lifetime expected credit losses is established utilizing a probability of default and loss given default method, which reflects the reinsurer’s ORR. The allowance for credit losses excludes disputed amounts. An allowance for disputes is established for a reinsurance recoverable using the losses incurred model for contingencies.
The total reinsurance recoverables as of June 30, 2022 were $
76.6
billion. As of that date, utilizing AIG’s ORRs, (i) approximately
92
percent of the reinsurance recoverables were investment grade, of which
53
percent related to General Insurance and
39
percent related to Life and Retirement; (ii) approximately
7
percent of the reinsurance recoverables were non-investment grade, the majority of which related to General Insurance; (iii) less than
one
percent of the non-investment grade reinsurance recoverables related to Life and Retirement and (iv) approximately
one
percent of the reinsurance recoverables related to entities that were not rated by AIG.
The total reinsurance recoverables as of December 31, 2021 were $
76.3
billion. As of that date, utilizing AIG’s ORRs, (i) approximately
92
percent of the reinsurance recoverables were investment grade, of which
52
percent related to General Insurance and
40
percent related to Life and Retirement; (ii) approximately
7
percent of the reinsurance recoverables were non-investment grade, the majority of which related to General Insurance; (iii) less than
one
percent of the non-investment grade reinsurance recoverables related to Life and Retirement and (iv) approximately
one
percent of the reinsurance recoverables related to entities that were not rated by AIG.
|
AIG | Second Quarter 2022 Form 10-Q
|
47
|
||||
ITEM 1 |
Notes to Condensed Consolidated Financial Statements (unaudited) |
7. Reinsurance
As of June 30, 2022 and December 31, 2021, approximately
72
percent and
71
percent, respectively, of our non-investment grade reinsurance exposure related to captive insurers. These arrangements are typically collateralized by letters of credit, funds withheld or trust agreements.
Reinsurance Recoverable Allowance
The following table presents a rollforward of the reinsurance recoverable allowance
:
| Three Months Ended June 30, | 2022 | 2021 | |||||||||||||||||||||||||||||||||||||||
| (in millions) | General Insurance | Life and Retirement | Total | General Insurance | Life and Retirement | Total | |||||||||||||||||||||||||||||||||||
| Balance, beginning of period | $ |
|
$ |
|
$ |
|
$ |
|
$ |
|
$ |
|
|||||||||||||||||||||||||||||
| Addition to (release of) allowance for expected credit losses and disputes, net |
(
|
|
(
|
(
|
|
(
|
|||||||||||||||||||||||||||||||||||
| Write-offs charged against the allowance for credit losses and disputes |
|
|
|
(
|
|
(
|
|||||||||||||||||||||||||||||||||||
| Recoveries of amounts previously written off |
|
|
|
|
|
|
|||||||||||||||||||||||||||||||||||
| Other changes |
|
|
|
|
|
|
|||||||||||||||||||||||||||||||||||
| Balance, end of period | $ |
|
$ |
|
$ |
|
$ |
|
$ |
|
$ |
|
|||||||||||||||||||||||||||||
| Six Months Ended June 30, | 2022 | 2021 | |||||||||||||||||||||||||||||||||||||||
| (in millions) | General Insurance | Life and Retirement | Total | General Insurance | Life and Retirement | Total | |||||||||||||||||||||||||||||||||||
| Balance, beginning of year | $ |
|
$ |
|
$ |
|
$ |
|
$ |
|
$ |
|
|||||||||||||||||||||||||||||
| Addition to (release of) allowance for expected credit losses and disputes, net |
|
|
|
|
|
|
|||||||||||||||||||||||||||||||||||
| Write-offs charged against the allowance for credit losses and disputes |
(
|
|
(
|
(
|
|
(
|
|||||||||||||||||||||||||||||||||||
| Recoveries of amounts previously written off |
|
|
|
|
|
|
|||||||||||||||||||||||||||||||||||
| Other changes |
|
|
|
|
|
|
|||||||||||||||||||||||||||||||||||
| Balance, end of period | $ |
|
$ |
|
$ |
|
$ |
|
$ |
|
$ |
|
|||||||||||||||||||||||||||||
There were no material recoveries of credit losses previously written off for the three- and six-month periods ended June 30, 2021.
Past-Due Status
We consider a reinsurance asset to be past due when it is 90 days past due. The allowance for credit losses is estimated excluding disputed amounts. An allowance for disputes is established using the losses incurred method for contingencies. Past due balances on claims that are not in dispute were not material for any of the periods presented.
8. Variable Interest Entities
We enter into various arrangements with variable interest entities (VIEs) in the normal course of business and consolidate the VIEs when we determine we are the primary beneficiary. This analysis includes a review of the VIE’s capital structure, related contractual relationships and terms, nature of the VIE’s operations and purpose, nature of the VIE’s interests issued and our involvement with the entity. When assessing the need to consolidate a VIE, we evaluate the design of the VIE as well as the related risks to which the entity was designed to expose the variable interest holders.
The primary beneficiary is the entity that has both (i) the power to direct the activities of the VIE that most significantly affect the entity’s economic performance and (ii) the obligation to absorb losses or the right to receive benefits that could be potentially significant to the VIE. While also considering these factors, the consolidation conclusion depends on the breadth of our decision-making ability and our ability to influence activities that significantly affect the economic performance of the VIE.
|
48
|
AIG | Second Quarter 2022 Form 10-Q
|
||||
ITEM 1 |
Notes to Condensed Consolidated Financial Statements (unaudited) |
8. Variable Interest Entities
BALANCE SHEET CLASSIFICATION AND EXPOSURE TO LOSS
Creditors or beneficial interest holders of VIEs for which AIG is the primary beneficiary generally have recourse only to the assets and cash flows of the VIEs and do not have recourse to AIG, except in limited circumstances when AIG has provided a guarantee to the VIE’s interest holders.
The following table presents the total assets and total liabilities associated with our variable interests in consolidated VIEs, as classified in the Condensed Consolidated Balance Sheets:
| (in millions) |
Real Estate and
Investment
Entities
(d)
|
Securitization Vehicles | Total | |||||||||||||||||
| June 30, 2022 | ||||||||||||||||||||
| Assets: | ||||||||||||||||||||
| Bonds available for sale | $ |
|
$ |
|
$ |
|
||||||||||||||
| Other bond securities |
|
|
|
|||||||||||||||||
| Equity securities |
|
|
|
|||||||||||||||||
|
Mortgage and other loans receivable
|
|
|
|
|||||||||||||||||
| Other invested assets | ||||||||||||||||||||
|
Alternative investments
(a)
|
|
|
|
|||||||||||||||||
| Investment real estate |
|
|
|
|||||||||||||||||
| Short-term investments |
|
|
|
|||||||||||||||||
| Cash |
|
|
|
|||||||||||||||||
| Accrued investment income |
|
|
|
|||||||||||||||||
|
Other assets
|
|
|
|
|||||||||||||||||
|
Total
(b)
|
$ |
|
$ |
|
$ |
|
||||||||||||||
| Liabilities: | ||||||||||||||||||||
| Debt of consolidated investment entities | $ |
|
$ |
|
$ |
|
||||||||||||||
|
Other
(c)
|
|
|
|
|||||||||||||||||
| Total | $ |
|
$ |
|
$ |
|
||||||||||||||
| December 31, 2021 | ||||||||||||||||||||
| Assets: | ||||||||||||||||||||
| Bonds available for sale | $ |
|
$ |
|
$ |
|
||||||||||||||
| Other bond securities |
|
|
|
|||||||||||||||||
| Equity securities |
|
|
|
|||||||||||||||||
| Mortgage and other loans receivable |
|
|
|
|||||||||||||||||
| Other invested assets | ||||||||||||||||||||
|
Alternative investments
(a)
|
|
|
|
|||||||||||||||||
| Investment real estate |
|
|
|
|||||||||||||||||
| Short-term investments |
|
|
|
|||||||||||||||||
| Cash |
|
|
|
|||||||||||||||||
| Accrued investment income |
|
|
|
|||||||||||||||||
| Other assets |
|
|
|
|||||||||||||||||
|
Total
(b)
|
$ |
|
$ |
|
$ |
|
||||||||||||||
| Liabilities: | ||||||||||||||||||||
| Debt of consolidated investment entities | $ |
|
$ |
|
$ |
|
||||||||||||||
|
Other
(c)
|
|
|
|
|||||||||||||||||
| Total | $ |
|
$ |
|
$ |
|
||||||||||||||
(a)
Comprised primarily of investments in real estate joint ventures at June 30, 2022 and December 31, 2021.
(b)
The assets of each VIE can be used only to settle specific obligations of that VIE.
(c)
Comprised primarily of Other liabilities at June 30, 2022 and December 31, 2021.
(d)
At June 30, 2022 and December 31, 2021, off-balance sheet exposure primarily consisting of our insurance companies’ commitments to real estate and investment entities were $
2.4
billion and $
2.2
billion, respectively, of which commitments to external parties were $
0.6
billion and $
0.6
billion, respectively.
We calculate our maximum exposure to loss to be (i) the amount invested in the debt or equity of the VIE, (ii) the notional amount of VIE assets or liabilities where we have also provided credit protection to the VIE with the VIE as the referenced obligation, and (iii) other commitments and guarantees to the VIE.
|
AIG | Second Quarter 2022 Form 10-Q
|
49
|
||||
ITEM 1 |
Notes to Condensed Consolidated Financial Statements (unaudited) |
8. Variable Interest Entities
The following table presents total assets of unconsolidated VIEs in which we hold a variable interest, as well as our maximum exposure to loss associated with these VIEs:
| Maximum Exposure to Loss | ||||||||||||||||||||||||||||||||
| (in millions) |
Total VIE
Assets |
On-Balance
Sheet (b) |
Off-Balance
Sheet |
Total | ||||||||||||||||||||||||||||
| June 30, 2022 | ||||||||||||||||||||||||||||||||
|
Real estate and investment entities
(a)
|
$ |
|
$ |
|
$ |
|
(c)
|
$ |
|
|||||||||||||||||||||||
| Other |
|
|
|
(d)
|
|
|||||||||||||||||||||||||||
| Total | $ |
|
$ |
|
$ |
|
$ |
|
||||||||||||||||||||||||
| December 31, 2021 | ||||||||||||||||||||||||||||||||
|
Real estate and investment entities
(a)
|
$ |
|
$ |
|
$ |
|
(c)
|
$ |
|
|||||||||||||||||||||||
| Other |
|
|
|
(d)
|
|
|||||||||||||||||||||||||||
| Total | $ |
|
$ |
|
$ |
|
$ |
|
||||||||||||||||||||||||
(a)
Comprised primarily of hedge funds and private equity funds.
(b)
At June 30, 2022 and December 31, 2021, $
8.3
billion and $
7.8
billion, respectively, of our total unconsolidated VIE assets were recorded as Other invested assets.
(c)
These amounts represent our unfunded commitments to invest in private equity funds and hedge funds.
(d)
These amounts represent our estimate of the maximum exposure to loss under certain insurance policies issued to VIEs if a hypothetical loss occurred to the extent of the full amount of the insured value. Our insurance policies cover defined risks and our estimate of liability is included in our insurance reserves on the balance sheet.
For additional information on VIEs see Note 9 to the Consolidated Financial Statements in the 2021 Annual Report
.
9. Derivatives and Hedge Accounting
We use derivatives and other financial instruments as part of our financial risk management programs and as part of our investment operations. Interest rate derivatives (such as interest rate swaps) are used to manage interest rate risk associated with embedded derivatives contained in insurance contract liabilities, fixed maturity securities, outstanding medium- and long-term notes as well as other interest rate sensitive assets and liabilities. Foreign exchange derivatives (principally foreign exchange forwards and swaps) are used to economically mitigate risk associated with non-U.S. dollar denominated debt, net capital exposures, foreign currency transactions, and foreign denominated investments. Equity derivatives are used to mitigate financial risk embedded in certain insurance liabilities and economically hedge certain investments. We use credit derivatives to manage our credit exposures. Commodity derivatives are used to hedge exposures within reinsurance contracts. The derivatives are effective economic hedges of the exposures that they are meant to offset. In addition to hedging activities, we also enter into derivative contracts with respect to investment operations, which may include, among other things, credit default swaps (CDSs), total return swaps and purchases of investments with embedded derivatives, such as equity-linked notes and convertible bonds.
|
50
|
AIG | Second Quarter 2022 Form 10-Q
|
||||
ITEM 1 |
Notes to Condensed Consolidated Financial Statements (unaudited) |
9. Derivatives and Hedge Accounting
The following table presents the notional amounts of our derivatives and the fair value of derivative assets and liabilities in the Condensed Consolidated Balance Sheets:
| June 30, 2022 | December 31, 2021 | ||||||||||||||||||||||||||||||||||||||||||||||||||||||||||
| Gross Derivative Assets | Gross Derivative Liabilities | Gross Derivative Assets | Gross Derivative Liabilities | ||||||||||||||||||||||||||||||||||||||||||||||||||||||||
| (in millions) | Notional Amount |
Fair
Value |
Notional Amount |
Fair
Value |
Notional Amount |
Fair
Value |
Notional Amount |
Fair
Value |
|||||||||||||||||||||||||||||||||||||||||||||||||||
| Derivatives designated as | |||||||||||||||||||||||||||||||||||||||||||||||||||||||||||
|
hedging instruments:
(a)
|
|||||||||||||||||||||||||||||||||||||||||||||||||||||||||||
| Interest rate contracts | $ |
|
$ |
|
$ |
|
$ |
|
$ |
|
$ |
|
$ |
|
$ |
|
|||||||||||||||||||||||||||||||||||||||||||
| Foreign exchange contracts |
|
|
|
|
|
|
|
|
|||||||||||||||||||||||||||||||||||||||||||||||||||
| Derivatives not designated | |||||||||||||||||||||||||||||||||||||||||||||||||||||||||||
|
as hedging instruments:
(a)
|
|||||||||||||||||||||||||||||||||||||||||||||||||||||||||||
| Interest rate contracts |
|
|
|
|
|
|
|
|
|||||||||||||||||||||||||||||||||||||||||||||||||||
| Foreign exchange contracts |
|
|
|
|
|
|
|
|
|||||||||||||||||||||||||||||||||||||||||||||||||||
| Equity contracts |
|
|
|
|
|
|
|
|
|||||||||||||||||||||||||||||||||||||||||||||||||||
| Commodity contracts |
|
|
|
|
|
|
|
|
|||||||||||||||||||||||||||||||||||||||||||||||||||
|
Credit contracts
(b)
|
|
|
|
|
|
|
|
|
|||||||||||||||||||||||||||||||||||||||||||||||||||
|
Other contracts
(c)
|
|
|
|
|
|
|
|
|
|||||||||||||||||||||||||||||||||||||||||||||||||||
| Total derivatives, gross | $ |
|
$ |
|
$ |
|
$ |
|
$ |
|
$ |
|
$ |
|
$ |
|
|||||||||||||||||||||||||||||||||||||||||||
|
Counterparty netting
(d)
|
(
|
(
|
(
|
(
|
|||||||||||||||||||||||||||||||||||||||||||||||||||||||
|
Cash collateral
(e)
|
(
|
(
|
(
|
(
|
|||||||||||||||||||||||||||||||||||||||||||||||||||||||
| Total derivatives on Condensed | |||||||||||||||||||||||||||||||||||||||||||||||||||||||||||
|
Consolidated Balance Sheets
(f)
|
$ |
|
$ |
|
$ |
|
$ |
|
|||||||||||||||||||||||||||||||||||||||||||||||||||
(a)
Fair value amounts are shown before the effects of counterparty netting adjustments and offsetting cash collateral.
(b)
As of June 30, 2022 and December 31, 2021, included CDSs on super senior multi-sector CDOs with a net notional amount of $
93
million and $
97
million (fair value liability of $
32
million and $
30
million), respectively. The net notional amount represents the maximum exposure to loss on the portfolio.
(c)
Consists primarily of stable value wraps and contracts with multiple underlying exposures.
(d)
Represents netting of derivative exposures covered by a qualifying master netting agreement.
(e)
Represents cash collateral posted and received that is eligible for netting.
(f)
Freestanding derivatives only, excludes embedded derivatives. Derivative instrument assets and liabilities are recorded in Other assets and Other liabilities, respectively. Fair value of assets related to bifurcated embedded derivatives was $
0.6
billion and
zero
at June 30, 2022 and December 31, 2021, respectively. Fair value of liabilities related to bifurcated embedded derivatives was $
7.0
billion and $
14.5
billion, respectively, at June 30, 2022 and December 31, 2021. A bifurcated embedded derivative is generally presented with the host contract in the Condensed Consolidated Balance Sheets. Embedded derivatives are primarily related to guarantee features in variable annuity products, which include equity and interest rate components, and the funds withheld arrangement with Fortitude Re.
For additional information see Note 7.
COLLATERAL
We engage in derivative transactions that are not subject to a clearing requirement directly with unaffiliated third parties, in most cases, under International Swaps and Derivatives Association, Inc. (ISDA) Master Agreements. Many of the ISDA Master Agreements also include Credit Support Annex provisions, which provide for collateral postings that may vary at various ratings and threshold levels. We attempt to reduce our risk with certain counterparties by entering into agreements that enable collateral to be obtained from a counterparty on an upfront or contingent basis. We minimize the risk that counterparties might be unable to fulfill their contractual obligations by monitoring counterparty credit exposure and collateral value and generally requiring additional collateral to be posted upon the occurrence of certain events or circumstances. In addition, certain derivative transactions have provisions that require collateral to be posted by us upon a downgrade of our long-term debt ratings or give the counterparty the right to terminate the transaction. In the case of some of the derivative transactions, upon a downgrade of our long-term debt ratings, as an alternative to posting collateral and subject to certain conditions, we may assign the transaction to an obligor with higher debt ratings or arrange for a substitute guarantee of our obligations by an obligor with higher debt ratings or take other similar action. The actual amount of collateral required to be posted to counterparties in the event of such downgrades, or the aggregate amount of payments that we could be required to make, depends on market conditions, the fair value of outstanding affected transactions and other factors prevailing at and after the time of the downgrade.
Collateral posted by us to third parties for derivative transactions was $
3.8
billion at June 30, 2022 and $
2.7
billion at December 31, 2021. In the case of collateral posted under derivative transactions that are not subject to clearing, this collateral can generally be repledged or resold by the counterparties. Collateral provided to us from third parties for derivative transactions was $
2.5
billion and $
2.4
billion at June 30, 2022 and December 31, 2021, respectively. In the case of collateral provided to us under derivative transactions that are not subject to clearing, we generally can repledge or resell collateral.
|
AIG | Second Quarter 2022 Form 10-Q
|
51
|
||||
ITEM 1 |
Notes to Condensed Consolidated Financial Statements (unaudited) |
9. Derivatives and Hedge Accounting
OFFSETTING
We have elected to present all derivative receivables and derivative payables, and the related cash collateral received and paid, on a net basis on our Condensed Consolidated Balance Sheets when a legally enforceable ISDA Master Agreement exists between us and our derivative counterparty. An ISDA Master Agreement is an agreement governing multiple derivative transactions between two counterparties. The ISDA Master Agreement generally provides for the net settlement of all, or a specified group, of these derivative transactions, as well as transferred collateral, through a single payment, and in a single currency, as applicable. The net settlement provisions apply in the event of a default on, or affecting any, one derivative transaction or a termination event affecting all, or a specified group of, derivative transactions governed by the ISDA Master Agreement.
HEDGE ACCOUNTING
We designated certain derivatives entered into with third parties as fair value hedges of available for sale investment securities held by our insurance subsidiaries. The fair value hedges include foreign currency forwards and cross currency swaps designated as hedges of the change in fair value of foreign currency denominated available for sale securities attributable to changes in foreign exchange rates. We also designated certain interest rate swaps entered into with third parties as fair value hedges of fixed rate GICs attributable to changes in benchmark interest rates.
We use foreign currency denominated debt and cross-currency swaps as hedging instruments in net investment hedge relationships to mitigate the foreign exchange risk associated with our non-U.S. dollar functional currency foreign subsidiaries. For net investment hedge relationships where issued debt is used as a hedging instrument, we assess the hedge effectiveness and measure the amount of ineffectiveness based on changes in spot rates. For net investment hedge relationships that use derivatives as hedging instruments, we assess hedge effectiveness and measure hedge ineffectiveness using changes in forward rates. For the three- and six-month periods ended June 30, 2022, we recognized gains (losses) of $
220
million and $
307
million, respectively, and for the three- and six-month periods ende
d
June 30, 2021, we recognized gains (losses) of $
5
million and $
106
million, respectively, included in Change in foreign currency translation adjustments in Other comprehensive income (loss) related to the net investment hedge relationships.
A qualitative methodology is utilized to assess hedge effectiveness for net investment hedges, while regression analysis is employed for all other hedges.
|
52
|
AIG | Second Quarter 2022 Form 10-Q
|
||||
ITEM 1 |
Notes to Condensed Consolidated Financial Statements (unaudited) |
9. Derivatives and Hedge Accounting
The following table presents the gain (loss) recognized in income on our derivative instruments in fair value hedging relationships in the Condensed Consolidated Statements of Income (Loss):
| Gains/(Losses) Recognized in Income for: | ||||||||||||||||||||||||||
| (in millions) |
Hedging
Derivatives
(a)
|
Excluded Components
(b)
|
Hedged
Items |
Net Impact | ||||||||||||||||||||||
| Three Months Ended June 30, 2022 | ||||||||||||||||||||||||||
| Interest rate contracts: | ||||||||||||||||||||||||||
| Interest credited to policyholder account balances | $ |
(
|
$ |
|
$ |
|
$ |
|
||||||||||||||||||
| Net investment income |
|
|
|
|
||||||||||||||||||||||
| Foreign exchange contracts: | ||||||||||||||||||||||||||
| Net realized gains/(losses) |
|
|
(
|
|
||||||||||||||||||||||
| Three Months Ended June 30, 2021 | ||||||||||||||||||||||||||
| Interest rate contracts: | ||||||||||||||||||||||||||
| Interest credited to policyholder account balances | $ |
(
|
$ |
|
$ |
|
$ |
(
|
||||||||||||||||||
| Net investment income (loss) |
(
|
|
|
(
|
||||||||||||||||||||||
| Foreign exchange contracts: | ||||||||||||||||||||||||||
| Net realized gains/(losses) |
(
|
|
|
|
||||||||||||||||||||||
| Six Months Ended June 30, 2022 | ||||||||||||||||||||||||||
| Interest rate contracts: | ||||||||||||||||||||||||||
| Interest credited to policyholder account balances | $ |
(
|
$ |
|
$ |
|
$ |
|
||||||||||||||||||
| Net investment income (loss) |
|
|
(
|
|
||||||||||||||||||||||
| Foreign exchange contracts: | ||||||||||||||||||||||||||
| Net realized gains/(losses) |
|
|
(
|
|
||||||||||||||||||||||
| Six Months Ended June 30, 2021 | ||||||||||||||||||||||||||
| Interest rate contracts: | ||||||||||||||||||||||||||
| Interest credited to policyholder account balances | $ |
(
|
$ |
|
$ |
|
$ |
|
||||||||||||||||||
| Net investment income (loss) |
|
|
(
|
|
||||||||||||||||||||||
| Foreign exchange contracts: | ||||||||||||||||||||||||||
| Net realized gains/(losses) |
(
|
|
|
|
||||||||||||||||||||||
(a)
Gains and losses on derivative instruments designated and qualifying in fair value hedges that are included in the assessment of hedge effectiveness.
(b)
Gains and losses on derivative instruments designated and qualifying in fair value hedges that are excluded from the assessment of hedge effectiveness and recognized in income on a mark-to-market basis.
|
AIG | Second Quarter 2022 Form 10-Q
|
53
|
||||
ITEM 1 |
Notes to Condensed Consolidated Financial Statements (unaudited) |
9. Derivatives and Hedge Accounting
DERIVATIVES NOT DESIGNATED AS HEDGING INSTRUMENTS
The following table presents the effect of derivative instruments not designated as hedging instruments in the Condensed Consolidated Statements of Income (Loss):
| Gains (Losses) Recognized in Income | |||||||||||||||||||||||||||||
| Three Months Ended June 30, | Six Months Ended June 30, | ||||||||||||||||||||||||||||
| (in millions) | 2022 | 2021 | 2022 | 2021 | |||||||||||||||||||||||||
| By Derivative Type: | |||||||||||||||||||||||||||||
| Interest rate contracts | $ |
(
|
$ |
|
$ |
(
|
$ |
(
|
|||||||||||||||||||||
| Foreign exchange contracts |
|
|
|
(
|
|||||||||||||||||||||||||
| Equity contracts |
|
(
|
(
|
(
|
|||||||||||||||||||||||||
| Commodity contracts |
(
|
|
(
|
|
|||||||||||||||||||||||||
| Credit contracts |
|
(
|
(
|
(
|
|||||||||||||||||||||||||
| Other contracts |
|
|
|
|
|||||||||||||||||||||||||
| Embedded derivatives |
|
(
|
|
|
|||||||||||||||||||||||||
| Total | $ |
|
$ |
(
|
$ |
|
$ |
|
|||||||||||||||||||||
| By Classification: | |||||||||||||||||||||||||||||
| Policy fees | $ |
|
$ |
|
$ |
|
$ |
|
|||||||||||||||||||||
| Net investment income |
|
|
|
(
|
|||||||||||||||||||||||||
| Net realized gains (losses) - excluding Fortitude Re funds withheld assets |
|
(
|
|
|
|||||||||||||||||||||||||
|
Net realized gains (losses) on Fortitude Re funds withheld assets
(a)
|
|
(
|
|
|
|||||||||||||||||||||||||
| Policyholder benefits and claims incurred |
(
|
|
(
|
(
|
|||||||||||||||||||||||||
| Total | $ |
|
$ |
(
|
$ |
|
$ |
|
|||||||||||||||||||||
(a)
Includes over-the-counter derivatives supporting the funds withheld arrangements with Fortitude Re and the embedded derivative contained within the funds withheld payable with Fortitude Re.
CREDIT RISK-RELATED CONTINGENT FEATURES
We estimate that at June 30, 2022, based on our outstanding financial derivative transactions, a downgrade of our long-term senior debt ratings to BBB or BBB– by Standard & Poor’s Financial Services LLC, a subsidiary of S&P Global Inc., and/or a downgrade to Baa2 or Baa3 by Moody’s Investors’ Service, Inc. would permit counterparties to make additional collateral calls and permit certain counterparties to elect early termination of contracts, resulting in corresponding collateral postings and termination payments in the total amount of up to approximately $
19
million. The aggregate fair value of our derivatives that were in a net liability position and that contain such credit risk-related contingencies which can be triggered below our long-term senior debt ratings of BBB+ or Baa1 was approximately $
104
million and $
206
million at June 30, 2022 and December 31, 2021, respectively. The aggregate fair value of assets posted as collateral under these contracts at June 30, 2022 and December 31, 2021, was approximately $
120
million and $
239
million, respectively.
HYBRID SECURITIES WITH EMBEDDED CREDIT DERIVATIVES
We invest in hybrid securities (such as credit-linked notes) with the intent of generating income and not specifically to acquire exposure to embedded derivative risk. As is the case with our other investments in RMBS, CMBS, CDOs and ABS, our investments in these hybrid securities are exposed to losses only up to the amount of our initial investment in the hybrid security. Other than our initial investment in the hybrid securities, we have no further obligation to make payments on the embedded credit derivatives in the related hybrid securities.
We elect to account for our investments in these hybrid securities with embedded written credit derivatives at fair value, with changes in fair value recognized in Net investment income. Our investments in these hybrid securities are reported as Other bond securities in the Condensed Consolidated Balance Sheets. The fair values of these hybrid securities were $
1.5
billion and $
2.0
billion at June 30, 2022 and December 31, 2021, respectively. These securities have par amounts of $
4.4
billion and $
4.6
billion at June 30, 2022 and December 31, 2021, respectively, and have remaining stated maturity dates that extend to 2052.
|
54
|
AIG | Second Quarter 2022 Form 10-Q
|
||||
ITEM 1 |
Notes to Condensed Consolidated Financial Statements (unaudited) |
10. Insurance Liabilities
10. Insurance Liabilities
LIABILITY FOR UNPAID LOSSES AND LOSS ADJUSTMENT EXPENSES (LOSS RESERVES)
Our gross loss reserves before reinsurance and discount are net of contractual deductible recoverable amounts due from policyholders of approximately $
12.1
billion and $
12.3
billion at June 30, 2022 and December 31, 2021, respectively. These recoverable amounts are related to certain policies with high deductibles (in excess of high dollar amounts retained by the insured through self-insured retentions, deductibles, retrospective programs, or captive arrangements, each referred to generically as “deductibles”), primarily for U.S. Commercial casualty business. With respect to the deductible portion of the claim, we manage and pay the entire claim on behalf of the insured and are reimbursed by the insured for the deductible portion of the claim. Thus, these recoverable amounts represent a credit exposure to us. At June 30, 2022 and December 31, 2021, we held collateral of approximately $
8.5
billion and $
8.6
billion, respectively, for these deductible recoverable amounts, consisting primarily of letters of credit and funded trust agreements. Allowance for credit losses for the unsecured portion of these recoverable amounts was $
14
million at both June 30, 2022 and December 31, 2021.
The following table presents the rollforward of activity in loss reserves:
| Three Months Ended June 30, | Six Months Ended June 30, | ||||||||||||||||||||||||||||
| (in millions) | 2022 | 2021 | 2022 | 2021 | |||||||||||||||||||||||||
| Liability for unpaid loss and loss adjustment expenses, beginning of period | $ |
|
$ |
|
$ |
|
$ |
|
|||||||||||||||||||||
| Reinsurance recoverable |
(
|
(
|
(
|
(
|
|||||||||||||||||||||||||
| Net Liability for unpaid loss and loss adjustment expenses, beginning of period |
|
|
|
|
|||||||||||||||||||||||||
| Losses and loss adjustment expenses incurred: | |||||||||||||||||||||||||||||
| Current year |
|
|
|
|
|||||||||||||||||||||||||
| Prior years, excluding discount and amortization of deferred gain |
(
|
(
|
(
|
(
|
|||||||||||||||||||||||||
| Prior years, discount charge (benefit) |
|
|
|
|
|||||||||||||||||||||||||
|
Prior years, amortization of deferred gain on retroactive reinsurance
(a)
|
|
(
|
(
|
(
|
|||||||||||||||||||||||||
| Total losses and loss adjustment expenses incurred |
|
|
|
|
|||||||||||||||||||||||||
| Losses and loss adjustment expenses paid: | |||||||||||||||||||||||||||||
| Current year |
(
|
(
|
(
|
(
|
|||||||||||||||||||||||||
| Prior years |
(
|
(
|
(
|
(
|
|||||||||||||||||||||||||
| Total losses and loss adjustment expenses paid |
(
|
(
|
(
|
(
|
|||||||||||||||||||||||||
| Other changes: | |||||||||||||||||||||||||||||
| Foreign exchange effect |
(
|
|
(
|
|
|||||||||||||||||||||||||
|
Retroactive reinsurance adjustment (net of discount)
(b)
|
|
|
|
|
|||||||||||||||||||||||||
| Total other changes |
(
|
|
(
|
|
|||||||||||||||||||||||||
| Liability for unpaid loss and loss adjustment expenses, end of period: | |||||||||||||||||||||||||||||
| Net liability for unpaid losses and loss adjustment expenses |
|
|
|
|
|||||||||||||||||||||||||
| Reinsurance recoverable |
|
|
|
|
|||||||||||||||||||||||||
| Total | $ |
|
$ |
|
$ |
|
$ |
|
|||||||||||||||||||||
(a)
Includes $
6
million and $
1
million for the retroactive reinsurance agreement with National Indemnity Company (NICO), a subsidiary of Berkshire Hathaway Inc. (Berkshire), covering U.S. asbestos exposures for the three-month periods ended June 30, 2022 and 2021, respectively, and $
10
million and $
18
million for the six-month periods ended June 30, 2022 and 2021.
(b)
Includes benefit (charge) from change in discount on retroactive reinsurance in the amount of $
18
million and $
17
million for the three-month periods ended June 30, 2022 and 2021 respectively, and $
57
million and $
56
million for the six-month periods ended June 30, 2022 and 2021 respectively.
|
AIG | Second Quarter 2022 Form 10-Q
|
55
|
||||
ITEM 1 |
Notes to Condensed Consolidated Financial Statements (unaudited) |
10. Insurance Liabilities
On January 20, 2017, we entered into an adverse development reinsurance agreement with NICO, under which we transferred to NICO
80
percent of the reserve risk on substantially all of our U.S. commercial long-tail exposures for accident years 2015 and prior. Under this agreement, we ceded to NICO
80
percent of the paid losses on subject business paid on or after January 1, 2016 in excess of $
25
billion of net paid losses, up to an aggregate limit of $
25
billion. At NICO’s
80
percent share, NICO’s limit of liability under the contract is $
20
billion. We account for this transaction as retroactive reinsurance. We paid total consideration, including interest, of $
10.2
billion. The consideration was placed into a collateral trust account as security for NICO’s claim payment obligations, and Berkshire has provided a parental guarantee to secure the obligations of NICO under the agreement.
Prior Year Development
During the three-month period ended June 30, 2022, we recognized favorable prior year loss reserve development of $
374
million excluding discount and amortization of deferred gain. During the six-month period ended June 30, 2022, we recognized favorable prior year loss reserve development of $
425
million excluding discount and amortization of deferred gain. The development in these periods was largely driven by favorable development on U.S. Workers Compensation, U.S. Other Casualty and Japan Personal Insurance, partially offset by unfavorable development on U.S Property and Special Risks.
During the three-month period ended June 30, 2021, we recognized favorable prior year loss reserve development of $
29
million excluding discount and amortization of deferred gain. During the six-month period ended June 30, 2021, we recognized favorable prior year loss reserve development of $
13
million excluding discount and amortization of deferred gain. The development in these periods was primarily driven by favorable development on U.S. Workers Compensation high deductible business, partially offset by adverse development on runoff companies, especially Blackboard and U.S. Financial Lines. U.S. Workers Compensation favorable development was driven by better than expected loss emergence for many older accident years over the last twelve months and an updated reserve analysis that reduced the ultimate loss estimates for many accident years. Blackboard adverse emergence was driven by significant increases in case incurred claim severity, principally in accident years 2018 to 2020.
Discounting of Loss Reserves
At June 30, 2022 and December 31, 2021, the loss reserves reflect a net loss reserve discount of $
939
million and $
876
million, respectively, including tabular and non-tabular calculations based upon the following assumptions:
•
The non-tabular workers’ compensation discount is calculated separately for companies domiciled in New York, Pennsylvania and Delaware, and follows the statutory regulations (prescribed or permitted) for each state.
–
For New York companies, the discount is based on a
5
percent interest rate and the companies’ own payout patterns.
–
The Pennsylvania and Delaware regulators approved use of a consistent benchmark discount rate and spread (U.S. Treasury rate plus a liquidity premium) to all of our workers’ compensation reserves in our Pennsylvania domiciled and Delaware domiciled companies, as well as our use of updated payout patterns specific to our primary and excess workers compensation portfolios. In 2020, the regulators also approved that the discount rate will be updated on an annual basis.
•
The tabular workers’ compensation discount is calculated based on the mortality rate used in the 2007 U.S. Life table and interest rates prescribed or permitted by each state (i.e. New York is based on
5
percent interest rate and Pennsylvania and Delaware are based on U.S. Treasury rate plus a liquidity premium). In the case that applying this tabular discount factor to our nominal reserves produces a tabular discount that is greater than the indemnity portion of our case reserves, the tabular discount is capped at our estimate of the indemnity portion of our cases reserves (
45
percent).
The discount for asbestos reserves has been fully accreted.
At June 30, 2022 and December 31, 2021, the discount consists of $
272
million and $
260
million of tabular discount, respectively, and $
667
million and $
616
million of non-tabular discount for workers’ compensation, respectively. During the six-month periods ended June 30, 2022 and 2021, the benefit / (charge) from changes in discount of $
6
million and $
10
million, respectively, were recorded as part of the policyholder benefits and losses incurred in the Condensed Consolidated Statements of Income (Loss).
The following table presents the components of the loss reserve discount discussed above:
| (in millions) | June 30, 2022 | December 31, 2021 | ||||||||||||
| U.S. workers' compensation | $ |
|
$ |
|
||||||||||
| Retroactive reinsurance |
(
|
(
|
||||||||||||
|
Total reserve discount
(a)(b)
|
$ |
|
$ |
|
||||||||||
(a)
Excludes $
111
million and $
116
million of discount related to certain long-tail liabilities in the UK at June 30, 2022 and December 31, 2021, respectively.
|
56
|
AIG | Second Quarter 2022 Form 10-Q
|
||||
ITEM 1 |
Notes to Condensed Consolidated Financial Statements (unaudited) |
10. Insurance Liabilities
The following table presents the net loss reserve discount benefit (charge):
| Three Months Ended June 30, | Six Months Ended June 30, | ||||||||||||||||||||||||||||
| (in millions) | 2022 | 2021 | 2022 | 2021 | |||||||||||||||||||||||||
| Current accident year | $ |
|
$ |
|
$ |
|
$ |
|
|||||||||||||||||||||
| Accretion and other adjustments to prior year discount |
(
|
(
|
(
|
(
|
|||||||||||||||||||||||||
| Net reserve discount benefit (charge) |
(
|
(
|
|
|
|||||||||||||||||||||||||
| Change in discount on loss reserves ceded under retroactive reinsurance |
|
|
|
|
|||||||||||||||||||||||||
| Net change in total reserve discount* | $ |
|
$ |
(
|
$ |
|
$ |
|
|||||||||||||||||||||
*
Excludes $(
7
) million and $
2
million discount related to certain long-tail liabilities in the UK for the three-month periods ended June 30, 2022 and 2021, respectively, and excludes $(
5
) million and $
9
million discount related to certain long-tail liabilities in the UK for the six-month periods ended June 30, 2022 and 2021, respectively.
Amortization of Deferred Gain on Retroactive Reinsurance
Amortization of the deferred gain on retroactive reinsurance includes $(
34
) million and $
21
million related to the adverse development reinsurance cover with NICO for the three-month periods ended June 30, 2022 and 2021, respectively, and $
4
million and $
76
million related to the adverse development reinsurance cover with NICO for the six-month periods ended June 30, 2022 and 2021, respectively.
Amounts recognized reflect the amortization of the initial deferred gain at inception, as amended for subsequent changes in the deferred gain due to changes in subject reserves.
11. Contingencies, Commitments and Guarantees
In the normal course of business, various contingent liabilities and commitments are entered into by AIG and our subsidiaries. In addition, AIG Parent guarantees various obligations of certain subsidiaries.
Although AIG cannot currently quantify its ultimate liability for unresolved litigation and investigation matters, including those referred to below, it is possible that such liability could have a material adverse effect on AIG’s consolidated financial condition or its consolidated results of operations or consolidated cash flows for an individual reporting period.
LEGAL CONTINGENCIES
Overview
In the normal course of business, AIG and our subsidiaries are subject to regulatory and government investigations and actions, and litigation and other forms of dispute resolution in a large number of proceedings pending in various domestic and foreign jurisdictions. Certain of these matters involve potentially significant risk of loss due to potential for significant jury awards and settlements, punitive damages or other penalties. Many of these matters are also highly complex and may seek recovery on behalf of a class or similarly large number of plaintiffs. It is therefore inherently difficult to predict the size or scope of potential future losses arising from these matters. In our insurance and reinsurance operations, litigation and arbitration concerning the scope of coverage under insurance and reinsurance contracts, and litigation and arbitration in which our subsidiaries defend or indemnify their insureds under insurance contracts, are generally considered in the establishment of our loss reserves. Separate and apart from the foregoing matters involving insurance and reinsurance coverage, AIG, our subsidiaries and their respective officers and directors are subject to a variety of additional types of legal proceedings brought by holders of AIG securities, customers, employees and others, alleging, among other things, breach of contractual or fiduciary duties, bad faith, indemnification and violations of federal and state statutes and regulations. With respect to these other categories of matters not arising out of claims for insurance or reinsurance coverage, we establish reserves for loss contingencies when it is probable that a loss will be incurred and the amount of the loss can be reasonably estimated. In many instances, we are unable to determine whether a loss is probable or to reasonably estimate the amount of such a loss and, therefore, the potential future losses arising from legal proceedings may exceed the amount of liabilities that we have recorded in our financial statements covering these matters. While such potential future charges could be material, based on information currently known to management, management does not believe, other than as may be discussed below, that any such charges are likely to have a material adverse effect on our financial position or results of operation.
Additionally, from time to time, various regulatory and governmental agencies review the transactions and practices of AIG and our subsidiaries in connection with industry- wide and other inquiries or examinations into, among other matters, the business practices of current and former operating insurance subsidiaries. Such investigations, inquiries or examinations could develop into administrative, civil or criminal proceedings or enforcement actions, in which remedies could include fines, penalties, restitution or alterations in our business practices, and could result in additional expenses, limitations on certain business activities and reputational damage.
|
AIG | Second Quarter 2022 Form 10-Q
|
57
|
||||
ITEM 1 |
Notes to Condensed Consolidated Financial Statements (unaudited)
|
11. Contingencies, Commitments and Guarantees
Moriarty Litigation
Effective January 1, 2013, the California legislature enacted AB 1747 (the Act), which amended the Insurance Code to mandate that life insurance policies issued and delivered in California contain a 60-day grace period during which time the policies must remain in force after a premium payment is missed, and that life insurers provide both a 30-day minimum notification of lapse and the right of policy owners to designate a secondary recipient for lapse and termination notices. Following guidance from the California Department of Insurance and certain industry trade groups, American General Life Insurance Company (AGL) interpreted the Act to be prospective in nature, applying only to policies issued and delivered on or after the Act’s January 1, 2013, effective date. On July 18, 2017, AGL was sued in a putative class action captioned Moriarty v. American General Life Insurance Company, No. 17-cv-1709 (S.D. Cal.), challenging AGL’s prospective application of the Act. Plaintiff’s complaint, which is similar to complaints filed against other insurers, argues that policies issued and delivered prior to January 1, 2013, like the $
1
million policy issued to Plaintiff’s husband do not lapse—despite nonpayment of premiums—if the insurer has not complied with the Act’s terms. On August 30, 2021, the California Supreme Court issued an opinion in McHugh v. Protective Life Insurance, 12 Cal. 5th 213 (2021), ruling that the Act applies to all policies in force on January 1, 2013, regardless of when the policies were issued. The District Court in Moriarty reached effectively the same result on October 2, 2020, when it held that the Act applied to Plaintiff’s husband’s 25-year term life insurance policy under the theory that the payment of premiums “renewed” Plaintiff’s policy after the effective date of the Act. However, the District Court in Moriarty also ruled on October 2, 2020 that various fact issues precluded a final determination as to AGL’s liability and what (if any) corresponding damages may have resulted. In addition, the District Court denied Plaintiff’s motion for class certification without prejudice on November 25, 2020. On February 7, 2022, Plaintiff filed motions for summary judgment and class certification; AGL opposed both motions. In addition, on February 7, 2022, AGL filed a motion for partial summary judgment, which Plaintiff opposed. The District Court heard arguments on these motions on April 11, 2022. On July 26, 2022, the District Court granted in part and denied in part AGL’s motion for partial summary judgment. The Court did not make a final determination as to AGL’s liability and what (if any) corresponding damages may have resulted. Plaintiff’s motions for summary judgment and class certification remain pending before the District Court. Proceedings are ongoing in other California cases that raise similar industry-wide issues. We have accrued our current estimate of probable loss with respect to this litigation.
OTHER COMMITMENTS
In the normal course of business, we enter into commitments to invest in limited partnerships, private equity funds and hedge funds and to purchase and develop real estate in the U.S. and abroad. These commitments totaled $
7.3
billion at both June 30, 2022 and December 31, 2021.
GUARANTEES
Subsidiaries
We have issued unconditional guarantees with respect to the prompt payment, when due, of all present and future payment obligations and liabilities of AIG Financial Products Corp. and related subsidiaries (collectively AIGFP) and of AIG Markets, Inc. arising from transactions entered into by AIG Markets, Inc.
In connection with AIGFP’s business activities, AIGFP has issued, in a limited number of transactions, standby letters of credit or similar facilities to equity investors of structured leasing transactions in an amount equal to the termination value owing to the equity investor by the lessee in the event of a lessee default (the equity termination value). The total amount outstanding at June 30, 2022 was $
70
million. In those transactions, AIGFP has agreed to pay such amount if the lessee fails to pay. The amount payable by AIGFP is, in certain cases, partially offset by amounts payable under other instruments typically equal to the present value of scheduled payments to be made by AIGFP. In the event that AIGFP is required to make a payment to the equity investor, the lessee is unconditionally obligated to reimburse AIGFP. To the extent that the equity investor is paid the equity termination value from the standby letter of credit and/or other sources, including payments by the lessee, AIGFP takes an assignment of the equity investor’s rights under the lease of the underlying property. Because the obligations of the lessee under the lease transactions are generally economically defeased, lessee bankruptcy is the most likely circumstance in which AIGFP would be required to pay without reimbursement.
AIG Parent files a consolidated federal income tax return with certain subsidiaries and acts as an agent for the consolidated tax group when making payments to the Internal Revenue Service (IRS). AIG Parent and its subsidiaries have adopted, pursuant to a written agreement, a method of allocating consolidated federal income taxes. Under an Amended and Restated Tax Payment Allocation Agreement dated June 6, 2011 between AIG Parent and one of its Bermuda-domiciled insurance subsidiaries, AIG Life of Bermuda, Ltd. (AIGB), AIG Parent has agreed to indemnify AIGB for any tax liability (including interest and penalties) resulting from adjustments made by the IRS or other appropriate authorities to taxable income, special deductions or credits in connection with investments made by AIGB in certain affiliated entities.
|
58
|
AIG | Second Quarter 2022 Form 10-Q
|
||||
ITEM 1 |
Notes to Condensed Consolidated Financial Statements (unaudited)
|
11. Contingencies, Commitments and Guarantees
Business and Asset Dispositions
We are subject to financial guarantees and indemnity arrangements in connection with the completed sales of businesses and assets. The various arrangements may be triggered by, among other things, declines in asset values, the occurrence of specified business contingencies, the realization of contingent liabilities, developments in litigation or breaches of representations, warranties or covenants provided by us. These arrangements are typically subject to various time limitations, defined by the contract or by operation of law, such as statutes of limitation. In some cases, the maximum potential obligation is subject to contractual limitations, while in other cases such limitations are not specified or are not applicable.
We are unable to develop a reasonable estimate of the maximum potential payout under certain of these arrangements. Overall, we believe the likelihood that we will have to make any material payments related to completed sales under these arrangements is remote, and no material liabilities related to these arrangements have been recorded in the Condensed Consolidated Balance Sheets.
Other
•
For additional information on commitments and guarantees associated with VIEs, see Note 8.
•
For additional information on derivatives, see Note 9.
12. Equity
SHARES OUTSTANDING
Preferred Stock
On March 14, 2019, we issued
20,000
shares of Series A
5.85
% Non-Cumulative Perpetual Preferred Stock (Series A Preferred Stock) (equivalent to
20,000,000
Depositary Shares, each representing a 1/1,000th interest in a share of Series A Preferred Stock), $
5.00
par value and $
25,000
liquidation preference per share (equivalent to $
25
per Depositary Share). After underwriting discounts and expenses, we received net proceeds of approximately $
485
million.
The following table presents declaration date, record date, payment date and dividends paid per preferred share and per depository share on the Series A Preferred Stock in the six months ended June 30, 2022 and 2021:
| Dividends Paid | ||||||||||||||
| Declaration Date | Record Date | Payment Date | Per Preferred Share | Per Depositary Share | ||||||||||
| May 3, 2022 | May 31, 2022 | June 15, 2022 | $ |
|
$ |
|
||||||||
| February 16, 2022 | February 28, 2022 | March 15, 2022 |
|
|
||||||||||
| May 6, 2021 | May 31, 2021 | June 15, 2021 | $ |
|
$ |
|
||||||||
| February 16, 2021 | February 26, 2021 | March 15, 2021 |
|
|
||||||||||
Common Stock
The following table presents a rollforward of outstanding shares:
| Six Months Ended June 30, 2022 |
Common
Stock Issued |
Treasury
Stock |
Common Stock Outstanding | ||||||||
| Shares, beginning of year |
|
(
|
|
||||||||
| Shares issued | — |
|
|
||||||||
| Shares repurchased | — |
(
|
(
|
||||||||
| Shares, end of period |
|
(
|
|
||||||||
|
AIG | Second Quarter 2022 Form 10-Q
|
59
|
||||
ITEM 1 |
Notes to Condensed Consolidated Financial Statements (unaudited)
|
12. Equity
Dividends
Dividends are payable on AIG Common Stock only when, as and if declared by our Board of Directors in its discretion, from funds legally available for this purpose. In considering whether to pay a dividend on or purchase shares of AIG Common Stock, our Board of Directors considers a number of factors, including, but not limited to: the capital resources available to support our insurance operations and business strategies, AIG’s funding capacity and capital resources in comparison to internal benchmarks, expectations for capital generation, rating agency expectations for capital, regulatory standards for capital and capital distributions, and such other factors as our Board of Directors may deem relevant. The payment of dividends is also subject to the terms of AIG’s outstanding Series A Preferred Stock, pursuant to which no dividends may be declared or paid on any AIG Common Stock unless the full dividends for the latest completed dividend period on all outstanding shares of Series A Preferred Stock have been declared and paid or provided for.
The following table presents declaration date, record date, payment date and dividends paid per common share on
AIG
Common Stock in the
six
months ended June 30, 2022 and
2021
:
| Declaration Date | Record Date | Payment Date |
Dividends Paid
Per Common Share |
|||||||||||
| May 3, 2022 | June 16, 2022 | June 30, 2022 | $ |
|
||||||||||
| February 16, 2022 | March 17, 2022 | March 31, 2022 |
|
|||||||||||
| May 6, 2021 | June 15, 2021 | June 29, 2021 | $ |
|
||||||||||
| February 16, 2021 | March 16, 2021 | March 30, 2021 |
|
|||||||||||
For a discussion of restrictions on payments of dividends to AIG Parent by its subsidiaries see Note 18 to the Consolidated Financial Statements in the 2021 Annual Report.
Repurchase of AIG Common Stock
Shares may be repurchased from time to time in the open market, private purchases, through forward, derivative, accelerated repurchase or automatic repurchase transactions or otherwise. Certain of our share repurchases have been and may from time to time be effected through Securities Exchange Act of 1934 (Exchange Act) Rule 10b5-1 repurchase plans. On May 3, 2022, the Board of Directors authorized the repurchase of $
6.5
billion of AIG Common Stock (inclusive of the approximately $
1.5
billion of expected remaining authorization upon expiration of the then-current 10b5-1 Plan as of May 20, 2022).
The timing of any future repurchases will depend on market conditions, our business and strategic plans, financial condition, results of operations, liquidity and other factors. The repurchase of AIG Common Stock is also subject to the terms of AIG’s outstanding Series A Preferred Stock, pursuant to which AIG may not (other than in limited circumstances) purchase, redeem or otherwise acquire AIG Common Stock unless the full dividends for the latest completed dividend period on all outstanding shares of Series A Preferred Stock have been declared and paid or provided for.
The following table presents repurchases of AIG Common Stock:
| Six Months Ended June 30, | ||||||||||||||
| (in millions) | 2022 | 2021 | ||||||||||||
|
Aggregate repurchases of common stock
*
|
$ |
|
$ |
|
||||||||||
| Total number of common shares repurchased |
|
|
||||||||||||
*
For the six months ended June 30, 2021, approximately $
92
million of these share repurchases were funded with proceeds received from warrant exercises that occurred prior to the expiration of warrants to purchase shares of AIG Common Stock on January 19, 2021.
Pursuant to an Exchange Act Rule 10b5-1 repurchase plan from July 1, 2022 to August 3, 2022, we repurchased approximately
11
million shares of AIG Common Stock for an aggregate purchase price of approximately $
556
million.
DIVIDENDS DECLARED
On August 8, 2022, our Board of Directors declared a cash dividend on AIG Common Stock of $
0.32
per share, payable on September 30, 2022 to shareholders of record on September 16, 2022. On August 8, 2022, our Board of Directors declared a cash dividend on AIG’s Series A Preferred Stock of $
365.625
per share, payable on September 15, 2022 to holders of record on August 31, 2022.
|
60
|
AIG | Second Quarter 2022 Form 10-Q
|
||||
ITEM 1 |
Notes to Condensed Consolidated Financial Statements (unaudited)
|
12. Equity
ACCUMULATED OTHER COMPREHENSIVE INCOME (LOSS)
The following table presents a rollforward of Accumulated other comprehensive income (loss):
| (in millions) |
Unrealized Appreciation (Depreciation) of Fixed Maturity Securities on Which Allowance for
Credit Losses Was Taken |
Unrealized Appreciation (Depreciation) of All Other Investments | Foreign Currency Translation Adjustments | Retirement Plan Liabilities Adjustment |
Fair Value of Liabilities Under Fair Value Option Attributable to Changes in
Own Credit Risk |
Total | ||||||||||||||||||||||||||||||||
| Balance, March 31, 2022, net of tax | $ |
(
|
$ |
(
|
$ |
(
|
$ |
(
|
$ |
|
$ |
(
|
||||||||||||||||||||||||||
|
Change in unrealized appreciation (depreciation) of investments
|
|
(
|
— | — | — |
(
|
||||||||||||||||||||||||||||||||
|
Change in deferred policy acquisition costs adjustment and other
|
|
|
— | — | — |
|
||||||||||||||||||||||||||||||||
|
Change in future policy benefits
|
— |
|
— | — | — |
|
||||||||||||||||||||||||||||||||
|
Change in foreign currency translation adjustments
|
— | — |
(
|
— | — |
(
|
||||||||||||||||||||||||||||||||
|
Change in net actuarial loss
|
— | — | — |
|
— |
|
||||||||||||||||||||||||||||||||
|
Change in prior service cost
|
— | — | — |
|
— |
|
||||||||||||||||||||||||||||||||
|
Change in deferred tax asset (liability)
|
(
|
|
(
|
|
— |
|
||||||||||||||||||||||||||||||||
|
Change in fair value of liabilities under fair value option attributable to changes in own credit risk
|
— | — | — | — |
(
|
(
|
||||||||||||||||||||||||||||||||
| Total other comprehensive income (loss) |
|
(
|
(
|
|
(
|
(
|
||||||||||||||||||||||||||||||||
| Noncontrolling interests |
|
(
|
(
|
|
|
(
|
||||||||||||||||||||||||||||||||
| Balance, June 30, 2022, net of tax | $ |
(
|
$ |
(
|
$ |
(
|
$ |
(
|
$ |
|
$ |
(
|
||||||||||||||||||||||||||
| Balance, March 31, 2021, net of tax | $ |
(
|
$ |
|
$ |
(
|
$ |
(
|
$ |
|
$ |
|
||||||||||||||||||||||||||
|
Change in unrealized appreciation (depreciation) of investments
|
|
|
— | — | — |
|
||||||||||||||||||||||||||||||||
|
Change in deferred policy acquisition costs adjustment and other
|
(
|
(
|
— | — | — |
(
|
||||||||||||||||||||||||||||||||
|
Change in future policy benefits
|
— |
(
|
— | — | — |
(
|
||||||||||||||||||||||||||||||||
|
Change in foreign currency translation adjustments
|
— | — |
|
— | — |
|
||||||||||||||||||||||||||||||||
|
Change in net actuarial loss
|
— | — | — |
|
— |
|
||||||||||||||||||||||||||||||||
|
Change in prior service cost
|
— | — | — |
|
— |
|
||||||||||||||||||||||||||||||||
|
Change in deferred tax asset (liability)
|
(
|
(
|
(
|
|
— |
(
|
||||||||||||||||||||||||||||||||
|
Change in fair value of liabilities under fair value option attributable to changes in own credit risk
|
— | — | — | — |
|
|
||||||||||||||||||||||||||||||||
| Total other comprehensive income |
|
|
|
|
|
|
||||||||||||||||||||||||||||||||
| Noncontrolling interests |
|
(
|
|
|
|
(
|
||||||||||||||||||||||||||||||||
| Balance, June 30, 2021, net of tax | $ |
(
|
$ |
|
$ |
(
|
$ |
(
|
$ |
|
$ |
|
||||||||||||||||||||||||||
|
AIG | Second Quarter 2022 Form 10-Q
|
61
|
||||
ITEM 1 |
Notes to Condensed Consolidated Financial Statements (unaudited)
|
12. Equity
| (in millions) |
Unrealized Appreciation (Depreciation) of Fixed Maturity Securities on Which Allowance for
Credit Losses Was Taken |
Unrealized Appreciation (Depreciation) of All Other Investments | Foreign Currency Translation Adjustments |
Retirement
Plan Liabilities Adjustment |
Fair Value of Liabilities Under Fair Value Option Attributable to Changes in
Own Credit Risk |
Total | ||||||||||||||||||||||||||||||||
| Balance, December 31, 2021, net of tax | $ |
(
|
$ |
|
$ |
(
|
$ |
(
|
$ |
|
$ |
|
||||||||||||||||||||||||||
| Change in unrealized appreciation (depreciation) of investments |
(
|
(
|
— | — | — |
(
|
||||||||||||||||||||||||||||||||
| Change in deferred policy acquisition costs adjustment and other |
|
|
— | — | — |
|
||||||||||||||||||||||||||||||||
| Change in future policy benefits | — |
|
— | — | — |
|
||||||||||||||||||||||||||||||||
| Change in foreign currency translation adjustments | — | — |
(
|
— | — |
(
|
||||||||||||||||||||||||||||||||
| Change in net actuarial loss | — | — | — |
|
— |
|
||||||||||||||||||||||||||||||||
| Change in prior service cost | — | — | — |
|
— |
|
||||||||||||||||||||||||||||||||
| Change in deferred tax asset (liability) |
|
|
(
|
|
— |
|
||||||||||||||||||||||||||||||||
|
Change in fair value of liabilities under fair value option attributable to changes in own credit risk
|
— | — | — | — |
(
|
(
|
||||||||||||||||||||||||||||||||
| Total other comprehensive income (loss) |
(
|
(
|
(
|
|
(
|
(
|
||||||||||||||||||||||||||||||||
| Noncontrolling interests |
(
|
(
|
|
|
|
(
|
||||||||||||||||||||||||||||||||
| Balance, June 30, 2022, net of tax | $ |
(
|
$ |
(
|
$ |
(
|
$ |
(
|
$ |
|
$ |
(
|
||||||||||||||||||||||||||
| Balance, December 31, 2020, net of tax | $ |
(
|
$ |
|
$ |
(
|
$ |
(
|
$ |
|
$ |
|
||||||||||||||||||||||||||
| Change in unrealized appreciation (depreciation) of investments |
|
(
|
— | — | — |
(
|
||||||||||||||||||||||||||||||||
| Change in deferred policy acquisition costs adjustment and other |
(
|
|
— | — | — |
|
||||||||||||||||||||||||||||||||
| Change in future policy benefits | — |
|
— | — | — |
|
||||||||||||||||||||||||||||||||
| Change in foreign currency translation adjustments | — | — |
|
— | — |
|
||||||||||||||||||||||||||||||||
| Change in net actuarial loss | — | — | — |
|
— |
|
||||||||||||||||||||||||||||||||
| Change in prior service cost | — | — | — |
|
— |
|
||||||||||||||||||||||||||||||||
| Change in deferred tax asset (liability) |
(
|
|
(
|
(
|
— |
|
||||||||||||||||||||||||||||||||
| Change in fair value of liabilities under fair value option attributable to changes in own credit risk | — | — | — | — |
(
|
(
|
||||||||||||||||||||||||||||||||
| Total other comprehensive income (loss) |
|
(
|
|
|
(
|
(
|
||||||||||||||||||||||||||||||||
| Noncontrolling interests |
|
(
|
|
|
|
(
|
||||||||||||||||||||||||||||||||
| Balance, June 30, 2021, net of tax | $ |
(
|
$ |
|
$ |
(
|
$ |
(
|
$ |
|
$ |
|
||||||||||||||||||||||||||
|
62
|
AIG | Second Quarter 2022 Form 10-Q
|
||||
ITEM 1 |
Notes to Condensed Consolidated Financial Statements (unaudited)
|
12. Equity
The following table presents the other comprehensive income (loss) reclassification adjustments for the three- and six-month periods ended June 30, 2022 and
2021
, respectively:
| (in millions) |
Unrealized Appreciation (Depreciation) of Fixed Maturity Securities on Which Allowance for
Credit Losses Was Taken |
Unrealized Appreciation (Depreciation) of All Other Investments | Foreign Currency Translation Adjustments |
Retirement Plan
Liabilities Adjustment |
Fair Value of Liabilities Under Fair Value Option Attributable to Changes in
Own Credit Risk |
Total | ||||||||||||||||||||||||||||||||
| Three Months Ended June 30, 2022 | ||||||||||||||||||||||||||||||||||||||
| Unrealized change arising during period | $ |
|
$ |
(
|
$ |
(
|
$ |
|
$ |
(
|
$ |
(
|
||||||||||||||||||||||||||
| Less: Reclassification adjustments included in net income |
(
|
(
|
|
(
|
|
(
|
||||||||||||||||||||||||||||||||
| Total other comprehensive income (loss), before income tax expense (benefit) |
|
(
|
(
|
|
(
|
(
|
||||||||||||||||||||||||||||||||
| Less: Income tax expense (benefit) |
|
(
|
|
(
|
|
(
|
||||||||||||||||||||||||||||||||
| Total other comprehensive income (loss), net of income tax expense (benefit) | $ |
|
$ |
(
|
$ |
(
|
$ |
|
$ |
(
|
$ |
(
|
||||||||||||||||||||||||||
| Three Months Ended June 30, 2021 | ||||||||||||||||||||||||||||||||||||||
| Unrealized change arising during period | $ |
|
$ |
|
$ |
|
$ |
|
$ |
|
$ |
|
||||||||||||||||||||||||||
| Less: Reclassification adjustments included in net income |
(
|
|
|
(
|
|
|
||||||||||||||||||||||||||||||||
| Total other comprehensive income (loss), before income tax expense (benefit) |
|
|
|
|
|
|
||||||||||||||||||||||||||||||||
| Less: Income tax expense (benefit) |
|
|
|
|
|
|
||||||||||||||||||||||||||||||||
| Total other comprehensive income (loss), net of income tax expense (benefit) | $ |
|
$ |
|
$ |
|
$ |
|
$ |
|
$ |
|
||||||||||||||||||||||||||
| Six Months Ended June 30, 2022 | ||||||||||||||||||||||||||||||||||||||
| Unrealized change arising during period | $ |
(
|
$ |
(
|
$ |
(
|
$ |
|
$ |
(
|
$ |
(
|
||||||||||||||||||||||||||
| Less: Reclassification adjustments included in net income |
(
|
(
|
|
(
|
|
(
|
||||||||||||||||||||||||||||||||
| Total other comprehensive income (loss), before of income tax expense (benefit) |
(
|
(
|
(
|
|
(
|
(
|
||||||||||||||||||||||||||||||||
| Less: Income tax expense (benefit) |
(
|
(
|
|
(
|
|
(
|
||||||||||||||||||||||||||||||||
| Total other comprehensive income (loss), net of income tax expense (benefit) | $ |
(
|
$ |
(
|
$ |
(
|
$ |
|
$ |
(
|
$ |
(
|
||||||||||||||||||||||||||
| Six Months Ended June 30, 2021 | ||||||||||||||||||||||||||||||||||||||
| Unrealized change arising during period | $ |
|
$ |
(
|
$ |
|
$ |
(
|
$ |
(
|
$ |
(
|
||||||||||||||||||||||||||
| Less: Reclassification adjustments included in net income |
(
|
|
|
(
|
|
|
||||||||||||||||||||||||||||||||
| Total other comprehensive income (loss), before income tax expense (benefit) |
|
(
|
|
|
(
|
(
|
||||||||||||||||||||||||||||||||
| Less: Income tax expense (benefit) |
|
(
|
|
|
|
(
|
||||||||||||||||||||||||||||||||
| Total other comprehensive income (loss), net of income tax expense (benefit) | $ |
|
$ |
(
|
$ |
|
$ |
|
$ |
(
|
$ |
(
|
||||||||||||||||||||||||||
|
AIG | Second Quarter 2022 Form 10-Q
|
63
|
||||
ITEM 1 |
Notes to Condensed Consolidated Financial Statements (unaudited)
|
12. Equity
The following table presents the effect of the reclassification of significant items out of AOCI on the respective line items in the Condensed Consolidated Statements of Income (Loss):
| Amount Reclassified from AOCI | Affected Line Item in the | |||||||||||||||||||
| Three Months Ended June 30, | Condensed Consolidated | |||||||||||||||||||
| (in millions) | 2022 | 2021 | Statements of Income (Loss) | |||||||||||||||||
| Unrealized appreciation (depreciation) of fixed maturity securities on which allowance for credit losses was taken | ||||||||||||||||||||
| Investments | $ |
(
|
$ |
(
|
Net realized gains (losses) | |||||||||||||||
| Total |
(
|
(
|
||||||||||||||||||
| Unrealized appreciation (depreciation) of all other investments | ||||||||||||||||||||
| Investments |
(
|
|
Net realized gains (losses) | |||||||||||||||||
| Total |
(
|
|
||||||||||||||||||
| Change in retirement plan liabilities adjustment | ||||||||||||||||||||
| Prior-service credit |
|
(
|
* | |||||||||||||||||
| Actuarial losses |
(
|
(
|
* | |||||||||||||||||
| Total |
(
|
(
|
||||||||||||||||||
| Total reclassifications for the period | $ |
(
|
$ |
|
||||||||||||||||
| Amount Reclassified from AOCI | Affected Line Item in the | |||||||||||||||||||
| Six Months Ended June 30, | Condensed Consolidated | |||||||||||||||||||
| (in millions) | 2022 | 2021 | Statements of Income (Loss) | |||||||||||||||||
| Unrealized appreciation (depreciation) of fixed maturity securities on which allowance for credit losses was taken | ||||||||||||||||||||
| Investments | $ |
(
|
$ |
(
|
Net realized gains (losses) | |||||||||||||||
| Total |
(
|
(
|
||||||||||||||||||
| Unrealized appreciation (depreciation) of all other investments | ||||||||||||||||||||
| Investments |
(
|
|
Net realized gains (losses) | |||||||||||||||||
| Total |
(
|
|
||||||||||||||||||
| Change in retirement plan liabilities adjustment | ||||||||||||||||||||
| Prior-service credit |
(
|
(
|
||||||||||||||||||
| Actuarial losses |
(
|
(
|
||||||||||||||||||
| Total |
(
|
(
|
||||||||||||||||||
| Total reclassifications for the period | $ |
(
|
$ |
|
||||||||||||||||
|
64
|
AIG | Second Quarter 2022 Form 10-Q
|
||||
ITEM 1 |
Notes to Condensed Consolidated Financial Statements (unaudited)
|
13. Earnings Per Common Share (EPS)
13. Earnings Per Common Share (EPS)
The basic EPS computation is based on the weighted average number of common shares outstanding, adjusted to reflect all stock dividends and stock splits. The diluted EPS computation is based on those shares used in the basic EPS computation plus common shares that would have been outstanding assuming issuance of common shares for all dilutive potential common shares outstanding and adjusted to reflect all stock dividends and stock splits, using the treasury stock method or the if-converted method, as applicable.
The following table presents the computation of basic and diluted EPS:
|
Three Months Ended
June 30, |
Six Months Ended
June 30, |
||||||||||||||||||||||||||||
| (dollars in millions, except per common share data) | 2022 | 2021 | 2022 | 2021 | |||||||||||||||||||||||||
| Numerator for EPS: | |||||||||||||||||||||||||||||
| Income from continuing operations | $ |
|
$ |
|
$ |
|
$ |
|
|||||||||||||||||||||
| Less: Net income from continuing operations attributable to noncontrolling interests |
|
|
|
|
|||||||||||||||||||||||||
| Less: Preferred stock dividends |
|
|
|
|
|||||||||||||||||||||||||
| Income attributable to AIG common shareholders from continuing operations |
|
|
|
|
|||||||||||||||||||||||||
| Loss from discontinued operations, net of income tax expense |
(
|
|
(
|
|
|||||||||||||||||||||||||
| Net income attributable to AIG common shareholders | $ |
|
$ |
|
$ |
|
$ |
|
|||||||||||||||||||||
| Denominator for EPS: | |||||||||||||||||||||||||||||
| Weighted average common shares outstanding - basic |
|
|
|
|
|||||||||||||||||||||||||
| Dilutive common shares |
|
|
|
|
|||||||||||||||||||||||||
|
Weighted average common shares outstanding - diluted
(a)
|
|
|
|
|
|||||||||||||||||||||||||
|
Income per common share attributable to AIG common shareholders:
|
|||||||||||||||||||||||||||||
| Basic: | |||||||||||||||||||||||||||||
| Income from continuing operations | $ |
|
$ |
|
$ |
|
$ |
|
|||||||||||||||||||||
| Income from discontinued operations | $ |
|
$ |
|
$ |
|
$ |
|
|||||||||||||||||||||
| Income attributable to AIG common shareholders | $ |
|
$ |
|
$ |
|
$ |
|
|||||||||||||||||||||
| Diluted: | |||||||||||||||||||||||||||||
| Income from continuing operations | $ |
|
$ |
|
$ |
|
$ |
|
|||||||||||||||||||||
| Income from discontinued operations | $ |
|
$ |
|
$ |
|
$ |
|
|||||||||||||||||||||
| Income attributable to AIG common shareholders | $ |
|
$ |
|
$ |
|
$ |
|
|||||||||||||||||||||
(a)
Potential dilutive common shares include our share-based employee compensation plans, a weighted average portion of the
10
-year warrants issued to AIG shareholders as part of AIG’s recapitalization in January 2011, which expired in January 2021 and an option for Blackstone to exchange all or a portion of its ownership interest in Corebridge for AIG common shares. The number of common shares excluded from diluted shares outstanding was
46.6
million and
46.2
million for the three- and six-month periods ended June 30, 2022, respectively, and
5.5
million and
7.4
million for the three- and six-month periods ended June 30, 2021, respectively, because the effect of including those common shares in the calculation would have been anti-dilutive.
For information regarding the Blackstone option to exchange all or a portion of its ownership interest in Corebridge for AIG common shares, see Note 1. For information regarding our repurchases of AIG Common Stock, see Note 12.
|
AIG | Second Quarter 2022 Form 10-Q
|
65
|
||||
ITEM 1 |
Notes to Condensed Consolidated Financial Statements (unaudited)
|
14. Income Taxes
14. Income Taxes
U.S. TAX LAW CHANGES
The IRS has continued to issue new guidance in relation to the Tax Cuts and Jobs Act (the Tax Act) enacted in 2017. Guidance has been issued covering provisions for Global Intangible Low-Taxed Income (GILTI) under which taxes are imposed on the excess of a deemed return on tangible assets of certain foreign subsidiaries, foreign tax credits by which the U.S. mitigates double taxation of foreign operations, and other elements of tax law. Changes to this guidance, and other provisions of tax law, are expected in future periods. Such guidance may result in changes to the interpretations and assumptions we made and actions we may take, which may impact amounts recorded with respect to international provisions of the Tax Act, possibly materially. Consistent with accounting guidance, we have made an accounting policy election to treat GILTI taxes as a period tax charge in the period the tax is incurred.
On March 27, 2020, the U.S. enacted the Coronavirus Aid, Relief, and Economic Security (CARES) Act to mitigate the economic impacts of the COVID-19 pandemic. The tax provisions of the CARES Act have not had and are currently not expected to have a material impact on AIG’s U.S. federal tax liabilities.
On November 15, 2021, the U.S. enacted the Infrastructure Investment and Jobs Act to improve infrastructure in the U.S. The tax provisions of the Infrastructure Investment and Jobs Act have not had and are currently not expected to have a material impact on AIG’s U.S. federal tax liabilities.
RECLASSIFICATION OF CERTAIN TAX EFFECTS FROM AOCI
We use an item-by-item approach to release the stranded or disproportionate income tax effects in AOCI related to our available-for-sale securities. Under this approach, a portion of the disproportionate tax effects is assigned to each individual security lot at the date the amount becomes lodged. When the individual securities are sold, mature, or are otherwise impaired on an other-than-temporary basis, the assigned portion of the disproportionate tax effect is reclassified from AOCI to income (loss) from continuing operations.
INTERIM TAX CALCULATION METHOD
We use the estimated annual effective tax rate method in computing our interim tax provision. Certain items, including those deemed to be unusual, infrequent or that cannot be reliably estimated, are excluded from the estimated annual effective tax rate. In these cases, the actual tax expense or benefit is reported in the same period as the related item. Certain tax effects are also not reflected in the estimated annual effective tax rate, primarily certain changes in uncertain tax positions and realizability of deferred tax assets, and are recorded in the period in which the change occurs. While certain impacts of the Tax Act are included in our annual effective tax rate, we continue to refine our calculations as additional information becomes available, which may result in changes to the estimated annual effective tax rate.
INTERIM TAX EXPENSE (BENEFIT)
For the three-month period ended June 30, 2022, the effective tax rate on income from continuing operations was
21.5
percent. The effective tax rate on income from continuing operations differs from the statutory tax rate of 21 percent primarily due to tax charges associated with the effect of foreign operations, state and local income taxes, and non-deductible transfer pricing charges. These tax charges were partially offset by tax benefits associated with tax exempt income and reclassifications from AOCI to income from continuing operations related to the disposal of available for sale securities. The effect of foreign operations is primarily related to income of our foreign operations taxed at statutory tax rates higher than 21 percent, other foreign taxes, and foreign income subject to U.S. taxation.
For the six-month period ended June 30, 2022, the effective tax rate on income from continuing operations was
20.7
percent. The effective tax rate on income from continuing operations differs from the statutory tax rate of 21 percent primarily due to tax benefits associated with tax exempt income, reclassifications from AOCI to income from continuing operations related to the disposal of available for sale securities, excess tax benefits related to share based compensation payments recorded through the income statement and tax adjustments related to prior year returns. These tax benefits were partially offset by tax charges associated with the effect of foreign operations, state and local income taxes, and non-deductible transfer pricing charges. The effect of foreign operations is primarily related to income of our foreign operations taxed at statutory tax rates higher than 21 percent, other foreign taxes, and foreign income subject to U.S. taxation.
|
66
|
AIG | Second Quarter 2022 Form 10-Q
|
||||
ITEM 1 |
Notes to Condensed Consolidated Financial Statements (unaudited)
|
14. Income Taxes
For the three-month period ended June 30, 2021, the effective tax rate on income from continuing operations was (
2.0
) percent. The effective tax rate on income from continuing operations differs from the statutory tax rate of 21 percent primarily due to tax benefits associated with the release of reserves for uncertain tax positions and interest related to a New York State tax settlement based on the completion of recent audit activity, tax exempt income, remeasurement of deferred taxes as a result of the increase in the UK corporate statutory income tax rate, and reclassifications from AOCI to income from continuing operations related to the disposal of available for sale securities. These tax benefits were partially offset by tax charges associated with the effect of foreign operations, state and local income taxes, and non-deductible transfer pricing charges. We also recognized a tax charge associated with reduction of net operating loss deferred tax assets in certain foreign jurisdictions, with a corresponding decrease in the related deferred tax asset valuation allowance. The effect of foreign operations is primarily related to income of our foreign operations taxed at statutory tax rates higher than 21 percent, other foreign taxes, and foreign income subject to U.S. taxation.
For the six-month period ended June 30, 2021, the effective tax rate on income from continuing operations was
16.3
percent. The effective tax rate on income from continuing operations differs from the statutory tax rate of 21 percent primarily due to tax benefits associated with the release of reserves for uncertain tax positions, penalties and interest related to the recent completion of audit activity by the IRS, release of reserves for uncertain tax positions and interest related to a New York State tax settlement based on the completion of recent audit activity, tax exempt income, remeasurement of deferred taxes as a result of an increase in the UK corporate income tax rate enacted during the second quarter, and reclassifications from AOCI to income from continuing operations related to the disposal of available for sale securities. These tax benefits were partially offset by tax charges associated with the establishment of U.S. federal valuation allowance related to certain tax attribute carryforwards, the effect of foreign operations, excess tax charges related to share based compensation payments recorded through the income statement, state and local income taxes, and non-deductible transfer pricing charges. We also recognized a tax charge associated with reduction of net operating loss deferred tax assets in certain foreign jurisdictions, with a corresponding decrease in the related deferred tax asset valuation allowance. The effect of foreign operations is primarily related to income of our foreign operations taxed at statutory tax rates higher than 21 percent, other foreign taxes, and foreign income subject to U.S. taxation.
For the six-month period ended June 30, 2022, we consider our foreign earnings with respect to certain operations in Canada, South Africa, Japan, Latin America, Bermuda as well as the European, Asia Pacific and Middle East regions to be indefinitely reinvested. These earnings relate to ongoing operations and have been reinvested in active business operations. Deferred taxes, if necessary, have been provided on earnings of non-U.S. affiliates whose earnings are not indefinitely reinvested.
ASSESSMENT OF DEFERRED TAX ASSET VALUATION ALLOWANCE
The evaluation of the recoverability of our deferred tax asset and the need for a valuation allowance requires us to weigh all positive and negative evidence to reach a conclusion that it is more likely than not that all or some portion of the deferred tax asset will not be realized. The weight given to the evidence is commensurate with the extent to which it can be objectively verified. The more negative evidence that exists, the more positive evidence is necessary and the more difficult it is to support a conclusion that a valuation allowance is not needed.
Our framework for assessing the recoverability of the deferred tax asset requires us to consider all available evidence, including:
•
the nature, frequency, and amount of cumulative financial reporting income and losses in recent years;
•
the sustainability of recent operating profitability of our subsidiaries;
•
the predictability of future operating profitability of the character necessary to realize the net deferred tax asset, including forecasts of future income for each of our businesses and actual and planned business and operational changes;
•
the carryforward periods for the net operating loss, capital loss and foreign tax credit carryforwards, including the effect of reversing taxable temporary differences; and
•
prudent and feasible actions and tax planning strategies that would be implemented, if necessary, to protect against the loss of the deferred tax asset.
In performing our assessment of the recoverability of the deferred tax asset under this framework, we consider tax laws governing the utilization of the net operating loss, capital loss and foreign tax credit carryforwards in each applicable jurisdiction. Under U.S. tax law, a company generally must use its net operating loss carryforwards before it can use its foreign tax credit carryforwards, even though the carryforward period for the foreign tax credit is shorter than for the net operating loss. Our U.S. consolidated federal income tax group includes both life companies and non-life companies. While the U.S. taxable income of our non-life companies can be offset by our net operating loss carryforwards, only a portion (no more than 35 percent) of the U.S. taxable income of our life companies can be offset by those net operating loss carryforwards. The remaining tax liability of our life companies can be offset by the foreign tax credit carryforwards. Accordingly, we are able to utilize both the net operating loss and foreign tax credit carryforwards concurrently.
|
AIG | Second Quarter 2022 Form 10-Q
|
67
|
||||
ITEM 1 |
Notes to Condensed Consolidated Financial Statements (unaudited)
|
14. Income Taxes
Recent events, including changes in target interest rates by the Board of Governors of the Federal Reserve System, and significant market volatility, continue to impact actual and projected results of our business operations as well as our views on potential effectiveness of certain prudent and feasible tax planning strategies. In order to demonstrate the predictability and sufficiency of future taxable income necessary to support the realizability of the net operating losses and foreign tax credit carryforwards, we have considered forecasts of future income for each of our businesses, including assumptions about future macro-economic and AIG-specific conditions and events, and any impact these conditions and events may have on our prudent and feasible tax planning strategies. We also subjected the forecasts to a variety of stresses of key assumptions and evaluated the effect on tax attribute utilization.
The carryforward period of our foreign tax credit carryforwards runs through 2023. Carryforward periods for our net operating losses extend from 2028 forward. However, utilization of a portion of our net operating losses is limited under separate return limitation year rules.
To the extent that the valuation allowance is attributed to changes in forecast of current year taxable income, the impact is included in our estimated annualized effective tax rate. A valuation allowance related to changes in forecasts of income in future periods as well as other items not related to the current year is recorded discretely.
As of June 30, 2022, the balance sheet reflects a valuation allowance of $
850
million related to a portion of our tax attribute carryforwards that are no longer more-likely-than-not to be realized. No change in valuation allowance was recorded for the three-month or six-month periods ended June 30, 2022.
Estimates of future taxable income, including income generated from prudent and feasible actions and tax planning strategies, impact of settlements with taxing authorities, and any changes to interpretations and assumptions related to the impact of the Tax Act could change in the near term, perhaps materially, which may require us to consider any potential impact to our assessment of the recoverability of the deferred tax asset. Such potential impact could be material to our consolidated financial condition or results of operations for an individual reporting period.
Further, the planned separation of the Life and Retirement business from AIG, if completed, would result in tax deconsolidation of these entities from the AIG Consolidated Federal Tax Group and potentially impact our ability to utilize certain tax loss and credit carryforwards. Such potential impact could result in valuation allowance being established with respect to such tax attributes in the reporting period in which tax deconsolidation occurs.
For the six-month period ended June 30, 2022, recent changes in market conditions, including rising interest rates, impacted the unrealized tax gains and losses in the available for sale securities portfolios of both our U.S. Life Insurance and non-life insurance companies, resulting in deferred tax assets related to net unrealized tax capital losses. The deferred tax assets relate to the unrealized tax capital losses for which the carryforward period has not yet begun, and as such, when assessing recoverability, we consider our ability and intent to hold the underlying securities to recovery. As of June 30, 2022, based on all available evidence, we concluded that a valuation allowance should be established on a portion of the deferred tax assets related to unrealized tax capital losses that are not more-likely-than-not to be realized. For the six-month period ended June 30, 2022, we established $
1.5
billion of valuation allowance associated with the unrealized tax capital losses in the U.S. Life Insurance Companies’ available for sale securities portfolio and $
630
million of valuation allowance associated with the unrealized tax capital losses in the non-life insurance companies’ available for sale securities portfolio. For the three-month period ended June 30, 2022, we recorded an increase in valuation allowance of $
735
million associated with the unrealized tax capital losses in the U.S. Life Insurance Companies’ available for sale securities portfolio and $
460
million associated with the unrealized tax capital losses in the non-life insurance companies’ available for sale securities portfolio. All of the valuation allowance establishment was allocated to other comprehensive income.
For the six-month period ended June 30, 2022, we recognized a net $
23
million decrease in deferred tax asset valuation allowance associated with certain foreign and state jurisdictions, primarily attributable to current year activity.
TAX EXAMINATIONS AND LITIGATION
We file a consolidated U.S. federal income tax return with our eligible U.S. subsidiaries. Income earned by subsidiaries operating outside the U.S. is taxed, and income tax expense is recorded, based on applicable U.S. and foreign laws.
We are currently under examination by the IRS for the tax years 2011 through 2019.
In September 2020, we received the IRS Revenue Agent Report containing agreed and disagreed issues for the audit of tax years 2007-2010. In October 2020, we filed a protest of the disagreed issues with the IRS Independent Office of Appeals (IRS Appeals). In March 2021, the IRS audit team issued their rebuttal to the protest of disagreed issues to IRS Appeals. We had an IRS Appeals conference in October 2021 and are continuing to engage in the Appeals process.
|
68
|
AIG | Second Quarter 2022 Form 10-Q
|
||||
ITEM 1 |
Notes to Condensed Consolidated Financial Statements (unaudited)
|
14. Income Taxes
In 2009, after paying amounts due on a statutory notice of deficiency related to the disallowance of foreign tax credits associated with cross border financing transactions, we filed a refund lawsuit in the Southern District of New York (Southern District) with respect to tax year 1997. During the fourth quarter of 2020, the parties executed a binding settlement agreement with respect to the underlying issues in the lawsuit. On October 22, 2020, the Southern District dismissed the case based upon the settlement reached between AIG and the government. During June 2021 and October 2021, AIG made additional payments of $
354
million and $
10
million to the U.S. Treasury with respect to this matter. In March 2022, interest amounts due on the settlement of items challenged by the IRS during the audit of AIG's 2006 and prior years were agreed to between AIG and the IRS.
ACCOUNTING FOR UNCERTAINTY IN INCOME TAXES
At both June 30, 2022 and December 31, 2021, our unrecognized tax benefits, excluding interest and penalties, were $
1.2
billion. At June 30, 2022 and December 31, 2021, our unrecognized tax benefits related to tax positions that, if recognized, would not affect the effective tax rate because they relate to such factors as the timing, rather than the permissibility, of the deduction were $
2
million and $
22
million, respectively. Accordingly, at June 30, 2022 and December 31, 2021, the amounts of unrecognized tax benefits that, if recognized, would favorably affect the effective tax rate were $
1.2
billion and $
1.1
billion, respectively.
Interest and penalties related to unrecognized tax benefits are recognized in income tax expense. At June 30, 2022 and December 31, 2021, we had accrued liabilities of $
66
million and $
69
million, respectively for the payment of interest (net of the federal benefit) and penalties. For the six-month period ended June 30, 2022, we accrued benefit of $
3
million for the payment of interest and penalties. The interest activity related to unrecognized tax benefits for the six-month period ended June 30, 2022 was due to the expiration of a certain statute in a foreign jurisdiction. For the six-month period ended June 30, 2021, we accrued benefit of $
203
million for the payment of interest and penalties. The activity for the six-month period ended June 30, 2021 primarily related to the completion of audit activity by the IRS.
We believe it is reasonably possible that our unrecognized tax benefits could decrease within the next 12 months by as much as $
11
million, principally as a result of potential resolutions or settlements of prior years’ tax items. The prior years’ tax items include unrecognized tax benefits related to the deductibility of certain expenses.
|
AIG | Second Quarter 2022 Form 10-Q
|
69
|
||||
ITEM 2 |
Management’s Discussion and Analysis of Financial Condition and Results of Operations
|
|
||
Glossary and Acronyms of Selected Insurance Terms and References
Throughout this Management’s Discussion and Analysis of Financial Condition and Results of Operations (MD&A), we use certain terms and abbreviations, which are summarized in the Glossary and Acronyms.
American International Group, Inc. (AIG) has incorporated into this discussion a number of cross-references to additional information included throughout this Quarterly Report on Form 10-Q and in our Annual Report on Form 10-K for the year ended December 31, 2021 (the 2021 Annual Report) to assist readers seeking additional information related to a particular subject.
In this Quarterly Report on Form 10-Q, unless otherwise mentioned or unless the context indicates otherwise, we use the terms “AIG,” “we,” “us” and “our” to refer to American International Group, Inc., a Delaware corporation, and its consolidated subsidiaries. We use the term “AIG Parent” to refer solely to American International Group, Inc., and not to any of its consolidated subsidiaries.
|
|
||
Cautionary Statement Regarding Forward-Looking Information
This Quarterly Report on Form 10-Q and other publicly available documents may include, and officers and representatives of AIG may from time to time make and discuss, statements which, to the extent they are not statements of historical or present fact, may constitute “forward-looking statements” within the meaning of the U.S. Private Securities Litigation Reform Act of 1995. These forward‑looking statements are intended to provide management’s current expectations or plans for AIG’s future operating and financial performance, based on assumptions currently believed to be valid or accurate. Forward-looking statements are often preceded by, followed by or include words such as “will,” “believe,” “anticipate,” “expect,” “expectations,” “intend,” “plan,” “strategy,” “prospects,” “project,” “anticipate,” “should,” “guidance,” “outlook,” “confident,” “focused on achieving,” “view,” “target,” “goal,” “estimate” and other words of similar meaning in connection with a discussion of future operating or financial performance. These statements may include, among other things, projections, goals and assumptions that relate to future actions, prospective services or products, future performance or results of current and anticipated services or products, sales efforts, expense reduction efforts, the outcome of contingencies such as legal proceedings, anticipated organizational, business or regulatory changes, such as the separation of the Life and Retirement business from AIG, the effect of catastrophes, and macroeconomic and/or geopolitical events, anticipated dispositions, monetization and/or acquisitions of businesses or assets, or successful integration of acquired businesses, management succession and retention plans, exposure to risk, trends in operations and financial results, and other statements that are not historical facts.
|
70
|
AIG | Second Quarter 2022 Form 10-Q
|
||||
All forward-looking statements involve risks, uncertainties and other factors that may cause AIG’s actual results and financial condition to differ, possibly materially, from the results and financial condition expressed or implied in the forward-looking statements. Factors that could cause AIG’s actual results to differ, possibly materially, from those in the specific projections, goals, assumptions and statements include, without limitation:
•
AIG’s ability to continue to separate the Life and Retirement business, including through an initial public offering, and the impact separation may have on AIG, its businesses, employees, contracts and customers;
•
the effects of economic conditions in the markets in which AIG and its businesses operate in the U.S. and globally and any changes therein, including financial market conditions, fluctuations in interest rates and foreign currency exchange rates and inflationary pressures, each of which may also be affected by geopolitical conflicts, including the conflict between Russia and Ukraine;
•
the occurrence of catastrophic events, both natural and man-made, including geopolitical conflicts, pandemics, civil unrest and the effects of climate change;
•
disruptions in the availability of AIG's electronic data systems or those of third parties, including as a result of potential information technology, cybersecurity or data security breaches due to supply chain disruptions, cyber-attacks or security vulnerabilities, the likelihood of which may increase as a result of remote business operations;
•
the effectiveness of AIG’s enterprise risk management policies and procedures, including with respect to business continuity and disaster recovery plans;
•
changes in judgments concerning potential cost-saving opportunities;
•
availability of reinsurance or access to reinsurance on acceptable terms;
•
concentrations in AIG’s investment portfolios, including as a result of our asset management relationships with Blackstone Inc. (Blackstone) and BlackRock, Inc. (BlackRock);
•
changes in the valuation of AIG’s investments;
•
the effectiveness of strategies to recruit and retain key personnel and to implement effective succession plans;
•
actions by rating agencies with respect to AIG’s credit and financial strength ratings as well as those of its businesses and subsidiaries;
•
changes to sources of or access to liquidity;
•
changes in judgments concerning the recognition of deferred tax assets and the impairment of goodwill;
•
changes in judgments or assumptions concerning insurance underwriting and insurance liabilities;
•
AIG’s ability to successfully dispose of, monetize and/or acquire businesses or assets or successfully integrate acquired businesses;
•
nonperformance or defaults by counterparties, including Fortitude Reinsurance Company Ltd. (Fortitude Re);
•
the requirements, which may change from time to time, of the global regulatory framework to which AIG is subject;
•
significant legal, regulatory or governmental proceedings;
•
the effects of sanctions related to the conflict between Russia and Ukraine and failure to comply therewith;
•
AIG’s ability to effectively execute on the AIG 200 operational programs designed to modernize AIG’s operating infrastructure and enhance user and customer experiences, and AIG’s ability to achieve anticipated cost savings from AIG 200;
•
the impact of COVID-19 and its variants and responses thereto;
•
AIG’s ability to effectively execute on environmental, social and governance targets and standards; and
•
such other factors discussed in:
–
Part I, Item 2. MD&A of this Quarterly Report on Form 10-Q; and
–
Part I, Item 1A. Risk Factors and Part II, Item 7. MD&A of the 2021 Annual Report.
The forward-looking statements speak only as of the date of this report, or in the case of any document incorporated by reference, the date of that document. We are not under any obligation to publicly update or revise any forward-looking statements, whether as a result of new information, future events or otherwise, except as required by applicable law. Additional information as to factors that may cause actual results to differ materially from those expressed or implied in the forward-looking statements is disclosed from time to time in our other filings with the Securities and Exchange Commission (SEC).
|
AIG | Second Quarter 2022 Form 10-Q
|
71
|
||||
|
72
|
AIG | Second Quarter 2022 Form 10-Q
|
||||
Use of Non-GAAP Measures
Throughout this MD&A, we present our financial condition and results of operations in the way we believe will be most meaningful and representative of our business results. Some of the measurements we use are “non-GAAP financial measures” under SEC rules and regulations. GAAP is the acronym for “generally accepted accounting principles” in the United States. The non-GAAP financial measures we present may not be comparable to similarly-named measures reported by other companies.
We use the following operating performance measures because we believe they enhance the understanding of the underlying profitability of continuing operations and trends of our business segments. We believe they also allow for more meaningful comparisons with our insurance competitors. When we use these measures, reconciliations to the most comparable GAAP measure are provided on a consolidated basis in the Consolidated Results of Operations section of this MD&A.
Book value per common share, excluding accumulated other comprehensive income (loss) (AOCI) adjusted for the cumulative unrealized gains and losses related to Fortitude Re funds withheld assets and deferred tax assets (DTA) (Adjusted book value per common share)
is used to show the amount of our net worth on a per-common share basis after eliminating items that can fluctuate significantly from period to period including changes in fair value of AIG’s available for sale securities portfolio, foreign currency translation adjustments and U.S. tax attribute deferred tax assets. This measure also eliminates the asymmetrical impact resulting from changes in fair value of our available for sale securities portfolio wherein there is largely no offsetting impact for certain related insurance liabilities. In addition, we adjust for the cumulative unrealized gains and losses related to Fortitude Re funds withheld assets held by AIG in support of Fortitude Re’s reinsurance obligations to AIG post deconsolidation of Fortitude Re (Fortitude Re funds withheld assets) since these fair value movements are economically transferred to Fortitude Re. We exclude deferred tax assets representing U.S. tax attributes related to net operating loss carryforwards and foreign tax credits as they have not yet been utilized. Amounts for interim periods are estimates based on projections of full-year attribute utilization. As net operating loss carryforwards and foreign tax credits are utilized, the portion of the DTA utilized is included in these book value per common share metrics. Adjusted book value per common share is derived by dividing total AIG common shareholders’ equity, excluding AOCI adjusted for the cumulative unrealized gains and losses related to Fortitude Re funds withheld assets, and DTA (Adjusted common shareholders’ equity), by total common shares outstanding.
Return on common equity – Adjusted after-tax income excluding AOCI adjusted for the cumulative unrealized gains and losses related to Fortitude Re funds withheld assets and DTA (Adjusted return on common equity)
is used to show the rate of return on common shareholders’ equity. We believe this measure is useful to investors because it eliminates items that can fluctuate significantly from period to period, including changes in fair value of our available for sale securities portfolio, foreign currency translation adjustments and U.S. tax attribute deferred tax assets. This measure also eliminates the asymmetrical impact resulting from changes in fair value of our available for sale securities portfolio wherein there is largely no offsetting impact for certain related insurance liabilities. In addition, we adjust for the cumulative unrealized gains and losses related to Fortitude Re funds withheld assets since these fair value movements are economically transferred to Fortitude Re. We exclude deferred tax assets representing U.S. tax attributes related to net operating loss carryforwards and foreign tax credits as they have not yet been utilized. Amounts for interim periods are estimates based on projections of full-year attribute utilization. As net operating loss carryforwards and foreign tax credits are utilized, the portion of the DTA utilized is included in Adjusted return on common equity. Adjusted return on common equity is derived by dividing actual or annualized adjusted after-tax income attributable to AIG common shareholders by average Adjusted common shareholders’ equity.
Adjusted after-tax income attributable to AIG common shareholders
is derived by excluding the tax effected adjusted pre-tax income (APTI) adjustments described below, dividends on preferred stock, noncontrolling interest on net realized gains (losses), other non-operating expenses and the following tax items from net income attributable to AIG:
•
deferred income tax valuation allowance releases and charges;
•
changes in uncertain tax positions and other tax items related to legacy matters having no relevance to our current businesses or operating performance; and
•
net tax charge related to the enactment of the Tax Cuts and Jobs Act (the Tax Act).
Adjusted revenues
exclude Net realized gains (losses), income from non-operating litigation settlements (included in Other income for GAAP purposes) and changes in fair value of securities used to hedge guaranteed living benefits (included in Net investment income for GAAP purposes). Adjusted revenues is a GAAP measure for our segments.
|
AIG | Second Quarter 2022 Form 10-Q
|
73
|
||||
Adjusted pre-tax income
is derived by excluding the items set forth below from income from continuing operations before income tax. This definition is consistent across our segments. These items generally fall into one or more of the following broad categories: legacy matters having no relevance to our current businesses or operating performance; adjustments to enhance transparency to the underlying economics of transactions; and measures that we believe to be common to the industry. APTI is a GAAP measure for our segments. Excluded items include the following:
•
changes in fair value of securities used to hedge guaranteed living benefits;
•
changes in benefit reserves and deferred policy acquisition costs (DAC), value of business acquired (VOBA), and deferred sales inducements (DSI) related to net realized gains and losses;
•
changes in the fair value of equity securities;
•
net investment income on Fortitude Re funds withheld assets;
•
following deconsolidation of Fortitude Re, net realized gains and losses on Fortitude Re funds withheld assets;
•
loss (gain) on extinguishment of debt;
•
all net realized gains and losses except earned income (periodic settlements and changes in settlement accruals) on derivative instruments used for non- qualifying (economic) hedging or for asset replication. Earned income on such economic hedges is reclassified from net realized gains and losses to specific APTI line items based on the economic risk being hedged (e.g. net investment income and interest credited to policyholder account balances);
•
income or loss from discontinued operations;
•
net loss reserve discount benefit (charge);
•
pension expense related to lump sum payments to former employees;
•
net gain or loss on divestitures;
•
non-operating litigation reserves and settlements;
•
restructuring and other costs related to initiatives designed to reduce operating expenses, improve efficiency and simplify our organization;
•
the portion of favorable or unfavorable prior year reserve development for which we have ceded the risk under retroactive reinsurance agreements and related changes in amortization of the deferred gain;
•
integration and transaction costs associated with acquiring or divesting businesses;
•
losses from the impairment of goodwill; and
•
non-recurring costs associated with the implementation of non-ordinary course legal or regulatory changes or changes to accounting principles.
•
General Insurance
–
Ratios:
We, along with most property and casualty insurance companies, use the loss ratio, the expense ratio and the combined ratio as measures of underwriting performance. These ratios are relative measurements that describe, for every $100 of net premiums earned, the amount of losses and loss adjustment expenses (which for General Insurance excludes net loss reserve discount), and the amount of other underwriting expenses that would be incurred. A combined ratio of less than 100 indicates underwriting income and a combined ratio of over 100 indicates an underwriting loss. Our ratios are calculated using the relevant segment information calculated under GAAP, and thus may not be comparable to similar ratios calculated for regulatory reporting purposes. The underwriting environment varies across countries and products, as does the degree of litigation activity, all of which affect such ratios. In addition, investment returns, local taxes, cost of capital, regulation, product type and competition can have an effect on pricing and consequently on profitability as reflected in underwriting income and associated ratios.
–
Accident year loss and accident year combined ratios, as adjusted (Accident year loss ratio, ex-CAT and Accident year combined ratio, ex-CAT):
both the accident year loss and accident year combined ratios, as adjusted, exclude catastrophe losses and related reinstatement premiums, prior year development, net of premium adjustments, and the impact of reserve discounting. Natural catastrophe losses are generally weather or seismic events, in each case, having a net impact on AIG in excess of $10 million and man-made catastrophe losses, such as terrorism and civil disorders that exceed the $10 million threshold. We believe that as adjusted ratios are meaningful measures of our underwriting results on an ongoing basis as they exclude catastrophes and the impact of reserve discounting which are outside of management’s control. We also exclude prior year development to provide transparency related to current accident year results.
•
Life and Retirement
–
Premiums and deposits:
includes direct and assumed amounts received and earned on traditional life insurance policies, group benefit policies and life-contingent payout annuities, as well as deposits received on universal life, investment-type annuity contracts, Federal Home Loan Bank (FHLB) funding agreements and mutual funds. We believe the measure of premiums and deposits is useful in understanding customer demand for our products, evolving product trends and our sales performance period over period.
Results from discontinued operations are excluded from all of these measures.
|
74
|
AIG | Second Quarter 2022 Form 10-Q
|
||||
Critical Accounting Estimates
The preparation of financial statements in accordance with GAAP requires the application of accounting policies that often involve a significant degree of judgment.
|
The accounting policies that we believe are most dependent on the application of estimates and assumptions, which are critical accounting estimates, are related to the determination of:
|
||
|
•
loss reserves;
•
future policy benefit reserves for life and accident and health insurance contracts;
•
liabilities for guaranteed benefit features of variable annuity, fixed annuity and fixed index annuity products;
•
embedded derivative liabilities for fixed index annuity and life products;
•
estimated gross profits to value deferred acquisition costs and unearned revenue for investment-oriented products;
•
reinsurance assets, including the allowance for credit losses and disputes;
•
goodwill impairment;
•
allowance for credit losses on certain investments, primarily on loans and available for sale fixed maturity securities;
•
legal contingencies;
•
fair value measurements of certain financial assets and financial liabilities; and
•
income taxes, in particular the recoverability of our deferred tax asset and establishment of provisions for uncertain tax positions.
|
||
These accounting estimates require the use of assumptions about matters, some of which are highly uncertain at the time of estimation. To the extent actual experience differs from the assumptions used, our consolidated financial condition, results of operations and cash flows could be materially affected.
For a complete discussion of our critical accounting estimates, see Part II, Item 7. MD&A – Critical Accounting Estimates in the 2021 Annual Report.
|
AIG | Second Quarter 2022 Form 10-Q
|
75
|
||||
Executive Summary
OVERVIEW
This overview of the MD&A highlights selected information and may not contain all of the information that is important to current or potential investors in our securities. You should read this Quarterly Report on Form 10-Q, together with the 2021 Annual Report, in their entirety for a more detailed description of events, trends, uncertainties, risks and critical accounting estimates affecting us.
Separation of Life and Retirement Business and Relationship with Blackstone
On October 26, 2020, AIG announced its intention to separate its Life and Retirement business from AIG. On November 2, 2021, AIG and Blackstone completed the acquisition by Blackstone of a 9.9 percent equity stake in Corebridge Financial, Inc., formerly known as SAFG Retirement Services, Inc. (Corebridge), which is the holding company for AIG’s Life and Retirement business. Pursuant to the definitive agreement, Blackstone will be required to hold its ownership interest in Corebridge following the completion of the separation of the Life and Retirement business, subject to exceptions permitting Blackstone to sell 25%, 67% and 75% of its shares after the first, second and third anniversaries, respectively, of the initial public offering of Corebridge (the IPO), with the transfer restrictions terminating in full on the fifth anniversary of the IPO. In the event that the IPO of Corebridge is not completed prior to November 2, 2023, Blackstone will have the right to require AIG to undertake the IPO, and in the event that the IPO has not been completed prior to November 2, 2024, Blackstone will have the right to exchange all or a portion of its ownership interest in Corebridge for shares of AIG’s common stock on the terms set forth in the definitive agreement. On November 1, 2021, Corebridge declared a dividend payable to AIG Parent in the amount of $8.3 billion. In connection with such dividend, Corebridge issued a promissory note to AIG Parent in the amount of $8.3 billion, which is required to be paid to AIG Parent prior to the IPO of Corebridge. On April 5, 2022, Corebridge issued senior unsecured notes in the aggregate principal amount of $6.5 billion, the proceeds of which were used to repay a portion of the $8.3 billion promissory note previously issued by Corebridge to AIG. While we currently believe the IPO is the next step in the separation of the Life and Retirement business from AIG, no assurance can be given regarding the form that future separation transactions may take or the specific terms or timing thereof, or that a separation will in fact occur. Any separation transaction will be subject to the satisfaction of various conditions and approvals, including approval by the AIG Board of Directors, receipt of insurance and other required regulatory approvals, and satisfaction of any applicable requirements of the SEC.
On December 15, 2021, AIG and Blackstone Real Estate Income Trust (BREIT), a long-term, perpetual capital vehicle affiliated with Blackstone, completed the acquisition by BREIT of AIG’s interests in a U.S. affordable housing portfolio. The historical results of the U.S. affordable housing portfolio were reported in our Life and Retirement operating segments.
Our Investment Management Agreements with BlackRock
On March 28, 2022, we announced entry into a binding letter of intent with BlackRock pursuant to which certain of our insurance company subsidiaries would enter into separate investment management agreements with BlackRock (the BlackRock Arrangement). Since April 28, 2022, certain of our insurance company subsidiaries have entered into such investment management agreements, with the expectation that certain additional insurance company subsidiaries will enter into such investment management agreements over the coming months. Overall, we expect to transfer the management of up to $150 billion of our investment of liquid fixed income and certain private placement assets, including $90 billion of the Life and Retirement investment portfolio, over a period of 12 months in connection with the BlackRock Arrangement. The investment management agreements contain detailed investment guidelines and reporting requirements. These agreements also contain reasonable and customary representations and warranties, standard of care, expense reimbursement, liability, indemnity and other provisions. The investment management agreements continue unless terminated by either party on 45 days’ notice or by us immediately for cause. We continue to be responsible for our overall investment portfolio, including decisions surrounding asset allocation, risk composition and investment strategy. There can be no assurance that all of such investment management agreements will be entered into as contemplated, or at all.
|
76
|
AIG | Second Quarter 2022 Form 10-Q
|
||||
OPERATING STRUCTURE
AIG reports the results of its businesses through three segments – General Insurance, Life and Retirement and Other Operations. General Insurance consists of two operating segments – North America and International. Life and Retirement consists of four operating segments – Individual Retirement, Group Retirement, Life Insurance and Institutional Markets. Other Operations is primarily comprised of corporate, our institutional asset management business and consolidation and eliminations.
Consistent with how we manage our business, our General Insurance North America operating segment primarily includes insurance businesses in the United States, Canada and Bermuda, and our global reinsurance business, AIG Re. Our General Insurance International operating segment includes regional insurance businesses in Japan, the United Kingdom, Europe, Middle East and Africa (EMEA region), Asia Pacific, Latin America and Caribbean, and China. International also includes the results of Talbot Holdings, Ltd. as well as AIG’s Global Specialty business.
For additional information on our business segments, see Note 3 to the Condensed Consolidated Financial Statements, and for information regarding the separation of Life and Retirement, see Note 1 to the Condensed Consolidated Financial Statements.
Business Segments
| General Insurance | Life and Retirement | ||||||||||||||||
|
General Insurance
is a leading provider of insurance products and services for commercial and personal insurance customers. It includes one of the world’s most far-reaching property casualty networks. General Insurance offers a broad range of products to customers through a diversified, multichannel distribution network. Customers value General Insurance’s strong capital position, extensive risk management and claims experience and its ability to be a market leader in critical lines of the insurance business.
|
Life and Retirement
is a unique franchise that brings together a broad portfolio of life insurance, retirement and institutional products offered through an extensive, multichannel distribution network. It holds long-standing, leading market positions in many of the markets it serves in the U.S. With its strong capital position, customer-focused service, breadth of product expertise and deep distribution relationships across multiple channels, Life and Retirement is well positioned to serve growing market needs.
|
||||||||||||||||


|


|
||||||||||||||||
|
General Insurance includes the following major operating companies: National Union Fire Insurance Company of Pittsburgh, Pa. (National Union); American Home Assurance Company (American Home); Lexington Insurance Company (Lexington); AIG General Insurance Company, Ltd. (AIG Sonpo); AIG Asia Pacific Insurance, Pte, Ltd.; AIG Europe S.A.; American International Group UK Ltd.; Validus Reinsurance, Ltd. (Validus Re); Talbot Holdings Ltd. (Talbot); Western World Insurance Group, Inc. and Glatfelter Insurance Group (Glatfelter).
|
Life and Retirement includes the following major operating companies: American General Life Insurance Company (AGL); The Variable Annuity Life Insurance Company (VALIC); The United States Life Insurance Company in the City of New York (U.S. Life); Laya Healthcare Limited and AIG Life Limited.
|
||||||||||||||||
|
Other Operations
|
|||||||||||||||||
|
Other Operations
primarily consists of income from assets held by
AIG
Parent and other corporate subsidiaries, deferred tax assets related to tax attributes, corporate expenses and intercompany eliminations, our institutional asset management business and results of our consolidated investment entities, General Insurance portfolios in run-off as well as the historical results of our legacy insurance lines ceded to Fortitude Re.
|
|||||||||||||||||
|
AIG | Second Quarter 2022 Form 10-Q
|
77
|
||||
FINANCIAL PERFORMANCE SUMMARY
Net Income (Loss) Attributable to AIG
Common Shareholders
Three Months Ended June 30,
(in millions)
|
Quarterly 2022 and 2021 Comparison
|
|||||
|
Net income attributable to AIG common shareholders increased $2.9 billion due to the following, on a pre-tax basis:
|
|||||
|
•
an increase in Net realized gains on Fortitude Re funds withheld embedded derivative of $4.8 billion driven by interest rate movements, partially offset by losses on Fortitude Re funds withheld assets of $86 million in 2022 compared to a gain of $173 million in 2021;
|
|||||
|
•
an increase in Net realized gains excluding Fortitude Re funds withheld assets and embedded derivative of $745 million, driven by a $1.8 billion increase in derivative and hedge activity and gains on variable annuity embedded derivatives, net of hedging partially offset by losses on sales of securities of $522 million and unfavorable effects of foreign exchange of $370 million;
|
|||||
|
•
higher underwriting income in General Insurance of $336 million from higher premiums marked by higher renewal retentions, positive rate change and strong new business production, focused risk selection and improved terms and conditions; and
|
|||||
|
•
lower interest expense of $72 million primarily driven by interest savings of $74 million from $7.6 billion debt repurchases, through cash tender offers, and debt redemptions in the six months ended June 30, 2022, as well as $646 million debt repurchases, through cash tender offers in the three months ended December 31, 2021 compared to interest savings of $19 million resulting from redemptions of $1.5 billion of debt in the three months ended June 30, 2021, and interest savings of $29 million from consolidated investment entities partially offset by interest expense of $61 million on $6.5 billion Corebridge senior unsecured notes issued in the six months ended June 30, 2022.
|
|||||
|
The increase in Net income attributable to AIG common shareholders was partially offset by the following:
|
|||||
|
•
lower net investment income of $1.1 billion primarily driven by declines in alternative investments of $506 million and fair value of fixed maturity securities of $454 million, where we elected the fair value option as a result of negative equity market performance.
|
|||||
|
•
higher income attributable to noncontrolling interest of $305 million driven by the sale of 9.9 percent interest of Corebridge to Blackstone in December 2021 of $306 million.
|
|||||
|
The $931 million increase in income tax expense was primarily attributable to higher income from continuing operations.
|
|||||
|
For further discussion see Consolidated Results of Operations.
|
|||||
|
78
|
AIG | Second Quarter 2022 Form 10-Q
|
||||
|
Net Income (Loss) Attributable to AIG Common Shareholders
Six Months Ended June 30,
(in millions)
|
||
|
Year-to-Date 2022 and 2021 Comparison
|
|||||
|
Net income attributable to AIG common shareholders increased $3.3 billion due to the following, on a pre-tax basis:
|
|||||
|
•
an increase in Net realized gains on Fortitude Re funds withheld embedded derivative of $5.8 billion driven by interest rate movements, partially offset by losses on Fortitude Re funds withheld assets of $226 million in 2022 compared to a gain of $346 million in 2021;
|
|||||
|
•
an increase in Net realized gains excluding Fortitude Re funds withheld assets and embedded derivative of $1.3 billion, driven by a $2.8 billion increase in derivative and hedge activity and gains on variable annuity embedded derivatives, net of hedging, partially offset by losses on sales of securities of $723 million, unfavorable effects of foreign exchange ($335 million) and unfavorable movement in the allowance for credit losses on fixed maturity securities and loans of $264 million;
|
|||||
|
•
higher underwriting income in General Insurance of $709 million from higher premiums marked by changes in business mix along with continued positive rate change, focused risk selection and improved terms and conditions, lower catastrophe losses and higher net favorable prior year reserve development; and
|
|||||
|
•
lower interest expense of $151 million primarily driven by interest savings of $89 million from $7.6 billion debt repurchases, through cash tender offers, and debt redemptions in the six months ended June 30, 2022 as well as $646 million debt repurchases, through cash tender offers in the three months ended December 31, 2021 compared to interest savings of $42 million resulting from redemptions of $3.0 billion of debt in the six months ended June 30, 2021, and interest savings from consolidated investment entities of $69 million, partially offset by interest expense of $61 million on $6.5 billion Corebridge senior unsecured notes issued in the six months ended June 30, 2022.
|
|||||
|
The increase in Net income attributable to AIG common shareholders was partially offset by the following:
|
|||||
|
•
lower net investment income of $1.5 billion primarily driven by declines in fair value of fixed maturity securities, where we elected the fair value option of $671 million, lower returns on our alternative investments of $407 million and lower returns on available for sale fixed maturity securities of $290 million as a result of the higher rate environment and negative equity market performance.
|
|||||
|
•
higher income attributable to noncontrolling interest of $647 million driven by the sale of 9.9 percent interest of Corebridge to Blackstone in December 2021 of $660 million.
|
|||||
|
The $1.3 billion increase in income tax expense was primarily attributable to higher income from continuing operations.
|
|||||
|
For further discussion see Consolidated Results of Operations.
|
|||||
|
AIG | Second Quarter 2022 Form 10-Q
|
79
|
||||
|
Adjusted Pre-Tax Income (Loss)*
Three Months Ended June 30,
(in millions)
|
||
|
Quarterly 2022 and 2021 Comparison
|
|||||
|
Adjusted pre-tax income decreased $349 million driven by lower net investment income at General Insurance ($273 million) and Life and Retirement ($387 million), primarily as a result of lower yield enhancement income and alternative investment income. In addition, Life and Retirement results were impacted by higher DAC amortization and policyholder benefits, net of premiums, as a result of lower variable annuity separate account returns partially offset by lower mortality of $90 million, and lower policy and advisory fee income, net of advisory fee expense, of $58 million due to negative equity market performance.
|
|||||
|
This decrease was partially offset by higher underwriting income in General Insurance of $336 million with 5.1 points of combined ratio improvement driven by higher premiums marked by higher renewal retentions, positive rate change and strong business production, focused risk selection and improved terms and conditions, as well as more favorable prior year development.
|
|||||
|
Adjusted Pre-Tax Income*
Six Months Ended June 30,
(in millions)
|
||
|
Year-to-Date 2022 and 2021 Comparison
|
|||||
|
Adjusted pre-tax income decreased $91 million driven by lower net investment income at General Insurance ($280 million) and Life and Retirement ($611 million), primarily as a result of lower yield enhancement income and alternative investment income. In addition, Life and Retirement results were impacted by higher DAC amortization and policyholder benefits, net of premiums as a result of lower variable annuity separate account returns partially offset by lower mortality of $91 million and lower policy and advisory fee income, net of advisory fee expense due to negative equity market performance of $77 million.
|
|||||
|
This decrease was partially offset by higher underwriting income in General Insurance ($709 million) from higher premiums marked by changes in business mix along with continued positive rate change, focused risk selection and improved terms and conditions and lower catastrophe losses and net favorable prior year reserve development in 2022 compared to net adverse prior year reserve development in 2021.
|
|||||
*
Non-GAAP measure – for reconciliation of Non-GAAP to GAAP measures see Consolidated Results of Operations.
|
80
|
AIG | Second Quarter 2022 Form 10-Q
|
||||
|
General Operating and Other Expenses
Three Months Ended June 30,
(in millions)
|
||
|
Quarterly 2022 and 2021 Comparison
|
|||||
|
General operating and other expenses increased $5 million primarily due to increases in professional fees inclusive of transaction costs and other acquisition expenses.
|
|||||
|
General operating and other expenses in the three-months ended June 30, 2022 and 2021 included approximately $175 million and $126 million, respectively, of pre-tax restructuring and other costs which were primarily comprised of employee severance charges and other costs related to organizational simplification, operational efficiency, and business rationalization.
|
|||||
|
General Operating and Other Expenses
Six Months Ended June 30,
(in millions)
|
||
|
Year-to-Date 2022 and 2021 Comparison
|
|||||
|
General operating and other expenses increased $98 million primarily due to increases in professional fees inclusive of transaction costs and other acquisition expenses.
|
|||||
|
General operating and other expenses in the six-month periods ended June 30, 2022 and 2021 included approximately $268 million and $200 million, respectively, of pre-tax restructuring and other costs which were primarily comprised of employee severance charges and other costs related to organizational simplification, operational efficiency, and business rationalization.
|
|||||
AIG’S OUTLOOK – INDUSTRY AND ECONOMIC FACTORS
Our business is affected by industry and economic factors such as interest rates, currency exchange rates, credit and equity market conditions, catastrophic claims events, regulation, tax policy, competition, and general economic, market and political conditions. We continued to operate under challenging market conditions in the first six months of 2022, characterized by factors such as the impact of COVID-19 and the related governmental and societal responses, rising interest rates, inflationary pressures, an uneven global economic recovery and global trade tensions. Responses by central banks and monetary authorities with respect to inflation, growth concerns and other macroeconomic factors have also affected global exchange rates and volatility.
Russia/Ukraine Conflict
The Russia/Ukraine conflict began in February 2022. The conflict has and may continue to have a significant impact on the global macroeconomic and geopolitical environments, including increased volatility in capital and commodity markets, rapid changes to regulatory conditions around the globe including the use of sanctions, operational challenges for multinational corporations, inflationary pressures and an increased risk of cybersecurity incidents.
The conflict is evolving and has the potential to adversely affect our business and results of operations from an investment, underwriting and operational perspective. While we believe we have taken appropriate actions to minimize related risk, we continue to monitor potential exposure and operational impacts, as well as any actual and potential claims activity. The ultimate impact will depend on future developments that are uncertain and cannot be predicted, including scope, severity and duration, the governmental, legislative and regulatory actions taken (including the application of sanctions), and court decisions, if any, rendered in response to those actions.
|
AIG | Second Quarter 2022 Form 10-Q
|
81
|
||||
Impact of Changes in the Interest Rate Environment and Equity Markets
Key U.S. benchmark rates have continued to rise during the first six months of 2022 as markets react to over elevated inflation measures, geopolitical risk, and the Board of Governors of the Federal Reserve System raising short term interest rates for the first time since 2018. As of June 30, 2022, increases in key rates have improved yields on new investments which are now closer to the yield on maturities and redemptions (runoff yield) that we are experiencing on our existing portfolios and in some instances are higher than the runoff yield. Furthermore, the impact of interest rate increases is further reflected in our results as these rate increases have also reduced the value of fixed income assets that are held in the variable annuity separate accounts and brokerage and advisory assets, and, accordingly, have adversely impacted the fees that are charged on these accounts. We actively manage our exposure to the interest rate environment through portfolio selection and asset-liability management, including spread management strategies for our investment-oriented products and economic hedging of interest rate risk from guarantee features in our variable and fixed index annuities, but we may not be able to fully mitigate our interest rate risk by matching exposure of our assets relative to our liabilities.
Equity Markets
Our financial results are impacted by the performance of equity markets which also impacts the performance of our alternative investment portfolio and fee income, net amount at risk, policyholder benefits and DAC on our variable annuity portfolio. For instance, we earn fee income on the account value in our variable annuities, which fluctuates with the equity markets as a significant amount of our separate account assets are invested in equity funds. The impact of equity market returns, both increases and decreases, is reflected in our results due to the impact on the variable annuity account value and the fair values of equity-exposed securities in our Life and Retirement investment portfolio.
In Life and Retirement, hedging costs could also be significantly impacted by changes in the level of equity markets as rebalancing and option costs are tied to the equity market volatility, and we may be required to post additional collateral when equity markets are higher. These hedging costs are mostly offset by our rider fees that are tied to the level of the Chicago Board Options Exchange Volatility Index. As rebalancing and option costs increase or decrease, the rider fees will increase or decrease partially offsetting the hedging costs incurred.
Annuity Sales and Surrenders
The rising interest rate environment has provided a strong tailwind for fixed annuity sales with sales in the three to five‑year products significantly increasing in 2022. Continued rising interest rates could create the potential for increased sales, but may also drive higher surrenders. Fixed annuities have surrender charge periods, generally in the three-to-seven year range. Fixed Index annuities have surrender charge periods, generally in the five-to-ten year range, and within our Group Retirement segment, certain of our fixed investment options are subject to other withdrawal restrictions, which may help mitigate increased early surrenders in a rising rate environment. In addition, older contracts that have higher minimum interest rates and continue to be attractive to contract holders have driven better than expected persistency in fixed annuities. The reserves for such contracts have continued to decrease over time in amount and as a percentage of the total annuity portfolio. We closely monitor surrenders of fixed annuities as contracts with lower minimum interest rates come out of the surrender charge period. Changes in interest rates significantly impact the valuation of our liabilities for annuities with guaranteed living benefit features and the value of the related hedging portfolio.
Reinvestment and Spread Management
We actively monitor fixed income markets, including the level of interest rates, credit spreads and the shape of the yield curve. We also frequently review our interest rate assumptions and actively manage the crediting rates used for new and in-force business. Business strategies continue to evolve and we attempt to maintain profitability of the overall business in light of the interest rate environment. A rising interest rate environment results in improved yields on new investments and improves margins for our Life and Retirement business while also making certain products, such as fixed annuities, more attractive to potential customers. However, the rising rate environment has resulted in lower values on general and separate accounts assets and brokerage and advisory assets that hold investments in fixed income assets.
For additional information on our investment and asset-liability management strategies see Investments.
For investment-oriented products, including universal life insurance, and variable, fixed and fixed index annuities, in our Individual Retirement, Group Retirement, Life Insurance and Institutional Markets businesses, our spread management strategies include disciplined pricing and product design for new business, modifying or limiting the sale of products that do not achieve targeted spreads, using asset-liability management to match assets to liabilities to the extent practicable, and actively managing crediting rates to help mitigate some of the pressure on investment spreads. Renewal crediting rate management is done under contractual provisions that were designed to allow crediting rates to be reset at pre-established intervals in accordance with state and federal laws and subject to minimum crediting rate guarantees. We expect to continue to adjust crediting rates on in-force business, as appropriate, to be responsive to a rising rate environment. As interest rates rise, we may need to raise crediting rates on in-force business for competitive and other reasons, potentially offsetting a portion of the additional investment income resulting from investing in a higher interest rate environment.
|
82
|
AIG | Second Quarter 2022 Form 10-Q
|
||||
Of the aggregate fixed account values of our Individual Retirement and Group Retirement annuity products, 68 percent were crediting at the contractual minimum guaranteed interest rate as of June 30, 2022. The percentage of fixed account values of our annuity products that are currently crediting at rates above one percent were 56 percent and 58 percent as of June 30, 2022 and December 31, 2021, respectively. In the universal life products in our Life Insurance business, 67 percent of the account values were crediting at the contractual minimum guaranteed interest rate as of both June 30, 2022 and December 31, 2021. These businesses continue to focus on pricing discipline and strategies to manage the minimum guaranteed interest crediting rates offered on new sales in the context of regulatory requirements and competitive positioning.
The following table presents fixed annuity and universal life account values of our Individual Retirement, Group Retirement and Life Insurance operating segments by contractual minimum guaranteed interest rate and current crediting rates, excluding balances ceded to Fortitude Re:
| Current Crediting Rates | |||||||||||||||||||||||||||||
| June 30, 2022 | 1-50 Basis | More than 50 | |||||||||||||||||||||||||||
| Contractual Minimum Guaranteed | At Contractual | Points Above | Basis Points | ||||||||||||||||||||||||||
| Interest Rate | Minimum | Minimum | Above Minimum | ||||||||||||||||||||||||||
| (in millions) | Guarantee | Guarantee | Guarantee | Total | |||||||||||||||||||||||||
| Individual Retirement* | |||||||||||||||||||||||||||||
| <=1% | $ | 10,300 | $ | 1,775 | $ | 19,868 | $ | 31,943 | |||||||||||||||||||||
| > 1% - 2% | 4,300 | 25 | 1,666 | 5,991 | |||||||||||||||||||||||||
| > 2% - 3% | 9,995 | — | 18 | 10,013 | |||||||||||||||||||||||||
| > 3% - 4% | 7,934 | 40 | 6 | 7,980 | |||||||||||||||||||||||||
| > 4% - 5% | 471 | — | 5 | 476 | |||||||||||||||||||||||||
| > 5% - 5.5% | 34 | — | 4 | 38 | |||||||||||||||||||||||||
| Total Individual Retirement | $ | 33,034 | $ | 1,840 | $ | 21,567 | $ | 56,441 | |||||||||||||||||||||
| Group Retirement* | |||||||||||||||||||||||||||||
| <=1% | $ | 3,817 | $ | 1,717 | $ | 4,674 | $ | 10,208 | |||||||||||||||||||||
| > 1% - 2% | 6,310 | 410 | 7 | 6,727 | |||||||||||||||||||||||||
| > 2% - 3% | 14,556 | — | — | 14,556 | |||||||||||||||||||||||||
| > 3% - 4% | 696 | — | — | 696 | |||||||||||||||||||||||||
| > 4% - 5% | 6,953 | — | — | 6,953 | |||||||||||||||||||||||||
| > 5% - 5.5% | 159 | — | — | 159 | |||||||||||||||||||||||||
| Total Group Retirement | $ | 32,491 | $ | 2,127 | $ | 4,681 | $ | 39,299 | |||||||||||||||||||||
| Universal life insurance | |||||||||||||||||||||||||||||
| <=1% | $ | — | $ | — | $ | — | $ | — | |||||||||||||||||||||
| > 1% - 2% | 105 | 24 | 350 | 479 | |||||||||||||||||||||||||
| > 2% - 3% | 240 | 638 | 1,108 | 1,986 | |||||||||||||||||||||||||
| > 3% - 4% | 1,395 | 186 | 189 | 1,770 | |||||||||||||||||||||||||
| > 4% - 5% | 3,024 | — | — | 3,024 | |||||||||||||||||||||||||
| > 5% - 5.5% | 226 | — | — | 226 | |||||||||||||||||||||||||
| Total universal life insurance | $ | 4,990 | $ | 848 | $ | 1,647 | $ | 7,485 | |||||||||||||||||||||
| Total | $ | 70,515 | $ | 4,815 | $ | 27,895 | $ | 103,225 | |||||||||||||||||||||
| Percentage of total | 68 | % | 5 | % | 27 | % | 100 | % | |||||||||||||||||||||
*
Individual Retirement and Group Retirement amounts shown include fixed options within variable annuity products.
|
AIG | Second Quarter 2022 Form 10-Q
|
83
|
||||
General Insurance
Our net investment income is significantly impacted by market interest rates as well as the deployment of asset allocation strategies to manage duration, enhance yield and manage interest rate risk. As interest rates increase, so too does our ability to reinvest future cash inflows from premiums, as well as sales and maturities of existing investments, at more favorable rates.
For additional information on our investment and asset-liability management strategies see Investments.
While the impact of rising interest rates on our General Insurance segment increases the benefit of investment income, the current and medium-term inflationary environment may also translate into higher loss cost trends. We monitor these trends closely, particularly loss cost trend uncertainty, to ensure that not only our pricing, but also our loss reserving assumptions are proactive to, and considerate of, current and future economic conditions.
For our General Insurance segment loss reserves, rising interest rates may favorably impact the statutory net loss reserve discount for workers’ compensation and its associated amortization.
Impact of Currency Volatility
Currency volatility remains acute. Strengthening of the U.S. dollar against the Euro, British pound and the Japanese yen (the Major Currencies) impacts income for our businesses with substantial international operations. In particular, growth trends in net premiums written reported in U.S. dollars can differ significantly from those measured in original currencies. The net effect on underwriting results, however, is significantly mitigated, as both revenues and expenses are similarly affected.
These currencies may continue to fluctuate, especially as a result of central bank responses to inflation, concerns regarding future economic growth and other macroeconomic factors, and such fluctuations will affect net premiums written growth trends reported in U.S. dollars, as well as financial statement line item comparability.
General Insurance businesses are transacted in most major foreign currencies. The following table presents the average of the quarterly weighted average exchange rates of the Major Currencies, which have the most significant impact on our businesses:
| Three Months Ended June 30, | Percentage | Six Months Ended June 30, | Percentage | |||||||||||||||||||||||||||||
| Rate for 1 USD | 2022 | 2021 | Change | 2022 | 2021 | Change | ||||||||||||||||||||||||||
| Currency: | ||||||||||||||||||||||||||||||||
| GBP | 0.78 | 0.72 | 8 | % | 0.76 | 0.73 | 4 | % | ||||||||||||||||||||||||
| EUR | 0.93 | 0.83 | 12 | % | 0.90 | 0.83 | 8 | % | ||||||||||||||||||||||||
| JPY | 124.44 | 108.95 | 14 | % | 119.53 | 106.62 | 12 | % | ||||||||||||||||||||||||
Unless otherwise noted, references to the effects of foreign exchange in the General Insurance discussion of results of operations are with respect to movements in the Major Currencies included in the preceding table.
|
84
|
AIG | Second Quarter 2022 Form 10-Q
|
||||
Consolidated Results of Operations
The following section provides a comparative discussion of our consolidated results of operations on a reported basis for the three-month periods ended June 30, 2022 and 2021. Factors that relate primarily to a specific business are discussed in more detail within the business segment operations section.
For information regarding the Critical Accounting Estimates that affect our results of operations see Critical Accounting Estimates in this MD&A and Part II, Item 7. MD&A – Critical Accounting Estimates in the 2021 Annual Report.
The following table presents our consolidated results of operations and other key financial metrics:
| Three Months Ended June 30, | Percentage | Six Months Ended June 30, | Percentage | |||||||||||||||||||||||||||||||||||
| (in millions) | 2022 | 2021 | Change | 2022 | 2021 | Change | ||||||||||||||||||||||||||||||||
| Revenues: | ||||||||||||||||||||||||||||||||||||||
| Premiums | $ | 7,516 | $ | 7,914 | (5) | % | $ | 14,626 | $ | 14,421 | 1 | % | ||||||||||||||||||||||||||
| Policy fees | 742 | 771 | (4) | 1,506 | 1,555 | (3) | ||||||||||||||||||||||||||||||||
| Net investment income: | ||||||||||||||||||||||||||||||||||||||
| Net investment income - excluding Fortitude Re funds withheld assets | 2,416 | 3,168 | (24) | 5,362 | 6,339 | (15) | ||||||||||||||||||||||||||||||||
| Net investment income - Fortitude Re funds withheld assets | 188 | 507 | (63) | 479 | 993 | (52) | ||||||||||||||||||||||||||||||||
| Total net investment income | 2,604 | 3,675 | (29) | 5,841 | 7,332 | (20) | ||||||||||||||||||||||||||||||||
| Net realized gains (losses): | ||||||||||||||||||||||||||||||||||||||
| Net realized gains (losses) - excluding Fortitude Re funds withheld assets and embedded derivative | 702 | (43) | NM | 1,943 | 652 | 198 | ||||||||||||||||||||||||||||||||
| Net realized gains (losses) on Fortitude Re funds withheld assets | (86) | 173 | NM | (226) | 346 | NM | ||||||||||||||||||||||||||||||||
| Net realized gains (losses) on Fortitude Re funds withheld embedded derivative | 2,776 | (2,056) | NM | 6,094 | 326 | NM | ||||||||||||||||||||||||||||||||
| Total net realized gains (losses) | 3,392 | (1,926) | NM | 7,811 | 1,324 | 490 | ||||||||||||||||||||||||||||||||
| Other income | 187 | 247 | (24) | 465 | 503 | (8) | ||||||||||||||||||||||||||||||||
| Total revenues | 14,441 | 10,681 | 35 | 30,249 | 25,135 | 20 | ||||||||||||||||||||||||||||||||
| Benefits, losses and expenses: | ||||||||||||||||||||||||||||||||||||||
| Policyholder benefits and losses incurred | 5,123 | 6,084 | (16) | 10,378 | 11,223 | (8) | ||||||||||||||||||||||||||||||||
| Interest credited to policyholder account balances | 910 | 872 | 4 | 1,787 | 1,740 | 3 | ||||||||||||||||||||||||||||||||
| Amortization of deferred policy acquisition costs | 1,298 | 915 | 42 | 2,735 | 2,219 | 23 | ||||||||||||||||||||||||||||||||
| General operating and other expenses | 2,223 | 2,218 | — | 4,404 | 4,306 | 2 | ||||||||||||||||||||||||||||||||
| Interest expense | 266 | 338 | (21) | 529 | 680 | (22) | ||||||||||||||||||||||||||||||||
| Loss on extinguishment of debt | 299 | 106 | 182 | 299 | 98 | 205 | ||||||||||||||||||||||||||||||||
| Net (gain) loss on divestitures | 1 | 1 | — | (39) | (6) | NM | ||||||||||||||||||||||||||||||||
| Total benefits, losses and expenses | 10,120 | 10,534 | (4) | 20,093 | 20,260 | (1) | ||||||||||||||||||||||||||||||||
| Income from continuing operations before income tax expense | 4,321 | 147 | NM | 10,156 | 4,875 | 108 | ||||||||||||||||||||||||||||||||
| Income tax expense (benefit) | 928 | (3) | NM | 2,107 | 795 | 165 | ||||||||||||||||||||||||||||||||
| Income from continuing operations | 3,393 | 150 | NM | 8,049 | 4,080 | 97 | ||||||||||||||||||||||||||||||||
| Income (loss) from discontinued operations, net of income taxes | (1) | — | NM | (1) | — | NM | ||||||||||||||||||||||||||||||||
| Net income | 3,392 | 150 | NM | 8,048 | 4,080 | 97 | ||||||||||||||||||||||||||||||||
| Less: Net income attributable to noncontrolling interests | 356 | 51 | NM | 752 | 105 | NM | ||||||||||||||||||||||||||||||||
| Net income attributable to AIG | 3,036 | 99 | NM | 7,296 | 3,975 | 84 | ||||||||||||||||||||||||||||||||
| Less: Dividends on preferred stock | 8 | 8 | — | 15 | 15 | — | ||||||||||||||||||||||||||||||||
| Net income attributable to AIG common shareholders | $ | 3,028 | $ | 91 | NM | % | $ | 7,281 | $ | 3,960 | 84 | % | ||||||||||||||||||||||||||
|
AIG | Second Quarter 2022 Form 10-Q
|
85
|
||||
| (in millions, except per common share data) | June 30, 2022 | December 31, 2021 | ||||||||||||
| Balance sheet data: | ||||||||||||||
| Total assets | $ | 538,938 | $ | 596,112 | ||||||||||
| Long-term debt | 22,186 | 23,741 | ||||||||||||
| Debt of consolidated investment entities | 6,252 | 6,422 | ||||||||||||
| Total AIG shareholders’ equity | 45,344 | 65,956 | ||||||||||||
| Book value per common share | 58.16 | 79.97 | ||||||||||||
| Adjusted book value per common share | 72.23 | 68.83 | ||||||||||||
The following table presents a reconciliation of Book value per common share to Adjusted book value per common share, which is a non-GAAP measure.
For additional information see Use of Non-GAAP Measures.
| (in millions, except per common share data) | June 30, 2022 | December 31, 2021 | ||||||||||||
| Total AIG shareholders' equity | $ | 45,344 | $ | 65,956 | ||||||||||
| Preferred equity | 485 | 485 | ||||||||||||
| Total AIG common shareholders' equity | 44,859 | 65,471 | ||||||||||||
| Less: Deferred tax assets | 4,582 | 5,221 | ||||||||||||
| Less: Accumulated other comprehensive income (loss) | (17,656) | 6,687 | ||||||||||||
| Add: Cumulative unrealized gains and losses related to Fortitude Re funds withheld assets | (2,223) | 2,791 | ||||||||||||
| Subtotal: AOCI plus cumulative unrealized gains and losses related to Fortitude Re funds withheld assets | (15,433) | 3,896 | ||||||||||||
| Adjusted common shareholders' equity | $ | 55,710 | $ | 56,354 | ||||||||||
| Total common shares outstanding | 771.3 | 818.7 | ||||||||||||
| Book value per common share | $ | 58.16 | $ | 79.97 | ||||||||||
| Adjusted book value per common share | 72.23 | 68.83 | ||||||||||||
The following table presents a reconciliation of Return on common equity to Adjusted return on common equity, which is a non-GAAP measure.
For additional information see Use of Non-GAAP Measures.
|
Three Months Ended
June 30, |
Six Months Ended
June 30, |
Year Ended
December 31, |
||||||||||||||||||||||||||||||||||||
| (dollars in millions) | 2022 | 2021 | 2022 | 2021 | 2021 | |||||||||||||||||||||||||||||||||
| Actual or annualized net income (loss) attributable to AIG common shareholders | $ | 12,112 | $ | 364 | $ | 14,562 | $ | 7,920 | $ | 9,359 | ||||||||||||||||||||||||||||
| Actual or annualized adjusted after-tax income attributable to AIG common shareholders | 3,916 | 5,324 | 4,106 | 4,508 | 4,430 | |||||||||||||||||||||||||||||||||
| Average AIG common shareholders' equity | $ | 50,159 | $ | 63,896 | $ | 55,263 | $ | 64,556 | $ | 64,704 | ||||||||||||||||||||||||||||
| Less: Average DTA | 4,699 | 7,457 | 4,873 | 7,607 | 7,025 | |||||||||||||||||||||||||||||||||
| Less: Average AOCI | (11,778) | 8,338 | (5,623) | 10,062 | 9,096 | |||||||||||||||||||||||||||||||||
| Add: Average cumulative unrealized gains and losses related to Fortitude Re funds withheld assets | (1,088) | 2,794 | 205 | 3,415 | 3,200 | |||||||||||||||||||||||||||||||||
| Subtotal: AOCI plus cumulative unrealized gains and losses related to Fortitude Re funds withheld assets | (10,690) | 5,544 | (5,828) | 6,647 | 5,896 | |||||||||||||||||||||||||||||||||
| Average adjusted AIG common shareholders' equity | $ | 56,150 | $ | 50,895 | $ | 56,218 | $ | 50,302 | $ | 51,783 | ||||||||||||||||||||||||||||
| Return on common equity | 24.1 | % | 0.6 | % | 26.4 | % | 12.3 | % | 14.5 | % | ||||||||||||||||||||||||||||
| Adjusted return on common equity | 7.0 | % | 10.5 | % | 7.3 | % | 9.0 | % | 8.6 | % | ||||||||||||||||||||||||||||
|
86
|
AIG | Second Quarter 2022 Form 10-Q
|
||||
The following table presents a reconciliation of revenues to adjusted revenues:
| Three Months Ended June 30, | Six Months Ended June 30, | ||||||||||||||||||||||||||||
| (in millions) | 2022 | 2021 | 2022 | 2021 | |||||||||||||||||||||||||
| Revenues | $ | 14,441 | $ | 10,681 | $ | 30,249 | $ | 25,135 | |||||||||||||||||||||
| Changes in fair value of securities used to hedge guaranteed living benefits | (13) | (14) | (27) | (32) | |||||||||||||||||||||||||
| Changes in the fair value of equity securities | 30 | 13 | 57 | (9) | |||||||||||||||||||||||||
| Other (income) expense - net | 9 | 2 | 16 | 8 | |||||||||||||||||||||||||
| Net investment income on Fortitude Re funds withheld assets | (188) | (507) | (479) | (993) | |||||||||||||||||||||||||
| Net realized (gains) losses on Fortitude Re funds withheld assets | 86 | (173) | 226 | (346) | |||||||||||||||||||||||||
| Net realized (gains) losses on Fortitude Re funds withheld embedded derivative | (2,776) | 2,056 | (6,094) | (326) | |||||||||||||||||||||||||
| Net realized (gains) losses* | (615) | 68 | (1,796) | (549) | |||||||||||||||||||||||||
| Non-operating litigation reserves and settlements | (4) | — | (38) | — | |||||||||||||||||||||||||
| Adjusted revenues | $ | 10,970 | $ | 12,126 | $ | 22,114 | $ | 22,888 | |||||||||||||||||||||
*
Includes all net realized gains and losses except earned income (periodic settlements and changes in settlement accruals) on derivative instruments used for non-qualifying (economic) hedging or for asset replication and net realized gains and losses on Fortitude Re funds withheld assets.
The following table presents a reconciliation of pre-tax income (loss)/net income (loss) attributable to AIG to adjusted pre-tax income (loss)/adjusted after-tax income (loss) attributable to AIG:
| Three Months Ended June 30, | 2022 | 2021 | |||||||||||||||||||||||||||||||||||||||||||||||||||
| (in millions, except per common share data) | Pre-tax |
Total Tax
(Benefit) Charge |
Non-controlling
Interests (d) |
After
Tax |
Pre-tax |
Total Tax
(Benefit) Charge |
Non-controlling
Interests (d) |
After
Tax |
|||||||||||||||||||||||||||||||||||||||||||||
| Pre-tax income/net income, including noncontrolling interests | $ | 4,321 | $ | 928 | $ | — | $ | 3,392 | $ | 147 | $ | (3) | $ | — | $ | 150 | |||||||||||||||||||||||||||||||||||||
| Noncontrolling interests | (356) | (356) | (51) | (51) | |||||||||||||||||||||||||||||||||||||||||||||||||
| Pre-tax income/net income attributable to AIG | $ | 4,321 | $ | 928 | $ | (356) | $ | 3,036 | $ | 147 | $ | (3) | $ | (51) | $ | 99 | |||||||||||||||||||||||||||||||||||||
| Dividends on preferred stock | 8 | 8 | |||||||||||||||||||||||||||||||||||||||||||||||||||
| Net income attributable to AIG common shareholders | $ | 3,028 | $ | 91 | |||||||||||||||||||||||||||||||||||||||||||||||||
|
Changes in uncertain tax positions and other tax adjustments
(a)
|
(3) | — | 3 | (35) | — | 35 | |||||||||||||||||||||||||||||||||||||||||||||||
|
Deferred income tax valuation allowance releases
(b)
|
17 | — | (17) | 25 | — | (25) | |||||||||||||||||||||||||||||||||||||||||||||||
| Changes in fair value of securities used to hedge guaranteed living benefits | (10) | (2) | — | (8) | (13) | (2) | — | (11) | |||||||||||||||||||||||||||||||||||||||||||||
| Changes in benefit reserves and DAC, VOBA and DSI related to net realized gains (losses) | 128 | 27 | — | 101 | (120) | (25) | — | (95) | |||||||||||||||||||||||||||||||||||||||||||||
| Changes in the fair value of equity securities | 30 | 6 | — | 24 | 13 | 3 | — | 10 | |||||||||||||||||||||||||||||||||||||||||||||
| Loss on extinguishment of debt | 299 | 63 | — | 236 | 106 | 23 | — | 83 | |||||||||||||||||||||||||||||||||||||||||||||
| Net investment income on Fortitude Re funds withheld assets | (188) | (40) | — | (148) | (507) | (107) | — | (400) | |||||||||||||||||||||||||||||||||||||||||||||
| Net realized (gains) losses on Fortitude Re funds withheld assets | 86 | 19 | — | 67 | (173) | (37) | — | (136) | |||||||||||||||||||||||||||||||||||||||||||||
| Net realized (gains) losses on Fortitude Re funds withheld embedded derivative | (2,776) | (583) | — | (2,193) | 2,056 | 431 | — | 1,625 | |||||||||||||||||||||||||||||||||||||||||||||
|
Net realized (gains) losses
(c)
|
(620) | (154) | — | (466) | 59 | 17 | — | 42 | |||||||||||||||||||||||||||||||||||||||||||||
| Loss from discontinued operations | 1 | — | |||||||||||||||||||||||||||||||||||||||||||||||||||
| Net loss on divestitures | 1 | 1 | — | — | 1 | — | — | 1 | |||||||||||||||||||||||||||||||||||||||||||||
| Non-operating litigation reserves and settlements | (4) | (1) | — | (3) | — | — | — | — | |||||||||||||||||||||||||||||||||||||||||||||
| Favorable prior year development and related amortization changes ceded under retroactive reinsurance agreements | (144) | (30) | — | (114) | (65) | (14) | — | (51) | |||||||||||||||||||||||||||||||||||||||||||||
| Net loss reserve discount charge | 14 | 4 | — | 10 | 22 | 5 | — | 17 | |||||||||||||||||||||||||||||||||||||||||||||
| Integration and transaction costs associated with acquiring or divesting businesses | 38 | 8 | — | 30 | 35 | 7 | — | 28 | |||||||||||||||||||||||||||||||||||||||||||||
| Restructuring and other costs | 175 | 37 | — | 138 | 126 | 26 | — | 100 | |||||||||||||||||||||||||||||||||||||||||||||
| Non-recurring costs related to regulatory or accounting changes | 9 | 2 | — | 7 | 21 | 4 | — | 17 | |||||||||||||||||||||||||||||||||||||||||||||
|
Noncontrolling interests
(d)
|
283 | 283 | — | — | |||||||||||||||||||||||||||||||||||||||||||||||||
| Adjusted pre-tax income/Adjusted after-tax income attributable to AIG common shareholders | $ | 1,359 | $ | 299 | $ | (73) | $ | 979 | $ | 1,708 | $ | 318 | $ | (51) | $ | 1,331 | |||||||||||||||||||||||||||||||||||||
| Weighted average diluted shares outstanding | 800.7 | 872.9 | |||||||||||||||||||||||||||||||||||||||||||||||||||
| Income per common share attributable to AIG common shareholders (diluted) | $ | 3.78 | $ | 0.11 | |||||||||||||||||||||||||||||||||||||||||||||||||
|
Adjusted after-tax income per common share attributable to AIG common shareholders (diluted)
(e)
|
$ | 1.19 | $ | 1.52 | |||||||||||||||||||||||||||||||||||||||||||||||||
|
AIG | Second Quarter 2022 Form 10-Q
|
87
|
||||
| Six Months Ended June 30, | 2022 | 2021 | |||||||||||||||||||||||||||||||||||||||||||||||||||
| (in millions, except per common share data) | Pre-tax |
Total Tax
(Benefit) Charge |
Non-controlling
Interests (d) |
After
Tax |
Pre-tax |
Total Tax
(Benefit) Charge |
Non-controlling
Interests (d) |
After
Tax |
|||||||||||||||||||||||||||||||||||||||||||||
| Pre-tax income/net income, including noncontrolling interests | $ | 10,156 | $ | 2,107 | $ | — | $ | 8,048 | $ | 4,875 | $ | 795 | $ | — | $ | 4,080 | |||||||||||||||||||||||||||||||||||||
| Noncontrolling interests | (752) | (752) | (105) | (105) | |||||||||||||||||||||||||||||||||||||||||||||||||
| Pre-tax income/net income attributable to AIG | $ | 10,156 | $ | 2,107 | $ | (752) | $ | 7,296 | $ | 4,875 | $ | 795 | $ | (105) | $ | 3,975 | |||||||||||||||||||||||||||||||||||||
| Dividends on preferred stock | 15 | 15 | |||||||||||||||||||||||||||||||||||||||||||||||||||
| Net income attributable to AIG common shareholders | $ | 7,281 | $ | 3,960 | |||||||||||||||||||||||||||||||||||||||||||||||||
|
Changes in uncertain tax positions and other tax adjustments
(a)
|
88 | — | (88) | 866 | — | (866) | |||||||||||||||||||||||||||||||||||||||||||||||
|
Deferred income tax valuation allowance (releases) charges
(b)
|
23 | — | (23) | (661) | — | 661 | |||||||||||||||||||||||||||||||||||||||||||||||
| Changes in fair value of securities used to hedge guaranteed living benefits | (23) | (5) | — | (18) | (35) | (7) | — | (28) | |||||||||||||||||||||||||||||||||||||||||||||
| Changes in benefit reserves and DAC, VOBA and DSI related to net realized gains (losses) | 401 | 84 | — | 317 | 83 | 18 | — | 65 | |||||||||||||||||||||||||||||||||||||||||||||
| Changes in the fair value of equity securities | 57 | 12 | — | 45 | (9) | (2) | — | (7) | |||||||||||||||||||||||||||||||||||||||||||||
| Loss on extinguishment of debt | 299 | 63 | — | 236 | 98 | 21 | — | 77 | |||||||||||||||||||||||||||||||||||||||||||||
| Net investment income on Fortitude Re funds withheld assets | (479) | (101) | — | (378) | (993) | (209) | — | (784) | |||||||||||||||||||||||||||||||||||||||||||||
| Net realized (gains) losses on Fortitude Re funds withheld assets | 226 | 48 | — | 178 | (346) | (73) | — | (273) | |||||||||||||||||||||||||||||||||||||||||||||
| Net realized gains on Fortitude Re funds withheld embedded derivative | (6,094) | (1,280) | — | (4,814) | (326) | (68) | — | (258) | |||||||||||||||||||||||||||||||||||||||||||||
|
Net realized gains
(c)
|
(1,808) | (435) | — | (1,373) | (568) | (128) | — | (440) | |||||||||||||||||||||||||||||||||||||||||||||
| Loss from discontinued operations | 1 | — | |||||||||||||||||||||||||||||||||||||||||||||||||||
| Net gain on divestitures | (39) | (8) | — | (31) | (6) | (1) | — | (5) | |||||||||||||||||||||||||||||||||||||||||||||
| Non-operating litigation reserves and settlements | (38) | (8) | — | (30) | — | — | — | — | |||||||||||||||||||||||||||||||||||||||||||||
| Favorable prior year development and related amortization changes ceded under retroactive reinsurance agreements | (144) | (30) | — | (114) | (84) | (18) | — | (66) | |||||||||||||||||||||||||||||||||||||||||||||
| Net loss reserve discount benefit | (6) | (1) | — | (5) | (10) | (2) | — | (8) | |||||||||||||||||||||||||||||||||||||||||||||
| Integration and transaction costs associated with acquiring or divesting businesses | 84 | 18 | — | 66 | 44 | 9 | — | 35 | |||||||||||||||||||||||||||||||||||||||||||||
| Restructuring and other costs | 268 | 56 | — | 212 | 200 | 42 | — | 158 | |||||||||||||||||||||||||||||||||||||||||||||
| Non-recurring costs related to regulatory or accounting changes | 13 | 3 | — | 10 | 41 | 8 | — | 33 | |||||||||||||||||||||||||||||||||||||||||||||
|
Noncontrolling interests
(d)
|
581 | 581 | — | — | |||||||||||||||||||||||||||||||||||||||||||||||||
| Adjusted pre-tax income/Adjusted after-tax income attributable to AIG common shareholders | $ | 2,873 | $ | 634 | $ | (171) | $ | 2,053 | $ | 2,964 | $ | 590 | $ | (105) | $ | 2,254 | |||||||||||||||||||||||||||||||||||||
| Weighted average diluted shares outstanding | 813.3 | 874.6 | |||||||||||||||||||||||||||||||||||||||||||||||||||
| Income per common share attributable to AIG common shareholders (diluted) | $ | 8.95 | $ | 4.53 | |||||||||||||||||||||||||||||||||||||||||||||||||
|
Adjusted after-tax income per common share attributable to AIG common shareholders (diluted)
(e)
|
$ | 2.50 | $ | 2.58 | |||||||||||||||||||||||||||||||||||||||||||||||||
(a)
Six months ended June 30, 2021 includes the completion of audit activity by the Internal Revenue Service (IRS).
(b)
Six months ended June 30, 2021 includes an increase in the valuation allowance against a portion of certain tax attribute carryforwards of AIG's U.S. federal consolidated income tax group, as well as net valuation allowance release in certain foreign jurisdictions.
(c)
Includes all net realized gains and losses except earned income (periodic settlements and changes in settlement accruals) on derivative instruments used for non-qualifying (economic) hedging or for asset replication and net realized gains and losses on Fortitude Re funds withheld assets.
(d)
For the three and six months ended June 30, 2022, noncontrolling interests include Blackstone’s 9.9 percent equity stake in Corebridge. Corebridge summarized financial information is presented below:
|
Three Months Ended
June 30, 2022 |
Six Months Ended
June 30, 2022 |
||||||||||||||||||||||||||||
| (in millions) | Corebridge | AIG Noncontrolling Interest | Corebridge | AIG Noncontrolling Interest | |||||||||||||||||||||||||
| Revenues | $ | 3,609 | $ | 357 | $ | 8,083 | $ | 800 | |||||||||||||||||||||
| Expenses | 3,330 | 331 | 7,037 | 698 | |||||||||||||||||||||||||
| Adjusted pre-tax income | 279 | 26 | 1,046 | 102 | |||||||||||||||||||||||||
| Taxes on APTI | 25 | 2 | 181 | 17 | |||||||||||||||||||||||||
| Adjusted after-tax income | 254 | 24 | 865 | 85 | |||||||||||||||||||||||||
| Non-operating income | 3,359 | 332 | 7,014 | 694 | |||||||||||||||||||||||||
| Taxes on non-operating income | 512 | 50 | 1,214 | 119 | |||||||||||||||||||||||||
| Non-operating income - after-tax | 2,847 | 282 | 5,800 | 575 | |||||||||||||||||||||||||
| Net income | $ | 3,101 | $ | 306 | $ | 6,665 | $ | 660 | |||||||||||||||||||||
(e)
For the three- and six-month periods ended June 30, 2022, an option for Blackstone to exchange all or a portion of its ownership interest in Corebridge for AIG common shares was dilutive for the calculation of Adjusted after-tax income per common share attributable to AIG common shareholders. The dilutive impact was an additional 42,572,031 shares for both periods.
|
88
|
AIG | Second Quarter 2022 Form 10-Q
|
||||
PRE-TAX INCOME (LOSS) QUARTERLY AND YEAR-TO-DATE COMPARISON FOR 2022 AND 2021
Pre-tax income was $4.3 billion in the three-month period ended June 30, 2022 compared to $147 million in the same period in 2021.
Pre-tax income was $10.2 billion in the six-month period ended June 30, 2022 compared to $4.9 billion in the same period in 2021.
For the main drivers impacting AIG’s results of operations, see Executive Summary – Financial Performance Summary – Net Income (Loss) Attributable to AIG Common Shareholders.
U.S. TAX LAW CHANGES
The IRS has continued to issue new guidance in relation to the Tax Act enacted in 2017. Guidance has been issued covering provisions for Global Intangible Low-Taxed Income (GILTI) under which taxes are imposed on the excess of a deemed return on tangible assets of certain foreign subsidiaries, foreign tax credits by which the U.S. mitigates double taxation of foreign operations, and other elements of tax law. Changes to this guidance, and other provisions of tax law, are expected in future periods. Such guidance may result in changes to the interpretations and assumptions we made and actions we may take, which may impact amounts recorded with respect to international provisions of the Tax Act, possibly materially. Consistent with accounting guidance, we have made an accounting policy election to treat GILTI taxes as a period tax charge in the period the tax is incurred.
On March 27, 2020, the U.S. enacted the Coronavirus Aid, Relief, and Economic Security (CARES) Act to mitigate the economic impacts of the COVID-19 pandemic. The tax provisions of the CARES Act have not had and are currently not expected to have a material impact on AIG’s U.S. federal tax liabilities.
On November 15, 2021, the U.S. enacted the Infrastructure Investment and Jobs Act to improve infrastructure in the U.S. The tax provisions of the Infrastructure Investment and Jobs Act have not had and are currently not expected to have a material impact on AIG’s U.S. federal tax liabilities.
Repatriation Assumptions
For the six-month period ended June 30, 2022, we consider our foreign earnings with respect to certain operations in Canada, South Africa, Japan, Latin America, Bermuda as well as the European, Asia Pacific and Middle East regions to be indefinitely reinvested. These earnings relate to ongoing operations and have been reinvested in active business operations. Deferred taxes, if necessary, have been provided on earnings of non-U.S. affiliates whose earnings are not indefinitely reinvested.
INTERIM TAX CALCULATION METHOD
We use the estimated annual effective tax rate method in computing our interim tax provision. Certain items, including those deemed to be unusual, infrequent or that cannot be reliably estimated, are excluded from the estimated annual effective tax rate. In these cases, the actual tax expense or benefit is reported in the same period as the related item. Certain tax effects are also not reflected in the estimated annual effective tax rate, primarily certain changes in uncertain tax positions and realizability of deferred tax assets, and are recorded in the period in which the change occurs. While certain impacts of the Tax Act are included in our annual effective tax rate, we continue to refine our calculations as additional information becomes available, which may result in changes to the estimated annual effective tax rate.
INCOME TAX EXPENSE ANALYSIS
For the three-month period ended June 30, 2022, the effective tax rate on income from continuing operations was 21.5 percent. The effective tax rate on income from continuing operations differs from the statutory tax rate of 21 percent primarily due to tax charges associated with the effect of foreign operations, state and local income taxes, and non-deductible transfer pricing charges. These tax charges were partially offset by tax benefits associated with tax exempt income and reclassifications from AOCI to income from continuing operations related to the disposal of available for sale securities. The effect of foreign operations is primarily related to income of our foreign operations taxed at statutory tax rates higher than 21 percent, other foreign taxes, and foreign income subject to U.S. taxation.
For the six-month period ended June 30, 2022, the effective tax rate on income from continuing operations was 20.7 percent. The effective tax rate on income from continuing operations differs from the statutory tax rate of 21 percent primarily due to tax benefits associated with tax exempt income, reclassifications from AOCI to income from continuing operations related to the disposal of available for sale securities, excess tax benefits related to share based compensation payments recorded through the income statement and tax adjustments related to prior year returns. These tax benefits were partially offset by tax charges associated with the effect of foreign operations, state and local income taxes, and non-deductible transfer pricing charges. The effect of foreign operations is primarily related to income of our foreign operations taxed at statutory tax rates higher than 21 percent, other foreign taxes, and foreign income subject to U.S. taxation.
For the three-month period ended June 30, 2021, the effective tax rate on income from continuing operations was (2.0) percent. The effective tax rate on income from continuing operations differs from the statutory tax rate of 21 percent primarily due to tax benefits
|
AIG | Second Quarter 2022 Form 10-Q
|
89
|
||||
associated with the release of reserves for uncertain tax positions and interest related to a New York State tax settlement based on the completion of recent audit activity, tax exempt income, remeasurement of deferred taxes as a result of the increase in the UK corporate statutory income tax rate, and reclassifications from AOCI to income from continuing operations related to the disposal of available for sale securities. These tax benefits were partially offset by tax charges associated with the effect of foreign operations, state and local income taxes, and non-deductible transfer pricing charges. We also recognized a tax charge associated with reduction of net operating loss deferred tax assets in certain foreign jurisdictions, with a corresponding decrease in the related deferred tax asset valuation allowance. The effect of foreign operations is primarily related to income of our foreign operations taxed at statutory tax rates higher than 21 percent, other foreign taxes, and foreign income subject to U.S. taxation.
For the six-month period ended June 30, 2021, the effective tax rate on income from continuing operations was 16.3 percent. The effective tax rate on income from continuing operations differs from the statutory tax rate of 21 percent primarily due to tax benefits associated with the release of reserves for uncertain tax positions, penalties and interest related to the recent completion of audit activity by the IRS, release of reserves for uncertain tax positions and interest related to a New York State tax settlement based on the completion of recent audit activity, tax exempt income, remeasurement of deferred taxes as a result of an increase in the UK corporate income tax rate enacted during the second quarter, and reclassifications from AOCI to income from continuing operations related to the disposal of available for sale securities. These tax benefits were partially offset by tax charges associated with the establishment of U.S. federal valuation allowance related to certain tax attribute carryforwards, the effect of foreign operations, excess tax charges related to share based compensation payments recorded through the income statement, state and local income taxes, and non-deductible transfer pricing charges. We also recognized a tax charge associated with reduction of net operating loss deferred tax assets in certain foreign jurisdictions, with a corresponding decrease in the related deferred tax asset valuation allowance. The effect of foreign operations is primarily related to income of our foreign operations taxed at statutory tax rates higher than 21 percent, other foreign taxes, and foreign income subject to U.S. taxation.
Business Segment Operations
Our business operations consist of General Insurance, Life and Retirement, and Other Operations.
General Insurance consists of two operating segments: North America and International. Life and Retirement consists of four operating segments: Individual Retirement, Group Retirement, Life Insurance and Institutional Markets. Other Operations is primarily comprised of corporate, our institutional asset management business and consolidation and eliminations.
On October 26, 2020, AIG announced its intention to separate its Life and Retirement business from AIG. For additional information on the separation of Life and Retirement, see Note 1 to the Condensed Consolidated Financial Statements.
The following table summarizes Adjusted pre-tax income (loss) from our business segment operations.
See also Note 3 to the Condensed Consolidated Financial Statements.
| Three Months Ended | Six Months Ended | ||||||||||||||||||||||||||||
| June 30, | June 30, | ||||||||||||||||||||||||||||
| (in millions) | 2022 | 2021 | 2022 | 2021 | |||||||||||||||||||||||||
| General Insurance | |||||||||||||||||||||||||||||
| North America - Underwriting income (loss) | $ | 406 | $ | 169 | $ | 662 | $ | (33) | |||||||||||||||||||||
| International - Underwriting income | 393 | 294 | 583 | 569 | |||||||||||||||||||||||||
| Net investment income | 458 | 731 | 1,223 | 1,503 | |||||||||||||||||||||||||
| General Insurance | 1,257 | 1,194 | 2,468 | 2,039 | |||||||||||||||||||||||||
| Life and Retirement | |||||||||||||||||||||||||||||
| Individual Retirement | 204 | 617 | 588 | 1,149 | |||||||||||||||||||||||||
| Group Retirement | 164 | 347 | 389 | 654 | |||||||||||||||||||||||||
| Life Insurance | 117 | 20 | 108 | (20) | |||||||||||||||||||||||||
| Institutional Markets | 78 | 140 | 202 | 282 | |||||||||||||||||||||||||
| Life and Retirement | 563 | 1,124 | 1,287 | 2,065 | |||||||||||||||||||||||||
| Other Operations | |||||||||||||||||||||||||||||
| Other Operations before consolidation and eliminations | (331) | (516) | (619) | (870) | |||||||||||||||||||||||||
| Consolidation and eliminations | (130) | (94) | (263) | (270) | |||||||||||||||||||||||||
| Other Operations | (461) | (610) | (882) | (1,140) | |||||||||||||||||||||||||
| Adjusted pre-tax income | $ | 1,359 | $ | 1,708 | $ | 2,873 | $ | 2,964 | |||||||||||||||||||||
|
90
|
AIG | Second Quarter 2022 Form 10-Q
|
||||
|
General Insurance
|
||
| General Insurance is managed by our geographic markets of North America and International. Our global presence is underpinned by our multinational capabilities to provide our Commercial Lines and Personal Insurance products within these geographic markets. | ||
| PRODUCTS AND DISTRIBUTION | ||
|
North America consists of insurance businesses in the United States, Canada and Bermuda, and our global reinsurance business, AIG Re.
|
International consists of regional insurance businesses in Japan, the United Kingdom, Europe, Middle East and Africa (EMEA region), Asia Pacific, Latin America and Caribbean, and China. International also includes the results of Talbot Holdings, Ltd. as well as AIG’s Global Specialty business.
|
||||
Property:
Products include commercial and industrial property, including business interruption, as well as package insurance products and services that cover exposures to man-made and natural disasters.
Liability:
Products include general liability, environmental, commercial automobile liability, workers’ compensation, excess casualty and crisis management insurance products. Casualty also includes risk-sharing and other customized structured programs for large corporate and multinational customers.
Financial Lines:
Products include professional liability insurance for a range of businesses and risks, including directors and officers, mergers and acquisitions, fidelity, employment practices, fiduciary liability, cyber risk, kidnap and ransom, and errors and omissions insurance.
Specialty:
Products include marine, energy-related property insurance products, aviation, political risk, trade credit, trade finance and portfolio solutions, as well as our global reinsurance business AIG Re and Crop Risk Services which includes multi-peril and hail coverages.
Accident & Health:
Products include voluntary and sponsor-paid personal accident and supplemental health products for individuals, employees, associations and other organizations, as well as a broad range of travel insurance products and services for leisure and business travelers.
Personal Lines:
Products include personal auto and personal property in selected markets, comprehensive extended warranty, device protection insurance, home warranty and related services, and insurance for high net-worth individuals offered through AIG’s Private Client Group (PCG) in the U.S. that covers auto, homeowners, umbrella, yacht, fine art and collections.
General Insurance products in North America and International markets are distributed through various channels, including captive and independent agents, brokers, affinity partners, airlines and travel agents, and retailers. Our global platform enables writing multinational and cross-border risks in both Commercial Lines and Personal Insurance.
|
BUSINESS STRATEGY
|
||
Profitable Growth:
Build on our high-quality portfolio by focusing on targeted growth through continued underwriting discipline, improved retentions and new business development. Deploy capital efficiently to act opportunistically and achieve growth in profitable lines, geographies and customer segments, while taking a disciplined underwriting approach to exposure management, terms and conditions and rate change to achieve our risk/return hurdles. Continue to be open to inorganic growth opportunities in profitable markets and segments to expand our capabilities and footprint.
|
AIG | Second Quarter 2022 Form 10-Q
|
91
|
||||
Reinsurance Optimization:
Strategically partner with reinsurers to effectively manage exposure to losses arising from frequency of large catastrophic events and severity from individual risk losses. We strive to optimize our reinsurance program to manage volatility and protect the balance sheet from tail events and unpredictable net losses in support of our profitable growth objectives.
Underwriting Excellence:
Continue to enhance portfolio optimization through strength of underwriting framework and guidelines as well as clear communication of risk appetite and rate adequacy. Empower and increase accountability of the underwriter and continue to integrate underwriting, claims and actuarial to enable better decision making. Focus on enhancing risk selection, driving consistent underwriting best practices and building robust monitoring standards to improve underwriting results.
|
COMPETITION AND CHALLENGES
|
||
General Insurance operates in a highly competitive industry against global, national and local insurers and reinsurers and underwriting syndicates in specific market areas and product types. Insurance companies compete through a combination of risk acceptance criteria, product pricing, service levels and terms and conditions. We serve our business and individual customers on a global basis – from the largest multinational corporations to local businesses and individuals. General Insurance seeks to differentiate itself in the markets where we participate by providing leading expertise and insight to clients, distribution partners and other stakeholders, delivering underwriting excellence and value-driven insurance solutions and providing high quality, tailored end-to-end support to stakeholders. In doing so, we leverage our world-class global franchise, multinational capabilities, balance sheet strength and financial flexibility.
Our challenges include:
•
ensuring adequate business pricing given passage of time to reporting and settlement for insurance business, particularly with respect to long-tail Commercial Lines exposures;
•
impact of social and economic inflation on claim frequency and severity; and
•
volatility in claims arising from natural and man-made catastrophes and other aggregations of risk exposure.
| OUTLOOK – INDUSTRY AND ECONOMIC FACTORS | ||
Below is a discussion of the industry and economic factors impacting our operating segments:
The results of General Insurance for the three months ended June 30, 2022 reflect continued strong performance from our Commercial Lines portfolio and focused execution on our portfolio management strategies within Personal Insurance. Across our North America and International Commercial Lines of business we have seen increased demand for our insurance products with continued positive rate change and improvement in terms and conditions. We continue to monitor inflationary impacts resulting from government stimulus in recent years, ongoing labor force and supply chain disruptions and rising commodity prices, among other factors, on rate adequacy and loss cost trends. Similarly, we are monitoring the responsive monetary policy actions taken or anticipated to be taken by central banks, to curb inflation and the corresponding impact on market interest rates.
| General Insurance – North America | ||
North America Commercial remains in a firm market amidst a backdrop of increasing claims severity due to elevated economic and social inflation, as well as a higher frequency and severity of natural catastrophe losses over recent years (which we believe to be in part connected to climate change). While market discipline continues to support price increases across most lines, we are seeing capacity move back into the market in certain segments given the improved pricing levels which is putting pressure on rates. We have focused on retaining our best accounts which has led to improving retention across the portfolio. These retention rates are often coupled with an exposure limit management strategy to reduce volatility within the portfolio. We continue to proactively identify segment growth areas as market conditions warrant through effective portfolio management, while non-renewing unprofitable business.
Personal Insurance growth prospects are supported by the need for full life cycle products and coverage, increases in personal wealth accumulation, and awareness of insurance protection and risk management. We compete in the high net worth market, accident and health insurance, travel insurance, and warranty services and will continue to expand our innovative products and services to distribution partners and clients.
|
92
|
AIG | Second Quarter 2022 Form 10-Q
|
||||
| General Insurance – International | ||
We are continuing to pursue growth in our most profitable lines of business and diversify our portfolio across all regions by expanding key business lines (i.e. Financial Lines and Accident & Health) while remaining a market leader in key developed and developing markets. Overall, Commercial Lines continue to show continued positive rate change, particularly in our Financial Lines, Property, Energy and Marine portfolios and across international markets where market events or withdrawal of capability and capacity have favorably impacted pricing. We are maintaining our underwriting discipline, reducing gross and net limits where appropriate, utilizing reinsurance to reduce volatility, as well as continuing our risk selection strategy to improve profitability.
Personal Insurance focuses on individual customers, as well as group and corporate clients. Although market competition within Personal Insurance has increased, we continue to benefit from the underwriting quality, portfolio diversity, and generally low volatility of the short-tailed risk in these business lines, although some product classes are exposed to catastrophe losses.
|
GENERAL INSURANCE RESULTS
|
||
| Three Months Ended June 30, | Six Months Ended June 30, | ||||||||||||||||||||||||||||||||||||||||
| (in millions) | 2022 | 2021 | Change | 2022 | 2021 | Change | |||||||||||||||||||||||||||||||||||
| Underwriting results: | |||||||||||||||||||||||||||||||||||||||||
| Net premiums written | $ | 6,866 | $ | 6,860 | — | % | $ | 13,499 | $ | 13,339 | 1 | % | |||||||||||||||||||||||||||||
| Increase in unearned premiums | (480) | (645) | 26 | (857) | (1,258) | 32 | |||||||||||||||||||||||||||||||||||
| Net premiums earned | 6,386 | 6,215 | 3 | 12,642 | 12,081 | 5 | |||||||||||||||||||||||||||||||||||
|
Losses and loss adjustment expenses incurred
(a)
|
3,591 | 3,810 | (6) | 7,400 | 7,658 | (3) | |||||||||||||||||||||||||||||||||||
| Acquisition expenses: | |||||||||||||||||||||||||||||||||||||||||
| Amortization of deferred policy acquisition costs | 864 | 854 | 1 | 1,753 | 1,727 | 2 | |||||||||||||||||||||||||||||||||||
| Other acquisition expenses | 382 | 335 | 14 | 732 | 646 | 13 | |||||||||||||||||||||||||||||||||||
| Total acquisition expenses | 1,246 | 1,189 | 5 | 2,485 | 2,373 | 5 | |||||||||||||||||||||||||||||||||||
| General operating expenses | 750 | 753 | — | 1,512 | 1,514 | — | |||||||||||||||||||||||||||||||||||
| Underwriting income | 799 | 463 | 73 | 1,245 | 536 | 132 | |||||||||||||||||||||||||||||||||||
| Net investment income | 458 | 731 | (37) | 1,223 | 1,503 | (19) | |||||||||||||||||||||||||||||||||||
| Adjusted pre-tax income | $ | 1,257 | $ | 1,194 | 5 | % | $ | 2,468 | $ | 2,039 | 21 | % | |||||||||||||||||||||||||||||
|
Loss ratio
(a)
|
56.2 | 61.3 | (5.1) | 58.5 | 63.4 | (4.9) | |||||||||||||||||||||||||||||||||||
| Acquisition ratio | 19.5 | 19.1 | 0.4 | 19.7 | 19.6 | 0.1 | |||||||||||||||||||||||||||||||||||
| General operating expense ratio | 11.7 | 12.1 | (0.4) | 12.0 | 12.5 | (0.5) | |||||||||||||||||||||||||||||||||||
| Expense ratio | 31.2 | 31.2 | — | 31.7 | 32.1 | (0.4) | |||||||||||||||||||||||||||||||||||
|
Combined ratio
(a)
|
87.4 | 92.5 | (5.1) | 90.2 | 95.5 | (5.3) | |||||||||||||||||||||||||||||||||||
| Adjustments for accident year loss ratio, as adjusted and accident year combined ratio, as adjusted: | |||||||||||||||||||||||||||||||||||||||||
| Catastrophe losses and reinstatement premiums | (1.8) | (2.1) | 0.3 | (3.1) | (4.6) | 1.5 | |||||||||||||||||||||||||||||||||||
|
Prior year development, net of reinsurance and prior year premiums
|
2.9 | 0.7 | 2.2 | 2.0 | 0.8 | 1.2 | |||||||||||||||||||||||||||||||||||
| Accident year loss ratio, as adjusted | 57.3 | 59.9 | (2.6) | 57.4 | 59.6 | (2.2) | |||||||||||||||||||||||||||||||||||
| Accident year combined ratio, as adjusted | 88.5 | 91.1 | (2.6) | 89.1 | 91.7 | (2.6) | |||||||||||||||||||||||||||||||||||
(a)
Consistent with our definition of APTI, excludes net loss reserve discount and the portion of favorable or unfavorable prior year reserve development for which we have ceded the risk under retroactive reinsurance agreements and related changes in amortization of the deferred gain.
|
AIG | Second Quarter 2022 Form 10-Q
|
93
|
||||
The following table presents General Insurance net premiums written by operating segment, showing change on both reported and constant dollar basis:
| Three Months Ended June 30, | Percentage Change in | Six Months Ended June 30, | Percentage Change in | ||||||||||||||||||||||||||||||||||||||||||||||||||||||||
| (in millions) | 2022 | 2021 | U.S. dollars | Original Currency | 2022 | 2021 | U.S. dollars | Original Currency | |||||||||||||||||||||||||||||||||||||||||||||||||||
| North America | $ | 3,401 | $ | 3,156 | 8 | % | 8 | % | $ | 6,552 | $ | 6,086 | 8 | % | 8 | % | |||||||||||||||||||||||||||||||||||||||||||
| International | 3,465 | 3,704 | (6) | 1 | 6,947 | 7,253 | (4) | 2 | |||||||||||||||||||||||||||||||||||||||||||||||||||
| Total net premiums written | $ | 6,866 | $ | 6,860 | — | % | 5 | % | $ | 13,499 | $ | 13,339 | 1 | % | 5 | % | |||||||||||||||||||||||||||||||||||||||||||
The following tables present General Insurance accident year catastrophes
(a)
by geography and number of events:
| (in millions) |
# of
Events
|
North America |
International
|
Total
|
|||||||||||||||||||
| Three Months Ended June 30, 2022 | |||||||||||||||||||||||
| Flooding, rainstorms and other | 2 | $ | 10 | $ | 26 | $ | 36 | ||||||||||||||||
| Windstorms and hailstorms | 6 | 41 | 37 | 78 | |||||||||||||||||||
| Winter storms | 2 | — | 3 | 3 | |||||||||||||||||||
| Earthquakes | 1 | — | 2 | 2 | |||||||||||||||||||
| Russia / Ukraine | N/A |
(b)
|
— | — | — | ||||||||||||||||||
| Reinstatement premiums | 2 | — | 2 | ||||||||||||||||||||
| Total catastrophe-related charges | 11 | $ | 53 | $ | 68 | $ | 121 | ||||||||||||||||
| Three Months Ended June 30, 2021 | |||||||||||||||||||||||
| Flooding, rainstorms and other | 1 | $ | — | $ | — | $ | — | ||||||||||||||||
| Windstorms and hailstorms | 3 | 72 | — | 72 | |||||||||||||||||||
| Winter storms | 3 | (2) | 41 | 39 | |||||||||||||||||||
| Earthquakes | 1 | — | 7 | 7 | |||||||||||||||||||
| Reinstatement premiums | 12 | 8 | 20 | ||||||||||||||||||||
| Total catastrophe-related charges | 8 | $ | 82 | $ | 56 | $ | 138 | ||||||||||||||||
| Six Months Ended June 30, 2022 | |||||||||||||||||||||||
| Flooding, rainstorms and other | 2 | $ | 35 | $ | 107 | $ | 142 | ||||||||||||||||
| Windstorms and hailstorms | 6 | 66 | 50 | 116 | |||||||||||||||||||
| Winter storms | 2 | 10 | 18 | 28 | |||||||||||||||||||
| Earthquakes | 1 | — | 22 | 22 | |||||||||||||||||||
| Russia / Ukraine | N/A |
(b)
|
— | 85 | 85 | ||||||||||||||||||
| Reinstatement premiums | 1 | 15 | 16 | ||||||||||||||||||||
| Total catastrophe-related charges | 11 | $ | 112 | $ | 297 | $ | 409 | ||||||||||||||||
| Six Months Ended June 30, 2021 | |||||||||||||||||||||||
| Flooding, rainstorms and other | 1 | $ | — | $ | 10 | $ | 10 | ||||||||||||||||
| Windstorms and hailstorms | 3 | 82 | — | 82 | |||||||||||||||||||
| Winter storms | 3 | 349 | 80 | 429 | |||||||||||||||||||
| Earthquakes | 1 | — | 19 | 19 | |||||||||||||||||||
| Reinstatement premiums | 18 | 14 | 32 | ||||||||||||||||||||
| Total catastrophe-related charges | 8 | $ | 449 | $ | 123 | $ | 572 | ||||||||||||||||
(a)
Natural catastrophe losses are generally weather or seismic events, in each case, having a net impact on AIG in excess of $10 million and man-made catastrophe losses, such as terrorism and civil unrest that exceed the $10 million threshold.
(b)
As the Russia/Ukraine conflict continues to evolve the number of events is yet to be determined.
|
94
|
AIG | Second Quarter 2022 Form 10-Q
|
||||
NORTH AMERICA RESULTS
| Three Months Ended June 30, | Six Months Ended June 30, | ||||||||||||||||||||||||||||||||||||||||
| (in millions) | 2022 | 2021 | Change | 2022 | 2021 | Change | |||||||||||||||||||||||||||||||||||
| Underwriting results: | |||||||||||||||||||||||||||||||||||||||||
| Net premiums written | $ | 3,401 | $ | 3,156 | 8 | % | $ | 6,552 | $ | 6,086 | 8 | % | |||||||||||||||||||||||||||||
| Increase in unearned premiums | (429) | (471) | 9 | (791) | (1,013) | 22 | |||||||||||||||||||||||||||||||||||
| Net premiums earned | 2,972 | 2,685 | 11 | 5,761 | 5,073 | 14 | |||||||||||||||||||||||||||||||||||
|
Losses and loss adjustment expenses incurred
(a)
|
1,725 | 1,810 | (5) | 3,457 | 3,712 | (7) | |||||||||||||||||||||||||||||||||||
| Acquisition expenses: | |||||||||||||||||||||||||||||||||||||||||
| Amortization of deferred policy acquisition costs | 386 | 309 | 25 | 742 | 616 | 20 | |||||||||||||||||||||||||||||||||||
| Other acquisition expenses | 153 | 112 | 37 | 297 | 207 | 43 | |||||||||||||||||||||||||||||||||||
| Total acquisition expenses | 539 | 421 | 28 | 1,039 | 823 | 26 | |||||||||||||||||||||||||||||||||||
| General operating expenses | 302 | 285 | 6 | 603 | 571 | 6 | |||||||||||||||||||||||||||||||||||
| Underwriting income (loss) | $ | 406 | $ | 169 | 140 | % | $ | 662 | $ | (33) | NM | % | |||||||||||||||||||||||||||||
|
Loss ratio
(a)
|
58.0 | 67.4 | (9.4) | 60.0 | 73.2 | (13.2) | |||||||||||||||||||||||||||||||||||
| Acquisition ratio | 18.1 | 15.7 | 2.4 | 18.0 | 16.2 | 1.8 | |||||||||||||||||||||||||||||||||||
| General operating expense ratio | 10.2 | 10.6 | (0.4) | 10.5 | 11.3 | (0.8) | |||||||||||||||||||||||||||||||||||
| Expense ratio | 28.3 | 26.3 | 2.0 | 28.5 | 27.5 | 1.0 | |||||||||||||||||||||||||||||||||||
|
Combined ratio
(a)
|
86.3 | 93.7 | (7.4) | 88.5 | 100.7 | (12.2) | |||||||||||||||||||||||||||||||||||
| Adjustments for accident year loss ratio, as adjusted and accident year combined ratio, as adjusted: | |||||||||||||||||||||||||||||||||||||||||
|
Catastrophe losses and reinstatement premiums
|
(1.7) | (2.9) | 1.2 | (1.9) | (8.8) | 6.9 | |||||||||||||||||||||||||||||||||||
|
Prior year development, net of reinsurance and prior year premiums
|
5.3 | 1.6 | 3.7 | 3.7 | 2.1 | 1.6 | |||||||||||||||||||||||||||||||||||
| Accident year loss ratio, as adjusted | 61.6 | 66.1 | (4.5) | 61.8 | 66.5 | (4.7) | |||||||||||||||||||||||||||||||||||
| Accident year combined ratio, as adjusted | 89.9 | 92.4 | (2.5) | 90.3 | 94.0 | (3.7) | |||||||||||||||||||||||||||||||||||
(a)
Consistent with our definition of APTI, excludes net loss reserve discount and the portion of favorable or unfavorable prior year reserve development for which we have ceded the risk under retroactive reinsurance agreements and related changes in amortization of the deferred gain.
Business and Financial Highlights
|
North America Net Premiums Written
Three Months Ended June 30,
(in millions)
|
||
|
Quarterly 2022 and 2021 Comparison
|
|||||
|
Net premiums written increased by $245 million primarily due to growth in Commercial Lines ($263 million), particularly within Property which was driven by continued positive rate change, higher renewal retentions and strong new business production, partially offset by a decrease in Financial Lines due to volatility in capital markets and uncertain economic conditions.
|
|||||
|
This increase was partially offset by lower production in Personal Lines ($18 million), including Warranty as well as underwriting actions taken in PCG, partially offset by an increase in Travel.
|
|||||
|
AIG | Second Quarter 2022 Form 10-Q
|
95
|
||||
|
North America Net Premiums Written
Six Months Ended June 30,
(in millions)
|
||
|
Year-to-Date 2022 and 2021 Comparison
|
|||||
|
Net premiums written increased by $466 million primarily due to:
|
|||||
|
•
growth in Commercial Lines ($428 million), particularly within our Property business driven by continued positive rate change, higher renewal retentions and strong new business production, as well as growth in Crop Risk Services driven by higher commodity prices, partially offset by a decrease in Financial Lines due to volatility in capital markets and uncertain economic conditions; and
|
|||||
|
•
growth in Personal Lines ($38 million), particularly in Travel, partially offset by lower production in Warranty as well as underwriting actions taken in PCG
|
|||||
|
North America Underwriting Income (Loss)
Three Months Ended June 30,
(in millions)
|
||

|
Quarterly 2022 and 2021 Comparison
|
|||||
|
Underwriting income increased by $237 million primarily due to:
|
|||||
|
•
premium growth with improvement in the accident year loss ratio, as adjusted (4.5 points) primarily driven by changes in business mix along with continued positive rate change, focused risk selection and improved terms and conditions;
|
|||||
|
•
higher net favorable prior year reserve development in 2022 (3.7 points or $101 million), primarily due to favorable development within Casualty, partially offset by favorable development in PCG in 2021; and
|
|||||
|
•
lower catastrophe losses (1.2 points or $29 million)
|
|||||
|
These increases were partially offset by a higher expense ratio of 2.0 points reflecting a higher acquisition ratio (2.4 points) primarily driven by changes in business mix and reinsurance, partially offset by a lower general operating expense ratio (0.4 points) resulting from continued general expense discipline as we grow the portfolio.
|
|||||
|
North America Underwriting Income (Loss)
Six Months Ended June 30,
(in millions)
|
||
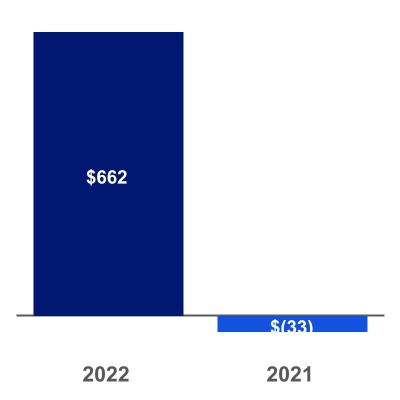
|
Year-to-Date 2022 and 2021 Comparison
|
|||||
|
Underwriting income of $662 million in 2022 compared to an underwriting loss of $33 million in 2021 primarily reflected:
|
|||||
|
•
lower catastrophe losses (6.9 points or $337 million);
|
|||||
|
•
premium growth with improvement in the accident year loss ratio, as adjusted (4.7 points) primarily driven by changes in business mix along with continued positive rate change, focused risk selection and improved terms and conditions; and
|
|||||
|
•
higher net favorable prior year reserve development in 2022 (1.6 points or $85 million), primarily due to favorable development within Casualty, partially offset by higher favorable development in PCG business in 2021.
|
|||||
|
These increases were partially offset by higher expense ratio of 1.0 points reflecting a higher acquisition ratio (1.8 points) primarily driven by changes in business mix and reinsurance, partially offset by a lower general operating expense ratio (0.8 points) resulting from continued general expense discipline as we grow the portfolio.
|
|||||
|
96
|
AIG | Second Quarter 2022 Form 10-Q
|
||||
|
North America Combined Ratios
Three Months Ended June 30,
|
||
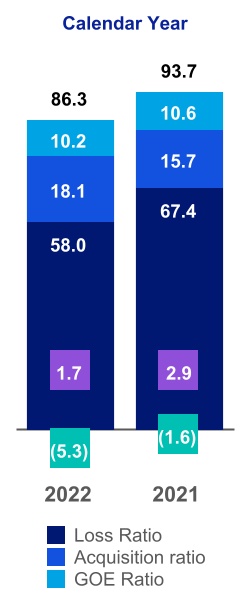
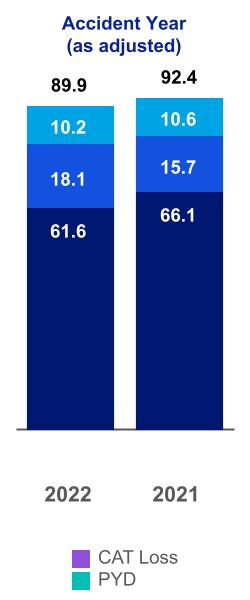
|
Quarterly 2022 and 2021 Comparison
|
|||||
|
The decrease in the calendar year combined ratio of 7.4 points reflected a decrease in loss ratio (9.4 points) partially offset by an increase in expense ratio (2.0 points).
|
|||||
|
The decrease in the loss ratio of 9.4 points reflected:
|
|||||
|
•
premium growth with improvement in the accident year loss ratio, as adjusted (4.5 points) primarily driven by changes in business mix along with continued positive rate change, focused risk selection and improved terms and conditions;
|
|||||
|
•
higher net favorable prior year reserve development in 2022 (3.7 points), primarily due to favorable development within Casualty, partially offset by favorable development in PCG in 2021; and
|
|||||
|
•
lower catastrophe losses (1.2 points).
|
|||||
|
The increase in the expense ratio of 2.0 points reflected a higher acquisition ratio (2.4 points) primarily driven by changes in business mix and reinsurance, partially offset by a lower general operating expense ratio (0.4 points) resulting from continued general expense discipline as we grow the portfolio.
|
|||||
|
North America Combined Ratios
Six Months Ended June 30,
|
||
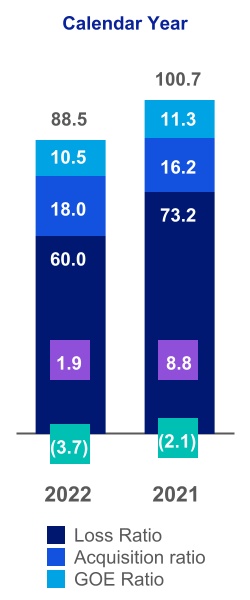

|
Year-to-Date 2022 and 2021 Comparison
|
|||||
|
The decrease in the calendar year combined ratio of 12.2 points reflected a decrease in loss ratio (13.2 points) partially offset by an increase in expense ratio (1.0 points).
|
|||||
|
The decrease in the loss ratio of 13.2 points reflected:
|
|||||
|
•
lower catastrophe losses (6.9 points)
|
|||||
|
•
premium growth with improvement in the accident year loss ratio, as adjusted (4.7 points) primarily driven by changes in business mix along with continued positive rate change, focused risk selection and improved terms and conditions; and
|
|||||
|
•
higher net favorable prior year reserve development in 2022 (1.6 points), primarily due to favorable development within Casualty, partially offset by higher favorable development in PCG in 2021.
|
|||||
|
The increase in the expense ratio of 1.0 points reflected a higher acquisition ratio (1.8 points) primarily driven by changes in business mix and reinsurance, partially offset by a lower general operating expense ratio (0.8 points) resulting from continued general expense discipline as we grow the portfolio.
|
|||||
|
AIG | Second Quarter 2022 Form 10-Q
|
97
|
||||
INTERNATIONAL RESULTS
| Three Months Ended June 30, | Six Months Ended June 30, | ||||||||||||||||||||||||||||||||||||||||
| (in millions) | 2022 | 2021 | Change | 2022 | 2021 | Change | |||||||||||||||||||||||||||||||||||
| Underwriting results: | |||||||||||||||||||||||||||||||||||||||||
| Net premiums written | $ | 3,465 | $ | 3,704 | (6) | % | $ | 6,947 | $ | 7,253 | (4) | % | |||||||||||||||||||||||||||||
| Increase in unearned premiums | (51) | (174) | 71 | (66) | (245) | 73 | |||||||||||||||||||||||||||||||||||
| Net premiums earned | 3,414 | 3,530 | (3) | 6,881 | 7,008 | (2) | |||||||||||||||||||||||||||||||||||
| Losses and loss adjustment expenses incurred | 1,866 | 2,000 | (7) | 3,943 | 3,946 | — | |||||||||||||||||||||||||||||||||||
| Acquisition expenses: | |||||||||||||||||||||||||||||||||||||||||
| Amortization of deferred policy acquisition costs | 478 | 545 | (12) | 1,011 | 1,111 | (9) | |||||||||||||||||||||||||||||||||||
| Other acquisition expenses | 229 | 223 | 3 | 435 | 439 | (1) | |||||||||||||||||||||||||||||||||||
| Total acquisition expenses | 707 | 768 | (8) | 1,446 | 1,550 | (7) | |||||||||||||||||||||||||||||||||||
| General operating expenses | 448 | 468 | (4) | 909 | 943 | (4) | |||||||||||||||||||||||||||||||||||
| Underwriting income | $ | 393 | $ | 294 | 34 | % | $ | 583 | $ | 569 | 2 | % | |||||||||||||||||||||||||||||
| Loss ratio | 54.7 | 56.7 | (2.0) | 57.3 | 56.3 | 1.0 | |||||||||||||||||||||||||||||||||||
| Acquisition ratio | 20.7 | 21.8 | (1.1) | 21.0 | 22.1 | (1.1) | |||||||||||||||||||||||||||||||||||
| General operating expense ratio | 13.1 | 13.3 | (0.2) | 13.2 | 13.5 | (0.3) | |||||||||||||||||||||||||||||||||||
| Expense ratio | 33.8 | 35.1 | (1.3) | 34.2 | 35.6 | (1.4) | |||||||||||||||||||||||||||||||||||
| Combined ratio | 88.5 | 91.8 | (3.3) | 91.5 | 91.9 | (0.4) | |||||||||||||||||||||||||||||||||||
| Adjustments for accident year loss ratio, as adjusted and accident year combined ratio, as adjusted: | |||||||||||||||||||||||||||||||||||||||||
| Catastrophe losses and reinstatement premiums | (2.0) | (1.5) | (0.5) | (4.2) | (1.7) | (2.5) | |||||||||||||||||||||||||||||||||||
| Prior year development, net of reinsurance and prior year premiums | 0.7 | (0.1) | 0.8 | 0.6 | (0.1) | 0.7 | |||||||||||||||||||||||||||||||||||
| Accident year loss ratio, as adjusted | 53.4 | 55.1 | (1.7) | 53.7 | 54.5 | (0.8) | |||||||||||||||||||||||||||||||||||
| Accident year combined ratio, as adjusted | 87.2 | 90.2 | (3.0) | 87.9 | 90.1 | (2.2) | |||||||||||||||||||||||||||||||||||
Business and Financial Highlights
|
International Net Premiums Written
Three Months Ended June 30,
(in millions)
|
||
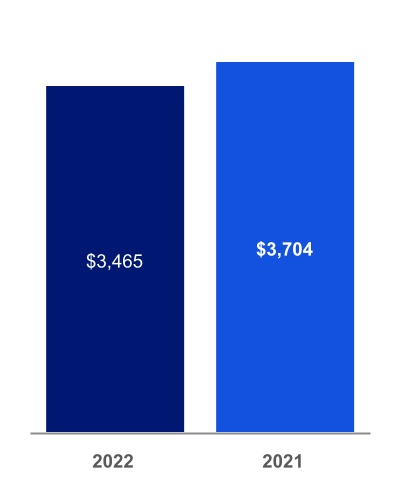
|
Quarterly 2022 and 2021 Comparison
|
|||||
|
Net premiums written, excluding the unfavorable impact of foreign exchange ($286 million), increased by $47 million due to growth in Commercial Lines ($100 million), notably Specialty and Property driven by continued positive rate change and strong new business production.
|
|||||
|
This increase was partially offset by lower production in Personal Insurance ($53 million). The declines in Warranty and Personal Auto were partially offset by growth in Travel and Accident & Health.
|
|||||
|
98
|
AIG | Second Quarter 2022 Form 10-Q
|
||||
|
International Net Premiums Written
Six Months Ended June 30,
(in millions)
|
||
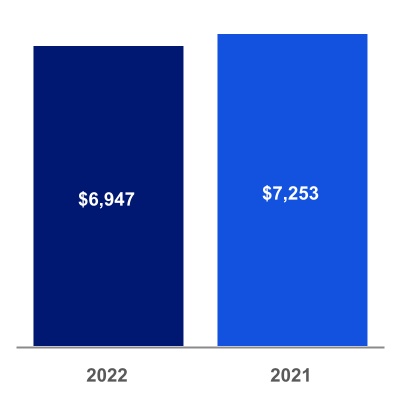
|
Year-to-Date 2022 and 2021 Comparison
|
|||||
|
Net premiums written, excluding the impact of unfavorable foreign exchange ($471 million), increased by $165 million due to growth in Commercial Lines ($290 million), notably Financial Lines, Specialty and Property driven by continued positive rate change and strong new business production.
|
|||||
|
This increase was partially offset by lower production in Personal Insurance ($125 million). The declines in Warranty and Personal Auto were partially offset by growth in Travel and Accident & Health.
|
|||||
|
International Underwriting Income (Loss)
Three Months Ended June 30,
(in millions)
|
||

|
Quarterly 2022 and 2021 Comparison
|
|||||
|
Underwriting income increased by $99 million primarily due to:
|
|||||
|
•
improvement in the accident year loss ratio, as adjusted (1.7 points) primarily driven by changes in business mix along with continued positive rate change, focused risk selection and improved terms and conditions;
|
|||||
|
•
a lower expense ratio (1.3 points), including a lower acquisition ratio (1.1 points) primarily driven by changes in business mix, improved commission terms and reinsurance program changes, as well as a lower general operating expense ratio (0.2 points), which reflects continued general expense discipline; and
|
|||||
|
•
higher net favorable prior year reserve development in 2022 (0.8 points or $36 million), primarily as a result of improvement in Commercial Property
|
|||||
|
These increases were partially offset by higher catastrophe losses (0.5 points or $12 million).
|
|||||
|
International Underwriting Income (Loss)
Six Months Ended June 30,
(in millions)
|
||

|
Year-to-Date 2022 and 2021 Comparison
|
|||||
|
Underwriting income increased by $14 million primarily due to:
|
|||||
|
•
a lower expense ratio (1.4 points), including a lower acquisition ratio (1.1 points) primarily driven by changes in business mix, improved commission terms and reinsurance program changes, as well as a lower general operating expense ratio (0.3 points), which reflects continued general expense discipline;
|
|||||
|
•
improvement in the accident year loss ratio, as adjusted (0.8 points) primarily driven by changes in business mix along with continued positive rate change, focused risk selection and improved terms and conditions; and
|
|||||
|
•
net favorable prior year reserve development in 2022 compared to net adverse prior year reserve development in 2021 (0.7 points or $56 million), primarily as a result of favorable development across Personal Insurance and improvement in Commercial Property
|
|||||
|
These increases were partially offset by higher catastrophe losses (2.5 points or $174 million).
|
|||||
|
AIG | Second Quarter 2022 Form 10-Q
|
99
|
||||
|
International Combined Ratios
Three Months Ended June 30,
|
||
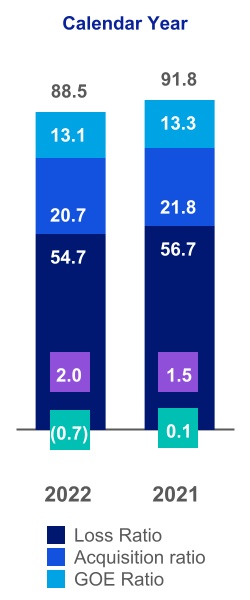
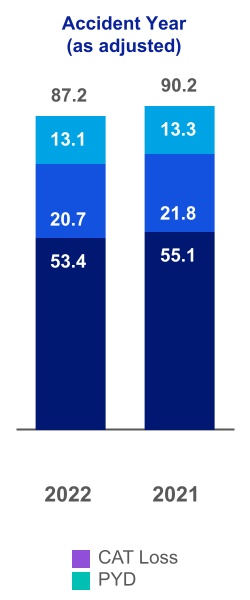
|
Quarterly 2022 and 2021 Comparison
|
|||||
|
The decrease in the calendar year combined ratio of 3.3 points reflected a decrease in both the loss ratio (2.0 points) and the expense ratio (1.3 points).
|
|||||
|
The decrease in the loss ratio of 2.0 points reflected:
|
|||||
|
•
improvement in the accident year loss ratio, as adjusted (1.7 points) primarily driven by changes in business mix along with continued positive rate change, focused risk selection and improved terms and conditions;
|
|||||
|
•
net favorable prior year reserve development in 2022 compared to net adverse prior year development in 2021 (0.8 points), primarily as a result of improvement in Commercial Property; partially offset by
|
|||||
|
•
higher catastrophe losses (0.5 points)
|
|||||
|
The decrease in the expense ratio of 1.3 points reflected a lower acquisition ratio (1.1 points) primarily driven by changes in business mix, improved commission terms and reinsurance program changes, as well as a lower general operating expense ratio (0.2 points), which reflects continued general expense discipline.
|
|||||
|
International Combined Ratios
Six Months Ended June 30,
|
||
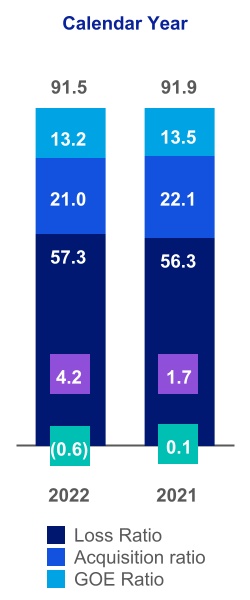
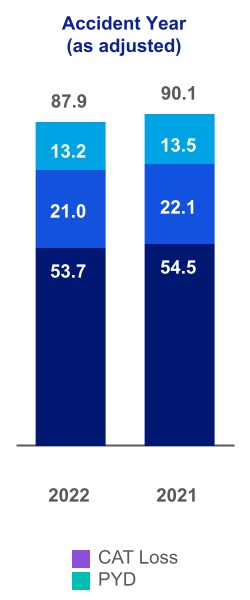
|
Year-to-Date 2022 and 2021 Comparison
|
|||||
|
The decrease in the calendar year combined ratio of 0.4 points reflected a decrease in expense ratio (1.4 points) partially offset by an increase in loss ratio (1.0 points).
|
|||||
|
The decrease in the expense ratio of 1.4 points reflected:
|
|||||
|
•
lower acquisition ratio (1.1 points) primarily driven by changes in business mix, improved commission terms and reinsurance program changes; and
|
|||||
|
•
lower general operating expense ratio (0.3 points) which reflects continued general expense discipline
|
|||||
|
The increase in the loss ratio of 1.0 points reflected:
|
|||||
|
•
higher catastrophe losses (2.5 points); partially offset by
|
|||||
|
•
improvement in the accident year loss ratio, as adjusted (0.8 points) primarily driven by changes in business mix along with continued positive rate change, focused risk selection and improved terms and conditions; and
|
|||||
|
•
net favorable prior year reserve development in 2022 compared to net adverse prior year reserve development in 2021 (0.7 points), primarily as a result of favorable development across Personal Insurance and improvement in Commercial Property
|
|||||
|
100
|
AIG | Second Quarter 2022 Form 10-Q
|
||||
|
Life and Retirement
|
||
|
Life and Retirement consists of four operating segments: Individual Retirement, Group Retirement, Life Insurance and Institutional Markets. We offer a broad portfolio of products in the U.S. through a multichannel distribution network and life and health products in the UK and Ireland.
|
||
| PRODUCTS AND DISTRIBUTION | ||
|
|
Variable
Annuities:
Products include variable annuities that offer a combination of growth potential, death benefit features and income protection features. Variable annuities are distributed primarily through banks, wirehouses, and regional and independent broker-dealers.
|
||||
|
Fixed Index
Annuities
: Products include fixed index annuities that provide growth potential based in part on the performance of a market index as well as optional living guaranteed features that provide lifetime income protection. Fixed index annuities are distributed primarily through banks, broker-dealers, independent marketing organizations and independent insurance agents.
|
|||||
|
Fixed
Annuities
: Products include single premium fixed annuities, immediate annuities and deferred income annuities. Certain fixed deferred annuity products offer optional income protection features. The fixed annuities product line maintains an industry-leading position in the U.S. bank distribution channel by designing products collaboratively with banks and offering an efficient and flexible administration platform.
|
|||||
|
Retail
Mutual
Funds:
Included our mutual fund offerings and related administration and servicing operations. Retail Mutual Funds were distributed primarily through broker-dealers. On July 16, 2021, the Company sold certain assets of the AIG Retail Mutual Funds business.
For additional information on the Sale of Certain Assets of the Retail Mutual Funds Business, see Executive Summary – Overview.
|
|||||
|
|
Group Retirement:
Products and services consist of record-keeping, plan administrative and compliance services, financial planning and advisory solutions offered to employer defined contribution plans and their participants, along with proprietary and non-proprietary annuities and advisory and brokerage products offered outside of plans.
|
||||
| AIG Retirement Services offers its products and services through The Variable Annuity Life Insurance Company and its subsidiaries, VALIC Financial Advisors, Inc. and VALIC Retirement Services Company. | |||||
| AIG Retirement Services career financial advisors serve individual clients, including in-plan enrollment support and education, and comprehensive financial planning services. | |||||
|
|
Life Insurance
: In the U.S., products primarily include term life and universal life insurance distributed through independent marketing organizations, independent insurance agents, financial advisors and direct marketing. International operations primarily include the distribution of life and health products in the UK and Ireland.
|
||||
|
|
Institutional Markets:
Products primarily include stable value wrap products, structured settlement and pension risk transfer annuities (direct and assumed reinsurance), corporate- and bank-owned life insurance, high net worth products and guaranteed investment contracts (GICs). Institutional Markets products are primarily distributed through specialized marketing and consulting firms and structured settlement brokers.
|
||||
|
AIG | Second Quarter 2022 Form 10-Q
|
101
|
||||
FHLB Funding Agreements
are issued through our Individual Retirement, Group Retirement and Institutional Markets operating segments. Funding agreements are issued by our U.S. Life and Retirement companies to FHLBs in their respective districts at fixed or floating rates over specified periods, which can be prepaid at our discretion. Proceeds are generally invested in fixed income securities and other suitable investments to generate spread income. These investment contracts do not have mortality or morbidity risk and are similar to GICs.
|
BUSINESS STRATEGY
|
||
Deliver client-centric solutions through our unique franchise
by bringing together a broad portfolio of life insurance, retirement and institutional products offered through an extensive, multichannel distribution network. Life and Retirement focuses on ease of doing business, offering valuable solutions, and expanding and deepening its distribution relationships across multiple channels.
Position market leading businesses to serve growing needs
by continually enhancing product solutions, service delivery and digital capabilities while using data and analytics in an innovative manner to improve customer experience.
|
Individual Retirement
will continue to capitalize on the opportunity to meet consumer demand for guaranteed income by maintaining innovative variable and fixed index annuity products, while also managing risk from guarantee features through risk-mitigating product design and well-developed economic hedging capabilities.
Our fixed annuity products provide diversity in our annuity product suite by offering stable returns for retirement savings.
|
Group Retirement
continues to enhance its technology platform to improve the customer experience for plan sponsors and individual participants
.
AIG Retirement Services’ self-service tools paired with its career financial advisors provide a compelling service platform. Group Retirement’s strategy also involves providing financial planning services for its clients and meeting their need for income in retirement. In this advisory role, Group Retirement’s clients may invest in assets in which AIG or a third-party is custodian.
|
||||||||||||||||
|
Life Insurance
in the U.S. will continue to position itself for growth and changing market dynamics while continuing to execute strategies to enhance returns. Our focus is on materializing success from a multi-year effort of building state-of-the-art platforms and underwriting innovations, which are expected to bring process improvements and cost efficiencies.
In the UK, AIG Life Insurance will continue to focus on growing the business organically and through potential acquisition opportunities.
|
Institutional Markets
continues to grow its assets under management across multiple product lines, including stable value wrap, GICs and pension risk transfer annuities. Our growth strategy is opportunistic and allows us to pursue select transactions that meet our risk-adjusted return requirements.
|
||||||||||||||||
Enhance Operational Effectiveness
by simplifying processes and operating environments to increase competitiveness, improve service and product capabilities and facilitate delivery of our target customer experience. We continue to invest in technology to improve operating efficiency and ease of doing business for our distribution partners and customers. We believe that simplifying our operating models will enhance productivity and support further profitable growth.
Manage our Balance Sheet
through a rigorous approach to our products and portfolio. We match our product design and high-quality investments with our asset and liability exposures to support our cash and liquidity needs under various operating scenarios.
Deliver Value Creation and Manage Capital
by striving to deliver solid earnings and returns on capital through disciplined pricing, sustainable underwriting improvements, expense efficiency, and diversification of risk, while optimizing capital allocation and efficiency within insurance entities to enhance return on common equity.
|
102
|
AIG | Second Quarter 2022 Form 10-Q
|
||||
|
COMPETITION AND CHALLENGES
|
||
Life and Retirement operates in the highly competitive insurance and financial services industry in the U.S. and select international markets, competing against various financial services companies, including banks and other life insurance and mutual fund companies. Competition is primarily based on product pricing and design, distribution, financial strength, customer service and ease of doing business.
Our business remains competitive due to its long-standing market leading positions, innovative products, distribution relationships across multiple channels, customer- focused service and strong financial ratings.
Our primary challenges include:
•
Managing a rising rate environment. While a rising rate environment improves yields on new investment, improves margins on our business, and increases sales in certain products such as fixed annuities, it may also result in increased competition for certain products resulting in a need to increase crediting rates, and has resulted in lower separate account asset values for investments in fixed income which has reduced fee income;
•
increased competition in our primary markets, including aggressive pricing of annuities by competitors, increased competition and consolidation of employer groups in the group retirement planning market, and competitors with different profitability targets in the pension risk transfer space as well as other product lines;
•
increasingly complex new and proposed regulatory requirements, which have affected industry growth and costs; and
•
upgrading our technology and underwriting processes while managing general operating expenses.
|
OUTLOOK–INDUSTRY AND ECONOMIC FACTORS
|
||
Below is a discussion of the industry and economic factors impacting our specific operating segments:
The worldwide health and economic impact of COVID-19 continues to evolve, influenced by the scope, severity and duration of the pandemic, including resurgences and variants of the virus as well as the distribution and effectiveness of vaccinations.
On October 26, 2020, AIG announced its intention to separate its Life and Retirement business from AIG. On November 2, 2021, AIG and Blackstone completed the acquisition by Blackstone of a 9.9 percent equity stake in Corebridge, which is the holding company for AIG’s Life and Retirement business. On November 1, 2021, Corebridge declared a dividend payable to AIG Parent in the amount of $8.3 billion. In connection with such dividend, Corebridge issued a promissory note to AIG Parent in the amount of $8.3 billion, which is required to be paid to AIG Parent prior to the IPO of Corebridge. On April 5, 2022, Corebridge issued senior unsecured notes in the aggregate principal amount of $6.5 billion, the proceeds of which were used to repay a portion of the $8.3 billion promissory note previously issued by Corebridge to AIG. While we currently believe the IPO is the next step in the separation of the Life and Retirement business from AIG, no assurance can be given regarding the form that future separation transactions may take or the specific terms or timing thereof, or that a separation will in fact occur. Any separation transaction will be subject to the satisfaction of various conditions and approvals, including approval by the AIG Board of Directors, receipt of insurance and other required regulatory approvals, and satisfaction of any applicable requirements of the SEC.
On December 15, 2021, AIG and BREIT, a long-term, perpetual capital vehicle affiliated with Blackstone, completed the acquisition by BREIT of AIG’s interests in a U.S. affordable housing portfolio. The historical results of the U.S. affordable housing portfolio were reported in our Life and Retirement operating segments.
For additional information on the separation of Life and Retirement please see Note 1 to the Condensed Consolidated Financial Statements and the 2021 Annual Report, Part I, Item 1A. Risk Factors – Business and Operations – “No assurances can be given that the separation of our Life and Retirement business will occur or as to the specific terms or timing thereof. In addition, the separation could cause the emergence or exacerbate the effects of other risks to which AIG is exposed.”
|
AIG | Second Quarter 2022 Form 10-Q
|
103
|
||||
Individual Retirement
Increasing life expectancy and reduced expectations for traditional retirement income from defined benefit programs and fixed income securities are leading Americans to seek additional financial security as they approach retirement. The strong demand for individual index and fixed deferred annuities with guaranteed income features has attracted increased competition in this product space. In response to the low interest rate environment that prevailed over the past several years we have developed guaranteed income benefits for variable, fixed index, and fixed deferred annuities with margins that are less sensitive to the level of interest rates.
Changes in the capital markets (interest rate environment, credit spreads, equity markets, volatility) can have a significant impact on sales, surrender rates, investment returns, guaranteed income features, and net investment spreads in the annuity industry.
Group Retirement
Group Retirement competes in the defined contribution market under the AIG Retirement Services brand. AIG Retirement Services is a leading retirement plan provider in the U.S. for K-12 schools and school districts, higher education, healthcare, government and other not-for-profit institutions. The defined contribution market is a highly efficient and competitive market that requires support for both plan sponsors and individual participants. To meet this challenge, AIG Retirement Services is investing in a client- focused technology platform to support improved compliance and self-service functionality. AIG Retirement Services’ model pairs self-service tools with its career financial advisors who provide individual plan participants with enrollment support and comprehensive financial planning services.
Changes in the interest rates, credit spreads and equity market environment can have a significant impact on investment returns, fee income, advisory and other income, guaranteed income features, and net investment spreads, and a moderate impact on sales and surrender rates.
Life Insurance
Consumers have a significant need for life insurance, whether it is used for income replacement for their surviving family, estate planning or wealth transfer. Additionally, consumers use life insurance to provide living benefits in case of chronic, critical or terminal illnesses, and to supplement retirement income.
In response to consumer needs and a low interest rate environment, our Life Insurance product portfolio will continue to promote products with less long-duration interest rate risk and mitigate exposure to products that have long-duration interest rate risk through sales levels and hedging strategies.
As life insurance ownership remains at historical lows in the U.S. and the UK, efforts to expand the reach and increase the affordability of life insurance are critical. The industry is investing in consumer-centric efforts to reduce traditional barriers to securing life protection by simplifying the sales and service experience. Digitally enabled processes and tools provide a fast, friendly and simple path to life insurance protection.
Institutional Markets
Institutional Markets serves a variety of needs for corporate clients. Demand is driven by a number of factors including the macroeconomic and regulatory environment. We expect to see continued growth in the pension risk transfer market (direct and assumed reinsurance) as corporate plan sponsors look to transfer asset or liability, longevity, administrative and operational risks associated with their defined benefit plans.
Changes in interest rates and credit spreads can have a significant impact on investment returns and net investment spreads, impacting organic growth opportunities.
For additional information on the impact of market interest rate movement on our Life and Retirement business see Executive Summary – AIG’s Outlook – Industry and Economic Factors – Impact of Changes in the Interest Rate Environment and Equity Markets.
|
104
|
AIG | Second Quarter 2022 Form 10-Q
|
||||
|
|
||
LIFE AND RETIREMENT RESULTS
| Three Months Ended June 30, |
Percentage
Change |
Six Months Ended
June 30, |
Percentage
Change |
||||||||||||||||||||||||||||||||||||||
| (in millions) | 2022 | 2021 | 2022 | 2021 | |||||||||||||||||||||||||||||||||||||
| Adjusted revenues: | |||||||||||||||||||||||||||||||||||||||||
| Premiums | $ | 1,119 | $ | 1,645 | (32) | % | $ | 1,959 | $ | 2,245 | (13) | % | |||||||||||||||||||||||||||||
| Policy fees | 743 | 772 | (4) | 1,506 | 1,555 | (3) | |||||||||||||||||||||||||||||||||||
| Net investment income | 1,989 | 2,376 | (16) | 4,118 | 4,729 | (13) | |||||||||||||||||||||||||||||||||||
| Advisory fee and other income | 204 | 253 | (19) | 437 | 497 | (12) | |||||||||||||||||||||||||||||||||||
| Total adjusted revenues | 4,055 | 5,046 | (20) | 8,020 | 9,026 | (11) | |||||||||||||||||||||||||||||||||||
| Benefits, losses and expenses: | |||||||||||||||||||||||||||||||||||||||||
| Policyholder benefits and losses incurred | 1,654 | 2,223 | (26) | 3,097 | 3,480 | (11) | |||||||||||||||||||||||||||||||||||
| Interest credited to policyholder account balances | 906 | 882 | 3 | 1,773 | 1,752 | 1 | |||||||||||||||||||||||||||||||||||
| Amortization of deferred policy acquisition costs | 301 | 168 | 79 | 581 | 393 | 48 | |||||||||||||||||||||||||||||||||||
| Non deferrable insurance commissions | 166 | 146 | 14 | 327 | 303 | 8 | |||||||||||||||||||||||||||||||||||
| Advisory fee expenses | 65 | 85 | (24) | 136 | 168 | (19) | |||||||||||||||||||||||||||||||||||
| General operating expenses | 395 | 383 | 3 | 808 | 796 | 2 | |||||||||||||||||||||||||||||||||||
| Interest expense | 5 | 35 | (86) | 11 | 69 | (84) | |||||||||||||||||||||||||||||||||||
| Total benefits, losses and expenses | 3,492 | 3,922 | (11) | 6,733 | 6,961 | (3) | |||||||||||||||||||||||||||||||||||
| Adjusted pre-tax income | $ | 563 | $ | 1,124 | (50) | % | $ | 1,287 | $ | 2,065 | (38) | % | |||||||||||||||||||||||||||||
Our insurance companies generate significant revenues from investment activities. As a result, the operating segments in Life and Retirement are significantly impacted by variances in net investment income on the asset portfolios that support insurance liabilities and surplus.
For additional information on our investment strategy, asset-liability management process and invested asset composition see Investments.
|
AIG | Second Quarter 2022 Form 10-Q
|
105
|
||||
INDIVIDUAL RETIREMENT RESULTS
| Three Months Ended June 30, |
Percentage
Change |
Six Months Ended June 30, |
Percentage
Change |
||||||||||||||||||||||||||||||||||||||||||||
| (in millions) | 2022 | 2021 | 2022 | 2021 | |||||||||||||||||||||||||||||||||||||||||||
| Adjusted revenues: | |||||||||||||||||||||||||||||||||||||||||||||||
| Premiums | $ | 57 | $ | 32 | 78 | % | $ | 112 | $ | 57 | 96 | % | |||||||||||||||||||||||||||||||||||
| Policy fees | 210 | 241 | (13) | 434 | 473 | (8) | |||||||||||||||||||||||||||||||||||||||||
| Net investment income | 906 | 1,089 | (17) | 1,889 | 2,157 | (12) | |||||||||||||||||||||||||||||||||||||||||
| Advisory fee and other income | 115 | 157 | (27) | 238 | 309 | (23) | |||||||||||||||||||||||||||||||||||||||||
| Total adjusted revenues | 1,288 | 1,519 | (15) | 2,673 | 2,996 | (11) | |||||||||||||||||||||||||||||||||||||||||
| Benefits and expenses: | |||||||||||||||||||||||||||||||||||||||||||||||
| Policyholder benefits and losses incurred | 190 | 95 | 100 | 329 | 211 | 56 | |||||||||||||||||||||||||||||||||||||||||
| Interest credited to policyholder account balances | 462 | 433 | 7 | 904 | 859 | 5 | |||||||||||||||||||||||||||||||||||||||||
| Amortization of deferred policy acquisition costs | 202 | 108 | 87 | 379 | 241 | 57 | |||||||||||||||||||||||||||||||||||||||||
| Non deferrable insurance commissions | 86 | 89 | (3) | 178 | 177 | 1 | |||||||||||||||||||||||||||||||||||||||||
| Advisory fee expenses | 35 | 54 | (35) | 72 | 106 | (32) | |||||||||||||||||||||||||||||||||||||||||
| General operating expenses | 107 | 107 | — | 218 | 221 | (1) | |||||||||||||||||||||||||||||||||||||||||
| Interest expense | 2 | 16 | (88) | 5 | 32 | (84) | |||||||||||||||||||||||||||||||||||||||||
| Total benefits, losses and expenses | 1,084 | 902 | 20 | 2,085 | 1,847 | 13 | |||||||||||||||||||||||||||||||||||||||||
| Adjusted pre-tax income | $ | 204 | $ | 617 | (67) | % | $ | 588 | $ | 1,149 | (49) | % | |||||||||||||||||||||||||||||||||||
| Fixed annuities base net investment spread: | |||||||||||||||||||||||||||||||||||||||||||||||
| Base yield* | 3.74 | % | 4.02 | % | (28) | bps | 3.75 | % | 4.00 | % | (25) | bps | |||||||||||||||||||||||||||||||||||
| Cost of funds | 2.59 | 2.58 | 1 | 2.58 | 2.60 | (2) | |||||||||||||||||||||||||||||||||||||||||
| Fixed annuities base net investment spread | 1.15 | % | 1.44 | % | (29) | bps | 1.17 | % | 1.40 | % | (23) | bps | |||||||||||||||||||||||||||||||||||
| Variable and fixed index annuities base net investment spread: | |||||||||||||||||||||||||||||||||||||||||||||||
| Base yield* | 3.78 | % | 3.96 | % | (18) | bps | 3.76 | % | 3.89 | % | (13) | bps | |||||||||||||||||||||||||||||||||||
| Cost of funds | 1.42 | 1.32 | 10 | 1.40 | 1.31 | 9 | |||||||||||||||||||||||||||||||||||||||||
| Variable and fixed index annuities base net investment spread | 2.36 | % | 2.64 | % | (28) | bps | 2.36 | % | 2.58 | % | (22) | bps | |||||||||||||||||||||||||||||||||||
*
Includes returns from base portfolio including accretion and income (loss) from certain other invested assets.
Business and Financial Highlights
For the three-month period ended June 30, 2022, Premiums and deposits decreased $358 million compared to the same period in the prior year, primarily driven by lower variable annuity sales, due to market volatility and less competitive pricing versus peers, partially offset by higher fixed annuity sales due to more competitive pricing versus peers and higher interest rates. For the six-month period ended June 30, 2022, Premiums and deposits increased $150 million compared to the same period in the prior year, primarily driven by improved fixed annuity sales, partially offset by lower variable annuity sales. Net flows improved in the three- and six-month periods ended June 30, 2022 compared to the same periods in the prior year primarily due to higher fixed annuity sales, as well as lower annuity surrenders and withdrawals and no retail mutual fund net flows due to the sale and liquidation of the Retail Mutual Fund business in the third quarter of 2021 compared to outflows in the same periods in the prior year.
Adjusted pre-tax income decreased $413 million and $561 million in the three- and six-month periods ended June 30, 2022, respectively, compared to the same periods in the prior year primarily due to lower net investment income ($183 million and $268 million). In addition, decreases in the equity markets and increases in interest rates resulted in lower variable annuity separate account assets that contributed to the acceleration of DAC amortization and higher policyholder benefits net of premiums ($164 million and $201 million) compared to the same periods in the prior year, and lower policy and advisory fee income, net of advisory fee expenses ($54 million and $76 million).
|
106
|
AIG | Second Quarter 2022 Form 10-Q
|
||||
Individual Retirement Adjusted Pre-Tax Income (Loss)
Three Months Ended June 30,
(in millions)
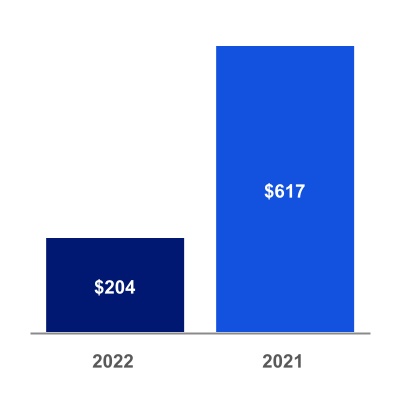
|
Quarterly 2022 and 2021 Comparison
|
|||||
|
Adjusted pre-tax income decreased $413 million primarily due to:
|
|||||
|
•
lower net investment income ($183 million) primarily driven by lower yield enhancement income ($78 million) primarily due to lower call and tender income, as well as higher losses on securities for which the fair value option was elected, lower alternative investment income ($95 million) and lower base portfolio income ($10 million) driven by decreased reinvestment rates;
|
|||||
|
•
higher DAC amortization and policyholder benefits net of premiums ($164 million) primarily due to lower variable annuity separate account returns; and
|
|||||
|
•
lower policy and advisory fee income, net of advisory fee expenses ($54 million), primarily due to a decrease in variable annuity separate account assets driven by negative equity market performance.
|
|||||
Individual Retirement Adjusted Pre-Tax Income (Loss)
Six Months Ended June 30,
(in millions)

|
Year-to-Date 2022 and 2021 Comparison
|
|||||
|
Adjusted pre-tax income decreased $561 million primarily due to:
|
|||||
|
•
lower net investment income ($268 million) primarily driven by lower yield enhancement income ($139 million) primarily due to lower call and tender income, as well as higher losses on securities for which the fair value option was elected, lower alternative investment income ($108 million) and lower base portfolio income ($21 million) driven by decreased reinvestment rates;
|
|||||
|
•
higher DAC amortization and policyholder benefits net of premiums ($201 million) primarily due to lower variable annuity separate account returns; and
|
|||||
|
•
lower policy and advisory fee income, net of advisory fee expenses ($76 million), primarily due to a decrease in variable annuity separate account assets driven by negative equity market performance.
|
|||||
INDIVIDUAL RETIREMENT GAAP PREMIUMS, PREMIUMS AND DEPOSITS, SURRENDERS AND NET FLOWS
Premiums and deposits are a non-GAAP financial measure that includes, in addition to direct and assumed premiums, deposits received on investment-type annuity contracts, FHLB funding agreements and mutual funds under administration.
Net flows for annuity products in Individual Retirement represent premiums and deposits less death, surrender and other withdrawal benefits. Net flows for mutual funds represent deposits less withdrawals.
The following table presents a reconciliation of Individual Retirement GAAP premiums to premiums and deposits:
| Three Months Ended | Six Months Ended | ||||||||||||||||||||||||||||
| June 30, | June 30, | ||||||||||||||||||||||||||||
| (in millions) | 2022 | 2021 | 2022 | 2021 | |||||||||||||||||||||||||
| Premiums | $ | 57 | $ | 32 | $ | 112 | $ | 57 | |||||||||||||||||||||
| Deposits | 3,566 | 3,949 | 7,396 | 7,298 | |||||||||||||||||||||||||
| Other | (3) | (3) | (7) | (4) | |||||||||||||||||||||||||
| Premiums and deposits | $ | 3,620 | $ | 3,978 | $ | 7,501 | $ | 7,351 | |||||||||||||||||||||
|
AIG | Second Quarter 2022 Form 10-Q
|
107
|
||||
The following table presents surrenders as a percentage of average reserves:
| Three Months Ended | Six Months Ended | ||||||||||||||||||||||||||||
| June 30, | June 30, | ||||||||||||||||||||||||||||
| 2022 | 2021 | 2022 | 2021 | ||||||||||||||||||||||||||
| Surrenders as a percentage of average reserves | |||||||||||||||||||||||||||||
| Fixed annuities | 7.9 | % | 8.0 | % | 7.3 | % | 7.5 | % | |||||||||||||||||||||
| Variable annuities | 6.3 | 7.3 | 6.4 | 7.1 | |||||||||||||||||||||||||
| Fixed index annuities | 4.0 | 4.6 | 4.0 | 4.7 | |||||||||||||||||||||||||
The following table presents reserves for fixed annuities and variable and fixed index annuities by surrender charge category:
| June 30, 2022 | December 31, 2021 | ||||||||||||||||||||||||||||||||||||||||
| (in millions) | Fixed Annuities | Fixed Index Annuities | Variable Annuities | Fixed Annuities | Fixed Index Annuities | Variable Annuities | |||||||||||||||||||||||||||||||||||
| No surrender charge | $ | 25,620 | $ | 1,810 | $ | 28,085 | $ | 26,419 | $ | 2,009 | $ | 34,030 | |||||||||||||||||||||||||||||
| Greater than 0% - 2% | 2,464 | 1,490 | 8,209 | 2,091 | 1,681 | 10,926 | |||||||||||||||||||||||||||||||||||
| Greater than 2% - 4% | 2,140 | 3,634 | 6,056 | 2,424 | 4,195 | 9,884 | |||||||||||||||||||||||||||||||||||
| Greater than 4% | 17,690 | 23,876 | 12,847 | 16,443 | 22,489 | 13,219 | |||||||||||||||||||||||||||||||||||
| Non-surrenderable | 2,386 | — | — | 2,373 | — | — | |||||||||||||||||||||||||||||||||||
| Total reserves | $ | 50,300 | $ | 30,810 | $ | 55,197 | $ | 49,750 | $ | 30,374 | $ | 68,059 | |||||||||||||||||||||||||||||
Individual Retirement annuities are typically subject to a three- to seven-year surrender charge period, depending on the product. For fixed and fixed index annuities, the proportion of reserves subject to surrender charge at June 30, 2022 increased compared to December 31, 2021 primarily due to growth in business. The increase in the proportion of reserves with no surrender charge for variable annuities as of June 30, 2022 compared to December 31, 2021 was principally due to normal aging of business.
|
108
|
AIG | Second Quarter 2022 Form 10-Q
|
||||
A discussion of the significant variances in premiums and deposits and net flows for each product line follows:
Individual Retirement Premiums and Deposits (P&D) and Net Flows
Three Months Ended June 30,
(in millions)
| P&D | Net Flows | ||||
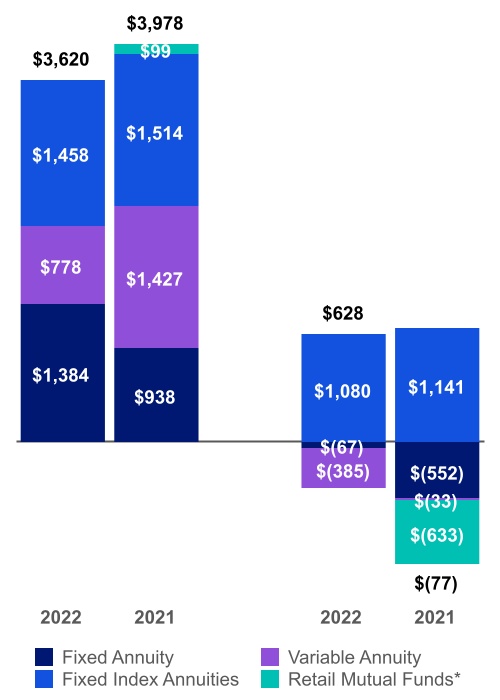
|
Quarterly 2022 and 2021 Comparison
|
|||||
|
•
Fixed Annuities
Net outflows decreased ($485 million) over the prior year, primarily due to higher premiums and deposits ($446 million) due to more competitive pricing versus peers and higher interest rates, lower surrenders, withdrawals and death benefits ($39 million).
|
|||||
|
•
Variable Annuities
Net flows deteriorated ($352 million) primarily due to lower premium and deposits ($649 million) due to market volatility and less competitive pricing versus peers, partially offset by lower surrenders and withdrawals ($268 million) and lower death benefits ($29 million).
|
|||||
|
•
Fixed Index Annuities
Net flows decreased ($61 million) primarily due to lower premiums and deposits ($56 million) and higher death benefits ($11 million), partially offset by lower surrenders and withdrawals ($6 million).
|
|||||
|
•
Retail Mutual Funds
There were no flows in 2022 due to the Touchstone sale in the third quarter of 2021.
|
|||||
|
For additional information regarding the sale of certain assets of the AIG Life and Retirement Retail Mutual Funds business, see Note 1 to the Condensed Consolidated Financial Statements
.
|
|||||
|
*
In 2021, Retail Mutual Fund premiums and deposits and net flows reflects customer activity of the funds that were transferred or liquidated in the third quarter of 2021.
|
||
|
AIG | Second Quarter 2022 Form 10-Q
|
109
|
||||
Individual Retirement Premiums and Deposits (P&D) and Net Flows
Six Months Ended June 30,
(in millions)
| P&D | Net Flows | ||||
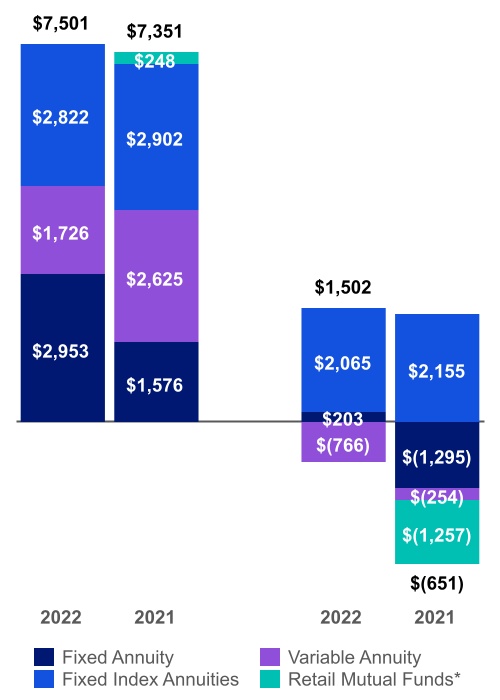
|
Year-to-Date 2022 and 2021 Comparison
|
|||||
|
•
Fixed Annuities
Net flows turned positive and improved ($1.5 billion) over the prior year, primarily due to higher premiums and deposits ($1.4 billion) due to more competitive pricing versus peers and higher interest rates, lower surrenders and withdrawals ($56 million) and lower death benefits ($65 million).
|
|||||
|
•
Variable Annuities
Net flows deteriorated ($512 million) primarily due to lower premium and deposits ($899 million), due to market volatility and less competitive pricing versus peers,
partially offset by lower surrenders and withdrawals ($344 million) and lower death benefits ($43 million).
|
|||||
|
•
Fixed Index Annuities
Net flows decreased ($90 million) primarily due to lower premiums and deposits ($80 million) and higher death benefits ($20 million), partially offset by lower surrenders and withdrawals ($10 million).
|
|||||
|
•
Retail Mutual Funds
There were no flows in 2022 due to the Touchstone sale in the second quarter of 2021.
|
|||||
| For additional information regarding the sale of certain assets of the AIG Life and Retirement Retail Mutual Funds business, see Note 1 to the Condensed Consolidated Financial Statements. | |||||
|
*
In 2021, Retail Mutual Fund premiums and deposits and net flows reflects customer activity of the funds that were transferred or liquidated in the third quarter of 2021.
|
||
|
110
|
AIG | Second Quarter 2022 Form 10-Q
|
||||
GROUP RETIREMENT RESULTS
| Three Months Ended June 30, |
Percentage
Change |
Six Months Ended June 30, |
Percentage
Change |
||||||||||||||||||||||||||||||||||||||||||||
| (in millions) | 2022 | 2021 | 2022 | 2021 | |||||||||||||||||||||||||||||||||||||||||||
| Adjusted revenues: | |||||||||||||||||||||||||||||||||||||||||||||||
| Premiums | $ | 5 | $ | 4 | 25 | % | $ | 13 | $ | 8 | 63 | % | |||||||||||||||||||||||||||||||||||
| Policy fees | 114 | 130 | (12) | 238 | 254 | (6) | |||||||||||||||||||||||||||||||||||||||||
| Net investment income | 490 | 605 | (19) | 1,017 | 1205 | (16) | |||||||||||||||||||||||||||||||||||||||||
| Advisory fee and other income | 73 | 81 | (10) | 158 | 159 | (1) | |||||||||||||||||||||||||||||||||||||||||
| Total adjusted revenues | 682 | 820 | (17) | 1,426 | 1626 | (12) | |||||||||||||||||||||||||||||||||||||||||
| Benefits and expenses: | |||||||||||||||||||||||||||||||||||||||||||||||
| Policyholder benefits and losses incurred | 27 | 8 | 238 | 54 | 26 | 108 | |||||||||||||||||||||||||||||||||||||||||
| Interest credited to policyholder account balances | 286 | 287 | — | 567 | 570 | (1) | |||||||||||||||||||||||||||||||||||||||||
| Amortization of deferred policy acquisition costs | 33 | 13 | 154 | 63 | 29 | 117 | |||||||||||||||||||||||||||||||||||||||||
| Non deferrable insurance commissions | 30 | 18 | 67 | 58 | 47 | 23 | |||||||||||||||||||||||||||||||||||||||||
| Advisory fee expenses | 30 | 31 | (3) | 64 | 62 | 3 | |||||||||||||||||||||||||||||||||||||||||
| General operating expenses | 111 | 106 | 5 | 228 | 219 | 4 | |||||||||||||||||||||||||||||||||||||||||
| Interest expense | 1 | 10 | (90) | 3 | 19 | (84) | |||||||||||||||||||||||||||||||||||||||||
| Total benefits, losses and expenses | 518 | 473 | 10 | 1,037 | 972 | 7 | |||||||||||||||||||||||||||||||||||||||||
| Adjusted pre-tax income | $ | 164 | $ | 347 | (53) | % | $ | 389 | $ | 654 | (41) | % | |||||||||||||||||||||||||||||||||||
| Base net investment spread: | |||||||||||||||||||||||||||||||||||||||||||||||
| Base yield* | 3.92 | % | 4.17 | % | (25) | bps | 3.90 | % | 4.14 | % | (24) | bps | |||||||||||||||||||||||||||||||||||
| Cost of funds | 2.58 | 2.61 | (3) | 2.58 | 2.61 | (3) | |||||||||||||||||||||||||||||||||||||||||
| Base net investment spread | 1.34 | % | 1.56 | % | (22) | bps | 1.32 | % | 1.53 | % | (21) | bps | |||||||||||||||||||||||||||||||||||
*
Includes returns from base portfolio including accretion and income (loss) from certain other invested assets.
Business and Financial Highlights
Group Retirement is focused on implementing initiatives to grow its business. Premiums and deposits decreased $483 million and $413 million in the three- and six-month periods ended June 30, 2022 compared to the same periods in the prior year. Net flows deteriorated by $319 million and $245 million in the three- and six-month periods ended June 30, 2022 compared to the same periods in 2021.
Adjusted pre-tax income decreased $183 million and $265 million in the three- and six-month periods ended June 30, 2022 compared to the same periods in the prior year primarily due to lower net investment income ($115 million and $188 million) and higher DAC amortization and policyholder benefits, net of premiums mostly due to lower equity market performance ($38 million and $57 million).
|
AIG | Second Quarter 2022 Form 10-Q
|
111
|
||||
Group Retirement Adjusted Pre-Tax Income (Loss)
Three Months Ended June 30,
(in millions)
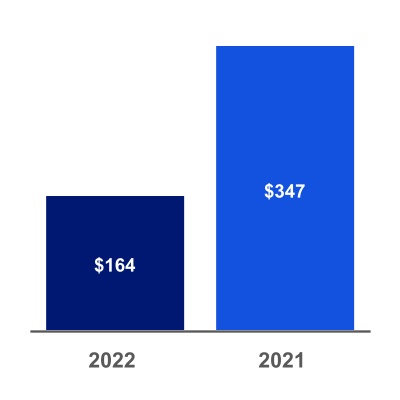
|
Quarterly 2022 and 2021 Comparison
|
|||||
|
Adjusted pre-tax income decreased $183 million primarily due to:
|
|||||
|
•
lower net investment income, net of interest credited ($112 million) primarily driven by lower alternative investment income ($49 million), lower yield enhancement income ($38 million) primarily due to lower call and tender income and lower base portfolio income net of interest credited ($25 million).
|
|||||
|
•
higher DAC amortization and policyholder benefits, net of premiums mostly due to lower equity market performance ($38 million).
|
|||||
|
•
lower policy and advisory fee income, net of advisory fee expenses of ($23 million) due to lower fee based assets under administration as a result of lower equity market performance.
|
|||||
Group Retirement Adjusted Pre-Tax Income (Loss)
Six Months Ended June 30,
(in millions)
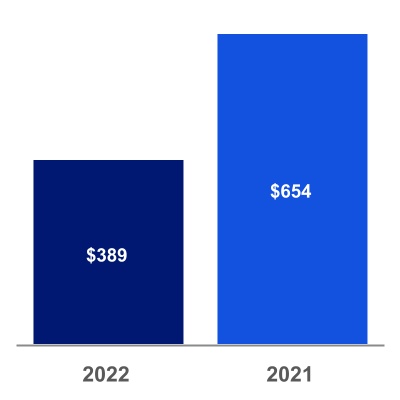
|
Year-to-Date 2022 and 2021 Comparison
|
|||||
|
Adjusted pre-tax income decreased $265 million primarily due to:
|
|||||
|
•
lower net investment income, net of interest credited ($183 million) primarily driven by lower yield enhancement income ($83 million) primarily due to lower call and tender income, lower alternative investment income ($55 million) and lower base portfolio income net of interest credited ($45 million).
|
|||||
|
•
higher DAC amortization and policyholder benefits, net of premiums mostly due to lower equity market performance ($57 million).
|
|||||
|
•
lower policy and advisory fee income, net of advisory fee expenses of $(19) million due to lower fee based assets under administration as a result of lower equity market performance.
|
|||||
GROUP RETIREMENT GAAP PREMIUMS, PREMIUMS AND DEPOSITS, SURRENDERS AND NET FLOWS
Premiums and deposits are a non-GAAP financial measure that includes, in addition to direct and assumed premiums, deposits received on investment-type annuity contracts, FHLB funding agreements and mutual funds under administration.
Net flows for annuity products included in Group Retirement represent premiums and deposits less death, surrender and other withdrawal benefits. Net flows for mutual funds represent deposits less withdrawals. Client deposits into advisory and brokerage accounts less total client withdrawals from advisory and brokerage accounts, are not included in net flows, but do contribute to growth in assets under administration and advisory fee income.
The following table presents a reconciliation of Group Retirement GAAP premiums to premiums and deposits:
| Three Months Ended June 30, | Six Months Ended June 30, | ||||||||||||||||||||||||||||
| (in millions) | 2022 | 2021 | 2022 | 2021 | |||||||||||||||||||||||||
| Premiums | $ | 5 | $ | 4 | $ | 13 | $ | 8 | |||||||||||||||||||||
| Deposits | 1,767 | 2,251 | 3,647 | 4,065 | |||||||||||||||||||||||||
|
Premiums and deposits
(a)
|
$ | 1,772 | $ | 2,255 | $ | 3,660 | $ | 4,073 | |||||||||||||||||||||
(a)
Excludes client deposits into advisory and brokerage accounts of $1.2 billion and $1.2 billion for the six months ended June 30, 2022 and 2021, respectively.
|
112
|
AIG | Second Quarter 2022 Form 10-Q
|
||||
The following table presents Group Retirement surrenders as a percentage of average reserves and mutual funds under administration:
| Three Months Ended June 30, | Six Months Ended June 30, | ||||||||||||||||||||||||||||
| 2022 | 2021 | 2022 | 2021 | ||||||||||||||||||||||||||
| Surrenders as a percentage of average reserves and mutual funds | 7.7 | % | 7.9 | % | 8.2 | % | 8.4 | % | |||||||||||||||||||||
The following table presents reserves for Group Retirement annuities by surrender charge category:
| (in millions) | June 30, 2022 |
(a)
|
December 31, 2021 |
(a)
|
||||||||||||||||
|
No surrender charge
(b)
|
$ | 71,176 | $ | 81,132 | ||||||||||||||||
| Greater than 0% - 2% | 569 | 716 | ||||||||||||||||||
| Greater than 2% - 4% | 402 | 857 | ||||||||||||||||||
| Greater than 4% | 6,214 | 6,197 | ||||||||||||||||||
| Non-surrenderable | 756 | 810 | ||||||||||||||||||
| Total reserves | $ | 79,117 | $ | 89,712 | ||||||||||||||||
(a)
Excludes mutual fund assets under administration of $23.4 billion and $28.8 billion at June 30, 2022 and December 31, 2021, respectively.
(b)
Group Retirement amounts in this category include general account reserves of approximately $4.6 billion and $4.7 billion at June 30, 2022 and December 31, 2021, respectively, which are subject to 20 percent annual withdrawal limitations at the participant level and general account reserves of
$5.8 billion
and
$5.7 billion at
June 30, 2022 and December 31, 2021, respectively, which are subject to 20 percent annual withdrawal limitations at the plan level.
Group Retirement annuity deposits are typically subject to a five- to seven-year surrender charge period, depending on the product. At June 30, 2022, Group Retirement annuity reserves with no surrender charge decreased compared to December 31, 2021 primarily due to decline in assets under management from lower equity markets.
A discussion of the significant variances in premiums and deposits and net flows follows:
Group Retirement Premiums and Deposits and Net Flows
Three Months Ended June 30,
(in millions)
| P&D | Net Flows | ||||
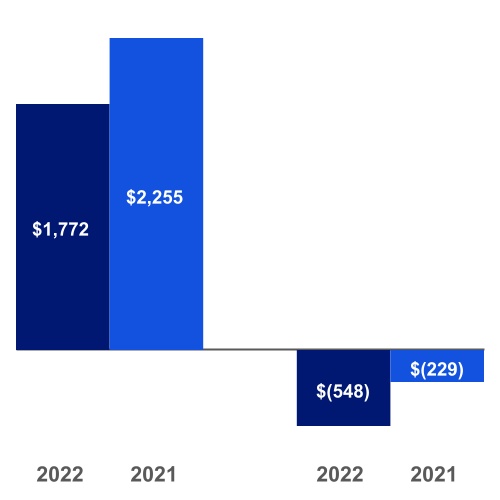
|
Quarterly 2022 and 2021 Comparison
|
|||||
|
Net flows deteriorated ($319 million) due to lower premiums and deposits ($483 million) partially offset by lower surrenders and withdrawals of $189 million. In general, net outflows are concentrated in fixed annuity products with higher contractual guaranteed minimum crediting rates. Large plan acquisitions and surrenders contributes period-to-period volatility and resulted in lower net flows of $0.5 billion compared to the same period in the prior year.
|
|||||
|
AIG | Second Quarter 2022 Form 10-Q
|
113
|
||||
Group Retirement Premiums and Deposits and Net Flows
Six Months Ended June 30,
(in millions)
| P&D | Net Flows | ||||
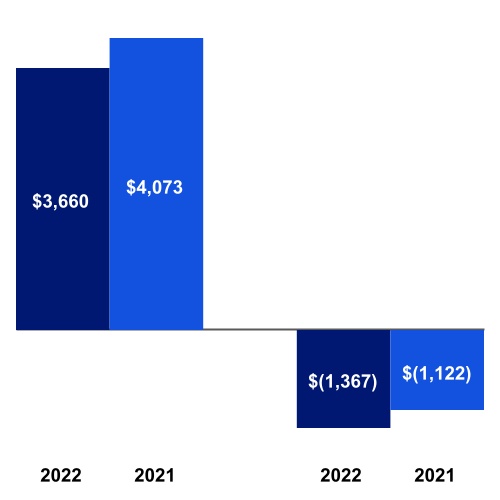
|
Year-to-Date 2022 and 2021 Comparison
|
|||||
|
Net flows deteriorated ($245 million) due to lower premiums and deposits ($413 million) partially offset by lower surrenders and withdrawals of ($200 million). In general, net outflows are concentrated in fixed annuity products with higher contractual guaranteed minimum crediting rates. Large plan acquisitions and surrenders resulted in lower net flows of $0.3 billion compared to the same period in the prior year.
|
|||||
LIFE INSURANCE RESULTS
| Three Months Ended | Six Months Ended | |||||||||||||||||||||||||||||||||||||
| June 30, | Percentage | June 30, | Percentage | |||||||||||||||||||||||||||||||||||
| (in millions) | 2022 | 2021 | Change | 2022 | 2021 | Change | ||||||||||||||||||||||||||||||||
| Adjusted revenues: | ||||||||||||||||||||||||||||||||||||||
| Premiums | $ | 561 | $ | 532 | 5 | % | $ | 1,100 | $ | 1,064 | 3 | % | ||||||||||||||||||||||||||
| Policy fees | 370 | 355 | 4 | 738 | 735 | — | ||||||||||||||||||||||||||||||||
| Net investment income | 352 | 394 | (11) | 708 | 801 | (12) | ||||||||||||||||||||||||||||||||
| Other income | 16 | 14 | 14 | 40 | 28 | 43 | ||||||||||||||||||||||||||||||||
| Total adjusted revenues | 1,299 | 1,295 | — | 2,586 | 2,628 | (2) | ||||||||||||||||||||||||||||||||
| Benefits and expenses: | ||||||||||||||||||||||||||||||||||||||
| Policyholder benefits and losses incurred | 828 | 950 | (13) | 1,766 | 1,954 | (10) | ||||||||||||||||||||||||||||||||
| Interest credited to policyholder account balances | 87 | 89 | (2) | 172 | 177 | (3) | ||||||||||||||||||||||||||||||||
| Amortization of deferred policy acquisition costs | 64 | 45 | 42 | 136 | 120 | 13 | ||||||||||||||||||||||||||||||||
| Non deferrable insurance commissions | 43 | 33 | 30 | 77 | 66 | 17 | ||||||||||||||||||||||||||||||||
| General operating expenses | 159 | 152 | 5 | 325 | 318 | 2 | ||||||||||||||||||||||||||||||||
| Interest expense | 1 | 6 | (83) | 2 | 13 | (85) | ||||||||||||||||||||||||||||||||
| Total benefits, losses and expenses | 1,182 | 1,275 | (7) | 2,478 | 2,648 | (6) | ||||||||||||||||||||||||||||||||
| Adjusted pre-tax income (loss) | $ | 117 | $ | 20 | 485 | % | $ | 108 | $ | (20) | NM | % | ||||||||||||||||||||||||||
|
114
|
AIG | Second Quarter 2022 Form 10-Q
|
||||
Business and Financial Highlights
Life Insurance is focused on selling profitable new products through strategic channels to enhance future returns. Premiums and deposits, excluding the effect of foreign exchange, increased $29 million and $77 million in the three- and six-month periods ended June 30, 2022, respectively, compared to the same periods in the prior year primarily due to growth in international life premiums.
Adjusted pre-tax income increased $97 million and $128 million in the three- and six-month periods ended June 30, 2022, respectively, compared to the same periods in the prior year primarily due to favorable premiums and policy fees, net of policyholder benefits ($166 million and $227 million), partially offset by lower net investment income.
Life Insurance Adjusted Pre-Tax Income (Loss)
Three Months Ended June 30,
(in millions)
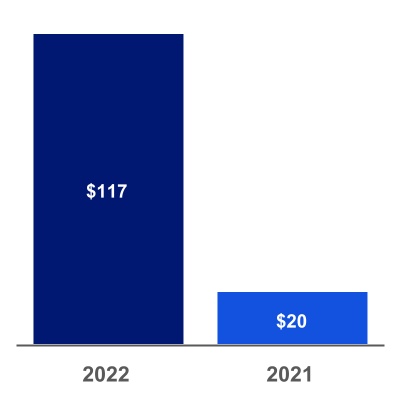
|
Quarterly 2022 and 2021 Comparison
|
|||||
|
Adjusted pre-tax income increased $97 million primarily due to:
|
|||||
|
•
higher premiums and policy fees, net of policyholder benefits ($166 million) primarily due to lower mortality.
|
|||||
| Partially offsetting this increase was: | |||||
|
•
lower net investment income ($42 million), primarily driven by lower yield enhancement income ($28 million) primarily due to lower equity partnership performance and lower base portfolio income ($14 million).
|
|||||
|
|
||
Life Insurance Adjusted Pre-Tax Income (Loss)
Six Months Ended June 30,
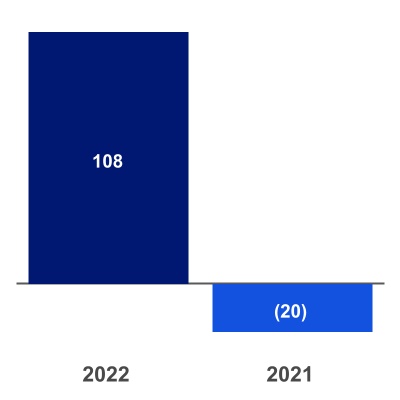
|
Year-to-Date 2022 and 2021 Comparison
|
|||||
|
Adjusted pre-tax income increased $128 million primarily due to:
|
|||||
|
•
higher premiums and policy fees, net of policyholder benefits ($227 million) primarily due to lower mortality.
|
|||||
| Partially offsetting this increase was: | |||||
|
•
lower net investment income ($93 million), primarily driven by lower yield enhancement income ($71 million) primarily due to lower equity partnership performance and lower base portfolio income ($22 million).
|
|||||
|
AIG | Second Quarter 2022 Form 10-Q
|
115
|
||||
LIFE INSURANCE GAAP PREMIUMS AND PREMIUMS AND DEPOSITS
Premiums for Life Insurance represent amounts received on traditional life insurance policies, primarily term life and international life and health. Premiums, excluding the effect of foreign exchange, increased $53 million and $69 million in the three- and six-month periods ended June 30, 2022, respectively, compared to the same periods in the prior year. Premiums and deposits for Life Insurance is a non-GAAP financial measure that includes direct and assumed premiums as well as deposits received on universal life insurance.
The following table presents a reconciliation of Life Insurance GAAP premiums to premiums and deposits:
| Three Months Ended | Six Months Ended | ||||||||||||||||||||||||||||
| June 30, | June 30, | ||||||||||||||||||||||||||||
| (in millions) | 2022 | 2021 | 2022 | 2021 | |||||||||||||||||||||||||
| Premiums | $ | 561 | $ | 532 | $ | 1,100 | $ | 1,064 | |||||||||||||||||||||
| Deposits | 388 | 409 | 785 | 806 | |||||||||||||||||||||||||
| Other* | 208 | 220 | 441 | 422 | |||||||||||||||||||||||||
| Premiums and deposits | $ | 1,157 | $ | 1,161 | $ | 2,326 | $ | 2,292 | |||||||||||||||||||||
*
Other principally consists of adding back ceded premiums to reflect the gross premiums and deposits.
A discussion of the significant variances in premiums and deposits follows:
|
|
||
Life Insurance Premiums and Deposits
Three Months Ended June 30,
(in millions)
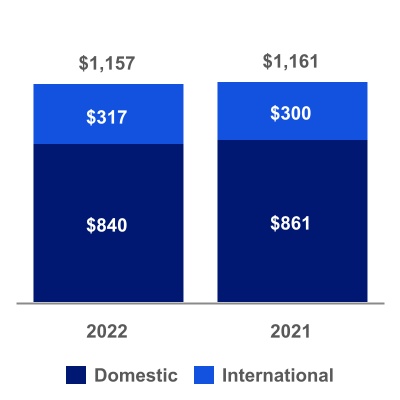
|
Quarterly 2022 and 2021 Comparison
|
|||||
|
Premiums and deposits, excluding the effect of foreign exchange, increased $29 million primarily due to growth in international life premiums.
|
|||||
|
|
||
Life Insurance Premiums and Deposits
Six Months Ended June 30,
(in millions)
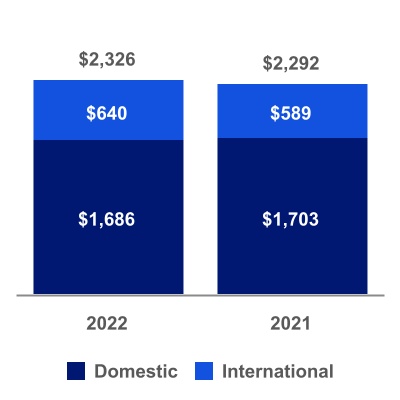
|
Year-to-Date 2022 and 2021 Comparison
|
|||||
|
Premiums and deposits, excluding the effect of foreign exchange, increased $77 million primarily due to growth in international life premiums.
|
|||||
|
116
|
AIG | Second Quarter 2022 Form 10-Q
|
||||
INSTITUTIONAL MARKETS RESULTS
| Three Months Ended | Six Months Ended | |||||||||||||||||||||||||||||||||||||
| June 30, | Percentage | June 30, | Percentage | |||||||||||||||||||||||||||||||||||
| (in millions) | 2022 | 2021 | Change | 2022 | 2021 | Change | ||||||||||||||||||||||||||||||||
| Adjusted revenues: | ||||||||||||||||||||||||||||||||||||||
| Premiums | $ | 496 | $ | 1,077 | (54) | % | $ | 734 | $ | 1,116 | (34) | % | ||||||||||||||||||||||||||
| Policy fees | 49 | 46 | 7 | 96 | 93 | 3 | ||||||||||||||||||||||||||||||||
| Net investment income | 241 | 288 | (16) | 504 | 566 | (11) | ||||||||||||||||||||||||||||||||
| Other income | — | 1 | NM | 1 | 1 | — | ||||||||||||||||||||||||||||||||
| Total adjusted revenues | 786 | 1,412 | (44) | 1,335 | 1,776 | (25) | ||||||||||||||||||||||||||||||||
| Benefits and expenses: | ||||||||||||||||||||||||||||||||||||||
| Policyholder benefits and losses incurred | 609 | 1,170 | (48) | 948 | 1,289 | (26) | ||||||||||||||||||||||||||||||||
| Interest credited to policyholder account balances | 71 | 73 | (3) | 130 | 146 | (11) | ||||||||||||||||||||||||||||||||
| Amortization of deferred policy acquisition costs | 2 | 2 | — | 3 | 3 | — | ||||||||||||||||||||||||||||||||
| Non deferrable insurance commissions | 7 | 6 | 17 | 14 | 13 | 8 | ||||||||||||||||||||||||||||||||
| General operating expenses | 18 | 18 | — | 37 | 38 | (3) | ||||||||||||||||||||||||||||||||
| Interest expense | 1 | 3 | (67) | 1 | 5 | (80) | ||||||||||||||||||||||||||||||||
| Total benefits, losses and expenses | 708 | 1,272 | (44) | 1,133 | 1,494 | (24) | ||||||||||||||||||||||||||||||||
| Adjusted pre-tax income | $ | 78 | $ | 140 | (44) | % | $ | 202 | $ | 282 | (28) | % | ||||||||||||||||||||||||||
Business and Financial Highlights
Institutional Markets is focused on opportunities to grow its portfolio while maintaining pricing discipline. Product distribution continues to be strong. Premiums and deposits decreased $1.1 billion and $844 million in the three- and six-month periods ended June 30, 2022, respectively, compared to the same periods in the prior year primarily due to lower premiums on new pension risk transfer business and lower deposits on GICs driven by the opportunistic nature of these businesses.
Adjusted pre-tax income decreased $62 million and $80 million in the three- and six-month periods ended June 30, 2022 compared to the same periods in the prior year primarily due to lower net investment income ($47 million and $62 million) driven by lower private equity returns and call and tender income.
|
|
||
Institutional Markets Adjusted Pre-Tax Income (Loss)
Three Months Ended June 30,
(in millions)
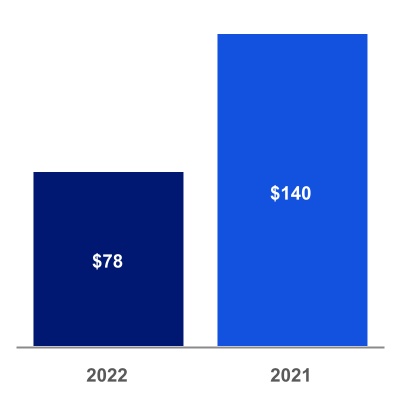
|
Quarterly 2022 and 2021 Comparison
|
|||||
|
Adjusted pre-tax income decreased $62 million primarily due to:
|
|||||
|
•
lower premiums primarily on new pension risk transfer business ($581 million); and
|
|||||
|
•
lower net investment income ($47 million) primarily due to lower private equity returns and call and tender income.
|
|||||
|
Partially offsetting these decreases were:
|
|||||
|
•
a decrease in policyholder benefits and losses incurred (including interest accretion) primarily on new pension risk transfer business ($561 million).
|
|||||
|
AIG | Second Quarter 2022 Form 10-Q
|
117
|
||||
|
|
||
Institutional Markets Adjusted Pre-Tax Income (Loss)
Six Months Ended June 30,
(in millions)
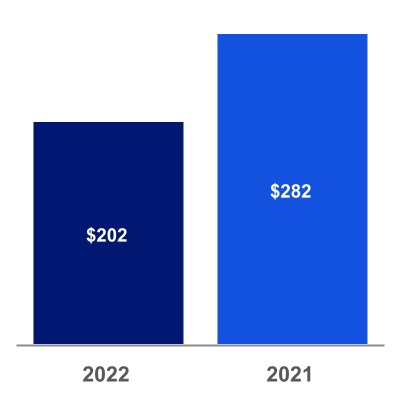
|
Year-to-Date 2022 and 2021 Comparison
|
|||||
|
Adjusted pre-tax income decreased $80 million primarily due to:
|
|||||
|
•
lower premiums primarily on new pension risk transfer business ($382 million); and
|
|||||
|
•
lower net investment income ($62 million) primarily due to lower private equity returns and call and tender income.
|
|||||
|
Partially offsetting these decreases were:
|
|||||
|
•
a decrease in policyholder benefits and losses incurred (including interest accretion) primarily on new pension risk transfer business ($341 million); and
|
|||||
|
•
lower interest credited to policyholder account balances ($16 million), primarily related to the GIC business.
|
|||||
INSTITUTIONAL MARKETS GAAP PREMIUMS AND PREMIUMS AND DEPOSITS
Premiums for Institutional Markets primarily represent amounts received on pension risk transfer or structured settlement annuities with life contingencies. Premiums decreased $581 million and $382 million in the three- and six-month periods ended June 30, 2022, respectively, compared to the same period in the prior year primarily driven by the opportunistic nature of the pension risk transfer business (direct and assumed reinsurance).
Premiums and deposits for Institutional Markets is a non-GAAP financial measure that includes direct and assumed premiums as well as deposits received on investment-type annuity contracts. Deposits primarily include GICs, FHLB funding agreements and structured settlement annuities with no life contingencies.
The following table presents a reconciliation of Institutional Markets GAAP premiums to premiums and deposits:
| Three Months Ended | Six Months Ended | |||||||||||||||||||||||||
| June 30, | June 30, | |||||||||||||||||||||||||
| (in millions) | 2022 | 2021 | 2022 | 2021 | ||||||||||||||||||||||
| Premiums | $ | 496 | $ | 1,077 | $ | 734 | $ | 1,116 | ||||||||||||||||||
| Deposits | 46 | 559 | 128 | 593 | ||||||||||||||||||||||
| Other* | 8 | 5 | 15 | 12 | ||||||||||||||||||||||
| Premiums and deposits | $ | 550 | $ | 1,641 | $ | 877 | $ | 1,721 | ||||||||||||||||||
*
Other principally consists of adding back ceded premiums to reflect the gross premiums and deposits.
|
118
|
AIG | Second Quarter 2022 Form 10-Q
|
||||
A discussion of the significant variances in premiums and deposits follows:
|
|
||
Institutional Markets Premiums and Deposits
Three Months Ended June 30,
(in millions
)
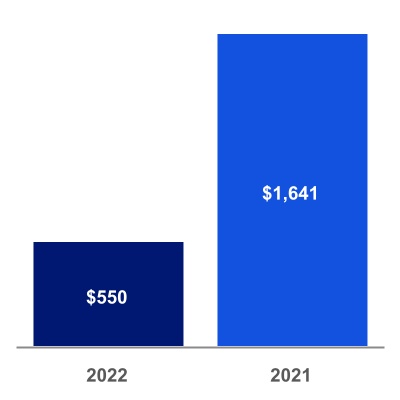
|
Quarterly 2022 and 2021 Comparison
|
|||||
|
Premiums and deposits decreased ($1.1 billion) primarily due to lower premiums on new pension risk transfer business and lower deposits on GICs driven by the opportunistic nature of these businesses.
|
|||||
|
|
||
Institutional Markets Premiums and Deposits
Six Months Ended June 30,
(in millions
)

|
Year-to-Date 2022 and 2021 Comparison
|
|||||
|
Premiums and deposits decreased ($844 million) primarily due to lower premiums on new pension risk transfer business and lower deposits on GICs driven by the opportunistic nature of these businesses, partially offset by increased deposits on structured settlement annuities.
|
|||||
|
AIG | Second Quarter 2022 Form 10-Q
|
119
|
||||
|
Other Operations
|
||
Other Operations primarily consists of income from assets held by AIG Parent and other corporate subsidiaries, deferred tax assets related to tax attributes, corporate expenses and intercompany eliminations, our institutional asset management business and results of our consolidated investment entities, General Insurance portfolios in run-off as well as the historical results of our legacy insurance lines ceded to Fortitude Re.
|
OTHER OPERATIONS RESULTS
|
||
| Three Months Ended June 30, | Percentage | Six Months Ended June 30, | Percentage | |||||||||||||||||||||||||||||||||||
| (in millions) | 2022 | 2021 | Change | 2022 | 2021 | Change | ||||||||||||||||||||||||||||||||
| Adjusted revenues: | ||||||||||||||||||||||||||||||||||||||
| Premiums | $ | 20 | $ | 54 | (63) | % | $ | 50 | $ | 106 | (53) | % | ||||||||||||||||||||||||||
| Policy fees | — | — | NM | — | — | NM | ||||||||||||||||||||||||||||||||
| Net investment income: | ||||||||||||||||||||||||||||||||||||||
| Interest and dividends | 97 | 45 | 116 | 160 | 95 | 68 | ||||||||||||||||||||||||||||||||
| Alternative investments | 167 | 118 | 42 | 436 | 325 | 34 | ||||||||||||||||||||||||||||||||
| Other investment income (loss) | (62) | 45 | NM | (147) | 43 | NM | ||||||||||||||||||||||||||||||||
| Investment expenses | (4) | (8) | 50 | (13) | (14) | 7 | ||||||||||||||||||||||||||||||||
| Total net investment income | 198 | 200 | (1) | 436 | 449 | (3) | ||||||||||||||||||||||||||||||||
| Other income | (11) | 5 | NM | 15 | 28 | (46) | ||||||||||||||||||||||||||||||||
| Total adjusted revenues | 207 | 259 | (20) | 501 | 583 | (14) | ||||||||||||||||||||||||||||||||
| Benefits, losses and expenses: | ||||||||||||||||||||||||||||||||||||||
| Policyholder benefits and losses incurred | 6 | 96 | (94) | 23 | 162 | (86) | ||||||||||||||||||||||||||||||||
| Interest credited to policyholder account balances | — | — | NM | — | — | NM | ||||||||||||||||||||||||||||||||
| Acquisition expenses: | ||||||||||||||||||||||||||||||||||||||
| Amortization of deferred policy acquisition costs | 2 | 11 | (82) | 5 | 21 | (76) | ||||||||||||||||||||||||||||||||
| Other acquisition expenses | (2) | (1) | (100) | (2) | (1) | (100) | ||||||||||||||||||||||||||||||||
| Total acquisition expenses | — | 10 | NM | 3 | 20 | (85) | ||||||||||||||||||||||||||||||||
| General operating expenses: | ||||||||||||||||||||||||||||||||||||||
| Corporate and Other | 245 | 319 | (23) | 510 | 560 | (9) | ||||||||||||||||||||||||||||||||
| Asset Management | 8 | 13 | (38) | 30 | 48 | (38) | ||||||||||||||||||||||||||||||||
| Amortization of intangible assets | 10 | 10 | — | 20 | 20 | — | ||||||||||||||||||||||||||||||||
| Total General operating expenses | 263 | 342 | (23) | 560 | 628 | (11) | ||||||||||||||||||||||||||||||||
| Interest expense: | ||||||||||||||||||||||||||||||||||||||
| Corporate and Other | 216 | 265 | (18) | 444 | 537 | (17) | ||||||||||||||||||||||||||||||||
| Asset Management* | 53 | 62 | (15) | 90 | 106 | (15) | ||||||||||||||||||||||||||||||||
| Total interest expense | 269 | 327 | (18) | 534 | 643 | (17) | ||||||||||||||||||||||||||||||||
| Total benefits, losses and expenses | 538 | 775 | (31) | 1,120 | 1,453 | (23) | ||||||||||||||||||||||||||||||||
| Adjusted pre-tax loss before consolidation and eliminations | (331) | (516) | 36 | (619) | (870) | 29 | ||||||||||||||||||||||||||||||||
| Consolidation and eliminations | (130) | (94) | (38) | (263) | (270) | 3 | ||||||||||||||||||||||||||||||||
| Adjusted pre-tax loss | $ | (461) | $ | (610) | 24 | % | $ | (882) | $ | (1,140) | 23 | % | ||||||||||||||||||||||||||
| Adjusted pre-tax income (loss) by activities: | ||||||||||||||||||||||||||||||||||||||
| Corporate and Other | $ | (494) | $ | (617) | 20 | % | $ | (1,041) | (1,169) | 11 | % | |||||||||||||||||||||||||||
| Asset Management | 163 | 101 | 61 | 422 | 299 | 41 | ||||||||||||||||||||||||||||||||
| Consolidation and eliminations | (130) | (94) | (38) | (263) | (270) | 3 | ||||||||||||||||||||||||||||||||
| Adjusted pre-tax loss | $ | (461) | $ | (610) | 24 | % | $ | (882) | $ | (1,140) | 23 | % | ||||||||||||||||||||||||||
*
Interest – Asset Management primarily represents interest expense on consolidated investment entities of $51 million and $61 million in the three-month periods ended June 30, 2022 and 2021, respectively, and $87 million and $102 million in the six-month periods ended June 30, 2022 and 2021, respectively.
|
120
|
AIG | Second Quarter 2022 Form 10-Q
|
||||
QUARTERLY 2022 AND 2021 COMPARISON
Adjusted pre-tax loss before consolidation and eliminations of $331 million in 2022 compared to $516 million in 2021, decreased $185 million, was primarily due to:
•
lower underwriting loss attributable to decreased catastrophe losses and absence of unfavorable prior year development ($71 million in 2021) within Other Operations Run-Off, primarily Blackboard U.S. Holdings, Inc.;
•
lower corporate and other general operating expenses primarily driven by decreases in employment costs ($105 million) partially offset by higher informational technology professional fees ($28 million);
•
lower corporate interest expense primarily driven by interest savings of $74 million from $7.6 billion debt repurchases, through cash tender offers, and debt redemption in the six months ended June 30, 2022 as well as $646 million debt repurchases, through cash tender offers in the three months ended December 31, 2021 compared to interest savings of $19 million resulting from redemptions of $1.5 billion of debt in the three months ended June 30, 2021, partially offset by interest expense of $61 million on $6.5 billion Corebridge senior unsecured notes issued in the six months ended June 30, 2022; and
•
lower net investment income driven by an increase in mark to market losses on CDO securities of $133 million, partially offset by higher income associated consolidated investment entities of $72 million, lower gains on fair value option assets and liabilities of $37 million, and higher income on structured securities on AIG Parent portfolio of $32 million.
Adjusted pre-tax loss on consolidation and eliminations of $130 million in 2022 compared to $94 million in 2021, an increase of $36 million, was primarily due to the elimination of the insurance companies’ net investment income from their investment in the consolidated investment entities of $30 million.
YEAR-TO-DATE 2022 AND 2021 COMPARISON
Adjusted pre-tax loss before consolidation and eliminations of $619 million in 2022 compared to $870 million in 2021, decreased $251 million, was primarily due to:
•
lower underwriting loss attributable to decreased catastrophe losses and absence of unfavorable prior year development ($107 million in 2021) within Other Operations Run-Off, primarily Blackboard U.S. Holdings, Inc.;
•
lower corporate interest expense primarily driven by interest savings of $89 million from $7.6 billion debt repurchases, through cash tender offers, and debt redemption in the six months ended June 30, 2022 as well as $646 million debt repurchases, through cash tender offers in the three months ended December 31, 2021 compared to interest savings of $42 million resulting from redemptions of $3.0 billion of debt in the six months ended in June 30, 2021, partially offset by interest expense of $61 million on $6.5 billion Corebridge senior unsecured notes issued in the six months ended June 30, 2022;
•
lower corporate and other general operating expenses primarily driven by decreases in employment costs ($176 million) partially offset by higher informational technology professional fees ($45 million); and
•
lower net investment income driven by an increase in mark to market losses on CDO securities of $209 million, partially offset by higher income associated consolidated investment entities of $101 million, lower income associated with equity investments of $55 million and higher income on structured securities on AIG Parent portfolio of $32 million.
Adjusted pre-tax loss on consolidation and eliminations of $263 million in 2022 compared to $270 million in 2021, a decrease of $7 million, was primarily due to the elimination of the insurance companies’ net investment income from their investment in the consolidated investment entities of $20 million.
|
AIG | Second Quarter 2022 Form 10-Q
|
121
|
||||
|
|
||
Investments
OVERVIEW
Our investment strategies are tailored to the specific business needs of each operating unit by targeting an asset allocation mix that supports estimated cash flows of our outstanding liabilities and provides diversification from an asset class, sector, issuer, and geographic perspective. The primary objectives are generation of investment income, preservation of capital, liquidity management and growth of surplus. The majority of assets backing our insurance liabilities consist of fixed maturity securities.
Over the past several quarters inflation has continued to remain elevated, which has led to the increases in interest rates by the Board of Governors of the Federal Reserve System in several years. This has also led to a significant rise in interest rates across the yield curve and a widening of credit spreads reflecting ongoing recession concerns.
| INVESTMENT HIGHLIGHTS IN THE SIX MONTHS ENDED JUNE 30, 2022 | ||
|
•
A significant rise in interest rates and widening of credit spreads resulted in net unrealized losses in our available for sale fixed security portfolio of $17.9 billion during the second quarter of 2022. Our Net unrealized gain of $18.1 billion as of December 31, 2021 decreased to a net unrealized loss of $20.0 billion on our available for sale portfolio as of June 30, 2022.
•
We continued to make investments in structured securities and other fixed maturity securities with favorable risk compared to return characteristics to improve yields and increase net investment income.
•
We experienced a decrease in net investment income in the six-month period ended June 30, 2022 compared to the same period in the prior year due primarily to higher losses on assets for which we elected fair value option, losses in our hedge funds versus gains in the prior year, and lower income in our available for sale fixed security portfolio primarily driven by lower call income and yield compression, which more than offset higher income in our private equity portfolio.
•
Blended investment yields on new investments are higher than blended rates on investments that were sold, matured or called.
|
||
INVESTMENT STRATEGIES
Investment strategies are assessed at the segment level and involve considerations that include local and general market conditions, duration and cash flow management, risk appetite and volatility constraints, rating agency and regulatory capital considerations, and tax and legal investment limitations.
Some of our key investment strategies are as follows:
•
Our fundamental strategy across the portfolios is to seek investments with similar characteristics to the associated insurance liabilities to the extent practicable.
•
AIG embeds Environmental, Social and Governance (ESG) considerations in its fundamental investment analysis of the companies or projects we invest in to ensure that they have sustainable earnings over the full term of our investment. This analysis is performed where ESG considerations are relevant or material to a particular investment. AIG considers internal and external factors and evaluates changes in consumer behavior, industry trends related to ESG factors as well as the ability of the management of companies to respond appropriately to these changes in order to maintain their competitive advantage.
•
We seek to originate investments that offer enhanced yield through illiquidity premiums, such as private placements and commercial mortgage loans, which also add portfolio diversification. These assets typically afford credit protections through covenants, ability to customize structures that meet our insurance liability needs, and deeper due diligence given information access.
•
Given our global presence, we have access to assets that provide diversification from local markets. To the extent we purchase these investments, we generally hedge any currency risk using derivatives, which could provide opportunities to earn higher risk adjusted returns compared to assets in the functional currency.
•
AIG Parent, included in Other Operations, actively manages its assets and liabilities, counterparties and duration. AIG Parent’s liquidity sources are held primarily in the form of cash, short-term investments and publicly traded, investment grade rated fixed maturity securities that can be readily monetized through sales or repurchase agreements. This strategy allows us to both diversify our sources of liquidity and reduce the cost of maintaining sufficient liquidity.
|
122
|
AIG | Second Quarter 2022 Form 10-Q
|
||||
•
Within the U.S., the Life and Retirement and General Insurance investments are generally split between reserve backing and surplus portfolios.
–
Insurance reserves are backed by mainly investment grade fixed maturity securities that meet our duration, risk-return, tax, liquidity, credit quality and diversification objectives. We assess asset classes based on their fundamental underlying risk factors, including credit (public and private), commercial real estate and residential real estate regardless of whether such investments are bonds, loans, or structured products.
–
Surplus investments seek to enhance portfolio returns and are generally comprised of a mix of fixed maturity investment grade and below investment grade securities and various alternative asset classes, including private equity, real estate equity, and hedge funds. Over the past few years, hedge fund investments have been reduced with more emphasis given to private equity, real estate and below investment grade credit.
•
Outside of the U.S., fixed maturity securities held by insurance companies consist primarily of investment-grade securities generally denominated in the currencies of the countries in which we operate.
Asset-Liability Management
The investment strategy within the General Insurance companies focuses on growth of surplus, maintenance of sufficient liquidity for unanticipated insurance claims, and preservation of capital. General Insurance invests primarily in fixed maturity securities issued by corporations, municipalities and other governmental agencies; structured securities collateralized by, among other assets, residential and commercial real estate; and commercial mortgage loans. Fixed maturity securities of the General Insurance companies’ North America operations have an average duration of 4.0 years. Fixed maturity securities of the General Insurance companies’ International operations have an average duration of 3.7 years.
While invested assets backing reserves of the General Insurance companies are primarily invested in conventional liquid fixed maturity securities, we have continued to allocate to asset classes that offer higher yields through structural and illiquidity premiums, particularly in our North America operations. In addition, we continue to invest in both fixed rate and floating rate asset-backed investments to manage our exposure to potential changes in interest rates and inflation. We seek to diversify the portfolio across asset classes, sectors and issuers to mitigate idiosyncratic portfolio risks.
In addition, a portion of the surplus of General Insurance is invested in a diversified portfolio of alternative investments that seek to balance liquidity, volatility and growth of surplus. There is a higher allocation to equity-oriented investments in General Insurance surplus relative to other AIG portfolios given the underlying inflation risks inherent in that business. Although these alternative investments are subject to periodic earnings fluctuations, they have historically achieved yields in excess of the fixed maturity portfolio yields and have provided added diversification to the broader portfolio.
The investment strategy of the Life and Retirement companies is to provide net investment income to back liabilities that result in stable distributable earnings and enhance portfolio value, subject to asset-liability management, capital, liquidity and regulatory constraints.
The Life and Retirement companies use asset-liability management as a primary tool to monitor and manage risk in their businesses. The Life and Retirement companies maintain a diversified, high-to-medium quality portfolio of fixed maturity securities issued by corporations, municipalities and other governmental agencies; structured securities collateralized by, among other assets, residential and commercial real estate; and commercial mortgage loans that, to the extent practicable, match the duration characteristics of the liabilities. We seek to diversify the portfolio across asset classes, sectors, and issuers to mitigate idiosyncratic portfolio risks. The investment portfolio of each product line is tailored to the specific characteristics of its insurance liabilities, and as a result, duration varies between distinct portfolios. The interest rate environment has a direct impact on the asset-liability management profile of the businesses, and changes in the interest rate environment may result in the need to lengthen or shorten the duration of the portfolio. In a rising rate environment, we may shorten the duration of the investment portfolio.
Fixed maturity securities of the Life and Retirement companies’ domestic operations have an average duration of 7.8 years.
In addition, the Life and Retirement companies seek to enhance surplus portfolio returns through investments in a diversified portfolio of alternative investments. Although these alternative investments are subject to periodic earnings fluctuations, they have historically achieved returns in excess of the fixed maturity portfolio returns.
|
AIG | Second Quarter 2022 Form 10-Q
|
123
|
||||
NAIC Designations of Fixed Maturity Securities
The Securities Valuation Office (SVO) of the NAIC evaluates the investments of U.S. insurers for statutory reporting purposes and assigns fixed maturity securities to one of six categories called ‘NAIC Designations.’ In general, NAIC Designations of ‘1’ highest quality, or ‘2’ high quality, include fixed maturity securities considered investment grade, while NAIC Designations of ‘3’ through ‘6’ generally include fixed maturity securities referred to as below investment grade. NAIC Designations for non-agency residential mortgage backed securities (RMBS) and commercial mortgage backed securities (CMBS) are calculated using third party modeling results provided through the NAIC. These methodologies result in an improved NAIC Designation for such securities compared to the rating typically assigned by the three major rating agencies. The following tables summarize the ratings distribution of AIG subsidiaries’ fixed maturity security portfolio by NAIC Designation, and the distribution by composite AIG credit rating, which is generally based on ratings of the three major rating agencies. For fixed maturity securities where no NAIC Designation is assigned or able to be calculated using third-party data, the NAIC Designation category used in the first table below reflects an internal rating.
The NAIC Designations presented below do not reflect the added granularity to the designation categories adopted by the NAIC in 2020, which further subdivide each category of fixed maturity securities by appending letter modifiers to the numerical designations.
For a full description of the composite AIG credit ratings see – Credit Ratings below.
The following table presents the fixed maturity security portfolio categorized by NAIC Designation, at fair value:
| June 30, 2022 | ||||||||||||||||||||||||||||||||||||||||||||||||||||||||
| (in millions) | ||||||||||||||||||||||||||||||||||||||||||||||||||||||||
| NAIC Designation | 1 | 2 |
Total
Investment Grade |
3 | 4 | 5 | 6 |
Total
Below Investment Grade |
Total | |||||||||||||||||||||||||||||||||||||||||||||||
| Other fixed maturity securities | $ | 93,390 | $ | 70,673 | $ | 164,063 | $ | 7,386 | $ | 7,938 | $ | 976 | $ | 228 | $ | 16,528 | $ | 180,591 | ||||||||||||||||||||||||||||||||||||||
| Mortgage-backed, asset-backed and collateralized | 50,719 | 6,707 | 57,426 | 193 | 81 | 240 | 1,076 | 1,590 | 59,016 | |||||||||||||||||||||||||||||||||||||||||||||||
| Total* | $ | 144,109 | $ | 77,380 | $ | 221,489 | $ | 7,579 | $ | 8,019 | $ | 1,216 | $ | 1,304 | $ | 18,118 | $ | 239,607 | ||||||||||||||||||||||||||||||||||||||
*
Excludes $26 million of fixed maturity securities for which no NAIC Designation is available.
The following table presents the fixed maturity security portfolio categorized by composite AIG credit rating, at fair value:
| June 30, 2022 | ||||||||||||||||||||||||||||||||||||||||||||||||||
| (in millions) | ||||||||||||||||||||||||||||||||||||||||||||||||||
| Composite AIG Credit Rating | AAA/AA/A | BBB |
Total
Investment Grade |
BB | B | CCC and Lower |
Total
Below Investment Grade |
Total | ||||||||||||||||||||||||||||||||||||||||||
| Other fixed maturity securities | $ | 96,408 | $ | 67,183 | $ | 163,591 | $ | 7,593 | $ | 6,876 | $ | 2,531 | $ | 17,000 | $ | 180,591 | ||||||||||||||||||||||||||||||||||
| Mortgage-backed, asset-backed and collateralized | 44,095 | 7,196 | 51,291 | 506 | 409 | 6,810 | 7,725 | 59,016 | ||||||||||||||||||||||||||||||||||||||||||
| Total* | $ | 140,503 | $ | 74,379 | $ | 214,882 | $ | 8,099 | $ | 7,285 | $ | 9,341 | $ | 24,725 | $ | 239,607 | ||||||||||||||||||||||||||||||||||
*
Excludes $26 million of fixed maturity securities for which no NAIC Designation is available.
CREDIT RATINGS
At June 30, 2022, approximately 87 percent of our fixed maturity securities were held by our domestic entities. Approximately 89 percent of these securities were rated investment grade by one or more of the principal rating agencies. Our investment decision process relies primarily on internally generated fundamental analysis and internal risk ratings. Third-party rating services’ ratings and opinions provide one source of independent perspective for consideration in the internal analysis.
Moody’s Investors Service Inc. (Moody’s), Standard & Poor’s Financial Services LLC, a subsidiary of S&P Global Inc. (S&P), or similar foreign rating services rate a significant portion of our foreign entities’ fixed maturity securities portfolio. Rating services are not available for some foreign-issued securities. Our Credit Risk Management department closely reviews the credit quality of the foreign portfolio’s non-rated fixed maturity securities. At June 30, 2022, approximately 94 percent of such investments were either rated investment grade or, on the basis of our internal analysis, were equivalent from a credit standpoint to securities rated investment grade. Approximately 27 percent of the foreign entities’ fixed maturity securities portfolio is comprised of sovereign fixed maturity securities supporting policy liabilities in the country of issuance.
|
124
|
AIG | Second Quarter 2022 Form 10-Q
|
||||
Composite AIG Credit Ratings
With respect to our fixed maturity securities, the credit ratings in the table below and in subsequent tables reflect: (i) a composite of the ratings of the three major rating agencies, or when agency ratings are not available, the NAIC designation assigned by the NAIC SVO (98 percent of total fixed maturity securities), or (ii) our internal ratings when these investments have not been rated by any of the major rating agencies or the NAIC. The “Non-rated” category in those tables consists of fixed maturity securities that have not been rated by any of the major rating agencies, the NAIC or us.
For information regarding credit risks associated with Investments see Part II, Item 7. MD&A – Enterprise Risk Management in the 2021 Annual Report.
The following table presents the composite AIG credit ratings of our fixed maturity securities calculated on the basis of their fair value:
| Available for Sale | Other | Total | ||||||||||||||||||||||||||||||||||||
| (in millions) | June 30, 2022 | December 31, 2021 | June 30, 2022 | December 31, 2021 | June 30, 2022 | December 31, 2021 | ||||||||||||||||||||||||||||||||
| Rating: | ||||||||||||||||||||||||||||||||||||||
| Other fixed maturity securities | ||||||||||||||||||||||||||||||||||||||
| AAA | $ | 14,873 | $ | 15,578 | $ | 1,620 | $ | 1,756 | $ | 16,493 | $ | 17,334 | ||||||||||||||||||||||||||
| AA | 33,634 | 39,110 | 576 | 282 | 34,210 | 39,392 | ||||||||||||||||||||||||||||||||
| A | 45,529 | 57,346 | 174 | 160 | 45,703 | 57,506 | ||||||||||||||||||||||||||||||||
| BBB | 66,461 | 83,192 | 723 | 461 | 67,184 | 83,653 | ||||||||||||||||||||||||||||||||
| Below investment grade | 15,316 | 17,795 | 363 | 314 | 15,679 | 18,109 | ||||||||||||||||||||||||||||||||
| Non-rated | 1,348 | 1,638 | — | — | 1,348 | 1,638 | ||||||||||||||||||||||||||||||||
| Total | $ | 177,161 | $ | 214,659 | $ | 3,456 | $ | 2,973 | $ | 180,617 | $ | 217,632 | ||||||||||||||||||||||||||
| Mortgage-backed, asset-backed and collateralized | ||||||||||||||||||||||||||||||||||||||
| AAA | $ | 21,515 | $ | 27,144 | $ | 204 | $ | 232 | $ | 21,719 | $ | 27,376 | ||||||||||||||||||||||||||
| AA | 14,729 | 15,688 | 567 | 485 | 15,296 | 16,173 | ||||||||||||||||||||||||||||||||
| A | 6,824 | 6,685 | 257 | 197 | 7,081 | 6,882 | ||||||||||||||||||||||||||||||||
| BBB | 6,237 | 5,492 | 959 | 725 | 7,196 | 6,217 | ||||||||||||||||||||||||||||||||
| Below investment grade | 6,171 | 7,508 | 1,165 | 1,462 | 7,336 | 8,970 | ||||||||||||||||||||||||||||||||
| Non-rated | 98 | 26 | 290 | 204 | 388 | 230 | ||||||||||||||||||||||||||||||||
| Total | $ | 55,574 | $ | 62,543 | $ | 3,442 | $ | 3,305 | $ | 59,016 | $ | 65,848 | ||||||||||||||||||||||||||
| Total | ||||||||||||||||||||||||||||||||||||||
| AAA | $ | 36,388 | $ | 42,722 | $ | 1,824 | $ | 1,988 | $ | 38,212 | $ | 44,710 | ||||||||||||||||||||||||||
| AA | 48,363 | 54,798 | 1,143 | 767 | 49,506 | 55,565 | ||||||||||||||||||||||||||||||||
| A | 52,353 | 64,031 | 431 | 357 | 52,784 | 64,388 | ||||||||||||||||||||||||||||||||
| BBB | 72,698 | 88,684 | 1,682 | 1,186 | 74,380 | 89,870 | ||||||||||||||||||||||||||||||||
| Below investment grade | 21,487 | 25,303 | 1,528 | 1,776 | 23,015 | 27,079 | ||||||||||||||||||||||||||||||||
| Non-rated | 1,446 | 1,664 | 290 | 204 | 1,736 | 1,868 | ||||||||||||||||||||||||||||||||
| Total | $ | 232,735 | $ | 277,202 | $ | 6,898 | $ | 6,278 | $ | 239,633 | $ | 283,480 | ||||||||||||||||||||||||||
Available-for-Sale Investments
The following table presents the fair value of our available-for-sale securities:
| (in millions) | June 30, 2022 | December 31, 2021 | |||||||||||||||
| Bonds available for sale: | |||||||||||||||||
| U.S. government and government sponsored entities | $ | 8,146 | $ | 8,194 | |||||||||||||
| Obligations of states, municipalities and political subdivisions | 12,600 | 14,527 | |||||||||||||||
| Non-U.S. governments | 13,674 | 16,330 | |||||||||||||||
| Corporate debt | 142,741 | 175,608 | |||||||||||||||
| Mortgage-backed, asset-backed and collateralized: | |||||||||||||||||
| RMBS | 20,173 | 27,287 | |||||||||||||||
| CMBS | 14,887 | 15,809 | |||||||||||||||
| CDO/ABS | 20,514 | 19,447 | |||||||||||||||
| Total mortgage-backed, asset-backed and collateralized | 55,574 | 62,543 | |||||||||||||||
| Total bonds available for sale* | $ | 232,735 | $ | 277,202 | |||||||||||||
*
At June 30, 2022 and December 31, 2021, the fair value of bonds available for sale held by us that were below investment grade or not rated totaled $22.9 billion and $27.0 billion, respectively.
|
AIG | Second Quarter 2022 Form 10-Q
|
125
|
||||
The following table presents the fair value of our aggregate credit exposures to non-U.S. governments for our fixed maturity securities:
| (in millions) | June 30, 2022 | December 31, 2021 | |||||||||||||||
| Canada | $ | 1,220 | $ | 1,233 | |||||||||||||
| Japan | 997 | 1,230 | |||||||||||||||
| Germany | 840 | 702 | |||||||||||||||
| France | 672 | 731 | |||||||||||||||
| United Kingdom | 563 | 1,031 | |||||||||||||||
| Indonesia | 510 | 634 | |||||||||||||||
| Chile | 406 | 511 | |||||||||||||||
| United Arab Emirates | 390 | 484 | |||||||||||||||
| Israel | 374 | 515 | |||||||||||||||
| Qatar | 366 | 438 | |||||||||||||||
| Other | 7,412 | 8,897 | |||||||||||||||
| Total | $ | 13,750 | $ | 16,406 | |||||||||||||
The following table presents the fair value of our aggregate European credit exposures by major sector for our fixed maturity securities:
| June 30, 2022 | ||||||||||||||||||||||||||||||||||||||
| (in millions) | Sovereign | Financial Institution | Non-Financial Corporates | Structured Products | Total | December 31, 2021 Total | ||||||||||||||||||||||||||||||||
| Euro-Zone countries: | ||||||||||||||||||||||||||||||||||||||
| Germany | $ | 840 | $ | 238 | $ | 2,144 | $ | — | $ | 3,222 | $ | 3,610 | ||||||||||||||||||||||||||
| France | 672 | 1,361 | 1,093 | — | 3,126 | 3,870 | ||||||||||||||||||||||||||||||||
| Netherlands | 225 | 861 | 1,051 | 36 | 2,173 | 2,652 | ||||||||||||||||||||||||||||||||
| Ireland | 9 | 76 | 401 | 1,206 | 1,692 | 1,958 | ||||||||||||||||||||||||||||||||
| Belgium | 67 | 293 | 943 | 40 | 1,343 | 1,620 | ||||||||||||||||||||||||||||||||
| Luxembourg | 18 | 642 | 348 | — | 1,008 | 880 | ||||||||||||||||||||||||||||||||
| Spain | 5 | 310 | 429 | — | 744 | 888 | ||||||||||||||||||||||||||||||||
| Italy | 19 | 85 | 408 | — | 512 | 636 | ||||||||||||||||||||||||||||||||
| Denmark | 229 | 80 | 137 | — | 446 | 518 | ||||||||||||||||||||||||||||||||
| Finland | 33 | 32 | 39 | — | 104 | 150 | ||||||||||||||||||||||||||||||||
| Other Euro-Zone | 262 | 2 | 26 | — | 290 | 379 | ||||||||||||||||||||||||||||||||
| Total Euro-Zone | $ | 2,379 | $ | 3,980 | $ | 7,019 | $ | 1,282 | $ | 14,660 | $ | 17,161 | ||||||||||||||||||||||||||
| Remainder of Europe: | ||||||||||||||||||||||||||||||||||||||
| United Kingdom | $ | 563 | $ | 3,643 | $ | 7,403 | $ | 962 | $ | 12,571 | $ | 16,908 | ||||||||||||||||||||||||||
| Switzerland | 23 | 787 | 764 | — | 1,574 | 1,884 | ||||||||||||||||||||||||||||||||
| Norway | 279 | 126 | 230 | — | 635 | 797 | ||||||||||||||||||||||||||||||||
| Sweden | 147 | 196 | 103 | — | 446 | 537 | ||||||||||||||||||||||||||||||||
| Jersey (Channel Islands) | 4 | 137 | 34 | — | 175 | 225 | ||||||||||||||||||||||||||||||||
| Russian Federation | 22 | 1 | 36 | — | 59 | 359 | ||||||||||||||||||||||||||||||||
| Other - Remainder of Europe | 55 | 29 | 79 | — | 163 | 261 | ||||||||||||||||||||||||||||||||
| Total - Remainder of Europe | $ | 1,093 | $ | 4,919 | $ | 8,649 | $ | 962 | $ | 15,623 | $ | 20,971 | ||||||||||||||||||||||||||
| Total | $ | 3,472 | $ | 8,899 | $ | 15,668 | $ | 2,244 | $ | 30,283 | $ | 38,132 | ||||||||||||||||||||||||||
|
126
|
AIG | Second Quarter 2022 Form 10-Q
|
||||
Investments in Municipal Bonds
At June 30, 2022, the U.S. municipal bond portfolio was composed primarily of essential service revenue bonds and high-quality tax-exempt bonds with 96 percent of the portfolio rated A or higher.
The following table presents the fair values of our available for sale U.S. municipal bond portfolio by state and municipal bond type:
| June 30, 2022 | ||||||||||||||||||||||||||||||||
| (in millions) | State General Obligation | Local General Obligation | Revenue |
Total
Fair Value |
December 31, 2021
Total Fair Value |
|||||||||||||||||||||||||||
| California | $ | 589 | $ | 391 | $ | 1,687 | $ | 2,667 | $ | 3,108 | ||||||||||||||||||||||
| New York | 35 | 185 | 2,074 | 2,294 | 2,765 | |||||||||||||||||||||||||||
| Texas | 35 | 481 | 750 | 1,266 | 1,416 | |||||||||||||||||||||||||||
| Illinois | 74 | 76 | 745 | 895 | 1,009 | |||||||||||||||||||||||||||
| Massachusetts | 253 | 20 | 296 | 569 | 666 | |||||||||||||||||||||||||||
| Georgia | 94 | 59 | 233 | 386 | 474 | |||||||||||||||||||||||||||
| Pennsylvania | 60 | 2 | 314 | 376 | 397 | |||||||||||||||||||||||||||
| Florida | 5 | — | 364 | 369 | 403 | |||||||||||||||||||||||||||
| Ohio | 8 | — | 359 | 367 | 488 | |||||||||||||||||||||||||||
| Washington | 122 | 6 | 203 | 331 | 359 | |||||||||||||||||||||||||||
| New Jersey | 10 | 3 | 305 | 318 | 282 | |||||||||||||||||||||||||||
| Virginia | 9 | — | 295 | 304 | 380 | |||||||||||||||||||||||||||
| Washington, D.C. | 10 | — | 246 | 256 | 293 | |||||||||||||||||||||||||||
|
All other states
(a)
|
324 | 159 | 1,719 | 2,202 | 2,487 | |||||||||||||||||||||||||||
|
Total
(b)(c)
|
$ | 1,628 | $ | 1,382 | $ | 9,590 | $ | 12,600 | $ | 14,527 | ||||||||||||||||||||||
(a)
We did not have material credit exposure to the government of Puerto Rico.
(b)
Excludes certain university and not-for-profit entities that issue their bonds in the corporate debt market. Includes industrial revenue bonds.
(c)
Includes $432 million of pre-refunded municipal bonds.
Investments in Corporate Debt Securities
The following table presents the fair value of our available for sale corporate debt securities by industry categories:
| Industry Category | |||||||||||||||||
| (in millions) | June 30, 2022 | December 31, 2021 | |||||||||||||||
| Financial institutions: | |||||||||||||||||
| Money center/Global bank groups | $ | 8,369 | $ | 10,053 | |||||||||||||
| Regional banks – other | 385 | 434 | |||||||||||||||
| Life insurance | 2,347 | 3,094 | |||||||||||||||
| Securities firms and other finance companies | 306 | 350 | |||||||||||||||
| Insurance non-life | 5,292 | 6,795 | |||||||||||||||
| Regional banks – North America | 5,785 | 7,228 | |||||||||||||||
| Other financial institutions | 16,469 | 18,255 | |||||||||||||||
| Utilities | 19,616 | 24,180 | |||||||||||||||
| Communications | 9,250 | 11,510 | |||||||||||||||
| Consumer noncyclical | 18,936 | 24,411 | |||||||||||||||
| Capital goods | 7,093 | 8,668 | |||||||||||||||
| Energy | 10,947 | 13,506 | |||||||||||||||
| Consumer cyclical | 11,146 | 13,279 | |||||||||||||||
| Basic | 4,721 | 6,041 | |||||||||||||||
| Other | 22,079 | 27,804 | |||||||||||||||
| Total* | $ | 142,741 | $ | 175,608 | |||||||||||||
*
At June 30, 2022 and December 31, 2021, approximately 89 percent and 90 percent, respectively, of these investments were rated investment grade.
|
AIG | Second Quarter 2022 Form 10-Q
|
127
|
||||
Our investments in the energy category, as a percentage of total investments in available-for-sale fixed maturities, was 4.7 percent and 4.9 percent, at June 30, 2022 and December 31, 2021, respectively. While the energy investments are primarily investment grade and are actively managed, the category continues to experience volatility that could adversely affect credit quality and fair value.
Investments in RMBS
The following table presents the fair value of AIG’s RMBS available for sale securities:
| (in millions) | June 30, 2022 | December 31, 2021 | |||||||||||||||
| Agency RMBS | $ | 8,898 | $ | 13,778 | |||||||||||||
| Alt-A RMBS | 4,891 | 5,936 | |||||||||||||||
| Subprime RMBS | 1,974 | 2,329 | |||||||||||||||
| Prime non-agency | 2,141 | 3,058 | |||||||||||||||
| Other housing related | 2,269 | 2,186 | |||||||||||||||
|
Total RMBS
(a)(b)
|
$ | 20,173 | $ | 27,287 | |||||||||||||
(a)
Includes approximately $5.0 billion and $6.1 billion at June 30, 2022 and December 31, 2021, respectively, of certain RMBS that had experienced deterioration in credit quality since their origination.
For additional information on Purchased Credit Deteriorated Securities see Note 5 to the Condensed Consolidated Financial Statements.
(b)
The weighted average expected life was six years at June 30, 2022 and five years at December 31, 2021.
Our underwriting practices for investing in RMBS, other asset-backed securities (ABS) and CDOs take into consideration the quality of the originator, the manager, the servicer, security credit ratings, underlying characteristics of the mortgages, borrower characteristics, and the level of credit enhancement in the transaction.
Investments in CMBS
The following table presents the fair value of our CMBS available for sale securities:
| (in millions) | June 30, 2022 | December 31, 2021 | |||||||||||||||
| CMBS (traditional) | $ | 12,549 | $ | 13,091 | |||||||||||||
| Agency | 1,375 | 1,627 | |||||||||||||||
| Other | 963 | 1,091 | |||||||||||||||
| Total | $ | 14,887 | $ | 15,809 | |||||||||||||
The fair value of CMBS holdings remained stable during the first six months of 2022. The majority of our investments in CMBS are in tranches that contain substantial protection features through collateral subordination. The majority of CMBS holdings are traditional conduit transactions, broadly diversified across property types and geographical areas.
Investments in ABS/CDOs
The following table presents the fair value of our ABS/CDO available for sale securities by collateral type:
| (in millions) | June 30, 2022 | December 31, 2021 | |||||||||||||||
| Collateral Type: | |||||||||||||||||
| ABS | $ | 11,146 | $ | 10,532 | |||||||||||||
| Bank loans (collateralized loan obligation) | 9,340 | 8,899 | |||||||||||||||
| Other | 28 | 16 | |||||||||||||||
| Total | $ | 20,514 | $ | 19,447 | |||||||||||||
|
128
|
AIG | Second Quarter 2022 Form 10-Q
|
||||
Unrealized Losses of Fixed Maturity Securities
The following table shows the aging of the unrealized losses of fixed maturity securities, the extent to which the fair value is less than amortized cost or cost, and the number of respective items in each category:
| June 30, 2022 | Less Than or Equal | Greater Than 20% | Greater Than 50% | |||||||||||||||||||||||||||||||||||||||||||||||||||||||||||
|
to 20% of Cost
(b)
|
to 50% of Cost
(b)
|
of Cost
(b)
|
Total | |||||||||||||||||||||||||||||||||||||||||||||||||||||||||||
|
Aging
(a)
|
Unrealized | Unrealized | Unrealized | Unrealized | ||||||||||||||||||||||||||||||||||||||||||||||||||||||||||
| (dollars in millions) |
Cost
(c)
|
Loss |
Items
(e)
|
Cost
(c)
|
Loss |
Items
(e)
|
Cost
(c)
|
Loss |
Items
(e)
|
Cost
(c)
|
Loss
(d)
|
Items
(e)
|
||||||||||||||||||||||||||||||||||||||||||||||||||
| Investment grade bonds | ||||||||||||||||||||||||||||||||||||||||||||||||||||||||||||||
| 0-6 months | $ | 124,636 | $ | 8,578 | 17,297 | $ | 17,539 | $ | 4,377 | 1,416 | $ | 1 | $ | 1 | 3 | $ | 142,176 | $ | 12,956 | 18,716 | ||||||||||||||||||||||||||||||||||||||||||
| 7-11 months | 28,454 | 2,901 | 5,112 | 9,771 | 2,796 | 1,060 | 25 | 15 | 7 | 38,250 | 5,712 | 6,179 | ||||||||||||||||||||||||||||||||||||||||||||||||||
| 12 months or more | 6,644 | 682 | 1,681 | 7,152 | 2,175 | 727 | 4 | 2 | 2 | 13,800 | 2,859 | 2,410 | ||||||||||||||||||||||||||||||||||||||||||||||||||
| Total | $ | 159,734 | $ | 12,161 | 24,090 | $ | 34,462 | $ | 9,348 | 3,203 | $ | 30 | $ | 18 | 12 | $ | 194,226 | $ | 21,527 | 27,305 | ||||||||||||||||||||||||||||||||||||||||||
| Below investment grade bonds | ||||||||||||||||||||||||||||||||||||||||||||||||||||||||||||||
| 0-6 months | $ | 10,931 | $ | 712 | 4,217 | $ | 667 | $ | 163 | 255 | $ | 30 | $ | 24 | 22 | $ | 11,628 | $ | 899 | 4,494 | ||||||||||||||||||||||||||||||||||||||||||
| 7-11 months | 2,618 | 230 | 965 | 745 | 200 | 280 | 12 | 7 | 14 | 3,375 | 437 | 1,259 | ||||||||||||||||||||||||||||||||||||||||||||||||||
| 12 months or more | 3,069 | 219 | 880 | 672 | 205 | 214 | 85 | 57 | 38 | 3,826 | 481 | 1,132 | ||||||||||||||||||||||||||||||||||||||||||||||||||
| Total | $ | 16,618 | $ | 1,161 | 6,062 | $ | 2,084 | $ | 568 | 749 | $ | 127 | $ | 88 | 74 | $ | 18,829 | $ | 1,817 | 6,885 | ||||||||||||||||||||||||||||||||||||||||||
| Total bonds | ||||||||||||||||||||||||||||||||||||||||||||||||||||||||||||||
| 0-6 months | $ | 135,567 | $ | 9,290 | 21,514 | $ | 18,206 | $ | 4,540 | 1,671 | $ | 31 | $ | 25 | 25 | $ | 153,804 | $ | 13,855 | 23,210 | ||||||||||||||||||||||||||||||||||||||||||
| 7-11 months | 31,072 | 3,131 | 6,077 | 10,516 | 2,996 | 1,340 | 37 | 22 | 21 | 41,625 | 6,149 | 7,438 | ||||||||||||||||||||||||||||||||||||||||||||||||||
| 12 months or more | 9,713 | 901 | 2,561 | 7,824 | 2,380 | 941 | 89 | 59 | 40 | 17,626 | 3,340 | 3,542 | ||||||||||||||||||||||||||||||||||||||||||||||||||
|
Total
(e)
|
$ | 176,352 | $ | 13,322 | 30,152 | $ | 36,546 | $ | 9,916 | 3,952 | $ | 157 | $ | 106 | 86 | $ | 213,055 | $ | 23,344 | 34,190 | ||||||||||||||||||||||||||||||||||||||||||
(a)
Represents the number of consecutive months that fair value has been less than cost by any amount.
(b)
Represents the percentage by which fair value is less than cost.
(c)
For bonds, represents amortized cost net of allowance.
(d)
The effect on Net income of unrealized losses after taxes will be mitigated upon realization because certain realized losses will result in current decreases in the amortization of certain DAC.
(e)
Item count is by CUSIP by subsidiary.
The allowance for credit losses was $7 million for investment grade bonds and $169 million for below investment grade bonds as of June 30, 2022.
|
AIG | Second Quarter 2022 Form 10-Q
|
129
|
||||
Commercial Mortgage Loans
At June 30, 2022, we had direct commercial mortgage loan exposure of $37.2 billion.
The following table presents the commercial mortgage loan exposure by location and class of loan based on amortized cost:
|
Number
of Loans |
Class |
Percent
of Total |
|||||||||||||||||||||||||||||||||||||||||||||||||||
| (dollars in millions) | Apartments | Offices | Retail | Industrial | Hotel | Others | Total | ||||||||||||||||||||||||||||||||||||||||||||||
| June 30, 2022 | |||||||||||||||||||||||||||||||||||||||||||||||||||||
| State: | |||||||||||||||||||||||||||||||||||||||||||||||||||||
| New York | 89 | $ | 1,569 | $ | 4,757 | $ | 481 | $ | 431 | $ | 104 | $ | — | $ | 7,342 | 20 | % | ||||||||||||||||||||||||||||||||||||
| California | 62 | 696 | 1,279 | 234 | 1,302 | 756 | 13 | 4,280 | 11 | ||||||||||||||||||||||||||||||||||||||||||||
| New Jersey | 62 | 2,204 | 83 | 436 | 435 | 11 | 32 | 3,201 | 9 | ||||||||||||||||||||||||||||||||||||||||||||
| Texas | 47 | 831 | 1,002 | 154 | 186 | 143 | — | 2,316 | 6 | ||||||||||||||||||||||||||||||||||||||||||||
| Florida | 61 | 560 | 120 | 365 | 213 | 391 | — | 1,649 | 4 | ||||||||||||||||||||||||||||||||||||||||||||
| Massachusetts | 14 | 567 | 355 | 530 | 23 | — | — | 1,475 | 4 | ||||||||||||||||||||||||||||||||||||||||||||
| Illinois | 23 | 559 | 629 | 3 | 47 | — | 21 | 1,259 | 3 | ||||||||||||||||||||||||||||||||||||||||||||
| Washington, D.C. | 11 | 474 | 184 | — | — | 18 | — | 676 | 2 | ||||||||||||||||||||||||||||||||||||||||||||
| Ohio | 22 | 146 | 10 | 172 | 321 | — | — | 649 | 2 | ||||||||||||||||||||||||||||||||||||||||||||
| Pennsylvania | 19 | 77 | 133 | 275 | 75 | 25 | — | 585 | 2 | ||||||||||||||||||||||||||||||||||||||||||||
| Other states | 138 | 1,822 | 511 | 922 | 979 | 326 | — | 4,560 | 12 | ||||||||||||||||||||||||||||||||||||||||||||
| Foreign | 96 | 4,201 | 1,868 | 906 | 1,493 | 418 | 327 | 9,213 | 25 | ||||||||||||||||||||||||||||||||||||||||||||
| Total* | 644 | $ | 13,706 | $ | 10,931 | $ | 4,478 | $ | 5,505 | $ | 2,192 | $ | 393 | $ | 37,205 | 100 | % | ||||||||||||||||||||||||||||||||||||
| December 31, 2021 | |||||||||||||||||||||||||||||||||||||||||||||||||||||
| State: | |||||||||||||||||||||||||||||||||||||||||||||||||||||
| New York | 94 | $ | 2,217 | $ | 4,329 | $ | 450 | $ | 438 | $ | 103 | $ | — | $ | 7,537 | 21 | % | ||||||||||||||||||||||||||||||||||||
| California | 62 | 817 | 1,293 | 239 | 553 | 761 | 13 | 3,676 | 10 | ||||||||||||||||||||||||||||||||||||||||||||
| New Jersey | 48 | 2,092 | 30 | 462 | 225 | 11 | 33 | 2,853 | 8 | ||||||||||||||||||||||||||||||||||||||||||||
| Texas | 49 | 630 | 1,133 | 167 | 187 | 144 | — | 2,261 | 6 | ||||||||||||||||||||||||||||||||||||||||||||
| Florida | 60 | 469 | 152 | 368 | 214 | 281 | — | 1,484 | 4 | ||||||||||||||||||||||||||||||||||||||||||||
| Massachusetts | 13 | 534 | 290 | 537 | 24 | — | — | 1,385 | 4 | ||||||||||||||||||||||||||||||||||||||||||||
| Illinois | 24 | 554 | 626 | 9 | 50 | — | 21 | 1,260 | 5 | ||||||||||||||||||||||||||||||||||||||||||||
| Pennsylvania | 22 | 78 | 144 | 477 | 76 | 25 | — | 800 | 2 | ||||||||||||||||||||||||||||||||||||||||||||
| Washington, D.C. | 11 | 455 | 184 | — | — | 18 | — | 657 | 2 | ||||||||||||||||||||||||||||||||||||||||||||
| Ohio | 25 | 167 | 10 | 175 | 289 | — | — | 641 | 2 | ||||||||||||||||||||||||||||||||||||||||||||
| Other states | 155 | 1,852 | 598 | 975 | 686 | 329 | — | 4,440 | 12 | ||||||||||||||||||||||||||||||||||||||||||||
| Foreign | 86 | 4,402 | 1,341 | 998 | 1,116 | 449 | 365 | 8,671 | 24 | ||||||||||||||||||||||||||||||||||||||||||||
| Total* | 649 | $ | 14,267 | $ | 10,130 | $ | 4,857 | $ | 3,858 | $ | 2,121 | $ | 432 | $ | 35,665 | 100 | % | ||||||||||||||||||||||||||||||||||||
*
Does not reflect allowance for credit losses.
For additional information on commercial mortgage loans, see Note 6 to the Consolidated Financial Statements in the 2021 Annual Report.
|
130
|
AIG | Second Quarter 2022 Form 10-Q
|
||||
Net Realized Gains and Losses
The following table presents the components of Net realized gains (losses):
| Three Months Ended June 30, | 2022 | 2021 | |||||||||||||||||||||||||||||||||||||||
| (in millions) |
Excluding
Fortitude Re Funds Withheld Assets |
Fortitude Re
Funds Withheld Assets |
Total
|
Excluding
Fortitude Re Funds Withheld Assets |
Fortitude Re
Funds Withheld Assets |
Total
|
|||||||||||||||||||||||||||||||||||
| Sales of fixed maturity securities | $ | (482) | $ | (122) | $ | (604) | $ | 40 | $ | 95 | $ | 135 | |||||||||||||||||||||||||||||
| Change in allowance for credit losses on fixed maturity securities | (47) | (1) | (48) | 10 | 4 | 14 | |||||||||||||||||||||||||||||||||||
| Change in allowance for credit losses on loans | 24 | 6 | 30 | 67 | 8 | 75 | |||||||||||||||||||||||||||||||||||
| Foreign exchange transactions | (231) | (15) | (246) | 139 | 9 | 148 | |||||||||||||||||||||||||||||||||||
| Variable annuity embedded derivatives, net of related hedges | 454 | — | 454 | (53) | — | (53) | |||||||||||||||||||||||||||||||||||
| All other derivatives and hedge accounting | 970 | 48 | 1,018 | (336) | 60 | (276) | |||||||||||||||||||||||||||||||||||
| Sales of alternative investments and real estate investments | 7 | 2 | 9 | 31 | (3) | 28 | |||||||||||||||||||||||||||||||||||
| Other | 7 | (4) | 3 | 59 | — | 59 | |||||||||||||||||||||||||||||||||||
| Net realized gains (losses) – excluding Fortitude Re funds withheld embedded derivative | 702 | (86) | 616 | (43) | 173 | 130 | |||||||||||||||||||||||||||||||||||
| Net realized gains (losses) on Fortitude Re funds withheld embedded derivative | — | 2,776 | 2,776 | — | (2,056) | (2,056) | |||||||||||||||||||||||||||||||||||
| Net realized gains (losses) | $ | 702 | $ | 2,690 | $ | 3,392 | $ | (43) | $ | (1,883) | $ | (1,926) | |||||||||||||||||||||||||||||
| Six Months Ended June 30, | 2022 | 2021 | |||||||||||||||||||||||||||||||||||||||
| (in millions) |
Excluding
Fortitude Re
Funds
Withheld Assets
|
Fortitude Re
Funds
Withheld
Assets
|
Total
|
Excluding
Fortitude Re Funds Withheld Assets |
Fortitude Re
Funds Withheld Assets |
Total
|
|||||||||||||||||||||||||||||||||||
| Sales of fixed maturity securities | $ | (589) | $ | (154) | $ | (743) | $ | 134 | $ | 390 | $ | 524 | |||||||||||||||||||||||||||||
| Change in allowance for credit losses on fixed maturity securities | (100) | (41) | (141) | 61 | 6 | 67 | |||||||||||||||||||||||||||||||||||
| Change in allowance for credit losses on loans | 5 | (2) | 3 | 108 | 3 | 111 | |||||||||||||||||||||||||||||||||||
| Foreign exchange transactions | (245) | (24) | (269) | 90 | 3 | 93 | |||||||||||||||||||||||||||||||||||
| Variable annuity embedded derivatives, net of related hedges | 960 | — | 960 | 36 | — | 36 | |||||||||||||||||||||||||||||||||||
| All other derivatives and hedge accounting | 1,909 | (8) | 1,901 | 15 | (57) | (42) | |||||||||||||||||||||||||||||||||||
| Sales of alternative investments and real estate investments | 23 | 3 | 26 | 57 | 1 | 58 | |||||||||||||||||||||||||||||||||||
| Other | (20) | — | (20) | 151 | — | 151 | |||||||||||||||||||||||||||||||||||
| Net realized gains (losses) – excluding Fortitude Re funds withheld embedded derivative | 1,943 | (226) | 1,717 | 652 | 346 | 998 | |||||||||||||||||||||||||||||||||||
| Net realized gains on Fortitude Re funds withheld embedded derivative | — | 6,094 | 6,094 | — | 326 | 326 | |||||||||||||||||||||||||||||||||||
| Net realized gains | $ | 1,943 | $ | 5,868 | $ | 7,811 | $ | 652 | $ | 672 | $ | 1,324 | |||||||||||||||||||||||||||||
Net realized capital gains excluding Fortitude Re funds withheld assets in the three-month period ended June 30, 2022 compared to the net realized capital losses in the same period in the prior year were due to derivative gains versus losses in the prior year, which was partially offset by losses in sales of securities and foreign exchange losses versus gains in the prior year period.
Variable annuity embedded derivatives, net of related hedges, reflected higher gains in the three-month period ended June 30, 2022 compared to the same period in the prior year. Fair value gains or losses in the hedging portfolio are typically not fully offset by increases or decreases in liabilities due to the non-performance or “own credit” risk adjustment used in the valuation of the variable annuities with GMWB embedded derivative, which are not hedged as part of our economic hedging program, and other risk margins used for valuation that cause the embedded derivatives to be less sensitive to changes in market rates than the hedge portfolio.
Net realized gains (losses) on Fortitude Re funds withheld assets primarily reflect changes in the valuation of the modified coinsurance and funds withheld assets. Increases in the valuation of these assets result in losses to AIG as the appreciation on the assets must under those reinsurance arrangements be transferred to Fortitude Re. Decreases in valuation of the assets result in gains to AIG as the depreciation on the assets under those reinsurance arrangements must be transferred to Fortitude Re.
For additional information on the impact of the funds withheld arrangements with Fortitude Re see Note 7 to the Condensed Consolidated Financial Statements.
|
AIG | Second Quarter 2022 Form 10-Q
|
131
|
||||
For additional information on market risk management related to these product features, see Part II, Item 7. MD&A – Enterprise Risk Management – Insurance Risks – Life and Retirement Companies’ Key Risks – Variable Annuity, Fixed Index Annuity and Universal Life Risk Management and Hedging Programs in the 2021 Annual Report. For additional information on the economic hedging target and the impact to pre-tax income of this program, see Insurance Reserves – Life and Annuity Future Policy Benefits, Policyholder Contract Deposits and DAC – Variable Annuity Guaranteed Benefits and Hedging Results in this MD&A.
For additional information on our investment portfolio, see Note 5 to the Condensed Consolidated Financial Statements.
Change in Unrealized Gains and Losses on Investments
The change in net unrealized gains and losses on investments in the three- and six-month periods ended June 30, 2022 was primarily attributable to decrease in the fair value of fixed maturity securities. For the second quarter of 2022, net unrealized losses related to fixed maturity securities were $17.9 billion due primarily to a significant increase in interest rates and widening of credit spreads. For the six-month period ended June 30, 2022, net unrealized losses were $38.1 billion due to increase in interest rates.
The change in net unrealized gains and losses on investments in the three- and six-month periods ended June 30, 2021 was primarily attributable to increases (decreases) in the fair value of fixed maturity securities. For the three-month period ended June 30, 2021, net unrealized gains related to fixed maturity securities increased by $5.9 billion due primarily to a decrease in rates and narrowing of credit spreads. For the six-month period ending June 30, 2021, net unrealized gains related to fixed maturity securities decreased by $5.8 billion due primarily to an increase in interest rates.
For additional information on our investment portfolio, see Note 5 to the Condensed Consolidated Financial Statements.
Insurance Reserves
LIABILITY FOR UNPAID LOSSES AND LOSS ADJUSTMENT EXPENSES (LOSS RESERVES)
The following table presents the components of our gross and net loss reserves by segment and major lines of business
(a)
:
| June 30, 2022 | December 31, 2021 | |||||||||||||||||||||||||||||||||||||
| (in millions) |
Net liability for unpaid losses
and loss adjustment expenses |
Reinsurance recoverable on unpaid losses and
loss adjustment expenses |
Gross liability
for unpaid losses and loss adjustment expenses |
Net liability for
unpaid losses and loss adjustment expenses |
Reinsurance recoverable on unpaid losses and loss adjustment expenses |
Gross liability
for unpaid losses and loss adjustment expenses |
||||||||||||||||||||||||||||||||
| General Insurance: | ||||||||||||||||||||||||||||||||||||||
| U.S. Workers' Compensation (net of discount) | $ | 3,165 | $ | 4,771 | $ | 7,936 | $ | 3,282 | $ | 5,216 | $ | 8,498 | ||||||||||||||||||||||||||
| U.S. Excess Casualty | 3,690 | 3,951 | 7,641 | 3,850 | 4,195 | 8,045 | ||||||||||||||||||||||||||||||||
| U.S. Other Casualty | 4,160 | 3,905 | 8,065 | 3,805 | 4,191 | 7,996 | ||||||||||||||||||||||||||||||||
| U.S. Financial Lines | 5,378 | 1,622 | 7,000 | 5,356 | 1,893 | 7,249 | ||||||||||||||||||||||||||||||||
| U.S. Property and Special Risks | 6,525 | 3,089 | 9,614 | 6,615 | 3,587 | 10,202 | ||||||||||||||||||||||||||||||||
| U.S. Personal Insurance | 919 | 2,154 | 3,073 | 1,001 | 2,198 | 3,199 | ||||||||||||||||||||||||||||||||
| UK/Europe Casualty and Financial Lines | 6,940 | 1,708 | 8,648 | 7,175 | 1,603 | 8,778 | ||||||||||||||||||||||||||||||||
| UK/Europe Property and Special Risks | 2,705 | 1,531 | 4,236 | 2,631 | 1,492 | 4,123 | ||||||||||||||||||||||||||||||||
| UK/Europe and Japan Personal Insurance | 1,852 | 633 | 2,485 | 1,962 | 608 | 2,570 | ||||||||||||||||||||||||||||||||
|
Other product lines
(b)
|
5,936 | 5,569 | 11,505 | 5,815 | 5,468 | 11,283 | ||||||||||||||||||||||||||||||||
|
Unallocated loss adjustment expenses
(b)
|
1,245 | 959 | 2,204 | 1,654 | 1,015 | 2,669 | ||||||||||||||||||||||||||||||||
| Total General Insurance | 42,515 | 29,892 | 72,407 | 43,146 | 31,466 | 74,612 | ||||||||||||||||||||||||||||||||
| Other Operations Run-Off: | ||||||||||||||||||||||||||||||||||||||
|
U.S. run-off long tail insurance lines
(net of discount)
|
196 | 3,393 | 3,589 | 164 | 3,434 | 3,598 | ||||||||||||||||||||||||||||||||
| Other run-off product lines | 255 | 52 | 307 | 264 | 61 | 325 | ||||||||||||||||||||||||||||||||
| Blackboard U.S. Holdings, Inc. | 180 | 132 | 312 | 217 | 138 | 355 | ||||||||||||||||||||||||||||||||
| Unallocated loss adjustment expenses | 10 | 114 | 124 | 22 | 114 | 136 | ||||||||||||||||||||||||||||||||
| Total Other Operations Run-Off | 641 | 3,691 | 4,332 | 667 | 3,747 | 4,414 | ||||||||||||||||||||||||||||||||
| Total | $ | 43,156 | $ | 33,583 | $ | 76,739 | $ | 43,813 | $ | 35,213 | $ | 79,026 | ||||||||||||||||||||||||||
(a)
Includes net loss reserve discount of $
939
million and $876 million as of June 30, 2022 and December 31, 2021, respectively.
For information regarding loss reserve discount see Note 10 to the Condensed Consolidated Financial Statements.
(b)
Other product lines and Unallocated loss adjustment expenses includes Gross liability for unpaid losses and loss adjustment expense and Reinsurance recoverable on unpaid losses and loss adjustment expense for the Fortitude Re reinsurance of $3.7 billion and $3.5 billion as of June 30, 2022 and December 31, 2021, respectively.
|
132
|
AIG | Second Quarter 2022 Form 10-Q
|
||||
Prior Year Development
The following table summarizes incurred (favorable) unfavorable prior year development net of reinsurance by segment:
| Three Months Ended | Six Months Ended | ||||||||||||||||||||||||||||
| June 30, | June 30, | ||||||||||||||||||||||||||||
| (in millions) | 2022 | 2021 | 2022 | 2021 | |||||||||||||||||||||||||
| General Insurance: | |||||||||||||||||||||||||||||
| North America* | $ | (191) | $ | (58) | $ | (264) | $ | (116) | |||||||||||||||||||||
| International | (11) | 7 | (31) | 9 | |||||||||||||||||||||||||
| Total General Insurance | $ | (202) | $ | (51) | $ | (295) | $ | (107) | |||||||||||||||||||||
| Other Operations Run-Off | (1) | 65 | (1) | 84 | |||||||||||||||||||||||||
| Total prior year (favorable) unfavorable development | $ | (203) | $ | 14 | $ | (296) | $ | (23) | |||||||||||||||||||||
*
Includes the amortization attributed to the deferred gain at inception from the National Indemnity Company (NICO) adverse development reinsurance agreement of $42 million and $49 million for the three-month periods ended June 30, 2022 and 2021, respectively, and $84 million and $101 million for the six-month periods ended June 30, 2022 and 2021, respectively. Consistent with our definition of APTI, the amount excludes the portion of (favorable)/unfavorable prior year reserve development for which we have ceded the risk under the NICO reinsurance agreements of $(213) million and $(92) million for the three-month periods ended June 30, 2022 and 2021, respectively, and $(213) million and $(91) million for the six-month periods ended June 30, 2022 and 2021, respectively. Also excludes the related changes in amortization of the deferred gain, which were $(70) million and $(27) million for the three-month periods ended June 30, 2022 and 2021, respectively, and $(70) million and $(7) million for the six-month periods ended June 30, 2022 and 2021, respectively.
Net Loss Development
In the three-month period ended June 30, 2022, we recognized favorable prior year loss reserve development of $(203) million. The key components of this development were:
North America
•
Favorable development on U.S. Workers Compensation
•
Favorable development on U.S. Other Casualty
•
Amortization benefit of $(40) million related to the deferred gain on the adverse development cover
In the six-month period ended June 30, 2022, we recognized favorable prior year loss reserve development of $(296) million. The key components of this development were:
North America
•
Favorable development on U.S. Workers Compensation and short tail lines
•
Favorable development on U.S. Other Casualty
•
Amortization benefit of $(80) million related to the deferred gain on the adverse development cover.
International
•
Favorable development in Japan personal lines.
In the three-month period ended June 30, 2021, we recognized adverse prior year loss reserve development of $14 million. The key components of this development were:
North America
•
Amortization of the deferred gain on the adverse development cover and favorable development on Workers Compensation partially offset by adverse development on U.S. Property, Special Risks and Financial Lines.
International
•
Adverse development on Property and Other short-tail lines.
Other Operations
•
Adverse development on the Blackboard insurance companies and other runoff companies due to increased severity on reported claims.
|
AIG | Second Quarter 2022 Form 10-Q
|
133
|
||||
In the six-month period ended June 30, 2021, we recognized favorable prior year loss reserve development of $(23) million. The key components of this development were:
North America
•
Amortization of the deferred gain from the adverse development cover and favorable development on Workers Compensation partially offset by adverse development on Commercial Property and Financial Lines.
International
•
Adverse development in Property and Other short-tailed lines.
Other Operations
•
Adverse development on the Blackboard insurance companies and other runoff companies due to increased severity on reported claims.
The following tables summarize incurred (favorable) unfavorable prior year development net of reinsurance, by segment and major lines of business, and by accident year groupings:
| Three Months Ended June 30, 2022 | ||||||||||||||||||||
| (in millions) | Total | 2021 | 2020 & Prior | |||||||||||||||||
| General Insurance North America: | ||||||||||||||||||||
| U.S. Workers' Compensation | $ | (128) | $ | (8) | $ | (120) | ||||||||||||||
| U.S. Excess Casualty | (10) | — | (10) | |||||||||||||||||
| U.S. Other Casualty | (42) | (1) | (41) | |||||||||||||||||
| U.S. Financial Lines | (7) | — | (7) | |||||||||||||||||
| U.S. Property and Special Risks | (5) | (30) | 25 | |||||||||||||||||
| U.S. Personal Insurance | 8 | 5 | 3 | |||||||||||||||||
| Other Product Lines | (7) | 4 | (11) | |||||||||||||||||
| Total General Insurance North America | $ | (191) | $ | (30) | $ | (161) | ||||||||||||||
| General Insurance International: | ||||||||||||||||||||
| UK/Europe Casualty and Financial Lines | $ | — | $ | — | $ | — | ||||||||||||||
| UK/Europe Property and Special Risks | (4) | (2) | (2) | |||||||||||||||||
| UK/Europe and Japan Personal Insurance | 1 | 1 | — | |||||||||||||||||
| Other product lines | (8) | 4 | (12) | |||||||||||||||||
| Total General Insurance International | $ | (11) | $ | 3 | $ | (14) | ||||||||||||||
| Other Operations Run-Off | (1) | — | (1) | |||||||||||||||||
| Total Prior Year (Favorable) Unfavorable Development | $ | (203) | $ | (27) | $ | (176) | ||||||||||||||
| Three Months Ended June 30, 2021 | ||||||||||||||||||||
| (in millions) | Total | 2020 | 2019 & Prior | |||||||||||||||||
| General Insurance North America: | ||||||||||||||||||||
| U.S. Workers' Compensation | $ | (79) | $ | 11 | $ | (90) | ||||||||||||||
| U.S. Excess Casualty | (12) | — | (12) | |||||||||||||||||
| U.S. Other Casualty | 3 | (2) | 5 | |||||||||||||||||
| U.S. Financial Lines | 30 | — | 30 | |||||||||||||||||
| U.S. Property and Special Risks | 22 | 5 | 17 | |||||||||||||||||
| U.S. Personal Insurance | (18) | (10) | (8) | |||||||||||||||||
| Other Product Lines | (4) | (4) | — | |||||||||||||||||
| Total General Insurance North America | $ | (58) | $ | — | $ | (58) | ||||||||||||||
| General Insurance International: | ||||||||||||||||||||
| UK/Europe Casualty and Financial Lines | $ | 12 | $ | 2 | $ | 10 | ||||||||||||||
| UK/Europe Property and Special Risks | (13) | (10) | (3) | |||||||||||||||||
| UK/Europe and Japan Personal Insurance | (3) | — | (3) | |||||||||||||||||
| Other product lines | 11 | 7 | 4 | |||||||||||||||||
| Total General Insurance International | $ | 7 | $ | (1) | $ | 8 | ||||||||||||||
| Other Operations Run-Off | 65 | 34 | 31 | |||||||||||||||||
| Total Prior Year (Favorable) Unfavorable Development | $ | 14 | $ | 33 | $ | (19) | ||||||||||||||
|
134
|
AIG | Second Quarter 2022 Form 10-Q
|
||||
| Six Months Ended June 30, 2022 | ||||||||||||||||||||
| (in millions) | Total | 2021 | 2020 & Prior | |||||||||||||||||
| General Insurance North America: | ||||||||||||||||||||
| U.S. Workers' Compensation | $ | (185) | $ | (9) | $ | (176) | ||||||||||||||
| U.S. Excess Casualty | (20) | — | (20) | |||||||||||||||||
| U.S. Other Casualty | (52) | — | (52) | |||||||||||||||||
| U.S. Financial Lines | (14) | — | (14) | |||||||||||||||||
| U.S. Property and Special Risks | 24 | (75) | 99 | |||||||||||||||||
| U.S. Personal Insurance | (6) | 2 | (8) | |||||||||||||||||
| Other Product Lines | (11) | (13) | 2 | |||||||||||||||||
| Total General Insurance North America | $ | (264) | $ | (95) | $ | (169) | ||||||||||||||
| General Insurance International: | ||||||||||||||||||||
| UK/Europe Casualty and Financial Lines | $ | 5 | $ | (2) | $ | 7 | ||||||||||||||
| UK/Europe Property and Special Risks | (16) | (22) | 6 | |||||||||||||||||
| UK/Europe and Japan Personal Insurance | (13) | (13) | — | |||||||||||||||||
| Other product lines | (7) | 14 | (21) | |||||||||||||||||
| Total General Insurance International | $ | (31) | $ | (23) | $ | (8) | ||||||||||||||
| Other Operations Run-Off | (1) | — | (1) | |||||||||||||||||
| Total Prior Year (Favorable) Unfavorable Development | $ | (296) | $ | (118) | $ | (178) | ||||||||||||||
| Six Months Ended June 30, 2021 | ||||||||||||||||||||
| (in millions) | Total | 2020 | 2019 & Prior | |||||||||||||||||
| General Insurance North America: | ||||||||||||||||||||
| U.S. Workers' Compensation | $ | (105) | $ | 13 | $ | (118) | ||||||||||||||
| U.S. Excess Casualty | (24) | — | (24) | |||||||||||||||||
| U.S. Other Casualty | 1 | (2) | 3 | |||||||||||||||||
| U.S. Financial Lines | 21 | — | 21 | |||||||||||||||||
| U.S. Property and Special Risks | 20 | (9) | 29 | |||||||||||||||||
| U.S. Personal Insurance | (22) | (9) | (13) | |||||||||||||||||
| Other Product Lines | (7) | (6) | (1) | |||||||||||||||||
| Total General Insurance North America | $ | (116) | $ | (13) | $ | (103) | ||||||||||||||
| General Insurance International: | ||||||||||||||||||||
| UK/Europe Casualty and Financial Lines | $ | 8 | $ | (1) | $ | 9 | ||||||||||||||
| UK/Europe Property and Special Risks | (10) | (1) | (9) | |||||||||||||||||
| UK/Europe and Japan Personal Insurance | (4) | (4) | — | |||||||||||||||||
| Other product lines | 15 | 18 | (3) | |||||||||||||||||
| Total General Insurance International | $ | 9 | $ | 12 | $ | (3) | ||||||||||||||
| Other Operations Run-Off | 84 | 33 | 51 | |||||||||||||||||
| Total Prior Year (Favorable) Unfavorable Development | $ | (23) | $ | 32 | $ | (55) | ||||||||||||||
We note that for certain categories of claims (e.g., construction defect claims and environmental claims) and for reinsurance recoverable, losses may sometimes be reclassified to an earlier or later accident year as more information about the date of occurrence becomes available to us.
Significant Reinsurance Agreements
In the first quarter of 2017, we entered into an adverse development reinsurance agreement with NICO, under which we transferred to NICO 80 percent of the reserve risk on substantially all of our U.S. Commercial long-tail exposures for accident years 2015 and prior. Under this agreement, we ceded to NICO 80 percent of the losses on subject business paid on or after January 1, 2016 in excess of $25 billion of net paid losses, up to an aggregate limit of $25 billion. We account for this transaction as retroactive reinsurance. This transaction resulted in a gain, which under GAAP retroactive reinsurance accounting is deferred and amortized into income over the settlement period. NICO created a collateral trust account as security for their claim payment obligations to us, into which they deposited the consideration paid under the agreement, and Berkshire Hathaway Inc. has provided a parental guarantee to secure NICO’s obligations under the agreement.
For a description of AIG’s catastrophe reinsurance protection for 2021, see Part II, Item 7. MD&A – Enterprise Risk Management – Insurance Risks – General Insurance Companies’ Key Risks – Natural Catastrophe Risk in the 2021 Annual Report.
|
AIG | Second Quarter 2022 Form 10-Q
|
135
|
||||
The table below shows the calculation of the deferred gain on the adverse development reinsurance agreement as of June 30, 2022 and as of December 31, 2021, showing the effect of discounting of loss reserves and amortization of the deferred gain.
| (in millions) | June 30, 2022 | December 31, 2021 | |||||||||||||||
| Gross Covered Losses | |||||||||||||||||
| Covered reserves before discount | $ | 13,374 | $ | 14,398 | |||||||||||||
| Inception to date losses paid | 27,781 | 27,023 | |||||||||||||||
| Attachment point | (25,000) | (25,000) | |||||||||||||||
| Covered losses above attachment point | $ | 16,155 | $ | 16,421 | |||||||||||||
| Deferred Gain Development | |||||||||||||||||
| Covered losses above attachment ceded to NICO (80%) | $ | 12,924 | $ | 13,137 | |||||||||||||
| Consideration paid including interest | (10,188) | (10,188) | |||||||||||||||
| Pre-tax deferred gain before discount and amortization | 2,736 | 2,949 | |||||||||||||||
|
Discount on ceded losses
(a)
|
(896) | (953) | |||||||||||||||
| Pre-tax deferred gain before amortization | 1,840 | 1,996 | |||||||||||||||
| Inception to date amortization of deferred gain at inception | (1,181) | (1,097) | |||||||||||||||
|
Inception to date amortization attributed to changes in deferred gain
(b)
|
50 | (30) | |||||||||||||||
| Deferred gain liability reflected in AIG's balance sheet | $ | 709 | $ | 869 | |||||||||||||
(a)
The accretion of discount and a reduction in effective interest rates is offset by changes in estimates of the amount and timing of future recoveries.
(b)
Excluded from APTI.
The following table presents the rollforward of activity in the deferred gain from the adverse development reinsurance agreement:
| Three Months Ended | Six Months Ended | ||||||||||||||||||||||||||||
| June 30, | June 30, | ||||||||||||||||||||||||||||
| (in millions) | 2022 | 2021 | 2022 | 2021 | |||||||||||||||||||||||||
| Balance at beginning of period, net of discount | $ | 870 | $ | 1,282 | $ | 869 | $ | 1,297 | |||||||||||||||||||||
|
(Favorable) unfavorable prior year reserve development ceded to NICO
(a)
|
(213) | (92) | (213) | (91) | |||||||||||||||||||||||||
|
Amortization attributed to deferred gain at inception
(b)
|
(42) | (49) | (84) | (101) | |||||||||||||||||||||||||
|
Amortization attributed to changes in deferred gain
(c)
|
76 | 28 | 80 | 25 | |||||||||||||||||||||||||
| Changes in discount on ceded loss reserves | 18 | 17 | 57 | 56 | |||||||||||||||||||||||||
| Balance at end of period, net of discount | $ | 709 | $ | 1,186 | $ | 709 | $ | 1,186 | |||||||||||||||||||||
(a)
Prior year reserve development ceded to NICO under the retroactive reinsurance agreement is deferred under GAAP.
(b)
Represents amortization of the deferred gain recognized in APTI.
(c)
Excluded from APTI.
The lines of business subject to this agreement include those with longer tails, which carry a higher degree of uncertainty. Since inception, there have been periods of unfavorable prior year development, with more recent favorable development. This agreement will continue to reduce the impact of volatility in the development on our ultimate loss estimates over time. The agreement has resulted in lower capital charges for reserve risks at our U.S. insurance subsidiaries. In addition, net investment income declined as a result of lower invested assets.
Fortitude Re was established during the first quarter of 2018 in a series of reinsurance transactions related to our run-off operations. Those reinsurance transactions were designed to consolidate most of our Insurance run-off lines into a single legal entity. As of June 30, 2022, approximately $29.3 billion of reserves from our Life and Retirement Run-Off Lines and approximately $3.6 billion of reserves from our General Insurance Run-Off Lines related to business written by multiple wholly-owned AIG subsidiaries, had been ceded to Fortitude Re under these reinsurance transactions.
Of the Fortitude Re reinsurance agreements, the largest is the Amended and Restated Combination Coinsurance and Modified Coinsurance Agreement by and between our subsidiary AGL and Fortitude Re. Under this treaty, approximately $22.4 billion of AGL reserves as of June 30, 2022 were ceded to Fortitude Re representing a mix of life and annuity risks. Fortitude Re provides 100 percent reinsurance of the ceded risks. AGL retains the risk of collection of any third party reinsurance covering the ceded business. At effectiveness of the treaty, an amount equal to the aggregate ceded reserves was deposited by AGL into a modified coinsurance account of AGL to secure the obligations of Fortitude Re. Fortitude Re receives or makes quarterly payments that represent the net gain or loss under the treaty for the relevant quarter, including any net investment gain or loss on the assets in the modified
|
136
|
AIG | Second Quarter 2022 Form 10-Q
|
||||
coinsurance account. An AIG affiliate will serve as portfolio manager of assets in the modified coinsurance account for a minimum of three years after the June 2, 2020 closing of the sale of our majority interest in Fortitude Group Holdings, LLC..
Following receipt of all regulatory approvals and the satisfaction of other conditions, effective as of January 1, 2022, AIG sold to an affiliate of Fortitude Re all of the outstanding capital stock of two servicing companies that administer the Life and Retirement and General Insurance ceded business, and the ceding insurers entered into administrative services agreements pursuant to which AIG transferred administration of certain Life and Retirement and General Insurance ceded business to such companies.
For a summary of significant reinsurers see Part II, Item 7. MD&A – Enterprise Risk Management – Insurance Risks – Reinsurance Activities – Reinsurance Recoverable in the 2021 Annual Report.
LIFE AND ANNUITY FUTURE POLICY BENEFITS, POLICYHOLDER CONTRACT DEPOSITS AND DAC
The following section provides discussion of life and annuity future policy benefits, policyholder contract deposits and deferred policy acquisition costs.
Variable Annuity Guaranteed Benefits and Hedging Results
Our Individual Retirement and Group Retirement businesses offer variable annuity products with GMWB riders that provide guaranteed living benefit features. The liabilities for GMWB are accounted for as embedded derivatives measured at fair value. The fair value of the embedded derivatives may fluctuate significantly based on market interest rates, equity prices, credit spreads, market volatility, policyholder behavior and other factors.
In addition to risk-mitigating features in our variable annuity product design, we have an economic hedging program designed to manage market risk from GMWB, including exposures to changes in interest rates, equity prices, credit spreads and volatility. The hedging program utilizes derivative instruments, including but not limited to equity options, futures contracts and interest rate swap and swaption contracts, as well as fixed maturity securities with a fair value election.
For additional information on market risk management related to these product features see Part II, Item 7. MD&A – Enterprise Risk Management – Insurance Risks – Life and Retirement Companies’ Key Risks – Variable Annuity, Index Annuity and Universal Life Risk Management and Hedging Programs in the 2021 Annual Report.
Differences in Valuation of Embedded Derivatives and Economic Hedge Target
The variable annuity hedging program utilizes an economic hedge target, which represents an estimate of the underlying economic risks in our GMWB riders. The economic hedge target differs from the GAAP valuation of the GMWB embedded derivatives, creating volatility in our net income (loss) primarily due to the following:
•
The economic hedge target includes 100 percent of rider fees in present value calculations; the GAAP valuation reflects only those fees attributed to the embedded derivative such that the initial value at contract issue equals zero;
•
The economic hedge target uses best estimate actuarial assumptions and excludes explicit risk margins used for GAAP valuation, such as margins for policyholder behavior, mortality, and volatility; and
•
The economic hedge target excludes the non-performance or “own credit” risk adjustment used in the GAAP valuation, which reflects a market participant’s view of our claims-paying ability by incorporating a different spread (the NPA spread) to the curve used to discount projected benefit cash flows. Because the discount rate includes the NPA spread and other explicit risk margins, the GAAP valuation has different sensitivities to movements in interest rates and other market factors, and to changes from actuarial assumption updates, than the economic hedge target.
For additional information on our valuation methodology for embedded derivatives within policyholder contract deposits, see Note 4 to the Condensed Consolidated Financial Statements.
The market value of the hedge portfolio compared to the economic hedge target at any point in time may be different and is not expected to be fully offsetting. In addition to the derivatives held in conjunction with the variable annuity hedging program, the Life and Retirement companies have cash and invested assets available to cover future claims payable under these guarantees. The primary sources of difference between the change in the fair value of the hedging portfolio and the economic hedge target include:
•
Basis risk due to the variance between expected and actual fund returns, which may be either positive or negative;
•
Realized volatility versus implied volatility;
•
Actual versus expected changes in the hedge target driven by assumptions not subject to hedging, particularly policyholder behavior; and
•
Risk exposures that we have elected not to explicitly or fully hedge.
|
AIG | Second Quarter 2022 Form 10-Q
|
137
|
||||
The following table presents a reconciliation between the fair value of the GAAP embedded derivatives and the value of our economic hedge target:
| (in millions) | June 30, 2022 | December 31, 2021 | ||||||||||||
| Reconciliation of embedded derivatives and economic hedge target: | ||||||||||||||
| Embedded derivative liability | $ | 1,198 | $ | 2,472 | ||||||||||
| Exclude non-performance risk adjustment | (2,810) | (2,508) | ||||||||||||
| Embedded derivative liability, excluding NPA | 4,008 | 4,980 | ||||||||||||
| Adjustments for risk margins and differences in valuation | (2,401) | (2,172) | ||||||||||||
| Economic hedge target liability | $ | 1,607 | $ | 2,808 | ||||||||||
Impact on Pre-tax Income (Loss)
The impact on our pre-tax income (loss) of variable annuity guaranteed living benefits and related hedging results includes changes in the fair value of the GMWB embedded derivatives, and changes in the fair value of related derivative hedging instruments, both of which are recorded in Net realized gains (losses). Realized gains (losses), as well as net investment income from changes in the fair value of fixed maturity securities used in the hedging program, are excluded from adjusted pre-tax income of Individual Retirement and Group Retirement.
The change in the fair value of the embedded derivatives and the change in the value of the hedging portfolio are not expected to be fully offsetting, primarily due to the differences in valuation between the economic hedge target, the GAAP embedded derivatives and the fair value of the hedging portfolio, as discussed above. When corporate credit spreads widen, the change in the NPA spread generally reduces the fair value of the embedded derivative liabilities, resulting in a gain, and when corporate credit spreads narrow or tighten, the change in the NPA spread generally increases the fair value of the embedded derivative liabilities, resulting in a loss. In addition to changes driven by credit market-related movements in the NPA spread, the NPA balance also reflects changes in business activity and in the net amount at risk from the underlying guaranteed living benefits.
The following table presents the net increase (decrease) to consolidated pre-tax income (loss) from changes in the fair value of the GMWB embedded derivatives and related hedges, excluding related DAC amortization:
| Three Months Ended | Six Months Ended | |||||||||||||||||||||||||
| June 30, | June 30, | |||||||||||||||||||||||||
| (in millions) | 2022 | 2021 | 2022 | 2021 | ||||||||||||||||||||||
| Change in fair value of embedded derivatives, excluding NPA | $ | 511 | $ | (762) | $ | 1,334 | $ | 1,917 | ||||||||||||||||||
| Change in fair value of variable annuity hedging portfolio: | ||||||||||||||||||||||||||
| Fixed maturity securities* | 10 | 13 | 23 | 31 | ||||||||||||||||||||||
| Interest rate derivative contracts | (862) | 760 | (1,592) | (644) | ||||||||||||||||||||||
| Equity derivative contracts | 650 | (390) | 915 | (780) | ||||||||||||||||||||||
| Change in fair value of variable annuity hedging portfolio | (202) | 383 | (654) | (1,393) | ||||||||||||||||||||||
| Change in fair value of embedded derivatives excluding NPA, net of hedging portfolio | 309 | (379) | 680 | 524 | ||||||||||||||||||||||
| Change in fair value of embedded derivatives due to NPA spread | 448 | 18 | 972 | (93) | ||||||||||||||||||||||
| Change in fair value of embedded derivatives due to change in NPA volume | (293) | 321 | (669) | (364) | ||||||||||||||||||||||
| Total change due to NPA | 155 | 339 | 303 | (457) | ||||||||||||||||||||||
| Net impact on pre-tax income (loss) | $ | 464 | $ | (40) | $ | 983 | $ | 67 | ||||||||||||||||||
| Impact to Condensed Consolidated Income Statement | ||||||||||||||||||||||||||
| Net investment income, net of related interest credited to policyholder account balances | $ | 10 | $ | 13 | $ | 23 | $ | 31 | ||||||||||||||||||
| Net realized gains (losses) | 454 | (53) | 960 | 36 | ||||||||||||||||||||||
| Net impact on pre-tax income (loss) | $ | 464 | $ | (40) | $ | 983 | $ | 67 | ||||||||||||||||||
| Net change in value of economic hedge target and related hedges | ||||||||||||||||||||||||||
| Net impact on economic gains (losses) | $ | 241 | $ | 267 | $ | 369 | $ | 77 | ||||||||||||||||||
*
The change in fair value of available-for-sale fixed maturity securities recognized as a component of other comprehensive income (loss) were losses of $215 million and $430 million for the three- and six-month periods ended June 30, 2022 due to higher interest rates and wider credit spreads. The change in fair value of available-for-sale fixed maturity securities recognized as a component of other comprehensive income (loss) were gains of $105 million for the three-month period ended June 30, 2021 due to lower interest rates, and losses of $111 million for the six-month period ended June 30, 2021, due to higher interest rates.
The three-month period ended June 30, 2022 net impact on pre-tax income (loss) of $464 million resulted from:
•
$309 million gain in the fair value of embedded derivatives excluding NPA, net of the hedging portfolio was driven by increases in interest rates, partially offset by lower equity markets.
•
$155 million gain due to NPA was driven by a widening of the NPA credit spread, partially offset by the impact of higher interest rates that resulted in NPA volume losses from lower expected GMWB payments.
|
138
|
AIG | Second Quarter 2022 Form 10-Q
|
||||
On an economic basis, the changes in the fair value of the hedge portfolio were partially offset by the changes in the economic hedge target. In the three months ended June 30, 2022, we had a net mark-to-market gain of approximately $241 million from our hedging activities related to our economic hedge target primarily driven by widening credit spreads.
The six-month period ended June 30, 2022 net impact on pre-tax income (loss) of $983 million resulted from:
•
$680 million gain in the fair value of embedded derivatives excluding NPA, net of the hedging portfolio was driven by increases in interest rates, partially offset by lower equity markets.
•
$303 million gain due to NPA was driven by a widening of the NPA credit spread, partially offset by the impact of higher interest rates that resulted in NPA volume losses from lower expected GMWB payments.
On an economic basis, the changes in the fair value of the hedge portfolio were partially offset by the changes in the economic hedge target. In the six months ended June 30, 2022, we had a net mark-to-market gain of approximately $369 million from our hedging activities related to our economic hedge target primarily driven by widening credit spreads.
The three-month period ended June 30, 2021 net impact on pre-tax income (loss) of $(40) million resulted from:
•
$379 million loss in the fair value of embedded derivatives excluding NPA, net of the hedging portfolio was driven by impact of lower interest rates partially offset by gains from higher equity markets.
•
$339 million gain due to NPA driven by a slight widening of the NPA credit spread and the impact of lower interest rates that resulted in NPA volume gains from higher expected GMWB payments.
On an economic basis, the changes in the fair value of the hedge portfolio were partially offset by the changes in the economic hedge target. In the three months ended June 30, 2021, we had a net mark-to-market gain of approximately $267 million from our hedging activities related to our economic hedge target primarily driven by widening credit spreads.
The six-month period ended June 30, 2021 net impact on pre-tax income (loss) of $67 million resulted from:
•
$524 million gain in the fair value of embedded derivatives excluding NPA, net of the hedging portfolio was driven by increases in interest rates and higher equity markets.
•
$457 million loss due to NPA was driven by a tightening of the NPA credit spread, and the impact of higher interest rates that resulted in NPA volume losses from lower expected GMWB payments.
On an economic basis, the changes in the fair value of the hedge portfolio were partially offset by the changes in the economic hedge target. In the six months ended June 30, 2021, we had a net mark-to-market gain of approximately $77 million from our hedging activities related to our economic hedge target primarily driven by positive basis risk.
Change in Economic Hedge Target
The decrease in the economic hedge target liability in the three- and six-month periods ended June 30, 2022 was primarily driven by higher interest rates and widening credit spreads, offset by lower equity markets. The increase in the economic hedge target liability in the three-month period ended June 30, 2021 was primarily driven by the decrease in rates offset by higher equity markets. The decrease in the economic hedge target liability in the first half of 2021 was primarily due to higher interest rates and equity markets.
Change in Fair Value of the Hedging Portfolio
The changes in the fair value of the economic hedge target and, to a lesser extent, the embedded derivative valuation under GAAP, were offset in part by the following changes in the fair value of the variable annuity hedging portfolio:
•
Changes in the fair value of interest rate derivative contracts, which included swaps, swaptions and futures, resulted in losses driven by higher interest rates in the three- and six-month periods ended June 30, 2022 compared to gains driven by declining interest rates in the three-month period ended June 30, 2021 and losses driven by higher interest rates in the six-month period ended June 30, 2021.
•
Changes in the fair value of equity derivative contracts, which included futures and options, resulted in gains in three- and six-month periods ended June 30, 2022 driven by the decline in the equity market compared to losses in the three- and six-month periods ended June 30, 2021.
•
Changes in the fair value of fixed maturity securities, primarily corporate bonds, are used as a capital-efficient way to economically hedge interest rate and credit spread-related risk. The change in the fair value of the corporate bond hedging program in the three- and six-month periods ended June 30, 2022 reflected losses due to increases in interest rates and widening credit spreads. The change in the fair value of the corporate bond hedging program in the three-month period ended June 30, 2021 reflected gains due to decreases in interest rates. The change in the fair value of the corporate bond hedging program in the six-month period ended June 30, 2021 reflected losses due to increases in interest rates, offset by tightening credit spreads.
|
AIG | Second Quarter 2022 Form 10-Q
|
139
|
||||
DAC
The following table summarizes the major components of the changes in DAC, including VOBA, within the Life and Retirement companies:
| Six Months Ended June 30, | ||||||||||||||
| (in millions) | 2022 | 2021 | ||||||||||||
| Balance, beginning of year | $ | 8,086 | $ | 7,316 | ||||||||||
| Acquisition costs deferred | 495 | 535 | ||||||||||||
| Amortization expense: | ||||||||||||||
| Related to realized gains and losses | (396) | (78) | ||||||||||||
| All other operating amortization | (581) | (393) | ||||||||||||
| Increase (decrease) in DAC due to foreign exchange | (73) | 6 | ||||||||||||
| Change related to unrealized depreciation (appreciation) of investments | 4,724 | 603 | ||||||||||||
|
Balance, end of period
(a)
|
$ | 12,255 | $ | 7,989 | ||||||||||
(a)
DAC balance excluding the amount related to unrealized depreciation (appreciation) of investments was $9.9 billion and $10.5 billion at June 30, 2022 and 2021, respectively.
DAC and Reserves Related to Unrealized Appreciation of Investments
DAC and Reserves for universal life insurance and investment-oriented products are adjusted at each balance sheet date to reflect the change in DAC, unearned revenue, and benefit reserves with an offset to Other comprehensive income (loss) (OCI) as if securities available for sale had been sold at their stated aggregate fair value and the proceeds reinvested at current yields (changes related to unrealized appreciation (depreciation) of investments). Similarly, for long-duration traditional products, significant unrealized appreciation of investments in a sustained low interest rate environment may cause additional future policy benefit liabilities with an offset to OCI to be recorded.
Changes related to unrealized appreciation (depreciation) of investments related to DAC and unearned revenue generally move in the opposite direction of the change in unrealized appreciation of the available for sale securities portfolio, reducing the reported DAC and unearned revenue balance when market interest rates decline. Conversely, changes related to unrealized appreciation (depreciation) of investments related to benefit reserves generally move in the same direction as the change in unrealized appreciation of the available for sale securities portfolio, increasing reported future policy benefit liabilities balance when market interest rates decline.
Market conditions in the six-month period ended June 30, 2022 drove a $32 billion decrease in the unrealized appreciation of the available for sale fixed maturity securities portfolio held to support the Life and Retirement businesses at June 30, 2022 compared to December 31, 2021. At June 30, 2022, the changes related to unrealized appreciation (depreciation) of investments reflected increases in amortized balances including DAC and unearned revenue reserves, while accrued liabilities such as policyholder benefit liabilities decreased $727 million from December 31, 2021.
|
140
|
AIG | Second Quarter 2022 Form 10-Q
|
||||
Reserves
The following table presents a rollforward of insurance reserves by operating segments for Life and Retirement, including future policy benefits, policyholder contract deposits, other policyholder funds, and separate account liabilities, as well as Retail Mutual Funds and Group Retirement mutual fund assets under administration:
| Three Months Ended | Six Months Ended | |||||||||||||||||||||||||
| June 30, | June 30, | |||||||||||||||||||||||||
| (in millions) | 2022 | 2021 | 2022 | 2021 | ||||||||||||||||||||||
| Individual Retirement | ||||||||||||||||||||||||||
| Balance at beginning of period, gross | $ | 143,834 | $ | 148,110 | $ | 148,492 | $ | 148,837 | ||||||||||||||||||
| Premiums and deposits | 3,620 | 3,978 | 7,501 | 7,351 | ||||||||||||||||||||||
| Surrenders and withdrawals | (2,229) | (3,238) | (4,434) | (6,349) | ||||||||||||||||||||||
| Death and other contract benefits | (763) | (817) | (1,565) | (1,653) | ||||||||||||||||||||||
| Subtotal | 144,462 | 148,033 | 149,994 | 148,186 | ||||||||||||||||||||||
| Change in fair value of underlying assets and reserve accretion, net of policy fees | (7,853) | 3,777 | (13,341) | 3,534 | ||||||||||||||||||||||
|
Cost of funds
(a)
|
440 | 415 | 868 | 829 | ||||||||||||||||||||||
| Other reserve changes | (431) | 234 | (903) | (90) | ||||||||||||||||||||||
| Balance at end of period | 136,618 | 152,459 | 136,618 | 152,459 | ||||||||||||||||||||||
| Reinsurance ceded | (311) | (312) | (311) | (312) | ||||||||||||||||||||||
| Total Individual Retirement insurance reserves and mutual fund assets | $ | 136,307 | $ | 152,147 | $ | 136,307 | $ | 152,147 | ||||||||||||||||||
| Group Retirement | ||||||||||||||||||||||||||
| Balance at beginning of period, gross | $ | 112,773 | $ | 112,732 | $ | 118,492 | $ | 110,651 | ||||||||||||||||||
| Premiums and deposits | 1,772 | 2,255 | 3,660 | 4,073 | ||||||||||||||||||||||
| Surrenders and withdrawals | (2,074) | (2,263) | (4,547) | (4,747) | ||||||||||||||||||||||
| Death and other contract benefits | (246) | (221) | (480) | (448) | ||||||||||||||||||||||
| Subtotal | 112,225 | 112,503 | 117,125 | 109,529 | ||||||||||||||||||||||
| Change in fair value of underlying assets and reserve accretion, net of policy fees | (9,984) | 4,206 | (15,096) | 7,049 | ||||||||||||||||||||||
|
Cost of funds
(a)
|
281 | 284 | 559 | 564 | ||||||||||||||||||||||
| Other reserve changes | 8 | (51) | (58) | (200) | ||||||||||||||||||||||
| Balance at end of period | 102,530 | 116,942 | 102,530 | 116,942 | ||||||||||||||||||||||
| Total Group Retirement insurance reserves and mutual fund assets | $ | 102,530 | $ | 116,942 | $ | 102,530 | $ | 116,942 | ||||||||||||||||||
| Life Insurance | ||||||||||||||||||||||||||
| Balance at beginning of period, gross | $ | 27,510 | $ | 27,589 | $ | 28,415 | $ | 27,998 | ||||||||||||||||||
| Premiums and deposits | 1,049 | 1,056 | 2,106 | 2,085 | ||||||||||||||||||||||
| Surrenders and withdrawals | (109) | (116) | (264) | (260) | ||||||||||||||||||||||
| Death and other contract benefits | (131) | (138) | (274) | (311) | ||||||||||||||||||||||
| Subtotal | 28,319 | 28,391 | 29,983 | 29,512 | ||||||||||||||||||||||
| Change in fair value of underlying assets and reserve accretion, net of policy fees | (400) | (198) | (734) | (406) | ||||||||||||||||||||||
|
Cost of funds
(a)
|
87 | 89 | 172 | 177 | ||||||||||||||||||||||
| Other reserve changes | (1,292) | 25 | (2,707) | (976) | ||||||||||||||||||||||
| Balance at end of period | 26,714 | 28,307 | 26,714 | 28,307 | ||||||||||||||||||||||
| Reinsurance ceded | (1,552) | (1,488) | (1,552) | (1,488) | ||||||||||||||||||||||
| Total Life Insurance reserves | $ | 25,162 | $ | 26,819 | $ | 25,162 | $ | 26,819 | ||||||||||||||||||
|
AIG | Second Quarter 2022 Form 10-Q
|
141
|
||||
| Institutional Markets | ||||||||||||||||||||||||||
| Balance at beginning of period, gross | $ | 30,153 | $ | 26,813 | $ | 30,264 | $ | 27,342 | ||||||||||||||||||
| Premiums and deposits | 550 | 1,641 | 877 | 1,721 | ||||||||||||||||||||||
| Surrenders and withdrawals | (53) | (607) | (69) | (919) | ||||||||||||||||||||||
| Death and other contract benefits | (232) | (194) | (506) | (402) | ||||||||||||||||||||||
| Subtotal | 30,418 | 27,653 | 30,566 | 27,742 | ||||||||||||||||||||||
| Change in fair value of underlying assets and reserve accretion, net of policy fees | (93) | 280 | (176) | 445 | ||||||||||||||||||||||
|
Cost of funds
(a)
|
71 | 73 | 130 | 146 | ||||||||||||||||||||||
| Other reserve changes | (282) | (7) | (406) | (334) | ||||||||||||||||||||||
| Balance at end of period | 30,114 | 27,999 | 30,114 | 27,999 | ||||||||||||||||||||||
| Reinsurance ceded | (45) | (45) | (45) | (45) | ||||||||||||||||||||||
| Total Institutional Markets reserves | $ | 30,069 | $ | 27,954 | $ | 30,069 | $ | 27,954 | ||||||||||||||||||
| Total insurance reserves and mutual fund assets | ||||||||||||||||||||||||||
| Balance at beginning of period, gross | $ | 314,270 | $ | 315,244 | $ | 325,663 | $ | 314,828 | ||||||||||||||||||
| Premiums and deposits | 6,991 | 8,930 | 14,144 | 15,230 | ||||||||||||||||||||||
| Surrenders and withdrawals | (4,465) | (6,224) | (9,314) | (12,275) | ||||||||||||||||||||||
| Death and other contract benefits | (1,372) | (1,370) | (2,825) | (2,814) | ||||||||||||||||||||||
| Subtotal | 315,424 | 316,580 | 327,668 | 314,969 | ||||||||||||||||||||||
| Change in fair value of underlying assets and reserve accretion, net of policy fees | (18,330) | 8,065 | (29,347) | 10,622 | ||||||||||||||||||||||
|
Cost of funds
(a)
|
879 | 861 | 1,729 | 1,716 | ||||||||||||||||||||||
| Other reserve changes | (1,997) | 201 | (4,074) | (1,600) | ||||||||||||||||||||||
| Balance at end of period, excluding Fortitude Re reserves | 295,976 | 325,707 | 295,976 | 325,707 | ||||||||||||||||||||||
|
Fortitude Re reserves
(b)
|
27,485 | 28,118 | 27,485 | 28,118 | ||||||||||||||||||||||
| Balance at end of period, including Fortitude Re reserves | 323,461 | 353,825 | 323,461 | 353,825 | ||||||||||||||||||||||
|
Fortitude Re reinsurance ceded
(b)
|
(27,485) | (28,118) | (27,485) | (28,118) | ||||||||||||||||||||||
| Reinsurance ceded | (1,908) | (1,845) | (1,908) | (1,845) | ||||||||||||||||||||||
| Total insurance reserves and mutual fund assets | $ | 294,068 | $ | 323,862 | $ | 294,068 | $ | 323,862 | ||||||||||||||||||
(a)
Excludes amortization of deferred sales inducements.
(b)
Includes amounts related to policies where AIG has partially ceded to other reinsurers and Fortitude Re.
Insurance reserves and Group Retirement mutual fund assets under administration, were comprised of the following balances:
| (in millions) | June 30, 2022 | December 31, 2021 | ||||||||||||
| Future policy benefits | $ | 55,669 | $ | 57,749 | ||||||||||
| Policyholder contract deposits | 156,634 | 156,844 | ||||||||||||
|
Other policyholder funds
(a)
|
1,009 | 833 | ||||||||||||
| Separate account liabilities | 86,735 | 109,111 | ||||||||||||
| Total insurance reserves | 300,047 | 324,537 | ||||||||||||
| Mutual fund assets | 23,414 | 28,780 | ||||||||||||
| Total insurance reserves and mutual fund assets | $ | 323,461 | $ | 353,317 | ||||||||||
(a)
Excludes unearned revenue liability.
|
142
|
AIG | Second Quarter 2022 Form 10-Q
|
||||
|
|
||
Liquidity and Capital Resources
OVERVIEW
Liquidity
refers to the ability to generate sufficient cash resources to meet our payment obligations. It is defined as cash and unencumbered assets that can be monetized in a short period of time at a reasonable cost. Our liquidity risk framework is designed to manage liquidity at both AIG Parent and its subsidiaries to meet our financial obligations for a minimum of six months under a liquidity stress scenario.
Capital
refers to the long-term financial resources available to support the operation of our businesses, fund business growth, and cover financial and operational needs that arise from adverse circumstances.
For additional information, see Part II, Item 7. MD&A – Enterprise Risk Management – Risk Appetite, Limits, Identification and Measurement and Part II, Item 7. MD&A – Enterprise Risk Management – Liquidity Risk Management in the 2021 Annual Report.
We believe that we have sufficient liquidity and capital resources to satisfy future requirements and meet our obligations to policyholders, customers, creditors and debt-holders, including those arising from reasonably foreseeable contingencies or events.
Nevertheless, some circumstances may cause our cash or capital needs to exceed projected liquidity or readily deployable capital resources. Additional collateral calls, deterioration in investment portfolios or reserve strengthening affecting statutory surplus, higher surrenders of annuities and other policies, downgrades in credit ratings, catastrophic losses or fluctuations in the capital markets generally may result in significant additional cash or capital needs and loss of sources of liquidity and capital. Other potential events that could cause a liquidity strain include an economic collapse of a nation or region significant to our operations, nationalization, catastrophic terrorist acts, pandemics or other events causing economic or political upheaval. In addition, regulatory and other legal restrictions could limit our ability to transfer funds freely, either to or from our subsidiaries.
Depending on market conditions, regulatory and rating agency considerations and other factors, we may take various liability and capital management actions. Liability management actions may include, but are not limited to, repurchasing or redeeming outstanding debt, issuing new debt or engaging in debt exchange offers. Capital management actions may include, but are not limited to, issuing preferred stock, paying dividends to our shareholders on the AIG Common Stock, par value $2.50 per share (AIG Common Stock), paying dividends to the holders of our Series A 5.85% Non-Cumulative Perpetual Preferred Stock (Series A Preferred Stock), and repurchases of AIG Common Stock.
|
AIG | Second Quarter 2022 Form 10-Q
|
143
|
||||
LIQUIDITY AND CAPITAL RESOURCES HIGHLIGHTS
|
SOURCES
|
||
Liquidity to AIG Parent from Subsidiaries
During the six-month period ended June 30, 2022, our General Insurance companies distributed cash and fixed maturity securities of $807 million, and our Life and Retirement companies distributed $1.7 billion of cash to AIG Parent or applicable intermediate holding companies.
Note offering of Corebridge
On April 5, 2022, Corebridge issued senior unsecured notes in the aggregate principal amount of $6.5 billion, the proceeds of which were used to repay a portion of the $8.3 billion promissory note previously issued by Corebridge to AIG in November 2021.
|
USES
|
||
General Borrowings
During the six-month period ended June 30, 2022, $7.6 billion of debt categorized as general borrowings matured, was repaid or redeemed as follows:
•
Redeemed €750 million aggregate principal amount of our 1.500% Notes due 2023 for a redemption price of 101.494 percent of the principal amount, plus accrued and unpaid interest.
•
Repurchased, through cash tender offers, approximately $6.8 billion aggregate principal amount of certain notes and debentures issued or guaranteed by AIG for an aggregate purchase price of approximately $7.1 billion.
We made interest payments on our general borrowings totaling $490 million during the six-month period ended June 30, 2022 including interest payments made by AIG Parent on AIG Parent-issued debt instruments of $464 million.
Dividends
During the six-month period ended June 30, 2022:
•
We made quarterly cash dividend payments of $365.625 per share on AIG’s Series A Preferred Stock totaling $15 million.
•
We made quarterly cash dividend payments of $0.32 per share on AIG Common Stock totaling $506 million.
•
Corebridge made cash dividend payments of $57 million in the aggregate to Blackstone.
Repurchases of Common Stock
(a)
During the six-month period ended June 30, 2022, AIG Parent repurchased approximately 53 million shares of AIG Common Stock, for an aggregate purchase price of approximately $3.1 billion.
(a)
Pursuant to a Securities Exchange Act of 1934 (the Exchange Act) Rule 10b5-1 repurchase plan, from July 1, 2022 to August 3, 2022, we repurchased approximately 11 million shares of AIG Common Stock for an aggregate purchase price of approximately $556 million.
ANALYSIS OF SOURCES AND USES OF CASH
Operating Cash Flow Activities
Insurance companies generally receive most premiums in advance of the payment of claims or policy benefits. The ability of insurance companies to generate positive cash flow is affected by the frequency and severity of losses under their insurance policies, policy retention rates, effective management of our investment portfolio and operating expense discipline.
Interest payments totaled $574 million and $592 million in the six-month periods ended June 30, 2022 and 2021. Excluding interest payments, AIG had operating cash inflows of $1.2 billion in the six-month period ended June 30, 2022 compared to operating cash inflows of $3.4 billion in the same period in the prior year.
Investing Cash Flow Activities
Net cash provided by investing activities in the six-month period ended June 30, 2022 was $2.5 billion compared to net cash used in investing activities of $1.6 billion in the same period in the prior year.
|
144
|
AIG | Second Quarter 2022 Form 10-Q
|
||||
Financing Cash Flow Activities
Net cash used in financing activities in the six-month period ended June 30, 2022 reflected:
•
$506 million to pay a dividend of $0.32 per share per quarter on AIG Common Stock;
•
$15 million to pay a dividend of $365.625 per share per quarter on AIG’s Series A Preferred Stock;
•
$57 million paid by Corebridge in the form of a cash dividend to Blackstone;
•
$3.1 billion to repurchase approximately 53 million shares of AIG Common Stock;
•
$1.1 billion in net outflows from the issuance and repayment of long-term debt; and
•
$133 million in net outflows from the issuance and repayment of debt of consolidated investment entities.
Net cash used in financing activities in the six-month period ended June 30, 2021 reflected:
•
$550 million to pay a dividend of $0.32 per share per quarter on AIG Common Stock;
•
$15 million to pay a dividend of $365.625 per share per quarter on AIG’s Series A Preferred Stock;
•
$592 million to repurchase approximately 13 million shares of AIG Common Stock;
•
$1.8 billion in net outflows from the issuance and repayment of long-term debt; and
•
$18 million in net outflows from the issuance and repayment of debt of consolidated investment entities.
LIQUIDITY AND CAPITAL RESOURCES OF AIG PARENT AND SUBSIDIARIES
AIG Parent
As of June 30, 2022, AIG Parent and applicable intermediate holding companies had approximately $10.1 billion in liquidity sources. AIG Parent’s liquidity sources are primarily held in the form of cash, short-term investments and publicly traded, investment grade rated fixed maturity securities and also include a committed, revolving syndicated credit facility. Fixed maturity securities primarily include U.S. government and government sponsored entity securities, U.S. agency mortgage-backed securities, corporate and municipal bonds and certain other highly rated securities. AIG Parent actively manages its assets and liabilities in terms of products, counterparties and duration. Based upon an assessment of funding needs, the liquidity sources can be readily monetized through sales or repurchase agreements or contributed as admitted assets to regulated insurance companies. AIG Parent liquidity is monitored through the use of various internal liquidity risk measures. AIG Parent’s primary sources of liquidity are dividends, distributions, loans and other payments from subsidiaries and credit facilities. AIG Parent’s primary uses of liquidity are for debt service, capital and liability management, and operating expenses.
We believe that we have sufficient liquidity and capital resources to satisfy our reasonably foreseeable future requirements and meet our obligations to our creditors, debt-holders and insurance company subsidiaries. We expect to access the debt and preferred equity markets from time to time to meet funding requirements as needed.
We utilize our capital resources to support our businesses, with the majority of capital allocated to our insurance operations. Should we have or generate more capital than is needed to support our business strategies (including organic growth or acquisition opportunities) or mitigate risks inherent to our business, we may develop plans to distribute such capital to shareholders via dividends or AIG Common Stock repurchase authorizations or deploy such capital towards liability management.
In the normal course, it is expected that a portion of the capital released by our insurance companies, by our other operations or through the utilization of AIG’s deferred tax assets may be available to support our business strategies, for distribution to shareholders or for liability management.
In developing plans to distribute capital, AIG considers a number of factors, including, but not limited to: AIG’s business and strategic plans, expectations for capital generation and utilization, AIG’s funding capacity and capital resources in comparison to internal benchmarks, as well as rating agency expectations, regulatory requirements, bank creditor covenants and internal stress tests for capital.
|
AIG | Second Quarter 2022 Form 10-Q
|
145
|
||||
The following table presents AIG Parent and applicable intermediate holding companies liquidity sources:
| As of | As of | |||||||||||||
| (in millions) | June 30, 2022 | December 31, 2021 | ||||||||||||
|
Cash and short-term investments
(a)
|
$ | 2,235 | $ | 4,334 | ||||||||||
|
Unencumbered fixed maturity securities
(b)
|
3,328 | 6,357 | ||||||||||||
| Total AIG Parent liquidity | 5,563 | 10,691 | ||||||||||||
|
Available capacity under committed, syndicated credit facility
(c)
|
4,500 | 4,500 | ||||||||||||
| Total AIG Parent liquidity sources | $ | 10,063 | $ | 15,191 | ||||||||||
(a)
Cash and short-term investments include agreements in which securities are purchased by us under agreements to resell totaling $409 million and $1.9 billion as of June 30, 2022 and December 31, 2021, respectively.
(b)
Unencumbered securities consist of publicly traded, investment grade rated fixed maturity securities. Fixed maturity securities primarily include U.S. government and government sponsored entity securities, U.S. agency mortgage-backed securities, corporate and municipal bonds and certain other highly rated securities.
(c)
For additional information relating to this committed, syndicated credit facility, see – Credit Facilities below.
Insurance Companies
We expect that our insurance companies will be able to continue to satisfy reasonably foreseeable future liquidity requirements and meet their obligations, including those arising from reasonably foreseeable contingencies or events, through cash from operations and, to the extent necessary, monetization of invested assets. Our insurance companies’ liquidity resources are primarily held in the form of cash, short-term investments and publicly traded, investment grade rated fixed maturity securities.
Each of our material insurance companies’ liquidity is monitored through various internal liquidity risk measures. The primary sources of liquidity are premiums, fees, reinsurance recoverables and investment income and maturities. The primary uses of liquidity are paid losses, reinsurance payments, benefit claims, surrenders, withdrawals, interest payments, dividends, expenses, investment purchases and collateral requirements.
Our insurance companies may require additional funding to meet capital or liquidity needs under certain circumstances. For example, large catastrophes may require us to provide additional support to the affected operations of our General Insurance companies, and a shift in interest rates may require us to provide support to the affected operations of our Life and Retirement companies.
Downgrades in our credit ratings could put pressure on the insurer financial strength ratings of our subsidiaries, which could result in non-renewals or cancellations by policyholders and adversely affect a subsidiary’s ability to meet its own obligations. Increases in market interest rates may adversely affect the financial strength ratings of our subsidiaries, as rating agency capital models may reduce the amount of available capital relative to required capital.
Management believes that because of the size and liquidity of our Life and Retirement companies’ investment portfolios, normal deviations from projected claim or surrender experience would not create significant liquidity risk. Furthermore, our Life and Retirement companies’ products contain certain features that mitigate surrender risk, including surrender charges. However, in times of extreme capital markets disruption or as a result of fluctuations in the capital markets generally, liquidity needs could outpace resources.
As part of their risk management framework, our insurance companies continue to evaluate and, where appropriate, pursue strategies and programs to improve their liquidity position and facilitate their ability to maintain a fully invested asset portfolio.
Certain of our U.S. insurance companies are members of the FHLBs in their respective districts. Borrowings from FHLBs are used to supplement liquidity or for other uses deemed appropriate by management. Our U.S. General Insurance companies had no outstanding borrowings from FHLBs at both June 30, 2022 and December 31, 2021. Our U.S. Life and Retirement companies had $3.6 billion which were due to FHLBs in their respective districts at both June 30, 2022 and December 31, 2021, under funding agreements issued through our Individual Retirement, Group Retirement and Institutional Markets operating segments, which were reported in Policyholder contract deposits. Proceeds from funding agreements are generally invested in fixed income securities and other investments intended to generate spread income. These investment contracts do not have mortality or morbidity risk and are similar to GICs. In addition, our U.S. Life and Retirement companies had no outstanding borrowings in the form of cash advances from FHLBs at both June 30, 2022 and December 31, 2021.
Certain of our U.S. Life and Retirement companies have programs, which began in 2012, that lend securities from their investment portfolio to supplement liquidity or for other uses as deemed appropriate by management. Under these programs, these U.S. Life and Retirement companies lend securities to financial institutions and receive cash as collateral equal to 102 percent of the fair value of the loaned securities. Cash collateral received is invested in short-term investments or partially used for short-term liquidity purposes. Additionally, the aggregate amount of securities that a Life and Retirement company is able to lend under its program at any time is limited to five percent of its general account statutory-basis admitted assets.
Our U.S. Life and Retirement companies had $2.6 billion and $3.3 billion of securities subject to these agreements at June 30, 2022 and December 31, 2021, respectively, and $3.2 billion and $3.4 billion of liabilities to borrowers for collateral received at June 30, 2022 and December 31, 2021, respectively.
|
146
|
AIG | Second Quarter 2022 Form 10-Q
|
||||
AIG generally manages capital between AIG Parent and our insurance companies through internal, Board-approved policies and limits, as well as management standards. In addition, AIG Parent has unconditional capital maintenance agreements in place with certain subsidiaries. Nevertheless, regulatory and other legal restrictions could limit our ability to transfer capital freely, either to or from our subsidiaries.
AIG Parent and/or certain subsidiaries are parties to several letter of credit agreements with various financial institutions, which issue letters of credit from time to time in support of our insurance companies. These letters of credit are subject to reimbursement by AIG Parent and/or certain subsidiaries in the event of a drawdown of these letters of credit. Letters of credit issued in support of the General Insurance companies totaled approximately $4.0 billion at June 30, 2022. Letters of credit issued in support of the Life and Retirement companies totaled approximately $272 million at June 30, 2022, of which $175 million are subject to reimbursement by Corebridge with no recourse to AIG Parent.
In the six-month period ended June 30, 2022, our General Insurance companies collectively paid to AIG Parent or applicable intermediate holding companies a total of approximately $775 million in dividends in the form of cash and fixed maturity securities and $32 million in tax sharing payments in the form of cash. The fixed maturity securities primarily included U.S. treasuries and securities issued by U.S. agencies.
In the six-month period ended June 30, 2022, our Life and Retirement companies collectively paid to AIG Parent or applicable intermediate holding companies a total of approximately $893 million in dividends in the form of cash and $834 million in tax sharing payments in the form of cash.
On November 1, 2021, Corebridge declared a dividend payable to AIG Parent in the amount of $8.3 billion. In connection with such dividend, Corebridge issued a promissory note to AIG Parent in the amount of $8.3 billion, which is required to be paid to AIG Parent prior to the initial public offering of Corebridge. As of August 8, 2022, Corebridge repaid approximately $6.5 billion of the $8.3 billion promissory note.
CREDIT FACILITIES
We maintain a committed, revolving syndicated credit facility (the Facility) as a potential source of liquidity for general corporate purposes. The Facility provides for aggregate commitments by the bank syndicate to provide unsecured revolving loans and/or standby letters of credit of up to $4.5 billion without any limits on the type of borrowings and is scheduled to expire in November 2026.
As of June 30, 2022, a total of $4.5 billion remained available for borrowing under the Facility. Our ability to utilize the Facility is not contingent on our credit ratings. However, our ability to utilize the Facility is conditioned on the satisfaction of certain legal, operating, administrative and financial covenants and other requirements contained in the Facility. These include covenants relating to our maintenance of a specified total consolidated net worth and total consolidated debt to total consolidated capitalization. Failure to satisfy these and other requirements contained in the Facility would restrict our access to the Facility and could have a material adverse effect on our financial condition, results of operations and liquidity. We expect to utilize the Facility from time to time, and may use the proceeds for general corporate purposes.
On February 25, 2022, Corebridge entered into an 18-Month Delayed Draw Term Loan Agreement (the 18-Month DDTL Facility) among Corebridge, as borrower, the lenders party thereto and the administrative agent thereto, and a 3-Year Delayed Draw Term Loan Agreement (the 3-Year DDTL Facility) among Corebridge, as borrower, the lenders party thereto and the administrative agent thereto.
The 18-Month DDTL Facility and 3-Year DDTL Facility provided Corebridge with committed delayed draw term loan facilities in the aggregate principal amount of $6 billion and $3 billion, respectively. On April 6, 2022, in connection with the issuance of certain senior unsecured notes of Corebridge, (i) the commitments under the 18-Month DDTL Facility were terminated in full and (ii) the commitments under the 3-Year DDTL Facility were reduced from $3.0 billion to $2.5 billion. The ability to borrow under the 3-Year DDTL Facility is subject to, among other conditions, Corebridge’s confirmation to the administrative agent that an initial public offering of Corebridge is expected to be consummated within five business days following such borrowing. Commitments under the 3-Year DDTL Facility will remain available for borrowing until December 30, 2022, subject to the terms and conditions thereof.
As of June 30, 2022, a total of $2.5 billion remained available for borrowing under the 3-Year DDTL Facility.
On May 12, 2022, Corebridge entered into a revolving syndicated credit facility (the Corebridge Facility) as a potential source of liquidity for general corporate purposes. The Corebridge Facility provides for aggregate commitments by the bank syndicate to provide unsecured revolving loans and/or standby letters of credit of up to $2.5 billion without any limits on the type of borrowings and is scheduled to expire on May 12, 2027 or if the IPO has not occurred on or prior to December 29, 2023, on such date.
As of June 30, 2022, a total of $2.5 billion remained available for borrowing under the Corebridge Facility.
|
AIG | Second Quarter 2022 Form 10-Q
|
147
|
||||
CONTRACTUAL OBLIGATIONS
As of June 30, 2022, there have been no material changes in our contractual obligations from December 31, 2021, a description of which may be found in Part II, Item 7. MD&A – Liquidity and Capital Resources – Contractual Obligations in the 2021 Annual Report.
OFF-BALANCE SHEET ARRANGEMENTS AND COMMERCIAL COMMITMENTS
As of June 30, 2022, there have been no material changes in our off-balance sheet arrangements and commercial commitments from December 31, 2021, a description of which may be found in Part II, Item 7. MD&A – Liquidity and Capital Resources – Off-Balance Sheet Arrangements and Commercial Commitments in the 2021 Annual Report.
DEBT
AIG expects to service and repay general borrowings through maturing investments and dispositions of invested assets, future cash flows from operations, cash flows generated from invested assets, future debt or preferred stock issuances and other financing arrangements. AIG borrowings supported by assets of AIG include GIAs that are supported by cash and investments held by AIG Parent, certain non-insurance subsidiaries and amounts posted to third parties as collateral for the repayment of those obligations. Total debt includes debt of consolidated investments not guaranteed by AIG.
For additional information on GIAs and associated collateral posted, see Note 5 to the Condensed Consolidated Financial Statements.
The following table provides the rollforward of AIG’s total debt outstanding:
| Six Months Ended June 30, 2022 | Balance at December 31, 2021 | Issuances |
Maturities
and Repayments |
Effect of Foreign Exchange | Other Changes | Balance at June 30, 2022 | |||||||||||||||||||||||||||||||||||
| (in millions) | |||||||||||||||||||||||||||||||||||||||||
| Debt issued or guaranteed by AIG: | |||||||||||||||||||||||||||||||||||||||||
| AIG general borrowings: | |||||||||||||||||||||||||||||||||||||||||
| Notes and bonds payable | $ | 19,633 | $ | — | $ | (7,409) | $ | (212) | $ | (20) |
(c)
|
$ | 11,992 | ||||||||||||||||||||||||||||
| Junior subordinated debt | 1,164 | — | (167) | (8) | — | 989 | |||||||||||||||||||||||||||||||||||
| AIG Japan Holdings Kabushiki Kaisha | 333 | — | — | (40) | — | 293 | |||||||||||||||||||||||||||||||||||
| AIGLH notes and bonds payable | 199 | — | — | — | 1 | 200 | |||||||||||||||||||||||||||||||||||
| AIGLH junior subordinated debt | 227 | — | — | — | — | 227 | |||||||||||||||||||||||||||||||||||
| Validus notes and bonds payable | 293 | — | (14) | — | (8) | 271 | |||||||||||||||||||||||||||||||||||
| Total AIG general borrowings | 21,849 | — | (7,590) | (260) | (27) | 13,972 | |||||||||||||||||||||||||||||||||||
|
AIG borrowings supported by assets:
(a)
|
|||||||||||||||||||||||||||||||||||||||||
| AIG notes and bonds payable | — | — | — | — | 81 |
(c)
|
81 | ||||||||||||||||||||||||||||||||||
| Series AIGFP matched notes and bonds payable | 18 | — | — | — | — | 18 | |||||||||||||||||||||||||||||||||||
| GIAs, at fair value | 1,803 | 15 | (30) | — | (161) |
(d)
|
1,627 | ||||||||||||||||||||||||||||||||||
| Notes and bonds payable, at fair value | 68 | — | (2) | — | (29) |
(d)
|
37 | ||||||||||||||||||||||||||||||||||
| Total AIG borrowings supported by assets | 1,889 | 15 | (32) | — | (109) | 1,763 | |||||||||||||||||||||||||||||||||||
| Total debt issued or guaranteed by AIG | 23,738 | 15 | (7,622) | (260) | (136) | 15,735 | |||||||||||||||||||||||||||||||||||
| Corebridge senior unsecured notes - not guaranteed by AIG | — | 6,461 | — | — | (12) | 6,449 | |||||||||||||||||||||||||||||||||||
| Other subsidiaries' notes, bonds, loans and mortgages payable - not guaranteed by AIG | 3 | — | (1) | — | — | 2 | |||||||||||||||||||||||||||||||||||
| Total long-term debt | $ | 23,741 | $ | 6,476 | $ | (7,623) | $ | (260) | $ | (148) | $ | 22,186 | |||||||||||||||||||||||||||||
| Debt of consolidated investment entities - not guaranteed by AIG | $ | 6,422 | $ | 808 | $ | (941) | $ | (37) | $ | — |
(e)
|
$ | 6,252 | ||||||||||||||||||||||||||||
(a)
AIG Parent guarantees all such debt, except for Series AIGFP matched notes and bonds payable and AIG notes and bonds payable, which are direct obligations of AIG Parent. Collateral posted to third parties were $1.4 billion at both June 30, 2022 and December 31, 2021. This collateral primarily consists of securities of the U.S. government and government sponsored entities and generally cannot be repledged or resold by the counterparties.
(b)
At June 30, 2022, includes debt of consolidated investment entities primarily related to real estate investments of $1.8 billion and other securitization vehicles of $4.4 billion. At December 31, 2021, includes debt of consolidated investment entities related to real estate investments of $1.9 billion and other securitization vehicles of $4.5 billion.
(c)
Includes reclassifications of debt between AIG general borrowings and AIG borrowings supported by assets.
(d)
Primarily represents adjustments to the fair value of debt.
(e)
Includes the effect of consolidating previously unconsolidated partnerships.
|
148
|
AIG | Second Quarter 2022 Form 10-Q
|
||||
Debt Maturities
The following table summarizes maturing long-term debt at June 30, 2022 of AIG for the next four quarters:
| Third Quarter | Fourth Quarter | First Quarter | Second Quarter | |||||||||||||||||||||||||||||
| (in millions) | 2022 | 2022 | 2023 | 2023 | Total | |||||||||||||||||||||||||||
| AIG general borrowings | $ | — | $ | 16 | $ | — | $ | 486 | $ | 502 | ||||||||||||||||||||||
| AIG borrowings supported by assets | 19 | 15 | 5 | 116 | 155 | |||||||||||||||||||||||||||
| Other subsidiaries' notes, bonds, loans and mortgages payable | 1 | — | — | — | 1 | |||||||||||||||||||||||||||
| Total | $ | 20 | $ | 31 | $ | 5 | $ | 602 | $ | 658 | ||||||||||||||||||||||
The following table presents maturities of long-term debt (including unamortized original issue discount, hedge accounting valuation adjustments and fair value adjustments, when applicable):
| June 30, 2022 | Remainder | Year Ending | ||||||||||||||||||||||||||||||||||||||||||||||||
| (in millions) | Total | of 2022 | 2023 | 2024 | 2025 | 2026 | 2027 | Thereafter | ||||||||||||||||||||||||||||||||||||||||||
| Debt issued or guaranteed by AIG: | ||||||||||||||||||||||||||||||||||||||||||||||||||
| AIG general borrowings: | ||||||||||||||||||||||||||||||||||||||||||||||||||
| Notes and bonds payable | $ | 11,992 | $ | 16 | $ | 404 | $ | 459 | $ | 2,015 | $ | 1,530 | $ | 1,044 | $ | 6,524 | ||||||||||||||||||||||||||||||||||
| Junior subordinated debt | 989 | — | — | — | — | — | — | 989 | ||||||||||||||||||||||||||||||||||||||||||
| AIG Japan Holdings Kabushiki Kaisha | 293 | — | 192 | — | 101 | — | — | — | ||||||||||||||||||||||||||||||||||||||||||
| AIGLH notes and bonds payable | 200 | — | — | — | 101 | — | — | 99 | ||||||||||||||||||||||||||||||||||||||||||
| AIGLH junior subordinated debt | 227 | — | — | — | — | — | — | 227 | ||||||||||||||||||||||||||||||||||||||||||
| Validus notes and bonds payable | 271 | — | — | — | — | — | — | 271 | ||||||||||||||||||||||||||||||||||||||||||
| Total AIG general borrowings | 13,972 | 16 | 596 | 459 | 2,217 | 1,530 | 1,044 | 8,110 | ||||||||||||||||||||||||||||||||||||||||||
| AIG borrowings supported by assets: | ||||||||||||||||||||||||||||||||||||||||||||||||||
| AIG notes and bonds payable | 81 | — | 62 | — | 12 | 7 | — | — | ||||||||||||||||||||||||||||||||||||||||||
| Series AIGFP matched notes and bonds payable | 18 | — | — | — | — | — | — | 18 | ||||||||||||||||||||||||||||||||||||||||||
| GIAs, at fair value | 1,627 | 34 | 121 | 139 | 542 | 94 | 61 | 636 | ||||||||||||||||||||||||||||||||||||||||||
| Notes and bonds payable, at fair value | 37 | — | — | — | — | — | — | 37 | ||||||||||||||||||||||||||||||||||||||||||
| Total AIG borrowings supported by assets | 1,763 | 34 | 183 | 139 | 554 | 101 | 61 | 691 | ||||||||||||||||||||||||||||||||||||||||||
| Total debt issued or guaranteed by AIG | 15,735 | 50 | 779 | 598 | 2,771 | 1,631 | 1,105 | 8,801 | ||||||||||||||||||||||||||||||||||||||||||
| Debt not guaranteed by AIG: | ||||||||||||||||||||||||||||||||||||||||||||||||||
| Corebridge senior unsecured notes | 6,449 | — | — | — | 993 | — | 1,240 | 4,216 | ||||||||||||||||||||||||||||||||||||||||||
| Other subsidiaries notes, bonds, loans and mortgages payable | 2 | 1 | 1 | — | — | — | — | — | ||||||||||||||||||||||||||||||||||||||||||
| Total debt not guaranteed by AIG | 6,451 | 1 | 1 | — | 993 | — | 1,240 | 4,216 | ||||||||||||||||||||||||||||||||||||||||||
| Total* | $ | 22,186 | $ | 51 | $ | 780 | $ | 598 | $ | 3,764 | $ | 1,631 | $ | 2,345 | $ | 13,017 | ||||||||||||||||||||||||||||||||||
*
Does not reflect $6.3 billion of notes issued by consolidated investment entities, for which recourse is limited to the assets of the respective investment entities and for which there is no recourse to the general credit of AIG.
|
AIG | Second Quarter 2022 Form 10-Q
|
149
|
||||
CREDIT RATINGS
Credit ratings estimate a company’s ability to meet its obligations and may directly affect the cost and availability of financing to that company.
The following table presents the credit ratings of AIG and certain of its subsidiaries as of the date of this filing. Figures in parentheses indicate the relative ranking of the ratings within the agency’s rating categories; that ranking refers only to the major rating category and not to the modifiers assigned by the rating agencies.
| Short-Term Debt | Senior Long-Term Debt | |||||||||||||||||||
| Moody's | S&P |
Moody's
(a)
|
S&P
(b)
|
Fitch
(c)
|
||||||||||||||||
|
American International Group, Inc.
|
P-2 (2nd of 4) | A-2 (2nd of 5) |
Baa 2 (4th of 9) /
Stable
|
BBB+ (4th of 9) /
Negative
|
BBB+ (4th of 9) /
Stable
|
|||||||||||||||
|
AIG Financial Products Corp.
(d)
|
P-2 | A-2 |
Baa 2 (4th of 9) /
Stable
|
BBB+ /
Negative
|
||||||||||||||||
|
Corebridge Financial, Inc.
|
Baa 2 (4th of 9) /
Stable
|
BBB+ (4th of 9) /
Stable
|
BBB+ (4th of 9) /
Stable |
|||||||||||||||||
(a)
Moody’s appends numerical modifiers 1, 2 and 3 to the generic rating categories to show relative position within the rating categories.
(b)
S&P ratings may be modified by the addition of a plus or minus sign to show relative standing within the major rating categories.
(c)
Fitch Ratings Inc. (Fitch) ratings may be modified by the addition of a plus or minus sign to show relative standing within the major rating categories.
(d)
AIG guarantees all obligations of AIG Financial Products Corp.
These credit ratings are current opinions of the rating agencies. They may be changed, suspended or withdrawn at any time by the rating agencies as a result of changes in, or unavailability of, information or based on other circumstances. Ratings may also be withdrawn at our request.
For a discussion of rating agency actions in response to AIG’s separation of its Life and Retirement business from AIG, see – Rating Agency Actions Related to Corebridge Senior Note Offering and Other Recent Actions below.
We are party to some agreements that contain “ratings triggers.” Depending on the ratings maintained by one or more rating agencies, these triggers could result in (i) the termination or limitation of credit availability or a requirement for accelerated repayment, (ii) the termination of business contracts or (iii) a requirement to post collateral for the benefit of counterparties.
In the event of a downgrade of AIG’s long-term senior debt ratings, AIG Financial Products Corp. and related subsidiaries (collectively AIGFP) and certain other AIG entities would be required to post additional collateral under some derivative and other transactions, or certain of the counterparties of AIGFP or of such other AIG entities would be permitted to terminate such transactions early.
The actual amount of collateral that we would be required to post to counterparties in the event of such downgrades, or the aggregate amount of payments that we could be required to make, depends on market conditions, the fair value of outstanding affected transactions and other factors prevailing at the time of the downgrade.
For information regarding the effects of downgrades in our credit ratings see Note 9 to the Condensed Consolidated Financial Statements and Part I, Item 1A. Risk Factors – Liquidity, Capital and Credit – “A downgrade by one or more of the rating agencies in the Insurer Financial Strength ratings of our insurance or reinsurance companies could limit their ability to write or prevent them from writing new business and impair their retention of customers and in-force business, and a downgrade in our credit ratings could adversely affect our business, results of operations, financial condition and liquidity” in the 2021 Annual Report.
FINANCIAL STRENGTH RATINGS
Financial Strength ratings estimate an insurance company’s ability to pay its obligations under an insurance policy.
The following table presents the ratings of our significant insurance subsidiaries as of the date of this filing.
| A.M. Best | S&P | Fitch | Moody’s | |||||||||||
| National Union Fire Insurance Company of Pittsburgh, Pa. | A | A+ | A | A2 | ||||||||||
| Lexington Insurance Company | A | A+ | A | A2 | ||||||||||
| American Home Assurance Company | A | A+ | A | A2 | ||||||||||
| American General Life Insurance Company | A | A+ | A+ | A2 | ||||||||||
| The Variable Annuity Life Insurance Company | A | A+ | A+ | A2 | ||||||||||
| United States Life Insurance Company in the City of New York | A | A+ | A+ | A2 | ||||||||||
| AIG Europe S.A. | NR | A+ | NR | A2 | ||||||||||
| American International Group UK Ltd. | A | A+ | NR | A2 | ||||||||||
| AIG General Insurance Co. Ltd. | NR | A+ | NR | NR | ||||||||||
| Validus Reinsurance, Ltd. | A | A+ | NR | NR | ||||||||||
|
150
|
AIG | Second Quarter 2022 Form 10-Q
|
||||
These financial strength ratings are current opinions of the rating agencies. They may be changed, suspended or withdrawn at any time by the rating agencies as a result of changes in, or unavailability of, information or based on other circumstances.
For information regarding the effects of downgrades in our financial strength ratings see Note 9 to the Condensed Consolidated Financial Statements and Part I, Item 1A. Risk Factors – Liquidity, Capital and Credit – “A downgrade by one or more of the rating agencies in the Insurer Financial Strength ratings of our insurance or reinsurance companies could limit their ability to write or prevent them from writing new business and impair their retention of customers and in-force business, and a downgrade in our credit ratings could adversely affect our business, results of operations, financial condition and liquidity” in the 2021 Annual Report.
RATING AGENCY ACTIONS RELATED TO COREBRIDGE SENIOR NOTE OFFERING AND OTHER RECENT ACTIONS
•
On March 29, 2022, Moody’s affirmed ratings on Corebridge entities and revised the outlook from Negative to Stable. On March 31, 2022, Moody’s assigned a Baa2 rating to the senior debt of Corebridge.
•
On March 29, 2022, S&P affirmed the ratings of AIG and subsidiaries and revised the outlook on AIG and General Insurance from CreditWatch Negative to Negative. On March 29, 2022, S&P affirmed the ratings of Corebridge and revised the outlook from CreditWatch Developing to Stable. On March 31, 2022, S&P assigned a rating of BBB+ to the senior debt of Corebridge.
•
On March 4, 2022, Fitch affirmed the ratings of AIG and subsidiaries and revised the outlook on General Insurance from Stable to Positive and revised the outlook for AIG senior debt from Rating Watch Negative to Stable. On March 31, 2022, Fitch assigned a rating of BBB+ to the senior debt of Corebridge.
•
On October 7, 2021, A.M. Best affirmed all of the financial strength and issuer credit ratings of AIG and subsidiaries with Stable outlooks.
REGULATION AND SUPERVISION
For a discussion of our regulation and supervision by different regulatory authorities in the United States and abroad, including with respect to our liquidity and capital resources see Part I, Item 1. Business – Regulation and Part I, Item 1A. Risk Factors – Regulation in the 2021 Annual Report, and Regulatory Environment below in this MD&A.
DIVIDENDS
The following table presents declaration date, record date, payment date and dividends paid per common share on AIG Common Stock in the six months ended June 30, 2022:
| Declaration Date | Record Date | Payment Date |
Dividends Paid
Per Common Share |
||||||||
| May 3, 2022 | June 16, 2022 | June 30, 2022 | $ | 0.32 | |||||||
| February 16, 2022 | March 17, 2022 | March 31, 2022 | 0.32 | ||||||||
On August 8, 2022, our Board of Directors declared a cash dividend on AIG Common Stock of $0.32 per share, payable on September 30, 2022 to shareholders of record on September 16, 2022.
The following table presents declaration date, record date, payment date and dividends paid per preferred share and per depository share on the Series A Preferred Stock in the six months ended June 30, 2022:
| Dividends Paid | ||||||||||||||
| Declaration Date | Record Date | Payment Date | Per Preferred Share | Per Depositary Share | ||||||||||
| May 3, 2022 | May 31, 2022 | June 15, 2022 | $ | 365.625 | $ | 0.365625 | ||||||||
| February 16, 2022 | February 28, 2022 | March 15, 2022 | 365.625 | 0.365625 | ||||||||||
On August 8, 2022, our Board of Directors declared a cash dividend on AIG's Series A Preferred Stock of $365.625 per share, payable on September 15, 2022 to holders of record on August 31, 2022.
The payment of any future dividends will be at the discretion of our Board of Directors and will depend on various factors, as discussed further in Note 12 to the Condensed Consolidated Financial Statements.
|
AIG | Second Quarter 2022 Form 10-Q
|
151
|
||||
REPURCHASES OF AIG COMMON STOCK
Our Board of Directors has authorized the repurchase of shares of AIG Common Stock through a series of actions. On May 3, 2022, our Board of Directors authorized the repurchase of $6.5 billion of AIG Common Stock (inclusive of the approximately $1.5 billion remaining under the Board’s prior share repurchase authorization). During the six-month period ended June 30, 2022, AIG Parent repurchased approximately 53 million shares of AIG Common Stock for an aggregate purchase price of $3.1 billion. Pursuant to an Exchange Act Rule 10b5-1 repurchase plan, from July 1, 2022 to August 3, 2022, we repurchased approximately $
556
million of additional shares of AIG Common Stock. As of August 3, 2022, $5.3 billion remained under the authorization.
Shares may be repurchased from time to time in the open market, private purchases, through forward, derivative, accelerated repurchase or automatic repurchase transactions or otherwise. Certain of our share repurchases have been and may from time to time be effected through the Exchange Act Rule 10b5-1 repurchase plans. The timing of any future share repurchases will depend on market conditions, our business and strategic plans, financial condition, results of operations, liquidity and other factors, as discussed further in Note 12 to the Condensed Consolidated Financial Statements.
DIVIDEND RESTRICTIONS
Payments of dividends to AIG by its insurance subsidiaries are subject to certain restrictions imposed by regulatory authorities.
For information regarding restrictions on payments of dividends by our subsidiaries see Note 18 to the Consolidated Financial Statements in the 2021 Annual Report.
|
|
||
Enterprise Risk Management
Risk management includes the identification and measurement of various forms of risk, the establishment of risk thresholds and the creation of processes intended to maintain risks within these thresholds while optimizing returns. We consider risk management an integral part of managing our core businesses and a key element of our approach to corporate governance.
OVERVIEW
We have an integrated process for managing risks throughout our organization in accordance with our firm-wide risk appetite. Our Board of Directors has oversight responsibility for the management of risk. Our Enterprise Risk Management Department supervises and integrates the risk management functions in each of our business units, providing senior management with a consolidated view of AIG’s major risk positions. Within each business unit, senior leaders and executives approve targeted risk tolerances within the framework provided by ERM. ERM supports our businesses and management by embedding risk management in our key day-to-day business processes and in identifying, assessing, quantifying, monitoring, reporting, and mitigating the risks taken by our businesses and AIG overall. Nevertheless, our risk management efforts may not always be successful and material adverse effects on our business, results of operations, cash flows, liquidity or financial condition may occur.
AIG employs a Three Lines of Defense model. AIG’s business leaders assume full accountability for the risks and controls in their operating units, and ERM performs a review, challenge and oversight function. The third line consists of our Internal Audit Group that provides independent assurance for AIG’s Board of Directors.
For additional information on AIG’s risk management program, see Part II, Item 7. MD&A ─ Enterprise Risk Management in the 2021 Annual Report.
The scope and magnitude of our market risk exposures is managed under a robust framework that contains defined risk limits and minimum standards for managing market risk in a manner consistent with our risk appetite statement. A description of our market risk exposures may be found in Part II, Item 7A. Quantitative and Qualitative Disclosures about Market Risk in the 2021 Annual Report.
See Part I, Item 1A. Risk Factors in the 2021 Annual Report on how difficult conditions in the financial markets and the economy generally may materially adversely affect our business and results of our operations.
|
152
|
AIG | Second Quarter 2022 Form 10-Q
|
||||
|
|
||
Regulatory Environment
OVERVIEW
Our operations around the world are subject to regulation by many different types of regulatory authorities, including insurance, securities, derivatives, investment advisory and thrift regulators in the United States and abroad. The insurance and financial services industries are generally subject to close regulatory scrutiny and supervision.
Our insurance subsidiaries are subject to regulation and supervision by the states and jurisdictions in which they do business. We expect that the domestic and international regulations applicable to us and our regulated entities will continue to evolve for the foreseeable future.
For information regarding sanctions related to the Russia/Ukraine conflict, see Executive Summary – Overview.
For information regarding our regulation and supervision by different regulatory authorities in the United States and abroad, see Part I, Item 1. Business – Regulation and Part I, Item 1A. Risk Factors – Regulation in the 2021 Annual Report.
|
AIG | Second Quarter 2022 Form 10-Q
|
153
|
||||
|
|
||
Glossary
Accident year
The annual calendar accounting period in which loss events occurred, regardless of when the losses are actually reported, booked or paid.
Accident year combined ratio, as adjusted (Accident year combined ratio, ex-CAT)
The combined ratio excluding catastrophe losses and related reinstatement premiums, prior year development, net of premium adjustments, and the impact of reserve discounting.
Accident year loss ratio, as adjusted (Accident year loss ratio, ex-CAT)
The loss ratio excluding catastrophe losses and related reinstatement premiums, prior year development, net of premium adjustments, and the impact of reserve discounting.
Acquisition ratio
Acquisition costs divided by net premiums earned. Acquisition costs are those costs incurred to acquire new and renewal insurance contracts and also include the amortization of VOBA and DAC. Acquisition costs vary with sales and include, but are not limited to, commissions, premium taxes, direct marketing costs and certain costs of personnel engaged in sales support activities such as underwriting.
Additional premium
represents a premium on an insurance policy over and above the initial premium imposed at the beginning of the policy. An additional premium may be assessed if the insured’s risk is found to have increased significantly.
Adjusted revenues
exclude Net realized gains (losses), income from non-operating litigation settlements (included in Other income for GAAP purposes) and changes in fair value of securities used to hedge guaranteed living benefits (included in Net investment income for GAAP purposes). Adjusted revenues is a GAAP measure for our segments.
Assets under administration
include assets under management and Retail Mutual Funds and Group Retirement mutual fund assets that we sell or administer.
Assets under management
include assets in the general and separate accounts of our subsidiaries that support liabilities and surplus related to our life and annuity insurance products and the notional value of stable value wrap contracts.
Attritional losses
are losses recorded in the current accident year, which are not catastrophe losses.
Base spread
Net investment income excluding income from alternative investments and other enhancements, less interest credited excluding amortization of deferred sales inducements.
Base yield
Net investment income excluding income from alternative investments and other enhancements, as a percentage of average base invested asset portfolio, which excludes alternative investments, other bond securities and certain other investments for which the fair value option has been elected.
Book value per common share, excluding accumulated other comprehensive income (loss) (AOCI) adjusted for the cumulative unrealized gains and losses related to Fortitude Re funds withheld assets and deferred tax assets (DTA) (Adjusted book value per common share)
is a non-GAAP measure and is used to show the amount of our net worth on a per-common share basis. Adjusted book value per common share is derived by dividing total AIG common shareholders’ equity, excluding AOCI adjusted for the cumulative unrealized gains and losses related to Fortitude Re funds withheld assets and DTA (Adjusted common shareholders’ equity), by total common shares outstanding.
Casualty insurance
Insurance that is primarily associated with the losses caused by injuries to third persons, i.e., not the insured, and the legal liability imposed on the insured as a result.
Combined ratio
Sum of the loss ratio and the acquisition and general operating expense ratios.
CSA
Credit Support Annex
A legal document generally associated with an ISDA Master Agreement that provides for collateral postings which could vary depending on ratings and threshold levels.
Credit Valuation Adjustment (CVA)/Non-Performance Risk Adjustment (NPA)
The CVA/NPA adjusts the valuation of derivatives to account for nonperformance risk of our counterparty with respect to all net derivative assets positions. Also, the CVA/NPA reflects the fair value movement in AIGFP's asset portfolio that is attributable to credit movements only, without the impact of other market factors such as interest rates and foreign exchange rates. Finally, the CVA/NPA also accounts for our own credit risk in the fair value measurement of all derivative net liability positions and liabilities where AIG has elected the fair value option, when appropriate.
DAC
Deferred Policy Acquisition Costs
Deferred costs that are incremental and directly related to the successful acquisition of new business or renewal of existing business.
|
154
|
AIG | Second Quarter 2022 Form 10-Q
|
||||
DAC Related to Unrealized Appreciation (Depreciation) of Investments
An adjustment to DAC and Reserves for investment-oriented products, equal to the change in DAC and unearned revenue amortization that would have been recorded if fixed maturity securities available for sale at fair value had been sold at their stated aggregate fair value and the proceeds reinvested at current yields. An adjustment to benefit reserves for investment-oriented products is also recognized to reflect the application of the benefit ratio to the accumulated assessments that would have been recorded if fixed maturity securities available for sale at fair value had been sold at their stated aggregate fair value and the proceeds reinvested at current yields.
For long-duration traditional products, significant unrealized appreciation of investments in a sustained low interest rate environment may cause additional future policy benefit liabilities to be recorded.
Deferred gain on retroactive reinsurance
Retroactive reinsurance is a reinsurance contract in which an assuming entity agrees to reimburse a ceding entity for liabilities incurred as a result of past insurable events. If the amount of premium paid by the ceding reinsurer is less than the related ceded loss reserves, the resulting gain is deferred and amortized over the settlement period of the reserves. Any related development on the ceded loss reserves recoverable under the contract would increase the deferred gain if unfavorable, or decrease the deferred gain if favorable.
DSI Deferred Sales Inducements
Represents enhanced crediting rates or bonus payments to contract holders on certain annuity and investment contract products that meet the criteria to be deferred and amortized over the life of the contract.
Expense ratio
Sum of acquisition expenses and general operating expenses, divided by net premiums earned.
General operating expense ratio
General operating expenses divided by net premiums earned. General operating expenses are those costs that are generally attributed to the support infrastructure of the organization and include but are not limited to personnel costs, projects and bad debt expenses. General operating expenses exclude losses and loss adjustment expenses incurred, acquisition expenses, and investment expenses.
GIC/GIA
Guaranteed Investment Contract/Guaranteed Investment Agreement
A contract whereby the seller provides a guaranteed repayment of principal and a fixed or floating interest rate for a predetermined period of time.
IBNR
Incurred But Not Reported
Estimates of claims that have been incurred but not reported to us.
ISDA Master Agreement
An agreement between two counterparties, which may have multiple derivative transactions with each other governed by such agreement, that generally provides for the net settlement of all or a specified group of these derivative transactions, as well as pledged collateral, through a single payment, in a single currency, in the event of a default on, or affecting any, one derivative transaction or a termination event affecting all, or a specified group of, derivative transactions.
LAE
Loss Adjustment Expenses
The expenses directly attributed to settling and paying claims of insureds and include, but are not limited to, legal fees, adjuster’s fees and the portion of general expenses allocated to claim settlement costs.
Loan-to-value ratio
Principal amount of loan amount divided by appraised value of collateral securing the loan.
Loss ratio
Losses and loss adjustment expenses incurred divided by net premiums earned.
Loss reserve development
The increase or decrease in incurred losses and loss adjustment expenses related to prior years as a result of the re-estimation of loss reserves at successive valuation dates for a given group of claims.
Loss reserves
Liability for unpaid losses and loss adjustment expenses. The estimated ultimate cost of settling claims relating to insured events that have occurred on or before the balance sheet date, whether or not reported to the insurer at that date.
Master netting agreement
An agreement between two counterparties who have multiple derivative contracts with each other that provides for the net settlement of all contracts covered by such agreement, as well as pledged collateral, through a single payment, in a single currency, in the event of default on or upon termination of any one such contract.
Natural catastrophe losses
are generally weather or seismic events having a net impact on AIG in excess of $10 million each and man-made catastrophe losses, such as terrorism and civil disorders that exceed the $10 million threshold.
Net premiums written
represent the sales of an insurer, adjusted for reinsurance premiums assumed and ceded, during a given period. Net premiums earned are the revenue of an insurer for covering risk during a given period. Net premiums written are a measure of performance for a sales period, while net premiums earned are a measure of performance for a coverage period.
Noncontrolling interests
The portion of equity ownership in a consolidated subsidiary not attributable to the controlling parent company.
Policy fees
An amount added to a policy premium, or deducted from a policy cash value or contract holder account, to reflect the cost of issuing a policy, establishing the required records, sending premium notices and other related expenses.
|
AIG | Second Quarter 2022 Form 10-Q
|
155
|
||||
Pool
A reinsurance arrangement whereby all of the underwriting results of the pool members are combined and then shared by each member in accordance with its pool participation percentage.
Premiums and deposits – Life and Retirement
includes direct and assumed amounts received and earned on traditional life insurance policies, group benefit policies and life-contingent payout annuities, as well as deposits received on universal life, investment-type annuity contracts, FHLB funding agreements and mutual funds.
Prior year development
See Loss reserve development
.
RBC
Risk-Based Capital
A formula designed to measure the adequacy of an insurer’s statutory surplus compared to the risks inherent in its business.
Reinstatement premiums
Additional premiums payable to reinsurers or receivable from insurers to restore coverage limits that have been reduced or exhausted as a result of reinsured losses under certain excess of loss reinsurance contracts.
Reinsurance
The practice whereby one insurer, the reinsurer, in consideration of a premium paid to that insurer, agrees to indemnify another insurer, the ceding company, for part or all of the liability of the ceding company under one or more policies or contracts of insurance which it has issued.
Retroactive reinsurance
See Deferred gain on retroactive reinsurance
.
Return on common equity – Adjusted after-tax income excluding AOCI adjusted for the cumulative unrealized gains and losses related to Fortitude Re funds withheld assets and DTA (Adjusted return on common equity)
is a non-GAAP measure and is used to show the rate of return on common shareholders’ equity. Adjusted return on common equity is derived by dividing actual or annualized adjusted after-tax income attributable to AIG common shareholders by average Adjusted common shareholders’ equity.
Return premium
represents amounts given back to the insured in the case of a cancellation, an adjustment to the rate or an overpayment of an advance premium.
Solvency II
Legislation in the European Union which reforms the insurance industry’s solvency framework, including minimum capital and solvency requirements, governance requirements, risk management and public reporting standards. The Solvency II Directive (2009/138/EEC) was adopted on November 25, 2009 and became effective on January 1, 2016.
Subrogation
The amount of recovery for claims we have paid our policyholders, generally from a negligent third party or such party’s insurer.
Surrender charge
A charge levied against an investor for the early withdrawal of funds from a life insurance or annuity contract, or for the cancellation of the agreement.
Surrender rate
represents annualized surrenders and withdrawals as a percentage of average reserves and Group Retirement mutual fund assets under administration.
Unearned premium reserve
Liabilities established by insurers and reinsurers to reflect unearned premiums, which are usually refundable to policyholders if an insurance or reinsurance contract is canceled prior to expiration of the contract term.
VOBA
Value of Business Acquired
Present value of projected future gross profits from in-force policies of acquired businesses.
|
156
|
AIG | Second Quarter 2022 Form 10-Q
|
||||
|
|
||
Acronyms
| A&H | Accident and Health Insurance | GMDB | Guaranteed Minimum Death Benefits | ||||||||
| ABS | Asset-Backed Securities | GMWB | Guaranteed Minimum Withdrawal Benefits | ||||||||
| APTI | Adjusted pre-tax income | ISDA | International Swaps and Derivatives Association, Inc. | ||||||||
| AUM | Assets Under Management | Moody's | Moody's Investors' Service Inc. | ||||||||
| CDO | Collateralized Debt Obligations | NAIC | National Association of Insurance Commissioners | ||||||||
| CDS | Credit Default Swap | NM | Not Meaningful | ||||||||
| CMA | Capital Maintenance Agreement | ORR | Obligor Risk Ratings | ||||||||
| CMBS | Commercial Mortgage-Backed Securities | OTC | Over-the-Counter | ||||||||
| EGPs | Estimated Gross Profits | OTTI | Other-Than-Temporary Impairment | ||||||||
| FASB | Financial Accounting Standards Board | RMBS | Residential Mortgage-Backed Securities | ||||||||
| FRBNY | Federal Reserve Bank of New York | S&P | Standard & Poor's Financial Services LLC | ||||||||
| GAAP | Accounting Principles Generally Accepted in the | SEC | Securities and Exchange Commission | ||||||||
| United States of America | URR | Unearned Revenue Reserve | |||||||||
| GIA | Guaranteed Investment Agreements | VIE | Variable Interest Entity | ||||||||
|
AIG | Second Quarter 2022 Form 10-Q
|
157
|
||||
ITEM 3 |
Quantitative and Qualitative Disclosures About Market Risk
Included in Part I, Item 2. Management's Discussion and Analysis of Financial Condition and Results of Operations – Enterprise Risk Management.
ITEM 4 |
Controls and Procedures
EVALUATION OF DISCLOSURE CONTROLS AND PROCEDURES
Disclosure controls and procedures are designed to ensure that information required to be disclosed in reports filed or submitted under the Securities Exchange Act of 1934, as amended (the Exchange Act), is recorded, processed, summarized and reported within the time periods specified in SEC rules and forms and that such information is accumulated and communicated to management, including the Chief Executive Officer and Chief Financial Officer, to allow timely decisions regarding required disclosures. In connection with the preparation of this Quarterly Report on Form 10-Q, an evaluation was carried out by American International Group, Inc. (AIG) management, with the participation of AIG’s Chief Executive Officer and Chief Financial Officer, of the effectiveness of our disclosure controls and procedures (as defined in Rules 13a-15(e) and 15d-15(e) under the Exchange Act), as of June 30, 2022. Based on this evaluation, AIG’s Chief Executive Officer and Chief Financial Officer concluded that our disclosure controls and procedures were effective as of June 30, 2022.
CHANGES IN INTERNAL CONTROL OVER FINANCIAL REPORTING
There have been no changes in our internal control over financial reporting (as defined in Rule 13a-15(f)) that have occurred during the quarter ended June 30, 2022 that have materially affected, or are reasonably likely to materially affect, our internal control over financial reporting.
|
158
|
AIG | Second Quarter 2022 Form 10-Q
|
||||
|
Part II – Other Information
|
||
ITEM 1 |
Legal Proceedings
For a discussion of legal proceedings see Note 11 to the Condensed Consolidated Financial Statements, which is incorporated herein by reference.
ITEM 1A |
Risk Factors
In addition to the other information set forth in this Quarterly Report on Form 10-Q, you should carefully consider the risk factors discussed in Part I, Item 1A. Risk Factors in the 2021 Annual Report.
ITEM 2 |
Unregistered Sales of Equity Securities and Use of Proceeds
The following table provides information about purchases made by or on behalf of AIG or any “affiliated purchaser” (as defined in Rule 10b-18(a)(3) under the Securities Exchange Act of 1934 (the Exchange Act)) of AIG Common Stock during the three months ended June 30, 2022:
| Period | Total Number of Shares Repurchased | Average Price Paid per Share |
Total Number of Shares
Purchased as Part of Publicly Announced Plans or Programs |
Approximate Dollar Value of Shares that May Yet Be Purchased Under the Plans or Programs (in millions) | ||||||||||||||||||||||
| April 1-30 | 9,639,408 | $ | 62.00 | 9,639,408 | $ | 1,942 | ||||||||||||||||||||
| May 1-31 | 10,060,592 | 58.98 | 10,060,592 | 6,349 | ||||||||||||||||||||||
| June 1-30 | 9,469,102 | 53.65 | 9,469,102 | 5,841 | ||||||||||||||||||||||
| Total | 29,169,102 | $ | 58.25 | 29,169,102 | $ | 5,841 | ||||||||||||||||||||
During the three-month period ended June 30, 2022, AIG Parent repurchased approximately 29 million shares of AIG common stock, par value $2.50 per share (AIG Common Stock) for an aggregate purchase price of $1.7 billion.
As of June 30, 2022, approximately $5.8 billion remained under the authorization. From July 1, 2022 to August 3, 2022, we repurchased approximately 11 million shares of AIG Common Stock for an aggregate purchase price of approximately $556 million.
Shares may be repurchased from time to time in the open market, private purchases, through forward, derivative, accelerated repurchase or automatic repurchase transactions or otherwise. Certain of our share repurchases have been and may from time to time be effected through Exchange Act Rule 10b5-1 repurchase plans. The timing of any future share repurchases will depend on market conditions, our business and strategic plans, financial condition, results of operations, liquidity and other factors. The repurchase of AIG Common Stock is also subject to the terms of AIG’s Series A 5.85% Non-Cumulative Preferred Stock (Series A Preferred Stock), pursuant to which AIG may not (other than in limited circumstances) purchase, redeem or otherwise acquire AIG Common Stock unless the full dividends for the latest completed dividend period on all outstanding shares of Series A Preferred Stock have been declared and paid or provided for.
ITEM 4 |
Mine Safety Disclosures
Not applicable.
|
AIG | Second Quarter 2022 Form 10-Q
|
159
|
||||
ITEM 6 |
Exhibits
Exhibit Index
|
Exhibit
Number
|
Description
|
Location
|
||||||
| 10 |
Incorporated by reference Exhibit 10.1 to AIG’s Current Report on Form 8-K, filed with the SEC on May 13, 2022 (File No. 1-8787).
|
|||||||
| Filed herewith. | ||||||||
| Filed herewith. | ||||||||
| 22 | Guaranteed Securities | None. | ||||||
| 31 | Filed herewith. | |||||||
| 32 | Filed herewith. | |||||||
| 101 |
Interactive data files pursuant to Rule 405 of Regulation S-T formatted in iXBRL (Inline eXtensible Business Reporting Language): (i) the Condensed Consolidated Balance Sheets as of June 30, 2022 and December 31, 2021, (ii) the Condensed Consolidated Statements of Income (Loss) for the three and six months ended June 30, 2022 and 2021, (iii) the Condensed Consolidated Statements of Equity for the three and six months ended June 30, 2022 and 2021, (iv) the Condensed Consolidated Statements of Cash Flows for the six months ended June 30, 2022 and 2021, (v) the Condensed Consolidated Statements of Comprehensive Income (Loss) for the three and six months ended June 30, 2022 and 2021 and (vi) the Notes to the Condensed Consolidated Financial Statements
|
Filed herewith. | ||||||
| 104 | Cover Page Interactive Data File (formatted as inline XBRL with applicable taxonomy extension information contained in Exhibits 101) | Filed herewith. | ||||||
*
This exhibit is a management contract or compensatory arrangement.
**
This information is furnished and not filed for purposes of Sections 11 and 12 of the Securities Act of 1933 and Section 18 of the Securities Exchange Act of 1934.
|
160
|
AIG | Second Quarter 2022 Form 10-Q
|
||||
|
Signatures
|
||
Pursuant to the requirements of the Securities Exchange Act of 1934, the registrant has duly caused this report to be signed on its behalf by the undersigned thereunto duly authorized.
| AMERICAN INTERNATIONAL GROUP, INC. | ||
| (Registrant) | ||
| /S/ SHANE FITZSIMONS | ||
| Shane Fitzsimons | ||
|
Executive Vice President and
|
||
|
Chief Financial Officer
|
||
|
(Principal Financial Officer)
|
||
| /S/ KATHLEEN CARBONE | ||
| Kathleen Carbone | ||
|
Vice President and
|
||
|
Chief Accounting Officer
|
||
|
(Principal Accounting Officer)
|
||
Dated: August 9, 2022
|
AIG | Second Quarter 2022 Form 10-Q
|
161
|
||||
TABLE OF CONTENTS
Part I, Item 1A. Risk Factors and Part Ii, Item 7. Md&a Of The 2021 Annual ReportItem 2 | Use Of Non-gaap MeasuresItem 2 | Critical Accounting EstimatesItem 2 | Executive SummaryItem 2 | Consolidated Results Of OperationsItem 2 | Business Segment Operations | General InsuranceItem 2 | Business Segment Operations | Life and RetirementItem 2 | Business Segment Operations | Other OperationsItem 2 | InvestmentsItem Count Is By Cusip By SubsidiaryItem 2 | Insurance ReservesItem 2 | Liquidity and Capital ResourcesItem 2 | Regulatory EnvironmentItem 3 | Quantitative and Qualitative Disclosures About Market RiskItem 4 | Controls and ProceduresPart II Other InformationItem 1 | Legal ProceedingsItem 1A | Risk FactorsItem 2 | Unregistered Sales Of Equity Securities and Use Of ProceedsItem 4 | Mine Safety DisclosuresItem 6 | Exhibits