As filed with the Securities and Exchange Commission on April 30, 2015
UNITED STATES
SECURITIES AND EXCHANGE COMMISSION
WASHINGTON, D.C. 20549
FORM 20-F
|
|
ANNUAL REPORT PURSUANT TO SECTION 13 OR 15(d) OF THE SECURITIES EXCHANGE ACT OF 1934
|
Commission file number 001-13142
|
Embotelladora Andina S.A. |
|
(Exact name of Registrant as specified in its charter) |
|
Andina Bottling Company |
|
(Translation of Registrant’s name in English) |
|
|
|
Republic of Chile |
|
(Jurisdiction of incorporation or organization) |
|
|
|
Miraflores 9153, 7th Floor Renca - Santiago, Chile |
|
(Address of principal executive offices) |
|
|
|
Paula Vicuña, Tel. (56-2) 2338-0520 E-mail: paula.vicuna@koandina.com Miraflores 9153, 7th Floor - Renca - Santiago, Chile |
|
(Name, Telephone, E-mail and/or Facsimile number and Address of Company Contact Person) |
Securities registered or to be registered pursuant to Section 12(b) of the Act.
|
Title of each class |
|
Name of each exchange on which registered |
|
Series A Shares, Series B Shares of Registrant represented by American Depositary Shares |
|
New York Stock Exchange |
Securities registered or to be registered pursuant to Section 12(g) of the Act: None
Securities for which there is a reporting obligation pursuant to Section 15(d) of the Act: None
Indicate the number of outstanding shares of each of the issuer’s classes of capital or common stock as of the close of the period covered by the annual report.
|
|
Series A Shares 473,289,301 |
|
|
Series B Shares 473,281,303 |
Indicate by check mark if the registrant is a well-known seasoned issuer, as defined in Rule 405 of the Securities Act.
x Yes o No
If this report is an annual or transition report, indicate by check mark if the registrant is not required to file reports pursuant to Section 13 or 15(d) of the Securities Exchange Act of 1934.
o Yes x No
Indicate by check mark whether the registrant (1) has filed all reports required to be filed by Section 13 or 15(d) of the Securities Exchange Act of 1934 during the preceding 12 months (or for such shorter period that the registrant was required to file such reports), and (2) has been subject to such filing requirements for the past 90 days.
x Yes o No
Indicate by check mark whether the registrant has submitted electronically and posted on its corporate Web site, if any, every Interactive Data File required to be submitted and posted pursuant to Rule 405 of Regulation S-T during the preceding 12 months (or for such shorter period that the registrant was required to submit and post such files).
o Yes x No
Indicate by check mark whether the registrant is a large accelerated filer, an accelerated filer, or a non-accelerated filer. See definition of “accelerated filer and large accelerated filer” in Rule 12b-2 of the Exchange Act. (Check one):
|
Large accelerated filer x |
|
Accelerated filer o |
|
Non-accelerated filer o |
Indicate by check mark which basis of accounting the registrant has used to prepare the financial statements included in this filing:
|
U.S. GAAP o |
|
International Financial Reporting Standards as issued
|
|
Other o |
If “Other” has been checked in response to the previous question, indicate by check mark which financial statement item the registrant has elected to follow.
o Item 17 o Item 18
If this is an annual report, indicate by check mark whether the registrant is a shell company (as defined in Rule 12b-2 of the Exchange Act).
o Yes x No
References
Unless the context otherwise requires, as used in this annual report the following terms have the meanings set forth below:
· the “Company”, “we”, “Andina” and “Coca-Cola Andina” means Embotelladora Andina S.A. and its consolidated subsidiaries;
· “Andina Brazil” means our subsidiary, Rio de Janeiro Refrescos Ltda. and its subsidiaries;
· “AESA” means our subsidiary, Andina Empaques Argentina S.A.
· “EDASA” means our subsidiary, Embotelladora del Atlántico S.A.;
· “PARESA” means our subsidiary, Paraguay Refrescos S.A.
· “CMF” means our affiliate, Envases CMF S.A.;
· “ECSA” means our affiliate, Envases Central S.A.;
· “Vital Jugos” means our affiliate, Vital Jugos S.A., previously known as Vital S.A.;
· “VASA” means our affiliate, Vital Aguas S.A.;
· “TAR” means our subsidiary, Transportes Andina Refrescos Ltda.
· “TP” means our subsidiary, Transportes Polar S.A.
· “The Coca-Cola Company” means The Coca-Cola Company or any of its subsidiaries, including without limitation Coca-Cola de Chile S.A. (“CC Chile”), which operates in Chile, Recofarma Industrias do Amazonas Ltda. (“CC Brazil”), which operates in Brazil and Servicios y Productos para Bebidas Refrescantes S.R.L. (“CC Argentina”), which operates in Argentina.
· the “Chilean territory” means the Metropolitan Region of Santiago and the neighboring provinces of Cachapoal and San Antonio; Due to our merger with Embotelladoras Coca-Cola Polar, we also participate in the regions of Antofagasta, Atacama, Coquimbo, Aisén and Magallanes.
· the “Brazilian territory” means the majority of the State of Rio de Janeiro, and the totality of the State of Espírito Santo. Due to our acquisition of Companhia de Bebidas Ipiranga (“Ipiranga”), on October 11, 2013, we also participate in part of the state of São Paulo and part of the state of Minas Gerais.
· the “Argentine territory” means the provinces of Córdoba, Mendoza, San Juan, San Luis, Entre Rios, Buenos Aires (only San Nicolás and Ramallo) and most of Santa Fe. Due to our merger with Embotelladoras Coca-Cola Polar, we also participate in the provinces of La Pampa, Neuquén, Río Negro, Chubut, Santa Cruz, Tierra del Fuego and part of the province of Buenos Aires; and
· the “Paraguayan territory” means the country of Paraguay
PRESENTATION OF FINANCIAL AND CERTAIN OTHER INFORMATION
Unless otherwise specified, references herein to “dollars,” “U.S. dollars” or “US$” are to United States dollars; references to “pesos,” “Chilean pesos”, “Ch$” or “ThCh$” are to Chilean pesos; references to “Argentine pesos” or “AR$” are to Argentine pesos, references to “real” or “reais” or “R$” are to Brazilian reais and references to “guaranies” or “guarani” or “G$” are to Paraguayan Guaranies. References to “UF” are to Unidades de Fomento . The UF is an inflation-indexed Chilean monetary unit with a value in Chilean pesos that is adjusted daily to reflect changes in the official consumer price index of the Instituto Nacional de Estadísticas (the “Chilean National Institute of Statistics”). The UF is adjusted in monthly cycles. Each day in the period beginning on the tenth day of the current month through the ninth day of the succeeding month, the nominal peso value of the UF is indexed up (or down in the event of deflation) in order to reflect a proportionate amount of the change in the Chilean consumer price index during the prior calendar month. Certain percentages and amounts contained in this annual report have been rounded for ease of presentation.
In this annual report certain (local currency) amounts have been translated into United States dollars at the rate of Ch$570.34 to the dollar when is average exchange rate and Ch$606.75 to the dollar when it is yearend exchange rate. Such translations should not be construed as representations that the (local currency) amounts represent, or have been or could be converted into, United States dollars at that or any other rate.
The Company’s Consolidated Financial Statements for the years ended December 31, 2014, 2013, 2012, 2011 and 2010 were prepared in accordance with International Financial Reporting Standards (hereinafter “IFRS”) issued by the International Accounting Standards Board (hereinafter “IASB”).
Special Note Regarding Non-IFRS Financial Measures
This annual report makes reference to certain non-IFRS measures, namely EBIT, EBITDA and Adjusted EBITDA. These non-IFRS measures are not recognized measures under IFRS, do not have a standardized meaning prescribed by IFRS and are therefore unlikely to be comparable to similar measures presented by other companies. Rather, these measures are provided as additional information to complement IFRS measures by providing further understanding of the Company’s results of operations from management’s perspective. Accordingly, they should not be considered in isolation nor as a substitute for analysis of our financial information reported under IFRS.
EBIT represents profit attributable to controlling shareholders before net interest expenseand income taxes. EBITDA represents EBIT plus depreciation and amortization expense. Adjusted EBITDA represents EBITDA plus other expenses (income), net. We have included EBIT, EBITDA and Adjusted EBITDA to provide investors with a supplemental measure of our operating performance.
We believe EBIT, EBITDA and Adjusted EBITDA are an important supplemental measure of operating performance because they eliminate items that have less bearing on our operating performance and thus highlight trends in our core business that may not otherwise be apparent when relying solely on IFRS financial measures. We also believe that securities analysts, investors and other interested parties frequently use EBITDA in the evaluation of issuers, many of which present EBITDA when reporting their results.
Our management also uses EBITDA and Adjusted EBITDA in order to facilitate operating performance comparisons from period to period, prepare annual operating budgets, assess our ability to meet our future debt service, capital expenditure and working capital requirements and assess our ability to pay dividends on our capital stock.
EBIT, EBITDA and Adjusted EBITDA have important limitations as analytical tools. For example, neither EBIT, EBITDA nor Adjusted EBITDA reflect (a) our cash expenditures, or future requirements for capital expenditures or contractual commitments; (b) changes in, or cash requirements for, our working capital needs; (c) the significant interest expense, or the cash requirements necessary to service interest or principal payments, on our debt; and (d) tax payments or distributions to our parent to make payments with respect to taxes attributable to us that represent a reduction in cash available to us. Although we consider the items excluded in the calculation of non-IFRS measures to be less relevant to evaluate our performance, some of these items may continue to take place and accordingly may reduce the cash available to us.
We believe that the presentation of the non-IFRS measures described above is appropriate. However, these non-IFRS measures have important limitations as analytical tools, and you should not consider them in isolation, or as substitutes for analysis of our results as reported under IFRS. Because of these limitations, we primarily rely on our results as reported in accordance with IFRS and use EBIT, EBITDA and Adjusted EBITDA only supplementally. In addition, because other companies may calculate EBITDA and Adjusted EBITDA differently than we do, EBITDA may not be, and Adjusted EBITDA as presented in this report is not, comparable to similarly titled measures reported by other companies.
Forward-Looking Statements
This annual report includes forward looking statements, principally under the captions, “Item 4. Information on the Company—Business Overview,” “Item 3. Key Information—Part D. Risk Factors,” and “Item 5. Operating and Financial Review and Prospects.” We have based these forward-looking statements largely on our current beliefs, expectations and projections about future events and financial trends affecting our business. Examples of such forward-looking statements include:
· statements of our plans, objectives or goals, including those related to anticipated trends, competition or regulation;
· statements about our future economic performance and that of Chile or other countries in which we operate;
· statements about our exposure to market risks, including interest rate risks, foreign exchange risk and equity price risk; and
· statements of assumptions underlying such statements.
Words such as “believes,” “expects,” “anticipates,” “projects,” “intends,” “should,” “could,” “may,” “seeks,” “aim,” “combined,” “estimates,” “probability,” “risk,” “target,” “goal,” “objective,” “future” or similar expressions are intended to identify forward-looking statements but are not the exclusive means of identifying such statements. These statements may relate to (i) our asset growth and financing plans, (ii) trends affecting our financial condition or results of operations and (iii) the impact of competition and regulations, but are not limited to such topics. Forward-looking statements are not guarantees of future performance and involve risks and uncertainties, and actual results may differ materially and adversely from those described in such forward-looking statements included in this annual report as a result of various factors (including, without limitation, the actions of competitors, future global economic conditions, market conditions, foreign exchange rates and operating and financial risks), many of which are beyond our control. The occurrence of any such factors not currently expected by us would significantly alter the results set forth in these statements.
You should understand that the following important factors, in addition to those discussed elsewhere in this annual report, could affect our future results and could cause those results or other outcomes to differ materially and adversely from those expressed in our forward-looking statements:
· changes in general economic, business, political or other conditions in the regions where we operate;
· changes in the legal and regulatory framework of the beverage sector in the regions where we operate;
· the monetary and interest rate policies of the central banks of the countries in which we operate;
· unanticipated movements or volatility in interest rates, foreign exchange rates, equity prices or other rates or prices;
· changes in, or our failure to comply with, laws and regulations in the countries where we operate and applicable foreign laws;
· changes in taxes;
· changes in competition and pricing environments;
· our inability to hedge certain risks economically;
· potential effects of weather conditions, earthquakes, tsunamis or other natural disasters;
· the outcome of litigation against us;
· the nature and extent of competition in the beverage industry in Latin America and the effect of competition on the prices we are able to charge for our products;
· volatility and fluctuations in demand for our products and the effect of such changes on the prices that we are able to charge for our products;
· capital and credit market conditions, including the availability of credit and changes in interest rates;
· delays in the development of our projects, changes to our investment plans due to changes in demand, authorizations, expropriations, etc.;
· actions of our shareholders;
· unanticipated increases in financing and other costs or the inability to obtain additional debt or equity financing on attractive terms if at all; and
· the factors described under “Risk Factors” beginning on page 8.
The forward-looking statements contained in this document speak only as of the date of this annual report, and we do not undertake to update any forward-looking statement to reflect events or circumstances after the date hereof or to reflect the occurrence of unanticipated events .
Market Data
We have computed the information contained in this annual report regarding annual volume and per capita growth rates and levels, and market share, product segment, and population data in our bottling territories, based upon accumulated statistics developed by us. Market share information presented with respect to soft drinks, juices, waters and beer is based on data supplied by A.C. Nielsen Company and by Ipsos ASI.
ITEM 1. IDENTITY OF DIRECTORS, SENIOR MANAGEMENT AND ADVISERS
Not applicable.
ITEM 2. OFFER STATISTICS AND EXPECTED TIMETABLE
Not applicable.
A. Selected Financial Data
The following tables present certain summary consolidated and other financial and operating information of Andina at the dates and for the periods indicated. This information should be read in conjunction with, and is qualified in its entirety by reference to our consolidated financial statements, including the notes thereto, included elsewhere in this annual report and our consolidated financial statements, including the notes thereto, included herein.
The summary consolidated financial information as of December 31, 2013 and 2014 and for the years ended December 31, 2012, 2013 and 2014 has been derived from our audited consolidated financial statements included herein. The summary consolidated financial information as of December 31, 2010, 2011 and 2012 and for the year ended December 31, 2010 and 2011 has been derived from our audited consolidated financial statements as of and for the years then ended not included herein.
On October 1, 2012, we consummated the acquisition of Polar, which significantly enhanced the size and scope of our company. We began consolidating the results of operations of Polar into our consolidated financial statements as of October 1, 2012. As a result, our consolidated results of operations for the year ended December 31, 2012 are not fully comparable to our consolidated results of operations for previous periods.
On October 11, 2013, Andina Brazil consummated its acquisition of Ipiranga in an all-cash transaction. We began consolidating the results of operations of Ipiranga into our consolidated financial statements as of October 1, 2013. As a result, our consolidated results of operations for the year ended December 31, 2013 are not fully comparable to our consolidated results of operations for previous periods.
Our consolidated financial statements reflect the results of our subsidiaries located in Brazil, Argentina and Paraguay, translated to Chilean pesos (our functional and reporting currency) and are presented in accordance with IFRS. IFRS requires assets and liabilities to be translated from the functional currency of our subsidiaries outside Chile to our reporting currency (Chilean peso) at the end of period exchange rates and income and expense accounts to be translated at the average monthly exchange rate for the month in which income or expense is recognized. Unless otherwise specified, our financial data is presented herein in Chilean pesos and U.S. dollars.
Our income and cash flow accounts have been translated according to the average exchange rate during the relevant periods, using the average of monthly averages, and therefore may differ from a daily average of the observed exchange rate. Balance sheet accounts have been translated using the exchange rate at the end of the relevant period.
|
|
|
|
|
Year Ended December 31, |
|
||||||||
|
|
|
2010 |
|
2011 |
|
2012 (2) |
|
2013 (3) |
|
2014 |
|
2014 |
|
|
|
|
(in millions of Ch$ and millions of US$) |
|
||||||||||
|
|
|
Ch$ |
|
Ch$ |
|
Ch$ |
|
Ch$ |
|
Ch$ |
|
US$ |
|
|
|
|
|
|
|
|
|
|
|
|
|
|
|
|
|
Net sales |
|
888,714 |
|
982,864 |
|
1,172,293 |
|
1,521,681 |
|
1,797,200 |
|
3,151 |
|
|
Cost of sales |
|
(506,882 |
) |
(578,581 |
) |
(698,955 |
) |
(914,818 |
) |
(1,081,243 |
) |
(1,896 |
) |
|
Gross profit |
|
381,832 |
|
404,283 |
|
473,338 |
|
606,863 |
|
715,957 |
|
1,255 |
|
|
Distribution, administrative and sales expenses |
|
(232,598 |
) |
(261,859 |
) |
(319,174 |
) |
(435,579 |
) |
(529,184 |
) |
(928 |
) |
|
Other (expense) income, net(4) |
|
(9,294 |
) |
(10,712 |
) |
(27,390 |
) |
(58,051 |
) |
(89,385 |
) |
(157 |
) |
|
Income taxes |
|
(36,340 |
) |
(34,685 |
) |
(38,505 |
) |
(22,966 |
) |
(45,354 |
) |
(79 |
) |
|
Net income |
|
103,600 |
|
97,027 |
|
88,269 |
|
90,267 |
|
52,034 |
|
91 |
|
|
|
|
|
|
|
|
|
|
|
|
|
|
|
|
|
|
|
|
|
|
|
|
|
|
|
|
|
|
|
|
Current assets |
|
|
|
|
|
|
|
|
|
|
|
|
|
|
Trade and other accounts receivable, net |
|
97,255 |
|
107,443 |
|
152,817 |
|
195,434 |
|
198,110 |
|
347 |
|
|
Noncurrent assets |
|
|
|
|
|
|
|
|
|
|
|
|
|
|
Intangible assets and goodwill, net |
|
59,136 |
|
58,691 |
|
529,375 |
|
816,386 |
|
845,105 |
|
1,482 |
|
|
Property, plant and equipment, net |
|
291,482 |
|
350,064 |
|
576,551 |
|
692,950 |
|
713,075 |
|
1,250 |
|
|
Total assets |
|
688,314 |
|
741,959 |
|
1,539,836 |
|
2,082,961 |
|
2,269,173 |
|
3,979 |
|
|
Current liabilities |
|
|
|
|
|
|
|
|
|
|
|
|
|
|
Other financial liabilities |
|
20,916 |
|
23,093 |
|
106,248 |
|
106,877 |
|
83,402 |
|
146 |
|
|
Trade and other accounts payable |
|
105,282 |
|
127,941 |
|
184,318 |
|
210,446 |
|
228,179 |
|
400 |
|
|
Noncurrent liabilities |
|
|
|
|
|
|
|
|
|
|
|
|
|
|
Other long-term current financial liabilities |
|
70,449 |
|
74,641 |
|
173,880 |
|
605,362 |
|
726,616 |
|
1,274 |
|
|
Deferred tax liabilities |
|
35,601 |
|
35,245 |
|
111,415 |
|
105,537 |
|
126,126 |
|
221 |
|
|
Total liabilities |
|
293,449 |
|
319,980 |
|
646,231 |
|
1,201,529 |
|
1,350,176 |
|
2,367 |
|
|
Total equity |
|
394,865 |
|
421,979 |
|
893,605 |
|
881,433 |
|
918,998 |
|
1,611 |
|
|
Total liabilities and equity |
|
688,314 |
|
741,959 |
|
1,539,836 |
|
2,082,961 |
|
2,269,173 |
|
3,979 |
|
|
|
|
|
|
|
|
|
|
|
|
|
|
|
|
|
Cash Flow Data |
|
|
|
|
|
|
|
|
|
|
|
|
|
|
Cash flows provided by (used in) operating activities |
|
125,848 |
|
138,950 |
|
188,857 |
|
172,085 |
|
215,514 |
|
378 |
|
|
Cash flows used in investing activities |
|
(80,504 |
) |
(89,621 |
) |
(156,170 |
) |
(447,550 |
) |
(166,776 |
) |
-292 |
|
|
Cash flows provided by (used in) financing activities |
|
(62,548 |
) |
(67,159 |
) |
(3,551 |
) |
303,106 |
|
(46,920 |
) |
-82 |
|
|
|
|
|
|
|
|
|
|
|
|
|
|
|
|
|
Other Financial Data |
|
|
|
|
|
|
|
|
|
|
|
|
|
|
Adjusted EBITDA(5) |
|
186,248 |
|
181,922 |
|
207,988 |
|
254,621 |
|
289,740 |
|
508 |
|
|
Adjusted EBITDA margin(6) |
|
21.0 |
% |
18.5 |
% |
17.7 |
% |
16.7 |
% |
16.1 |
% |
16.1 |
% |
|
Adjusted EBITDA/net financial expense(7) |
|
46.3 |
|
44.9 |
|
24.6 |
|
10.6 |
|
5.1 |
|
5.1 |
|
|
Net debt(7) |
|
(5,813 |
) |
50,776 |
|
224,477 |
|
587,869 |
|
572,901 |
|
1,004 |
|
|
Net debt/Adjusted EBITDA(9) |
|
0.0 |
|
0.3 |
|
1.1 |
|
2.3 |
|
2.0 |
|
.2.0 |
|
|
Depreciation and amortization |
|
37,015 |
|
39,498 |
|
53,824 |
|
83,337 |
|
102,967 |
|
181 |
|
|
Capital expenditures |
|
95,462 |
|
126,931 |
|
143,764 |
|
183,697 |
|
114,217 |
|
200 |
|
|
Dividends paid |
|
66,525 |
|
70,906 |
|
69,766 |
|
73,041 |
|
52,269 |
|
92 |
|
|
Basic and diluted earnings per share: |
|
|
|
|
|
|
|
|
|
|
|
|
|
|
Series A(10) |
|
129.78 |
|
121.54 |
|
104.12 |
|
89.53 |
|
52.19 |
|
0.09 |
|
|
Series B(10) |
|
142.75 |
|
133.69 |
|
114.53 |
|
98.48 |
|
57.41 |
|
0.10 |
|
|
Basic and diluted earnings per ADR:(11) |
|
|
|
|
|
|
|
|
|
|
|
|
|
|
Series A(10) |
|
778.68 |
|
729.24 |
|
624.72 |
|
537.18 |
|
313.16 |
|
0.55 |
|
|
Series B(10) |
|
856.5 |
|
802.14 |
|
687.18 |
|
590.88 |
|
344.48 |
|
0.60 |
|
|
Capital Stock: |
|
|
|
|
|
|
|
|
|
|
|
|
|
|
Series A |
|
380,137,271 |
|
380,137,271 |
|
473,289,368 |
|
473,289,301 |
|
473,289,301 |
|
473,289,301 |
|
|
Series B |
|
380,137,271 |
|
380,137,271 |
|
473,289,368 |
|
473,281,303 |
|
473,281,303 |
|
473,281,303 |
|
|
Issued Capital |
|
230,892 |
|
230,892 |
|
270,759 |
|
270,738 |
|
270,738 |
|
475 |
|
|
Total dividends declared: |
|
|
|
|
|
|
|
|
|
|
|
|
|
|
Total Series A Shares |
|
32,578 |
|
33,809 |
|
34,018 |
|
33,888 |
|
24,800 |
|
43 |
|
|
Total Series B Shares |
|
35,836 |
|
37,190 |
|
37,420 |
|
37,276 |
|
27,283 |
|
48 |
|
|
|
|
|
|
|
|
|
|
|
|
|
|
|
|
|
Other Operating Data |
|
|
|
|
|
|
|
|
|
|
|
|
|
|
Sales volume |
|
|
|
|
|
|
|
|
|
|
|
|
|
|
Coca-Cola trade brand soft drinks (millions of unit cases)(12) |
|
438.0 |
|
448.2 |
|
517.6 |
|
633.5 |
|
671.6 |
|
671.6 |
|
|
Other beverages (millions of unit cases)(2)(3)(12)(13) |
|
51.2 |
|
53.3 |
|
78.6 |
|
129.5 |
|
159.0 |
|
159.0 |
|
(1) Translation of U.S. dollar amounts, solely for the convenience of the reader.
(2) Due to Polar’s merger with and into us on October 1, 2012, data for the year ended December 31, 2012 includes the operations of Polar (as well as the operations of Vital Aguas, Vital Jugos and Envases Central (together, the “Joint Ventures”)) for the period from October 1, 2012 to December 31, 2012. Prior to our merger with Polar, the Joint Ventures were held, in part, by each of Andina, Polar and Embonor S.A., respectively, and the Joint Ventures’ operations were not consolidated in the financial and other data of Andina or Polar. Upon consummation of our merger with Polar, and our increased participatory interest in the Joint Ventures that resulted from such merger, the Joint Ventures became our subsidiaries, for accounting purposes, and are therefore consolidated into our financial and other data for periods subsequent to such merger.
(3) Due to Ipiranga’s acquisition consummated on October 11, 2013, data for the year ended December 31, 2013 includes the operations of Ipiranga for the period from October 1, 2013 to December 31, 2013.
(4) Includes other expenses, other income (expense), finance income, finance costs, share in profit of investees accounted under the equity method, foreign exchange gains (losses) and gains (losses) from indexed financial assets and liabilities.
(5) Adjusted EBITDA is a non-IFRS financial measure, does not represent cash flows from operations for the periods indicated and should not be considered an alternative to net income as an indicator of our results of operations or as an alternative to cash flows from operations as an indicator of liquidity. Adjusted EBITDA does not have a standardized meaning and, accordingly, our definition of Adjusted EBITDA may not be comparable to Adjusted EBITDA as used by other companies. See “Presentation of Financial and Other Information —Non-IFRS Financial Information.” We define Adjusted EBITDA as net income plus income taxes, other expenses (income), depreciation and amortization (which includes only the amortization of information technology software). A reconciliation of our net income to our Adjusted EBITDA is set forth below:
|
|
|
|
|
Year Ended December 31, |
|
||||||||
|
|
|
2010 |
|
2011 |
|
2012 |
|
2013 |
|
2014 |
|
2014 |
|
|
|
|
(in millions of Ch$ and US$) |
|
||||||||||
|
|
|
Ch$ |
|
Ch$ |
|
Ch$ |
|
Ch$ |
|
Ch$ |
|
US$ |
|
|
Net income |
|
103,600 |
|
97,027 |
|
88,269 |
|
90,267 |
|
52,034 |
|
91 |
|
|
Add : |
|
|
|
|
|
|
|
|
|
|
|
|
|
|
Income taxes |
|
36,340 |
|
34,685 |
|
38,505 |
|
22,966 |
|
45 , 354 |
|
80 |
|
|
Finance costs |
|
7,402 |
|
7,235 |
|
11,173 |
|
28,944 |
|
65 , 081 |
|
114 |
|
|
Finance income |
|
(3,376 |
) |
(3,182 |
) |
(2,728 |
) |
(4,973 |
) |
(8 , 656 |
) |
(15 |
) |
|
Depreciation and amortization(5) |
|
37,015 |
|
39,498 |
|
53,824 |
|
83,337 |
|
102 , 967 |
|
181 |
|
|
Share of profit of investments using equity method of accounting |
|
(2,315 |
) |
(2,026 |
) |
(1,770 |
) |
(783 |
) |
(1 , 191 |
) |
(2 |
) |
|
Foreign exchange difference |
|
222 |
|
(3 |
) |
4,471 |
|
7,695 |
|
2 , 675 |
|
5 |
|
|
Gain (loss) from indexed financial assets and liabilities |
|
218 |
|
1,178 |
|
1,754 |
|
3,881 |
|
15 , 235 |
|
27 |
|
|
Other income |
|
(1,118 |
) |
(2,909 |
) |
(3,266 |
) |
(6,434 |
) |
(6 , 744 |
) |
(12 |
) |
|
Other expenses |
|
7,776 |
|
11,915 |
|
15,420 |
|
30,462 |
|
18 , 591 |
|
33 |
|
|
Other income (expenses) |
|
484 |
|
(1,496 |
) |
2,336 |
|
(741 |
) |
4 , 392 |
|
8 |
|
|
Adjusted EBITDA(14) |
|
186,248 |
|
181,922 |
|
207,988 |
|
254,621 |
|
289 , 740 |
|
508 |
|
(6) Adjusted EBITDA margin is defined as Adjusted EBITDA divided by net sales, expressed as a percentage.
(7) Adjusted EBITDA / net financial expense is defined as Adjusted EBITDA divided by total financial expense (which includes expenses for hedging purposes) minus total financial income.
(8) Net debt is defined as the sum of (i) other current financial liabilities and (ii) other noncurrent financial liabilities, minus the sum of (i) cash and cash equivalents, (ii) other current financial assets and (iii) other non-current financial assets.
(9) Net debt/Adjusted EBITDA ratio is the ratio of our net debt (defined as the sum of (i) other current financial liabilities and (ii) other noncurrent financial liabilities, minus the sum of (i) cash and cash equivalents and (ii) other financial assets) as of the end of the applicable period divided by our Adjusted EBITDA for the last 12 months ended as of the end of the applicable period.
(10) For the calculation of the profits per share, it is taken into consideration the average amount of outstanding shares existing at each date.
(11) Each ADR represents six shares of common stock of the corresponding series of Shares.
(12) Unit cases refer to 192 ounces of finished beverage product (24 eight-ounce servings) or 5.69 liters.
(13) Includes waters, juices, beer and other spirits.
(14) Totals may not sum due to rounding.
Exchange Rates
Chile
Chile has two currency markets, the Mercado Cambiario Formal (the “Formal Exchange Market”) and the Mercado Cambiario Informal (the “Informal Exchange Market”). The Formal Exchange Market is comprised of banks and other entities authorized by the Chilean Central Bank. The Informal Exchange Market is comprised of entities that are not expressly authorized to operate in the Formal Exchange Market, such as certain foreign exchange houses and travel agencies, among others. The Chilean Central Bank is empowered to require that certain purchases and sales of foreign currencies be carried out on the Formal Exchange Market. See also “Item 10. Additional Information—D. Exchange Controls—Foreign Exchange Controls—Chile.”
Both the Formal and Informal Exchange Markets are driven by free market forces. Current regulations require that the Chilean Central Bank be informed of certain transactions and that they be effected through the Formal Exchange Market.
The U.S. dollar observed exchange rate ( dólar observado ), which is reported by the Chilean Central Bank and published daily in the Official Gazette ( Diario Oficial ), is the weighted average exchange rate of the previous business day’s transactions in the Formal Exchange Market. The Chilean Central Bank has the power to intervene by buying or selling foreign currency on the Formal Exchange Market to attempt to maintain the observed exchange rate within a desired range. During the past few years the Chilean Central Bank has attempted to keep the observed exchange rate within a certain range only under special circumstances. Although the Chilean Central Bank is not required to purchase or sell dollars at any specific exchange rate, it generally uses spot rates for its transactions. Other banks generally carry out authorized transactions at spot rates as well.
The Informal Exchange Market reflects transactions carried out at an informal exchange rate (the “informal exchange rate”). There are no limits imposed on the extent to which the rate of exchange in the Informal Exchange Market can fluctuate above or below the observed exchange rate. In recent years, the variation between the observed exchange rate and the informal exchange rate has not been significant.
The following table sets forth the annual low, high, average and period end observed exchange rate for U.S. dollars for the periods presented, as reported by the Chilean Central Bank. The Federal Reserve Bank of New York does not report a noon buying rate for Chilean pesos.
|
|
|
Daily observed exchange rate Ch$ per U.S.$ |
|
||||||
|
|
|
High(1) |
|
Low(1) |
|
Average(2) |
|
Period end(3) |
|
|
Year ended December 31, |
|
|
|
|
|
|
|
|
|
|
2010 |
|
549.17 |
|
468.01 |
|
510.21 |
|
468.01 |
|
|
2011 |
|
533.74 |
|
455.91 |
|
483.57 |
|
519.20 |
|
|
2012 |
|
519.69 |
|
469.65 |
|
486.59 |
|
479.96 |
|
|
2013 |
|
533.95 |
|
466.50 |
|
495.18 |
|
524.61 |
|
|
2014 |
|
621.41 |
|
527.53 |
|
570.33 |
|
606.75 |
|
|
Month end |
|
|
|
|
|
|
|
|
|
|
October 31, 2014 |
|
598.64 |
|
527.53 |
|
538.36 |
|
553.84 |
|
|
November 30, 2014 |
|
605.46 |
|
580.62 |
|
593.91 |
|
605.46 |
|
|
December 31, 2014 |
|
621.41 |
|
606.75 |
|
612.98 |
|
606.75 |
|
|
January 31, 2015 |
|
632.03 |
|
612.47 |
|
622.11 |
|
632.03 |
|
|
February 28, 2015 |
|
632.19 |
|
616.86 |
|
622.95 |
|
618.76 |
|
|
March 31, 2015 |
|
642.18 |
|
617.38 |
|
628.86 |
|
626.58 |
|
|
April 2015 (through April 17, 2015) |
|
621.10 |
|
610.74 |
|
614.84 |
|
612.30 |
|
Source: Chilean Central Bank.
(1) Exchange rates are the actual low and high, on a daily basis for each period.
(2) The yearly average rate is calculated as the average of the exchange rates on the last day of each month during the period.
(3) Each year period ends on December 31, and the respective period-end exchange rate is published by the Chilean Central Bank on the first business day of the following year. Each month period ends on the last calendar day of such month, and the respective period end exchange rate is published by the Chilean Central Bank on the first business day of the following month.
Argentina
From April 1, 1991 until the end of 2001, the Convertibility Law No. 23,928 and Regulatory Decree No. 529/91 (together, the “Convertibility Law”) established a fixed exchange rate under which the Central Bank of Argentina was obliged to sell U.S. dollars at a fixed rate of one Argentine peso per U.S. dollar. On January 6, 2002, the Argentine Congress enacted the Public Emergency Law, which suspended certain provisions of the Convertibility Law, including the fixed exchange rate of Ar$1.00 to U.S.$1.00, and granted the executive branch of the Argentine government the power to set the exchange rate between the Argentine peso and foreign currencies and to issue regulations related to the foreign exchange market. Following a brief period during which the Argentine government established a temporary dual exchange rate system, pursuant to the Public Emergency Law, the Argentine peso has been allowed to float freely against other currencies since February 2002. For the last few years the Argentine government has maintained a policy of intervention in foreign exchange markets,
conducting periodic transactions for the sale and purchase of U.S. dollars. There is no way to forsee if this could continue in the future. See also “Item 10. Additional Information—D. Exchange Controls—Foreign Exchange Controls—Argentina.”
The following table sets forth the annual high, low, average and period-end exchange rates for the periods indicated, expressed in Argentine pesos per U.S. dollar and not adjusted for inflation as reported by the Central Bank of Argentina. The Federal Reserve Bank of New York does not report a noon buying rate for Argentine pesos.
|
|
|
Daily observed exchange rate Ar$ per U.S.$ |
|
||||||
|
|
|
High |
|
Low |
|
Average(1) |
|
Period end |
|
|
Year ended December 31, |
|
|
|
|
|
|
|
|
|
|
2010 |
|
3.988 |
|
3.794 |
|
3.913 |
|
3.976 |
|
|
2011 |
|
4.304 |
|
3.972 |
|
4.131 |
|
4.304 |
|
|
2012 |
|
4.917 |
|
4.304 |
|
4.552 |
|
4.917 |
|
|
2013 |
|
6.518 |
|
4.923 |
|
5.479 |
|
6.518 |
|
|
2014 |
|
8.556 |
|
6.543 |
|
8.119 |
|
8.552 |
|
|
Month end |
|
|
|
|
|
|
|
|
|
|
October 31, 2014 |
|
8.503 |
|
8.448 |
|
8.480 |
|
8.502 |
|
|
November 30, 2014 |
|
8.526 |
|
8.507 |
|
8.514 |
|
8.526 |
|
|
December 31, 2014 |
|
8.556 |
|
8.526 |
|
8.550 |
|
8.552 |
|
|
January 31, 2015 |
|
8.640 |
|
8.554 |
|
8.602 |
|
8.640 |
|
|
February 28, 2015 |
|
8.726 |
|
8.649 |
|
8.686 |
|
8.724 |
|
|
March 31, 2015 |
|
8.820 |
|
8.736 |
|
8.781 |
|
8.820 |
|
|
April 2015 (through April 17, 2015) |
|
8.867 |
|
8.826 |
|
8.848 |
|
8.867 |
|
Source: Central Bank of Argentina.
(1) Represents the daily average exchange rate during each of the relevant periods.
Brazil
The Central Bank of Brazil allows the real/U.S. dollar exchange rate to float freely and has intervened occasionally to control unstable fluctuations in foreign exchange rates. We cannot predict whether the Central Bank of Brazil or the Brazilian government will continue to let the real float freely or will intervene in the exchange rate market through a currency band system or otherwise. The Brazilian real may depreciate or appreciate substantially against the U.S. dollar in the future. Exchange rate fluctuations may adversely affect our financial condition. See also “Item 10. Additional Information—D. Exchange Controls—Foreign Exchange Controls—Brazil.”
Prior to March 14, 2005, under Brazilian regulations, foreign exchange transactions were carried out on either the commercial rate exchange market or the floating rate exchange market. Rates in the two markets were generally the same. On March 14, 2005, the National Monetary Council of Brazil ( Conselho Monetário Nacional ) unified the two markets.
The following table sets forth the exchange selling rates expressed in Brazilian reais per U.S. dollar for the periods indicated, as reported by the Central Bank of Brazil through the Central Bank System (Sistema do Banco Central) using PTAX 800, option 5.
|
|
|
Daily observed exchange rate R$ per U.S.$ |
|
||||||
|
|
|
High |
|
Low |
|
Average |
|
Period end |
|
|
Year ended December 31, |
|
|
|
|
|
|
|
|
|
|
2010 |
|
2.4218 |
|
1.7024 |
|
1.9935 |
|
1.7412 |
|
|
2011 |
|
1.8811 |
|
1.6554 |
|
1.7593 |
|
1.6662 |
|
|
2012 |
|
1.9016 |
|
1.5345 |
|
1.6746 |
|
1.8758 |
|
|
2013 |
|
2.1121 |
|
1.7024 |
|
1.9550 |
|
2.0435 |
|
|
2014 |
|
2.7403 |
|
2.1974 |
|
2.3547 |
|
2.6562 |
|
|
Month end |
|
|
|
|
|
|
|
|
|
|
October 31, 2014 |
|
2.5341 |
|
2.3914 |
|
2.4483 |
|
2.4442 |
|
|
November 30, 2014 |
|
2.6136 |
|
2.4839 |
|
2.5484 |
|
2.5601 |
|
|
December 31, 2014 |
|
2.7403 |
|
2.5607 |
|
2.6394 |
|
2.6562 |
|
|
January 31, 2015 |
|
2.7107 |
|
2.5754 |
|
2.6342 |
|
2.6623 |
|
|
February 28, 2015 |
|
2.8811 |
|
2.6894 |
|
2.8165 |
|
2.8782 |
|
|
March 31, 2015 |
|
3.2683 |
|
2.8655 |
|
3.1395 |
|
3.2080 |
|
|
April 2015 (through April 17, 2015) |
|
3.1556 |
|
3.0249 |
|
3.0889 |
|
3.0544 |
|
Source: Central Bank of Brazil.
(1) Represents the daily average exchange rate during each of the relevant periods.
Not applicable.
C. REASONS FOR THE OFFER AND USE OF PROCEEDS
Not applicable.
D. RISK FACTORS
We are subject to various economic, political, social and competitive conditions. Any of the following risks, if they materialize, could materially and adversely affect our business, results of operations, prospects and financial condition.
Risks Relating to Our Company
We rely heavily on our relationship with The Coca-Cola Company, which has substantial influence over our business and operations.
75% of our net sales for the year ended December 31, 2014 was derived from the distribution of soft drinks under The Coca-Cola Company trademarks, and an additional 19% was derived from the distribution of other beverages also bearing trademarks owned by The Coca-Cola Company. We produce, market and distribute Coca-Cola products through standard bottler agreements between our bottler subsidiaries and The Coca-Cola Company and in certain cases a subsidiary of The Coca-Cola Company. The Coca-Cola Company has the ability to exercise substantial influence over our business through its rights under these bottler agreements. Under these bottler agreements, The Coca-Cola Company unilaterally sets the prices for Coca-Cola soft drink concentrate sold to us. The Coca-Cola Company also monitors our prices and has the right to review and approve our marketing, operational and advertising plans. In addition, The Coca-Cola Company may unilaterally set the price for its concentrate, and it may in the future increase the price we pay for concentrate, increasing our costs. These factors may impact our profit margins, which could adversely affect our net income and results of operations. Our marketing campaigns for Coca-Cola products are designed and controlled by The Coca-Cola Company. The Coca-Cola Company also makes significant contributions to our marketing expenses, although it is not required to contribute a particular amount. Accordingly, The Coca-Cola Company may discontinue or reduce such contribution at any time. Pursuant to the bottler agreements, we are required to submit a business plan to The
Coca-Cola Company for prior approval on a yearly basis. In accordance with our bottler agreements, The Coca-Cola Company may, among other things, require that we demonstrate the financial ability to meet our business plan, and if we are not able to demonstrate our financial capacity, The Coca-Cola Company may terminate our rights to produce, market and distribute Coca-Cola soft drinks or other Coca-Cola beverages in territories where we have such approval. Under these bottler agreements, we are prohibited from producing, bottling, distributing or selling any products that could be substituted for, be confused with or be considered an imitation of, Coca-Cola soft drinks or other Coca-Cola beverages and products.
We depend on The Coca-Cola Company to renew our bottler agreements, which are subject to termination by The Coca-Cola Company in the event we default or upon expiration of their respective terms. We currently are party to five bottler agreements: two agreements for Chile, which expire in 2018 and 2019, one agreement for Brazil, which expires in 2017, one agreement for Argentina, which expires in 2017, and one agreement for Paraguay, which is in process of renewal. We cannot provide any assurance that our bottler agreements will be maintained or extended upon their termination. Even if they are renewed, we cannot provide any assurance that renewal will be granted on the same terms as those currently in effect. Termination, non-extension or non-renewal of any of our bottler agreements would have a material adverse effect on our business, financial condition and results of operation.
In addition, any acquisition we make of bottlers of Coca-Cola products in other territories may require, among other things, the consent of The Coca-Cola Company under bottler agreements to which such other bottlers are subject. We cannot assure you that The Coca-Cola Company will consent to any future geographic expansion of our Coca-Cola beverage business. In addition, we cannot assure you that our relationship with The Coca-Cola Company will not deteriorate or otherwise undergo significant changes in the future. If such changes do occur, our operations and financial results and condition could be materially affected.
The nonalcoholic beverage business environment is changing rapidly, including as a result of increased obesity and other health concerns, which could have a material adverse effect on demand for our products, and consequently on our financial performance.
Consumers, public health officials and government officials in certain of our core markets, including Chile and Brazil, are increasingly concerned with public health consequences associated with obesity, particularly among young people. In addition, some researchers, health advocates and dietary guidelines are encouraging consumers to reduce consumption of sugar-sweetened beverages and beverages sweetened with nutritive or alternative sweeteners. Increasing public concern about these issues; possible new taxes on sugar-sweetened beverages; additional governmental regulations concerning the marketing, labeling, packaging or sale of our beverages; and negative publicity resulting from actual or threatened legal actions against nonalcoholic beverage companies relating to the marketing, labeling or sale of beverages may reduce demand for our products, which could adversely affect our profitability.
The nonalcoholic beverage business environment in our territories is evolving rapidly as a result of, among other things, changes in consumer preferences, including changes based on health and nutrition considerations and obesity concerns; shifting consumer tastes and needs; changes in consumer lifestyles; and competitive product and pricing pressures. In addition, the nonalcoholic beverage retail landscape is dynamic and constantly evolving, and if we are unable to adapt successfully to the changing environment and retail landscape, our share of nonalcoholic beverage sales, volume growth and overall financial results will be adversely affected.
Our business is highly competitive, including with respect to price competition, which may adversely affect our net profits and margins.
The soft drink and nonalcoholic beverage businesses are highly competitive in each of the territories in which we operate. We compete with bottlers of regional brands, including low cost “B brand” beverages and Pepsi products. In Argentina and Brazil, we compete with Companhia de Bebidas das Americas, commonly referred to as AmBev, the largest brewer in Latin America and a subsidiary of InBev S.A., which sells Pepsico trademark products, in addition to a portfolio that includes local brands with flavors, such as Guaraná. In Chile, our main competitor is Compañía de Cervecerías Unidas, which sells Pepsico trademark products as well as local brands. In Paraguay, a new local bottler of Pepsico trademark products entered the market, which we believe had
the effect of reducing our market share in Paraguay and could continue doing so. This competition in each of the regions where we operate is likely to continue, and we cannot assure you that it will not intensify in the future, which could materially and adversely affect our financial condition and results of operations.
Raw material prices may be subject to U.S. dollar/local currency exchange risk and price volatility, which could increase our costs of operations.
Numerous raw materials, including concentrate, sugar and resin, are used in producing beverages and containers. Prices for concentrate are determined by The Coca-Cola Company, and we cannot assure you that The Coca-Cola Company will not increase the price for concentrate or change the manner in which these prices are calculated. We purchase our raw materials from both domestic and international suppliers, some of which must be approved by The Coca-Cola Company, which may limit the number of suppliers available to us. Because the prices of certain raw materials are denominated in U.S. dollars, we are subject to local currency risk with respect to each of our operations. If any of the Chilean peso, Brazilian real, Argentine peso, or Paraguayan guaraní were to depreciate significantly against the U.S. dollar, the cost of certain raw materials in our respective territories could rise significantly, which could have an adverse effect on our financial condition and results of operations. We cannot assure you that these currencies will not lose value against the U.S. dollar in the future. Additionally, some raw material prices are subject to high volatility, which could also have a material adverse effect on our profitability. The supply or cost of specific raw materials could be adversely affected by domestic or global price changes, strikes, weather conditions, governmental controls or other factors. Any sustained interruption in the supply of these raw materials or any significant increase in their price could have a material adverse effect on our financial performance.
Instability in the supply of utility services and oil prices may adversely impact our results of operations.
Our operations depend on a stable supply of utilities and fuel in the countries where we operate. Electrical power outages could lead to increased energy prices and possible service interruptions. We cannot assure you that in the future we will not experience energy interruptions that materially and adversely affect our business. In addition, a significant increase in energy prices would raise our costs, which could materially impact our results of operations. Fluctuations in oil prices have adversely affected our cost of energy and transportation in the regions where we operate and we expect that they will continue to do so in the future. We cannot assure you that fuel prices will not increase in the future, and a significant increase in fuel price may have a significant effect on our financial performance.
Water scarcity and poor water quality could adversely impact our production costs and capacity.
Water is the main ingredient in substantially all of our products. It is also a limited resource in many parts of the world, facing unprecedented challenges from overexploitation, increasing pollution and poor management. As demand for water continues to increase around the world, and as the quality of available water deteriorates, we may incur increasing production costs or face capacity constraints that could adversely affect our profitability or net operating revenues. In addition, the Paraguayan government recently enacted new regulations related to ownership and water usage rights. Because this legislation is new, we will also be subject to uncertainty with respect to the interpretation of the regulations, and any ambiguity or uncertainty with respect to the interpretation or application of the regulation could result in non-compliance and associated costs and penalties, which are impossible or difficult to predict. We also anticipate discussions on new regulations on ownership and water usage in Chile.
Significant additional labeling or warning requirements may inhibit sales of our products.
The countries in which we operate may adopt significant advertising restrictions as well as additional product labeling or warning requirements relating to the chemical content or perceived adverse health consequences of certain of our Coca-Cola products or other products. In addition, the Chilean congress recently passed a new law with respect to labeling of certain consumer products, including soft drinks and bottled juices and waters such as ours. Because this legislation is new, we will also be subject to uncertainty with respect to the interpretation of the regulations, and any ambiguity or uncertainty with respect to the interpretation or application
of the regulation could result in non-compliance and associated costs and penalties, which are impossible or difficult to predict. These types of requirements, may adversely affect sales of our products.
Our business may be adversely affected if we are unable to maintain brand image and product quality.
Our beverage business is highly dependent on maintaining the reputation of our products in the countries where we operate. If we fail to maintain high standards for product quality, our reputation and ability to remain a distributor of Coca-Cola beverages in the countries where we operate could be jeopardized. In addition, we may be liable if the consumption of any of our products causes injury or illness. Negative publicity or incidents related to our products may reduce their demand and could have a material adverse effect on our financial performance.
We may not be able to realize the anticipated benefits of our acquisition of Ipiranga.
The success of our acquisition of Ipiranga will depend in part on our ability to achieve synergies from the streamlining of operations and personnel, increased economies of scale, organic growth and the implementation of best practices, from each of Ipiranga and Andina, with respect to production, distribution and commercialization, across our operations in Brazil.
We have been integrating Ipiranga’s operations with ours, which consists of combining back-office operations (mainly those activities related to finance, treasury, accounting, procurement, tax, legal and human resources) to achieve synergies from our combined operations. Additionally, we will determine the organizational structure and define the management team. The second stage of integration will be focused on logistics and production, as well as the exchange of commercial best practices. However, we may not be able to complete these phases of integration in a manner that achieve the synergies, efficiencies and growth opportunities in the time, manner or amount that we seek. Challenges we will face in the integration process include, among others, the following:
· integrating different commercial practices and company cultures in order to provide a unified and superior client experience in each of our territories in Brazil;
· streamlining human resources and different management structures, while retaining highly qualified personnel;
· integrating different accounting, information technology and management systems;
· integrating procurement processes and maintaining strong relations with suppliers;
· maintaining client loyalty while consolidating marketing processes; and
· encountering unforeseen expenses, delays or liabilities that could exceed the savings that we seek to achieve from the elimination of duplicative expenses and cost savings.
The integration process itself presents significant management challenges and is time consuming and disruptive, as it requires coordination of operations in different geographic locations in Brazil. As a result, the integration process may divert our management’s attention from the day-to-day operation of our core business operations. Any such diversion could adversely affect our ability to maintain good relations with our customers, suppliers, employees, regulators and other constituencies or otherwise adversely affect our business, financial condition, results of operations and our business prospects. If we fail to implement the integration with Ipiranga effectively within the timeline contemplated by us, or if for any other reason the anticipated synergies, cost savings and growth opportunities fail to materialize, our business, financial condition, results of operation and business prospects could be materially and adversely affected.
In addition, Ipiranga is party to a series of ongoing administrative tax proceedings in which the Brazilian federal tax authorities have claimed that Ipiranga has unpaid liabilities for value-added taxes on
industrialized products ( imposto sobre produtos industrializados , or IPI) in an aggregate amount of approximately R$939.288.545. Ipiranga disagrees with the Brazilian tax authority ’ s position and believes that it was entitled to claim IPI tax credits in connection with its purchases of certain exempt inputs from suppliers located in the Manaus Free Trade Zone, and believes that the Brazilian tax authority ’ s claims are without merit, and intends to defend its position vigorously. Our external Brazilian counsel has advised us that it believes Ipiranga ’ s likelihood of loss in most of these procedures should be classified as possible to remote (i.e., approximately 30% likelihood). If Ipiranga were required to pay all or a substantial portion of the amount claimed by the tax authorities, such payment could have a material adverse effect on the value of our investment in Ipiranga and our financial condition and results of operations. Additionally, adverse preliminary decisions in one or more of these proceedings may require the use of substantial financial resources during its review by a higher court.
Trademark infringement could adversely impact our beverage business.
A significant portion of our sales derives from sales of soft drinks branded with Coca-Cola trademarks, as well as other trademarks. If other parties attempt to misappropriate trademarks we use, we may be unable to protect these trademarks. The maintenance of the reputation of these brands is essential for the future success of our beverage business. Misappropriation of trademarks we use, or challenges thereto, could have a material adverse effect on our financial performance.
Weather conditions or natural disasters may adversely affect our business.
Lower temperatures and higher rainfall may negatively impact consumer patterns, which may result in lower per capita consumption of our beverage offerings. Additionally, adverse weather conditions or natural disasters may affect road infrastructure in the countries in which we operate and limit our ability to sell and distribute our products. For example, in February of 2010 our business experienced a temporary interruption in our production as a result of the 8.8 magnitude earthquake in central Chile; and in March 2015, flash floods in the north of Chile interrupted our production and distribution in such territory.
A severe earthquake or tsunami in Chile could adversely affect the Chilean economy and our network infrastructure.
Chile lies on the Nazca tectonic plate, one of the world’s most seismically active regions. Chile has been adversely affected by powerful earthquakes in the past, including an 8.0 magnitude earthquake that struck Santiago in 1985 and a 9.5 magnitude earthquake in 1960 which was the largest earthquake ever recorded.
On February 27, 2010, an 8.8 magnitude earthquake struck the central and south central regions of Chile. The quake epicenter was located 200 miles southwest of Santiago and 70 miles north of Concepción, Chile’s second largest city. The regions of Bío Bío and Maule were the most severely affected regions, especially the coastal area, which, shortly after the earthquake, was hit by a tsunami that significantly damaged cities and port facilities. The regions of Valparaíso and Metropolitan region were also severely affected. At least 1,500,000 homes were damaged and more than 500 people were killed. According to an initial assessment by the government of Chile, the repair of the resulting damage, excluding damage to port facilities, is likely to take between three and four years and the preliminary assessments of reconstruction costs indicate that they could total approximately US$30 billion. As a result of these developments, economic activity in Chile was adversely affected in March 2010. Legislation was passed to raise the corporate income tax rate in order to pay for reconstruction following the earthquake and tsunami, which had an adverse effect on our results. The legislation increased the corporate tax rate from its previous rate of 17.0% to 20.0%.
A severe earthquake and/or tsunami in Chile in the future could have an adverse impact on the Chilean economy and on our production and logistics network, including our business, results of operations and financial condition.
Our insurance coverage may not adequately cover losses resulting from the risks for which we are insured.
We maintain insurance for our principal facilities and other assets. Our insurance coverage protects us in the event we suffer certain losses resulting from theft, fraud, expropriation, business interruption, natural disasters or other similar events or from business interruptions caused by such events. In addition, we maintain insurance policies for our directors and officers. We cannot assure you that our insurance coverage will be sufficient or will provide adequate compensation for losses that we may incur.
If we are unable to protect our information systems against data corruption, cyber-based attacks or network security breaches, our operations could be disrupted.
We are increasingly dependent on information technology networks and systems, including over the Internet, to process, transmit and store electronic information. In particular, we depend on our information technology infrastructure for digital marketing activities and electronic communications among us and our clients, suppliers and also among our subsidiaries. Security breaches of this infrastructure can create system disruptions, shutdowns or unauthorized disclosure of confidential information. If we are unable to prevent such breaches, our operations could be disrupted, or we may suffer financial damage or loss because of lost or misappropriated information.
Perception of risk in emerging economies may impede our access to international capital markets, hinder our ability to finance our operations and adversely affect our financial performance.
International investors generally consider Argentina and Paraguay, and to a lesser extent Chile and Brazil, to be emerging market economies. Consequently, economic conditions and the market for securities of emerging market countries influence investors’ perceptions of Chile, Brazil, Argentina and Paraguay and their evaluation of securities of companies located in these countries.
During periods of heightened investor concern regarding emerging market economies, in particular Argentina and to a lesser extent Brazil and Paraguay, have experienced significant outflows of U.S. dollars.
In addition, in these periods Brazilian, Argentine and Paraguayan companies have faced higher costs for raising funds, both domestically and abroad, as well as limited access to international capital markets, which have negatively affected the prices of the aforementioned countries’ securities. Although economic conditions are different in each of the emerging-market countries, investors’ reactions to developments in one of these countries may affect the securities of issuers in the others, including Chile. For example, adverse developments in other developing or emerging market countries may lead to decreased investor interest in investing in Chile or in the securities of Chilean companies.
Our business may be adversely affected if we fail to renew collective bargaining labor agreements on satisfactory terms or experience strikes or other labor unrest.
A substantial portion of our employees is covered by collective bargaining labor agreements. These agreements generally expire every one, two or three years, as the case may be. Our inability to renegotiate these agreements on satisfactory terms could cause work stoppages and interruptions, which may adversely impact our operations. The terms and conditions of existing or renegotiated agreements could also increase our costs or otherwise have an adverse effect on our operational efficiency. We experience periodic strikes and other forms of labor unrest through the ordinary course of business. For example, in 2008 we experienced a strike in our production facilities in Chile, which lasted for a period of approximately two weeks, and which had a significant effect on our production capacity. We cannot assure you labor interruptions or other labor unrest will not occur in the future. If we experience strikes, work stoppages or other forms of labor unrest at any of our production facilities, our ability to supply finished beverages to customers could be impaired, which would reduce our net operating revenues and could expose us to customer claims.
Our business is subject to extensive regulation, which is complex and subject to change.
We are subject to local regulations in each of the territories in which we operate. The principal areas in which we are subject to regulation are water, environment, labor, taxation, health, consumer protection, advertising and antitrust. Regulation could also affect our ability to set prices for our products. The adoption of new laws or regulations or a stricter interpretation or enforcement thereof in the countries in which we operate may increase our operating costs or impose restrictions on our operations which, in turn, may adversely affect our financial condition, business and results. Further changes in current regulations may result in increased compliance costs, which may have an adverse effect on our results or financial condition.
In the past, voluntary price restraints or statutory price controls have been imposed in several of the countries in which we operate. Currently there are no price controls applicable to our products in any of the territories in which we operate, other than in Argentina, where there are voluntary price restraints. There are currently no published laws or regulations imposing price controls on our products in Argentina. Nonetheless, we have complied with the request by Argentine government authorities to maintain prices of certain products sold through supermarkets. The imposition of these restrictions or voluntary price restraints in Argentina or other territories may have an adverse effect on our results and financial condition. We cannot assure you that government authorities in Argentina or in any country in which we operate will not impose statutory price controls, or that we will not be asked to accept further voluntary price restraints in the future.
We may be required to incur considerable expenses in order to comply with various environmental laws and regulations. Such expenses may have a material adverse effect on our results of operations and financial position.
We are subject to various environmental laws and regulations that apply to our products and activities. If these environmental laws and regulations are strengthened or newly established in jurisdictions in which we conduct our businesses, we may be required to incur considerable expenses in order to comply with such laws and regulations. Such expenses may have a material adverse effect on our results of operations and financial position. To the extent we determine that it is not financially sound for us to continue to comply with such laws and regulations, we may have to curtail or discontinue our activities in the affected business areas.
If we were to become subject to adverse judgments or determinations in legal proceedings to which we are, or may become, a party, our future profitability could suffer through a reduction of sales, increased costs or damage to our reputation due to our failure to adequately communicate the impact of any such proceeding or its outcome to the investor and business communities.
In the ordinary course of our business, we become involved in various other claims, lawsuits, investigations and governmental and administrative proceedings, some of which are or may be significant. In addition, Andina Brazil is party to a series of ongoing administrative tax proceedings in which the Brazilian federal tax authorities have claimed that Andina Brazil has unpaid liabilities for value-added taxes on industrialized products ( imposto sobre produtos industrializados , or IPI) involving aggregate claims of a significant amount. We may not be able to realize the anticipated benefits of our acquisition of Ipiranga.” Adverse judgments or determinations in one or more of these proceedings could require us to change the way we do business or use substantial resources in adhering to the settlements and could have a material adverse effect on our business, including, among other consequences, by significantly increasing the costs required to operate our business. Ineffective communications, during or after these proceedings, could amplify the negative effects, if any, of these proceedings on our reputation and may result in a negative market impact on the price of our securities. Additionally, adverse preliminary decisions in one or more of these proceedings may require the use of substantial financial resources during its review by a higher court.
The countries in which we operate may adopt new tax laws or modify existing laws to increase taxes applicable to our business.
We cannot assure you that any governmental authority in any country where we operate will not impose new taxes or increase taxes on our products in the future. The imposition of new taxes or increases in taxes on our products may have a material adverse effect on our business, financial condition, prospects and results.
For example, in Chile, a tax reform became effective in September 2014 . This reform provides “Transitional rules” for business years 2014, 2015 and 2016 and “Permanent rules” for business years 2017 and following.
In the Transitional Regime, for calendar years 2014, 2015 and 2016, the Reform progressively increases the Corporate Income Tax rate (“corporate income tax”) to 21%, 22.5% and 24%, respectively. There are no changes to the taxation that applies to dividends paid to non-resident in Chile shareholders. The additional tax rate (“withholding tax”) remains at 35% and credit for 100 percent of corporate income tax that may be charged to dividends remitted abroad. For local shareholders, natural persons domiciled or resident in Chile the current regime also remains.. They are taxed with the Supplementary Global Tax which has progressive rates ranging between 0% and 40% in the year they receive the payment of the dividend, entitled to credit for the entirety of corporate income tax paid by the issuer of the shares. For the business year 2017 the rate will be 25% for companies that choose the “attributed” system and 25.5% for those taxed by the “semi-integrated” system.
In the Permanent Regime, for the years 2017 and following, taxpayers may choose one of the following income taxation schemes: a) Attributed Regime: in this scheme, annual accrued profits are immediately charged with the corporate income tax rate of 25% and an Additional Tax of 35%, maintaining the right to credit against the latter, 100% of corporate income tax. In this option, not resident in Chile shareholders are taxed with the Additional Tax regardless of whether the Chilean company pays a dividend or not, since the Additional Tax should be declared and paid in the year in which profits are accrued in the Chilean company that has issued the shares.
The same applies to local shareholders, natural persons domiciled in Chile, but with a maximum rate of 35% for Supplementary Global Tax. (b) Semi-integrated regime: under this regime, the earned annual profits are taxed with the corporate income tax rate of 27% (25.5% for business year 2017). Dividends remitted abroad and those paid to local shareholders are taxed with additional tax or Supplementary Global Tax (with a maximum rate of 35%) only in the year of the payment of the dividend. The additional tax rate remains at 35% with corporate income tax credit paid by the issuing company.
Notwithstanding the previous, local shareholders and shareholders domiciled in countries that do not have an existing Treaty to avoid double taxation with Chile, can only credit 65% of corporate income tax, with which total tax burden on profits distributed to these shareholders rises to 44,45%. The credit limitation is made by establishing a debit (tax) to the shareholder equal to 35% of corporate income tax.
It should be noted, that in an open stock corporation the option to choose the regime which will be used, must be approved at an extraordinary shareholders meeting with a quorum of at least two thirds of the shares issued with voting rights. For the first period (business year 2017), the option must be exercised (via a statement to the tax authority) during the second half of business year 2016. If it does not exercise the option, it will be subject to the semi-integrated system.
The same reform increased the additional tax on non-alcoholic beverages with sugar from 13% to 18%, and reduced the additional tax on non-alcoholic beverages without sugar from 13% to 10%.
In November 2012, the government of the Province of Buenos Aires, Argentina, adopted Law No. 14,394, which increased the tax rate applied to revenue from products sold within the Province of Buenos Aires. For products manufactured in the territory of the Province of Buenos Aires, Law No. 14,394 increased the tax rate from 1% to 1.75%, and for products manufactured in any other Argentine province, from 3% to 4%. In January 2013, the government of the Province of Chubut, Argentina, adopted Law No. XXIV-62, which increased the tax rate applied to revenue from products sold within the Province of Chubut and manufactured in any other Argentine province from 3% to 4%. In December 2012, the government of the Province of La Pampa, Argentina, adopted Law No. 2,700, which increased the tax rate applied to revenue from products sold within the Province of La Pampa and manufactured in any other Argentine province, from 1.5% to 2.5%. In January 2013, the government of the Province of Mendoza, Argentina, adopted Law No. 8,523, which increased the tax rate applied to revenue from the sale of mineral water bottled in any other Argentine province and sold within the Province of Mendoza from 4% to 6%. In January 2013, the government of the Province of Río Negro, Argentina,
adopted Law No. 4,816, which increased the tax rate applied to revenue from products sold within the Province of Río Negro and manufactured in any other Argentine province from 1.8% to 3%.
Given the high tax burden in Brazil, the government provides relevant tax incentives to attract investment to certain territories, particularly for manufacturers and other companies operating and investing in Brazil. Andina Brazil has been provided with some of said incentives. However, these incentive programs may be modified or terminated, thereby increasing our cost of operations in Brazil. Termination, non-extension or non-renewal of said tax incentives would have a material adverse effect on our business, financial condition and results of operation.
Risks Relating to Chile
Our growth and profitability depend on economic conditions in Chile.
39.3% of our assets as of December 31, 2014 and 27.3% of our net sales for the year ended December 31, 2013 corresponded to our operations in Chile. Thus, our financial condition and results of operations depend significantly on economic conditions prevailing in Chile.
International and local economic crisis may adversely affect the Chilean economy, and unfavorable general economic conditions could negatively affect the affordability of and demand for some of our products. In difficult economic conditions, consumers may seek to reduce discretionary spending by forgoing purchases of our products or buying low cost “B brands” offered by competitors. Any of these events could have an adverse effect on our business, financial condition and results of operations.
According to data published by the Central Bank, the Chilean economy grew at a rate of 5.6% in 2012, 4.2% in 2013 and 1.9% in 2014. Our financial condition and results of operations could also be adversely affected by changes over which we have no control, including, without limitation:
· the economic or other policies of the Chilean government, which has a substantial influence over many aspects of the private sector;
· other political or economic developments in or affecting Chile;
· regulatory changes or administrative practices of Chilean authorities;
· inflation and governmental policies to combat inflation;
· currency exchange movements; and
· global and regional economic conditions.
We cannot assure you that Chile’s economy will continue to grow in the future, nor can we assure you that future developments in or affecting the Chilean economy will not impair our ability to successfully carry out our business plan or materially adversely affect our business, financial condition or results of operations.
Inflation in Chile and government measures to curb inflation may disrupt our business and have an adverse effect on our financial condition and results of operations.
Although Chilean inflation has decreased in recent years, Chile has experienced high levels of inflation in the past. The annual rates of inflation in Chile, which in 2012, 2013 and 2014 were 1.5%, 3.0% and 4.6%, respectively, as measured by changes in the consumer price index and as reported by the INE ( Instituto Nacional de Estadísticas , or the Chilean National Institute of Statistics), could adversely affect the Chilean economy and have a material adverse effect on our financial condition and results of operations if we are unable to increase our prices in line with inflation. We cannot assure you that Chilean inflation will not revert to prior levels in the future.
The measures taken by the Central Bank to control inflation have often included maintaining a conservative monetary policy with high interest rates, thereby restricting the availability of credit and economic growth. Inflation, measures to combat inflation, and public speculation about possible additional actions have also contributed materially to economic uncertainty in Chile and to heightened volatility in its securities markets. Periods of higher inflation may also slow the growth rate of the Chilean economy, which could lead to reduced demand for our products and decreased sales. Inflation is also likely to increase some of our costs and expenses, given that the majority of our supply contracts are UF-denominated or are indexed to the Chilean consumer price index, and we cannot assure you that, under competitive pressure, we will be able to realize price increases, which could adversely impact our operating margins and operating income. Additionally, an important part of our financial debt is UF-denominated, and therefore the value of the debt reflects any increase of the inflation in Chile.
The Chilean peso is subject to depreciation and volatility, which could adversely affect our business.
The Chilean government’s economic policies and any future changes in the value of the Chilean peso against the U.S. dollar could adversely affect our operations and financial results. The Chilean peso has been subject to large nominal devaluations in the past and may be subject to significant fluctuations in the future. The main drivers of exchange rate volatility in past years were the significant fluctuations of commodity prices, as well as general uncertainty and trade imbalances in the global markets. In 2011, the Chilean peso appreciated mainly resulting from worsening financial conditions in certain Eurozone countries and higher volatility in global financial markets. The more recent exchange rate volatility has also been driven by uncertainty about the Eurozone’s financial situation and its effects on global growth. The value of the Chilean peso against the U.S. dollar may continue to fluctuate significantly in the future.
Based on the Observed Exchange Rates for U.S. dollars as of December 31, 2012, 2013 and 2014, the Chilean peso appreciated 7.6% and depreciated 9.3% and 15.7% relative to the U.S. dollar in nominal terms, respectively.
Risks Relating to Brazil
Our business operations in Brazil are dependent on economic conditions in Brazil.
36.6% of our assets as December 31, 2014 and 39.8% of our consolidated net sales for the year ended December 31, 2014 corresponded to our operations in Brazil. Because demand for soft drinks and beverage products is usually correlated to economic conditions prevailing in the relevant local market, which in turn is dependent on the macroeconomic condition of the country in which the market is located, our financial condition and results of operations to a considerable extent are dependent upon political and economic conditions prevailing in Brazil. The Brazilian economy is also affected by international economic and market conditions in general, especially economic and market conditions in the United States. Similarly to other emerging market countries, the Brazilian currency depreciated significantly during 2014, attributed in part to an outflow of capital related to the expectation that the United States Federal Reserve will reduce or end its “quantitative easing” economic stimulus measures. The Brazilian economy is therefore subject to uncertainties and risks related to changes in economic conditions and policy measures in countries such as the United States and China, as well as the European Union and elsewhere.
In recent years, the Brazilian economy has experienced a decline in GDP growth. After growing at a rate of 7.6% in 2010, GDP increased by 3.9% in 2011, 1.0% in 2012, 2.7 in 2013 and 0.1 in 2014. During 2013 and 2014, the Brazilian economy has also experienced rising inflation, partially resulting from a significant depreciation in the value of its currency. Increased inflation and decreased economic growth have also contributed to an increase in social unrest, including public protests. In late August 2013, the Central Bank of Brazil announced new policy measures, including interventions in foreign exchange markets designed to prevent the real from depreciating further, as well as raising Brazil’s benchmark interest rate, designed to prevent a further increase in inflation. However, the effect of such policy measures are subject to significant uncertainties, and we cannot provide any assurance that these measures will be effective in causing an improvement in economic conditions, or that they will not lead to unintended, adverse effects on the Brazilian economy.
The Brazilian government exercises significant influence over the Brazilian economy, which together with historically volatile Brazilian political, social and economic conditions, could adversely affect our financial condition and results of operations.
The Brazilian government has intervened in the Brazilian economy and occasionally makes significant changes to monetary, tax and credit policies, among others. The Brazilian government’s measures to control inflation, stimulate economic expansion and implement other policies have included, among others, salary and price controls, appreciation or depreciation of the Brazilian real, foreign exchange adjustments, control over remittances abroad and intervention by the Central Bank of Brazil to change the basic interest rates. We cannot foresee or control which measures or policies the Brazilian government may adopt in the future. Our activities, financial and operating results, as well as our estimates may be adversely affected by changes in the policies adopted by the Brazilian government, as well as by general factors, including, but not limited to:
· Brazilian economic expansion;
· inflation;
· interest rates;
· variation in foreign exchange rates;
· foreign exchange rate control policies;
· liquidity of domestic capital and debt markets;
· tax policy and changes in tax laws; and
· other political, diplomatic, social and economic guidelines or events in Brazil or otherwise affecting the country.
Changes and uncertainties with respect to the implementation of the aforementioned governmental policies may contribute to uncertainties in Brazil.
In 2011, a new presidential term began, which raised the possibility of the introduction of new economic and social policies at the federal and state levels. Historically, changes in government have brought changes to Brazilian economic policy. As of mid-2013, the Brazilian economy had experienced declining GDP growth, as well as a depreciated currency and increased inflation. In late August 2013, the Brazilian central bank announced new policy measures, including interventions in foreign exchange markets designed to prevent the real from depreciating further, as well as raising Brazil’s benchmark interest rate, designed to prevent a further increase in inflation. However, the effect of such policy measures are subject to significant uncertainties, and we cannot provide any assurance that these measures will be effective in causing an improvement in economic conditions, or that they will not lead to unintended, adverse effects on the Brazilian economy.
Any unfavorable policy changes by the Brazilian government could adversely affect us. Uncertainty over whether the Brazilian government will implement changes in policy or laws affecting these and other factors in the future may contribute to economic uncertainty in Brazil. These factors, as well as uncertainties about the policies or regulations to be adopted by the Brazilian government with respect to these factors may adversely affect us, including our activities and financial performance.
Inflation and the Brazilian government’s measures to curb inflation, including by increasing interest rates, may contribute to economic uncertainty in Brazil, adversely affecting the operations of Andina Brazil, which could adversely impact our financial condition and results of operations.
Brazil has historically experienced extremely high rates of inflation. Inflation, and several measures taken by the Federal Government in order to control it, combined with speculation about possible government
measures, had significant negative effects on the Brazilian economy. Historically, the annual inflation rates recorded in Brazil before 1995 were extremely high, and included periods of hyperinflation. The annual rate of inflation measured by the price index known as the IPCA ( Índice Nacional de Preçosao Consumidor Amplo ) was 6.50% in 2011, 5.84% in 2012 and 5.91% in 2013. For the year ended December 31, 2014 the IPCA was 6.41%. Considering this history and the uncertainty around the Brazilian government’s policies, we cannot provide any assurance that inflation rates in Brazil will not increase.
Inflationary pressures may result in governmental interventions in the economy, including policies that could adversely affect the general performance of the Brazilian economy, which, in turn, could adversely affect our business operations in Brazil. Inflation may also increase our costs and expenses, and we may be unable to transfer such costs to our customers, reducing our profit margins and net income. In addition, inflation could also affect us indirectly, as our customers may also be affected and have their financial capacity reduced. Any decrease in our net sales or net income, as well as any reduction in our financial performance, may also result in a reduction in our net operating margin. Our customers and suppliers may be affected by high inflation rates and such effects on our customers and suppliers may adversely affect us.
The Brazilian real is subject to depreciation and volatility, which could adversely affect our financial condition and results of operations.
The Brazilian currency has fluctuated over the past three decades. Throughout this period, the Brazilian government has implemented various economic plans and exchange rate policies, including sudden devaluations, periodic mini-devaluations (during which the frequency of adjustments has ranged from daily to monthly), exchange controls, dual exchange market and floating exchange rate systems. Although long-term devaluation of the real is generally related to the rate of inflation in Brazil, the devaluation of the real over shorter periods has resulted in significant fluctuations in the exchange rate between the Brazilian currency, the U.S. dollar and other currencies. For example, the real depreciated 15.7% in 2001 and 34.3% in 2002 against the U.S. dollar. However, the real appreciated 13.4%, 9.5% and 20.7% against the U.S. dollar in 2005, 2006 and 2007, respectively. In 2008, as a result of the worsening global economic crisis, the real depreciated 24.2% against the U.S. dollar, closing at R$2.34 to US$1.00 on December 31, 2008. In 2009, the real appreciated 34.2% against the U.S. dollar, closing at R$1.74 to US$1.00. In 2010, the real appreciated 9.6% against the U.S. dollar, closing at R$1.666 to US$1.00 on December 31, 2010. In 2011, the real depreciated against the U.S. dollar, closing at R$1.866 to US$1.00 on December 31, 2011. In 2012, the real depreciated against the U.S. dollar, closing at R$2.0435 to US$1.00 on December 31, 2012. In 2013, the real depreciated against the U.S. dollar, closing at R$2.3426 to US$1.00. In 2014, the real depreciated against the U.S. dollar, closing at R$2.6562 to US$1.00. We cannot guarantee that the real will not again depreciate or appreciate against the U.S. dollar in the future. In addition, we cannot guarantee that any deprecation or appreciation of the real against the U.S. dollar or other currencies will not have an adverse effect on our business.
Any depreciation of the real against the U.S. dollar could create additional inflationary pressure, which might result in the Brazilian government adopting restrictive policies to combat inflation. This could lead to increases in interest rates, which might negatively affect the Brazilian economy as a whole, as well as our results of operations, in addition to restricting our access to international financial markets. It also reduces the U.S. dollar value of our revenues. On the other hand, future appreciation of the real against the U.S. dollar might result in the deterioration of Brazil’s current and capital accounts, as well as a weakening of Brazilian GDP growth derived from exports.
Risks Relating to Argentina Our business operations in Argentina are dependent on economic conditions in Argentina.
10.0% of our assets as of December 31, 2014 and 25.7% of our net sales for the year ended December 31, 2014 corresponded to our operations in Argentina. Because demand for soft drinks and beverage products is usually correlated to economic conditions prevailing in the local market, which in turn is dependent on the macroeconomic condition of the country, the financial condition and results of operations of our business operations in Argentina are, to a considerable extent, dependent upon political and economic conditions prevailing in Argentina.
Historically, the Argentine economy has experienced periods of high levels of instability and volatility, low or negative economic growth and high and variable inflation and devaluation levels. During 2001 and 2002, Argentina went through a period of major political, economic and social instability, which led to a partial default by Argentina in the payment of its sovereign debt, and the devaluation of the peso in January 2002, after over ten years of parity with the U.S. dollar. Although general economic conditions in Argentina have recovered significantly during the past years, there is uncertainty as to whether this recovery is sustainable. This is mainly because recent economic growth was initially dependent on a significant devaluation of the Argentine peso, a high excess production capacity resulting from a long period of deep recession and high commodity prices. According to the INDEC ( Instituto Nacional de Estadísticas y Censos , or the National Statistics and Census Institute), GDP growth in real terms in Argentina 9.2% in 2010, 8.9% in 2011, 1.9% in 2012, 3.0% in 2013 and 0.5% in 2014. We cannot assure you that Argentine GDP will increase or remain stable in the future. The economic crisis in Europe, the international demand for Argentine products, the stability and competitiveness of the Argentine peso against foreign currencies, confidence among consumers and foreign and domestic investors, a stable and relatively low rate of inflation and the future political uncertainties, among other factors, may affect the development of the Argentine economy.
Political and economic instability in Argentina may recur, which could have a material adverse effect on our Argentine operations and on our financial condition and results of operations.
In the period from 1998 through 2003, Argentina experienced acute economic difficulties that culminated in the restructuring of substantially all of Argentina’s sovereign indebtedness. A succession of presidents was inaugurated during this crisis period and various states of emergency were declared that suspended civil liberties and instituted restrictions on transfers of funds abroad and foreign exchange controls, among other measures. Argentina’s GDP contracted 10.9% in 2002. Beginning in 2003, Argentine GDP began to recover and from 2004 to 2008 recorded an average rate of growth of 8.4%.
The global economic crisis of 2008 led to a sudden economic decline, accompanied by political and social unrest, inflationary and Argentine peso depreciation pressures and lack of consumer and investor confidence, which have forced the Argentine government to adopt different measures, including the tightening of foreign exchange controls, the elimination of subsidies to the private sector and the proposal for new taxes.
Moreover, the Argentine government may increase its level of intervention in certain areas of the economy. For example, in May of 2012, the Argentine government nationalized YPF S.A., Argentina’s largest and previously Spanish-owned oil company. Expropriations and other interventions by the Argentine government such as the one relating to YPF can have an adverse impact on the level of foreign investment in Argentina, the access of Argentine companies to the international capital markets and Argentina’s commercial and diplomatic relations with other countries. In the future, the level of governmental intervention in the economy may continue, which may have adverse effects on Argentina’s economy and, in turn, our business, results of operations and financial condition.
The Argentine government could impose certain restrictions on currency conversions and remittances abroad, which could affect the timing and amount of any dividends or other payment we receive from our Argentine subsidiary.
In 2001 and 2002, the Argentine government implemented a number of monetary and currency exchange control measures, which included restrictions on the withdrawal of funds deposited with banks and stringent restrictions on the outflow of foreign currency from Argentina, including for purposes of paying principal and interest on debt and distributing dividends. Although most of these restrictions were eased in the past, as a consequence of the increase of the demand in Argentina for U.S. dollars and the capital flows out of Argentina during 2011, the Argentine government imposed additional restrictions on the purchase of foreign currency and on certain transfers of funds from Argentina and reduced the time required to comply with certain transfers of funds into Argentina.
Under current Argentine law, we may declare and distribute dividends with respect to our Argentine subsidiary and Argentine banks may lawfully process payments of those dividends to us and other non-resident shareholders. Our declaration and distribution of dividends is subject to certain statutory requirements and must
be consistent with our audited financial statements. The processing of payment of dividends by Argentine banks is subject to Argentine Central Bank regulations, including verification of our Argentine subsidiary’s compliance with foreign debt and direct investment disclosure obligations. In addition to statutory and administrative rules affecting our Argentine subsidiary’s payment of dividends, during 2012 the Argentine government imposed discretionary restrictions on Argentine companies as part of a policy to limit outbound transfers of U.S. dollars. These de facto restrictions essentially halted dividend payments to non-resident shareholders. The Argentine government has begun to relax these restrictions. Nonetheless, we cannot assure you that we will be able to cause our Argentine subsidiary to distribute dividends to its non-resident shareholders now or in the foreseeable future, despite otherwise meeting all statutory and regulatory requirements for payment.
Argentina’s government may impose certain restrictions on imports, which could have an impact in our operations.
Pursuant to a resolution of the Argentine Federal Tax Authority (“ Administración Federal de Ingresos Públicos—AFIP ”), since February 2012, prior to the execution of any purchase order or similar document, Argentine importers are required to file before the AFIP a “Prior Import Statement” ( Declaración Jurada Anticipada de Importación ) providing information on future imports. Compliance with this requirement will be verified by the Argentine customs upon arrival of the goods into Argentina and will be a condition for the authorization of the payment of the purchase price by the Argentine financial entities. Although this is intended merely as an information regime, it may be used for purposes of restricting imports into Argentina. A similar regime was also imposed in respect of the import and export of services, and could result in additional restrictions being imposed on the payments made by Argentine residents on services provided by foreign residents. The imposition of this regime may restrict the imports of goods and services of our Argentine subsidiaries which may adversely affect our financial conditions or results of operations.
Inflation in Argentina may adversely affect our operations, which could adversely impact our financial condition and results of operations.
Argentina has experienced high levels of inflation in recent decades, resulting in large devaluations of its currency. Argentina’s historically high rates of inflation resulted mainly from its lack of control over fiscal policy and the money supply. According to the INDEC, the official annual rates of inflation for the years 2011, 2012, 2013 and 2014 were 9.5%, 10.8%, 10.9% and 23.9%, respectively. Moreover, after changes in personnel and in the methodology used to calculate the consumer price index at the INDEC in 2007, the accuracy of its measurements has been put in doubt by economists and investors, and the actual consumer price index and wholesale price index could be substantially higher than those indicated by the INDEC. If it is determined that it is necessary to correct the consumer price index and other INDEC indices, there could be a significant decrease in confidence in the Argentine economy, which could, in turn, have a material adverse effect on our operations and financial condition.
In the past, inflation has materially undermined the Argentine economy and the government’s ability to generate conditions that foster economic growth. In addition, high inflation or a high level of price instability may materially and adversely affect the business volume of the financial system. This result, in turn, could adversely affect the level of economic activity and employment in the country.
High inflation would also undermine Argentina’s foreign competitiveness and adversely affect economic activity, employment, real salaries, consumption and interest rates. In addition, the dilution of the positive effects of the Argentine peso devaluation on the export-oriented sectors of the Argentine economy will decrease the level of economic activity in the country. In turn, a portion of the Argentine debt is adjusted by the Coeficiente de Estabilización de Referencia , the Stabilization Coefficient Index, or “CER Index,” a currency index that is strongly tied to inflation. Therefore, any significant increase in inflation would cause an increase in Argentina’s debt and, consequently, the country’s financial obligations. A high level of uncertainty with respect to these economic indicators, and a general lack of stability with respect to inflation, could cause a shortening of contract terms and affect the ability of businesses to plan and make decisions, thereby potentially materially and adversely affecting economic activity and lowering consumers’ and individuals’ income and their purchasing power, all of which could have a material adverse effect on our financial condition and operating results.
Due to a default by Argentina on its debt obligations in 2001 and related litigation, the ability of Argentina and private sector companies in Argentina to obtain financing and to attract direct foreign investment is and will continue to be limited, which may have material adverse effects on the economy and our financial performance.
Argentina has very limited access to foreign financing. In December 2001, Argentina defaulted on over $81.8 billion in external debt to bondholders. In addition, since 2002, Argentina suspended payments on over $15.7 billion in debt to multilateral financial institutions (and continues to owe a substantial portion of this amount to the Paris Club and to other financial institutions). As of December 31, 2013, Argentina’s total public debt amounted to approximately $28.4 billion (excluding the debt in default to bondholders).
In addition, the foreign shareholders of several Argentine companies, including public utilities, and bondholders filed claims that exceeded US$20 billion with the International Centre for Settlement of Investment Disputes, or “ICSID.” During 2013, approximately US$ 680 million of these claims were settled. As of the date hereof, approximately US$ 15 billion in claims remains pending.
In addition, pursuant to an order dated February 23, 2012, as amended by an order dated November 21, 2012, the United States District Court for the Southern District of New York granted an injunction requiring Argentina to pay the holders of the defaulted debt as a precondition to making a single interest payment under the restructured debt. The injunction further required Argentina to pay into an escrow account over $1.3 billion prior to making the payment of the restructured debt on the December 15, 2012 scheduled payment. Upon appeal by Argentina, on August 23, 2013 the U.S. Court of Appeals for the Second Circuit upheld the lower court order requiring Argentina to pay holdout bondholders as a condition to payments to holders of restructured debt. On September 11, 2013, Argentina’s Congress approved an open-ended bond swap offer that would allow holders of the remaining 7% of bonds still outstanding after the country’s 2002 default (as well as participating bondholders) to exchange their instruments for new bonds governed by Argentine Law. On October 3, 2013, the U.S. District Court for the Southern District of New York ordered Argentina to desist from the exchange offer. Argentina has appealed the Second Circuit’s ruling to the Supreme Court and has appealed the District Court’s order to desist from implementing the exchange offer. This substantial uncertainty on the outstanding defaulted debt limits the access of Argentina to foreign financing in the international markets. Without access to international private financing, Argentina may not be able to finance its obligations, which could also inhibit the ability of the Argentine Central Bank to adopt measures to curb inflation and could adversely affect Argentina’s economic growth and public finances, which could, in turn, adversely affect our operations in Argentina, our financial condition and the results of our operations.
The Argentine peso is subject to depreciation and volatility, which could adversely affect our financial condition and results of operations.
After several years of price stability in Argentina, the devaluation of the Argentine peso in January 2002 imposed pressures on the domestic price system that generated high inflation throughout 2002. The devaluation had an adverse effect on the ability of Argentine companies to make timely payments on their foreign currency denominated obligations, generated high inflation throughout 2002, significantly reduced real salaries and had an adverse effect on companies that were focused on the domestic market, such as public service companies and financial companies. It also adversely affected the ability of the government to honor its foreign debt obligations. During 2014, the official exchange rate in Argentina further depreciated 48.4% against the U.S. dollar with respect to the official exchange rate as of the end of 2013.
In order to ensure the level of reserves of the Banco Central de la República Argentina (“BCRA”), the Argentine government implemented in late 2011 a series of measures aimed at maintaining the level of the BCRA reserves. To that effect, during the last quarter of 2011, 2012 and 2013, new measures were implemented to limit the purchase of foreign currency made by private companies and individuals. Access to the foreign exchange market requires authorization of the tax authorities, among other restrictions. As a result, the implied exchange rate in the quotation of Argentine securities that trade in foreign markets and in the local market increased significantly. Given the economic and political conditions in Argentina, we cannot predict whether, and to what extent, the value of the Argentine peso may depreciate or appreciate against the U.S. dollar, the euro or other foreign currencies, which could partially or totally reduce the current gap between the exchange rate
published by the BCRA and the black market exchange rate. We cannot predict how these conditions will affect the consumption of our products. Moreover, we cannot predict whether the Argentine government will further modify its monetary, fiscal, and exchange rate policy and, if so, what impact any of these changes could have on the value of the Argentine peso and, accordingly, on our financial condition, results of operations and cash flows, and on our ability to transfer funds abroad in order to comply with commercial or financial obligations. According to IFRS, which is the method under which the Company presents its results, the results generated by our operations in Argentina are translated to the reporting currency using the official exchange rate.
Government measures to preempt or respond to social unrest may adversely affect the Argentine economy and our business.
During the Argentine economic crisis in 2001 and 2002, Argentina experienced significant social and political turmoil, including civil unrest, riots, looting, nationwide protests, strikes and street demonstrations. Despite Argentina’s economic recovery and relative stabilization, social and political tension and high levels of poverty and unemployment continue. In 2008, Argentina faced nationwide strikes and protests. In November of 2012 there was a general strike led by opposition trade unions. The social unrest increased during the last months of 2012, and in December 2012 additional riots occurred, in addition to lootings to shops and supermarkets in various cities around the country.
Future government policies to preempt, or in response to, social unrest may include expropriation, nationalization, forced renegotiation or modification of existing contracts, suspension of the enforcement of creditors’ rights, new taxation policies and changes in laws and policies affecting foreign trade and investment. Such policies could destabilize the country and adversely and materially affect the Argentine economy, and thereby our business, results of operations and financial condition.
The reform of the retirement and pension integrated system has materially and adversely affected the local capital markets and may materially and adversely affect our ability to obtain liquidity for our operations.
In November 2008, the Argentine government eliminated the private retirement system. The elimination of this system created a significant change in the operations of the local capital markets, as the private retirement funds were significant institutional investors in respect of local issuances of debt. The elimination of institutional investors and the related sources of funding from the local market could materially and adversely affect our future ability to access capital through the domestic capital markets to fund the operations of our Argentine subsidiaries. In addition, the nationalization of the private retirement funds has adversely affected investor confidence in Argentina, which may impact our Argentine subsidiaries’ ability to access the capital markets in the future.
The government may order salary increases to be paid to employees in the private sector, which could increase our operating costs and affect our results of operations.
In the past, the Argentine government has passed laws, regulations and decrees requiring companies in the private sector to increase wages and provide specified benefits to employees, and may do so again in the future. Due to the high levels of inflation, labor organizations are demanding significant wage increases. In August 2012, the Argentine government established a 25% increase in the minimum salary and during the beginning of 2013, organized labor has agreed with employers’ associations on salary increases between 22% and 25%. It is possible that the Argentine government could adopt measures mandating salary increases and/or the provision of additional employee benefits in the future, which could have a material and adverse effect on our expenses and business, results of operations and financial condition.
Changes in Argentine tax laws may adversely affect the results of our operations.
The Argentine government is currently developing a bill to amend the income tax law denominated “ Anti-Evasion Plan III. ” Pursuant to the proposed bill, among other things, deductible losses (that can be deducted within the following five years) would be limited to 30% of the gains earned in each fiscal year; capital gains obtained from foreign individuals or entities from the sale, exchange or disposition of shares and other securities would be subject to the income tax at a rate of 35%; and payments made to individuals or entities located or
incorporated in countries with no income taxation would be subject to withholding at a rate of 35% and would not be deductible. If these amendments are passed into law, the limitations on the deductions may adversely affect the results of our Argentine subsidiaries’ operations; and the taxation of the capital gains will adversely impact the results of the sale or disposition of our Argentine subsidiaries’ shares.
Risks Relating to Paraguay
Our business operations in Paraguay are dependent on economic conditions in Paraguay.
14.1% of our assets as of December 31, 2014 and 7.2% of our net sales for the year ended December 31, 2014 corresponded to our operations in Paraguay. Because demand for soft drinks and beverage products is generally related to the economic conditions prevailing in the local market which, in turn, depend on the macroeconomic and political conditions of the country, our financial situation and our results of operations could be adversely affected by changes in these factors over which we have no control.
The GDP growth of Paraguay for 2014 was approximately 4.0%, and in 2013 increased 14.2% compared to the previous year, after having decreased 1.2% in 2012. In 2011 the GDP increased approximately 4%.
The decrease in GDP in 2012 was heavily influenced by the effects of a severe drought on the agricultural industry during 2011 and 2012, mainly on soybeans, corn and sunflower crops. In addition, there was an outbreak of foot and mouth disease detected in the last months of 2011, which resulted in the closing of markets for Paraguayan meat and a reduction in the levels of slaughtering activity during the first half of 2012. This reduction was reversed during the second half of 2012.
Inflation in Paraguay may adversely affect our financial condition and results of operations.
Inflation in Paraguay during 2014 was 4.2%, in 2013 was 3.7% and in 2012 was 4.0, remaining below the maximum target of 7.5%. An increase in inflation in Paraguay could decrease the purchasing power of our consumers in the country, which could adversely affect our volumes and impact our sales income. We cannot assure you that inflation in Paraguay will not increase significantly.
The Paraguayan guaraní is subject to depreciation and volatility, which could adversely affect our financial condition and results of operations.
The exchange rate of Paraguay is free and floating and the Banco Central de Paraguay , or Paraguay Central Bank (“BCP”), actively participates in the exchange market in order to smooth abrupt oscillations. In 2012 the local currency depreciated 5.9%, while in 2013, it appreciated 3.0%. In 2014 it depreciated 4.2%. Nevertheless, the guaraní experienced substantial volatility during 2012. It appreciated during the first quarter, depreciated by 11% during the second and third quarters, as a result of lower export earnings, and stabilized towards the last quarter of the year, closing 2012 with an appreciation of approximately 3%. A significant depreciation of the local currency could adversely affect our financial situation and financial results, as 25% of our total costs of raw materials and supplies are in U.S. dollars, as well as impact other expenses such as professional fees and maintenance costs.
Risk Factors Relating to the ADRs and Common Stock
Preemptive rights may be unavailable to ADR holders
According to the Ley de Sociedades Anónimas No. 18.046 and the Reglamento de Sociedades Anónimas (collectively, the “Chilean Companies Law”), whenever we issue new shares for cash, we are required to grant preemptive rights to holders of our shares (including shares represented by ADRs), giving them the right to purchase a sufficient number of shares to maintain their existing ownership percentage. However, we may not be able to offer shares to United States holders of ADRs pursuant to preemptive rights granted to our shareholders in connection with any future issuance of shares unless a registration statement under the U.S. Securities Act of
1933, as amended, is effective with respect to such rights and shares, or an exemption from the registration requirements of the U.S. Securities Act of 1933, as amended, is available.
Under the procedure established by the Central Bank of Chile, the foreign investment agreement of a Chilean company with an existing ADR program will become subject to an amendment (which will also be deemed to incorporate all laws and regulations applicable to international offerings in effect as of the date of the amendment) that will extend the benefits of such contract to new shares issued pursuant to a preemptive rights offering to existing ADR owners and to other persons residing and domiciled outside of Chile that exercise preemptive rights, upon request to the Central Bank of Chile. We intend to evaluate at the time of any rights offering the costs and potential liabilities associated with any such registration statement as well as the indirect benefits to us of enabling United States ADR holders to exercise preemptive rights and any other factors that we consider appropriate at the time, and then make a decision as to whether to file such registration statement.
We cannot assure you that any registration statement would be filed. To the extent ADR holders are unable to exercise such rights because a registration statement has not been filed, the depositary will attempt to sell such holders’ preemptive rights and distribute the net proceeds thereof if a secondary market for such rights exists and a premium can be recognized over the cost of any such sale. If such rights cannot be sold, they will expire and ADR holders will not realize any value from the grant of such preemptive rights. In any such case, such holder’s equity interest in the Company would be diluted proportionately.
Shareholders’ rights are less well defined in Chile than in other jurisdictions, including the United States
Under the United States federal securities laws, as a foreign private issuer, we are exempt from certain rules that apply to domestic United States issuers with equity securities registered under the United States Securities Exchange Act of 1934, as amended, including the proxy solicitation rules, the rules requiring disclosure of share ownership by directors, officers and certain shareholders. We are also exempt from certain of the corporate governance requirements of the Sarbanes-Oxley Act of 2002 and the New York Stock Exchange, Inc., including the requirements concerning independent directors.
Our corporate affairs are governed by the laws of Chile and our estatutos or bylaws, which function not only as our bylaws but also as our articles of incorporation. Under such laws, our shareholders may have fewer or less well-defined rights than they might have as shareholders of a corporation incorporated in a U.S. jurisdiction.
Pursuant to Law No. 19,705, enacted in December 2000, the controlling shareholders of an open stock corporation can only sell their controlling shares via a tender offer issued to all shareholders in which the bidder would have to buy all the offered shares up to the percentage determined by it, when the price paid is substantially higher than the market price (that is, when the price paid was higher than the average market price of a period starting 90 days before the proposed transaction and ending 30 days before such proposed transaction, plus 10%).
The market for our shares may be volatile and illiquid.
The Chilean securities markets are substantially smaller, less liquid and more volatile than major securities markets in the United States. The Bolsa de Comercio de Santiago (the “Santiago Stock Exchange”), which is Chile’s principal securities exchange, had a market capitalization of approximately US$265,150 million at December 31, 2013 and an average monthly trading volume of approximately US$3,640 million for 2013. The lack of liquidity is owed, in part, to the relatively small size of the Chilean securities markets and may have a material adverse effect on the trading prices of our shares. Because the market for our ADRs depends, in part, on investors’ perception of the value of our underlying shares, this lack of liquidity for our shares in Chile may have a significant effect on the trading prices of our ADRs.
ITEM 4. INFORMATION ON THE COMPANY
A. HISTORY AND DEVELOPMENT OF THE COMPANY
Overview
Our legal name is Embotelladora Andina S.A., and our commercial name is Coca-Cola Andina. We were incorporated and organized on February 7, 1946 under the Chilean Companies Law as a sociedad anónima (stock corporation). An abstract of our bylaws is registered with the Registro de Comercio de Santiago (Public Registry of Commerce of the City of Santiago) under No. 581 of the year 1946. Pursuant to our bylaws, our term of duration is indefinite.
Our shares of common stock are listed and traded on the Santiago Stock Exchange, on the Bolsa Electrónica de Chile (the Chilean Electronic Stock Exchange) and the Bolsa de Comercio de Valparaiso (the Valparaiso Stock Exchange). Our Series A and Series B ADRs representing our Series A and Series B shares, respectively, are listed on the New York Stock Exchange. Our principal executive offices are located at Avenida Miraflores 9153, Piso 7, Renca, Santiago, Chile. Our telephone number is +56-2-2338-0520 and our website is www.koandina.com.
Our depositary agent for the ADRs in the United States is The Bank of New York Mellon Corporation, located at One Wall Street, New York, New York 10286. Our depositary agent’s telephone number is (212) 815-2296. Our authorized representative in the United States is Puglisi & Associates, located at 850 Library Avenue, Suite 204, Newark, Delaware 19711, United States, and its phone number is (302) 738-6680.
History
Chile
In 1941, The Coca-Cola Company licensed a private Chilean company to produce Coca-Cola soft drinks in Chile and production began in 1943. In 1946, the original licensee withdrew from the license arrangement and a group of U.S. and Chilean investors formed Andina, which became The Coca-Cola Company’s sole licensee in Chile.
Between 1946 and the early 1980s, Andina developed the Chilean market for Coca-Cola soft drinks with a system of production and distribution facilities covering the central and southern regions of Chile. In the early 1980s, Andina sold its Coca-Cola licenses for most areas outside the Santiago metropolitan region and concentrated on the development of its soft drink business in the Santiago area. Although no longer the sole Coca-Cola bottler in Chile, we have been the principal manufacturer of Coca-Cola products in Chile for an uninterrupted period of 66 years.
In 1998, we purchased from The Coca-Cola Company a 49% stake in Vital. Concurrently, The Coca-Cola Company purchased Vital’s mineral water springs located in Chanqueahue, 80 miles south of Santiago. As part of the transaction, the Vital bottler agreement was replaced with a Minute Maid International Inc., juice bottler agreement and a new mineral water bottling agreement with The Coca-Cola Company.
The production and packaging business of water, juices and non carbonated beverages licensed by the TCCC in Chile was restructured in 2005. Vital Aguas S.A: (“VASA”) was created in 2005 in order to develop the processing, production and packaging business of Agua Mineral de Chanqueahue Vital (mineral water) and other waters. Vital S.A. is focused on developing juices and non carbonated beverages. For said purpose Andina and Embonor S.A. participate in the ownership of VASA, with a 66.5% and 33.5% ownership interest, respectively. In January 2011 the juice production business is restructured allowing the incorporation of the other Coca-Cola bottlers in Chile to the ownership of Vital S.A. which changed its name to Vital Jugos S.A. Of said company 65% ownership is held by Andina and 35% by Embonor S.A.
In 2001, we entered into a joint venture with Cristalerías de Chile to produce PET bottles. On January 27, 2012, Coca-Cola Embonor through its subsidiary, Embonor Empaques S.A. acquired Cristalerías de Chile’s stake equivalente to a 50% ownership interest in Envases CMF.
Brazil
Andina Brazil, our Brazilian subsidiary, began production and distribution of Coca-Cola soft drinks in Rio de Janeiro in 1942. In June 1994, we acquired 100% of the capital stock of Andina Brazil for approximately US$120 million and contributed an additional US$31 million to Andina Brazil’s capital immediately after the acquisition to repay certain indebtedness of Andina Brazil. In 2000, we purchased through Andina Brazil, a Coca-Cola franchise license for a territory in Brazil comprising the State of Espírito Santo and part of the States of Rio de Janeiro and Minas Gerais (NVG), for US$74.5 million. NVG was merged into Andina Brazil in 2000, and its operations were integrated with Andina Brazil in 2001.
In 2004, Andina Brazil entered into a franchise swap agreement with the Brazilian subsidiary of The Coca-Cola Company, Recofarma Indústria do Amazonas Ltda., for (1) an exchange of franchising rights, goods and other assets of Andina Brazil in the territory of Governador Valadares in the State of Minas Gerais, and (2) other franchise rights of The Coca-Cola Company in the territories of Nova Iguaçu in the state of Rio de Janeiro, which were previously owned by Companhia Mineira de Refrescos S.A.
In 2007, The Coca-Cola Company along with the Coca-Cola bottlers in Brazil create a joint venture, Mais Indústria de Alimentos, in order to enhance the non-carbonated business for the entire System in that country, and in 2008 The Coca-Cola System acquired a second company that produces non-carbonated beverages called Sucos del Valle do Brasil Ltda. These two companies merged in 2011 and SABB (Sistema de Alimentos y Bebidas do Brasil) was created.
In 2010, The Coca-Cola Company along with its bottlers, acquired in a joint venture the company Leão Junior S.A. with a consolidated presence and market share in Andina Brazil’s region in the category of iced tea. Leão Junior S.A. commercializes the Matte Leão brand, among others. Andina Brazil controls 18.20% of Leão Junior S.A. Andina Brazil holds a 10.74% average ownership interest in Leão Junior S.A and SABB.
In November, 2012 Andina Brazil acquired a 40% stake in Sorocaba Refrescos S.A., a Coca-Cola bottler located in the state of Sao Paulo, for R$146,946,004.
During 2013, there was a restructuring of the juice and mate business, pursuant to which the companies in which Rio de Janeiro Refrescos Ltda. held an interest were merged. As a result of the restructuring Rio de Janeiro Refrescos Ltda. ended up with a 9.57% ownership interest in Leon Alimentos y Bebidas Ltda., the legal successor of these companies. This percentage increased to 10.87% as a result of our acquisition of, and subsequent merger with, Compañía de Bebidas Ipiranga that held an ownership interest in Leon Alimentos y Bebidas Ltda. During 2014, Rio de Janeiro Refrescos Ltda. sold 2.05% of its ownership interest in Leão Alimentos e Bebidas Ltda., remaining with a final ownership interest of 8.82%.
Argentina
Production of Coca-Cola soft drinks in Argentina began in 1943 with operations in the province of Córdoba, Argentina, through Inti S.A.I.C., (“INTI”). In July 1995, we, through an investment company incorporated in Argentina called Inversiones del Atlántico S.A., (“IASA”), acquired a 59% interest in EDASA, the parent company of Rosario Refrescos S.A. and Mendoza Refrescos S.A. These entities were subsequently merged to create Rosario Mendoza Refrescos S.A., (“Romesa”). In 1996, we acquired an additional 35.9% interest in EDASA, an additional 78.7% interest in Inti, a 100% interest in Cipet located in Buenos Aires (a PET plastic bottle and packaging business) and a 15.2% interest in Cican S.A. During 1997, the operations of Romesa were merged with INTI. In 1999, Edasa was merged into IASA. In 2000, IASA was merged into INTI, forming Embotelladora del Atlántico S.A. (“EDASA”). In 2002, Cipet merged into EDASA. During 2007, EDASA’s ownership interest in Cican S.A. was sold to FEMSA.
During 2011, EDASA resolved the division of part of its equity to form a new company, Andina Empaques Argentina S.A., transferring all activities and assets necessary for the development of EDASA’s Packaging Division. Accounting and tax effects began January 1, 2012. Subsequently, Edasa absorbed Coca-Cola Polar Argentina S.A. by merger. The corresponding Definitive Merger Agreement was registered in the Public Register of Trade of the Province of Córdoba under the Contracts and Dissolves Protocol Registration N ° 007-A25 on September 24, 2014. The merger has tax and accounting effects beginning November 1, 2012. Currently Edasa is the Coca-Cola bottler in the provinces of Córdoba, Mendoza, San Juan, San Luis, Entre Ríos, part of the province
of Buenos Aires and in almost all of Santa Fe, as well as in La Pampa, Neuquén, Río Negro, Chubut, Santa Cruz, Tierra del Fuego, Antarctica and South Atlantic Islands.
Paraguay
PARESA is the first authorized Coca-Cola Bottler Company in Paraguay, which started its operations in May 13, 1965. In 1967, Plant 1 opened with a capacity of 400,000 annual unit cases. In 1980, the Barcequillo Plant - located on Km 3.5 Barcequillo of the Ñemby route, in the City of San Lorenzo- was opened, reaffirming and applying the concept of the highest end technology of bottling. Beginning in 2004, PARESA became property of the Grupo Polar from Chile, continuing its operations in the Paraguayan market. On October 1, 2012, PARESA became part of Grupo Coca-Cola Andina due to the merger of Embotelladoras Coca-Cola Polar S.A. into Embotelladora Andina S.A.
Recent Acquisitions
On March 30, 2012, after completion of due-diligence procedures, the Company signed a Promissory Merger Agreement with Embotelladoras Coca-Cola Polar S.A. (“Polar”). Polar is also a Coca-Cola bottler with operations in: Chile, servicing territories in the II, III, IV, XI and XII regions; Argentina, servicing territories in Santa Cruz, Neuquén, El Chubut, Tierra del Fuego, Río Negro La Pampa and the western zone of the province of Buenos Aires; and Paraguay, servicing the whole country. The merger was made in order to reinforce our leadership position among Coca-Cola bottlers in South America.
Prior to closing, the merger was approved by the shareholders of both of the companies, as well as the Chilean Superintendence of Securities and Insurance, and The Coca-Cola Company. The terms of the merger prescribed the exchange of newly issued Company shares at a rate of 0.33269 Series A shares and 0.33269 Series B shares, for each outstanding share of Polar. Prior to the finalization of the merger and the approval of the Shareholder Meetings of the Company and Polar, dividends were distributed among their respective shareholders, in addition to those already declared and distributed with charge to 2011 income. The dividends distributed by the Company and Polar amounted to Ch$28,155,862,307 and Ch$29,565,609,857 respectively, that represented Ch$35.27 per each share of the Series A and Ch$38.80 per each share of the Series B.
The physical exchange of shares took place on October 16, 2012, with which former shareholders of Polar then had a 19.68% ownership interest in the merged Company. Based upon the terms of the executed agreements, the actual control over day-to-day operations of Polar transferred to the Company as of October 1, 2012, and the Company began consolidating Polar’s operations from that date forward. Additionally and as a result of Embotelladora Andina becoming the legal successor of Polar’s rights and obligations, we indirectly acquired additional ownership interest in Vital Jugos S.A., Vital Aguas S.A. and Envases Central S.A. that added to its previous ownership interest in those entities. Our current ownership enables it to exercise control over these entities, and thus incorporate them into the consolidation of the financial statements beginning October 1, 2012.
On October 11th, 2013, Rio de Janeiro Refrescos Ltda. (“RJR”), a subsidiary of Embotelladora Andina S.A. (“Coca-Cola Andina”) in Brazil, closed the acquisition of 100% of the capital stock of Companhia de Bebidas Ipiranga (“Ipiranga”) in an all-cash transaction. Ipiranga is also a Coca-Cola bottler with operations in part of the States of São Paulo and part of the State of Minas Gerais. This acquisition was previously arranged between the parties through an agreement signed on July 10th, 2013. The final price paid amounted R$1,155,445,998. Ipiranga is a leading bottler of The Coca-Cola System in Brazil that operates in certain territories of the states of São Paulo and Minas Gerais. During 2012, its sales volume amounted to 89.3 million unit cases, with revenues amounting to R$695 million, and an EBITDA of R$112 million.
Capital Expenditures
During 2014, we used external financing to refinance certain current financial liabilities, to cover temporary cash shortages and other corporate purposes.
The following table sets forth our capital expenditures by territory and line of business for the periods indicated:
|
|
|
Year ended December 31, |
|
||||
|
|
|
2012 |
|
2013 |
|
2014 |
|
|
|
|
MCh$ |
|
MCh$ |
|
MCh$ |
|
|
Chile |
|
54,736 |
|
57,545 |
|
45,110 |
|
|
Brazil |
|
36,109 |
|
56,720 |
|
30,280 |
|
|
Argentina |
|
46,834 |
|
52,272 |
|
25,724 |
|
|
Paraguay |
|
6,085 |
|
17,160 |
|
13.103 |
|
|
Total |
|
143,764 |
|
183,697 |
|
114,217 |
|
During 2014, we made investments totaling Ch$8,826 million (unaudited figures) for improvements in industrial processes, equipment to measure industrial waste flows, laboratory analyses, consulting on environmental impacts and other studies. For further details please refer to Note 29| of our consolidated financial statements filed herewith.
Our total capital expenditures were Ch$143,764 million in 2012, Ch$183,697 million in 2013 and Ch$114,217 million in 2014.
We have budgeted approximately US$240-270 million for our capital expenditures in 2015. Our capital expenditures in 2015 are primarily intended for:
· investments in production capacity (primarily for a plant in Brazil among other investments);
· investments in real estate (primarily for land in Chile)
· market investments (primarily for the placement of coolers);
· returnable bottles and cases;
· invesments in vehicles (primarily in Brazil); and
· investments in information technology.
We believe that internally generated funds will be sufficient to meet our budgeted capital expenditure for 2015. Our capital expenditure plan for 2015 may change based on market and other conditions, our results and financial resources.
In 2014, capital expenditures were principally related to the following:
Argentina
· Bottles (glass and PET) and bottle cases
· Coolers and post mix equipment;
· Logistic Technology Projects (“LGV”, automatic sorting and picking) (fine tuning);
· New Box Line for packaging (Andina Empaques Plant-in process)
· Process and storage adaptation at Raw Sugar Plant;
· Expansion Effluent Plant (Córdoba Plant);
· Adaptation Cold and Hot Fill Production Lines (all plants);
· Adaptation Finished Product Deposit and yard (all Plants and Distribution Centers) and
· Acquistion of auto-elevators for the Logistics and Industrial Areas (Trelew Plant)
Brazil
· Development of the Duque de Caxias plant project and initiation of construction
· Development of the new Caju Distribution Center project and initiation of construction;
· REF PET and glass returnable bottles and bottle cases;
· Coolers and post-mix equipment for the point of sale;
· Machinery to increase efficiency and production capacity;
· Acquisition of distribution trucks and motorcycles for the sales force.
Chile
· Returnable bottles (glass and PET) and bottle cases;
· Cold equipment, post-mix and other equipment for the point of sale
· Refurbishing of the Carlos Valdovinos distribution center;
· Aditional investments in the Renca plant and corporate offices
· Cold equipment, post-mix and other equipment for the point of sale
· Machinery to improve efficiency and production capacity;
· Additives in batch solution system for juices formulation area (Vital Jugos)
· Construction of storage warehouse for fruit pulps (Vital Jugos)
· Expansion finished product warehouse, Drive-in system (Vital Jugos);
· Installation of a 330 Kwh electric generator group (Vital Jugos);
· Acquisition of driving parts for Line N°3 (SACMI) for new 1.5 liters and 2.0 liters OW Pet bottles (Vital Jugos)
· Renew fork-lifts (Vital Jugos)
· Installation of 2 burners at boiler room (Vital Jugos)
· Acquisition of automatic bottle box-in system for Line N° 1 RGB glass (Vital Jugos)
· Incorporation of new 330 Tetra Pak format for Powerade (Vital Jugos);
· Air gateway construction and enabling for entry of personnel to the area of operations (Vital Jugos)
· Replacement surveillance cameras system (Vital Aguas);
· Increase service life Line N° 3 Pet OW caps machine (Vital Aguas)
· Drains system construction of wastewater plant (Vital Aguas)
· Power network installation from new thermal water well to accumulation tank (Vital Aguas)
· Management integrated system SIG improvements (Vital Aguas)
· Hazardous waste warehouse construction (Vital Aguas)
· Increase service life of electric panels Filler N ° 3, N ° 4 and Carbo Cooler N ° 4 (Vital Aguas)
· Caustic soda storage tank (Vital Aguas);
· Construction and fitting of well N°3 - service water (Vital Aguas)
Paraguay
· New Tetrapak production line for 1.0 and 1.5 liters;
· Transformation of two production lines for short finish (100% of the Pet lines);
· Miebach project, investment in selective shelves and racks, drive in, 3,855 positions;
· Returnable bottles and plastic cases and
· Cooling equipments.
B. BUSINESS OVERVIEW
We believe we are the third largest bottler of Coca-Cola trademark beverages in Latin America in terms of sales volume. We believe we are the largest bottler of Coca-Cola trademark beverages in Chile, the second largest in Argentina and the third largest in Brazil, in each case in terms of sales volume. We are also the only bottler of Coca-Cola trademark beverages in Paraguay.
In 2014, we recorded consolidated net sales of Ch$1,352,242 million and total sales volume of 671.6 million unit cases of Coca-Cola soft drinks.
In addition to our soft drinks business, which accounted for 75% of our consolidated net sales during 2014, we also: (i) produce and distribute fruit juices, other fruit-flavored beverages and mineral and purified water in Chile, Argentina and Paraguay under trademarks owned by The Coca-Cola Company; (ii) produce flavored waters and other carbonated beverages under trademarks owned by The Coca-Cola Company; (iii) manufacture polyethylene terephthalate (“PET”) bottles primarily for our own use in the packaging of Coca-Cola soft drinks in Chile and Argentina; (iv) in Brazil we produce Tea and Juices for Leão Alimentos e Industria Ltda., (v) distribute non carbonated beverages in Brazil such as te, fruit juices, energy drinks, sport drinks and waters,
under trademarks owned by The Coca-Cola Company; (vi) distribute beer in Brazil under the brands Amstel, Bavaria, Birra Moretti, Dos Equis (XX), Edelweiss, Heineken, Kaiser, Murphy’s, Sol and Xingú; (vii) distribute beer in the south of Argentina; and (viii) distribute spirits in the south of Chile.
Our Territories
The following map shows our territories, estimates of the population to which we offer products, the number of retailers of our beverages and the per capita consumption of our beverages as of December 31, 2014.
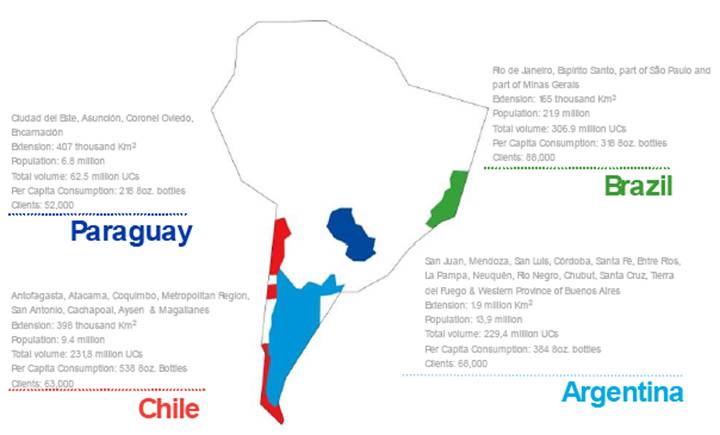
Per capita consumption data for a territory is determined by dividing total beverage sales volume, excluding the sales to other Coca-Cola bottlers within the territory by the estimated population within such territory, and is expressed on the basis of the number of eight-ounce servings of our products consumed annually per capita. One of the factors we use to evaluate the development of local volume sales in our territories and to determine product potential is the per capital consumption of our beverages.
Our Product Overview
We produce, market and distribute the following Coca-Cola trademark beverages and brands licensed from third parties throughout our franchise territories. The following table sets forth our brands as of December 31, 2014:
|
|
|
Chile |
|
Brazil |
|
Argentina |
|
Paraguay |
|
|
Colas: |
|
|
|
|
|
|
|
|
|
|
Coca-Cola |
|
ü |
|
ü |
|
ü |
|
ü |
|
|
Coca-Cola Light |
|
ü |
|
o |
|
ü |
|
|
|
|
Coca-Cola Zero |
|
ü |
|
ü |
|
ü |
|
ü |
|
|
Coca-Cola Life |
|
ü |
|
|
|
ü |
|
|
|
|
|
|
|
|
|
|
|
|
|
|
|
Flavored Soft Drinks: |
|
|
|
|
|
|
|
|
|
|
Crush |
|
|
|
|
|
ü |
|
ü |
|
|
Fanta |
|
ü |
|
ü |
|
ü |
|
ü |
|
|
Fanta Zero |
|
ü |
|
|
|
|
|
|
|
|
Fanta Limón |
|
ü |
|
|
|
|
|
|
|
|
Inca Kola |
|
ü |
|
|
|
|
|
|
|
|
Inca Kola Zero |
|
ü |
|
|
|
|
|
|
|
|
Kuat |
|
|
|
ü |
|
|
|
|
|
|
Nordic Mist Ginger Ale |
|
ü |
|
|
|
|
|
|
|
|
Nordic Mist Zero |
|
ü |
|
|
|
|
|
|
|
|
Nordic Mist Agua Tónica |
|
ü |
|
|
|
|
|
|
|
|
Quatro |
|
|
|
|
|
ü |
|
|
|
|
Quatro Guarana |
|
ü |
|
|
|
|
|
|
|
|
Quatro Pomelo Light |
|
ü |
|
|
|
|
|
|
|
|
Quatro Frambuesa |
|
ü |
|
|
|
|
|
|
|
|
Quatro Papaya |
|
ü |
|
|
|
|
|
|
|
|
Quatro Piña |
|
ü |
|
|
|
|
|
|
|
|
Sprite |
|
ü |
|
ü |
|
ü |
|
ü |
|
|
Sprite Zero |
|
ü |
|
|
|
|
|
|
|
|
Schweppes |
|
|
|
ü |
|
ü |
|
ü |
|
|
Cantarina |
|
ü |
|
|
|
|
|
|
|
|
|
|
|
|
|
|
|
|
|
|
|
Juice: |
|
|
|
|
|
|
|
|
|
|
Cepita |
|
|
|
|
|
ü |
|
|
|
|
Del Valle |
|
o |
|
ü |
|
|
|
|
|
|
Frugos |
|
|
|
|
|
|
|
ü |
|
|
Sabores Caseros |
|
o |
|
|
|
|
|
o |
|
|
|
|
|
|
|
|
|
|
|
|
|
Water: |
|
|
|
|
|
|
|
|
|
|
Aquarius |
|
o |
|
ü |
|
ü |
|
ü |
|
|
Benedictino |
|
ü |
|
|
|
|
|
|
|
|
Bonaqua |
|
|
|
|
|
ü |
|
|
|
|
Crystal |
|
|
|
ü |
|
|
|
|
|
|
Dasani |
|
|
|
|
|
|
|
ü |
|
|
Glaceau |
|
o |
|
|
|
|
|
|
|
|
Vital |
|
o |
|
|
|
|
|
|
|
|
|
|
|
|
|
|
|
|
|
|
|
Other: |
|
|
|
|
|
|
|
|
|
|
Black |
|
ü |
|
|
|
|
|
|
|
|
Burn |
|
ü |
|
ü |
|
|
|
ü |
|
|
Chá Leão |
|
|
|
o |
|
|
|
|
|
|
Fuze |
|
o |
|
o |
|
ü |
|
|
|
|
Infusions |
|
|
|
o |
|
|
|
|
|
|
I9 |
|
|
|
ü |
|
|
|
|
|
|
Kapo |
|
o |
|
ü |
|
|
|
|
|
|
Kin (with and without gas) |
|
|
|
|
|
ü |
|
|
|
|
Leão Ice Tea |
|
|
|
ü |
|
|
|
|
|
|
Matte Leão |
|
|
|
ü |
|
|
|
|
|
|
Nutri Defensas |
|
|
|
|
|
|
|
o |
|
|
Powerade |
|
o |
|
ü |
|
ü |
|
ü |
|
We produce, market and distribute Coca-Cola soft drinks in our franchise territories through standard bottler agreements between our bottler subsidiaries and the local subsidiary in each jurisdiction of The Coca-Cola Company (collectively, the “Bottler Agreements”). We consider the enhancement of our relationship with The Coca-Cola Company an integral part of our business strategy.
We seek to enhance our business throughout the franchise territories by developing existing markets, penetrating other soft drink, waters and juices markets, forming strategic alliances with retailers to increase consumer demand for our products, increasing productivity, and by further internationalizing our operations.
Reporting Segments
The following discussion analyzes our product sales and customers by reporting segments.
Chile
In Chile, we produce, market and distribute our beverages under The Coca-Cola Company trademarks in the metropolitan region of Santiago and the neighboring provinces of Cachapoal and San Antonio, as well as the regions of Antofagasta, Atacama, Coquimbo, Aisén and Magallanes. Chile accounted for 27.9% and 27.4% of our volumes and consolidated net sales, respectively, during 2014.
Soft Drinks. Our Chilean soft drink operations accounted for net sales in 2014 of Ch$363,123 million. We measure sales volume in terms of unit cases, which we refer to as UCs. Unit cases contain 192 ounces of finished beverage product (24 eight-ounce servings) or 5.69 liters. The following table highlights historical sales and volume of Coca-Cola soft drinks sold in Chile for the periods indicated:
|
|
|
Year ended December 31, |
|
||||||||||
|
|
|
2012 |
|
2013 |
|
2014 |
|
||||||
|
|
|
Ch$ |
|
UCs |
|
Ch$ |
|
UCs |
|
Ch$ |
|
UCs |
|
|
|
|
(in millions) |
|
||||||||||
|
Colas |
|
228,651 |
|
114.4 |
|
243,176 |
|
118.7 |
|
262,901 |
|
122.8 |
|
|
Flavored soft drinks |
|
71,023 |
|
35.5 |
|
113,999 |
|
55.7 |
|
100,222 |
|
45.7 |
|
|
Total |
|
299,673 |
|
149.9 |
|
357,175 |
|
174.4 |
|
363,123 |
|
168.5 |
|
As of December 31, 2014, we sold our products to approximately 62,576 customers in Chile. Although the mix varies significantly among the franchise territories, our distribution network generally relies on a combination of Company-owned trucks and independent distributors in each territory. The following table highlights the type of customer in Chile for our products:
|
|
|
Year ended December 31, |
|
||||
|
|
|
2012 |
|
2013 |
|
2014 |
|
|
|
|
(%) |
|
||||
|
Mom & Pops |
|
51 |
|
58 |
|
53 |
|
|
Supermarkets |
|
20 |
|
25 |
|
25 |
|
|
On Premise |
|
13 |
|
10 |
|
15 |
|
|
Wholesale distributors |
|
16 |
|
7 |
|
7 |
|
|
Total |
|
100 |
|
100 |
|
100 |
|
(1) Mom & Pops: are all the neighborhood stores (grocery stores, minimarkets, kiosks, liquor stores, bakeries, etc.) characterized by providing daily shopping needs, and differentiated because they are nearby, the provide informal credit and products are available in smaller formats.
Other Beverages. In addition to Coca-Cola soft drinks, through Vital Jugos S.A., we produce and sell juices, other fruit flavored beverages, ready-to-drink tea and sports drinks, and through Vital Aguas S.A. we produce and sell mineral water and purified water. Juices are produced and sold under the brands Andina del Valle (juices and fruit nectars), Kapo (juice drink), Fuze Tea (ready-to-drink tea), Glaceau Vitamin Water (water with added vitamins and minerals) and Powerade (isotonic).
Waters are produced and sold under the brands Vital (mineral water) as sparkling, still and lightly carbonate; and Benedictino (purified water) as sparkling and still.
In 2014, net sales of waters and juices in Chile represented 7.2% of our consolidated net sales. On a consolidated basis, sales of waters and juices in Chile were Ch$128,948 million.
Brazil
In Brazil, we produce, market and distribute our beverages under The Coca-Cola Company trademarks in the majority of the State of Rio de Janeiro and the entirety of the State of Espírito Santo and as of October 1, 2013 in part of the state of São Paulo and part of the state of Minas Gerais, as a consequence of the consummation of the Ipiranga acquisition on October 1, 2013. Brazil accounted for 37.9% and 27.3% of our volumes and consolidated net sales, respectively, during 2014.
Soft Drinks. The Brazilian soft drink operations accounted for net sales of Ch$490,931 million. The following table highlights historical sales and volume of Coca-Cola soft drinks sold in Brazil for the periods indicated:
|
|
|
Year ended December 31, |
|
||||||||||
|
|
|
2012 |
|
2013 |
|
2014 |
|
||||||
|
|
|
(in millions) |
|
||||||||||
|
|
|
Ch$ |
|
UCs |
|
Ch$ |
|
UCs |
|
Ch$ |
|
UCs |
|
|
Colas |
|
280,829 |
|
154.7 |
|
271,159 |
|
154.8 |
|
365,744 |
|
186.6 |
|
|
Flavored soft drinks |
|
78,287 |
|
43.1 |
|
88,342 |
|
50.4 |
|
125,188 |
|
63.6 |
|
|
Total |
|
359,116 |
|
197.8 |
|
359,501 |
|
205.2 |
|
490,931 |
|
250.2 |
|
As of December 31, 2013, we sold our products to approximately 88,300 customers in Brazil. The following table highlights the type of customer in Brazil for our products:
|
|
|
Year ended December 31, |
|
||||
|
|
|
2012 |
|
2013 |
|
2014 |
|
|
|
|
(%) |
|
||||
|
Mom & Pops |
|
24 |
|
25 |
|
26 |
|
|
Supermarkets |
|
30 |
|
32 |
|
31 |
|
|
On Premise |
|
22 |
|
22 |
|
21 |
|
|
Wholesale distributors |
|
24 |
|
21 |
|
22 |
|
|
Total |
|
100 |
|
100 |
|
100 |
|
Other Beverages. We distribute beer under the Amstel, Bavaria, Birra Moretti, Desesperados, Dos Equis (XX), Edelweiss, Heineken, Kaiser, Murphys, Sagres, Sol and Xingu labels. We also distribute water under the labels Crystal and Aquarius Fresh and sell and distribute ready-to-drink juices under the labels Del Valle Frut, Del Valle Mais, and Kapo; milk and cocoa-based beverages under the Kapo Chocolate brand, energy drinks under the brand names Burn and Gladiator, isotonics under i9 and Powerade brand names and Chá Leão, Leão Ice Tea, Matte Leão, and Guaraná Leão ready-to-drink teas.
In 2014, net sales of beer, juices, waters, tea based beverages, isotonics and energy drinks in Brazil were Ch$224,797 million, representing 12.5% of our consolidated net sales.
Argentina
In Argentina, we produce, market and distribute our beverages under The Coca-Cola Company trademarks in the entirety of the provinces of Córdoba, Mendoza, San Juan, San Luis, Entre Rios, part of the Province of Buenos Aires and most of Santa Fé, as well as La Pampa, Neuquén, Río Negro, Chubut, Santa Cruz, Tierra del Fuego,
Antarctica and South Atlantic Islands. . Argentina accounted for 28.3% and 25.7% of our volumes and consolidated net sales, respectively, during 2014.
Soft Drinks. The Argentine soft drink operations accounted for net sales of Ch$391,799 million in 2014. The following table highlights historical sales and volume of Coca-Cola soft drinks sold in Argentina for the periods indicated:
|
|
|
Year ended December 31, |
|
||||||||||
|
|
|
2012 |
|
2013 |
|
2014 |
|
||||||
|
|
|
(in millions) |
|
||||||||||
|
|
|
Ch$ |
|
UCs |
|
Ch$ |
|
UCs |
|
Ch$ |
|
UCs |
|
|
Colas |
|
218,878 |
|
119.2 |
|
291,231 |
|
149.8 |
|
294,241 |
|
149.5 |
|
|
Flavored soft drinks |
|
62,818 |
|
34.2 |
|
98,537 |
|
50.6 |
|
97,558 |
|
49.6 |
|
|
Total |
|
281,696 |
|
153.4 |
|
389,768 |
|
200.4 |
|
391,799 |
|
199.1 |
|
As of December 31, 2014, we sold our products to approximately 68,000 clients in Argentina. The following table highlights the type of client in Argentina for our products:
|
|
|
Year ended December 31, |
|
||||
|
|
|
2012 |
|
2013 |
|
2014 |
|
|
|
|
(%) |
|
||||
|
Mom & Pops |
|
47 |
|
45 |
|
44 |
|
|
Supermarkets |
|
20 |
|
22 |
|
22 |
|
|
On Premise |
|
3 |
|
3 |
|
3 |
|
|
Wholesale distributors |
|
30 |
|
30 |
|
31 |
|
|
Total |
|
100 |
|
100 |
|
100 |
|
Other Beverages. In Argentina, we produce and distribute ready-to-drink juices under the Cepita brand name. We also produce and sell water under the brands Kin, Bonaqua (sparkling and still mineral water), Aquarius and Quatro Liviana (flavored waters), as well as Powerade in the isotonic segment. With the incorporation of Coca-Cola Polar Argentina S.A., starting 2012, we distribute energy drinks under the trademark Black Fire and beers including Palermo, Schneider, Heineken, and Budweiser.
In 2014, net sales of juices, waters, tea based beverages, isotonics and energy drinks in Argentina were Ch$69,204 million, representing 3.9% of our consolidated net sales.
Paraguay
In Paraguay, we produce, market and distribute our beverages under The Coca-Cola Company trademarks in the entire country. Paraguay accounted for 8.0% and 7.9% of our volumes and consolidated net sales, respectively, during 2014.
Soft Drinks. The Paraguayan soft drinks operations accounted for net sales of Ch$106,579 million. The following table highlights historical sales and volume of Coca-Cola soft drinks sold in Paraguay for the periods indicated:
|
|
|
Year ended December 31, , |
|
||||||||||
|
|
|
2012* |
|
2013 |
|
2014 |
|
||||||
|
|
|
(in millions) |
|
||||||||||
|
|
|
Ch$ |
|
UCs |
|
Ch$ |
|
UCs |
|
Ch$ |
|
UCs |
|
|
Colas |
|
16,373 |
|
10.1 |
|
60,230 |
|
34.2 |
|
65,866 |
|
33.2 |
|
|
Flavored soft drinks |
|
10,512 |
|
6.4 |
|
34,084 |
|
19.3 |
|
40,713 |
|
20.6 |
|
|
Total |
|
26,885 |
|
16.5 |
|
94,314 |
|
53.5 |
|
106,579 |
|
53.8 |
|
*2012 figures only for the 4Q12
As of December 31, 2014, we sold our products to approximately 52,000 customers in Paraguay. The following table highlights the type of customer in Paraguay for our products:
|
|
|
Year ended December 31, |
|
||||
|
|
|
2012 |
|
2013 |
|
2014 |
|
|
|
|
(%) |
|
||||
|
Mom & Pops |
|
40 |
|
45 |
|
44 |
|
|
Supermarkets |
|
9 |
|
11 |
|
11 |
|
|
On Premise |
|
22 |
|
22 |
|
22 |
|
|
Wholesale distributors |
|
28 |
|
22 |
|
23 |
|
|
Total |
|
100 |
|
100 |
|
100 |
|
Other Beverages. In Paraguay, we produce and distribute juices ready to be consumed under the trademark Frugos. We also manufacture and sell water under the trademarks Dasani (purified water) and Aquarius (flavored water), isotonic drinks like Powerade and energy drinks in disposable glass bottles and cans under the trademark Burn.
In 2014, net sales of juices, waters, isotonics and energy drinks in Paraguay were Ch$22,916 million, representing 1.3% of our consolidated net sales.
Distribution
Chile
Soft Drinks . In Chile, we generally distribute Coca-Cola soft drinks through a distribution system that includes: (i) trucks operated by independent distributors pursuant to exclusive distribution arrangements with us (515 trucks) and (ii) our own trucks (79 trucks). In 2014, 85% was distributed by exclusive distributors and 15% by our own trucks. Distribution of all of Andina Chile’s beverages takes place from distribution centers and production facilities. The 77 distributors collectively service all of our Chilean customers. In most cases, the distributor collects payment from the customer in cash or check. Where applicable, the driver also either collects empty returnable glass or PET bottles of the same type and quantity as the bottles being delivered, or collects cash deposits for the net returnable bottles delivered. This task is particularly significant in the Chilean territory where returnable containers accounted for approximately 53.1% of total soft drinks volume in 2014. Certain important customers (such as supermarkets), maintain accounts receivables with us, which are settled on average every 49 days after invoices are issued. On average, accounts receivable from all credit sales clients are liquidated on a 35 day term.
Other Beverages . Juices and waters throughout Chile are distributed by means of distribution agreements between The Coca-Cola Company and the Coca-Cola bottlers in Chile. In 2014, Andina distributed approximately 71% of the products of Vital Jugos and Vital Aguas. Under Vital Jugos’ and Vital Aguas’ distribution agreements, each bottler has the exclusive right to distribute waters and juices in its territory.
Our management believes that our distribution arrangements for waters and juices provide an effective means of distributing those products throughout Chile using the extensive distribution system of the Coca-Cola bottlers. We have a good working relationship with the other Coca-Cola bottler that distribute waters and juices. If the other Coca-Cola bottler was to cease distribution, our management believes it could arrange alternative distribution arrangements, but the transition to the new arrangements could involve significant delays in distributing products and would involve additional costs and an initial reduction in sales.
Brazil
Soft Drinks . In Brazil, we generally distribute Coca-Cola soft drinks through a distribution system that includes: (i) trucks operated by independent distributors pursuant to exclusive distribution arrangements with us;
(ii) trucks operated by independent transport companies on a non-exclusive basis and (iii) own trucks. In 2014, 7% was distributed by exclusive distributors, 36% by independent transport companies and 57% by our own trucks. Distribution of all of Andina Brazil’s beverages takes place from distribution centers and production facilities. In 2014, approximately 8% of Andina Brazil’ soft drink sales were paid for in cash at the time of delivery, 0.1% were paid by check and 92% were paid were paid with other bank securities with an average payment term of 17 days.
Other Beverages . Andina Brazil uses its distribution system to distribute beer in the Brazilian territory. Andina Brazil started distributing beer in the 1980s as a result of the acquisition of Kaiser by a consortium of Coca-Cola bottlers (including Andina Brazil) in Brazil. In March 2002, the Canadian brewing company Molson Inc. acquired Cervejarias Kaiser S.A. (“Kaiser”). In 2006, Femsa acquired from Molson the controlling ownership interest over Kaiser and, in 2010, Heineken acquired the controlling interest of Femsa’s beer operation. Andina Brazil buys beer from Heineken at a price determined by Heineken and sells it to its customers with a fixed margin. In the case of certain discount sales that have been approved by Heineken, Heineken shares between 50% and 100% of the cost of such discounts. In 2014, Andina Brazil’s net sales of beer were Ch$89,201 million, of which Bavaria brand beer accounted for 37.4%, Heineken for 17.6%, Kaiser for 42.8%, Sol for 1.0%, and all the other brands accounted for 1.2% of net sales.
The Coca-Cola Company and the Brazilian Association of Coca-Cola Manufacturers entered into an agreement regarding the distribution through the Coca-Cola System of beer produced and imported by Heineken. The agreements were signed May 30, 2003, and are renewable for a period of 20 years. Andina Brazil is not allowed to produce, bottle, sell or obtain any interest in any bottled or tap beer under any other label or in any bottle or packaging that could be confused with brand beers, except as may be mutually agreed in writing between Andina Brazil and Heineken.
Argentina
Soft Drinks . In 2014, 76% of Edasa’s Coca-Cola soft drinks were distributed by direct distribution (trucking) and 24% by wholesale distribution. All of the direct distribution is done by a group of independent transport companies (each with three or more trucks). In 2014, approximately 67% of EDASA’s soft drink sales were paid for in cash and 33% were credit sales.
Paraguay
Soft Drinks . PARESA distributed 75% Coca-Cola soft drinks through direct distribution, and 25% through wholesalers distributors. All direct distribution is done by a group of small truck businessmen. In 2014 approximately 61.5% of sales of Paresa soft drinks were paid in cash and 38.5% were credit sales.
Competition
We face intense competition throughout the franchise territories principally from bottlers of competing soft drink brands. See “Item 3. Key Information — Risk Factors — Risks Related to our Company — Our business is highly competitive including with respect to price competition which may adversely affect our net profits and margins.” The following table presents the market share of our main competitors in Chile, Brazil, Argentina and Paraguay for the periods indicated:
Market Share
|
|
|
2012 |
|
2013 |
|
2014 |
|
||||||||||||||||||
|
|
|
Chile |
|
Brazil |
|
Argentina |
|
Paraguay* |
|
Chile |
|
Brazil |
|
Argentina |
|
Paraguay |
|
Chile |
|
Brazil |
|
Argentina |
|
Paraguay |
|
|
|
|
(%) |
|
||||||||||||||||||||||
|
Coca-Cola soft drinks |
|
69 |
|
59 |
|
59 |
|
60 |
|
67 |
|
61 |
|
60 |
|
61 |
|
69 |
|
61 |
|
61 |
|
62 |
|
|
ECUSA soft drinks |
|
21 |
|
— |
|
— |
|
— |
|
21 |
|
— |
|
— |
|
— |
|
21 |
|
— |
|
— |
|
— |
|
|
Pepsi-Cola and 7 Up products |
|
4 |
|
5 |
|
20 |
|
9 |
|
5 |
|
5 |
|
20 |
|
11 |
|
5 |
|
5 |
|
20 |
|
12 |
|
|
Pritty products |
|
— |
|
— |
|
7 |
|
— |
|
— |
|
— |
|
6 |
|
— |
|
— |
|
— |
|
6 |
|
— |
|
|
Antarctica products |
|
— |
|
12 |
|
— |
|
— |
|
— |
|
13 |
|
— |
|
— |
|
— |
|
13 |
|
— |
|
— |
|
|
Brahma products |
|
— |
|
1 |
|
— |
|
— |
|
— |
|
1 |
|
— |
|
— |
|
— |
|
1 |
|
— |
|
— |
|
|
Other |
|
6 |
|
23 |
|
14 |
|
31 |
|
7 |
|
20 |
|
14 |
|
28 |
|
5 |
|
20 |
|
13 |
|
26 |
|
|
Total |
|
100 |
|
100 |
|
100 |
|
100 |
|
100 |
|
100 |
|
100 |
|
100 |
|
100 |
|
100 |
|
100 |
|
100 |
|
Source: A.C. Nielsen, with the exception of Paraguay, where the data is collected by IPSOS.
(*) In the case of Paraguay, the average market share for October, November and December 2012 published by IPSOS
Chile
Soft Drinks. The soft drink segment of the Chilean beverage industry is highly competitive. The most important areas of competition are product image, pricing, advertising, ability to deliver product in popular bottle sizes, distribution capacity, and the amount of returnable bottles held by retailers or by consumers. Returnable bottles can be exchanged at the time of new purchases in lieu of paying a bottle deposit, thereby decreasing the purchase price. Our main competitor in the Chilean franchise territory is Embotelladora Chilenas Unidas or ECUSA, a subsidiary of Compañía Cervecerías Unidas S.A. or CCU, the major brewer in Chile. ECUSA produces and distributes Pepsi-Cola products and its own brands (soft drinks and bottled water). Based on reports by A.C. Nielsen, we estimate that in 2014, our average soft drink market share within our franchise territories reached 68.5%.
Other Beverages. Vital Aguas’ principal competitor in the water segment is CCU, but there is also competition from low priced brands (“B-brands”) in the water segment in Chile. Vital Jugos S.A.’s principal competitors in the juice segment are, Watt’s-CCU, Corpora Tres Montes and three of the leading dairy producers in Chile: Soprole S.A., Nestlé Chile S.A. and Loncoleche S.A.. During 2006, the largest Chilean brewery CCU acquired a 50% ownership interest of the juice brands in Chile, creating a joint venture for the management of this business area. The Chilean market for fruit-flavored beverages and waters also includes low-cost, lower-quality fruit juice concentrates and artificially flavored powdered beverage mixes. We do not consider these products competition for our waters and juices business because we believe that these products are of lower quality and value. Based on reports by A.C. Nielsen, we estimate that in 2014, our market share within our Chilean franchise territories was approximately 33.5% for the juice segment and approximately 45.7% for waters.
Brazil
Soft Drinks. The soft drink segment of the Brazilian beverage industry is highly competitive. The most important areas of competition are product image, pricing, advertising and distribution capacity (including the number and location of sales outlets). According to A.C. Nielsen, our main soft drink competitor in the Brazilian territory is American Beverage Company or Ambev, the largest beer producer and distributor in Brazil and also produces soft drinks, including Pepsi-Cola products. Based on reports by A.C. Nielsen, we estimate that in 2014, our average soft drink market share within our Brazilian franchise territories was approximately 61.4%.
Other Beverages . In the beer sector, Andina Brazil’s main competitor is Ambev that during 2014 had a very dominant position in the Brazilian market. In our Rio de Janeiro and Espiritu Santo franchise our market share for waters was 5.8%, where we distribute under the Crystal brand mineral water. In the segment of juices and others our market share reached 40.8%.
Argentina
Soft Drinks. The soft drink segment of the Argentine beverage industry is highly competitive. The most important areas of competition are product image, pricing, advertising, ability to produce bottles in popular sizes
and distribution capacity. Our greatest competitor in Argentina is Inbev. The most significant B-brand competitors are: Talca, Pritty and Interlagos. Based on reports by A.C. Nielsen, we estimate that in 2014, our average soft drink market share within our Argentine franchise territories was approximately 61.4%.
Other Beverages . We service the water market through the Bonaqua brand, with which we have 8% of the market. In addition the market of juices and others is serviced through the Cepita juice brand, Aquarius in flavored water and Powerade in Isotonicos, where we have a market share of 26.4%.
Paraguay
Soft Drinks. The soft drink segment of the Paraguayan beverage industry is highly competitive. The most important areas of competition are product image, pricing, advertising, ability to produce bottles in popular and the amount of returnable bottles held by retailers or by consumers.
Our greatest competitor, local brand “Niko/De La Costa,” is produced and bottled by Embotelladora Central S.A., which has a 16.8% market share. B-brands in Paraguay represents 20.3% of the soft drink industry. Pepsi, which resumed its operations in Paraguay in November 2011, reached a market share of 11.8% in December 2014, and is produced and marketed by Group Vierci, a local franchisee. Based on reports by IPSOS, we estimate that in 2014, our average soft drinks market share within our Paraguayan franchise territories was approximately 62.1%.
Other Beverages . We are leaders in all non-carbonated categories. In waters, we achieved a market share of 63.4% with the Aquarius and Dasani brands. In juices and others we are market leaders with Frugos, Powerade and Burn brands, among others and reached a market share of 38.3%.
Seasonality
Each of our lines of business is seasonal. Most of our beverage products have their highest sales volumes during the South American summer (October through March), with the exception of nectar products, which have a slightly higher sales volume during the South American winter (April through September).
Packaging
Overview and Background
We produce PET bottles in both returnable and non-returnable formats and plastic caps. As a returnable packaging material, PET has advantages compared to glass because it is lightweight, difficult to break, transparent and easily recyclable. On average, returnable PET bottles can be used up to 12 times. Non-returnable PET bottles also are produced in various sizes and are used by a variety of soft drink producers and, in Chile, by producers of edible oil products, wine and personal hygiene products.
Coca-Cola soft drinks are distributed in returnable and non-returnable glass and PET bottles and aluminum cans of various sizes. They are also distributed as post-mix syrup, which is mixed with carbonated water in a dispenser at the point of sale, in stainless steel and bag-in-box containers. EDASA produces and distributes Coca-Cola soft drinks in returnable and non-returnable glass and PET bottles of various sizes, in aluminum cans and as post-mix syrup.
Juices are distributed in non-returnable glass and PET bottles, returnable glass bottles, in bi-laminated sachets, cardboard Tetra Pak containers and bag-in-box as concentrated juice that is mixed with water at the point of sale. Waters are distributed in returnable glass bottles and non-returnable PET bottles.
Sales
In 2014, AEASA had net sales of Ch$16,640 million with sales to EDASA and other related companies amounting to Ch$8,970 million. AEASA also sold PET bottles to third parties accounting for approximately Ch$7,671 million.
Competition
We are suppliers of returnable and non-returnable PET bottles and plastic caps for Coca-Cola bottlers in Argentina and Chile. According to the pre-existing agreements between The Coca-Cola Company and the other Coca-Cola bottlers within South America, we must obtain the consent and assistance of The Coca-Cola Company to expand our sales of returnable PET bottles to said bottlers.
In Chile, we do not have any principal competitors in the non—returnable PET bottles market for oils, wines and personal hygiene. There are a few producers of non-returnable PET bottles in Chile who are significantly smaller than CMF. Plasco S.A., the second Chilean manufacturer of non-returnable PET bottles, does not compete with us because it is the exclusive supplier of PET bottles for ECUSA. (The Chilean Pepsi bottler).
In Argentina, we compete principally with Alpla S.A. and Amcor. AEASA is the supplier of returnable PET bottles to all Coca-Cola bottlers in Argentina.
PET Agreements
On June 29, 2001, we and Cristalerías de Chile S.A. signed a series of contracts forming a joint venture for the development of a PET production facility in Chile through the formation of Envases CMF S.A. We contributed the assets necessary to further the development of the joint venture. Our subsidiary Andina Inversiones Societarias S.A. holds a 50% stake in the joint venture while Cristalerías de Chile S.A. retains the other 50% interest. On January 27, 2012, Coca-Cola Embonor through its subsidiary, Embonor Empaques S.A. acquired Cristalerías de Chile’s stake equivalent to a 50% ownership interest in Envases CMF.
Raw Materials and Supplies
The principal raw materials used in the production of Coca-Cola soft drinks are concentrate, sweetener, water and carbon dioxide gas. Production also requires glass and plastic bottles, bottle tops and labels. Water used in soft drink production is treated for impurities and adjusted for taste reasons. All raw materials, especially water, are subjected to continuous quality control.
Chile
Soft Drinks. We purchase concentrate at prices established by The Coca-Cola Company. We mainly purchase sugar from Industria Azucarera Nacional S.A., IANSA, Sucden Américas and to Sucden Chile S.A., although we may purchase sugar in the international market when prices are favorable, and have done so on occasion. Chilean sugar prices are subject to a price band established by the Chilean government on an annual basis. We obtain carbon dioxide gas from Linde Gas Chile S.A. and Praxair. Andina’s affiliate Envases CMF, produces returnable PET bottles and non-returnable PET pre-forms which are blown at our Renca plant. We purchase glass bottles principally from Cristalerías de Chile S.A. and Cristalerías Toro S.A.I.C. Bottle caps are purchased from Envases CMF S.A., Alucaps Mexicana S.A. de C.V., Sinea S.A.y Sanchez e Hijos Limitada and other suppliers.
During 2014, 83% of the variable cost of sales for soft drinks produced by Andina Chile corresponded to main raw materials. The cost of each raw material within the total of main raw materials is the following: concentrate represents 66%; sugar and artificial sweeteners 21%; non-returnable bottles 9%; bottle caps 3%, carbon dioxide 1% and other raw material 2%. Water does not constitute an important cost as raw material. Additionally, the cost of finished products purchased from third parties (“ECSA”) is included within the cost of sales of soft drinks. These costs represent 15% of the total costs of sales of soft drinks and correspond to cans and some PET bottles.
Other Beverages . The principal raw materials used by Vital Jugos S.A. in the production of juices and as a percentage of total raw material costs, are sweeteners 12%, fruit pulp and juices 14%, concentrate 23%, containers 23% and wrapping material 4%, caps 3% and other raw material 3% all of which during 2014 accounted for 82% of total costs for sales of juice, including packaging.
The principal raw materials used by Vital Aguas S.A. in the production of mineral water and purified unflavored and purified flavored water and as a percentage of total raw material costs are: packaging 42%, concentrate 22%, caps 7%, wrapping material 5%, and carbonation 1%, all of which during 2014 accounted for 80% of total costs for sales of water, including packaging.
Brazil
Soft Drinks. Andina Brazil purchases concentrate in the city of Manaus at prices established by The Coca-Cola Company. Manaus has been designated as a duty-free development zone by the Brazilian government. Andina Brazil purchases sugar from Brazilian suppliers, in particular from Copersucar Ltda., Alta Mogiana and Usina Moreno. It purchases carbon dioxide gas mainly from Companhia White Martins Gases S.A and Light Esco Ltda., PET pre-forms from Braspla Ltda., and Amcor Ltda., CPR Indústria e Comércio de Plásticos and Engepack Embalagens São Paulo S.A. Glass bottles are purchased from Owens-Illinois; cans are purchased from Rexam and Latapack Ball; metal bottle caps from Aro S.A. and Plastic bottle caps are purchased from Closure Systems International and Rexam. Andina Brazil purchases water from the municipality of Rio de Janeiro and to Companhia Espírito Santense de Sanenamento.
During 2013, 77% of the variable cost of sales for soft drinks produced by Andina Brazil corresponded to main raw materials. The cost of each raw material within the total of main raw materials is the following: concentrate (including juice used for some flavors) represents 41%; sugar and artificial sweeteners 20%; non-returnable bottles 17%; cans 13%; bottle caps 4%; carbon dioxide 1% and other raw material 4%. Additionally, the cost of soft drinks finished products purchased from third parties is included within the cost of sales of soft drinks. These costs represent 0.4% of the total costs of sales of soft drinks and correspond to some formats of cans, PET and non-returnable glass bottles.
Argentina
Soft Drinks. EDASA purchases concentrate at prices established by The Coca-Cola Company. EDASA purchases sugar mainly from Atanor S.C.A., Ingenio y Refinería San Martín de Tabacal S.R.L. and Cía. Inversora Industrial S.A.; fructose from Ingredion Argentina S.A. and Glucovil S.A. and carbon dioxide gas from Praxair S.A. and Air Liquide S.A. EDASA buys non-returnable and returnable PET bottles from AEASA and glass bottles from Cattorini Hermanos S.A. The plastic caps are purchased from Alusud S.A., AEASA, Sinea Plásticos S.A. and Bericap S.A. and the metal caps are purchased from Metalgráfica Cearense S.A. and Aro S.A. in Brazil. Regarding water supply for the production of soft drinks, EDASA owns water wells and pays a fee to the Dirección Provincial de Aguas Sanitarias. EDASA also buys plastic labels from Luis and Miguel Zanniello S.A., Envases John S.A and Cañuelas Pack S.A; and plastic packaging from Manuli Packaging Argentina S.A., Plastiandino S.A., Sanlufilm S.A., Atiles S.A., IPESA Industrias Plásticas S.A. and Rio Chico S.A. Finally cardboard boxes and tabs are purchased from Cartocor S.A., Smurfit Kappa de Argentina S.A., Zucamor S.A. and Papeltectica S.A.
During 2014, 73% of the variable cost of sales for soft drinks produced by Andina Argentina corresponded to main raw materials. The cost of each raw material as a percentage of the total cost of raw materials is the following: concentrate 57%; sugar and artificial sweeteners 20%; non-returnable bottles 15%; bottle caps 3%, carbon dioxide 1% and other raw materials 4%. Additionally, the cost of finished products purchased from third parties is included within the cost of sales of soft drinks. These costs represent 4% of the total costs of sales of soft drinks and correspond to can formats and other formats of soft drinks which are not produced by Andina Argentina.
PET Packaging. The principal raw material required for production of PET bottles is PET resin. During 2014, this raw material was mainly purchased from DAK Américas de Argentina S.A. and Cabelma S.A. In the case of plastic caps, the main raw material required for their production is PEAD resin, which during the year 2014 was bought mainly from PBBPolisur S.A.
In 2014, AEASA’s costs for PET resin accounted for 43% of the total variable cost of its sales of PET bottles and preforms.
Paraguay
Soft Drinks . PARESA acquires concentrates at prices established by The Coca-Cola Company. PARESA acquires sugar from Industria Paraguaya de Alcoholes S.A. and Azucarera Paraguaya S.A. carbon dioxide gas is obtained from provider Liquid Carbonic (Praxair). Non-returnable pre-forms are mainly supplied by local provider Inpet, Cristalpet, and from the associate company Andina Empaques de Argentina. The pre-forms are blown in our plant located in San Lorenzo. Glass bottles are bought from Cattorini Hermanos S.A. and Vidriolux. RefPet bottles are purchased from Cristalpet and Andina Empaques de Argentina. Plastic caps for non-returnable bottles are bought from Andina Empaques in Argentina and plastic caps for returnable glass bottles and RefPet are are bought from Sinea, and metal caps from Aro S.A. de Brazil. Plastic wrappers are purchased from suppliers Manuli, IPESA, Petropack, Bolsiplast and Anchor Packaging.
During 2014, 78% of the variable cost of sales for soft drinks produced by Paresa corresponded to main raw materials. The cost of each raw material within the total of main raw materials is the following: concentrate represents 48%; sugar and artificial sweeteners 23%; non-returnable bottles 12%; bottle caps 4%, carbon dioxide 1% and other raw material 12%. Water does not constitute an important cost as raw material. Additionally, the cost of finished products purchased from third parties is included within the cost of sales of soft drinks. These costs represent 1% of the total costs of sales of soft drinks and correspond to cans and some PET bottles.
Marketing
We and The Coca-Cola Company jointly promote and market Coca-Cola soft drinks in our franchise territories, in accordance with the terms of our respective Bottler Agreements. We advertise in all major communications media. We focus our advertising efforts on increasing brand recognition by consumers and improving our customer relations. National advertising campaigns are designed and proposed by The Coca-Cola Company’s local affiliates, with our input at the local or regional level.
During 2014, we paid approximately 50% of the advertising and promotional expenses incurred by The Coca-Cola Company in our franchise territories. Nearly all media advertising and promotional materials for Coca-Cola soft drinks are produced and distributed by The Coca-Cola Company. See “Item 4. Information on the Company —Bottler Agreements.” Marketing and promotional programs, including television, radio and print advertising, point-of-sale advertising, sales promotions and entertainment are developed by The Coca-Cola Company for all Vital Jugos’ and Vital Aguas’ products.
Under the terms of our agreement with Heineken, Heineken undertakes all responsibility for planning and managing advertising, marketing and promotional activities related to beer. Andina Brazil, however, is free to undertake marketing or promotional activities with Heineken´s prior approval. The parties have agreed to assume joint responsibility for the costs of certain promotional activities (radio or television) and for certain outdoor events which take place in the Rio de Janeiro and Espirito Santo region. Andina Brazil has agreed to devote at least 1.0% of its sales net of taxes of Heineken products to such promotional activities or events.
Channel Marketing
In order to provide more dynamic and specialized marketing of our products, our strategy is to divide our market into distribution channels. Our principal channels are small retailers, “on-premise” consumption such as restaurants and bars, supermarkets and third party distributors. Presence in these channels entails a comprehensive and detailed analysis of the purchasing patterns and preferences of various groups of soft drink consumers in each type of location or distribution channel. In response to this analysis, we seek to tailor our product, price, packaging and distribution strategies to meet the particular needs of and exploit the potential of each channel.
We believe that the implementation of our channel marketing strategy also enables us to respond to competitive initiatives with channel-specific responses as opposed to market-wide responses. This focused response capability isolates the effects of competitive pressure in a specific channel, thereby avoiding costlier market-wide responses. Our channel marketing activities are facilitated by our management information systems. We have invested significantly in creating such systems, including providing hand-held computer and data
gathering equipment to support the gathering of product, consumer and delivery information required to implement our channel marketing strategies effectively for most of our sales routes in Chile, Brazil, Argentina and Paraguay. We will continue investing to increase pre-sale coverage in our territories.
Our consolidated total advertising expenditures were Ch$38,667 million, Ch$45,729 million and Ch$48,110 million in 2012, 2013 and 2014 respectively.
Bottler Agreements
The Company has entered into Bottler Agreements with The Coca-Cola Company by which it has the license to produce and distribute Coca-Cola brand products within its operating franchise territories in Chile, Brazil, Argentina and Paraguay. The Company’s operations are highly dependent on maintaining and renewing the Bottler Agreements which provide for the production and distribution of Coca-Cola brand products.
The Bottler Agreements are international standard contracts The Coca-Cola Company enters into with bottlers outside the United States for the sale of concentrates and beverage basis for certain Coca-Cola soft drinks and non-soft drink beverages.
Bottler Agreements are renewable upon request by the bottler and at the sole discretion of The Coca-Cola Company. We cannot assure you that the Bottler Agreements will be renewed upon their expiration, and even if they are renewed.
The Bottler Agreements provide that we will purchase our entire requirement of concentrates and beverage basis for Coca-Cola soft drinks and other Coca-Cola beverages from The Coca-Cola Company and other authorized suppliers. Although under the Bottler Agreements The Coca-Cola Company, in its sole discretion, may set the price of concentrates and beverage basis, among other terms, we set the price of products sold to retailers at our discretion, subject only to certain price restraints.
We are the sole producer of Coca-Cola soft drinks and other Coca-Cola beverages in our franchise territories. Although this right is not exclusive, The Coca-Cola Company has never authorized any other entity to produce or distribute Coca-Cola soft drinks or other Coca-Cola beverages in such territories, although we cannot assure you that in the future it will not do so. In the case of post-mix soft drinks, the Bottler Agreements explicitly establish such non-exclusive rights.
The Bottler Agreements include an acknowledgment by us that The Coca-Cola Company is the sole owner of the trademarks that identify the Coca-Cola soft drinks and other Coca-Cola beverages and of any secret formula used in concentrates.
All distribution must be in authorized containers. The Coca-Cola Company has the right to approve, at its sole discretion, any and all kinds of packages and containers for beverages, including their size, shape and any of their attributes. The Coca-Cola Company has the authority at its sole discretion to redesign or discontinue any package of any of the Coca-Cola products, subject to certain limitations, so long as Coca-Cola soft drinks and other Coca-Cola beverages are not all discontinued at the same time. We are prohibited from producing or handling any other beverage products, other than those of The Coca-Cola Company or other products or packages that would imitate, infringe or cause confusion with the products, trade dress, containers or trademarks of The Coca-Cola Company, or from acquiring or holding an interest in a party that engages in such activities. The Bottler Agreements also impose restrictions concerning the use of certain trademarks, authorized containers, packaging and labeling of The Coca-Cola Company and prohibit bottlers from distributing Coca-Cola soft drinks or other Coca-Cola beverages outside their designated territories.
The Bottler Agreements require us to maintain adequate production and distribution facilities; inventories of bottles, caps, boxes, cartons and other exterior packaging or materials; to undertake adequate quality control measures prescribed by The Coca-Cola Company; to develop, stimulate, and fully satisfy the demand for Coca-Cola soft drinks and other Coca-Cola beverages and to use all approved means, and spend such funds on advertising and other forms of marketing, as may be reasonably required to meet that objective; and to maintain
such sound financial capacity as may be reasonably necessary to assure performance by us and our affiliates of our obligations to The Coca-Cola Company. All Bottler Agreements require us annually to submit our business plans for such franchise territories to The Coca-Cola Company, including without limitation, marketing, management and promotional and advertising plans for the following year.
The Coca-Cola Company has no obligation to contribute to our expenditures derived from advertising and marketing, but it may, at its discretion, contribute to such expenditures and undertake independent advertising and marketing activities, as well as cooperative advertising and sales promotion that would require our cooperation and support. In each of the franchise territories, The Coca-Cola Company has been contributing approximately 50% of advertising and marketing expenses, but no assurances can be given that equivalent contributions will be made in the future.
Each bottler is prohibited from, directly or indirectly, assigning, transferring or pledging its Bottler Agreement, or any interest therein, whether voluntarily, involuntarily or by operation of law, without the consent of The Coca-Cola Company, and each Bottler Agreement is subject to termination by The Coca-Cola Company in the event of default by us. Moreover, the bottler may not undergo a material change of ownership or control without the consent of The Coca-Cola Company.
The Coca-Cola Company may terminate a Bottler Agreement immediately, by written notice to the bottler, in the event that, inter alia, (i) the bottler suspends payments to creditors, declares bankruptcy, is declared bankrupt, is expropriated or nationalized, is liquidated, dissolved, changes its legal structure, or pledges or mortgages its assets; (ii) the bottler does not comply with instructions and standards established by The Coca-Cola Company relating to the production of its authorized soft drink products; (iii) the bottler ceases to be controlled by its controlling shareholders; or (iv) the terms of the Bottler Agreement come to violate applicable law.
Either party to any Bottler Agreement may, with 60 days’ notice thereof to the other party, terminate the Bottler Agreement in the event of non-compliance by the other party with the terms thereof so long as the party in non-compliance has not remedied such non-compliance during this period. In addition, if a bottler does not wish to pay the required price for concentrate for any Coca-Cola products, it must notify The Coca-Cola Company within 30 days of receipt of The Coca-Cola Company’s new prices. In the case of any Coca-Cola soft drink or other Coca-Cola beverages other than Coca-Cola concentrate, the franchise regarding such product shall be deemed automatically canceled three months after The Coca-Cola Company’s receipt of the bottler’s notice of refusal. In the case of Coca-Cola concentrate, the Bottler Agreements shall be deemed terminated three months after The Coca-Cola Company’s receipt of the bottler’s notice of refusal. The Coca-Cola Company may also terminate the Bottler Agreements if the bottler or any individual or legal entity that controls, owns a majority share in or directly or indirectly influences the management of the bottler, engages in the production of any non-Coca-Cola beverage, whether through direct ownership of such operations or through control or administration thereof, provided that, upon request, the bottler shall be given six months to remedy such situation.
Chile
Our licenses for the territories in Chile expire in 2018 and 2019. On December 22, 2005, Vital S.A. and The Coca-Cola Company entered into a Juice Bottler Agreement by which The Coca-Cola Company authorized Vital S.A. to produce, prepare and bottle in packaging previously approved by The Coca-Cola Company the following brands: Andina Frut Andina Nectar, Kapo, Nestea, Fruitopia and Powerade. The Agreement will expire on December 31, 2015, and sets forth that Andina, and the other Chilean Coca-Cola bottler, Embonor, have the right to purchase products from Vital S.A. as well as produce, package, and sell these products at their respective production facilities. On December 22, 2005, Vital Aguas S.A. and The Coca-Cola Company entered into a Water Manufacturing and Packaging Agreement for the preparation and packaging of beverages that will be in effect until December 31, 2015, regarding the brands Vital, Chanqueahue, Vital de Chanqueahue, Benedictino, Dasani and Aquarius.
Brazil
Our licenses for the territories in Brazil will expire in 2017.
Argentina
Our licenses for the territories in Argentina expire in 2017 .
Paraguay
Our licenses for the territories in Paraguay expire in August 2015 .
Regulation
General
We are subject to the full range of government regulations generally applicable to companies engaged in business in our franchise territories, including but not limited to labor, social security, public health, consumer protection, environmental, sanitation, employee safety, securities and anti-trust laws. Currently, no material legal or administrative proceedings are pending against us with respect to any regulatory matter in any of our franchise territories except those listed as such in “Item 3. Key Information—Risk Factors” and “Item 8. Financial Information—Contingencies.”
We believe, to the best of our knowledge that we are in compliance in all material respects with applicable statutory and administrative regulations relating to our business in each of our franchise territories.
Chile . There are no special licenses or permits required to manufacture and distribute soft drinks and juices in the Chilean territory. Food and beverage producers in Chile, however, must obtain authorization from (and their activities are subject to supervision by) the Chilean Environmental Protection Services ( Servicio Sanitario Metropolitano del Ambiente ), which inspects production facilities and takes liquid samples for analysis on a regular basis. Our permit from the Chilean Environmental Protection Authority was obtained on January 8, 1992 and is in effect indefinitely. In addition, production and distribution of mineral water is subject to special regulations such that mineral water may be drawn only from sources designated for such purpose by presidential decree. Certification of compliance with such decree is provided by the National Health Service, the Undersecretary’s Office of the Ministry of Health ( Servicio de Salud Metropolitano del Ambiente ). Our mineral water production facilities have received the required certification.
Brazil . Labor laws, in addition to mandating employee benefits, include regulations to ensure sanitary and safe working conditions in our production facilities located in Brazil. Food and beverage producers in Brazil must register their products with and receive a ten-year permit from the Ministry of Agriculture and Provisioning and the Ministry of Health, which oversees diet products. Our permits from said Ministries are valid and in force for a term of ten years for each product we produce. Although we cannot assure you that they will be renewed, we have not experienced any material difficulties in renewing our permits in the past nor do we expect to experience any difficulties in the future. The Ministries do not regularly inspect facilities but they do send inspectors to investigate any complaints it receives.
Argentina . While most laws applicable to EDASA are enforced at the federal level, some, such as sanitary and environmental regulations, are primarily enforced by provincial and municipal governments. There are no licenses or permits required for the manufacture or distribution of soft drinks in the Argentine territory. However, our production facilities are subject to registration with federal and provincial authorities and to supervision by municipal health agencies, which certify compliance with applicable laws.
Paraguay . Paresa is registered with the Ministry of Industry and Trade in Paraguay, which issues and renews the industrial registry, and its latest renewal expires in 2015. Food and beverage producers in Paraguay must register with the Ministry of Health, which performs inspections of plants and monitors products in the market. Industries must also have an environmental license issued by the Ministry of Environment, which is the main body responsible for monitoring compliance with environmental laws. In addition to establishing the mandatory employee benefits, include safe working and sanitary conditions at industrial installations within
Paraguay. Paresa maintains all of its licenses, permits and registrations issued by these institutions and ensures compliance with the regulations and ordinances of the municipalities where its plant is located.
Environmental Matters
It is our policy to conduct environmentally sound operations on a basis consistent with applicable laws and with criteria established by The Coca-Cola Company. Although regulation of matters relating to the protection of the environment is not as well-developed in the franchise territories as in the United States and other industrialized countries, we expect that additional laws and regulations may be enacted in the future with respect to environmental matters that may impose additional restrictions on us which could materially or adversely affect our results of operations in the future. There are no material legal or administrative proceedings pending against us in any of the franchise territories with respect to environmental matters, and we believe that, to the best of our knowledge, we are in compliance in all material respects with all environmental regulations applicable to us.
Chile
The Chilean government has several regulations governing environmental matters relating to our operations.
Law 19,300, passed in March 1994, addresses general environmental concerns that may be applicable to our activities and which, if applicable, would require us to hire independent experts to conduct environmental impact studies or declarations of any future projects or activities that could be impacted by the regulations of Law 19,300. This Law creates the National Commission on the Environment, which is supported by regional commissions to supervise environmental impact studies and declarations for all new projects, to enforce the regulations of Law 19,300 and to grant discretionary power to regulators. In January 2010, the law was amended with the enactment of Law 20,417, which created a new environmental institution and created the Ministry of Environment, Environmental Assessment Services, the Superintendence of Environmental Protection and the Environmental Courts, which became effective on December 2012. The Environmental Courts in the Metropolitan Region and in Antofagasta began functioning during 2013.
Brazil
Our Brazilian operations are subject to several environmental laws, none of which currently impose substantial restrictions on us. The Brazilian Constitution establishes the broad guidelines for the new treatment of environmental concerns, dedicating an entire chapter (Chapter VI, Article 225) to the protection of the environment, along with several other articles related to the environmental law and urban law. Environmental issues are regulated at the federal, state and municipal levels. The Brazilian Constitution empowers the public authorities to develop regulations designed to preserve and restore the environment and to control industrial processes that affect human life. Violations of these regulations are subject to criminal, civil and administrative penalties.
In addition, Law No. 6,938 of 1981, known as the Brazilian Environmental Policy, introduced an environmental regime by which no environmental damage is exempt from coverage. The legislation is based on the idea that even a polluting waste tolerated under the established standards could cause environmental damage, and therefore subjects the party causing such damage to payment of an indemnity. Moreover, as mentioned above, activities damaging to the environment lead to criminal and administrative penalties, provided for in Law 9,605 of 1998 or the Environmental Crimes Act.
Numerous governmental bodies have jurisdiction over environmental matters. At the federal level, the Ministério do Meio Ambiente (Brazilian Ministry of Environment) and the Conselho Nacional do Meio-Ambiente or CONAMA dictate environmental policy, including, without limitation, initiating environmental improvement projects, establishing a system of fines and administrative penalties and reaching agreements on environmental matters with offending industries. The Instituto Brasileiro do Meio Ambiente e dos Recursos Naturais Renováveis or IBAMA enforces environmental regulations set by CONAMA. In addition, various federal authorities have jurisdiction over specific industrial sectors, but none of these currently affect us.
Finally, various state and local authorities regulate environmental matters in the Brazilian territory including the Fundação Estadual de Engenharia do Meio-Ambiente or FEEMA, the principal environmental authority in Rio de Janeiro, the Instituto Estadual de Medio Ambiente e Recursos Hídricos or IEMA, the principal environmental authority in Espírito Santo and the principal environmental authority in São Paulo is CETESB - Companhia de Tecnologia de Saneamento Ambiental . FEEMA, IEMA and CETESB periodically inspect industrial sites and test liquid waste for contamination. We believe to the best of our knowledge that we are in compliance in all material respects with the standards established by all the governmental authorities applicable to our operations in Brazil. We cannot assure you, however, that additional regulations will not be enacted in the future, and that such restrictions would not have a material adverse effect on our results or operations. The operation in Brazil as that of Chile counts with all certifications mentioned in terms of Quality, Environment and Occupational Health and Safety and those associated with Food Safety and Best Practices in Food Processing.
Argentina
The Argentine Constitution, as amended in 1994, allows any individual who believes a third party may be damaging the environment to initiate an action against it. No such action has ever been instituted against us, but we cannot assure you that an action will not be brought in the future. Though provincial governments have primary regulatory authority over environmental matters, municipal and federal authorities also have authority competent to enact decrees and laws on environmental issues. Thus, municipalities can set policy on local environmental matters, such as waste management, while the federal government regulates inter-province environmental issues, such as transport of hazardous waste or environmental matters covered by international treaties.
In 2002, the National Congress approved federal Law No. 25,612, Gestión Integral de Residuos Industriales y de Actividades de Servicios (Integral Management of Industrial Residues and Service Activities) and Law No. 25,675, Ley General del Ambiente (General Environmental Law) establishing minimum guidelines for the protection of the sustainable environmental management and the protection of biodiversity, applicable throughout Argentina. The law establishes the purposes, principles and instruments of the national environmental policy, the concept of “minimum guidelines,” the judicial competence and the rules governing environmental education and information, citizens’ participation and self-management, among other provisions.
Provincial governments within the Argentine territory have enacted laws establishing a framework for the preservation of the environment. Provincial laws that are applicable to industrial facilities at EDASA, among others are Law No. 7,343 of the Province of Córdoba and its supplemental N°. 10208 since 2014 , Law No. 11,459 of the Province of Buenos Aires and Environmental Code N° 5439 of the Chubut province These laws contain principles on environmental policy and management, as well as rules on environmental impact assessment. They also give certain agencies competence in environmental issues.
Almost all provinces as well as many municipalities have established rules regarding the use of water, the sewage system and the disposal of liquids into underground flows of water or rivers. There are currently no claims pending against us on this matter. The violation of these rules usually results in fines.
Paraguay
The environmental framework comprises several national and local environmental regulations. The Paraguayan Constitution of 1992 states that everyone has the right to live in a healthy and ecologically balanced environment and has the obligation to preserve it. All damage caused to the environment will carry the obligation to repair and compensate.
Considered the “mother of environmental law” in the country, Law 1561/00 chartered the three primary environmental agencies in Paraguay. These are: the Secretaría del Ambiente (SEAM or the Environmental Department), Consejo Nacional del Ambiente (CONAM or the National Environmetal Counsel), and el Sistema Nacional del Ambiente (SISNAM or National Environmental System). The Law establishes the authorities and responsibilities of the agencies to develop and oversee the national environmental policy.
Of the three, the SEAM is the main environmental institution responsible for the development and implementation of national environmental laws and for monitoring their compliance. The SEAM can apply sanctions, including: warnings, temporary or permanent suspension of authorizations or concessions, confiscations and/or fines. These penalties are applicable regardless of other civil or criminal sanctions or of the revocation of the environmental authorizations granted by SEAM. The CONAM is responsible for investigating and establishing the main goals in the environmental policies, which the SEAM must then implement. The SISNAM is integrated by several bodies, including governmental and municipal agencies and private sector stakeholders, all interested in solving environmental issues. The SISNAM provides a discussion forum for the public and private sectors to work together collectively, developing ideas and plans to promote a sustainable development.
Environmental Impact : Law 294/93 states the rights and obligations that will be triggered by any damage caused to the environment and provides the obligation to restore the environment to its previous state or instead, if that is technically impossible, the corresponding payment or compensation.
Water Resources Act of Paraguay : Law 3239/07 on water resources establishes the sustainable management of all waters (superficial, ground, atmospheric) and the territories that generate such waters, regardless of their location, physical condition or natural occurrence within the Paraguayan territory, in order to make it socially, economically and environmentally sustainable for the people living in the territory of Paraguay. The supervising agency is the SEAM. Superficial and ground waters are property of the State’s public domain. The Law establishes the following order of priority for the use of water: i) fulfillment of the needs of aquatic ecosystems; ii) social use within the home environment; iii) use and enjoyment for agricultural activities, including aquaculture; iv) use and utilization for power generation; v) use and enjoyment for other industrial activities and vi) use and enjoyment for other activities. The use of water for productive purposes is subject to the authorization granted by the State through a permit (for the use of small amounts of water) or through concessions (prior public bidding process), in both cases after the payment of applicable rights. Authorizations may be revoked based on the occurrence of the situations contemplated in the law. Concessions may be expropriated for public benefit, or be terminated in certain situations established by the Law. In addition, a National Registry of Water Resources has been created to keep record of all individuals or legal entities that utilize water resources or engage in activities related to them.
C. ORGANIZATIONAL STRUCTURE
The following chart presents in summary form our direct and indirect ownership participations in subsidiaries and affiliates:

The following tables presents information relating to the main activity of our subsidiaries and associates and our direct and indirect ownership interest in them as of the date of preparation of this document:
|
Subsidiary |
|
Activity |
|
Country of
|
|
Percentage
|
|
|
Embotelladora Andina Chile S.A.(1) |
|
Manufacture, bottle, distribute, and commercialize non-alcoholic beverages. |
|
Chile |
|
99.99 |
|
|
Vital Jugos S.A.(4 and 5) |
|
Manufacture, distribute, and commercialize all kinds of food products, juices, and beverages. |
|
Chile |
|
65.00 |
|
|
Vital Aguas S.A.(4 and 5) |
|
Manufacture, distribute, and commercialize all kinds of waters and beverages in general. |
|
Chile |
|
66.50 |
|
|
Servicios Multivending Ltda. |
|
Commercialize products through equipment and vending machines. |
|
Chile |
|
99.99 |
|
|
Transportes Andina Refrescos Ltda. |
|
Provide administration services and management of domestic and foreign ground transportation. |
|
Chile |
|
99.99 |
|
|
Transporte Polar S.A.(6) |
|
Provide administration services and management of domestic and foreign ground transportation. |
|
Chile |
|
99.99 |
|
|
Envases Central S.A.(4) |
|
Manufacture and packaging of all kinds of beverages, and commercialize all kinds of packaging. |
|
Chile |
|
59.27 |
|
|
Andina Bottling Investments S.A. |
|
Manufacture, bottle and commercialize beverages and food in general. Invest in other companies. |
|
Chile |
|
99.99 |
|
|
Andina Bottling Investments Dos S.A. |
|
Carryout exclusively foreign permanent investments or lease all kinds of real estate. |
|
Chile |
|
99.99 |
|
|
Inversiones Los Andes Ltda.(6) |
|
Invest in all types of real property and chattels |
|
Chile |
|
99.99 |
|
|
Andina Inversiones Societarias S.A. |
|
Invest in all types of companies and commercialize food products in general. |
|
Chile |
|
99.99 |
|
|
Rio de Janeiro Refrescos Ltda.(9) |
|
Manufacture and commercialize beverages in general, powdered juices and other related semi-processed products. |
|
Brazil |
|
99.99 |
|
|
Embotelladora del Atlántico S.A.(2) |
|
Manufacture, bottle, distribute, and commercialize non-alcoholic beverages. Design, produce, and commercialize plastic products mainly packaging. |
|
Argentina |
|
99.98 |
|
|
Andina Empaques S.A.(2) |
|
Design, produce, and commercialize plastic products mainly packaging. |
|
Argentina |
|
99.98 |
|
|
Paraguay Refrescos S.A. (6) |
|
Manufacture, bottle, distribute, and commercialize non-alcoholic beverages. Design, produce, and commercialize plastic products mainly packaging. |
|
Paraguay |
|
97.83 |
|
|
Abisa Corp. |
|
Invest in financial instruments. |
|
British Virgin Islands |
|
99.99 |
|
|
Aconcagua Investing Ltda. (6) |
|
Invest in financial instruments. |
|
British Virgin Islands |
|
99.99 |
|
|
Red de Transportes Comerciales Ltda. (8) |
|
Provide administration services and management of domestic and foreign ground transportation. |
|
Chile |
|
99.99 |
|
|
Sociedad de Transportes Trans-Heca Limitada(8) |
|
Provide administration services and management of domestic and foreign ground transportation. |
|
Chile |
|
99.99 |
|
|
Associates |
|
Activity |
|
Country of
|
|
Percentage
|
|
|
Envases CMF S.A. |
|
Manufacture, acquire and commercialize all types of containers and packaging; and provide bottling services. |
|
Chile |
|
50.00 |
|
|
Leao Alimentos e Bebidas Ltda. (7) |
|
Manufacture, bottle and commercialize beverages and food in general. Invest in other companies. |
|
Brazil |
|
8.82 |
|
|
Sorocaba Refrescos S.A.(3) |
|
Manufacture, bottle and commercialize beverages and food in general. Invest in other companies. |
|
Brazil |
|
40.00 |
|
|
SRSA Participacoes Ltda.(3) |
|
Manufacture, bottle and commercialize beverages and food in general. Invest in other companies. |
|
Brazil |
|
40.00 |
|
|
Kaik Participações Ltda. |
|
Invest in other companies with own resources. |
|
Brazil |
|
11.32 |
|
(1) At the Extraordinary Shareholders’ Meeting held November 22, 2011, the shareholders of Embotelladora Andina Chile S.A. agreed to increase the capital of the latter from Ch$10,000,000 -divided into 10,000 shares- to Ch$4,778,206,076 -divided into 4,778,206 shares-. It was agreed that the capital increase was to be subscribed and paid by the shareholder Embotelladora Andina S.A. through the contribution of movable goods and real estate property, which are identified in the minutes of the Shareholders’ Meeting. The Shareholders’ Meeting was reduced to public document on November 28, 2011, granted by the notary public of Santiago, Cosme Gomila.
(2) At the Extraordinary General Shareholders’ Meeting held November 1st 2011, Embotelladora del Atlántico S.A. decided to divide part of its equity to form a new company, Andina Empaques Argentina S.A., for the purpose of developing the design, manufacture and sale of all kinds of plastic products or products derived from the industry for plastics, primarily in the packaging division. Accounting and tax effects will begin on January 1st 2012.
(3) In October 2012, 40% of the Brazilian company Sociedad Brasilera Sorocaba Refrescos S.A. was acquired for a total price of 146. 9 million Brazilian reais.
(4) Vital Aguas S.A., Vital Jugos S.A. and Envases Central S.A., modified their percentage interests, due to the merger with Embotelladoras Coca Cola Polar in 2012.
(5) During 2012 a capital increase was made for M$6,960,000, of which, Embotelladora Andina S.A. paid the M$2,380,320 according to its percentage of interests.
(6) Companies incorporated during 2012, due to the merger with Embotelladoras Coca Cola Polar S.A
(7) During the first quarter of 2013, there was a reorganization of the companies that manufacture juice products and mate in Brazil, with the merger of Holdfab2 Participações Ltda. and Sistema de Alimentos de Bebidas Do Brasil Ltda. into a single company that is the legal continuing entity, namely Leao Alimentos e Bebidas Ltda. According to the current business scheme in Brazil for this company, during 2014 a 2.05% ownership interest held by Rio de Janeiro Refrescos Ltda. in Leao Alimentos e Bebidas Ltda. was sold to the rest of the bottlers’ system in Brazil.
(8) Companies created to facilitate the restructuring of the distribution process in Chile.
(9) During the fourth quarter of 2013 Rio de Janeiro Refrescos Ltda. acquired Companhia de Bebidas Ipiranga, which was legally merged into this entity.
D. PROPERTY, PLANTS AND EQUIPMENT
We maintain production plants in each of the principal population centers that comprise the franchise territories. In addition, we maintain distribution centers and administrative offices in each of the franchise territories. The following table sets forth in square meters, our principal properties, and facilities in each of the franchise territories:
|
|
|
Main Use |
|
(Square Meters) |
|
Property |
|
Embotelladora del Atlántico S.A. |
|
|
|
|
|
|
|
Bahía Blanca * |
|
Offices / Production of Soft Drinks / Distribution Center / Warehouses |
|
102,708 |
|
Own |
|
Bahía Blanca |
|
Comercial Offices |
|
576 |
|
Leased |
|
Bariloche |
|
Offices / Distribution Centers / Warehouses |
|
1,870 |
|
Leased |
|
Bragado |
|
Comercial Offices |
|
25 |
|
Leased |
|
Carlos Paz |
|
Comercial Offices |
|
30 |
|
Leased |
|
Carmen de Patagones |
|
Comercial Offices / Warehouses |
|
1,600 |
|
Leased |
|
Chacabuco * |
|
Offices / Distribution Centers / Warehouses |
|
25,798 |
|
Own |
|
Comodoro Rivadavia |
|
Offices / Distribution Centers / Warehouses |
|
7,500 |
|
Leased |
|
Concepcion del Uruguay |
|
Comercial Offices |
|
118 |
|
Leased |
|
Concordia |
|
Offices / Distribution Centers / Warehouses |
|
1,289 |
|
Leased |
|
Córdoba * |
|
Offices / Production of Soft Drinks and stills / Distribution Center / Warehouses / Land |
|
1,008,390 |
|
Own |
|
Córdoba |
|
Comercial Offices |
|
1,173 |
|
Leased |
|
Coronel Suarez |
|
Offices / Distribution Centers / Warehouses |
|
1,000 |
|
Leased |
|
General Pico * |
|
Offices / Distribution Centers / Warehouses |
|
15,525 |
|
Own |
|
Gualeguaychu |
|
Offices / Distribution Centers / Warehouses |
|
1,471 |
|
Leased |
|
Junin |
|
Comercial Offices |
|
100 |
|
Leased |
|
Mendoza * |
|
Offices / Distribution Centers / Warehouses |
|
36,452 |
|
Own |
|
Monte Hermoso * |
|
Land |
|
300 |
|
Own |
|
Neuquén * |
|
Offices / Distribution Centers / Warehouses |
|
10,157 |
|
Own |
|
Olavarria |
|
Offices / Distribution Centers / Warehouses |
|
1,974 |
|
Leased |
|
Paraná |
|
Comercial Offices |
|
172 |
|
Leased |
|
Pehuajo |
|
Offices / Distribution Centers / Warehouses |
|
1,060 |
|
Leased |
|
Pergamino * |
|
Offices / Cross Docking |
|
15,700 |
|
Own |
|
Puerto Madryn |
|
Offices |
|
115 |
|
Leased |
|
Rio Gallegos |
|
Distribution Centers / Warehouses |
|
2,491 |
|
Leased |
|
Rio Grande |
|
Offices / Distribution Centers / Warehouses |
|
4,518 |
|
Leased |
|
Río IV * |
|
Cross Docking |
|
7,482 |
|
Own |
|
Río IV |
|
Comercial Offices |
|
93 |
|
Leased |
|
Rosario |
|
Offices / Distribution Center / Warehouses / Land |
|
27,814 |
|
Own |
|
San Francisco |
|
Comercial Offices |
|
63 |
|
Leased |
|
San Juan * |
|
Offices / Distribution Centers / Warehouses |
|
48,036 |
|
Own |
|
San Luis * |
|
Offices / Distribution Centers / Warehouses |
|
5,205 |
|
Own |
|
San Martin de los Andes |
|
Offices / Distribution Centers / Warehouses |
|
70 |
|
Leased |
|
San Nicolas |
|
Comercial Offices |
|
30 |
|
Leased |
|
San Rafael |
|
Comercial Offices |
|
57 |
|
Leased |
|
Santa Fe |
|
Comercial Offices |
|
238 |
|
Leased |
|
Santo Tomé * |
|
Offices / Distribution Centers / Warehouses |
|
88,309 |
|
Own |
|
Trelew * |
|
Offices / Production of Soft Drinks / Distribution Center / Warehouses |
|
51,000 |
|
Own |
|
Tres Arroyos |
|
Comercial Offices / Cross Docking / Warehouses |
|
1,548 |
|
Leased |
|
Ushuaia |
|
Offices / Distribution Centers / Warehouses |
|
1,360 |
|
Leased |
|
Ushuaia |
|
Comercial Offices |
|
94 |
|
Leased |
|
Venado Tuerto |
|
Offices / Distribution Centers / Warehouses |
|
2,449 |
|
Leased |
|
Villa Maria |
|
Comercial Offices |
|
98 |
|
Leased |
|
Villa Mercedes |
|
Comercial Offices |
|
70 |
|
Leased |
|
Andina Empaques Argentina S.A. |
|
|
|
|
|
|
|
Buenos Aires * |
|
Production of PET bottles and preforms |
|
27,043 |
|
Own |
|
|
|
|
|
|
|
|
|
BRASIL |
|
|
|
|
|
|
|
Rio de Janeiro Refrescos Ltda. |
|
|
|
|
|
|
|
Jacarepaguá |
|
Offices / Production of Soft Drinks / Distribution Center / Warehouses |
|
249,470 |
|
Own |
|
Duque de Caxias * |
|
Land to build a Plant |
|
2,243,953 |
|
Own |
|
Nova Iguaçu * |
|
Distribution Centers / Warehouses |
|
82,618 |
|
Own |
|
Bangu * |
|
Distribution Centers |
|
44,389 |
|
Own |
|
Campos * |
|
Distribution Centers |
|
42,370 |
|
Own |
|
Itambi |
|
Distribution Centers |
|
149,000 |
|
Leased |
|
Cabo Frio * |
|
Distribution Centers - Desactivated |
|
1,985 |
|
Own |
|
Sao Pedro da Aldeia * |
|
Distribution Centers |
|
10,139 |
|
Own |
|
Itaperuna |
|
Cross Docking |
|
2,500 |
|
Leased |
|
Caju 1 * |
|
Distribution Centers |
|
4,866 |
|
Own |
|
Caju 2 * |
|
Distribution Centers |
|
8,058 |
|
Own |
|
Vitória (Cariacica) * |
|
Offices / Production of Soft Drinks / Distribution Center / Warehouses |
|
93,320 |
|
Own |
|
Cachoeiro do Itapemirim |
|
Cross Docking |
|
8,000 |
|
Leased |
|
Linhares |
|
Cross Docking |
|
1,500 |
|
Leased |
|
Serra |
|
Distribution Centers |
|
28,000 |
|
Leased |
|
Ribeirão Preto |
|
Offices / Production of Soft Drinks / Distribution Center / Warehouses |
|
238,096 |
|
Own |
|
Ribeirão Preto |
|
Real Estate |
|
279,557 |
|
Own |
|
Franca |
|
Distribution Centers |
|
32,500 |
|
Own |
|
Mococa |
|
Distribution Centers |
|
40,056 |
|
Leased |
|
Araraquara |
|
Distribution Centers |
|
12,698 |
|
Leased |
|
Castelo Branco |
|
Distribution Centers |
|
11,110 |
|
Leased |
|
Sao Joao da Boa Vista, Araraquara e Sao Paulo |
|
Real Estate |
|
32,506 |
|
Own |
|
|
|
|
|
|
|
|
|
CHILE |
|
|
|
|
|
|
|
|
|
|
|
|
|
|
|
Embotelladora Andina S.A. |
|
|
|
|
|
|
|
Renca * |
|
Offices / Production of Soft Drinks / Distribution Center / Warehouses |
|
267,095 |
|
Own |
|
Carlos Valovinos * |
|
Distribution Centers / Warehouses |
|
101,902 |
|
Own |
|
Puente Alto * |
|
Distribution Centers / Warehouses |
|
68,682 |
|
Own |
|
Maipu * |
|
Distribution Centers / Warehouses |
|
45,833 |
|
Own |
|
Rancagua * |
|
Distribution Centers / Warehouses |
|
25,920 |
|
Own |
|
San Antonio * |
|
Distribution Centers / Warehouses |
|
19,809 |
|
Own |
|
Antofagasta * |
|
Offices / Production of Soft Drinks / Distribution Center / Warehouses |
|
34,729 |
|
Own |
|
Calama * |
|
Distribution Centers / Warehouses |
|
10,700 |
|
Own |
|
Taltal * |
|
Distribution Centers / Warehouses |
|
975 |
|
Own |
|
Tocopilla * |
|
Distribution Centers / Warehouses |
|
562 |
|
Own |
|
Coquimbo * |
|
Offices / Production of Soft Drinks / Distribution Center / Warehouses |
|
31,383 |
|
Own |
|
Copiapo * |
|
Distribution Centers / Warehouses |
|
26,800 |
|
Own |
|
Ovalle * |
|
Distribution Centers / Warehouses |
|
6,223 |
|
Own |
|
Vallenar * |
|
Distribution Centers / Warehouses |
|
5,000 |
|
Own |
|
Illapel |
|
Distribution Centers / Warehouses |
|
s/d |
|
Leased |
|
Pta. Arenas * |
|
Offices / Production of Soft Drinks / Distribution Center / Warehouses |
|
109,517 |
|
Own |
|
Coyhaique * |
|
Distribution Centers / Warehouses |
|
5,093 |
|
Own |
|
Puerto Natales |
|
Distribution Centers / Warehouses |
|
850 |
|
Leased |
|
Vital Jugos S.A. |
|
|
|
|
|
|
|
Región Metropolitana * |
|
Offices / Production of Juices |
|
40,000 |
|
Own |
|
Vital Aguas S.A. |
|
|
|
|
|
|
|
Rengo * |
|
Offices / Production of Waters |
|
12,375 |
|
Own |
|
Envases Central S.A. |
|
|
|
|
|
|
|
Región Metropolitana * |
|
Offices / Production of Soft Drinks |
|
50,100 |
|
Own |
|
|
|
|
|
|
|
|
|
PARAGUAY |
|
|
|
|
|
|
|
|
|
|
|
|
|
|
|
Paraguay Refrescos S.A. |
|
|
|
|
|
|
|
San Lorenzo * |
|
Offices / Production of Soft Drinks / Warehouses |
|
275,292 |
|
Own |
|
Coronel Oviedo * |
|
Offices / Warehouses |
|
32,911 |
|
Own |
|
Encarnación * |
|
Offices / Warehouses |
|
12,744 |
|
Own |
|
Ciudad del Este * |
|
Offices / Warehouses |
|
14,620 |
|
Own |
* Encumbrance free properties
Capacity by Line of Business
Set forth below is certain information concerning the installed capacity and approximate average utilization of our production facilities, by line of business.
|
|
|
Year Ended December 31, |
|
||||||||||
|
|
|
2013 |
|
2014 |
|
||||||||
|
|
|
Annual
|
|
Average
|
|
Capacity
|
|
Annual
|
|
Average
|
|
Capacity
|
|
|
Soft drinks (millions of UCs): |
|
|
|
|
|
|
|
|
|
|
|
|
|
|
Chile . |
|
327 |
|
51 |
|
65 |
|
320 |
|
52 |
|
68 |
|
|
Brazil |
|
420 |
|
78 |
|
85 |
|
405 |
|
72 |
|
74 |
|
|
Argentina |
|
327 |
|
63 |
|
73 |
|
341 |
|
60 |
|
72 |
|
|
Paraguay |
|
80 |
|
83 |
|
85 |
|
80 |
|
82 |
|
86 |
|
|
Other beverages (millions of UCs) |
|
|
|
|
|
|
|
|
|
|
|
|
|
|
Chile |
|
59 |
|
65 |
|
83 |
|
62 |
|
61 |
|
83 |
|
|
Brazil |
|
17 |
|
78 |
|
97 |
|
16 |
|
81 |
|
86 |
|
|
Argentina |
|
52 |
|
33 |
|
42 |
|
52 |
|
31 |
|
49 |
|
|
Paraguay |
|
23 |
|
70 |
|
85 |
|
23 |
|
75 |
|
88 |
|
|
PET packaging (millions of bottles) |
|
74 |
|
69 |
|
100 |
|
67 |
|
56 |
|
100 |
|
|
Preformas (millones de preformas) |
|
824 |
|
92 |
|
100 |
|
988 |
|
88 |
|
100 |
|
|
Plastic caps (millions of caps) |
|
— |
|
— |
|
— |
|
511 |
|
85 |
|
100 |
|
(1) Total installed annual production capacity assumes production of the mix of products and containers produced in 2014.
In 2014, we continued to modernize and renovate our manufacturing facilities in order to maximize efficiency and productivity; we also made significant improvements to our auxiliary services and complementary processes such as water treatment plants and effluent treatment stations. At present, we estimate we have the capacity in each of the franchise territories to meet consumer demand for each product format. Because bottling is a seasonal business with significantly higher demand during the South American summer and because soft drinks are perishable, it is necessary for bottlers to carry significant over-capacity in order to meet the substantially greater seasonal demand. We assure the quality of our products through worldwide class practices and procedures maintaining quality control laboratories and structures in each production facility where raw materials are tested and where we analyze samples of our products.
As of December 31, 2014, we had total installed annual production capacity, including soft drinks, fruit juices, and water, of 1,299 million unit cases. Our primary facilities include:
· through Coca-Cola Andina, in the Chilean territory, four soft drink production facilities with ten production lines in Renca, four production lines in Antofagasta, three production lines in Coquimbo and two production lines in Punta Arenas with total installed annual capacity of 320 million unit cases (24.6% of our total installed annual capacity);
· through Vital Jugos in the Chilean territory, one fruit juice production facility, with fifteen production lines, with total installed annual capacity of 41 million unit cases (3.2% of our total installed annual capacity);
· through Vital Aguas in the Chilean territory, one mineral water production facility, with four production lines, with total installed annual capacity of 21 million unit cases (1.6% of our total installed annual capacity);
· through Rio de Janeiro Refrescos in the Brazilian territory, three soft drink production facilities with 20 production lines with total installed annual capacity of 405 million unit cases (31.2% of our total installed annual capacity); and five production lines for juices and tea which satisfy the franchise’s needs and re-sales to other Bottlers in Brazil, with total installed annual capacity of 16 million unit cases (1.2% of our total installed annual capacity);
· through Embotelladora del Atlántico in the Argentine territory, three soft drink production facilities with seventeen production lines with a total installed annual capacity of 341 million unit cases
(26.3% of our total installed annual capacity); and two facility for the production of juices with five production lines that covers the needs of our franchise with a total installed annual capacity of 16,4 million unit cases (1.3% of our total installed annual capacity), and one production line for waters and sensitive products with a total installed annual capacity of 35.3 million unit cases (2.7% of our total installed annual capacity);
· through Andina Empaques Argentina S.A. in the Argentine territory one production facility for bottles, preforms and plastic caps that covers the needs of the Coca-Cola system in that country. It has 13 preform injectors, three bottle blowers and 1 injector for plastic caps, with a total installed annual capacity of 1,566 million units considering PET bottles, preforms and plastic caps.
· through Paresa in the Paraguayan territory, one production facility located in San Lorenzo, with eight production lines with a total installed annual capacity of 80 million unit cases (6.2% of our total installed annual capacity); and three tetra pack lines with a total installed annual capacity of 30 million unit cases (1.8% of our total installed annual capacity).
Not applicable.
ITEM 5. OPERATING AND FINANCIAL REVIEW AND PROSPECTS
A. OPERATING RESULTS
Results of Operations
Set forth below is a discussion and analysis of our results of operations for the year ended December 31, 2014 compared to the year ended December 31, 2013 and 2012. On October 11, 2013, Andina Brazil consummated its acquisition of Ipiranga and we began consolidating the results of the operations of Ipiranga into our consolidated financial statements as of October 1, 2013. Additionally, on October 1, 2012, the merger with Polar was finalized and we began consolidating the results of the operations of Polar into our consolidated financial statements as of the same date. As a result, our consolidated results of operations for the year ended December 31, 2014 are not fully comparable to our consolidated results of operations for December 31, 2013 and 2012.
Our consolidated financial results include the results of our subsidiaries located in Chile, Brazil, Argentina and Paraguay. Our consolidated financial results for the year ended December 31, 2014 include the results of Polar and its subsidiaries located in Chile, Argentina, Paraguay and include the results of Ipiranga. Our consolidated financial results for the year ended December 31, 2013 include the results of Polar and its subsidiaries located in Chile, Argentina and Paraguay. Our consolidated financial results for the year ended December 31, 2013 also include the results of Ipiranga (only the fourth quarter). Our consolidated financial statements reflect the results of the subsidiaries outside of Chile, translated into Chilean pesos (our functional and reporting currency) and are presented in accordance with IFRS. IFRS requires assets and liabilities to be translated from the functional currency of each entity to the reporting currency (Chilean peso) at end of period exchange rates and income and expense accounts to be translated at the average monthly exchange rate for the month in which income or expense is recognized.
Summary of Results of Operations for the Year ended December 31, 2013 and the Year ended December 31, 2014
The following tables set forth our sales volume, net sales and gross profit for the year ended December 31, 2012, compared to the year ended December 31, 2013 and December 31, 2014:
|
|
|
Year ended December 31, |
|
||||
|
|
|
2012 |
|
2013 |
|
2014 |
|
|
|
|
(millions of unit cases(1)) |
|
||||
|
Sales volume: |
|
|
|
|
|
|
|
|
Chile |
|
185.4 |
|
234.7 |
|
231.8 |
|
|
Soft drinks |
|
149.9 |
|
174.4 |
|
168.5 |
|
|
Mineral water 10 |
|
16.8 |
|
30.0 |
|
32.8 |
|
|
Juices |
|
18.6 |
|
30.3 |
|
30.3 |
|
|
Beer |
|
— |
|
0.1 |
|
0.1 |
|
|
Brazil |
|
225.0 |
|
242.6 |
|
306.9 |
|
|
Soft drinks |
|
197.8 |
|
205.2 |
|
250.2 |
|
|
Mineral water |
|
5.8 |
|
6.2 |
|
5.4 |
|
|
Juices |
|
16.2 |
|
22.9 |
|
34.1 |
|
|
Beer |
|
5.2 |
|
8.4 |
|
17.2 |
|
|
Argentina |
|
167.0 |
|
224.4 |
|
229.4 |
|
|
Soft drinks |
|
153.4 |
|
200.4 |
|
199.1 |
|
|
Mineral water |
|
9.8 |
|
18.0 |
|
21.7 |
|
|
Juices |
|
3.8 |
|
6.0 |
|
8.5 |
|
|
Paraguay |
|
18.8 |
|
61.2 |
|
62.5 |
|
|
Soft drinks |
|
16.5 |
|
53.5 |
|
53.8 |
|
|
Mineral water |
|
1.5 |
|
4.4 |
|
5.5 |
|
|
Juices |
|
0.8 |
|
3.4 |
|
3.3 |
|
(1) Unit cases refer to 192 ounces of finished beverage product (24 eight-ounce servings) or 5.69 liters
|
|
|
Year ended December 31, |
|
||||||||||
|
|
|
2012 |
|
2013 |
|
2014 |
|
||||||
|
|
|
Ch$
|
|
% of
|
|
Ch$
|
|
% of
|
|
Ch$
|
|
% of
|
|
|
Net sales: |
|
|
|
|
|
|
|
|
|
|
|
|
|
|
Chile |
|
374,873 |
|
32.0 |
|
477,918 |
|
31.4 |
|
492,072 |
|
27.4 |
|
|
Brazil |
|
451,597 |
|
38.5 |
|
491,861 |
|
32.3 |
|
715,728 |
|
39.8 |
|
|
Argentina |
|
315,336 |
|
26.9 |
|
441,229 |
|
29.0 |
|
461,003 |
|
25.7 |
|
|
Paraguay |
|
32,028 |
|
2.7 |
|
112,254 |
|
7.4 |
|
129,496 |
|
7.2 |
|
|
Inter-country eliminations(1) |
|
(1,541 |
) |
(0.1 |
) |
(1,581 |
) |
(0.1 |
) |
(1,099 |
) |
(0.1 |
) |
|
Total net sales |
|
1,172,293 |
|
100.0 |
% |
1,521,681 |
|
100.0 |
% |
1,797,200 |
|
100.0 |
% |
(1) Eliminations represent intercompany sales.
The following table sets forth our results of operations for the year ended December 31, 2013 compared to the year ended December 31, 2014.
|
|
|
Year ended December 31, |
|
||||||||||
|
|
|
2013 |
|
2014 |
|
2014 |
|
||||||
|
|
|
Ch$
|
|
% of net
|
|
Ch$
|
|
% of
|
|
US$
|
|
% of
|
|
|
Net sales |
|
1,521,681 |
|
100.0 |
|
1.797.200 |
|
100.0 |
|
3,151 |
|
100.0 |
|
|
Cost of sales |
|
(914,818 |
) |
(60.1 |
) |
(1.081.243 |
) |
(60.2 |
) |
(1,896 |
) |
(60.2 |
) |
|
Gross profit |
|
606,864 |
|
39.9 |
|
715.957 |
|
39.8 |
|
1,255 |
|
39.8 |
|
|
Distribution, administrative and sales expenses |
|
(435,579 |
) |
(28.6 |
) |
(529.184 |
) |
(29.4 |
) |
(928 |
) |
(29.4 |
) |
|
Other (expense) income, net(2) |
|
(58,051 |
) |
(3.8 |
) |
(89.385 |
) |
(5.0 |
) |
(157 |
) |
(5.0 |
) |
|
Income taxes |
|
(22,966 |
) |
(1.5 |
) |
(45.354 |
) |
(2.5 |
) |
(79 |
) |
(2.5 |
) |
|
Net income |
|
90,267 |
|
5.9 |
|
52.034 |
|
2.9 |
|
91 |
|
2.9 |
|
(1) Translation of U.S. dollar amounts, solely for the convenience of the reader.
(2) Includes other expenses, other income (expense), financial income, financial costs, share in profit of investees accounted under the equity method, foreign exchange gains (losses) and gains (losses) from indexed financial assets and liabilities.
|
|
|
Chile |
|
Brazil |
|
Argentina |
|
Paraguay |
|
Eliminations |
|
Total |
|
||||||||||||
|
|
|
2013 |
|
2014 |
|
2013 |
|
2014 |
|
2013 |
|
2014 |
|
2013 |
|
2014 |
|
2013 |
|
2014 |
|
2013 |
|
2014 |
|
|
M Ch$ |
|
|
|
|
|
|
|
|
|
|
|
|
|
|
|
|
|
|
|
|
|
|
|
|
|
|
Net sales |
|
477,918 |
|
492,072 |
|
491,861 |
|
715,728 |
|
441,229 |
|
461,003 |
|
112,254 |
|
129,496 |
|
-1,581 |
|
-1,099 |
|
1,521,681 |
|
1,797,200 |
|
|
Cost of sales |
|
-283,988 |
|
-296,894 |
|
-308,359 |
|
-440,655 |
|
-250,551 |
|
-265,288 |
|
-73,500 |
|
-79,505 |
|
1,581 |
|
1,099 |
|
-914,818 |
|
-1,081,243 |
|
|
Gross profit |
|
193,930 |
|
195,178 |
|
183,502 |
|
275,073 |
|
190,678 |
|
195,715 |
|
38,753 |
|
49,990 |
|
|
|
|
|
606,864 |
|
715,956 |
|
|
Distribution, administrative and selling expenses |
|
-127,311 |
|
-138,718 |
|
-124,383 |
|
-190,272 |
|
-155,211 |
|
-165,267 |
|
-23,700 |
|
-23,700 |
|
|
|
|
|
-430,605 |
|
-524,089 |
|
|
Corporate expenses |
|
|
|
|
|
|
|
|
|
|
|
|
|
|
|
|
|
|
|
|
|
-4,975 |
|
-5,095 |
|
Overview
The Ipiranga acquisition was consummated on October 11, 2013 and their results are included in our consolidated results as of October 1, 2013. For this analysis we define “Organically” as without taking into account the M&A activity associated with the Ipiranga acquisition.
Net Sales
Our sales volume reached 830.6 million unit cases during the year ended December 31, 2014, an 8.9% increase compared to 763.0 million unit cases during in 2013. Volumes for soft drinks increased 6.0%, and volumes for juices, beer and waters increased 21.8%, 104.3% and 11.9%, respectively, in each case during the year ended December 31, 2014, compared to the corresponding period in 2013. Organically, our sales volume increased 0.7%, which was comprised of a 0.7% decrease in soft drinks volume, and increases in waters, juices and beer volumes of 10.5%, 6.4% and 4.0% respectively. The Ipiranga acquisition contributed 25.7 million unit cases in 2013 and 87.9 million unit cases in 2014.
Our net sales were Ch$1,797,200 million during the year ended December 31, 2014, a Ch$275,519 million, or 18.1% increase compared to Ch$1,521,681 million during the corresponding period in 2013. Organically, our net sales increased 8.8%, principally as a result of (i) increased volumes, mainly soft drinks in Argentina and waters in Chile and Argentina and (ii) increased prices in Brazil and Argentina, and partially offset by (i) a decrease in soft drink volumes in Chile and Brazil and (ii) currency translations into Chilean pesos, resulting from an appreciation of the Chilean peso against the Argentine peso.
Soft drinks represented 75% of net sales during the year ended December 31, 2014, compared to 79% during the corresponding period in 2013.
Chile
Our sales volumes in Chile reached 231.8 million unit cases during the year ended December 31, 2014, a 1.3% decrease compared to 234.7 million unit cases during the corresponding period in 2013. Volumes for soft drinks in Chile decreased 3.3%, and volumes for juices and waters in Chile increased by 0.2% and 11.9%, respectively, in each case during the year ended December 31, 2014, compared to the corresponding period during 2013.
Our market share for soft drinks in Chile during the year ended December 31, 20134, according to A.C. Nielsen Company, was 68.5% (in terms of volumes), compared to 67.6% for the corresponding period in 2013, and 70.9% (in terms of average sales), compared to 70.0% for the corresponding period in 2013.
Our net sales in Chile were Ch$492,072 million during the year ended December 31, 2014, a Ch$14,154 million, or 3.0% increase compared to Ch$477,918 million during the corresponding period in 2013, mainly resulting from higher revenues per unit case and partially offset by the aforementioned decrease in volume sold.
Our net sales of soft drinks in Chile were Ch$363,123 million during the year ended December 31, 2014, a Ch$5,948 million, or 1.7% increase compared to Ch$357,175 million during the corresponding period in 2013. Our net sales of juices and waters in Chile were Ch$128,072 million during the year ended December 31, 2014, a Ch$8,477 million, or 7.0% increase compared to Ch$120,472 million during the corresponding period in 2013.
Brazil
Our sales volumes in Brazil reached 306.9 million unit cases during the year ended December 31, 2014, a 26.5% increase compared to 242.6 million unit cases during the corresponding period in 2013. Volumes for soft drinks in Brazil increased 21.9%, and volumes for waters decreased 13.1%, volumes for juices increased 49.2% and volumes for beer increased 105.6% in each case during the year ended December 31, 2014, compared to the corresponding period during 2013. Excluding the effect of our merger with Ipiranga, sales volumes increased 1.0% principally resulting from the 1.3% increase in soft drinks volumes and the 7.3% increase in juices and 4.3% increase in beer, partially offset by the 30.5% decrease in the volumes for waters. The low growth in soft drinks volumes is principally due to (i) the unfavorable macroeconomic condition in Brazil; and (ii) food inflation above general inflation which reduced consumers’ purchasing power. The Ipiranga acquisition contributed 25.7 million unit cases in 2013 (when we incorporated only 4Q13 in our results) and 87.9 million unit cases in 2014 (when we incorporated results for the full year 2014).
Our market share for soft drinks in Brazil, excluding Ipiranga, during the year ended December 31, 2014, according to A.C. Nielsen Company, was 59.1% (in terms of volumes), compared to 58.4% for the corresponding period in 2013, and 66.6% (in terms of average sales), compared to 66.4% for the corresponding period in 2013.
Our net sales in Brazil were Ch$ 715,728 million during the year ended December 31, 2014, a Ch$ 91.572 million, or 45.5% increase compared to Ch$ 491,861 million during the corresponding period in 2013. Excluding the effect of the Ipiranga acquisition, which represented Ch$ 194,810 million, net sales in Brazil increased 17.7%, principally as a result of (i) higher revenues per unit case and (ii) the aforementioned volume increase. These effects where greatened by the effect of translation of local currency to Chilean pesos resulting from a 5.6% appreciation of the Brazilian real against the Chilean Peso, based on the average exchange rate for the year ended December 31, 2014 compared with the corresponding period in 2013.
Our net sales of soft drinks in Brazil were Ch$ 490,931 million during the year ended December 31, 2014, a Ch$ 131,431 million, or 36.6% increase compared to Ch$ 359,501 million during the corresponding period in 2013. Our net sales of juices, waters and beer in Brazil were Ch$ 224,797 million during the year ended December 31, 2013, a Ch$ 92,436 million, or 69.8% increase compared to Ch$ 132,361 million during the corresponding period in 2013.
Argentina
Our sales volumes in Argentina reached 229.4 million unit cases during the year ended December 31, 2014, a 2.2% increase compared to 224.4 million unit cases unit cases during the corresponding period in 2013. Volumes for soft drinks in Argentina decreased 0.7%, and volumes for juices increased by 41.0% and volumes for waters increased 21.0%, in each case during the year ended December 31, 2014, compared to the corresponding period during 2013.
Our market share for soft drinks in Argentina during the year ended December 31, 2014, according to A.C. Nielsen Company, was 61.4% (in terms of volumes), compared to 60.4% for the corresponding period in 2013, and 66.6% (in terms of average sales), compared to 66.0% for the corresponding period in 2013.
Our net sales in Argentina were Ch$ 461,003 million during the year ended December 31, 2014, a Ch$19,774 million, or 4.5% increase compared to Ch$441,229 million during the corresponding period in 2013, mainly resulting from (i) increased volumes; and (ii) increased prices, partially offset by currency translation to Chilean Pesos, resulting from the 22.3% depreciation of the Argentine Peso against the Chilean Peso based on the average exchange rate for the year ended December 31, 2014, compared to the corresponding period in 2013.
Our net sales of soft drinks in Argentina were Ch$ 391,799 million during the year ended December 31, 2014, a Ch$ 2.031 million, or 0.5% increase compared to Ch$ 389,768 million during the corresponding period in 2013. Our net sales of juices and waters in Argentina were Ch$ 61,533 million during the year ended December 31, 2013, an Ch$ 16,187 million, or 35.7% increase compared to Ch$ 45,346 million during the corresponding period in 2013.
Paraguay
Our sales volumes in Paraguay reached 62.5 million unit cases during the year ended December 31, 2014, a 2.1% increase compared to 61.2 million unit cases unit cases during the corresponding period in 2013. Volumes for soft drinks in Paraguay increased 0.5%, and volumes for juices decreased by 4.4% and volumes for waters increased 26.9%, in each case during the year ended December 31, 2014, compared to the corresponding period during 2013.
Our market share for soft drinks in Paraguay during the year ended December 31, 20134, according to IPSOS ASI, was 62.1% in terms of volumes, compared to 60.6% for the corresponding period in 2013, and 70.1% in terms of average sales, compared to 69.0% for the corresponding period in 2013.
Our net sales in Paraguay were Ch$ 129.496 million during the year ended December 31, 2014, a Ch$ 17,242 million, or 15.4% increase compared to Ch$ 112,254 million during the corresponding period in 2013, mainly resulting from (i) increased volumes; and (ii) increased prices, and (iii) local currency translation to Chilean Pesos, resulting from the 10.6% appreciation of the Paraguayan Guarani against the Chilean Peso based on the average exchange rate for the year ended December 31, 2014, compared to the corresponding period in 2013.
Our net sales of soft drinks in Paraguay were Ch$ 106,579 million during the year ended December 31, 2014, a Ch$ 12,266 million, or 13.0% increase compared to Ch$ 94,314 million during the corresponding period in 2013. Our net sales of juices and waters in Paraguay were Ch$ 22,916 million during the year ended December 31, 2014, a Ch$ 4,977 million, or 27.7% increase compared to Ch$ 17,940 million during the corresponding period in 2013.
Cost of Sales
Our cost of sales were Ch$ 1,081,243 million during the year ended December 31, 2014, a Ch$ 166,426 million, or 18.2% increase, compared to Ch$ 914,818 million during the corresponding period in 2013. The cost of sales per unit case increased 8.6% in the same period. Excluding the effect of the Ipiranga acquisition, which represented Ch$ 130,012 million of our cost of sales in 2014 and Ch$35,044 million in 2013, our cost of sales increased 8.1% compared to the corresponding period in 2013. This increase was mainly due to (i) an increase in the percentage of distributed products (juices and waters) in our product mix in Brazil and Chile which have a greater cost per unit case; (ii) an increase in labor costs, mainly in Argentina, Chile and Paraguay, (iii) the depreciation of the local currencies of Argentina, Chile and Brazil relative to the U.S. dollar, which increases our effective cost of raw materials denominated in U.S. dollars; (iv) increased depreciation of capital goods, corresponding to plant and equipment in Brazil and Paraguay and (v) higher cost of concentrate in Argentina, Chile and Brazil, due to price increases of our products. These effects were partially offset by the depreciation of the Argentinean peso with respect to the Chilean Peso, which reduces our costs upon translation to Chilean Pesos and by the lower cost of sugar in Paraguay. Our cost of sales represented 60.2% of net sales for the year ended December 31, 2014, compared to 60.1% for the corresponding period in 2013.
Chile
Our cost of sales in Chile was Ch$ 296.894 million during the year ended December 31, 2014, a Ch$ 12.906 million, or 4.5% increase compared to Ch$ 283,988 million during the corresponding period in 2013. The cost of sales per unit case increased 5.9% in the same period. This increase was mainly due to (i) the depreciation of the Chilean peso which has a negative impact over dollarized costs, (ii) an increase in the mix of distributed products (juices and waters), which have a higher cost per unit case, (iii) higher concentrate costs given price increases carried out which explains 57% of the increase of cost of sales per unit case and (iv) higher labor costs in Chile, which explains 8% of the increase of cost of sales per unit cases. Our cost of sales in Chile represented 60.3% of net sales in Chile for the year ended December 31, 2014, compared to 59.4% for the corresponding period in 2013.
Brazil
Our cost of sales in Brazil was Ch$440,655 million during the year ended December 31, 2014, a Ch$ 132,295 million, or 42.9% increase compared to Ch$ 308.360 million during the corresponding period in 2013. The cost of sales per unit case increased 13.0% in the same period. Excluding the effect of the Ipiranga acquisition, which contributed Ch$130,012 million to our cost of sales during the year ended December 31, 2014, our cost of sales increased 8.1% (an increase of 12.5% per unit case) compared to the corresponding period in 2013. In local currency and excluding the effect of the Ipiranga acquisition, cost of sales increased 8.0%, mainly due to (i) an increase in our product mix of distributed products (juices and waters), which have a greater cost per unit case, which explains 76% of the increase of the cost of sales per unit case; (ii) increased costs of concentrate resulting from price increases carried out which explains 17% of the increase of the cost of sales per unit case; and (iii) greater depreciation charges, which explains 11% of the increase of the cost of sales per unit case. These effects were partially offset by the lower cost of PET and labels, resulting from the shift in the product mix towards returnable formats and the translation of local currency to Chilean Pesos, resulting from the 5.6% appreciation of the Brazilian Real against the Chilean Peso, based on the average exchange rate for the period ended December 31, 2014 compared to the corresponding period in 2013. Our cost of sales in Brazil represented 61.6% of net sales in Brazil for the year ended December 31, 2014, compared to 62.7% for the corresponding period in 2013.
Argentina
Our cost of sales in Argentina was Ch$ 265,288 million during the year ended December 31, 2014, a Ch$ 14,737 million, or 5.9% increase compared to Ch$ 250,551 million during the corresponding period in 2013. The cost of sales per unit case increased 3.6% in the same period. In local currency total cost of sales increased 35.7%. The increase in our cost of sales per unit case in local currency was mainly due to: (i) higher costs of concentrate explained by price increases and higher volumes sold, which explains 29% of the increase of the cost of sales per unit case; (ii) increase in the product mix of juices and waters, which explains 16% of the increase of the cost of sales per unit case; (iii) higher labor costs, mainly caused by the increase in real wages, which explains 15% of the increase of the cost of sales per unit case; and (iv) higher depreciation due to recent investments, which explains 8% of the increase of the cost of sales per unit case. Our cost of sales in Argentina represented 57.5% of net sales in Argentina for the year ended December 31, 2014, compared to 56.8% for the corresponding period in 2013.
Paraguay
Our cost of sales in Paraguay was Ch$79,506 million during the year ended December 31, 2014, a Ch$6,005 million, or 8.2% increase compared to Ch$73,500 million during the corresponding period in 2013. Cost of sales per unit case increase 5.9% during the same period. This increase is explained by the effect of translation of figures given the appreciation of the Paraguayan Guarani against the Chilean Peso. In local currency cost of sales decreased 2%, which is mainly explained by the lower cost of sugar which was 25% lower per unit case when compared to the previous year. This was partially offset by (i) greater depreciation charges and (ii) increased labor costs. Our cost of sales in Paraguay represented 61.4% of net sales in Paraguay for the year ended December 31, 2014, compared to 65.5% for the corresponding period in 2013.
Gross Profit
Due to the factors described above, our gross profit reached Ch$715,956 million during the year ended December 31, 2014, a Ch$109,093 million, or 18.0% increase compared to Ch$606,864 million during the corresponding period 2013. Our gross profit represented 39.8% of our net sales during the year ended December 31, 2014, while in the corresponding period in 2013 represented 39.9% of our net sales. Organically, our gross profit during the year ended December 31, 2014 was $651,158 million, representing 40.6% of our net sales, and a Ch$58,587 million, or 9.9% increase compared to the corresponding period in 2013.
Distribution, administrative and sales expenses
We had distribution, administrative and sales expenses of Ch$ 529,184 million during the year ended December 31, 2014, a Ch$ 93,605 million, or 21.5% increase compared to Ch$ 435,579 million during the corresponding period in 2013. Excluding the effect of the acquisition of Ipiranga, which represented Ch$ 50,225 million of our distribution, administrative and sales expenses in 2014, and Ch$ 14,293 million in 2013, our distribution, administrative and sales expenses increased 12.3% compared to the corresponding period in 2013. This increase in distribution, administrative and sales expenses, excluding the effect of the M&A activity, was mainly due to (i) increased distribution costs in the four countries where we operate; (ii) increased labor costs in the four countries; (iii) increased marketing expenses in the four countries and (iv) the effect of other operating income which is classified under this item and which was substantially higher in 2013 in Paraguay. Our distribution, administrative and sales expenses represented 29.4% of our net sales during the year ended December 31, 2014, compared to 28.6% for to the corresponding period in 2013.
Chile
In Chile, our distribution, administrative and sales expenses reached Ch$138,718 million during the year ended December 31, 2014, a Ch$11,407 million, or 9.0% increase compared to Ch$127,311 million during the corresponding period in 2013. The increase in distribution, administrative and sales expenses in Chile was mainly due to the effect of other operating income which is classified under the item and which were greater in 2013. Isolating this effect, distribution, administrative and sales expenses increased 7%, which is mainly explained by (i) higher distribution expenses, which were 14% higher when compared to the previous year and (ii) increased labor costs which were 7% higher when compared to the previous year. Our distribution, administrative and sales expenses in Chile represented 28.2% of our net sales in Chile during the year ended December 31, 2014, compared to 26.6% for the corresponding period in 2013.
Brazil
In Brazil, our distribution, administrative and sales expenses reached Ch$190,272 million during the year ended December 31, 2014, a Ch$65,889 million, or 53.0% increase compared to Ch$124,383 million during the corresponding period in 2013. Excluding the effect of the Ipiranga acquisition, which represented Ch$50,225 million of our distribution, administrative and sales expenses in Brazil in 2014, our distribution, administrative and sales expenses in Brazil increased 21.4% compared to the corresponding period in 2013. In local currency and excluding the effect of the Ipiranga acquisition, our distribution, administrative and sales expenses increased 13.8%, mainly due to (i) increased marketing expenses, which were 57% higher compared to the previous year; (ii) increased labor costs resulting from an increase in salaries, which were 11% higher when compared to the previous year; (iii) higher distribution costs, which were 10% higher when compared to the previous year. Our distribution, administrative and sales expenses in Brazil represented 26.6% of our net sales in Brazil during the year ended December 31, 2014, compared to 25.3% for the corresponding period in 2013.
Argentina
In Argentina, our distribution, administrative and sales expenses reached Ch$ 165,267 million during the year ended December 31, 2014, a Ch$ 10.056 million, or 6.5% increase compared to Ch$ 155,211 million during the corresponding period in 2013. In local currency the distribution, administrative and sales expenses increased 36.1%, mainly due to (i) the effect of local inflation on labor costs, freight costs and services provided by third parties, (ii) higher distribution costs, which were 36% higher when compared to the previous year; and (iii) higher marketing expenses, which were 54% higher when compared to the previous year. Our distribution, administrative and sales expenses in Argentina represented 35.8% of our net sales in Argentina during the year ended December 31, 2014, compared to 35.2% for the corresponding period in 2013.
Paraguay
In Paraguay, our distribution, administrative and sales expenses reached Ch$29,833 million during the year ended December 31, 2014, a Ch$6,133 million, or 25.9% increase compared to Ch$23,700 million during the corresponding period in 2013. The increase in distribution, administrative and sales expenses in local currency in Paraguay was mainly due to the effect of other operating income which is classified under the item and which were substantially greater in 2013. Isolating this effect, distribution, administrative and sales expenses increased 8% in local currency, which is mainly explained by (i) increased labor costs, which were 15% higher when compared to the previous year and (ii) increased freight distribution charged due to higher tariffs which were 11% higher compared to the previous year. Our distribution, administrative and sales expenses in Paraguay represented 23.0% of our net sales in Paraguay during the year ended December 31, 2014, compared to 21.1% for the corresponding period in 2013.
Other Income (Expense), Net
The following table sets forth our other income (expense), net for the year ended December 31, 2013 and 2014:
|
|
|
Year Ended December 31, |
|
||
|
|
|
2013 |
|
2014 |
|
|
|
|
(in millions of Ch$) |
|
||
|
|
|
|
|
|
|
|
Other income (expense) |
|
(23,287 |
) |
(16,241 |
) |
|
Financial income |
|
4,973 |
|
8,656 |
|
|
Financial costs |
|
(28,944 |
) |
(65,081 |
) |
|
Share of income (losses) from affiliated companies and joint business that are accounted for using the equity method |
|
783 |
|
1,191 |
|
|
Exchange rate differences |
|
(7,695 |
) |
(2,675 |
) |
|
Loss from differences in indexed financial assets and liabilities |
|
(3,881 |
) |
(15,235 |
) |
|
Other income (expense), net |
|
(58,051 |
) |
(89,385 |
) |
We had other expenses, net, of Ch$89,385 million during the year ended December 31, 2014, a Ch$31,334 million, or 54.0% increase compared to Ch$58,051 million during 2013. This increase was mainly influenced by increased financial costs and loss generated on UF conversion, which resulted primarily from increased levels of financial indebtedness (basically due the financing of the acquisition of Ipiranga and other debt restructuring). The financing of the acquisition of Ipiranga consisted of an issuance of US$575 million in Yankee Bonds, which began to accrue interest from October 1, 2013. Additionally in April 2014 a UF 3 million local bond was issued, which add to the issuance of UF 5 million in local bonds issued in August of 2013.
Income Taxes
We had income taxes of Ch$45,354 million during the year ended December 31, 2014, a Ch$22,388 million, or 97.5% increase compared to Ch$22,966 million during 2013. This increase was mainly due to the effects of the tax reform in Chile, which increased the tax income line in Ch$ 23,335 million. On September 29, 2014, Chile enacted the Tax Reform Act. The Tax Reform Act introduced changes to the corporate tax rate, mandating a gradual increase of the rate from 20% to 25% or 27% in certain cases, the rules regarding minimum capitalization, and the taxation of Chilean investments abroad (the controlled-foreign-corporation rules), among others. The new rules are set to come into effect gradually, with the implementation process having commenced on October 1, 2014 and set to be completed by January 1, 2018.
On the other hand the effect of tax reductions in 2013 for Ch$14,055 million of deferred taxes with credit to 2013 income in our subsidiary, Rio de Janeiro Refrescos Ltda. This decrease was mainly due to the reversal of Ch$14,055 million of deferred tax liabilities in the subsidiary, Rio de Janeiro Refrescos Ltda. due to a new repatriation structure of earnings from Brazil, from a scheme based on dividends to a combination of interest returns on inter-company loans and dividends, in which the Company will not have to pay certain local taxes on earnings remitted to Chile, is offset by lower income taxes during 2014, resulting from the Company’s greater financial burden beginning 2014 tax year.
Net Income
Due to the factors described above, we had net income of Ch$52,034 million during the year ended December 31, 2014, a Ch$38,233 million, or 42.4% decrease compared to Ch$90,267 million during 2013. Our net income represented 4.2% of our net sales during the year ended December 31, 2014, compared to 5.9% for 2013.
Summary of Results of Operations for the Year ended December 31, 2012 and the Year ended December 31, 2013
The following tables set forth our sales volume, net sales and gross profit for the year ended December 31, 2012, compared to the year ended December 31, 2013:
|
|
|
Year ended December 31, |
|
||||
|
|
|
2011 |
|
2012 |
|
2013 |
|
|
|
|
(millions of unit cases(1)) |
|
||||
|
Sales volume: |
|
|
|
|
|
|
|
|
Chile |
|
158.0 |
|
185.4 |
|
234.7 |
|
|
Soft drinks |
|
135.1 |
|
149.9 |
|
174.4 |
|
|
Mineral water |
|
10.6 |
|
16.8 |
|
30.0 |
|
|
Juices |
|
12.4 |
|
18.6 |
|
30.3 |
|
|
Beer |
|
— |
|
— |
|
0.1 |
|
|
Brazil |
|
205.1 |
|
225.0 |
|
242.6 |
|
|
Soft drinks |
|
183.5 |
|
197.8 |
|
205.2 |
|
|
Mineral water |
|
4.5 |
|
5.8 |
|
6.2 |
|
|
Juices |
|
13.4 |
|
16.2 |
|
22.9 |
|
|
Beer |
|
3.7 |
|
5.2 |
|
8.4 |
|
|
Argentina |
|
138.4 |
|
167.0 |
|
224.4 |
|
|
Soft drinks |
|
129.6 |
|
153.4 |
|
200.4 |
|
|
Mineral water |
|
6.2 |
|
9.8 |
|
18.0 |
|
|
Juices |
|
2.6 |
|
3.8 |
|
6.0 |
|
|
Paraguay |
|
— |
|
18.8 |
|
61.2 |
|
|
Soft drinks |
|
— |
|
16.5 |
|
53.5 |
|
|
Mineral water |
|
— |
|
1.5 |
|
4.4 |
|
|
Juices |
|
— |
|
0.8 |
|
3.4 |
|
(1) Unit cases refer to 192 ounces of finished beverage product (24 eight-ounce servings) or 5.69 liters
|
|
|
Year ended December 31, |
|
||||||||||
|
|
|
2011 |
|
2012 |
|
2013 |
|
||||||
|
|
|
Ch$
|
|
% of
|
|
Ch$
|
|
% of
|
|
Ch$
|
|
% of
|
|
|
Net sales: |
|
|
|
|
|
|
|
|
|
|
|
|
|
|
Chile |
|
304,948 |
|
31.0 |
|
374,873 |
|
32.0 |
|
477,918 |
|
31.4 |
|
|
Brazil |
|
445,693 |
|
45.4 |
|
451,597 |
|
38.5 |
|
491,861 |
|
32.3 |
|
|
Argentina |
|
232,223 |
|
23.6 |
|
315,336 |
|
26.9 |
|
441,229 |
|
29.0 |
|
|
Paraguay |
|
— |
|
— |
|
32,028 |
|
2.7 |
|
112,254 |
|
7.4 |
|
|
Inter-country eliminations(1) |
|
— |
|
— |
|
(1,541 |
) |
(0.1 |
) |
(1,581 |
) |
(0.1 |
) |
|
Total net sales |
|
982,864 |
|
100.0 |
% |
1,172,293 |
|
100.0 |
% |
1,521,681 |
|
100.0 |
% |
(1) Eliminations represent intercompany sales.
The following table sets forth our results of operations for the year ended December 31, 2012 compared to the year ended December 31, 2013.
|
|
|
Year ended December 31, |
|
||||||||||
|
|
|
2012 |
|
2013 |
|
2013 |
|
||||||
|
|
|
Ch$
|
|
% of net
|
|
Ch$
|
|
% of
|
|
US$
|
|
% of
|
|
|
Net sales |
|
1,172,293 |
|
100.0 |
|
1,521,681 |
|
100.0 |
|
3,071 |
|
100.0 |
|
|
Cost of sales |
|
(698,955 |
) |
(59.6 |
) |
(914,818 |
) |
(60.1 |
) |
(1,846 |
) |
(60.1 |
) |
|
Gross profit |
|
473,338 |
|
40.4 |
|
606,864 |
|
39.9 |
|
1,225 |
|
39.9 |
|
|
Distribution, administrative and sales expenses |
|
(319,174 |
) |
(27.2 |
) |
(435,579 |
) |
(28.6 |
) |
(879 |
) |
(28.6 |
) |
|
Other (expense) income, net(2) |
|
(27,290 |
) |
(2.3 |
) |
(58,051 |
) |
(3.8 |
) |
(118 |
) |
(3.8 |
) |
|
Income taxes |
|
(38,505 |
) |
(3.3 |
) |
(22,966 |
) |
(1.5 |
) |
(46 |
) |
(1.5 |
) |
|
Net income |
|
88,269 |
|
7.5 |
|
90,267 |
|
5.9 |
|
182 |
|
5.9 |
|
(1) Translation of U.S. dollar amounts, solely for the convenience of the reader.
(2) Includes other expenses, other income (expense), financial income, financial costs, share in profit of investees accounted under the equity method, foreign exchange gains (losses) and gains (losses) from indexed financial assets and liabilities.
|
|
|
Chile |
|
Brazil |
|
Argentina |
|
Paraguay |
|
Eliminations |
|
Total |
|
||||||||||||
|
|
|
2012 |
|
2013 |
|
2012 |
|
2013 |
|
2012 |
|
2013 |
|
2012 (1) |
|
2013 |
|
2012 |
|
2013 |
|
2012 |
|
2013 |
|
|
M Ch$ |
|
|
|
|
|
|
|
|
|
|
|
|
|
|
|
|
|
|
|
|
|
|
|
|
|
|
Net sales |
|
374,873 |
|
477,918 |
|
451,597 |
|
491,861 |
|
315,336 |
|
441,229 |
|
32,028 |
|
112,254 |
|
-1,541 |
|
-1,581 |
|
1,172,293 |
|
1,521,681 |
|
|
Cost of sales |
|
-224,024 |
|
-283,988 |
|
-272,890 |
|
-308,359 |
|
-181,924 |
|
-250,551 |
|
-21,658 |
|
-73,500 |
|
1,541 |
|
1,581 |
|
-698,955 |
|
-914,818 |
|
|
Gross profit |
|
150,849 |
|
193,930 |
|
178,707 |
|
183,502 |
|
133,412 |
|
190,678 |
|
10,370 |
|
38,753 |
|
|
|
|
|
473,338 |
|
606,864 |
|
|
Distribution, administrative and selling expenses |
|
-93,164 |
|
-127,311 |
|
-114,060 |
|
-124,383 |
|
-101,321 |
|
-155,211 |
|
-5,750 |
|
-23,700 |
|
|
|
|
|
-314,295 |
|
-430,605 |
|
|
Corporate expenses |
|
|
|
|
|
|
|
|
|
|
|
|
|
|
|
|
|
|
|
|
|
-4,879 |
|
-4,975 |
|
(1) Only 4Q12 figures.
Overview
The merger with Embotelladoras Coca-Cola Polar (“Polar”) took place on October 1, 2012, pursuant to which we increased our ownership interest in Vital, Vital Jugos and ECSA, incorporating them into our consolidated results as of that date, as well as the results of Polar for the fourth quarter of 2012. The Ipiranga acquisition was consummated on October 11, 2013 and their results are included in our consolidated results as of October 1, 2013. For this analysis we define “Organically” as without taking into account the M&A activity associated with the Polar and Ipiranga acquisitions.
Net Sales
We had sales volumes of 763.0 million unit cases during the year ended December 31, 2013, a 28.0% increase compared to 596.2 million unit cases during in 2012. Volumes for soft drinks increased 22.4%, and volumes for juices, beer and waters increased 59.0%, 61.4% and 72.1%, respectively, in each case during the year ended December 31, 2013, compared to 2012. Organically, our sales volume increased 2.0%, which was comprised of a 0.1% increase in soft drinks volume, and increases in juices and waters volumes of 3.4% and 34.9%, respectively, while the beer volume decreased 4.4%. The merger with Polar and the Ipiranga acquisition contributed 51.1 million unit cases in 2012 and 207.0 million unit cases in 2013.
We had net sales of Ch$1,512,681 million during the year ended December 31, 2013, a Ch$349,389 million, or 29.8% increase compared to Ch$1,172,293 million during 2012. Organically, our net sales increased 3.1%, mainly as a result of (i) increased volumes, mainly soft drinks in Argentina and waters in Chile and in Argentina and (ii) increased prices in Brazil and Argentina, and partially offset by (i) a decrease in soft drink volumes in Chile and Brazil and (ii) currency translations into Chilean pesos, resulting from an appreciation of the Chilean peso against the Brazilian real and the Argentine peso.
Soft drinks represented 79% of net sales during the year ended December 31, 2013, compared to 82% during 2012.
Chile
We had sales volumes in Chile of 234.7 million unit cases during the year ended December 31, 2013, a 26.6% increase compared to 185.4 million unit cases during 2012. Volumes for soft drinks in Chile increased 16.3%, and volumes for juices and waters in Chile increased by 62.7% and 78.5%, respectively, in each case during the year ended December 31, 2013, compared to 2012. Excluding the effect of our merger with Polar, sales volume increased 0.3%, mainly as a result of a 33.1% increase in water volumes, partially offset by the decrease of 1.6% in soft drink volumes and 12.4% decrease in juice volumes. The merger with Polar contributed
18.7 million unit cases in 2012 (where we incorporated only the fourth quarter of 2012 into our results) and 67.5 million unit cases in 2013 (where we incorporate full year 2013 results).
Our market share for soft drinks during the year ended December 31, 2013, according to A.C. Nielsen Company, was 67.6% (in terms of volumes), compared to 69.4% for 2012, and 70.0% (in terms of average sales), compared to 72.1% during 2012.
We had net sales in Chile of Ch$477,918 million during the year ended December 31, 2013, a Ch$103,045 million, or 27.5% increase compared to Ch$374,873 million during 2012. Excluding the effect of our merger with Polar, which represented Ch$137,785 million, our net sales in Chile increased 1.3%, mainly as a result of (i) higher revenues per unit case and (ii) the aforementioned increase in volume sold.
We had net sales of soft drinks in Chile of Ch$357,175 million during the year ended December 31, 2013, a Ch$57,502 million, or 19.2% increase compared to Ch$299,673 million during 2012. We had net sales of juices and waters in Chile of Ch$120,472 million during the year ended December 31, 2013, a Ch$45,570 million, or 60.6% increase compared to Ch$74,902 million during 2012.Beer sales in 2013 accounted for Ch$271 million, while in 2012 they reached Ch$298 million.
Brazil
We had sales volumes in Brazil of 242.6 million unit cases during the year ended December 31, 2013, a 7.8% increase compared to 225.0 million unit cases during 2012. Volumes for soft drinks in Brazil increased 3.7%, volumes for waters increased 5.7%, volumes for juices increased 41.6% and volumes for beer increased 59.6% , in each case during the year ended December 31, 2013, compared to 2012. Excluding the effect of our merger with Ipiranga, sales volume decreased 3.6%, mainly as a result of a 4.6% decrease in soft drinks volumes, a 4.3% decrease in mineral water volumes and a 6,2% decrease in beers volume, which were partially offset by an 9.7% increase in juices volumes. The decrease in our soft drinks volumes was mainly due to (i) unfavorable macroeconomic conditions in Brazil; (ii) food inflation above overall inflation, which reduced the purchasing power of our consumers; and (iii) unfavorable weather conditions. The Ipiranga acquisition contributed 25.7 million unit cases in 2013 (where we incorporated only the fourth quarter of 2013 into our results).
Our market share for soft drinks in Brazil during the year ended December 31, 2013, according to A.C. Nielsen Company, was 58.4% (in terms of volumes), compared to 59.1% during 2012, and 66.4% (in terms of average sales), compared to 66.9% during 2012.
We had net sales in Brazil of Ch$491,861 million during the year ended December 31, 2013, a Ch$40,265 million, or 8.9% increase compared to Ch$451,597 million during 2012. Excluding the effect of the Ipiranga acquisition, which represented Ch$49,354 million, our net sales in Brazil decreased 2.0%, mainly as a result of (i) the currency translation into Chilean pesos, resulting from a 7.7% depreciation of the Brazilian real against the Chilean peso, based upon the average exchange rate for the year ended December 31, 2013 compared to 2012; and (ii) decreased volumes, mainly with respect to soft drinks. This decrease was partially offset by higher prices.
We had net sales of soft drinks in Brazil of Ch$359,501 million during the year ended December 31, 2013, a Ch$384 million, or 0.1% increase compared to Ch$359,116 million during 2012. We had net sales of juices, water and beer in Brazil of Ch$132,361 million during the year ended December 31, 2013, a Ch$39,880 million, or 43.1% increase compared to Ch$92.480 million during 2012.
Argentina
We had sales volumes in Argentina of 224.4 million unit cases during the year ended December 31, 2013, a 34.4% increase compared to 167.0 million unit cases during 2012. Volumes for soft drinks in Argentina increased 30.7%, volumes for juices increased 59.2% and volumes of waters increased 83.2%, in each case during the year ended December 31, 2013, compared to 2012. Excluding the effect of our merger with Polar, sales volumes increased 12.1%, comprised of an 8.3% increase in soft drinks volumes, a 39.3% increase in juices
volumes and a 63.1% increase in waters volumes. The merger with Polar contributed with 13.7 million unit cases in 2012 (where we incorporated only the fourth quarter of 2012 into our results) and 52.4 million unit cases in 2013 (where we incorporate full year 2013 results).
Our market share for soft drinks in Argentina during the year ended December 31, 2013, according to A.C. Nielsen Company, was 60.4% (in terms of volumes), compared to 59.2% during 2012, and 66.0% (in terms of average sales) compared to 65.1% during 2012.
We had net sales in Argentina of Ch$441,229 million during the year ended December 31, 2013, a Ch$125,893 million, or 39.9% increase compared to Ch$315,336 million during 2012. Excluding the effect of our merger with Polar, which represented Ch$120,829 million, our net sales in Argentina increased 13.3%, mainly as a result of (i) increased volumes; and (ii) price increases, partially offset by currency translations into Chilean pesos, resulting from a 15.3% depreciation of the Argentine peso against the Chilean peso, based upon the average exchange rate for the year ended December 31, 2013 compared to 2012.
We had net sales of soft drinks in Argentina of Ch$389,768 million during the year ended December 31, 2013, a Ch$108,072 million, or 38.4% increase compared to Ch$281,696 million during 2012. We had net sales of juices and waters in Argentina of Ch$45,346 million during the year ended December 31, 2013, a Ch$21,519 million, or 90.3% increase compared to Ch$23,827 million during 2012.
Paraguay
We had sales volumes in Paraguay of 61.2 million unit cases during the year ended December 31, 2013, a 225.3% increase compared to 18.8 million unit cases during 2012. This increase is because we began the consolidation of Polar figures as of the fourth quarter of 2012, after the consummation of the merger, while in 2013 we consolidated the full year figures.
Our market share for soft drinks in Paraguay during the year ended December 31, 2013, according to Ipsos ASI, was 60.6% in terms of volumes compared to 60.2% during the fourth quarter of 2012 and 69.0% in terms of average sales compared to 69.5% during the fourth quarter of 2012.
We had net sales in Paraguay of Ch$112,254 million during the year ended December 31, 2013, a Ch$80,226 million, or 250.5% increase compared to Ch$32,028 million during 2012. Sales increased mainly because we began to consolidate Polar figures as of the fourth quarter of 2012 after the consummation of the merger in 2012, while in 2013, we consolidated the full year figures.
We had net sales of soft drinks in Paraguay of Ch$93,314 million during the year ended December 31, 2013, a Ch$67,429 million, or 250.8% increase compared to Ch$26,885 million during the fourth quarter of 2012. We had net sales of juices and waters in Paraguay of Ch$17,940 million during the year ended December 31, 2013, a Ch$12,796 million, or 248.8% increase compared to Ch$5,144 million during the fourth quarter of 2012.
Cost of Sales
Our cost of sales was Ch$914,818 million during the year ended December 31, 2013, a Ch$215,863 million, or 30.9% increase, compared to Ch$698,955 million during 2012. The cost of sales per unit case increases 2.3% in the same period. Excluding the effect of the merger with Polar and the Ipiranga acquisition, which represented Ch$262,671 million of our cost of sales in 2013 and Ch$64,203 million in 2012, our cost of sales increased 2.7% compared to 2012. This increase was mainly due to (i) an increase in the percentage of distributed products (juices and waters) in our product mix in Argentina, Brazil and Chile, which have a greater cost per unit case; (ii) an increase in labor costs, mainly in Argentina and Brazil, (iii) the depreciation of the local currencies of Argentina and Brazil relative to the U.S. dollar, which increases our effective cost of raw materials denominated in U.S. dollars; (iv) increased depreciation of capital goods, corresponding to plant and equipment in Argentina and Chile and (iv) higher cost of concentrate in Argentina and Brazil. These effects were partially offset by lower cost of sales in Chile and the depreciation of local currencies, which reduced our costs when
converted into Chilean pesos. Our cost of sales represented 60.1% of net sales for the year ended December 31, 2013, compared to 59.6% for 2012.
Chile
Our cost of sales in Chile was Ch$283,988 million during the year ended December 31, 2013, a Ch$59,963 million, or 26.8% increase compared to Ch$224,025 million during 2012. The cost of sales per unit case increases 0.1% in the same period. Excluding the effect of our merger with Polar, which contributed Ch$88,908 million to our cost of sales during the year ended December 31, 2013, and Ch$25,400 million in 2012, our cost of sales decreased 1.8% compared to 2012. The decrease in our cost of sales, without considering the effect of the incorporation of Polar, was mainly due to (i) reduced costs of supplies, in particular from decreased sugar prices on the international markets, which explains 55% of the decrease of the cost of sales per unit case; (ii) a decrease in our cost of products purchased from third parties, resulting from the commencement of the production of soft drinks in 250 cc and 591 cc PET bottles at our Renca plant, which explains 88% of the decrease of the cost of sales per unit case, and (iii) decreased labor costs resulting from the closing of our Carlos Valdovinos plant, which explains 34% of the decrease of the cost of sales per unit case. The decrease in cost of sales was partially offset, among others by (i) an increased percentage of distributed products (juices and waters) in our product mix, which have a greater cost per unit case; and (ii) increased depreciation charges resulting from the depreciation of the new production lines at our Renca plant. Our cost of sales in Chile represented 59.4% of net sales in Chile for the year ended December 31, 2013, compared to 59.8% for 2012.
Brazil
Our cost of sales in Brazil was Ch$308,360 million during the year ended December 31, 2013, a Ch$35,470 million, or 13.0% increase compared to Ch$272,890 million during 2012. The cost of sales per unit case increased 4.8% in the same period. Excluding the effect of our merger with Ipiranga, which contributed Ch$35,062 million to our cost of sales during the year ended December 31, 2013, our cost of sales increased 0.1% (an increase of 3.9% per unit case) compared to 2012. This increase in Brazil, without considering the acquisition of Ipiranga, was mainly due to (i) an increase in our product mix of distributed products (juices and waters), which have a greater cost per unit case, which explains 68% of the increase of the cost of sales per unit case; (ii) increased costs of concentrate resulting from a reduction of certain tax incentives beginning in October 2012, which explains 23% of the increase of the cost of sales per unit case; (iii) increased labor costs, which explains 12% of the increase of the cost of sales per unit case; and (iv) the depreciation of the Brazilian real against the U.S. dollar, which increases our cost of raw materials denominated in U.S. dollars such as sugar and PET. These effects were partially offset by the currency translation into Chilean pesos, resulting from a 7.7% depreciation of the Brazilian real against the Chilean peso, based upon the average exchange rate for the year ended December 31, 2013 compared to 2012. Our cost of sales in Brazil represented 62.7% of net sales in Brazil for the year ended December 31, 2013, compared to 60.4% for 2012.
Argentina
Our cost of sales in Argentina was Ch$250,551 million during the year ended December 31, 2013, a Ch$68,627 million, or 37.7% increase compared to Ch$181,924 million during 2012. The cost of sales per unit case increased 2.5% in the same period. Excluding the effect of our merger with Polar, which contributed Ch$66,782 million to our cost of sales during the year ended December 31, 2013, and Ch$18,687 million in 2012, our cost of sales increased 12.6% (an increase of 0.4% per unit case) compared to 2012. The increase in our cost of sales per unit case, without considering the effect of the incorporation of Polar, and in local currency was mainly due to: (i) higher costs of concentrate explained by price increases and higher volume sold, which explains 33% of the increase of the cost of sales per unit case; (ii) can increase in the product mix of distributed products, which explains 22% of the increase of the cost of sales per unit case; (iii) higher labor costs, mainly caused by the increase in real wages and increase of headcount as a result of higher volumes, which explains 11% of the increase of the cost of sales per unit case; and (iv) higher depreciation due to recent investments, which explains 8% of the increase of the cost of sales per unit case. All these effects were partially offset by a decrease in the cost of sugar. Our cost of sales in Argentina represented 56.8% of net sales in Argentina for the year ended December 31, 2013, compared to 57.7% for 2012.
Paraguay
Our cost of sales in Paraguay was Ch$73,500 million during the year ended December 31, 2013, a Ch$51,842 million, or 239.4% increase compared to Ch$21,658 million during 2012. Cost of sales increased mainly because in 2012 we began the consolidation of Polar figures as of the fourth quarter of 2012, after the conummation of the merger, while in 2013 we consolidated the full year figures. Our cost of sales in Paraguay represented 65.5% of net sales in Paraguay for the year ended December 31, 2013, compared to 67.6% for 2012.
Gross Profit
Due to the factors described above, we had gross profit of Ch$606,864 million during the year ended December 31, 2013, a Ch$133,526 million, or 28.2% increase compared to Ch$473,338 million during 2012. Our gross profit represented 39.9% of our net sales during the year ended December 31, 2013, while in 2012 represented 40.4% of our net sales. Organically, our gross profit during the year ended December 31, 2013 was $450,893 million, representing 40.9% of our net sales, and a Ch$15,520 million, or 3.6% increase compared to 2012.
Distribution, administrative and sales expenses
We had distribution, administrative and sales expenses of Ch$435,579 million during the year ended December 31, 2013, a Ch$116,405 million, or 36.5% increase compared to Ch$319,174 million during 2012. Excluding the effect of the merger with Polar and the acquisition of Ipiranga,, which represented Ch$118,583 million of our distribution, administrative and sales expenses in 2013, and Ch$27,851 million in 2012, our distribution, administrative and sales expenses increased 8.8% compared to 2012. This increase in distribution, administrative and sales expenses, excluding the effect of the M&A activity, was mainly due to (i) increased distribution costs in Chile and Brazil; (ii) increased labor costs in Argentina, Brazil and Chile; (iii) increased depreciation charges in Brazil and Chile and; (iv) increased marketing expenses in Argentina. Our distribution, administrative and sales expenses represented 28.3% of our net sales during the year ended December 31, 2013, compared to 26.8% for 2012.
Chile
In Chile, we had distribution, administrative and sales expenses of Ch$127,311 million during the year ended December 31, 2013, a Ch$34,147 million, or 36.7% increase compared to Ch$93,164 million during 2012. Excluding the effect of our merger with Polar, which represented Ch$36,397 million of our distribution, administrative and sales expenses in Chile in 2013 and Ch$8,907 million in 2012, our distribution, administrative and sales expenses in Chile increased 7.9% compared to 2012. This increase, excluding the incorporation of Polar, was mainly due to (i) increased labor costs resulting from salary increases, which were 11% higher when compared to the previous year; (ii) higher distribution expenses, which were 14% higher when compared to the previous year and (iii) increased capital goods depreciation charges, which was 63% higher when compared to the previous year. Our distribution, administrative and sales expenses in Chile represented 26.6% of our net sales in Chile during the year ended December 31, 2013, compared to 24.9% for 2012.
Brazil
In Brazil, we had distribution, administrative and sales expenses of Ch$124,383 million during the year ended December 31, 2013, a Ch$10,323 million, or 9.0% increase compared to Ch$114,060 million during 2012. Excluding the effect of the Ipiranga acquisition, which represented Ch$9,048 million of our distribution, administrative and sales expenses in Brazil in 2013, our distribution, administrative and sales expenses in Brazil increased 1.1% compared to 2012. In local currency, this increase was mainly due to (i) increased labor costs resulting from an increase in our sales personnel, as well as increased sales commissions and salaries, which were 18% higher when compared to the previous year; (ii) increased depreciation charges, which were 11% higher when compared to the previous year; and (iii) higher distribution costs, which were 3% higher when compared to the previous year. This increase was partially offset by lower marketing expenses, 15% lower when
compared to the previous year. Our distribution, administrative and sales expenses in Brazil represented 25.3% of our net sales in Brazil during the year ended December 31, 2013, unchanged when compared to 2012.
Argentina
In Argentina, we had distribution, administrative and sales expenses of Ch$155,211 million during the year ended December 31, 2013, a Ch$53,890 million, or 53.2% increase compared to Ch$101,321 million during 2012. Excluding the effect of our merger with Polar, which represented Ch$49,438 million of our distribution, administrative and sales expenses in Argentina in 2013 and Ch$13,195 million in 2012, our distribution, administrative and sales expenses in Argentina were Ch$105,773 million, representing an increase of 20.0% compared to 2012. In local currency, the increase in our distribution, administrative and sales expenses in Argentina, excluding the incorporation of Polar, was mainly due to (i) higher distribution costs, which were 38% higher when compared to the previous year; and (iii) higher marketing expenses, which were 58% higher when compared to the previous year; and (iii) the effect of local inflation on labor costs, freight costs and services provided by third parties. Our distribution, administrative and sales expenses in Argentina represented 35.2% of our net sales in Argentina during the year ended December 31, 2013, compared to 32.1% for 2012.
Paraguay
In Paraguay, we had distribution, administrative and sales expenses of Ch$23,700 million during the year ended December 31, 2013, a Ch$17,959 million, or 312.2% increase compared to Ch$5,750 million during 2012. Distribution, administrative and sales expenses increased mainly because in 2012 we began the consolidation of Polar figures as of the fourth quarter of 2012, after the consummation of the merger, while in 2013 we consolidated the complete year figures. Our distribution, administrative and sales expenses in Paraguay represented 21.1% of our net sales in Paraguay during the year ended December 31, 2013, compared to 18.0% for 2012.
Other Income (Expense), Net
The following table sets forth our other income (expense), net for the year ended December 31, 2012 and 2013:
|
|
|
Year Ended December 31, |
|
||
|
|
|
2012 |
|
2013 |
|
|
|
|
(in millions of Ch$) |
|
||
|
|
|
|
|
|
|
|
Other income (expense) |
|
(14,490 |
) |
(23,287 |
) |
|
Financial income |
|
2,728 |
|
4,973 |
|
|
Financial costs |
|
(11,173 |
) |
(28,944 |
) |
|
Share of income (losses) from affiliated companies and joint business that are accounted for using the equity method |
|
1,770 |
|
783 |
|
|
Exchange rate differences |
|
(4,471 |
) |
(7,695 |
) |
|
Profit from unit of adjustment |
|
(1,754 |
) |
(3,881 |
) |
|
Other income (expense), net |
|
(27,390 |
) |
(58,051 |
) |
We had other expenses, net, of Ch$58,051 million during the year ended December 31, 2013, a Ch$30,661, or 112% increase compared to Ch$27,390 million during 2012. In addition to the effects of our merger with Polar and acquisition of Ipiranga, this increase was also influenced by (i) increased financial costs and profit from unit of adjustment, which resulted primarily from increased levels of financial indebtedness (in part due to our merger with Polar and the financing of the acquisition of Ipiranga); (ii) write-offs of property, plant & equipment in Brazil resulting from the discontinuation of the 1.25 liter returnable glass bottle format, as part of our product shift towards returnable plastic bottles; (iii) restructuring of the distribution process in Chile that implied additional expenses; (iv) decreased financial income, which resulted primarily from a decrease in financial investments compared to the prior period and; (v) we had losses of Ch$7,695 million as a result of the translation of accounts payable from U.S. dollars to the functional currency of each operation, and also of the translation into Chilean pesos of certain accounts receivable denominated in Argentine pesos and Brazilian reais, compared to losses of Ch$4,471 million during 2012.
Income Taxes
We had income taxes of Ch$22,966 million during the year ended December 31, 2013, a Ch$15,539 million, or 40.4% decrease compared to Ch$38,505 million during 2012. This decrease was mainly due to the reversal of Ch$14,055million of deferred taxes with credit to 2013 income in our subsidiary, Rio de Janeiro Refrescos Ltda. This decrease was mainly due to the reversal of Ch$14,055 million of deferred tax liabilities in the subsidiary, Rio de Janeiro Refrescos Ltda. due to a new repatriation structure of earnings from Brazil, from a scheme based on dividends to a combination of interest returns on inter-company loans and dividends, in which the Company will not have to pay certain local taxes on earnings remitted to Chile.
Net Income
Due to the factors described above, we had net income of Ch$90,267 million during the year ended December 31, 2013, a Ch$1,998 million, or 2.3% increase compared to Ch$88,269 million during 2012. Our net income represented 5.9% of our net sales during the year ended December 31, 2013, compared to 7.5% for 2012.
Basis of Presentation
The aforementioned discussion should be read in conjunction with and is qualified in its entirety by reference to the Consolidated Financial Statements, including the notes thereto.
These Financial Statements have been prepared in accordance with IFRS issued by the IASB.
These Financial Statements reflect the consolidated financial position of Embotelladora Andina. S.A. and its subsidiaries as of December 31, 2014 and 2013 as well as the operating results, changes in shareholders’ equity and cash flows for the years ended December 31, 2014 and 2013, all of which were approved by the board of directors on April 28, 2015.
Our consolidated financial results include the results of our subsidiaries located in Chile, Brazil, Argentina and Paraguay. Our subsidiaries outside Chile prepare their financial statements in accordance with IFRS and to comply with local regulations in accordance with generally accepted accounting principles of the country in which they operate. The Consolidated Financial Statements reflect the results of the subsidiaries outside of Chile, translated to Chilean pesos (functional and reporting currency of the parent company) and are presented in accordance with IFRS. The International Financial Reporting Standards requires assets and liabilities to be translated from the functional currency of each entity to the reporting currency (Chilean peso) at end of period exchange rates and income and expense accounts to be translated at the average monthly exchange rate for the month in which income or expense is recognized
Factors Affecting Comparability
During 2014, there were no changes in the application of IFRS compared to the previous year that could materially affect the comparability of the financial statements.
On October 11, 2013, Andina Brazil consummated its acquisition of Ipiranga in an all-cash transaction. We began consolidating the results of operations of Ipiranga into our consolidated financial statements as of October 1, 2013.
Critical Accounting Estimates
Discussion of critical accounting estimates
In the ordinary course of business, we have made a number of estimates and assumptions relating to the reporting of our results of operations and financial position in the preparation of financial statements in conformity with IFRS. We cannot assure you that actual results will not differ from those estimates. We believe that the following discussion addresses our most critical accounting policies, which are those that are most
important to the portrayal of our financial condition and results of operations and require management’s most difficult, subjective and complex judgments, often as a result of the need to make estimates and assumptions about the effect of matters that are inherently uncertain. For a more detailed discussion of accounting policies significant to our operations, please see Note 2 to our Consolidated Financial Statements.
Impairment of goodwill and intangible assets of indefinite useful life
We test if goodwill and intangible assets of indefinite useful life have suffered impairment loss on an annual basis or whenever there are indicators of impairment. The recoverable amounts of cash generating units are determined based on calculations of the value in use. The key variables that management calculates include the volume of sales, prices, marketing expenses and other economic factors. The estimation of these variables requires a material administrative judgment as those variables imply inherent uncertainties. However, the assumptions are consistent with our internal planning. Therefore, management evaluates and updates estimates according to the conditions affecting the variables. If these assets are deemed to have become impaired, they will be written off at their estimated fair value or future recovery value according to discounted cash flows. Refer to note 15.3 of the consolidated Financial Statements for additional information related to key assumptions and the results of our 2014 annual impairment assessments.
Fair value of assets and liabilities
IFRS requires, in certain cases, that assets and liabilities be recorded at their fair value. Fair value is the amount at which an asset can be purchased or sold or the amount at which a liability can be incurred or liquidated in an actual transaction among parties duly informed under conditions of mutual independence, different from a forced liquidation.
The basis for measuring assets and liabilities at fair value are the current prices in the active market. Lacking such an active market, we estimate said values based on the best information available, including the use of models or other valuation techniques.
We estimated the fair value of the intangible assets acquired as a result of mergers and acquisitions based on the multiple period excess earning method, which implies the estimation of future cash flows generated by the intangible asset, adjusted by cash flows that do not come from the intangible asset, but from other assets. For this, we estimated the time during which the intangible asset will generate cash flows, the cash flows themselves, cash flows from other assets and a discount rate.
Other assets acquired and implicit liabilities in the business combination are carried at fair value using valuation methods that are considered appropriate under the circumstances including the cost of depreciated recovery and recent transaction values for comparable assets, among others. These methodologies require certain inputs to be estimated, including the estimation of future cash flows.
Provision for doubtful accounts
We evaluate the possibility of collecting trade accounts receivable using several factors. When we become aware of a specific inability of a customer to fulfill its financial commitments, a specific provision for doubtful accounts is estimated and recorded, which reduces the recognized receivable to the amount that we estimate will ultimately be collected. In addition to specifically identifying potential uncollectible customer accounts, debits for doubtful accounts are accounted for based on the recent history of prior losses and a general assessment of trade accounts receivable, both outstanding and past due, among other factors.
Useful life, residual value and impairment of property, plant, and equipment
Property, plant, and equipment are recorded at cost and depreciated using the straight-line method over the estimated useful life of those assets. Changes in circumstances, such as technological advances, changes to our business model, or changes in our capital strategy might modify the effective useful lives compared to our estimates. Whenever we determine that the useful life of property, plant and equipment might be shortened, it depreciates the
excess between the net book value and the estimated recoverable amount according to the revised remaining useful life. Factors such as changes in the planned use of manufacturing equipment, dispensers, and transportation equipment or computer software could make the useful lives of assets shorter. We review the impairment of long-lived assets each time events or changes in circumstances indicate that the book value of any of those assets might not be recovered. The estimate of future cash flows is based, among other things, on certain assumptions about the expected operating profits in the future. Our estimates of non-discounted cash flows may differ from real cash flows because of, among other reasons, technological changes, economic conditions, changes in the business model, or changes in the operating profit. If the sum of non-discounted cash flows that have been projected (excluding interest) is less than the carrying value of the asset, the asset will be written down to its estimated fair value.
Liabilities for bottle and case collateral
We have a liability for deposits received for bottles and cases provided to our customers and distributors. The liability represents the deposit value that we may be required to remit upon receipt from the customer or distributor of the bottles and cases, in good condition, along with the original invoice. The liability is not subject to price level restatements as per current agreements with customers and distributors. We estimate the liability for deposits based on a periodic inventory of bottles sold to customers and distributors, estimates of bottles in circulation and a weighted average historical deposit value per bottle or case. Significant management judgment is involved in estimating the number of bottles in circulation, the deposit value that could be subject to redemption and the timing of disbursements related to this liability.
Impact of Foreign Currency Fluctuations
In accordance with IFRS conversion methods, assets and liabilities from Argentina, Paraguay and Brazil are converted from their functional currency (Argentine peso, Paraguayan guaraní and Brazilian real respectively) to the reporting currency of the parent company (Chilean peso) at the end of period exchange rate, and income accounts at the exchange rate as of the date of the transaction or monthly average exchange rate of the month when it took place. The effects of translation are presented as comprehensive income and do not affect the results for the years ended December 31, 2014, 2013 and 2012. The translation effects due to the currency conversion undertaken for assets and liabilities in accordance with the method previously explained resulted in an increase of other comprehensive income of Ch$28,150 during 2014 (net decrease of Ch$17,297 million during 2013 and net decrease of Ch$35,983 million during 2012). We also present under other comprehensive income the net effect as result of the restatement of Chilean pesos to U.S. dollars and other currencies to U.S. dollars resulting from the update of intercompany accounts that have designated as part of the Company’s investment, this effect resulted in an increase of Ch$92 million during 2014 (decrease of Ch$975 million during 2013 and an decrease of Ch$5,113 million during 2012).
In order to protect us from the effects on income resulting from the volatility of the Brazilian real and the Chilean peso against the U.S. dollar, we maintain derivative contracts (cross currency swaps) derivative to cover almost 100% of U.S. dollar-denominated financial liabilities.
By designating such contracts as hedging derivatives, the effects on income for variations in the Chilean peso and the Brazilian real against the U.S. dollar, are mitigated annulling its exposure to exchange rate.
In Chile, we use hedge agreements, to protect against foreign currency risk, which has an impact on our dollar denominated raw materials needs. The mark to market of these contracts was recorded in 2014 and 2013 according to the hedge accounting methodology outlined in IFRS standards, i.e., the valuation at fair value is carried to equity accounts, and when the effect on results of the hedged item occurs, the effects of derivatives contracts, are recycled from equity to operating results. For further information about the instruments we use to protect against foreign currency risk, see “Item 11. Quantitative and Qualitative Disclosures about Market Risk—Foreign Currency Risk.”
Impact of Governmental Policies
Our business is dependent upon the economic conditions prevailing in our countries of operation. Various governmental economic, fiscal, monetary and political policies, such as those related to inflation or foreign
exchange, may affect these economic conditions, and in turn may impact our business. These government policies may also affect investments by our shareholders.
For a discussion of political factors and governmental, economic, fiscal and monetary policies that could materially affect investments by U.S. shareholders as well as our operations, please refer to “Item 3. Key Information—Risk Factors” and “Item 10. Additional Information”
B. LIQUIDITY AND CAPITAL RESOURCES
Capital Resources, Treasury and Funding Policies
The products we sell are usually paid for in cash and short term credit, and therefore our main source of financing comes from the cash flow of our operations. This cash flow has been generally sufficient to cover the investments necessary for the normal course of our business, as well as the distribution of dividends approved at our General Shareholders’ Meeting. Nevertheless, in 2013 was necessary to issue international bonds to finance the acquisition of the 100% stake of Ipiranga in Brazil for R$1,155 million (equivalent to Ch$261,245 million). Our net cash position diminished after the merger with Polar and the Ipiranga acquisition in part because Polar and Ipiranga used to have more debt when compared to Andina’s balance sheet. Should additional funding be required for future geographic expansion or other needs, the main sources of financing to consider are: (i) debt offerings in the Chilean and foreign capital markets (ii) borrowings from commercial banks, both internationally and in the local markets where we have operations; and; (iii) public equity offerings.
Certain restrictions could exist to transfer funds among our operating subsidiaries. In 2012, 2013 and 2014, all cash flow generated by the subsidiary in Argentina was reinvested in the operation, and we did not receive dividends from our subsidiary in Argentina. During 2012, 2013 and 2014, we received dividends from our subsidiaries in Brazil and Paraguay. No assurance can be made that we will not face restrictions in the future regarding the distribution of dividends from our foreign subsidiaries.
Our management believes that we have access to financial resources to maintain our current operations and provide for our current capital expenditure and working capital requirements, scheduled debt payments, interest and income tax payments and dividends to shareholders. The amount and frequency of future dividends to our shareholders will be determined at the General Shareholders’ Meeting upon the proposal of our board of directors in light of our earnings and financial condition at such time, and we cannot assure you that dividends will be declared in the future.
Our board of directors has been empowered by our shareholders to define our financing and investment policies. Our bylaws do not define a strict financing structure, nor do they limit the types of investments we may make. Traditionally, we have preferred to use our own resources to finance our investments.
Our general financing policy is that each subsidiary should finance its own operations. From this perspective, each subsidiary’s management must focus on cash generation and should establish clear targets for operating income, capital expenditures and levels of working capital. These targets are reviewed on a monthly basis to ensure that their objectives are met. Should additional financing needs arise, either as a result of a cash deficit or to take advantage of market opportunities, our general policy is to prefer local financing to allow for natural hedging. If local financing conditions were not acceptable, because of costs or other constraints, Andina will provide financing, or our subsidiary could finance itself in a currency different than the local one.
Our cash surplus policy is that Andina invests any cash surplus in a portfolio of investment grade securities until such time as our board of directors makes a final decision as to the disposition of the surplus.
Derivative instruments are utilized only for business purposes, and never for speculative purposes. Forward currency contracts are used in some operations to cover the risk of local currency devaluation relative to the U.S. dollar in an amount not greater than the budgeted purchases of U.S. dollar-denominated raw materials. Depending on market conditions, instead of forward currency contracts, from time to time we prefer to utilize our cash surplus to purchase raw materials in advance to obtain better prices and a fixed exchange rate.
Cash Flows from Operating Activities 2014 vs Cash Flows from Operating Activities 2013
Cash flows from operating activities during 2014 amounted to Ch$215,514 million compared to Ch$172,085 million in 2013. The increase in cash flow generation was mainly due to higher client collections, resulting from the integration of Ipiranga for the whole year, partially offset by higher interest payments due to greater indebtedness entered into by the Company . Cash flows from operating activities without considering the merger with Ipiranga amounted to Ch$183,805 million.
Cash Flows from Operating Activities 2013 vs Cash Flows from Operating Activities 2012
Cash flows from operating activities during 2013 amounted to Ch$172,085 million compared to Ch$188,857 million in 2012. The decrease in cash flow generation was mainly due to higher interest payments and greater indebtedness entered into by the Company primarily due to the acquisition of Polar and Ipiranga . Cash flows from operating activities without considering the merger with Ipiranga amounted to Ch$169,361 million.
Cash Flows from Investing Activities 2014 vs Cash Flows from Investing Activities 2013
Cash flows for investing activities (includes purchase and sale of: property, plant and equipment; investment in associated companies; and financial investments) amounted to Ch$166,776 million in 2014 compared to Ch$447,550 million during 2013. In 2013 the Ipiranga acquisition represented a disbursement in the amount of Ch$261,245 million. The investment activities of Andina during 2013, without considering the effect of the acquisition of Ipiranga and the disbursements associated with its purchase, amounted to Ch$191.852 million.
The main item of investing activities is the purchase of property, plant and equipment which decreased from Ch$183,697 million in 2013 to Ch$114,217 million in 2014. In 2014, and without considering the effect of the merger with Ipiranga, Andina invested Ch$109,513 million. This figure is highly influenced by greater purchases of property, plant and equipment in Brazil and Paraguay, and by purchases of financial instruments which are not defined as cash and cash equivalents.
Cash Flows from Investing Activities 2013 vs Cash Flows from Investing Activities 2012
Cash flows for investing activities (includes purchase and sale of: property, plant and equipment; investment in associated companies; and financial investments) amounted to Ch$447,550 million in 2013 compared to Ch$156,170 million during 2012. The Ipiranga acquisition represented a disbursement in the amount of Ch$261,245 million. The investment activities of Andina during 2013, without considering the effect of the acquisition of Ipiranga and the disbursements associated with its purchase, amounted to Ch$191.852 million.
The main item of investing activities is the purchase of property, plant and equipment which increased from Ch$143,764 million in 2012 to Ch$183,697 million in 2013. In 2013, and without considering the effect of the merger with Ipiranga, Andina invested Ch$180,133 million. This figure is highly influenced by greater purchases of property, plant and equipment in Brazil and Paraguay, and by purchases of financial instruments which are not defined as cash and cash equivalents.
Cash Flows from Financing Activities 2014 vs Cash Flows from Financing Activities 2013
Our financing activities are directly related to dividend distributions to our shareholders, that record a utilization of cash resources amounting to Ch$52,269 million compared to Ch$73,041 million during 2013, and borrowings from banks and payment of these loans, in order to finance these dividend payments and investments. As a result of our business’ seasonality, we generate greater cash flows during the summer months (December
through March); therefore, during the winter season we may require short term financing in order to fulfill our dividend and investment commitments.
As of December 31, 2014, we had available short-term credit lines in an amount equivalent to Ch$320,113 million. The aggregate unused portion of such lines of credit at that date was equivalent to Ch$204,594 million. Our unused sources of liquidity include eight lines of credit. In Chile, we had the equivalent of Ch$16,738 million in credit available from five separate lines. The unused portion of such lines of credit at that date was equivalent to Ch$16,532 million. In Brazil, we had the equivalent of Ch$197,376 million in credit available with twenty one lines. The unused portion of such lines of credit at that date was equivalent to Ch$101,145 million. In Argentina, we had the equivalent of Ch$87,979 million in credit available with ten lines. The unused portion of such lines of credit at that date was equivalent to Ch$68,896 million. In Paraguay, we had the equivalent of Ch$18,020 million in credit available with two lines. The unused portion of such lines of credit at that date was equivalent to Ch$18,020 million.
Cash Flows from Financing Activities 2013 vs Cash Flows from Financing Activities 2012
Our financing activities are directly related to dividend distributions to our shareholders, that record a utilization of cash resources amounting to Ch$73,041 million compared to Ch$69,766 million during 2012, and borrowings from banks and payment of these loans, in order to finance these dividend payments and investments. As a result of our business’ seasonality, we generate greater cash flows during the summer months (December through March); therefore, during the winter season we may require short term financing in order to fulfill our dividend and investment commitments.
As of December 31, 2013, we had available short-term credit lines in an amount equivalent to Ch$279,196 million. The aggregate unused portion of such lines of credit at that date was equivalent to Ch$134,803 million. Our unused sources of liquidity include five lines of credit. In Chile, we had the equivalent of Ch$17,500 million in credit available from five separate lines. The unused portion of such lines of credit at that date was equivalent to Ch$15,591 million. In Brazil, we had the equivalent of Ch$179,333 million in credit available with seven lines. The unused portion of such lines of credit at that date was equivalent to Ch$72,286 million. In Argentina, we had the equivalent of Ch$58,756 million in credit available with ten lines. The unused portion of such lines of credit at that date was equivalent to Ch$23,319 million. In Paraguay, we had the equivalent of Ch$23,607 million in credit available with two lines. The unused portion of such lines of credit at that date was equivalent to Ch$23,607 million.
Liabilities
For the year ended 2014, our total liabilities, excluding non-controlling interest, were Ch$1,350,176 million; representing a 12.4% increase compared to December 31, 2013. The increase in total liabilities resulted principally from the Issuance of public liabilities in the amount of UF 3 million on the local market (Ch$70,855 million) and the increase of deferred taxes caused by the tax reform in Chile whose effect on increase in liabilities was Ch$23,335 million. As of December 31, 2014, our noncurrent liabilities included (i) other noncurrent financial liabilities of Ch$726,616 million, (ii) noncurrent accounts payable of Ch$1,216 million (iii) other noncurrent provisions of Ch$77,447 million, (iv) deferred tax liabilities for Ch$126,126 million; (v) noncurrent employee benefit provisions for Ch$8,125 million; and (vi) other noncurrent non-financial liabilities for Ch$432 million, totaling noncurrent liabilities for Ch$939,963 million during the year ended December 31, 2014 compared to Ch$799,385 million during the year ended December 31, 2013.
For the year ended, 2014, our current liabilities included (i) other current financial liabilities of Ch$83,402 million; (ii) commercial accounts and other accounts payable for Ch$228,179 million; (iii) current accounts payable to related entities for Ch$55,967 million; (iv) other current provisions for Ch$366 million; (v) current tax liabilities for Ch$2,931 million and (vi) other non-financial current liabilities for Ch$39,367 million. Total current liabilities during the year ended December 31, 2014 amounted to Ch$410,212 million compared to Ch$402,144 million during the year ended December 31, 2013.
As of December 31, 2014, and before the cross currency swaps contracts the company entered in, our bond liabilities had a weighted average interest rate of 4.66% while our bank liabilities had a weighted average interest rate of 8.47%.
Summary of Significant Debt Instruments
Summary of Significant Debt Instruments
As of December 31, 2014, the Company is in compliance with all its debt covenants which are summarized below:
Series B Local Bonds
In 2001, we issued in the Chilean capital markets UF 3.7 million Series B bonds due 2026, bearing interest at a variable annual interest rate of 6.50% over inflation. The Series B Local Bonds are subject to the following restrictive covenants:
· The ratio of our consolidated financial liabilities to our consolidated shareholders’ equity (including noncontrolling interest) must not exceed 1.2 to 1.0. For this purpose, “consolidated financial liabilities” includes interest accruing current liabilities, which includes obligations with banks and financial institutions.
· The ratio of our consolidated assets free of any pledge, mortgage or other encumbrances to our unsecured consolidated liabilities must be at least 1.3 to 1.0.
· We must maintain, and not sell, assign or transfer to a third party, the geographical area currently denominated as the “Metropolitan Region” (Región Metropolitana) as a territory in Chile in which we have been authorized by The Coca-Cola Company for the production, sale and distribution of Coca-Cola products and brands.
· We must maintain, and not sell, assign or transfer to a third party any other territory of Argentina or Brazil in which we are currently authorized by The Coca-Cola Company for the production, sale and distribution of Coca-Cola products and brands, where any such territories represent more than 40% of our adjusted consolidated operating cash flow.
Series A and C Local Bonds
As a consequence of our merger with Polar, we became an obligor under the following two bonds issued by Polar in the Chilean capital markets in 2010:
· UF 1.0 million of Series A bonds due 2017, bearing interest at a variable annual rate equal to 3.00%; and
· UF 1.5 million of Series C bonds due 2031, bearing interest at a variable annual rate equal to 4.00 %
The Series A and C local bonds are subject to the following restrictions:
· The ratio of our net financial debt (i.e., our financial debt minus our cash) to our total equity (i.e., equity attributable to controlling owners and to noncontrolling interests) may not exceed 1.5 to 1.0.
· The ratio of our consolidated assets free of any pledge, mortgage or other encumbrances to our unsecured consolidated liabilities must be at least 1.3 to 1.0.
· The ratio of our EBITDA for the last 12 months to our net financial expenses (i.e., financial income less financial expenses) for the last 12 months must be greater than 3.0 to 1.0. This requirement will have been breached if such ratio is not met for two consecutive quarters.
Series C and D Local Bonds
On September 4, 2013, we issued in the Chilean capital markets UF 4,000,000 aggregate principal amount (equivalent to Ch$92,199.40 million, as of September 5, 2013) of UF 3.80% bonds due 2034 and UF 1,000,000 aggregate principal amount (equivalent to Ch$23,049.85 million, as of September 5, 2013) of UF 3.50% bonds due 2020. The bonds are non-convertible and are not guaranteed. The proceeds from these local bonds were used to pay down existing indebtedness and for other general corporate purposes.
The Series C and D local bonds are subject to the following restrictions:
· The ratio of our net consolidated financial liabilities to our consolidated shareholders’ equity (including noncontrolling interest) must not exceed 1.2 to 1.0. For this purpose, “net consolidated financial liabilities” includes interest accruing current liabilities, which includes obligations with banks and financial institutions, and is determined net of cash and cash equivalents.
· The ratio of our consolidated assets free of any pledge, mortgage or other encumbrances to our unsecured consolidated liabilities must be at least 1.3 to 1.0.
· We must maintain, and not sell, assign or transfer to a third party, the geographical area currently denominated as the “Metropolitan Region” (Región Metropolitana) as a territory in Chile in which we have been authorized by The Coca-Cola Company for the production, sale and distribution of Coca-Cola products and brands.
· We must maintain, and not sell, assign or transfer to a third party any other territory of Argentina or Brazil in which we are currently authorized by The Coca-Cola Company for the production, sale and distribution of Coca-Cola products and brands, where any such territories represent more than 40% of our adjusted consolidated operating cash flow.
Series E Local Bonds
On April 3, 2014, we issued added capital in the amount of UF 3,000,000 in the Chilean capital markets (equivalent to Ch$70,855 million, on April 3, 2014) in UF bonds at 3.75% maturing in 2035. The funds from these local bond funds were used to pay off existing debts existing and for other general corporate purposes.
Series C and D Local Bonds are subject to the following restrictions:
· The ratio of our net consolidated financial liabilities to our consolidated equity (including non-controlling interests) should not exceed 1.2 to 1.0. For this purpose, “net consolidated financial liabilities” includes current liability interest which include bank and financial institution liabilities and are deemed net of cash and cash equivalents.
· The ratio our consolidated assets free of any pledge, mortgage or other encumbrances to our consolidated liabilities that are not guaranteed must be at least 1.30 to 1.0.
· We must keep and not sell, assign or transfer to a third party the geographical area currently referred to as the “Región Metropolitana” (Metroplitan Region) as a territory in Chile in which we have been authorized by The Coca-Cola Company to produce, sell and distribute Coca-Cola brands and products.
We must keep and not sell, assign, or transfer to third parties any other territory of the Republic of Argentina or Brazil in which we are currently authorized by The Coca-Cola Company to produce, sell and distribute Coca-Cola products and brands, where any such territory represents more than 40% of our consolidated adjusted operating cash flow
Senior Notes due 2023 in Connection with Acquisition of Ipiranga
In October 2013, we issued US$575 million of 5.000% Senior Notes due 2023. The notes will mature on October 1, 2023. The notes are unsecured obligations that are effectively subordinated to our secured debt. The proceeds from these notes were used to finance a portion of the purchase price for our acquisition of Ipiranga and for general corporate purposes.
Repurchased Notes due 2027 and 2097
In October 1997, we issued US$100 million of 7.625% Notes due 2027 and US$100 million of 7.875% Notes due 2097. Through a series of repurchases between 2000 and 2009, we have repurchased and currently hold, all of these notes through our wholly-owned subsidiary Abisa Corp. On December 15, 2014, Embotelladora Andina S.A. rescued US$200 million in outstanding bonds from its subsidiary Abisa Corp S.A., thus since legally debtor and creditor are joined in a single entity, the mentioned bond liability becomes extinguished.
C. RESEARCH AND DEVELOPMENT, PATENTS AND LICENSES
Given the nature of the business and the support provided by The Coca-Cola Company as franchisor to its bottlers, the Company’s research and development expenses are not meaningful.
D. TREND INFORMATION
Our results will likely continue to be influenced by changes in the level of consumer demand in the countries in which we operate, resulting from governmental economic measures that are or may be implemented in the future. Additionally, principal raw materials used in the production of soft drinks, such as sugar and resin, may experience price increases in the future. Such price increases may affect our results if we are unable to pass the cost increases on to the sales price of our products due to depressed consumer demand and/or heightened competition.
Increased competition from low-price brands is another factor that could limit our ability to grow, and thus negatively affect our results.
Finally, exchange rate fluctuations, in particular the potential devaluations relative to the U.S. dollar of local currencies in the countries in which we operate, may adversely affect our results because of the impact on the cost of U.S. dollar-denominated raw materials and the conversion of monetary assets.
E. OFF-BALANCE SHEET ARRANGEMENTS
At December 31, 2014, we did not have any material off-balance sheet arrangements.
F. CONTRACTUAL OBLIGATIONS
The following table sets forth our principal contractual and commercial obligations as of December 31, 2014:
|
|
|
Payments Due by Period |
|
||||||||
|
|
|
Less than 1
|
|
1-3 Years |
|
3-5 Years |
|
More than 5
|
|
Total |
|
|
|
|
(in millions of Ch$ ) |
|
||||||||
|
|
|
|
|
|
|
|
|
|
|
|
|
|
Debt with financial institutions |
|
44,876 |
|
47,242 |
|
9,310 |
|
— |
|
101,428 |
|
|
Bonds(1) |
|
41,747 |
|
89,047 |
|
81,737 |
|
779,404 |
|
991,935 |
|
|
Operating lease obligations |
|
8,331 |
|
2,899 |
|
2,550 |
|
— |
|
13,780 |
|
|
Purchase obligations |
|
194,472 |
|
52,858 |
|
21,519 |
|
92,360 |
|
361,209 |
|
|
Total |
|
289,426 |
|
192,046 |
|
115,116 |
|
871,764 |
|
1,468,352 |
|
(1) See Note 16 to our consolidated financial statements as of December 31, 2014 and for the year ended December 31, 2013 and 2014 for additional information.
The following table presents future expirations for additional long-term liabilities. These expirations have been estimated based on accounting estimates because the liabilities do not have specific dates of future payment, as allowance for severance indemnities, contingencies, and liabilities are included.
|
|
|
Maturity Years |
|
||||||
|
|
|
1-3 Years |
|
3-5 Years |
|
More than 5
|
|
Total |
|
|
|
|
(in millions of Ch$ 2014) |
|
||||||
|
Provisions |
|
2,689 |
|
32,306 |
|
42,452 |
|
77,447 |
|
|
Other long-term liabilities |
|
1,918 |
|
1,486 |
|
6,370 |
|
9,774 |
|
|
Total long-term liabilities |
|
4,607 |
|
33,792 |
|
48,822 |
|
87,221 |
|
G. SAFE HARBOR
See “Presentation of Financial and Certain Other Information—Forward-Looking Statements.”
ITEM 6. DIRECTORS, SENIOR MANAGEMENT AND EMPLOYEES
A. DIRECTORS AND SENIOR MANAGEMENT
Pursuant to Chilean law, we are managed by a group of executive officers under the supervision of our board of directors. The Company’s operations in Chile, Brazil, Argentina and Paraguay report to the Corporate Office.
Principal Officers
The following table includes information regarding our senior executives:
|
Name |
|
Age |
|
Position |
|
Miguel Ángel Peirano |
|
56 |
|
Chief Executive Officer |
|
Cristián Mandiola |
|
57 |
|
Chief Operations South Officer |
|
Andrés Wainer |
|
44 |
|
Chief Financial Officer |
|
Rodrigo Ormaechea |
|
39 |
|
Chief Strategic Planning Officer |
|
Jaime Cohen |
|
47 |
|
Chief Legal Officer |
|
German Garib |
|
53 |
|
Chief Process and Information Officer |
|
Alan Dunford |
|
58 |
|
Chief Human Resourcers Officer |
|
|
|
|
|
|
|
Fabián Castelli |
|
49 |
|
General Manager of Embotelladora del Atlántico S.A. |
|
Renato Barbosa |
|
55 |
|
General Manager of Rio de Janeiro Refrescos Ltda. |
|
José Luis Solorzano |
|
44 |
|
General Manager of Chilean Soft Drink Operation. |
|
Francisco Sanfurgo |
|
60 |
|
General Manager of Paraguay Refrescos S.A. |
Mr. Peirano joined us in 2011, as Chief Executive Officer. Prior to his appointment in Andina, he was president at FEMSA Cerveza Brazil from 2009 through 2011. While at Coca-Cola FEMSA he held several positions: vice-president from 2006-2008; director of operations in Argentina from 2003 through 2005; commercial director during 2002; manufacturing director in 2000 and strategic planning director in 1999. He also worked as Assistant manager at McKinsey & Company in 1999.
Mr. Mandiola joined us after the merger with Embotelladoras Coca-Cola Polar assuming the position of Chief Operations South Officer. In 1996, he joined Embotelladoras Coca-Cola Polar S.A. and was responsible for planning, organizing, strategic direction and company results as Chile General Manager (1996-1998), Chile and Argentina General Manager (1998-2002), Chile, Argentina and Paraguay Executive Vice-President from August 2002 until the merger with Andina.
Mr. Wainer joined us in 1996 as a research analyst in the corporate office. In 2000, he was appointed development manager in EDASA and in 2001, he returned to the corporate office as research and development officer. In 2006, he was appointed finance and administration manager at the Chilean operation and in November 2010, he returns to the corporate office as Chief Financial Officer.
Mr. Ormaechea joined us in 2011 as Chief Strategic Planning Officer. Prior to joining Andina, he held the position of projects manager at Virtus Partners, strategic consultant at Bain & Co. in London, executive director at Uruguay Junior Achievement (NGO), relationship manager Corporate Banking and M&A at ABN AMRO Bank Uruguay and risk analyst at ABN AMRO Bank Brazil and Uruguay.
Mr. Cohen joined us in 2008, as chief legal officer. Prior to joining Andina, he held a similar position at Socovesa S.A. from 2004. He formed part of the legal division of Citibank from 2000 to 2004. He also was an attorney at the law offices of Cruzat, Ortuzar & Mackenna, Baker & McKenzie from 1996 until 1999. He began his professional career in 1993 as lawyer at Banco de A. Edwards.
Mr. Garib joined us in 1998, as chief information officer. Prior to Andina, he was the marketing manager of IBM Chile.
Mr. Dunford* joined us after the merger with Embotelladoras Coca-Cola Polar, assuming the position of Corporate Project Manager. As of January 4, 2013, he assumed as chief human resources officer replacing
Mr. Castelli joined us in 1994, holding the position of Traditional Sales Manager in Mendoza. He is currently General Manager (since April 2014) of Andina Argentina. Previously, he was Andina Argentina Commercial Manager (2010). Marketing Manager from 2000-2010, Commercial Planning Manager from 1997 to 2000, Marketing Services Manager between 1996 and 1997, Sales Manager Traditional Mendoza in 1994-1995.
Mr. Barbosa joined us on January 1, 2012 as general manager of our operation in Brazil. He has worked in the Coca-Cola System for 23 years, primarily as general manager of Brasal, a Coca-Cola bottling company servicing the western central part of Brazil. He also has worked for other large companies such as McDonald’s and Banco do Brasil.
Mr. Solorzano joined us in 2003, where he served in various managerial positions in the commercial area, passing through the management of key accounts sales, traditional channel sales management, and management of marketing and commercial areas. In March of 2010, he has served as general manager of Andina’s Argentine operations. On April 1, 2014 assumed as General Manager of Andina Chile. Prior to his arrival at Andina, he worked as marketing manager, plant manager and business manager of Coca-Cola Polar, for five years. Before his introduction to the Coca-Cola bottler system, he worked at Malloa.
Mr. Sansfurgo joined us after the merger with Embotelladoras Coca-Cola Polar assuming the position of general manager of Paraguay Refrescos S.A. In 1990, he joined Embotelladoras Coca-Cola Polar S.A. as general manager of Embotelladora Austral (Punta Arenas — Chile). Since 2005 has been general manager of Paraguay Refrescos S.A.
* Mr. Dunford left his position on December 31, 2014 and has been replaced as Chief Human Resources Officer by Mr. Gonzalo Muñoz.
Board of Directors
In accordance with our current bylaws, the board of directors must consist of fourteen directors. The directors may or may not be shareholders and are elected for a term of three years subject to indefinite re-election. All members of the board of directors are nominated and elected every three years by and during the ordinary annual shareholders’ meeting. Cumulative voting is permitted for the election of directors.
In the event of a vacancy, the board of directors may appoint a replacement to fill the vacancy, and the entire board of directors must be elected or re-elected at the next regularly scheduled shareholders’ meeting.
The majority shareholders’ agreement for the election of directors is contained in the Agreement and further explained on Item 7 “Major Shareholders and Related Companies”. In addition, pursuant to the terms and conditions of the deposit agreement among the Company and the Bank of New York dated as of December 14, 2000, (the “Deposit Agreement”), if no instructions are received by The Bank of New York Mellon, as depositary (the “Depositary”), it shall give a discretionary proxy to a person designated by the chairman of our board of directors with respect to the shares or other deposited securities that represent the ADRs.
As of December 31, 2014, our board of directors consisted of the following directors:
|
Name |
|
Age |
|
Position |
|
Juan Claro |
|
64 |
|
Chairman of the Board of Directors |
|
Eduardo Chadwick |
|
56 |
|
Director |
|
José Antonio Garcés, Jr. |
|
49 |
|
Director |
|
Arturo Majlis |
|
53 |
|
Director |
|
Gonzalo Said(1) |
|
50 |
|
Vice Chairman of the Board of Directors |
|
Salvador Said(1) |
|
50 |
|
Director |
|
Francisco Javier Crespo |
|
49 |
|
Director |
|
Gonzalo Parot(2) |
|
62 |
|
Director |
|
Emilio Rodriguez Larraín |
|
63 |
|
Director |
|
José de Gregorio |
|
55 |
|
Director |
|
Juan Andrés Fontaine |
|
60 |
|
Director |
|
Franz Alscher |
|
51 |
|
Director |
|
Ricardo Vontobel |
|
55 |
|
Director |
|
Mariano Rossi |
|
49 |
|
Director |
(1) Salvador Said is the cousin of Gonzalo Said.
(2) Independent from controlling shareholder pursuant to Article 50 bis, paragraph 6 of the Chilean Public Company Law N° 18,046.
Mr. Claro has been a member of our board of directors since April 2004. His principal occupation is as an entrepreneur. He also serves as a director in the following organizations: Chairman of Embotelladora Andina, Energía Covanco and Energía Llaima; director of Entel, Antofagasta Minerals, Antofagasta Plc, Pesquera Friosur, Melon S.A and Agrosuper.
Mr. Chadwick has been a member of our board of directors since June 2012. His principal occupation is as an entrepreneur. He also serves as a director in the following organizations:Viña Errazuriz, Empresas Penta, MaltexcoS.A., Ebema, Vinos de Chile and Banco Penta.
Mr. Majlis has been a member of our board of directors since April 1997. His principal occupation is as a principal partner of the law offices of Grasty, Quintana, Majlis y Compañía. He also serves as a director in the following organizations: Asesorías e Inversiones Til Til S.A.; Asesorias e Inversiones MJS Ltda., Banchile Seguros de Vida, Seguros Orion, Mathiesen Group, Laboratotio Maver, Fundación Convivir, Fundación Puerto de Ideas and Orion Seguros Generales.
Mr. Garcés has been a member of our board of directors since April 1992. His principal occupation is as general manager of Inversiones San Andrés Ltda. He also serves as director in the following organizations: Banco Consorcio, Banvida S.A.; Inmobiliaria FFV S.A., Fundación Paternitas, Viña Montes, Viña Garcés Silva Ltda., and Chairman of USEC.
Mr. Gonzalo Said has been a member of our board of directors since April 1993. He also serves as director in the following organizations: Banco BBVA, Director Newport Ltda. (Grupo Said Handal), Member of the “Circle
of Finance” of ICARE, and participates in the Board of Universidad Finnis Terrae and is the Chairman of Fundación Generación Empresarial
Mr. Salvador Said has been a member of our board of directors since April 1992. His principal occupation is as director of Said Holding Group. He also serves as director in the following organizations: Chairman of Endeavor Chile and of Bupa Chile S.A. Board member of Parque Arauco S.A., Edelpa S.A., BBVA Chile and Envases CMF S.A. Counselor in CEP (Centro de Estudios Públicos) and in Generación Empresarial.
Mr. Crespo has been member of our board of directors since April 2013. His principal occupation is as President of Coca Cola Mexico.
Mr. Parot has been a member of our board of directors since April 2009. His principal occupation is as an engineer and economist. He is principal partner and CEO at Elex Consulting Group. He also serves as director in Inmobiliaria Elex.
Mr. Rodriguez has been member of our board of directors since April 2013. His principal occupation is as attorney at law. He also serves as director in the following organizations: Lan Peru, Inmuebles Comerciales del peru S.A., Inmuebles Panamericana S.A., La Positiva Sanitas EPS S.A., Soriperu S.A., Inversiones en Salud S.A., Automotores Gildemeister del Peru S.A., Maquinaria Nacional Perú S.A. Motormundi S.A., Prospectiva 2020 Perú,
Mr. de Gregorio has been a member of our board of directors since June 2012. His principal occupation are Professor of Economics at Universidad de Chile and non-resident Senior Fellow at the Petersen Institute for International Economics. He also serves as director in the following corporations: Compañía Sudamericana de Vapores; Intervial S.A., Euroamerica S.A. and Ruta del Maipo S.A.
Mr. Fontaine has been a member of our board of directors since June 2012. His principal occupation is as a consultant. He also serves as director in the following organizations: Bolsa de Comercio de Santiago (Santiago Stock Exchange), Administradora de Inversiones La Construcción S.A., Sigdo Koppers. Advisor of Libertad y Desarrollo.
Mr. Alscher has been a member of our board of directors since June 2012. His principal occupation is as Vice President of Finance for Latin America, The Coca-Cola Company. He does not serve as director in any other organizations.
Mr. Vontobel has been a member of our board of directors since June 2012. His principal occupation is as General Manager of Vonpar S.A. He also serves as director in Vonpar S.A.
Mr. Rossi has been a member of our board of directors since June 2012. His principal occupation is as a consultant. He does not serve as director in any other organizations.
B. COMPENSATION
Compensation of Principal Officers
The Company does not provide general incentives other than its compensation plans, except in the case of its principal officers, whose compensation plans are composed of a fixed remuneration and a performance bonus, which try to adapt to the reality and competitive conditions in each market, and whose amounts vary according to the position or exercised responsibility. Such performance bonuses are payable only to the extent that personal goals of each principal officer and company goals are met, which are previously defined for each case in particular.
For the period ended December 31, 2014 the amount of fixed compensations paid to Coca-Cola Andina’s principal officers amounted to ThCh$3,859 (ThCh$3,057 in 2013). Likewise, the amount of compensation paid in performance bonuses amounted to ThCh$2,468 (ThCh$2,107 in 2013).
During the period ended December 31, 2014 severance payments to managers and principal officers of Embotelladora Andina S.A. reached Ch$327 million. There were not severance payments to former managers or former principal officers for the period ended December 31, 2013.
We do not make available to the public information as to the compensation of our executive officers on an individual basis, as disclosure of such information is not required under Chilean law.
Compensation of Directors
Directors receive an annual fee for attendance to meetings of the board of directors and committees. The amounts paid to each director for attendance at board meetings varies in accordance with the position held and the period of time during which such position is held. Total compensation paid to each director or alternate director during 2014, which was approved by our shareholders, was as follows:
|
|
|
Directors’ |
|
Executive |
|
Directors’ and Audit |
|
|
|
|
|
|
Compensation |
|
Committee |
|
Committee |
|
Total |
|
|
2014 |
|
ThCh$ |
|
ThCh$ |
|
ThCh$ |
|
ThCh$ |
|
|
|
|
|
|
|
|
|
|
|
|
|
Juan Claro Gonzalez |
|
144,000 |
|
— |
|
— |
|
144,000 |
|
|
Arturo Majlis Albala |
|
72,000 |
|
72,000 |
|
24,000 |
|
168,000 |
|
|
Gonzalo Said Handal |
|
72,000 |
|
72,000 |
|
— |
|
144,000 |
|
|
Jose Antonio Garces Silva, Jr |
|
72,000 |
|
72,000 |
|
— |
|
144,000 |
|
|
Salvador Said Somavia |
|
72,000 |
|
72,000 |
|
24,000 |
|
168,000 |
|
|
Eduardo Chadwick Claro |
|
72,000 |
|
72,000 |
|
— |
|
144,000 |
|
|
Gonzalo Parot Palma (Ind) |
|
72,000 |
|
— |
|
24,000 |
|
96,000 |
|
|
Francisco Crespo |
|
72,000 |
|
— |
|
— |
|
72,000 |
|
|
Cesar Emilio Rodriguez Larrain Salinas (Ind.) |
|
72,000 |
|
— |
|
— |
|
72,000 |
|
|
José Fernando De Gregorio Rebeco |
|
72,000 |
|
— |
|
— |
|
72,000 |
|
|
Juan Andrés Fontaine Talavera |
|
72,000 |
|
— |
|
— |
|
72,000 |
|
|
Franz Alscher |
|
72,000 |
|
— |
|
— |
|
72,000 |
|
|
Ricardo Vontobel |
|
72,000 |
|
— |
|
— |
|
72,000 |
|
|
Mariano Rossi |
|
72,000 |
|
— |
|
— |
|
72,000 |
|
|
|
|
|
|
|
|
|
|
|
|
|
Total |
|
1,080,000 |
|
360,000 |
|
72,000 |
|
1,512,000 |
|
For the year that ended on December 31, 2013, the aggregate amount of compensation we paid to all directors and executive officers as a group was Ch$7,839 million of which Ch$6,327 million was paid to our executive officers. We do not disclose to our shareholders or otherwise make available to the public information as to the compensation of our executive officers on an individual basis. We do not maintain any pension or retirement programs for our directors or executive officers. See “—Employees.”
C. BOARD PRACTICES
Our board of directors has regularly scheduled meetings at least once a month, and extraordinary meetings are convened when called by the chairman or when requested by one or more directors. The quorum for a meeting of the board of directors is established by the presence of an absolute majority of its directors. Directors serve terms of 3 years and are elected. Resolutions are passed by the affirmative vote of an absolute majority of those directors present at the meeting, with the chairman determining the outcome of any tie vote.
Benefits upon Termination of Employment
There are no contracts providing for benefits to Directors upon termination of employment.
Executive Committee
Our board of directors is counseled by an Executive Committee that proposes Company policies and is currently comprised by the following Directors: Mr. Eduardo Chadwick Claro, Mr. Arturo Majlis Albala, Mr. José Antonio Garcés Silva (junior), Mr. Gonzalo Said Handal, and Mr. Salvador Said Somavía, who were elected during ordinary Board Session N°1,086 held on April 30, 2013. It is also comprised by the Chairman of the Board, Mr. Juan Claro González and by our chief executive officer who participate by their own rights. This committee meets permanently throughout the year and normally holds one or two monthly sessions.
Directors’ Committee
Pursuant to Article 50 bis of Chilean Company Law N°18,046 and in accordance to the dispositions of Circular N°1956 and Circular N°560 of the Chilean Superintendence of Securities and Insurance, a new Directors’ Committee was elected during Board Session N°1086 dated April 30, 2013, applying the same election criteria set forth by Circular N°1956. Mr. Gonzalo Parot Palma (as Committee Chairman and as Independent Director), Mr. Arturo Majlis Albala and Mr. Salvador Said Somavía comprise the Committee.
The duties performed by this Committee during 2014, following the same categorization of faculties and responsibilities established by Article 50 bis of Company Law N°18,046 of the Chilean Superintendence of Securities and Insurance, were the following:
· Examined the reports of external auditors, of the balance sheets and other financial statements, presented by the administrators of the Company to the shareholders, and to take a position on such reports before they are presented to shareholders for their approval.
· Proposed External Auditors and Private Rating Agencies, accordingly to the Board of Directors were proposed to the Shareholders’ Meeting.
· Examined information regarding the operations referred to by Title XVI of Law N°18,046 and report on these operations. For detailed information regarding these operations, please refer to the Notes of the Consolidated Financial Statements included in this annual report.
· Examine the salary systems and compensation plans of managers, principal officers and employees.
· Report to the Board of Directors whether it is convenient or not to hire an external auditing Company to render services that do not form part of the external audit, when they are not forbidden in accordance to article 242 of Chilean Law N°18,045, in that the nature of those services may generate a risk of loss of independence.
· Reviewed and approved the Company’s 20F and verified management compliance with Rule 404 of the Sarbanes Oxley Act (Rule 404 states that management must evaluate Company internal controls on a yearly basis).
· Approved Directors’ Committee budget.
· Supervised the implementation of the Crime Prevention Model (Law N° 20,393) and prepared and approved a new Ethics Code and Business Conduct for the Company .
· Model (Law N° 20,393) and prepared and approved a new Ethics Code and Business Conduct for the Company
· Reviewed periodic reports prepared by the Company’s area of Internal Audit.
· Reviewed claims and complaints received through the Company’s whistleblower hotline, and monitored their investigation.
During 2014, the Directors’ Committee incurred in expenses for Ch$29.2 million.
Sarbanes-Oxley Audit Committee
In accordance with NYSE and SEC requirements regarding compliance with the Sarbanes-Oxley Act, the board of directors established the first Audit Committee on July 26, 2005. The members of the Audit Committee are designated by the Board, and serve until such member’s successor is duly designated or until such member’s earlier resignation or removal. Any member of the Audit Committee may be removed, with or without cause, by a majority vote of the Board. During Board Session N°1086 dated April 30, 2013, Mr. Gonzalo Parot Palma, Mr. Arturo Majlis Albala, and Mr. Salvador Said Somavía were elected as members of our Audit Committee. It was determined that Mr. Gonzalo Parot Palma complied with the independence standards set forth in the Sarbanes-Oxley Act, SEC and NYSE regulations. Also, Mr. Parot has been appointed by the Board of Directors as the financial expert in accordance with the definitions of the listing standards of the NYSE and the Sarbanes-Oxley Act.
The resolutions, agreements and organization of the Audit Committee are governed by the rules relating to Board Meetings and to the Company’s Directors’ Committee. Since its creation, the sessions of the Audit
Committee have been held with the Directors’ Committee, since some of the functions are very similar and the members of both of these Committees are the same.
The Audit Committee Charter that is available on our website: www.koandina.com, defines the duties and responsibilities of this Committee. The Audit Committee is responsible for analyzing the Company’s financial statements; supporting the financial supervision and rendering of accounts; ensuring management’s development of reliable internal controls; ensuring compliance by the audit department and external auditors of their respective roles; and reviewing auditing practices.
For the period ended December 31, 2014, the Audit Committee did not incur any expenses.
Ethics Committee ,
The Ethics Committee was established during the Board of Directors session held January 28, 2014. This Committee is composed by three directors, who are appointed by the Board of Directors and will occupy their posts until their successors are elected, or until resignation or dismissal. The current members of the Ethics Committee are the directors Mr. José Antonio Garcés Silva, Mr. Juan Claro González and Mr. José de Gregorio Rebeco.
D. EMPLOYEES
Overview
On December 31, 2014, we had 15,428 employees, including 3,102 in Chile, 7,560 in Brazil, and 3,288 in Argentina and 1,478 in Paraguay. Of these employees, 417 were temporary employees in Chile, 20 were temporary employees in Brazil, 473 were temporary employees in Argentina and 100 were temporary employees in Paraguay. During the South American summer, it is customary for us to increase the number of employees in order to meet peak demand.
On December 31, 2014, 1,500; 612; 2,270 and 332 of our employees in Chile, Brazil, Argentina and Paraguay, respectively, were members of unions.
The following table represents a breakdown of our employees for the years ended December 31, 2013, and 2014:
|
|
|
2013 |
|
||||||||||||||||||||||
|
|
|
Chile |
|
Brazil |
|
Argentina |
|
Paraguay |
|
||||||||||||||||
|
|
|
Total |
|
Union |
|
Non-
|
|
Total |
|
Union |
|
Non-
|
|
Total |
|
Union |
|
Non-
|
|
Total |
|
Union |
|
Non-
|
|
|
Executives |
|
80 |
|
— |
|
80 |
|
67 |
|
1 |
|
66 |
|
110 |
|
— |
|
110 |
|
22 |
|
— |
|
22 |
|
|
Technicians and professionals |
|
1,204 |
|
472 |
|
732 |
|
4,698 |
|
289 |
|
4,409 |
|
669 |
|
12 |
|
657 |
|
229 |
|
9 |
|
220 |
|
|
Workers |
|
1,878 |
|
1,281 |
|
597 |
|
2,522 |
|
40 |
|
2,482 |
|
2,031 |
|
1,821 |
|
210 |
|
1,106 |
|
292 |
|
814 |
|
|
Temporary Workers |
|
508 |
|
320 |
|
188 |
|
760 |
|
— |
|
760 |
|
600 |
|
577 |
|
23 |
|
114 |
|
— |
|
114 |
|
|
Total |
|
3,670 |
|
2,073 |
|
1,597 |
|
8,047 |
|
330 |
|
7,717 |
|
3,410 |
|
2,410 |
|
1.000 |
|
1,471 |
|
301 |
|
1,170 |
|
|
|
|
2014 |
|
||||||||||||||||||||||
|
|
|
Chile |
|
Brazil |
|
Argentina |
|
Paraguay |
|
||||||||||||||||
|
|
|
Total |
|
Union |
|
Non-
|
|
Total |
|
Union |
|
Non-
|
|
Total |
|
Union |
|
Non-
|
|
Total |
|
Union |
|
Non-
|
|
|
Executives |
|
69 |
|
— |
|
69 |
|
60 |
|
— |
|
60 |
|
107 |
|
— |
|
107 |
|
29 |
|
— |
|
29 |
|
|
Technicians and professionals |
|
1,008 |
|
388 |
|
620 |
|
5,278 |
|
599 |
|
4,679 |
|
687 |
|
10 |
|
677 |
|
246 |
|
24 |
|
222 |
|
|
Workers |
|
1,608 |
|
1,112 |
|
496 |
|
2,202 |
|
13 |
|
2,189 |
|
2,021 |
|
1,801 |
|
220 |
|
1,103 |
|
308 |
|
795 |
|
|
Temporary Workers |
|
417 |
|
— |
|
417 |
|
20 |
|
— |
|
20 |
|
473 |
|
459 |
|
14 |
|
100 |
|
— |
|
100 |
|
|
Total |
|
3,102 |
|
1,500 |
|
1,602 |
|
7,560 |
|
612 |
|
6,948 |
|
3,288 |
|
2,270 |
|
1,018 |
|
1,478 |
|
332 |
|
1,146 |
|
Management believes that is has good relations with its employees.
Chile
In Chile, we continue to make provisions for severance indemnities in accordance with our collective bargaining agreements and labor legislations, in the amount of one month ’ s salary for every year of employment subject to certain restrictions. In addition, we complement our employees ’ contribution to our health insurance system, thus decreasing health costs for the employees ’ families. Employees are required to contribute funds for financing pension funds, which are mainly managed by private entities.
In Chile, 55.9% of employees with indefinite work contracts are members of labor unions. The following collective bargaining agreements are in effect as of December 31, 2014 in the city of Santiago: (i) with Labor Union N° 1, that mainly represents workers from the bottling area, from December 1, 2012 to December 30, 2015; (ii) with Labor Union N°2, that mainly represents personel from the areas of management, logistics and operations specialists from June 1, 2011 to June 1, 2015; (iii) with Labor Union N°3 that mainly represents sales force employees from May 1, 2014 to April 30, 2018; (iv) Collective contract with Workers Union N°3 of new salesforce from June 1, 2013 to May 31, 2016; (v) Agreement with sales force negotiating group in force since June 1, 2013 through May 31, 2016; (vi) Collective Contract with Labor Union TAR, that represents workers from the distribution area from July 1, 2012 to June 30, 2016; and collective agreement with the picking area workers from the Venecia, Renca and Carlos Valdovinos branches, from March 1 st 2011, to February 28, 2015 and (vii) collective contract with a group of workers in the area of operations of the new plant Renca, effective as from October 1, 2011, until June 30, 2015.
The agreements in force as of December 31, 2014 in Coquimbo are: (viii) Workers Union N°1 Agreement, formed mainly by workers from the production area, in force since March 1, 2013 through February 28, 2016; (ix) National Workers Union N°1 Agreement, which represents a part of the Administrative Employees and salesman, in force since January 1, 2014 through November 30, 2016; (x) Collective Agreement formed mainly by Administrative Employees which is in force since September 1, 2013 through August 31, 2016; (xi)Transportation Collective Agreement, in force since May 1, 2014 through October 31, 2016. The collective agreements in force as of December 31, 2014 in Antofagasta (xii) Collective agreement with Workers Union N°1 formed mainly by workers form the production area, in force since May 1 2014 through April 30, 2017; (xiii) Collective agreement with Workers Union N°2, form by personnel from different areas, in force since November 27, 2013 through November 30, 2016; (xiv) collective agreement with the salesmen negotiating group, in force since December 1, 2013 through November 30, 2016; (xv) Collective agreement with transportation workers from the base zone, in force since May 4, 2014 through May 4, 2017, and (xvi) Collective agreement with transportation workers from Calama, in force since October 1, 2013 through September 30, 2016. Finally, the collective agreements in force as of December 31, 2014 in Punta Arenas are: (xvii) Collective agreement with the workers union, which mainly represents workers from the Production Area, in force since August 1, 2013, through July 31, 2016; (xviii) Collective Agreement with InterAreas personnel, in force since February 1, 2014 through December 31, 2016, and (xix) Collective agreement with Transportation workers, in force since December 1, 2013 through November 30, 2016.
Brazil
In Brazil, 8.1%of employees are members of labor unions. Collective bargaining agreements are negotiated on an industry-wide basis, although companies can negotiate special terms for their affiliates that apply to all employees in each jurisdiction where companies have a plant. Collective bargaining agreements are generally binding for one year.
With respect to Andina Brazil, there are fifteen collective bargaining agreements currently in force. Seven agreements for employees in the State of Rio de Janeiro; (i) the Soft Drink Industry Employees’ Union agreement from July 1, 2014 to June 30, 2015; (ii) the Sales Force Union agreement from May 1, 2014 to April 30, 2015; (iii) the “Stack Machine” Operator Union agreement from May 1, 2014 to April 30, 2015; (iv) the Driver and Helper of the Lagos Region Union agreement from May 1, 2014 through April 30, 2015; (v) Collective bargaining agreement executed with the Drivers and Nova Iguaçu Helpers effective from May 1, 2014 until April 30, 2015, (vi) Collective bargaining agreement executed with Drivers and São Gonçalo helpers effective form May 1, 2014 until April 30, 2015; and (vii) Agreement with the Drivers and Helpers Workers’ Union of the city of Rio de Janeiro in force since May 1, 2014 through April 30, 2015.
Three agreements for employees in the State of Espírito Santo: (i) the Nourishment Union agreement from July 1, 2014 to June 30, 2015; (ii) the Sales Force Union agreement from May 1, 2014 to April 30, 2015; and (iii) Agreement with the Drivers and Helpers Workers’ Union of the State of Espirito Santo in force since May 1, 2014 through April 30, 2015.
Five agreements with employees from the State of São Paulo: (i) Workers Union for the Beverage Industry of Ribeirão Preto since October 1, 2014 through September 1, 2015; (ii) Agreement with the Trade Workers Union for the region of Araraquara and Franca since October 1, 2014 through September 1, 2015; (iii) agreement with the Transportation Workers Union for the regions of Ribeirão Preto, Franca, Araraquara and São João da Boa Vista since July 1, 2014 through June 30, 2015; (iv) Agreement with the Salesmen Union of the State of São Paulo since July 1, 2014 through June 30, 2015; and (v) Agreement with the Security Technicians Union for the region of Ribeirão Preto, Franca, Araraquara and Mococa since May 1, 2014 through April 30, 2015.
These agreements do not require us to increase wages on a collective basis. Selected increases were granted, however, mainly in the manufacturing area. We provide benefits to our employees according to the relevant legislation and to the collective bargaining agreements. Andina Brazil experienced its most recent work stoppages in December 2014, for three days organized by the drivers of internal buses.
Argentina
In Argentina, 69% of EDASA’s employees are parties to collective bargaining agreements and are represented by local workers’ unions associated with a national federation of unions. The Argentine Chamber of Non-Alcoholic Beverages of the Argentine Republic ( Cámara Argentina de Industria de Bebidas sin Alcohol de la República Argentina (the “Chamber”) and the Argentine Workers Federation of Carbonated Water ( Federación Argentina de Trabajadores de Aguas Gaseosas) (the “Federation”) are parties to a collective bargaining agreement that began July 29, 2008. On December 12, 2013, the Chamber and the Federation entered into a new collective bargaining agreement establishing new salaries, new non salary benefits and a new complementary regulation on company contributions.
Argentine law requires severance payments upon dismissal without cause in an amount at least equal to an average of one-month’s wages for each year of employment or a fraction thereof if employed longer than three months. Severance payments are subject to maximum and minimum amounts fixed by legislations and jurisprudence of the Justice Supreme Court of Argentina.
Beginning in 2009, private pension funds were eliminated and all employee contributions are to the government social security system. Most of the health system in the Argentine territory is run by the unions through contributions from union and non-union employees.
Paraguay
In Paraguay, 22.5% of PARESA’s employees are members of labor unions. Collective bargaining agreements are negotiated with the company (Coca-Cola Paresa Paraguay). Unions can negotiate special terms for their members, which are applicable to all employees. Collective bargaining agreements generally have a two year term of duration.
Collective bargaining agreements that are currently in force are: (1) Collective bargaining agreement executed with Sindicato Autentico de Trabajadores de Paraguay Refrescos effective from June 16, 2013 to June 15, 2015; and (2) Sindicato de Empleados de Paraguay Refrescos effective from May 3, 2014 to November 3, 2015.
E. SHARE OWNERSHIP
The following table sets forth the amount and percentage of our shares beneficially owned by our directors, members of the Directors’ Committee and senior executives as of December 31, 2014.
|
|
|
Series A |
|
Series B |
|
||||||||||||||||||||
|
|
|
Beneficial
|
|
%
|
|
Direct
|
|
%
|
|
Indirect
|
|
%
|
|
Beneficial
|
|
%
|
|
Direct
|
|
%
|
|
Indirect
|
|
%
|
|
|
Shareholder |
|
|
|
|
|
|
|
|
|
|
|
|
|
|
|
|
|
|
|
|
|
|
|
|
|
|
José Antonio Garcés Silva (junior) |
|
— |
|
— |
|
— |
|
— |
|
52,987,375 |
|
11.19 |
|
— |
|
— |
|
— |
|
— |
|
25,728,183 |
|
5.43 |
|
|
Arturo Majlis Albala |
|
— |
|
— |
|
— |
|
— |
|
2,150 |
|
0.0006 |
|
— |
|
— |
|
5,220 |
|
0.0014 |
|
— |
|
— |
|
|
Salvador Said Somavía |
|
— |
|
— |
|
— |
|
— |
|
52,987,375 |
|
11.19 |
|
— |
|
— |
|
— |
|
— |
|
49,700,463 |
|
10.50 |
|
|
Gonzalo Said Handal |
|
— |
|
— |
|
— |
|
— |
|
52,987,375 |
|
11.19 |
|
11,761,462 |
|
3.094 |
|
— |
|
— |
|
37,914,463 |
|
8.018 |
|
|
Eduardo Chadwick Claro |
|
|
|
|
|
|
|
|
|
52,987,375 |
|
11.19 |
|
|
|
|
|
|
|
|
|
52,989,382 |
|
11.19 |
|
ITEM 7. MAJOR SHAREHOLDERS AND RELATED PARTY TRANSACTIONS
A. MAJOR SHAREHOLDERS
The following table sets forth certain information concerning beneficial ownership of our capital stock with respect to the principal shareholders known to us who maintain at least a 5% beneficial ownership in our shares and with respect to all of our directors and executive officers as a group as of December 31, 2013:
|
|
|
Series A |
|
Series B |
|
||||
|
Shareholder |
|
Shares |
|
% Class |
|
Shares |
|
% Class |
|
|
Controlling shareholders(1) |
|
263,524,909 |
|
55.68 |
|
207.258.566 |
|
43.79 |
|
|
The Bank of New York Mellon(2) |
|
9.269.364 |
|
1.96 |
|
50.710.236 |
|
10.71 |
|
|
The Coca-Cola Company, directly or through subsidiaries |
|
69,348,241 |
|
14.65 |
|
69,348,241 |
|
14.65 |
|
|
AFPs as a group (Chilean pension funds) |
|
18.680.443 |
|
3.95 |
|
5.221.342 |
|
1.10 |
|
|
Principal foreign funds as a group |
|
9.269.364 |
|
1.96 |
|
50.710.236 |
|
10.71 |
|
|
Executive officers as a group |
|
0 |
|
0 |
|
0 |
|
0 |
|
|
Directors as a group(3) |
|
211,955,684 |
|
44.78 |
|
166,339,861 |
|
35.14 |
|
(1) Our controlling shareholders are comprised by: Inversiones SH Seis Limitada, Inversiones Cabildo SpA, Inversiones El Olivillo Limitada, Inversiones Nueva Delta S.A., Inversiones Alerce Limitada, Inversiones Nueva Delta Dos S.A., Inversiones Las Gaviotas Dos Limitada, Inversiones Playa Negra Dos Limitada, Inversiones Don Alfonso Dos Limitada, today known as Don Alfonso Limitada, Inversiones El Campanario Dos Limitada, today known as Inversiones El Campanario Limitada, Inversiones Los Robles Dos Limitada, today known as Inversiones Los Robles Limitada and Inversiones Las Viñas Dos Limitada, today known as Inversiones Las Niñas Dos SpA.; the estate of Jaime Said Demaría; José Said Saffie; José Antonio Garcés Silva and Alberto Hurtado Fuenzalida.
(2) Acting as Depositary for ADRs.
(3) Represents shares held directly and indirectly by Mr. Gonzalo Said Handal, Mr. José Antonio Garcés Silva (junior), Mr. Salvador Said Somavía, Mr. Eduardo Chadwick Claro and Mr. Arturo Majlis Albala.
Our controlling shareholders act pursuant to a shareholders’ agreement that establishes that our controlling group will jointly control us in order to assure most of the votes at shareholders’ meetings and board sessions. Our controlling shareholders pass resolutions with the approval of at least four of the five parties, except with respect to the following matters, which require a unanimous decision:
· the carrying out of new business activities different from our current line of business (unless related to “ready to drink products” or Coca Cola products);
· the amendment of the number of our directors;
· issuances of new shares;
· spin-offs or mergers;
· capital increases (subject to certain indebtedness thresholds); and
· the joint acquisition of our Series A shares
In connection with The Coca-Cola Company’s investment in us, The Coca-Cola Company and our c ontrolling s hareholders entered into a Shareholders’ Agreement dated September 5, 1996, as amended (the “ Amended and Restated Shareholders Agreement or Shareholders’ Agreement”-incorporated as Exhibit to the Form 20-F), providing for certain restrictions on the transfer of shares of our capital stock by the Coca-Cola Shareholders and ourc ontrolling s hareholders. Specifically, our c ontrolling s hareholders are restricted from transferring its Series A shares without the prior authorization of The Coca-Cola Company . The Shareholders’ Agreement also provides for certain corporate governance matters, including the right of the Coca-Cola shareholders to elect two members of our board of directors so long as The Coca-Cola Company and its subsidiaries collectively own, in aggregate, certain percentage of the Series A shares. In addition, in related agreements, our c ontrolling s hareholders granted The Coca-Cola Company an option, exercisable upon the occurrence of certain changes in the beneficial ownership of the Controlling Group, to acquire 100% of the Series A shares held by our c ontrolling shareholders at a price and in accordance with procedures established in such agreements .
B. RELATED PARTY TRANSACTIONS
In the ordinary course of our business, we engage in a variety of transactions with certain of our affiliates and related parties. Financial information concerning these transactions is set forth in Note 12.3 to our Consolidated Financial Statements and were carried out under the following conditions: (i) they were previously approved by the Company’s Board of Directors, with the abstainment of the director involved in the corresponding case; (ii) the purpose of these transactions was to contribute to the Company’s interest; and (iii) they were consistent to the prevailing market price, terms and conditions at the time of their approval. Our Directors’ Committee is charged with evaluating transactions with related parties and to report on these transactions to the full board of directors. See “Item 6. Directors, Senior Management and Employees—Directors’ Committee.”
Our management believes, to the best of its knowledge, it has complied, in all material respects with the Chilean Public Company law regarding to the transactions with related parties in full force and effect at December 31, 2014. There can be no assurance, however, that these regulations will not be modified in the future.
C. INTERESTS OF EXPERTS AND COUNSEL
Not applicable.
A. CONSOLIDATED STATEMENTS AND OTHER FINANCIAL INFORMATION
See “Item 18. —Financial Statements” for our Consolidated Financial Statements filed as part of this annual report.
Contingencies
We are party to certain legal proceedings that have arisen during the normal course of business, and we believe none of them are likely to have a material adverse effect on our financial condition. In accordance with accounting principles, the provisions regarding legal proceedings must be recorded if said procedures are reasonably probable to be resolved against the Company.
The following table represents accounting provisions made as of December 31, 2013 and 2014, for potential loss contingencies stemming from labor, tax, commercial and other litigation faced by our Company:
|
|
|
For the year ended December 31, |
|
||
|
|
|
2013 |
|
2014 |
|
|
|
|
Million Ch$ |
|
||
|
Chile |
|
270 |
|
366 |
|
|
Brazil |
|
75,942 |
|
76,016 |
|
|
Argentina |
|
1,600 |
|
1,430 |
|
|
Total |
|
77,812 |
|
77,812 |
|
Dividend Policy
The declaration and payment of dividends are determined, subject to the limitations set forth below, by the affirmative vote of a majority of our shareholders at a general shareholders’ meeting, based upon the recommendation of our board of directors.
At our annual ordinary shareholders’ meeting, our board of directors submits for approval by our shareholders our annual financial statements for the preceding fiscal year together with reports prepared by our Audit Committee. Once our shareholders have approved our annual financial statements, they determine the allocation of our net income, after provision for income taxes and legal reserves for the preceding year and taking into account the accumulation of losses from prior periods. All shares of our capital stock outstanding at the time a dividend or other distribution is declared are entitled to share equally in that dividend or other distribution, except that holders of our Series B shares are entitled to a dividend 10% greater than any dividend on Series A shares.
Pursuant to Chilean law, we must distribute cash dividends equal to at least 30% of our annual net income, calculated in accordance with IFRS. If we do not record any net income in a given year, we are not legally required to distribute dividends from accumulated earnings. At the annual meeting of shareholders held in April of 2013, our shareholders authorized our board of directors to distribute, at its discretion, interim dividends during 2013 and 2014.
During 2012, 2013 and 2014, our respective shareholders’ meetings approved additional dividend payments to be paid from retained earnings, given our significant cash generation. These additional dividend payments for 2012, 2013 and 2014 are not indicative of whether or not additional dividend payments will be made in any future period.
The following table sets forth the amount in Chilean pesos of dividends declared and paid per share each year and the U.S. dollar amounts paid to shareholders (each ADR represents six shares), on each of the respective payment dates:
|
Dividend |
|
Dividend |
|
Fiscal year with respect |
|
Aggregate
|
|
Series A |
|
Series B |
|
||||
|
Approval |
|
payment |
|
to which dividend was |
|
(Ch$ |
|
Ch$ per |
|
US$ per |
|
Ch$ per |
|
US$ per |
|
|
Date |
|
Date |
|
declared |
|
millions) |
|
share |
|
share |
|
share |
|
share |
|
|
|
|
|
|
|
|
|
|
|
|
|
|
|
|
|
|
|
12-18-2014 |
|
01-29-2015 |
|
2014 |
|
8,945 |
|
9.0 |
|
0.014459 |
|
9.9 |
|
0.01591 |
|
|
09-30-2014 |
|
10-29-2014 |
|
2014 |
|
13,020 |
|
13.10 |
|
0.022523 |
|
14.41 |
|
0.02478 |
|
|
04-21-2014 |
|
08-20-2014 |
|
Retained Earnings |
|
12,295 |
|
12.37 |
|
0.021381 |
|
13.607 |
|
0.02352 |
|
|
04-21-2014 |
|
05-16-2014 |
|
2013 |
|
1,451 |
|
1.46 |
|
0.00264 |
|
1.606 |
|
0.00290 |
|
|
04-21-2014 |
|
05-16-2014 |
|
Retained Earnings |
|
12,295 |
|
12.37 |
|
0.022344 |
|
13.607 |
|
0.02458 |
|
|
12-17-2013 |
|
01-23-2014 |
|
2013 |
|
13,020 |
|
13.1 |
|
0.02407 |
|
14.41 |
|
0.02648 |
|
|
04-25-2013 |
|
11-15-2013 |
|
Retained Earnings |
|
46,713 |
|
47.0 |
|
0.09023 |
|
51.7 |
|
0.09925 |
|
|
05-28-2013 |
|
06-26-2013 |
|
2013 |
|
12,225 |
|
12.3 |
|
0.02419 |
|
13.53 |
|
0.02660 |
|
|
04-25-2013 |
|
05-20-2013 |
|
Retained Earnings |
|
12,225 |
|
12.3 |
|
0.02581 |
|
13.53 |
|
0.02814 |
|
|
11-20-2012 |
|
12-27-2012 |
|
2012 |
|
24,331 |
|
24.480 |
|
0.05110 |
|
26.930 |
|
0.05621 |
|
|
10-02-2012 |
|
10-30-2012 |
|
2012 |
|
12,165 |
|
12.240 |
|
0.02550 |
|
13.460 |
|
0.02805 |
|
|
02-27-2012 |
|
05-31-2012 |
|
Retained Earnings |
|
19,398 |
|
24.30 |
|
0.04692 |
|
26.730 |
|
0.05161 |
|
|
04-27-2012 |
|
05-11-2012 |
|
2011 |
|
8,757 |
|
10.97 |
|
0.02256 |
|
12.067 |
|
0.02481 |
|
|
12-20-2011 |
|
01-23-2012 |
|
2011 |
|
6,785 |
|
8.50 |
|
0.01742 |
|
9.35 |
|
0.01916 |
|
|
09-27-2011 |
|
10-27-2011 |
|
2011 |
|
6.785 |
|
8.50 |
|
0.01696 |
|
9.35 |
|
0.01866 |
|
|
06-28-2011 |
|
07-26-2011 |
|
2011 |
|
6,785 |
|
8.50 |
|
0.01838 |
|
9.35 |
|
0.02022 |
|
|
04-27-2011 |
|
07-26-2011 |
|
Retained Earnings |
|
39,914 |
|
50.00 |
|
0.10811 |
|
55.00 |
|
0.11892 |
|
|
04-27-2011 |
|
05-12-2011 |
|
2010 |
|
10,728 |
|
13.44 |
|
0.02870 |
|
14.784 |
|
0.03157 |
|
|
12-21-2010 |
|
01-27-2011 |
|
2010 |
|
6,785 |
|
8.50 |
|
0.01734 |
|
9.35 |
|
0.01907 |
|
B. SIGNIFICANT CHANGES
We are not aware of any changes bearing upon our financial condition since the date of the financial statements included in this annual report.
A. OFFER AND LISTING DETAILS
Shares of our common stock trade in Chile on the Bolsa de Comercio de Santiago , the Bolsa de Valores Electrónica and the Bolsa de Valores de Valparaíso . Also, shares of our common stock have traded in the United States on the New York Stock Exchange (“NYSE”) since July 14, 1994 in the form of ADRs, which represent six shares of common stock. The Depositary for the ADRs is The Bank of New York Mellon.
The table below shows the high and low daily closing prices of the common stock in Chilean pesos and the trading volume of the common stock on the Santiago Stock Exchange for the periods indicated. It also shows the high and low daily closing prices of the ADRs and the volume traded in the NYSE.
|
|
|
Share Volume
|
|
Ch$ per Share |
|
||||||||
|
|
|
Series A |
|
Series B |
|
Series A |
|
Series B |
|
||||
|
|
|
|
|
|
|
High |
|
Low |
|
High |
|
Low |
|
|
2008 |
|
76,084 |
|
147,144 |
|
1,426 |
|
919 |
|
1,581 |
|
1,164 |
|
|
2009 |
|
63,647 |
|
125,476 |
|
1,440 |
|
1,088 |
|
1,740 |
|
1,262 |
|
|
2010 |
|
15,196 |
|
110,049 |
|
2,072 |
|
1,282 |
|
2,501 |
|
1,621 |
|
|
2011 |
|
38,416 |
|
79,599 |
|
2,120 |
|
1,600 |
|
2,521 |
|
1,780 |
|
|
2012 |
|
45,877 |
|
123,437 |
|
2,550 |
|
1,847 |
|
3,155 |
|
2,220 |
|
|
2013 |
|
|
|
|
|
|
|
|
|
|
|
|
|
|
1st Quarter |
|
8,604 |
|
16,629 |
|
2,622 |
|
2,312 |
|
3,350 |
|
2,960 |
|
|
2nd Quarter |
|
10,286 |
|
27,587 |
|
2,560 |
|
2,240 |
|
3,250 |
|
2,750 |
|
|
3rd Quarter |
|
14,270 |
|
19,657 |
|
2,250 |
|
1,950 |
|
3,100 |
|
2,373 |
|
|
4th Quarter |
|
8,713 |
|
15,746 |
|
2,293 |
|
1,847 |
|
2,940 |
|
2,310 |
|
|
2014 |
|
|
|
|
|
|
|
|
|
|
|
|
|
|
1st Quarter |
|
12,606 |
|
36,919 |
|
1,890 |
|
1,590 |
|
2,525 |
|
1,900 |
|
|
2nd Quarter |
|
14,817 |
|
22,665 |
|
1,840 |
|
1,600 |
|
2,380 |
|
1,982 |
|
|
3rd Quarter |
|
10,363 |
|
27,004 |
|
1,730 |
|
1,590 |
|
2,123 |
|
1,865 |
|
|
4th Quarter |
|
16,478 |
|
27,034 |
|
1,640 |
|
1,400 |
|
1,975 |
|
1,705 |
|
|
Last six months |
|
|
|
|
|
|
|
|
|
|
|
|
|
|
Oct-14 |
|
1,101 |
|
10,848 |
|
1,640 |
|
1,475 |
|
1,975 |
|
1,795 |
|
|
Nov-14 |
|
12,212 |
|
8,277 |
|
1,550 |
|
1,450 |
|
1,870 |
|
1,765 |
|
|
Dec-14 |
|
3,165 |
|
7,909 |
|
1,570 |
|
1,400 |
|
1,906 |
|
1,705 |
|
|
Jan-15 |
|
2,025 |
|
5,829 |
|
1,500 |
|
1,470 |
|
1,829 |
|
1,650 |
|
|
Feb-15 |
|
493 |
|
6,106 |
|
1,500 |
|
1,450 |
|
1,801 |
|
1,679 |
|
|
Mar-15 |
|
7,585 |
|
10,650 |
|
1,440 |
|
1,350 |
|
1,822 |
|
1,550 |
|
|
|
|
ADR Volume
|
|
US$ per Share |
|
||||||||
|
|
|
Series A |
|
Series B |
|
Series A |
|
Series B |
|
||||
|
|
|
|
|
|
|
High |
|
Low |
|
High |
|
Low |
|
|
2008 |
|
2,564 |
|
5,459 |
|
20.10 |
|
8.41 |
|
21.79 |
|
10.53 |
|
|
2009 |
|
1,307 |
|
6,366 |
|
17.19 |
|
10.26 |
|
18.50 |
|
12.36 |
|
|
2010 |
|
2,076 |
|
7,140 |
|
28.83 |
|
15.04 |
|
31.40 |
|
18.68 |
|
|
2011 |
|
911 |
|
5,089 |
|
26.25 |
|
15.04 |
|
31.41 |
|
21.00 |
|
|
2012 |
|
1,276 |
|
6,030 |
|
33 |
|
21 |
|
40 |
|
26 |
|
|
2013 |
|
|
|
|
|
|
|
|
|
|
|
|
|
|
1st Quarter |
|
161 |
|
798 |
|
34.07 |
|
30.03 |
|
42.23 |
|
37.75 |
|
|
2nd Quarter |
|
304 |
|
1,480 |
|
32.55 |
|
25.63 |
|
41.70 |
|
32.46 |
|
|
3rd Quarter |
|
616 |
|
1,199 |
|
27.60 |
|
21.83 |
|
35.55 |
|
28.75 |
|
|
4th Quarter |
|
270 |
|
1,453 |
|
26.41 |
|
20.67 |
|
35.86 |
|
26.51 |
|
|
2014 |
|
|
|
|
|
|
|
|
|
|
|
|
|
|
1st Quarter |
|
457 |
|
2,567 |
|
21.50 |
|
16.59 |
|
28.25 |
|
19.75 |
|
|
2nd Quarter |
|
393 |
|
2,257 |
|
21.45 |
|
17.06 |
|
25.75 |
|
21.19 |
|
|
3rd Quarter |
|
167 |
|
2,346 |
|
19.08 |
|
16.04 |
|
22.96 |
|
18.19 |
|
|
4th Quarter |
|
498 |
|
2,843 |
|
16.15 |
|
14.00 |
|
19.93 |
|
16.82 |
|
|
Last six months |
|
|
|
|
|
|
|
|
|
|
|
|
|
|
Oct-14 |
|
89 |
|
1,068 |
|
16.15 |
|
15.50 |
|
19.93 |
|
18.25 |
|
|
Nov-14 |
|
352 |
|
817 |
|
15.67 |
|
14.94 |
|
19.00 |
|
17.77 |
|
|
Dec-14 |
|
57 |
|
957 |
|
15.42 |
|
14.00 |
|
18.81 |
|
16.82 |
|
|
Jan-15 |
|
47 |
|
534 |
|
14.40 |
|
13.85 |
|
17.30 |
|
16.06 |
|
|
Feb-15 |
|
39 |
|
331 |
|
15.00 |
|
13.95 |
|
17.77 |
|
16.27 |
|
|
Mar-15 |
|
151 |
|
996 |
|
14.01 |
|
12.14 |
|
17.26 |
|
14.87 |
|
Source:Bloomberg
The total number of registered ADR holders we had at December 2014 was 28 (20 in the Series A ADRs and 8 in the Series B ADRs). As of this date the ADRs represented 6.34% of the total number of our issued and outstanding shares. On December 31, 2014, the closing price for the Series A shares on the Santiago Stock Exchange was Ch$1,472.00 per share (US$14.30 per Series A ADR), and Ch$1,717.00 for the Series B shares (US$17.00 per Series B ADR). At December 31, 2014, there were 1,544,894 Series A ADRs (equivalent to 9,269,364 Series A shares) and 8,451,706 Series B ADRs (equivalent to 50,710,236 Series B shares).
Trading activity on the Santiago Stock Exchange is on average substantially less than that on the principal national securities exchanges in the United States. We estimate that for the year ended December 31, 2014, Andina’s shares were traded on the Santiago Stock Exchange on an average of approximately 81% and 100% of such trading days, for Series A and Series B shares respectively.
Other than as previously discussed in “Item 7-Major Shareholders” we are not aware of any other existing contracts or documents that impose material limitations or qualifications on the rights of shareholders of our listed securities.
Debt Securities
The Central Bank is responsible, inter alia , for Chile’s monetary policies and exchange controls. The Central Bank has authorized Chilean issuers to offer bonds in Chile and abroad under the terms of Chapter XIV of the Compendium of Foreign Exchange Regulations ( Compendio de Normas de Cambios Internacionales or CFER). The following paragraphs summarize some of the Central Bank rules on international bond issuances. This summary does not intend to be complete and those interested in a full description should refer to Chapter XIV of the CFER.
Effective April 19, 2001 the CFER greatly simplified the procedure to register capital contributions, investments and foreign loans, including bonds issuances. Payments or remittances of funds, to or from Chile, in connection with credits granted abroad should be made through the Formal Exchange Market, which is composed by the main commercial banks that operate in Chile. When foreign currency resulting from loans or bonds is made available to the beneficiary in the country, the intervening bank should issue the pertinent “Form” and request certain information from the debtor and creditor, as applicable, pursuant to Chapter XIV.
Payments or remittances of foreign currency as capital, interest, adjustments, profits and other benefits originating in the transactions regulated under Chapter XIV must be reported to the Central Bank as follows: (i) if the foreign currency represents a remittance made from Chile, the intervening Formal Exchange Market bank should issue the above form; (ii) the issuer or borrower should inform the Central Bank, within the first 10 days of the month following the date of the transaction, if the foreign currency used to make the pertinent payments originates from credit transactions for which the foreign currency has been used directly abroad or if the corresponding payment obligation is fulfilled abroad using funds other than those indicated in Chapter XIV.
Any change in the terms of the transaction must be reported to the Central Bank within 10 days after formalization. This requirement applies, among others, to the substitution of the debtor or creditor, total or partial assignments of credits or rights and the modification of the financial terms of the respective credit regarding investments or capital contributions.
Exchange rule amendments dated April 2001 established that transactions recorded prior to April 19, 2001 will continue to be governed by the rules in force at the time they were recorded, but that the parties may choose to apply the new regulations.
These procedures also apply to foreign loans obtained through the placement of convertible bonds, in which case the issuer shall report to the Central Bank any increase or decrease in their registered amount as a result of the conversion of convertible bonds denominated and payable in Chilean pesos, for other convertible bonds denominated and payable in foreign currency or shares, as applicable, acquired by foreign investors with proceeds that had entered Chile under the terms of Chapter XIV.
According to Chapter XIV, the Central Bank established that credits relating to acts, agreements or contracts which create a direct obligation of payment or remittance of foreign currency abroad by persons domiciled or residing in Chile, that exceed on an individual basis the sum of US$100,000 or the equivalent in other foreign currencies, absent any special rule in the CFER, shall be reported to the Chilean Central Bank by the obligor either directly or through a Formal Exchange Market entity using the forms contained in the CFER, within 10 days from formalization.
In February 1999, after obtaining the requisite authorization from the Central Bank, we issued bonds in the international markets, subject to the exchange regulations in effect at that time. The main difference between the exchange regime applicable to our bond issuances and those currently in effect, is that in the case of our bond issuances the Central Banks warrants the access to currency markets. However, the regime applicable to our bond issuance has less flexibility as far as the procedures to carry out payments or remittances to bond holders.
We cannot give any assurance that the Central Bank will not impose future restrictions applicable to the holders of debt securities, nor can we make any evaluation of the duration or impact of such restrictions, if imposed.
B. PLAN OF DISTRIBUTION
Not applicable.
C. MARKETS
See “Item 9. The Offer and Listing—A. Offer and Listing Details.”
D. SELLING SHAREHOLDERS
Not applicable.
E. DILUTION
Not applicable.
ITEM 10. ADDITIONAL INFORMATION
A. SHARE CAPITAL
Not applicable.
B. MEMORANDUM AND ARTICLES OF ASSOCIATION
Our bylaws (“Estatutos”) are incorporated as an Exhibit to this Form 20F, and are also available on our website www.koandina.com, under Corporate Governance/Board of Directors/Deeds of Incorporation. The following is a summary of the material provisions of our bylaws. The last amendment of our bylaws was approved on July 12, 2012.
Organization
We are a publicly held company and were incorporated in February 7, 1946. Our legal domicile is the city of Santiago, Chile, notwithstanding the special domiciles of offices, agencies or branches that are established in the country as well as abroad. Our duration is indefinite.
Purposes
Our corporate purposes are to execute and develop the following:
· Develop one or more industrial establishments dedicated to the business, operations and activities to manufacture, produce, transform, bottle, can, distribute, transport, import, export, purchase, sell and market in general, in any form and in any way, any type of food product and in particular any type of mineral water, juice, beverage and drink in general or other similar products, and raw materials or semi- finished materials used in such activities and/or products complementary or related to the preceding businesses and activities;
· Develop one or more agricultural or agro industrial establishments and farm land dedicated to the business, operations and development of agricultural activities and agro industry in general;
· Produce, transform, distribute, transport, import, export, purchase, sell and market in general, in any form and in any way, any type of agricultural products and/or agro industrial products and raw materials, or semi-finished materials used in such activities, and/or products complementary or related to the preceding activities;
· Manufacture, distribute, transport, import, export, purchase, sell and market in general, in any form and in any way, any type of container; and execute and develop any type of material recycling process and activity;
· Accept from and/or grant the representation of trademarks, products and/or licenses related to such businesses, activities, operations and products to national or foreign companies;
· Provide any type of service and/or technical assistance in any way related to the goods, products, businesses and activities referred to in the preceding letters;
· Invest cash surplus, even in the capital market; and
· In general, undertake all other businesses and activities supplementary or linked to the above mentioned operations.
We may execute our objectives directly or by participating as a partner or shareholder in other companies or by acquiring rights or interests in any other type of association related to the aforementioned activities.
Voting Rights
Our capital equity is divided into Series A shares and Series B shares, both preferred and with no par value, whose features, rights and privileges are the following:
· The preference of Series A shares consists solely of the right to elect twelve out of the fourteen board members of the Company. Series A shares are entitled to full voting rights without limitations.
· The preference of Series B shares consists solely of the right to receive all and any of the per share dividends we may distribute, whether temporary, definitive, minimum mandatory, additional, or eventual, increased by 10%. Series B shares are entitled to a limited voting right, voting only with respect to the election of a board member for the Company.
· The preferences of Series A and B shares will remain in effect through December 31, 2130. Once this period has expired, Series A and B will be eliminated and the shares which comprise them shall automatically become common shares without any preferences whatsoever, therefore eliminating the division of shares into series.
Board of Directors and Shareholder Meetings
Our management is controlled by a board of directors, whose members are proposed and elected every three years during the general annual shareholders’ meeting. Board members are elected by separate voting of the Series A and Series B shareholder. As mentioned, Series A shares elect twelve directors, and Series B shares elect two Directors.
The Directors may or may not be shareholders, and will hold their offices for three years with the possibility to be re-elected for an indefinite number of periods. Even though we have not established a formal process that allows our shareholders to communicate with the directors, shareholders desiring to do so may share their opinions, considerations or recommendations before or during the corresponding shareholders’ meeting which will be heard and attended by the Chairman of the Board, or by the Chief Executive Officer, as the case may be, and any such recommendations will be submitted for resolution by the shareholders in attendance during the meeting.
Regular general shareholders meetings are held once a year within the first four months following the date of the annual balance sheet. We prepare a balance sheet annually on our operations as of December 31, which is presented together with the profit and loss statement, the report by the auditors and annual report to the respective shareholders meeting. The board sends a copy of the balance sheet, annual report, report by the
auditors and respective notes to each of the shareholders registered in the registry no later than by the date the first summons is published. Special shareholders meetings may be held at any time according to corporate needs and to discuss and decide upon any matter within the competence thereof, provided it is indicated in the summons.
C. MATERIAL CONTRACTS
In 2013, we acquired the 100% of the shares of Companhia de Bebidas Ipiranga in Brazil. Additionally, we issued UF 5,000,000 in bonds in tranches of 7 and 21 years in the Chilean market and US$575 million in 10 years term bonds in the US market.
On August 30, 2012, Andina Brazil entered into a Share Purchase and Sale Agreement for the acquisition of 40% of the capital shares of Sorocaba Refreshments S.A., a manufacturer authorized by The Coca-Cola Company, based in the city of Sorocaba, State of São Paulo, owned by Compañía Maranhense de Refrigerantes (sucesora de Renosa Ind. Brasileira de Bebidas S/A) and in November 2012 RJR paid the purchase price of R$146,946,044.00.
Our general extraordinary shareholders meeting held on June 25, 2012, approved the merger (by absorption) of Embotelladora Coca Cola Polar S.A. and Embotelladora Andina S.A. On September 28, 2012, Embotelladora Andina S.A. and Embotelladora Coca Cola Polar S.A. signed the public deed of the merger of their operations, in which they declared that merger had been finalized and perfected on October 1, 2012. This operation began on February 2, 2012, and allows Embotelladora Andina S.A. to consolidate its leading position in the business of bottling products licensed by The Coca-Cola Company in the southern cone and generate opportunities for growth and generation of value for its shareholders and employees. In practice, Embotelladora Andina S.A. is the second largest Coca-Cola bottler in South America and the seventh in the world, with operations in Argentina, Brazil, Chile and Paraguay. The transaction took the form of a merger (by absorption) and the exchange of newly issued shares of Andina, at a ratio of 0.33268606071 shares of Andina Series A shares and 0.33268606071 Andina Series B shares for each share of Embotelladoras Coca-Cola Polar S.A. The final process of exchange of shares took place on October 16, 2012.
During 2012, Andina Argentina held, among others, the following contracts with economic or strategic transcendent content: natural gas supply agreements, and electricity supply agreements; IP telephony services agreement (with supplier SIEMENS); purchase of new forklift agreement (with supplier Toyota) which are necessary due to enlargement of the Cordoba Plant Deposit; and agreement for the extension of the Deposit of Final Products and Patio of the Cordoba Plant (13,600 m2) and at the Bahia Blanca Plant (2,800 m2).
During 2012, PARESA executed a contract with TECNOEDIL S.A. building company for the construction of Warehouse 9, extension of Warehouse 8 for forklifts and the construction of the Distribution building, which represents additional storage capacity, the total contract value Gs.8,262,784,550. Additionally, on June 1, 2012 an agreement was signed with AZPA (Azucarera Paraguaya S.A.) for the supply of sugar, raw material, which considers the provision of 38,500 tons (Thirty eight thousand five hundred tons) until May 31, 2013, the total value of the contract is Gs.192,500,000,000.
In October 2011, Andina Brazil entered into an agreement with the company “Light Esco — Prestação de Serviços S/A”, for the construction and operation of an electrical cogeneration station at the Jacarepaguá bottling facility. The term of this agreement is 15 years, since the date on which the station begins operating, which would enter into operation towards the year 2013 and will ensure the supply of energy for the plant. The estimated value of the agreement is of $738 million reals. At the end of the contractual term, ownership of the cogeneration station will be transferred to Andina Brazil and equipment maintenance and upgrades will be carried out by Light Esco.
On June 30, 2011, Andina Brazil together with the other bottlers of the Coca-Cola System in Brazil, and Recofarma (company of the Coca-Cola Group Brazil), signed an amendement to the agreement with SABB - SISTEMA DE ALIMENTOS E BEBIDAS DO BRASIL, new corporate name of Sucos del Valle, approving the incorporation of Mais Indústria de Alimentos Ltda to SABB, and bottlers remained with 50% of the share capital
of SABB. With this agreement, Andina Brazil went on to have a total ownership of 5.74% of the share capital of SABB.
During January of 2011, the juice business in Chile was restructured, allowing the incorporation of the other Coca-Cola bottlers in Chile in the property of Vital S.A. which changed its name to Vital Jugos S.A. Andina, Embonor S.A. and Embotelladora Coca-Cola Polar S.A. own 57%, 28% and 15%, respectively, of the outstanding capital of Vital Jugos S.A.
During 2011, EDASA, among others, entered into the following materially significant agreements: construction of the new plant for raw sugar; purchase of machinery and equipment for the REF PET line N°8 and N°7 (600 bottles per minute); construction and equipment for a new filling line for water and sensitive products; supply of natural gas; supply of electric power and long distance and inter-deposit service agreements.
D. EXCHANGE CONTROLS
Foreign Investment and Exchange Controls in Chile
The Central Bank is responsible, among other matters, for setting monetary policies and exchange controls in Chile. As of April 19, 2001, the Chilean Central Bank (“CCB”) eliminated prior foreign exchange controls, imposed certain reporting requirements and determined that certain operations be conducted through the Formal Exchange Market (“FEM”). The main purpose of these amendments, as declared by the Central Bank, is to facilitate the flow of capital into Chile and outside the country and to foster foreign investment.
Equity investments in Chile (including investments in stock) by non-resident persons or entities must comply with some of the existing exchange control restrictions. Foreign investments may be registered with the Foreign Investment Committee ( Comité de Inversiones Extranjeras ) in accordance with Law N° 600 of 1974 and amendments or with the Central Bank in accordance with Chapter XIV of the Compendium of Foreign Exchange Regulations ( Compendio de Normas de Cambios Internacionales or CFER) of the Central Bank. In the case of Decree Law N° 600, foreign investors execute a foreign investment agreement with Chile, thus guaranteeing access to the FEM. However, investors under Decree Law N° 600 will only be able to repatriate capital one-year after the investment. Earnings can be remitted abroad at any time. In the case of CFER, capital as well as earnings can be repatriated at any time, without an agreement with the Central Bank.
During 2001, the CCB eliminated certain exchange controls. For instance, it revoked Chapter XXVI of the CFER, which regulated the issuance and placement of ADRs by Chilean corporations. Pursuant to the new rules, the Central Bank’s approval is no longer a pre-condition for ADR issuances or foreign investment contracts with the CCB. ADR issuances are now regarded as an ordinary foreign investment, and the only requirements are that the CCB be informed of the transaction, by fulfilling the rules of Chapter XIV of the CFER, that mainly establishes that the monies come in or leave the country exclusively through the Formal Exchange Market, if the recipient of the investment decides to enter the foreign currency to the country or if it carries out payments or remittances from Chile.
Notwithstanding these changes, exchange transactions authorized prior to April 19, 2001 remained subject to the rules in force as of the date of such transactions. The new exchange regime did not affect Chapter XXVI of the CFER and the Foreign Investment Contract - FIC between Andina, the Central Bank and The Bank of New York Mellon (as Depositary of the shares represented by ADRs). Notwithstanding the previous, the parties to the FIC may choose to adopt the norms imposed by the CCB, resigning to those of the FIC, and which has been the option we have taken until this date. The FIC is the agreement by which access to the FEM is given to the Depositary and ADR holders. The FIC adopted the dispositions of Chapter XXVI and was celebrated pursuant to Article 47 of the Constitutional Organic Act of the CCB.
Under Chapter XXVI of the CFER, if the funds to purchase the common shares underlying the ADRs are brought into Chile, the Depositary must deliver, on behalf of foreign investors, an annex providing information on the transaction to the Formal Exchange Market entity involved, together with a letter instructing such entity to deliver the foreign currency or the equivalency in pesos, on or before the date the foreign currency is brought or is to be brought into Chile.
Repatriation of amounts received with respect to deposited common shares or common shares withdrawn from deposits on surrender of ADRs (including amounts received as cash dividends and proceeds from the sale in Chile of the underlying common shares and any rights arising there from) need be made through the FEM. The FEM entity intervening in the repatriation must provide certain information to the CCB on the following banking business day.
Under Chapter XXVI and the FIC, the CCB agreed to grant to the Depositary, on behalf of ADR holders, and to any investor not residing nor domiciled in Chile who acquire shares or replace ADRs for common stock, which we refer to as the Withdrawn Shares, FEM access to convert Chilean pesos into U.S. dollars and to remit those dollars outside Chile including amounts received as: (i) cash dividends; (ii) proceeds from the sale in Chile of Withdrawn Shares; (iii) proceeds from the sale in Chile of preemptive rights to subscribe for additional shares; (iv) proceeds from the liquidation, merger or consolidation of Andina; (v) proceeds resulting from capital decreases or earnings or liquidations; and (vi) other distributions, including those in respect of any re-capitalization resulting from holding shares, ADRs or by Withdrawn Shares.
The guarantee of FEM access under the FIC will extend to the participants of the ADR offering if the following requirements are met: (i) that the funds to purchase the shares underlying the ADRs are brought into Chile and converted into Chilean pesos through the FEM; (ii) that the purchase of the underlying shares is made on a Chilean stock exchange; and (iii) that within five business days from the conversion of the funds into Chilean pesos, the CCB is informed that the funds converted were used to purchase the underlying shares, if those funds are not invested in shares within that period, it can access the FEM to reacquire foreign currency, provided that the request is submitted to the CCB within seven banking business days of the initial conversion into pesos.
Chapter XXVI provides that FEM access in connection with dividend payments is conditioned to our certifying to the CCB that a dividend payment has been made and that any applicable tax has been withheld. Chapter XXVI also provides that FEM access in connection with the sale of Withdrawn Shares, or distribution thereon, is conditioned upon receipt by the CCB (i) a certificate by the Depositary or custodian, as the case may be, that the shares have been withdrawn in exchange for delivery of the appropriate ADRs, and (ii) a waiver of the benefits of the FIC with respect to ADRs (except in connection with the proposed sale of the shares) until the Withdrawn Shares are re-deposited.
FEM access under any of the circumstances described above is not automatic. Pursuant to Chapter XXVI, such access needs the BCC’s approval on a request submitted to that end through a banking institution established in Chile. The FIC provides that if the BCC has not acted upon the request within seven banking days, the request is deemed to have been granted.
Under current Chilean law, the BCC cannot unilaterally change the FIC. The Chilean Courts (although not binding on future judicial decisions) also have established that the FIC cannot be annulled by future legislative changes. No assurance can be given, however, that additional Chilean restrictions applicable to the holders of ADRs, to the disposition of underlying shares, or to the repatriation of proceeds from their disposition, will not be imposed in the future; nor can there be any assessment of the duration or impact of any restrictions that might be imposed. If for whatever reason, including changes in the FIC or Chilean law, the Depositary is prevented from converting Chilean pesos into U.S. dollars; the investors shall receive dividends or other payments in Chilean pesos, which shall subject the investors to exchange rate risks. It cannot be assured that the CFER, as amended, or any other exchange regulation will not be amended in the future, or that if new regulations are enacted that they shall have no material bearing on Andina or the ADR holders.
No assurance can be given that Andina will be able to purchase U.S. dollars in the local exchange market at any time in the future, nor that any such purchase will be for the amounts necessary to pay any sum due under any of its capital or debt instruments. Likewise, it is not possible to guarantee that changes to the regulations of the CCB or other legislative changes relating to exchange controls will not restrict nor impair Andina’s ability to purchase U.S. dollars in order to make payment on its debt instruments.
E. TAXATION
Tax Considerations Relating to Equity Securities
Chilean Tax Considerations
The following discussion summarizes the material Chilean income tax consequences of an investment in Andina’s stock or ADRs by an individual who is not domiciled or resident in Chile or a legal entity that is not organized under the laws of Chile and does not have a permanent establishment in Chile (a “foreign holder”). This discussion is based upon Chilean income tax laws presently in force, including Ruling No. 324 of January 29, 1990 of the Servicio de Impuestos Internos (the Chilean Internal Revenue Service or “SII”) and other applicable regulations and rulings that are subject to change without notice. The discussion is not intended as tax advice to any particular investor, which can be rendered only in light of that investor’s particular tax situation. Each investor or potential investor is encouraged to seek independent tax advice with respect to consequences of investing in Andina’s stock or ADRs.
Capital Gains
Gains recognized from the sale or exchange of ADRs by a foreign holder outside Chile will not be subject to Chilean taxation. Gains recognized on a sale or exchange of shares of common stock will be subject to both the Corporate Income Tax and the Withholding Tax (the former being credited against the latter) if either: (i) the foreign holder has held the shares of common stock for less than one year, (ii) the foreign holder acquired and disposed of the shares of common stock in the ordinary course of its business or as an habitual trader of shares, or (iii) the foreign holder transfers shares of common stock to a related person, as defined by Chilean tax law. In all other cases, gain on the disposition of shares of common stock will be subject only to the Corporate Income Tax, with rates of 22.5% and 24% for business years 2015 and 2016, respectively, except for shares resulting from an exchange of ADRs for shares (flow back) in which case, the Chilean Internal Revenue Service pursuant to Oficio 1,705 dated May 15, 2006 has interpreted that said shares may benefit from article 18 ter if the ADRs were acquired through a stock broker or by any other circumstance stipulated by that norm.
The profit generated by sales of shares carried out beginning business year 2017 is subject to both Corporate Income Tax and Withholding Tax (crediting the first against the latter, under the same conditions and limitations outlined in Item 3. Key Information-Risk Factors), except that between the date of acquisition and the sale of shares one year or more elapsed, in which case, the gain is taxed only with the Withholding Tax rate of 35%. Equal treatment will apply to sales that are made to related parties, according to the Chilean tax regulation, even when a year or more elapsed from the date of purchase.
The tax basis of shares of common stock received in exchange for ADRs will be determined in accordance with the valuation procedure set forth in the Deposit Agreement, which values shares of common stock at the highest reported sales price at which they trade on the Santiago Stock Exchange on the date of the withdrawal of the shares of common stock from the Depositary. Consequently, the conversion of ADRs into shares of common stock, and the immediate sale of the shares for the value established under the Deposit Agreement, will not generate a capital gain subject to taxation in Chile. However, in the case where the sale of the shares is made on a day that is different than the date in which the exchange is recorded, capital gain subject to taxation in Chile may be generated. In connection thereto, on October 1, 1999 the Chilean Internal Revenue Service issued Ruling No. 3708 whereby it allowed Chilean issuers of ADRs to amend the deposit agreements to which they are parties in order to include a clause that states that, in the case that the exchanged shares are sold by the ADRs’ holders on a Chilean stock exchange either on the same day in which the exchange is recorded or within the two business days prior to such date, the acquisition price of such exchanged shares shall be the price registered in the invoice issued by the stock broker that participated in the sale transaction. As this amendment has been included in the Deposit Agreement, the capital gain that may be generated if the exchange date is different than the date in which the shares received in exchange for ADRs were sold, will not be subject to taxation.We reiterate that if a contributor in good faith adopts Oficio 1,705, then the excess value will not be subject to taxation in Chile.
The distribution and exercise of preemptive rights relating to the shares of common stock will not be subject to Chilean taxation. Any gain on the sale or assignment of preemptive rights relating to the shares of
common stock will be subject to both the Corporate Income Tax and the Withholding Tax (the former being credited against the latter).
Other Chilean Taxes
No Chilean inheritance, gift or succession taxes apply to the transfer or disposition of the ADRs by a foreign holder, but such taxes generally will apply to the transfer at death or by gift of shares of common stock by a foreign holder. No Chilean stamp, issue, registration or similar taxes or duties apply to foreign holders of ADRs or shares of common stock.
Withholding Tax Certificates
Upon request, we will provide to foreign holders appropriate documentation evidencing the payment of Chilean withholding taxes.
United States Tax Considerations Relating to ADRs or Shares of Common Stock
The following discussion summarizes certain U.S. federal income tax consequences of an investment in Andina’s ADRs or shares of common stock. This discussion is based upon U.S. federal income tax laws presently in force. The discussion is not a full description of all tax considerations that may be relevant to a decision to purchase ADRs or shares of common stock. In particular, the discussion is directed only to U.S. holders (as defined below) that hold ADRs or shares of common stock as capital assets, and it does not address the tax treatment of holders that are subject to special tax rules under the Internal Revenue Code of 1986 as amended (the “Code”), such as financial institutions, regulated investment companies, real estate investment trusts, partnerships or other pass-through entities, dealers in securities or currencies, traders in securities that elect to use a mark-to-market method of accounting for their securities holdings, insurance companies, tax-exempt entities, persons holding ADRs or shares of common stock as part of a hedging, integrated, conversion or constructive sale transaction or a straddle, holders that own or are deemed to own 10% or more of our voting shares, persons liable for alternative minimum tax or persons whose “functional currency” is not the U.S. dollar. Furthermore, the discussion below is based upon the provisions of the Code and regulations, rulings and judicial decisions there under as of the date hereof, and such authorities may be repealed, revoked or modified so as to result in U.S. federal income tax consequences different from those discussed below. In addition, the discussion below assumes that the Deposit Agreement, and all other related agreements, will be performed in accordance with their terms. If a partnership holds our ADRs or shares of common stock, the tax treatment of a partner will generally depend upon the status of the partner and the activities of the partnership. Partners in a partnership holding ADRs or shares of common stock should consult their tax advisors. This summary does not contain a detailed description of all the United States federal income tax consequences to a holder in light of its particular circumstances and does not address the effects of any state, local or non-United States tax laws. Prospective purchasers should consult their tax advisors about the federal, state, local and foreign tax consequences to them of the purchase, ownership and disposition of ADRs or shares of common stock.
As used herein, the term “U.S. holder” means a holder of ADRs or shares of common stock that is (i) an individual U.S. citizen or resident, (ii) a corporation (or any other entity treated as a corporation for U.S. federal income tax purposes) created or organized in or under the laws of the United States, any state thereof or the District of Columbia, (iii) an estate the income of which is subject to U.S. federal income taxation regardless of its source or (iv) a trust that: (a) is subject to the primary supervision of a court within the United States and with respect to which one or more U.S. persons have the authority to control all substantial decisions of the trust or (b) has a valid election in effect under applicable U.S. Treasury regulations to be treated as a U.S. person.
If the obligations contemplated by the Deposit Agreement are performed in accordance with its terms, ADR holders generally will be treated for U.S. federal income tax purposes as the owners of the shares of common stock represented by those ADRs. Deposits or withdrawals of shares of common stock by U.S. holders in exchange for ADRs will not result in the realization of gain or loss for U.S. federal income tax purposes.
Cash Dividends and Other Distributions
Cash distributions (including the amount of any Chilean taxes withheld) paid to U.S. holders with respect to the ADRs or shares of common stock generally will be treated as dividend income to such U.S. holders, to the extent paid out of our current or accumulated earnings and profits, as determined under U.S. federal income tax principles. Such income will be includable in the gross income of a U.S. holder as ordinary income on the day received by the Depositary, in the case of ADRs, or by the U.S. holder, in the case of shares of common stock. The dividends will not be eligible for the dividends received deduction allowed to corporations under the Code. With respect to non-corporate U.S. holders, certain dividends received from a qualified foreign corporation may be subject to reduced rates of taxation. A foreign corporation is treated as a qualified foreign corporation with respect to dividends received from that corporation on shares (or ADRs backed by such shares) that are readily tradable on an established securities market in the United States. U.S. Treasury Department guidance indicates that our ADRs (which are listed on the New York Stock Exchange), but not our shares of common stock, are readily tradable on an established securities market in the United States. Thus, we do not believe that dividends that we pay on our shares of our common stock that are not backed by ADRs currently meet the conditions required for these reduced tax rates. There can be no assurance that our ADRs will be considered readily tradable on an established securities market in later years. Non-corporate holders that do not meet a minimum holding period requirement during which they are not protected from the risk of loss or that elect to treat the dividend income as “investment income” pursuant to section 163(d)(4) of the Code will not be eligible for the reduced rates of taxation regardless of our status as a qualified foreign corporation. In addition, the rate reduction will not apply to dividends if the recipient of a dividend is obligated to make related payments with respect to positions in substantially similar or related property. This disallowance applies even if the minimum holding period has been met. Non-corporate U.S. holders should consult their own tax advisors regarding the application of these rules given their particular circumstances.
Dividends paid in Chilean pesos will be includable in income in a U.S. dollar amount based on the exchange rate in effect on the day of receipt by the Depositary, in the case of ADRs, or by the U.S. holder, in the case of shares of common stock, regardless of whether the Chilean pesos are converted into U.S. dollars. If the Chilean pesos received as dividends are not converted into U.S. dollars on the date of receipt, a U.S. holder will have a basis in the Chilean pesos equal to their U.S. dollar value on the date of receipt. Any gain or loss realized on a subsequent conversion or other disposition of the Chilean pesos will be treated as U.S. source ordinary income or loss, regardless of whether the pesos are converted into U.S. dollars.
The Chilean Withholding Tax (net of any credit for the Corporate Income Tax) paid by or for the account of any U.S. holder may be eligible, subject to generally applicable limitations and conditions, for credit against the U.S. holder’s federal income tax liability. For purposes of calculating the foreign tax credit, dividends paid with respect to the ADRs or shares of common stock generally will be foreign source income and will generally constitute passive category income. Further, in certain circumstances, a U.S. holder that (i) has held ADRs or shares of common stock for less than a specified minimum period during which it is not protected from risk of loss or (ii) is obligated to make payments related to the dividends, will not be allowed a foreign tax credit for foreign taxes imposed on dividends paid on ADRs or shares of common stock. The rules governing the foreign tax credit are complex. Investors are urged to consult their tax advisors regarding the availability of the foreign tax credit under their particular circumstances.
Distributions to U.S. holders of additional shares of common stock or preemptive rights with respect to shares of common stock that are made as part of a pro rata distribution to all shareholders of the Company generally should not be subject to U.S. federal income tax.
To the extent that the amount of any distribution exceeds our current and accumulated earnings and profits for a taxable year, as determined under U.S. federal income tax principles, the distribution will first be treated as a tax-free return of capital, causing a reduction in the adjusted basis of the ADRs or shares of common stock (thereby increasing the amount of gain, or decreasing the amount of loss, to be recognized by the investor on a subsequent disposition of the ADRs or shares of common stock), and the balance in excess of adjusted basis will be taxed as capital gain recognized on a sale or exchange. Consequently, such distributions in excess of our current and accumulated earnings and profits generally would not give rise to foreign source income and a U.S. holder generally would not be able to use the foreign tax credit arising from any Chilean withholding tax imposed on such distributions unless such credit can be applied (subject to applicable limitations) against U.S. taxes due on other foreign source income in the appropriate category for foreign tax credit purposes. However,
we do not expect to keep earnings and profits in accordance with U.S. federal income tax principles. Therefore, a U.S. holder should expect that a distribution will generally be treated as a dividend (as discussed above).
Passive Foreign Investment Company
We do not believe that we are, for U.S. federal income tax purposes, a passive foreign investment company (a “PFIC”), and expect to continue our operations in such a manner that we will not be a PFIC. If, however, we are or become a PFIC, U.S. holders could be subject to additional U.S. federal income taxes on gain recognized with respect to the ADRs or shares of common stock and on certain distributions, plus an interest charge on certain taxes treated as having been deferred by the U.S. holder under the PFIC rules of the U.S. federal income tax laws.
Non-corporate U.S. holders will not be eligible for reduced rates of taxation on any dividends received from us, if we are a PFIC in the taxable year in which such dividends are paid or in the preceding taxable year.
Capital Gains
U.S. holders that hold ADRs or shares of common stock as capital assets will recognize capital gain or loss for federal income tax purposes on the sale or other disposition of such ADRs or shares (or preemptive rights with respect to such shares) held by the U.S. holder or the Depositary. Capital gains of individuals derived with respect to capital assets held for more than one year are eligible for reduced rates of taxation. The deductibility of capital losses is subject to limitations. Any gain or loss recognized by a U.S. holder generally will be treated as U.S. source gain or loss. Consequently, in the case of a disposition of shares of common stock (which, unlike a disposition of ADRs, may be taxable in Chile), the U.S. holder may not be able to use the foreign tax credit for any Chilean tax imposed on the gain unless it can apply (subject to applicable limitations) the credit against tax due on other income from foreign sources.
Estate and Gift Taxation
As discussed above under “Chilean Tax Considerations — Other Chilean Taxes,” there are no Chilean inheritance, gift or succession taxes applicable to the transfer or disposition of ADRs by a foreign holder, but such taxes generally will apply to the transfer at death or by gift of shares of common stock by a foreign holder. The amount of any inheritance tax paid to Chile may be eligible for credit against the amount of U.S. federal estate tax imposed on the estate of a U.S. holder. U.S. holders should consult their personal tax advisors to determine whether and to what extent they may be entitled to such credit. The Chilean gift tax generally will not be treated as a creditable foreign tax for U.S. tax purposes.
Information Reporting and Backup Withholding
In general, information reporting requirements will apply to dividends in respect of ADRs or shares of common stock or the proceeds received on the sale, exchange, or redemption of ADRs or shares of common stock paid within the United States (and in certain cases, outside of the United States) to U.S. holders other than certain exempt recipients. A backup withholding tax may apply to such payments if the U.S. holder fails to provide an accurate taxpayer identification number or certification of other exempt status or fails to report interest and dividends required to be shown on its federal income tax returns. The amount of any backup withholding from a payment to a U.S. holder will be allowed as a refund or a credit against the U.S. holder’s U.S. federal income tax liability, provided the required information is furnished to the Internal Revenue Service.
F. DIVIDENDS AND PAYING AGENTS
Not applicable.
G. STATEMENT BY EXPERTS
Not applicable.
H. DOCUMENTS ON DISPLAY
We are subject to the informational reporting requirements of the U.S. Securities Exchange Act of 1934, as amended, which requires that we file periodic reports and other information with the SEC. As a foreign private issuer, we file annual reports on Form 20-F as opposed to Form 10-K. We do not file quarterly reports on Form 10-Q but furnish quarterly reports and reports in relation to material events on Form 6-K. As a foreign private issuer, we are exempt from the rules under the U.S. Securities Exchange Act of 1934, as amended, prescribing the furnishing and content of proxy statements and short-swing profit disclosure and liability.
You may read and copy all or any portion of the annual report or other information in our files in the SEC’s public reference room at 100 F Street, N.E., Washington, D.C. 20549. You can also access these documents through the SEC’s website at www.sec.gov or from our corporate website www.koandina.com or request a hard copy through our website also. You can also request copies of these documents upon payment of a duplicating fee, by writing to the SEC. Please call the SEC at 1-800-SEC-0330 for further information on the operation of the public reference rooms. In addition, reports and other information concerning us may be inspected at the offices of the New York Stock Exchange, Inc., 20 Broad Street, New York, New York 10005, on which our ADRs are listed.
We also file reports with the Chilean Superintendencia de Valores y Seguros . You may read and copy any materials filed with the SVS directly from its website www.svs.cl. The documents referred to in this annual report can be inspected at Miraflores 9153, Piso 7, Renca, Santiago, Chile.
I. SUBSIDIARY INFORMATION
Not applicable.
ITEM 11. QUANTITATIVE AND QUALITATIVE DISCLOSURES ABOUT MARKET RISK
Market risk generally represents the risk that losses may occur in the values of financial instruments as a result of movements in interest rates, foreign currency exchange rates and commodity prices. We are exposed to changes in financial market conditions in the normal course of our business due to our use of certain financial instruments as well as transacting in various foreign currencies and translation of our foreign subsidiaries’ financial statements into the Chilean peso.
Interest Rate Risk
Our primary interest rate exposures relate to U.S. dollar denominated and UF long-term fixed rate bond liabilities and other long-term variable and fixed rate bank liabilities. We also invest in certain medium-term bond securities that bear a fixed interest rate. We monitor our exposure to interest rate fluctuations regularly depending on market conditions.
The following table provides information about our long-term debt and bond investments that are sensitive to changes in market interest rates as of December 31, 2014.
|
|
|
Expected Maturity Date |
|
Estimated
|
|
||||||||||||
|
|
|
2015 |
|
2016 |
|
2017 |
|
2018 |
|
2019 |
|
Therafter |
|
Total |
|
Total |
|
|
|
|
MCh$ |
|
MCh$ |
|
MCh$ |
|
MCh$ |
|
MCh$ |
|
MCh$ |
|
MCh$ |
|
MCh$ |
|
|
|
|
|
|
|
|
|
|
|
|
|
|
|
|
|
|
|
|
|
Interest Earning Assets |
|
|
|
|
|
|
|
|
|
|
|
|
|
|
|
|
|
|
Time deposits and credit links |
|
114,001 |
|
20 |
|
— |
|
— |
|
— |
|
— |
|
114,021 |
|
114,021 |
|
|
Weighted average interest rate |
|
2.48 |
% |
8.82 |
% |
— |
|
— |
|
— |
|
— |
|
2.48 |
% |
— |
|
|
|
|
|
|
|
|
|
|
|
|
|
|
|
|
|
|
|
|
|
Interest Bearing Liabilities |
|
|
|
|
|
|
|
|
|
|
|
|
|
|
|
|
|
|
Long-term debt (Bonds) |
|
17,624 |
|
10,678 |
|
17,163 |
|
11,328 |
|
11,662 |
|
606,388 |
|
674,844 |
|
720,175 |
|
|
Fixed Rate |
|
4.44 |
% |
4.48 |
% |
4.16 |
% |
4.86 |
% |
4.91 |
% |
4.67 |
% |
4.66 |
% |
|
|
|
Bank liabilities |
|
41,676 |
|
22,525 |
|
15,331 |
|
4,423 |
|
3,315 |
|
821 |
|
88,091 |
|
84,467 |
|
|
Weighted average interest rate |
|
11.26 |
% |
6.43 |
% |
4.74 |
% |
6.90 |
% |
7.00 |
% |
7.00 |
% |
8.47 |
% |
— |
|
Foreign Currency Risk
As of December 31, 2014, we have debt held by banks and debt held by the public denominated in U.S. dollars, which are hedged by derivative instruments, which lower the risk of exposure to the accrual of fluctuations of the value of the US dollar. Net assets balance is denominated in dollars as of December 31, 2014, which amounts to $626.6 million as detailed below:
The following table summarizes the financial instruments held December 31, 2014, denominated in dollars:
|
|
|
2014 |
|
2015 |
|
2016 |
|
2017 |
|
2018 |
|
2019 Onwards |
|
Total |
|
Fair estimated
|
|
|
|
|
MM$ |
|
MM$ |
|
MM$ |
|
MM$ |
|
MM$ |
|
MM$ |
|
MM$ |
|
MM$ |
|
|
Assets |
|
|
|
|
|
|
|
|
|
|
|
|
|
|
|
|
|
|
Denominated in US dollars |
|
|
|
|
|
|
|
|
|
|
|
|
|
|
|
|
|
|
Assets |
|
|
|
|
|
|
|
|
|
|
|
|
|
|
|
|
|
|
Cash and cash equivalents |
|
5,747 |
|
— |
|
— |
|
— |
|
— |
|
— |
|
5,747 |
|
5,747 |
|
|
Mutual fund |
|
|
|
|
|
|
|
|
|
|
|
|
|
|
|
|
|
|
Liabilities |
|
|
|
|
|
|
|
|
|
|
|
|
|
|
|
|
|
|
Bonds obligations |
|
(4,361 |
) |
— |
|
— |
|
— |
|
— |
|
(348,881 |
) |
(353,242 |
) |
(367,549 |
) |
|
Bank debt |
|
(16,118 |
) |
(8,281 |
) |
(8,281 |
) |
— |
|
— |
|
|
|
(32,680 |
) |
(33,824 |
) |
|
Net assets (liabilities) |
|
(14,732 |
) |
(8,281 |
) |
(8,281 |
) |
— |
|
— |
|
(348,881 |
) |
(380,175 |
) |
(395,626 |
) |
ITEM 12. DESCRIPTION OF SECURITIES OTHER THAN EQUITY SECURITIES
A. DEBT SECURITIES
Not applicable.
B. WARRANTS AND RIGHTS
Not applicable.
C. OTHER SECURITIES
Not applicable.
D. AMERICAN DEPOSITARY RECEIPTS
Fees and Charges
The Bank of New York Mellon serves as the depositary for our ADRs. ADR holders are required to pay various fees to the depositary, and the depositary may refuse to provide any service for which a fee is assessed until the applicable fee has been paid.
ADR holders are required to pay the depositary amounts in respect of expenses incurred by the depositary or its agents on behalf of ADR holders, including expenses arising from compliance with applicable law, taxes or other governmental charges, or conversion of foreign currency into U.S. dollars. The depositary
may decide in its sole discretion to seek payment by either billing holders or by deducting the fee from one or more cash dividends or other cash distributions.
ADR holders are also required to pay additional fees for certain services provided by the depositary, as set forth in the table below.
|
Depositary service |
|
Fee payable by ADR holders |
|
Issuance and delivery of ADRs, including in connection with share distributions |
|
Up to US$5.00 per 100 ADSs (or portion thereof) |
|
Withdrawal of shares underlying ADRs |
|
Up to US$5.00 per 100 ADSs (or portion thereof) |
|
Registration for the transfer of shares |
|
Registration or transfer fees that may from time to time be in effect |
|
Cash distribution fees |
|
US$ 0.02 or less per ADS |
In addition, holders may be required to pay a fee for the distribution or sale of securities. Such fee (which may be deducted from such proceeds) would be for an amount equal to the lesser of (1) the fee for the issuance of ADRs that would be charged as if the securities were treated as deposited shares and (2) the amount of such proceeds.
Fees Incurred in Past Annual Period
From January 1, 2013 to December 31, 2014, we received from the depositary US$66,665.02 for continuing annual stock exchange listing fees, standard out-of-pocket maintenance costs for the ADRs (consisting of the expenses of postage and envelopes for mailing annual and interim financial reports, printing and distributing dividend checks, electronic filing of U.S. Federal tax information, mailing required tax forms, stationery, postage, facsimile, and telephone calls), any applicable performance indicators relating to the ADR facility, underwriting fees and legal fees.
Fees to be Paid in the Future
The Bank of New York Mellon, as depositary, has agreed to reimburse us for expenses they incur that are related to establishment and maintenance expenses of the ADR program. The depositary has agreed to reimburse us for its continuing annual stock exchange listing fees. The depositary has also agreed to pay the standard out-of-pocket maintenance costs for the ADRs, which consist of the expenses of postage and envelopes for mailing annual and interim financial reports, printing and distributing dividend checks, electronic filing of U.S. Federal tax information, mailing required tax forms, stationery, postage, facsimile, and telephone calls. It has also agreed to reimburse us annually for certain investor relationship programs or special investor relations promotional activities. In certain instances, the depositary has agreed to provide additional payments to us based on any applicable performance indicators relating to the ADR facility. There are limits on the amount of expenses for which the depositary will reimburse us, but the amount of reimbursement available to us is not necessarily tied to the amount of fees the depositary collects from investors.
The depositary collects its fees for delivery and surrender of ADRs directly from investors depositing shares or surrendering ADRs for the purpose of withdrawal or from intermediaries acting for them. The depositary collects fees for making distributions to investors by deducting those fees from the amounts distributed or by selling a portion of distributable property to pay the fees. The depositary may collect its annual fee for depositary services by deduction from cash distributions or by directly billing investors or by charging the book-entry system accounts of participants acting for them. The depositary may generally refuse to provide fee-attracting services until its fees for those services are paid.
ITEM 13. DEFAULTS, DIVIDEND ARREARAGES AND DELINQUENCIES
Not applicable.
ITEM 14. MATERIAL MODIFICATIONS TO THE RIGHTS OF SECURITY HOLDERS AND USE OF PROCEEDS
In 1996, our shareholders approved the Reclassification of Capital Stock, which we refer to as the “Reclassification,” of our common stock into two new series of shares. Pursuant to the Reclassification, each outstanding share of our common stock was replaced by one newly issued Series A share and one newly issued Series B share.
The Series A and Series B shares are principally differentiated by their voting and economic rights. The modification of our bylaws as of June 25, 2012, increased the number of directors from 7 to 14. The holders of the Series A shares have full voting power and are entitled to elect 12 of 14 members of the board of directors, and the holders of the Series B shares have no voting rights but for the right to elect 2 members of the board of directors. In addition, holders of Series B shares are entitled to a dividend 10% greater than any dividend on Series A shares.
After the Reclassificaction, the Superintendence of Pension Fund Managers ( Superintendencia de Administradores de Fondos de Pensiones ) decreed that Chilean pension funds would not be permitted to acquire Series B Shares due to their limited voting rights. Later, during 2004, the Superintendence approved Series B shares as investment instruments for Chilean Pension funds. Series A shares have always been eligible as investment instruments.
ITEM 15. CONTROLS AND DISCLOSURE PROCEDURES
Disclosure Controls and Procedures
We have evaluated, with the participation of our chief executive officer and chief financial officer, the effectiveness of our disclosure controls and procedures as of December 31, 2014. There are inherent limitations to the effectiveness of any system of disclosure controls and procedures, including the possibility of human error and the circumvention or overriding of the controls and procedures. Accordingly, even effective disclosure controls and procedures can only provide reasonable assurance of achieving their control objectives. Based upon our evaluation, our chief executive officer and chief financial officer concluded that our disclosure controls and procedures were effective to provide reasonable assurance that information required to be disclosed by us in the reports that we file or submit under the Exchange Act is recorded, processed, summarized and reported, within the time periods specified in the applicable rules and forms, and that it is accumulated and communicated to our management, including our chief executive officer and chief financial officer, as appropriate to allow timely decisions regarding required disclosure.
Management’s Annual Report on Internal Control Over Financial Reporting
Our management is responsible for establishing and maintaining adequate internal control over financial reporting, as such term is defined in Rules 13a—15(f) and 15d—15(f) under the Securities Exchange Act of 1934, as amended. Under the supervision and with the participation of our management, including our chief executive officer and chief financial officer, we conducted an evaluation of effectiveness of our internal control over financial reporting based on the framework in Internal Control—Integrated Framework (1992) issued by the Committee of Sponsoring Organizations of the Treadway Commission.
Our internal control over financial reporting is a process designed to provide reasonable assurance regarding the reliability of financial reporting and the preparation of financial statements for external purposes in accordance with IFRS as issued by the IASB. Our internal control over financial reporting includes those policies and procedures that (i) pertain to maintenance of records that, in reasonable detail, accurately and fairly reflect the transactions and dispositions or our assets; (ii) provide reasonable assurance that transactions are recorded as necessary to permit preparation of financial statements in accordance with IFRS as issued by the IASB, and that
our receipts an expenditures are being made only in accordance with authorizations of our management and directors; and (iii) provide reasonable assurance regarding prevention or timely detection of unauthorized acquisition, use, or disposition of our assets that could have a material effect on our financial statements.
Because of its inherent limitations, internal control over financial reporting may not prevent or detect misstatements. Also, projections of any evaluation of effectiveness to future periods are subject to the risk that controls may become inadequate because of changes in conditions, or that the degree of compliance with the policies or procedures may deteriorate. Based on our evaluation under the framework in Internal Controls—Integrated framework (1992) issued by the Committee of Sponsoring Organizations of the Tread way Commission, our management concluded that our internal control over financial reporting was effective as of December 31, 2014.
The effectiveness of our internal control over financial reporting as of December 31, 2014 has been audited by our registered independent accounting firm, which opinion is stated in their report, included on pages F-2 and F-3 herein.
Attestation Report of the Registered Public Accounting Firm

REPORT OF INDEPENDENT REGISTERED PUBLIC ACCOUNTING FIRM
Santiago, April 30, 2015
To the Shareholders and the Board of Directors of
Embotelladora Andina S.A.
In our opinion, the accompanying consolidated statement of financial position and the related consolidated statement of income, comprenhensive income, cash flows and of changes in equity present fairly, in all material respects, the financial position of Embotelladora Andina S.A. and its subsidiaries at December 31, 2014 and 2013, and the results of their operations and their cash flows for each of the years then ended in conformity with International Financial Reporting Standards as issued by the International Accounting Standards Board. Also in our opinion, the Company maintained, in all material respects, effective internal control over financial reporting as of December 31, 2014, based on criteria established in Internal Control - Integrated Framework (1992) issued by the Committee of Sponsoring Organizations of the Treadway Commission (COSO). The Company’s management is responsible for these financial statements, for maintaining effective internal control over financial reporting and for its assessment of the effectiveness of internal control over financial reporting, included in Management’s Annual Report on Internal Control over Financial Reporting appearing under Item 15. Our responsibility is to express opinions on these financial statements and on the Company’s internal control over financial reporting based on our integrated audits. We conducted our audits in accordance with the standards of the Public Company Accounting Oversight Board (United States). Those standards require that we plan and perform the audits to obtain reasonable assurance about whether the financial statements are free of material misstatement and whether effective internal control over financial reporting was maintained in all material respects. Our audits of the financial statements included examining, on a test basis, evidence supporting the amounts and disclosures in the financial statements, assessing the accounting principles used and significant estimates made by management, and evaluating the overall financial statement presentation. Our audit of internal control over financial reporting included obtaining an understanding of internal control over financial reporting, assessing the risk that a material weakness exists, and testing and evaluating the design and operating effectiveness of internal control based on the assessed risk. Our audits also included performing such other procedures as we considered necessary in the circumstances. We believe that our audits provide a reasonable basis for our opinions.
A company’s internal control over financial reporting is a process designed to provide reasonable assurance regarding the reliability of financial reporting and the preparation of financial statements for external purposes in accordance with generally accepted accounting principles. A company’s internal control over financial reporting includes those policies and procedures that (i) pertain to the maintenance of records that, in reasonable detail, accurately and fairly reflect the transactions and dispositions of the assets of the company; (ii) provide reasonable assurance that transactions are recorded as necessary to permit preparation of financial statements in accordance with generally accepted accounting principles, and that receipts and expenditures of the company are being made only in accordance with authorizations of management and directors of the company; and (iii) provide reasonable assurance regarding prevention or timely detection of unauthorized acquisition, use, or disposition of the company’s assets that could have a material effect on the financial statements.
|
PwC Chile, Av. Andrés Bello 2711 - piso 5, Las Condes - Santiago, Chile RUT: 81.513.400-1 | Teléfono: (562) 22940 0000 | www.pwc.cl |
|
Because of its inherent limitations, internal control over financial reporting may not prevent or detect misstatements. Also, projections of any evaluation of effectiveness to future periods are subject to the risk that controls may become inadequate because of changes in conditions, or that the degree of compliance with the policies or procedures may deteriorate.
/s/ PricewaterhouseCoopers
Santiago, Chile
April 30, 2015
Changes in Internal Control Over Financial Reporting
There have been no changes in our internal control over financial reporting identified in connection with the evaluation required under Rules 13a-15 or 15d-15 that occurred during the period covered by this annual report that has materially affected, or is reasonably likely to materially affect, our internal control over financial reporting.
ITEM 16A. AUDIT COMMITTEE FINANCIAL EXPERT
Our board of directors has designated Mr. Gonzalo Parot Palma as our Audit Committee Financial Expert, as defined in the instructions to Item 16A of Form 20-F. Our board of directors has also determined that Mr. Gonzalo Parot Palma is an Independent Director as defined in Section 303A.02 of the NYSE’s Listed Company Manual.
We have adopted a Code of Ethics that constitutes a code of ethics for our directors and employees. This Code applies to our Board of Directors, chief executive officer and all senior financial officers of our Company, including the chief financial officer or any other persons performing similar functions, as well as to all other officers and employees of the Company. Our Code of Ethics is available on our website www.koandina.com. If we make any substantive amendment to the Code or grant any waivers, including any implicit waiver, from a provision of the Code, we will disclose the nature of such amendment or waiver on the above mentioned website through a 6-K form.
ITEM 16C. PRINCIPAL ACCOUNTANT FEES AND SERVICES
Fees Paid To Independent Public Accountants
The following table sets forth, for each of the years indicated, the kinds of fees paid to our external auditors and the percentage of each of the fees out of the total amount paid to them.
|
|
|
Year ended December 31, |
|
||||||
|
|
|
2013 |
|
2014 |
|
||||
|
Services rendered |
|
Fees
|
|
% of
|
|
Fees
|
|
% of
|
|
|
Audit fees(1) |
|
706 |
|
74 |
% |
889 |
|
94 |
% |
|
Audit-related fees(2) |
|
180 |
|
19 |
% |
28 |
|
3 |
% |
|
Tax fees(3) |
|
23 |
|
2 |
% |
18 |
|
2 |
% |
|
Other fees |
|
47 |
|
5 |
% |
10 |
|
1 |
% |
|
Total |
|
956 |
|
100 |
% |
945 |
|
100 |
% |
(1) Audit fees consist of services that would normally be provided in connection with statutory and regulatory filings or engagements, including services that generally only the independent accountant can reasonably provide.
(2) Audit-related fees relate to assurance and associated services that traditionally are performed by the independent accountant, including: attest services that are not required by statute or regulation; accounting consultation and audits in connection with mergers, acquisitions and divestitures; employee benefit plans audits; and consultation concerning financial accounting and reporting standards.
(3) Tax fees relate to services performed by the tax division for tax compliance, planning, and advice.
Directors’ Committee and Audit Committee Pre-Approval Policies and Procedures
We have adopted pre-approval policies and procedures under which all non-audit services provided by our external auditors must be pre-approved by our Directors’ Committee. Once the proposed service is approved, our subsidiaries or we formalize the engagement of services. In addition, the members of our board of directors are briefed on matters discussed by the Directors’ Committee.
ITEM 16D. EXEMPTIONS FROM THE LISTING STANDARDS FOR AUDIT COMMITTEES
Our Audit Committee is comprised of Gonzalo Parot Palma, Salvador Said Somavía and Arturo Majlis Albala.
We disclose that, with respect to the current membership of Mr. Salvador Said Somavía and Mr. Arturo Majlis Albala on our Audit Committee, it has relied on the exemption from the independence requirements provided by Rule 10A-3(b)(1)(iv)(D) of the Securities and Exchange Act of 1934, as amended. Pursuant to said rule, a member of the Committee who is an affiliate of the foreign private issuer or a representative of such an affiliate; has only observer status on, and is not a voting member or the chair of, the audit committee; and is not an executive officer of the foreign private issuer, may be exempted from the independence requirement.
Mr. Arturo Majlis Albala and Mr. Salvador Said Somavía meet, for the duration of their membership, the requirements of Rule 10A-3(b)(1)(iv)(D) because they (i) are a representative of our controlling shareholder group; (ii) have an observer-only status on our Audit Committee;(iii) are not officers of us or any of our subsidiaries; and (iv) do not receive, directly or indirectly, compensation from us or any of our subsidiaries other than in their capacities as members of our Audit Committee.
Our reliance on the exemption provided by Rule 10A-3of the Exchange Act, with respect to Mr. Arturo Majlis Albala and Mr. Salvador Said Somavía, would not materially adversely affect the ability of our Audit Committee to act independently.
ITEM 16E. PURCHASERS OF EQUITY SECURITIES BY THE ISSUER AND AFFILIATED PURCHASERS
During 2014, no issuer or affiliated parties made purchases pursuant to publicly announced plans or programs or not pursuant to such plans.
Not applicable to this annual report.
NYSE and Chilean Corporate Governance Requirements
In accordance with Section 303A.11 of the NYSE’s Listed Company Manual, the following table sets forth significant differences between Chilean corporate governance practices and those corporate governance practices followed by domestic corporations under NYSE listing standards. Significant ways in which our corporate
governance practices differ from those followed by U.S. companies under NYSE listing standards are also publicly available on our website at www.koandina.com.
|
ITEM |
|
NYSE REQUIREMENTS |
|
CHILEAN LAW REQUIREMENTS |
|
|
|
|
|
|
|
303A.01
|
|
Members of the Board of Directors must be independent in their majority. |
|
There is no legal obligation to have a Board of Directors composed mainly of independent members. In addition, according to section 303A regarding Controlled Companies, the requirements of 303A do not apply to our Company. |
|
|
|
|
|
|
|
303A.02
|
|
Members of the Board of Directors must meet the Test of Independence. |
|
No similar legal obligation exists under Chilean law. However, article 50 bis of the Corporations Law require appointing at least one independent director. Law considers independent such director that within the last 18 months is not involved in certain circumstances, such as: having an economic interest in the company or other group, having a relationship with such persons, be director of nonprofit organizations, among others, and comply with a declaration of independence. |
|
|
|
|
|
|
|
303A.03
|
|
Non-Management Directors must meet regularly without management of the company. |
|
No similar legal obligation exists under Chilean law. Under Chilean law, the position of director of a corporation is incompatible with the position of manager, auditor, accountant or president of the company. The Non-Management Director does not exist under Chilean law. Directors, however, are required to convene in legally established meetings to resolve matters required by Chilean Corporation Law. |
|
|
|
|
|
|
|
303A.04 Nominating/Corporate Governance Committee |
|
Listed companies must have a Nominating/Corporate Governance Committee composed entirely of independent directors and must have a written charter addressing certain matters. |
|
There is no similar legal obligation under Chilean law.Andina has a Directors’ Committee whose functions are set by Chilean Corporation Law. In addition, section 303 A regarding Controlled Companies does not apply to our Company |
|
|
|
|
|
|
|
303A.05
|
|
Listed companies must have a Compensation Committee composed entirely of independent directors, and must have a written charter addressing certain matters. |
|
There is no similar legal obligation under Chilean law. In accordance with Chilean law, the above-mentioned Directors’ Committee is in charge of reviewing management compensation. In addition, section 303 A regarding Controlled Companies does not apply to our Company. |
|
ITEM |
|
NYSE REQUIREMENTS |
|
CHILEAN LAW REQUIREMENTS |
|
|
|
|
|
|
|
303A.06
|
|
Listed companies must have an Audit Committee that satisfies the requirements of Rule 10A-3 under the Exchange Act.
|
|
No similar legal obligation exists under Chilean law. However, in accordance with the Chilean Public Companies Law 18,046, public companies that have a net worth of more than 1.5 million UFs and/or at least a 12,5% of its issued shares with voting rights are held by individual shareholders who control or own less than 10% of such shares must have a Directors’ Committee, formed by three members who are in their majority independent of the controller. Andina designated an Audit Committee in accordance with Rule 10 A.3.The functions of this committee are described under “Item 6. Directors, Senior Management and Employees-Board Practices” |
|
|
|
|
|
|
|
303A.07
|
|
Listed companies must maintain an Internal Audit Function to provide management and the Audit Committee with ongoing assessments of the company’s risk management processes and systems of internal control. A listed company may choose to outsource this function to a third party service provider other than its independent auditor. |
|
There is no similar obligation under Chilean law. Chilean law requires that companies must have both account inspectors and external auditors. However, Andina has an Internal Auditor who reports to the Audit Committee. |
|
|
|
|
|
|
|
303A.08
|
|
Shareholders must have the opportunity to vote on the creation or amendment of compensation plans regarding board members, executives and employees. |
|
There is no similar obligation under Chilean law, with the exception of Directors’ compensation which annually approved during the General Shareholders’ Meeting. |
|
|
|
|
|
|
|
303A.09
|
|
Listed companies must adopt and disclose Corporate Governance Practices. |
|
Chilean Law does not require the adoption of Corporate Governance Practices because they have been established by Chilean Corporate Law. However, the Superintendency of Securities and Insurance in General Rule No. 341 requires publicly traded corporations to report their corporate governance practices. |
|
ITEM |
|
NYSE REQUIREMENTS |
|
CHILEAN LAW REQUIREMENTS |
|
|
|
|
|
|
|
303A.10
|
|
A company must adopt a Code of Business Conduct for its directors, officers and employees. Such company must disclose any waiver of its code of conduct that is granted to an officer or director. |
|
There is no legal obligation to adopt a Code of Business Conduct. Chilean law requires that a company have a set of internal regulations which regulate the company and its relations with personnel. Such regulations must contain, among other things, regulations related to ethics and good behavior. Notwithstanding the above, a company may create internal codes of conduct, provided they do not require or prohibit behavior that contravenes Chilean law. In 1996, Andina created a Code of Ethics and Business Conduct that applies to the entire Company. Andina has posted this information on its website www.koandina.com |
|
|
|
|
|
|
|
303A.11
|
|
A company must provide a summary description of significant differences between its home country corporate governance practices and the corporate governance requirements established by the NYSE as applicable to U.S. domestic listed companies |
|
No similar obligation exists under Chilean law. However, Andina has posted this information on its website www.koandina.com |
|
|
|
|
|
|
|
303A.12
|
|
Each listed company CEO must certify to the NYSE each year that he or she is not aware of any violation by the company of NYSE corporate governance listing standards. Each listed company CEO must promptly notify the NYSE in writing after any executive officer of the listed company becomes aware of any material non-compliance with any of the applicable provisions of Section 303 A. Each listed company must submit an executed Written Affirmation annually to the NYSE. In addition, each listed company must submit an interim Written Affirmation each time a change occurs to the Board of Directors or any of the committees subject to Section 303 A. The annual and interim Written Affirmations must be in the form specified by the NYSE. |
|
No similar obligation exists under Chilean law. However, in accordance with Chilean law, the directors of a company must annually submit for approval the company’s annual report and financial statements to its shareholders at the company’s annual shareholders’ meeting. Similarly, public companies must, from time to time, provide all relevant company information by means of the publications and notifications established by law. |
|
ITEM |
|
NYSE REQUIREMENTS |
|
CHILEAN LAW REQUIREMENTS |
|
|
|
|
|
|
|
303A.13
|
|
The NYSE may issue a Public Reprimand letter to any listed company, regardless of the type of security listed or country of incorporation if it determines the company has violated a NYSE listing standard. |
|
No similar obligation exists under Chilean law, with the exception of sanctions imposed by the Chilean Superintendence of Securities and Insurance (SVS). |
|
|
|
|
|
|
|
307
|
|
Listed Companies must have a company website which is accessible from the United States. The website must contain its all NYSE requirements including those referring to Corporate Governance. |
|
Chilean law does not require listed companies to maintain a website. However, if a listed company does have a website, the company must make available on its website certain information required by the rules under Chilean Company Law N° 18,046. |
ITEM 16H. MINE SAFETY DISCLOSURE
Not applicable.
Reference is made to Item 18 for a list of all financial statements filed as part of this annual report.
The following financial statements, together with the report of independent registered accounting firm, are filed as part of this Annual Report:
SIGNATURES
The registrant hereby certifies that it meets all of the requirements for filing on Form 20-F and that it has duly caused and authorized the undersigned to sign this annual report on its behalf.
|
|
Embotelladora Andina S.A. |
||||
|
|
(Registrant) |
||||
|
|
|
||||
|
|
|
||||
|
|
/s/ Miguel Ángel Peirano |
|
/s/ Andrés Wainer/ |
||
|
|
(Signature) |
||||
|
|
|
||||
|
|
|
||||
|
Date: |
April 30, 2015 |
|
|
||

EMBOTELLADORA ANDINA S.A. AND SUBSIDIARIES
Consolidated Statements of Financial Position
as of December 31, 2014 and 2013

EMBOTELLADORA ANDINA S.A. AND SUBSIDIARIES
Consolidated Statements of Financial Position
INDEX

REPORT OF INDEPENDENT REGISTERED PUBLIC ACCOUNTING FIRM
Santiago, April 30, 2015
To the Shareholders and the Board of Directors of
Embotelladora Andina S.A.
In our opinion, the accompanying consolidated statement of financial position and the related consolidated statement of income, comprenhensive income, cash flows and of changes in equity present fairly, in all material respects, the financial position of Embotelladora Andina S.A. and its subsidiaries at December 31, 2014 and 2013, and the results of their operations and their cash flows for each of the years then ended in conformity with International Financial Reporting Standards as issued by the International Accounting Standards Board. Also in our opinion, the Company maintained, in all material respects, effective internal control over financial reporting as of December 31, 2014, based on criteria established in Internal Control - Integrated Framework (1992) issued by the Committee of Sponsoring Organizations of the Treadway Commission (COSO). The Company’s management is responsible for these financial statements, for maintaining effective internal control over financial reporting and for its assessment of the effectiveness of internal control over financial reporting, included in Management’s Annual Report on Internal Control over Financial Reporting appearing under Item 15. Our responsibility is to express opinions on these financial statements and on the Company’s internal control over financial reporting based on our integrated audits. We conducted our audits in accordance with the standards of the Public Company Accounting Oversight Board (United States). Those standards require that we plan and perform the audits to obtain reasonable assurance about whether the financial statements are free of material misstatement and whether effective internal control over financial reporting was maintained in all material respects. Our audits of the financial statements included examining, on a test basis, evidence supporting the amounts and disclosures in the financial statements, assessing the accounting principles used and significant estimates made by management, and evaluating the overall financial statement presentation. Our audit of internal control over financial reporting included obtaining an understanding of internal control over financial reporting, assessing the risk that a material weakness exists, and testing and evaluating the design and operating effectiveness of internal control based on the assessed risk. Our audits also included performing such other procedures as we considered necessary in the circumstances. We believe that our audits provide a reasonable basis for our opinions.
A company’s internal control over financial reporting is a process designed to provide reasonable assurance regarding the reliability of financial reporting and the preparation of financial statements for external purposes in accordance with generally accepted accounting principles. A company’s internal control over financial reporting includes those policies and procedures that (i) pertain to the maintenance of records that, in reasonable detail, accurately and fairly reflect the transactions and dispositions of the assets of the company; (ii) provide reasonable assurance that transactions are recorded as necessary to permit preparation of financial statements in accordance with generally accepted accounting principles, and that receipts and expenditures of the company are being made only in accordance with authorizations of management and directors of the company; and (iii) provide reasonable assurance regarding prevention or timely detection of unauthorized acquisition, use, or disposition of the company’s assets that could have a material effect on the financial statements.
|
PwC Chile, Av. Andrés Bello 2711 - piso 5, Las Condes - Santiago, Chile RUT: 81.513.400-1 | Teléfono: (562) 22940 0000 | www.pwc.cl |
|

Because of its inherent limitations, internal control over financial reporting may not prevent or detect misstatements. Also, projections of any evaluation of effectiveness to future periods are subject to the risk that controls may become inadequate because of changes in conditions, or that the degree of compliance with the policies or procedures may deteriorate.
/s/ PricewaterhouseCoopers
Santiago, Chile
April 30, 2015
Report of Independent Registered Public Accounting Firm
To the Shareholders and the Board of Directors of
Embotelladora Andina S.A.:
We have audited the accompanying consolidated income statement, statement of comprehensive income, changes in equity and cash flows of Embotelladora Andina S.A. and subsidiaries (“the Company”) for the year ended December 31, 2012. These financial statements are the responsibility of the Company’s management. Our responsibility is to express an opinion on these consolidated financial statements based on our audit.
We conducted our audit in accordance with the standards of the Public Company Accounting Oversight Board (United States). Those standards require that we plan and perform the audit to obtain reasonable assurance about whether the financial statements are free of material misstatement. An audit includes examining, on a test basis, evidence supporting the amounts and disclosures in the financial statements. An audit also includes assessing the accounting principles used and significant estimates made by management, as well as evaluating the overall financial statement presentation. We believe that our audit provides a reasonable basis for our opinion.
In our opinion, the consolidated financial statements referred to above present fairly, in all material respects, the consolidated results of operations and cash flows of Embotelladora Andina S.A. and subsidiaries for the year ended December 31, 2012, in conformity with International Financial Reporting Standards, as issued by the International Accounting Standards Board.
|
EY LTDA. |
/s/ Ernst & Young Ltda. |
Santiago, Chile, April 30, 2013
EMBOTELLADORA ANDINA S.A. AND SUBSIDIARIES
Consolidated Statements of Financial Pos ition
As of December 31, 2014 and 2013
(Translation of consolidated financial statements originally issued in Spanish — See Note 2.2)
|
ASSETS |
|
NOTE |
|
12.31.2014 |
|
12.31.2013 |
|
|
|
|
|
|
ThCh$ |
|
ThCh$ |
|
|
Current assets: |
|
|
|
|
|
|
|
|
Cash and cash equivalents |
|
5 |
|
79,514,434 |
|
79,976,126 |
|
|
Other financial assets |
|
6 |
|
106,577,042 |
|
36,471,637 |
|
|
Other non-financial assets |
|
7.1 |
|
7,787,181 |
|
9,695,804 |
|
|
Trade and other accounts receivable, net |
|
8 |
|
198,110,424 |
|
195,434,075 |
|
|
Accounts receivable from related parties |
|
12.1 |
|
5,994,453 |
|
8,028,987 |
|
|
Inventories |
|
9 |
|
149,727,618 |
|
125,853,991 |
|
|
Current tax assets |
|
10.2 |
|
6,025,049 |
|
3,989,697 |
|
|
Total current assets excluding assets held for sale |
|
|
|
553,736,201 |
|
459,450,317 |
|
|
Assets held for sale |
|
|
|
— |
|
1,133,769 |
|
|
Total Current Assets |
|
|
|
553,736,201 |
|
460,584,086 |
|
|
|
|
|
|
|
|
|
|
|
Non-Current Assets : |
|
|
|
|
|
|
|
|
Other financial assets |
|
6 |
|
51,026,773 |
|
7,922,287 |
|
|
Other non-financial assets |
|
7.2 |
|
33,056,780 |
|
28,796,153 |
|
|
Trade and other receivables |
|
8 |
|
7,097,809 |
|
7,631,253 |
|
|
Accounts receivable from related parties |
|
12.1 |
|
24,752 |
|
18,765 |
|
|
Investments accounted for under the equity method |
|
14.1 |
|
66,050,213 |
|
68,673,399 |
|
|
Intangible assets other than goodwill |
|
15.1 |
|
728,181,279 |
|
700,606,492 |
|
|
Goodwill |
|
15.2 |
|
116,924,199 |
|
115,779,067 |
|
|
Property, plant and equipment |
|
11.1 |
|
713,075,285 |
|
692,949,808 |
|
|
Total Non-Current Assets |
|
|
|
1,715,437,090 |
|
1,622,377,224 |
|
|
Total Assets |
|
|
|
2,269,173,291 |
|
2,082,961,310 |
|
The accompanying notes 1 to 30 form an integral part of these financial statements
EMBOTELLADORA ANDINA S.A. AND SUBSIDIARIES
Consolidated Statements of Financial Position
As of December 31, 2014 and 2013
(Translation of consolidated financial statements originally issued in Spanish — See Note 2.2)
|
LIABILITIES AND EQUITY |
|
NOTE |
|
12.31.2014 |
|
12.31.2013 |
|
|
|
|
|
|
ThCh$ |
|
ThCh$ |
|
|
LIABILITIES |
|
|
|
|
|
|
|
|
|
|
|
|
|
|
|
|
|
Current Liabilities : |
|
|
|
|
|
|
|
|
Other financial liabilities |
|
16 |
|
83,402,440 |
|
106,877,255 |
|
|
Trade and other accounts payable |
|
17 |
|
228,179,112 |
|
210,446,298 |
|
|
Accounts payable to related parties |
|
12.2 |
|
55,966,789 |
|
43,425,287 |
|
|
Provisions |
|
18 |
|
365,832 |
|
269,906 |
|
|
Income taxes payable |
|
10.2 |
|
2,931,206 |
|
3,679,057 |
|
|
Other non-financial liabilities |
|
19 |
|
39,367,048 |
|
37,446,336 |
|
|
Total Current Liabilities |
|
|
|
410,212,427 |
|
402,144,139 |
|
|
|
|
|
|
|
|
|
|
|
Non-Current Liabilities: |
|
|
|
|
|
|
|
|
Other financial liabilities |
|
16 |
|
726,616,440 |
|
605,362,059 |
|
|
Trade and other payables |
|
|
|
1,216,434 |
|
1,262,043 |
|
|
Provisions |
|
18 |
|
77,446,513 |
|
77,542,388 |
|
|
Deferred income tax liabilities |
|
10.4 |
|
126,126,147 |
|
105,537,484 |
|
|
Post-employment benefit liabilities |
|
13.3 |
|
8,125,107 |
|
8,758,111 |
|
|
Other non-financial liabilities |
|
19 |
|
432,490 |
|
922,498 |
|
|
Total Non-Current Liabilities |
|
|
|
939,963,131 |
|
799,384,583 |
|
|
|
|
|
|
|
|
|
|
|
Equity: |
|
20 |
|
|
|
|
|
|
Issued capital |
|
|
|
270,737,574 |
|
270,737,574 |
|
|
Retained earnings |
|
|
|
247,817,939 |
|
243,192,801 |
|
|
Other reserves |
|
|
|
378,738,982 |
|
346,738,667 |
|
|
Equity attributable to equity holders of the parent |
|
|
|
897,294,495 |
|
860,669,042 |
|
|
Non-controlling interests |
|
|
|
21,703,238 |
|
20,763,546 |
|
|
Total Equity |
|
|
|
918,997,733 |
|
881,432,588 |
|
|
Total Liabilities and Equity |
|
|
|
2,269,173,291 |
|
2,082,961,310 |
|
The accompanying notes 1 to 30 form an integral part of these financial statements
EMBOTELLADORA ANDINA S.A. AND SUBSIDIARIES
Consolidated Statements of Income by Function for t he years ended
December 31, 2014, 2013 and 2012
(Translation of consolidated financial statements originally issued in Spanish — See Note 2.2)
|
|
|
NOTE |
|
12.31.2014 |
|
12.31.2013 |
|
12.31.2012 |
|
|
|
|
|
|
ThCh$ |
|
ThCh$ |
|
ThCh$ |
|
|
Net sales |
|
|
|
1,797,199,877 |
|
1,521,681,335 |
|
1,172,292,817 |
|
|
Cost of sales |
|
24 |
|
(1,081,243,408 |
) |
(914,817,748 |
) |
(698,955,215 |
) |
|
Gross Profit |
|
|
|
715,956,469 |
|
606,863,587 |
|
473,337,602 |
|
|
Other income |
|
25 |
|
6,743,691 |
|
6,434,020 |
|
3,265,998 |
|
|
Distribution expenses |
|
24 |
|
(187,042,843 |
) |
(163,022,685 |
) |
(122,818,941 |
) |
|
Administrative expenses |
|
24 |
|
(342,140,932 |
) |
(272,556,438 |
) |
(196,355,000 |
) |
|
Other expenses |
|
26 |
|
(18,591,271 |
) |
(30,462,097 |
) |
(15,420,008 |
) |
|
Other (losses) gains |
|
28 |
|
(4,392,105 |
) |
740,373 |
|
(2,336,215 |
) |
|
Financial income |
|
27 |
|
8,655,623 |
|
4,973,312 |
|
2,728,059 |
|
|
Financial expenses |
|
27 |
|
(65,081,431 |
) |
(28,944,023 |
) |
(11,172,753 |
) |
|
Share of profit of investments accounted for using the equity method |
|
14.3 |
|
1,190,969 |
|
783,418 |
|
1,769,898 |
|
|
Foreign exchange differences |
|
|
|
(2,675,027 |
) |
(7,694,834 |
) |
(4,471,031 |
) |
|
Loss from differences in indexed financial assets and liabilities |
|
|
|
(15,234,616 |
) |
(3,881,145 |
) |
(1,753,801 |
) |
|
Net income before income taxes |
|
|
|
97,388,527 |
|
113,233,488 |
|
126,773,808 |
|
|
Income tax expense |
|
10.3 |
|
(45,354,435 |
) |
(22,966,264 |
) |
(38,504,636 |
) |
|
Net income |
|
|
|
52,034,092 |
|
90,267,224 |
|
88,269,172 |
|
|
|
|
|
|
|
|
|
|
|
|
|
Net income attributable to: |
|
|
|
|
|
|
|
|
|
|
Equity holders of the parent |
|
|
|
51,875,084 |
|
88,982,678 |
|
87,636,961 |
|
|
Non-controlling interests |
|
|
|
159,008 |
|
1,284,546 |
|
632,211 |
|
|
Net income |
|
|
|
52,034,092 |
|
90,267,224 |
|
88,269,172 |
|
|
|
|
|
|
|
|
|
|
|
|
|
|
|
|
|
Ch$ |
|
Ch$ |
|
Ch$ |
|
|
Earnings per Share, basic and diluted |
|
|
|
|
|
|
|
|
|
|
Earnings per Series A Share |
|
20.5 |
|
52.19 |
|
89.53 |
|
104.12 |
|
|
Earnings per Series B Share |
|
20.5 |
|
57.41 |
|
98.48 |
|
114.53 |
|
The accompanying notes 1 to 30 form an integral part of these financial statements
EMBOTELLADORA ANDINA S.A. AND SUBSIDIARIES
Consolidated Statements of Comprehensi ve Income
for the years ended December 31, 2014, 2013 and 2012
(Translation of consolidated financial statements originally issued in Spanish — See Note 2.2)
|
|
|
12.31.2014 |
|
12.31.2013 |
|
12.31.2012 |
|
|
|
|
ThCh$ |
|
ThCh$ |
|
ThCh$ |
|
|
Net income |
|
52,034,092 |
|
90,267,224 |
|
88,269,172 |
|
|
Other Comprehensive Income: |
|
|
|
|
|
|
|
|
Components of other comprehensive income that are not reclassified to net income for the period, before taxes |
|
|
|
|
|
|
|
|
Actuarial losses from defined benefit plans |
|
(140,749 |
) |
(1,411,030 |
) |
— |
|
|
Components of other comprehensive income that will be reclassified to net income for the period, before taxes |
|
|
|
|
|
|
|
|
Gains (losses) from exchange rate translation differences |
|
28,309,535 |
|
(18,877,527 |
) |
(42,186,310 |
) |
|
Gains from cash flow hedges |
|
5,909,129 |
|
2,961,146 |
|
— |
|
|
Income tax related to components of other comprehensive income that are not reclassified to net income for the period |
|
|
|
|
|
|
|
|
Income tax benefit related to defined benefit plans |
|
31,580 |
|
282,206 |
|
— |
|
|
Income tax related to components of other comprehensive income that will be reclassified to net income for the period |
|
|
|
|
|
|
|
|
Income tax, related to exchange rate translation differences |
|
663,705 |
|
1,096,509 |
|
1,089,225 |
|
|
Income tax related to cash flow hedges |
|
(2,041,658 |
) |
(703,002 |
) |
— |
|
|
Total comprehensive income |
|
84,765,634 |
|
73,615,526 |
|
47,172,087 |
|
|
Total comprehensive income attributable to: |
|
|
|
|
|
|
|
|
Equity holders of the parent |
|
83,875,399 |
|
72,139,832 |
|
46,541,295 |
|
|
Non-controlling interests |
|
890,234 |
|
1,475,694 |
|
630,792 |
|
|
Total comprehensive income |
|
84,765,634 |
|
73,615,526 |
|
47,172,087 |
|
The accompanying notes 1 to 30 form an integral part of these financial statements
EMBOTELLADORA ANDINA S.A. AND SUBSIDIARIES
Consolidated Statement of Changes in Equi ty
for the years ended December 31, 2014, 2013 and 2012
(Translation of consolidated financial statements originally issued in Spanish — See Note 2.2)
|
|
|
|
|
|
|
Other reserves |
|
|
|
|
|
|
|
|
|
||||||||
|
|
|
Issued capital |
|
Treasury
|
|
Translation
|
|
Cash flow
|
|
Actuarial gains
|
|
Other
|
|
Total
|
|
Retained
|
|
Controlling Equity |
|
Non-Controlling
|
|
Total Equity |
|
|
|
|
ThCh$ |
|
ThCh$ |
|
ThCh$ |
|
ThCh$ |
|
ThCh$ |
|
ThCh$ |
|
ThCh$ |
|
ThCh$ |
|
ThCh$ |
|
ThCh$ |
|
ThCh$ |
|
|
Opening balance at 01.01.2014 |
|
270,737,574 |
|
— |
|
(81,527,711 |
) |
2,258,144 |
|
(1,128,824 |
) |
427,137,058 |
|
346,738,667 |
|
243,192,801 |
|
860,669,042 |
|
20,763,546 |
|
881,432,588 |
|
|
Changes in Equity |
|
|
|
|
|
|
|
|
|
|
|
|
|
|
|
|
|
|
|
|
|
|
|
|
Comprehensive Income |
|
|
|
|
|
|
|
|
|
|
|
|
|
|
|
|
|
|
|
|
|
|
|
|
Net income |
|
— |
|
— |
|
— |
|
— |
|
— |
|
— |
|
— |
|
51,875,084 |
|
51,875,084 |
|
159,008 |
|
52,034,092 |
|
|
Other comprehensive income |
|
— |
|
— |
|
28,242,013 |
|
3,867,471 |
|
(109,169 |
) |
— |
|
32,000,315 |
|
— |
|
32,000,315 |
|
731,227 |
|
32,731,542 |
|
|
Comprehensive income |
|
— |
|
— |
|
28,242,013 |
|
3,867,471 |
|
(109,169 |
) |
— |
|
32,000,315 |
|
51,875,084 |
|
83,875,399 |
|
890,235 |
|
84,765,634 |
|
|
Dividends |
|
— |
|
— |
|
— |
|
— |
|
— |
|
— |
|
— |
|
(47,249,946 |
) |
(47,249,946 |
) |
49,457 |
|
(47,200,489 |
) |
|
Total changes in equity |
|
— |
|
— |
|
28,242,013 |
|
3,867,471 |
|
(109,169 |
) |
— |
|
32,000,315 |
|
4,625,138 |
|
36,625,453 |
|
939,692 |
|
37,565,145 |
|
|
Ending balance at 12.31.2014 |
|
270,737,574 |
|
— |
|
(53,285,698 |
) |
6,125,615 |
|
(1,237,993 |
) |
427,137,058 |
|
378,738,982 |
|
247,817,939 |
|
897,294,495 |
|
21,703,238 |
|
918,997,733 |
|
|
|
|
|
|
|
|
Other reserves |
|
|
|
|
|
|
|
|
|
||||||||
|
|
|
Issued capital |
|
Treasury
|
|
Translation
|
|
Cash flow
|
|
Actuarial gains
|
|
Other
|
|
Total
|
|
Retained
|
|
Controlling Equity |
|
Non-Controlling
|
|
Total Equity |
|
|
|
|
ThCh$ |
|
ThCh$ |
|
ThCh$ |
|
ThCh$ |
|
ThCh$ |
|
ThCh$ |
|
ThCh$ |
|
ThCh$ |
|
ThCh$ |
|
ThCh$ |
|
ThCh$ |
|
|
Opening balance at 01.01.2013 |
|
270,759,299 |
|
(21,725 |
) |
(63,555,545 |
) |
— |
|
— |
|
427,137,058 |
|
363,581,513 |
|
239,844,662 |
|
874,163,749 |
|
19,441,172 |
|
893,604,921 |
|
|
Changes in Equity |
|
|
|
|
|
|
|
|
|
|
|
|
|
|
|
|
|
|
|
|
|
|
|
|
Comprehensive Income |
|
|
|
|
|
|
|
|
|
|
|
|
|
|
|
|
|
|
|
|
|
|
|
|
Net income |
|
— |
|
— |
|
— |
|
— |
|
— |
|
— |
|
— |
|
88,982,678 |
|
88,982,678 |
|
1,284,546 |
|
90,267,224 |
|
|
Other comprehensive income |
|
— |
|
— |
|
(17,972,166 |
) |
2,258,144 |
|
(1,128,824 |
) |
— |
|
(16,842,846 |
) |
— |
|
(16,842,846 |
) |
191,148 |
|
(16,651,698 |
) |
|
Comprehensive income |
|
— |
|
— |
|
(17,972,166 |
) |
2,258,144 |
|
(1,128,824 |
) |
— |
|
(16,842,846 |
) |
88,982,678 |
|
72,139,832 |
|
1,475,694 |
|
73,615,526 |
|
|
Dividends |
|
— |
|
— |
|
— |
|
— |
|
— |
|
— |
|
— |
|
(85,634,539 |
) |
(85,634,539 |
) |
(153,320 |
) |
(85,787,859 |
) |
|
Decrease of Capital |
|
(21,725 |
) |
21,725 |
|
— |
|
— |
|
— |
|
— |
|
— |
|
— |
|
— |
|
— |
|
— |
|
|
Total changes in equity |
|
(21,725 |
) |
21,725 |
|
(17,972,166 |
) |
2,258,144 |
|
(1,128,824 |
) |
— |
|
(16,842,846 |
) |
3,348,139 |
|
(13,494,707 |
) |
1,322,374 |
|
(12,172,333 |
) |
|
Ending balance at 12.31.2013 |
|
270,737,574 |
|
— |
|
(81,527,711 |
) |
2,258,144 |
|
(1,128,824 |
) |
427,137,058 |
|
346,738,667 |
|
243,192,801 |
|
860,669,042 |
|
20,763,546 |
|
881,432,588 |
|
The accompanying notes 1 to 30 form an integral part of these financial statements
EMBOTELLADORA ANDINA S.A. AND SUBSIDIARIES
Consolidated Statement of Changes in Equi ty
for the years ended December 31, 2014, 2013 and 2012
(Translation of consolidated financial statements originally issued in Spanish — See Note 2.2)
|
|
|
|
|
|
|
Other reserves |
|
|
|
|
|
|
|
|
|
||||||||
|
|
|
Issued capital |
|
Treasury
|
|
Translation
|
|
Cash
|
|
Actuarial gains
|
|
Other reserves
|
|
Total
|
|
Retained
|
|
Controlling Equity |
|
Non-Controlling
|
|
Total Equity |
|
|
|
|
ThCh$ |
|
ThCh$ |
|
ThCh$ |
|
ThCh$ |
|
ThCh$ |
|
ThCh$ |
|
ThCh$ |
|
ThCh$ |
|
ThCh$ |
|
ThCh$ |
|
ThCh$ |
|
|
Opening balance at 01.01.2012 |
|
230,892,178 |
|
— |
|
(22,459,879 |
) |
— |
|
— |
|
5,435,538 |
|
(17,024,341 |
) |
208,102,068 |
|
421,969,905 |
|
9,015 |
|
421,978,920 |
|
|
Changes in Equity |
|
|
|
|
|
|
|
|
|
|
|
|
|
|
|
|
|
|
|
|
|
|
|
|
Comprehensive Income |
|
|
|
|
|
|
|
|
|
|
|
|
|
|
|
|
|
|
|
|
|
|
|
|
Net income |
|
— |
|
— |
|
— |
|
— |
|
— |
|
— |
|
— |
|
87,636,961 |
|
87,636,961 |
|
632,211 |
|
88,269,172 |
|
|
Other comprehensive income |
|
— |
|
— |
|
(41,095,666 |
) |
— |
|
— |
|
— |
|
(41,095,666 |
) |
— |
|
(41,095,666 |
) |
(1,419 |
) |
(41,097,085 |
) |
|
Comprehensive income |
|
— |
|
— |
|
(41,095,666 |
) |
— |
|
— |
|
— |
|
(41,095,666 |
) |
87,636,961 |
|
46,541,295 |
|
630,792 |
|
47,172,087 |
|
|
Equity Issuance-Polar acquisition |
|
39,867,121 |
|
— |
|
— |
|
— |
|
— |
|
421,701,520 |
|
421,701,520 |
|
— |
|
461,568,641 |
|
18,801,365 |
|
480,370,006 |
|
|
Dividends |
|
— |
|
— |
|
— |
|
— |
|
— |
|
— |
|
— |
|
(55,894,367 |
) |
(55,894,367 |
) |
— |
|
(55,894,367 |
) |
|
Purchase of treasury-shares |
|
— |
|
(21,725 |
) |
— |
|
— |
|
— |
|
— |
|
— |
|
— |
|
(21,725 |
) |
— |
|
(21,725 |
) |
|
Total changes in equity |
|
39,867,121 |
|
(21,725 |
) |
(41,095,666 |
) |
— |
|
— |
|
421,701,520 |
|
380,605,854 |
|
31,742,594 |
|
452,193,844 |
|
19,432,157 |
|
471,626,001 |
|
|
Ending balance at 12.31.2012 |
|
270,759,299 |
|
(21,725 |
) |
(63,555,545 |
) |
— |
|
— |
|
427,137,058 |
|
363,581,513 |
|
239,844,662 |
|
874,163,749 |
|
19,441,172 |
|
893,604,921 |
|
The accompanying notes 1 to 30 form an integral part of these financial statements
EMBOTELLADORA ANDINA S.A. AND SUBSIDIARIES
For the years ended December 31, 2014, 2013 and 2012
(Translation of consolidated financial statements originally issued in Spanish — See Note 2.2)
|
Cash flows provided by Operating Activities |
|
NOTE |
|
12.31.2014 |
|
12.31.2013 |
|
12.31.2012 |
|
|
|
|
|
|
ThCh$ |
|
ThCh$ |
|
ThCh$ |
|
|
Cash flows provided by Operating Activities |
|
|
|
|
|
|
|
|
|
|
Receipts from customers (including taxes) |
|
|
|
2,367,485,129 |
|
1,954,744,395 |
|
1,557,595,968 |
|
|
Receipts from premiums, claims, annuities and other policy benefits |
|
|
|
— |
|
77,300 |
|
— |
|
|
Payments for Operating Activities |
|
|
|
|
|
|
|
|
|
|
Payments to suppliers for goods and services (including taxes) |
|
|
|
(1,579,575,529 |
) |
(1,349,009,473 |
) |
(1,038,437,026 |
) |
|
Payments to employees |
|
|
|
(191,529,823 |
) |
(153,571,748 |
) |
(109,386,885 |
) |
|
Other payments for operating activities (v alue-added taxes on purchases, sales and others) |
|
|
|
(295,650,855 |
) |
(222,218,717 |
) |
(188,266,514 |
) |
|
Dividends received |
|
|
|
1,590,675 |
|
2,085,031 |
|
725,000 |
|
|
Interest payments |
|
|
|
(62,079,744 |
) |
(23,319,351 |
) |
(7,608,496 |
) |
|
Interest received |
|
|
|
5,332,755 |
|
3,295,309 |
|
1,874,032 |
|
|
Income tax payments |
|
|
|
(23,778,366 |
) |
(33,410,166 |
) |
(23,229,558 |
) |
|
Other cash movements (t ax on bank debits Argentina and others) |
|
|
|
(6,279,811 |
) |
(6,587,855 |
) |
(4,409,721 |
) |
|
Net cash flows generated from Operating Activities |
|
|
|
215,514,431 |
|
172,084,725 |
|
188,856,800 |
|
|
Cash flows used in Investing Activities |
|
|
|
|
|
|
|
|
|
|
Cash flows from the sale of equity investees (sale of investment in Leao Alimentos e Bebidas Ltd.) |
|
|
|
4,616,752 |
|
3,704,831 |
|
— |
|
|
Cash flows used to obtain control of subsidiaries or other businesses (Purchase Compañía de Bebidas Ipiranga) |
|
|
|
— |
|
(261,244,818 |
) |
— |
|
|
Cash flows used in the purchase of non-controlling interests (Purchase 40% Sorocaba Refrescos and capital contributions in Vital Jugos S.A. after its proportional sale) |
|
|
|
— |
|
— |
|
(35,877,240 |
) |
|
Cash flows from change in controls of subsidiaries and others (Capital decrease in Envases CMF S.A.) |
|
|
|
— |
|
— |
|
1,150,000 |
|
|
Proceeds from sale of property, plant and equipment |
|
|
|
2,273,241 |
|
6,861,329 |
|
611,634 |
|
|
Purchase of property, plant and equipment |
|
|
|
(114,216,855 |
) |
(183,697,386 |
) |
(143,763,670 |
) |
|
Proceeds from other long term assets (term deposits over 90 days) |
|
|
|
122,292,893 |
|
19,423,100 |
|
14,864,854 |
|
|
Purchase of other long term assets (term deposits over 90 days) |
|
|
|
(186,014,285 |
) |
(52,076,837 |
) |
(1,455,348 |
) |
|
Payments on forward, term, option and financial exchange agreements |
|
|
|
(702,959 |
) |
(873,453 |
) |
(1,360,880 |
) |
|
Receipts from forward, term, option and financial exchange agreements |
|
|
|
4,975,477 |
|
11,216,678 |
|
881,832 |
|
|
Other cash movements (cash opening balance Companhia de Bebidas Ipiranga in 2013 and Embotelladoras Coca Cola Polar in 2012 and others) |
|
|
|
— |
|
9,137,035 |
|
8,778,615 |
|
|
Net cash flows used in Investing Activities |
|
|
|
(166,775,736 |
) |
(447,549,521 |
) |
(156,170,203 |
) |
|
Cash Flows generated from (used in) Financing Activities |
|
|
|
|
|
|
|
|
|
|
Proceeds from long-term loans obtained |
|
|
|
73,087,596 |
|
403,245,077 |
|
61,053,312 |
|
|
Proceeds from short-term loans obtained |
|
|
|
106,645,178 |
|
246,038,498 |
|
197,968,578 |
|
|
Loan payments |
|
|
|
(167,480,619 |
) |
(271,177,359 |
) |
(192,768,709 |
) |
|
Payments of finance lease liabilities |
|
|
|
(6,903,487 |
) |
(1,959,307 |
) |
(16,438 |
) |
|
Purchase of treasury shares |
|
|
|
— |
|
— |
|
(21,725 |
) |
|
Dividend payments by the reporting entity |
|
|
|
(52,268,909 |
) |
(73,041,053 |
) |
(69,766,002 |
) |
|
Net cash flows generated by (used in) Financing Activities |
|
|
|
(46,920,241 |
) |
303,105,856 |
|
(3,550,984 |
) |
|
Net increase in cash and cash equivalents before exchange differences |
|
|
|
1,818,454 |
|
27,641,060 |
|
29,135,613 |
|
|
Effects of exchange differences on cash and cash equivalents |
|
|
|
(2,280,146 |
) |
(3,187,189 |
) |
(4,911,280 |
) |
|
Net increase (decrease) in cash and cash equivalents |
|
|
|
(461,692 |
) |
24,453,871 |
|
24,224,333 |
|
|
Cash and cash equivalents — beginning of year |
|
5 |
|
79,976,126 |
|
55,522,255 |
|
31,297,922 |
|
|
Cash and cash equivalents - end of year |
|
5 |
|
79,514,434 |
|
79,976,126 |
|
55,522,255 |
|
The accompanying notes 1 to 30 form an integral part of these financial statements
EMBOTELLADORA ANDINA S.A. AND SUBSIDIARIES
Notes to the Consolidated Financial Statements
(Translation of consolidated financial statements originally issued in Spanish — See Note 2.2)
Embotelladora Andina S.A. is registered under No. 00124 of the Securities Registry and is regulated by the Chilean Superintendence of Securities and Insurance (SVS) pursuant to Law 18.046.
The principal activities of Embotelladora Andina S.A. (hereafter “Andina,” and together with its subsidiaries, the “Company”) are to produce and sell Coca-Cola products and other Coca-Cola beverages. After the merger and recent acquisitions, the Company has operations in Chile, Brazil, Argentina and Paraguay. In Chile, the geographic areas in which the Company has distribution franchises are regions II, III, IV, XI, XII, Metropolitan Region, Rancagua and San Antonio. In Brazil, the Company has distribution franchises in the states of Rio de Janeiro, Espírito Santo, Niteroi, Vitoria, Nova Iguaçu, part of Sao Paulo and part of Minas Gerais. In Argentina, the Company has distribution franchises in the provinces of Mendoza, Córdoba, San Luis, Entre Ríos, Santa Fe, Rosario, Santa Cruz, Neuquén, El Chubut, Tierra del Fuego, Río Negro, La Pampa and the western zone of the Province of Buenos Aires. In Paraguay the franchised territory coveres the whole country . The Company has distribution licenses from The Coca-Cola Company in all of its territories: Chile, Brazil, Argentina and Paraguay. The licenses for the territories in Chile expire in 2018 and 2019; in Argentina expire in 2017; in Brazil expire in 2017; and the Paraguayan franchise expired in December 2014, and an extension has been granted until February 2015 within the normal renewal process, after which the long-term agreement should be signed or a new extension shall be granted until the long-term agreement is signed. All these licenses are issued at The Coca-Cola Company´s discretion. The Company currently expects that these licenses will be renewed with similar terms and conditions upon expiration .
As of December 31, 2014, the Freire Group and its related companies hold 55.68% of the outstanding shares with voting rights, corresponding to the Series A shares.
The head office of Embotelladora Andina S.A. is located on Miraflores 9153, municipality of Renca, Santiago, Chile. Its taxpayer identification number is 91.144.000-8 .
2.1 Periods covered
These consolidated financial statements encompass the following periods:
Consolidated statements of financial position : For the years ended at December 31, 2014 and 2013 .
Consolidated statements of income by function: For the periods from January 1 to December 31, 2014, 2013 and 2012.
Consolidated statements of comprehensive income : For the periods from January 1 to December 31, 2014, 2013 and 2012.
Consolidated statements of cash flows: For the periods from January 1 to December 31, 2014, 2013 and 2012, using the “direct method”.
Consolidated statements of changes in equity : For the periods between January 1 and December 31, 2014, 2013 and 2012 .
Rounding : The consolidated financial statements are presented in thousands of Chilean pesos and all values are rounded to the nearest thousand, except where otherwise indicated.
2.2 Basis of preparation
As explained in note 10.1, on September 29, 2014 Law No. 20,780 was issued, which introduces modifications to the income tax system in Chile and other tax matters. On October 17, 2014 the Chilean Superintendence of Securities and Insurance (the “SVS”) issued Circular No. 856, which established that the effects of the change in the income tax rates on deferred tax assets and liabilities must be recognized directly within “Retained earnings” instead of the income statement as required by IAS 12.
In order to comply with IAS 12, these financial statements are different to those presented to the SVS as the aforementioned effect has been recognized within the income statement. A reconciliation of such differences in presented as follows:
As of December 31, 2014
|
|
|
Consolidated
|
|
Consolidated
|
|
Difference |
|
|
|
|
ThCh$ |
|
ThCh$ |
|
ThCh$ |
|
|
Total Equity |
|
|
|
|
|
|
|
|
Equity holders of the parent |
|
|
|
|
|
|
|
|
Retained earnings |
|
|
|
|
|
|
|
|
Net income (loss) for the period |
|
51,875,084 |
|
75,490,235 |
|
(23,615,151 |
) |
|
Retained earnings for the last period |
|
195,942,855 |
|
172,327,704 |
|
23,615,151 |
|
|
Total retained earnings |
|
247,817,939 |
|
247,817,939 |
|
— |
|
|
|
|
|
|
|
|
|
|
|
Non-controlling interest |
|
|
|
|
|
|
|
|
Retained earnings |
|
|
|
|
|
|
|
|
Net income (loss) for the period |
|
159,008 |
|
317,203 |
|
(158,195 |
) |
|
Retained earnings for the last period |
|
21,544,230 |
|
21,386,035 |
|
158,195 |
|
|
Total retained earnings |
|
21,703,238 |
|
21,703,238 |
|
— |
|
The Company’s Consolidated Financial Statements for the years ended December 31, 2014 and 2013 were prepared in accordance with International Financial Reporting Standards (hereinafter “IFRS”) issued by the International Accounting Standards Board (hereinafter “IASB”).
The consolidated financial statements are presented under the historical cost criteria, although modified by the revaluation of certain financial instruments and derivative instruments.
The Company’s 2014 local statutory consolidated financial statements in spanish were approved by the Company’s Board of Directors on February 26, 2015, with subsequent events first being considered through that date. Those local statutory consolidated financial statements consisted of consolidated statement of financial position as of December, 31 2014 and 2013 along with consolidated income statement, consolidated statement of comprehensive income, consolidated statement of changes in equity, and consolidated statement of cash flows (and related disclosures), each for the two years then ended. Those consolidated financial statements were then subsequently approved by the Company’s shareholders during its April 22, 2015 meeting.
Included in this 2014 consolidated financial statements are consolidated statement of financial position as of December 31, 2014 and 2013, along with consolidated income statement, consolidated statement of comprehensive income, consolidated statement of changes in equity and consolidated statement of cash flows (and the related disclosures) for each of the three years ended December 31, 2014. This three year presentation of operations, changes in equity and of cash flows is required by the rules of the United States Securities and Exchange Commission. Other than such three year presentation and disclosure and the effect of the change in the income tax rates on deferred tax assets and liabilities were directly recognized within “Retained Earnings” in the Company’s 2014 local statutory consolidated financial statements instead of the income statement for the period ended December 31, 2014, the accompanying English language IFRS consolidated financial statements are consistent with the previously issued local statutory consolidated financial statements. This three year English language IFRS consolidated financial statements were approved for issuances by the Board of Directors during a session held on April 28, 2015, with subsequent events considered through this later date.
2.3 Basis of consolidation
2.3.1 Subsidiaries
These consolidated financial statement incorporate the financial statements of the Company and the companies controlled by the Company (its subsidiaries). Control is obtained when the Company has power over the investee, when it has exposure or is entitled to variable returns from its involvement in the investee and when it has the ability to use its power to influence the amount of investor returns. They include assets and liabilities as of December 31, 2014 and 2013 and results of operations and cash flows for the years ended December 31, 2014, 2013 and 2012. Income or losses from subsidiaries acquired or sold are included in the consolidated financial statements from the effective date of acquisition through to the effective date of disposal, as applicable.
The acquisition method is used to account for the acquisition of subsidiaries. The consideration transferred for the acquisition of the subsidiary is the fair value of assets transferred, equity securities issued, liabilities incurred to the former owners of the acquire or assumed on the date that control is obtained. Identifiable assets acquired and identifiable liabilities and contingencies assumed in a business combination are accounted for initially at their fair values at the acquisition date. Goodwill is initially measured as the excess of the aggregate of the consideration transferred and the fair value of non-controlling interest over the net identifiable assets acquired and liabilities assumed. If the consideration is less than the fair value of the net assets of the subsidiary acquired, the difference is recognized directly in the income statement . All acquisition related costs are expensed in the period incurred.
Intercompany transactions, balances, income, expenses and unrealized gains and losses on transactions between Group companies are eliminated. Accounting policies of subsidiaries are changed to ensure consistency with the policies adopted by the Company, where necessary .
The interest of non-controlling shareholders is presented in “Non-Controlling Interest” in the consolidated income statement and Earnings attributable to non-controlling interests”, in the consolidated statement of changes in equity .
The consolidated financial statements include all assets, liabilities, income, expenses, and cash flows after eliminating intercompany balances and transactions.
The list of subsidiaries included in the consolidation is detailed as follows:
|
|
|
|
|
Holding control (percentage) |
|
||||||||||
|
|
|
|
|
12-31-2014 |
|
12-31-2013 |
|
||||||||
|
Taxpayer ID |
|
Name of the Company |
|
Direct |
|
Indirect |
|
Total |
|
Direct |
|
Indirect |
|
Total |
|
|
59.144.140-K |
|
Abisa Corp S.A. |
|
— |
|
99.99 |
|
99.99 |
|
— |
|
99.99 |
|
99.99 |
|
|
Foreign |
|
Aconcagua Investing Ltda. |
|
0.71 |
|
99.28 |
|
99.99 |
|
0.71 |
|
99.28 |
|
99.99 |
|
|
96.842.970-1 |
|
Andina Bottling Investments S.A. |
|
99.90 |
|
0.09 |
|
99.99 |
|
99.90 |
|
0.09 |
|
99.99 |
|
|
96.972.760-9 |
|
Andina Bottling Investments Dos S.A. |
|
99.90 |
|
0.09 |
|
99.99 |
|
99.90 |
|
0.09 |
|
99.99 |
|
|
Foreign |
|
Andina Empaques Argentin a S.A. |
|
— |
|
99.98 |
|
99.98 |
|
— |
|
99.98 |
|
99.98 |
|
|
96.836.750-1 |
|
Andina Inversiones Societarias S.A. |
|
99.98 |
|
0.01 |
|
99.99 |
|
99.99 |
|
— |
|
99.99 |
|
|
76.070.406-7 |
|
Embotelladora Andina Chile S.A. |
|
99.99 |
|
— |
|
99.99 |
|
99.99 |
|
— |
|
99.99 |
|
|
Foreign |
|
Embotelladora del Atlántico S.A. |
|
0.92 |
|
99.07 |
|
99.99 |
|
0.92 |
|
99.07 |
|
99.99 |
|
|
96.705.990-0 |
|
Envases Central S.A. |
|
59.27 |
|
— |
|
59.27 |
|
59.27 |
|
— |
|
59.27 |
|
|
96.971.280-6 |
|
Inversiones Los Andes Ltda. |
|
99.99 |
|
— |
|
99.99 |
|
99.99 |
|
— |
|
99.99 |
|
|
Foreign |
|
Paraguay Refrescos S.A. |
|
0.08 |
|
97.75 |
|
97.83 |
|
0.08 |
|
97.75 |
|
97.83 |
|
|
76.276.604-3 |
|
Red de Transportes Comerciales Ltda. |
|
99.90 |
|
0.09 |
|
99.99 |
|
99.90 |
|
0.09 |
|
99.99 |
|
|
Foreign |
|
Rio de Janeiro Refrescos Ltda. |
|
— |
|
99.99 |
|
99.99 |
|
— |
|
99.99 |
|
99.99 |
|
|
78.536.950-5 |
|
Servicios Multivending Ltda. |
|
99.90 |
|
0.09 |
|
99.99 |
|
99.90 |
|
0.09 |
|
99.99 |
|
|
78.775.460-0 |
|
Sociedad de Transportes Trans-Heca Limitada |
|
— |
|
99.99 |
|
99.99 |
|
— |
|
99.99 |
|
99.99 |
|
|
78.861.790-9 |
|
Transportes Andina Refrescos Ltda. |
|
99.90 |
|
0.09 |
|
99.99 |
|
99.90 |
|
0.09 |
|
99.99 |
|
|
96.928.520-7 |
|
Transportes Polar S.A. |
|
99.99 |
|
— |
|
99.99 |
|
99.99 |
|
— |
|
99.99 |
|
|
76.389.720-6 |
|
Vital Aguas S.A. |
|
66.50 |
|
— |
|
66.50 |
|
66.50 |
|
— |
|
66.50 |
|
|
93.899.000-k |
|
Vital Jugos S.A. |
|
15.00 |
|
50.00 |
|
65.00 |
|
15.00 |
|
50.00 |
|
65.00 |
|
2.3.2 Investments accounted for under the equity method
Associates are all entities over which the Company exercises significant influence but does not have control. Investments in associates are accounted for using the equity method of accounting.
The Company’s share in profit or loss in associates subsequent to the acquisition date is recognized in the income statement, and its share of post acquisition movements in other comprehensive income is recognized in OCI with corresponding adjustment to the carrying amount of the investment.
Unrealized gains in transactions between the Company and its associates are eliminated to the extent of the Company´s interests in those associates. Unrealized losses are also eliminated unless the transaction provides evidence of an impairment on the asset transferred. Accounting policies of the associates are changed, where necessary, to ensure conformity with the policies adopted by the Company.
2.4 Financial reporting by operating segment
IFRS 8 requires that entities disclose information on the results of operating segments. In general, this is information that Management and the Board of Directors use internally to assess performance of segments and allocate resources to them. Therefore, the following operating segments have been determined based on geographic location:
· Chilean operations
· Brazilian operations
· Argentine operations
· Paraguayan operations
2.5 Foreign currency translation
2.5.1 Functional currency and presentation currency
Items included in the financial statements of each of the entities in the Company are measured using the currency of the primary economic environment in which the entity operates (“functional currency”). The consolidated financial statements are presented in Chilean pesos, which is the parent company’s functional currency and the Company´s presentation currency.
2.5.2 Balances and transactions
Foreign currency transactions are translated into the functional currency using the foreign exchange rates prevailing on the dates of the transactions. Losses and gains in foreign currency resulting from the liquidation of these transactions and the translation at the closing exchange rate of monetary assets and liabilities denominated in foreign currency are recognized in the income statements under foreign exchange rate differences, except when they correspond to cash flow hedges; in which case they are presented in the statement of comprehensive income.
The exchange rates at the close of each of the periods presented were as follows:
|
|
|
Exchange rate to the Chilean peso |
|
||||||||||
|
Date |
|
US$
|
|
R$ Brazilian
|
|
A$ Argentine
|
|
UF Unidad de
|
|
Paraguayan
|
|
€
|
|
|
12.31.2014 |
|
606.75 |
|
228.43 |
|
70.96 |
|
24,627.10 |
|
0.1311 |
|
738.05 |
|
|
12.31.2013 |
|
524.61 |
|
223.94 |
|
80.45 |
|
23,309.56 |
|
0.1144 |
|
724.30 |
|
|
12.31.2012 |
|
479.96 |
|
234.87 |
|
97.59 |
|
22,840.75 |
|
0.1100 |
|
634.45 |
|
2.5.3 Translate of foreign subsidiaries
The financial position and results of all entities in the Company (none of which has the currency of a hyperinflationary economy) that have a functional currency different from the presentation currency are translated into the presentation currency as follows:
(i) Assets and liabilities for the statement of financial position are translated at the closing exchange rate as of the reporting date;
(ii) Income and expenses of the income statement are translated at average exchange rates for the period; and
(iii) All resulting translation differences are recognized in other comprehensive income.
The companies that have a functional currency different from the presentation currency of the parent company are:
|
Company |
|
Functional currency |
|
Rio de Janeiro Refrescos Ltda. |
|
R$ Brazilian Real |
|
Embotelladora del Atlántico S.A. |
|
A$ Argentine Peso |
|
Andina Empaques Argentina S.A. |
|
A$ Argentine Peso |
|
Paraguay Refrescos S.A. |
|
G$ Paraguayan Guaraní |
In consolidation, translation differences arising from the translation of net investments in foreign entities are recognized in other comprehensive income. Exchange differences from accounts receivable which are considered to be part of an equity investment are recognized as comprehensive income net of deferred taxes, if applicable. On disposal of the investment, such translation differences are recognized in the income statement as part of the gain or loss on the disposal of the investment.
2.6 Property, plant, and equipment
Assets included in property, plant and equipment are recognized at their historical cost or fair value on the IFRS transition date, less depreciation and cumulative impairment losses.
Historical cost of property, plant and equipment includes expenditures that are directly attributable to the acquisition of the items less government subsidies resulting from the difference between market interest rates and the government´s preferential credit rates. Historical cost also includes revaluations and price-level restatements of opening balances (attributable cost) at January 1, 2009, in accordance with the exemptions in IFRS 1.
Subsequent costs are included in the asset´s carrying amount or recognized as a separate asset only when it is probable that future economic benefits associated with the items of property, plant and equipment will flow to the Company and the cost of the item can be measured reliably. The carrying amount of the replaced part is derecognized. Repairs and maintenance are charged to the income statement in the reporting period in which they are incurred.
Land is not depreciated. Depreciation on other assets is calculated using the straight-line method to allocate their cost or revalued amounts to their residual values over their estimated useful lives.
The estimated useful lives by asset category are:
|
Assets |
|
Range in years |
|
|
Buildings |
|
30-50 |
|
|
Plant and equipment |
|
10-20 |
|
|
Warehouse installations and accessories |
|
10-30 |
|
|
Software licenses, furniture and supplies |
|
4-5 |
|
|
Motor vehicles |
|
5-7 |
|
|
Other property, plant and equipment |
|
3-8 |
|
|
Bottles and containers |
|
2-8 |
|
The residual value and useful lives of assets are reviewed and adjusted at the end of each financial statement reporting period, if appropriate.
When the value of an asset is greater than its estimated recoverable amount, the value is written down immediately to its recoverable amount.
Gains and losses on disposals of property, plant, and equipment are calculated by comparing the proceeds to the carrying amount and are charged to the income statement.
Items that are available for sale, and comply with the conditions of IFRS 5 “Non-current assets held for sale and discontinued operations” are separated from property, plant and equipment and are presented within current assets at the lower value between the book value and its fair value less selling costs..
2.7 Intangible assets and Goodwill
2.7.1 Goodwill
Goodwill represents the excess of the consideration transferred over the Company’s interest in the net fair value of the net identifiable assets of the subsidiary and the fair value of the non-controlling interest in the subsidiary on the acquisition date. Goodwill is recognized separately and tested annually for impairment or more frequently if events or changes in circumstances indicate a potential impairment. Goodwill is carried at cost less accumulated impairment losses.
Gains and losses on the sale of an entity include the carrying amount of goodwill related to that entity.
Goodwill is assigned to each cash generating unit (CGU) or group of cash-generating units; from where it is expected to benefit from the synergies arising from the business combination. Such CGUs or groups of CGUs represent the lowest level in the organization at which goodwill is monitored for internal management purposes.
2.7.2 Distribution rights
Distribution rights are contractual rights to produce and distribute products under the Coca-Cola brand in certain territories in Argentina, Brazil, Chile and Paraguay which were acquired during Business Combination. Distribution rights have an indefinite useful life and are not amortized, as the Company believes that the agreements will be renewed indefinitely by the Coca-Cola Company with similar terms and conditions. They are subject to impairment tests on an annual basis.
2.7.3 Software
Carrying amounts correspond to internal and external software development costs, which are capitalized once the recognition criteria in IAS 38, Intangible Assets , have been met. Software is amortized in administrative expenses in the consolidated income statement over a period of four years.
2.8 Impairments of non-financial assets
Assets that have an indefinite useful life, such as intangibles related to distribution rights and goodwill, are not amortized and are tested annually for impairment or more frequently if events or changes in circumstances indicate a potential impairment. Assets that are subject to amortization are tested for impairment whenever there is an event or change in circumstances indicating that the carrying amount may not be recoverable. An impairment loss is recognized for the amount by which the carrying value of the asset exceeds its recoverable amount. The recoverable amount is the greater of an asset’s fair value less costs to sell or its value in use.
For the purposes of assessing impairment, assets are grouped at the lowest levels for which there are separately identifiable cash flows (cash generating units).
2.9 Financial assets
The Company classifies its financial assets into the following categories: financial assets at fair value through profit or loss, loans and receivables, financial assets held to maturity, and available for sale. The classification depends on the purpose for which the financial assets were acquired. Management determines the classification of its financial assets at initial recognition.
At each reporting date the Company assesses if there is evidence of impairment for any asset or group of financial assets.
2.9.1 Financial assets at fair value through profit or loss
Financial assets at fair value through profit or loss are financial assets held for trading. A financial asset is classified in this category if it is acquired principally for the purpose of selling in the short term. Assets in this category are classified as current assets.
Derivatives are also categorized as held for trading unless they are designated as hedges.
Gains or losses from changes in fair value of financial assets at fair value through profit and loss are recognized in the income statement under financial income or expense during the year in which they incur.
2.9.2 Loans and receivables
Loans and accounts receivable are financial assets with fixed and determinable payments that are not quoted in an active market period. Loans and receivables are not quoted in an active market. They are included in current assets, unless they are due more than 12 months from the reporting date, in which case they are classified as non-current assets. Loans and receivables are included in trade and other receivables in the consolidated statement of financial position and they are recorded at their amortized cost less a provision for impairment.
An impairment is recorded on trade accounts receivable when there is objective evidence that the Company may not be able to collect the full amount according to the original terms of the receivable, based either on individual or on global aging analyses. The loss is recognized in administrative expenses in the consolidated income statement.
2.9.3 Financial assets held to maturity
Other financial assets corresponds to bank deposits that the Company’s management has the positive intention and ability to hold until their maturity. They are recorded in current assets because they mature in less than 12 months from the reporting date and are carried at cost, which approximates their fair value considering their short-term nature.
Accrued interest is recognized in the consolidated income statement under financial income during the year in which it occurs.
2.10 Derivatives financial instruments and hedging activities
The Company uses derivative financial instruments to mitigate risks relating to changes in foreign currency and exchange rates associated with raw materials, property, plant and equipment, and loan obligations.
Derivatives are initially recognized at fair value on the date a derivative contract is entered into and are subsequently re-measured at their fair value. The method of recognizing the resulting gain or loss depends on whether the derivative is designated as a hedging instrument, and if so, the nature of the item being hedged.
2.10.1 Derivative financial instruments designated as cash flow hedges
The group documents at the inception of the transaction the relationship between hedging instruments and hedged items, as well as its risk management objectives and strategy for undertaking various hedging transactions. The group also documents its assessment, both at hedge inception and on an ongoing basis, of whether the derivatives that are used in hedging transactions are highly effective in offsetting changes in cash flows of hedged items.
The effective portion of changes in the fair value of derivatives that are designated and qualify as cash flow hedges is recognized in other comprehensive income. The gain or loss relating to the ineffective portion is recognized immediately in the consolidated income statement within “other gains (losses)”
Amounts accumulated in equity are reclassified to profit or loss in the periods when the hedged item affects profit or loss (for example, when foreign currency denominated financial liabilities are translated into their functional currencies). The gain or loss relating to the effective portion of cross currency swaps hedging the effects of changes in foreign exchange rates are recognized in the consolidated income statement within “foreign exchange differences”. When a hedging instrument expires or is sold, or when a hedge no longer meets the criteria for hedge accounting, any cumulative gain or loss existing in equity at that time remains in equity and is recognized when the forecast transaction is ultimately recognized in the consolidated income statement.
2.10.2 Derivative financial instruments not designated for hedging
The fair value of derivative financial instruments that do not qualify for hedge accounting pursuant to IFRS are immediately recognized in the consolidated income statement under “Other income and losses”. The fair value of these derivatives are recorded under “other current financial assets” or “other current financial liabilities” in the statement of financial position.”
The Company does not use hedge accounting for its foreign investments.
The Company also evaluates the existence of derivatives implicitly in financial instrument contracts to determine whether their characteristics and risks are closely related to the master agreement, as stipulated by IAS 39.
Fair value hierarchy
The Company records assets and liabilities as of December 31, 2014 and 2013 based on its derivative foreign exchange contracts, which are classified within other financial assets (current assets and non-current) and other current financial liabilities (current and non-current financial liabilities), respectively. These contracts are carried at fair value in the statement of financial position. The Company uses the following hierarchy for determining and disclosing financial instruments at fair value by valuation method:
|
Level 1: |
Quoted (unadjusted) prices in active markets for identical assets or liabilities. |
|
Level 2: |
Inputs other than quoted prices included in Level 1 that are observable for the assets and liabilities, either directly (that is, as prices) or indirectly (that is, derived from prices). |
|
Level 3: |
Inputs for the assets or liabilities that are not based on observable market data information. |
During the year ended December 31, 2014, there were no transfers of items between fair value measurement categories; all of which were valued during the period using Level 2 .
2.11 Inventories
Inventories are stated at the lower of cost and net realizable value. Cost is determined using the weighted average cost method. The cost of finished goods and work in progress includes raw materials, direct labor, other direct costs and manufacturing overhead (based on operating capacity) to bring the goods to marketable condition, but it excludes interest expense. Net realizable value is the estimated selling price in the ordinary course of business, less applicable variable selling expenses.
Estimates are also made for obsolescence of raw materials and finished products based on turnover and age of the related goods.
2.12 Trade receivables
Trade accounts receivables are recognized initially at fair value and subsequently measured at amortized cost less provision for impairment, given their short term nature. A provision for impairment is made when there is objective evidence that the Company may not be able to collect the full amount according to the original terms of the receivable, based either on individual or on global aging analyses. The carrying amount of the asset is reduced by the provision amount and the loss is recognized in administrative expenses in the consolidated income statement.
2.13 Cash and cash equivalents
Cash and cash equivalents include cash on hand, time deposits with banks and other short-term highly liquid and low risk of change in value investments with original maturities of three months or less.
2.14 Other financial liabilities
Bank borrowings are initially recognized at fair value, net of transaction costs. These liabilities are subsequently carried at amortized cost. Any difference between the proceeds (net of transaction costs) and the redemption value is recognized in the income statement over the period of the borrowings using the effective interest rate method.
General and specific borrowing costs directly attributable to the acquisition, construction or production of qualifying assets, which are assets that necessarily take a substantial period of time to get ready for their intended use or sale, are added to the cost of those assets, until such time as the assets are substantially ready for their intended use or sale. For the years ended December 31, 2014 and 2013, no borrowing costs have been capitalized.
2.15 Government subsidies
Government subsidies are recognized at fair value when it is certain that the subsidy will be received and that the Company will meet all the established conditions.
Subsidies for operating costs are deferred and recognized on the income statement in the period that the operating costs are incurred.
Subsidies for purchases of property, plant and equipment are deducted from the costs of the related asset in property, plant and equipment and depreciation is recognized on the income statement, on a straight-line basis during the estimated useful life of the related asset.
2.16 Income tax
The Company and its subsidiaries in Chile account for income tax according to the net taxable income calculated based on the rules in the Income Tax Law. Subsidiaries in other countries account for income taxes according to the tax regulations of the country in which they operate.
Deferred income taxes are calculated using the liability method on temporary differences arising between the tax bases of assets and liabilities and their carrying amounts in the consolidated financial statements, using the tax rates that have been enacted or substantively enacted on the balance sheet date and are expected to apply when the deferred income tax asset is realized or the deferred income tax liability is settled.
Deferred income tax assets are recognized only to the extent that it is probable that future taxable profits will be available against which the temporary differences can be utilized.
The Company does not recognize deferred income taxes for temporary differences from investments in subsidiaries in which the Company can control the timing of the reversal of the temporary differences and it is probable that they will not be reversed in the foreseeable future, the amount of deferred tax not recognized in this connection amounted to ThCh$ 62,662,666 at December 31, 2014 (ThCh$ 47,560,506 at December 31, 2013).
2.17 Employee benefits
The Company provides for post-retirement compensation to its retirees according to their years of service and the individual and collective contracts in place. This provision is recognized in the balance sheet at the present value of the defined benefit obligation using the projected unit credit method based on discounted estimated future cash outflows using interest rates of high-quality corporate bonds denominated in the currency in which the benefits will be paid and with terms approximating the terms of the related pension obligation.
Actuarial variables updated income are recorded under other comprehensive income, beginning 2013, according to amendments established by IAS 19.
The Company also has an executive retention plan. It is accounted for as a liability according to the guidelines of the plan. This plan grants certain executives the right to receive a fixed cash payment on a pre-set date once they have completed the required years of employment.
The Company and its subsidiaries have recorded a provision to account for the cost of vacations and other employee benefits on an accrual basis. These liabilities are recorded under provisions .
2.18 Provisions
Provisions for litigation and other contingencies are recognized when the Company has a present legal or constructive obligation as a result of past event, it is probable that an outflow of resources will be required to settle the obligation, and the amount can be reliably estimated.
Provisions are measured at the present value of the expenditures expected to be required to settle the obligation using a pre-tax rate that reflects current market assessments of the time value of money and the risks specific to the obligation .
2.19 Leases
a) Operating leases
Operating lease payments are recognized as an expense on a straight-line basis over the term of the lease.
b) Finance leases
Leases of property, plant and equipment where the Company has substantially all the risks and rewards of ownership are classified as finance leases. Finance leases are capitalized at the inception of the lease at the lower of the fair value of the leased assets and the present value of the minimum lease payments. Each lease payment is allocated between the liability and finance charges.
The interest element is charged to the income statement over the lease period so as to produce a constant periodic rate of interest on the remaining balance of the liability for each period.
2.20 Deposits for returnable containers
This liability comprises of cash collateral, or deposit, received from customers for bottles and other returnable containers made available to them.
This liability pertains to the deposit amount that is reimbursed when the customer or distributor returns the bottles and containers in good condition, together with the original invoice. The liability is estimated based on the number of bottles given to clients and distributors, the estimated amount of bottles in circulation, and a historical average weighted value per bottle or containers .
Deposits for returnable containers are presented as a current liability in other financial liabilities because the Company does not have legal rights to defer settlement for a period in excess of one year. However, the Company does not anticipate any material cash settlements for such amounts during the upcoming year.
2.21 Revenue recognition
Revenue is measured at fair value of the consideration received or receivable for the sale of goods in the ordinary course of the Company’s business. Revenue presents amounts receivable for goods supplied net of value-added tax, returns, rebates, and discounts and net of sales between companies that are consolidated.
The Company recognizes revenue when the amount of revenue can be reliably measured and it is probable that the future economic benefits will flow to the Company.
Revenues are recognized once the products are physically delivered to customers.
2.22 Contributions of The Coca-Cola Company
The Company receives certain discretionary contributions from The Coca-Cola Company related to the financing of advertising and promotional programs for its products in the territories where it has distribution licenses. The contributions received are recorded as a reduction in marketing expenses in the consolidated income statement. Given its discretionary nature, the portion of contributions received in one period does not imply it will be repeated in the following period.
In certain limited situations, there is a legally binding agreement with The Coca-Cola Company through which the Company receives contributions for the building and acquisition of specific items of property, plant and equipment. In such situations, payments received pursuant to these agreements are recorded as a reduction of the cost of the related assets.
2.23 Dividend payments
Dividend payments to the Company’s shareholders are recognized as a liability in the Company´s consolidated financial statements, based on the obligatory 30% minimum in accordance with the Corporations Law.
2.24 Critical accounting estimates and judgments
The Company makes estimates and judgments concerning the future. Actual results may differ from previously estimated amounts. The estimates and judgments that might have a material impact on future financial statements are explained below :
2.24.1 Impairment of goodwill and intangible assets with indefinite useful lives
The Company tests annually whether goodwill and intangible assets with indefinite useful lives (such as distribution rights) have suffered any loss of impairment. The recoverable amounts of cash generating units are determined based on value-in-use calculations. The key variables used in the calculations include sales volumes and prices, discount rates, marketing expenses and other economic factors including inflation. The estimation of these variables requires an use of estimates and judgments as they are subject to inherent uncertainties; however, the assumptions are consistent with the Company´s internal planning end past results. Therefore, management evaluates and updates estimates according to the conditions affecting the variables. If these assets are considered to have been impaired, they will be written off at their estimated fair value or future recovery value according to the discounted cash flows analysis. Discounted cash flows in the Company’s cash generating units in Chile, Brazil, Argentina and Paraguay generated a higher value than the carrying values of the respective net assets, including goodwill.
2.24.2 Fair Value of Assets and Liabilities
IFRS requires in certain cases that assets and liabilities be recorded at their fair value. Fair value is the amount at which an asset can be purchased or sold or a liability can be incurred or liquidated in an actual transaction among parties under mutually independently agreed conditions which are different from a forced liquidation.
The basis for measuring assets and liabilities at fair value are their current prices in an active market. For those that are not traded in an active market, the Company determines fair value based on the best information available by using valuation techniques.
In the case of the valuation of intangibles recognized as a result of acquisitions from business combinations, the Company estimates the fair value based on the “multi-period excess earning method”, which involves the estimation of future cash flows generated by the intangible assets, adjusted by cash flows which do not come from these, but from other assets. The Company also applies estimations over the time period during which the intangible assets will generate cash flows, cash flows from other assets, and a discount rate.
Other assets acquired and liabilities assumed in a business combination are carried at fair value using valuation methods that are considered appropriate under the circumstances. Assumptions include the depreciated cost of recovery and recent transaction values for comparable assets, among others. These valuation techniques require certain inputs to be estimated, including the estimation of future cash flows.
2.24.3 Allowances for doubtful accounts
The Company evaluates the collectability of trade receivables using several factors. When the Company becomes aware of a specific inability of a customer to fulfill its financial commitments, a specific provision for doubtful accounts is estimated and recorded, which reduces the recognized receivable to the amount that the Company estimates to be able to collect. In addition to specific provisions, allowances for doubtful accounts are also determined based on historical collection history and a general assessment of trade receivables, both outstanding and past due, among other factors.
2.24.4 Useful life, residual value and impairment of property, plant, and equipment
Property, plant, and equipment are recorded at cost and depreciated using the straight-line method over the estimated useful life of those assets. Changes in circumstances, such as technological advances, changes to the Company’s business model, or changes in its capital strategy might modify the effective useful lives as compared to our estimates. Whenever the Company determines that the useful life of property, plant and equipment might be shortened, it depreciates the excess between the net book value and the estimated recoverable amount according to the revised remaining useful life. Factors such as changes in the planned usage of manufacturing equipment, dispensers, transportation equipment and computer software could make the useful lives of assets shorter. The Company reviews its long-lived assets for impairment whenever events or changes in circumstances indicate that the carrying value of any of those assets may not be recovered. The estimate of future cash flows is based, among other factors, on certain assumptions about the expected operating profits in the future. The Company´s estimation of discounted cash flows may differ from actual cash flows because of, among other reasons, technological changes, economic conditions, changes in the business model, or changes in operating profit. If the sum of the projected discounted cash flows (excluding interest) is less than the carrying amount of the asset, the asset shall be written-off to its estimated recoverable value.
2.24.5 Liabilities for deposits of returnable container
The Company records a liability for deposits received in exchange for bottles and containers provided to its customers and distributors. This liability represents the amount of deposits that must be reimbursed if the customer or distributor returns the bottles and containers in good condition, together with the original invoice. This liability is estimated on the basis of the number of bottles given on loan to customers and distributors, estimates of bottles in circulation and the weighted average historical cost per bottle or container. Management makes several assumptions in order to estimate this liability, including the number of bottles in circulation, the amount of deposit that must be reimbursed and the timing of disbursements.
2.25 New IFRS and interpretations of the IFRS Interpretations Committee (IFRSIC)
a) The following standards, amendments and interpretations are mandatory for the first time for financial years beginning on January 1, 2014:
|
Standards and interpretations |
|
Mandatory for the
|
|
IFRIC 21 “Levies” - Indicates the accounting treatment for a liability to pay a levy if that liability is within the scope of IAS 37. It proposes to recognize that liability when the source of the liability occurs and payment cannot be avoided. The source of the liability will be the one established by the corresponding legislation and it may occur on a certain date or gradually over time. |
|
01/01/2014 |
|
Amendments |
|
Mandatory for the
|
|
IAS 32 “ Financial Instruments: Presentation” - Amends the requirements for compensating financial assets and liabilities in the Statement of Financial Position. |
|
01/01/2014 |
|
|
|
|
|
IAS 27 “ Separate Financial Statements” and IFRS 10 “Consolidated Financial Statements” and IFRS 12 “Disclosure of information about interest in other entities” - The amendments include the definition of an entity’s investment and incorporate an exception to consolidate certain subsidiaries belonging to investment entities. The amendment also incorporates new information disclosure requirements relating to investment entities in IFRS 12 and IAS 27 . |
|
01/01/2014 |
|
|
|
|
|
IAS 36 “Impairment of Assets” - Amends disclosure of information regarding recovery of non-financial assets aligning them with IFRS 13 requirements . |
|
01/01/2014 |
|
|
|
|
|
IAS 39 “Financial Instruments: Recognition and Measurement” - Sets certain conditions for the novation of derivatives and continuation of hedge accounting; preventing novations resulting from laws and regulations affecting the financial statements. |
|
01/01/2014 |
|
|
|
|
|
IAS 19 “Employee Benefits” - This amendment applies to contributions to defined benefit plans from employees or third parties. The amendment target is to simplify accounting of contributions that are independent of the number of years of service of employees, for example, contributions for employees calculated according to a fixed percentage of the salary . |
|
01/01/2014 |
|
Improvements to International Financial Reporting Standards (2012) |
|
|
|
|
|
|
|
Issued in December 2013. |
|
|
|
|
|
|
|
IFRS 2 “Share-based Payment” - Amends the definition of ‘Vesting Condition’ and ‘Market Condition”. “Performance Condition’ and ‘Service Condition’ are defined separately. This amendment should be applied for future periods to share-based payment transactions for which the date of grant is July 1, 2014 or later. |
|
07/01/2014 |
|
|
|
|
|
IFRS 3 “Business Combinations” - The standard is amended to clarify that the obligation to pay contingent consideration which complies with the definition of financial instrument is classified as financial liability or as equity, based on IAS 32 definitions, and that all non-equity contingent consideration, both financial and non-financial, is measured at fair value at each reporting date with changes in fair value recognized in results. Consequently, changes are also introduced to IFRS 9, IAS 37 and IAS 39. The amendment applies for future periods to business combinations whose acquisition date is July 1, 2014 or later. |
|
07/01/2014 |
|
|
|
|
|
IFRS 8 “Operating Segments” - The standard is amended to include the disclosure requirement of management judgement in the aggregation of operating segments. The standard was additionally amended to require a reconciliation between the segment’s assets with the entity’s assets, when assets are reported by segment. |
|
07/01/2014 |
|
|
|
|
|
IFRS 13 “Fair Value Measurement” - The IASB has amended the basis of the conclusions of IFRS 13 to clarify that the ability to measure short term accounts receivable and accounts payable in nominal amounts is not removed if there is no significant effect of not updating. |
|
07/01/2014 |
|
|
|
|
|
IAS 16 - “Property, plant and equipment”, and IAS 38 “Intangible assets” - Both standards are amended regarding treatment of gross value in accounting books and accumulated depreciation when the entity uses the revaluation model. |
|
07/01/2014 |
|
|
|
|
|
IAS 24 - Disclosure information on related parties” - The standard is amended to include as a related company, an entity that provides key directing personnel to the reporting company or to the parent company of the reporting company (“the managing company”). |
|
07/01/2014 |
|
|
|
|
|
Improvements to International Financial Reporting Standards (2013) |
|
|
|
|
|
|
|
Issued in December 2013. |
|
|
|
|
|
|
|
IFRS 3 “Business Combinations” - The standard is amended to clarify that IFRS 3 is not applicable to accounting of a joint venture under IFRS 11. The amendment also clarifies that the exemption scope is only applied to the financial statements of the joint agreement in itself. |
|
07/01/2014 |
|
|
|
|
|
IFRS 13 “Fair Value Measurement” - Clarifies that the portfolio exemption under IFRS 13, which allows an entity to measure fair value of a group of financial assets and liabilities over its net value, is applicable to all contracts (including non-financial contracts) within the scope of IAS 39 or IFRS 9. An entity must apply amendments for future periods from the beginning of the yearly period in which IFRS 13 is applied. |
|
07/01/2014 |
The Company´s management considers the adoption of standards, amendments and interpretations previously described, will not have a significantly impact on the consolidated financial statements of the Company in the period of their adoption.
b) The new standards, interpretations and amendments issued, which are not in force for the 2014 period, for which no early adoption has been adopted are as follow:
|
Standards and interpretations |
|
Mandatory for the
|
|
IFRS 9 “Financial Instruments” - Amends classification and measurement of financial assets. Establishes two measurement categories: amortized cost and fair value. All equity instruments are measured at fair value. This standard was subsequently amended to include treatment and classification of financial liabilities. The main change is that if the fair value of financial liabilities is adopted, the change in fair value attributable to changes in the entity’s own credit risk is recognized in other comprehensive income instead of income, unless this generates an accounting asymmetry. Early adoption is permitted. |
|
01/01/2018 |
|
|
|
|
|
IFRS 15 “Revenues from Contracts with Customers” - Establishes the principles to be applied by an entity in presenting useful information for users of financial statements about the nature, amount, timing, and uncertainty of revenue and cash flows arising from a contract with a customer. The core principle is that an entity will recognize revenue to depict the transfer of promised goods or services to customers in an amount that reflects the consideration to which the entity expects to be entitled in exchange for those goods or services. Its application replaces IAS 11 Construction Contracts; IAS 18 Revenue; IFRIC 13 Customer Loyalty Programs; IFRIC 15 Agreements for the Construction of Real Estate; IFRIC 18 Transfers of Assets from Customers; and SIC-31 Revenue — Barter Transactions Involving Advertising Services. Early adoption is permitted. |
|
01/01/2017 |
|
Amendments and improvements |
|
Mandatory for the
|
|
IFRS 9 “Financial instruments” - The amendments include a substantial review on hedge accounting to enable entities to better reflect their risk management activities in the financial statements. Likewise, this amendment enables entities to early adopt the requirement to recognize the changes in fair value attributable to changes in the entity’s own credit risk (for financial liabilities designated under the fair value option), in other comprehensive income. Said amendment can be applied without having to adopt the remainder of IFRS 9. The amendment is mandatory for periods beginning on July 1, 2014. An entity must apply the amendments in future reporting periods from the beginning of the first yearly period in which IFRS 13 is applied. |
|
01/01/2018 |
|
|
|
|
|
IFRS 11 “ Joint Arrangements” - This amendment incorporates guidance to the standard regarding how to account for the acquisition of an interest in a joint operation which constitutes a business, thus specifying the appropriate treatment for said acquisition. |
|
01/01/2016 |
|
|
|
|
|
IAS 16 “Property, Plant and Equipment” and IAS 38 “Intangible Assets”- The amendment clarifies that the use of asset amortization methods based on revenue is not appropriate, given that the revenue generated by the activity that includes use of assets generally reflects other factors different from the use of economic benefits embedded in the asset. Likewise, it clarifies that revenues in general are an inappropriate base to measure consumption of economic benefits embedded in the intangible asset. |
|
01/01/2016 |
|
|
|
|
|
IAS 16 “Property, Plant and Equipment” and IAS 38 “Agriculture”- The amendment modifies |
|
01/01/2016 |
|
financial information regarding “ bearer plants” such as vines, rubber and palm oil trees. The amendment defines the concept of a “bearer plant” and establishes that it should be accounted for as property, plant and equipment, because its operation is similar to that of a production facility. As a result, it is brought into the scope of IAS 16 rather than IAS 41. Products grown in bearer plants will remain within scope of IAS 41. Early application is permitted. |
|
|
|
|
|
|
|
IFRS 5 “Non-current Assets Held for Sale and Discontinued Operations” The amendment clarifies that when an asset (or disposal group) is reclassified from “held for sale” to “maintained for distribution”, or vice versa, this does not constitute an amendment to a sale or distribution plan, and does not have to be accounted for as such. This means that the asset (or disposal group) need not be reinstalled in the financial statements as if it had never been classified as “held for sale” or “maintained for distribution”, simply because the provision conditions have changed. The amendment also corrects an omission in the standard explaining that guidance on changes to a sales plan should be applied to an asset (or disposal group) that is no longer maintained for distribution, but that is not reclassified as “held for sale”. |
|
01/01/2016 |
|
|
|
|
|
IFRS 7 “Financial Instruments: Disclosures” There are two amendments to IFRS 7. (1) Service Agreements: if an entity transfers a financial asset to a third party under conditions that allow the grantor to write off the asset, IFRS 7 requires disclosure of any type of continued implication that the entity may still have in the transferred assets. IFRS 7 provides guidance regarding continued implication in this context. The amendment is prospective with the option to retroactive application. This also affects IFRS 1 to give the same option to those who apply IFRS for the first time. (2) Interim Financial Statements: The amendment clarifies the additional disclosure required by IFRS 7 amendments, “Offsetting financial assets and financial liabilities” is not specifically required for all interim periods, unless required by IAS 34. The amendment is retroactive. |
|
01/01/2016 |
|
|
|
|
|
IFRS 19 “Employee Benefits” - The amendment clarifies that in order to determine the liabilities’ discount rate for post-employment benefits it should be denominated in the same currency as the benefits to be paid and not the currency from the country where it has been generated. The evaluation of the existence of a broad market for high quality corporate bonds is based on corporate bonds denominated in that currency, not on corporate bonds from a specific country. Likewise, where a broad market for high quality corporate bonds in that currency does not exist, government bonds should be used in the corresponding currency. The amendment is retroactive but limited to the beginning of the first period presented. |
|
01/01/2016 |
|
|
|
|
|
IAS 34 “Interim Financial Reporting” The amendment clarifies the meaning of “elsewhere in the interim report”. The new amendment to IAS 34 requires a cross-reference of the interim financial statements as to the location of said information. The amendment is retroactive. |
|
01/01/2016 |
Regarding IFRS 15, the Company is in the process of analysing the potential impacts of its adoption.
The Company’s management considers the adoption of all other standards, amendments and interpretations previously described, will not have a significantly impact on the consolidated financial statements of the Company in the period of their adoption.
NOTE 3 — BUSINESS COMBINATIONS
a) Merger with Embotelladoras Coca-Cola Polar S.A.:
On March 30, 2012, after completion of due-diligence procedures, the Company signed a Promissory Merger Agreement with Embotelladoras Coca-Cola Polar S.A. (“Polar”). Polar is also a Coca-Cola bottler with operations in Chile, servicing territories in the II, III, IV, XI and XII regions; in Argentina, servicing territories in Santa Cruz, Neuquén, El Chubut, Tierra del Fuego, Río Negro, La Pampa and the western zone of the province of Buenos Aires; and in Paraguay servicing the whole country. The merger was made in order to reinforce the Company’s leading position among other Coca-Cola bottlers in South America .
Prior to the finalization of the merger and the approval of the shareholders at the Shareholders’ Meetings of the Company and Polar, dividends were distributed among their respective shareholders, in addition to those already declared and distributed from 2011 results. Dividends distributed by the Company and Polar amounted to Ch$ 28,155,862,307 and Ch$ 29,565,609,857, respectively, which represented Ch$ 35.27 per each Series A share and Ch$ 38.80 per each Series B share. The physical exchange of shares took place on October 16, 2012, when the former shareholders of Polar obtained a 19.68% ownership interest in the merged Company. Based upon the terms of the executed agreements, the Company took actual control over day-to-day operations of Polar as of October 1, 2012, when it began to consolidate Polar’s operating results. As a result of Embotelladora Andina becoming the legal successor of Polar’s rights and obligations, the Company indirectly acquired additional ownership interests in Vital Jugos S.A., Vital Aguas S.A., and Envases Central S.A., in addition to its existing ownership interests in those entities. The Company’s current ownership enables it to exercise control over these entities, and thus, consolidate them into its consolidated financial statements from October 1, 2012.
As part of the business combination, the Company obtained controls over Vital Jugos S.A., Vital Aguas S.A. and Envases Central S.A. because of the combination of its news shares and existing shares in these entities. Under IFRS 3, because the business combination of Vital Jugos S.A., and Vital Aguas S.A., and Envases Central S.A., was achieved in stages, carrying value of the Company´s previously held equity interest in these entities was re-measured to fair value at the acquisition date. The Company has not recognized any gain or loss in its 2012 income statement due to the fact that carrying values of these investments were not significantly different from their fair values.
A total of 93,152,097 Series A shares and 93,152,097 Series B shares were issued at closing in exchange for 100% of Polar’s outstanding shares. The total purchase price was ThCh$ 461,568,641 based on a share price of Ch$ 2,220 per Series A share and Ch$ 2,735 per Series B share on October 1, 2012. There are no contingent purchase price provisions. Transaction related costs of ThCh$ 193,825 in 2013 and ThCh$ 4,517,661 in 2012 were expensed as incurred, and recorded as a component of other expenses in the consolidated income statement.
The fair value of Polar’s net assets acquired is as follows :
|
|
|
ThCh$ |
|
|
Total current assets acquired, including cash amounting to ThCh$ 4,760,888 |
|
11,063,598 |
|
|
Trade accounts receivable |
|
31,980,882 |
|
|
Inventories |
|
23,491,532 |
|
|
Property, plant and equipment |
|
153,012,024 |
|
|
Other non current assets |
|
6,651,326 |
|
|
Deferred income tax assets |
|
8,570,596 |
|
|
Contractual rights to distribute Coca-Cola products (“Distribution Rights”) |
|
459,393,920 |
|
|
Total assets |
|
694,163,878 |
|
|
Indebtedness |
|
(99,924,279 |
) |
|
Suppliers |
|
(41,840,383 |
) |
|
Deferred income tax liabilities |
|
(81,672,940 |
) |
|
Other liabilities |
|
(25,617,704 |
) |
|
Total liabilities |
|
(249,055,306 |
) |
|
Net assets acquired |
|
445,108,572 |
|
|
Goodwill |
|
16,460,068 |
|
|
Total consideration excluding non-controlling interests (purchase price) |
|
461,568,640 |
|
The Company determined the fair value of its distribution rights, and property, plant and equipment using discounted cash flow models, replacement costs for similar assets, and market based appraisals. Distribution rights are expected to be tax deductible for income tax purposes.
The Company expects to recover goodwill through related synergies with the available distribution capacity. Goodwill has been assigned to the Company´s operating segments in Chile (ThCh$ 8,503,023), Argentina (ThCh$ 1,041,633), and Paraguay (ThCh$ 6,915,412). Goodwill is not expected to be tax deductible for income tax purposes.
Condensed financial information of Polar for the period October 1, 2012 to December 31, 2012 is as follows:
|
|
|
Millions Ch$ |
|
|
Net sales |
|
93,918 |
|
|
Income before taxes |
|
5,466 |
|
|
Net income |
|
4,648 |
|
The proforma consolidated statement of income had the acquisition occurred on January 1, 2012 is as follows :
|
|
|
Millions Ch$ |
|
|
|
|
(Unaudited) |
|
|
Net sales |
|
1,427,936 |
|
|
Income before taxes |
|
130,246 |
|
|
Net income |
|
91,371 |
|
b) Acquisition of Companhia de Bebidas Ipiranga :
On June 18, 2013 the Board of Directors of Embotelladora Andina S.A., unanimously approved the acquisition of the Brazilian company Companhia de Bebidas Ipiranga. The aforementioned company is dedicated to the marketing and distribution of Coca-Cola products in parts of the territories of São Paulo and Minas Gerais, serving approximately 23,000 customers. Such approval was reflected in a purchase and sale agreement signed on July 10, 2013.
After the transaction was approved by Coca-Cola and the Administrative Council of Economic Defense of Brazil, on October 11, 2013 the Brazilian subsidiary, Rio de Janeiro Refrescos Ltda., completed the acquisition of 100% of the shares of Companhia de Bebidas Ipiranga . The acquisition price was ThR$ 1,155,446 (equivalent to ThCh$ 261,244,818) and was paid in cash by Rio de Janeiro Refrescos Ltda. using proceeds from intercompany loans and a capital contribution from the parent .
Transaction costs of ThCh$ 578,864 were charged to results at the time they were incurred, and were recorded as other expenses within the Company’s consolidated income statement.
Estimated fair value of the net assets acquired of Companhia de Bebidas Ipiranga is as follows :
|
|
|
ThCh$ |
|
|
Total current assets acquired, including cash in the amount of ThCh$ 8,963,612 |
|
14,117,173 |
|
|
Trade accounts receivable |
|
11,462,843 |
|
|
Inventories |
|
6,930,932 |
|
|
Property, plant and equipment |
|
68,575,023 |
|
|
Deferred tax assets |
|
85,404,849 |
|
|
Other non-current assets |
|
6,702,764 |
|
|
Contractual rights to distribute Coca-Cola products (“Distribution Rights”) |
|
228,359,641 |
|
|
Total assets |
|
421,553,225 |
|
|
Indebtedness |
|
(30,392,168 |
) |
|
Suppliers |
|
(12,471,093 |
) |
|
Contingencies (refer to note 22.1) |
|
(70,902,559 |
) |
|
Deferred taxes |
|
(91,830,873 |
) |
|
Other liabilities |
|
(9,966,908 |
) |
|
Total liabilities |
|
(215,563,601 |
) |
|
Net asset acquired |
|
205,989,624 |
|
|
Goodwill |
|
55,255,194 |
|
|
Total value transferred (purchase price) |
|
261,244,818 |
|
The fair value of distribution rights and property, plant and equipment, was calculated by the Company, using valuation models such as discounted cash flows. Distribution rights are expected to be tax deductible for income tax purposes.
The Company expects to recover goodwill through synergies related to available production capacity. Goodwill has been assigned to the Company’s Brazil operating segment in the amount of ThCh$ 55,255,194. Goodwill is expected to be tax deductible for income tax purposes.
During the fiscal year 2014, and using the guidelines of IFRS 3 “Business Combinations” that allows to adjust the values assigned to the purchase by knowledge of new information which was not available at the first date of recognition, we have decreased the allowance value from contingencies of the Brazilian company Compañía de Bebidas Ipiranga, given litigation that already existed at the date of purchase in an amount of ThCh$ 442,977, the net tax value of ThCh$ 292,365 was assigned to goodwill from the purchase.
The condensed income statement of Companhia de Bebidas Ipiranga for the period October 11, 2013 to Deceber 31, 2013 is as follows:
|
|
|
Million$ |
|
|
Net sales |
|
49,336 |
|
|
Income before taxes |
|
4,764 |
|
|
Net income |
|
5,366 |
|
Embotelladora Andina S.A.’s proforma condensed income statement at December 31, 2013, as if the acquisition would have occurred on January 1, 2013 is as follows:
|
|
|
(Unaudited) |
|
|
|
|
Million$ |
|
|
Net sales |
|
1,640,705 |
|
|
Income before taxes |
|
111,320 |
|
|
Net income |
|
86,423 |
|
NOTE 4 — REPORTING BY SEGMENT
The Company provides information by segments according to IFRS 8 “Operating Segments,” which establishes standards for reporting by operating segment and related disclosures for products and services, and geographic areas.
The Company’s Board of Directors and Management measures and assesses performance of operating segments based on the operating income of each of the countries where there are Coca-Cola franchises.
The operating segments are determined based on the presentation of internal reports to the Company´s chief operating decision-maker. The chief operating decision-maker has been identified as the Company´s Board of Directors who makes the Company´s strategic decisions.
The following operating segments have been determined for strategic decision making based on geographic location:
· Chilean operations
· Brazilian operations
· Argentine operations
· Paraguayan operations
The four operating segments conduct their businesses through the production and sale of soft drinks and other beverages, as well as packaging materials.
Total income by segment includes sales to unrelated customers and inter-segment sales, as indicated in the Company’s consolidated statement of income.
Net expenses related to corporate management, have been assigned to the Chilean operating segment.
A summary of the Company’s operating segments in accordance to IFRS is as follows :
|
For the period ended December 31, 2014 |
|
Chile
|
|
Argentina
|
|
Brazil
|
|
Paraguay
|
|
Intercompany
|
|
Consolidated
|
|
|
|
|
ThCh$ |
|
ThCh$ |
|
ThCh$ |
|
ThCh$ |
|
ThCh$ |
|
ThCh$ |
|
|
Softdrinks |
|
363,123,062 |
|
391,798,772 |
|
490,931,489 |
|
106,579,478 |
|
(190,520 |
) |
1,352,242,281 |
|
|
Other beverages |
|
128,948,478 |
|
61,533,214 |
|
224,796,810 |
|
22,916,498 |
|
— |
|
438,195,000 |
|
|
Packaging |
|
— |
|
7,670,802 |
|
— |
|
— |
|
(908,206 |
) |
6,762,596 |
|
|
Net sales |
|
492,071,540 |
|
461,002,788 |
|
715,728,299 |
|
129,495,976 |
|
(1,098,726 |
) |
1,797,199,877 |
|
|
Cost of sales |
|
(296,893,869 |
) |
(265,287,659 |
) |
(440,654,978 |
) |
(79,505,628 |
) |
1,098,726 |
|
(1,081,243,408 |
) |
|
Distribution expenses |
|
(50,807,225 |
) |
(74,059,744 |
) |
(55,131,215 |
) |
(7,044,659 |
) |
— |
|
(187,042,843 |
) |
|
Administrative expenses |
|
(101,676,504 |
) |
(87,897,233 |
) |
(130,689,621 |
) |
(21,877,574 |
) |
— |
|
(342,140,932 |
) |
|
Finance income |
|
3,453,892 |
|
240,844 |
|
4,680,739 |
|
280,148 |
|
— |
|
8,655,623 |
|
|
Finance expense |
|
(16,939,606 |
) |
(8,416,222 |
) |
(39,454,670 |
) |
(270,933 |
) |
— |
|
(65,081,431 |
) |
|
Interest expense, net |
|
(13,485,714 |
) |
(8,175,378 |
) |
(34,773,931 |
) |
9,215 |
|
— |
|
(56,425,808 |
) |
|
Share of the entity in income of associates accounted for using the equity method, total |
|
(212,439 |
) |
— |
|
1,403,408 |
|
— |
|
— |
|
1,190,969 |
|
|
Income tax expense |
|
(28,215,677 |
) |
(5,904,815 |
) |
(8,959,990 |
) |
(2,273,953 |
) |
— |
|
(45,354,435 |
) |
|
Other income (loss) |
|
(21,101,524 |
) |
(5,814,509 |
) |
(6,900,864 |
) |
(332,431 |
) |
— |
|
(34,149,328 |
) |
|
Net income of the segment reported |
|
(20,321,412 |
) |
13,863,450 |
|
40,021,108 |
|
18,470,946 |
|
— |
|
52,034,092 |
|
|
|
|
|
|
|
|
|
|
|
|
|
|
|
|
|
Depreciation and amortization |
|
38,707,146 |
|
18,372,306 |
|
32,702,078 |
|
13,185,395 |
|
— |
|
102,966,925 |
|
|
|
|
|
|
|
|
|
|
|
|
|
|
|
|
|
Current assets |
|
252,116,763 |
|
100,705,367 |
|
165,690,695 |
|
35,223,376 |
|
— |
|
553,736,201 |
|
|
Non current assets |
|
640,425,454 |
|
126,044,044 |
|
664,110,834 |
|
284,856,758 |
|
— |
|
1,715,437,090 |
|
|
Segment assets, total |
|
892,542,217 |
|
226,749,411 |
|
829,801,529 |
|
320,080,134 |
|
— |
|
2,269,173,291 |
|
|
|
|
|
|
|
|
|
|
|
|
|
|
|
|
|
Carrying amount in associates and joint ventures accounted for using the equity method, total |
|
17,684,657 |
|
— |
|
48,365,556 |
|
— |
|
— |
|
66,050,213 |
|
|
Capital expenditures and other |
|
45,109,547 |
|
25,724,227 |
|
30,280,491 |
|
13,102,590 |
|
— |
|
114,216,855 |
|
|
|
|
|
|
|
|
|
|
|
|
|
|
|
|
|
Current liabilities |
|
86,641,700 |
|
125,942,946 |
|
172,228,688 |
|
25,399,093 |
|
— |
|
410,212,427 |
|
|
Non-current liabilities |
|
527,235,725 |
|
15,151,169 |
|
379,280,707 |
|
18,295,530 |
|
— |
|
939,963,131 |
|
|
Segment liabilities, total |
|
613,877,425 |
|
141,094,115 |
|
551,509,395 |
|
43,694,623 |
|
— |
|
1,350,175,558 |
|
|
|
|
|
|
|
|
|
|
|
|
|
|
|
|
|
Cash flows provided by in Operating Activities |
|
84,409,260 |
|
31,798,589 |
|
76,107,895 |
|
23,198,687 |
|
— |
|
215,514,431 |
|
|
Cash flows used in Investing Activities |
|
(100,090,488 |
) |
(25,297,402 |
) |
(25,663,739 |
) |
(15,724,107 |
) |
— |
|
(166,775,736 |
) |
|
Cash flows provided by (used in) Financing Activities |
|
(2,382,266 |
) |
(11,603,894 |
) |
(31,087,316 |
) |
(1,846,765 |
) |
— |
|
(46,920,241 |
) |
|
For the period ended December 31, 2013 |
|
Chile
|
|
Argentina
|
|
Brazil
|
|
Paraguay
|
|
Intercompany
|
|
Consolidated
|
|
|
|
|
ThCh$ |
|
ThCh$ |
|
ThCh$ |
|
ThCh$ |
|
ThCh$ |
|
ThCh$ |
|
|
Softdrinks |
|
357,175,049 |
|
389,768,200 |
|
359,500,578 |
|
94,313,713 |
|
(1,137,508 |
) |
1,199,620,032 |
|
|
Other beverages |
|
120,742,893 |
|
45,345,896 |
|
132,360,694 |
|
17,939,818 |
|
— |
|
316,389,301 |
|
|
Packaging |
|
— |
|
6,115,002 |
|
— |
|
— |
|
(443,000 |
) |
5,672,002 |
|
|
Net sales |
|
477,917,942 |
|
441,229,098 |
|
491,861,272 |
|
112,253,531 |
|
(1,580,508 |
) |
1,521,681,335 |
|
|
Cost of sales |
|
(283,987,524 |
) |
(250,550,829 |
) |
(308,359,706 |
) |
(73,500,197 |
) |
1,580,508 |
|
(914,817,748 |
) |
|
Distribution expenses |
|
(46,133,420 |
) |
(70,901,210 |
) |
(39,999,942 |
) |
(5,988,113 |
) |
— |
|
(163,022,685 |
) |
|
Administrative expenses |
|
(94,360,894 |
) |
(80,644,714 |
) |
(80,841,396 |
) |
(16,709,434 |
) |
— |
|
(272,556,438 |
) |
|
Finance income |
|
1,751,973 |
|
48,638 |
|
3,035,143 |
|
137,558 |
|
— |
|
4,973,312 |
|
|
Finance expense |
|
(16,619,213 |
) |
(5,407,881 |
) |
(6,524,560 |
) |
(392,369 |
) |
— |
|
(28,944,023 |
) |
|
Interest expense, net |
|
(14,867,240 |
) |
(5,359,243 |
) |
(3,489,417 |
) |
(254,811 |
) |
— |
|
(23,970,711 |
) |
|
Share of the entity in income of associates accounted for using the equity method, total |
|
724,629 |
|
— |
|
58,789 |
|
— |
|
— |
|
783,418 |
|
|
Income tax expense |
|
(15,339,760 |
) |
(7,743,806 |
) |
1,853,334 |
|
(1,736,032 |
) |
— |
|
(22,966,264 |
) |
|
Other income (loss) |
|
(13,023,761 |
) |
(8,434,348 |
) |
(12,573,197 |
) |
(832,377 |
) |
— |
|
(34,863,683 |
) |
|
Net income of the segment reported |
|
10,929,972 |
|
17,594,948 |
|
48,509,737 |
|
13,232,567 |
|
— |
|
90,267,224 |
|
|
|
|
|
|
|
|
|
|
|
|
|
|
|
|
|
Depreciation and amortization |
|
35,967,369 |
|
17,282,433 |
|
19,611,566 |
|
10,475,516 |
|
— |
|
83,336,884 |
|
|
|
|
|
|
|
|
|
|
|
|
|
|
|
|
|
Current assets |
|
205,826,948 |
|
89,031,091 |
|
141,763,935 |
|
23,962,112 |
|
— |
|
460,584,086 |
|
|
Non current assets |
|
632,472,652 |
|
129,560,418 |
|
609,181,470 |
|
251,162,684 |
|
— |
|
1,622,377,224 |
|
|
Segment assets, total |
|
838,299,600 |
|
218,591,509 |
|
750,945,405 |
|
275,124,796 |
|
— |
|
2,082,961,310 |
|
|
Carrying amount in associates and joint ventures accounted for using the equity method, total |
|
17,881,972 |
|
— |
|
50,791,427 |
|
— |
|
— |
|
68,673,399 |
|
|
Capital expenditures and other |
|
57,545,219 |
|
52,271,592 |
|
317,965,173 |
|
17,160,220 |
|
— |
|
444,942,204 |
|
|
Current liabilities |
|
151,808,516 |
|
117,167,718 |
|
108,646,120 |
|
24,521,785 |
|
— |
|
402,144,139 |
|
|
Non-current liabilities |
|
382,039,567 |
|
16,215,376 |
|
383,329,737 |
|
17,799,903 |
|
— |
|
799,384,583 |
|
|
Segment liabilities, total |
|
533,848,083 |
|
133,383,094 |
|
491,975,857 |
|
42,321,688 |
|
— |
|
1,201,528,722 |
|
|
|
|
|
|
|
|
|
|
|
|
|
|
|
|
|
Cash flows provided by in Operating Activities |
|
78,994,275 |
|
35,501,051 |
|
37,067,316 |
|
20,522,083 |
|
— |
|
172,084,725 |
|
|
Cash flows used in Investing Activities |
|
(76,510,197 |
) |
(51,754,052 |
) |
(302,125,052 |
) |
(17,160,220 |
) |
— |
|
(447,549,521 |
) |
|
Cash flows provided by (used in) Financing Activities |
|
282,137,848 |
|
19,569,666 |
|
7,924,748 |
|
(6,526,406 |
) |
— |
|
303,105,856 |
|
|
For the year ended December 31, 2012 |
|
Chile
|
|
Argentina
|
|
Brazil
|
|
Paraguay
|
|
Eliminations
|
|
Consolidated
|
|
|
|
|
ThCh$ |
|
ThCh$ |
|
ThCh$ |
|
ThCh$ |
|
ThCh$ |
|
ThCh$ |
|
|
Softdrinks |
|
299,673,400 |
|
281,696,617 |
|
359,116,392 |
|
26,884,520 |
|
(1,039,291 |
) |
966,331,638 |
|
|
Other beverages |
|
75,199,621 |
|
25,075,149 |
|
92,480,349 |
|
5,143,780 |
|
(89,595 |
) |
197,809,304 |
|
|
Packaging |
|
— |
|
8,564,719 |
|
— |
|
— |
|
(412,844 |
) |
8,151,875 |
|
|
Net sales |
|
374,873,021 |
|
315,336,485 |
|
451,596,741 |
|
32,028,300 |
|
(1,541,730 |
) |
1,172,292,817 |
|
|
Finance income |
|
803,029 |
|
301,025 |
|
1,602,098 |
|
21,907 |
|
— |
|
2,728,059 |
|
|
Finance costs |
|
(7,540,887 |
) |
(2,277,362 |
) |
(1,231,153 |
) |
(123,351 |
) |
— |
|
(11,172,753 |
) |
|
Finance income, net |
|
(6,737,858 |
) |
(1,976,337 |
) |
370,945 |
|
(101,444 |
) |
— |
|
(8,444,694 |
) |
|
Depreciation and amortization |
|
(24,290,171 |
) |
(11,201,323 |
) |
(16,064,773 |
) |
(2,267,871 |
) |
— |
|
(53,824,138 |
) |
|
Share of profit of associates using equity method of accounting |
|
1,120,893 |
|
— |
|
649,005 |
|
— |
|
— |
|
1,769,898 |
|
|
Income tax expense |
|
(7,378,459 |
) |
(10,204,847 |
) |
(20,365,279 |
) |
(556,051 |
) |
— |
|
(38,504,636 |
) |
|
Total expenses |
|
(314,388,493 |
) |
(274,350,434 |
) |
(372,822,384 |
) |
(25,000,494 |
) |
1,541,730 |
|
(985,020,075 |
) |
|
Net income of the segment reported |
|
23,198,933 |
|
17,603,544 |
|
43,364,255 |
|
4,102,440 |
|
— |
|
88,269,172 |
|
|
|
|
|
|
|
|
|
|
|
|
|
|
|
|
|
Current assets |
|
134,592,777 |
|
77,684,243 |
|
89,318,029 |
|
25,577,117 |
|
— |
|
327,172,166 |
|
|
Non Current Assets |
|
620,989,136 |
|
123,085,710 |
|
235,114,011 |
|
233,475,308 |
|
— |
|
1,212,664,165 |
|
|
Segment assets, total |
|
755,581,913 |
|
200,769,953 |
|
324,432,040 |
|
259,052,425 |
|
— |
|
1,539,836,331 |
|
|
Investments in associates using equity method of accounting |
|
17,848,009 |
|
— |
|
55,232,052 |
|
— |
|
— |
|
73,080,061 |
|
|
Capital expenditures and other |
|
57,115,820 |
|
46,833,922 |
|
69,605,956 |
|
6,085,212 |
|
— |
|
179,640,910 |
|
|
|
|
|
|
|
|
|
|
|
|
|
|
|
|
|
Current liabilities |
|
158,127,119 |
|
102,846,204 |
|
61,583,727 |
|
22,813,770 |
|
— |
|
345,370,820 |
|
|
Non current liabilities |
|
208,885,400 |
|
6,049,860 |
|
68,518,934 |
|
17,406,396 |
|
— |
|
300,860,590 |
|
|
Segment liabilities, total |
|
367,012,519 |
|
108,896,064 |
|
130,102,661 |
|
40,220,166 |
|
— |
|
646,231,410 |
|
|
|
|
|
|
|
|
|
|
|
|
|
|
|
|
|
Cash flows generated from Operating Activities |
|
62,059,810 |
|
42,711,789 |
|
74,224,089 |
|
9,861,112 |
|
— |
|
188,856,800 |
|
|
Cash flows used in Investing Activities |
|
(39,707,483 |
) |
(43,996,852 |
) |
(69,604,445 |
) |
(2,861,423 |
) |
— |
|
(156,170,203 |
) |
|
Cash flows generated from (used in) Financing Activities |
|
(38,808,788 |
) |
2,720,303 |
|
32,537,501 |
|
— |
|
— |
|
(3,550,984 |
) |
Cash and cash equivalents are detailed as follows as of December 31, 2014 and 2013:
|
Description |
|
12.31.2014 |
|
12.31.2013 |
|
|
By item |
|
ThCh$ |
|
ThCh$ |
|
|
Cash |
|
595,442 |
|
505,545 |
|
|
Bank balances |
|
13,931,375 |
|
23,317,938 |
|
|
Time deposits |
|
13,159,563 |
|
16,233,044 |
|
|
Mutual funds |
|
51,828,054 |
|
39,919,599 |
|
|
Total cash and cash equivalents |
|
79,514,434 |
|
79,976,126 |
|
|
By currency |
|
ThCh$ |
|
ThCh$ |
|
|
Dollar |
|
5,747,745 |
|
10,021,933 |
|
|
Euro |
|
15 |
|
522 |
|
|
Argentine Peso |
|
1,317,489 |
|
7,947,636 |
|
|
Chilean Peso |
|
17,708,037 |
|
30,452,472 |
|
|
Paraguayan Guaraní |
|
9,385,359 |
|
3,970,265 |
|
|
Brazilian Real |
|
45,355,789 |
|
27,583,298 |
|
|
Total cash and cash equivalents |
|
79,514,434 |
|
79,976,126 |
|
5.1 Time deposits
Time deposits defined as cash and cash equivalents are detailed as follows at December 31, 2014 and 2013:
|
Placement |
|
Institution |
|
Currency |
|
Principal |
|
Annual
|
|
12.31.2014 |
|
|
|
|
|
|
|
|
ThCh$ |
|
% |
|
ThCh$ |
|
|
11-28-2014 |
|
Banco de Chile |
|
Chilean pesos |
|
3,800,000 |
|
3.60 |
|
3,810,980 |
|
|
11-28-2014 |
|
Banco Santander |
|
Chilean pesos |
|
1,300,000 |
|
3.72 |
|
2,508,525 |
|
|
12-31-2014 |
|
Banco Regional S.A.E.C.A. |
|
Paraguayan guaranies |
|
4,218,542 |
|
4.00 |
|
4,218,542 |
|
|
12-19-2014 |
|
Banco Citibank NA |
|
Paraguayan guaranies |
|
1,310,758 |
|
4.75 |
|
1,310,758 |
|
|
12-19-2014 |
|
Banco Itaú Paraguay S.A. |
|
Paraguayan guaranies |
|
1,310,758 |
|
4.50 |
|
1,310,758 |
|
|
Total |
|
|
|
|
|
|
|
|
|
13,159,563 |
|
|
Placement |
|
Institution |
|
Currency |
|
Principal |
|
Annual
|
|
12.31.2013 |
|
|
|
|
|
|
|
|
ThCh$ |
|
% |
|
ThCh$ |
|
|
12-18-2013 |
|
Banco Chile |
|
Chilean pesos |
|
4,340,000 |
|
4.56 |
|
4,347,147 |
|
|
12-18-2013 |
|
Banco Santander |
|
Chilean pesos |
|
4,340,000 |
|
4.92 |
|
4,347,705 |
|
|
12-11-2013 |
|
Banco Chile |
|
Chilean pesos |
|
3,000,000 |
|
4.68 |
|
3,007,800 |
|
|
12-18-2013 |
|
Banco HSBC |
|
Chilean pesos |
|
2,579,000 |
|
4.56 |
|
2,583,247 |
|
|
12-31-2013 |
|
Banco Regional S.A.E.C.A. |
|
Paraguayan guaranies |
|
1,929,567 |
|
3.50 |
|
1,929,567 |
|
|
12-18-2013 |
|
Banco Votorantim |
|
Brazilian real |
|
16,702 |
|
8.82 |
|
17,578 |
|
|
Total |
|
|
|
|
|
|
|
|
|
16,233,044 |
|
5.2 Money Market
Money market mutual fund´s shares are valued using the share values at the close of each reporting period. Below is a description for the end of each period:
|
Institution |
|
12.31.2014 |
|
12.31.2013 |
|
|
|
|
ThCh$ |
|
ThCh$ |
|
|
Mutual fund Soberano Banco Itaú — Brazil |
|
41,354,014 |
|
20,414,604 |
|
|
Mutual fund Corporativo Banchile - Chile |
|
7,006,132 |
|
9,720,215 |
|
|
Western Assets Institutional Cash Reserves - USA |
|
3,313,647 |
|
6,427,025 |
|
|
Mutual fund Wells Fargo - USA |
|
154,261 |
|
133,378 |
|
|
Mutual fund Banco Galicia - Argentina |
|
— |
|
3,224,247 |
|
|
UBS |
|
— |
|
130 |
|
|
Total m utual funds |
|
51,828,054 |
|
39,919,599 |
|
NOTE 6 — OTHER CURRENT AND NON-CURRENT FINANCIAL ASSETS
Below are the financial instruments held by the Company at December 31, 2014 and 2013, other than cash and cash equivalents. They consist of time deposits with short-term maturities (more than 90 days), restricted mutual funds and derivative contracts. Financial instruments are detailed as follows :
a) Current portion 2014
Time deposits
|
Placement |
|
Maturity |
|
Institution |
|
Currency |
|
Principal |
|
Annual
|
|
12.31.2014 |
|
|
|
|
|
|
|
|
|
|
ThCh$ |
|
% |
|
ThCh$ |
|
|
08-14-2014 |
|
02-13-2015 |
|
Banco Santander - Chile |
|
Unidad de fomento |
|
4,500,000 |
|
1.65 |
% |
4,632,134 |
|
|
08-14-2014 |
|
02-13-2015 |
|
Banco de Chile - Chile |
|
Unidad de fomento |
|
4,500,000 |
|
1.25 |
% |
4,625,025 |
|
|
08-14-2014 |
|
02-13-2015 |
|
Banco Estado - Chile |
|
Unidad de fomento |
|
4,500,000 |
|
1.15 |
% |
4,623,248 |
|
|
08-19-2014 |
|
02-13-2015 |
|
Banco Santander - Chile |
|
Unidad de fomento |
|
5,480,000 |
|
1.45 |
% |
5,633,637 |
|
|
08-29-2014 |
|
08-31-2015 |
|
Banco Itaú - Chile |
|
Unidad de fomento |
|
6,000,000 |
|
0.60 |
% |
6,143,820 |
|
|
08-29-2014 |
|
08-31-2015 |
|
Banco Santander - Chile |
|
Unidad de fomento |
|
6,000,000 |
|
0.70 |
% |
6,145,932 |
|
|
09-26-2014 |
|
05-13-2015 |
|
Banco Santander - Chile |
|
Unidad de fomento |
|
8,950,000 |
|
0.15 |
% |
9,127,301 |
|
|
09-26-2014 |
|
09-30-2015 |
|
Banco HSBC - Chile |
|
Unidad de fomento |
|
8,950,000 |
|
0.54 |
% |
9,136,789 |
|
|
10-07-2014 |
|
09-24-2015 |
|
Banco de Chile - Chile |
|
Unidad de fomento |
|
4,650,000 |
|
0.35 |
% |
4,738,930 |
|
|
11-06-2014 |
|
08-13-2015 |
|
Banco de Chile - Chile |
|
Unidad de fomento |
|
4,000,000 |
|
1.60 |
% |
4,053,000 |
|
|
11-06-2014 |
|
11-12-2015 |
|
Banco Santander - Chile |
|
Unidad de fomento |
|
4,000,000 |
|
1.58 |
% |
4,052,877 |
|
|
11-06-2014 |
|
08-13-2015 |
|
Banco Itaú - Chile |
|
Unidad de fomento |
|
4,000,000 |
|
1.47 |
% |
4,052,197 |
|
|
12-10-2014 |
|
08-13-2015 |
|
Banco Santander - Chile |
|
Unidad de fomento |
|
6,580,000 |
|
3.28 |
% |
6,592,590 |
|
|
12-10-2014 |
|
05-13-2015 |
|
Banco Itaú - Chile |
|
Unidad de fomento |
|
3,290,000 |
|
3.87 |
% |
3,297,427 |
|
|
12-12-2014 |
|
08-13-2015 |
|
Banco Itaú - Chile |
|
Unidad de fomento |
|
400,000 |
|
3.50 |
% |
400,739 |
|
|
12-19-2014 |
|
08-26-2015 |
|
Banco Santander - Chile |
|
Unidad de fomento |
|
4,100,000 |
|
3.86 |
% |
4,105,275 |
|
|
12-19-2014 |
|
08-26-2015 |
|
Banco Santander - Chile |
|
Unidad de fomento |
|
3,500,000 |
|
3.59 |
% |
3,504,188 |
|
|
12-26-2014 |
|
10-27-2015 |
|
Banco Santander - Chile |
|
Unidad de fomento |
|
2,000,000 |
|
2.75 |
% |
2,000,764 |
|
|
12-29-2014 |
|
10-27-2015 |
|
Banco Santander - Chile |
|
Unidad de fomento |
|
4,750,000 |
|
2.81 |
% |
4,750,742 |
|
|
12-30-2014 |
|
10-27-2015 |
|
Banco de Chile - Chile |
|
Unidad de fomento |
|
3,500,000 |
|
2.55 |
% |
3,500,248 |
|
|
11-28-2014 |
|
03-02-2015 |
|
Banco Citibank NA - Paraguay |
|
Paraguayan guaraníes |
|
1,310,758 |
|
4.75 |
% |
1,310,758 |
|
|
11-28-2014 |
|
03-02-2015 |
|
Banco BBVA Paraguay S.A. |
|
Paraguayan guaraníes |
|
1,310,758 |
|
4.75 |
% |
1,310,758 |
|
|
11-03-2014 |
|
01-02-2015 |
|
Banco Galicia - Argentina |
|
Argentine pesos (1) |
|
366,130 |
|
20.75 |
% |
366,130 |
|
|
11-05-2014 |
|
01-05-2015 |
|
Banco HSBC - Argentina |
|
Argentine pesos (1) |
|
148,668 |
|
20.00 |
% |
148,668 |
|
|
11-07-2014 |
|
01-06-2015 |
|
Banco Galicia - Argentina |
|
Argentine pesos (1) |
|
365,348 |
|
20.75 |
% |
365,348 |
|
|
11-17-2014 |
|
01-16-2015 |
|
Banco Industrial - Argentina |
|
Argentine pesos (1) |
|
291,128 |
|
22.00 |
% |
291,128 |
|
|
12-17-2014 |
|
02-18-2015 |
|
Banco Industrial - Argentina |
|
Argentine pesos (1) |
|
152,652 |
|
21.00 |
% |
152,652 |
|
|
11-21-2014 |
|
01-20-2015 |
|
Banco Galicia - Argentina |
|
Argentine pesos (1) |
|
304,783 |
|
20.75 |
% |
304,783 |
|
|
12-09-2014 |
|
02-09-2015 |
|
Banco Santander Río - Argentina |
|
Argentine pesos (1) |
|
349,255 |
|
20.90 |
% |
349,255 |
|
|
12-16-2014 |
|
02-18-2015 |
|
Banco Industrial - Argentina |
|
Argentine pesos (1) |
|
370,189 |
|
21.00 |
% |
370,189 |
|
|
12-19-2014 |
|
02-18-2015 |
|
Banco Santander Río - Argentina |
|
Argentine pesos (1) |
|
383,087 |
|
20.90 |
% |
383,087 |
|
|
12-22-2014 |
|
02-18-2015 |
|
Banco ICB - Argentina |
|
Argentine pesos (1) |
|
160,501 |
|
20.00 |
% |
160,501 |
|
|
12-29-2014 |
|
02-27-2015 |
|
Banco Santander Río - Argentina |
|
Argentine pesos (1) |
|
211,092 |
|
20.90 |
% |
211,092 |
|
|
Subtotal |
|
|
|
|
|
|
|
|
|
|
|
100,841,212 |
|
(1) Corresponds to time deposits entered into in order to guaranty derivative operations in Argentina
|
|
|
12.31.2014
|
|
|
Mutual funds |
|
|
|
|
Banco Crédito e Inversiones - Chile |
|
23,514 |
|
|
Western Assets Institutional Cash Reserves - USA |
|
1,107,579 |
|
|
|
|
1,131,093 |
|
|
Bonds |
|
|
|
|
Bonds Provincia Buenos Aires - Argentina |
|
3,584 |
|
|
|
|
|
|
|
Guarantee Funds |
|
|
|
|
Guarantee funds for derivative operations Rofex-Argentina (2) |
|
1,729,820 |
|
|
|
|
|
|
|
Derivative futures contracts |
|
|
|
|
Derivative futures contracts (see note Note 21) |
|
2,871,333 |
|
|
|
|
|
|
|
Total other current financial assets |
|
106,577,042 |
|
(2) Corresponds to funds that should remain restricted according to the partial results from derivative operations in Argentina.
b) Non-current portion 2014
|
|
|
12.31.2014
|
|
|
Time Deposits |
|
|
|
|
Banco Votorantim |
|
19,533 |
|
|
|
|
19,533 |
|
|
|
|
|
|
|
Derivative futures contracts |
|
|
|
|
Derivative futures contracts (see note Note 21) |
|
51,007,240 |
|
|
Total other non-current financial assets |
|
51,026,773 |
|
c) Current portion 2013
Time deposits
|
Placement |
|
Maturity |
|
Institution |
|
Currency |
|
Principal |
|
Annual
|
|
12.31.2013 |
|
|
|
|
|
|
|
|
|
|
ThCh$ |
|
% |
|
ThCh$ |
|
|
09-13-2013 |
|
02-13-2014 |
|
Banco HSBC - Chile |
|
Chilean pesos |
|
1,650,000 |
|
5.40 |
|
1,676,978 |
|
|
09-30-2013 |
|
03-26-2014 |
|
Banco Santander - Chile |
|
Chilean pesos |
|
1,600,000 |
|
5.52 |
|
1,622,571 |
|
|
10-10-2013 |
|
02-13-2014 |
|
Banco Santander - Chile |
|
Chilean pesos |
|
1,000,000 |
|
5.52 |
|
1,012,573 |
|
|
10-10-2013 |
|
03-26-2014 |
|
Banco HSBC - Chile |
|
Chilean pesos |
|
2,380,000 |
|
5.16 |
|
2,407,973 |
|
|
11-20-2013 |
|
04-22-2014 |
|
Banco HSBC - Chile |
|
Chilean pesos |
|
3,630,000 |
|
4.56 |
|
3,648,852 |
|
|
11-20-2013 |
|
04-22-2014 |
|
Banco BBVA - Chile |
|
Chilean pesos |
|
3,630,000 |
|
4.44 |
|
3,648,356 |
|
|
11-20-2013 |
|
22-04-2014 |
|
Banco Itaú - Chile |
|
Chilean pesos |
|
3,630,000 |
|
4.50 |
|
3,648,604 |
|
|
12-11-2013 |
|
05-29-2014 |
|
Banco HSBC - Chile |
|
Chilean pesos |
|
3,000,000 |
|
4.92 |
|
3,008,200 |
|
|
12-18-2013 |
|
04-22-2014 |
|
Banco de Chile- Chile |
|
Chilean pesos |
|
6,200,000 |
|
4.80 |
|
6,210,747 |
|
|
12-18-2013 |
|
04-22-2014 |
|
Banco Santander - Chile |
|
Chilean pesos |
|
6,200,000 |
|
4.92 |
|
6,211,014 |
|
|
10-15-2013 |
|
04-14-2014 |
|
Banco Bradesco |
|
Brazilian real |
|
25,662 |
|
10.01 |
|
26,129 |
|
|
Subtotal |
|
|
|
|
|
|
|
|
|
|
|
33,121,997 |
|
|
|
|
12.31.2013 |
|
|
|
|
ThCh$ |
|
|
Bonds |
|
|
|
|
Bonds Provincia Buenos Aires - Argentina |
|
7,468 |
|
|
|
|
|
|
|
Derivative futures contracts |
|
|
|
|
Derivative futures contracts (see note Note 21) |
|
3,342,172 |
|
|
Total other non-current financial assets |
|
36,471,637 |
|
d) Non-current portion 2013
|
|
|
12.31.2013 |
|
|
|
|
ThCh$ |
|
|
Derivative futures contracts |
|
|
|
|
Derivative futures contracts (see note Note 21) |
|
7,922,287 |
|
|
Total other non-current financial assets |
|
7,922,287 |
|
Note 7.1 Other current non-financial assets
|
Description |
|
12.31.2014 |
|
12.31.2013 |
|
|
|
|
ThCh$ |
|
ThCh$ |
|
|
Prepaid expenses |
|
6,178,285 |
|
4,959,328 |
|
|
Fiscal credits |
|
1,466,228 |
|
4,386,106 |
|
|
Prepaid insurance |
|
53,402 |
|
112,460 |
|
|
Prepaid insurance (Argentine) |
|
9,924 |
|
11,252 |
|
|
Other current assets |
|
79,342 |
|
226,658 |
|
|
Total |
|
7,787,181 |
|
9,695,804 |
|
Note 7.2 Other non-current, non-financial assets
|
Description |
|
12.31.2014 |
|
12.31.2013 |
|
|
|
|
ThCh$ |
|
ThCh$ |
|
|
Judicial deposits (1) |
|
22,717,093 |
|
21,357,404 |
|
|
Prepaid expenses |
|
5,624,838 |
|
4,067,531 |
|
|
Fiscal credits |
|
4,409,561 |
|
2,816,784 |
|
|
Others |
|
305,288 |
|
554,434 |
|
|
Total |
|
33,056,780 |
|
28,796,153 |
|
(1) See note 22.2
NOTE 8 — TRADE AND OTHER RECEIVABLES
The composition of trade and other receivables is detailed as follows:
|
|
|
12.31.2014 |
|
12.31.2013 |
|
||||||||
|
Trade and other receivables |
|
Assets
|
|
Allowance for
|
|
Commercial
|
|
Assets
|
|
Allowance
|
|
Commercial
|
|
|
|
|
ThCh$ |
|
ThCh$ |
|
ThCh$ |
|
ThCh$ |
|
ThCh$ |
|
ThCh$ |
|
|
Current commercial debtors |
|
|
|
|
|
|
|
|
|
|
|
|
|
|
Trade debtors |
|
164,026,718 |
|
(7,028,207 |
) |
156,998,511 |
|
153,734,921 |
|
(2,628,832 |
) |
151,106,089 |
|
|
Other current debtors |
|
30,963,659 |
|
— |
|
30,963,659 |
|
34,433,688 |
|
— |
|
34,433,688 |
|
|
Current commercial debtors |
|
194,990,377 |
|
(7,028,207 |
) |
187,962,170 |
|
188,168,609 |
|
(2,628,832 |
) |
185,539,777 |
|
|
Prepayments suppliers |
|
6,017,624 |
|
— |
|
6,017,624 |
|
4,926,329 |
|
— |
|
4,926,329 |
|
|
Other current accounts receivable |
|
4,189,001 |
|
(58,371 |
) |
4,130,630 |
|
5,018,016 |
|
(50,047 |
) |
4,967,969 |
|
|
Commercial debtors and other current accounts receivable |
|
205,197,002 |
|
(7,086,578 |
) |
198,110,424 |
|
198,112,954 |
|
(2,678,879 |
) |
195,434,075 |
|
|
|
|
|
|
|
|
|
|
|
|
|
|
|
|
|
Non-current accounts receivable |
|
|
|
|
|
|
|
|
|
|
|
|
|
|
Trade debtors |
|
100,105 |
|
— |
|
100,105 |
|
92,283 |
|
— |
|
92,283 |
|
|
Other non-current debtors |
|
6,997,704 |
|
— |
|
6,997,704 |
|
7,538,970 |
|
— |
|
7,538,970 |
|
|
Non-current accounts receivable |
|
7,097,809 |
|
— |
|
7,097,809 |
|
7,631,253 |
|
— |
|
7,631,253 |
|
|
|
|
|
|
|
|
|
|
|
|
|
|
|
|
|
Trade and other receivable |
|
212,294,811 |
|
(7,086,578 |
) |
205,208,233 |
|
205,744,207 |
|
(2,678,879 |
) |
203,065,328 |
|
|
Aging of debtor portfolio |
|
Number of
|
|
12.31.2014 |
|
Number of
|
|
12.31.2013 |
|
|
|
|
|
|
ThCh$ |
|
|
|
ThCh$ |
|
|
Up to date non-securitized portfolio |
|
25,834 |
|
59,916,856 |
|
38,701 |
|
44,992,572 |
|
|
1 and 30 days |
|
63,235 |
|
92,184,412 |
|
68,206 |
|
100,449,837 |
|
|
31 and 60 days |
|
583 |
|
1,309,832 |
|
1,256 |
|
3,387,111 |
|
|
61 and 90 days |
|
396 |
|
420,965 |
|
392 |
|
585,664 |
|
|
91 and 120 days |
|
334 |
|
481,396 |
|
353 |
|
365,714 |
|
|
121 and 150 days |
|
210 |
|
353,768 |
|
287 |
|
235,232 |
|
|
151 and 180 days |
|
197 |
|
207,522 |
|
253 |
|
412,096 |
|
|
181 and 210 days |
|
306 |
|
568,956 |
|
219 |
|
1,284,030 |
|
|
211 and 250 days |
|
199 |
|
548,469 |
|
300 |
|
450,165 |
|
|
More than 250 days |
|
1,248 |
|
8,134,647 |
|
1,134 |
|
1,664,783 |
|
|
Total |
|
92,542 |
|
164,126,823 |
|
111,101 |
|
153,827,204 |
|
|
|
|
|
|
12.31.2014 |
|
|
|
12.31.2013 |
|
|
|
|
|
|
ThCh$ |
|
|
|
ThCh$ |
|
|
Current comercial debtors |
|
|
|
164,026,718 |
|
|
|
153,734,921 |
|
|
Non-current comercial debtors |
|
|
|
100,105 |
|
|
|
92,283 |
|
|
Total |
|
|
|
164,126,823 |
|
|
|
153,827,204 |
|
The movement in the allowance for doubtful accounts between January 1 and December 31, 2014 and 2013, are presented below:
|
|
|
12.31.2014 |
|
12.31.2013 |
|
12.31.2012 |
|
|
|
|
ThCh$ |
|
ThCh$ |
|
ThCh$ |
|
|
Opening balance |
|
2,678,879 |
|
1,486,749 |
|
1,544,574 |
|
|
Bad debt expense |
|
4,459,276 |
|
2,519,653 |
|
976,331 |
|
|
Reverse applied against the provision |
|
(35,827 |
) |
(1,278,400 |
) |
(843,766 |
) |
|
Change due to foreign exchange differences |
|
(15,750 |
) |
(49,123 |
) |
(190,390 |
) |
|
Movement |
|
4,407,699 |
|
1,192,130 |
|
(57,825 |
) |
|
Ending balance |
|
7,086,578 |
|
2,678,879 |
|
1,486,749 |
|
The composition of inventories is detailed as follows :
|
Details |
|
12.31.2014 |
|
12.31.2013 |
|
|
|
|
ThCh$ |
|
ThCh$ |
|
|
Raw materials |
|
74,691,675 |
|
64,227,397 |
|
|
Finished goods |
|
27,912,801 |
|
25,526,110 |
|
|
Spare parts and supplies |
|
26,213,284 |
|
21,960,091 |
|
|
Merchandise |
|
19,981,602 |
|
14,713,305 |
|
|
Work in progress |
|
289,740 |
|
324,781 |
|
|
Other inventories |
|
3,039,477 |
|
2,510,771 |
|
|
Obsolescence provision (1) |
|
(2,400,961 |
) |
(3,408,464 |
) |
|
Total |
|
149,727,618 |
|
125,853,991 |
|
The cost of inventory recognized as cost of sales is ThCh$ 1,081,243,408, ThCh$ 914,817,748 and ThCh$ 698,955,215 at December 31, 2014, 2013 and 2012, respectively.
(1) The provision for obsolescence is primarily related more to the obsolescence of parts classified as inventories than finished goods and raw materials.
NOTE 10 — CURRENT AND DEFERRED INCOME TAXE
For the year ended December 31, 2014, the Company had taxable profits of ThCh$ 64,344,562, comprised of profits with credits for first category income tax amounting to ThCh$ 53,682,038 and profits without credits amounting to ThCh$ 10,662,524.
10.1 Tax Reform
On September 29, 2014, the Official Daily Newspaper published Law N°20,780 which amends the Chilean tax regime, with the main following changes :
· It establishes a new system of semi-integrated taxation, which can be used as an alternative to the integrated regime of attributed income. Taxpayers may opt freely to any of the two to pay their taxes. In the case of Embotelladora Andina S.A. by a general rule established by law the semi-integrated taxation system applies, which should be subsequently ratified by a future General Shareholders Meeting .
· The semi-integrated system establishes the gradual increase in the first category tax rate for the business years 2014, 2015, 2016, 2017 and 2018 onwards, increasing to 21%, 22.5%, 24%, 25.5% and 27% respectively .
· The effect of applying the new rate of 21% from January 1, 2014, generated a higher charge to income in the amount of ThCh$ 180,724 .
· Regarding the amendments to deferred taxes resulting from rate changes to be applied during the reversal period of differences between the bases of valuation of assets and liabilities by deferred taxes, were recognized on December 31, 2014, according to IAS 12 with a charge to net income, amounting to a total of ThCh$ 23,615,151.
10.2 Current tax assets
Current tax payables correspond to the following items:
|
Description |
|
12.31.2014 |
|
12.31.2013 |
|
|
|
|
ThCh$ |
|
ThCh$ |
|
|
Monthly provisional payments |
|
5,727,642 |
|
3,756,220 |
|
|
Tax credits (1) |
|
297,407 |
|
233,477 |
|
|
Total |
|
6,025,049 |
|
3,989,697 |
|
(1) Tax credits correspond to income tax credits on training expenses, purchase of property, plant and equipment, and donations.
10.3 Current tax liabilities
Current tax payables correspond to the following items
|
Description |
|
12.31.2014 |
|
12.31.2013 |
|
|
|
|
ThCh$ |
|
ThCh$ |
|
|
Income tax expense |
|
2,931,206 |
|
3,679,057 |
|
|
Total |
|
2,931,206 |
|
3,679,057 |
|
10.4 Income tax expense
The current and deferred income tax expenses for the years ended December 31, 2014 and 2013 are detailed as follows:
|
Item |
|
12.31.2014 |
|
12.31.2013 |
|
12.31.2012 |
|
|
|
|
ThCh$ |
|
ThCh$ |
|
ThCh$ |
|
|
Current income tax expense |
|
16,313,855 |
|
31,237,950 |
|
31,849,744 |
|
|
Adjustment to current income tax from the previous fiscal year |
|
(547,549 |
) |
1,051,182 |
|
172,055 |
|
|
Withholding tax expense foreign subsidiaries |
|
4,848,794 |
|
1,032,620 |
|
322,703 |
|
|
Property tax expense |
|
784,742 |
|
668,111 |
|
428,008 |
|
|
Other current income tax expense (income) |
|
(220,675 |
) |
(12,281 |
) |
72,905 |
|
|
Current income tax expense |
|
21,179,167 |
|
33,977,582 |
|
32,845,415 |
|
|
I ncome (expense) for the creation and reversal of current tax difference |
|
840,269 |
|
(11,011,318 |
) |
5,659,221 |
|
|
Tax reform |
|
23,334,999 |
|
— |
|
— |
|
|
Expense (income) for deferred taxes |
|
24,175,268 |
|
(11,011,318 |
) |
5,659,221 |
|
|
Total income tax expense |
|
45,354,435 |
|
22,966,264 |
|
38,504,636 |
|
10.5 Deferred income taxes
The net cumulative balances of temporary differences which give rise to deferred tax assets and liabilities are shown below:
|
|
|
12.31.2014 |
|
12.31.2013 |
|
||||
|
Temporary differences (4) |
|
Assets |
|
Liabilities |
|
Assets |
|
Liabilities |
|
|
|
|
ThCh$ |
|
ThCh$ |
|
ThCh$ |
|
ThCh$ |
|
|
|
|
|
|
|
|
|
|
|
|
|
Property, plant and equipment |
|
1,825,735 |
|
50,035,641 |
|
1,056,518 |
|
49,845,214 |
|
|
Obsolescence provision |
|
1,789,886 |
|
— |
|
965,678 |
|
— |
|
|
Employee benefits |
|
3,092,399 |
|
— |
|
2,088,002 |
|
31,116 |
|
|
Post-employment benefits |
|
82,299 |
|
798,459 |
|
53,660 |
|
109,700 |
|
|
Tax loss carried-forwards (1) and (2) |
|
12,301,624 |
|
— |
|
6,889,833 |
|
— |
|
|
Tax Goodwill Brazil |
|
51,257,770 |
|
— |
|
58,617,580 |
|
— |
|
|
Contingency provision |
|
29,553,200 |
|
— |
|
26,495,935 |
|
— |
|
|
Foreign exchange differences ( Foreign Subsidiaries) (3) |
|
— |
|
2,612,804 |
|
— |
|
2,456,789 |
|
|
Allowance for doubtful accounts |
|
977,330 |
|
— |
|
328,046 |
|
— |
|
|
Tax resulting from holding inventories (Argentina) |
|
1,892,625 |
|
— |
|
1,154,458 |
|
— |
|
|
Assets and liabilities for placement of bonds |
|
— |
|
809,091 |
|
— |
|
516,364 |
|
|
Lease liabilities |
|
4,441,730 |
|
— |
|
3,807,924 |
|
11,924 |
|
|
Inventories |
|
— |
|
78,337 |
|
425,384 |
|
415,379 |
|
|
Distribution rights |
|
— |
|
178,308,862 |
|
— |
|
153,253,820 |
|
|
Others |
|
939,033 |
|
1,636,584 |
|
850,620 |
|
1,630,816 |
|
|
Subtotal |
|
108,153,631 |
|
234,279,778 |
|
102,733,638 |
|
208,271,122 |
|
|
Net Liabilities |
|
— |
|
126,126,147 |
|
— |
|
105,537,484 |
|
(1) Tax losses associated mainly with our subsidiary in Chile - Embotelladora Andina Chile S.A., which is in the process of implementation of their manufacturing and commercial operations, the amount totals to ThCh$ 9,994,425 and other minor subsidiaries in Chile ThCh$ 540,276. Tax losses in Chile do not have an expiration date
(2) Tax losses associated to our subsidiary Rio de Janeiro Refrescos Ltda. amounting to ThCh$ 1,766,923 arising during 2014.
(3) This corresponds to tax incentives in Brazil that consist of a tax withholding reduction that are recorded under income statement, but under tax rules they must be recorded in equity, and cannot be distributed as dividends.
(4) Balances are increased due to rate changes resulting from the Tax Reform approved in Chile, which is explained in note 10.1.
10.6 Deferred tax liability movement
The movement in deferred income tax accounts is as follows:
|
Item |
|
12.31.2014 |
|
12.31.2013 |
|
12.31.2012 |
|
|
|
|
ThCh$ |
|
ThCh$ |
|
ThCh$ |
|
|
|
|
|
|
|
|
|
|
|
Opening Balance |
|
105,537,484 |
|
111,414,626 |
|
35,245,490 |
|
|
Increase due to merger |
|
— |
|
6,938,385 |
|
76,544,806 |
|
|
Increase (decrease) in deferred tax |
|
(4,931,757 |
) |
(12,592,600 |
) |
4,453,994 |
|
|
Increase resulting from Tax Reform rates |
|
23,334,999 |
|
— |
|
— |
|
|
Decrease due to foreign currency translation |
|
2,185,421 |
|
(222,927 |
) |
(4,829,664 |
) |
|
Movements |
|
20,588,663 |
|
(5,877,142 |
) |
76,169,136 |
|
|
Ending balance |
|
126,126,147 |
|
105,537,484 |
|
111,414,626 |
|
10.7 Distribution of domestic and foreign tax expense
For the years ended December 31, 2014 and 2013, domestic and foreign tax expense are detailed as follows:
|
Income tax |
|
12.31.2014 |
|
12.31.2013 |
|
12.31.2012 |
|
|
|
|
ThCh$ |
|
ThCh$ |
|
ThCh$ |
|
|
Current income taxes |
|
|
|
|
|
|
|
|
Foreign |
|
(15,058,221 |
) |
(18,135,554 |
) |
(25,054,795 |
) |
|
Domestic |
|
(6,120,946 |
) |
(15,842,028 |
) |
(7,790,620 |
) |
|
Current income tax expense |
|
(21,179,167 |
) |
(33,977,582 |
) |
(32,845,415 |
) |
|
|
|
|
|
|
|
|
|
|
Deferred income taxes |
|
|
|
|
|
|
|
|
Foreign |
|
(2,080,538 |
) |
10,509,053 |
|
(6,071,382 |
) |
|
Domestic |
|
(22,094,730 |
) |
502,265 |
|
412,161 |
|
|
Deferred income tax expense |
|
(24,175,268 |
) |
11,011,318 |
|
(5,659,221 |
) |
|
Income tax expense |
|
(45,354,435 |
) |
(22,966,264 |
) |
(38,504,636 |
) |
10.8 Reconciliation of effective rate
Below is the reconciliation between the effective tax rate and the statutory rate:
|
Reconciliation of effective rate |
|
12.31.2014 |
|
12.31.2013 |
|
|
|
|
ThCh$ |
|
ThCh$ |
|
|
Net income before taxes |
|
97,388,527 |
|
113,233,488 |
|
|
Tax expense at legal rate (21.0%) |
|
(20,451,591 |
) |
— |
|
|
Tax expense at legal rate (20.0%) |
|
— |
|
(22,646,698 |
) |
|
Effect of a different tax rate in other jurisdictions |
|
(6,916,744 |
) |
(8,244,382 |
) |
|
|
|
|
|
|
|
|
Permanent differences : |
|
|
|
|
|
|
Non-taxable revenues |
|
16,703,891 |
|
14,908,228 |
|
|
Non-deductible expenses |
|
(7,336,011 |
) |
(6,750,973 |
) |
|
Tax reform (Chile) |
|
(23,334,999 |
) |
— |
|
|
Tax effect of tax provided in excess of prior period |
|
(254,185 |
) |
— |
|
|
Foreign subsidiaries tax withholding expense and other legal tax debits and credits |
|
(3,764,796 |
) |
(232,439 |
) |
|
Adjustments to tax expense |
|
(17,986,100 |
) |
7,924,816 |
|
|
|
|
|
|
|
|
|
Tax expense at effective rate |
|
(45,354,435 |
) |
(22,966,264 |
) |
|
Effective rate |
|
46.6 |
% |
20.3 |
% |
Below are the income tax rates applicable in each jurisdiction where the Company operates:
|
|
|
Rate |
|
||
|
Country |
|
2014 |
|
2013 |
|
|
Chile |
|
21 |
% |
20 |
% |
|
Brazil |
|
34 |
% |
34 |
% |
|
Argentina |
|
35 |
% |
35 |
% |
|
Paraguay |
|
10 |
% |
10 |
% |
11.1 Balances
Property, plant and equipment are detailed below at the end of each period:
|
|
|
Property, plant and equipment,
|
|
Cumulative depreciation and
|
|
Property, plant and equipment,
|
|
||||||
|
Item |
|
12.31.2014 |
|
12.31.2013 |
|
12.31.2014 |
|
12.31.2013 |
|
12.31.2014 |
|
12.31.2013 |
|
|
|
|
ThCh$ |
|
ThCh$ |
|
ThCh$ |
|
ThCh$ |
|
ThCh$ |
|
ThCh$ |
|
|
Construction in progress |
|
25,522,059 |
|
36,544,802 |
|
— |
|
— |
|
25,522,059 |
|
36,544,802 |
|
|
Land |
|
76,957,848 |
|
76,063,090 |
|
— |
|
— |
|
76,957,848 |
|
76,063,090 |
|
|
Buildings |
|
223,273,615 |
|
192,480,646 |
|
(51,215,168 |
) |
(40,664,034 |
) |
172,058,447 |
|
151,816,612 |
|
|
Plant and equipment |
|
489,218,564 |
|
441,676,692 |
|
(235,979,731 |
) |
(200,955,598 |
) |
253,238,833 |
|
240,721,094 |
|
|
Information technology |
|
17,527,911 |
|
16,144,001 |
|
(12,706,055 |
) |
(10,559,816 |
) |
4,821,856 |
|
5,584,185 |
|
|
Fixed facilities and accessories |
|
34,015,967 |
|
45,615,919 |
|
(8,960,420 |
) |
(12,407,955 |
) |
25,055,547 |
|
33,207,964 |
|
|
Vehicles |
|
36,966,300 |
|
28,724,536 |
|
(20,796,517 |
) |
(13,602,672 |
) |
16,169,783 |
|
15,121,864 |
|
|
Leasehold improvements |
|
786,269 |
|
770,928 |
|
(340,149 |
) |
(203,887 |
) |
446,120 |
|
567,041 |
|
|
Other property, plant and equipment (1) |
|
404,317,216 |
|
378,989,105 |
|
(265,512,424 |
) |
(245,665,949 |
) |
138,804,792 |
|
133,323,156 |
|
|
Total |
|
1,308,585,749 |
|
1,217,009,719 |
|
(595,510,464 |
) |
(524,059,911 |
) |
713,075,285 |
|
692,949,808 |
|
(1) Other property, plant and equipment is composed of bottles, market assets, furniture and other minor assets.
The net balance of each of these categories at December 31, 2014 and 2013 is detailed as follows:
|
Other property, plant and equipment |
|
12.31.2014 |
|
12.31.2013 |
|
|
|
|
ThCh$ |
|
ThCh$ |
|
|
Bottles |
|
62,769,011 |
|
71,654,957 |
|
|
Marketing and promotional assets |
|
66,444,241 |
|
42,683,677 |
|
|
Other property, plant and equipment |
|
9,591,540 |
|
18,984,522 |
|
|
Total |
|
138,804,792 |
|
133,323,156 |
|
The Company has insurance to protect its property, plant and equipment and its inventory from potential losses. The geographic distribution of those assets is detailed as follows:
|
Chile |
: |
Santiago, Puente Alto, Maipú, Renca, Rancagua y San Antonio, Antofagasta, Coquimbo and Punta Arenas. |
|
Argentina |
: |
Buenos Aires, Mendoza, Córdoba y Rosario, Bahía Blanca, Chacabuco, La Pampa, Neuqén, Comodoro Rivadavia, Trelew, andTierra del Fuego |
|
Brazil |
: |
Río de Janeiro, Niteroi, Campos, Cabo Frío, Nova Iguazú, Espirito Santo, Vitoria parts Sao Paulo and Minas Gerais. |
|
Paraguay |
: |
Asunción, Coronel Oviedo, Ciudad del Este and Encarnación. |
11.2 Movements
Movements in property, plant and equipment are detailed as follows between January 1 and December 31, 2014 and January 1 and December 31, 2013:
|
|
|
Construction in
|
|
Land |
|
Buildings, net |
|
Plant and
|
|
IT Equipment,
|
|
Fixed facilities
|
|
Vehicles, net |
|
Leasehold
|
|
Other
|
|
Property, plant
|
|
|
|
|
ThCh$ |
|
ThCh$ |
|
ThCh$ |
|
ThCh$ |
|
ThCh$ |
|
ThCh$ |
|
ThCh$ |
|
ThCh$ |
|
ThCh$ |
|
ThCh$ |
|
|
|
|
|
|
|
|
|
|
|
|
|
|
|
|
|
|
|
|
|
|
|
|
|
Opening balance at January 1, 2014 |
|
36,544,802 |
|
76,063,090 |
|
151,816,612 |
|
240,721,094 |
|
5,584,185 |
|
33,207,964 |
|
15,121,864 |
|
567,041 |
|
133,323,156 |
|
692,949,808 |
|
|
Additions |
|
61,749,644 |
|
— |
|
2,689,039 |
|
46,090,966 |
|
403,941 |
|
196,726 |
|
921,557 |
|
— |
|
13,661,737 |
|
125,713,610 |
|
|
Disposals |
|
(16,668 |
) |
(109,252 |
) |
(22,864 |
) |
(3,017,160 |
) |
(1,296 |
) |
(1,940 |
) |
(51,126 |
) |
— |
|
(1,299,940 |
) |
(4,520,246 |
) |
|
Transfers between items of property, plant and equipment |
|
(71,807,784 |
) |
— |
|
22,189,920 |
|
13,217,587 |
|
920,853 |
|
(5,762,142 |
) |
4,710,288 |
|
— |
|
36,531,278 |
|
— |
|
|
Depreciation expense |
|
— |
|
— |
|
(5,510,350 |
) |
(37,943,247 |
) |
(2,020,178 |
) |
(1,818,210 |
) |
(4,661,508 |
) |
(132,184 |
) |
(47,832,641 |
) |
(99,918,318 |
) |
|
Increase (decrease) due to foreign currency translation differences |
|
(912,128 |
) |
1,004,086 |
|
568,887 |
|
(1,733,312 |
) |
54,839 |
|
(766,851 |
) |
206,760 |
|
11,208 |
|
9,964,653 |
|
8,398,142 |
|
|
Other increase (decrease) |
|
(35,807 |
) |
(76 |
) |
327,203 |
|
(4,097,095 |
) |
(120,488 |
) |
— |
|
(78,052 |
) |
55 |
|
(5,543,451 |
) |
(9,547,711 |
) |
|
Total movements |
|
(11,022,743 |
) |
894,758 |
|
20,241,835 |
|
12,517,739 |
|
(762,329 |
) |
(8,152,417 |
) |
1,047,919 |
|
(120,921 |
) |
5,481,636 |
|
20,125,477 |
|
|
Ending balance at December 31, 2014 |
|
25,522,059 |
|
76,957,848 |
|
172,058,447 |
|
253,238,833 |
|
4,821,856 |
|
25,055,547 |
|
16,169,783 |
|
446,120 |
|
138,804,792 |
|
713,075,285 |
|
|
|
|
Construction in
|
|
Land |
|
Buildings, net |
|
Plant and
|
|
IT Equipment, net |
|
Fixed facilities
|
|
Vehicles, net |
|
Leasehold
|
|
Other property,
|
|
Property, plant and
|
|
|
|
|
ThCh$ |
|
ThCh$ |
|
ThCh$ |
|
ThCh$ |
|
ThCh$ |
|
ThCh$ |
|
ThCh$ |
|
ThCh$ |
|
ThCh$ |
|
ThCh$ |
|
|
|
|
|
|
|
|
|
|
|
|
|
|
|
|
|
|
|
|
|
|
|
|
|
Opening balance at January 1, 2013 |
|
61,735,710 |
|
57,134,715 |
|
131,779,399 |
|
176,179,349 |
|
5,800,223 |
|
24,838,592 |
|
7,835,697 |
|
9,422 |
|
111,237,618 |
|
576,550,725 |
|
|
Additions |
|
99,023,742 |
|
13,048,106 |
|
5,123,731 |
|
16,777,829 |
|
469,280 |
|
479,487 |
|
1,097,294 |
|
7,535 |
|
43,207,810 |
|
179,234,814 |
|
|
Disposals |
|
— |
|
(733,044 |
) |
(230,659 |
) |
(2,198,991 |
) |
(213 |
) |
(700,111 |
) |
— |
|
— |
|
(2,030,783 |
) |
(5,893,801 |
) |
|
Transfers between items of property, plant and equipment |
|
(120,904,100 |
) |
(182,817 |
) |
16,005,001 |
|
61,071,686 |
|
1,666,511 |
|
10,979,455 |
|
6,629,711 |
|
639,213 |
|
24,095,340 |
|
— |
|
|
Transfer to investment property |
|
— |
|
— |
|
— |
|
(1,565,232 |
) |
— |
|
— |
|
— |
|
— |
|
— |
|
(1,565,232 |
) |
|
Additions from business combinations (1) |
|
18,282 |
|
9,124,967 |
|
13,469,878 |
|
25,832,574 |
|
551,976 |
|
— |
|
2,027,699 |
|
— |
|
7,692,513 |
|
58,717,889 |
|
|
Depreciation expense |
|
— |
|
— |
|
(3,912,718 |
) |
(28,448,397 |
) |
(1,694,902 |
) |
(2,346,228 |
) |
(2,153,714 |
) |
(89,976 |
) |
(42,943,717 |
) |
(81,589,652 |
) |
|
Increase (decrease) due to foreign currency translation differences |
|
(3,319,254 |
) |
(1,389,534 |
) |
(8,451,502 |
) |
(5,130,748 |
) |
(150,635 |
) |
2,412,608 |
|
(313,103 |
) |
847 |
|
(3,345,472 |
) |
(19,686,793 |
) |
|
Other increase (decrease) |
|
(9,578 |
) |
(939,303 |
) |
(1,966,518 |
) |
(1,796,976 |
) |
(1,058,055 |
) |
(2,455,839 |
) |
(1,720 |
) |
— |
|
(4,590,153 |
) |
(12,818,142 |
) |
|
Total movements |
|
(25,190,908 |
) |
18,928,375 |
|
20,037,213 |
|
64,541,745 |
|
(216,038 |
) |
8,369,372 |
|
7,286,167 |
|
557,619 |
|
22,085,538 |
|
116,399,083 |
|
|
Ending balance at December 31, 2013 |
|
36,544,802 |
|
76,063,090 |
|
151,816,612 |
|
240,721,094 |
|
5,584,185 |
|
33,207,964 |
|
15,121,864 |
|
567,041 |
|
133,323,156 |
|
692,949,808 |
|
(1) Corresponds to balances incorporated as of October 11, 2013, resulting from the acquisition of Companhia de Bebidas Ipiranga, pursuant to the description in Note 3b) .
|
|
|
Construction in
|
|
Land |
|
Buildings, net |
|
Plant and
|
|
IT Equipment, net |
|
Fixed facilities
|
|
Vehicles, net |
|
Leasehold
|
|
Other
|
|
Property, plant
|
|
|
|
|
ThCh$ |
|
ThCh$ |
|
ThCh$ |
|
ThCh$ |
|
ThCh$ |
|
ThCh$ |
|
ThCh$ |
|
ThCh$ |
|
ThCh$ |
|
ThCh$ |
|
|
|
|
|
|
|
|
|
|
|
|
|
|
|
|
|
|
|
|
|
|
|
|
|
Opening balance at January 1, 2012 |
|
47,924,160 |
|
34,838,977 |
|
65,354,562 |
|
109,316,370 |
|
2,143,340 |
|
15,450,209 |
|
1,938,804 |
|
23,980 |
|
73,074,065 |
|
350,064,467 |
|
|
Additions |
|
59,622,568 |
|
— |
|
163,015 |
|
16,253,430 |
|
590,141 |
|
33,027 |
|
1,623,662 |
|
— |
|
50,800,843 |
|
129,086,686 |
|
|
Disposals |
|
— |
|
— |
|
— |
|
(425,844 |
) |
(32,575 |
) |
— |
|
— |
|
— |
|
(712,471 |
) |
(1,170,890 |
) |
|
Transfers between items of property, plant and equipment |
|
(62,379,694 |
) |
(263,320 |
) |
33,207,590 |
|
20,739,334 |
|
2,326,639 |
|
11,403,778 |
|
4,676,401 |
|
— |
|
(9,710,728 |
) |
— |
|
|
Transfer to investment property |
|
— |
|
— |
|
(2,977,969 |
) |
— |
|
— |
|
— |
|
— |
|
— |
|
— |
|
(2,977,969 |
) |
|
Additions from business combinations (1) |
|
18,267,801 |
|
25,288,317 |
|
46,717,142 |
|
58,602,133 |
|
2,068,712 |
|
24,765 |
|
591,579 |
|
— |
|
40,370,384 |
|
191,930,833 |
|
|
Depreciation expense |
|
— |
|
— |
|
(2,958,099 |
) |
(20,058,072 |
) |
(1,043,395 |
) |
(1,645,825 |
) |
(728,228 |
) |
(11,624 |
) |
(26,831,414 |
) |
(53,276,657 |
) |
|
Increase (decrease) due to foreign currency translation differences |
|
(1,699,125 |
) |
(2,729,259 |
) |
(7,833,909 |
) |
(8,547,363 |
) |
(236,756 |
) |
(422,406 |
) |
(133,634 |
) |
(2,934 |
) |
(13,619,288 |
) |
(35,224,674 |
) |
|
Other increase (decrease) |
|
— |
|
— |
|
107,067 |
|
299,361 |
|
(15,883 |
) |
(4,956 |
) |
(132,887 |
) |
— |
|
(2,133,773 |
) |
(1,881,071 |
) |
|
Total movimientos |
|
13,811,550 |
|
22,295,738 |
|
66,424,837 |
|
66,862,979 |
|
3,656,883 |
|
9,388,383 |
|
5,896,893 |
|
(14,558 |
) |
38,163,553 |
|
226,486,258 |
|
|
Ending balance at December 31, 2012 |
|
61,735,710 |
|
57,134,715 |
|
131,779,399 |
|
176,179,349 |
|
5,800,223 |
|
24,838,592 |
|
7,835,697 |
|
9,422 |
|
111,237,618 |
|
576,550,725 |
|
(1) Corresponds to balances incorporated as of October 1, 2012 as a result of the consolidation of Embotelladoras Coca-Cola Polar S.A. and certain other companies explained in note 3a) .
Balances and transactions with related parties as of December 31, 2014 and December 31, 2013 are detailed as follows :
12.1 Accounts receivable :
12.1.1 Current :
|
Taxpayer ID |
|
Company |
|
Relationship |
|
Country
|
|
Currency |
|
12.31.2014 |
|
12.31.2013 |
|
|
|
|
|
|
|
|
|
|
|
|
ThCh$ |
|
ThCh$ |
|
|
96.891.720-K |
|
Embonor S.A. |
|
Related to Shareholder |
|
Chile |
|
Chilean pesos |
|
5,629,383 |
|
4,958,064 |
|
|
96.517.210-2 |
|
Embotelladora Iquique S.A. |
|
Related to Shareholder |
|
Chile |
|
Chilean pesos |
|
359,933 |
|
607,913 |
|
|
96.714.870-9 |
|
Coca-Cola de Chile S.A. |
|
Shareholder |
|
Chile |
|
Chilean pesos |
|
— |
|
2,441,871 |
|
|
96.919.980-7 |
|
Cervecería Austral S.A. |
|
Related to director |
|
Chile |
|
Dollars |
|
4,847 |
|
20,368 |
|
|
77.755.610-k |
|
Comercial Patagona Ltda. |
|
Related to director |
|
Chile |
|
Chilean pesos |
|
290 |
|
771 |
|
|
|
|
|
|
Total |
|
|
|
|
|
5,994,453 |
|
8,028,987 |
|
12.1.2 Non current:
|
Taxpayer ID |
|
Company |
|
Relationship |
|
Country
|
|
Currency |
|
12.31.2014 |
|
12.31.2013 |
|
|
|
|
|
|
|
|
|
|
|
|
ThCh$ |
|
ThCh$ |
|
|
96.714.870-9 |
|
Coca-Cola de Chile S.A. |
|
Shareholder |
|
Chile |
|
Chilean pesos |
|
24,752 |
|
18,765 |
|
|
|
|
|
|
|
|
|
|
|
|
|
|
|
|
|
|
|
|
|
Total |
|
|
|
|
|
24,752 |
|
18,765 |
|
12.2 Accounts payable:
12.2.1 Current:
|
Taxpayer ID |
|
Company |
|
Relationship |
|
Country of
|
|
Currency |
|
12.31.2014 |
|
12.31.2013 |
|
|
|
|
|
|
|
|
|
|
|
|
ThCh$ |
|
ThCh$ |
|
|
96.714.870-9 |
|
Coca-Cola de Chile S.A. |
|
Shareholder |
|
Chile |
|
Chilean pesos |
|
14,076,916 |
|
11,942,070 |
|
|
Foreign |
|
Servicio y Productos para Bebidas Refrescantes S.R.L. |
|
Shareholder |
|
Argentina |
|
Argentine pesos |
|
5,831,334 |
|
2,500,343 |
|
|
Foreign |
|
Recofarma do Industrias Amazonas Ltda, |
|
Related to Shareholder |
|
Brazil |
|
Brazilian real |
|
13,482,012 |
|
9,613,040 |
|
|
86.881.400-4 |
|
Envases CMF S.A. |
|
Associate |
|
Chile |
|
Chilean pesos |
|
6,281,874 |
|
4,882,720 |
|
|
Foreign |
|
Coca-Cola Perú |
|
Related to Shareholder |
|
Perú |
|
Dollars |
|
5,354,145 |
|
3,489,376 |
|
|
Foreign |
|
Leao Alimentos e Bebidas Ltda. |
|
Associate |
|
Brazil |
|
Brazilian real |
|
10,356,646 |
|
10,683,703 |
|
|
Foreign |
|
Socoraba Refrescos S.A. |
|
Associate |
|
Brazil |
|
Brazilian real |
|
— |
|
83,128 |
|
|
89.996.200-1 |
|
Envases del Pacífico S.A. |
|
Related to director |
|
Chile |
|
Chilean pesos |
|
583,862 |
|
230,907 |
|
|
|
|
|
|
Total |
|
|
|
|
|
55,966,789 |
|
43,425,287 |
|
12.3 Transactions:
|
Taxpayer ID |
|
Company |
|
Relationship |
|
Country
|
|
Description of transaction |
|
Currency |
|
Cumulative
|
|
|
|
|
|
|
|
|
|
|
|
|
|
|
ThCh$ |
|
|
96.714.870-9 |
|
Coca-Cola de Chile S.A. |
|
Shareholder |
|
Chile |
|
Purchase of concentrates |
|
Chilean pesos |
|
132,201,085 |
|
|
96.714.870-9 |
|
Coca-Cola de Chile S.A. |
|
Shareholder |
|
Chile |
|
Purchase of advertising services |
|
Chilean pesos |
|
4,112,331 |
|
|
96.714.870-9 |
|
Coca-Cola de Chile S.A. |
|
Shareholder |
|
Chile |
|
Lease of water fountain |
|
Chilean pesos |
|
3,143,674 |
|
|
96.714.870-9 |
|
Coca-Cola de Chile S.A. |
|
Shareholder |
|
Chile |
|
Sale of services and others |
|
Chilean pesos |
|
5,494,143 |
|
|
86.881.400-4 |
|
Envases CMF S.A. |
|
Associate |
|
Chile |
|
Purchase of bottles |
|
Chilean pesos |
|
35,394,840 |
|
|
86.881.400-4 |
|
Envases CMF S.A. |
|
Associate |
|
Chile |
|
Sale of packaging materials |
|
Chilean pesos |
|
2,210,686 |
|
|
96.891.720-K |
|
Embonor S.A. |
|
Related to Shareholder |
|
Chile |
|
Sale of finished products |
|
Chilean pesos |
|
12,526,172 |
|
|
96.517.310-2 |
|
Embotelladora Iquique S.A. |
|
Related to Shareholder |
|
Chile |
|
Sale of finished products |
|
Chilean pesos |
|
2,369,911 |
|
|
Foreign |
|
Recofarma do Industrias Amazonas Ltda. |
|
Related to Shareholder |
|
Brazil |
|
Purchase of concentrates |
|
Brazilian real |
|
101,724,406 |
|
|
Foreign |
|
Recofarma do Industrias Amazonas Ltda. |
|
Related to Shareholder |
|
Brazil |
|
Advertising participation payment |
|
Brazilian real |
|
19,598,422 |
|
|
Foreign |
|
Leao Alimentos e Bebidas Ltda. |
|
Associate |
|
Brazil |
|
Purchase of concentrates |
|
Brazilian real |
|
35,118,038 |
|
|
Foreign |
|
Servicio y Productos para Bebidas Refrescantes S.R.L. |
|
Shareholder |
|
Argentina |
|
Purchase of concentrates |
|
Argentine pesos |
|
112,809,593 |
|
|
Foreign |
|
Servicio y Productos para Bebidas Refrescantes S.R.L. |
|
Shareholder |
|
Argentina |
|
Advertising participation payment |
|
Argentine pesos |
|
15,624,972 |
|
|
89.996.200-1 |
|
Envases del Pacífico S.A. |
|
Related to director |
|
Chile |
|
Purchase of raw materials |
|
Chilean pesos |
|
1,718,878 |
|
|
84.505.800-8 |
|
Vendomática S.A. |
|
Related to director |
|
Chile |
|
Sale of finished products |
|
Chilean pesos |
|
— |
|
|
Foreign |
|
Coca-Cola Perú |
|
Related to Shareholder |
|
Perú |
|
Purchase of concentrates and advertising participation |
|
Chilean pesos |
|
986,989 |
|
|
Foreign |
|
Sorocaba Refrescos S. A. |
|
Associate |
|
Brazil |
|
Purchase of products |
|
Brazilian real |
|
537,948 |
|
|
Taxpayer ID |
|
Company |
|
Relationship |
|
Country
|
|
Description of transaction |
|
Currency |
|
Cumulative
|
|
|
|
|
|
|
|
|
|
|
|
|
|
|
ThCh$ |
|
|
96.714.870-9 |
|
Coca-Cola de Chile S.A. |
|
Shareholder |
|
Chile |
|
Purchase of concentrates |
|
Chilean peso |
|
110,774,146 |
|
|
96.714.870-9 |
|
Coca-Cola de Chile S.A. |
|
Shareholder |
|
Chile |
|
Purchase of advertising services |
|
Chilean peso |
|
5,429,796 |
|
|
96.714.870-9 |
|
Coca-Cola de Chile S.A. |
|
Shareholder |
|
Chile |
|
Lease of water fountain |
|
Chilean peso |
|
2,646,654 |
|
|
96.714.870-9 |
|
Coca-Cola de Chile S.A. |
|
Shareholder |
|
Chile |
|
Sale of services and others |
|
Chilean peso |
|
5,571,189 |
|
|
86.881.400-4 |
|
Envases CMF S.A. |
|
Associate |
|
Chile |
|
Purchase of bottles |
|
Chilean peso |
|
33,459,965 |
|
|
86.881.400-4 |
|
Envases CMF S.A. |
|
Associate |
|
Chile |
|
Sale of packaging materials |
|
Chilean peso |
|
3,373,064 |
|
|
86.881.400-4 |
|
Envases CMF S.A. |
|
Associate |
|
Chile |
|
Purchase of packaging |
|
Chilean peso |
|
2,822,034 |
|
|
86.881.400-4 |
|
Envases CMF S.A. |
|
Associate |
|
Chile |
|
Purchase of services and others |
|
Chilean peso |
|
145,773 |
|
|
96.891.720-K |
|
Embonor S.A. |
|
Related to Shareholder |
|
Chile |
|
Sale of finished products |
|
Chilean peso |
|
28,698,682 |
|
|
96.517.310-2 |
|
Embotelladora Iquique S.A. |
|
Related to Shareholder |
|
Chile |
|
Sale of finished products |
|
Chilean peso |
|
2,383,113 |
|
|
Foreign |
|
Recofarma do Industrias Amazonas Ltda. |
|
Related to Shareholder |
|
Brasil |
|
Purchase of concentrates |
|
Brazilian real |
|
97,171,997 |
|
|
Foreign |
|
Recofarma do Industrias Amazonas Ltda. |
|
Related to Shareholder |
|
Brasil |
|
Reimbursement and other purchases |
|
Brazilian real |
|
630,511 |
|
|
Foreign |
|
Recofarma do Industrias Amazonas Ltda. |
|
Related to Shareholder |
|
Brasil |
|
Advertising participation payment |
|
Brazilian real |
|
14,788,823 |
|
|
Foreign |
|
Sorocaba Refrescos S. A. |
|
Associate |
|
Brasil |
|
Purchase of products |
|
Brazilian real |
|
2,788,906 |
|
|
Foreign |
|
Leao Alimentos e Bebidas Ltda. |
|
Associate |
|
Brasil |
|
Purchase of products |
|
Brazilian real |
|
31,991,055 |
|
|
Foreign |
|
Sistema de Alimentos e Bebidas do Brasil Ltda. |
|
Associate |
|
Brasil |
|
Purchase of products |
|
Brazilian real |
|
24,283,921 |
|
|
Foreign |
|
Servicio y Productos para Bebidas Refrescantes S.R.L. |
|
Shareholder |
|
Argentina |
|
Purchase of concentrates |
|
Argentine peso |
|
95,897,878 |
|
|
Foreign |
|
Servicio y Productos para Bebidas Refrescantes S.R.L. |
|
Shareholder |
|
Argentina |
|
Advertising rights, rewards and others |
|
Argentine peso |
|
2,321,031 |
|
|
Foreign |
|
Servicio y Productos para Bebidas Refrescantes S.R.L. |
|
Shareholder |
|
Argentina |
|
Collection of advertising participation |
|
Argentine peso |
|
8,534,260 |
|
|
89.996.200-1 |
|
Envases del Pacífico S.A. |
|
Related to director |
|
Chile |
|
Purchase of raw materials |
|
Chilean peso |
|
1,406,642 |
|
|
Foreign |
|
Coca-Cola Perú |
|
Related to Shareholder |
|
Perú |
|
Purchase of concentrates and marketing expenses recovery |
|
Chilean peso |
|
1,426,307 |
|
|
84.505.800-8 |
|
Vendomática S.A. |
|
Related to director |
|
Chile |
|
Sale of finished products |
|
Chilean peso |
|
883,534 |
|
|
97.032.000-8 |
|
BBVA Administradora General de Fondos |
|
Related to director |
|
Chile |
|
Investment in mutual funds |
|
Chilean peso |
|
54,441,000 |
|
|
97.032.000-8 |
|
BBVA Administradora General de Fondos |
|
Related to director |
|
Chile |
|
Redemption of mutual funds |
|
Chilean peso |
|
54,953,000 |
|
|
Taxpayer ID |
|
Company |
|
Relationship |
|
Country
|
|
Description of transaction |
|
Currency |
|
Cumulative
|
|
|
|
|
|
|
|
|
|
|
|
|
|
|
ThCh$ |
|
|
96.714.870-9 |
|
Coca-Cola de Chile S.A. |
|
Shareholder |
|
Chile |
|
Purchase of concentrates |
|
Chilean peso |
|
76,756,589 |
|
|
96.714.870-9 |
|
Coca-Cola de Chile S.A. |
|
Shareholder |
|
Chile |
|
Purchase of advertising services |
|
Chilean peso |
|
3,184,671 |
|
|
96.714.870-9 |
|
Coca-Cola de Chile S.A. |
|
Shareholder |
|
Chile |
|
Lease of water fountain |
|
Chilean peso |
|
2,731,636 |
|
|
96.714.870-9 |
|
Coca-Cola de Chile S.A. |
|
Shareholder |
|
Chile |
|
Sale of finished products |
|
Chilean peso |
|
1,245,309 |
|
|
96.714.870-9 |
|
Coca-Cola de Chile S.A. |
|
Shareholder |
|
Chile |
|
Sale of services and others |
|
Chilean peso |
|
1,016,520 |
|
|
96.714.870-9 |
|
Coca-Cola de Chile S.A. |
|
Shareholder |
|
Chile |
|
Sale of raw materials and others |
|
Chilean peso |
|
3,686,498 |
|
|
86.881.400-4 |
|
Envases CMF S.A. |
|
Associate |
|
Chile |
|
Purchase of bottles |
|
Chilean peso |
|
28,986,747 |
|
|
86.881.400-4 |
|
Envases CMF S.A. |
|
Associate |
|
Chile |
|
Sale of packaging materials |
|
Chilean peso |
|
2,722,611 |
|
|
96.891.720-K |
|
Embonor S.A. |
|
Related to Shareholder |
|
Chile |
|
Sale of finished products |
|
Chilean peso |
|
10,293,435 |
|
|
96.517.310-2 |
|
Embotelladora Iquique S.A. |
|
Related to Shareholder |
|
Chile |
|
Sale of finished products |
|
Chilean peso |
|
2,244,302 |
|
|
Foreign |
|
Recofarma do Industrias Amazonas Ltda. |
|
Related to Shareholder |
|
Brasil |
|
Purchase of concentrates |
|
Brazilean real |
|
78,524,183 |
|
|
Foreign |
|
Recofarma do Industrias Amazonas Ltda. |
|
Related to Shareholder |
|
Brasil |
|
Reimbursement and other purchases |
|
Brazilean real |
|
1,335,869 |
|
|
Foreign |
|
Recofarma do Industrias Amazonas Ltda. |
|
Related to Shareholder |
|
Brasil |
|
Advertising participation payment |
|
Brazilean real |
|
14,502,915 |
|
|
Foreign |
|
Servicio y Productos para Bebidas Refrescantes S.R.L. |
|
Shareholder |
|
Argentina |
|
Purchase of concentrates |
|
Argentine peso |
|
68,569,280 |
|
|
Foreign |
|
Servicio y Productos para Bebidas Refrescantes S.R.L. |
|
Shareholder |
|
Argentina |
|
Advertising rights, rewards and others |
|
Argentine peso |
|
2,624,656 |
|
|
Foreign |
|
Servicio y Productos para Bebidas Refrescantes S.R.L. |
|
Shareholder |
|
Argentina |
|
Collection of advertising participation |
|
Argentine peso |
|
5,419,055 |
|
|
89.996.200-1 |
|
Envases del Pacífico S.A. |
|
Related to director |
|
Chile |
|
Purchase of raw materials |
|
Chilean peso |
|
1,873,336 |
|
|
97.032.000-8 |
|
BBVA Administradora General de Fondos |
|
Related to director |
|
Chile |
|
Investment in mutual funds |
|
Chilean peso |
|
61,042,686 |
|
|
97.032.000-8 |
|
BBVA Administradora General de Fondos |
|
Related to director |
|
Chile |
|
Redemption of mutual funds |
|
Chilean peso |
|
59,455,046 |
|
|
97.032.000-8 |
|
BBVA Administradora General de Fondos |
|
Related to director |
|
Chile |
|
Redemption of time deposits |
|
Chilean peso |
|
223,027 |
|
|
84.505.800-8 |
|
Vendomática S.A. |
|
Related to director |
|
Chile |
|
Sale of finished products |
|
Chilean peso |
|
1,358,380 |
|
|
79.753.810-8 |
|
Claro y Cía. |
|
Related to partner |
|
Chile |
|
Legal Counseling charges |
|
Chilean peso |
|
349,211 |
|
|
93.899.000-K |
|
Vital Jugos S.A. (1) |
|
Associate |
|
Chile |
|
Sale of raw material and materials |
|
Chilean peso |
|
4,697,898 |
|
|
93.899.000-K |
|
Vital Jugos S.A. (1) |
|
Associate |
|
Chile |
|
Purchase of finished products |
|
Chilean peso |
|
18,656,191 |
|
|
96.705.990-0 |
|
Envases Central S.A. (1) |
|
Associate |
|
Chile |
|
Purchase of finished products |
|
Chilean peso |
|
14,618,933 |
|
|
96.705.990-0 |
|
Envases Central S. A. (1) |
|
Associate |
|
Chile |
|
Sale of raw materials and materials |
|
Chilean peso |
|
2,479,381 |
|
|
76.389.720-6 |
|
Vital Aguas S.A. (1) |
|
Associate |
|
Chile |
|
Purchase of finished products |
|
Chilean peso |
|
4,065,125 |
|
(1) Corresponds to transactions generated with Vital Aguas S.A:, Vital Jugos S.A. and Envases Central S.A. up until before taking control over those companies as a result of what has been described in Note 3a)
12.4 Key management compensation
Salaries and benefits paid to the Company’s key management personnel including directors and managers, are detailed as follows:
|
Description |
|
12.31.2014 |
|
12.31.2013 |
|
12.31.2012 |
|
|
|
|
ThCh$ |
|
ThCh$ |
|
ThCh$ |
|
|
Executive wages, salaries and benefits |
|
5,296,344 |
|
4,965,149 |
|
4,511,609 |
|
|
Director allowances |
|
1,512,000 |
|
1,512,000 |
|
1,302,000 |
|
|
Contract termination benefits |
|
327,000 |
|
— |
|
— |
|
|
Accrued benefits during the last five years and paid during the period |
|
1,030,990 |
|
196,819 |
|
723,298 |
|
|
Total |
|
8,166,334 |
|
6,673,968 |
|
6,536,907 |
|
NOTE 13 — EMPLOYEE BENEFITS
As of December 31, 2014 and 2013, the Company had recorded reserves for profit sharing and for bonuses totaling ThCh$ 14,563,449 and ThCh$ 8,749,678, respectively.
This liability is included in other non-current non-financial liabilities in the statement of financial position.
Employee benefits expense is allocated between the cost of sales, cost of marketing, distribution costs and administrative expenses.
13.1 Personnel expenses
Personnel expenses included in the consolidated statement of income statement are as follows:
|
Description |
|
12.31.2014 |
|
12.31.2013 |
|
12.31.2012 |
|
|
|
|
ThCh$ |
|
ThCh$ |
|
ThCh$ |
|
|
Wages and salaries |
|
197,343,949 |
|
164,138,911 |
|
116,549,091 |
|
|
Employee benefits |
|
47,424,162 |
|
36,190,649 |
|
29,023,263 |
|
|
Severance and post-employment benefits |
|
7,154,581 |
|
4,519,576 |
|
2,474,611 |
|
|
Other personnel expenses |
|
12,721,326 |
|
9,334,468 |
|
7,218,448 |
|
|
Total |
|
264,644,018 |
|
214,183,604 |
|
155,265,413 |
|
13.2 Number of Employees
|
Description |
|
12.31.2014 |
|
12.31.2013 |
|
12.31.2012 |
|
|
Number of employees |
|
16,136 |
|
16,587 |
|
13,762 |
|
|
Number of average employees |
|
15,703 |
|
15,913 |
|
12,028 |
|
13.3 Post-employment benefits
This item represents post employment benefits which are determined as stated in Note 2.17
|
Post-employment benefits |
|
12.31.2014 |
|
12.31.2013 |
|
|
|
|
ThCh$ |
|
ThCh$ |
|
|
|
|
|
|
|
|
|
Non-current provision |
|
8,125,107 |
|
8,758,111 |
|
|
Total |
|
8,125,107 |
|
8,758,111 |
|
13.4 Post-employment benefits movement
The movements of post-employment benefits for the periods ended December 31, 2014 and 2013 are detailed as follows:
|
Movements |
|
12.31.2014 |
|
12.31.2013 |
|
|
|
|
ThCh$ |
|
ThCh$ |
|
|
Opening balance |
|
8,758,111 |
|
7,037,122 |
|
|
Increase due to merger |
|
— |
|
— |
|
|
Service costs |
|
1,385,620 |
|
1,957,686 |
|
|
Interest costs |
|
199,314 |
|
133,561 |
|
|
Net actuarial losses |
|
342,990 |
|
1,411,030 |
|
|
Benefits paid |
|
(2,560,928 |
) |
(1,781,288 |
) |
|
Total |
|
8,125,107 |
|
8,758,111 |
|
13.5 Assumptions
The actuarial assumptions used at December 31, 2014 and 2013 were:
|
Assumptions |
|
12.31.2014 |
|
12.31.2013 |
|
|
|
|
|
|
|
|
|
Discount rate |
|
2.7% |
|
2.7% |
|
|
Expected salary increase rate |
|
2.0% |
|
2.0% |
|
|
Turnover rate |
|
5.4% |
|
5.4% |
|
|
Mortality rate (1) |
|
RV-2009 |
|
RV-2009 |
|
|
Retirement age of women |
|
60 years |
|
60 years |
|
|
Retirement age of men |
|
65 years |
|
65 years |
|
(1) Mortality assumption tables prescribed for use by the Chilean Superintendence of Securities and Insurance .
14.1 Balances
Investments in associates using equity method of accounting are detailed as follows:
|
|
|
|
|
Country of |
|
Functional |
|
Carrying Value |
|
Percentage interest |
|
||||
|
Taxpayer ID |
|
Name |
|
Incorporation |
|
Currency |
|
12.31.2014 |
|
12.31.2013 |
|
12.31.2014 |
|
12.31.2013 |
|
|
|
|
|
|
|
|
|
|
ThCh$ |
|
ThCh$ |
|
% |
|
% |
|
|
86.881.400-4 |
|
Envases CMF S.A. (1) |
|
Chile |
|
Chilean peso |
|
17,684,657 |
|
17,881,972 |
|
50.00 |
% |
50.00 |
% |
|
Foreign |
|
Leao Alimentos e Bebidas Ltda. (2) (3) |
|
Brasil |
|
Brazilian real |
|
14,910,530 |
|
17,354,749 |
|
8.82 |
% |
10.87 |
% |
|
Foreign |
|
Kaik Participacoes Ltda. (2) |
|
Brasil |
|
Brazilian real |
|
1,276,042 |
|
1,165,044 |
|
11.32 |
% |
11.32 |
% |
|
Foreign |
|
SRSA Participacoes Ltda. |
|
Brasil |
|
Brazilian real |
|
238,647 |
|
100,874 |
|
40.00 |
% |
40.00 |
% |
|
Foreign |
|
Sorocaba Refrescos S.A. |
|
Brasil |
|
Brazilian real |
|
31,940,337 |
|
32,170,760 |
|
40.00 |
% |
40.00 |
% |
|
|
|
|
|
|
|
|
|
|
|
|
|
|
|
|
|
|
|
|
Total |
|
|
|
|
|
66,050,213 |
|
68,673,399 |
|
|
|
|
|
(1) In these company, regardless of the percentage of ownership interest, it was determined that no controlling interest was held, only a significant influence, given that there was not a majority vote of the Board of Directors to make strategic business decisions.
(2) In these companies, regardless of the percentage of ownership interest held, the Company has significant influence, given that it has a representative on each entity’s Board of Directors.
(3) In October 2014, Rio Janeiro Refrescos Ltda., sold the 2.05% stake in Leão Alimentos e Bebidas Ltda. according to volume quotas for US$ 4,495,771 generating earnings amounting to ThCh$ 300,816, which were recognized as a credit to results.
14.2 Movement
The movement of investments in associates accounted for using, the equity method is shown below, for the period ended December 31, 2014, 2013 and 2012:
|
Details |
|
12.31.2014 |
|
12.31.2013 |
|
12.31.2012 |
|
|
|
|
ThCh$ |
|
ThCh$ |
|
ThCh$ |
|
|
Opening Balance |
|
68,673,399 |
|
73,080,061 |
|
60,290,966 |
|
|
Investment in Holdfab 2 Soc Participacoes Ltda and SABB in exchange for interest in the new company Leao Alimentos e Bebidas Ltda. |
|
— |
|
(19,349,496 |
) |
— |
|
|
Capital increases in equity investees |
|
— |
|
— |
|
2,380,320 |
|
|
Acquisition of Sorocaba Refrescos S.A. (40%) |
|
— |
|
— |
|
34,513,444 |
|
|
Increase in interest in new company Leao Alimentos e Bebidas Ltda. By 9.57% |
|
— |
|
18,928,747 |
|
— |
|
|
Increase of 1.30% participation in Leao Alimentos e Bebidas Ltda. for cquisition of the Compañía de Bebidas Ipiranga, October 11, 2013. |
|
— |
|
2,089,253 |
|
— |
|
|
Dividends received |
|
(1,590,674 |
) |
(2,085,031 |
) |
— |
|
|
Variation of minimum dividends from equity investees |
|
149,938 |
|
22,459 |
|
(402,148 |
) |
|
Share in operating income |
|
2,169,272 |
|
1,325,518 |
|
2,409,110 |
|
|
Unrealized income |
|
85,266 |
|
85,266 |
|
7,791 |
|
|
Other decrease investment in associate (Sale participation in Leon Alimentos y Bebidas Ltda.). |
|
(4,194,955 |
) |
(3,704,831 |
) |
— |
|
|
Deferred tax effect resulting from change in related tax rate in associate |
|
(438,347 |
) |
— |
|
— |
|
|
Deconsolidation of certain investments under equity method of accounting due to Polar merger (1) |
|
— |
|
— |
|
(22,466,682 |
) |
|
Decrease due to foreign currency translation differences |
|
1,196,314 |
|
(1,718,547 |
) |
(3,652,740 |
) |
|
Ending Balance |
|
66,050,213 |
|
68,673,399 |
|
73,080,061 |
|
(1) Corresponds to the proportional equity value recorded as of September 30, 2012 for the equity investees Vital Aguas S.A. Vital Jugos S.A. and Envases Central, as explained in note 3 a) as a result of the merger with Embotelladoras Coca-Cola Polar, they are now considered subisidiaries and are incorporated into the Company´s consolidation as of October 1, 2012.
The main movements for the periods ended 2014, 2013 and 2012 are detailed as follows:
· During the year ended December 31, 2014, the Company received dividends from its equity investee, Envases CMF S.A. in the amount of ThCh$ 760,037 ( ThCh$ 1,340,492 at December 31, 2013). During the year 2012 said Company did not distributed dividends, however, the minimum dividend established by the corporate law has been recognized in the amount of ThCh$ 402,148.
· During the year ended December 31, 2014, Sorocaba Refrescos S.A. has distributed dividends of ThCh$ 830,637 (ThCh$ 744,539 at December 31, 2013).
· During the first quarter of 2013, there was a reorganization of the companies that manufacture juice products and mate in Brazil, with the merger of Holdfab2 Participações Ltda., and Sistema de Alimentos de Bebidas Do Brasil Ltda., into a single company that is the legal continuing entity, namely Leao Alimentos e Bebidas Ltda.
· In accordance with the Special Shareholders’ Meeting of our equity investee, Vital Jugos S.A., held April 10, 2012, a capital increase was agreed in the amount of ThCh$ 6,960,000, with 60% of the increase being paid on May 15, 2012 and the balance thereof will be paid in the future. The Andina Company met that capital increase in the percentage of the outstanding ownership at that date of 57% contributing ThCh$ 2,380,320.
· After the merger with Embotelladoras Coca-Cola Polar, identified in Note 3a) the Company acquired control in Vital Jugos S.A., Vital Aguas S.A. and Envases Central as of October 1, 2012, since it now holds an ownership interest of 72.0%, 73.6% and 59.27% respectively, and the substantive participating rights of other shareholders that previously existed are no longer in effect.
· In November 2012 and exercising the faculties given by the Shareholders’ Agreements, Coca-Cola Embonor S.A., purchased at book value 7.1% ownership interest in Vital Aguas S.A. and 7.0% ownership interest in Vital Jugos S.A. The disbursements received for these transactions amounted to ThCh$ 2,112,582.
· On August 30, 2012, Rio de Janeiro Refrescos Ltda. (“RJR”), a subsidiary of Embotelladora Andina S.A. in Brazil, on one part ; and, on the other, Renosa Industria Brasileira de Bebidas S.A. have signed a promissory purchase agreement containing the conditions leading to the acquisition by RJR of 100% of the equity interest held by Renosa in Sorocaba Refrescos S.A. which is equivalent to 40% of the total shares of Sorocaba. The promissory agreement should be fulfilled within a period of 180 days. The agreement was materialized during the month of October 2012 with a payment of 146.9 million reais.
· During the first quarter of 2013, there was a reorganization of the companies that manufacture juice products and mate in Brazil, with the merger of Holdfab2 Participações Ltda. and Sistema de Alimentos de Bebidas Do Brasil Ltda. into a single company that is the legal continuing entity, namely Leao Alimentos e Bebidas Ltda.
14.3 Reconciliation of share of profit in investments in associates:
|
Details |
|
12.31.2014 |
|
12.31.2013 |
|
12.31.2012 |
|
|
|
|
ThCh$ |
|
ThCh$ |
|
ThCh$ |
|
|
Share of profit of investment accounted for using the equity method |
|
1,730,925 |
|
1,325,518 |
|
2,409,110 |
|
|
|
|
|
|
|
|
|
|
|
Unrealized earnings in inventory acquired from associates and not sold at the end of period, presented as a discount in the respective asset account (containers and/or inventories) |
|
(625,222 |
) |
(627,366 |
) |
(647,003 |
) |
|
Amortization of Fair Value in Vital Jugos S. A |
|
85,266 |
|
85,266 |
|
85,266 |
|
|
Amortization of fair value adjustments related to the Vital acquisition |
|
— |
|
— |
|
(77,475 |
) |
|
Income Statement Balance |
|
1,190,969 |
|
783,418 |
|
1,769,898 |
|
14.4 Summary financial information of associates:
The attached table presents summarized information regarding the Company´s equity investees as of December 31, 2014:
|
|
|
Envases CMF
|
|
Sorocaba
|
|
Kaik
|
|
SRSA
|
|
Leao Alimentos
|
|
|
|
|
ThCh$ |
|
ThCh$ |
|
ThCh$ |
|
ThCh$ |
|
ThCh$ |
|
|
Total assets |
|
64,887,663 |
|
138,474,778 |
|
11,272,685 |
|
5,184,855 |
|
398,795,472 |
|
|
Total liabilities |
|
28,409,885 |
|
57,233,278 |
|
43 |
|
4,588,430 |
|
228,729,868 |
|
|
Total revenue |
|
44,960,882 |
|
12,099,822 |
|
721,375 |
|
— |
|
461,349,291 |
|
|
Net income of associate |
|
1,531,727 |
|
747,644 |
|
721,375 |
|
592,085 |
|
8,601,678 |
|
|
|
|
|
|
|
|
|
|
|
|
|
|
|
Reporting date |
|
12/31/2014 |
|
11/30/2014 |
|
11/30/2014 |
|
11/30/2014 |
|
11/30/2014 |
|
15.1 Intangible assets other than goodwill
Intangible assets other than goodwill as of the end of each reporting period are detailed as follows:
|
|
|
December 31, 2014 |
|
December 31, 2013 |
|
||||||||
|
|
|
Gross |
|
Cumulative |
|
Net |
|
Gross |
|
Cumulative |
|
Net |
|
|
Detail |
|
Amount |
|
Amortization |
|
Amount |
|
Amount |
|
Amortization |
|
Amount |
|
|
|
|
ThCh$ |
|
ThCh$ |
|
ThCh$ |
|
ThCh$ |
|
ThCh$ |
|
ThCh$ |
|
|
Distribution rights (1) |
|
719,385,108 |
|
— |
|
719,385,108 |
|
691,355,453 |
|
— |
|
691,355,453 |
|
|
Software |
|
22,591,363 |
|
(14,242,229 |
) |
8,349,134 |
|
21,106,268 |
|
(12,308,966 |
) |
8,797,302 |
|
|
Water rights |
|
521,234 |
|
(74,197 |
) |
447,037 |
|
532,912 |
|
(79,175 |
) |
453,737 |
|
|
Total |
|
742,497,705 |
|
(14,316,426 |
) |
728,181,279 |
|
712,994,633 |
|
(12,388,141 |
) |
700,606,492 |
|
(1) According to note 3 Business Combinations, these assets correspond to the rights to produce and distribute Coca-Cola products in the territories where Embotelladoras Coca-Cola Polar S.A., maintained franchises in Chile, Argentina and Paraguay and in the territories in parts of Sao Paulo and Minas Gerais maintained by Companhia de Bebidas Ipiranga. Such distribution rights are composed as follows and are not subject to amortization:
|
|
|
12.31.2014 |
|
12.31.2013 |
|
|
|
|
ThCh$ |
|
ThCh$ |
|
|
Chile |
|
300,305,727 |
|
300,305,727 |
|
|
Brazil |
|
230,712,143 |
|
226,182,916 |
|
|
Paraguay |
|
186,636,782 |
|
162,904,834 |
|
|
Argentina |
|
1,730,456 |
|
1,961,976 |
|
|
Total |
|
719,385,108 |
|
691,355,453 |
|
The movement and balances of identifiable intangible assets are detailed as follows for the period January 1 to December 31, 2014 and December 31, 2013:
|
|
|
December 31, 2014 |
|
December 31, 2013 |
|
||||||||||||
|
|
|
Distribution |
|
|
|
|
|
|
|
Distribution |
|
|
|
|
|
|
|
|
Details |
|
Rights |
|
Rights |
|
Software |
|
Total |
|
Rights |
|
Rights |
|
Software |
|
Total |
|
|
|
|
ThCh$ |
|
ThCh$ |
|
ThCh$ |
|
ThCh$ |
|
ThCh$ |
|
ThCh$ |
|
ThCh$ |
|
ThCh$ |
|
|
|
|
|
|
|
|
|
|
|
|
|
|
|
|
|
|
|
|
|
Opening balance |
|
691,355,453 |
|
453,737 |
|
8,797,302 |
|
700,606,492 |
|
459,320,270 |
|
407,957 |
|
4,854,046 |
|
464,582,273 |
|
|
Increase due to acquisitions |
|
— |
|
— |
|
— |
|
— |
|
228,359,641 |
|
— |
|
1,034,159 |
|
229,393,800 |
|
|
Additions |
|
— |
|
— |
|
3,191,059 |
|
3,191,059 |
|
— |
|
56,000 |
|
4,709,903 |
|
4,765,903 |
|
|
Amortization |
|
— |
|
(4,365 |
) |
(3,048,607 |
) |
(3,052,972 |
) |
— |
|
(4,948 |
) |
(1,747,232 |
) |
(1,752,180 |
) |
|
Other increases (decreases)(1) |
|
28,029,655 |
|
(2,335 |
) |
(590,620 |
) |
27,436,700 |
|
3,675,542 |
|
(5,272 |
) |
(53,574 |
) |
3,616,696 |
|
|
Ending balance |
|
719,385,108 |
|
447,037 |
|
8,349,134 |
|
728,181,279 |
|
691,355,453 |
|
453,737 |
|
8,797,302 |
|
700,606,492 |
|
(1) Mainly corresponds to the foreign currency effect of converting foreign subsidiaries’ distribution rights.
15.2 Goodwill
Movement in goodwill is detailed as follows:
Year ended December 31, 2014
|
Operating segment |
|
01.01.2014 |
|
Additions |
|
Disposals
|
|
Foreign currency
|
|
12.31.2014 |
|
|
|
|
ThCh$ |
|
ThCh$ |
|
ThCh$ |
|
ThCh$ |
|
ThCh$ |
|
|
Chilean operation |
|
8,522,488 |
|
— |
|
(19,465 |
) |
— |
|
8,503,023 |
|
|
Brazilian operation |
|
88,659,503 |
|
— |
|
(292,365 |
)(1) |
1,754,919 |
|
90,122,057 |
|
|
Argentine operation |
|
11,404,496 |
|
— |
|
— |
|
(1,345,771 |
) |
10,058,725 |
|
|
Paraguayan operation |
|
7,192,580 |
|
— |
|
— |
|
1,047,814 |
|
8,240,394 |
|
|
Total |
|
115,779,067 |
|
— |
|
(311,830 |
) |
1,456,962 |
|
116,924,199 |
|
Year ended December 31, 2013
|
Operating segment |
|
01.01.2013 |
|
Additions |
|
Disposals
|
|
Foreign currency
|
|
12.31.2013 |
|
|
|
|
ThCh$ |
|
ThCh$ |
|
ThCh$ |
|
ThCh$ |
|
ThCh$ |
|
|
Chilean operation |
|
8,503,023 |
|
19,465 |
|
— |
|
— |
|
8,522,488 |
|
|
Brazilian operation |
|
35,536,967 |
|
55,255,194 |
(2) |
— |
|
(2,132,658 |
) |
88,659,503 |
|
|
Argentine operation |
|
13,837,339 |
|
— |
|
— |
|
(2,432,843 |
) |
11,404,496 |
|
|
Paraguayan operation |
|
6,915,412 |
|
— |
|
— |
|
277,168 |
|
7,192,580 |
|
|
Total |
|
64,792,741 |
|
55,274,659 |
|
— |
|
(4,288,333 |
) |
115,779,067 |
|
(1) Corresponds to goodwill generated from the adcquisition of Compañía de Bebidas Ipiranga, refer to Note 3.
(2) Corresponds to the final valuation of assets and liabilities acquired at the purchase of Compañia de Bebidas Ipiranga, in accordance to what has been described in Note 3 “Business Combinations” .
15.3 Impairment Test
Management reviews the business performance based on geography. Goodwill is monitored by management at the operating segment level which includes the Chilean, Brazilian, Argentinian and Paraguayan operations. Distribution rights are monitored for impairment geographically at the CGU or group of CGUs, which correspond to specific territories for which Coca Cola distribution rights have been acquired. These CGUs or group of CGUs consists of Chilean Regions, Argentina South, Brazil (Ipiranga territories) and Paraguay.
The recoverable amount of all CGUs and operating segments has been determined based on value-in-use calculations. These calculations use pre-tax cash flow projections based on financial budgets approved by management. Cash flows beyond the budgeted period are extrapolated using the estimated average volume growth rates, which do not exceed the long term average growth rates. Management determined annual volume growth rates, discount rates and local inflation rates for each CGU to be key assumptions. The volume of sales in each period is the main driver for revenue and costs. Annual volume growth rates are based on past performance and management’s expectations of market development. The discount rates used are US Dollar pre-tax rates and reflect specific risks relating to each country of operations. Local inflation rates are based on available country data and information provided by financial institutions .
The main assumptions used in the calculations, performed at December 31, 2014 (the impairment tests are performed annually):
|
Country |
|
Volume Growth
|
|
Discount
|
|
Local
|
|
|
Argentina |
|
2.9 |
% |
32.8 |
% |
22.7 |
% |
|
Brazil |
|
2.9 |
% |
10.7 |
% |
5.2 |
% |
|
Chile |
|
3.7 |
% |
8.7 |
% |
3.1 |
% |
|
Paraguay |
|
3.8 |
% |
12.4 |
% |
5.0 |
% |
As a result of the annual test there were no impairments identified in any of the CGUs (distribution rights) or reporting segments (goodwill).
The fair value of Company’s Chilean Regions CGU is approximately equal to net book value. The distribution rights associated with this CGU were acquired in the Polar acquisition in October 2012. The Chilean Regions CGU is sensitive to expected future growth rates in sales volumes and sales prices, as well as changes in the discount rate, including market and risk premiums. The Chilean Regions CGU’s failure to meet management’s objectives or a future increase in the discount rate could result in future impairment of some or all of the Chilean Regions distribution rights, which were ThCh$ 300,305,727 at December 31, 2014 .
Liabilities are detailed as follows:
|
Current |
|
12.31.2014 |
|
12.31.2013 |
|
|
|
|
ThCh$ |
|
ThCh$ |
|
|
Bank loans |
|
41,675,933 |
|
70,356,550 |
|
|
Bonds payable |
|
17,623,883 |
|
15,589,444 |
|
|
Deposits in guarantee |
|
15,982,913 |
|
14,577,572 |
|
|
Derivative contract obligations (see note 21) |
|
4,431,484 |
|
1,037,473 |
|
|
Leasing agreements |
|
3,688,227 |
|
5,316,216 |
|
|
Total |
|
83,402,440 |
|
106,877,255 |
|
|
Non-current |
|
12.31.2014 |
|
12.31.2013 |
|
|
|
|
ThCh$ |
|
ThCh$ |
|
|
Bank loans |
|
46,414,771 |
|
68,086,431 |
|
|
Bonds payable |
|
657,220,248 |
|
532,376,302 |
|
|
Derivative contract obligations (see note 21) |
|
— |
|
948,481 |
|
|
Leasing agreements |
|
22,981,421 |
|
3,950,845 |
|
|
Total |
|
726,616,440 |
|
605,362,059 |
|
The fair value of the aforementioned financial liabilities is presented below:
|
Currrent |
|
Book Value
|
|
Fair Value
|
|
Book Value
|
|
Fair Value
|
|
|
|
|
ThCh$ |
|
ThCh$ |
|
ThCh$ |
|
ThCh$ |
|
|
Cash and cash equivalents (3) |
|
79,514,434 |
|
79,514,434 |
|
79,976,126 |
|
79,976,126 |
|
|
Other financial assets (3) |
|
106,577,042 |
|
106,577,042 |
|
36,471,637 |
|
36,471,637 |
|
|
Trade and other accounts receivable, net (3) |
|
198,110,424 |
|
198,110,424 |
|
195,434,075 |
|
195,434,075 |
|
|
Accounts receivable from related parties (3) |
|
5,994,453 |
|
5,994,453 |
|
8,028,987 |
|
8,028,987 |
|
|
Bank Loans (1) |
|
41,675,933 |
|
42,604,758 |
|
70,356,550 |
|
70,110,113 |
|
|
Bonds Payable (2) |
|
17,623,883 |
|
18,852,764 |
|
15,589,444 |
|
16,109,523 |
|
|
Deposits in guarantee (3) |
|
15,982,913 |
|
15,982,913 |
|
14,577,572 |
|
14,577,572 |
|
|
Derivative contract obligations (see note 21) |
|
4,431,484 |
|
4,431,484 |
|
1,037,473 |
|
1,037,473 |
|
|
Non-current |
|
12.31.2014 |
|
12.31.2014 |
|
12.31.2013 |
|
12.31.2013 |
|
|
|
|
ThCh$ |
|
ThCh$ |
|
ThCh$ |
|
ThCh$ |
|
|
Other financial assets (3) |
|
51,026,773 |
|
51,026,773 |
|
7,922,287 |
|
7,922,287 |
|
|
Trade and other receivables (3) |
|
7,097,809 |
|
7,097,809 |
|
7,631,253 |
|
7,631,253 |
|
|
Accounts receivable from related parties (3) |
|
24,752 |
|
24,752 |
|
18,765 |
|
18,765 |
|
|
Bank loans (1) |
|
46,414,771 |
|
41,861,984 |
|
68,086,431 |
|
66,079,744 |
|
|
Bonds payable (2) |
|
657,220,248 |
|
701,322,386 |
|
532,376,302 |
|
549,592,754 |
|
|
Derivative contract obligations (see note 21) |
|
— |
|
— |
|
948,481 |
|
948,481 |
|
(1) The fair values are based on discounted cash flows using market based discount rates as of year-end and are Level 2 fair value measurements.
(2) The fair value of coporate bonds are classified as a Level 1 fair value measurements based on quoted prices for the Company’s obligations.
(3) The fair value approximates book value considering the nature and term of the obligations.
16.1.1 Bank obligations, current
|
|
|
|
|
|
|
|
|
|
|
|
|
|
|
|
|
|
|
|
|
Maturity |
|
Total |
|
||||
|
Indebted Entity |
|
Creditor Entity |
|
|
|
Type |
|
Effective |
|
Nominal |
|
Up to |
|
90 days |
|
at |
|
at |
|
||||||||
|
Tax ID, |
|
Name |
|
Country |
|
Tax ID, |
|
Name |
|
Country |
|
Currency |
|
Amortization |
|
Rate |
|
Rate |
|
90 days |
|
To 1 year |
|
12.31.2014 |
|
12.31.2013 |
|
|
|
|
|
|
|
|
|
|
|
|
|
|
|
|
|
|
|
|
|
|
ThCh$ |
|
ThCh$ |
|
ThCh$ |
|
ThCh$ |
|
|
91.144.000-8 |
|
Embotelladora Andina S.A. |
|
Chile |
|
97.004.000-5 |
|
Banco Chile |
|
Chile |
|
Chilean pesos |
|
At maturity |
|
5.76 |
% |
5.76 |
% |
— |
|
— |
|
— |
|
665,914 |
|
|
91.144.000-8 |
|
Embotelladora Andina S.A. |
|
Chile |
|
97.004.000-5 |
|
Banco Chile |
|
Chile |
|
Chilean pesos |
|
At maturity |
|
6.39 |
% |
6.39 |
% |
— |
|
— |
|
— |
|
1,932,039 |
|
|
91.144.000-8 |
|
Embotelladora Andina S.A. |
|
Chile |
|
97.036.000-K |
|
Banco Santander |
|
Chile |
|
Unidades de fomento |
|
At maturity |
|
3.84 |
% |
3.84 |
% |
— |
|
— |
|
— |
|
23,924,349 |
|
|
91.144.000-8 |
|
Embotelladora Andina S.A. |
|
Chile |
|
97.036.000-K |
|
Banco Santander |
|
Chile |
|
Chilean pesos |
|
Monthly |
|
1.10 |
% |
1.10 |
% |
7,238 |
|
2,395 |
|
9,633 |
|
38,313 |
|
|
91.144.000-8 |
|
Embotelladora Andina S.A. |
|
Chile |
|
97.032.000-8 |
|
BBVA |
|
Chile |
|
Chilean pesos |
|
At maturity |
|
6.50 |
% |
6.50 |
% |
— |
|
— |
|
— |
|
1,887,000 |
|
|
91.144.000-8 |
|
Embotelladora Andina S.A. |
|
Chile |
|
97.032.000-8 |
|
BBVA |
|
Chile |
|
Chilean pesos |
|
At maturity |
|
5.00 |
% |
5.00 |
% |
205,000 |
|
— |
|
205,000 |
|
— |
|
|
96.705.990-0 |
|
Envases Central S.A. |
|
Chile |
|
97.080.000-K |
|
Banco BICE |
|
Chile |
|
Chilean pesos |
|
Semiannually |
|
4.29 |
% |
4.29 |
% |
211,137 |
|
— |
|
211,137 |
|
199,487 |
|
|
Foreign |
|
Embotelladora del Atlántico S.A. |
|
Argentina |
|
Foreign |
|
Banco de la Ciudad de Bs.As. |
|
Argentina |
|
Argentine pesos |
|
Quarterly |
|
15.25 |
% |
15.25 |
% |
190,666 |
|
468,314 |
|
658,980 |
|
1,181,591 |
|
|
Foreign |
|
Embotelladora del Atlántico S.A. |
|
Argentina |
|
Foreign |
|
Banco de la Nación Argentina (1) |
|
Argentina |
|
Argentine pesos |
|
Monthly |
|
14.80 |
% |
9.90 |
% |
157,591 |
|
591,305 |
|
748,896 |
|
809,756 |
|
|
Foreign |
|
Embotelladora del Atlántico S.A. |
|
Argentina |
|
Foreign |
|
Banco de la Nación Argentina |
|
Argentina |
|
Argentine pesos |
|
Monthly |
|
9.90 |
% |
9.90 |
% |
50,904 |
|
150,428 |
|
201,332 |
|
227,753 |
|
|
Foreign |
|
Embotelladora del Atlántico S.A. |
|
Argentina |
|
Foreign |
|
Banco de la Nación Argentina |
|
Argentina |
|
Argentine pesos |
|
Monthly |
|
23.06 |
% |
23.06 |
% |
853,102 |
|
— |
|
853,102 |
|
— |
|
|
Foreign |
|
Embotelladora del Atlántico S.A. |
|
Argentina |
|
Foreign |
|
Banco de la Nación Argentina |
|
Argentina |
|
Argentine pesos |
|
Monthly |
|
23.38 |
% |
23.38 |
% |
— |
|
4,587,880 |
|
4,587,880 |
|
— |
|
|
Foreign |
|
Embotelladora del Atlántico S.A. |
|
Argentina |
|
Foreign |
|
Banco de la Nación Argentina |
|
Argentina |
|
Argentine pesos |
|
At maturity |
|
18.85 |
% |
18.85 |
% |
— |
|
— |
|
— |
|
5,162,051 |
|
|
Foreign |
|
Embotelladora del Atlántico S.A. |
|
Argentina |
|
Foreign |
|
Banco Galicia y Bs. As. |
|
Argentina |
|
Argentine pesos |
|
Quarterly |
|
15.00 |
% |
15.00 |
% |
21,064 |
|
39,913 |
|
60,977 |
|
93,778 |
|
|
Foreign |
|
Embotelladora del Atlántico S.A. |
|
Argentina |
|
Foreign |
|
Banco Galicia y Bs. As. |
|
Argentina |
|
Argentine pesos |
|
Quarterly |
|
15.25 |
% |
15.25 |
% |
385,008 |
|
1,005,811 |
|
1,390,819 |
|
85,866 |
|
|
Foreign |
|
Embotelladora del Atlántico S.A. |
|
Argentina |
|
Foreign |
|
Banco Galicia y Bs. As. |
|
Argentina |
|
Argentine pesos |
|
At maturity |
|
21.00 |
% |
21.00 |
% |
— |
|
— |
|
— |
|
73,045 |
|
|
Foreign |
|
Embotelladora del Atlántico S.A. |
|
Argentina |
|
Foreign |
|
Banco Macro Bansud |
|
Argentina |
|
Argentine pesos |
|
Monthly |
|
15.25 |
% |
15.25 |
% |
51,945 |
|
147,005 |
|
198,950 |
|
197,217 |
|
|
Foreign |
|
Embotelladora del Atlántico S.A. |
|
Argentina |
|
Foreign |
|
Banco Macro Bansud |
|
Argentina |
|
Argentine pesos |
|
At maturity |
|
21.00 |
% |
21.00 |
% |
— |
|
— |
|
— |
|
22,738 |
|
|
Foreign |
|
Embotelladora del Atlántico S.A. |
|
Argentina |
|
Foreign |
|
Banco Santander Río |
|
Argentina |
|
Argentine pesos |
|
Monthly |
|
15.25 |
% |
15.25 |
% |
82,786 |
|
236,498 |
|
319,284 |
|
274,524 |
|
|
Foreign |
|
Embotelladora del Atlántico S.A. |
|
Argentina |
|
Foreign |
|
BBVA Banco Francés |
|
Argentina |
|
Argentine pesos |
|
Monthly |
|
15.25 |
% |
15.25 |
% |
48,179 |
|
138,658 |
|
186,837 |
|
184,855 |
|
|
Foreign |
|
Embotelladora del Atlántico S.A. |
|
Argentina |
|
Foreign |
|
BBVA Banco Francés |
|
Argentina |
|
Argentine pesos |
|
At maturity |
|
21.00 |
% |
21.00 |
% |
— |
|
— |
|
— |
|
8,862,492 |
|
|
Foreign |
|
Embotelladora del Atlántico S.A. |
|
Argentina |
|
Foreign |
|
Nuevo Banco de Santa Fe |
|
Argentina |
|
Argentine pesos |
|
Quarterly |
|
15.00 |
% |
15.00 |
% |
70,588 |
|
140,139 |
|
210,727 |
|
319,342 |
|
|
Foreign |
|
Embotelladora del Atlántico S.A. |
|
Argentina |
|
Foreign |
|
Nuevo Banco de Santa Fe |
|
Argentina |
|
Argentine pesos |
|
Quarterly |
|
15.25 |
% |
15.25 |
% |
146,019 |
|
399,130 |
|
545,149 |
|
425,755 |
|
|
Foreign |
|
Embotelladora del Atlántico S.A. |
|
Argentina |
|
Foreign |
|
Nuevo Banco de Santa Fe |
|
Argentina |
|
Argentine pesos |
|
At maturity |
|
21.00 |
% |
21.00 |
% |
— |
|
— |
|
— |
|
7,578,030 |
|
|
Foreign |
|
Embotelladora del Atlántico S.A. |
|
Argentina |
|
Foreign |
|
Nuevo Banco Santa Fe |
|
Argentina |
|
Argentine pesos |
|
At maturity |
|
28.00 |
% |
28.00 |
% |
5,080,638 |
|
— |
|
5,080,638 |
|
— |
|
|
Foreign |
|
Embotelladora del Atlántico S.A. |
|
Argentina |
|
Foreign |
|
Comercial Bank of China |
|
Argentina |
|
Argentine pesos |
|
Quarterly |
|
15.25 |
% |
15.25 |
% |
83,593 |
|
234,157 |
|
317,750 |
|
382,211 |
|
|
Foreign |
|
Embotelladora del Atlántico S.A. |
|
Argentina |
|
Foreign |
|
Bank HSBC Argentina S.A |
|
Argentina |
|
Argentine pesos |
|
Quarterly |
|
15.25 |
% |
15.25 |
% |
83,593 |
|
234,157 |
|
317,750 |
|
— |
|
|
Foreign |
|
Andina Empaques Argentina S.A. |
|
Argentina |
|
Foreign |
|
Banco Galicia y Bs.As. |
|
Argentina |
|
Argentine pesos |
|
Monthly |
|
30.25 |
% |
30.25 |
% |
453,690 |
|
— |
|
453,690 |
|
— |
|
|
Foreign |
|
Andina Empaques Argentina S.A. |
|
Argentina |
|
Foreign |
|
Banco Galicia y Bs.As. |
|
Argentina |
|
Argentine pesos |
|
At maturity |
|
15.25 |
% |
15.25 |
% |
79,631 |
|
236,522 |
|
316,153 |
|
91,405 |
|
|
Foreign |
|
Andina Empaques Argentina S.A. |
|
Argentina |
|
Foreign |
|
Banco Galicia y Bs.As. |
|
Argentina |
|
Argentine pesos |
|
At maturity |
|
21.00 |
% |
21.00 |
% |
— |
|
— |
|
— |
|
23,623 |
|
|
Foreign |
|
Rio de Janeiro Refrescos Ltda. |
|
Brazil |
|
Foreign |
|
VOTORANTIM |
|
Brazil |
|
Brazilian real |
|
Monthly |
|
9.40 |
% |
9.40 |
% |
32,894 |
|
32,894 |
|
65,788 |
|
128,393 |
|
|
Foreign |
|
Rio de Janeiro Refrescos Ltda. |
|
Brazil |
|
Foreign |
|
ITAÚ - Finame |
|
Brazil |
|
Brazilian real |
|
Monthly |
|
6.63 |
% |
6.63 |
% |
— |
|
— |
|
— |
|
2,313,264 |
|
|
Foreign |
|
Rio de Janeiro Refrescos Ltda. |
|
Brazil |
|
Foreign |
|
ITAÚ - Finame |
|
Brazil |
|
Brazilian real |
|
Monthly |
|
6.60 |
% |
6.60 |
% |
1,045,057 |
|
3,152,076 |
|
4,197,133 |
|
— |
|
|
Foreign |
|
Rio de Janeiro Refrescos Ltda. |
|
Brazil |
|
Foreign |
|
Banco Santander |
|
Brazil |
|
Brazilian real |
|
Monthly |
|
7.15 |
% |
7.15 |
% |
108,275 |
|
332,591 |
|
440,866 |
|
299,997 |
|
|
Foreign |
|
Rio de Janeiro Refrescos Ltda. |
|
Brazil |
|
Foreign |
|
Banco Itaú |
|
Brazil |
|
Dollars |
|
Monthly |
|
2.992 |
% |
2.992 |
% |
— |
|
16,118,096 |
|
16,118,096 |
|
9,260,831 |
|
|
Foreign |
|
Rio de Janeiro Refrescos Ltda. |
|
Brazil |
|
Foreign |
|
Banco Citibank |
|
Brazil |
|
Brazilian real |
|
Monthly |
|
3.06 |
% |
3.06 |
% |
— |
|
— |
|
— |
|
572,058 |
|
|
Foreign |
|
Rio de Janeiro Refrescos Ltda. |
|
Brazil |
|
Foreign |
|
Banco Bradesco |
|
Brazil |
|
Brazilian real |
|
Quarterly |
|
12.41 |
% |
12.41 |
% |
— |
|
— |
|
— |
|
602,303 |
|
|
Foreign |
|
Rio de Janeiro Refrescos Ltda. |
|
Brazil |
|
Foreign |
|
Banco Bradesco |
|
Brazil |
|
Brazilian real |
|
Monthly |
|
4.50 |
% |
4.50 |
% |
174,976 |
|
428,302 |
|
603,278 |
|
— |
|
|
Foreign |
|
Rio de Janeiro Refrescos Ltda. |
|
Brazil |
|
Foreign |
|
Banco Itaú |
|
Brazil |
|
Brazilian real |
|
Quarterly |
|
11.79 |
% |
11.79 |
% |
— |
|
— |
|
— |
|
2,336,239 |
|
|
Foreign |
|
Rio de Janeiro Refrescos Ltda. |
|
Brazil |
|
Foreign |
|
Banco Itaú |
|
Brazil |
|
Brazilian real |
|
Monthly |
|
4.50 |
% |
4.50 |
% |
— |
|
— |
|
— |
|
190,737 |
|
|
Foreign |
|
Rio de Janeiro Refrescos Ltda. |
|
Brazil |
|
Foreign |
|
Banco Itaú |
|
Brazil |
|
Brazilian real |
|
Monthly |
|
7.00 |
% |
7.00 |
% |
881,046 |
|
2,495,042 |
|
3,376,088 |
|
9,594 |
|
|
Total |
|
|
|
|
|
|
|
|
|
|
|
|
|
|
|
|
|
|
|
|
|
|
|
41,675,933 |
|
70,356,550 |
|
(1) The Bicentennial loan granted at a prime rate by Banco de la Nacion Argentina to Embotelladora del Atlántico S.A., is a benefit from the Argentine government to encourage investment projects. Embotelladora del Atlántico S.A. registered investment projects and received this loan at a prime rate of 9.9% annually.
16.1.2 Bank obligations, non-current December 31,2014
|
|
|
|
|
|
|
|
|
|
|
|
|
|
|
|
|
|
|
|
|
Maturity |
|
|
|
||||||||
|
Indebted Entity |
|
Creditor Entity |
|
|
|
Type |
|
Effective |
|
Nominal |
|
1 year up to |
|
More 2 years |
|
More 3 years |
|
More 4 years |
|
More 5 |
|
at |
|
||||||||
|
Tx ID |
|
Name |
|
Country |
|
Tx ID |
|
Name |
|
Country |
|
Currency |
|
Amortization |
|
Rate |
|
Rate |
|
2 years |
|
Up to 3 years |
|
Up to 4 years |
|
Up to 5 years |
|
Years |
|
12.31.2014 |
|
|
|
|
|
|
|
|
|
|
|
|
|
|
|
|
|
|
|
|
|
|
ThCh$ |
|
ThCh$ |
|
ThCh$ |
|
ThCh$ |
|
ThCh$ |
|
ThCh$ |
|
|
Foreign |
|
Rio de Janeiro Refrescos Ltda. |
|
Brazil |
|
Foreign |
|
Banco Itaú |
|
Brazil |
|
Brazilian real |
|
Monthly |
|
6.63 |
% |
6.63 |
% |
4,169,265 |
|
3,582,205 |
|
1,133,230 |
|
65,787 |
|
— |
|
8,950,487 |
|
|
Foreign |
|
Rio de Janeiro Refrescos Ltda. |
|
Brazil |
|
Foreign |
|
Banco Santander Río |
|
Brazil |
|
Brazilian real |
|
Monthly |
|
7.15 |
% |
7.15 |
% |
476,272 |
|
310,662 |
|
158,529 |
|
117,869 |
|
— |
|
1,063,332 |
|
|
Foreign |
|
Rio de Janeiro Refrescos Ltda. |
|
Brazil |
|
Foreign |
|
Banco Itaú |
|
Brazil |
|
Dólar USA |
|
Monthly |
|
2.992 |
% |
2.992 |
% |
8,280,509 |
|
8,280,509 |
|
— |
|
— |
|
— |
|
16,561,018 |
|
|
Foreign |
|
Rio de Janeiro Refrescos Ltda. |
|
Brazil |
|
Foreign |
|
Banco Bradesco |
|
Brazil |
|
Brazilian real |
|
Monthly |
|
4.50 |
% |
4.50 |
% |
428,302 |
|
— |
|
— |
|
— |
|
— |
|
428,302 |
|
|
Foreign |
|
Rio de Janeiro Refrescos Ltda. |
|
Brazil |
|
Foreign |
|
Banco Itaú |
|
Brazil |
|
Brazilian real |
|
Monthly |
|
7.00 |
% |
7.00 |
% |
3,327,965 |
|
3,157,786 |
|
3,131,517 |
|
3,131,517 |
|
820,546 |
|
13,569,331 |
|
|
Foreign |
|
Embotelladora del Atlántico S.A. |
|
Argentina |
|
Foreign |
|
Banco de la Nación Argentina |
|
Argentina |
|
Argentine pesos |
|
Monthly |
|
14.80 |
% |
9.90 |
% |
581,022 |
|
— |
|
— |
|
— |
|
— |
|
581,022 |
|
|
Foreign |
|
Embotelladora del Atlántico S.A. |
|
Argentina |
|
Foreign |
|
Banco de la Nación Argentina |
|
Argentina |
|
Argentine pesos |
|
Monthly |
|
9.90 |
% |
9.90 |
% |
150,428 |
|
— |
|
— |
|
— |
|
— |
|
150,428 |
|
|
Foreign |
|
Embotelladora del Atlántico S.A. |
|
Argentina |
|
Foreign |
|
Nuevo Banco de Santa Fe |
|
Argentina |
|
Argentine pesos |
|
Quarterly |
|
15.25 |
% |
15.25 |
% |
175,174 |
|
— |
|
— |
|
— |
|
— |
|
175,174 |
|
|
Foreign |
|
Embotelladora del Atlántico S.A. |
|
Argentina |
|
Foreign |
|
Banco Galicia y Bs. As |
|
Argentina |
|
Argentine pesos |
|
Quarterly |
|
15.25 |
% |
15.25 |
% |
988,071 |
|
— |
|
— |
|
— |
|
— |
|
988,071 |
|
|
Foreign |
|
Embotelladora del Atántico S.A. |
|
Argentina |
|
Foreign |
|
Banco Ciudad de Bs. As. |
|
Argentina |
|
Argentine pesos |
|
Quarterly |
|
15.25 |
% |
15.25 |
% |
326,400 |
|
— |
|
— |
|
— |
|
— |
|
326,400 |
|
|
Foreign |
|
Embotelladora del Atlántico S.A. |
|
Argentina |
|
Foreign |
|
Banco HSBC Argentina S.A |
|
Argentina |
|
Argentine pesos |
|
Quarterly |
|
15.25 |
% |
15.25 |
% |
319,305 |
|
— |
|
— |
|
— |
|
— |
|
319,305 |
|
|
Foreign |
|
Embotelladora del Atlántico S.A. |
|
Argentina |
|
Foreign |
|
Comercial Bank of China |
|
Argentina |
|
Argentine pesos |
|
Quarterly |
|
15.25 |
% |
15.25 |
% |
319,305 |
|
— |
|
— |
|
— |
|
— |
|
319,305 |
|
|
Foreign |
|
Embotelladora del Atlántico S.A. |
|
Argentina |
|
Foreign |
|
Banco BBVA Francés |
|
Argentina |
|
Argentine pesos |
|
Monthly |
|
15.25 |
% |
15.25 |
% |
269,432 |
|
— |
|
— |
|
— |
|
— |
|
269,432 |
|
|
Foreign |
|
Embotelladora del Atlántico S.A. |
|
Argentina |
|
Foreign |
|
Banco Santander Río |
|
Argentina |
|
Argentine pesos |
|
Monthly |
|
15.25 |
% |
15.25 |
% |
157,737 |
|
— |
|
— |
|
— |
|
— |
|
157,737 |
|
|
Foreign |
|
Embotelladora del Atlántico S.A. |
|
Argentina |
|
Foreign |
|
Banco Macro Bansud |
|
Argentina |
|
Argentine pesos |
|
Monthly |
|
15.25 |
% |
15.25 |
% |
290,509 |
|
— |
|
— |
|
— |
|
— |
|
290,509 |
|
|
Foreign |
|
Andina Empaques Argentina S.A. |
|
Argentina |
|
Foreign |
|
Banco Galicia y Bs As. |
|
Argentina |
|
Argentine pesos |
|
Monthly |
|
15.25 |
% |
15.25 |
% |
315,363 |
|
— |
|
— |
|
— |
|
— |
|
315,363 |
|
|
96.705.990-0 |
|
Envases Central S.A. |
|
Chile |
|
97.080.000-K |
|
Banco Bice |
|
Chile |
|
Chilean pesos |
|
At maturity |
|
4.29 |
% |
4.29 |
% |
1,949,555 |
|
— |
|
— |
|
— |
|
— |
|
1,949,555 |
|
|
|
|
|
|
|
|
|
|
|
|
|
|
|
|
|
|
|
|
|
|
|
|
|
|
|
|
|
|
|
|
|
|
|
|
|
|
|
|
|
|
|
|
|
|
|
|
|
|
|
|
|
|
|
|
|
|
|
|
|
|
|
Total |
|
46,414,771 |
|
(1) The Bicentennial loan granted at a prime rate by Banco de la Nacion Argentina to Embotelladora del Atlántico S.A., is a benefit from the Argentine government to encourage investment projects. Embotelladora del Atlántico S.A. registered investment projects and received this loan at a prime rate of 9.9% annually.
16.1.3 Bank obligations, non-current, December 31, 2013
|
|
|
|
|
|
|
|
|
|
|
|
|
|
|
|
|
|
|
|
|
Maturity |
|
|
|
||||||||
|
Indebted Entity |
|
Creditor Entity |
|
|
|
Type |
|
Effective |
|
Nominal |
|
1 year up
|
|
More 2 years |
|
More 3 years |
|
More 4 years |
|
more 5 |
|
At |
|
||||||||
|
Tx ID |
|
Name |
|
Country |
|
Tx ID |
|
Name |
|
Country |
|
Currency |
|
Amortization |
|
Rate |
|
Rate |
|
2 years |
|
Up to 3 years |
|
Up to 4 years |
|
Up to 5 years |
|
years |
|
12.31.2013 |
|
|
|
|
|
|
|
|
|
|
|
|
|
|
|
|
|
|
|
|
|
|
ThCh$ |
|
ThCh$ |
|
ThCh$ |
|
ThCh$ |
|
ThCh$ |
|
ThCh$ |
|
|
Foreign |
|
Rio de Janeiro Refrescos Ltda. |
|
Brazil |
|
Foreign |
|
Banco Votorantim |
|
Brazil |
|
Brazilian Real |
|
Monthly |
|
9.40 |
% |
9.40 |
% |
32,464 |
|
32,464 |
|
— |
|
— |
|
— |
|
64,928 |
|
|
Foreign |
|
Rio de Janeiro Refrescos Ltda. |
|
Brazil |
|
Foreign |
|
Banco Itaú |
|
Brazil |
|
Brazilian Real |
|
Monthly |
|
6.63 |
% |
6.63 |
% |
4,721,649 |
|
4,721,649 |
|
1,043,036 |
|
— |
|
— |
|
10,486,334 |
|
|
Foreign |
|
Rio de Janeiro Refrescos Ltda. |
|
Brazil |
|
Foreign |
|
Banco Santander Rio |
|
Brazil |
|
Brazilian Real |
|
Monthly |
|
7.15 |
% |
7.15 |
% |
391,812 |
|
391,811 |
|
— |
|
— |
|
— |
|
783,623 |
|
|
Foreign |
|
Rio de Janeiro Refrescos Ltda. |
|
Brazil |
|
Foreign |
|
Banco Santander Itaú |
|
Brazil |
|
US$Dollars |
|
Monthly |
|
2.992 |
% |
2.992 |
% |
3,147,356 |
|
3,147,356 |
|
11,059,059 |
|
11,059,058 |
|
— |
|
28,412,829 |
|
|
Foreign |
|
Rio de Janeiro Refrescos Ltda. |
|
Brazil |
|
Foreign |
|
Banco Bradesco |
|
Brazil |
|
Brazilian Real |
|
Quarterly |
|
12.41 |
% |
12.41 |
% |
489,877 |
|
489,876 |
|
— |
|
— |
|
— |
|
979,753 |
|
|
Foreign |
|
Rio de Janeiro Refrescos Ltda. |
|
Brazil |
|
Foreign |
|
Banco Itaú |
|
Brazil |
|
Brazilian Real |
|
Quarterly |
|
11.79 |
% |
11.79 |
% |
3,062,054 |
|
3,062,054 |
|
3,062,054 |
|
3,062,054 |
|
3,827,567 |
|
16,075,783 |
|
|
Foreign |
|
Rio de Janeiro Refrescos Ltda. |
|
Brazil |
|
Foreign |
|
Banco Itaú |
|
Brazil |
|
Brazilian Real |
|
Monthly |
|
4.50 |
% |
4.50 |
% |
189,654 |
|
189,654 |
|
21,685 |
|
— |
|
— |
|
400,993 |
|
|
Foreign |
|
Rio de Janeiro Refrescos Ltda. |
|
Brazil |
|
Foreign |
|
Banco Itaú |
|
Brazil |
|
Brazilian Real |
|
Monthly |
|
7.00 |
% |
7.00 |
% |
9,499 |
|
9,499 |
|
3,958 |
|
— |
|
— |
|
22,956 |
|
|
Foreign |
|
Embotelladora del Atlántico S.A. |
|
Argentina |
|
Foreign |
|
Banco de la Nación Argentina |
|
Argentina |
|
Argentine pesos |
|
Monthly |
|
9.90 |
% |
9.90 |
% |
198,978 |
|
198,978 |
|
— |
|
— |
|
— |
|
397,956 |
|
|
Foreign |
|
Embotelladora del Atlántico S.A. |
|
Argentina |
|
Foreign |
|
Banco Nación Bicentenario (1) |
|
Argentina |
|
Argentine pesos |
|
Monthly |
|
14.80 |
% |
9.90 |
% |
752,222 |
|
752,221 |
|
— |
|
— |
|
— |
|
1,504,443 |
|
|
Foreign |
|
Embotelladora del Atlántico S.A. |
|
Argentina |
|
Foreign |
|
Nuevo Banco de Santa Fe |
|
Argentina |
|
Argentine pesos |
|
Quarterly |
|
15.00 |
% |
15.00 |
% |
119,166 |
|
119,165 |
|
— |
|
— |
|
— |
|
238,331 |
|
|
Foreign |
|
Embotelladora del Atlántico S.A. |
|
Argentina |
|
Foreign |
|
Nuevo Banco de Santa Fe |
|
Argentina |
|
Argentine pesos |
|
Quarterly |
|
15.25 |
% |
15.25 |
% |
400,990 |
|
400,990 |
|
— |
|
— |
|
— |
|
801,980 |
|
|
Foreign |
|
Embotelladora del Atlántico S.A. |
|
Argentina |
|
Foreign |
|
Banco Galicia y Bs. As. |
|
Argentina |
|
Argentine pesos |
|
Quarterly |
|
15.00 |
% |
15.00 |
% |
33,940 |
|
33,939 |
|
— |
|
— |
|
— |
|
67,879 |
|
|
Foreign |
|
Embotelladora del Atlántico S.A. |
|
Argentina |
|
Foreign |
|
Banco Galicia y Bs. As. |
|
Argentina |
|
Argentine pesos |
|
Quarterly |
|
15.25 |
% |
15.25 |
% |
65,365 |
|
65,365 |
|
— |
|
— |
|
— |
|
130,730 |
|
|
Foreign |
|
Embotelladora del Atlántico S.A. |
|
Argentina |
|
Foreign |
|
Banco Ciudad de Bs. As. |
|
Argentina |
|
Argentine pesos |
|
Quarterly |
|
15.25 |
% |
15.25 |
% |
1,078,063 |
|
1,078,062 |
|
— |
|
— |
|
— |
|
2,156,125 |
|
|
Foreign |
|
Embotelladora del Atlántico S.A. |
|
Argentina |
|
Foreign |
|
BBVA Banco Francés |
|
Argentina |
|
Argentine pesos |
|
Monthly |
|
15.25 |
% |
15.25 |
% |
255,770 |
|
255,769 |
|
— |
|
— |
|
— |
|
511,539 |
|
|
Foreign |
|
Embotelladora del Atlántico S.A. |
|
Argentina |
|
Foreign |
|
Banco Santanderr Río |
|
Argentina |
|
Argentine pesos |
|
Monthly |
|
15.25 |
% |
15.25 |
% |
268,178 |
|
268,178 |
|
— |
|
— |
|
— |
|
536,356 |
|
|
Foreign |
|
Embotelladora del Atlántico S.A. |
|
Argentina |
|
Foreign |
|
Banco Macro Bansud |
|
Argentina |
|
Argentine pesos |
|
Monthly |
|
15.25 |
% |
15.25 |
% |
273,922 |
|
273,922 |
|
— |
|
— |
|
— |
|
547,844 |
|
|
Foreign |
|
Embotelladora del Atlántico S.A. |
|
Argentina |
|
Foreign |
|
Comercial Bank Of China |
|
Argentina |
|
Argentine pesos |
|
Quarterly |
|
15.25 |
% |
15.25 |
% |
1,431,997 |
|
1,431,997 |
|
— |
|
— |
|
— |
|
2,863,994 |
|
|
Foreign |
|
Andina Empaques Argentina S.A. |
|
Argentina |
|
Foreign |
|
Banco Galicia y Bs. As. |
|
Argentina |
|
Argentine pesos |
|
At maturity |
|
15.25 |
% |
15.25 |
% |
357.558 |
|
357,558 |
|
— |
|
— |
|
— |
|
715,116 |
|
|
96.705.990-0 |
|
Envases Central S.A. |
|
Chile |
|
97.080.000-K |
|
Banco Bice |
|
Chile |
|
Pesos chilenos |
|
At maturity |
|
4.29 |
% |
4.29 |
% |
193,470 |
|
193,469 |
|
— |
|
— |
|
— |
|
386,939 |
|
|
|
|
Total |
|
|
|
|
|
|
|
|
|
|
|
|
|
|
|
|
|
|
|
|
|
|
|
|
|
|
|
68,086,431 |
|
(1) The Bicentennial loan granted at a prime rate by Banco de la Nacion Argentina to Embotelladora del Atlántico S.A., is a benefit from the Argentine government to encourage investment projects. Embotelladora del Atlántico S.A. registered investment projects and received this loan at a prime rate of 9.9% annually.
16.2.1 Bonds payable
|
|
|
Current |
|
Non-Current |
|
Total |
|
||||||
|
Composition of bonds payable |
|
12.31.2014 |
|
12.31.2013 |
|
12.31.2014 |
|
12.31.2013 |
|
12.31.2014 |
|
12.31.2013 |
|
|
|
|
ThCh$ |
|
ThCh$ |
|
ThCh$ |
|
ThCh$ |
|
ThCh$ |
|
ThCh$ |
|
|
Bonds (face value) |
|
18,457,970 |
|
16,260,180 |
|
662,420,327 |
|
538,269,015 |
|
680,878,297 |
|
554,529,195 |
|
|
Expenses of bond issuance and discounts on placement |
|
(834,087 |
) |
(670,736 |
) |
(5,200,079 |
) |
(5,892,713 |
) |
(6,034,166 |
) |
(6,563,449 |
) |
|
Net balance presented in statement of financial position |
|
17,623,883 |
|
15,589,444 |
|
657,220,248 |
|
532,376,302 |
|
674,844,131 |
|
547,965,746 |
|
16.2.2 Current and non-current balances
Obligations with the public correspond to bonds in UF issued by the parent company on the Chilean market and bonds in US dollars issued by the parent company on the international market. In the month of April 2014, the Company placed series E bonds on the Chilean market for an amount of UF 3,000,000. Following is a detail of the these instruments:
|
|
|
|
|
Face |
|
Unit of |
|
Interest |
|
Final |
|
Interest |
|
Date |
|
|
|
|
|
|
|
|
Series |
|
amount |
|
Adjustment |
|
rate |
|
Maturity |
|
Payment |
|
Amortization of capital |
|
12.31.2014 |
|
12.31.2013 |
|
|
|
|
|
|
|
|
|
|
|
|
|
|
|
|
|
|
ThCh$ |
|
ThCh$ |
|
|
Bonds, current portion |
|
|
|
|
|
|
|
|
|
|
|
|
|
|
|
|
|
|
|
|
SVS Registration N°640 SVS 08.23.2010 |
|
A |
|
750,000 |
|
UF |
|
3.0 |
% |
08-15-2017 |
|
Semiannually |
|
02-15-2015 |
|
6,363,030 |
|
6,087,682 |
|
|
SVS Registration N°254 SVS 06.13.2001 |
|
B |
|
2,901,125 |
|
UF |
|
6.5 |
% |
06-01-2026 |
|
Semiannually |
|
06-01-2015 |
|
4,749,263 |
|
4,262,972 |
|
|
SVS Registration N°641 08.23.2010 |
|
C |
|
1,500,000 |
|
UF |
|
4.0 |
% |
08-15-2031 |
|
Semiannually |
|
02-15-2021 |
|
548,679 |
|
519,326 |
|
|
SVS Registration N°759 08.20.2013 |
|
C |
|
1,000,000 |
|
UF |
|
3.5 |
% |
08-16-2020 |
|
Semiannually |
|
02-16-2017 |
|
284,837 |
|
303,298 |
|
|
SVS Registration N°760 08.20.2013 |
|
D |
|
4,000,000 |
|
UF |
|
3.8 |
% |
08-16-2034 |
|
Semiannually |
|
02-16-2032 |
|
1,236,149 |
|
1,316,268 |
|
|
SVS Registration N°760 04.02.2014 |
|
E |
|
3,000,000 |
|
UF |
|
3.75 |
% |
03-01-2035 |
|
Semiannually |
|
09-01-2032 |
|
914,996 |
|
— |
|
|
Yankee Bonds |
|
— |
|
575,000,000 |
|
US$ |
|
5.0 |
% |
10-01-2023 |
|
Semiannually |
|
10-01-2023 |
|
4,361,016 |
|
3,770,634 |
|
|
Total current portion |
|
|
|
|
|
|
|
|
|
|
|
|
|
|
|
18,457,970 |
|
16,260,180 |
|
|
Bonds non-current portion |
|
|
|
|
|
|
|
|
|
|
|
|
|
|
|
|
|
|
|
|
SVS Registration N°640 SVS 08.23.2010 |
|
A |
|
750,000 |
|
UF |
|
3.0 |
% |
08-15-2017 |
|
Semiannually |
|
02-15-2016 |
|
12,313,550 |
|
17,482,170 |
|
|
SVS Registration N°254 SVS 06.13.2001 |
|
B |
|
2,901,125 |
|
UF |
|
6.5 |
% |
06-01-2026 |
|
Semiannually |
|
06-01-2016 |
|
67,077,946 |
|
67,623,955 |
|
|
SVS Registration N°641 08.23.2010 |
|
C |
|
1,500,000 |
|
UF |
|
4.0 |
% |
08-15-2031 |
|
Semiannually |
|
02-15-2021 |
|
36,940,650 |
|
34,964,340 |
|
|
SVS Registration N°759 08.20.2013 |
|
C |
|
1,000,000 |
|
UF |
|
3.5 |
% |
08-16-2020 |
|
Semiannually |
|
02-16-2017 |
|
24,662,705 |
|
23,309,560 |
|
|
SVS Registration N°760 08.20.2013 |
|
D |
|
4,000,000 |
|
UF |
|
3.8 |
% |
08-16-2034 |
|
Semiannually |
|
02-16-2032 |
|
98,662,919 |
|
93,238,240 |
|
|
SVS Registration N°760 04.02.2014 |
|
E |
|
3,000,000 |
|
UF |
|
3.75 |
% |
03-01-2035 |
|
Semiannually |
|
09-01-2032 |
|
73,881,307 |
|
— |
|
|
Yankee Bonds |
|
— |
|
575,000,000 |
|
US$ |
|
5.0 |
% |
10-01-2023 |
|
Semiannually |
|
10-01-2023 |
|
348,881,250 |
|
301,650,750 |
|
|
Total non-current portion |
|
|
|
|
|
|
|
|
|
|
|
|
|
|
|
662,420,327 |
|
538,269,015 |
|
Accrued interest included in the current portion of bonds totaled ThCh$ 8,122,961 and ThCh$ 6,550,485 at December 31, 2014 and 2013, respectively.
16.2.3 Non-current maturities
|
|
|
|
|
Year of maturity |
|
Total non-
|
|
||||||
|
|
|
Series |
|
2016 |
|
2017 |
|
2018 |
|
After |
|
12-31-2014 |
|
|
|
|
|
|
ThCh$ |
|
ThCh$ |
|
ThCh$ |
|
ThCh$ |
|
ThCh$ |
|
|
SVS Registration N°640 08.23.2010 |
|
A |
|
6,156,775 |
|
6,156,775 |
|
— |
|
— |
|
12,313,550 |
|
|
SVS Registration N°254 06.13.2001 |
|
B |
|
4,652,434 |
|
4,954,726 |
|
5,276,849 |
|
52,193,937 |
|
67,077,946 |
|
|
SVS Registration N°641 08.23.2010 |
|
C |
|
— |
|
— |
|
— |
|
36,940,650 |
|
36,940,650 |
|
|
SVS Registration N°759 08.20.2013 |
|
C |
|
— |
|
6,165,641 |
|
6,165,640 |
|
12,331,424 |
|
24,662,705 |
|
|
SVS Registration N°760 08.20.2013 |
|
D |
|
— |
|
— |
|
— |
|
98,662,919 |
|
98,662,919 |
|
|
SVS Registration N°760 04.02.2014 |
|
E |
|
— |
|
— |
|
— |
|
73,881,307 |
|
73,881,307 |
|
|
Yankee Bonds |
|
— |
|
— |
|
— |
|
— |
|
348,881,250 |
|
348,881,250 |
|
|
|
|
|
|
10,809,209 |
|
17,277,142 |
|
11,442,489 |
|
622,891,487 |
|
662,420,327 |
|
16.2.4 Market rating
The bonds issued on the Chilean market had the following rating at December 31, 2014:
|
AA |
: |
ICR Compañía Clasificadora de Riesgo Ltda. rating |
|
AA |
: |
Fitch Chile Clasificadora de Riesgo Limitada rating |
The rating of bonds issued on the international market as of December 31, 2014 is the following:
|
BBB |
: |
Standard&Poors rating |
|
A- |
: |
Fitch Chile Clasificadora de Riesgo Limitada rating. |
16.2.5 Restrictions
16.2.5.1 Restrictions regarding bonds placed abroad
On September 26, 2013, Andina issued a bond in the U.S. Market (Yankee Bonds) for US$575 million at a coupon rate of 5.000% maturing on October 1, 2023. These bonds do not have financial restrictions .
16.2.5.2 Restrictions regarding bonds placed in the local market .
Restrictions regarding the issuance of bonds for a fixed amount registered under number 254.
During 2001, Andina placed local bonds in the Chilean market. The issuance was structured into two series, one of which matured during 2008 .
The outstanding series as of December 31, 2014 is Series B for a nominal amount of up to UF 4 million, of which amount UF 3.7 million in bonds were placed with final maturity in the year 2026 at a 6.50% annual interest rate. The balance of outstanding capital as of December 31, 2014 is UF 2,901 million.
Series B was issued with charge to the Bonds Line registered with the Securities Registered under number 254 dated June 13, 2001 .
Regarding Series B, the Issuer is subject to the following restrictions:
· Maintain an indebtedness level where Consolidated Financial Liabilities does not exceed Consolidated Equity by 1.20 times. For these purposes Consolidated Financial Liabilities shall be regarded as Liabilities Payable bearing interest, namely: (i) other current financial liabilities, plus (ii) other non-current financial liabilities. Consolidated Equity will be regarded as total equity including non-controlling interest .
As of December 31, 2014, Indebtedness Level is 0.88 times of Consolidated Equity.
The breakdown of accounts with the respective amounts used for the previous calculation is summarized as follows (in thousand Chilean pesos) :
|
As of December 31, 2014, the values of items included in this indicator are
|
|
ThCh$ |
|
|
Other current financial liabilities |
|
83,402,440 |
|
|
Other non-current financial liabilities |
|
726,616,440 |
|
|
Total Consolidated Equity |
|
918,997,733 |
|
· Maintain, and in no manner lose, sell, assign or transfer to a third party, the geographical area currently denominated as the “Metropolitan Region” (Región Metropolitana) as a territory in Chile in which we have been authorized by The Coca-Cola Company for the development, production, sale and distribution of products and brands of the licensor, in accordance to the respective bottler or license agreement, renewable from time to time.
· Not lose, sell, assign, or transfer to a third party any other territory of Argentina or Brazil, which as of this date is franchised by TCCC to the Company for the development, production, sale and distribution of products and brands of such licensor, as long as any of these territories account for more than 40% of the Issuer’s Adjusted Consolidated Operating Cash Flow.
· Maintain consolidated assets free of any pledge, mortgage or other encumbrances for an amount at least equal to 1.30 times of the issuer’s unsecured consolidated liabilities.
As of December 31, 2014, this index is 1.59 times
The breakdown of accounts with the respective amounts used for the previous calculation is summarized as follows :
|
As of December 31, 2014, the values of items included in this restriction
|
|
ThCh$ |
|
|
Consolidated assets free of collateral, mortgages or other liens |
|
2,149,231,064 |
|
|
Unsecured consolidated liabilities payable |
|
1,350,175,558 |
|
Restrictions regarding bond lines registered in the Securities Registrered under numbers 640 and 641 .
As a consequence of our merger with Coca-Cola Polar S.A., Andina became a debtor of the following two bonds placed in the Chilean market in 2010:
· UF 1.0 million of Series A bonds due 2017, bearing an annual interest of 3.00%. As of December 31, 2014, the balance of outstanding capital is UF 0.750 million
· UF 1.5 million of Series C bonds due 2031, bearing an annual interest rate of 4.00%. As of December 31, 2014, the balance of outstanding capital is UF 1.5 million.
Series A and Series C were issued with charge to the Bond Lines registered with the Securities Registrar, under numbers 640 and 641, respectively, both on August 23, 2010
Regarding Series A and Series C, the Issuer is subject to the following restrictions:
· Maintain a level of “Net Financial Debt” within its quarterly financial statements that may not exceed 1.5 times, measured over figures included in its consolidated statement of financial position. To this end, net financial debt shall be defined as the ratio between net financial debt and total equity of the issuer (equity attributable to controlling owners plus non-controlling interest). On its part, net financial debt will be the difference between the Issuer’s financial debt and cash.
As of December 31, 2014, Net Financial Debt was 0.79 times.
The breakdown of accounts with the respective amounts used for the previous calculation is summarized as follows:
|
As of
December 31
, 2014, the values of items included in this indicator are
|
|
ThCh$ |
|
|
Cash and cash equivalent |
|
79,514,434 |
|
|
Other current financial liabilities |
|
83,402,440 |
|
|
Other non-current financial liabilities |
|
726,616,440 |
|
|
Total Consolidated Equity |
|
918,997,733 |
|
· Maintain consolidated assets free of any pledge, mortgage or other encumbrances for an amount at least equal to 1.30 times of the issuer’s unsecured consolidated liabilities.
As of December 31, 2014, this index is 1.59 times.
The breakdown of accounts with the respective amounts used for the previous calculation is summarized as follows :
|
As of December 31, 2014, the values of items included in this restriction
|
|
ThCh$ |
|
|
Consolidated assets free of collateral, mortgages or other liens |
|
2,149,231,064 |
|
|
Consolidated liabilities payable not guaranteed |
|
1,350,175,558 |
|
· Not carry out investments in instruments issued by related parties, nor carry out with these parties any other operations not related to normal business, in conditions that may be more unfavorable to the Issuer regarding those prevailing in the market .
· Maintain a level of “Financial net coverage” in its quarterly financial statements of more than 3 times. Net financial coverage means the ratio between the Issuer’s Ebitda for the past 12 months and net financial expenses (financial income less financial expenses) of the issuer for the past 12 months. However, this restriction will be considered breached when the mentioned net financial coverage level is lower than the level previously indicated during two consecutive quarters.
As of December 31, 2014 Net Financial Coverage level is 5.13 times.
The breakdown of accounts with the respective amounts used for the previous calculation is summarized as follows :
|
As of December 31, 2014, the values of items included in this indicator are
|
|
ThCh$ |
|
|
(+) Consolidated Ebitda between January 1 and December 31, 2014 |
|
289,739,619 |
|
|
(+) Consolidated financial income between January 1 and December 31, 2014 |
|
8,655,623 |
|
|
(-) Consolidated financial expenses between January 1 and December 31, 2014 |
|
65,081,431 |
|
Restrictions regarding bond lines registered in the Securities Registrar under numbers 759 and 760
During 2013 and 2014, Andina placed local bonds in the Chilean market. The issuance was structured into two series.
· Series C outstanding as of December 31, 2014, for a nominal value of up to UF 3 million, of which bonds were placed for a nominal amount of UF 1.0 million with final maturity during year 2020 at an annual interest rate of 3.50% issued against line number 759. Outstanding capital as of December 31, 2014 is UF 1.0 million.
· Series D and E outstanding at December 31, 2014 for a total nominal value of UF 8 million, of which UF 4 million were placed in bonds during August, 2013 (series D) and UF 3 million during April, 2014 (series E), with final maturity in 2034 and 2035, respectively, issued with charge against line number 760. The anual interest rates are 3.8% for Series D and 3.75% for Series E. The oustanding capital balance at December 31, 2014 of both series amounts to UF 7.0 million.
Regarding Series C, D and E, the Issuer is subject to the following restrictions:
· Maintain an indebtedness level where Net Consolidated Financial Liabilities does not exceed Consolidated Equity by 1.20 times. For these purposes Consolidated Financial Liabilities shall be regarded as Liabilities Payable bearing interest, namely: (i) other current financial liabilities, plus (ii) other non-current financial liabilities, less (iii) cash and cash equivalent and (iv) other current financial assets. Consolidated Equity will be regarded as total equity including non-controlling interest.
As of December 31, 2014, Indebtedness Level is 0.68 times of Consolidated Equity
The breakdown of accounts with the respective amounts used for the previous calculation is summarized as follows :
|
As of December 31, 2014, the values of items included in this indicaror are
|
|
ThCh$ |
|
|
Cash and cash equivalent |
|
79,514,434 |
|
|
Other current financial assets |
|
106,577,042 |
|
|
Other current financial liabilities |
|
83,402,440 |
|
|
Other non-current financial liabilities |
|
726,616,440 |
|
|
Total Consolidated Equity |
|
918,997,733 |
|
· Maintain consolidated assets free of any pledge, mortgage or other encumbrances for an amount at least equal to 1.30 times of the issuer’s unsecured consolidated liabilities payable.
As of December 31, 2014, this index is 1.59 times.
The breakdown of accounts with the respective amounts used for the previous calculation is summarized as follows :
|
As of December 31, 2014, the values of items included in this restriction are
|
|
ThCh$ |
|
|
Consolidated assets free of collateral, mortgages or other liens |
|
2,149,231,064 |
|
|
Consolidated liabilities payable not guaranteed |
|
1,350,175,558 |
|
· Maintain, and in no manner lose, sell, assign or transfer to a third party, the geographical area currently denominated as the “Metropolitan Region” as a territory franchised to the Issuer in Chile by The Coca-Cola Company, hereinafter also referred to as “ TCCC ” or the “ Licensor ” for the development, production, sale and distribution of products and brands of said licensor, in accordance to the respective bottler or license agreement, renewable from time to time. Losing said territory, means the non-renewal, early termination or cancellation of this license agreement by TCCC, for the geographical area today called “Metropolitan Region”. This reason shall not apply if, as a result of the loss, sale, transfer or disposition, of that licensed territory is purchased or acquired by a subsidiary or an entity that consolidates in terms of accounting with the Issuer.
· Not lose, sell, assign, or transfer to a third party any other territory of Argentina or Brazil, which as of the issuance date of these instruments is franchised by TCCC to the Issuer for the development, production, sale and distribution of products and brands of such licensor, as long as any of these territories account for more than 40% of the Issuer’s Adjusted Consolidated Operating Cash Flow of the audited period immediately before the moment of loss, sale, assignment or transfer. For these purposes, the term “Adjusted Consolidated Operating Cash Flow” shall mean the addition of the following accounting accounts of the Issuer’s Consolidated Statement of Financial Position: (i) “Gross Profit” which includes regular activities and cost of sales; less (ii) “Distribution Costs”; less (iii) “Administrative Expenses”; plus (iv) “Participation in profits (losses) of associates and joint ventures that are accounted for using the equity method”; plus (v) “Depreciation”; plus (vi) “Intangibles Amortization”.
As of December 31, 2014 and 2013, the Company complies with all financial collaterals .
16.2.6 Repurchased bonds
In addition to UF bonds, the Company holds bonds that it has repurchased in full through companies that are included in the consolidation:
Through its subsidiaries, Abisa Corp S.A. (formerly Pacific Sterling), Embotelladora Andina S.A. repurchased its Yankee Bonds issued on the U.S. Market during the years 2000, 2001, 2002, 2007 and 2008. On December 15, 2014, Embotelladora Andina S.A. rescued US$200 million in outstanding bonds from its subsidiary Abisa Corp S.A., thus since legally debtor and creditor are joined in a single entity, the mentioned bond liability becomes extinguished.
The subsidiary Rio de Janeiro Refrescos Ltda. maintains a liability corresponding to a bond issuance for US $75 million due in December 2020 and semi-annual interest payments. On December 31, 2014 these issues belong to Andina, until December 31, 2012 belong to the subsidiary Abisa Corp S.A., (former Pacific Sterling). On January 1, 2013, Abisa Corp S.A. transferred the totality of this asset to Embotelladora Andina S.A., passing the latter to be the creditor of the above mentioned Brazilian subsidiary. As a result, in these consolidated financial statements the assets and liabilities related to the transaction have been eliminated. In addition, the transaction has been treated as a net investment of the group in the Brazilian subsidiary, consequently the effects of exchange rate differences between the dollar and the functional currency of each one have been recorded in other comprehensive income.
16.3.1 Derivative contract obligations.
Please see details in Note 21.
16.4.1 Current liabilities for leasing agreements
|
|
|
|
|
|
|
|
|
|
|
|
|
|
|
|
|
|
|
Maturity |
|
Total |
|
||||
|
Indebted Entity |
|
Creditor Entity |
|
|
|
Amortization |
|
Effective |
|
Nominal |
|
Up to |
|
90 days |
|
at |
|
at |
|
||||||
|
Name |
|
Country |
|
Tax,ID |
|
Name |
|
Country |
|
Currency |
|
type |
|
rate |
|
rate |
|
90 días |
|
1 año |
|
12.31.2014 |
|
12.31.2013 |
|
|
|
|
|
|
|
|
|
|
|
|
|
|
|
|
|
|
|
|
ThCh$ |
|
ThCh$ |
|
ThCh$ |
|
ThCh$ |
|
|
Rio de Janeiro Refrescos Ltda. |
|
Brazil |
|
Foreign |
|
Banco Itaú |
|
Brazil |
|
Brazilian real |
|
Monthly |
|
10.21 |
% |
10.22 |
% |
39,290 |
|
39,290 |
|
78,580 |
|
110,098 |
|
|
Rio de Janeiro Refrescos Ltda. |
|
Brazil |
|
Foreign |
|
Banco Santander |
|
Brazil |
|
Brazilian real |
|
Monthly |
|
9.65 |
% |
9.47 |
% |
5,939 |
|
17,817 |
|
23,756 |
|
6,971 |
|
|
Rio de Janeiro Refrescos Ltda. |
|
Brazil |
|
Foreign |
|
Cogeracao Ligth Esco |
|
Brazil |
|
Brazilian real |
|
Monthly |
|
13.00 |
% |
13.00 |
% |
133,630 |
|
471,475 |
|
605,105 |
|
— |
|
|
Rio de Janeiro Refrescos Ltda. |
|
Brazil |
|
Foreign |
|
Alfa |
|
Brazil |
|
Brazilian real |
|
Monthly |
|
13.00 |
% |
13.00 |
% |
79,950 |
|
162,869 |
|
242,819 |
|
1,370,828 |
|
|
Rio de Janeiro Refrescos Ltda. |
|
Brazil |
|
Foreign |
|
Banco Bradesco |
|
Brazil |
|
Brazilian real |
|
Monthly |
|
13.06 |
% |
13.06 |
% |
72,183 |
|
175,661 |
|
247,844 |
|
246,334 |
|
|
Rio de Janeiro Refrescos Ltda. |
|
Brazil |
|
Foreign |
|
Banco Citibank |
|
Brazil |
|
Brazilian real |
|
Monthly |
|
12.70 |
% |
12.70 |
% |
221,575 |
|
433,556 |
|
655,131 |
|
1,594,463 |
|
|
Rio de Janeiro Refrescos Ltda. |
|
Brazil |
|
Foreign |
|
Banco Santander |
|
Brazil |
|
Brazilian real |
|
Monthly |
|
12.68 |
% |
12.68 |
% |
215,864 |
|
1,496,888 |
|
1,712,752 |
|
1,782,674 |
|
|
Rio de Janeiro Refrescos Ltda. |
|
Brazil |
|
Foreign |
|
Banco Itaú |
|
Brazil |
|
Brazilian real |
|
Monthly |
|
13.49 |
% |
13.49 |
% |
31,592 |
|
16,904 |
|
48,496 |
|
148,266 |
|
|
Embotelladora del Atlántico S.A. |
|
Argentina |
|
Foreign |
|
Tetra Pak SRL |
|
Argentina |
|
Dollars |
|
Monthly |
|
12.00 |
% |
12.00 |
% |
17,619 |
|
56,125 |
|
73,744 |
|
56,582 |
|
|
|
|
|
|
|
|
|
|
|
|
|
|
|
|
|
|
|
|
|
|
|
|
|
|
|
|
|
|
|
|
|
|
|
|
|
|
|
|
|
|
|
|
|
|
|
|
|
Total |
|
3,688,227 |
|
5,316,216 |
|
16.4.2 Non-Current liabilities for leasing agreements December 31, 2014
|
|
|
|
|
|
|
|
|
|
|
|
|
|
|
|
|
|
|
Maturity |
|
|
|
||||||||
|
Indebted Entity |
|
Creditor Entity |
|
|
|
Amortization |
|
Effective |
|
Nominal |
|
1 year to |
|
2 years to |
|
3 years to |
|
4 years to |
|
more |
|
at |
|
||||||
|
Name |
|
Country |
|
Tax,ID |
|
Name |
|
Type |
|
Currency |
|
type |
|
rate |
|
rate |
|
2 years |
|
3 years |
|
4 years |
|
5 years |
|
5 years |
|
12.31.2014 |
|
|
|
|
|
|
|
|
|
|
|
|
|
|
|
|
|
|
|
|
ThCh$ |
|
ThCh$ |
|
ThCh$ |
|
ThCh$ |
|
ThCh$ |
|
ThCh$ |
|
|
Rio de Janeiro Refrescos Ltda. |
|
Brazil |
|
Foreign |
|
Banco Itaú |
|
Brazil |
|
Brazilian real |
|
Monthly |
|
10.21 |
% |
10.22 |
% |
479,460 |
|
— |
|
— |
|
— |
|
— |
|
479,460 |
|
|
Rio de Janeiro Refrescos Ltda. |
|
Brazil |
|
Foreign |
|
Banco Santander |
|
Brazil |
|
Brazilian real |
|
Monthly |
|
9.65 |
% |
9.47 |
% |
18,881 |
|
— |
|
— |
|
— |
|
— |
|
18,881 |
|
|
Rio de Janeiro Refrescos Ltda. |
|
Brazil |
|
Foreign |
|
Cogeracao Ligth Esco |
|
Brazil |
|
Brazilian real |
|
Monthly |
|
13.00 |
% |
13.00 |
% |
1,945,291 |
|
17,775,797 |
|
— |
|
— |
|
— |
|
19,721,088 |
|
|
Rio de Janeiro Refrescos Ltda. |
|
Brazil |
|
Foreign |
|
Alfa |
|
Brazil |
|
Brazilian real |
|
Monthly |
|
13.00 |
% |
13.00 |
% |
43,401 |
|
— |
|
— |
|
— |
|
— |
|
43,401 |
|
|
Rio de Janeiro Refrescos Ltda. |
|
Brazil |
|
Foreign |
|
Banco Bradesco |
|
Brazil |
|
Brazilian real |
|
Monthly |
|
13.06 |
% |
13.06 |
% |
125,635 |
|
— |
|
— |
|
— |
|
— |
|
125,635 |
|
|
Rio de Janeiro Refrescos Ltda. |
|
Brazil |
|
Foreign |
|
Banco Citibank |
|
Brazil |
|
Brazilian real |
|
Monthly |
|
12.70 |
% |
12.70 |
% |
786,477 |
|
— |
|
— |
|
— |
|
— |
|
786,477 |
|
|
Rio de Janeiro Refrescos Ltda. |
|
Brazil |
|
Foreign |
|
Banco Santander |
|
Brazil |
|
Brazilian real |
|
Monthly |
|
12.68 |
% |
12.68 |
% |
1,306,378 |
|
— |
|
— |
|
— |
|
— |
|
1,306,378 |
|
|
Embotelladora del Atlántico S.A. |
|
Argentina |
|
Foreign |
|
Tetra Pak SRL |
|
Argentina |
|
Dollars |
|
Monthly |
|
12.00 |
% |
12.00 |
% |
500,101 |
|
— |
|
— |
|
— |
|
— |
|
500,101 |
|
|
|
|
|
|
|
|
|
|
|
|
|
|
|
|
|
|
|
|
|
|
|
|
|
|
|
|
|
|
|
|
|
|
|
|
|
|
|
|
|
|
|
|
|
|
|
|
|
|
|
|
|
|
|
|
|
|
|
Total |
|
22,981,421 |
|
16.4.3 Non-Current liabilities for leasing agreements December 31, 2013
|
|
|
|
|
|
|
|
|
|
|
|
|
|
|
|
|
|
|
Maturity |
|
|
|
||||||||
|
Indebted Entity |
|
Creditor Entity |
|
|
|
Amortization |
|
Effective |
|
Nominal |
|
1 year to |
|
2 years to |
|
3 years to |
|
4 years to |
|
more |
|
at |
|
||||||
|
Name |
|
Country |
|
Tax,ID |
|
Name |
|
Type |
|
Currency |
|
type |
|
rate |
|
rate |
|
2 years |
|
3 years |
|
4 years |
|
5 years |
|
5 years |
|
12.31.2013 |
|
|
|
|
|
|
|
|
|
|
|
|
|
|
|
|
|
|
|
|
ThCh$ |
|
ThCh$ |
|
ThCh$ |
|
ThCh$ |
|
ThCh$ |
|
ThCh$ |
|
|
Rio de Janeiro Refrescos Ltda. |
|
Brazil |
|
Foreign |
|
Banco Itaú |
|
Brazil |
|
Brazilian real |
|
Monthly |
|
10.21 |
% |
10.22 |
% |
824,548 |
|
— |
|
— |
|
— |
|
— |
|
824,548 |
|
|
Rio de Janeiro Refrescos Ltda. |
|
Brazil |
|
Foreign |
|
Banco Santander |
|
Brazil |
|
Brazilian real |
|
Monthly |
|
9.65 |
% |
9.47 |
% |
53,764 |
|
— |
|
— |
|
— |
|
— |
|
53,764 |
|
|
Rio de Janeiro Refrescos Ltda. |
|
Brazil |
|
Foreign |
|
Alfa |
|
Brazil |
|
Brazilian real |
|
Monthly |
|
13.00 |
% |
13.00 |
% |
192,802 |
|
— |
|
— |
|
— |
|
— |
|
192,802 |
|
|
Rio de Janeiro Refrescos Ltda. |
|
Brazil |
|
Foreign |
|
Banco Bradesco |
|
Brazil |
|
Brazilian real |
|
Monthly |
|
13.06 |
% |
13.06 |
% |
248,187 |
|
— |
|
— |
|
— |
|
— |
|
248,187 |
|
|
Rio de Janeiro Refrescos Ltda. |
|
Brazil |
|
Foreign |
|
Banco Citibank |
|
Brazil |
|
Brazilian real |
|
Monthly |
|
12.70 |
% |
12.70 |
% |
671,942 |
|
— |
|
— |
|
— |
|
— |
|
671,942 |
|
|
Rio de Janeiro Refrescos Ltda. |
|
Brazil |
|
Foreign |
|
Banco Santander |
|
Brazil |
|
Brazilian real |
|
Monthly |
|
12.68 |
% |
12.68 |
% |
1,437,383 |
|
— |
|
— |
|
— |
|
— |
|
1,437,383 |
|
|
Rio de Janeiro Refrescos Ltda. |
|
Brazil |
|
Foreign |
|
Banco Itaú |
|
Brazil |
|
Brazilian real |
|
Monthly |
|
13.49 |
% |
13.49 |
% |
26,057 |
|
— |
|
— |
|
— |
|
— |
|
26,057 |
|
|
Embotelladora del Atlántico S.A. |
|
Argentina |
|
Foreign |
|
Tetra Pak SRL |
|
Argentina |
|
Dollars |
|
Monthly |
|
12.00 |
% |
12.00 |
% |
63,761 |
|
71,848 |
|
80,960 |
|
279,593 |
|
— |
|
496,162 |
|
|
|
|
|
|
|
|
|
|
|
|
|
|
|
|
|
|
|
|
|
|
|
|
|
|
|
|
|
|
|
|
|
|
|
|
|
|
|
|
|
|
|
|
|
|
|
|
|
|
|
|
|
|
|
|
|
|
|
Total |
|
3,950,845 |
|
a) Trade and other current accounts payable are detailed as follows:
|
Item |
|
12.31.2014 |
|
12.31.2013 |
|
|
|
|
ThCh$ |
|
ThCh$ |
|
|
Trade accounts payable |
|
171,289,867 |
|
162,980,833 |
|
|
Withholdings tax |
|
47,459,313 |
|
41,564,170 |
|
|
Others |
|
9,429,932 |
|
5,901,295 |
|
|
Total |
|
228,179,112 |
|
210,446,298 |
|
b) The Company maintains commercial lease agreements for forklifts, vehicles, properties and machinery. These lease agreements have an average duration of one to five years excluding renewal options. No restrictions exist with respect to the lessee by virtue of these lease agreements.
Future payments of the Company´s operating leases are as follows:
|
Item |
|
12.31.2014 |
|
|
|
|
ThCh$ |
|
|
Maturity within one year |
|
5,377,854 |
|
|
Maturity between one and eight years |
|
2,220,125 |
|
|
Total |
|
7,597,979 |
|
Total expenses related to operating leases maintained by the Company as of December 31, 2014 and 2013 amounted to ThCh$ 4,915,222 and ThCh$ 5,261,246 respectively
18.1 Balances
The balances of provisions recorded by the Company at December 31, 2014 and 2013 are detailed as follows:
|
Description |
|
12.31.2014 |
|
12.31.2013 |
|
|
|
|
ThCh$ |
|
ThCh$ |
|
|
Litigation (1) |
|
77,812,345 |
|
77,812,294 |
|
|
Total |
|
77,812,345 |
|
77,812,294 |
|
|
|
|
|
|
|
|
|
Current |
|
365,832 |
|
269,906 |
|
|
Non-current |
|
77,446,513 |
|
77,542,388 |
|
|
Total |
|
77,812,345 |
|
77,812,294 |
|
(1) Corresponds to the provision for probable fiscal, labor and trade contingency losses based on the opinion of our legal advisors, according to the following breakdown:
|
Detail (see note 22.1) |
|
12.31.2014 |
|
12.31.2013 |
|
|
|
|
ThCh$ |
|
ThCh$ |
|
|
|
|
|
|
|
|
|
Tax Contingencies |
|
68,750,633 |
|
73,238,000 |
|
|
Labor Contingencies |
|
4,671,795 |
|
4,077,980 |
|
|
Civil Contingencies |
|
4,389,917 |
|
496,314 |
|
|
Total |
|
77,812,345 |
|
77,812,294 |
|
18.2 Movements
Movement of provisions is detailed as follows:
|
|
|
12.31.2014 |
|
12.31.2013 |
|
||||||||
|
Description |
|
Litigation |
|
Others |
|
Total |
|
Litigation |
|
Others |
|
Total |
|
|
|
|
TCh$ |
|
ThCh$ |
|
ThCh$ |
|
ThCh$ |
|
ThCh$ |
|
ThCh$ |
|
|
Opening Balance at January |
|
77,812,294 |
|
— |
|
77,812,294 |
|
6,821,165 |
|
195,103 |
|
7,016,268 |
|
|
|
|
|
|
|
|
|
|
|
|
|
|
|
|
|
Increase due to business combination |
|
— |
|
— |
|
— |
|
70,902,559 |
|
— |
|
70,902,559 |
|
|
Additional provisions |
|
— |
|
— |
|
— |
|
— |
|
— |
|
— |
|
|
Increase (decrease) in existing provisions |
|
1,064,399 |
|
— |
|
1,064,399 |
|
2,109,425 |
|
(195,103 |
) |
1,914,322 |
|
|
Payments |
|
(2,403,975 |
) |
— |
|
(2,403,975 |
) |
(2,201,350 |
) |
— |
|
(2,201,350 |
) |
|
Increase (decrease) due to foreign exchange differences |
|
1,339,627 |
|
— |
|
1,339,627 |
|
180,495 |
|
— |
|
180,495 |
|
|
Total |
|
77,812,345 |
|
— |
|
77,812,345 |
|
77,812,294 |
|
— |
|
77,812,294 |
|
Other current and non-current liabilities at each reporting period end are detailed as follows:
|
Description |
|
12.31.2014 |
|
12.31.2013 |
|
|
|
|
ThCh$ |
|
ThCh$ |
|
|
Minimum Dividend |
|
695,729 |
|
1,451,092 |
|
|
Dividend payable |
|
9,164,842 |
|
13,489,949 |
|
|
Employee remuneration payable |
|
14,563,449 |
|
8,749,678 |
|
|
Accrued vacations |
|
13,183,296 |
|
12,690,387 |
|
|
Other |
|
2,192,222 |
|
1,987,728 |
|
|
Total |
|
39,799,538 |
|
38,368,834 |
|
|
|
|
|
|
|
|
|
Current |
|
39,367,048 |
|
37,446,336 |
|
|
Non-current |
|
432,490 |
|
922,498 |
|
|
Total |
|
39,799,538 |
|
38,368,834 |
|
20.1 Paid-in capital
On August 21, 2013 saw the decline of paid capital as of right for not having alienated third 67 shares of Series A and 8,065 Series B shares, which the Company acquired in 2012, to shareholders exercised their right to retire when it was merged with Embotelladoras Coca-Cola Polar S.A, thus passing the capital paid a total of ThCh $ 270,759,299 to a total of ThCh$ 270,737,574.
The paid-in capital of the Company totaled ThCh$ 270,737,574 as of December 31, 2014 and 2013. The distribution and classification is detailed as follows:
20.1.1 Number of shares:
|
|
|
Number of shares subscribed |
|
Number of shares paid in |
|
Number of voting shares |
|
||||||||||||
|
Series |
|
2014 |
|
2013 |
|
2012 |
|
2014 |
|
2013 |
|
2012 |
|
2014 |
|
2013 |
|
2012 |
|
|
A |
|
473,289,301 |
|
473,289,301 |
|
473,289,368 |
|
473,289,301 |
|
473,289,301 |
|
473,289,368 |
|
473,289,301 |
|
473,289,301 |
|
473,289,368 |
|
|
B |
|
473,281,303 |
|
473,281,303 |
|
473,289,368 |
|
473,281,303 |
|
473,281,303 |
|
473,289,368 |
|
473,281,303 |
|
473,281,303 |
|
473,289,368 |
|
20.1.2 Equity :
|
|
|
Subscribed Capital |
|
Paid-in capital |
|
||||||||
|
Series |
|
2014 |
|
2013 |
|
2012 |
|
2014 |
|
2013 |
|
2012 |
|
|
|
|
ThCh$ |
|
ThCh$ |
|
ThCh$ |
|
ThCh$ |
|
ThCh$ |
|
ThCh$ |
|
|
A |
|
135,379,504 |
|
135,379,504 |
|
135,379,649.5 |
|
135,379,504 |
|
135,379,504 |
|
135,379,649.5 |
|
|
B |
|
135,358,070 |
|
135,358,070 |
|
135,379,649.5 |
|
135,358,070 |
|
135,358,070 |
|
135,379,649.5 |
|
|
Total |
|
270,737,574 |
|
270,737,574 |
|
270,759 ,299.0 |
|
270,737,574 |
|
270,737,574 |
|
270,759 ,299.0 |
|
20.1.3 Rights of each series :
· Series A : Elect 12 of the 14 Directors
· Series B : Receives an additonal 10% of dividends distributed to Series A and elects 2 of the 14 Directors.
20.2 Dividend policy
According to Chilean law, cash dividends must be paid equal to at least 30% of annual net profit, barring a unanimous vote by shareholders to the contrary. If there is no net profit in a given year, the Company will not be legally obligated to pay dividends from retained earnings. At the April 2014 Annual Shareholders Meeting, the shareholders authorised to pay out of the 2013 earnings one final dividend to complete 30% required by the law 18,046 and 2 additional dividends payments; one in May, 2014 and the other in August, 2014.
Pursuant to Circular Letter N° 1,945 of the Chilean Superintendence of Securities and Insurance dated September 29, 2009, the Company’s Board of Directors decided to maintain the initial adjustments from adopting IFRS as retained earnings for future distribution .
Retained earnings at the date of IFRS adoption amounted to ThCh$ 19,260,703, of which ThCh$ 4,059,927 have been realized at December 31, 2014 and are available for distribution as dividends in accordance with the following:
|
Description |
|
Event when amount
|
|
Amount of
|
|
Realized at
|
|
Amount of
|
|
|
|
|
|
|
|
|
|
|
|
|
|
Revaluation of assets |
|
Sale or impairment |
|
12,538,123 |
|
(2,524,449 |
) |
10,013,674 |
|
|
Foreign currency translation differences of investments in related companies |
|
Sale or impairment |
|
6,393,518 |
|
(1,481,482 |
) |
4,912,036 |
|
|
Full absorption cost accounting |
|
Sale of products |
|
813,885 |
|
(813,885 |
) |
— |
|
|
Post-employment benefits actuarial calculation |
|
Termination of employees |
|
929,560 |
|
(550,944 |
) |
378,616 |
|
|
Deferred taxes complementary accounts |
|
Amortization |
|
(1,414,383 |
) |
1,310,833 |
|
(103,550 |
) |
|
Total |
|
|
|
19,260,703 |
|
(4,059,927 |
) |
15,200,776 |
|
The dividends declared and paid during 2014 and 2013 are presented below:
|
Dividend payment date |
|
Dividend type |
|
Profits imputable to
|
|
Ch$ per
|
|
Ch$ per
|
|
||
|
2012 |
|
January |
|
Interim |
|
2011 |
|
8.50 |
|
9.35 |
|
|
2012 |
|
May |
|
Definitivo |
|
2011 |
|
10.97 |
|
12.067 |
|
|
2012 |
|
May |
|
Additional |
|
Retained Earnings |
|
24.30 |
|
26.73 |
|
|
2012 |
|
October |
|
Interim |
|
2012 |
|
12.24 |
|
13.46 |
|
|
2012 |
|
December |
|
Interim |
|
2012 |
|
24.48 |
|
26.93 |
|
|
2013 |
|
May |
|
Additional |
|
2012 |
|
12.30 |
|
13.53 |
|
|
2013 |
|
June |
|
Interim |
|
2013 |
|
12.30 |
|
13.53 |
|
|
2013 |
|
Novembre |
|
Additional |
|
2012 |
|
47.00 |
|
51.70 |
|
|
2013 |
|
December |
|
Interim |
|
2013 |
|
13.10 |
|
14.41 |
|
|
2014 |
|
May |
|
Additional |
|
Retained Earnings |
|
12.37 |
|
13.61 |
|
|
2014 |
|
May |
|
Final |
|
2013 |
|
1.46 |
|
1.61 |
|
|
2014 |
|
August |
|
Additional |
|
Retained Earnings |
|
12.37 |
|
13.61 |
|
|
2014 |
|
October |
|
Interim |
|
2014 |
|
13.10 |
|
14.41 |
|
|
2014 |
|
December (*) |
|
Interim |
|
2014 |
|
9.00 |
|
9.90 |
|
(*) As of December 31, 2014 this dividend is yet to be paid and in accordance to the agreements of the Board of Directors held during December 2014, will be available to shareholders beginning January 29, 2015.
20.3 Reserves
The balance of other reserves include the following :
|
Description |
|
12.31.2014 |
|
12.31.2013 |
|
12.31.2012 |
|
|
|
|
ThCh$ |
|
ThCh$ |
|
ThCh$ |
|
|
Polar acquisition |
|
421,701,520 |
|
421,701,520 |
|
421,701,520 |
|
|
Foreign currency translation reserves |
|
(53,285,698 |
) |
(81,527,711 |
) |
(63,555,545 |
) |
|
Cash flow hedge reserve |
|
6,125,615 |
|
2,258,144 |
|
— |
|
|
Reserve for employee benefit actuarial gains or losses |
|
(1,237,993 |
) |
(1,128,824 |
) |
— |
|
|
Legal and statutory reserves |
|
5,435,538 |
|
5,435,538 |
|
5,435,538 |
|
|
Total |
|
378,738,982 |
|
346,738,667 |
|
363,581,513 |
|
20.3.1 Polar acquisition
This amount corresponds to the fair value of the issuance of shares of Embotelladora Andina S.A., used to acquire Embotelladoras Coca-Cola Polar S.A..
20.3.2 Cash flow hedge reserve
They arise from the fair value of the existing derivative contracts that have been qualified for hedge accounting at the end of each financial period. When contracts are expired, these reserves are adjusted and recognized in the income statement in the corresponding period (see Note 21).
20.3.3 Reserve for employee benefit actuarial gains or losses
Corresponds to the restatement effect of employee benefits actuarial losses, that according to IAS 19 amendments must be carried to other comprehensive income.
20.3.4 Legal and statutory reserves
In accordance with Official Circular No. 456 issued by the Chilean Superintendence of Securities and Insurance, the legally required price-level restatement of paid-in capital for 2009 is presented as part of other equity reserves and is accounted for as a capitalization from Other Reserves with no impact on net income or retained earnings under IFRS. This amount totaled ThCh$ 5,435,538 at December 31, 2009.
20.3.5 Foreign currency translation reserves
This corresponds to the conversion of the financial statements of foreign subsidiaries whose functional currency is different from the presentation currency of the consolidated financial statements. Additionally exchange differences between accounts receivable kept by the companies in Chile with foreign subsidiaries are presented in this account, which have been treated as investment equivalents accounted for using the equity method. A breakdown of translation reserves is presented below :
|
Description |
|
12.31.2014 |
|
12.31.2013 |
|
12.31.2012 |
|
|
|
|
ThCh$ |
|
ThCh$ |
|
ThCh$ |
|
|
Brazil |
|
(30,861,504 |
) |
(36,125,708 |
) |
(26,905,052 |
) |
|
Argentina |
|
(56,273,418 |
) |
(46,087,935 |
) |
(29,448,998 |
) |
|
Paraguay |
|
41,657,749 |
|
8,586,782 |
|
24,248 |
|
|
Exchange rate differences in related companies |
|
(7,808,525 |
) |
(7,900,850 |
) |
(7,225,743 |
) |
|
Total |
|
(53,285,698 |
) |
(81,527,711 |
) |
(63,555,545 |
) |
The movement of this reserve for the fiscal periods ended December 31, 2014 and 2013 respectively is detailed as follows:
|
Description |
|
12.31.2014 |
|
12.31.2013 |
|
12.31.2012 |
|
|
|
|
ThCh$ |
|
ThCh$ |
|
ThCh$ |
|
|
Brazil |
|
5,264,204 |
|
(9,220,656 |
) |
(25,630,195 |
) |
|
Argentina |
|
(10,185,483 |
) |
(16,638,937 |
) |
(10,376,803 |
) |
|
Paraguay |
|
33,070,967 |
|
8,562,534 |
|
24,248 |
|
|
Exchange rate differences in related companies |
|
92,325 |
|
(675,107 |
) |
(5,112,916 |
) |
|
Total |
|
28,242,013 |
|
(17,972,166 |
) |
(41,095,666 |
) |
20.4 Non-controlling interests
This is the recognition of the portion of equity and income from subsidiaries that are owned by third parties, Details of this account at December 31, 2014 are as follow:
|
|
|
Non-controlling Interests |
|
||||||||||||||||
|
|
|
Percentage % |
|
Shareholders Equity |
|
Income |
|
||||||||||||
|
Details |
|
2014 |
|
2013 |
|
2012 |
|
2014 |
|
2013 |
|
2012 |
|
2014 |
|
2013 |
|
2012 |
|
|
|
|
|
|
|
|
|
|
ThCh$ |
|
ThCh$ |
|
ThCh$ |
|
ThCh$ |
|
ThCh$ |
|
ThCh$ |
|
|
Embotelladora del Atlántico S.A. |
|
0.0171 |
|
0.0171 |
|
0.0243 |
|
13,181 |
|
13,118 |
|
10,763 |
|
2,014 |
|
2,692 |
|
3,468 |
|
|
Andina Empaques Argentina S.A. |
|
0.0209 |
|
0.0209 |
|
0.0244 |
|
2,093 |
|
1,760 |
|
1,977 |
|
536 |
|
406 |
|
439 |
|
|
Paraguay Refrescos S.A. |
|
2.1697 |
|
2.1697 |
|
2.1697 |
|
5,996,843 |
|
5,051,217 |
|
4,697,403 |
|
400,771 |
|
287,112 |
|
89,012 |
|
|
Inversiones Los Andes Ltda. |
|
|
|
0.0001 |
|
0.0001 |
|
— |
|
51 |
|
53 |
|
— |
|
— |
|
1 |
|
|
Transportes Polar S.A. |
|
|
|
— |
|
0.0001 |
|
— |
|
— |
|
6 |
|
— |
|
— |
|
— |
|
|
Vital S.A. |
|
35.0000 |
|
35.0000 |
|
35.0000 |
|
8,910,290 |
|
9,216,505 |
|
8,811,764 |
|
(286,878 |
) |
502,397 |
|
130,874 |
|
|
Vital Aguas S.A. |
|
33.5000 |
|
33.5000 |
|
33.5000 |
|
1,948,634 |
|
1,913,632 |
|
1,807,913 |
|
21,517 |
|
115,774 |
|
81,651 |
|
|
Envases Central S.A. |
|
40.7300 |
|
40.7300 |
|
40.7300 |
|
4,832,197 |
|
4,567,226 |
|
4,111,258 |
|
179,243 |
|
376,163 |
|
326,764 |
|
|
Andina Inversiones Societarias S.A. |
|
|
|
0.0001 |
|
0.0001 |
|
— |
|
37 |
|
35 |
|
— |
|
2 |
|
2 |
|
|
Total |
|
|
|
|
|
|
|
21,703,238 |
|
20,763,546 |
|
19,441,172 |
|
317,203 |
|
1,284,546 |
|
632,211 |
|
20.5 Earnings per share
The basic earnings per share presented in the statement of comprehensive income is calculated as the quotient between income for the period and the average number of shares outstanding during the same period.
The earnings per share used to calculate basic and diluted earnings per share is detailed as follows:
|
|
|
12.31.2014 |
|
||||
|
Earnings per share |
|
SERIES A |
|
SERIES B |
|
TOTAL |
|
|
Earnings attributable to shareholders (ThCh$) |
|
24,702,640 |
|
27,172,444 |
|
51,875,084 |
|
|
Average weighted number of shares |
|
473,289,301 |
|
473,281,303 |
|
946,570,604 |
|
|
Earnings per basic and diluted share (in Chilean pesos) |
|
52.19 |
|
57.41 |
|
54.80 |
|
|
|
|
12.31.2013 |
|
||||
|
Earnings per share |
|
SERIES A |
|
SERIES B |
|
TOTAL |
|
|
Earnings attributable to shareholders (ThCh$) |
|
42,373,551 |
|
46,609,127 |
|
88,982,678 |
|
|
Average weighted number of shares |
|
473,289,301 |
|
473,281,303 |
|
946,570,604 |
|
|
Earnings per basic and diluted share (in Chilean pesos) |
|
89.53 |
|
98.48 |
|
94.01 |
|
|
|
|
12.31.2012 |
|
||||
|
Earnings per share |
|
SERIES A |
|
SERIES B |
|
TOTAL |
|
|
Earnings attributable to shareholders (ThCh$) |
|
41,732,721 |
|
45,904,240 |
|
87,636,961 |
|
|
Average weighted number of shares |
|
400,809,380 |
|
400,809,380 |
|
801,618,760 |
|
|
Earnings per basic and diluted share (in Chilean pesos) |
|
104.12 |
|
114.53 |
|
109.32 |
|
The company held the following derivative instruments at December 31, 2014 and 2013:
21.1 Derivatives accounted for as cash flow hedges:
a) Cross Currency Swap Itau Credit.
As of December 31, 2014, the Company maintained derivative contracts to ensure U.S. dollar denominated bank liabilities in Brazil amounting to ThUS$ 53,574, to convert them to liabilities in Brazilian Real. The valuation of these contracts was performed at their fair values, yielding a receivable value of ThCh$ 8,459,531 at December 31, 2014 which is presented in other financial assets non-current. In addition, the excess value of the derivative above the hedged items of ThCh$ 639,447 (ThCh$ 1,371,220 in 2013) has been recognized within other equity reserves as of December 31, 2014. The amount of income recognized in results for financial liabilities in US Dollars that were neutralized by the recycling of derivative contracts from equity amounted to ThCh$ 1,632,629 at December 31, 2014 (ThCh$ 3,128,270 at December 31, 2013).
b) Cross Currency Swaps associated with US Bonds
At December 31, 2014, the Company entered into cross currency swap derivative contracts to convert US Dollar public bond obligations of US$ 570 million into UF and Real liabilities to hedge the Company’s exposure to variations in foreign exchange rates. These swap contracts have the same terms of the underlying bond obligation and expire in 2023. The fair value of these derivatives resulted in an asset of ThCh$ 42,547,508 at December 31, 2014, which is presented as other financial assets non-current. In addition excess value of the derivative above the hedged items of ThCh$ 5,861,704 has been recognized within other equity reserves as of December 31, 2014. The ineffective portion amount of ThCh$ 5,995,530 (ThCh$ 559,875 at December 31, 2013) associated with this hedge was recorded in other gains and losses.
The amount of net earnings recognized in income for financial liabilities in U.S. dollars and those declared as effective that were neutralized by the recycling of capital derivative contracts amounted to ThCh$ 16,427,083 (ThCh$ 1,421,253 in 2013).
21.2 Derivatives accounted for as financial assets and liabilities at fair value through profit and loss :
In 2012, 2013 and 2014, the Company entered into foreign currency forward contracts to hedge its exposure to expected future raw materials purchases in US Dollars during the years 2013,2014 and 2015. The total amount of outstanding forward contracts were US$ 125.1 million at December 31, 2014 (US$ 103.3 million at December 31, 2013). These agreements were recorded at fair value, resulting in a net gains of ThCh$ 196,009 for the period ended December 31, 2013 (net gains of ThCh$ 1,711,816 at December 31, 2013). The fair value of these derivative contracts is an asset of ThCh$ 2,871,333 and liability of ThCh$ 4,431,484 at December 31, 2014 (assets of ThCh$ 1,949,958 and liabilities of ThCh$ 1,985,954 at December 31, 2013). The agreements that ensure future flows of foreign currency have been designated as hedge beginning August 1, 2014, following hedge accounting as of that date, a t December 31, 2014, as a result of this methodology the Company registered a net balance of ThCh$ 375,536 as a capital decrease associated with the fair value of existing contracts . Futures contracts that ensure prices of future materials have not been designated as hedge agreements, whereby its effects on variations in fair value are accounted for directly under statements of income in the “other gains and losses” account.
These derivative contracts do not qualify for hedge accounting and are accounted for as investment contracts with the changes in fair value recorded directly in the income statement each reporting period.
Fair value hierarchy
The Company had total assets related to its foreign exchange derivative contracts of ThCh$ 53,878,373 and liabilities to ThCh$ 4,431,484 at December 31, 2014 (assets for ThCh$ 11,264,459 and liabilities for ThCh$ 1,985,954 at December 31, 2013). T hose contracts covering existing items have been classified in the same category of hedged, the net amount of derivative contracts by concepts covering forecasted items have been classified in financial assets and financial liabilities , All the derivative contracts are carried at fair value in the consolidated statement of financial position , The Company uses the following hierarchy for determining and disclosing the fair value of financial instruments by valuation technique:
Level 1 : quoted (unadjusted) prices in active markets for identical assets or liabilities
Level 2: Inputs other than quoted prices included in level 1 that are observable for the assets and liabilities, either directly (that is, as prices) or indirectly (that is, derived from prices)
Level 3: Inputs for assets and liabilities that are not based on observable market data.
During the period ended December 31, 2014, there were no transfers of items between fair value measurement categories; all of which were valued during the period using level 2 .
|
|
|
Fair Value Measurements at December, 31 2014 |
|
|
|
||||
|
|
|
Quoted prices in active
|
|
Observable
|
|
Unobservable
|
|
|
|
|
|
|
(Level 1) |
|
(Level 2) |
|
(Level 3) |
|
Total |
|
|
|
|
ThCh$ |
|
ThCh$ |
|
ThCh$ |
|
ThCh$ |
|
|
Assets |
|
|
|
|
|
|
|
|
|
|
Current assets |
|
|
|
|
|
|
|
|
|
|
Other current financial assets |
|
— |
|
2,871,333 |
|
— |
|
2,871,333 |
|
|
Other non-current financial assets |
|
— |
|
51,007,240 |
|
— |
|
51,007,240 |
|
|
Total assets |
|
— |
|
53,878,573 |
|
— |
|
53,878,573 |
|
|
Liabilities |
|
|
|
|
|
|
|
|
|
|
Current liabilities |
|
|
|
|
|
|
|
|
|
|
Other current financial liabilities |
|
— |
|
4,431,484 |
|
— |
|
4,431,484 |
|
|
Total liabilities |
|
— |
|
4,431,484 |
|
— |
|
4,431,484 |
|
|
|
|
Fair Value Measurements at December, 31 2013 |
|
|
|
||||
|
|
|
Quoted prices in active
|
|
Observable
|
|
Unobservable
|
|
|
|
|
|
|
(Level 1) |
|
(Level 2) |
|
(Level 3) |
|
|
|
|
|
|
ThCh$ |
|
ThCh$ |
|
ThCh$ |
|
ThCh$ |
|
|
Assets |
|
|
|
|
|
|
|
|
|
|
Current assets |
|
|
|
|
|
|
|
|
|
|
Other current financial assets |
|
— |
|
3,342,172 |
|
— |
|
3,342,172 |
|
|
Other non-current financial assets |
|
— |
|
7,922,287 |
|
— |
|
7,922,287 |
|
|
Total assets |
|
— |
|
11,264,459 |
|
— |
|
11,264,459 |
|
|
Liabilities |
|
|
|
|
|
|
|
|
|
|
Current liabilities |
|
|
|
|
|
|
|
|
|
|
Other current financial liabilities |
|
— |
|
1,037,473 |
|
— |
|
1,037,473 |
|
|
Other non-current financial liabilities |
|
— |
|
948,481 |
|
— |
|
948,481 |
|
|
Total liabilities |
|
— |
|
1,985,954 |
|
— |
|
1,985,954 |
|
22.1 Lawsuits and other legal actions:
In the opinion of the Company’s legal counsel, the Parent Company and its subsidiaries do not face judicial or extra-judicial contingencies that might result in material or significant losses or gains, except for the following:
1) Embotelladora del Atlántico S.A. faces labor, tax, civil and trade lawsuits. Accounting provisions have been made for the contingency of a probable loss because of these lawsuits, totaling ThCh$ 1,430,150. Management considers it unlikely that non-provisioned contingencies will affect the Company’s income and equity, based on the opinion of its legal counsel. Additionally Embotelladora del Atlántico S.A. maintains time deposits for an amount of ThCh$ 1,055,127 to guaranty judicial liabilities.
2) Rio de Janeiro Refrescos Ltda. faces labor, tax, civil and trade lawsuits. Accounting provisions have been made for the contingency of a probable loss because of these lawsuits, totaling ThCh$ 76,016,363. Management considers it unlikely that non-provisioned contingencies will affect the Company’s income and equity, based on the opinion of its legal counsel. As it is customary in Brazil, Rio de Janeiro Refrescos Ltda. maintains judicial deposits and assets given in pledge to secure the compliance of certain processes, irrespective of whether these have been classified as a possible, probable or remote. The amounts deposited or pledged as a legal guarantees as of Decemberr 31, 2014 and 2013 amounted to ThCh$ 113,574,536 and ThCh$ 114,126,292 respectively
a) Tax contingencies resulting from credits on tax on industrialized products (IPI).
Rio de Janeiro Refrescos is a party to a series of proceedings under way, in which the Brazilian federal tax authorities demand payment of value-added tax on industrialized products ( Imposto sobre Produtos Industrializados , or IPI) allegedly owed by ex-Companhia de Bebidas Ipiranga totaling approximately R$ 1,379,707,155.
The Company rejects the position of the Brazilian tax authority in these procedures, and considers that Companhia de Bebidas Ipiranga was entitled to claim IPI tax credits in connection with purchases of certain exempt raw materials from suppliers located in the Manaus free trade zone .
Based on the opinion of its advisers, and judicial outcomes to date, Management estimates that these procedures do not represent probable losses, and has net recorded a provision on these matters.
Notwithstanding the above, the accounting standards of financial information related to business combination in terms of distribution of the purchase price, establish that contingencies must be valued one by one according to their probability of occurrence and discounted to fair value from the date on which it is deemed the loss can be generated. According to this criteria, an initial provision has been made in the business combination accounting for an amount of R$ 200.6 million equivalent to ThCh$ 44,939,519. (ThCh$ 45,822,657 in currency of December 31, 2014)
b) Tax contingencies on ICMS and IPI causes .
They refer mainly to tax settlements issued by advance appropriation of ICMS credits on fixed assets, payment of the replacement of ICMS tax to the operations, untimely IPI credits calculated on bonuses, among other claims .
The Company does not consider that these judgments will result in significant losses, given that their loss is considered unlikely. However, the accounting standards of financial information related to business combination in terms of distribution of the purchase price, establish contingencies must be valued one by one according to their probability of occurrence and discounted to fair value from the date on which it is deemed that the loss can be generated. According to this criteria, an initial provision has been made in the business combination accounting for an amount of R$ 126.3 million equivalent to ThCh$ 28,298,481 . (ThCh$ 28,850,456 in currency of December 31, 2014)
3) Embotelladora Andina S.A., faces labor, tax, civil and trade lawsuits. Accounting provisions have been made for the contingency of a probable loss because of these lawsuits, totaling ThCh$ 365,832. Management considers it is unlikely that non-provisioned contingencies will affect income and equity of the Company, in the opinion of its legal advisors
22.2 Direct guarantees and restricted assets:
Guarantees and restricted December 31, 2014 and 2013 are detailed as follows:
Guarantees that compromise assets including in the financial statements:
|
Provided by |
|
Committed assets |
|
Carrying at |
|
Balance pending payment on the
|
|
Date of guarantee release |
|
||||||||||
|
Guarantee in favor of |
|
Name |
|
Relationship |
|
Guarantee |
|
Type |
|
12.31.2014 |
|
12.31.2014 |
|
12.31.2013 |
|
2014 |
|
2015 |
|
|
|
|
|
|
|
|
|
|
|
|
ThCh$ |
|
ThCh$ |
|
ThCh$ |
|
ThCh$ |
|
ThCh$ |
|
|
Diverse suppliers |
|
Embotelladora Andina S.A. |
|
Parent Company |
|
Cash and cash equivalents |
|
Other debtors |
|
— |
|
— |
|
21,172 |
|
— |
|
— |
|
|
Bodega San Francisco |
|
Embotelladora Andina S.A. |
|
Parent Company |
|
Cash and cash equivalents |
|
Cash and cash equivalents |
|
6,788 |
|
6,788 |
|
6,788 |
|
— |
|
6,788 |
|
|
Gas licuado Lipigas S.A. |
|
Embotelladora Andina S.A. |
|
Parent Company |
|
Cash and cash equivalents |
|
Cash and cash equivalents |
|
1,140 |
|
1,140 |
|
1,140 |
|
— |
|
1,140 |
|
|
Nazira Tala |
|
Embotelladora Andina S.A. |
|
Parent Company |
|
Cash and cash equivalents |
|
Cash and cash equivalents |
|
3,416 |
|
3,416 |
|
3,416 |
|
— |
|
3,416 |
|
|
Nazira Tala |
|
Embotelladora Andina S.A. |
|
Parent Company |
|
Cash and cash equivalents |
|
Cash and cash equivalents |
|
3,508 |
|
3,508 |
|
3,508 |
|
— |
|
3,508 |
|
|
Inmob. e Invers. Supetar Ltda. |
|
Transportes Polar S.A. |
|
Subsidiary |
|
Cash and cash equivalents |
|
Cash and cash equivalents |
|
4,579 |
|
4,579 |
|
3,216 |
|
— |
|
4,579 |
|
|
María Lobos Jamet |
|
Transportes Polar S.A. |
|
Subsidiary |
|
Cash and cash equivalents |
|
Cash and cash equivalents |
|
2,565 |
|
2,565 |
|
1,000 |
|
— |
|
2,565 |
|
|
Reclamantes ações trabalhistas |
|
Rio de Janeiro Refrescos Ltda. |
|
Subsidiary |
|
Judicial deposit |
|
Other non-current, non-financial assets |
|
15,017,759 |
|
15,017,579 |
|
17,537,735 |
|
— |
|
15,07,759 |
|
|
Diversos |
|
Rio de Janeiro Refrescos Ltda. |
|
Subsidiary |
|
Property, plant and equipment |
|
Property, plant and equipment |
|
15,817,942 |
|
15,817,942 |
|
15,554,926 |
|
— |
|
15,817,942 |
|
|
Instituciones Gubernamentales |
|
Rio de Janeiro Refrescos Ltda. |
|
Subsidiary |
|
Judicial deposit |
|
Other non-current, non-financial assets |
|
6,944,052 |
|
6,944,052 |
|
6,550,967 |
|
— |
|
6,944,052 |
|
|
Instituciones Gubernamentales |
|
Rio de Janeiro Refrescos Ltda. |
|
Subsidiary |
|
Property, plant and equipment |
|
Property, plant and equipment |
|
75,794,783 |
|
75,794,783 |
|
74,306,829 |
|
— |
|
75,794,783 |
|
|
Distribuidora Baraldo S.H. |
|
Embotelladora del Atlántico S.A. |
|
Subsidiary |
|
Cash and cash equivalents |
|
Other non-current, non-financial assets |
|
1,419 |
|
1,419 |
|
1,741 |
|
— |
|
1,419 |
|
|
Acuña Gomez |
|
Embotelladora del Atlántico S.A. |
|
Subsidiary |
|
Cash and cash equivalents |
|
Other non-current, non-financial assets |
|
2,129 |
|
2,129 |
|
2,611 |
|
— |
|
2,129 |
|
|
Municipalidad Gral. Alvear |
|
Embotelladora del Atlántico S.A. |
|
Subsidiary |
|
Cash and cash equivalents |
|
Other non-current, non-financial assets |
|
9,170 |
|
9,170 |
|
11,249 |
|
— |
|
9,170 |
|
|
Municipalidad San Martin Mza |
|
Embotelladora del Atlántico S.A. |
|
Subsidiary |
|
Cash and cash equivalents |
|
Other non-current, non-financial assets |
|
25,544 |
|
25,544 |
|
31,334 |
|
— |
|
25,544 |
|
|
Nicanor López |
|
Embotelladora del Atlántico S.A. |
|
Subsidiary |
|
Cash and cash equivalents |
|
Other non-current, non-financial assets |
|
1,522 |
|
1,522 |
|
1,867 |
|
— |
|
1,522 |
|
|
Municipalidad Bariloche |
|
Embotelladora del Atlántico S.A. |
|
Subsidiary |
|
Cash and cash equivalents |
|
Other non-current, non-financial assets |
|
385,720 |
|
385,720 |
|
473,149 |
|
— |
|
385,720 |
|
|
Municipalidad San Antonio Oeste |
|
Embotelladora del Atlántico S.A. |
|
Subsidiary |
|
Cash and cash equivalents |
|
Other non-current, non-financial assets |
|
3,017 |
|
3,017 |
|
3,701 |
|
— |
|
3,017 |
|
|
Municipalidad Chivilcoy |
|
Embotelladora del Atlántico S.A. |
|
Subsidiary |
|
Cash and cash equivalents |
|
Other non-current, non-financial assets |
|
979,627 |
|
979,627 |
|
10,828 |
|
— |
|
979,627 |
|
|
Municipalidad Carlos Casares |
|
Embotelladora del Atlántico S.A. |
|
Subsidiary |
|
Cash and cash equivalents |
|
Other non-current, non-financial assets |
|
6,334 |
|
6,334 |
|
1,201,674 |
|
— |
|
6,334 |
|
|
Granada Maximiliano |
|
Embotelladora del Atlántico S.A. |
|
Subsidiary |
|
Cash and cash equivalents |
|
Other non-current, non-financial assets |
|
12,772 |
|
12,772 |
|
— |
|
— |
|
12,772 |
|
|
CICSA |
|
Embotelladora del Atlántico S.A. |
|
Subsidiary |
|
Guarantees CICSA for packaging |
|
Other current financial assets |
|
39,524 |
|
39,524 |
|
— |
|
— |
|
39,524 |
|
|
Locadores varios |
|
Embotelladora del Atlántico S.A. |
|
Subsidiary |
|
Guarantee deposit for rentals |
|
Other current financial assets |
|
10,710 |
|
10,710 |
|
— |
|
— |
|
10,710 |
|
|
Aduana de Ezeiza |
|
Embotelladora del Atlántico S.A. |
|
Subsidiary |
|
Import machinery |
|
Other current financial assets |
|
9,924 |
|
9,924 |
|
— |
|
— |
|
9,924 |
|
|
Municipalidad de Junin |
|
Embotelladora del Atlántico S.A. |
|
Subsidiary |
|
Cash and cash equivalents |
|
Other non-current, non-financial assets |
|
8,300 |
|
8,300 |
|
— |
|
— |
|
8,300 |
|
|
Almada Jorge |
|
Embotelladora del Atlántico S.A. |
|
Subsidiary |
|
Cash and cash equivalents |
|
Other non-current, non-financial assets |
|
17,332 |
|
17,332 |
|
— |
|
— |
|
17,332 |
|
|
Banco Santander Rio |
|
Embotelladora del Atlántico S.A. |
|
Subsidiary |
|
Cash and cash equivalents |
|
Other current financial assets |
|
943,434 |
|
943,434 |
|
— |
|
— |
|
943,434 |
|
|
Banco Galicia |
|
Embotelladora del Atlántico S.A. |
|
Subsidiary |
|
Cash and cash equivalents |
|
Other current financial assets |
|
1,036,261 |
|
1,036,261 |
|
— |
|
— |
|
1,036,261 |
|
|
Banco HSBC |
|
Embotelladora del Atlántico S.A. |
|
Subsidiary |
|
Cash and cash equivalents |
|
Other current financial assets |
|
148,666 |
|
148,666 |
|
— |
|
— |
|
148,666 |
|
|
Banco Industrial |
|
Embotelladora del Atlántico S.A. |
|
Subsidiary |
|
Cash and cash equivalents |
|
Other current financial assets |
|
813,969 |
|
813,969 |
|
— |
|
— |
|
813,969 |
|
|
Banco ICBC |
|
Embotelladora del Atlántico S.A. |
|
Subsidiary |
|
Cash and cash equivalents |
|
Other current financial assets |
|
160,501 |
|
160,501 |
|
— |
|
— |
|
160,501 |
|
|
Rofex |
|
Embotelladora del Atlántico S.A. |
|
Subsidiary |
|
Cash and cash equivalents |
|
Other current financial assets |
|
1,729,820 |
|
1,729,820 |
|
— |
|
— |
|
1,729,820 |
|
|
|
|
|
|
|
|
|
|
|
|
119,942,227 |
|
|
|
|
|
|
|
|
|
Guarantees provided without obligation of assets included in the financial statements:
|
Provided by |
|
Committed assets |
|
Balance pending payment on the
|
|
Date of guarantee
|
|
||||||||||
|
Guarantee in favor of |
|
Name |
|
Relationship |
|
Guarantee |
|
Type |
|
12.31.2014 |
|
12.31.2013 |
|
2014 |
|
2015 |
|
|
|
|
|
|
|
|
|
|
|
|
ThCh$ |
|
ThCh$ |
|
ThCh$ |
|
ThCh$ |
|
|
Linde Gas Chile |
|
Embotelladora Andina S.A. |
|
Parent Company |
|
Guarantee insurance |
|
Guarantee insurance |
|
546,075 |
|
472,149 |
|
— |
|
546,075 |
|
|
Central de Restaurantes Aramark Ltda. |
|
Embotelladora Andina S.A. |
|
Parent Company |
|
Guarantee insurance |
|
Guarantee insurance |
|
— |
|
243,515 |
|
— |
|
— |
|
|
Echeverría, Izquierdo Ingeniería y Construcción, |
|
Embotelladora Andina S.A. |
|
Parent Company |
|
Guarantee insurance |
|
Guarantee insurance |
|
515,348 |
|
487,776 |
|
— |
|
515,348 |
|
|
Rabdstad Chile S.A. |
|
Embotelladora Andina S.A. |
|
Parent Company |
|
Guarantee insurance |
|
Guarantee insurance |
|
640,000 |
|
— |
|
640,000 |
|
— |
|
|
Vigaflow S.A. |
|
Embotelladora Andina S.A. |
|
Parent Company |
|
Guarantee insurance |
|
Guarantee insurance |
|
— |
|
472,149 |
|
— |
|
— |
|
|
Transpores Vic Ben |
|
Embotelladora Andina S.A. |
|
Parent Company |
|
Guarantee insurance |
|
Guarantee insurance |
|
— |
|
472,149 |
|
— |
|
— |
|
|
Processos trabalhistas |
|
Rio de Janeiro Refrescos Ltda. |
|
Subsidiary |
|
Guarantee insurance |
|
Guarantee insurance |
|
567,285 |
|
556,149 |
|
— |
|
567,285 |
|
|
Processos administrativos |
|
Rio de Janeiro Refrescos Ltda. |
|
Subsidiary |
|
Guarantee insurance |
|
Guarantee insurance |
|
2,041,360 |
|
2,001,285 |
|
— |
|
2,041,360 |
|
|
Governo Federal |
|
Rio de Janeiro Refrescos Ltda. |
|
Subsidiary |
|
Guarantee insurance |
|
Guarantee insurance |
|
86,750 |
|
85,047 |
|
— |
|
86,750 |
|
|
Governo Estadual |
|
Rio de Janeiro Refrescos Ltda. |
|
Subsidiary |
|
Guarantee insurance |
|
Guarantee insurance |
|
9,632,911 |
|
9,174,320 |
|
— |
|
9,632,911 |
|
|
Others |
|
Rio de Janeiro Refrescos Ltda. |
|
Subsidiary |
|
Guarantee insurance |
|
Guarantee insurance |
|
1,246,117 |
|
204,520 |
|
— |
|
1,246,117 |
|
The Company’s businesses are exposed to a variety of financial and market risks (including foreign exchange risk, interest rate risk and price risk). The Company’s global risk management program focuses on the uncertainty of financial markets and seeks to minimize potential adverse effects on the performance of the Company. The Company uses derivatives to hedge certain risks. Below is a description of the primary policies established by the Company to manage financial risks.
Interest Rate Risk
As of December 31, 2014, the Company carried all of its debt liabilities at a fixed rate, variability factors are given by the currencies in which they are set: UF and US$ (are variable). As a result, the risk of fluctuations in market interest rates on the Company’s cash flows is low.
The Company’s greatest indebtedness corresponds to bonds of own issuance; the portion of bonds issued in the local market are denominated in Unidades de Fomento, indexed to inflation in Chile (the Company’s sales are correlated with UF variations). If inflation in Chile would have generated a UF variation of 6.65% during the period between January 1 and December 31, 2014 (instead of 5.65%, excluding changes in the level of sales), the Company’s income would have been lower by ThCh$ 3,159,754 .
There are also bonds of own issuance amounting to US$ 575 million, which are hedged against the fluctuation of the U.S. dollar with cross currency swap agreements.
Exchange Rate Risk
The company is exposed to three types of risk caused by exchange rate volatility:
a) Exposure of foreign investment: this risk originates from the translation of net investment from the functional currency of each country (Brazilian Real, Paraguayan Guaraní, Argentine Peso) to the Parent Company’s reporting currency (Chilean Peso). Appreciation or devaluation of the Chilean Peso with respect to each of the functional currencies of each country, originates decreases and increases in equity, respectively. The Company does not hedge this risk .
a.1 Investment in Argentina
As of December 31, 2014, the Company maintains a net investment of ThCh$ 85,655,296 in Argentina, composed by the recognition of assets amounting to ThCh$226,749,411 and liabilities amounting to ThCh$ 141,094,115. These investments reported 25.7% of the Company’s consolidated sales revenues.
As of December 31, 2014, the Argentine peso devalued 11.8% with respect to the Chilean peso
There are currently exchange restrictions in Argentina and a parallel foreign exchange market with a higher exchange rate than the official exchange rate.
If the official exchange rate in Argentina devalued reaching the informal rate of $ 13.7 (42.7% devaluation), the Company would have lower income from the operations in Argentina of ThCh$ 4,149,218, and a decrease in equity of ThCh$ 26,340,652, originated by lower asset recognition of ThCh$ 67,573,563 and lower liabilities recognition of ThCh$ 41,232,911.
a.2 Investment in Brazil
As of December 31, 2014, the Company maintains a net investment of ThCh$ 278,292,133 in Brazil, composed by the recognition of assets amounting to ThCh$ 797,796,613 and liabilities amounting to ThCh$ 519,504,480. These investments reported 39.8% of the Company’s consolidated sales revenues.
As of December 31, 2014, the Brazilian Real apreciated 2.0% with respect to the Chilean peso.
If the exchange rate of the Brazilian Real apreciated an additional 5% with respect to the Chilean Peso, the Company would have greater income from the operation in Brazil of ThCh$ 3,024,991, and a increase in equity of ThCh$ 13,012,915, originated by higher asset recognition of ThCh$ 37,734,122 and a higher liabilities recognition of ThCh$ 24,721,207.
a.3 Investment in Paraguay
As of December 31, 2014, the Company maintains a net investment of ThCh$ 276,385,512 in Paraguay, composed by the recognition of assets amounting to ThCh$ 320,080,134 and liabilities amounting to ThCh$ 43,694,622. These investments reported 7.2% of the Company’s consolidated sales revenues.
As of December 31, 2014, the Paraguayan Guarani appreciated 14.6% with respect to the Chilean peso.
If the exchange rate of the Paraguayan Guaraní apreciated an additional 5% with respect to the Chilean Peso, the Company would have greater income from the operations in Paraguay of ThCh$ 4,514,068, and an increase in equity of ThCh$ 11,805,902, originated by higher asset recognition of ThCh$ 13,952,118 and greater liabilities recognition of ThCh$ 2,146,216.
b) Net exposure of assets and liabilities in foreign currency: the risk stems mostly from carrying liabilities in US dollar, so the volatility of the US dollar with respect to the functional currency of each country generates a variation in the valuation of these obligations, with consequent effect on results.
As of December 31, 2014, the Company maintains a net liability position totaling ThCh$ 380,173,635, basically composed of obligations with the public and bank liabilities for ThCh$ 385,921,380 offset partially by financial assets denominated in dollars for ThCh$ 5,747,745.
Of total financial liabilities denominated in US dollars, ThCh$ 32,679,114 come from debts taken by the Brazilian operation and are exposed to the volatility of the Brazilian Real against the US dollar. On the other and ThCh$ 353,242,266 of US dollar liabilities correspond to Chilean operations, which are exposed to the volatility of the Chilean Peso against the US dollar
In order to protect the Company from the effects on income resulting from the volatility of the Brazilian Real and the Chilean Peso against the U.S. dollar, the Company maintains derivative contracts (cross currency swaps) to cover almost 100% of US dollar-denominated financial liabilities.
By designating such contracts as hedging derivatives, the effects on income for variations in the Chilean Peso and the Brazilian Real against the US dollar, are mitigated annulling its exposure to exchange rates.
The Company’s net exposure as of December 31, 2014 to foreign currency over existing assets and liabilities, discounting the derivatives contracts, is an asset position of ThCh$ 2,713,995.
c) Assets purchased or indexed to foreign currency exposure: this risk originates from purchases of raw materials and investments in property, plant and equipment, whose values are expressed in a currency other than the functional currency of the subsidiary. Changes in the value of costs or investments can be generated through time, depending on the volatility of the exchange rate.
Annual purchases of raw materials denominated or indexed in U.S. dollars, amounts to 19% of our cost of sales or approximately US$ 340 million.
In addition, and depending on market conditions, the Company enter into foreign currency derivatives contracts to lessen the effect of the exchange rate over cash expenditures expressed in US dollar, which mainly correspond to payment to suppliers of raw materials and fixed assets. US$ 111.7 million for future purchases have been hedged as of December 31, 2014.
According to the percentage of purchases of raw materials which are carried out or indexed to U.S. dollars, a possible change in the value of the US dollar by 5% in the four countries where the Company operates, and excluding derivatives contracts taken to mitigate the effect of currency volatility, keeping everything constant, would lead to a lower accumulated result amounting to ThCh$ 4,410,105 as of December 31, 2014. Currently, the Company has contracts to hedge this effect in Argentina, Brazil and Chile.
d) Commodities risk
The Company is subject to a risk of price fluctuations in the international markets for sugar, aluminum and PET resin, which are inputs required to produce beverages and, as a whole, account for 35% to 40% of operating costs. Procurement and anticipated purchase contracts are made frequently to minimize and/or stabilize this risk. When allowed by market conditions commodity hedges have also been used in the past. The possible effects that exist in the present consolidated financial statements of a 5% eventual rise in prices of its main raw materials, would be a reduction in our accumulated results for the period ended December 31, 2014 of approximately ThCh$ 9,455,581. To minimize the risk often supply contracts and anticipated purchases are made when market conditions warrant. Also been used commodity derivative instruments by $ 13.4 million.
e) Liquidity risk
The products we sell are mainly paid for in cash and short term credit, therefore the Company´s main source of financing comes from the cash flow of our operations. This cash flow has historically been sufficient to cover the investments necessary for the normal course of our business, as well as the distribution of dividends approved by the General Shareholders’ Meeting. Should additional funding be required for future geographic expansion or other needs, the main sources of financing to consider are: (i) debt offerings in the Chilean and foreign capital markets (ii) borrowings from commercial banks, both internationally and in the local markets where the Company operates; and (iii) public equity offerings
The following table presents our contractual and commercial obligations as of December 31, 2014:
|
|
|
Maturity |
|
||||||||
|
Item |
|
1 year |
|
More 1 year
|
|
More 2 years
|
|
More 3 years
|
|
More 4 years |
|
|
|
|
ThCh$ |
|
ThCh$ |
|
ThCh$ |
|
ThCh$ |
|
ThCh$ |
|
|
Bank debt |
|
44,876,229 |
|
27,891,067 |
|
19,351,077 |
|
9,309,688 |
|
— |
|
|
Bonds payable |
|
41,746,599 |
|
41,563,261 |
|
47,483,291 |
|
40,975,386 |
|
820,165,956 |
|
|
Operating lease obligations |
|
8,330,983 |
|
1,686,336 |
|
1,212,946 |
|
1,374,541 |
|
1,175,175 |
|
|
Purchase obligations |
|
194,471,800 |
|
41,201,103 |
|
11,656,865 |
|
113,525,381 |
|
353,997 |
|
|
Total |
|
289,425,611 |
|
112,341,767 |
|
79,704,179 |
|
165,184,996 |
|
821,695,128 |
|
Other expenses by nature are:
|
|
|
01.01.2014 |
|
01.01.2013 |
|
01.01.2012 |
|
|
Details |
|
12.31.2014 |
|
12.31.2013 |
|
12.31.2012 |
|
|
|
|
ThCh$ |
|
ThCh$ |
|
ThCh$ |
|
|
Direct production costs |
|
841,172,891 |
|
709,805,149 |
|
553,318,289 |
|
|
Payroll and employee benefits |
|
264,644,018 |
|
214,183,604 |
|
155,265,412 |
|
|
Transportation and distribution |
|
172,927,314 |
|
153,775,697 |
|
115,231,690 |
|
|
Marketing |
|
48,109,609 |
|
45,729,107 |
|
38,667,202 |
|
|
Depreciation and amortization |
|
102,966,925 |
|
83,336,884 |
|
53,824,138 |
|
|
Repairs and maintenance |
|
34,374,318 |
|
29,869,212 |
|
13,976,614 |
|
|
Other expenses |
|
146,232,108 |
|
113,697,218 |
|
87,845,811 |
|
|
Total |
|
1,610,427,183 |
|
1,350,396,871 |
|
1,018,129,156 |
|
Other operating income is detailed as follows:
|
|
|
01.01.2014 |
|
01.01.2013 |
|
01.01.2012 |
|
|
Details |
|
12.31.2014 |
|
12.31.2013 |
|
12.31.2012 |
|
|
|
|
TCh$ |
|
ThCh$ |
|
ThCh$ |
|
|
Gain on disposal of property, plant and equipment |
|
2,533,546 |
|
3,345,299 |
|
2,304,613 |
|
|
Adjustment of judicial deposit (Brazil) |
|
2,773,068 |
|
2,048,403 |
|
748,299 |
|
|
Earnings from sale of ownership interest in Leao Junior |
|
300,816 |
|
— |
|
— |
|
|
Others |
|
1,136,261 |
|
1,040,318 |
|
213,086 |
|
|
Total |
|
6,743,691 |
|
6,434,020 |
|
3,265,998 |
|
NOTE 26 — OTHER EXPENSES
Other expenses are detailed as follows:
|
|
|
01.01.2014 |
|
01.01.2013 |
|
01.01.2012 |
|
|
Details |
|
12.31.2014 |
|
12.31.2013 |
|
12.31.2012 |
|
|
|
|
ThCh$ |
|
ThCh$ |
|
ThCh$ |
|
|
Disposal and write-off of property, plant and equipment |
|
5,812,123 |
|
7,546,982 |
|
2,119,279 |
|
|
Tax on bank debits |
|
6,130,568 |
|
6,189,979 |
|
4,487,209 |
|
|
Fiscal Credit Provision (Brazil) |
|
— |
|
1,970,894 |
|
2,012,879 |
|
|
Judicial Deposits Provision (Brazil) |
|
— |
|
1,255,090 |
|
— |
|
|
Non-operating fees |
|
934,646 |
|
2,560,619 |
|
650,912 |
|
|
Distribution restructuring project (Chile) |
|
— |
|
3,148,187 |
|
— |
|
|
Contingencies |
|
2,567,561 |
|
4,510,908 |
|
— |
|
|
Donations |
|
2,034,119 |
|
582,000 |
|
815,945 |
|
|
Merger expenses |
|
— |
|
772,689 |
|
4,517,661 |
|
|
Others |
|
1,112,254 |
|
1,924,749 |
|
816,123 |
|
|
Total |
|
18,591,271 |
|
30,462,097 |
|
15,420,008 |
|
Financial income and expenses are detailed as follows:
a) Finance income
|
|
|
01.01.2014 |
|
01.01.2013 |
|
01.01.2012 |
|
|
Description |
|
12.31.2014 |
|
12.31.2013 |
|
12.31.2012 |
|
|
|
|
ThCh$ |
|
ThCh$ |
|
ThCh$ |
|
|
Interest income |
|
7,770,198 |
|
4,497,802 |
|
2,487,739 |
|
|
Other interest income |
|
885,425 |
|
475,510 |
|
240,320 |
|
|
Total |
|
8,655,623 |
|
4,973,312 |
|
2,728,059 |
|
a) Finance expenses
|
|
|
01.01.2014 |
|
01.01.2013 |
|
01.01.2012 |
|
|
Description |
|
12.31.2014 |
|
12.31.2013 |
|
12.31.2012 |
|
|
|
|
ThCh$ |
|
ThCh$ |
|
ThCh$ |
|
|
Bond interest |
|
44,917,601 |
|
12,441,966 |
|
5,473,534 |
|
|
Bank loan interest |
|
15,029,145 |
|
14,283,636 |
|
4,594,167 |
|
|
Other interest costs |
|
5,134,685 |
|
2,218,421 |
|
1,105,052 |
|
|
Total |
|
65,081,431 |
|
28,944,023 |
|
11,172,753 |
|
Other gains (losses) are detailed as follows:
|
|
|
01.01.2014 |
|
01.01.2013 |
|
01.01.2012 |
|
|
Details |
|
12.31.2014 |
|
12.31.2013 |
|
12.31.2012 |
|
|
|
|
ThCh$ |
|
ThCh$ |
|
ThCh$ |
|
|
Restructuring of operations (new Renca plant) |
|
— |
|
(94,143 |
) |
(1,212,579 |
) |
|
Gains (loss) on derivative transactions raw materials |
|
196,009 |
|
1,711,816 |
|
(1,102,412 |
) |
|
Losses on ineffective portion of hedge derivatives (1) |
|
(5,995,530 |
) |
(559,875 |
) |
— |
|
|
Previous year allownace reversals |
|
1,411,030 |
|
— |
|
— |
|
|
Other income and (expenses) |
|
(3,614 |
) |
(317,425 |
) |
(21,224 |
) |
|
Total |
|
(4,392,105 |
) |
740,373 |
|
(2,336,215 |
) |
(1) See note 21 (b) .
The Company has made disbursements totaling ThCh$ 8,825,599 for improvements in industrial processes, equipment to measure industrial waste flows, laboratory analysis, consulting on environmental impacts and others.
These disbursements by country are detailed as follows:
|
|
|
Year ended 2014 |
|
Future commitments |
|
||||
|
Country |
|
Recorded as
|
|
Capitalized to
|
|
To be Recorded
|
|
To be
|
|
|
|
|
ThCh$ |
|
ThCh$ |
|
ThCh$ |
|
ThCh$ |
|
|
Chile |
|
788,373 |
|
— |
|
— |
|
— |
|
|
Argentina |
|
1,258,397 |
|
— |
|
1,804,605 |
|
— |
|
|
Brazil |
|
1,727,599 |
|
4,888,812 |
|
2,184,684 |
|
1,191,708 |
|
|
Paraguay |
|
97,243 |
|
65,175 |
|
— |
|
27,389 |
|
|
Total |
|
3,871,612 |
|
4,953,987 |
|
3,989,289 |
|
1,219,097 |
|
NOTE 30 — SUBSEQUENT EVENTS
On January 29, 2015 a dividend was paid on interim character, which amounted to Ch$ 9.00 for each share of Series A and Ch$ 9.90 for each share of Series B.
On April 22, 2015, final dividend number 193 was agreed to pay from net income 2014 follows:
a) Ch$15.0 for each series A share; and
b) Ch$16.54 for each series B share.
On April 22, 2015, final additional dividend number 194 was agreed to pay from retained earnings as follows:
a) Ch$15.0 for each series A share; and
b) Ch$16.5 for each series B share.
Except as provided above there are no subsequent events that may significantly affect the Company’s consolidated financial position, results of operations or cash flows.
The exhibits filed with or incorporated by reference in this annual report are listed in the exhibit index below.
EXHIBIT INDEX
|
Item |
|
Description |
|
|
|
|
|
1.1 |
|
Amended and restated Bylaws of Embotelladora Andina S.A. dated as of June 25, 2012 (English Translation) (incorporated by reference to Exhibit 1.1 to Andina’s Annual Report on Form 20-F filed on April 30, 2012 (File No. 001-13142)) |
|
2.1 |
|
Amended and restated Deposit Agreement, dated as of December 14, 2000, among Embotelladora Andina S.A., The Bank of New York as Depositary, and Holders and Beneficial Owners of American Depositary Receipts (incorporated by reference to Exhibit 1.3 to Andina’s Annual Report on Form 20-F filed on April 30, 2012 (File No. 001-13142)) |
|
2.2 |
|
Indenture dated as of September 30, 1997, among Embotelladora Andina S.A., Credit Suisse First Boston Corporation, and J.P. Morgan Securities Inc. (incorporated herein by reference and filed with the SEC on September 30, 1997 and also available on our website www.koandina.com) |
|
4.1 |
|
Amended and restated Call Option Agreement, dated as of December 17, 1996, among Inversiones Freire Limitada, Inversiones Freire Dos Limitada, Coca-Cola Interamerican Corporation, Coca-Cola de Argentina S.A., The Coca-Cola Company, and Embotelladora Andina S.A. and Custody Agreement among Inversiones Freire Limitada and Inversiones Freire Dos Limitada and Citibank, N.A. (English translation) (incorporated by reference to Exhibit 1.5 to Andina’s Annual Report on Form 20-F filed on April 30, 2012 (File No. 001-13142)) |
|
4.2 |
|
Amendment dated as of August 31, 2012 to the Amended and restated Shareholders’ Agreement, dated as of June 25, 2012, among Embotelladora Andina S.A., the Coca-Cola Company, Coca-Cola Interamerican Corporation, Coca-Cola de Argentina S.A., Bottling Investment Limited, Inversiones Freire Ltda., and Inversiones Freire Dos Ltda (incorporated by reference to Exhibit 4.2 to Andina’s Annual Report on Form 20-F filed on May 15, 2014 (File No. 001-13142) |
|
4.3 |
|
English translation of the form Bottler Agreement, (incorporated by reference to Exhibit 1.2 to Andina’s Annual Report on Form 20-F filed on April 30, 2012 (File No. 001-13142)) |
|
4.4 |
|
Bottler Agreement dated as of February 10, 2007, among Embotelladora del Atlántico S.A. and The Coca-Cola Company (incorporated by reference to Exhibit 1.2.1 to Andina’s Annual Report on Form 20-F filed on April 30, 2013 (File No. 001-13142)) |
|
4.5 |
|
Amendment dated as of February 1, 2012 to the Bottler Agreement dated as of February 10, 2007, among Embotelladora del Atlántico S.A. and Schweppes Holdings Limited (incorporated by reference to Exhibit 1.2.2 to Andina’s Annual Report on Form 20-F filed on April 30, 2013 (File No. 001-13142)) |
|
4.6 |
|
Amendment dated as of June 30, 2013 to the Bottler Agreement dated as of February 10, 2007, among Embotelladora del Atlántico S.A. and The Coca-Cola Company (incorporated by reference to Exhibit 1.2.2 to Andina’s Annual Report on Form 20-F filed on April 30, 2013 (File No. 001-13142)) |
|
4.7 |
|
Bottler Agreement in force as of July 1, 2003, among Embotelladora del Atlántico S.A., Coca-Cola Polar Argentina S.A. and The Coca-Cola Company regarding operations in Argentina (incorporated by reference to Exhibit 1.2.3 to Andina’s Annual Report on Form 20-F filed on April 30, 2013 (File No. 001-13142)) |
|
4.8 |
|
Amendment dated as of October 16, 2003 to Bottler Agreement effective as of July 1, 2003, among Coca-Cola Polar Argentina S.A. and The Coca-Cola Company regarding syrup mix (incorporated by reference to Exhibit 1.2.3 to Andina’s Annual Report on Form 20-F filed on April 30, 2013 (File No. 001-13142)) |
|
4.9 |
|
Amendment dated as of October 16, 2003 to Bottler Agreement effective as of July 1, 2003, among Coca-Cola Polar Argentina S.A. and The Coca-Cola Company regarding distribution in Argentina (incorporated by reference to Exhibit 1.2.4 to Andina’s Annual Report on Form 20-F filed on April 30, 2013 (File No. 001-13142)) |
|
4.10 |
|
Amendment dated as of November 17, 2003 to Bottler Agreement effective as of July 1, 2003, among Coca-Cola Polar Argentina S.A. and The Coca-Cola Company (incorporated by reference to Exhibit 1.2.4 to Andina’s Annual Report on Form 20-F filed on April 30, 2013 (File No. 001-13142)) |
|
4.11 |
|
Amendment dated as of November 28, 2003 to Bottler Agreement effective as of July 1, 2003, among Coca-Cola Polar Argentina S.A. and The Coca-Cola Company (incorporated by reference to Exhibit 1.2.4 to Andina’s Annual Report on Form 20-F filed on April 30, 2013 (File No. 001-13142)) |
|
4.12 |
|
Amendment dated as of March 21, 2004 to Bottler Agreement effective as of July 1, 2003, among Coca-Cola Polar Argentina S.A. and The Coca-Cola Company (incorporated by reference to Exhibit 1.2.4 to Andina’s Annual Report on Form 20-F filed on April 30, 2013 (File No. 001-13142)) |
|
4.13 |
|
Amendment dated as of November 26, 2004 to Bottler Agreement effective as of July 1, 2003, among Coca-Cola Polar Argentina S.A. and The Coca-Cola Company (incorporated by reference to Exhibit 1.2.4 to Andina’s Annual |
|
Item |
|
Description |
|
|
|
|
|
|
|
Report on Form 20-F filed on April 30, 2013 (File No. 001-13142)) |
|
4.14 |
|
Amendment dated as of December 7, 2004 to Bottler Agreement effective as of July 1, 2003, among Coca-Cola Polar Argentina S.A. and The Coca-Cola Company (incorporated by reference to Exhibit 1.2.4 to Andina’s Annual Report on Form 20-F filed on April 30, 2013 (File No. 001-13142)) |
|
4.15 |
|
Amendment dated as of December 27, 2004 to Bottler Agreement effective as of July 1, 2003, among Coca-Cola Polar Argentina S.A. and The Coca-Cola Company (incorporated by reference to Exhibit 1.2.4 to Andina’s Annual Report on Form 20-F filed on April 30, 2013 (File No. 001-13142)) |
|
4.16 |
|
Amendment dated as of July 28, 2008 to Bottler Agreement effective as of July 1, 2003, among Embotelladora del Atlántico S.A., Coca-Cola Polar Argentina S.A. and The Coca-Cola Company (incorporated by reference to Exhibit 1.2.3 to Andina’s Annual Report on Form 20-F filed on April 30, 2013 (File No. 001-13142)) |
|
4.17 |
|
Amendment dated as of July 28, 2008 to Bottler Agreement effective as of July 1, 2003, among Embotelladora del Atlántico S.A., Coca-Cola Polar Argentina S.A. and Schweppes Holdings Limited (incorporated by reference to Exhibit 1.2.3 to Andina’s Annual Report on Form 20-F filed on April 30, 2013 (File No. 001-13142)) |
|
4.18 |
|
Bottler Agreement dated as of October 4, 2007 among Rio de Janeiro Refrescos Ltda and The Coca-Cola Company (incorporated by reference to Exhibit 1.2.5 to Andina’s Annual Report on Form 20-F filed on April 30, 2013 (File No. 001-13142)) |
|
4.19 |
|
Amendment dated as of October 4, 2012 to Bottler Agreement dated as of October 4, 2007 between Rio de Janeiro Refrescos Ltda and The Coca-Cola Company (incorporated by reference to Exhibit 1.2.6 to Andina’s Annual Report on Form 20-F filed on April 30, 2013 (File No. 001-13142)) |
|
4.20 |
|
Amendment dated as of February 7, 2013 to the Bottling Agreement dated as of October 4, 2007 between Cia. de Bebidas Ipiranga and The Coca-Cola Company (incorporated by reference to Exhibit 4.20 to Andina’s Annual Report on Form 20-F filed on May 15, 2014 (File No. 001-13142). |
|
4.21 |
|
Bottler Agreement dated as of September 1, 2008 among Embotelladoras Coca-Cola Polar S.A. and The Coca-Cola Company (incorporated by reference to Exhibit 1.2.7 to Andina’s Annual Report on Form 20-F filed on April 30, 2013 (File No. 001-13142)) |
|
4.21.1 |
|
Amendment dated as of July 9, 2014 to Bottler Agreement dated as of September 1, 2008 between Embotelladora Andina (ex-Embotelladoras Coca-Cola Polar S.A.) and The Coca-Cola Company (filed herein) |
|
4.21.2 |
|
Bottler Agreement dated as of November 3, 2014 among Embotelladora andina (ex-Embotelladoras Coca-Cola Polar S.A.) and The Coca-Cola Company (filed herein) |
|
4.22 |
|
Bottler Agreement dated as of February 1, 2008 among Embotelladora Andina S.A. and The Coca-Cola Company (incorporated by reference to Exhibit 1.2.8 to Andina’s Annual Report on Form 20-F filed on April 30, 2013 (File No. 001-13142)) |
|
4.23 |
|
Amendment dated as of February 1, 2013 to Bottler Agreement dated as of February 1, 2008 among Embotelladora Andina S.A. and The Coca-Cola Company (incorporated by reference to Exhibit 1.2.9 to Andina’s Annual Report on Form 20-F filed on April 30, 2013 (File No. 001-13142)) |
|
4.24 |
|
Bottler Agreement dated as of December 1, 2004 among Paraguay Refrescos S.A. and The Coca-Cola Company (incorporated by reference to Exhibit 1.2.10 to Andina’s Annual Report on Form 20-F filed on April 30, 2013 (File No. 001-13142)) |
|
4.25 |
|
Amendment dated as of March 3, 2010 to Bottler Agreement dated as of December 1, 2004 among Paraguay Refrescos S.A. and The Coca-Cola Company (incorporated by reference to Exhibit 1.2.10 to Andina’s Annual Report on Form 20-F filed on April 30, 2013 (File No. 001-13142)) |
|
4.26 |
|
Amendment dated as of November 6, 2014 to Bottler Agreement dated as of December 1, 2004 among Paraguay Refrescos S.A. and The Coca-Cola Company (filed herein) |
|
4.27 |
|
Amendment dated as of March 25, 2015 to Bottler Agreement dated as of December 1, 2004 among Paraguay Refrescos S.A. and The Coca-Cola Company (filed herein) |
|
8.1 |
|
List of our subsidiaries (filed herein). |
|
12.1 |
|
Certification of Miguel Ángel Peirano, Chief Executive Officer, pursuant to Rule 13-a14(a) (17 CFR 240.13a-12(a)) or Rule 15d-14(a) (17 CFR 240.15d-14(a)) (filed herein). |
|
12.2 |
|
Certification of Andrés Wainer, Chief Financial Officer pursuant to Rule 13-a14(a) (17 CFR 240.13a-12(a)) or Rule 15d-14(a) (17 CFR 240.15d-14(a)) (filed herein). |
|
13.1 |
|
Certification of Miguel Ángel Peirano, Chief Executive Officer, pursuant to 18 U.S.C. Chapter 63, Section 1350, (filed herein). |
|
13.2 |
|
Certification of Andrés Wainer, Chief Financial Officer, pursuant to 18 U.S.C. Chapter 63, Section 1350, (filed herein). |