ALBEMARLE CORP
10-Ks and 10-Qs
|
|
|
|
|
|
|
|
|
|
|
|
|
|
|
|
|
|
|
|
|
|
|
|
|
|
|
|
|
|
|
|
|
|
|
|
|
|
|
|
|
|
|
|
|
|
|
|
|
|
|
|
|
|
|
|
UNITED STATES
SECURITIES AND EXCHANGE COMMISSION
Washington, D.C. 20549
________________________________________
FORM 10-K
________________________________________
|
x
|
Annual Report Pursuant to Section 13 or 15(d) of the Securities Exchange Act of 1934
|
or
|
¨
|
Transition Report Pursuant to Section 13 or 15(d) of the Securities Exchange Act of 1934
|
Commission file number 001-12658
ALBEMARLE CORPORATION
(Exact name of registrant as specified in its charter)
|
VIRGINIA
|
54-1692118
|
|
|
(State or other jurisdiction of
incorporation or organization)
|
(I.R.S. Employer
Identification No.)
|
|
Baton Rouge, Louisiana 70801
(Address of principal executive offices) (Zip Code)
Registrant’s telephone number, including area code: 225-388-8011
Securities registered pursuant to Section 12(b) of the Act:
|
Title of each class
|
Name of each exchange on which registered
|
|
|
COMMON STOCK, $.01 Par Value
|
NEW YORK STOCK EXCHANGE
|
|
Indicate by check mark if the registrant is a well-known seasoned issuer, as defined in Rule 405 of the Securities Act. Yes
x
No
¨
Indicate by check mark if the registrant is not required to file reports pursuant to Section 13 or Section 15(d) of the Act. Yes
¨
No
x
Indicate by check mark whether the registrant (1) has filed all reports required to be filed by Section 13 or 15(d) of the Securities Exchange Act of 1934 during the preceding 12 months (or for such shorter period that the registrant was required to file such reports), and (2) has been subject to such filing requirements for at least the past 90 days. Yes
x
No
¨
Indicate by check mark whether the registrant has submitted electronically and posted on its Corporate Web site, if any, every Interactive Data File required to be submitted and posted pursuant to Rule 405 of Regulation S-T (§232.405 of this chapter) during the preceding 12 months (or for such shorter period that the registrant was required to submit and post such files). Yes
x
No
¨
Indicate by check mark if disclosure of delinquent filers pursuant to Item 405 of Regulation S-K (§229.405) is not contained herein, and will not be contained, to the best of registrant’s knowledge, in definitive proxy or information statements incorporated by reference in Part III of this Form 10-K or any amendment to this Form 10-K.
¨
Indicate by check mark whether the registrant is a large accelerated filer, an accelerated filer, a non-accelerated filer, or a smaller reporting company. See the definitions of “large accelerated filer,” “accelerated filer,” and “smaller reporting company” in Rule 12b-2 of the Exchange Act. (Check one):
|
Large accelerated filer
|
x
|
Accelerated filer
|
¨
|
Non-accelerated filer
|
¨
|
Smaller reporting company
|
¨
|
|||
Indicate by check mark whether the registrant is a shell company (as defined in Rule 12b-2 of the Exchange Act). Yes
¨
No
x
Number of shares of common stock outstanding as of
February 10, 2014
:
79,497,921
The aggregate market value of the voting and non-voting common equity stock held by non-affiliates of the registrant was approximately
$5.1 billion
based on the reported last sale price of common stock on June 28, 2013, the last business day of the registrant’s most recently completed second quarter.
Documents Incorporated by Reference
Portions of Albemarle Corporation’s definitive Proxy Statement for its
2014
Annual Meeting of Shareholders to be filed with the Securities and Exchange Commission pursuant to Regulation 14A under the Securities Exchange Act of 1934, as amended, are incorporated by reference into Parts II and III of this Form 10-K.
|
Albemarle Corporation and Subsidiaries
|
||
Index to Form 10-K
Year Ended
December 31, 2013
|
Page
|
||
|
Albemarle Corporation and Subsidiaries
|
||
|
Item 1.
|
Business.
|
Albemarle Corporation was incorporated in Virginia in 1993. Our principal executive offices are located at 451 Florida Street, Baton Rouge, Louisiana 70801. Unless the context otherwise indicates, the terms “Albemarle,” “we,” “us,” “our” or “the Company” mean Albemarle Corporation and our consolidated subsidiaries.
We are a leading global developer, manufacturer and marketer of highly-engineered specialty chemicals that meet customer needs across an exceptionally diverse range of end markets including the petroleum refining, consumer electronics, plastics/packaging, construction, automotive, lubricants, pharmaceuticals, crop protection, food safety and custom chemistry services markets. We are committed to global sustainability and are advancing responsible eco-practices and solutions. We believe that our commercial and geographic diversity, technical expertise, innovative capability, flexible, low-cost global manufacturing base, experienced management team, and strategic focus on our core base technologies will enable us to maintain leading market positions in those areas of the specialty chemicals industry in which we operate.
We and our joint ventures currently operate 49 facilities, encompassing production, research and development facilities, and administrative and sales offices in North and South America, Europe, the Middle East, Asia, Africa and Australia. We serve approximately
2,700
customers in approximately
100
countries. For information regarding our unconsolidated joint ventures see Note 8, “Investments” to our consolidated financial statements included in Item 8 beginning on pa
ge 53.
Business Segments
Through 2013, our operations were managed and reported as three operating segments: Polymer Solutions, Catalysts and Fine Chemistry. Financial results and discussion about our operating segments included in this Annual Report on Form 10-K are categorized according to these three operating segments except where noted.
As previously announced on September 23, 2013, we realigned our operating segments effective January 1, 2014. The Performance Chemicals segment will include Fire Safety Solutions, Specialty Chemicals and Fine Chemistry Services, consolidating our bromine, mineral and custom manufacturing assets under one business unit. The Catalyst Solutions segment will include Refinery Catalyst Solutions, Performance Catalyst Solutions and Antioxidants.
For financial information regarding our operating segments, including revenues generated for each of the last three fiscal years from each of the product categories included in our operating segments, and geographic areas, see Note 23, “Operating Segments and Geographic Area Information” to our consolidated financial statements included in Item 8 beginning o
n page 53.
Polymer Solutions
Our Polymer Solutions segment consists of two product market categories: flame retardants, and stabilizers and curatives.
Flame Retardants.
Our fire safety technology enables the use of plastics in high performance, high heat applications by enhancing the flame resistant properties of these materials. Some of the end market products that benefit from our fire safety technology include plastic enclosures for consumer electronics, printed circuit boards, wire and cable, electrical connectors, textiles and foam insulation. We compete in two major fire safety chemistries: brominated and mineral. Our brominated flame retardants include products sold under the Saytex
®
brand and our mineral-based flame retardants include products such as Martinal
®
and Magnifin
®
. Our strategy is to have a broad range of chemistries applicable to each major flame retardant application.
Stabilizers and Curatives.
We produce plastic additives as well as other additives, such as curatives, antioxidants and stabilizers, which are often specially developed and formulated for a customer’s specific manufacturing requirements. Our additives products include curatives for polyurethane, polyurea and epoxy system polymerization. This business also produces antioxidants and stabilizers to improve the performance integrity of thermoplastic resins. We are well-positioned for global growth, notably with our leading antioxidant supplier position in the rapidly growing Chinese market.
Our Ethacure
®
curatives are used in cast elastomers, coatings, reaction injection molding (RIM) and specialty adhesives that are incorporated into products such as wheels, tires and rollers. Our line of Ethanox
®
antioxidants is used by manufacturers of polyolefins to maintain physical properties during the manufacturing process, including the color of the final product. These antioxidants are found in applications such as slit film, wire and cable, food packaging and pipes.
3
|
Albemarle Corporation and Subsidiaries
|
||
We also produce antioxidants used in fuels and lubricants. Our line of Ethanox
®
fuel and lubricant antioxidants is used by refiners and fuel marketers to extend fuel storage life and protect fuel systems, and by oil marketers and lubricant manufacturers to extend the useful life of lubricating oils, fluids and greases used in engines and various types of machinery.
Realignment.
As previously announced on September 23, 2013, we realigned our operating segments effective January 1, 2014. As a result of this realignment, the Flame Retardants and Curatives product market categories are aligned under the Performance Chemicals segment and the Stabilizers product market category is aligned under the Catalyst Solutions segment.
Customers
Our Polymer Solutions segment offers more than
80
products to a variety of end markets. We sell our products mostly to chemical manufacturers and processors, such as polymer resin suppliers, lubricant manufacturers, refiners and other specialty chemical companies.
Sales of Polymer Solutions in Asia are expected to grow long-term due to the underlying growth in consumer demand and the shift of the production of consumer electronics from the United States (U.S.) and Europe to Asia. In response to this development, we have established a sales and marketing network in China, Japan, Korea and Singapore with products sourced from the U.S., Europe, China and the Middle East. We are now operating two production facilities in China to deliver polymer solutions products to this rapidly growing market.
A number of customers of our Polymer Solutions segment manufacture products for cyclical industries, including the consumer electronics, building and construction, and automotive industries. As a result, demand from our customers in such industries is also cyclical.
Competition
Our Polymer Solutions segment serves the following geographic markets: the U.S., Asia, Europe and the Middle East, each of which is highly competitive. Product performance and quality, price and contract terms are the primary factors in determining which qualified supplier is awarded a contract. Research and development, product and process improvements, specialized customer services, the ability to attract and retain skilled personnel and maintenance of a good safety record have also been important factors to compete effectively in the Polymer Solutions marketplace.
Competition also arises from the substitution of different polymers and resin systems in end-products in an effort to reduce costs or change product qualities. For flame retardants, competition can be introduced from alternative chemistries, which is why our product portfolio includes bromine and mineral chemistries that are common in over
70%
of high value end uses today. For other additives, competition is introduced by low-cost antioxidant suppliers. We offer our basic antioxidant products from low cost manufacturing sites in China.
We are a market leader in the brominated flame retardants business and our most significant competitors are Chemtura Corporation and Israel Chemicals Ltd. We are also a market leader in the mineral-based flame retardants business. In our mineral-based flame retardants business, our most significant competitors include J.M. Huber Corporation, Kyowa Chemical Industry Co., Ltd. and Nabaltec GmbH. We are a significant player in the stabilizers business and our most significant competitors are BASF Corporation, SK Capital and Songwon Industrial Co., Ltd.
Raw Materials and Significant Supply Contracts
The major raw materials we use in our Polymer Solutions operations are bromine, bisphenol-A, phenol, benzene, caustic soda, alumina trihydrate, polystyrene and isobutylene, most of which are readily available from numerous independent suppliers and are purchased under contracts at prices we believe are competitive. The cost of raw materials is generally based on market prices although we may use contracts with price caps or other tools, as appropriate, to mitigate price volatility. Many of our customers operate under long-term supply contracts that provide for either the pass-through of raw material and energy cost changes, or pricing based on short-term “tenders” in which changing market conditions are quickly reflected in the pricing of the finished product.
The bromine we use in our Polymer Solutions segment comes from two locations: Arkansas and the Dead Sea. Our brine reserves in Arkansas are supported by an active brine rights leasing program. We believe that we have in excess of
70
years of proven bromine reserves in Arkansas. In addition, through our 50% interest in Jordan Bromine Company Limited (JBC), a consolidated joint venture with operations in Safi, Jordan, we produce bromine from the Dead Sea, which has virtually inexhaustible reserves. In addition, we have a joint venture with Weifang Sinobrom Import and Export Company, Ltd., or Sinobrom, in China that allows us the option to source bromine directly from China’s Shandong Province brine fields.
4
|
Albemarle Corporation and Subsidiaries
|
||
Catalysts
Our Catalysts segment includes our refinery catalysts and performance catalyst solutions businesses.
Refinery Catalyst Solutions.
Our two main refinery catalysts businesses are Clean Fuels Technologies (CFT), primarily composed of hydroprocessing catalysts (HPC), and Heavy Oil Upgrading (HOU), primarily composed of fluidized catalytic cracking (FCC) catalysts and additives. HPC products are widely applied throughout the refining industry. Their application enables the upgrading of oil fractions to clean fuels and other usable oil products by removing sulfur, nitrogen and other impurities from the feedstock. In addition, they improve product properties by adding hydrogen and in some cases improve the performance of downstream catalysts and processes. Albemarle continuously seeks to add more value to refinery operations by offering HPC products that meet our customers’ requirements for profitability and performance in the very demanding refining market. FCC catalysts assist in the high yield cracking of less desired refinery petroleum streams into derivative, higher-value products such as transportation fuels and petrochemical feedstocks like propylene. Our FCC additives are used to reduce emissions of sulfur dioxide and nitrogen oxide in FCC units and to increase liquefied petroleum gas olefins yield, such as propylene, and to boost octane in gasoline. Albemarle offers unique refinery catalysts to crack and treat the lightest to the heaviest feedstocks while meeting refinery yield and product needs. We offer a wide range of HPC products and approximately
60
different FCC catalysts and additives products to our customers.
Performance Catalyst Solutions (PCS).
We have three business units in our PCS division: polymer catalysts, chemical catalysts, and electronic materials. We manufacture organometallic co-catalysts (e.g., aluminum, magnesium and zinc alkyls) as well as metallocene components and co-catalysts (e.g., methylaluminumoxane, organoborons, metallocene compounds, and finished polymerization catalysts comprising these products). We also offer finished single-site catalysts with or without our proprietary ActivCat
®
technology and a line of proprietary Ziegler-Natta catalysts under the Advantage
™
brand. Our co-catalysts and finished catalysts are used in our customers’ production of polyolefin polymers. Such polymers are commodity (i.e., Ziegler-Natta polymerization technology-based) and specialty (i.e., Single Site polymerization technology-based) plastics serving a wide variety of end markets including packaging, non-packaging, films and injection molding. Some of our organometallic products are also used in the manufacture of alpha-olefins (i.e., hexene, octene, decene). In electronic materials, we manufacture and sell high purity metal organic products into electronic applications such as the production of light emitting diodes (LEDs) for displays and general lighting, as well as other products used in the production of solar cells. Our chemical catalysts include a variety of catalysts used in the broad chemical industry, for example, catalysts used in the production of ethylene dichloride and methylamines, among others.
Realignment.
As previously announced on September 23, 2013, we realigned our operating segments effective January 1, 2014. As a result of this realignment, the Refinery Catalyst Solutions and PCS businesses are aligned under the Catalyst Solutions segment.
Customers
Our Catalysts segment customers include multinational corporations such as ExxonMobil Corporation, Chevron Corporation, TOTAL S.A., Saudi Basic Industries Corporation and INEOS Group Holdings S.A.; independent petroleum refining companies such as Valero Energy Corporation and SK Holdings; and national petroleum refining companies such as Reliance, Petróleo Brasileiro S.A. and Petróleos Mexicanos.
We estimate that there are currently approximately
500
FCC units being operated globally, each of which requires a constant supply of FCC catalysts. In addition, we estimate that there are approximately
3,000
HPC units being operated globally, each of which typically requires replacement HPC catalysts once every one to three years. There are approximately
1,000
polyolefin and elastomer units worldwide which require a constant supply of co-catalysts and finished catalysts.
Competition
Our Catalysts segment serves the global market including the Americas, Asia, Europe and the Middle East, each of which is highly competitive. Product performance and quality, price and contract terms are the primary factors in determining which qualified supplier is awarded a contract. Research and development, product and process improvements, specialized customer services, the ability to attract and retain skilled personnel and the maintenance of a good safety record have also been important factors to compete effectively in the Catalysts marketplace. Through our research and development programs, we strive to differentiate our business by developing value-added products and products based on proprietary technologies.
We are a market leader in the HPC, FCC and polyolefin organometallic catalysts markets. Our major competitors in the HPC catalysts market include Criterion Catalysts and Technologies, Advanced Refining Technologies and Haldor Topsoe. Our
5
|
Albemarle Corporation and Subsidiaries
|
||
major competitors in the FCC catalysts market include W.R. Grace & Co. and BASF Corporation. Our major competitors in the organometallics market include AkzoNobel and Chemtura Corporation, as well as W.R. Grace & Co. and BASF in the Ziegler-Natta catalysts area. Some of our major catalysts competitors have alliances with global major refiners to facilitate new product development and introduction.
Raw Materials
The major raw materials we use in our Catalysts operations include aluminum, ethylene, alpha-olefins, sodium silicate, sodium aluminate, kaolin, rare earths, molybdenum, nickel and cobalt, most of which are readily available from numerous independent suppliers and are purchased or provided under contracts at prices we believe are competitive. The cost of raw materials is generally based on market prices, although we may use contracts with price caps or other tools, as appropriate, to mitigate price volatility. These raw materials may nevertheless be subject to significant volatility despite our mitigating efforts. Our profitability may be affected if we are unable to recover significant raw material costs from our customers.
Fine Chemistry
Our Fine Chemistry segment consists of two categories: Performance Chemicals and Fine Chemistry Services and Intermediates.
Performance Chemicals.
Performance Chemicals includes products such as elemental bromine, alkyl bromides, inorganic bromides, brominated powdered activated carbon and a number of bromine fine chemicals. Our products are used in chemical synthesis, oil and gas well drilling and completion fluids, mercury control, paper manufacturing, water purification, beef and poultry processing and various other industrial applications. Other performance chemicals that we produce include tertiary amines for surfactants, biocides, disinfectants and sanitizers and aluminum oxides used in a wide variety of refractory, ceramic and polishing applications.
Fine Chemistry Services and Intermediates.
In addition to supplying the specific fine chemistry products and performance chemicals for the pharmaceutical and agricultural uses described below, our fine chemistry services business offers custom manufacturing, research and chemical scale-up services for companies. These services position us to support customers in developing their new products, such as new drugs, specialty materials and agrichemicals.
Our most significant pharmaceutical bulk active is ibuprofen. Ibuprofen is widely used to provide temporary pain relief and fever reduction. Bulk ibuprofen is formulated by pharmaceutical companies that sell in both the prescription and over-the-counter markets. This product competes against other painkillers, including aspirin and acetaminophen. We are one of the largest global producers of ibuprofen. We also produce a range of intermediates used in the manufacture of a variety of over-the-counter and prescription drugs.
Our agrichemicals are sold to agrichemical manufacturers and distributors that produce and distribute finished agricultural herbicides, insecticides, fungicides and soil fumigants. Our products include orthoalkylated anilines used in the acetanilide family of pre-emergent herbicides used with corn, soybeans and other crops and methyl bromide, which is used as a soil fumigant. We also manufacture and supply a variety of custom chemical intermediates for the agricultural industry.
In recent years, the market for methyl bromide has changed significantly, driven by the Montreal Protocol of 1990 and related regulations prompted by findings regarding the chemical’s potential to deplete the ozone layer. Methyl bromide is injected into the soil by end users before planting to eliminate bacteria, nematodes, fungus and weeds. Methyl bromide is used on high-value crops, such as strawberries, tomatoes, melons and peppers.
We will continue to sell methyl bromide in our current markets as regulations allow. In accordance with the Montreal Protocol and the U.S. Clean Air Act, completion of the phase-out of methyl bromide as a fumigant in the U.S., Western Europe and Japan took effect in 2005. Methyl bromide, however, can continue to be used for “critical uses” where there are no other alternatives. Growers submit applications on a yearly basis detailing the amount of methyl bromide they will need for critical uses. Once approved by the U.S. Environmental Protection Agency (EPA), the U.S. submits the application for approval by the parties to the Montreal Protocol. The critical use process is done annually and will continue until feasible alternatives are available. Certain other markets for methyl bromide, including quarantine and pre-shipment and chemical intermediate uses, are not restricted by the Montreal Protocol. Our sales of methyl bromide approximated 0.4%, 0.3% and 0.6% of our total annual net sales in 2013, 2012 and 2011, respectively.
Realignment.
As previously announced on September 23, 2013, we realigned our operating segments effective January 1, 2014. As a result of this realignment, the Performance Chemicals and Fine Chemistry Services and Intermediates product market categories are aligned under the Performance Chemicals segment, effective January 1, 2014.
6
|
Albemarle Corporation and Subsidiaries
|
||
Customers
Our Fine Chemistry segment manufactures more than
100
products, which are used in a variety of end markets. Sales of products and services are mostly to chemical manufacturers and processors (including pharmaceutical and agricultural companies), drilling and oil service companies, beef and poultry processors, water treatment and photographic companies, energy producers and other specialty chemical companies.
Pricing for many of our fine chemistry products and services is based upon negotiation with customers. The critical factors that affect prices are the level of technology differentiation we provide, the maturity of the product and the level of assistance required to bring a new product through a customer’s developmental process.
Competition
Our Fine Chemistry segment serves the following geographic markets: the Americas, Asia, Europe and the Middle East, each of which is highly competitive. Product performance and quality, price and contract terms are the primary factors in determining which qualified supplier is awarded a contract. Research and development, product and process improvements, specialized customer services, the ability to attract and retain skilled personnel and the maintenance of a good safety record have also been important factors to compete effectively in the fine chemistry marketplace.
We are a market leader in the bromine-based product groups and primarily compete with two other integrated global bromine producers, Chemtura Corporation and Israel Chemicals Ltd. We are a leading producer of pharmaceutical bulk actives (i.e., ibuprofen and propofol) and we primarily compete with a few major Western competitors, such as BASF Corporation, Lonza, Clariant Ltd. and Cilag AG; however, there is increasing competition from Asian sources. We differentiate ourselves from our competitors by developing new, high quality innovative products, offering cost reductions and enhancing the services that we offer.
Raw Materials
The major raw materials we use in our Fine Chemistry operations include potassium chloride, chlorine, ammonia, aluminum chloride, alpha-olefins, methyl amines and propylene, most of which are readily available from numerous independent suppliers.
The bromine that we use in our Fine Chemistry segment comes from two locations: Arkansas and the Dead Sea. Our brine reserves in Arkansas are supported by an active brine rights leasing program. We believe that we have in excess of
70
years of proven bromine reserves in Arkansas. In addition, through our 50% interest in JBC, a consolidated joint venture with operations in Safi, Jordan, we produce bromine from the Dead Sea, which has virtually inexhaustible reserves. In addition, we have our Sinobrom joint venture in China that allows us the option to source bromine directly from China’s Shandong Province brine fields.
Sales, Marketing and Distribution
We have an international strategic account program that uses cross-functional teams to serve large global customers. This program emphasizes creative strategies to improve and strengthen strategic customer relationships with emphasis on creating value for customers and promoting post-sale service. Complementing this program are regional Albemarle sales personnel around the world who serve numerous additional customers within North America, Europe, the Middle East, India, Asia Pacific, Russia, Africa and Latin America. We also use approximately
85
commissioned sales representatives and specialists in specific market areas, some of which are subsidiaries of large chemical companies.
Research and Development
We believe that in order to generate revenue growth, maintain our margins and remain competitive, we must continually invest in research and development, product and process improvements and specialized customer services. Through research and development, we continue to seek increased margins by introducing value-added products and proprietary processes and innovative green chemistry technologies. Our green chemistry efforts focus on the development of products that benefit society in a manner that minimizes waste and the use of raw materials and energy, avoids the use of toxic reagents and solvents and is produced in safe, environmentally friendly manufacturing processes. Green chemistry is encouraged with our researchers through periodic focus group discussions and special rewards and recognition for outstanding new green developments.
Our research and development efforts support each of our business segments. The focus of research in Polymer Solutions is divided among new and improved flame retardants, plastic and other additives and blends, and curing agents. Flame retardant
7
|
Albemarle Corporation and Subsidiaries
|
||
research is focused primarily on developing new flame retardants which not only meet the higher performance requirements required by today’s polymer producers, formulators and original equipment manufacturers but which also have superior toxicological and environmental profiles, such as our GreenArmor
™
flame retardant product, that are greatly enhanced in both end product performance and environmental responsibility. Plastic and other additives research is focused primarily on developing improved capabilities to deliver commodity and value-added plastic and other additive blends to the polymer market. Curatives research is focused primarily on improving and extending our line of curing agents and formulations.
Catalysts research is focused on the needs of our refinery catalysts customers, our performance catalysts customers and developing metal organics for LED and other electronic applications. Refinery catalysts research is focused primarily on the development of more effective catalysts and related additives to produce clean fuels and to maximize the production of the highest value refined products. In the performance catalysts area, we are focused primarily on catalysts, co-catalysts and finished catalysts systems for polymer producers to meet the market’s demand for improved polyolefin polymers and elastomers as well as metal organics for electronic customers.
The primary focus of our Fine Chemistry research program is the development of efficient processes for the manufacture of chemical intermediates and actives for the pharmaceutical and agrichemical industries. Another area of research is the development of bromine-based products for use as biocides in industrial water treatment and food safety applications and as additives used to reduce mercury emissions from coal-fired power plants.
We have incurred research and development expenses of
$82.2 million
,
$78.9 million
, and
$77.1 million
during
2013
,
2012
and
2011
, respectively.
Intellectual Property
Our intellectual property, including our patents, licenses and trade names, is an important component of our business. As of
December 31, 2013
, we owned approximately
1,700
active U.S. and foreign patents and approximately
1,200
pending U.S. and foreign patent applications. We also have acquired rights under patents and inventions of others through licenses, and we license certain patents and inventions to third parties.
Regulation
Our business is subject to a broad array of employee health and safety laws and regulations, including those under the Occupational Safety and Health Act. We also are subject to similar state laws and regulations as well as local laws and regulations for our non-U.S. operations. We devote significant resources and have developed and implemented comprehensive programs to promote the health and safety of our employees and we maintain an active health, safety and environmental program. We finished
2013
with an occupational injury and illness rate of
0.55
for Albemarle employees and nested contractors, up from
0.23
in
2012
.
Our business and our customers also may be subject to significant requirements under the European Community Regulation for the Registration, Evaluation and Authorization of Chemicals (REACH). REACH imposes obligations on European Union manufacturers and importers of chemicals and other products into the European Union to compile and file comprehensive reports, including testing data, on each chemical substance, and perform chemical safety assessments. Additionally, substances of high concern—such as Carcinogenic, Mutagenic and Reprotoxic (CMRs); Persistent, Bioaccumulative and Toxic (PBTs); very Persistent, very Bioaccumulative (vPvB); and endocrine disruptors—will be subject to an authorization process. Authorization may result in restrictions in the use of products by application or even banning the product. In 2009, one of our products was designated by European regulators as a Substance of Very High Concern under authorization, Hexabromocyclododecane (HBCD). Our sales of HBCD approximated
1.3%
,
1.9%
and
2.1%
of our total annual net sales in
2013
,
2012
and
2011
, respectively. In 2012, another of our products, decabromodiphenyl ether (decaBDE) similarly was identified as a Substance of Very High Concern. Our sales of decaBDE approximated 0.3% of our total annual net sales in 2013, and 0.7% of our total annual net sales in 2012 and 2011. In accordance with our voluntary commitment announced in 2009, Albemarle ceased production of decaBDE effective at the end of 2012.
The REACH regulations impose significant additional burdens on chemical producers, importers, downstream users of chemical substances and preparations, and the entire supply chain. Our significant manufacturing presence and sales activities in the European Union will require us to incur significant additional compliance costs and may result in increases in the costs of raw materials we purchase and the products we sell. Increases in the costs of our products could result in a decrease in their overall demand; additionally, customers may seek products that are not regulated by REACH, which could also result in a decrease in the demand of certain of our products subject to the REACH regulations.
8
|
Albemarle Corporation and Subsidiaries
|
||
Recently, there has been increased scrutiny of certain brominated flame retardants by regulatory authorities, legislative bodies and environmental interest groups in various countries. We manufacture a broad range of brominated flame retardant products, which are used in a variety of applications. Concern about the impact of some of our products on human health or the environment may lead to regulation, or reaction in our markets independent of regulation.
Environmental Regulation
We are subject to numerous foreign, federal, state and local environmental laws and regulations, including those governing the discharge of pollutants into the air and water, the management and disposal of hazardous substances and wastes and the cleanup of contaminated properties. Ongoing compliance with such laws and regulations is an important consideration for us. Key aspects of our operations are subject to these laws and regulations. In addition, we incur substantial capital and operating costs in our efforts to comply with them.
Liabilities associated with the investigation and cleanup of hazardous substances, as well as personal injury, property damages or natural resource damages arising from the release of, or exposure to, such hazardous substances, may be imposed in many situations without regard to violations of laws or regulations or other fault, and may also be imposed jointly and severally (so that a responsible party may be held liable for more than its share of the losses involved, or even the entire loss). Such liabilities also may be imposed on many different entities with a relationship to the hazardous substances at issue, including, for example, entities that formerly owned or operated the property affected by the hazardous substances and entities that arranged for the disposal of the hazardous substances at the affected property, as well as entities that currently own or operate such property. We are subject to such laws, including the federal Comprehensive Environmental Response, Compensation and Liability Act, commonly known as CERCLA or Superfund, in the U.S., and similar foreign and state laws. We may have liability as a potentially responsible party (PRP) with respect to active off-site locations under CERCLA or state equivalents. We have sought to resolve our liability as a PRP at these sites through indemnification by third parties and settlements, which would provide for payment of our allocable share of remediation costs. Because the cleanup costs are estimates and are subject to revision as more information becomes available about the extent of remediation required, and in some cases we have asserted a defense to any liability, our estimates could change. Moreover, liability under CERCLA and equivalent state statutes may be joint and several, meaning that we could be required to pay in excess of our pro rata share of remediation costs. Our understanding of the financial strength of other PRPs has been considered, where appropriate, in estimating our liabilities. Accruals for these matters are included in the environmental reserve discussed below. Our management is actively involved in evaluating environmental matters and, based on information currently available to us, we have concluded that our outstanding environmental liabilities for unresolved waste sites currently known to us should not have a material effect on our operations.
We use and generate hazardous substances and wastes in our operations and may become subject to claims for personal injury and/or property damage relating to the release of such substances into the environment. In addition, some of our current properties are, or have been, used for industrial purposes, which could contain currently unknown contamination that could expose us to governmental requirements or claims relating to environmental remediation, personal injury and/or property damage. While we conduct our operations so as to minimize the risk of incurring such losses, the nature of our business and the types of operations in which we engage create a potential for such losses to occur. These risks could expose us to substantial liability for personal injury, wrongful death, property damage, loss of production, pollution and other environmental damages. Depending on the frequency and severity of such incidents, it is possible that the Company’s operating costs, insurability and relationships with customers, employees and regulators could be impaired. In particular, our customers may elect not to purchase our product if they view our safety record as unacceptable. This could also cause us to lose customers and substantial revenues. However, we believe that the likelihood of an environmental-related catastrophic occurrence or a series of occurrences that could materially affect the Company’s financial position or competitiveness is low.
We record accruals for environmental and asset retirement obligation matters when it is probable that a liability has been incurred and the amount of the liability can be reasonably estimated. It is possible that new information or future developments could require us to reassess our potential exposure related to environmental matters. We may incur significant costs and liabilities in order to comply with existing environmental laws and regulations. It is also possible that other developments, such as increasingly strict environmental laws, regulations and orders of regulatory agencies, as well as claims for damages to property and the environment or injuries to employees and other persons resulting from our current or past operations, could result in substantial costs and liabilities in the future. As this information becomes available, or other relevant developments occur, we will adjust our accrual amounts accordingly. While there are still uncertainties related to the ultimate costs we may incur, based upon our evaluation and experience to date, we believe our reserves are adequate. We cannot assure you that, as a result of former, current or future operations, there will not be some future impact on us relating to new regulations or additional environmental remediation or restoration liabilities. See “Safety and Environmental Matters” in Item 7. Management’s Discussion and Analysis of Financial Condition and Results of Operation
s on page 50.
9
|
Albemarle Corporation and Subsidiaries
|
||
Climate Change
The growing concerns about climate change and the related imposition by governments of more stringent regulations may provide us with new or expanded business opportunities. The Company seeks to capitalize on the “green revolution” by providing solutions to companies pursuing alternative fuel products and technologies (such as renewable fuels, gas-to-liquids and others), emission control technologies (including mercury emissions) and other similar solutions. As demand for, and legislation mandating or incentivizing the use of alternative fuel technologies that limit or eliminate greenhouse gas emissions increase, we continue to monitor the market and offer solutions where we have appropriate technology and believe we are well positioned to take advantage of opportunities that may arise if new legislation is enacted. See page 15 for further discussion on climate change in Item 1A. Risk Factors.
Recent Acquisitions and Joint Ventures
Over the last three years, we have devoted resources to acquisitions and joint ventures, including the subsequent integration of acquired businesses. These acquisitions and joint ventures have expanded our base business, provided our customers with a wider array of products and presented new alternatives for discovery through additional chemistries. Following is a summary of our acquisitions and joint ventures during recent years.
On October 8, 2013, we announced the expansion of our presence in the electronic materials market with the acquisition of Cambridge Chemical Company, Ltd., effective October 1, 2013. Based in Cambridge, UK, Cambridge Chemical is a key technology player for producing high purity metal organic chemicals used in the laser market. Cambridge Chemical’s technology and products will further strengthen Albemarle’s offerings in the electronic market including LED, semiconductor, OLED and now laser. Albemarle will also benefit from a number of R&D and distribution synergies resulting from the acquisition.
On May 11, 2011, we announced that we had expanded our presence in the biofuels market with the acquisition of Catilin Inc., based in Ames, Iowa.
On September 13, 2010, we announced the purchase of certain property and equipment in Yeosu, South Korea in connection with our plans for building a metallocene polyolefin catalyst and trimethyl gallium (TMG) manufacturing site. The site will effectively mirror Albemarle’s world scale metallocene polyolefin catalyst and TMG capabilities located in Baton Rouge, Louisiana. Commercial production of metallocene polyolefin catalysts and co-catalysts began in July 2013 and commercial production of TMG is expected to begin in August 2014.
On October 27, 2009, we entered into an agreement with Saudi Specialty Chemicals Company, an affiliate of Saudi Basic Industries Corporation (SABIC), to form a joint venture called Saudi Organometallic Chemicals Company (SOCC). Under the terms of the joint venture agreement, the two parent companies have built a world-scale organometallics production facility strategically located in the Arabian gulf industrial city of Al-Jubail. This facility is now operational and available for full commercial production once customer qualifications are completed.
Employees
As of
December 31, 2013
, we had
4,231
employees of whom
2,148
, or
51%
, are employed in the U.S.;
1,152
, or
27%
, are employed in Europe;
590
, or
14%
, are employed in Asia and
341
, or
8%
, are employed in the Middle East. Approximately
14%
of our U.S. employees are unionized. We have bargaining agreements at three of our U.S. locations:
|
•
|
Baton Rouge, Louisiana—United Steel Workers (USW);
|
|
•
|
Orangeburg, South Carolina—International Brotherhood of Teamsters-Industrial Trades Division (IBT); and
|
|
•
|
Pasadena, Texas—USW; Sheet Metal Workers International Association (SMWIA); United Association of Journeymen & Apprentices of Plumbing and Pipefitting Industry (UAJAPPI); and International Brotherhood of Electrical Workers (IBEW).
|
We believe that we have good working relationships with these unions, and we have operated without a labor work stoppage at each of these locations for more than 20 years. Bargaining agreements expire at our Pasadena, Texas location in 2014, our Baton Rouge, Louisiana location in 2015 and our Orangeburg, South Carolina location in 2016.
We have two works councils representing the majority of our European sites—Amsterdam, the Netherlands and Bergheim, Germany—covering approximately
900
employees. We believe that we have a generally good relationship with these councils and bargaining representatives.
10
|
Albemarle Corporation and Subsidiaries
|
||
During 2013, we recorded workforce reduction charges of approximately $33.4 million in connection with the realignment of our operating segments effective January 1, 2014, which will result in a reduction of approximately 230 employees worldwide in 2014. During 2012, we recorded workforce reduction charges of approximately $21.6 million in connection with our exit of the phosphorus flame retardants business, whose products were sourced mainly at our Avonmouth, United Kingdom and Nanjing, China manufacturing sites.
Available Information
Our internet website address is
http://www.albemarle.com
. We make available free of charge through our website our Annual Report on Form 10-K, Quarterly Reports on Form 10-Q, Current Reports on Form 8-K and amendments to those reports filed or furnished pursuant to Section 13(a) or 15(d) of the Securities Exchange Act of 1934, as amended (Exchange Act), as well as reports on Forms 3, 4 and 5 filed pursuant to Section 16 of the Exchange Act, as soon as reasonably practicable after such documents are electronically filed with, or furnished to, the Securities and Exchange Commission (SEC). The information on our website is not, and shall not be deemed to be, a part of this report or incorporated into any other filings we make with the SEC. These reports may also be obtained at the SEC’s Public Reference Room at 100 F Street, N.E., Washington, DC 20549. The SEC also maintains a website at
http://www.sec.gov
that contains reports, proxy statements and other information regarding SEC registrants, including Albemarle.
Our Corporate Governance Guidelines, Code of Business Conduct and the charters of the Audit and Finance, Health, Safety and Environment, Executive Compensation, and Nominating and Governance Committees are also available on our website and are available in print to any shareholder upon request by writing to Investor Relations, 451 Florida Street, Baton Rouge, Louisiana 70801, or by calling (225) 388-8011.
|
Item 1A.
|
Risk Factors.
|
You should consider carefully the following risks when reading the information, including the financial information, contained in this Annual Report on Form 10-K.
Adverse conditions in the global economy and volatility and disruption of financial markets can negatively impact our customers and suppliers and therefore have a material adverse effect on our results of operations.
A global economic downturn may reduce customer demand or inhibit our ability to produce our products, negatively impacting our operating results. Our business and operating results have been and will continue to be sensitive to global economic downturns (including credit market tightness which can impact our liquidity as well as our customers and suppliers), declining consumer and business confidence, fluctuating commodity prices, volatile exchange rates and other challenges that can affect the global economy. Our customers may experience deterioration of their businesses, cash flow shortages and difficulty obtaining financing. As a result, existing or potential customers can delay or cancel plans to purchase products and may not be able to fulfill their obligations in a timely fashion. Further, suppliers may be experiencing similar conditions, which could impact their ability to fulfill their obligations to us. If the current weakness in much of the global economy continues for an extended period or deepens significantly, our results of operations, financial condition and cash flows could be materially adversely affected.
In the U.S., the uncertainty regarding government shutdowns and threatened shutdowns, significant mandated tax increases, government debt ceiling limitations, sequestration and government spending cuts and budget negotiations pose a serious risk for the U.S. economy and consumer confidence. In the event that the U.S. federal government is unable to achieve a resolution of these issues, there could be an adverse impact on the U.S. economy which could negatively impact our revenues and earnings.
Our inability to pass through increases in costs and expenses for raw materials and energy, on a timely basis or at all, could have a material adverse effect on the margins of our products.
Our raw material and energy costs can be volatile and may increase significantly. Increases are primarily driven by significantly tighter market conditions and major increases in the pricing of basic building blocks for our products such as crude oil, chlorine and metals (including molybdenum and rare earths which are used in the refinery catalysts business). We generally attempt to pass through changes in the prices of raw materials and energy to our customers, but we may be unable to or be delayed in doing so. Our inability to efficiently and effectively pass through price increases, or inventory impacts resulting from price volatility, could adversely affect our margins. In addition to raising prices, raw material suppliers may extend lead times or limit supplies. Constraints on the supply or delivery of critical raw materials could disrupt production and adversely affect the performance of our business.
11
|
Albemarle Corporation and Subsidiaries
|
||
We face competition from other specialty chemical companies, which places downward pressure on the prices and margins of our products.
We operate in a highly competitive marketplace, competing against a number of domestic and foreign specialty chemical producers. Competition is based on several key criteria, including product performance and quality, product price, product availability and security of supply and responsiveness of product development in cooperation with customers and customer service. Some of our competitors are larger than we are and may have greater financial resources. These competitors may also be able to maintain significantly greater operating and financial flexibility than we do. As a result, these competitors may be better able to withstand changes in conditions within our industry, changes in the prices of raw materials and energy and in general economic conditions. Additionally, competitors’ pricing decisions could compel us to decrease our prices, which could affect our margins and profitability adversely. Our ability to maintain or increase our profitability is, and will continue to be, dependent upon our ability to offset decreases in the prices and margins of our products by improving production efficiency and volume, shifting to higher margin chemical products and improving existing products through innovation and research and development. If we are unable to do so or to otherwise maintain our competitive position, we could lose market share to our competitors.
Albemarle’s brands, product image and trademarks represent the unique product identity of each of our products and are important symbols of the Company’s reputation. Accordingly, the performance of our business could be adversely affected by any marketing and promotional materials used by our competitors that make false or unsubstantiated claims, implies immoral or improper conduct or is otherwise disparaging to our Company or its products. Further, our own actions could hurt such brands, product image and trademarks if our products underperform or we otherwise draw negative publicity.
Downturns in our customers’ cyclical industries could adversely affect our sales and profitability.
Downturns in the businesses that use our specialty chemicals will adversely affect our sales. Many of our customers are in industries, including the electronics, building and construction and automotive industries, that are cyclical in nature and sensitive to changes in general economic conditions. Historically, downturns in general economic conditions have resulted in diminished product demand, excess manufacturing capacity and lower average selling prices, and we may experience similar problems in the future. A decline in economic conditions in our customers’ cyclical industries may have a material adverse effect on our sales and profitability.
Our results are subject to fluctuation because of irregularities in the demand for our HPC catalysts and certain of our agrichemicals.
Our HPC catalysts are used by petroleum refiners in their processing units to reduce the quantity of sulfur and other impurities in petroleum products. The effectiveness of HPC catalysts diminishes with use, requiring the HPC catalysts to be replaced, on average, once every one to three years. The sales of our HPC catalysts, therefore, are largely dependent on the useful life cycle of the HPC catalysts in the processing units and may vary materially by quarter. In addition, the timing and profitability of HPC catalysts sales can have a significant impact on revenue and profit in any one quarter. Sales of our agrichemicals are also subject to fluctuation as demand varies depending on climate and other environmental conditions, which may prevent or reduce farming for extended periods. In addition, crop pricing and timing of when farms alternate from one crop to another crop in a particular year can also alter sales of agrichemicals.
Changes in our customers’ products can reduce the demand for our specialty chemicals.
Our customers use our specialty chemicals for a broad range of applications. Changes in our customers’ products or processes may enable our customers to reduce consumption of the specialty chemicals that we produce or make our specialty chemicals unnecessary. Customers may also find alternative materials or processes that no longer require our products. For example, many of our flame retardants are incorporated into resin systems to enhance the flame retardancy of a particular polymer. Should a customer decide to use a different polymer due to price, performance or other considerations, we may not be able to supply a product that meets the customer’s new requirements. Consequently, it is important that we develop new products to replace the sales of products that mature and decline in use. Our business, results of operations, cash flows and margins could be materially adversely affected if we are unable to manage successfully the maturation of our existing products and the introduction of new products.
12
|
Albemarle Corporation and Subsidiaries
|
||
Our research and development efforts may not succeed and our competitors may develop more effective or successful products.
The specialty chemicals industry is subject to periodic technological change and ongoing product improvements. In order to maintain our margins and remain competitive, we must successfully develop, manufacture and market new or improved products. As a result, we must commit substantial resources each year to research and development. Ongoing investments in research and development for future products could result in higher costs without a proportional increase in revenues. Additionally, for any new product program, there is a risk of technical or market failure in which case we may not be able to develop the new commercial products needed to maintain our competitive position or we may need to commit additional resources to new product development programs. Moreover, new products may have lower margins than the products they replace.
We also expect competition to increase as our competitors develop and introduce new and enhanced products. For example, we are experiencing increased competition from large-scale producers of pharmachemicals, particularly from Asian producers, and, our petroleum refinery customers are processing crude oil feedstocks of declining quality while at the same time operating under increasingly stringent regulations requiring the gasoline, diesel and other fuels they produce to contain fewer impurities, including sulfur. As a result, our petroleum refining customers are demanding more effective and more cost-effective catalysts products. As new products enter the market, our products may become obsolete or competitors’ products may be marketed more effectively than our products. If we fail to develop new products, maintain or improve our margins with our new products or keep pace with technological developments, our business, financial condition, results of operations and cash flows will suffer.
Our inability to protect our intellectual property rights could have a material adverse effect on our business, financial condition and results of operations.
Protection of our proprietary processes, methods and compounds and other technology is important to our business. We generally rely on patent, trade secret, trademark and copyright laws of the U.S. and certain other countries in which our products are produced or sold, as well as licenses and nondisclosure and confidentiality agreements, to protect our intellectual property rights. The patent, trade secret, trademark and copyright laws of some countries may not protect our intellectual property rights to the same extent as the laws of the U.S. Failure to protect our intellectual property rights may result in the loss of valuable proprietary technologies. Additionally, some of our technologies are not covered by any patent or patent application and, even if a patent application has been filed, it may not result in an issued patent. If patents are issued to us, those patents may not provide meaningful protection against competitors or against competitive technologies. We cannot assure you that our intellectual property rights will not be challenged, invalidated, circumvented or rendered unenforceable.
We could face patent infringement claims from our competitors or others alleging that our processes or products infringe on their proprietary technologies. If we are found to be infringing on the proprietary technology of others, we may be liable for damages and we may be required to change our processes, redesign our products partially or completely, pay to use the technology of others, stop using certain technologies or stop producing the infringing product entirely. Even if we ultimately prevail in an infringement suit, the existence of the suit could prompt customers to switch to products that are not the subject of infringement suits. We may not prevail in intellectual property litigation and such litigation may result in significant legal costs or otherwise impede our ability to produce and distribute key products.
We also rely upon unpatented proprietary manufacturing expertise, continuing technological innovation and other trade secrets to develop and maintain our competitive position. While we generally enter into confidentiality agreements with our employees and third parties to protect our intellectual property, we cannot assure you that our confidentiality agreements will not be breached, that they will provide meaningful protection for our trade secrets and proprietary manufacturing expertise or that adequate remedies will be available in the event of an unauthorized use or disclosure of our trade secrets or manufacturing expertise.
Our business and operations could suffer in the event of cyber-security breaches.
Attempts by others to gain unauthorized access to our information technology systems become more sophisticated over time. These attempts, which might be related to industrial or other espionage, include covertly introducing malware to our computers and networks and impersonating authorized users, among others. We seek to detect and investigate all security incidents and to prevent their recurrence, but in some cases we might be unaware of an incident or its magnitude and effects. The theft, unauthorized use or publication of our intellectual property and/or confidential business information could harm our competitive position, reduce the value of our investment in research and development and other strategic initiatives or
13
|
Albemarle Corporation and Subsidiaries
|
||
otherwise adversely affect our business. To the extent that any cyber-security breach results in inappropriate disclosure of our customers’ or licensees’ confidential information, we may incur liability as a result.
Our substantial international operations subject us to risks of doing business in foreign countries, which could adversely affect our business, financial condition and results of operations.
We conduct a substantial portion of our business outside of the U.S. We and our joint ventures currently have 34 facilities located outside the U.S., including facilities and offices located in Austria, Australia, Belgium, Brazil, France, Germany, Hungary, India, Italy, Japan, Jordan, Korea, the Netherlands, the People’s Republic of China, Russia, Saudi Arabia, Singapore, United Arab Emirates and the United Kingdom. We expect sales from international markets to continue to represent a significant portion of our net sales and the net sales of our joint ventures. Accordingly, our business is subject to risks related to the differing legal, political, social and regulatory requirements and economic conditions of many jurisdictions. Risks inherent in international operations include the following:
|
•
|
fluctuations in foreign currency exchange rates may affect product demand and may adversely affect the profitability in U.S. Dollars of products and services we provide in international markets where payment for our products and services is made in the local currency;
|
|
•
|
transportation and other shipping costs may increase;
|
|
•
|
intellectual property rights may be more difficult to enforce;
|
|
•
|
changes in foreign laws and tax rates or U.S. laws and tax rates with respect to foreign income may unexpectedly increase the rate at which our income is taxed, impose new and additional taxes or cause the loss of previously recorded tax benefits;
|
|
•
|
foreign countries may adopt other restrictions on foreign trade or investment, including currency exchange controls;
|
|
•
|
trade sanctions could result in losing access to customers and suppliers in those countries;
|
|
•
|
unexpected adverse changes in foreign laws or regulatory requirements may occur;
|
|
•
|
agreements may be difficult to enforce and receivables difficult to collect;
|
|
•
|
compliance with a variety of foreign laws and regulations may be burdensome;
|
|
•
|
compliance with anti-bribery and anti-corruption laws may be costly;
|
|
•
|
unexpected adverse changes in export duties, quotas and tariffs and difficulties in obtaining export licenses;
|
|
•
|
general economic conditions in the countries in which we operate could have an adverse effect on our earnings from operations in those countries;
|
|
•
|
foreign operations may experience staffing difficulties and labor disputes;
|
|
•
|
foreign governments may nationalize private enterprises; and
|
|
•
|
our business and profitability in a particular country could be affected by political or economic repercussions from terrorist activities and the response to such activities.
|
In addition, certain of our joint ventures operate, and we have ongoing capital projects in, high-risk regions of the world such as the Middle East and South America. Unanticipated events such as geopolitical changes could result in a write-down of our investment in the affected joint venture or a delay or cancellation of those capital projects, which could negatively impact our future growth and profitability. Our success as a global business will depend, in part, upon our ability to succeed in differing legal, regulatory, economic, social and political conditions by developing, implementing and maintaining policies and strategies that are effective in each location where we and our joint ventures do business.
We are exposed to fluctuations in foreign exchange rates, which may adversely affect our operating results and net income.
We conduct our business and incur costs in the local currency of most of the countries in which we operate. The financial condition and results of operations of each foreign operating subsidiary and joint venture are reported in the relevant local currency and then translated to U.S. Dollars at the applicable currency exchange rate for inclusion in our consolidated financial statements. Changes in exchange rates between these foreign currencies and the U.S. Dollar will affect the recorded levels of our assets, liabilities, net sales, cost of goods sold and operating margins and could result in exchange losses. The primary currencies to which we have exposure are the European Union Euro, Japanese Yen, British Pound Sterling, Korean Won, Chinese Renminbi, Brazilian Real and the U.S. Dollar (in certain of our foreign locations). Exchange rates between these currencies and the U.S. Dollar in recent years have fluctuated significantly and may do so in the future. With respect to our potential exposure to foreign currency fluctuations and devaluations, for the year ended
December 31, 2013
, approximately
26%
of our net sales were denominated in such currencies. Significant changes in these foreign currencies relative to the U.S. Dollar could also have an adverse effect on our ability to meet interest and principal payments on any foreign currency-
14
|
Albemarle Corporation and Subsidiaries
|
||
denominated debt outstanding. In addition to currency translation risks, we incur currency transaction risks whenever one of our operating subsidiaries or joint ventures enters into either a purchase or a sales transaction using a different currency from its functional currency. Our operating results and net income may be affected by any volatility in currency exchange rates and our ability to manage effectively our currency transaction and translation risks.
We incur substantial costs in order to comply with extensive environmental, health and safety laws and regulations.
In the jurisdictions in which we operate, we are subject to numerous federal, state and local environmental, health and safety laws and regulations, including those governing the discharge of pollutants into the air and water, the management and disposal of hazardous substances and wastes and the cleanup of contaminated properties. Ongoing compliance with such laws and regulations is an important consideration for us and we incur substantial capital and operating costs in our compliance efforts. Environmental laws have become increasingly strict in recent years. We expect this trend to continue and anticipate that compliance will continue to require increased capital expenditures and operating costs.
Violations of environmental, health and safety laws and regulations may subject us to fines, penalties and other liabilities and may require us to change certain business practices or curtail production.
If we violate environmental, health and safety laws or regulations, in addition to being required to correct such violations, we can be held liable in administrative, civil or criminal proceedings for substantial fines and other sanctions could be imposed that could disrupt or limit our operations. Liabilities associated with the investigation and cleanup of hazardous substances, as well as personal injury, property damages or natural resource damages arising from the release of, or exposure to, such hazardous substances, may be imposed in many situations without regard to violations of laws or regulations or other fault, and may also be imposed jointly and severally (so that a responsible party may be held liable for more than its share of the losses involved, or even the entire loss). Such liabilities may also be imposed on many different entities with a relationship to the hazardous substances at issue, including, for example, entities that formerly owned or operated the property affected by the hazardous substances and entities that arranged for the disposal of the hazardous substances at the affected property, as well as entities that currently own or operate such property. Such liabilities can be difficult to identify and the extent of any such liabilities can be difficult to predict. We use, and in the past have used, hazardous substances at many of our facilities, and we have in the past, and may in the future, be subject to claims relating to exposure to hazardous materials and the associated liabilities may be material. We also have generated, and continue to generate, hazardous wastes at a number of our facilities. Some of our facilities also have lengthy histories of manufacturing or other activities that have resulted in site contamination. We have also given contractual indemnities for environmental conditions relating to facilities we no longer own or operate. The nature of our business, including historical operations at our current and former facilities, exposes us to risks of liability under these laws and regulations due to the production, storage, use, transportation and sale of materials that can cause contamination or personal injury if released into the environment. Additional information may arise in the future concerning the nature or extent of our liability with respect to identified sites, and additional sites may be identified for which we are alleged to be liable, that could cause us to materially increase our environmental accrual or the upper range of the costs we believe we could reasonably incur for such matters.
Contractual indemnities may be ineffective in protecting us from environmental liabilities.
At several of our properties where hazardous substances are known to exist (including some sites where hazardous substances are being investigated or remediated), we believe we are entitled to contractual indemnification from one or more former owners or operators; however, in the event we make a claim, the indemnifier may disagree with us or not have the financial capacity to fulfill its indemnity obligation. If our contractual indemnity is not upheld or effective, our accrual and/or our costs for the investigation and cleanup of hazardous substances could increase materially.
We may be exposed to certain regulatory and financial risks related to climate change.
Growing concerns about climate change may result in the imposition of additional regulations or restrictions to which we may become subject. Climate changes include changes in rainfall and in storm patterns and intensities, water shortages, significantly changing sea levels and increasing atmospheric and water temperatures, among others. For example, there has been increasing concern regarding the declining water level of the Dead Sea, from which our joint venture, JBC, produces bromine. A number of governments or governmental bodies have introduced or are contemplating regulatory changes in response to climate change. For example, some of our operations are within jurisdictions that have, or are developing, regulatory regimes governing greenhouse gas emissions. Potentially, additional U.S. federal regulation will be forthcoming with respect to greenhouse gas emissions (including carbon dioxide (CO
2
)) and/or “cap and trade” legislation that could have impacts on our operations. In addition, we have operations in the European Union, Brazil, China, Japan, Jordan, Saudi Arabia, Singapore and the United Arab Emirates, which have implemented measures to achieve objectives under the Kyoto Protocol, an
15
|
Albemarle Corporation and Subsidiaries
|
||
international agreement linked to the United Nations Framework Convention on Climate Change (UNFCC), which set binding targets for reducing greenhouse gas emissions. The first commitment period under the Kyoto Protocol expired in 2012. An amendment was passed by the UNFCC during the December 2012 Doha climate change talks that would implement a second commitment period through 2020, but the amendment has not entered into legal force pending acceptance by participating countries. The outcome of new legislation or regulation in the U.S. and other jurisdictions in which we operate may result in new or additional requirements, additional charges to fund energy efficiency activities, fees or restrictions on certain activities. While certain climate change initiatives may result in new business opportunities for us in the area of alternative fuel technologies and emissions control, compliance with these initiatives may also result in additional costs to us, including, among other things, increased production costs, additional taxes, reduced emission allowances or additional restrictions on production or operations. Any adopted future climate change regulations could also negatively impact our ability to compete with companies situated in areas not subject to such limitations. Even without such regulation, increased public awareness and adverse publicity about potential impacts on climate change emanating from us or our industry could harm us. We may not be able to recover the cost of compliance with new or more stringent laws and regulations, which could adversely affect our business and negatively impact our growth. Furthermore, the potential impacts of climate change and related regulation on our customers are highly uncertain and may adversely affect us.
Regulation, or the threat of regulation, of some of our products could have an adverse effect on our sales and profitability.
We manufacture or market a number of products that are or have been the subject of attention by regulatory authorities and environmental interest groups. For example, for many years we have marketed methyl bromide, a chemical that is particularly effective as a soil fumigant. In recent years, the market for methyl bromide has changed significantly, driven by the Montreal Protocol of 1990 and related regulations prompted by findings regarding the chemical’s potential to deplete the ozone layer. Completion of the phase-out of methyl bromide as a fumigant took effect January 1, 2005 with critical uses allowed on an annual basis until feasible alternatives are available.
Over the past decade, there has been increasing scrutiny of certain brominated flame retardants by regulatory authorities, legislative bodies and environmental interest groups in various countries. We manufacture a broad range of brominated flame retardant products, which are used in a variety of applications. Concern about the impact of some of our products on human health or the environment may lead to regulation, or reaction in our markets independent of regulation, that could reduce or eliminate markets for such products.
In 2009, one of our products, HBCD, was designated by European regulators as a Substance of Very High Concern. In February 2011, the European Union included HBCD on a list of substances published under Annex XIV of the REACH regulation. Our expectation is that the sale of HBCD could be banned in Europe under the REACH process as early as August 2015, or by 2019 assuming certain applications are authorized during a period of transition to alternative products. Also, in August 2013, the Stockholm Convention on Persistent Organic Pollutants (POPs) banned HBCD under the Convention effective November 2014, with certain uses exempted to allow time for the development of alternative products. A number of countries may ban HBCD immediately in November 2014, allowing for no period of transition thereby eliminating sales of HBCD in such countries. Our sales of HBCD approximated
1.3%
,
1.9%
, and
2.1%
of our total annual net sales in
2013
,
2012
and
2011
, respectively. There is no assurance that we will be able to develop alternative products in the future that generate sales comparable to HBCD.
Agencies in the European Union continue to evaluate the risks to human health and the environment associated with certain brominated flame retardants such as tetrabromobisphenol A and decabromodiphenylethane, both of which we manufacture. Additional government regulations, including limitations or bans on the use of brominated flame retardants, would likely result in a decline in our net sales of brominated flame retardants and have an adverse effect on our sales and profitability. In addition, the threat of additional regulation or concern about the impact of brominated flame retardants on human health or the environment could lead to a negative reaction in our markets that could reduce or eliminate our markets for these products, which could have an adverse effect on our sales and profitability.
We could be subject to damages based on claims brought against us by our customers or lose customers as a result of the failure of our products to meet certain quality specifications.
Our products provide important performance attributes to our customers’ products. If a product fails to perform in a manner consistent with quality specifications or has a shorter useful life than guaranteed, a customer could seek replacement of the product or damages for costs incurred as a result of the product failing to perform as guaranteed. These risks apply to our refinery catalysts in particular because, in certain instances, we sell our refinery catalysts under agreements that contain limited performance and life cycle guarantees. A successful claim or series of claims against us could have a material adverse effect on our financial condition and results of operations and could result in a loss of one or more customers.
16
|
Albemarle Corporation and Subsidiaries
|
||
Our business is subject to hazards common to chemical businesses, any of which could interrupt our production and adversely affect our results of operations.
Our business is subject to hazards common to chemical manufacturing, storage, handling and transportation, including explosions, fires, inclement weather, natural disasters, mechanical failure, unscheduled downtime, transportation interruptions, remediation, chemical spills, discharges or releases of toxic or hazardous substances or gases and other risks. These hazards can cause personal injury and loss of life, severe damage to, or destruction of, property and equipment and environmental contamination. In addition, the occurrence of material operating problems at our facilities due to any of these hazards may diminish our ability to meet our output goals. Accordingly, these hazards and their consequences could have a material adverse effect on our operations as a whole, including our results of operations and cash flows, both during and after the period of operational difficulties.
Natural disasters and weather-related matters could impact our results of operations.
In 2005 and again in the third quarter of 2008, major hurricanes caused significant disruption to the operations on the U.S. Gulf Coast for many of our customers and our suppliers of certain raw materials, which had an adverse impact on volume and cost for some of our products. If similar weather-related matters or other natural disasters occur in the future, they could negatively affect the results of operations at our sites in the affected regions as well as have adverse impacts on the global economy.
The insurance that we maintain may not fully cover all potential exposures.
We maintain property, business interruption and casualty insurance but such insurance may not cover all risks associated with the hazards of our business and is subject to limitations, including deductibles and maximum liabilities covered. We may incur losses beyond the limits, or outside the coverage, of our insurance policies, including liabilities for environmental remediation. In addition, from time to time, various types of insurance for companies in the specialty chemical industry have not been available on commercially acceptable terms or, in some cases, have not been available at all. We are potentially at additional risk if one or more of our insurance carriers fail. Additionally, severe disruptions in the domestic and global financial markets could adversely impact the ratings and survival of some insurers. Future downgrades in the ratings of enough insurers could adversely impact both the availability of appropriate insurance coverage and its cost. In the future, we may not be able to obtain coverage at current levels, if at all, and our premiums may increase significantly on coverage that we maintain.
We may incur significant charges in the event we close or divest all or part of a manufacturing plant or facility.
We continually assess our manufacturing operations in order to manufacture and distribute our products in the most efficient manner. Based on our assessments, we may make capital improvements to modernize certain units, move manufacturing or distribution capabilities from one plant or facility to another plant or facility, discontinue manufacturing or distributing certain products or close or divest all or part of a manufacturing plant or facility. We also have shared services agreements at several of our plants and if such agreements are terminated or revised, we would assess and potentially adjust our manufacturing operations. The closure or divestiture of all or part of a manufacturing plant or facility could result in future charges that could be significant.
If we are unable to retain key personnel or attract new skilled personnel, it could have an adverse effect on our business.
The unanticipated departure of any key member of our management team could have an adverse effect on our business. In addition, because of the specialized and technical nature of our business, our future performance is dependent on the continued service of, and on our ability to attract and retain, qualified management, scientific, technical, marketing and support personnel. Competition for such personnel is intense, and we may be unable to continue to attract or retain such personnel.
Some of our employees are unionized, represented by workers’ councils or are employed subject to local laws that are less favorable to employers than the laws of the U.S.
As of
December 31, 2013
, we had
4,231
employees. Approximately
14%
of our
2,148
U.S. employees are unionized. Our collective bargaining agreements expire in 2014, 2015 and 2016. In addition, a large number of our employees are employed in countries in which employment laws provide greater bargaining or other rights to employees than the laws of the U.S. Such employment rights require us to work collaboratively with the legal representatives of the employees to effect any changes to labor arrangements. For example, most of our employees in Europe are represented by workers’ councils that must approve any changes in conditions of employment, including salaries and benefits and staff changes, and may impede efforts to restructure our workforce. Although we believe that we have a good working relationship with our employees, a strike, work stoppage,
17
|
Albemarle Corporation and Subsidiaries
|
||
slowdown or significant dispute with our employees could result in a significant disruption of our operations or higher ongoing labor costs.
Our joint ventures may not operate according to their business plans if our partners fail to fulfill their obligations, which may adversely affect our results of operations and may force us to dedicate additional resources to these joint ventures.
We currently participate in a number of joint ventures and may enter into additional joint ventures in the future. The nature of a joint venture requires us to share control with unaffiliated third parties. If our joint venture partners do not fulfill their obligations, the affected joint venture may not be able to operate according to its business plan. In that case, our results of operations may be adversely affected and we may be required to increase the level of our commitment to the joint venture. Also, differences in views among joint venture participants may result in delayed decisions or failures to agree on major issues. If these differences cause the joint ventures to deviate from their business plans, our results of operations could be adversely affected.
We may not be able to consummate future acquisitions or integrate future acquisitions into our business, which could result in unanticipated expenses and losses.
As part of our business growth strategy, we have acquired businesses and entered into joint ventures in the past and intend to pursue acquisitions and joint venture opportunities in the future. Our ability to implement this component of our growth strategy will be limited by our ability to identify appropriate acquisition or joint venture candidates and our financial resources, including available cash and borrowing capacity. The expense incurred in consummating acquisitions or entering into joint ventures, the time it takes to integrate an acquisition or our failure to integrate businesses successfully, could result in unanticipated expenses and losses. Furthermore, we may not be able to realize any of the anticipated benefits from acquisitions or joint ventures.
The process of integrating acquired operations into our existing operations may result in unforeseen operating difficulties and may require significant financial resources that would otherwise be available for the ongoing development or expansion of existing operations. Some of the risks associated with the integration of acquisitions include:
|
•
|
potential disruption of our ongoing business and distraction of management;
|
|
•
|
unforeseen claims and liabilities, including unexpected environmental exposures;
|
|
•
|
unforeseen adjustments, charges and write-offs;
|
|
•
|
problems enforcing the indemnification obligations of sellers of businesses or joint venture partners for claims and liabilities;
|
|
•
|
unexpected losses of customers of, or suppliers to, the acquired business;
|
|
•
|
difficulty in conforming the acquired businesses’ standards, processes, procedures and controls with our operations;
|
|
•
|
variability in financial information arising from the implementation of purchase price accounting;
|
|
•
|
inability to coordinate new product and process development;
|
|
•
|
loss of senior managers and other critical personnel and problems with new labor unions; and
|
|
•
|
challenges arising from the increased scope, geographic diversity and complexity of our operations.
|
Although our pension plans currently meet minimum funding requirements, events could occur that would require us to make significant contributions to the plans and reduce the cash available for our business.
We have several defined benefit pension plans around the world, including in the U.S., the Netherlands, Germany, Belgium, and Japan, covering most of our employees. The U.S. plans represent approximately
93%
of the total liabilities of the plans worldwide. We are required to make cash contributions to our pension plans to the extent necessary to comply with minimum funding requirements imposed by the various countries’ benefit and tax laws. The amount of any such required contributions will be determined annually based on an actuarial valuation of the plans as performed by the plans’ actuaries.
During 2011, we made voluntary contributions of $50.0 million to our U.S. qualified defined benefit pension plans. Under the Pension Protection Act of 2006, we anticipate no required cash contributions during 2014 for our U.S. qualified defined benefit pension plans. Additional voluntary pension contributions in and after
2014
may vary depending on factors such as asset returns, interest rates, and legislative changes. The amounts we may elect or be required to contribute to our pension plans in the future may increase significantly. These contributions could be substantial and would reduce the cash available for our business.
18
|
Albemarle Corporation and Subsidiaries
|
||
The occurrence or threat of extraordinary events, including domestic and international terrorist attacks, may disrupt our operations and decrease demand for our products.
Chemical-related assets may be at greater risk of future terrorist attacks than other possible targets in the U.S. and throughout the world. As a result, we are subject to existing federal rules and regulations (and may be subject to additional legislation or regulations in the future) that impose site security requirements on chemical manufacturing facilities, which increase our overhead expenses.
We are also subject to federal regulations that have heightened security requirements for the transportation of hazardous chemicals in the U.S. We believe we have met these requirements but additional federal and local regulations that limit the distribution of hazardous materials are being considered. We ship and receive materials that are classified as hazardous. Bans on movement of hazardous materials through cities, like Washington, D.C., could affect the efficiency of our logistical operations. Broader restrictions on hazardous material movements could lead to additional investment to produce hazardous raw materials and change where and what products we manufacture.
The occurrence of extraordinary events, including future terrorist attacks and the outbreak or escalation of hostilities, cannot be predicted, and their occurrence can be expected to continue to negatively affect the economy in general and specifically the markets for our products. The resulting damage from a direct attack on our assets, or assets used by us, could include loss of life and property damage. In addition, available insurance coverage may not be sufficient to cover all of the damage incurred or, if available, may be prohibitively expensive.
We will need a significant amount of cash to service our indebtedness and our ability to generate cash depends on many factors beyond our control.
Our ability to generate sufficient cash flow from operations to make scheduled payments on our debt depends on a range of economic, competitive and business factors, many of which are outside our control. Our business may not generate sufficient cash flow from operations to service our debt obligations. If we are unable to service our debt obligations, we may need to refinance all or a portion of our indebtedness on or before maturity, reduce or delay capital expenditures, sell assets or raise additional equity. We may not be able to refinance any of our indebtedness, sell assets or raise additional equity on commercially reasonable terms or at all, which could cause us to default on our obligations and impair our liquidity. Our inability to generate sufficient cash flow to satisfy our debt obligations, or to refinance our obligations on commercially reasonable terms, could have a material adverse effect on our business and financial condition.
Restrictive covenants in our debt instruments may adversely affect our business.
Our February 2014 credit agreement and the indentures governing our senior notes contain select restrictive covenants. These covenants provide constraints on our financial flexibility. The failure to comply with the covenants in our February 2014 credit agreement, the indentures governing the senior notes and the agreements governing other indebtedness, including indebtedness incurred in the future, could result in an event of default, which, if not cured or waived, could have a material adverse effect on our business, financial condition and results of operations. See “Financial Condition and Liquidity—Long-Term Debt” in Item 7. Management’s Discussion and Analysis of Financial Condition and Results of Operations on pa
ge 47.
A downgrade of the ratings on our debt or an increase in interest rates will cause our debt service obligations to increase.
Borrowings under our February 2014 credit agreement and our commercial paper program bear interest at floating rates. The rates under the February 2014 credit agreement are subject to adjustment based on the ratings of our senior unsecured long-term debt by Standard & Poor’s Ratings Services (S&P) and Moody’s Investors Services (Moody’s). S&P has rated our senior unsecured long-term debt as BBB+ and Moody’s has rated our senior unsecured long-term debt as Baa1. S&P has rated our commercial paper as A-2 and Moody’s has rated it as P-2. S&P and/or Moody’s may downgrade our ratings in the future. The downgrading of any of our ratings or an increase in any of the benchmark interest rates would result in an increase of our interest expense on our variable rate borrowings.
19
|
Albemarle Corporation and Subsidiaries
|
||
Changes in credit ratings issued by nationally recognized statistical rating organizations could adversely affect our cost of financing and the market price of our securities.
Credit rating agencies rate our debt securities on factors that include our operating results, actions that we take, their view of the general outlook for our industry and their view of the general outlook for the economy. Actions taken by the rating agencies can include maintaining, upgrading or downgrading the current rating or placing us on a watch list for possible future downgrading. Downgrading the credit rating of our debt securities or placing us on a watch list for possible future downgrading would likely increase our cost of future financing, could limit our access to the capital markets and have an adverse effect on the market price of our securities.
Because a significant portion of our operations is conducted through our subsidiaries and joint ventures, our ability to service our debt may be dependent on our receipt of distributions or other payments from our subsidiaries and joint ventures.
A significant portion of our operations is conducted through our subsidiaries and joint ventures. As a result, our ability to service our debt may be partially dependent on the earnings of our subsidiaries and joint ventures and the payment of those earnings to us in the form of dividends, loans or advances and through repayment of loans or advances from us. Payments to us by our subsidiaries and joint ventures will be contingent upon our subsidiaries’ or joint ventures’ earnings and other business considerations and may be subject to statutory or contractual restrictions. In addition, there may be significant tax and other legal restrictions on the ability of non-U.S. subsidiaries or joint ventures to remit money to us.
The instruments governing our indebtedness do not limit our acquisitions and may allow us to incur additional indebtedness, including indebtedness in relation to acquisitions.
We have historically expanded our business primarily through acquisitions. A part of our business strategy is to continue to grow through acquisitions that complement and expand our distribution network. The terms of our indebtedness do not limit the number or scale of acquisitions that we may complete. Because the consummation of acquisitions and integration of acquired businesses involves significant risk, this means that investors in our securities will be subject to the risks inherent in our acquisition strategy.
|
Item 1B.
|
Unresolved Staff Comments.
|
NONE
|
Item 2.
|
Properties.
|
We operate on a global basis. We believe that our production facilities, research and development facilities, and administrative and sales offices are generally well maintained, effectively used and are adequate to operate our business. During
2013
, the Company’s manufacturing plants operated at appro
ximately
65%
capacity in
the aggregate.
Set forth below is information at
December 31, 2013
regarding our significant facilities operated by our joint ventures and us:
|
Location
|
Principal Use
|
Owned/Leased
|
||
|
Amsterdam, the Netherlands
|
Production of refinery catalysts, research and product development activities
|
Owned
|
||
|
Baton Rouge, Louisiana
|
Research and product development activities, and production of flame retardants, catalysts and additives
|
Owned; on leased land
|
||
|
Baton Rouge, Louisiana
|
Principal executive offices
|
Leased
|
||
|
Beijing, China
|
Regional sales and administrative offices
|
Leased
|
||
|
Bergheim, Germany
|
Production of flame retardants and specialty products based on aluminum trihydrate and aluminum oxide, and research and product development activities
|
Owned
|
||
20
|
Albemarle Corporation and Subsidiaries
|
||
|
Location
|
Principal Use
|
Owned/Leased
|
||
|
Bitterfeld, Germany
|
Refinery catalyst regeneration, rejuvenation, and sulfiding
|
Owned by Eurecat S.A., a joint venture owned 50% by each of IFP Investissements and us
|
||
|
Budapest, Hungary
|
Regional shared services office
|
Leased
|
||
|
Cambridge, United Kingdom
|
Production of performance catalysts
|
Leased
|
||
|
Dalian, China
|
Regional shared services office
|
Leased
|
||
|
Dubai, United Arab Emirates
|
Regional sales and administrative offices
|
Leased
|
||
|
Houston, Texas
|
Regional sales and administrative offices
|
Leased
|
||
|
Jin Shan District, Shanghai, China
|
Production of antioxidants and polymer intermediates
|
Owned; on leased land
|
||
|
Jubail, Saudi Arabia
|
Manufacturing and marketing of organometallics
|
Owned; Albemarle Netherlands BV and Saudi Specialty Chemicals Company (a SABIC affiliate) each owns 50% interest
|
||
|
Louvain-la-Neuve, Belgium
|
Regional offices and research and customer technical service activities
|
Owned
|
||
|
La Voulte, France
|
Refinery catalysts regeneration and treatment, research and development activities
|
Owned by Eurecat S.A., a joint venture owned 50% by each of IFP Investissements and us
|
||
|
Magnolia, Arkansas
|
Production of flame retardants, bromine, inorganic bromides, agricultural intermediates and tertiary amines
|
Owned
|
||
|
McAlester, Oklahoma
|
Refinery catalyst regeneration, rejuvenation, pre-reclaim burn off, as well as specialty zeolites and additives marketing activities
|
Owned by Eurecat S.A., a joint venture owned 50% by each of IFP Investissements and us
|
||
|
Mobile, Alabama
|
Production of tin stabilizers
|
Owned by PMC Group, Inc. which operates the plant for Stannica LLC, a joint venture in which we and PMC Group Inc. each own a 50% interest
|
||
|
Moscow, Russia
|
Regional sales and administrative offices
|
Leased
|
||
|
Niihama, Japan
|
Production of refinery catalysts
|
Leased by Nippon Ketjen Company Limited, a joint venture owned 50% by each of Sumitomo Metal Mining Company Limited and us
|
||
|
Ninghai County, Zhejiang Province, China
|
Production of antioxidants and polymer intermediates
|
Owned; on leased land
|
||
|
Orangeburg, South Carolina
|
Production of flame retardants, aluminum alkyls and fine chemistry products, including pharmaceutical actives, fuel additives, orthoalkylated phenols, polymer modifiers and phenolic antioxidants
|
Owned
|
||
21
|
Albemarle Corporation and Subsidiaries
|
||
|
Location
|
Principal Use
|
Owned/Leased
|
||
|
Pasadena, Texas
|
Production of aluminum alkyls, alkenyl succinic anhydride, orthoalkylated anilines, and other specialty chemicals
|
Owned
|
||
|
Pasadena, Texas
|
Production of refinery catalysts, research and development activities
|
Owned
|
||
|
Pasadena, Texas
|
Refinery catalysts regeneration services
|
Owned by Eurecat U.S. Incorporated, a joint venture in which we own a 57.5% interest and a consortium of entities in various proportions owns the remaining interest
|
||
|
Safi, Jordan
|
Production of bromine and derivatives and flame retardants
|
Owned and leased by JBC, a joint venture owned 50% by each of Arab Potash Company Limited and us
|
||
|
St. Jakobs/Breitenau, Austria
|
Production of specialty magnesium hydroxide products
|
Leased by Magnifin Magnesiaprodukte GmbH & Co. KG, a joint venture owned 50% by each of Radex Heraklith Industriebeteiligung AG and us
|
||
|
Santa Cruz, Brazil
|
Production of catalysts, research and product development activities
|
Owned by Fábrica Carioca de Catalisadores S.A, a joint venture owned 50% by each of Petrobras Química S.A.—PETROQUISA and us
|
||
|
Seoul, South Korea
|
Regional sales and administrative offices
|
Leased
|
||
|
Shandong, China
|
Regional sales and administrative offices
|
Owned by Shandong Sinobrom, a joint venture in which we own a 75% interest, and Weifang Rui Yin Investment Management and Consultancy Co. Ltd., owns a 25% interest
|
||
|
Shanghai, China
|
Regional sales and administrative offices
|
Leased
|
||
|
Singapore
|
Regional sales and administrative offices
|
Leased
|
||
|
South Haven, Michigan
|
Production of custom fine chemistry products including pharmaceutical actives
|
Owned
|
||
|
Taipei, Taiwan
|
Regional sales and administrative office
|
Leased
|
||
|
Takaishi City, Osaka, Japan
|
Production of aluminum alkyls
|
Owned by Nippon Aluminum Alkys, a joint venture owned 50% by each of Mitsui Chemicals, Inc. and us
|
||
|
Tokyo, Japan
|
Regional sales and administrative offices
|
Leased
|
||
|
Tokyo, Japan
|
Administrative offices
|
Leased by Nippon Ketjen Co., Ltd., a joint venture 50% owned by each of Sumitomo Metal Mining Co. Ltd. and us
|
||
|
Tokyo, Japan
|
Regional sales and administrative offices
|
Leased by Nippon Aluminum Alkyls, a joint venture owned 50% by each of Mitsui Chemicals, Inc. and us
|
||
|
Twinsburg, Ohio
|
Production of bromine-activated carbon
|
Leased
|
||
|
Tyrone, Pennsylvania
|
Production of custom fine chemistry products, agricultural intermediates, performance polymer products and research and development activities
|
Owned
|
||
|
Yeosu, South Korea
|
Research and product development activities/small scale production of catalysts and catalyst components
|
Owned
|
||
22
|
Albemarle Corporation and Subsidiaries
|
||
|
Item 3.
|
Legal Proceedings.
|
On July 3, 2006, we received a Notice of Violation (the 2006 NOV) from the U.S. Environmental Protection Agency Region 4 (EPA) regarding the implementation of the Pharmaceutical Maximum Achievable Control Technology standards at our plant in Orangeburg, South Carolina. The alleged violations involve (i) the applicability of the specific regulations to certain intermediates manufactured at the plant, (ii) failure to comply with certain reporting requirements, (iii) improper evaluation and testing to properly implement the regulations and (iv) the sufficiency of the leak detection and repair program at the plant. In the second quarter of 2011, the Company was served with a complaint by the EPA in the U.S. District Court for the District of South Carolina, based on the alleged violations set out in the 2006 NOV seeking civil penalties and injunctive relief. The complaint was subsequently amended to add the State of South Carolina as a plaintiff. We intend to vigorously defend this action. Any settlement or finding adverse to us could result in the payment by us of fines, penalties, capital expenditures or some combination thereof. At this time, it is not possible to predict with any certainty the outcome of this litigation or the financial impact which may result therefrom. However, we do not expect any financial impact to have a material adverse effect on the Company’s results of operations, financial condition or cash flows.
In addition, we are involved from time to time in legal proceedings of types regarded as common in our business, including administrative or judicial proceedings seeking remediation under environmental laws such as CERCLA or Superfund, products liability, breach of contract liability and premises liability litigation. Where appropriate, we may establish financial reserves as estimated by our general counsel for such proceedings. We also maintain insurance to mitigate certain of such risks.
|
Item 4.
|
Mine Safety Disclosures.
|
Not applicable.
Executive Officers of the Registrant.
The names, ages and biographies of our executive officers as of February 10, 2014 are set forth below. The term of office of each officer is until the meeting of the Board of Directors following the next annual shareholders’ meeting (
May 13, 2014
).
|
Name
|
Age
|
Position
|
||
|
Luther C. Kissam, IV
|
49
|
President, Chief Executive Officer and Director
|
||
|
Matthew K. Juneau
|
53
|
Senior Vice President, President Performance Chemicals
|
||
|
Susan Kelliher
|
47
|
Senior Vice President, Human Resources
|
||
|
Karen G. Narwold
|
54
|
Senior Vice President, General Counsel, Corporate and Government Affairs, Corporate Secretary
|
||
|
Scott A. Tozier
|
48
|
Senior Vice President, Chief Financial Officer and Chief Accounting Officer
|
||
|
D. Michael Wilson
|
51
|
Senior Vice President, President Catalyst Solutions
|
||
|
Ronald C. Zumstein
|
52
|
Senior Vice President, Manufacturing and Supply Chain Excellence
|
||
|
Donald J. LaBauve, Jr.
|
47
|
Vice President, Corporate Controller
|
||
Luther C. Kissam, IV
was elected to our Board of Directors on November 2, 2011, Chief Executive Officer effective September 1, 2011 and as our President effective May 7, 2013. Previously, Mr. Kissam served as President from March 15, 2010 until March 1, 2012, Executive Vice President, Manufacturing and Law and Secretary from May 2009 until March 15, 2010, and as Senior Vice President, Manufacturing and Law and Corporate Secretary from January 8, 2008 until May 2009. Mr. Kissam joined us in September 2003 and served as Vice President, General Counsel and Corporate Secretary from that time until December 16, 2005, when he was promoted to Senior Vice President, General Counsel and Corporate Secretary. Before joining us, Mr. Kissam served as Vice President, General Counsel and Secretary of Merisant Company (manufacturer and marketer of sweetener and consumer food products), having previously served as Associate General Counsel of Monsanto Company (provider of agricultural products and solutions).
Matthew K. Juneau
was elected Senior Vice President, President Performance Chemicals effective December 30, 2013. Previously, Mr. Juneau served as Vice President, Polymer Solutions since March 2012, Vice President, Global Sales and Services from May 2009 to February 2012, and prior to that as Division Vice President of our performance chemicals business in the Fine Chemistry division since January 2007. Prior to that, Mr. Juneau held various positions of increasing responsibility
23
|
Albemarle Corporation and Subsidiaries
|
||
in research and development and business management with us including Managing Director of our European operations from January 2003 until December 2007. Mr. Juneau joined us as a chemical engineer in June 1982.
Susan Kelliher
joined us in March of 2012, as Senior Vice President, Human Resources. Ms. Kelliher has over twenty years of human resources experience, having most recently served at Hewlett Packard as Vice President, Human Resources—Global Sales and Enterprise Marketing from April 2010 to February 2012, and as Vice President, Human Resources—Imaging and Printing Group from September 2007 to April 2010. Prior to joining Hewlett Packard, she was the Vice President of Human Resources for Cymer, Inc., the world’s leading supplier of deep ultraviolet illumination sources. Prior to that, Ms. Kelliher served in various executive and managerial human resources positions at The Home Depot, Inc., Raytheon Company, YUM! Brands’ Pizza Hut division, beginning her career at Mobil Oil.
Karen G. Narwold
joined us in September of 2010 and currently serves as Senior Vice President, General Counsel, Corporate and Government Affairs, Corporate Secretary of Albemarle. Ms. Narwold has over 20 years of legal, management and business experience with global industrial and chemical companies. After five years in private practice, she served as Vice President, General Counsel, Human Resources and Secretary of GrafTech International Ltd., a global graphite and carbon manufacturer and former subsidiary of Union Carbide. She then served as Vice President and Strategic Counsel of Barzel Industries, a North American steel processor and distributor. Ms. Narwold resigned from Barzel in November 2009, after Barzel reached an agreement to sell substantially all of its assets in a planned transaction that was consummated in a sale pursuant to Section 363 of the U.S. Bankruptcy Code. Prior to joining Albemarle, Ms. Narwold served as Special Counsel with Kelley Drye & Warren LLP and with Symmetry Advisors where she worked in the areas of strategic, financial and capital structure planning and restructuring for public and private companies.
Scott A. Tozier
was elected as our Senior Vice President and Chief Financial Officer effective January 31, 2011. Mr. Tozier also serves as our Chief Accounting Officer. Mr. Tozier has over 20 years of diversified international financial management experience. Following four years of assurance services with the international firm Ernst & Young, LLP, Mr. Tozier joined Honeywell International, Inc., where his 16 year career spanned senior financial positions in the U.S., Australia and Europe. His roles of increasing responsibilities included management of financial planning, analysis and reporting, global credit and treasury services and Chief Financial Officer of Honeywell’s Transportation Systems, Turbo Technologies and Building Solutions divisions. Most recently, Mr. Tozier served as Vice President of Finance, Operations and Transformation of Honeywell International, Inc.
D. Michael Wilson
joined us in October 2013 and currently serves as Senior Vice President, President Catalyst Solutions. Mr. Wilson joined Albemarle after a successful career with FMC Corporation where he most recently served as president of the Specialty Chemicals Group. At FMC, he held a number of executive roles, including leadership of the Industrial Chemicals Group and the Lithium division. Prior to joining FMC, Mr. Wilson’s career progressed through a variety of general management, sales and operational leadership roles with the Wausau Paper Corporation and Rexam, Inc.
Ronald C. Zumstein
was elected Senior Vice President, Manufacturing and Supply Chain Excellence effective December 30, 2013. Previously, Dr. Zumstein served as Vice President of Manufacturing since March 2010, and prior to that, as Vice President, Manufacturing Operations since March 2008. Dr. Zumstein previously served as our Vice President of Health, Safety and Environment and Vice President of Manufacturing for our Polymer Solutions division. Dr. Zumstein has held various positions of increasing responsibility since joining the Company and Ethyl Corporation in 1987, including serving as Plant Manager at several of our U.S. manufacturing locations.
Donald J. LaBauve Jr.
was elected Vice President, Corporate Controller effective February 12, 2013, after having previously served as Vice President, Finance - Business Operations since April 2009. Mr. LaBauve served as Chief Financial Officer, Fine Chemistry from April 2007 until April 2009, and prior to that time held the role of Controller, Polymer Solutions from January 2006 through March 2007. Since joining the Company as Ethyl Corporation in April 1990, Mr. LaBauve has held various staff and leadership positions of increasing responsibility within the finance function, including an assignment to our European headquarters in Belgium in April 2000 where he held the regional finance leadership role from July 2002 through June 2005.
24
|
Albemarle Corporation and Subsidiaries
|
||
|
Item 5.
|
Market for the Registrant’s Common Equity, Related Stockholder Matters and Issuer Purchases of Equity Securities.
|
Our common stock trades on the New York Stock Exchange (NYSE) under the symbol “ALB.” The following table sets forth on a per share basis the high and low sales prices for our common stock for the periods indicated as reported on the NYSE composite transactions reporting system and the dividends declared per share on our common stock.
|
Common Stock Price Range
|
Dividends
Declared Per
Share of
Common Stock
|
||||||||||
|
High
|
Low
|
||||||||||
|
2012
|
|||||||||||
|
First Quarter
|
$
|
68.51
|
|
$
|
52.27
|
|
$
|
0.20
|
|
||
|
Second Quarter
|
$
|
67.14
|
|
$
|
55.86
|
|
$
|
0.20
|
|
||
|
Third Quarter
|
$
|
62.34
|
|
$
|
50.88
|
|
$
|
0.20
|
|
||
|
Fourth Quarter
|
$
|
62.51
|
|
$
|
51.77
|
|
$
|
0.20
|
|
||
|
2013
|
|||||||||||
|
First Quarter
|
$
|
67.75
|
|
$
|
60.71
|
|
$
|
0.24
|
|
||
|
Second Quarter
|
$
|
69.03
|
|
$
|
56.64
|
|
$
|
0.24
|
|
||
|
Third Quarter
|
$
|
66.39
|
|
$
|
60.16
|
|
$
|
0.24
|
|
||
|
Fourth Quarter
|
$
|
70.00
|
|
$
|
62.02
|
|
$
|
0.24
|
|
||
There were
80,052,842
shares of common stock held by
3,076
shareholders of record as of
December 31, 2013
. On
February 25, 2014
, we declared a dividend of
$0.275
per share of common stock, payable
April 1, 2013
.
The following table summarizes our repurchases of equity securities for the three-month period ended December 31, 2013:
|
Period
|
Total
Number of
Shares
Repurchased
|
Average
Price Paid
Per Share
|
Total Number of
Shares
Repurchased as
Part of Publicly
Announced
Plans or
Programs
(a)
|
Maximum
Number of
Shares that May
Yet Be
Repurchased
Under the Plans
or Programs
(a)
|
|||||||||
|
October 1, 2013 to October 31, 2013
|
—
|
|
$
|
—
|
|
—
|
|
7,323,605
|
|
||||
|
November 1, 2013 to November 30, 2013
|
—
|
|
—
|
|
—
|
|
7,323,605
|
|
|||||
|
December 1, 2013 to December 31, 2013
(b)
|
1,384,011
|
|
63.69
|
|
1,384,011
|
|
5,939,594
|
|
|||||
|
Total
|
1,384,011
|
|
$
|
63.69
|
|
1,384,011
|
|
5,939,594
|
|
||||
|
(a)
|
Our stock repurchase plan, which was authorized by our Board of Directors, became effective on October 25, 2000 and included ten million shares. Since then, the Company has regularly repurchased shares under the stock repurchase plan, resulting in the Board of Directors periodically authorizing additional shares for repurchase under the plan. On February 12, 2013, our Board of Directors authorized another increase in the number of shares, pursuant to which the Company is now permitted to repurchase up to a maximum of fifteen million shares under the plan, including those shares previously authorized, but not yet repurchased. The stock repurchase plan will expire when we have repurchased all shares authorized for repurchase thereunder, unless the stock repurchase plan is earlier terminated by action of our Board of Directors or further shares are authorized for repurchase.
|
|
(b)
|
In the second quarter of 2013, we paid $450 million under an accelerated share repurchase agreement and received an initial delivery of 5,680,921 shares. Under the terms of the agreement, in the fourth quarter of 2013 the accelerated share repurchase agreement was completed and we received a final settlement of 1,384,011 shares. The Average Price Paid Per Share reported herein is based on the daily Rule 10b-18 volume-weighted average prices of the Company’s common stock during the term of the agreement, less a forward price adjustment amount of approximately $1.01.
|
25
|
Albemarle Corporation and Subsidiaries
|
||
The information required by Item 201(d) of Regulation S-K is contained in our definitive Proxy Statement for our
2014
Annual Meeting of Shareholders to be filed with the SEC pursuant to Regulation 14A under the Exchange Act, or the Proxy Statement, and is incorporated herein by reference.
Stock Performance Graph
The graph below shows the cumulative total shareholder return assuming the investment of $100 in our common stock on December 31, 2008 and the reinvestment of all dividends thereafter. The information contained in the graph below is furnished and therefore not to be considered “filed” with the SEC, and is not incorporated by reference into any document that incorporates this Annual Report on Form 10-K by reference.
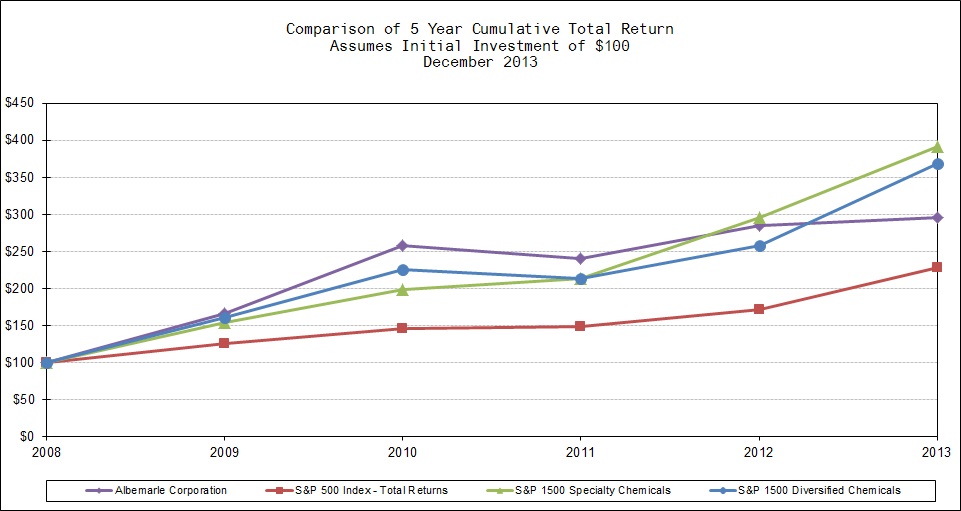
|
Item 6.
|
Selected Financial Data.
|
The information for the five years ended
December 31, 2013
, is contained in the “Five-Year Summary” included in Part IV, Item 15, Exhibit 99.1 and incorporated herein by reference.
|
Item 7.
|
Management’s Discussion and Analysis of Financial Condition and Results of Operations.
|
Forward-looking Statements
Some of the information presented in this Annual Report on Form 10-K, including the documents incorporated by reference, may constitute forward-looking statements within the meaning of the Private Securities Litigation Reform Act of 1995. Such forward-looking statements are based on our current expectations, which are in turn based on assumptions that we believe are reasonable based on our current knowledge of our business and operations. We have used words such as “anticipate,” “believe,” “could,” “estimate,” “expect,” “intend,” “may,” “should,” “will” and variations of such words and similar expressions to identify such forward-looking statements.
These forward-looking statements are not guarantees of future performance and involve certain risks, uncertainties and assumptions, which are difficult to predict and many of which are beyond our control. Therefore, there can be no assurance that our actual results will not differ materially from the results and expectations expressed or implied in the forward-looking statements. Factors that could cause actual results to differ materially include, without limitation:
|
•
|
changes in economic and business conditions;
|
|
•
|
changes in financial and operating performance of our major customers and industries and markets served by us;
|
|
•
|
the timing of orders received from customers;
|
26
|
Albemarle Corporation and Subsidiaries
|
||
|
•
|
the gain or loss of significant customers;
|
|
•
|
competition from other manufacturers;
|
|
•
|
changes in the demand for our products;
|
|
•
|
limitations or prohibitions on the manufacture and sale of our products;
|
|
•
|
availability of raw materials;
|
|
•
|
changes in the cost of raw materials and energy, and our ability to pass through such increases;
|
|
•
|
acquisitions and divestitures, and changes in performance of acquired companies;
|
|
•
|
changes in our markets in general;
|
|
•
|
fluctuations in foreign currencies;
|
|
•
|
changes in laws and government regulation impacting our operations or our products;
|
|
•
|
the occurrence of claims or litigation;
|
|
•
|
the occurrence of natural disasters;
|
|
•
|
the inability to maintain current levels of product or premises liability insurance or the denial of such coverage;
|
|
•
|
political unrest affecting the global economy, including adverse effects from terrorism or hostilities;
|
|
•
|
political instability affecting our manufacturing operations or joint ventures;
|
|
•
|
changes in accounting standards;
|
|
•
|
the inability to achieve results from our global manufacturing cost reduction initiatives as well as our ongoing continuous improvement and rationalization programs;
|
|
•
|
changes in the jurisdictional mix of our earnings and changes in tax laws and rates;
|
|
•
|
changes in monetary policies, inflation or interest rates that may impact our ability to raise capital or increase our cost of funds, impact the performance of our pension fund investments and increase our pension expense and funding obligations;
|
|
•
|
volatility and substantial uncertainties in the debt and equity markets;
|
|
•
|
technology or intellectual property infringement, including cyber security breaches, and other innovation risks;
|
|
•
|
decisions we may make in the future; and
|
|
•
|
the other factors detailed from time to time in the reports we file with the SEC.
|
For further discussion regarding the Company’s business risks, see also Item 1A. Risk Factors.
We assume no obligation to provide revisions to any forward-looking statements should circumstances change, except as otherwise required by securities and other applicable laws. The following discussion should be read together with our consolidated financial statements and related notes included in this Annual Report on Form 10-K.
The following is a discussion and analysis of results of operations for the years ended December 31,
2013
,
2012
and
2011
. A discussion of consolidated financial condition and sources of additional capital is included under a separate heading “Financial Condition and Liquidity” on p
age 45.
Overview and Outlook
We are a leading global developer, manufacturer and marketer of highly-engineered specialty chemicals that meet customer needs across an exceptionally diverse range of end markets including the petroleum refining, consumer electronics, plastics/packaging, construction, automotive, lubricants, pharmaceuticals, crop protection, food safety and custom chemistry services markets. We are committed to global sustainability and are advancing responsible eco-practices and solutions in our three business segments. We believe that our commercial and geographic diversity, technical expertise, innovative capability, flexible, low cost global manufacturing base, experienced management team and strategic focus on our core base technologies will enable us to maintain leading market positions in those areas of the specialty chemicals industry in which we operate.
Secular trends favorably impacting demand within the end markets that we serve combined with our diverse product portfolio, broad geographic presence and customer-focused solutions will continue to be key drivers to our future earnings growth. We continue to build upon our existing green solutions portfolio and our ongoing mission to provide innovative, yet commercially viable, clean energy products and services to the marketplace. We believe our disciplined cost reduction efforts, ongoing productivity improvements and strong balance sheet will position us well to take advantage of strengthening economic conditions as they occur while softening the negative impact of the current challenging economic environment.
27
|
Albemarle Corporation and Subsidiaries
|
||
Through 2013, our operations were managed and reported as three operating segments: Polymer Solutions, Catalysts and Fine Chemistry. Financial results and discussion about our operating segments included in this Annual Report on Form 10-K are categorized according to these three operating segments except where noted.
As previously announced on September 23, 2013, we realigned our operating segments effective January 1, 2014. The Performance Chemicals segment will include Fire Safety Solutions, Specialty Chemicals and Fine Chemistry Services, consolidating our bromine, mineral and custom manufacturing assets under one business unit. The Catalyst Solutions segment will include Refinery Catalyst Solutions, Performance Catalyst Solutions and Antioxidants. Each segment will have a dedicated team of sales, research and development, process engineering, manufacturing and sourcing, and business strategy personnel that will have full accountability for improving execution through greater asset and market focus, agility and responsiveness. The new structure will also facilitate the continued standardization of business processes across the organization as part of our ongoing One Albemarle strategy.
2013 Highlights
|
•
|
On February 7, 2013, we announced a $30 million expansion project at our Tyrone, Pennsylvania manufacturing site to add new capacity for custom manufacturing projects. The first increment of new capacity is expected to be operational in 2015.
|
|
•
|
On February 12, 2013, our Board of Directors authorized an increase in the number of shares the Company is permitted to repurchase under our share repurchase program, pursuant to which the Company is now permitted to repurchase up to a maximum of 15 million shares, including those shares previously authorized but not yet repurchased.
|
|
•
|
On March 7, 2013, we announced that JBC, our consolidated joint venture with operations in Safi, Jordan, completed its first phase of expansion which doubles the site’s bromine production capacity. The second phase of the expansion doubled the current capacity of key bromine derivatives, hydrobromic acid, calcium bromide and sodium bromide, and began operations in the second quarter of 2013.
|
|
•
|
In the first quarter of 2013, we increased our quarterly dividend for the 19th consecutive year, to $0.24 per share.
|
|
•
|
On April 11, 2013, we announced that we expected to begin the supply of our GreenCrest™ polymeric fire safety solution for commercial qualification in expanded and extruded polystyrene foam applications by midyear of 2013, as scheduled.
|
|
•
|
Under the existing Board authorized share repurchase program, on May 9, 2013, we entered into an accelerated share repurchase agreement with J.P. Morgan Securities LLC (JPMorgan) relating to a fixed-dollar, uncollared accelerated share repurchase program (the 2013 ASR Program). The 2013 ASR Program was completed in December 2013. We repurchased approximately 9.2 million shares of our common stock during 2013 under our existing share repurchase program and the 2013 ASR Program. As of December 31, 2013, there were approximately
5.9 million
shares remaining available for repurchase under our authorized share repurchase program.
|
|
•
|
On May 14, 2013, we announced the signing of definitive agreements with Senze Meilu Company, of Shanxi, China, to establish a joint venture company in Lvliang, Shanxi.
|
|
•
|
On May 29, 2013, we entered into agreements to initiate a commercial paper program on a private placement basis under which we may issue from time to time unsecured commercial paper notes.
|
|
•
|
On July 8, 2013, SOCC and Saudi Specialty Chemicals Company (an affiliate of SABIC), announced the initial start-up of its aluminum alkyls facility located in Al-Jubail, Saudi Arabia. At capacity, it will manufacture 6,000 metric tons per year of tri-ethyl aluminum (TEA), a Ziegler Natta co-catalyst used in the plastics industry. An ultra-low hydride grade of TEA (TEA-ULH) will also be produced at the SOCC plant. This new facility is designed to meet the growing needs for TEA and ULH-TEA in the region, using raw materials supplied from member countries of the Gulf Cooperation Council. This facility is now operational and available for full commercial production once customer qualifications are completed.
|
|
•
|
On August 7, 2013, we announced the successful start-up of a new catalyst manufacturing plant at our facility in Yeosu, South Korea. The plant will produce commercial quantities of single site metallocene catalysts, including grades enhanced by our proprietary ActivCat® activation technology, as well as catalyst components such as methylaluminoxane.
|
|
•
|
On October 8, 2013, we announced the expansion of our presence in the electronic materials market with the acquisition of Cambridge Chemical Company, Ltd., effective October 1, 2013. Based in Cambridge, UK, Cambridge Chemical is a key technology player for producing high purity metal organic chemicals used in the laser market. Cambridge Chemical’s technology and products will further strengthen Albemarle’s offerings in the electronic market including LED, semiconductor, OLED and now laser. Albemarle will also benefit from a number of R&D and distribution synergies resulting from the acquisition.
|
28
|
Albemarle Corporation and Subsidiaries
|
||
|
•
|
On October 21, 2013, we announced the sampling of our GreenCrest™ polymeric fire safety solution from the commercial scale campaign to customers as scheduled. GreenCrest is targeted for use in expanded and extruded polystyrene applications. We expect to commercialize GreenCrest before the REACH sunset date for HBCD.
|
|
•
|
On October 21, 2013, we announced the expansion of the kilo lab at our U.S. Food and Drug Administration-registered Current Good Manufacturing Practice (cGMP) active pharmaceutical ingredient (API) production facility in South Haven, Michigan. Production using the new, expanded kilo lab is expected in the third quarter of 2014. The expanded kilo lab will allow Albemarle to better focus on customers’ needs for smaller quantities of material specifically produced to cGMP guidelines. Supporting the Company’s overall pharmaceutical custom synthesis offering, the expansion will enable Albemarle to address customer requirements throughout the entire life-cycle of their product, beginning from early stage clinical development to full-scale commercial production. The kilo lab production unit will operate within South Haven’s cGMP standards and will be suitable for production of API products.
|
|
•
|
On October 22, 2013, we announced the expansion of our ETHANOX® one-pack antioxidant manufacturing capabilities in Shanghai with the installation of a granulation and blending system. This increases the Company’s total one-pack capacity to over 10,000 metric tons/year, and adds the capability to make one-pack formulations of up to eight components.
|
|
•
|
We achieved annual earnings of
$413.2 million
during
2013
as compared to
$311.5 million
for
2012
. Our operating results contributed
$432.9 million
to cash flows from operations in
2013
. Earnings for
2013
includes pension and other postretirement benefit (OPEB) actuarial gains of
$88.3 million
after income taxes compared to pension and OPEB actuarial losses of
$48.2 million
after income taxes in
2012
.
|
Outlook
The 2013 business environment presented a diverse set of challenges in the markets we serve, from a slow global economic recovery, significant pricing pressure on bromine, and an ever-changing landscape in electronics, to the continuous need for cutting edge catalysts and technology by our refinery partners. Despite these continuing challenges, our business fundamentals are sound and we are strategically well-positioned as we remain focused on increasing sales volumes, managing costs and delivering value to our customers. We believe that when the end markets we serve begin to stabilize and resume growth, our businesses will be ready to respond quickly to the improved market conditions and new business opportunities.
Polymer Solutions:
Year-over-year results for 2013 on both the top and bottom line are a reflection of the difficult pricing environment for our portfolio of flame retardants, but we did enjoy mid-single-digit volume growth for both mineral and brominated flame retardants. We continue to manage through an uncertain environment characterized by soft demand in certain products and applications and cautious inventory management by our customers, which could continue to challenge the growth curve of this business into 2014.
Despite these current trends and concerns, we believe that the combination of solid, long-term business fundamentals with our competitive position, product innovations and effective management of raw material inventory inflation will enable us to manage our business through these periods of end market challenges and to capitalize on opportunities that will come with a sustained economic recovery. Our view of third party market indicators and order book trends makes us cautiously optimistic that broad pricing trends for brominated flame retardants have stabilized.
On a long-term basis, we continue to believe that improving global standards of living and the potential for increasingly stringent fire safety regulations in developing markets are likely to drive continued demand for fire safety products. Further, the demand environment for antioxidants (both polymer and lubes and fuel segments) continues to grow, with new polyolefin plants in China, the U.S. and the Middle East expected to support strong demand growth for several years forward. Based on current production capacities and end market demand, we remain well-positioned for the future.
Catalysts:
Lower metals surcharges, unfavorable foreign currency effects and unfavorable mix in Refinery Catalysts sales have resulted in overall lower year-over-year net sales for our Catalysts segment during 2013. However, sales volumes in our Refinery Catalysts businesses were strong as compared to 2012, and are a good indication of the healthy global demand for these products. In 2013 we executed several initiatives that strengthened our competitive position and laid the foundation for greater innovation and organic growth going forward, as we successfully started up a polyolefin catalyst center in South Korea and a world class aluminum alkyls facility in Saudi Arabia within our previously announced joint venture there. These new units, while unlikely to reach high utilization rates for a few years, are state-of-the-art units designed using the best technology and benefiting from our many years of hands-on operating experience.
On a longer term basis, we believe increased global demand for petroleum products and implementation of more stringent fuel quality requirements will drive growth in our refinery catalysts business. In addition, we expect growth in our PCS division
29
|
Albemarle Corporation and Subsidiaries
|
||
to come from growing global demand for plastics driven by rising standards of living and infrastructure spending, particularly in Asia and the Middle East, as well as from the LED market, driven by energy efficiency demands.
Delivering superior end-use performance continues to be the most effective way to create sustainable value in the refinery catalysts industry, and our technologies continue to provide significant performance and financial benefits to refiners challenged to meet tighter regulations around the world, those managing new contaminants present in North America tight oil, and those in the Middle East and Asia seeking to use heavier feedstock while pushing for higher propylene yields.
Fine Chemistry:
In our Fine Chemistry segment, year-over-year results were down in a difficult bromine pricing environment. Record volumes and revenue in clear completion fluids was offset by higher fixed costs related to our capacity expansion in Jordan, which we expect to strengthen our competitive position in the markets we serve. We believe we can sustain healthy margins with continued focus on the two strategic areas in our Fine Chemistry segment—maximizing our bromine franchise value in the performance chemicals sector and continued growth of our fine chemistry services business.
On a longer term basis, we are focused on profitably growing our globally competitive bromine and derivatives production network to serve all major bromine consuming products and markets. We believe the global supply/demand gap will tighten as demand for existing and new uses of bromine expand. After an exceptional two-year run, clear completion fluids are expected to grow at a healthy rate. Factors that could cause a decline in the trajectory of this business include a continuation of the recent destocking and well completion delays that we observed late in 2013, or a meaningful decline in oil prices, or increase in regulatory pressure on offshore drilling, which could lead to delays in deep water and ultra-deep water spending.
Fine Chemistry Services has a solid pipeline and good growth in contracts linked to electronic materials and agricultural applications, and although we expect the near term trajectory of growth in this business to be challenging due to the conclusion of several major projects, we expect new projects to offset these losses and establish a foundation for future growth. Our technical expertise, manufacturing capabilities and speed to market allow us to develop a preferred outsourcing position serving leading chemical, agrochemical and life science innovators in diverse industries. We believe we will continue to generate growth in profitable niche products leveraged from this service business.
Corporate and Other:
We continue to focus on cash generation, working capital management and process efficiencies. Our global effective tax rate was
25.0%
for
2013
, and we expect our global effective tax rate for
2014
to be approximately
25.0%
; however, our rate will vary based on the locales in which income is actually earned and remains subject to potential volatility from changing legislation in the U.S. and other tax jurisdictions.
Actuarial gains and losses related to our defined benefit pension and OPEB plan obligations are reflected in Corporate and other as a component of non-operating pension and OPEB plan costs under mark-to-market accounting. Results for the year ended
December 31, 2013
include an actuarial gain of
$139.0 million
(
$88.3 million
after income taxes), as compared to a loss of
$75.7 million
(
$48.2 million
after income taxes) for the year ended
December 31, 2012
.
In the first quarter of 2013, we increased our quarterly dividend rate to $0.24 per share. We repurchased approximately 9.2 million shares of our common stock during 2013 for approximately $582 million under our existing share repurchase program and the 2013 ASR program, and we may periodically repurchase shares in the future on an opportunistic basis. In the first quarter of 2014 we announced that we entered into an accelerated share repurchase agreement to repurchase $50 million of of our common stock by the end of April 2014. Also, in the first quarter of 2014 we increased our quarterly dividend rate to
$0.275
per share.
We remain committed to evaluating the merits of any opportunities that may arise for acquisitions or other business development activities that will complement our business footprint. Additional information regarding our products, markets and financial performance is provided at our web site,
www.albemarle.com
. Our web site is not a part of this document nor is it incorporated herein by reference.
30
|
Albemarle Corporation and Subsidiaries
|
||
Results of Operations
The following data and discussion provides an analysis of certain significant factors affecting our results of operations during the periods included in the accompanying condensed consolidated statements of income.
|
Selected Financial Data
|
Year Ended December 31,
|
Percentage Change
|
|||||||||||||||
|
2013
|
2012
|
2011
|
2013 vs.
2012
|
2012 vs.
2011
|
|||||||||||||
|
(In thousands, except percentages and per share amounts)
|
|||||||||||||||||
|
NET SALES
|
$
|
2,616,416
|
|
$
|
2,745,420
|
|
$
|
2,869,005
|
|
(5
|
)%
|
(4
|
)%
|
||||
|
Cost of goods sold
|
1,755,011
|
|
1,835,425
|
|
1,914,058
|
|
(4
|
)%
|
(4
|
)%
|
|||||||
|
GROSS PROFIT
|
861,405
|
|
909,995
|
|
954,947
|
|
(5
|
)%
|
(5
|
)%
|
|||||||
|
GROSS PROFIT MARGIN
|
32.9
|
%
|
33.1
|
%
|
33.3
|
%
|
|||||||||||
|
Selling, general and administrative expenses
|
162,889
|
|
313,227
|
|
360,070
|
|
(48
|
)%
|
(13
|
)%
|
|||||||
|
Research and development expenses
|
82,246
|
|
78,919
|
|
77,083
|
|
4
|
%
|
2
|
%
|
|||||||
|
Restructuring and other charges, net
|
33,361
|
|
111,685
|
|
—
|
|
(70
|
)%
|
*
|
|
|||||||
|
OPERATING PROFIT
|
582,909
|
|
406,164
|
|
517,794
|
|
44
|
%
|
(22
|
)%
|
|||||||
|
OPERATING PROFIT MARGIN
|
22.3
|
%
|
14.8
|
%
|
18.0
|
%
|
|||||||||||
|
Interest and financing expenses
|
(31,559
|
)
|
(32,800
|
)
|
(37,574
|
)
|
(4
|
)%
|
(13
|
)%
|
|||||||
|
Other (expenses) income, net
|
(6,923
|
)
|
1,229
|
|
357
|
|
*
|
|
*
|
|
|||||||
|
INCOME BEFORE INCOME TAXES AND
EQUITY IN NET INCOME OF
UNCONSOLIDATED INVESTMENTS
|
544,427
|
|
374,593
|
|
480,577
|
|
45
|
%
|
(22
|
)%
|
|||||||
|
Income tax expense
|
136,322
|
|
82,533
|
|
104,134
|
|
65
|
%
|
(21
|
)%
|
|||||||
|
Effective tax rate
|
25.0
|
%
|
22.0
|
%
|
21.7
|
%
|
|||||||||||
|
INCOME BEFORE EQUITY IN NET
INCOME OF UNCONSOLIDATED
INVESTMENTS
|
408,105
|
|
292,060
|
|
376,443
|
|
40
|
%
|
(22
|
)%
|
|||||||
|
Equity in net income of unconsolidated
investments (net of tax)
|
31,729
|
|
38,067
|
|
43,754
|
|
(17
|
)%
|
(13
|
)%
|
|||||||
|
NET INCOME
|
439,834
|
|
330,127
|
|
420,197
|
|
33
|
%
|
(21
|
)%
|
|||||||
|
Net income attributable to noncontrolling
interests
|
(26,663
|
)
|
(18,591
|
)
|
(28,083
|
)
|
43
|
%
|
(34
|
)%
|
|||||||
|
NET INCOME ATTRIBUTABLE TO
ALBEMARLE CORPORATION
|
$
|
413,171
|
|
$
|
311,536
|
|
$
|
392,114
|
|
33
|
%
|
(21
|
)%
|
||||
|
PERCENTAGE OF NET SALES
|
15.8
|
%
|
11.3
|
%
|
13.7
|
%
|
|||||||||||
|
Basic earnings per share
|
$
|
4.93
|
|
$
|
3.49
|
|
$
|
4.33
|
|
41
|
%
|
(19
|
)%
|
||||
|
Diluted earnings per share
|
$
|
4.90
|
|
$
|
3.47
|
|
$
|
4.28
|
|
41
|
%
|
(19
|
)%
|
||||
* Percentage calculation is not meaningful.
Comparison of
2013
to
2012
Net Sales
For the year ended
December 31, 2013
, we recorded net sales of
$2.62 billion
, a
5%
decrease
compared to net sales of
$2.75 billion
for the corresponding period of
2012
. This
decrease
was due primarily to unfavorable pricing impacts of 6%, mainly lower metals surcharges in Refinery Catalyst Solutions, lower price mix in overall Catalysts, lower regional pricing on bromine and derivatives, and lower flame retardant pricing, partly offset by favorable volume impacts of 2%, driven by higher volumes in Refinery Catalysts, Flame Retardants, and Additives, net of lower volumes in Fine Chemistry Services and the unfavorable volume impacts from our exit of the phosphorus flame retardants business in 2012.
Gross Profit
For the year ended
December 31, 2013
, our gross profit
decreased
$48.6 million
, or
5%
, from the corresponding
2012
period due mainly to overall unfavorable pricing impacts, unfavorable currency impacts mainly from a weaker Japanese yen, and higher manufacturing costs. These were partly offset by favorable impacts from lower variable input costs and favorable
31
|
Albemarle Corporation and Subsidiaries
|
||
overall volumes. Additionally, our gross profit for
2013
was impacted by approximately
$42.2 million
of pension and OPEB benefits (including mark-to-market actuarial gains) allocated to cost of goods sold, as compared to $26.3 million of pension and OPEB costs allocated to cost of goods sold in
2012
. Pension and OPEB costs included in cost of goods sold for 2012 include a correction of
$3.5 million
for actuarial gains that relate to 2011. Overall, these factors contributed to our gross profit margin of
32.9%
for the current year, down from
33.1%
in 2012.
Selling, General and Administrative Expenses
For the year ended
December 31, 2013
, our selling, general and administrative (SG&A) expenses
decreased
$150.3 million
, or
48%
, compared to the year ended
December 31, 2012
. This decrease was primarily due to favorable pension and OPEB items, lower personnel costs and lower sales commissions partly offset by higher expenses for services. SG&A expenses for
2013
includes approximately
$90.5 million
of pension and OPEB benefits (including mark-to-market actuarial gains), as compared to $51.1 million of pension and OPEB costs in
2012
. Pension and OPEB costs included in SG&A for 2012 include a correction of
$6.8 million
for actuarial gains that relate to 2011. Additionally, SG&A expenses for 2012 included (a) a gain of $8.1 million resulting from proceeds received in connection with the settlement of litigation (net of legal fees), and (b) an $8 million charitable contribution to the Albemarle Foundation, a non-profit organization that sponsors grants, health and social projects, educational initiatives, disaster relief, matching gift programs, scholarships and other charitable initiatives in locations where our employees live and operate.
As a percentage of net sales, SG&A expenses were
6.2%
for the year ended
December 31, 2013
, compared to
11.4%
for the corresponding period in
2012
.
Research and Development Expenses
For the year ended
December 31, 2013
, our R&D expenses
increased
$3.3 million
, or
4%
, from the year ended
December 31, 2012
, as a result of higher expenses for services. As a percentage of net sales, R&D expenses were
3.1%
in
2013
, compared to
2.9%
in
2012
.
Restructuring and Other Charges, Net
In connection with the announced realignment of our operating segments effective January 1, 2014, in the fourth quarter of 2013 we initiated a workforce reduction plan which will result in a reduction of approximately 230 employees worldwide. We recorded charges of
$33.4 million
($21.9 million after income taxes) during the year ended December 31, 2013 for termination benefits and other costs related to this workforce reduction plan.
Restructuring and other charges, net were
$111.7 million
for the year ended December 31, 2012 and included the following items:
|
(a)
|
Net charges amounting to $100.8 million ($76.1 million after income taxes) in connection with our exit of the phosphorus flame retardants business. The charges are comprised mainly of non-cash items consisting of net asset write-offs of approximately $57 million and write-offs of foreign currency translation adjustments of approximately $12 million, as well as accruals for future cash costs associated with related severance programs of approximately $22 million, estimated site remediation costs of approximately $9 million, other estimated exit costs of approximately $3 million, partly offset by a gain of approximately $2 million related to the sale of our Nanjing, China manufacturing site. We began to realize favorable profit impacts from this program in the fourth quarter of 2012.
|
|
(b)
|
A net curtailment gain of $4.5 million ($2.9 million after income taxes) and a one-time employer contribution to the Company’s defined contribution plan of $10.1 million ($6.4 million after income taxes), both in connection with various amendments to certain of our U.S. pension and defined contribution plans that were approved by our Board of Directors in the fourth quarter of 2012. These amendments provided for formula changes to the related defined contribution plans as well as special benefits for certain defined benefit plan participants which culminate in a freeze of pension benefits under the related qualified and nonqualified defined benefit plan after a two year transition period.
|
|
(c)
|
Charges amounting to $5.3 million ($4.3 million after income taxes) related to changes in product sourcing and other items.
|
32
|
Albemarle Corporation and Subsidiaries
|
||
Interest and Financing Expenses
Interest and financing expenses for the year ended
December 31, 2013
decreased
$1.2 million
to
$31.6 million
from the corresponding
2012
period, due mainly to lower interest rates on variable-rate borrowings partially offset by higher levels of variable-rate debt in 2013.
Other (Expenses) Income, Net
Other (expenses) income, net for the year ended
December 31, 2013
was
$(6.9) million
versus
$1.2 million
for the corresponding
2012
period. This change was due primarily to unfavorable currency impacts compared to the corresponding period in
2012
.
Income Tax Expense
The effective income tax rate for
2013
was
25.0%
compared to
22.0%
for
2012
. Our effective income tax rate differs from the U.S. federal statutory income tax rates in the comparative periods mainly due to the impact of earnings from outside the U.S. Our effective income tax rate for the 2012 period was impacted by discrete net tax benefit items of $1.0 million related principally to tax planning and the release of various tax reserves for uncertain domestic tax positions due to the expiration of the domestic statute of limitations related to the 2008 tax year, as well as $100.8 million of pre-tax charges ($76.1 million after taxes) associated with our exit of the phosphorus flame retardants business. For additional information about income tax rates, see Note 18, “Income Taxes” to our consolidated financial statements included in Item 8 beginning o
n page 53.
Equity in Net Income of Unconsolidated Investments
Equity in net income of unconsolidated investments was
$31.7 million
for the year ended
December 31, 2013
compared to
$38.1 million
in the same period last year. This decrease was due primarily to overall lower equity income amounts reported from our Catalysts segment joint ventures, including unfavorable currency translation impacts of $2.4 million due to a weaker Japanese yen and Brazilian real, partly offset by higher equity income amounts reported from our Polymer Solutions joint venture Magnifin.
Net Income Attributable to Noncontrolling Interests
For the year ended
December 31, 2013
, net income attributable to noncontrolling interests was
$26.7 million
compared to
$18.6 million
in the same period last year. This
increase
of
$8.1 million
was due primarily to higher overall profits and a contractually-based reduction in our share of profits of $6.6 million in our joint venture in Jordan.
Net Income Attributable to Albemarle Corporation
Net income attributable to Albemarle Corporation
increased
to
$413.2 million
for the year ended
December 31, 2013
, from
$311.5 million
for the corresponding period of
2012
primarily due to higher sales volumes, lower SG&A expenses (including favorable impacts from pension and OPEB items), lower restructuring and other charges and favorable overall variable input costs. These impacts were partly offset by lower pricing, including impacts from both volatility in metals surcharges and related cost impacts in Refinery Catalyst Solutions (particularly rare earths) and in certain products in our bromine portfolio and Flame Retardants, unfavorable manufacturing costs (net of favorable impacts from pension and OPEB items), lower equity in net income of unconsolidated investments, higher R&D expenses and unfavorable foreign currency impacts.
Segment Information Overview.
We have identified three reportable segments according to the nature and economic characteristics of our products as well as the manner in which the information is used internally by the Company’s key decision maker, our Chief Executive Officer, in accordance with current accounting guidance. Our Polymer Solutions segment is comprised of the flame retardants and stabilizers and curatives product areas. Our Catalysts segment is comprised of the refinery catalysts and PCS product areas. Our Fine Chemistry segment is comprised of the performance chemicals and fine chemistry services and intermediates product areas. Segment income represents operating profit (adjusted for significant non-recurring items) and equity in net income of unconsolidated investments and is reduced by net income attributable to noncontrolling interests. Segment data includes intersegment transfers of raw materials at cost and allocations for certain corporate costs.
33
|
Albemarle Corporation and Subsidiaries
|
||
The Corporate & other segment includes corporate-related items not allocated to the reportable segments. Pension and OPEB service cost (which represents the benefits earned by active employees during the period) and amortization of prior service cost or benefit are allocated to each segment whereas the remaining components of pension and OPEB cost or credit are included in Corporate and other.
|
Year Ended December 31,
|
Percentage
Change
|
||||||||||||||||
|
2013
|
% of
net sales
|
2012
|
% of
net sales
|
2013 vs. 2012
|
|||||||||||||
|
(In thousands, except percentages)
|
|||||||||||||||||
|
Net sales:
|
|||||||||||||||||
|
Polymer Solutions
|
$
|
864,388
|
|
33.0
|
%
|
$
|
892,232
|
|
32.5
|
%
|
(3
|
)%
|
|||||
|
Catalysts
|
1,001,606
|
|
38.3
|
%
|
1,067,948
|
|
38.9
|
%
|
(6
|
)%
|
|||||||
|
Fine Chemistry
|
750,422
|
|
28.7
|
%
|
785,240
|
|
28.6
|
%
|
(4
|
)%
|
|||||||
|
Total net sales
|
$
|
2,616,416
|
|
100.0
|
%
|
$
|
2,745,420
|
|
100.0
|
%
|
(5
|
)%
|
|||||
|
Segment operating profit:
|
|||||||||||||||||
|
Polymer Solutions
|
$
|
153,747
|
|
17.8
|
%
|
$
|
198,426
|
|
22.2
|
%
|
(23
|
)%
|
|||||
|
Catalysts
|
222,749
|
|
22.2
|
%
|
260,544
|
|
24.4
|
%
|
(15
|
)%
|
|||||||
|
Fine Chemistry
|
153,629
|
|
20.5
|
%
|
182,690
|
|
23.3
|
%
|
(16
|
)%
|
|||||||
|
Total segment operating profit
|
530,125
|
|
641,660
|
|
(17
|
)%
|
|||||||||||
|
Equity in net income of unconsolidated investments:
|
|||||||||||||||||
|
Polymer Solutions
|
8,875
|
|
6,416
|
|
38
|
%
|
|||||||||||
|
Catalysts
|
22,854
|
|
31,651
|
|
(28
|
)%
|
|||||||||||
|
Fine Chemistry
|
—
|
|
—
|
|
—
|
%
|
|||||||||||
|
Corporate & other
|
—
|
|
—
|
|
—
|
%
|
|||||||||||
|
Total equity in net income of unconsolidated
investments
|
31,729
|
|
38,067
|
|
(17
|
)%
|
|||||||||||
|
Net income attributable to noncontrolling interests:
|
|||||||||||||||||
|
Polymer Solutions
|
(4,753
|
)
|
(2,221
|
)
|
114
|
%
|
|||||||||||
|
Catalysts
|
—
|
|
—
|
|
—
|
%
|
|||||||||||
|
Fine Chemistry
|
(21,910
|
)
|
(16,350
|
)
|
34
|
%
|
|||||||||||
|
Corporate & other
|
—
|
|
(20
|
)
|
(100
|
)%
|
|||||||||||
|
Total net income attributable to noncontrolling
interests
|
(26,663
|
)
|
(18,591
|
)
|
43
|
%
|
|||||||||||
|
Segment income:
|
|||||||||||||||||
|
Polymer Solutions
|
157,869
|
|
18.3
|
%
|
202,621
|
|
22.7
|
%
|
(22
|
)%
|
|||||||
|
Catalysts
|
245,603
|
|
24.5
|
%
|
292,195
|
|
27.4
|
%
|
(16
|
)%
|
|||||||
|
Fine Chemistry
|
131,719
|
|
17.6
|
%
|
166,340
|
|
21.2
|
%
|
(21
|
)%
|
|||||||
|
Total segment income
|
535,191
|
|
661,156
|
|
(19
|
)%
|
|||||||||||
|
Corporate & other
|
86,145
|
|
(123,831
|
)
|
(170
|
)%
|
|||||||||||
|
Restructuring and other charges, net
|
(33,361
|
)
|
(111,685
|
)
|
(70
|
)%
|
|||||||||||
|
Interest and financing expenses
|
(31,559
|
)
|
(32,800
|
)
|
(4
|
)%
|
|||||||||||
|
Other (expenses) income, net
|
(6,923
|
)
|
1,229
|
|
*
|
|
|||||||||||
|
Income tax expense
|
(136,322
|
)
|
(82,533
|
)
|
65
|
%
|
|||||||||||
|
Net income attributable to Albemarle Corporation
|
$
|
413,171
|
|
$
|
311,536
|
|
33
|
%
|
|||||||||
* Percentage calculation is not meaningful.
Our segment information includes measures we refer to as “Segment operating profit” and “Segment income” which are financial measures that are not required by, or presented in accordance with, GAAP. The Company has reported Segment operating profit and Segment income because management believes that these financial measures provide transparency to investors and enable period-to-period comparability of financial performance. Segment operating profit and Segment income should not be considered as an alternative to Operating profit or Net income attributable to Albemarle Corporation, respectively, as determined in accordance with GAAP.
34
|
Albemarle Corporation and Subsidiaries
|
||
See below for a reconciliation of Segment operating profit and Segment income, the non-GAAP financial measures, to Operating profit and Net income attributable to Albemarle Corporation, respectively, the most directly comparable financial measures calculated and reported in accordance with GAAP.
|
Year Ended
December 31,
|
|||||||
|
2013
|
2012
|
||||||
|
(In thousands)
|
|||||||
|
Total segment operating profit
|
$
|
530,125
|
|
$
|
641,660
|
|
|
|
Add (less):
|
|||||||
|
Corporate & other
(a)
|
86,145
|
|
(123,811
|
)
|
|||
|
Restructuring and other charges, net
|
(33,361
|
)
|
(111,685
|
)
|
|||
|
GAAP Operating profit
|
$
|
582,909
|
|
$
|
406,164
|
|
|
|
Total segment income
|
$
|
535,191
|
|
$
|
661,156
|
|
|
|
Add (less):
|
|||||||
|
Corporate & other
|
86,145
|
|
(123,831
|
)
|
|||
|
Restructuring and other charges, net
|
(33,361
|
)
|
(111,685
|
)
|
|||
|
Interest and financing expenses
|
(31,559
|
)
|
(32,800
|
)
|
|||
|
Other (expenses) income, net
|
(6,923
|
)
|
1,229
|
|
|||
|
Income tax expense
|
(136,322
|
)
|
(82,533
|
)
|
|||
|
GAAP Net income attributable to Albemarle Corporation
|
$
|
413,171
|
|
$
|
311,536
|
|
|
|
(a)
|
Excludes corporate noncontrolling interest adjustments of $(20) for the year ended December 31, 2012.
|
Polymer Solutions
Polymer Solutions segment net sales for the year ended
December 31, 2013
were
$864.4 million
, down
$27.8 million
, or
3%
, in comparison to the same period in
2012
. The decrease was driven mainly by our mid-year 2012 exit of the phosphorus flame retardants business, an impact of $33.6 million. Other unfavorable impacts from lower pricing in Flame Retardants and Additives and the weaker Japanese yen were more than offset by favorable overall volumes. Segment income for Polymer Solutions was down
22%
, or
$44.8 million
, to
$157.9 million
for the year ended
2013
compared to
2012
, as a result of lower pricing mainly in Flame Retardants and Additives, higher variable input costs, higher manufacturing costs, and unfavorable currency impacts mainly due to the weaker Japanese yen. Also contributing to the decrease was
$2.5 million
in higher net income attributable to noncontrolling interests in our JBC joint venture. These were partly offset by favorable volume impacts in Brominated Flame Retardants and Additives and favorable equity in net income from our unconsolidated investment in Magnifin.
Catalysts
Catalysts segment net sales for the year ended
December 31, 2013
were
$1.0 billion
, a decrease of
$66.3 million
, or
6%
, compared to the year ended
December 31, 2012
. This decrease was due mainly to unfavorable pricing on lower metals surcharges in Refinery Catalyst Solutions, and lower pricing and volumes in Performance Catalyst Solutions, partly offset by favorable volumes in Refinery Catalyst Solutions. Catalysts segment income decreased
16%
, or
$46.6 million
, to
$245.6 million
for the year ended
December 31, 2013
in comparison to the corresponding period of
2012
. This decrease was due primarily to net unfavorable pricing impacts from volatility in metals surcharges and related cost impacts in Refinery Catalyst Solutions, unfavorable manufacturing costs, and $8.8 million lower equity in net income of unconsolidated investments. These were partly offset by favorable volume impacts in Refinery Catalysts Solutions.
35
|
Albemarle Corporation and Subsidiaries
|
||
Fine Chemistry
Fine Chemistry segment net sales for the year ended
December 31, 2013
were
$750.4 million
, a decrease of
$34.8 million
, or
4%
, versus the prior year. This decrease was primarily attributable to the timing of custom services projects, lower overall pricing impacts, and unfavorable volumes in our pharmaceutical businesses, partly offset by favorable bromine portfolio volumes. Segment income for the year ended
December 31, 2013
was
$131.7 million
, down
21%
from the corresponding period in
2012
. The decrease was due to lower pricing, delays in product launches in our Fine Chemistry Services businesses, unfavorable volumes in our agricultural intermediates business, higher manufacturing costs and $5.4 million higher net income attributable to noncontrolling interests associated with a contractual reduction in our share of profits at our Jordan joint venture.
Corporate and other
For the year ended
December 31, 2013
, Corporate and other income was
$86.1 million
compared to Corporate and other expense of
$123.8 million
for the corresponding period in
2012
. This decrease was primarily due to favorable pension and OPEB plan impacts. Corporate and other income for
2013
includes
$143.1 million
of pension and OPEB benefits (including mark-to market actuarial gains) compared to
$68.0 million
of pension and OPEB costs in
2012
. Pension and OPEB costs included in Corporate and other for 2012 include a correction of
$10.3 million
(comprised of
$3.5 million
in cost of goods sold and
$6.8 million
in SG&A) for actuarial gains that relate to 2011.
Comparison of
2012
to
2011
Net Sales
For the year ended December 31, 2012, we recorded net sales of $2.75 billion, a 4% decrease compared to net sales of $2.87 billion for the corresponding period of 2011. This decrease was due primarily to unfavorable pricing impacts of 3% (mainly lower metals surcharges in refinery catalysts) and unfavorable foreign currency impacts of 1% (mainly the weaker Euro). Volume impacts on our net sales were flat year-over-year, with softness in our brominated flame retardants business and the unfavorable impacts from our phosphorus flame retardant business exit announced in the second quarter of 2012 being fully offset by strong year-over-year volume impacts in our Catalysts and Fine Chemistry segments.
Gross Profit
For the year ended December 31, 2012, our gross profit decreased $45.0 million, or 5%, from the corresponding 2011 period due mainly to overall unfavorable pricing impacts from volatility in both metals surcharges and related cost impacts in refinery catalysts (particularly rare earths), unfavorable foreign currency impacts and unfavorable manufacturing spending, partly offset by favorable overall volume impacts. Additionally, our gross profit for 2012 was impacted by approximately $26.3 million of pension and OPEB costs (including mark-to-market actuarial losses) allocated to cost of goods sold, as compared to $31.7 million in 2011. Pension and OPEB costs included in cost of goods sold for 2012 include a correction of
$3.5 million
for actuarial gains that relate to 2011. Overall, these factors contributed to our gross profit margin for the current year of 33.1% , essentially flat with the corresponding period in 2011.
Selling, General and Administrative Expenses
For the year ended December 31, 2012, our SG&A expenses decreased $46.8 million, or 13%, compared to the year ended December 31, 2011. This decrease was primarily due to lower personnel-related costs (particularly incentive compensation) and other spending as well as favorable impacts from foreign currency. Our SG&A expenses for 2012 were impacted by approximately $51.1 million of pension and OPEB costs (including mark-to-market actuarial losses), as compared to $65.5 million in 2011. Pension and OPEB costs included in SG&A for 2012 include a correction of
$6.8 million
for actuarial gains that relate to 2011. Additionally, SG&A expenses for 2012 included (a) a gain of $8.1 million resulting from proceeds received in connection with the settlement of litigation (net of legal fees), and (b) an $8 million charitable contribution to the Albemarle Foundation, a non-profit organization that sponsors grants, health and social projects, educational initiatives, disaster relief, matching gift programs, scholarships and other charitable initiatives in locations where our employees live and operate.
As a percentage of net sales, SG&A expenses were 11.4% for the year ended December 31, 2012, compared to 12.6% for the corresponding period in 2011.
36
|
Albemarle Corporation and Subsidiaries
|
||
Research and Development Expenses
For the year ended December 31, 2012, our R&D expenses increased $1.8 million, or 2%, from the year ended December 31, 2011, due mainly to higher spending, partly offset by favorable impacts from foreign currency. As a percentage of net sales, R&D expenses were 2.9% for the 2012 period, compared to 2.7% in 2011.
Restructuring and Other Charges, Net
Restructuring and other charges, net were $111.7 million for the year ended December 31, 2012 and included the following items:
|
(a)
|
Net charges amounting to $100.8 million ($76.1 million after income taxes) in connection with our exit of the phosphorus flame retardants business. The charges are comprised mainly of non-cash items consisting of net asset write-offs of approximately $57 million and write-offs of foreign currency translation adjustments of approximately $12 million, as well as accruals for future cash costs associated with related severance programs of approximately $22 million, estimated site remediation costs of approximately $9 million, other estimated exit costs of approximately $3 million, partly offset by a gain of approximately $2 million related to the sale of our Nanjing, China manufacturing site. We began to realize favorable profit impacts from this program in the fourth quarter of 2012.
|
|
(b)
|
A net curtailment gain of $4.5 million ($2.9 million after income taxes) and a one-time employer contribution to the Company’s defined contribution plan of $10.1 million ($6.4 million after income taxes), both in connection with various amendments to certain of our U.S. pension and defined contribution plans that were approved by our Board of Directors in the fourth quarter of 2012. These amendments provided for formula changes to the related defined contribution plans as well as special benefits for certain defined benefit plan participants which culminate in a freeze of pension benefits under the related qualified and nonqualified defined benefit plan after a two year transition period.
|
|
(c)
|
Charges amounting to $5.3 million ($4.3 million after income taxes) related to changes in product sourcing and other items.
|
Interest and Financing Expenses
Interest and financing expenses for the year ended December 31, 2012 decreased $4.8 million to $32.8 million from the corresponding 2011 period, due mainly to increases in interest capitalized on higher average construction work in progress balances and lower variable-rate borrowings year-over-year.
Other Income, Net
Other income, net, for the year ended December 31, 2012 was $1.2 million versus $0.4 million for the corresponding 2011 period. This change was due primarily to favorable interest income and other miscellaneous items partly offset by unfavorable currency over the corresponding period in 2011.
Income Tax Expense
The effective income tax rate for 2012 was 22.0% compared to 21.7% for 2011. Our effective income tax rate differs from the U.S. federal statutory income tax rates in the comparative periods mainly due to the impact of earnings from outside the U.S. Also, our effective income tax rate for the 2012 period was impacted by discrete net tax benefit items of $1.0 million related principally to tax planning and the release of various tax reserves for uncertain domestic tax positions due to the expiration of the domestic statute of limitations related to the 2008 tax year, as well as $100.8 million of pre-tax charges ($76.1 million after taxes) associated with our exit of the phosphorus flame retardants business. For additional information about income tax rates, see Note 18, “Income Taxes” to our consolidated financial statements included in Item 8 beginning on page
53.
Equity in Net Income of Unconsolidated Investments
Equity in net income of unconsolidated investments was $38.1 million for the year ended December 31, 2012 compared to $43.8 million in the same period last year. This decrease was due primarily to lower equity income amounts reported from our Catalysts segment joint ventures FCC SA and Nippon Ketjen Company Limited, as well as our Polymer Solutions joint venture Magnifin.
37
|
Albemarle Corporation and Subsidiaries
|
||
Net Income Attributable to Noncontrolling Interests
For the year ended December 31, 2012, net income attributable to noncontrolling interests was $18.6 million compared to $28.1 million in the same period last year. This decrease of $9.5 million was due primarily to lower year-over-year profitability from our consolidated joint venture JBC based mainly on lower demand in our brominated flame retardants business.
Net Income Attributable to Albemarle Corporation
Net income attributable to Albemarle Corporation decreased to $311.5 million for the year ended December 31, 2012, from $392.1 million for the corresponding period of 2011, primarily due to restructuring and other charges in 2012, lower pricing including impacts from both volatility in metals surcharges and related cost impacts in refinery catalysts (particularly rare earths), unfavorable foreign currency impacts, lower equity in net income of unconsolidated investments and higher R&D costs. These impacts were partly offset by favorable overall volume impacts (including favorable impacts from our exit of the phosphorus business), lower SG&A expenses, lower interest and financing expenses, higher other income, net, lower income tax expense and lower net income attributable to noncontrolling interests.
38
|
Albemarle Corporation and Subsidiaries
|
||
|
Year Ended December 31,
|
Percentage
Change
|
||||||||||||||||
|
2012
|
% of
net sales
|
2011
|
% of
net sales
|
2012 vs. 2011
|
|||||||||||||
|
(In thousands, except percentages)
|
|||||||||||||||||
|
Net sales:
|
|||||||||||||||||
|
Polymer Solutions
|
$
|
892,232
|
|
32.5
|
%
|
$
|
1,001,922
|
|
34.9
|
%
|
(11
|
)%
|
|||||
|
Catalysts
|
1,067,948
|
|
38.9
|
%
|
1,116,863
|
|
38.9
|
%
|
(4
|
)%
|
|||||||
|
Fine Chemistry
|
785,240
|
|
28.6
|
%
|
750,220
|
|
26.2
|
%
|
5
|
%
|
|||||||
|
Total net sales
|
$
|
2,745,420
|
|
100.0
|
%
|
$
|
2,869,005
|
|
100.0
|
%
|
(4
|
)%
|
|||||
|
Segment operating profit:
|
|||||||||||||||||
|
Polymer Solutions
|
$
|
198,426
|
|
22.2
|
%
|
$
|
243,396
|
|
24.3
|
%
|
(18
|
)%
|
|||||
|
Catalysts
|
260,544
|
|
24.4
|
%
|
290,065
|
|
26.0
|
%
|
(10
|
)%
|
|||||||
|
Fine Chemistry
|
182,690
|
|
23.3
|
%
|
162,726
|
|
21.7
|
%
|
12
|
%
|
|||||||
|
Subtotal
|
641,660
|
|
696,187
|
|
(8
|
)%
|
|||||||||||
|
Equity in net income of unconsolidated investments:
|
|||||||||||||||||
|
Polymer Solutions
|
6,416
|
|
7,696
|
|
(17
|
)%
|
|||||||||||
|
Catalysts
|
31,651
|
|
36,259
|
|
(13
|
)%
|
|||||||||||
|
Fine Chemistry
|
—
|
|
—
|
|
—
|
%
|
|||||||||||
|
Corporate & other
|
—
|
|
(201
|
)
|
(100
|
)%
|
|||||||||||
|
Total equity in net income of unconsolidated
investments
|
38,067
|
|
43,754
|
|
(13
|
)%
|
|||||||||||
|
Net (income) loss attributable to noncontrolling
interests:
|
|||||||||||||||||
|
Polymer Solutions
|
(2,221
|
)
|
(9,803
|
)
|
(77
|
)%
|
|||||||||||
|
Catalysts
|
—
|
|
—
|
|
—
|
%
|
|||||||||||
|
Fine Chemistry
|
(16,350
|
)
|
(18,306
|
)
|
(11
|
)%
|
|||||||||||
|
Corporate & other
|
(20
|
)
|
26
|
|
*
|
|
|||||||||||
|
Total net income attributable to noncontrolling
interests
|
(18,591
|
)
|
(28,083
|
)
|
(34
|
)%
|
|||||||||||
|
Segment income:
|
|||||||||||||||||
|
Polymer Solutions
|
202,621
|
|
22.7
|
%
|
241,289
|
|
24.1
|
%
|
(16
|
)%
|
|||||||
|
Catalysts
|
292,195
|
|
27.4
|
%
|
326,324
|
|
29.2
|
%
|
(10
|
)%
|
|||||||
|
Fine Chemistry
|
166,340
|
|
21.2
|
%
|
144,420
|
|
19.3
|
%
|
15
|
%
|
|||||||
|
Total segment income
|
661,156
|
|
712,033
|
|
(7
|
)%
|
|||||||||||
|
Corporate & other
|
(123,831
|
)
|
(178,568
|
)
|
(31
|
)%
|
|||||||||||
|
Restructuring and other charges, net
|
(111,685
|
)
|
—
|
|
*
|
|
|||||||||||
|
Interest and financing expenses
|
(32,800
|
)
|
(37,574
|
)
|
(13
|
)%
|
|||||||||||
|
Other income, net
|
1,229
|
|
357
|
|
*
|
|
|||||||||||
|
Income tax expense
|
(82,533
|
)
|
(104,134
|
)
|
(21
|
)%
|
|||||||||||
|
Net income attributable to Albemarle Corporation
|
$
|
311,536
|
|
$
|
392,114
|
|
(21
|
)%
|
|||||||||
*Percentage calculation is not meaningful.
39
|
Albemarle Corporation and Subsidiaries
|
||
Our segment information includes measures we refer to as “Segment operating profit” and “Segment income” which are financial measures that are not required by, or presented in accordance with, GAAP. The Company has reported Segment operating profit and Segment income because management believes that these financial measures provide transparency to investors and enable period-to-period comparability of financial performance. Segment operating profit and Segment income should not be considered as an alternative to Operating profit or Net income attributable to Albemarle Corporation, respectively, as determined in accordance with GAAP.
See below for a reconciliation of Segment operating profit and Segment income, the non-GAAP financial measures, to Operating profit and Net income attributable to Albemarle Corporation, respectively, the most directly comparable financial measures calculated and reported in accordance with GAAP.
|
Year Ended
December 31,
|
|||||||
|
2012
|
2011
|
||||||
|
(In thousands)
|
|||||||
|
Total segment operating profit
|
$
|
641,660
|
|
$
|
696,187
|
|
|
|
Add (less):
|
|||||||
|
Corporate & other
(a)
|
(123,811
|
)
|
(178,393
|
)
|
|||
|
Restructuring and other charges, net
|
(111,685
|
)
|
—
|
|
|||
|
GAAP Operating profit
|
$
|
406,164
|
|
$
|
517,794
|
|
|
|
Total segment income
|
$
|
661,156
|
|
$
|
712,033
|
|
|
|
Add (less):
|
|||||||
|
Corporate & other
|
(123,831
|
)
|
(178,568
|
)
|
|||
|
Restructuring and other charges, net
|
(111,685
|
)
|
—
|
|
|||
|
Interest and financing expenses
|
(32,800
|
)
|
(37,574
|
)
|
|||
|
Other income, net
|
1,229
|
|
357
|
|
|||
|
Income tax expense
|
(82,533
|
)
|
(104,134
|
)
|
|||
|
GAAP Net income attributable to Albemarle Corporation
|
$
|
311,536
|
|
$
|
392,114
|
|
|
|
(a)
|
Excludes corporate equity income and noncontrolling interest adjustments of $(20) and $(175) for the years ended December 31, 2012 and 2011, respectively.
|
Polymer Solutions
Polymer Solutions segment net sales for the year ended December 31, 2012 were $892.2 million, down $109.7 million, or 11%, in comparison to the same period in 2011. The decrease was driven mainly by lower sales volumes in flame retardants of 7%, unfavorable currency impacts of 2% from a weaker Euro as compared to the U.S. dollar, and lower average pricing in our mineral flame retardants. These impacts were partly offset by favorable volumes in our stabilizers and curatives business and favorable average pricing in brominated flame retardants. Additionally, the second quarter exit from our phosphorus flame retardants business reduced revenue for the period by $24.0 million, or 2%, as compared to the prior year. Segment income for Polymer Solutions was down 16%, or $38.7 million, to $202.6 million for the year ended 2012 compared to 2011, due mainly to volume declines in flame retardants, lower pricing impacts in mineral flame retardants, unfavorable foreign currency impacts, and higher manufacturing costs, as well as lower equity in net income from our unconsolidated investment in Magnifin of $1.3 million compared to the corresponding period in 2011. These unfavorable results were offset in part by $7.6 million in lower net income attributable to noncontrolling interests in our JBC joint venture, favorable pricing in brominated flame retardants, and lower variable input costs. Additionally, the second quarter exit from our phosphorus flame retardants business increased segment income by $10.5 million, or 4%, as compared to the prior year.
Catalysts
Catalysts segment net sales for the year ended December 31, 2012 were $1.07 billion, a decrease of $48.9 million, or 4%, compared to the year ended December 31, 2011. This decrease was due mainly to unfavorable pricing on lower metals surcharges in refinery catalysts, partly offset by improved pricing in PCS. This net unfavorable price impact of 6% and unfavorable foreign exchange impacts of 2% were partly offset by higher volume impacts of 4% despite unfavorable mix shift impacts from HPC and alternative fuels to FCC refinery catalysts compared to the prior year. Catalysts segment income
40
|
Albemarle Corporation and Subsidiaries
|
||
decreased 10%, or $34.1 million, to $292.2 million for the year ended December 31, 2012 in comparison to the corresponding period of 2011. This decrease was due primarily to net unfavorable pricing impacts from volatility in metals surcharges and related cost impacts in refinery catalysts, higher manufacturing and SG&A spending and unfavorable foreign currency impacts, partly offset by overall favorable volume impacts and improved pricing in PCS. Also, Catalysts segment income for 2012 was unfavorably impacted by year-over-year declines in equity in net income from unconsolidated investments of $4.6 million, resulting mainly from unfavorable year-over-year performance in its refinery catalysts joint ventures FCC SA and Nippon Ketjen.
Fine Chemistry
Fine Chemistry segment net sales for the year ended December 31, 2012 were $785.2 million, an increase of $35.0 million, or 5%, versus the prior year. This increase was primarily attributable to favorable volume impacts of 6%, partly offset by unfavorable foreign currency impacts of 1%. Segment income for the year ended December 31, 2012 was $166.3 million, up 15% from the corresponding period in 2011. These improved results were due mainly to improved volumes in the segment, particularly in our services and intermediates businesses, offset in part by increases in manufacturing spending, higher variable input costs and unfavorable impacts from foreign currency. Also, Fine Chemistry segment income results were unfavorably impacted by higher SG&A/R&D spending (including favorable currency impacts), partly offset by lower net income attributable to noncontrolling interests of $2.0 million associated with lower profit results from our JBC joint venture.
Corporate and other
For the year ended December 31, 2012, our Corporate and other expense was $123.8 million compared to $178.6 million for the corresponding period in 2011. This decrease was primarily due to lower employee-related costs, including performance-based incentive compensation (reflected mainly in SG&A expenses). Additionally, Corporate and other expenses for 2012 include $68.0 million of pension and OPEB plan costs (including mark-to market actuarial losses) compared to $89.2 million of corresponding charges in 2011. Pension and OPEB costs included in Corporate and other for 2012 include a correction of
$10.3 million
for actuarial gains that relate to 2011.
Summary of Critical Accounting Policies and Estimates
Estimates, Assumptions and Reclassifications
The preparation of financial statements in conformity with GAAP requires management to make estimates and assumptions that affect the reported amounts of revenues, expenses, assets and liabilities and disclosure of contingent assets and liabilities at the date of the financial statements. Listed below are the estimates and assumptions that we consider to be critical in the preparation of our financial statements.
Certain amounts in the accompanying consolidated financial statements and notes thereto have been reclassified to conform to the current presentation.
Recovery of Long-Lived Assets.
We evaluate the recovery of our long-lived assets on a reporting unit basis by periodically analyzing our operating results and considering significant events or changes in the business environment.
Income Taxes.
We assume the deductibility of certain costs in our income tax filings and estimate the future recovery of deferred tax assets.
Environmental Remediation Liabilities.
We estimate and accrue the costs required to remediate a specific site depending on site-specific facts and circumstances. Cost estimates to remediate each specific site are developed by assessing (i) the scope of our contribution to the environmental matter, (ii) the scope of the anticipated remediation and monitoring plan and (iii) the extent of other parties’ share of responsibility.
Actual results could differ materially from the estimates and assumptions that we use in the preparation of our financial statements.
Revenue Recognition
We recognize sales when the revenue is realized or realizable, and has been earned, in accordance with authoritative accounting guidance. We recognize net sales as risk and title to the product transfer to the customer, which usually occurs at the time shipment is made. Significant portions of our sales are sold free on board (FOB) shipping point or on an equivalent basis, and other transactions are based upon specific contractual arrangements. Our standard terms of delivery are generally included
41
|
Albemarle Corporation and Subsidiaries
|
||
in our contracts of sale, order confirmation documents and invoices. We recognize revenue from services when performance of the services has been completed. We have a limited amount of consignment sales that are billed to the customer upon monthly notification of amounts used by the customers under these contracts. Where the Company incurs pre-production design and development costs under long-term supply contracts, these costs are expensed where they relate to the products sold unless contractual guarantees for reimbursement exist. Conversely, these costs are capitalized if they pertain to equipment that we will own and use in producing the products to be supplied and expect to utilize for future revenue generating activities.
Goodwill and Other Intangible Assets
We account for goodwill and other intangibles acquired in a business combination in conformity with current accounting guidance which requires goodwill and indefinite-lived intangible assets to not be amortized.
We test goodwill for impairment by comparing the estimated fair value of our reporting units to the related carrying value. We estimate the fair value based on present value techniques involving future cash flows. Future cash flows include assumptions for sales volumes, selling prices, raw material prices, labor and other employee benefit costs, capital additions and other economic or market related factors. Significant management judgment is involved in estimating these variables and they include inherent uncertainties since they are forecasting future events. We use a Weighted Average Cost of Capital (WACC) approach to determine our discount rate for goodwill recoverability testing. Our WACC calculation incorporates industry-weighted average returns on debt and equity from a market perspective. The factors in this calculation are largely external to the Company and, therefore, are beyond our control. We test our recorded goodwill balances for impairment in the fourth quarter of each year or upon the occurrence of events or changes in circumstances that would more likely than not reduce the fair value of our reporting units below their carrying amounts. The Company performed its annual goodwill impairment test as of October 31,
2013
and concluded there was no impairment as of that date.
Definite-lived intangible assets, such as purchased technology, patents, customer lists and trade names, are amortized over their estimated useful lives generally for periods ranging from
five
to
forty
years. We continually evaluate the reasonableness of the useful lives of these assets and test for impairment in accordance with current accounting guidance. See Note 10, “Goodwill and Other Intangibles” to our consolidated financial statements included in Item 8 beginning on page 53.
Pension Plans and Other Postretirement Benefits
Under authoritative accounting standards, assumptions are made regarding the valuation of benefit obligations and the performance of plan assets. As required, we recognize a balance sheet asset or liability for each of the pension or OPEB plans equal to the plan’s funded status as of the measurement date. The primary assumptions are as follows:
|
•
|
Discount Rate—The discount rate is used in calculating the present value of benefits, which is based on projections of benefit payments to be made in the future.
|
|
•
|
Expected Return on Plan Assets—We project the future return on plan assets based on prior performance and future expectations for the types of investments held by the plans as well as the expected long-term allocation of plan assets for these investments. These projected returns reduce the net benefit costs recorded currently.
|
|
•
|
Rate of Compensation Increase—For salary-related plans, we project employees’ annual pay increases, which are used to project employees’ pension benefits at retirement.
|
|
•
|
Rate of Increase in the Per Capita Cost of Covered Health Care Benefits—Eligible retirees receive fully insured medical benefits with the Company providing a cost sharing benefit subject to a cap. The pre-65 and post-65 caps were fully met as of January 1, 2013 and we do not anticipate increases in the cost sharing caps.
|
Actuarial gains and losses are recognized annually in our consolidated statements of income in the fourth quarter and whenever a plan is determined to qualify for a remeasurement during a fiscal year. The remaining components of pension and OPEB plan expense, primarily service cost, interest cost and expected return on assets, are recorded on a quarterly basis. The market-related value of assets equals the actual market value as of the date of measurement.
During
2013
, we made changes to the assumptions related to the discount rate, expected return on assets, and mortality scales. We consider available information that we deem relevant when selecting each of these assumptions.
In selecting the discount rates for the U.S. plans, we consider expected benefit payments on a plan-by-plan basis. As a result, the Company uses different discount rates for each plan depending on the demographics of participants and the expected timing of benefit payments. For
2013
, the discount rates were calculated using the results from a bond matching technique developed by Milliman, which matched the future estimated annual benefit payments of each respective plan against a portfolio of bonds of high quality to determine the discount rate. We believe our selected discount rates are determined using preferred
42
|
Albemarle Corporation and Subsidiaries
|
||
methodology under authoritative accounting guidance and accurately reflect market conditions as of the
December 31, 2013
measurement date.
In selecting the discount rates for the foreign plans, we relied on Aon Hewitt methods, including the Aon Hewitt Top-Quartile and a yield curve derived from fixed-income security yields. The yield curve is generally based on a universe containing Aa-graded corporate bonds in the Euro zone without special features or options, which could affect the duration. In some countries, the yield curve is based on local government bond rates with a premium added to reflect corporate bond risk. Payments we expect to be made from our retirement plans are applied to the resulting yield curve. For each plan, the discount rate was developed as the level equivalent rate that would produce the same present value as that using spot rates aligned with the projected benefit payments.
At
December 31, 2013
, the weighted-average discount rate was increased for the pension plans from
4.04%
to
5.00%
and for the OPEB plans from
4.00%
to
5.03%
to reflect market conditions as of the
December 31, 2013
measurement date.
In estimating the expected return on plan assets, we consider past performance and future expectations for the types of investments held by the plan as well as the expected long-term allocations of plan assets to these investments. For the years
2013
and
2012
, the weighted-average expected rate of return on domestic pension plan assets was
7.25%
and
8.25%
, respectively. The weighted-average expected rate of return on U.S. pension plan assets is
6.91%
effective January 1,
2014
. The weighted-average expected rate of return on plan assets for our OPEB plans was
7.00%
during
2013
and
2012
. There has been no change to the assumed rate of return on OPEB plan assets effective January 1,
2014
. Our U.S. defined benefit plan for non-represented employees was closed to new participants effective March 31, 2004 and benefit accruals will be frozen effective December 31, 2014. We adopted a defined contribution pension plan for U.S. employees hired after March 31, 2004 which was expanded to include all non-represented employees effective January 1, 2013.
In projecting the rate of compensation increase, we consider past experience in light of movements in inflation rates. At
December 31, 2013
, the assumed weighted-average rate of compensation increase changed to
2.78%
from
3.37%
for the pension plans. The assumed weighted-average rate of compensation increase was
3.50%
for the OPEB plans at
December 31, 2013
and 2012.
At
December 31, 2013
, the assumed rate of increase in the pre-65 and post-65 per capita cost of covered health care benefits for U.S. retirees was zero as the employer-paid premium caps (pre-65 and post-65) were met starting January 1, 2013.
A variance in the assumptions discussed above would have an impact on the projected benefit obligations, the accrued OPEB liabilities, and the annual net periodic pension and OPEB cost. The following table reflects the sensitivities associated with a hypothetical change in certain assumptions, primarily in the U.S. (in thousands):
|
(Favorable) Unfavorable
|
|||||||||||||||
|
1% Increase
|
1% Decrease
|
||||||||||||||
|
Increase (Decrease)
in Benefit Obligation
|
Increase (Decrease)
in Benefit Cost
|
Increase (Decrease)
in Benefit Obligation
|
Increase (Decrease)
in Benefit Cost
|
||||||||||||
|
Actuarial Assumptions
|
|||||||||||||||
|
Discount Rate:
|
|||||||||||||||
|
Pension
|
$
|
(67,729
|
)
|
$
|
(66,173
|
)
|
$
|
81,152
|
|
$
|
77,441
|
|
|||
|
Other postretirement benefits
|
$
|
(5,601
|
)
|
$
|
(5,601
|
)
|
$
|
6,830
|
|
$
|
6,830
|
|
|||
|
Expected return on plan assets:
|
|||||||||||||||
|
Pension
|
*
|
|
$
|
(5,989
|
)
|
*
|
|
$
|
6,052
|
|
|||||
|
Other postretirement benefits
|
*
|
|
$
|
(32
|
)
|
*
|
|
$
|
(32
|
)
|
|||||
* Not applicable.
Of the
$622.2 million
total pension and postretirement assets at
December 31, 2013
,
$123.6 million
, or approximately
20%
, are measured using significant unobservable inputs (Level 3). Gains or losses attributable to these assets are recognized in the consolidated balance sheets as either an increase or decrease in plan assets. See Note 17, “Pension Plans and Other Postretirement Benefits” to our consolidated financial statements included in Item 8 beginning on page 53.
43
|
Albemarle Corporation and Subsidiaries
|
||
Income Taxes
We use the liability method for determining our income taxes, under which current and deferred tax liabilities and assets are recorded in accordance with enacted tax laws and rates. Under this method, the amounts of deferred tax liabilities and assets at the end of each period are determined using the tax rate expected to be in effect when taxes are actually paid or recovered. Future tax benefits are recognized to the extent that realization of such benefits is more likely than not.
Deferred income taxes are provided for the estimated income tax effect of temporary differences between the financial statement carrying amounts and the tax basis of existing assets and liabilities. Deferred tax assets are also provided for operating losses, capital losses and certain tax credit carryovers. A valuation allowance, reducing deferred tax assets, is established when it is more likely than not that some portion or all of the deferred tax assets will not be realized. The realization of such deferred tax assets is dependent upon the generation of sufficient future taxable income of the appropriate character. Although realization is not assured, we do not establish a valuation allowance when we believe it is more likely than not that a net deferred tax asset will be realized.
We only recognize a tax benefit after concluding that it is more likely than not that the benefit will be sustained upon audit by the respective taxing authority based solely on the technical merits of the associated tax position. Once the recognition threshold is met, we recognize a tax benefit measured as the largest amount of the tax benefit that, in our judgment, is greater than 50% likely to be realized. Interest and penalties related to income tax liabilities are included in income tax expense.
We are subject to income taxes in the U.S. and numerous foreign jurisdictions. We are no longer subject to U.S. federal income tax audits by tax authorities for years prior to 2010 since the IRS has completed a review of our income tax returns through 2007 and our statute of limitations has expired for 2008 and 2009 except for the amount of any carryforward to 2010. We also are no longer subject to any U.S. state income tax audits prior to 2004.
With respect to jurisdictions outside the U.S., we are no longer subject to income tax audits for years prior to 2006. During 2013, the German tax authorities continued the audit of two of our German subsidiaries for 2006 through 2009 that began in 2011, and the Chinese tax authorities completed an audit of one of our Chinese subsidiaries for 2006 through 2010 that began in 2011. During 2011, we completed tax audits for one of our Belgian companies for 2008 and 2009, our Japanese company for 2006 through 2010, and two of our Chinese companies through 2010. No significant tax was assessed as a result of the completed audits.
While we believe we have adequately provided for all tax positions, amounts asserted by taxing authorities could be greater than our accrued position. Accordingly, additional provisions on federal and foreign tax-related matters could be recorded in the future as revised estimates are made or the underlying matters are settled or otherwise resolved.
Since the timing of resolutions and/or closure of tax audits are uncertain, it is difficult to predict with certainty the range of reasonably possible significant increases or decreases in the liability related to uncertain tax positions that may occur within the next twelve months. Our current view is that it is reasonably possible that we could record a decrease in the liability related to uncertain tax positions, relating to a number of issues, up to approximately
$2.8 million
as a result of closure of tax statutes.
We have designated the undistributed earnings of substantially all of our foreign operations as permanently reinvested and as a result we do not provide for deferred income taxes on the unremitted earnings of these subsidiaries. Our foreign earnings are computed under U.S. federal tax earnings and profits (E&P) principles. In general, to the extent our financial reporting book basis over tax basis of a foreign subsidiary exceeds these E&P amounts, deferred taxes have not been provided, as they are essentially permanent in duration. The determination of the amount of such unrecognized deferred tax liability is not practicable. We provide for deferred income taxes on our undistributed earnings of foreign operations that are not deemed to be permanently reinvested.
Stock-based Compensation Expense
The fair value of restricted stock awards, restricted stock unit awards and performance unit awards is determined based on the number of shares or units granted and the quoted price of our common stock at grant date, and the fair value of stock options is determined using the Black-Scholes valuation model. The fair value of these awards is determined after giving effect to estimated forfeitures. Such value is recognized as expense over the service period, which is generally the vesting period of the equity grant. To the extent restricted stock awards, restricted stock unit awards, performance unit awards and stock options are forfeited prior to vesting in excess of the estimated forfeiture rate, the corresponding previously recognized expense is reversed as an offset to operating expenses.
44
|
Albemarle Corporation and Subsidiaries
|
||
Internal Control Over Financial Reporting
Section 404 of the Sarbanes Oxley Act of 2002 (SOX 404) requires that we make an assertion as to the effectiveness of our internal control over financial reporting in our Annual Reports on Form 10-K. Our independent registered public accounting firm, PricewaterhouseCoopers LLP, provides its assessment of our effectiveness of internal control over financial reporting. In order to make our assertion, we are required to identify material financial and operational processes, document internal controls supporting the financial reporting process and evaluate the design and effectiveness of these controls. See “Management’s Report on Internal Control Over Financial Reporting” in Item 8.
We have a dedicated SOX 404 team to facilitate ongoing internal control testing, provide direction to the business groups and corporate staff in their control processes and assist in the overall assessment of internal control over financial reporting. Status and updates are provided to executive management and our Audit and Finance Committee of our Board of Directors on an ongoing basis. We also retain accounting firms other than our independent registered public accounting firm to assist us in our compliance with SOX 404.
Our SOX 404 effort involves many of our employees around the world, including participation by our business and functional groups. We view our ongoing evaluation of our internal control over financial reporting as more than a regulatory exercise—it provides us an opportunity to continually assess our financial control environment and make us a more effective company.
Financial Condition and Liquidity
Overview
The principal uses of cash in our business generally have been capital investments, funding working capital and repayment of debt. We also make contributions to our U.S. defined benefit pension plans, pay dividends to our shareholders and repurchase shares of our common stock. Historically, cash to fund the needs of our business has been principally provided by cash from operations, debt financing and equity issuances.
We are continually focused on working capital efficiency particularly in the areas of accounts receivable and inventory. We anticipate that cash on hand, cash provided by operating activities and long-term borrowings will be sufficient to pay our operating expenses, satisfy debt service obligations, fund capital expenditures and other investing activities, fund pension contributions and pay dividends for the foreseeable future.
Cash Flow
Our cash and cash equivalents were
$477.2 million
at
December 31, 2013
as compared to
$477.7 million
at
December 31, 2012
. Cash provided by operating activities was
$432.9 million
,
$488.8 million
and
$487.4 million
during the years ended
December 31, 2013
,
2012
and
2011
, respectively.
The decrease in cash provided by operating activities in 2013 versus 2012 was primarily due to a decrease in gross profit from our businesses offset by lower pension contributions and higher deferred income taxes. Cash provided by operating activities in 2012 was essentially flat versus 2011, with favorable impacts from lower pension contributions in 2012 being offset mainly by unfavorable impacts from lower profitability in 2012.
During 2013, proceeds from borrowings net of repayments, cash on hand and cash provided by operations funded payments of
$582.3 million
for repurchases of our common stock, capital expenditures for plant, machinery and equipment of
$155.3 million
, dividends to shareholders of
$78.1 million
and pension and postretirement contributions of
$13.3 million
. Additionally, during 2013 our consolidated joint venture, JBC, paid a dividend of approximately $38 million, which resulted in a dividend to noncontrolling interests of $10.0 million. In 2012, cash on hand and cash from operations funded capital expenditures for plant, machinery and equipment of $280.9 million, $22.5 million in loans to our 50%-owned joint venture SOCC, repayments of debt, net of borrowings, of $63.8 million, repurchases of shares of our common stock of $63.6 million, dividends to shareholders of $69.1 million and $9.1 million in withholding taxes paid on stock-based compensation amounts distributed during the period. In 2011, our operating cash flows funded capital expenditures for plant machinery and equipment of $190.6 million, repurchases of common stock of $178.1 million, dividends to shareholders of $57.8 million and $100.2 million of repayments of debt, net of borrowings, during the year.
Net current assets increased to approximately
$1.05 billion
at
December 31, 2013
from
$1.02 billion
at
December 31, 2012
. The increase in net current assets was due primarily to increases in accounts receivable and inventories, partly offset by increases in accounts payable, accrued expenses and the current portion of long-term debt.
45
|
Albemarle Corporation and Subsidiaries
|
||
Capital expenditures were
$155.3 million
,
$280.9 million
and
$190.6 million
for the years ended
December 31, 2013
,
2012
and
2011
, respectively, and were incurred mainly for plant machinery and equipment. We expect our capital expenditures to approximate $130 million in
2014
for capacity increases, cost reduction and continuity of operations projects.
We made contributions to our defined benefit pension and OPEB plans of
$13.3 million
,
$21.6 million
and
$59.8 million
during the years ended
December 31, 2013
,
2012
and
2011
, respectively. Included in contributions for the year ended December 31, 2012 is a contribution of $14.1 million to our supplemental executive retirement plan (SERP) in connection with the retirement of our former CEO and executive chairman.
On February 12, 2013, our Board of Directors authorized an increase in the number of shares the Company is permitted to repurchase under its existing share repurchase program to 15 million from 3.9 million shares that remained outstanding under the program as of December 31, 2012. Under the existing Board authorized share repurchase program, on May 9, 2013, the Company entered into an accelerated share repurchase agreement with JPMorgan relating to a fixed-dollar, uncollared accelerated share repurchase program. Pursuant to the terms of the agreement, on May 10, 2013, the Company paid $450 million to JPMorgan and received an initial delivery of 5,680,921 shares with a fair market value of approximately $360 million. This purchase was funded through a combination of available cash on hand and debt. Under the terms of the agreement, on December 19, 2013, the transaction was completed and we received a final settlement of 1,384,011 shares, calculated based on the daily Rule 10b-18 volume-weighted average prices of the Company’s common stock over the term of the agreement, less a forward price adjustment amount of approximately $1.01.
On February 3, 2014, we entered into an accelerated share repurchase agreement with Merrill Lynch International (“Merrill Lynch”), acting through its agent Merrill Lynch, Pierce, Fenner and Smith Incorporated, relating to a fixed-dollar, uncollared accelerated share repurchase program pursuant to which we will purchase $50 million of our shares from Merrill Lynch. The shares will be purchased by Merrill Lynch in two $25 million tranches that may be settled separately or simultaneously. On February 3, 2014, we paid $50 million to Merrill Lynch and received an initial delivery of 623,248 shares of our common stock with a fair market value of approximately $40 million. This purchase was funded with cash on hand. The total number of shares to ultimately be purchased under the agreement will be determined at the completion of the trade and will generally be based on the daily Rule 10b-18 volume-weighted average prices of the Company’s common stock over the term of the agreement, less a forward price adjustment amount of approximately $0.77. Final settlement may be accelerated, and the number of shares to be delivered upon final settlement may be adjusted upon the announcement or occurrence of certain corporate events, including without limitation, tender offers, delisting, merger events or insolvency. The agreement will be terminated at any time that our share price is at or below $30 per share. No more than 1.5 million shares can be repurchased under this program, and this program is expected to be completed by the end of April 2014.
During the year ended December 31, 2012, we and our joint venture partner each advanced $22.5 million to our 50%-owned joint venture, SOCC, pursuant to a long-term loan arrangement. The proceeds under this arrangement are for the construction of SOCC’s aluminum alkyls manufacturing facility. Our loan bears quarterly interest at the LIBOR plus 1.275% per annum (
1.52%
as of
December 31, 2013
), with interest receivable on a semi-annual basis on January 1 and July 1. Principal repayments on amounts outstanding under this arrangement are required as mutually agreed upon by the joint venture partners, but with any outstanding balances receivable in full no later than December 31, 2021. Also during the year ended December 31, 2012, we and our joint venture partner each advanced approximately 1.9 million Euros (approximately
$2.6 million
at
December 31, 2013
) to our 50%-owned joint venture, Eurecat S.A., pursuant to a long-term loan arrangement.
On
February 25, 2014
, we increased our quarterly dividend rate to
$0.275
per share, a
15%
increase from the quarterly rate of
$0.24
per share paid in 2013.
In connection with the announced realignment of our operating segments effective January 1, 2014, in the fourth quarter of 2013 we initiated a workforce reduction plan which will result in a reduction of approximately 230 employees worldwide. In the fourth quarter of 2013 we recorded charges of $33.4 million ($21.9 million after income taxes) for termination benefits and other costs related to this workforce reduction plan. Payments under this workforce reduction plan are expected to occur through 2014. We do not anticipate a significant reduction in future operating expenses as a result of the workforce reduction because we plan to redeploy resources to research and development, sales and business development in support of our strategic objectives to more rapidly develop and commercialize new applications for bromine, protect and grow our flame retardants business and more aggressively expand our catalyst business into new markets.
In 2012 we recorded net charges amounting to $100.8 million ($76.1 million after income taxes) in connection with our exit of the phosphorus flame retardants business. We began to realize favorable profit impacts from this program in the fourth quarter of 2012, and we expect to fund the remaining obligations associated with these charges (approximately $9 million) with cash generated from our ongoing operations.
46
|
Albemarle Corporation and Subsidiaries
|
||
At
December 31, 2013
and
December 31, 2012
, our cash and cash equivalents included
$388.3 million
and
$319.3 million
, respectively, held by our foreign subsidiaries. The majority of these foreign cash balances are associated with earnings that we have asserted are permanently reinvested and which we plan to use to support our continued growth plans outside the U.S. through funding of capital expenditures, acquisitions, research, operating expenses or other similar cash needs of our foreign operations. From time to time, we repatriate cash from our foreign subsidiaries to the U.S. for normal operating needs through intercompany dividends, but only from subsidiaries whose earnings we have not asserted to be permanently reinvested or whose earnings qualify as “previously taxed income” as defined by the Internal Revenue Code. For the years ended
December 31, 2013
,
2012
and
2011
, we repatriated approximately
$7.2 million
,
$70.6 million
and
$98.5 million
in cash, respectively, as part of these foreign cash repatriation activities.
While we continue to closely monitor our cash generation, working capital management and capital spending in light of continuing uncertainties in the global economy, we are optimistic that in
2014
we will continue to have the financial flexibility and capability to opportunistically fund future growth initiatives. Additionally, we anticipate that future capital spending including business acquisitions, share repurchases and other cash outlays should be financed primarily with cash flow provided by operations and cash on hand, with additional cash needed, if any, provided by borrowings, including borrowings under our February 2014 credit agreement and our commercial paper program. The amount and timing of any additional borrowings will depend on our specific cash requirements.
We currently have outstanding $325.0 million of 5.10% senior notes due in 2015 and $350.0 million of 4.50% senior notes due in 2020, or the senior notes. The senior notes are senior unsecured obligations and rank equally with all of our other senior unsecured indebtedness from time to time outstanding. The senior notes are effectively subordinated to any of our existing or future secured indebtedness and to the existing and future indebtedness of our subsidiaries. We may redeem the senior notes before their maturity, in whole at any time or in part from time to time, at a redemption price equal to the greater of (i) 100% of the principal amount of the senior notes to be redeemed, or (ii) the sum of the present values of the remaining scheduled payments of principal and interest thereon (exclusive of interest accrued to the date of redemption) discounted to the redemption date on a semi-annual basis using the Treasury Rate (as defined in the indentures governing the senior notes) plus 15 basis points for the senior notes maturing in 2015 and 25 basis points for the senior notes maturing in 2020, plus, in each case, accrued interest thereon to the date of redemption. However, the 2020 senior notes are redeemable in whole or in part, at our option, at any time on or after three months prior to the maturity date, at a redemption price equal to 100% of the principal amount of the senior notes to be redeemed plus accrued and unpaid interest on the senior notes to be redeemed to the date of redemption. Holders of the 2020 senior notes may require us to purchase such notes at 101% upon a Change of Control Triggering Event, as defined in the related indenture.
The principal amounts of the senior notes become immediately due and payable upon the occurrence of certain bankruptcy or insolvency events involving us or certain of our subsidiaries and may be declared immediately due and payable by the trustee or the holders of not less than 25% of the senior notes upon the occurrence of an event of default. Events of default include, among other things: failure to pay principal or interest at required times; failure to perform or remedy a breach of covenants within prescribed periods; an event of default on any of our other indebtedness or certain indebtedness of our subsidiaries of $40.0 million or more that is caused by a failure to make a payment when due or that results in the acceleration of that indebtedness before its maturity; and certain bankruptcy or insolvency events involving us or certain of our subsidiaries.
In anticipation of refinancing our 2015 senior notes in the fourth quarter of 2014, on January 22, 2014, we entered into a pay fixed, receive variable rate forward starting interest rate swap with J.P. Morgan Chase Bank, N.A., to be effective October 15, 2014. Under this swap, we hedged the interest rate and partial credit spread on the 20 future semi-annual coupon payments that we would pay when we refinance our 2015 senior notes with another 10 year note. The notional amount of the swap is $325.0 million and the fixed rate is 3.281%. A cash settlement will occur on the termination date determined by reference to the changes in the U.S. dollar 3-month LIBOR and credit spreads from the date we entered into the swap until the date we terminate the swap. We intend to designate this derivative financial instrument as an effective hedge under Accounting Standards Codification 815,
Derivatives and Hedging
.
On February 7, 2014, we entered into a new $750.0 million credit facility. The five-year, revolving, unsecured credit agreement (the February 2014 credit agreement) matures on February 7, 2019 and (i) replaces our previous $750.0 million amended and restated credit agreement (the September 2011 credit agreement) dated as of September 22, 2011; (ii) provides for an additional $250.0 million in credit, if needed, subject to the terms of the agreement; and (iii) provides for the ability to extend the maturity date under certain conditions. Borrowings bear interest at variable rates based on the LIBOR for deposits in the relevant currency plus an applicable margin which ranges from 0.900% to 1.500%, depending on the Company’s credit rating from S&P and Moody’s. The applicable margin on the facility was 1.000% as of February 25, 2014. There were no
47
|
Albemarle Corporation and Subsidiaries
|
||
borrowings outstanding under the February 2014 credit agreement as of February 25, 2014 and there were no borrowings outstanding under the September 2011 credit agreement as of
December 31, 2013
.
Borrowings under the February 2014 credit agreement are conditioned upon compliance with the following covenants: (i) consolidated funded debt, as defined in the agreement, must be less than or equal to 3.50 times consolidated EBITDA, as defined in the agreement, (which reflects adjustments for certain non-recurring or unusual items such as restructuring charges, facility divestiture charges and other significant non-recurring items), or herein “consolidated adjusted EBITDA,” as of the end of any fiscal quarter; (ii) with the exception of liens specified in our new credit facility, liens may not attach to assets when the aggregate amount of all indebtedness secured by such liens plus unsecured subsidiary indebtedness, other than indebtedness incurred by our subsidiaries under the February 2014 credit agreement, would exceed 20% of consolidated net worth, as defined in the agreement; and (iii) with the exception of indebtedness specified in the February 2014 credit agreement, subsidiary indebtedness may not exceed the difference between 20% of consolidated net worth, as defined in the agreement, and indebtedness secured by liens permitted under the agreement.
On May 29, 2013, we entered into agreements to initiate a commercial paper program on a private placement basis under which we may issue unsecured commercial paper notes (the “Notes”) from time-to-time up to a maximum aggregate principal amount outstanding at any time of $750 million. The proceeds from the issuance of the Notes are expected to be
used for general corporate purposes, including the repayment of other debt of the Company. Our February 2014 credit agreement is available to repay the Notes, if necessary. Aggregate borrowings outstanding under the February 2014 credit agreement and the commercial paper program will not exceed the $750 million current maximum amount available under the February 2014 credit agreement. The Notes will be sold at a discount from par, or alternatively, will be sold at par and bear interest at rates that will vary based upon market conditions at the time of the issuance of the Notes. The maturities of the Notes will vary but may not exceed 397 days from the date of issue. The definitive documents relating to the Program contain customary representations, warranties, default and indemnification provisions.
At
December 31, 2013
, we had
$363.0 million
of Notes outstanding bearing a weighted-average interest rate of approximately
0.23%
and a weighted-average maturity of
21 days
. While the outstanding Notes generally have short-term maturities, we classify the Notes as long-term based on our ability and intent to refinance the Notes on a long-term basis through the issuance of additional Notes or borrowings under the February 2014 credit agreement.
The non-current portion of our long-term debt amounted to
$1.1 billion
at
December 31, 2013
, compared to
$686.6 million
at
December 31, 2012
. The increase is mainly attributable to the issuance of the commercial paper notes noted above. In addition, at
December 31, 2013
, we had the ability to borrow
$387.0 million
under our commercial paper program and the September 2011 credit agreement, and
$233.8 million
under other existing lines of credit, subject to various financial covenants under our September 2011 credit agreement. As noted above, on February 7, 2014, we replaced the September 2011 credit agreement with a new $750.0 million credit facility with substantially similar terms, referred to as the February 2014 credit agreement. We have the ability and intent to refinance our borrowings under our other existing credit lines with borrowings under the February 2014 credit agreement, as applicable. Therefore, the amounts outstanding under those credit lines, if any, are classified as long-term debt. We believe that as of
December 31, 2013
we were, and currently are, in compliance with all of our debt covenants.
Off-Balance Sheet Arrangements
In the normal course of business with customers, vendors and others, we have entered into off-balance sheet arrangements, including bank guarantees and letters of credit, which totaled approximately
$26.6 million
at
December 31, 2013
. None of these off-balance sheet arrangements has, or is likely to have, a material effect on our current or future financial condition, results of operations, liquidity or capital resources.
48
|
Albemarle Corporation and Subsidiaries
|
||
Other Obligations
The following table summarizes our contractual obligations for capital projects, various take or pay and throughput agreements, long-term debt, operating leases and other commitments as of
December 31, 2013
(in thousands):
|
2014
|
2015
|
2016
|
2017
|
2018
|
Thereafter
|
||||||||||||||||||
|
Long-term debt obligations
(a)
|
$
|
24,554
|
|
$
|
327,070
|
|
$
|
379,416
|
|
$
|
46
|
|
$
|
—
|
|
$
|
350,000
|
|
|||||
|
Expected interest payments on long-
term debt obligations
(b)
|
33,665
|
|
19,559
|
|
16,499
|
|
15,750
|
|
15,750
|
|
31,500
|
|
|||||||||||
|
Operating lease obligations (rental)
|
7,232
|
|
5,556
|
|
4,142
|
|
3,351
|
|
2,286
|
|
6,060
|
|
|||||||||||
|
Take or pay / throughput agreements
(c)
|
16,303
|
|
13,635
|
|
11,019
|
|
5,220
|
|
595
|
|
1,122
|
|
|||||||||||
|
Letters of credit and guarantees
|
12,618
|
|
3,262
|
|
328
|
|
3,839
|
|
232
|
|
6,291
|
|
|||||||||||
|
Capital projects
|
17,158
|
|
142
|
|
—
|
|
—
|
|
—
|
|
—
|
|
|||||||||||
|
Payments in connection with global
business realignment
|
33,361
|
|
—
|
|
—
|
|
—
|
|
—
|
|
—
|
|
|||||||||||
|
Payments in connection with exit of
phosphorus flame retardants business
|
8,928
|
|
—
|
|
—
|
|
—
|
|
—
|
|
—
|
|
|||||||||||
|
Total
|
$
|
153,819
|
|
$
|
369,224
|
|
$
|
411,404
|
|
$
|
28,206
|
|
$
|
18,863
|
|
$
|
394,973
|
|
|||||
|
(a)
|
Amount for 2016 includes $363.0 million of Notes outstanding under our commercial paper program as of December 31, 2013. While the outstanding Notes generally have short-term maturities, we classify the Notes as long-term based on our ability and intent to refinance the Notes on a long-term basis through the issuance of additional Notes or borrowings under our credit agreement. In February 2014, the September 2011 credit agreement, which had a scheduled maturity date of September 22, 2016, was replaced by the February 2014 credit agreement, which has a scheduled maturity date of February 7, 2019.
|
|
(b)
|
These amounts are based on interest rates of 5.1% for the 2015 senior notes and 4.5% for the 2020 senior notes. A weighted average interest rate of 0.32% was used for our remaining long-term debt obligations.
|
|
(c)
|
These amounts primarily relate to contracts entered into with certain third party vendors in the normal course of business to secure raw materials for our production processes. In order to secure materials, sometimes for long durations, these contracts mandate a minimum amount of product to be purchased at predetermined rates over a set timeframe.
|
Amounts in the table above exclude required employer pension contributions. Contributions to our domestic and foreign qualified and nonqualified pension plans, including our SERP, are expected to approximate
$5 million
in
2014
. We may choose to make additional pension contributions in excess of this amount. We made contributions of
$9.8 million
to our domestic and foreign pension plans (both qualified and nonqualified) during the year ended
December 31, 2013
.
The liability related to uncertain tax positions, including interest and penalties, recorded in Other noncurrent liabilities totaled
$29.8 million
and
$29.2 million
at
December 31, 2013
and
2012
, respectively. Related assets for corresponding offsetting benefits recorded in Other assets totaled
$25.7 million
and
$25.8 million
at
December 31, 2013
and
2012
, respectively. We cannot estimate the amounts of any cash payments during the next twelve months associated with these liabilities and are unable to estimate the timing of any such cash payments in the future at this time.
In anticipation of refinancing our 2015 senior notes in the fourth quarter of 2014, on January 22, 2014, we entered into a pay fixed, receive variable rate forward starting interest rate swap with J.P. Morgan Chase Bank, N.A., to be effective October 15, 2014. Under this swap, we hedged the interest rate and partial credit spread on the 20 future semi-annual coupon payments that we would pay when we refinance our 2015 senior notes with another 10 year note. The notional amount of the swap is $325.0 million and the fixed rate is 3.281%. A cash settlement will occur on the termination date determined by reference to the changes in the U.S. dollar 3-month LIBOR and credit spreads from the date we entered into the swap until the date we terminate the swap.
On February 3, 2014, we paid $50 million to Merrill Lynch in connection with an accelerated share repurchase agreement that we entered into with Merrill Lynch on that date. For additional details about this transaction, see
Cash Flow
above.
Liquidity Outlook
We anticipate that cash on hand, cash provided by operating activities (including goals to reduce working capital by $100 million over two years) and long-term borrowings will be sufficient to pay our operating expenses, satisfy debt service obligations, fund any capital expenditures and share repurchases, make pension contributions and pay dividends for the
49
|
Albemarle Corporation and Subsidiaries
|
||
foreseeable future. In addition, as we have historically done, we will continue to evaluate the merits of any opportunities that may arise for acquisitions of businesses or assets, which may require additional liquidity.
While we maintain business relationships with a diverse group of financial institutions, an adverse change in their credit standing could lead them to not honor their contractual credit commitments, decline funding under existing but uncommitted lines of credit, not renew their extensions of credit or not provide new financing. While the corporate bond and debt markets remain strong, volatility has increased in all capital markets over the past few years during times of uncertainty, such as European sovereign debt and U.S. budget concerns. If these concerns heighten, we may incur increased borrowing costs and reduced credit capacity as our various credit facilities mature. In addition, our cash flows from operations may be negatively affected by adverse consequences to our customers and the markets in which we compete as a result of moderating global economic conditions and reduced capital availability. When the U.S. Federal Reserve or similar national reserve banks in other countries decide to tighten the monetary supply in response, for example, to improving economic conditions, we may incur increased borrowing costs as interest rates increase on our variable rate credit facilities, as our various credit facilities mature or as we refinance any maturing fixed rate debt obligations.
At
December 31, 2013
, we had the ability to borrow approximately
$621 million
subject to the leverage covenant under our September 2011 credit agreement. On February 7, 2014, we replaced our September 2011 credit agreement with a new $750.0 million credit facility with substantially similar terms, referred to as the February 2014 credit agreement. With generally strong cash-generative businesses and no significant debt maturities before 2015, we believe we have and will maintain a solid liquidity position.
We had cash and cash equivalents totaling
$477.2 million
as of
December 31, 2013
of which
$388.3 million
is held by our foreign subsidiaries. This cash represents an important source of our liquidity and is invested in short-term investments including time deposits and readily marketable securities with relatively short maturities. Substantially all of this cash is held, and intended for use, outside of the U.S. We anticipate that any needs for liquidity within the U.S. in excess of our cash held in the U.S. can be readily satisfied with borrowings under our existing U.S. credit facilities or our commercial paper program.
Safety and Environmental Matters
We are subject to federal, state, local and foreign requirements regulating the handling, manufacture and use of materials (some of which may be classified as hazardous or toxic by one or more regulatory agencies), the discharge of materials into the environment and the protection of the environment. To our knowledge, we are currently complying and expect to continue to comply in all material respects with applicable environmental laws, regulations, statutes and ordinances. Compliance with existing federal, state, local and foreign environmental protection laws is not expected to have a material effect on capital expenditures, earnings or our competitive position, but the costs associated with increased legal or regulatory requirements could have an adverse effect on our results.
Among other environmental requirements, we are subject to the federal Superfund law, and similar state laws, under which we may be designated as a PRP, and may be liable for a share of the costs associated with cleaning up various hazardous waste sites. Management believes that in cases in which we may have liability as a PRP, our liability for our share of cleanup is de minimis. Further, almost all such sites represent environmental issues that are quite mature and have been investigated, studied and in many cases settled. In de minimis situations, our policy generally is to negotiate a consent decree and to pay any apportioned settlement, enabling us to be effectively relieved of any further liability as a PRP, except for remote contingencies. In other than de minimis PRP matters, our records indicate that unresolved PRP exposures should be immaterial. We accrue and expense our proportionate share of PRP costs. Because management has been actively involved in evaluating environmental matters, we are able to conclude that the outstanding environmental liabilities for unresolved PRP sites should not have a material adverse effect upon our results of operations or financial condition.
Our environmental and safety operating costs charged to expense were
$44.0 million
,
$39.0 million
and
$35.4 million
in
2013
,
2012
and
2011
, respectively, excluding depreciation of previous capital expenditures, and are expected to be in the same range in the next few years. Costs for remediation have been accrued and payments related to sites are charged against accrued liabilities, which at
December 31, 2013
totaled approximately
$16.6 million
,
a decrease
of
$3.7 million
from
$20.3 million
at
December 31, 2012
. During the second quarter of 2012, the Company recorded $8.7 million in estimated site remediation liabilities at our Avonmouth, United Kingdom site as part of the charges associated with our exit of the phosphorus flame retardant business.
We believe that any sum we may be required to pay in connection with environmental remediation and asset retirement obligation matters in excess of the amounts recorded should occur over a period of time and should not have a material adverse effect upon our results of operations, financial condition or cash flows on a consolidated annual basis, although any such sum
50
|
Albemarle Corporation and Subsidiaries
|
||
could have a material adverse impact on our results of operations, financial condition or cash flows in a particular quarterly reporting period. See also Item 3. “Legal Proceedings” on p
age 23.
Capital expenditures for pollution-abatement and safety projects, including such costs that are included in other projects, were approximately
$14.1 million
,
$25.4 million
and
$16.1 million
in
2013
,
2012
and
2011
, respectively. In the future, capital expenditures for these types of projects may increase due to more stringent environmental regulatory requirements and our efforts in reaching sustainability goals. Management’s estimates of the effects of compliance with governmental pollution-abatement and safety regulations are subject to (i) the possibility of changes in the applicable statutes and regulations or in judicial or administrative construction of such statutes and regulations and (ii) uncertainty as to whether anticipated solutions to pollution problems will be successful, or whether additional expenditures may prove necessary.
Recently Issued Accounting Pronouncements
In December 2011, the Financial Accounting Standards Board (FASB) issued accounting guidance that requires entities to disclose information about financial instruments (including derivatives) and transactions eligible for offset in the statement of financial position or subject to an agreement similar to a master netting arrangement. In January 2013, the FASB issued additional guidance that limits the scope of these new requirements to certain derivatives, repurchase agreements and reverse repurchase agreements and securities borrowing and lending transactions. These amendments became effective on January 1, 2013 and had no impact on our consolidated financial statements.
In February 2013, the FASB issued accounting guidance that requires companies to present either in a single note or on the face of the financial statements the effect of significant amounts reclassified from each component of accumulated other comprehensive income, and the income statement line items affected by the reclassification. If a component is not required to be reclassified to net income in its entirety, companies would instead cross reference to the related footnote for additional information. These amendments became effective for us beginning with the first quarter of 2013 and did not have a material impact on our consolidated financial statements.
In February 2013, the FASB issued accounting guidance that requires entities that have obligations resulting from joint and several liability arrangements and for which the total amount is fixed at the reporting date to measure such obligations as the sum of (a) the amount the entity agreed to pay on the basis of its arrangement among its co-obligors, and (b) any additional amount the reporting entity expects to pay on behalf of its co-obligors. Entities are also required to disclose the nature, amount and any other relevant information about such obligations. This accounting guidance will become effective for fiscal years, and interim periods within those years, beginning after December 15, 2013 and should be applied retrospectively to all prior periods presented for obligations that exist at the beginning of an entity’s fiscal year of adoption. We do not expect this new guidance to have a material effect on our consolidated financial statements.
In March 2013, the FASB issued accounting guidance that clarifies a parent company’s accounting for the cumulative foreign currency translation adjustment when the parent sells a part or all of its investment in a foreign entity. The guidance clarifies that the sale of an investment in a foreign entity includes both (a) events that result in the loss of a controlling financial interest in a foreign entity, and (b) events that result in an acquirer obtaining control of an acquiree in which it held an equity interest immediately before the acquisition date (sometimes also referred to as a step acquisition). Accordingly, the cumulative foreign currency translation adjustment should be released into net income upon the occurrence of those events. This accounting guidance will become effective for fiscal years, and interim periods within those years, beginning after December 15, 2013, and should be applied prospectively to derecognition events occurring after the effective date. The impact of these new requirements on our financial statements will depend upon the nature, terms and size of derecognition events, if any, that may occur in the future related to any of our foreign entities.
In July 2013, the FASB issued accounting guidance designed to reduce diversity in practice of financial statement presentation of an unrecognized tax benefit when a net operating loss carryforward, a similar tax loss, or a tax credit carryforward exists. These new requirements become effective for fiscal years, and interim periods within those years, beginning after December 15, 2013. We do not expect this new guidance to have a material effect on our consolidated financial statements.
51
|
Albemarle Corporation and Subsidiaries
|
||
|
Item 7A.
|
Quantitative and Qualitative Disclosures About Market Risk.
|
The primary currencies to which we have foreign currency exchange rate exposure are the European Union Euro, Japanese Yen, British Pound Sterling, Korean Won, Chinese Renminbi, Brazilian Real and the U.S. Dollar (in certain of our foreign locations). In response to greater fluctuations in foreign currency exchange rates in recent periods, we have increased the degree of exposure risk management activities to minimize the potential impact on earnings.
We manage our foreign currency exposures by balancing certain assets and liabilities denominated in foreign currencies and through the use, from time to time, of foreign currency forward contracts. The principal objective of such contracts is to minimize the risks and/or costs associated with global operating activities. The counterparties to these contractual agreements are major financial institutions with which we generally have other financial relationships. We are exposed to credit loss in the event of nonperformance by these counterparties. However, we do not anticipate nonperformance by the counterparties. We do not utilize financial instruments for trading or other speculative purposes.
The primary method we use to reduce foreign currency exposure is to identify natural hedges, in which the operating activities denominated in respective currencies across various subsidiaries balance in respect to timing and the underlying exposures. In the event a natural hedge is not available, we may employ a forward contract to reduce exposure, generally expiring within one year. While these contracts are subject to fluctuations in value, such fluctuations are intended to offset the changes in the value of the underlying exposures being hedged. Gains and losses on foreign currency forward contracts are recognized currently in income but do not have a significant impact on results of operations.
Our financial instruments, which are subject to foreign currency exchange risk, consist of foreign currency forward contracts with an aggregate notional value of
$321.4 million
and with a fair value representing a net asset position of
$0.2 million
at
December 31, 2013
. Fluctuations in the value of these contracts are intended to offset the changes in the value of the underlying exposures being hedged. We conducted a sensitivity analysis on the fair value of our foreign currency hedge portfolio assuming an instantaneous 10% change in select foreign currency exchange rates from their levels as of
December 31, 2013
, with all other variables held constant. A 10% appreciation of the U.S. Dollar against foreign currencies that we hedge would result in
a decrease
of approximately
$16.4 million
in the fair value of our foreign currency forward contracts. A 10% depreciation of the U.S. Dollar against these foreign currencies would result in
an increase
of approximately
$12.0 million
in the fair value of our foreign currency forward contracts. The sensitivity of the fair value of our foreign currency hedge portfolio represents changes in fair values estimated based on market conditions as of
December 31, 2013
, without reflecting the effects of underlying anticipated transactions. When those anticipated transactions are realized, actual effects of changing foreign currency exchange rates could have a material impact on our earnings and cash flows in future periods.
We are exposed to changes in interest rates that could impact our results of operations and financial condition. We manage global interest rate and foreign exchange exposure as part of our regular operational and financing strategies. We had variable interest rate borrowings of
$397.9 million
and
$7.0 million
outstanding at
December 31, 2013
and
2012
, respectively. These borrowings represented
37%
and
1%
of total outstanding debt and bore average interest rates of
0.30%
and
1.74%
at
December 31, 2013
and
2012
, respectively. A hypothetical 10% increase (approximately
3
basis points) in the average interest rate applicable to these borrowings would change our annualized interest expense by approximately
$0.1 million
as of
December 31, 2013
. We may enter into interest rate swaps, collars or similar instruments with the objective of reducing interest rate volatility relating to our borrowing costs.
Our raw materials are subject to price volatility caused by weather, supply conditions, political and economic variables and other unpredictable factors. Historically, we have not used futures, options or swap contracts to manage the volatility related to the above exposures. However, the refinery catalysts business has used financing arrangements to provide long-term protection against changes in metals prices. We seek to limit our exposure by entering into long-term contracts when available, and we seek price increase limitations through contracts. These contracts do not have a significant impact on our results of operations.
52
|
Albemarle Corporation and Subsidiaries
|
||
|
Item 8.
|
Financial Statements and Supplementary Data.
|
MANAGEMENT’S REPORT ON INTERNAL CONTROL OVER FINANCIAL REPORTING
Our management is responsible for establishing and maintaining adequate internal control over financial reporting as defined in Exchange Act Rule 13a-15(f) and 15d-15(f). Our internal control over financial reporting is a process designed to provide reasonable assurance regarding the reliability of financial reporting and the preparation of financial statements for external purposes in accordance with accounting principles generally accepted in the United States. Our internal control over financial reporting includes those policies and procedures that (i) pertain to the maintenance of records that, in reasonable detail, accurately and fairly reflect the transactions and dispositions of assets; (ii) provide reasonable assurance that transactions are recorded as necessary to permit preparation of financial statements in accordance with accounting principles generally accepted in the United States, and that receipts and expenditures of the Company are being made only in accordance with management’s and our directors’ authorizations; and (iii) provide reasonable assurance regarding prevention or timely detection of unauthorized acquisition, use, or disposition of our assets that could have a material effect on the financial statements.
Under the supervision and with the participation of our management, including our principal executive officer and principal financial officer, we conducted an evaluation of the effectiveness of our internal control over financial reporting as of
December 31, 2013
. In making this assessment, management used the criteria for effective internal control over financial reporting described in the “Internal Control-Integrated Framework” (1992) set forth by the Committee of Sponsoring Organizations of the Treadway Commission (COSO). Based on the assessment, management concluded that, as of
December 31, 2013
, our internal control over financial reporting was effective to provide reasonable assurance regarding the reliability of financial reporting and the preparation of financial statements for external purposes in accordance with generally accepted accounting principles in the United States. The concept of reasonable assurance is based on the recognition that there are inherent limitations in all systems of internal control. Because of its inherent limitations, internal control over financial reporting may not prevent or detect misstatements. Also, projections of any evaluation of effectiveness to future periods are subject to the risk that controls may become inadequate because of changes in conditions, or that the degree of compliance with the policies or procedures may deteriorate.
The effectiveness of our internal control over financial reporting as of
December 31, 2013
has been audited by PricewaterhouseCoopers LLP, an independent registered public accounting firm, as stated in their report which is included herein.
|
/
S
/ L
UTHER
C. K
ISSAM
IV
|
/
S
/ S
COTT
A. T
OZIER
|
|
|
Luther C. Kissam IV
|
Scott A. Tozier
|
|
|
President, Chief Executive Officer and Director
|
Senior Vice President, Chief Financial Officer and
|
|
|
(principal executive officer)
|
Chief Accounting Officer
|
|
|
February 25, 2014
|
February 25, 2014
|
|
53
|
Albemarle Corporation and Subsidiaries
|
||
Report of Independent Registered Public Accounting Firm
To the Board of Directors and Shareholders of Albemarle Corporation:
In our opinion, the financial statements listed in the index appearing under Item 15(a) (1) present fairly, in all material respects, the financial position of Albemarle Corporation and its subsidiaries at
December 31, 2013
and
December 31, 2012
, and the results of their operations and their cash flows for each of the three years in the period ended
December 31, 2013
in conformity with accounting principles generally accepted in the United States of America. Also in our opinion, the Company maintained, in all material respects, effective internal control over financial reporting as of
December 31, 2013
, based on criteria established in
Internal Control—Integrated Framework
(1992) issued by the Committee of Sponsoring Organizations of the Treadway Commission (COSO). The Company’s management is responsible for these financial statements, for maintaining effective internal control over financial reporting and for its assessment of the effectiveness of internal control over financial reporting, included in the accompanying Management’s Report on Internal Control over Financial Reporting. Our responsibility is to express opinions on these financial statements and on the Company’s internal control over financial reporting based on our integrated audits. We conducted our audits in accordance with the standards of the Public Company Accounting Oversight Board (United States). Those standards require that we plan and perform the audits to obtain reasonable assurance about whether the financial statements are free of material misstatement and whether effective internal control over financial reporting was maintained in all material respects. Our audits of the financial statements included examining, on a test basis, evidence supporting the amounts and disclosures in the financial statements, assessing the accounting principles used and significant estimates made by management, and evaluating the overall financial statement presentation. Our audit of internal control over financial reporting included obtaining an understanding of internal control over financial reporting, assessing the risk that a material weakness exists, and testing and evaluating the design and operating effectiveness of internal control based on the assessed risk. Our audits also included performing such other procedures as we considered necessary in the circumstances. We believe that our audits provide a reasonable basis for our opinions.
A company’s internal control over financial reporting is a process designed to provide reasonable assurance regarding the reliability of financial reporting and the preparation of financial statements for external purposes in accordance with generally accepted accounting principles. A company’s internal control over financial reporting includes those policies and procedures that (i) pertain to the maintenance of records that, in reasonable detail, accurately and fairly reflect the transactions and dispositions of the assets of the company; (ii) provide reasonable assurance that transactions are recorded as necessary to permit preparation of financial statements in accordance with generally accepted accounting principles, and that receipts and expenditures of the company are being made only in accordance with authorizations of management and directors of the company; and (iii) provide reasonable assurance regarding prevention or timely detection of unauthorized acquisition, use, or disposition of the company’s assets that could have a material effect on the financial statements.
Because of its inherent limitations, internal control over financial reporting may not prevent or detect misstatements. Also, projections of any evaluation of effectiveness to future periods are subject to the risk that controls may become inadequate because of changes in conditions, or that the degree of compliance with the policies or procedures may deteriorate.
|
/s/ PricewaterhouseCoopers LLP
|
|
New Orleans, Louisiana
|
|
February 25, 2014
|
54
|
Albemarle Corporation and Subsidiaries
|
||
|
|
|
(In Thousands)
|
|||||||
|
December 31
|
2013
|
2012
|
|||||
|
Assets
|
|||||||
|
Current assets:
|
|||||||
|
Cash and cash equivalents
|
$
|
477,239
|
|
$
|
477,696
|
|
|
|
Trade accounts receivable, less allowance for doubtful accounts (2013—$1,614;
2012—$1,641)
|
446,864
|
|
378,973
|
|
|||
|
Other accounts receivable
|
45,094
|
|
43,844
|
|
|||
|
Inventories:
|
|||||||
|
Finished goods
|
340,863
|
|
325,762
|
|
|||
|
Raw materials
|
47,784
|
|
57,245
|
|
|||
|
Stores, supplies and other
|
47,402
|
|
45,138
|
|
|||
|
436,049
|
|
428,145
|
|
||||
|
Other current assets
|
77,669
|
|
78,655
|
|
|||
|
Total current assets
|
1,482,915
|
|
1,407,313
|
|
|||
|
Property, plant and equipment, at cost
|
2,972,084
|
|
2,818,604
|
|
|||
|
Less accumulated depreciation and amortization
|
1,615,015
|
|
1,522,033
|
|
|||
|
Net property, plant and equipment
|
1,357,069
|
|
1,296,571
|
|
|||
|
Investments
|
212,178
|
|
207,141
|
|
|||
|
Other assets
|
160,229
|
|
154,836
|
|
|||
|
Goodwill
|
284,203
|
|
276,966
|
|
|||
|
Other intangibles, net of amortization
|
88,203
|
|
94,464
|
|
|||
|
Total assets
|
$
|
3,584,797
|
|
$
|
3,437,291
|
|
|
|
Liabilities and Equity
|
|||||||
|
Current liabilities:
|
|||||||
|
Accounts payable
|
$
|
194,064
|
|
$
|
172,866
|
|
|
|
Accrued expenses
|
190,533
|
|
177,546
|
|
|||
|
Current portion of long-term debt
|
24,554
|
|
12,700
|
|
|||
|
Dividends payable
|
19,197
|
|
17,471
|
|
|||
|
Income taxes payable
|
8,015
|
|
4,426
|
|
|||
|
Total current liabilities
|
436,363
|
|
385,009
|
|
|||
|
Long-term debt
|
1,054,310
|
|
686,588
|
|
|||
|
Postretirement benefits
|
53,903
|
|
60,815
|
|
|||
|
Pension benefits
|
57,647
|
|
195,481
|
|
|||
|
Other noncurrent liabilities
|
110,610
|
|
114,022
|
|
|||
|
Deferred income taxes
|
129,188
|
|
63,368
|
|
|||
|
Commitments and contingencies (Note 15)
|
|
|
|||||
|
Equity:
|
|||||||
|
Albemarle Corporation shareholders’ equity:
|
|||||||
|
Common stock, $.01 par value (authorized 150,000 shares), issued and outstanding —
80,053 in 2013 and 88,899 in 2012
|
801
|
|
889
|
|
|||
|
Additional paid-in capital
|
9,957
|
|
2,761
|
|
|||
|
Accumulated other comprehensive income
|
116,245
|
|
85,264
|
|
|||
|
Retained earnings
|
1,500,358
|
|
1,744,684
|
|
|||
|
Total Albemarle Corporation shareholders’ equity
|
1,627,361
|
|
1,833,598
|
|
|||
|
Noncontrolling interests
|
115,415
|
|
98,410
|
|
|||
|
Total equity
|
1,742,776
|
|
1,932,008
|
|
|||
|
Total liabilities and equity
|
$
|
3,584,797
|
|
$
|
3,437,291
|
|
|
See accompanying notes to the consolidated financial statements.
55
|
Albemarle Corporation and Subsidiaries
|
||
|
|
|
(In Thousands, Except Per Share Amounts)
|
|||||||||||
|
Year Ended December 31
|
2013
|
2012
|
2011
|
||||||||
|
Net sales
|
$
|
2,616,416
|
|
$
|
2,745,420
|
|
$
|
2,869,005
|
|
||
|
Cost of goods sold
|
1,755,011
|
|
1,835,425
|
|
1,914,058
|
|
|||||
|
Gross profit
|
861,405
|
|
909,995
|
|
954,947
|
|
|||||
|
Selling, general and administrative expenses
|
162,889
|
|
313,227
|
|
360,070
|
|
|||||
|
Research and development expenses
|
82,246
|
|
78,919
|
|
77,083
|
|
|||||
|
Restructuring and other charges, net (Note 19)
|
33,361
|
|
111,685
|
|
—
|
|
|||||
|
Operating profit
|
582,909
|
|
406,164
|
|
517,794
|
|
|||||
|
Interest and financing expenses
|
(31,559
|
)
|
(32,800
|
)
|
(37,574
|
)
|
|||||
|
Other (expenses) income, net
|
(6,923
|
)
|
1,229
|
|
357
|
|
|||||
|
Income before income taxes and equity in net income of
unconsolidated investments
|
544,427
|
|
374,593
|
|
480,577
|
|
|||||
|
Income tax expense
|
136,322
|
|
82,533
|
|
104,134
|
|
|||||
|
Income before equity in net income of unconsolidated investments
|
408,105
|
|
292,060
|
|
376,443
|
|
|||||
|
Equity in net income of unconsolidated investments (net of tax)
|
31,729
|
|
38,067
|
|
43,754
|
|
|||||
|
Net income
|
439,834
|
|
330,127
|
|
420,197
|
|
|||||
|
Net income attributable to noncontrolling interests
|
(26,663
|
)
|
(18,591
|
)
|
(28,083
|
)
|
|||||
|
Net income attributable to Albemarle Corporation
|
$
|
413,171
|
|
$
|
311,536
|
|
$
|
392,114
|
|
||
|
Basic earnings per share
|
$
|
4.93
|
|
$
|
3.49
|
|
$
|
4.33
|
|
||
|
Diluted earnings per share
|
$
|
4.90
|
|
$
|
3.47
|
|
$
|
4.28
|
|
||
|
Weighted-average common shares outstanding—basic
|
83,839
|
|
89,189
|
|
90,522
|
|
|||||
|
Weighted-average common shares outstanding—diluted
|
84,322
|
|
89,884
|
|
91,522
|
|
|||||
|
Cash dividends declared per share of common stock
|
$
|
0.96
|
|
$
|
0.80
|
|
$
|
0.67
|
|
||
See accompanying notes to the consolidated financial statements.
56
|
Albemarle Corporation and Subsidiaries
|
||
|
CONSOLIDATED STATEMENTS OF COMPREHENSIVE INCOME
|
|
(In Thousands)
|
|||||||||||
|
Year Ended December 31
|
2013
|
2012
|
2011
|
||||||||
|
Net income
|
$
|
439,834
|
|
$
|
330,127
|
|
$
|
420,197
|
|
||
|
Other comprehensive income (loss), net of tax:
|
|||||||||||
|
Foreign currency translation
|
31,704
|
|
28,769
|
|
(13,565
|
)
|
|||||
|
Pension and postretirement benefits
|
(502
|
)
|
(4,071
|
)
|
(1,362
|
)
|
|||||
|
Other
|
135
|
|
134
|
|
162
|
|
|||||
|
Total other comprehensive income (loss), net of tax
|
31,337
|
|
24,832
|
|
(14,765
|
)
|
|||||
|
Comprehensive income
|
471,171
|
|
354,959
|
|
405,432
|
|
|||||
|
Comprehensive income attributable to non-controlling interests
|
(27,019
|
)
|
(18,488
|
)
|
(27,878
|
)
|
|||||
|
Comprehensive income attributable to Albemarle Corporation
|
$
|
444,152
|
|
$
|
336,471
|
|
$
|
377,554
|
|
||
See accompanying notes to the consolidated financial statements.
57
|
Albemarle Corporation and Subsidiaries
|
||
|
CONSOLIDATED STATEMENTS OF CHANGES IN EQUITY
|
|
(In Thousands, Except Share Data)
|
|||||||||||||||||||||||||||||||
|
Common Stock
|
Additional
Paid-in
Capital
|
Accumulated
Other
Comprehensive
Income
|
Retained
Earnings
|
Total
Albemarle
Shareholders’
Equity
|
Non-
controlling
Interests
|
Total
Equity
|
|||||||||||||||||||||||||
|
Shares
|
Amounts
|
||||||||||||||||||||||||||||||
|
Balance at January 1, 2011
|
91,593,984
|
|
$
|
916
|
|
$
|
18,835
|
|
$
|
74,889
|
|
$
|
1,321,434
|
|
$
|
1,416,074
|
|
$
|
59,672
|
|
$
|
1,475,746
|
|
||||||||
|
Net income for 2011
|
392,114
|
|
392,114
|
|
28,083
|
|
420,197
|
|
|||||||||||||||||||||||
|
Other comprehensive loss
|
(14,560
|
)
|
(14,560
|
)
|
(205
|
)
|
(14,765
|
)
|
|||||||||||||||||||||||
|
Cash dividends declared for
2011
|
(60,450
|
)
|
(60,450
|
)
|
(60,450
|
)
|
|||||||||||||||||||||||||
|
Stock-based compensation and
other
|
26,556
|
|
26,556
|
|
26,556
|
|
|||||||||||||||||||||||||
|
Exercise of stock options
|
169,350
|
|
2
|
|
2,228
|
|
2,230
|
|
2,230
|
|
|||||||||||||||||||||
|
Shares repurchased
|
(3,000,000
|
)
|
(30
|
)
|
(39,870
|
)
|
(138,232
|
)
|
(178,132
|
)
|
(178,132
|
)
|
|||||||||||||||||||
|
Tax benefit related to stock
plans
|
10,574
|
|
10,574
|
|
10,574
|
|
|||||||||||||||||||||||||
|
Issuance of common stock, net
|
131,713
|
|
1
|
|
(1
|
)
|
—
|
|
—
|
|
|||||||||||||||||||||
|
Shares withheld for withholding
taxes associated with common
stock issuances
|
(53,807
|
)
|
(1
|
)
|
(3,128
|
)
|
(3,129
|
)
|
(3,129
|
)
|
|||||||||||||||||||||
|
Balance at December 31, 2011
|
88,841,240
|
|
$
|
888
|
|
$
|
15,194
|
|
$
|
60,329
|
|
$
|
1,514,866
|
|
$
|
1,591,277
|
|
$
|
87,550
|
|
$
|
1,678,827
|
|
||||||||
|
Balance at January 1, 2012
|
88,841,240
|
|
$
|
888
|
|
$
|
15,194
|
|
$
|
60,329
|
|
$
|
1,514,866
|
|
$
|
1,591,277
|
|
$
|
87,550
|
|
$
|
1,678,827
|
|
||||||||
|
Net income for 2012
|
311,536
|
|
311,536
|
|
18,591
|
|
330,127
|
|
|||||||||||||||||||||||
|
Other comprehensive income
(loss)
|
24,935
|
|
24,935
|
|
(103
|
)
|
24,832
|
|
|||||||||||||||||||||||
|
Cash dividends declared for
2012
|
(71,347
|
)
|
(71,347
|
)
|
(7,628
|
)
|
(78,975
|
)
|
|||||||||||||||||||||||
|
Stock-based compensation and
other
|
13,939
|
|
13,939
|
|
13,939
|
|
|||||||||||||||||||||||||
|
Exercise of stock options
|
949,170
|
|
9
|
|
21,139
|
|
21,148
|
|
21,148
|
|
|||||||||||||||||||||
|
Shares repurchased
|
(1,092,767
|
)
|
(11
|
)
|
(53,193
|
)
|
(10,371
|
)
|
(63,575
|
)
|
(63,575
|
)
|
|||||||||||||||||||
|
Tax benefit related to stock
plans
|
14,809
|
|
14,809
|
|
14,809
|
|
|||||||||||||||||||||||||
|
Issuance of common stock, net
|
341,620
|
|
4
|
|
(4
|
)
|
—
|
|
—
|
|
|||||||||||||||||||||
|
Shares withheld for withholding
taxes associated with common
stock issuances
|
(140,054
|
)
|
(1
|
)
|
(9,123
|
)
|
(9,124
|
)
|
(9,124
|
)
|
|||||||||||||||||||||
|
Balance at December 31, 2012
|
88,899,209
|
|
$
|
889
|
|
$
|
2,761
|
|
$
|
85,264
|
|
$
|
1,744,684
|
|
$
|
1,833,598
|
|
$
|
98,410
|
|
$
|
1,932,008
|
|
||||||||
|
Balance at January 1, 2013
|
88,899,209
|
|
$
|
889
|
|
$
|
2,761
|
|
$
|
85,264
|
|
$
|
1,744,684
|
|
$
|
1,833,598
|
|
$
|
98,410
|
|
$
|
1,932,008
|
|
||||||||
|
Net income for 2013
|
413,171
|
|
413,171
|
|
26,663
|
|
439,834
|
|
|||||||||||||||||||||||
|
Other comprehensive income
|
30,981
|
|
30,981
|
|
356
|
|
31,337
|
|
|||||||||||||||||||||||
|
Cash dividends declared for
2013
|
(79,833
|
)
|
(79,833
|
)
|
(10,014
|
)
|
(89,847
|
)
|
|||||||||||||||||||||||
|
Stock-based compensation and
other
|
9,072
|
|
9,072
|
|
9,072
|
|
|||||||||||||||||||||||||
|
Exercise of stock options
|
191,732
|
|
2
|
|
5,551
|
|
5,553
|
|
5,553
|
|
|||||||||||||||||||||
|
Shares repurchased
|
(9,198,056
|
)
|
(92
|
)
|
(4,542
|
)
|
(577,664
|
)
|
(582,298
|
)
|
(582,298
|
)
|
|||||||||||||||||||
|
Tax benefit related to stock
plans
|
3,266
|
|
3,266
|
|
3,266
|
|
|||||||||||||||||||||||||
|
Issuance of common stock, net
|
256,834
|
|
3
|
|
(3
|
)
|
—
|
|
—
|
|
|||||||||||||||||||||
|
Shares withheld for withholding
taxes associated with common
stock issuances
|
(96,877
|
)
|
(1
|
)
|
(6,148
|
)
|
(6,149
|
)
|
(6,149
|
)
|
|||||||||||||||||||||
|
Balance at December 31, 2013
|
80,052,842
|
|
$
|
801
|
|
$
|
9,957
|
|
$
|
116,245
|
|
$
|
1,500,358
|
|
$
|
1,627,361
|
|
$
|
115,415
|
|
$
|
1,742,776
|
|
||||||||
See accompanying notes to the consolidated financial statements.
58
|
Albemarle Corporation and Subsidiaries
|
||
|
|
|
(In Thousands)
|
|||||||||||
|
Year Ended December 31
|
2013
|
2012
|
2011
|
||||||||
|
Cash and cash equivalents at beginning of year
|
$
|
477,696
|
|
$
|
469,416
|
|
$
|
529,650
|
|
||
|
Cash flows from operating activities:
|
|||||||||||
|
Net income
|
439,834
|
|
330,127
|
|
420,197
|
|
|||||
|
Adjustments to reconcile net income to cash flows from operating activities:
|
|||||||||||
|
Depreciation and amortization
|
107,370
|
|
99,020
|
|
96,753
|
|
|||||
|
Write-offs associated with restructuring and other
|
—
|
|
61,809
|
|
—
|
|
|||||
|
Stock-based compensation
|
10,164
|
|
15,211
|
|
27,069
|
|
|||||
|
Excess tax benefits realized from stock-based compensation arrangements
|
(3,266
|
)
|
(14,809
|
)
|
(10,574
|
)
|
|||||
|
Equity in net income of unconsolidated investments (net of tax)
|
(31,729
|
)
|
(38,067
|
)
|
(43,754
|
)
|
|||||
|
Dividends received from unconsolidated investments and nonmarketable securities
|
21,632
|
|
26,908
|
|
23,685
|
|
|||||
|
Pension and postretirement (benefit) expense
|
(132,707
|
)
|
77,442
|
|
97,207
|
|
|||||
|
Pension and postretirement contributions
|
(13,294
|
)
|
(21,610
|
)
|
(59,773
|
)
|
|||||
|
Unrealized gain on investments in marketable securities
|
(3,681
|
)
|
(1,872
|
)
|
(688
|
)
|
|||||
|
Deferred income taxes
|
64,865
|
|
(14,587
|
)
|
(11,198
|
)
|
|||||
|
Change in current assets and liabilities:
|
|||||||||||
|
Increase in accounts receivable
|
(65,906
|
)
|
(25,992
|
)
|
(16,435
|
)
|
|||||
|
(Increase) decrease in inventories
|
(1,810
|
)
|
7,364
|
|
(41,749
|
)
|
|||||
|
Decrease (increase) in other current assets excluding deferred income taxes
|
5,261
|
|
(19,590
|
)
|
4,499
|
|
|||||
|
Increase (decrease) in accounts payable
|
21,316
|
|
(16,798
|
)
|
(11,971
|
)
|
|||||
|
Increase in accrued expenses and income taxes payable
|
10,136
|
|
7,306
|
|
28,229
|
|
|||||
|
Other, net
|
4,674
|
|
16,904
|
|
(14,138
|
)
|
|||||
|
Net cash provided by operating activities
|
432,859
|
|
488,766
|
|
487,359
|
|
|||||
|
Cash flows from investing activities:
|
|||||||||||
|
Capital expenditures
|
(155,346
|
)
|
(280,873
|
)
|
(190,574
|
)
|
|||||
|
Cash payments related to acquisitions and other
|
(2,565
|
)
|
(3,360
|
)
|
(13,164
|
)
|
|||||
|
Cash proceeds from divestitures
|
—
|
|
9,646
|
|
—
|
|
|||||
|
Sales of (investments in) marketable securities, net
|
169
|
|
(1,615
|
)
|
1,670
|
|
|||||
|
Long-term advances to joint ventures
|
—
|
|
(24,959
|
)
|
—
|
|
|||||
|
Investments in equity and other corporate investments
|
—
|
|
—
|
|
(10,868
|
)
|
|||||
|
Net cash used in investing activities
|
(157,742
|
)
|
(301,161
|
)
|
(212,936
|
)
|
|||||
|
Cash flows from financing activities:
|
|||||||||||
|
Repayments of long-term debt
|
(135,733
|
)
|
(14,390
|
)
|
(9,043
|
)
|
|||||
|
Proceeds from borrowings of long-term debt
|
117,000
|
|
—
|
|
3,510
|
|
|||||
|
Other borrowings (repayments), net
|
398,544
|
|
(49,421
|
)
|
(94,643
|
)
|
|||||
|
Dividends paid to shareholders
|
(78,107
|
)
|
(69,113
|
)
|
(57,759
|
)
|
|||||
|
Dividends paid to noncontrolling interests
|
(10,014
|
)
|
(7,628
|
)
|
—
|
|
|||||
|
Repurchases of common stock
|
(582,298
|
)
|
(63,575
|
)
|
(178,132
|
)
|
|||||
|
Proceeds from exercise of stock options
|
5,553
|
|
21,148
|
|
2,230
|
|
|||||
|
Excess tax benefits realized from stock-based compensation arrangements
|
3,266
|
|
14,809
|
|
10,574
|
|
|||||
|
Withholding taxes paid on stock-based compensation award distributions
|
(6,149
|
)
|
(9,124
|
)
|
(3,129
|
)
|
|||||
|
Debt financing costs
|
(108
|
)
|
—
|
|
(2,727
|
)
|
|||||
|
Net cash used in financing activities
|
(288,046
|
)
|
(177,294
|
)
|
(329,119
|
)
|
|||||
|
Net effect of foreign exchange on cash and cash equivalents
|
12,472
|
|
(2,031
|
)
|
(5,538
|
)
|
|||||
|
(Decrease) increase in cash and cash equivalents
|
(457
|
)
|
8,280
|
|
(60,234
|
)
|
|||||
|
Cash and cash equivalents at end of year
|
$
|
477,239
|
|
$
|
477,696
|
|
$
|
469,416
|
|
||
See accompanying notes to the consolidated financial statements.
59
|
Albemarle Corporation and Subsidiaries
|
||
|
NOTES TO THE CONSOLIDATED FINANCIAL STATEMENTS
|
||
Basis of Consolidation
The consolidated financial statements include the accounts and operations of Albemarle Corporation and our wholly owned, majority owned and controlled subsidiaries. Unless the context otherwise indicates, the terms “Albemarle,” “we,” “us,” “our” or “the Company” mean Albemarle Corporation and our consolidated subsidiaries. We apply the equity method of accounting for investments in which we have an ownership interest from
20%
to
50%
or where we exercise significant influence over the related investee’s operations. All significant intercompany accounts and transactions are eliminated in consolidation.
Estimates, Assumptions and Reclassifications
The preparation of financial statements in conformity with generally accepted accounting principles (GAAP) in the United States (U.S.) requires management to make estimates and assumptions that affect the reported amounts of revenues, expenses, assets and liabilities and disclosure of contingent assets and liabilities at the date of the financial statements. Actual results could differ from those estimates.
Certain amounts in the accompanying consolidated financial statements and notes thereto have been reclassified to conform to the current presentation.
Revenue Recognition
We recognize sales when the revenue is realized or realizable, and has been earned, in accordance with authoritative accounting guidance. We recognize net sales as risk and title to the product transfer to the customer, which usually occurs at the time shipment is made. Significant portions of our sales are sold free on board (FOB) shipping point or on an equivalent basis, and other transactions are based upon specific contractual arrangements. Our standard terms of delivery are generally included in our contracts of sale, order confirmation documents and invoices. We recognize revenue from services when performance of the services has been completed. We have a limited amount of consignment sales that are billed to the customer upon monthly notification of amounts used by the customers under these contracts. Where the Company incurs pre-production design and development costs under long-term supply contracts, these costs are expensed where they relate to the products sold unless contractual guarantees for reimbursement exist. Conversely, these costs are capitalized if they pertain to equipment that we will own and use in producing the products to be supplied and expect to utilize for future revenue generating activities.
Performance and Life Cycle Guarantees
We provide customers certain performance guarantees and life cycle guarantees. These guarantees entitle the customer to claim compensation if the product does not conform to performance standards originally agreed upon. Performance guarantees relate to minimum technical specifications that products produced with the delivered product must meet, such as yield and product quality. Life cycle guarantees relate to minimum periods for which performance of the delivered product is guaranteed. When either performance guarantees or life cycle guarantees are contractually agreed upon, an assessment of the appropriate revenue recognition treatment is evaluated. When testing or modeling of historical results predict that the performance or life cycle criteria will be satisfied, revenue is recognized in accordance with shipping terms at the time of delivery. When testing or modeling of historical results predict that the performance or life cycle criteria may not be satisfied, we bill the customer upon shipment and defer the related revenue and cost associated with these products. These deferrals are released to earnings when the contractual period expires.
Shipping and Handling Costs
Amounts billed to customers in a sales transaction related to shipping and handling have been classified as net sales and the cost incurred by us for shipping and handling has been classified as cost of goods sold in the accompanying consolidated statements of income. In addition, taxes billed to customers in a sales transaction are presented in the consolidated statements of income on a net basis.
Cash and Cash Equivalents
Cash and cash equivalents include cash and highly liquid investments with insignificant interest rate risks and original maturities of three months or less.
60
|
Albemarle Corporation and Subsidiaries
|
||
|
NOTES TO THE CONSOLIDATED FINANCIAL STATEMENTS
|
||
Inventories
Inventories are stated at lower of cost or market with cost determined primarily on the first-in, first-out basis. Cost is determined on the weighted-average basis for a small portion of our inventories at foreign plants and our stores, supplies and other inventory. A portion of our domestic produced finished goods and raw materials are determined on the last-in, first-out basis.
Property, Plant and Equipment
Property, plant and equipment include costs of assets constructed, purchased or leased under a capital lease, related delivery and installation costs and interest incurred on significant capital projects during their construction periods. Expenditures for renewals and betterments also are capitalized, but expenditures for normal repairs and maintenance are expensed as incurred. Costs associated with yearly planned major maintenance are deferred and amortized over
12 months
or until the same major maintenance activities must be repeated, whichever is shorter. The cost and accumulated depreciation applicable to assets retired or sold are removed from the respective accounts, and gains or losses thereon are included in income. Depreciation is computed by the straight-line method based on the estimated useful lives of the assets. We have a policy where our internal engineering group provides asset life guidelines for book purposes. These guidelines are reviewed against the economic life of the business for each project and asset life is determined as the lesser of the manufacturing life or the “business” life. The engineering guidelines are reviewed periodically.
We evaluate historical and expected undiscounted operating cash flows of our business segments to determine the future recoverability of any property, plant and equipment recorded. Property, plant and equipment is re-evaluated whenever events or changes in circumstances indicate that its carrying amount may not be recoverable.
The costs of brine wells, leases and royalty interests are primarily amortized over the estimated average life of the field on a straight-line basis. On a yearly basis for all fields, this approximates a units-of-production method based upon estimated reserves and production volumes.
Investments
Investments are accounted for using the equity method of accounting if the investment gives us the ability to exercise significant influence, but not control, over the investee. Significant influence is generally deemed to exist if we have an ownership interest in the voting stock of the investee between
20%
and
50%
, although other factors, such as representation on the investee’s board of directors and the impact of commercial arrangements, are considered in determining whether the equity method of accounting is appropriate. Under the equity method of accounting, we record our investments in equity-method investees in the consolidated balance sheets as Investments and our share of investees’ earnings or losses together with other-than temporary impairments in value as Equity in net income of unconsolidated investments in the consolidated statements of income.
Certain mutual fund investments are accounted for as trading equities and are marked-to-market on a monthly basis through the consolidated statements of income. Investments in joint ventures and nonmarketable securities of immaterial entities are estimated based upon the overall performance of the entity where financial results are not available on a timely basis.
Environmental Compliance and Remediation
Environmental compliance costs include the cost of purchasing and/or constructing assets to prevent, limit and/or control pollution or to monitor the environmental status at various locations. These costs are capitalized and depreciated based on estimated useful lives. Environmental compliance costs also include maintenance and operating costs with respect to pollution prevention and control facilities and other administrative costs. Such operating costs are expensed as incurred. Environmental remediation costs of facilities used in current operations are generally immaterial and are expensed as incurred. On an undiscounted basis, we accrue for environmental remediation costs and post-remediation costs that relate to existing conditions caused by past operations at facilities or off-plant disposal sites in the accounting period in which responsibility is established and when the related costs are estimable. In developing these cost estimates, we evaluate currently available facts regarding each site, with consideration given to existing technology, presently enacted laws and regulations, prior experience in remediation of contaminated sites, the financial capability of other potentially responsible parties and other factors, subject to uncertainties inherent in the estimation process. Additionally, these estimates are reviewed periodically, with adjustments to the accruals recorded as necessary.
61
|
Albemarle Corporation and Subsidiaries
|
||
|
NOTES TO THE CONSOLIDATED FINANCIAL STATEMENTS
|
||
Research and Development Expenses
Our research and development expenses related to present and future products are expensed as incurred. These expenses consist primarily of personnel-related costs and other overheads, as well as outside service and consulting costs incurred for specific programs. Our U.S. facilities in Michigan, Pennsylvania, South Carolina, Texas and Louisiana and our global facilities in the Netherlands, Germany, Belgium, China and Korea form the capability base for our contract research and custom manufacturing businesses. These business areas provide research and scale-up services primarily to innovative life science companies.
Goodwill and Other Intangible Assets
We account for goodwill and other intangibles acquired in a business combination in conformity with current accounting guidance that requires that goodwill and indefinite-lived intangible assets not be amortized.
We test goodwill for impairment by comparing the estimated fair value of our reporting units to the related carrying value. We estimate the fair value based on present value techniques involving future cash flows. Future cash flows include assumptions for sales volumes, selling prices, raw material prices, labor and other employee benefit costs, capital additions and other economic or market related factors. Significant management judgment is involved in estimating these variables and they include inherent uncertainties since they are forecasting future events. We use a Weighted Average Cost of Capital (WACC) approach to determine our discount rate for goodwill recoverability testing. Our WACC calculation incorporates industry-weighted average returns on debt and equity from a market perspective. The factors in this calculation are largely external to our company, and therefore, are beyond our control. We test our recorded goodwill balances for impairment in the fourth quarter of each year or upon the occurrence of events or changes in circumstances that would more likely than not reduce the fair value of our reporting units below their carrying amounts. The Company performed its annual goodwill impairment test as of October 31,
2013
and concluded there was no impairment as of that date.
Definite-lived intangible assets, such as purchased technology, patents, customer lists and trade names are amortized over their estimated useful lives, generally for periods ranging from
five
to
forty years
. We continually evaluate the reasonableness of the useful lives of these assets and test for impairment in accordance with current accounting guidance. See Note 10, “Goodwill and Other Intangibles.”
Pension Plans and Other Postretirement Benefits
Under authoritative accounting standards, assumptions are made regarding the valuation of benefit obligations and the performance of plan assets. As required, we recognize a balance sheet asset or liability for each of the pension and other postretirement benefit (OPEB) plans equal to the plan’s funded status as of the measurement date. The primary assumptions are as follows:
|
•
|
Discount Rate—The discount rate is used in calculating the present value of benefits, which is based on projections of benefit payments to be made in the future.
|
|
•
|
Expected Return on Plan Assets—We project the future return on plan assets based on prior performance and future expectations for the types of investments held by the plans, as well as the expected long-term allocation of plan assets for these investments. These projected returns reduce the net benefit costs recorded currently.
|
|
•
|
Rate of Compensation Increase—For salary-related plans, we project employees’ annual pay increases, which are used to project employees’ pension benefits at retirement.
|
|
•
|
Rate of Increase in the Per Capita Cost of Covered Health Care Benefits—Eligible retirees receive fully insured medical benefits with the Company providing a cost sharing benefit subject to a cap. The pre-65 and post-65 caps were fully met as of January 1, 2013 and we do not anticipate increases in the cost sharing caps.
|
Actuarial gains and losses are recognized annually in our consolidated statements of income in the fourth quarter and whenever a plan is determined to qualify for a remeasurement during a fiscal year. The remaining components of pension and OPEB plan expense, primarily service cost, interest cost and expected return on assets, are recorded on a quarterly basis. The market-related value of assets equals the actual market value as of the date of measurement.
During
2013
, we made changes to the assumptions related to the discount rate, expected return on assets, and mortality scales. We consider available information that we deem relevant when selecting each of these assumptions.
In selecting the discount rates for the U.S. plans, we consider expected benefit payments on a plan-by-plan basis. As a result, the Company uses different discount rates for each plan depending on the demographics of participants and the expected timing of benefit payments. For
2013
, the discount rates were calculated using the results from a bond matching technique
62
|
Albemarle Corporation and Subsidiaries
|
||
|
NOTES TO THE CONSOLIDATED FINANCIAL STATEMENTS
|
||
developed by Milliman, which matched the future estimated annual benefit payments of each respective plan against a portfolio of bonds of high quality to determine the discount rate. We believe our selected discount rates are determined using preferred methodology under authoritative accounting guidance and accurately reflect market conditions as of the
December 31, 2013
measurement date.
In selecting the discount rates for the foreign plans, we relied on Aon Hewitt methods, including the Aon Hewitt Top-Quartile and a yield curve derived from fixed-income security yields. The yield curve is generally based on a universe containing Aa-graded corporate bonds in the Euro zone without special features or options, which could affect the duration. In some countries, the yield curve is based on local government bond rates with a premium added to reflect corporate bond risk. Payments we expect to be made from our retirement plans are applied to the resulting yield curve. For each plan, the discount rate was developed as the level equivalent rate that would produce the same present value as that using spot rates aligned with the projected benefit payments.
In estimating the expected return on plan assets, we consider past performance and future expectations for the types of investments held by the plan as well as the expected long-term allocation of plan assets to these investments. In projecting the rate of compensation increase, we consider past experience in light of movements in inflation rates.
Employee Savings Plans
Certain of our employees participate in our defined contribution 401(k) employee savings plan, which is generally available to all U.S. full-time salaried and non-union hourly employees and to employees who are covered by a collective bargaining agreement that provides for such participation. With respect to our foreign subsidiaries, we have a plan in the Netherlands similar to a collective defined contribution plan.
Deferred Compensation Plan
We maintain an Executive Deferred Compensation Plan (EDCP) that was adopted in 2001 and subsequently amended. The purpose of the EDCP is to provide current tax planning opportunities as well as supplemental funds upon the retirement or death of certain of our employees. The EDCP is intended to aid in attracting and retaining employees of exceptional ability by providing them with these benefits. We also maintain a Benefit Protection Trust (the Trust) that was created to provide a source of funds to assist in meeting the obligations of the EDCP, subject to the claims of our creditors in the event of our insolvency. Assets of the Trust are consolidated in accordance with authoritative guidance. The assets of the Trust consist primarily of mutual fund investments (which are accounted for as trading securities and are marked-to-market on a monthly basis through the consolidated statement of income) and cash and cash equivalents.
Stock-based Compensation Expense
The fair value of restricted stock awards, restricted stock unit awards and performance unit awards is determined based on the number of shares or units granted and the quoted price of our common stock at grant date, and the fair value of stock options is determined using the Black-Scholes valuation model. The fair value of these awards is determined after giving effect to estimated forfeitures. Such value is recognized as expense over the service period, which is generally the vesting period of the equity grant. To the extent restricted stock awards, restricted stock unit awards, performance unit awards and stock options are forfeited prior to vesting in excess of the estimated forfeiture rate, the corresponding previously recognized expense is reversed as an offset to operating expenses.
Income Taxes
We use the liability method for determining our income taxes, under which current and deferred tax liabilities and assets are recorded in accordance with enacted tax laws and rates. Under this method, the amounts of deferred tax liabilities and assets at the end of each period are determined using the tax rate expected to be in effect when taxes are actually paid or recovered. Future tax benefits are recognized to the extent that realization of such benefits is more likely than not.
Deferred income taxes are provided for the estimated income tax effect of temporary differences between the financial statement carrying amounts and the tax basis of existing assets and liabilities. Deferred tax assets are also provided for operating losses, capital losses and certain tax credit carryovers. A valuation allowance, reducing deferred tax assets, is established when it is more likely than not that some portion or all of the deferred tax assets will not be realized. The realization of such deferred tax assets is dependent upon the generation of sufficient future taxable income of the appropriate character. Although realization is not assured, we do not establish a valuation allowance when we believe it is more likely than not that a net deferred tax asset will be realized.
63
|
Albemarle Corporation and Subsidiaries
|
||
|
NOTES TO THE CONSOLIDATED FINANCIAL STATEMENTS
|
||
We only recognize a tax benefit after concluding that it is more likely than not that the benefit will be sustained upon audit by the respective taxing authority based solely on the technical merits of the associated tax position. Once the recognition threshold is met, we recognize a tax benefit measured as the largest amount of the tax benefit that, in our judgment, is greater than
50%
likely to be realized. Interest and penalties related to income tax liabilities under current accounting guidance for uncertain tax positions are included in income tax expense.
We have designated the undistributed earnings of substantially all of our foreign operations as permanently reinvested and as a result we do not provide for deferred income taxes on the unremitted earnings of these subsidiaries. Our foreign earnings are computed under U.S. federal tax earnings and profits, or E&P, principles. In general, to the extent our financial reporting book basis over tax basis of a foreign subsidiary exceeds these E&P amounts, deferred taxes have not been provided as they are essentially permanent in duration. The determination of the amount of such unrecognized deferred tax liability is not practicable. We provide for deferred income taxes on our undistributed earnings of foreign operations that are not deemed to be permanently reinvested.
Accumulated Other Comprehensive Income
Accumulated other comprehensive income is comprised principally of foreign currency translation adjustments and net prior service benefit for our defined benefit plans and related deferred income taxes in accordance with current accounting guidance.
Foreign Currency Translation
The assets and liabilities of all foreign subsidiaries were prepared in their respective functional currencies and translated into U.S. Dollars based on the current exchange rate in effect at the balance sheet dates, while income and expenses were translated at average exchange rates for the periods presented. Translation adjustments are reflected as a separate component of equity.
Our consolidated statements of income include foreign exchange transaction losses of
$10.6 million
,
$4.9 million
and
$3.6 million
for the years ended
December 31, 2013
,
2012
and
2011
, respectively.
Derivative Financial Instruments
We manage our foreign currency exposures by balancing certain assets and liabilities denominated in foreign currencies and through the use of foreign currency forward contracts from time to time, which generally expire within
one year
. The principal objective of such contracts is to minimize the financial risks and costs associated with global operating activities. While these contracts are subject to fluctuations in value, such fluctuations are generally expected to be offset by fluctuations in the value of the underlying foreign currency exposures being hedged. Gains and losses on foreign currency forward contracts are recognized currently in income, but generally do not have a significant impact on results of operations.
The counterparties to these contractual agreements are major financial institutions with which we generally have other financial relationships. We are exposed to credit loss in the event of nonperformance by these counterparties. However, we do not anticipate nonperformance by the counterparties. We do not utilize financial instruments for trading or other speculative purposes. At
December 31, 2013
and
2012
, we had outstanding foreign currency forward contracts with notional values totaling
$321.4 million
and
$274.0 million
, respectively.
64
|
Albemarle Corporation and Subsidiaries
|
||
|
NOTES TO THE CONSOLIDATED FINANCIAL STATEMENTS
|
||
Recently Issued Accounting Pronouncements
In December 2011, the Financial Accounting Standards Board (FASB) issued accounting guidance that requires entities to disclose information about financial instruments (including derivatives) and transactions eligible for offset in the statement of financial position or subject to an agreement similar to a master netting arrangement. In January 2013, the FASB issued additional guidance that limits the scope of these new requirements to certain derivatives, repurchase agreements and reverse repurchase agreements and securities borrowing and lending transactions. These amendments became effective on January 1, 2013 and had no impact on our consolidated financial statements.
In February 2013, the FASB issued accounting guidance that requires companies to present either in a single note or on the face of the financial statements the effect of significant amounts reclassified from each component of accumulated other comprehensive income, and the income statement line items affected by the reclassification. If a component is not required to be reclassified to net income in its entirety, companies would instead cross reference to the related footnote for additional information. These amendments became effective for us beginning with the first quarter of 2013 and did not have a material impact on our consolidated financial statements.
In February 2013, the FASB issued accounting guidance that requires entities that have obligations resulting from joint and several liability arrangements and for which the total amount is fixed at the reporting date to measure such obligations as the sum of (a) the amount the entity agreed to pay on the basis of its arrangement among its co-obligors, and (b) any additional amount the reporting entity expects to pay on behalf of its co-obligors. Entities are also required to disclose the nature, amount and any other relevant information about such obligations. This accounting guidance will become effective for fiscal years, and interim periods within those years, beginning after December 15, 2013 and should be applied retrospectively to all prior periods presented for obligations that exist at the beginning of an entity’s fiscal year of adoption. We do not expect this new guidance to have a material effect on our consolidated financial statements.
In March 2013, the FASB issued accounting guidance that clarifies a parent company’s accounting for the cumulative foreign currency translation adjustment when the parent sells a part or all of its investment in a foreign entity. The guidance clarifies that the sale of an investment in a foreign entity includes both (a) events that result in the loss of a controlling financial interest in a foreign entity, and (b) events that result in an acquirer obtaining control of an acquiree in which it held an equity interest immediately before the acquisition date (sometimes also referred to as a step acquisition). Accordingly, the cumulative foreign currency translation adjustment should be released into net income upon the occurrence of those events. This accounting guidance will become effective for fiscal years, and interim periods within those years, beginning after December 15, 2013, and should be applied prospectively to derecognition events occurring after the effective date. The impact of these new requirements on our financial statements will depend upon the nature, terms and size of derecognition events, if any, that may occur in the future related to any of our foreign entities.
In July 2013, the FASB issued accounting guidance designed to reduce diversity in practice of financial statement presentation of an unrecognized tax benefit when a net operating loss carryforward, a similar tax loss, or a tax credit carryforward exists. These new requirements become effective for fiscal years, and interim periods within those years, beginning after December 15, 2013. We do not expect this new guidance to have a material effect on our consolidated financial statements.
65
|
Albemarle Corporation and Subsidiaries
|
||
|
NOTES TO THE CONSOLIDATED FINANCIAL STATEMENTS
|
||
Supplemental information related to the consolidated statements of cash flows is as follows (in thousands):
|
Year Ended December 31,
|
|||||||||||
|
2013
|
2012
|
2011
|
|||||||||
|
Cash paid during the year for:
|
|||||||||||
|
Income taxes (net of refunds of $14,296, $1,849 and $4,339
in 2013, 2012 and 2011, respectively)
|
$
|
51,772
|
|
$
|
112,442
|
|
$
|
123,341
|
|
||
|
Interest (net of capitalization)
|
$
|
29,629
|
|
$
|
31,144
|
|
$
|
33,127
|
|
||
|
Supplemental non-cash disclosures related to exit of phosphorus
flame retardants business:
|
|||||||||||
|
Decrease in property, plant and equipment
|
$
|
—
|
|
$
|
(41,120
|
)
|
$
|
—
|
|
||
|
Decrease in accumulated depreciation
|
—
|
|
(17,870
|
)
|
—
|
|
|||||
|
Decrease in other intangibles, net of amortization
|
—
|
|
(27,384
|
)
|
—
|
|
|||||
|
Increase in accumulated other comprehensive income
|
—
|
|
12,268
|
|
—
|
|
|||||
|
Supplemental non-cash disclosures related to defined benefit
pension plan net curtailment gain:
|
|||||||||||
|
Decrease in accumulated other comprehensive income
|
$
|
—
|
|
$
|
(4,507
|
)
|
$
|
—
|
|
||
|
Supplemental non-cash disclosures related to other restructuring
charges:
|
|||||||||||
|
Decrease in property, plant and equipment
|
$
|
—
|
|
$
|
(5,002
|
)
|
$
|
—
|
|
||
|
Decrease in accumulated depreciation
|
—
|
|
(1,588
|
)
|
—
|
|
|||||
Basic and diluted earnings per share are calculated as follows (in thousands, except per share amounts):
|
Year Ended December 31,
|
|||||||||||
|
2013
|
2012
|
2011
|
|||||||||
|
Basic earnings per share
|
|||||||||||
|
Numerator:
|
|||||||||||
|
Net income attributable to Albemarle Corporation
|
$
|
413,171
|
|
$
|
311,536
|
|
$
|
392,114
|
|
||
|
Denominator:
|
|||||||||||
|
Weighted-average common shares for basic earnings per share
|
83,839
|
|
89,189
|
|
90,522
|
|
|||||
|
Basic earnings per share
|
$
|
4.93
|
|
$
|
3.49
|
|
$
|
4.33
|
|
||
|
Diluted earnings per share
|
|||||||||||
|
Numerator:
|
|||||||||||
|
Net income attributable to Albemarle Corporation
|
$
|
413,171
|
|
$
|
311,536
|
|
$
|
392,114
|
|
||
|
Denominator:
|
|||||||||||
|
Weighted-average common shares for basic earnings per share
|
83,839
|
|
89,189
|
|
90,522
|
|
|||||
|
Incremental shares under stock compensation plans
|
483
|
|
695
|
|
1,000
|
|
|||||
|
Total shares
|
84,322
|
|
89,884
|
|
91,522
|
|
|||||
|
Diluted earnings per share
|
$
|
4.90
|
|
$
|
3.47
|
|
$
|
4.28
|
|
||
The Company’s policy on how to determine windfalls and shortfalls for purposes of calculating assumed stock award proceeds under the treasury stock method when determining the denominator for diluted earnings per share is to exclude the impact of pro forma deferred tax assets (i.e. the windfall or shortfall that would be recognized in the financial statements upon exercise of the award). At
December 31, 2013
, there were
468,120
common stock equivalents not included in the computation of diluted earnings per share.
Included in the calculation of basic earnings per share are unvested restricted stock awards that contain nonforfeitable rights to dividends. At
December 31, 2013
, there were
13,133
unvested shares of restricted stock awards outstanding.
66
|
Albemarle Corporation and Subsidiaries
|
||
|
NOTES TO THE CONSOLIDATED FINANCIAL STATEMENTS
|
||
We have the authority to issue
15 million
shares of preferred stock in one or more classes or series. As of
December 31, 2013
, no shares of preferred stock have been issued.
On October 13, 2011, our Board of Directors authorized an increase in the number of shares the Company is permitted to repurchase under our share repurchase program up to a maximum of
five million
shares. On February 12, 2013, our Board of Directors authorized another increase in the number of shares the Company is permitted to repurchase under our share repurchase program, pursuant to which the Company is now permitted to repurchase up to a maximum of
15 million
shares, including those shares previously authorized but not yet repurchased.
Under the existing Board authorized share repurchase program, on May 9, 2013, the Company entered into an accelerated share repurchase agreement with J.P. Morgan Securities LLC (JPMorgan) relating to a fixed-dollar, uncollared accelerated share repurchase program. Pursuant to the terms of the agreement, JPMorgan immediately borrowed shares of Albemarle common stock that were sold to the Company, thereby decreasing the Company’s issued and outstanding shares (with no change to its authorized shares). On May 10, 2013, the Company paid
$450 million
to JPMorgan and received an initial delivery of
5,680,921
shares with a fair market value of approximately
$360 million
. This purchase was funded through a combination of available cash on hand and debt. The Company determined that the accelerated share repurchase agreement met the criteria to be accounted for as a forward contract indexed to its stock and was therefore treated as an equity instrument. Under the terms of the agreement, on December 19, 2013, the transaction was completed and we received a final settlement of
1,384,011
shares, calculated based on the daily Rule 10b-18 volume-weighted average prices of the Company’s common stock over the term of the agreement, less a forward price adjustment amount of approximately
$1.01
. The total number of shares repurchased under this agreement (
7,064,932
shares) reduced the Company’s weighted average shares outstanding for purposes of calculating basic and diluted earnings per share during the year ended December 31, 2013.
During the year ended
December 31, 2013
, we repurchased a total of
9,198,056
shares of our common stock pursuant to the terms of our share repurchase program and the accelerated share repurchase agreement. During the years ended
December 31, 2012
and
2011
, we repurchased
1,092,767
and
3,000,000
shares of our common stock, respectively, pursuant to the terms of our share repurchase program. As of
December 31, 2013
, there were
5,939,594
remaining shares available for repurchase under our authorized share repurchase program.
On February 3, 2014, we entered into an accelerated share repurchase agreement with Merrill Lynch International (“Merrill Lynch”), acting through its agent Merrill Lynch, Pierce, Fenner and Smith Incorporated, relating to a fixed-dollar, uncollared accelerated share repurchase program pursuant to which we will purchase
$50 million
of our shares from Merrill Lynch. The shares will be purchased by Merrill Lynch in
two
$25 million
tranches that may be settled separately or simultaneously. Pursuant to the terms of this agreement, Merrill Lynch immediately borrowed shares of Albemarle common stock that were sold to the Company, thereby decreasing the Company’s issued and outstanding shares (with no change to its authorized shares). On February 3, 2014, we paid
$50 million
to Merrill Lynch and received an initial delivery of
623,248
shares of our common stock with a fair market value of approximately
$40 million
. This purchase was funded with cash on hand. Although the agreement can be settled, at the Company’s option, in cash or in shares of common stock, the Company intends to settle in shares of common stock. The total number of shares to ultimately be purchased under the agreement will be determined at the completion of the trade and will generally be based on the daily Rule 10b-18 volume-weighted average prices of the Company’s common stock over the term of the agreement, less a forward price adjustment amount of approximately
$0.77
. Final settlement may be accelerated, and the number of shares to be delivered upon final settlement may be adjusted upon the announcement or occurrence of certain corporate events, including without limitation, tender offers, delisting, merger events or insolvency. The agreement will be terminated at any time that our share price is at or below
$30
per share. No more than
1.5 million
shares can be repurchased under this program, and this program is expected to be completed by the end of April 2014.
Other accounts receivable consist of the following at
December 31, 2013
and
2012
(in thousands):
|
December 31,
|
||||||||
|
2013
|
2012
|
|||||||
|
Value added tax/consumption tax
|
$
|
21,956
|
|
$
|
22,398
|
|
||
|
Other
|
23,138
|
|
21,446
|
|
||||
|
Total
|
$
|
45,094
|
|
$
|
43,844
|
|
||
67
|
Albemarle Corporation and Subsidiaries
|
||
|
NOTES TO THE CONSOLIDATED FINANCIAL STATEMENTS
|
||
Approximately
28%
and
30%
of our inventories are valued using the last-in, first-out (LIFO) method at
December 31, 2013
and
2012
, respectively. The portion of our domestic inventories stated on the LIFO basis amounted to
$121.9 million
and
$126.6 million
at
December 31, 2013
and
2012
, respectively, which are below replacement cost by approximately
$41.7 million
and
$51.4 million
, respectively.
Other current assets consist of the following at
December 31, 2013
and
2012
(in thousands):
|
December 31,
|
||||||||
|
2013
|
2012
|
|||||||
|
Deferred income taxes—current
(a)
|
$
|
3,912
|
|
$
|
4,197
|
|
||
|
Income tax receivables
|
26,310
|
|
26,208
|
|
||||
|
Prepaid expenses
|
47,447
|
|
48,250
|
|
||||
|
Total
|
$
|
77,669
|
|
$
|
78,655
|
|
||
|
(a)
|
See Note 18, “Income Taxes.”
|
Property, plant and equipment, at cost, consist of the following at
December 31, 2013
and
2012
(in thousands):
|
Useful
Lives
(Years)
|
December 31,
|
|||||||||
|
2013
|
2012
|
|||||||||
|
Land
|
—
|
$
|
63,153
|
|
$
|
61,123
|
|
|||
|
Land improvements
|
5 – 30
|
52,452
|
|
51,218
|
|
|||||
|
Buildings and improvements
|
10 – 45
|
235,929
|
|
198,260
|
|
|||||
|
Machinery and equipment
(a)
|
2 – 19
|
1,731,247
|
|
1,603,533
|
|
|||||
|
Machinery and equipment (major plant components)
(b)
|
20 – 45
|
688,284
|
|
586,433
|
|
|||||
|
Long-term mineral rights and production equipment costs
|
7 – 60
|
85,514
|
|
83,089
|
|
|||||
|
Construction in progress
|
—
|
115,505
|
|
234,948
|
|
|||||
|
Total
|
$
|
2,972,084
|
|
$
|
2,818,604
|
|
||||
|
(a)
|
Consists primarily of (1) short-lived production equipment components, office and building equipment and other equipment with estimated lives ranging 2 – 7 years, and (2) production process equipment (intermediate components) with estimated lives ranging 8 – 19 years.
|
|
(b)
|
Consists primarily of (1) production process equipment (major unit components) with estimated lives ranging 20 – 29 years, and (2) production process equipment (infrastructure and other) with estimated lives ranging 30 – 45 years.
|
The cost of property, plant and equipment is depreciated generally by the straight-line method. Depreciation expense amounted to
$99.3 million
,
$88.3 million
and
$83.6 million
during the years ended
December 31, 2013
,
2012
and
2011
, respectively. Interest capitalized on significant capital projects in
2013
,
2012
and
2011
was
$6.1 million
,
$5.8 million
and
$2.4 million
, respectively.
In 2012 we announced our plan to exit the phosphorus flame retardants business, whose products were sourced mainly at our Avonmouth, United Kingdom and Nanjing, China manufacturing sites. In connection with our exit of this business, net property, plant and equipment was written down by
$30.9 million
, and in the fourth quarter of 2012 we received cash proceeds of
$7.7 million
from the sale of our Nanjing, China manufacturing site, which resulted in the recognition of a gain of approximately
$2 million
. See Note 2 “Supplemental Cash Flow Information” and Note 19 “Special Items” for additional details about our exit of the phosphorus flame retardants business.
In the fourth quarter of 2012, we received proceeds of
$1.9 million
in connection with the sale of land adjacent to our regional offices in Belgium.
68
|
Albemarle Corporation and Subsidiaries
|
||
|
NOTES TO THE CONSOLIDATED FINANCIAL STATEMENTS
|
||
In the third quarter of 2010, we purchased certain property and equipment in Yeosu, South Korea in connection with our plans for building a metallocene polyolefin catalyst and trimethyl gallium manufacturing facility. Cash payments related to this acquisition were
$6.5 million
in 2011.
Investments include our share of unconsolidated joint ventures, nonmarketable securities and marketable equity securities. The following table details our investment balances at
December 31, 2013
and
2012
(in thousands).
|
December 31,
|
||||||||
|
2013
|
2012
|
|||||||
|
Joint ventures
|
$
|
187,843
|
|
$
|
185,928
|
|
||
|
Nonmarketable securities
|
534
|
|
923
|
|
||||
|
Marketable equity securities
|
23,801
|
|
20,290
|
|
||||
|
Total
|
$
|
212,178
|
|
$
|
207,141
|
|
||
Our ownership positions in significant unconsolidated investments are shown below:
|
December 31,
|
||||||||||
|
2013
|
2012
|
2011
|
||||||||
|
*
|
Nippon Aluminum Alkyls - a joint venture with Mitsui Chemicals, Inc. that produces
aluminum alkyls
|
50
|
%
|
50
|
%
|
50
|
%
|
|||
|
*
|
Magnifin Magnesiaprodukte GmbH & Co. KG - a joint venture with Radex Heraklith
Industriebeteiligung AG that produces specialty magnesium hydroxide products
|
50
|
%
|
50
|
%
|
50
|
%
|
|||
|
*
|
Nippon Ketjen Company Limited - a joint venture with Sumitomo Metal Mining
Company Limited that produces refinery catalysts
|
50
|
%
|
50
|
%
|
50
|
%
|
|||
|
*
|
Eurecat S.A. - a joint venture with IFP Investissements for refinery catalysts
regeneration services
|
50
|
%
|
50
|
%
|
50
|
%
|
|||
|
*
|
Fábrica Carioca de Catalisadores S.A. - a joint venture with Petrobras Quimica S.A. -
PETROQUISA that produces catalysts and includes catalysts research and product
development activities
|
50
|
%
|
50
|
%
|
50
|
%
|
|||
|
*
|
Stannica, LLC - a joint venture with PMC Group, Inc. that produces tin stabilizers
|
50
|
%
|
50
|
%
|
50
|
%
|
|||
Our investment in the significant unconsolidated joint ventures above amounted to
$172.9 million
and
$170.6 million
as of
December 31, 2013
and
2012
, respectively, and the amount included in Equity in net income of unconsolidated investments (net of tax) in the consolidated statements of income totaled
$31.5 million
,
$37.0 million
and
$43.3 million
for the years ended
December 31, 2013
,
2012
and
2011
, respectively. Undistributed earnings attributable to our significant unconsolidated investments represented approximately
$117.1 million
and
$106.1 million
of our consolidated retained earnings at December 31,
2013
and
2012
, respectively. All of the unconsolidated joint ventures in which we have investments are private companies and accordingly do not have a quoted market price available.
The following summary lists our assets, liabilities and results of operations for our significant unconsolidated joint ventures presented herein (in thousands):
|
December 31,
|
||||||||
|
2013
|
2012
|
|||||||
|
Summary of Balance Sheet Information:
|
||||||||
|
Current assets
|
$
|
313,446
|
|
$
|
343,129
|
|
||
|
Noncurrent assets
|
198,776
|
|
212,587
|
|
||||
|
Total assets
|
$
|
512,222
|
|
$
|
555,716
|
|
||
|
Current liabilities
|
$
|
100,469
|
|
$
|
129,105
|
|
||
|
Noncurrent liabilities
|
77,734
|
|
76,422
|
|
||||
|
Total liabilities
|
$
|
178,203
|
|
$
|
205,527
|
|
||
69
|
Albemarle Corporation and Subsidiaries
|
||
|
NOTES TO THE CONSOLIDATED FINANCIAL STATEMENTS
|
||
|
Year Ended December 31,
|
||||||||||||
|
2013
|
2012
|
2011
|
||||||||||
|
Summary of Statements of Income Information:
|
||||||||||||
|
Net sales
|
$
|
598,459
|
|
$
|
601,233
|
|
$
|
672,859
|
|
|||
|
Gross profit
|
$
|
169,406
|
|
$
|
165,650
|
|
$
|
189,691
|
|
|||
|
Income before income taxes
|
$
|
101,652
|
|
$
|
105,329
|
|
$
|
132,399
|
|
|||
|
Net income
|
$
|
71,294
|
|
$
|
71,561
|
|
$
|
88,414
|
|
|||
We have evaluated each of the unconsolidated investments pursuant to current accounting guidance and none qualify for consolidation. Dividends received from our significant unconsolidated investments were
$20.5 million
,
$25.6 million
and
$22.8 million
in
2013
,
2012
and
2011
, respectively.
At
December 31, 2013
and
2012
, the carrying amount of our investments in unconsolidated joint ventures exceeded the amount of underlying equity in net assets by approximately
$8.4 million
and
$12.1 million
, respectively. These amounts represent the differences between the value of certain assets of the joint ventures and our related valuation on a U.S. GAAP basis. As of
December 31, 2013
and
2012
,
$1.4 million
and
$1.8 million
, respectively, remained to be amortized over the remaining useful lives of the assets with the balance of the difference representing primarily our share of the joint ventures’ goodwill.
The carrying value of our unconsolidated investment in Stannica LLC, a variable interest entity for which we are not the primary beneficiary, was
$5.5 million
and
$6.6 million
at
December 31, 2013
and
2012
, respectively. Our maximum exposure to loss in connection with our continuing involvement with Stannica LLC is limited to our investment carrying value.
Assets of the Benefit Protection Trust, in conjunction with our EDCP, are accounted for as trading securities in accordance with authoritative accounting guidance. The assets of the Trust consist primarily of mutual fund investments and are marked-to-market on a monthly basis through the consolidated statements of income. As of
December 31, 2013
and
2012
, these marketable securities amounted to
$23.0 million
and
$20.3 million
, respectively.
During the year ended December 31, 2012, we and our joint venture partner each advanced
$22.5 million
to our
50%
-owned joint venture, Saudi Organometallic Chemicals Company (SOCC), pursuant to a long-term loan arrangement. Our loan bears quarterly interest at the London Inter-Bank Offered Rate (LIBOR) plus
1.275%
per annum (
1.52%
and
1.58%
as of
December 31, 2013
and
2012
, respectively), with interest receivable on a semi-annual basis on January 1 and July 1. Principal repayments on amounts outstanding under this arrangement are required as mutually agreed upon by the joint venture partners, but with any outstanding balances receivable in full no later than
December 31, 2021
. This loan receivable outstanding has been recorded in Other assets in our consolidated balance sheets at
December 31, 2013
and
2012
. The recorded value of this receivable approximates fair value as it bears interest based on prevailing variable market rates. Also during the year ended December 31, 2012, we and our joint venture partner each advanced
1.9 million
Euros (approximately
$2.6 million
and
$2.5 million
at
December 31, 2013
and
2012
, respectively) to our
50%
-owned joint venture, Eurecat S.A., pursuant to a long-term loan arrangement. During the year ended December 31, 2011, we made a capital contribution of
$10.9 million
to SOCC.
Other assets consist of the following at
December 31, 2013
and
2012
(in thousands):
|
December 31,
|
||||||||
|
2013
|
2012
|
|||||||
|
Deferred income taxes—noncurrent
(a)
|
$
|
65,667
|
|
$
|
64,512
|
|
||
|
Assets related to unrecognized tax benefits
(a)
|
25,730
|
|
25,788
|
|
||||
|
Long-term advances to joint ventures
(b)
|
25,124
|
|
25,017
|
|
||||
|
Other
|
43,708
|
|
39,519
|
|
||||
|
Total
|
$
|
160,229
|
|
$
|
154,836
|
|
||
|
(a)
|
See Note 18, “Income Taxes.”
|
|
(b)
|
See Note 8, “Investments.”
|
70
|
Albemarle Corporation and Subsidiaries
|
||
|
NOTES TO THE CONSOLIDATED FINANCIAL STATEMENTS
|
||
Goodwill and other intangibles consist principally of goodwill, customer lists, trade names, patents and other intangibles.
The following table summarizes the changes in goodwill by operating segment for the years ended
December 31, 2013
and
2012
(in thousands):
|
Polymer
Solutions
|
Catalysts
|
Fine
Chemistry
|
Total
|
||||||||||||
|
Balance at December 31, 2011
|
$
|
37,163
|
|
$
|
211,210
|
|
$
|
24,772
|
|
$
|
273,145
|
|
|||
|
Foreign currency translation adjustments
|
452
|
|
3,361
|
|
8
|
|
3,821
|
|
|||||||
|
Balance at December 31, 2012
|
37,615
|
|
214,571
|
|
24,780
|
|
276,966
|
|
|||||||
|
Foreign currency translation adjustments
|
457
|
|
6,677
|
|
103
|
|
7,237
|
|
|||||||
|
Balance at December 31, 2013
|
$
|
38,072
|
|
$
|
221,248
|
|
$
|
24,883
|
|
$
|
284,203
|
|
|||
Other intangibles consist of the following at
December 31, 2013
and
2012
(in thousands):
|
Customer
Lists and
Relationships
|
Trade
Names
(c)
|
Patents
and
Technology
|
Land Use
Rights
|
Manufacturing
Contracts and
Supply/Service
Agreements
|
Other
|
Total
|
|||||||||||||||||||||
|
Gross Asset Value
|
|||||||||||||||||||||||||||
|
Balance at December 31, 2011
|
$
|
100,078
|
|
$
|
45,399
|
|
$
|
45,973
|
|
$
|
8,098
|
|
$
|
13,782
|
|
$
|
24,161
|
|
$
|
237,491
|
|
||||||
|
Acquisitions
(a)
|
—
|
|
—
|
|
1,500
|
|
—
|
|
—
|
|
—
|
|
1,500
|
|
|||||||||||||
|
Exit of phosphorus flame retardants
business
(b)
|
(16,189
|
)
|
(19,441
|
)
|
—
|
|
(1,915
|
)
|
(5,470
|
)
|
(1,122
|
)
|
(44,137
|
)
|
|||||||||||||
|
Foreign currency translation adjustments
and other
|
1,278
|
|
985
|
|
403
|
|
20
|
|
211
|
|
373
|
|
3,270
|
|
|||||||||||||
|
Balance at December 31, 2012
|
85,167
|
|
26,943
|
|
47,876
|
|
6,203
|
|
8,523
|
|
23,412
|
|
198,124
|
|
|||||||||||||
|
Foreign currency translation adjustments
and other
|
1,259
|
|
(36
|
)
|
867
|
|
173
|
|
(185
|
)
|
216
|
|
2,294
|
|
|||||||||||||
|
Balance at December 31, 2013
|
$
|
86,426
|
|
$
|
26,907
|
|
$
|
48,743
|
|
$
|
6,376
|
|
$
|
8,338
|
|
$
|
23,628
|
|
$
|
200,418
|
|
||||||
|
Accumulated Amortization
|
|||||||||||||||||||||||||||
|
Balance at December 31, 2011
|
$
|
(30,281
|
)
|
$
|
(12,220
|
)
|
$
|
(35,212
|
)
|
$
|
(1,118
|
)
|
$
|
(11,113
|
)
|
$
|
(17,266
|
)
|
$
|
(107,210
|
)
|
||||||
|
Amortization
|
(4,499
|
)
|
(1,307
|
)
|
(3,176
|
)
|
(183
|
)
|
(658
|
)
|
(900
|
)
|
(10,723
|
)
|
|||||||||||||
|
Exit of phosphorus flame retardants
business
(b)
|
4,134
|
|
5,791
|
|
—
|
|
236
|
|
5,470
|
|
1,122
|
|
16,753
|
|
|||||||||||||
|
Foreign currency translation adjustments
and other
|
(838
|
)
|
(750
|
)
|
(390
|
)
|
(14
|
)
|
(211
|
)
|
(277
|
)
|
(2,480
|
)
|
|||||||||||||
|
Balance at December 31, 2012
|
(31,484
|
)
|
(8,486
|
)
|
(38,778
|
)
|
(1,079
|
)
|
(6,512
|
)
|
(17,321
|
)
|
(103,660
|
)
|
|||||||||||||
|
Amortization
|
(4,332
|
)
|
(995
|
)
|
(797
|
)
|
(166
|
)
|
(647
|
)
|
(1,129
|
)
|
(8,066
|
)
|
|||||||||||||
|
Foreign currency translation adjustments
and other
|
(172
|
)
|
511
|
|
(779
|
)
|
(23
|
)
|
185
|
|
(211
|
)
|
(489
|
)
|
|||||||||||||
|
Balance at December 31, 2013
|
$
|
(35,988
|
)
|
$
|
(8,970
|
)
|
$
|
(40,354
|
)
|
$
|
(1,268
|
)
|
$
|
(6,974
|
)
|
$
|
(18,661
|
)
|
$
|
(112,215
|
)
|
||||||
|
Net Book Value at December 31, 2012
|
$
|
53,683
|
|
$
|
18,457
|
|
$
|
9,098
|
|
$
|
5,124
|
|
$
|
2,011
|
|
$
|
6,091
|
|
$
|
94,464
|
|
||||||
|
Net Book Value at December 31, 2013
|
$
|
50,438
|
|
$
|
17,937
|
|
$
|
8,389
|
|
$
|
5,108
|
|
$
|
1,364
|
|
$
|
4,967
|
|
$
|
88,203
|
|
||||||
|
(a)
|
The increase of
$1.5 million
in Patents and Technology relates to our acquisition of certain patents in 2012 related to catalysts useful in the production of fuel products from renewable feedstocks.
|
|
(b)
|
In 2012 we reduced intangible assets by
$44.1 million
and related accumulated amortization by
$16.8 million
in connection with our exit of the phosphorus flame retardants business. See Note 19 “Special Items.”
|
|
(c)
|
Trade names include a gross carrying amount of
$10.3 million
for an indefinite-lived intangible asset.
|
Useful lives range from
15
–
25 years
for customer lists and relationships;
11
–
35 years
for trade names;
17
–
20 years
for patents and technology;
37
–
40 years
for land use rights;
6
–
12 years
for manufacturing contracts and supply/service agreements; and
5
–
35 years
for other.
Amortization of other intangibles amounted to
$8.1 million
,
$10.7 million
and
$13.1 million
for the years ended
December 31, 2013
,
2012
and
2011
, respectively. Total estimated amortization expense of other intangibles for the next five fiscal years is as follows (in thousands):
71
|
Albemarle Corporation and Subsidiaries
|
||
|
NOTES TO THE CONSOLIDATED FINANCIAL STATEMENTS
|
||
|
Estimated
Amortization
Expense
|
|||
|
2014
|
$
|
8,310
|
|
|
2015
|
$
|
6,554
|
|
|
2016
|
$
|
6,078
|
|
|
2017
|
$
|
5,909
|
|
|
2018
|
$
|
5,711
|
|
Accrued expenses consist of the following at
December 31, 2013
and
2012
(in thousands):
|
December 31,
|
||||||||
|
2013
|
2012
|
|||||||
|
Employee benefits, payroll and related taxes
|
$
|
41,955
|
|
$
|
39,442
|
|
||
|
Taxes other than income taxes and payroll taxes
|
23,864
|
|
25,025
|
|
||||
|
Deferred revenue
|
17,896
|
|
13,955
|
|
||||
|
Accrued sales commissions
|
7,241
|
|
7,893
|
|
||||
|
Accrued interest payable
|
7,716
|
|
7,816
|
|
||||
|
Accrued utilities
|
8,608
|
|
9,108
|
|
||||
|
Reduction in force accruals
(a)
|
39,104
|
|
14,428
|
|
||||
|
Other
|
44,149
|
|
59,879
|
|
||||
|
Total
|
$
|
190,533
|
|
$
|
177,546
|
|
||
|
(a)
|
See Note 19, “Special Items.”
|
Long-term debt consists of the following at
December 31, 2013
and
2012
(in thousands):
|
December 31,
|
|||||||
|
2013
|
2012
|
||||||
|
5.10% Senior notes, net of unamortized discount of $36 at December 31, 2013
and $70 at December 31, 2012
|
$
|
324,964
|
|
$
|
324,930
|
|
|
|
4.50% Senior notes, net of unamortized discount of $2,186 at December 31, 2013
and $2,500 at December 31, 2012
|
347,814
|
|
347,500
|
|
|||
|
Commercial paper notes
|
363,000
|
|
—
|
|
|||
|
Fixed rate foreign borrowings
|
7,879
|
|
19,458
|
|
|||
|
Variable-rate foreign bank loans
|
34,910
|
|
7,006
|
|
|||
|
Miscellaneous
|
297
|
|
394
|
|
|||
|
Total long-term debt
|
1,078,864
|
|
699,288
|
|
|||
|
Less amounts due within one year
|
24,554
|
|
12,700
|
|
|||
|
Long-term debt, less current portion
|
$
|
1,054,310
|
|
$
|
686,588
|
|
|
Aggregate annual maturities of long-term debt as of
December 31, 2013
are as follows (in millions):
2014
—
$24.6
;
2015
—
$327.1
;
2016
—
$379.4
;
2017
—
$0.0
;
2018
—
$0.0
; thereafter—
$350.0
.
On February 7, 2014, we entered into a new
$750.0 million
credit facility. The
five
-year, revolving, unsecured credit agreement (hereinafter referred to as the February 2014 credit agreement) matures on February 7, 2019 and (i) replaces our previous
$750.0 million
amended and restated credit agreement dated as of September 22, 2011 (the September 2011 credit agreement); (ii) provides for an additional
$250.0 million
in credit, if needed, subject to the terms of the agreement; and (iii) provides for the ability to extend the maturity date under certain conditions. Borrowings bear interest at variable rates based on the LIBOR for deposits in the relevant currency plus an applicable margin which ranges from
0.900%
to
1.500%
, depending on the Company’s credit rating from Standard & Poor’s Ratings Services (S&P) and Moody’s Investors Services (Moody’s).
72
|
Albemarle Corporation and Subsidiaries
|
||
|
NOTES TO THE CONSOLIDATED FINANCIAL STATEMENTS
|
||
The applicable margin on the facility was
1.000%
as of February 25, 2014. As of February 25, 2014, there were no borrowings outstanding under the February 2014 credit agreement.
Borrowings under the February 2014 credit agreement are conditioned upon compliance with the following covenants: (i) consolidated funded debt, as defined in the agreement, must be less than or equal to
3.50
times consolidated EBITDA, as defined in the agreement, (which reflects adjustments for certain non-recurring or unusual items such as restructuring charges, facility divestiture charges and other significant non-recurring items), or herein “consolidated adjusted EBITDA,” as of the end of any fiscal quarter; (ii) with the exception of liens specified in our new credit facility, liens may not attach to assets when the aggregate amount of all indebtedness secured by such liens plus unsecured subsidiary indebtedness, other than indebtedness incurred by our subsidiaries under the February 2014 credit agreement, would exceed
20%
of consolidated net worth, as defined in the agreement; and (iii) with the exception of indebtedness specified in the February 2014 credit agreement, subsidiary indebtedness may not exceed the difference between
20%
of consolidated net worth, as defined in the agreement, and indebtedness secured by liens permitted under the agreement. We believe that as of
December 31, 2013
, we were, and currently are, in compliance with all of our debt covenants.
On May 29, 2013, we entered into agreements to initiate a commercial paper program on a private placement basis under which we may issue unsecured commercial paper notes (the “Notes”) from time-to-time up to a maximum aggregate principal amount outstanding at any time of
$750.0 million
. The proceeds from the issuance of the Notes are expected to be used for general corporate purposes, including the repayment of other debt of the Company. Our February 2014 credit agreement is available to repay the Notes, if necessary. Aggregate borrowings outstanding under the February 2014 credit agreement and the commercial paper program will not exceed the
$750.0 million
current maximum amount available under the February 2014 credit agreement. The Notes will be sold at a discount from par, or alternatively, will be sold at par and bear interest at rates that will vary based upon market conditions at the time of the issuance of the Notes. The maturities of the Notes will vary but may not exceed 397 days from the date of issue. The definitive documents relating to the Program contain customary representations, warranties, default and indemnification provisions.
At
December 31, 2013
, we had
$363.0 million
of Notes outstanding bearing a weighted-average interest rate of approximately
0.23%
and a weighted-average maturity of
21 days
. While the outstanding Notes generally have short-term maturities, we classify the Notes as long-term based on our ability and intent to refinance the Notes on a long-term basis through the issuance of additional Notes or borrowings under the February 2014 credit agreement.
In September 2011, we amended and restated our previous credit facility. Fees and expenses of
$2.7 million
were incurred and paid in connection with this amendment. Borrowings under the September 2011 credit agreement bore interest at variable rates based on the LIBOR for deposits in the relevant currency plus an applicable margin which ranged from
0.900%
to
1.400%
, depending on the Company’s credit rating applicable from time to time. The applicable margin on the September 2011 credit agreement was
0.975%
as of
December 31, 2013
. As of
December 31, 2013
and
2012
, we had no borrowings outstanding under the September 2011 credit agreement.
Our
$325.0 million
aggregate principal amount of senior notes, issued on January 20, 2005, bear interest at a rate of
5.10%
, payable semi-annually on February 1 and August 1 of each year. The effective interest rate on these senior notes is approximately
5.19%
. These senior notes mature on
February 1, 2015
.
Our
$350.0 million
aggregate principal amount of senior notes, issued on December 10, 2010, bear interest at a rate of
4.50%
, payable semi-annually on June 15 and December 15 of each year. The effective interest rate on these senior notes is approximately
4.70%
. These senior notes mature on
December 15, 2020
.
We have additional agreements with financial institutions that provide for borrowings under uncommitted credit lines up to a maximum of
$60.0 million
. There were no outstanding borrowings under these agreements at either
December 31, 2013
or
December 31, 2012
. The average interest rate on borrowings under these agreements during
2013
,
2012
and
2011
was
0.89%
,
1.49%
and
1.43%
, respectively.
We have an agreement with a foreign bank that provides immediate U.S Dollar or Euro-denominated borrowings under uncommitted credit lines up to a maximum of
$48.0 million
or the Euro equivalent. At
December 31, 2013
and
2012
, there were no outstanding borrowings under this agreement.
One of our foreign subsidiaries has agreements with several foreign banks, which provide immediate borrowings under uncommitted credit lines up to a maximum of
4.5 billion
Japanese Yen (approximately
$42.8 million
at
December 31, 2013
, based on applicable exchange rates). At
December 31, 2013
there were outstanding borrowings of
$16.4 million
and at December 31, 2012 there were no outstanding borrowings under these agreements. The weighted average interest rate on
73
|
Albemarle Corporation and Subsidiaries
|
||
|
NOTES TO THE CONSOLIDATED FINANCIAL STATEMENTS
|
||
borrowings under these agreements during 2013 and 2011 was
0.52%
and
1.07%
, respectively (there were no borrowings in 2012).
Certain of our remaining foreign subsidiaries have additional agreements with foreign institutions that provide immediate uncommitted credit lines, on a short term basis, up to an aggregate maximum of approximately
$93.3 million
, of which
$80.1 million
supports foreign subsidiaries based in China. We have guaranteed these agreements. At
December 31, 2013
and
2012
, there were no outstanding borrowings under these agreements.
At
December 31, 2013
and
2012
, we had the ability and intent to refinance our borrowings under our other existing credit lines with borrowings under the September 2011 credit agreement. Therefore, the amounts outstanding under those credit lines, if any, are classified as long-term debt at
December 31, 2013
and
2012
. At
December 31, 2013
, we had the ability to borrow
$387.0 million
under our commercial paper program and the September 2011 credit agreement, plus an additional
$250.0 million
if needed, subject to the terms of the September 2011 credit agreement.
Our consolidated joint venture JBC has foreign currency denominated debt, which amounted to
$26.4 million
at
December 31, 2013
and
2012
, and principally includes (i) foreign plant-related construction borrowings maturing in April 2015 amounting to
$7.9 million
and
$13.5 million
at
December 31, 2013
and
2012
, respectively, which bore interest at rates ranging from
2.09%
to
5.3%
at
December 31, 2013
, (ii) short-term borrowings of
$18.5 million
at
December 31, 2013
, bearing interest at
1.59%
as of
December 31, 2013
, and (iii) a
$6.0 million
unsecured non-interest bearing loan from its other shareholder at December 31, 2012, which was repaid in 2013. At
December 31, 2013
, JBC had additional borrowing capacity of approximately
$6.1 million
.
In anticipation of refinancing our 2015 senior notes in the fourth quarter of 2014, on January 22, 2014, we entered into a pay fixed, receive variable rate forward starting interest rate swap with J.P. Morgan Chase Bank, N.A., to be effective October 15, 2014. Under this swap, we hedged the interest rate and partial credit spread on the
20
future semi-annual coupon payments that we would pay when we refinance our 2015 senior notes with another
10
year note. The notional amount of the swap is
$325.0 million
and the fixed rate is
3.281%
. A cash settlement will occur on the termination date determined by reference to the changes in the U.S. dollar 3-month LIBOR and credit spreads from the date we entered into the swap until the date we terminate the swap. We intend to designate this derivative financial instrument as an effective hedge under Accounting Standards Codification 815,
Derivatives and Hedging
.
Other noncurrent liabilities consist of the following at
December 31, 2013
and
2012
(in thousands):
|
December 31,
|
|||||||
|
2013
|
2012
|
||||||
|
Liabilities related to uncertain tax positions
(a)
|
$
|
29,834
|
|
$
|
29,179
|
|
|
|
Executive deferred compensation plan obligation
|
23,030
|
|
20,265
|
|
|||
|
Deferred revenue—long-term
|
2,444
|
|
3,362
|
|
|||
|
Environmental liabilities
(b)
|
9,213
|
|
17,213
|
|
|||
|
Asset retirement obligations
(b)
|
16,930
|
|
16,517
|
|
|||
|
Other
|
29,159
|
|
27,486
|
|
|||
|
Total
|
$
|
110,610
|
|
$
|
114,022
|
|
|
|
(a)
|
See Note 18, “Income Taxes.”
|
|
(b)
|
See Note 15, “Commitments and Contingencies.”
|
Incentive Plans
We have various share-based compensation plans that authorize the granting of (i) stock options to purchase shares of our common stock, (ii) restricted stock and restricted stock units, (iii) performance unit awards and (iv) stock appreciation rights (SARs) to employees and non-employee directors. The plans provide for payment of incentive awards in one or more of the following at our option: cash, shares of our common stock, qualified and non-qualified stock options, SARs, restricted stock awards, restricted stock unit awards and performance unit awards. The share-based awards granted by us generally contain vesting provisions ranging from
one
to
five years
, and with respect to stock options granted by us, have a term of not more than ten years from the date of grant. Stock options granted to employees generally vest over
three years
and have a term of
ten
74
|
Albemarle Corporation and Subsidiaries
|
||
|
NOTES TO THE CONSOLIDATED FINANCIAL STATEMENTS
|
||
years
. Restricted stock and restricted stock unit awards vest in periods ranging from
one
to
five years
from the date of grant. Performance unit awards are earned at a level ranging from zero to
200%
contingent upon the achievement of specific performance criteria over periods ranging from
one
to
two years
. Distribution of the earned units occurs generally
50%
upon completion of a two-year measurement period with the remaining
50%
of the earned units distributed one year thereafter.
We granted
297,924
,
263,200
and
401,500
stock options during
2013
,
2012
and
2011
, respectively. There were no significant modifications made to any share-based grants during these periods.
On April 20, 2010, the maximum number of shares available for issuance to participants under the Albemarle Corporation 2008 Incentive Plan (the “Incentive Plan”) increased by
4,470,000
shares to
7,470,000
shares. With respect to any awards, other than stock options or SARs, the number of shares available for awards under the Incentive Plan were reduced by
1.6
shares for each share covered by such award or to which such award related. Effective May 7, 2013, the Albemarle Corporation 2008 Stock Compensation Plan for Non-Employee Directors and the 1996 Directors’ Deferred Compensation Plan (as amended and restated in 2005) were merged into the Albemarle Corporation 2013 Stock Compensation and Deferral Election Plan for Non-Employee Directors (the “Non-Employee Directors Plan”). Under the Non-Employee Directors Plan, a maximum aggregate number of
500,000
shares of our common stock is authorized for issuance to the Company’s non-employee directors; any shares remaining available for issuance under the prior plans were canceled. The aggregate fair market value of shares that may be issued to a director during any compensation year (as defined in the agreement, generally July 1 to June 30) shall not exceed
$150,000
. At
December 31, 2013
, there were
3,587,539
shares available for grant under the Incentive Plan and
485,600
shares available for grant under the Non-Employee Directors Plan.
Total stock-based compensation expense associated with our incentive plans for the years ended
December 31, 2013
,
2012
and
2011
amounted to
$10.2 million
,
$15.2 million
and
$27.1 million
, respectively, and is included in cost of goods sold and selling, general and administrative (SG&A) expenses on the consolidated statements of income. Total related recognized tax benefits for the years ended
December 31, 2013
,
2012
and
2011
amounted to
$3.7 million
,
$5.6 million
and
$10.0 million
, respectively.
The following table summarizes information about the Company’s fixed-price stock options as of and for the year ended
December 31, 2013
:
|
Shares
|
Weighted-
Average
Exercise
Price
|
Weighted-
Average
Remaining
Contractual
Term (Years)
|
Aggregate
Intrinsic Value
(in thousands)
|
|||||||||
|
Outstanding at December 31, 2012
|
1,343,261
|
|
$
|
41.78
|
|
7.2
|
$
|
28,232
|
|
|||
|
Granted
|
297,924
|
|
65.35
|
|
||||||||
|
Exercised
|
(191,732
|
)
|
28.96
|
|
||||||||
|
Forfeited
|
(80,337
|
)
|
61.39
|
|
||||||||
|
Outstanding at December 31, 2013
|
1,369,116
|
|
$
|
47.55
|
|
7.0
|
$
|
22,795
|
|
|||
|
Exercisable at December 31, 2013
|
854,031
|
|
$
|
37.86
|
|
6.0
|
$
|
21,977
|
|
|||
The fair value of each option granted during the years ended
December 31, 2013
,
2012
and
2011
was estimated on the date of grant using the Black-Scholes option-pricing model with the following weighted-average assumptions:
|
Year Ended December 31,
|
|||||||||||
|
2013
|
2012
|
2011
|
|||||||||
|
Dividend yield
|
1.58
|
%
|
1.59
|
%
|
1.53
|
%
|
|||||
|
Volatility
|
33.55
|
%
|
34.04
|
%
|
33.04
|
%
|
|||||
|
Average expected life (years)
|
6
|
|
6
|
|
6
|
|
|||||
|
Risk-free interest rate
|
2.18
|
%
|
2.05
|
%
|
3.67
|
%
|
|||||
|
Fair value of options granted
|
$
|
19.73
|
|
$
|
20.00
|
|
$
|
18.42
|
|
||
Dividend yield is the average of historical yields and those estimated over the average expected life. The stock volatility is based on historical volatilities of our common stock. The average expected life represents the weighted average period of time that options granted are expected to be outstanding giving consideration to vesting schedules and our historical exercise
75
|
Albemarle Corporation and Subsidiaries
|
||
|
NOTES TO THE CONSOLIDATED FINANCIAL STATEMENTS
|
||
patterns. The risk-free interest rate is based on the U.S. Treasury strip rate with stripped coupon interest for the period equal to the contractual term of the share option grant in effect at the time of grant.
The intrinsic value of options exercised during the years ended
December 31, 2013
,
2012
and
2011
was
$7.0 million
,
$37.4 million
and
$7.9 million
, respectively. The intrinsic value of a stock option is the amount by which the market value of the underlying stock exceeds the exercise price of the option.
Total compensation cost not yet recognized for nonvested stock options outstanding as of
December 31, 2013
is approximately
$6.1 million
and is expected to be recognized over a remaining weighted-average period of
2.3
years. Cash proceeds from stock options exercised and tax benefits related to stock options exercised were
$5.6 million
and
$2.5 million
for the year ended
December 31, 2013
, respectively. The Company issues new shares of common stock upon exercise of stock options and vesting of restricted common stock awards.
The following table summarizes activity in performance unit awards as of and for the year ended
December 31, 2013
:
|
Shares
|
Weighted
Average
Grant Date
Fair Value
Per Share
|
|||||
|
Nonvested, beginning of period
|
364,100
|
|
$
|
55.94
|
|
|
|
Granted
|
274,621
|
|
61.41
|
|
||
|
Vested
|
(228,001
|
)
|
49.77
|
|
||
|
Forfeited
|
(39,317
|
)
|
62.53
|
|
||
|
Nonvested, end of period
|
371,403
|
|
63.08
|
|
||
The weighted average grant date fair value of performance unit awards granted in
2013
,
2012
and
2011
was
$16.9 million
,
$19.7 million
and
$10.7 million
, respectively. Performance units awarded in 2013 include shares with a weighted average grant date fair value of
$6.3 million
related to awards granted in 2011 that earned at a rate of
200%
based upon the achievement of specific performance criteria. Performance units awarded in 2012 include shares with a weighted average grant date fair value of
$8.9 million
related to awards granted in 2011 and 2010 that earned at a rate of
200%
based upon the achievement of specific performance criteria.
The weighted average fair value of performance unit awards that vested during
2013
,
2012
and
2011
was
$14.5 million
,
$18.3 million
and
$0.2 million
, respectively, based on the closing prices of our common stock on the dates of vesting. Total compensation cost not yet recognized for nonvested performance unit awards outstanding as of
December 31, 2013
is approximately
$2.4 million
, calculated based on current expectation of specific performance criteria, and is expected to be recognized over a remaining weighted-average period of approximately
1.1
years. Each performance unit represents
one
share of common stock.
The following table summarizes activity in non-performance based restricted stock and restricted stock unit awards as of and for the year ended
December 31, 2013
:
|
Shares
|
Weighted
Average
Grant Date
Fair Value
Per Share
|
|||||
|
Nonvested, beginning of period
|
142,805
|
|
$
|
51.01
|
|
|
|
Granted
|
53,593
|
|
63.17
|
|
||
|
Vested
|
(51,416
|
)
|
41.48
|
|
||
|
Forfeited
|
(33,787
|
)
|
57.46
|
|
||
|
Nonvested, end of period
|
111,195
|
|
59.32
|
|
||
The weighted average grant date fair value of restricted stock and restricted stock unit awards granted in
2013
,
2012
and
2011
was
$3.4 million
,
$2.9 million
and
$3.7 million
, respectively. The weighted average fair value of restricted stock and restricted stock unit awards that vested in
2013
,
2012
and
2011
was
$3.2 million
,
$7.4 million
and
$9.4 million
, respectively, based on the closing prices of our common stock on the dates of vesting. Total compensation cost not yet recognized for nonvested, non-performance based restricted stock and restricted stock units as of
December 31, 2013
is approximately
$3.4
76
|
Albemarle Corporation and Subsidiaries
|
||
|
NOTES TO THE CONSOLIDATED FINANCIAL STATEMENTS
|
||
million
and is expected to be recognized over a remaining weighted-average period of
1.6
years. The fair value of the non-performance based restricted stock and restricted stock units was estimated on the date of grant adjusted for a dividend factor, if necessary.
In the ordinary course of business, we have commitments in connection with various activities, the most significant of which are as follows:
Environmental
We had the following activity in our recorded environmental liabilities for the years ended
December 31, 2013
,
2012
and
2011
(in thousands):
|
Year Ended December 31,
|
|||||||||||
|
2013
|
2012
|
2011
|
|||||||||
|
Balance, beginning of year
|
$
|
20,322
|
|
$
|
12,359
|
|
$
|
13,806
|
|
||
|
Expenditures
|
(3,013
|
)
|
(1,451
|
)
|
(1,081
|
)
|
|||||
|
Changes in estimates recorded to earnings and other
|
(902
|
)
|
227
|
|
(270
|
)
|
|||||
|
Exit of phosphorus flame retardants business
|
—
|
|
8,700
|
|
—
|
|
|||||
|
Foreign currency translation
|
192
|
|
487
|
|
(96
|
)
|
|||||
|
Balance, end of year
|
16,599
|
|
20,322
|
|
12,359
|
|
|||||
|
Less amounts reported in Accrued expenses
|
7,386
|
|
3,109
|
|
1,433
|
|
|||||
|
Amounts reported in Other noncurrent liabilities
|
$
|
9,213
|
|
$
|
17,213
|
|
$
|
10,926
|
|
||
The amounts recorded represent our future remediation and other anticipated environmental liabilities. These liabilities typically arise during the normal course of our operational and environmental management activities or at the time of acquisition of the site, and are based on internal analysis as well as input from outside consultants. As evaluations proceed at each relevant site, changes in risk assessment practices, remediation techniques and regulatory requirements can occur, therefore such liability estimates may be adjusted accordingly. The timing and duration of remediation activities at these sites will be determined when evaluations are completed. Although it is difficult to quantify the potential financial impact of these remediation liabilities, management estimates (based on the latest available information) that there is a reasonable possibility that future environmental remediation costs associated with our past operations, in excess of amounts already recorded, could be up to approximately
$17 million
before income taxes.
Approximately
$7.3 million
of our recorded liability is related to the closure and post-closure activities at a former landfill associated with our Bergheim, Germany site, which was recorded at the time of our acquisition of this site in 2001. This closure project has been approved under the authority of the governmental permit for this site and is scheduled for completion in 2017, with post-closure monitoring to occur for 30 years thereafter. The remainder of our recorded liability is associated with sites that are being evaluated under governmental authority but for which final remediation plans have not yet been approved. In connection with the remediation activities at our Bergheim, Germany site as required by the German environmental authorities, we have pledged certain of our land and housing facilities at this site which has an estimated fair value of
$6.2 million
.
During the second quarter of 2012, the Company recorded
$8.7 million
in estimated site remediation liabilities at our Avonmouth, United Kingdom site as part of the charges associated with our exit of the phosphorus flame retardant business. Included in these estimated charges are anticipated costs of site investigation, remediation and cleanup activities. We are in the process of reviewing our investigation and remediation plans with local government authorities. Based on current information about site conditions, we anticipate this investigation and remediation program will be substantially completed during 2014.
We believe that any sum we may be required to pay in connection with environmental remediation matters in excess of the amounts recorded should occur over a period of time and should not have a material adverse effect upon our results of operations, financial condition or cash flows on a consolidated annual basis although any such sum could have a material adverse impact on our results of operations, financial condition or cash flows in a particular quarterly reporting period.
77
|
Albemarle Corporation and Subsidiaries
|
||
|
NOTES TO THE CONSOLIDATED FINANCIAL STATEMENTS
|
||
Rental Expense
Our rental expenses include a number of operating lease agreements, primarily for office space, transportation equipment and storage facilities. The following schedule details the future non-cancelable minimum lease payments for the next five years and thereafter (in thousands):
|
Minimum
Operating Lease
Payments
|
|||
|
2014
|
$
|
7,232
|
|
|
2015
|
$
|
5,556
|
|
|
2016
|
$
|
4,142
|
|
|
2017
|
$
|
3,351
|
|
|
2018
|
$
|
2,286
|
|
|
Thereafter
|
$
|
6,060
|
|
Rental expense was approximately
$30.7 million
,
$33.1 million
, and
$30.9 million
for
2013
,
2012
and
2011
, respectively. Rental expense is shown net of rental income which was minimal during
2013
,
2012
and
2011
.
Litigation
On July 3, 2006, we received a Notice of Violation (the 2006 NOV) from the U.S. Environmental Protection Agency Region 4 (EPA) regarding the implementation of the Pharmaceutical Maximum Achievable Control Technology standards at our plant in Orangeburg, South Carolina. The alleged violations involve (i) the applicability of the specific regulations to certain intermediates manufactured at the plant, (ii) failure to comply with certain reporting requirements, (iii) improper evaluation and testing to properly implement the regulations and (iv) the sufficiency of the leak detection and repair program at the plant. In the second quarter of 2011, the Company was served with a complaint by the EPA in the U.S. District Court for the District of South Carolina, based on the alleged violations set out in the 2006 NOV seeking civil penalties and injunctive relief. The complaint was subsequently amended to add the State of South Carolina as a plaintiff. We intend to vigorously defend this action. Any settlement or finding adverse to us could result in the payment by us of fines, penalties, capital expenditures or some combination thereof. At this time, it is not possible to predict with any certainty the outcome of this litigation or the financial impact which may result therefrom. However, we do not expect any financial impact to have a material adverse effect on the Company’s results of operations, financial condition or cash flows.
In addition, we are involved from time to time in legal proceedings of types regarded as common in our business, including administrative or judicial proceedings seeking remediation under environmental laws, such as the federal Comprehensive Environmental Response, Compensation and Liability Act, commonly known as CERCLA or Superfund, products liability, breach of contract liability and premises liability litigation. Where appropriate, we may establish financial reserves as estimated by our general counsel for such proceedings. We also maintain insurance to mitigate certain of such risks. Costs for legal services are generally expensed as incurred.
Other
The Company has standby letters of credit and guarantees with various financial institutions. The following table summarizes our letters of credit and guarantee agreements (in thousands):
|
2014
|
2015
|
2016
|
2017
|
2018
|
Thereafter
|
||||||||||||||||||
|
Letters of credit and other guarantees
|
$
|
12,618
|
|
$
|
3,262
|
|
$
|
328
|
|
$
|
3,839
|
|
$
|
232
|
|
$
|
6,291
|
|
|||||
The outstanding letters of credit are primarily related to insurance claim payment guarantees with expiration dates ranging from
2014
to
2022
. The majority of the Company’s other guarantees have terms of one year and mainly consist of performance and environmental guarantees, as well as guarantees to customs and port authorities. The guarantees arose during the ordinary course of business.
We do not have recorded reserves for the letters of credit and guarantees as of
December 31, 2013
. We are unable to estimate the maximum amount of the potential future liability under guarantees and letters of credit. However, we accrue for any potential loss for which we believe a future payment is probable and a range of loss can be reasonably estimated. We believe our liability under such obligations is immaterial.
78
|
Albemarle Corporation and Subsidiaries
|
||
|
NOTES TO THE CONSOLIDATED FINANCIAL STATEMENTS
|
||
Our estimated asset retirement obligations associated with certain property and equipment were
$16.9 million
and
$16.5 million
at
December 31, 2013
and
2012
, respectively. We have not recognized conditional asset retirement obligations for which a fair value cannot be reasonably estimated in our consolidated financial statements. It is the opinion of our management that the possibility is remote that such conditional asset retirement obligations, when estimable, will have a material adverse impact on our consolidated financial statements based on current costs.
We currently, and are from time to time, subject to transactional audits in various taxing jurisdictions and to customs audits globally. We do not expect the financial impact of any of these audits to have a material adverse effect on the Company’s results of operations, financial condition or cash flows.
The components and activity in Accumulated other comprehensive income (net of deferred income taxes) consisted of the following during the years ended
December 31, 2013
,
2012
and
2011
(in thousands):
|
Foreign
Currency
Translation
Adjustments
(a)
|
Net
Prior Service
Benefit
(b)
|
Unrealized
Gain (Loss) on
Marketable
Securities
|
Other
|
Total
|
|||||||||||||||
|
Balance at December 31, 2010
|
$
|
69,605
|
|
$
|
6,422
|
|
$
|
(3
|
)
|
$
|
(1,135
|
)
|
$
|
74,889
|
|
||||
|
Current period change
|
(17,269
|
)
|
(2,156
|
)
|
1
|
|
257
|
|
(19,167
|
)
|
|||||||||
|
Tax benefit (expense)
|
3,909
|
|
794
|
|
(1
|
)
|
(95
|
)
|
4,607
|
|
|||||||||
|
Balance at December 31, 2011
|
56,245
|
|
5,060
|
|
(3
|
)
|
(973
|
)
|
60,329
|
|
|||||||||
|
Current period change
|
26,846
|
|
(6,533
|
)
|
(5
|
)
|
217
|
|
20,525
|
|
|||||||||
|
Tax benefit (expense)
|
2,026
|
|
2,462
|
|
2
|
|
(80
|
)
|
4,410
|
|
|||||||||
|
Balance at December 31, 2012
|
85,117
|
|
989
|
|
(6
|
)
|
(836
|
)
|
85,264
|
|
|||||||||
|
Current period change
|
29,539
|
|
(781
|
)
|
(3
|
)
|
217
|
|
28,972
|
|
|||||||||
|
Tax benefit (expense)
|
1,809
|
|
279
|
|
1
|
|
(80
|
)
|
2,009
|
|
|||||||||
|
Balance at December 31, 2013
|
$
|
116,465
|
|
$
|
487
|
|
$
|
(8
|
)
|
$
|
(699
|
)
|
$
|
116,245
|
|
||||
|
(a)
|
Current period change for the year ended December 31, 2012 includes
$12.3 million
related to a non-cash write-off of foreign currency translation adjustments from Accumulated other comprehensive income in connection with our exit of the phosphorus flame retardants business (see Note 19) in accordance with current accounting guidance.
|
|
(b)
|
Current period change for the year ended December 31, 2012 includes
$6.5 million
related to a supplemental executive retirement plan settlement in connection with the retirement of our former CEO and executive chairman, and
($4.5) million
related to various amendments to certain of our U.S. pension and defined contribution plans that were approved by our Board of Directors in the fourth quarter of 2012.
|
In accordance with accounting guidance issued by the FASB in February 2013 which became effective for us in the first quarter of 2013 on a prospective basis, below is information about amounts reclassified from accumulated other comprehensive income for the year ended
December 31, 2013
(in thousands):
|
Foreign
Currency
Translation
Adjustments
|
Net
Prior Service
Benefit
|
Unrealized
Loss on
Marketable
Securities
|
Other
|
Total
|
|||||||||||||||
|
Accumulated other comprehensive income -
balance at December 31, 2012
|
$
|
85,117
|
|
$
|
989
|
|
$
|
(6
|
)
|
$
|
(836
|
)
|
$
|
85,264
|
|
||||
|
Other comprehensive income (loss) before
reclassifications
|
31,704
|
|
—
|
|
(2
|
)
|
—
|
|
31,702
|
|
|||||||||
|
Amounts reclassified from accumulated
other comprehensive income
|
—
|
|
(502
|
)
|
—
|
|
137
|
|
(365
|
)
|
|||||||||
|
Other comprehensive income (loss), net of
tax
|
31,704
|
|
(502
|
)
|
(2
|
)
|
137
|
|
31,337
|
|
|||||||||
|
Other comprehensive income attributable to
noncontrolling interests
|
(356
|
)
|
—
|
|
—
|
|
—
|
|
(356
|
)
|
|||||||||
|
Accumulated other comprehensive income -
balance at December 31, 2013
|
$
|
116,465
|
|
$
|
487
|
|
$
|
(8
|
)
|
$
|
(699
|
)
|
$
|
116,245
|
|
||||
79
|
Albemarle Corporation and Subsidiaries
|
||
|
NOTES TO THE CONSOLIDATED FINANCIAL STATEMENTS
|
||
We have certain noncontributory defined benefit pension plans covering certain U.S., German, Japanese and the Netherlands employees. We also have a contributory defined benefit plan covering certain Belgian employees. The benefits for these plans are based primarily on compensation and/or years of service. The funding policy for each plan complies with the requirements of relevant governmental laws and regulations. The pension information for all periods presented includes amounts related to salaried and hourly plans.
During 2009, the U.S. defined benefit pension plans were amended to be in compliance with the Pension Protection Act of 2006 (PPA), which was signed into law on August 16, 2006. This law amended the Employee Retirement Income Security Act of 1974 (ERISA) and included new rules regarding methods and assumptions, including measuring the benefit obligation and plan assets, use of interest rate assumptions, mortality tables, valuation date, credit balances for carryover and pre-funded balances, etc.
Our U.S. defined benefit plan for non-represented employees was closed to new participants effective March 31, 2004. On October 1, 2012, our Board of Directors approved certain plan amendments, such that effective December 31, 2014, no additional benefits shall accrue under this plan and participants’ accrued benefits shall be frozen as of that date. In addition, for participants who retire on or after December 31, 2012 and before December 31, 2013, final average earnings shall be determined as of December 31, 2012. For participants who retire on or after December 31, 2013 and before December 31, 2014, final average earnings shall be determined as of December 31, 2013. And for participants who retire on or after December 31, 2014, final average earnings shall be determined as of December 31, 2014. In addition to freezing the accrued benefits as of December 31, 2014, our Board of Directors also authorized application of a higher benefit formula for calculating accrued benefits in 2013 and 2014 only, as well as including an offset factor that would be applied to accrued benefits earned in 2013 and 2014. In connection with the plan amendments approved on October 1, 2012, we recorded a net curtailment gain of
$4.5 million
, which is included in Restructuring and other charges, net on our consolidated statements of income for the year ended December 31, 2012.
On March 31, 2004, a new defined contribution pension plan benefit was adopted under the qualified defined contribution plan for U.S. non-represented employees hired after March 31, 2004. The benefit was an annual contribution to the defined contribution plan based on
5%
of eligible employee compensation, which was further amended on January 1, 2007 to increase the annual contributions to
6%
or
7%
for eligible employees, depending on specified levels of years of service. On October 1, 2012 our Board of Directors approved additional plan amendments, such that effective January 1, 2013, the defined contribution pension plan benefit is expanded to include non-represented employees hired prior to March 31, 2004, and the annual contribution to the defined contribution plan for all participants is based on
5%
of eligible employee compensation. Furthermore, our Board of Directors approved a one-time contribution to be made in December 2012 for active participants still in the U.S. defined benefit plan; the one-time contribution, in the amount of
$10.1 million
, was made into the defined contribution pension plan and into the EDCP for the amount of the one-time contribution that exceeded U.S. Internal Revenue Service (IRS) limits. The employer portion of contributions to our U.S. defined contribution plan amounted to
$8.8 million
,
$14.8 million
(including the one-time contribution made in the fourth quarter of 2012) and
$4.5 million
in
2013
,
2012
and
2011
, respectively.
We have a defined benefit plan covering employees in the Netherlands. This plan is a transitional arrangement in which benefits are based primarily on employee compensation and/or years of service. This plan is for certain individuals born on or before 1949 whom had a prior agreement, which we elected to honor, in connection with the refinery catalysts business acquisition in 2004.
Pension coverage for the employees of our other foreign subsidiaries is provided through separate plans. The plans are funded in conformity with the funding requirements of applicable governmental regulations. The pension cost, actuarial present value of benefit obligations and plan assets for all plans are combined in the other pension disclosure information presented.
80
|
Albemarle Corporation and Subsidiaries
|
||
|
NOTES TO THE CONSOLIDATED FINANCIAL STATEMENTS
|
||
The following provides a reconciliation of benefit obligations, plan assets and funded status of the plans, as well as a summary of significant assumptions for our pension benefit plans (in thousands):
|
Year Ended December 31, 2013
|
Year Ended December 31, 2012
|
||||||||||||||
|
Total Pension
Benefits
|
Domestic Pension
Benefits
|
Total Pension
Benefits
|
Domestic Pension
Benefits
|
||||||||||||
|
Change in benefit obligations:
|
|||||||||||||||
|
Benefit obligation at January 1
|
$
|
762,395
|
|
$
|
714,158
|
|
$
|
674,665
|
|
$
|
634,184
|
|
|||
|
Service cost
|
13,962
|
|
12,177
|
|
12,741
|
|
11,274
|
|
|||||||
|
Interest cost
|
29,883
|
|
28,406
|
|
31,636
|
|
29,843
|
|
|||||||
|
Plan amendments
|
—
|
|
—
|
|
1,123
|
|
1,123
|
|
|||||||
|
Actuarial (gain) loss
|
(88,392
|
)
|
(85,774
|
)
|
90,336
|
|
83,428
|
|
|||||||
|
Benefits paid
|
(41,132
|
)
|
(39,630
|
)
|
(49,234
|
)
|
(45,694
|
)
|
|||||||
|
Employee contributions
|
320
|
|
—
|
|
294
|
|
—
|
|
|||||||
|
Foreign exchange loss
|
1,546
|
|
—
|
|
834
|
|
—
|
|
|||||||
|
Benefit obligation at December 31
|
$
|
678,582
|
|
$
|
629,337
|
|
$
|
762,395
|
|
$
|
714,158
|
|
|||
|
Change in plan assets:
|
|||||||||||||||
|
Fair value of plan assets at January 1
|
$
|
563,303
|
|
$
|
554,179
|
|
$
|
531,105
|
|
$
|
522,408
|
|
|||
|
Actual return on plan assets
|
83,853
|
|
83,499
|
|
62,577
|
|
62,167
|
|
|||||||
|
Employer contributions
|
9,790
|
|
7,556
|
|
18,299
|
|
15,298
|
|
|||||||
|
Benefits paid
|
(41,132
|
)
|
(39,630
|
)
|
(49,234
|
)
|
(45,694
|
)
|
|||||||
|
Employee contributions
|
320
|
|
—
|
|
294
|
|
—
|
|
|||||||
|
Foreign exchange gain
|
411
|
|
—
|
|
262
|
|
—
|
|
|||||||
|
Fair value of plan assets at December 31
|
$
|
616,545
|
|
$
|
605,604
|
|
$
|
563,303
|
|
$
|
554,179
|
|
|||
|
Funded status at December 31
|
$
|
(62,037
|
)
|
$
|
(23,733
|
)
|
$
|
(199,092
|
)
|
$
|
(159,979
|
)
|
|||
|
December 31, 2013
|
December 31, 2012
|
||||||||||||||
|
Total Pension
Benefits
|
Domestic Pension
Benefits
|
Total Pension
Benefits
|
Domestic Pension
Benefits
|
||||||||||||
|
Amounts recognized in consolidated
balance sheets:
|
|||||||||||||||
|
Current liabilities (accrued expenses)
|
$
|
(4,390
|
)
|
$
|
(2,856
|
)
|
$
|
(3,611
|
)
|
$
|
(2,015
|
)
|
|||
|
Noncurrent liabilities (pension benefits)
|
(57,647
|
)
|
(20,877
|
)
|
(195,481
|
)
|
(157,964
|
)
|
|||||||
|
Net pension liability
|
$
|
(62,037
|
)
|
$
|
(23,733
|
)
|
$
|
(199,092
|
)
|
$
|
(159,979
|
)
|
|||
|
Amounts recognized in accumulated other
comprehensive income:
|
|||||||||||||||
|
Prior service benefit
|
$
|
(70
|
)
|
$
|
(441
|
)
|
$
|
(759
|
)
|
$
|
(1,181
|
)
|
|||
|
Net amount recognized
|
$
|
(70
|
)
|
$
|
(441
|
)
|
$
|
(759
|
)
|
$
|
(1,181
|
)
|
|||
|
Weighted-average assumption
percentages:
|
|||||||||||||||
|
Discount rate
|
5.00
|
%
|
5.14
|
%
|
4.04
|
%
|
4.10
|
%
|
|||||||
|
Rate of compensation increase
|
2.78
|
%
|
3.50
|
%
|
3.37
|
%
|
3.50
|
%
|
|||||||
The accumulated benefit obligation for all defined benefit pension plans was
$669.1 million
and
$738.7 million
at
December 31, 2013
and
2012
, respectively.
Postretirement medical benefits and life insurance is provided for certain groups of U.S. retired employees. Medical and life insurance benefit costs have been funded principally on a pay-as-you-go basis. Although the availability of medical coverage after retirement varies for different groups of employees, the majority of employees who retire before becoming
81
|
Albemarle Corporation and Subsidiaries
|
||
|
NOTES TO THE CONSOLIDATED FINANCIAL STATEMENTS
|
||
eligible for Medicare can continue group coverage by paying a portion of the cost of a monthly premium designed to cover the claims incurred by retired employees subject to a cap on payments allowed. The availability of group coverage for Medicare-eligible retirees also varies by employee group with coverage designed either to supplement or coordinate with Medicare. Retirees generally pay a portion of the cost of the coverage. Plan assets for retiree life insurance are held under an insurance contract and are reserved for retiree life insurance benefits. In 2005, the postretirement medical benefit available to U.S. employees was changed to provide that employees who are
under age 50
as of December 31, 2005 would no longer be eligible for a company-paid retiree medical premium subsidy. Employees who are of
age 50 and above
as of December 31, 2005 and who retire after January 1, 2006 will have their retiree medical premium subsidy capped. Effective January 1, 2008, our medical insurance for certain groups of U.S. retired employees is now insured through a medical carrier.
The following provides a reconciliation of benefit obligations, plan assets and funded status of the plans, as well as a summary of significant assumptions for our postretirement benefit plans (in thousands):
|
Year Ended December 31,
|
|||||||
|
2013
|
2012
|
||||||
|
Total Other
Postretirement
Benefits
|
Total Other
Postretirement
Benefits
|
||||||
|
Change in benefit obligations:
|
|||||||
|
Benefit obligation at January 1
|
$
|
70,787
|
|
$
|
68,935
|
|
|
|
Service cost
|
309
|
|
274
|
|
|||
|
Interest cost
|
2,764
|
|
3,172
|
|
|||
|
Actuarial (gain) loss
|
(6,165
|
)
|
3,032
|
|
|||
|
Benefits paid
|
(4,863
|
)
|
(4,626
|
)
|
|||
|
Benefit obligation at December 31
|
$
|
62,832
|
|
$
|
70,787
|
|
|
|
Change in plan assets:
|
|||||||
|
Fair value of plan assets at January 1
|
$
|
6,611
|
|
$
|
7,681
|
|
|
|
Actual return on plan assets
|
368
|
|
358
|
|
|||
|
Employer contributions
|
3,504
|
|
3,198
|
|
|||
|
Benefits paid
|
(4,863
|
)
|
(4,626
|
)
|
|||
|
Fair value of plan assets at December 31
|
$
|
5,620
|
|
$
|
6,611
|
|
|
|
Funded status at December 31
|
$
|
(57,212
|
)
|
$
|
(64,176
|
)
|
|
|
December 31,
|
|||||||
|
2013
|
2012
|
||||||
|
Total Other
Postretirement
Benefits
|
Total Other
Postretirement
Benefits
|
||||||
|
Amounts recognized in consolidated balance sheets:
|
|||||||
|
Current liabilities (accrued expenses)
|
$
|
(3,309
|
)
|
$
|
(3,361
|
)
|
|
|
Noncurrent liabilities (postretirement benefits)
|
(53,903
|
)
|
(60,815
|
)
|
|||
|
Net postretirement liability
|
$
|
(57,212
|
)
|
$
|
(64,176
|
)
|
|
|
Amounts recognized in accumulated other comprehensive income:
|
|||||||
|
Prior service benefit
|
(429
|
)
|
(525
|
)
|
|||
|
Net amount recognized
|
$
|
(429
|
)
|
$
|
(525
|
)
|
|
|
Weighted-average assumption percentages:
|
|||||||
|
Discount rate
|
5.03
|
%
|
4.00
|
%
|
|||
|
Rate of compensation increase
|
3.50
|
%
|
3.50
|
%
|
|||
82
|
Albemarle Corporation and Subsidiaries
|
||
|
NOTES TO THE CONSOLIDATED FINANCIAL STATEMENTS
|
||
The components of pension benefits (credit) cost are as follows (in thousands):
|
Year Ended
|
Year Ended
|
Year Ended
|
|||||||||||||||||||||
|
December 31, 2013
|
December 31, 2012
|
December 31, 2011
|
|||||||||||||||||||||
|
Total
Pension
Benefits
|
Domestic
Pension
Benefits
|
Total
Pension
Benefits
|
Domestic
Pension
Benefits
|
Total
Pension
Benefits
|
Domestic
Pension
Benefits
|
||||||||||||||||||
|
Service cost
|
$
|
13,962
|
|
$
|
12,177
|
|
$
|
12,741
|
|
$
|
11,274
|
|
$
|
12,830
|
|
$
|
11,169
|
|
|||||
|
Interest cost
|
29,883
|
|
28,406
|
|
31,636
|
|
29,843
|
|
32,933
|
|
30,945
|
|
|||||||||||
|
Expected return on assets
|
(39,392
|
)
|
(38,975
|
)
|
(44,752
|
)
|
(44,342
|
)
|
(42,186
|
)
|
(41,776
|
)
|
|||||||||||
|
Actuarial (gain) loss
(a)
|
(132,916
|
)
|
(130,297
|
)
|
72,550
|
|
65,603
|
|
88,809
|
|
88,091
|
|
|||||||||||
|
Amortization of prior service
benefit
|
(689
|
)
|
(741
|
)
|
(757
|
)
|
(812
|
)
|
(953
|
)
|
(1,009
|
)
|
|||||||||||
|
Total net pension benefits (credit)
cost
|
$
|
(129,152
|
)
|
$
|
(129,430
|
)
|
$
|
71,418
|
|
$
|
61,566
|
|
$
|
91,433
|
|
$
|
87,420
|
|
|||||
|
Weighted-average assumption
percentages:
|
|||||||||||||||||||||||
|
Discount rate
|
4.04
|
%
|
4.10
|
%
|
5.04
|
%
|
5.07
|
%
|
5.40
|
%
|
5.45
|
%
|
|||||||||||
|
Expected return on plan assets
|
7.20
|
%
|
7.25
|
%
|
8.19
|
%
|
8.25
|
%
|
8.19
|
%
|
8.25
|
%
|
|||||||||||
|
Rate of compensation increase
|
3.37
|
%
|
3.50
|
%
|
3.96
|
%
|
4.11
|
%
|
3.93
|
%
|
4.11
|
%
|
|||||||||||
|
(a)
|
In the second quarter of 2013, we identified that our consolidated statement of income for the year ended December 31, 2012 included a correction of
$5.8 million
(recorded in the second quarter of 2012) for pension plan actuarial gains that related to 2011. This amount was deemed to be not material with respect to our financial statements for the year ended December 31, 2012 and any prior period financial statements.
|
The estimated amounts to be amortized from accumulated other comprehensive income into net periodic pension costs during
2014
are as follows (in thousands):
|
Total
Pension
Benefits
|
Domestic
Pension
Benefits
|
||||||
|
Amortization of prior service benefit
|
$
|
(689
|
)
|
$
|
(741
|
)
|
|
83
|
Albemarle Corporation and Subsidiaries
|
||
|
NOTES TO THE CONSOLIDATED FINANCIAL STATEMENTS
|
||
The components of postretirement benefits (credit) cost are as follows (in thousands):
|
Year Ended December 31,
|
|||||||||||
|
2013
|
2012
|
2011
|
|||||||||
|
Total Other
Postretirement
Benefits
|
Total Other
Postretirement
Benefits
|
Total Other
Postretirement
Benefits
|
|||||||||
|
Service cost
|
$
|
309
|
|
$
|
274
|
|
$
|
263
|
|
||
|
Interest cost
|
2,764
|
|
3,172
|
|
3,393
|
|
|||||
|
Expected return on assets
|
(413
|
)
|
(488
|
)
|
(509
|
)
|
|||||
|
Actuarial (gain) loss
(a)
|
(6,120
|
)
|
3,161
|
|
3,324
|
|
|||||
|
Amortization of prior service benefit
|
(95
|
)
|
(95
|
)
|
(697
|
)
|
|||||
|
Total net postretirement benefits (credit) cost
|
$
|
(3,555
|
)
|
$
|
6,024
|
|
$
|
5,774
|
|
||
|
Weighted-average assumption percentages:
|
|||||||||||
|
Discount rate
|
4.00
|
%
|
5.10
|
%
|
5.30
|
%
|
|||||
|
Expected return on plan assets
|
7.00
|
%
|
7.00
|
%
|
7.00
|
%
|
|||||
|
Rate of compensation increase
|
3.50
|
%
|
4.00
|
%
|
4.00
|
%
|
|||||
|
(a)
|
In the second quarter of 2013, we identified that our consolidated statement of income for the year ended December 31, 2012 included a correction of
$4.4 million
(recorded in the second quarter of 2012) for postretirement plan actuarial gains that related to 2011. This amount was deemed to be not material with respect to our financial statements for the year ended December 31, 2012 and any prior period financial statements.
|
The estimated amounts to be amortized from accumulated other comprehensive income into net periodic postretirement costs during
2014
are as follows (in thousands):
|
Total Other
Postretirement
Benefits
|
|||
|
Amortization of prior service benefit
|
$
|
(95
|
)
|
In estimating the expected return on plan assets, consideration is given to past performance and future performance expectations for the types of investments held by the plan, as well as the expected long-term allocations of plan assets to these investments. For the years
2013
and
2012
, the weighted-average expected rate of return on domestic pension plan assets was
7.25%
and
8.25%
, respectively. The weighted-average expected rate of return on our domestic pension plan assets is
6.91%
effective January 1,
2014
. The weighted-average expected rate of return on plan assets for our OPEB plans was
7.00%
during
2013
and
2012
. There has been no change to the assumed rate of return on OPEB plan assets effective January 1,
2014
. The weighted-average expected rate of return on pension plan assets for foreign plans was
4.35%
and
4.50%
during
2013
and
2012
, respectively.
In projecting the rate of compensation increase, we consider past experience in light of movements in inflation rates. At
December 31, 2013
, the assumed weighted-average rate of compensation increase changed to
2.78%
from
3.37%
for the pension plans. The assumed weighted-average rate of compensation increase was
3.50%
for the OPEB plans at
December 31, 2013
and
2012
.
84
|
Albemarle Corporation and Subsidiaries
|
||
|
NOTES TO THE CONSOLIDATED FINANCIAL STATEMENTS
|
||
Fair value is defined as the price that would be received to sell an asset or paid to transfer a liability in an orderly transaction between market participants at the measurement date (exit price). The inputs used to measure fair value are classified into the following hierarchy:
|
Level 1
|
Unadjusted quoted prices in active markets for identical assets or liabilities
|
|
Level 2
|
Unadjusted quoted prices in active markets for similar assets or liabilities, or
|
|
Unadjusted quoted prices for identical or similar assets or liabilities in markets that are not active, or
|
|
|
Inputs other than quoted prices that are observable for the asset or liability
|
|
|
Level 3
|
Unobservable inputs for the asset or liability
|
We endeavor to utilize the best available information in measuring fair value. Financial assets and liabilities are classified in their entirety based on the lowest level of input that is significant to the fair value measurement. Transfers between levels of the fair value hierarchy are deemed to have occurred on the date of the event or change in circumstance that caused the transfer. There were no transfers between Levels 1 and 2 during the year ended December 31, 2013. Investments for which market quotations are readily available are valued at the closing price on the last business day of the year. Listed securities for which no sale was reported on such date are valued at the mean between the last reported bid and asked price. Securities traded in the over-the-counter market are valued at the closing price on the last business day of the year or at bid price. The net asset value of shares or units is based on the quoted market value of the underlying assets. The market value of corporate bonds is based on institutional trading lots and is most often reflective of bid price. Government securities are valued at the mean between bid and ask prices. Holdings in private equity securities are typically valued using the net asset valuations provided by the underlying private investment companies.
The following table sets forth the assets of our pension and postretirement plans that were accounted for at fair value on a recurring basis as of
December 31, 2013
(in thousands):
|
December 31, 2013
|
Quoted Prices in
Active Markets
for Identical
Items
(Level 1)
|
Quoted Prices in
Active Markets
for Similar
Items
(Level 2)
|
Unobservable
Inputs
(Level 3)
|
||||||||||||
|
Pension Assets:
|
|||||||||||||||
|
Domestic Equity
(a)
|
$
|
167,627
|
|
$
|
167,627
|
|
$
|
—
|
|
$
|
—
|
|
|||
|
International Equity
(b)
|
70,609
|
|
70,609
|
|
—
|
|
—
|
|
|||||||
|
Fixed Income
(c)
|
248,095
|
|
237,151
|
|
10,944
|
|
—
|
|
|||||||
|
Absolute Return
(d)
|
125,137
|
|
1,538
|
|
—
|
|
123,599
|
|
|||||||
|
Cash
|
5,077
|
|
5,077
|
|
—
|
|
—
|
|
|||||||
|
Total Pension Assets
|
$
|
616,545
|
|
$
|
482,002
|
|
$
|
10,944
|
|
$
|
123,599
|
|
|||
|
Postretirement Assets:
|
|||||||||||||||
|
Fixed Income
(c)
|
$
|
5,620
|
|
$
|
—
|
|
$
|
5,620
|
|
$
|
—
|
|
|||
|
(a)
|
Consists primarily of U.S. stock funds that track or are actively managed and measured against the S&P 500 index.
|
|
(b)
|
Consists primarily of an international equity fund which invests in common stocks and other securities whose value is based on an international equity index or an underlying equity security or basket of equity securities.
|
|
(c)
|
Consists primarily of mutual funds that hold debt obligations issued by governments, corporations, municipalities and other borrowers. Also includes insurance policies.
|
|
(d)
|
Consists primarily of funds with holdings in private investment companies. See additional information about the Absolute Return investments below.
|
85
|
Albemarle Corporation and Subsidiaries
|
||
|
NOTES TO THE CONSOLIDATED FINANCIAL STATEMENTS
|
||
The table below sets forth a summary of changes in the fair value of the plans’ Level 3 assets for the year ended
December 31, 2013
(in thousands):
|
Absolute Return:
|
Year Ended December 31, 2013
|
||
|
Beginning Balance
|
$
|
70,829
|
|
|
Total gains relating to assets sold during the period
(a)
|
994
|
|
|
|
Total unrealized losses relating to assets still held at the reporting date
(a)
|
(4,511
|
)
|
|
|
Purchases
|
76,643
|
|
|
|
Sales
|
(20,356
|
)
|
|
|
Ending Balance
|
$
|
123,599
|
|
|
(a)
|
These gains (losses) are recognized in the consolidated balance sheets and are included as changes in plan assets in the tables above.
|
The following table sets forth the assets of our pension and postretirement plans that were accounted for at fair value on a recurring basis as of
December 31, 2012
(in thousands):
|
December 31, 2012
|
Quoted Prices in
Active Markets
for Identical
Items
(Level 1)
|
Quoted Prices in
Active Markets
for Similar
Items
(Level 2)
|
Unobservable
Inputs
(Level 3)
|
||||||||||||
|
Pension Assets:
|
|||||||||||||||
|
Domestic Equity
(a)
|
$
|
218,145
|
|
$
|
153,465
|
|
$
|
64,680
|
|
$
|
—
|
|
|||
|
International Equity
(b)
|
107,647
|
|
18,977
|
|
88,670
|
|
—
|
|
|||||||
|
Fixed Income
(c)
|
142,967
|
|
51,306
|
|
91,661
|
|
—
|
|
|||||||
|
Absolute Return
(d)
|
80,714
|
|
9,885
|
|
—
|
|
70,829
|
|
|||||||
|
Cash
|
13,830
|
|
13,830
|
|
—
|
|
—
|
|
|||||||
|
Total Pension Assets
|
$
|
563,303
|
|
$
|
247,463
|
|
$
|
245,011
|
|
$
|
70,829
|
|
|||
|
Postretirement Assets:
|
|||||||||||||||
|
Fixed Income
(c)
|
$
|
6,611
|
|
$
|
—
|
|
$
|
6,611
|
|
$
|
—
|
|
|||
|
(a)
|
Consists primarily of U.S. equity securities covering a diverse group of companies and U.S. stock funds that primarily track or are actively managed and measured against indices including the S&P 500 and the Russell 2000.
|
|
(b)
|
Consists primarily of international equity funds which include stocks and debt obligations of non-U.S. entities that primarily track or are actively managed and measured against various MSCI indices.
|
|
(c)
|
Consists primarily of fixed income mutual funds, corporate bonds, U.S. Treasury notes, other government securities and insurance policies.
|
|
(d)
|
Consists primarily of funds with holdings in private investment companies. See additional information about the Absolute Return investments below.
|
The table below sets forth a summary of changes in the fair value of the plans’ Level 3 assets for the year ended
December 31, 2012
(in thousands):
|
Absolute Return:
|
Year Ended December 31, 2012
|
||
|
Beginning Balance
|
$
|
73,025
|
|
|
Total losses relating to assets sold during the period
(a)
|
(31
|
)
|
|
|
Total unrealized gains relating to assets still held at the reporting date
(a)
|
2,311
|
|
|
|
Sales
|
(4,476
|
)
|
|
|
Ending Balance
|
$
|
70,829
|
|
|
(a)
|
These gains (losses) are recognized in the consolidated balance sheets and are included as changes in plan assets in the tables above.
|
The investment objective of the U.S. pension plan assets is preservation of capital while achieving solid returns. Assets should participate in rising markets, with defensive action in declining markets expected to an even greater degree. Target asset
86
|
Albemarle Corporation and Subsidiaries
|
||
|
NOTES TO THE CONSOLIDATED FINANCIAL STATEMENTS
|
||
allocations include
65%
in return enhancement exposure and the remaining
35%
in risk management exposure. Depending on market conditions, the broad asset class targets may range up or down by approximately
10%
. These asset classes include but are not limited to hedge fund of funds, bonds and other fixed income vehicles, high yield fixed income securities, equities and distressed debt. At
December 31, 2013
and
2012
, equity securities held by our pension and OPEB plans did not include direct ownership of Albemarle common stock.
Our Absolute Return investments consist primarily of our investments in hedge fund of funds. These are holdings in private investment companies with fair values that are based on significant unobservable inputs including assumptions where there is little, if any, market activity for the investment. Investment managers or fund managers associated with these investments provide valuations of the investments on a monthly basis utilizing the net asset valuation approach for determining fair values. These valuations are reviewed by the Company for reasonableness based on applicable sector, benchmark and company performance to validate the appropriateness of the net asset values as a fair value measurement. Where available, audited financial statements are obtained and reviewed for the investments as support for the manager’s investment valuation. In general, the investment objective of these funds is high risk-adjusted returns with an emphasis on preservation of capital. The investment strategies of each of the funds vary; however, the objective of our Absolute Return investments is complementary to the overall investment objective of our U.S. pension plan assets.
We made contributions to our defined benefit pension and OPEB plans of
$13.3 million
,
$21.6 million
and
$59.8 million
during the years ended
December 31, 2013
,
2012
and
2011
, respectively. Included in contributions for the year ended December 31, 2012 is a contribution of
$14.1 million
to our supplemental executive retirement plan (SERP) in connection with the retirement of our former CEO and executive chairman. We expect contributions to our domestic nonqualified and foreign qualified and nonqualified pension plans to approximate
$5 million
in
2014
. Also, we expect to pay approximately
$3 million
in premiums to our U.S. postretirement benefit plan in
2014
. However, we may choose to make additional voluntary pension contributions in excess of these amounts.
The current forecast of benefit payments, which reflect expected future service, amounts to (in millions):
|
Total
Pension
Benefits
|
Domestic
Pension
Benefits
|
Total
Postretirement
Benefits
|
|||||||||
|
2014
|
$
|
40.0
|
|
$
|
37.6
|
|
$
|
4.8
|
|
||
|
2015
|
$
|
39.6
|
|
$
|
37.8
|
|
$
|
4.9
|
|
||
|
2016
|
$
|
41.2
|
|
$
|
39.4
|
|
$
|
5.0
|
|
||
|
2017
|
$
|
43.2
|
|
$
|
40.9
|
|
$
|
4.9
|
|
||
|
2018
|
$
|
46.2
|
|
$
|
44.5
|
|
$
|
4.8
|
|
||
|
2019-2023
|
$
|
236.3
|
|
$
|
223.0
|
|
$
|
21.4
|
|
||
We have a SERP, which provides unfunded supplemental retirement benefits to certain management or highly compensated employees. The SERP provides for incremental pension benefits to offset the limitations imposed on qualified plan benefits by federal income tax regulations. (Credits) costs relating to our SERP were
$(1.5) million
,
$10.3 million
and
$4.7 million
for the years ended
December 31, 2013
,
2012
and
2011
, respectively. The projected benefit obligation for the SERP recognized in the consolidated balance sheets at
December 31, 2013
and
2012
was
$21.8 million
and
$30.9 million
, respectively. The benefit expenses and obligations of this SERP are included in the tables above. Benefits of
$2.9 million
are expected to be paid to SERP retirees in
2014
. On October 1, 2012, our Board of Directors approved amendments to the SERP, such that effective December 31, 2014, no additional benefits shall accrue under this plan and participants’ accrued benefits shall be frozen as of that date to reflect the same changes as were made under the U.S. qualified defined benefit plan. For participants who retire on or after December 31, 2012, and before December 31, 2013, final average earnings shall be determined as of December 31, 2012. For participants who retire on or after December 31, 2013 and before December 31, 2014, final average earnings shall be determined as of December 31, 2013. And for participants who retire on or after December 31, 2014, final average earnings shall be determined as of December 31, 2014. In addition to freezing the accrued benefits as of December 31, 2014, our Board of Directors also authorized the application in 2013 and 2014 of the higher benefit formula approved for the U.S. qualified defined benefit plan and an offset factor that will be applied to accrued benefits earned in 2013 and 2014.
At
December 31, 2013
, the assumed rate of increase in the pre-65 and post-65 per capita cost of covered health care benefits for U.S. retirees was zero as the employer-paid premium caps (pre-65 and post-65) were met starting January 1, 2013.
87
|
Albemarle Corporation and Subsidiaries
|
||
|
NOTES TO THE CONSOLIDATED FINANCIAL STATEMENTS
|
||
Employee Savings Plans
Certain of our employees participate in our defined contribution 401(k) employee savings plan, which is generally available to all U.S. full-time salaried and non-union hourly employees and to employees who are covered by a collective bargaining agreement that provides for such participation. This U.S. defined contribution plan is funded with contributions made by the participants and us. Our contributions to the 401(k) plan amounted to
$10.6 million
,
$9.5 million
and
$9.1 million
in
2013
,
2012
and
2011
, respectively. We amended our 401(k) plan in 2004 to allow pension contributions to be made by us to participants hired or rehired on or after April 1, 2004 as these participants are not eligible to participate in the Company’s defined benefit pension plan.
In 2006, we formalized a new plan in the Netherlands similar to a collective defined contribution plan. The collective defined contribution plan is supported by annuity contracts through an insurance company. The insurance company unconditionally undertakes the legal obligation to provide specific benefits to specific individuals in return for a fixed amount of premiums. Our obligation under this plan is limited to a variable calculated employer match for each participant plus an additional fixed amount of contributions to assist in covering estimated cost of living and salary increases (indexing) and administrative costs for the overall plan. We paid approximately
$10.3 million
,
$9.5 million
and
$9.9 million
in
2013
,
2012
and
2011
, respectively, in annual premiums and related costs pertaining to this plan.
Other Postemployment Benefits
Certain postemployment benefits to former or inactive employees who are not retirees are funded on a pay-as-you-go basis. These benefits include salary continuance, severance and disability health care and life insurance, which are accounted for in accordance with authoritative guidance. The accrued postemployment benefit liability was
$0.8 million
and
$0.6 million
at
December 31, 2013
and
2012
, respectively.
Income before income taxes and equity in net income of unconsolidated investments and current and deferred income tax expense (benefit) are composed of the following (in thousands):
|
Year Ended December 31,
|
|||||||||||
|
2013
|
2012
|
2011
|
|||||||||
|
Income before income taxes and equity in net income of
unconsolidated investments:
|
|||||||||||
|
Domestic
|
$
|
355,375
|
|
$
|
316,856
|
|
$
|
209,714
|
|
||
|
Foreign
|
189,052
|
|
57,737
|
|
270,863
|
|
|||||
|
Total
|
$
|
544,427
|
|
$
|
374,593
|
|
$
|
480,577
|
|
||
|
Current income tax expense:
|
|||||||||||
|
Federal
|
$
|
52,413
|
|
$
|
71,930
|
|
$
|
82,379
|
|
||
|
State
|
2,121
|
|
6,478
|
|
4,774
|
|
|||||
|
Foreign
|
16,923
|
|
18,712
|
|
28,179
|
|
|||||
|
Total
|
$
|
71,457
|
|
$
|
97,120
|
|
$
|
115,332
|
|
||
|
Deferred income tax expense (benefit):
|
|||||||||||
|
Federal
|
$
|
72,299
|
|
$
|
(2,632
|
)
|
$
|
(23,060
|
)
|
||
|
State
|
2,525
|
|
477
|
|
(417
|
)
|
|||||
|
Foreign
|
(9,959
|
)
|
(12,432
|
)
|
12,279
|
|
|||||
|
Total
|
$
|
64,865
|
|
$
|
(14,587
|
)
|
$
|
(11,198
|
)
|
||
|
Total income tax expense
|
$
|
136,322
|
|
$
|
82,533
|
|
$
|
104,134
|
|
||
88
|
Albemarle Corporation and Subsidiaries
|
||
|
NOTES TO THE CONSOLIDATED FINANCIAL STATEMENTS
|
||
The significant differences between the U.S. federal statutory rate and the effective income tax rate are as follows:
|
% of Income Before Income Taxes
|
||||||||
|
2013
|
2012
|
2011
|
||||||
|
Federal statutory rate
|
35.0
|
%
|
35.0
|
%
|
35.0
|
%
|
||
|
State taxes, net of federal tax benefit
|
0.7
|
|
1.4
|
|
0.6
|
|
||
|
Change in valuation allowance
(a)
|
(2.2
|
)
|
3.4
|
|
(0.3
|
)
|
||
|
Impact of foreign earnings, net
(b)
|
(10.3
|
)
|
(6.1
|
)
|
(10.9
|
)
|
||
|
Depletion
|
(0.9
|
)
|
(1.3
|
)
|
(0.9
|
)
|
||
|
Revaluation of unrecognized tax benefits/reserve requirements
(c)
|
(0.1
|
)
|
(1.7
|
)
|
(0.1
|
)
|
||
|
Domestic Manufacturing tax deduction
(d)
|
(0.9
|
)
|
(3.8
|
)
|
(1.2
|
)
|
||
|
Undistributed earnings of foreign subsidiaries
(b)
|
2.9
|
|
(4.9
|
)
|
(0.4
|
)
|
||
|
Other items, net
|
0.8
|
|
—
|
|
(0.1
|
)
|
||
|
Effective income tax rate
|
25.0
|
%
|
22.0
|
%
|
21.7
|
%
|
||
|
(a)
|
During 2013, the Avonmouth, United Kingdom legal entity was dissolved, therefore the corresponding valuation allowance and deferred tax assets were written off. During 2012, a valuation allowance was established for
$15.9 million
as a result of the planned shut-down of our Avonmouth, United Kingdom legal entity in connection with our exit of the phosphorus flame retardants business. See Note 19, “Special Items.”
|
|
(b)
|
In prior years, we designated the undistributed earnings of substantially all of our foreign subsidiaries as permanently reinvested. The benefit of the lower tax rates in the jurisdictions for which we made this designation have been reflected in our effective income tax rate. During
2013
,
2012
and
2011
, we received distributions of
$12.3 million
,
$56.9 million
and
$33.8 million
, respectively, from various foreign subsidiaries and joint ventures and realized an expense (benefit), net of foreign tax credits, of
$2.4 million
,
$(1.8) million
and
$5.4 million
, respectively, related to the repatriation of these high taxed earnings. We have asserted for all periods being reported, permanent reinvestment of our share of the income of JBC, a Free Zones company under the laws of the Hashemite Kingdom of Jordan. The applicable provisions of the Jordanian law, and applicable regulations thereunder, do not have a termination provision and the exemption is permanent. As a Free Zones company, JBC is not subject to income taxes on the profits of products exported from Jordan, and currently, substantially all of the profits are from exports. In 2012, undistributed foreign subsidiary earnings were primarily impacted by a
$17.4 million
change related to the closure of our Avonmouth, United Kingdom site in connection with our exit of the phosphorus flame retardants business.
|
|
(c)
|
During 2012, we released various tax reserves primarily related to the expiration of the applicable U.S. federal statute of limitations for 2008 which provided a net benefit of
$5.2 million
.
|
|
(d)
|
During 2012, we amended the calculation of the domestic manufacturing tax deduction for the year 2010 and filed the 2011 tax return. As a result, in 2012 we recognized tax benefits of
$1.5 million
and
$3.0 million
related to the 2010 and 2011 tax years, respectively.
|
89
|
Albemarle Corporation and Subsidiaries
|
||
|
NOTES TO THE CONSOLIDATED FINANCIAL STATEMENTS
|
||
The deferred income tax assets and liabilities recorded on the consolidated balance sheets as of
December 31, 2013
and
2012
consist of the following (in thousands):
|
December 31,
|
|||||||
|
2013
|
2012
|
||||||
|
Deferred tax assets:
|
|||||||
|
Postretirement benefits other than pensions
|
$
|
300
|
|
$
|
14,900
|
|
|
|
Accrued employee benefits
|
31,089
|
|
26,603
|
|
|||
|
Operating loss carryovers
|
88,614
|
|
74,934
|
|
|||
|
Pensions
|
37,172
|
|
74,521
|
|
|||
|
Tax credit carryovers
|
35,170
|
|
37,684
|
|
|||
|
Undistributed earnings of foreign subsidiaries
|
—
|
|
15,583
|
|
|||
|
Other
|
15,447
|
|
23,280
|
|
|||
|
Gross deferred tax assets
|
207,792
|
|
267,505
|
|
|||
|
Valuation allowance
|
(33,757
|
)
|
(49,562
|
)
|
|||
|
Deferred tax assets
|
174,035
|
|
217,943
|
|
|||
|
Deferred tax liabilities:
|
|||||||
|
Depreciation
|
(213,575
|
)
|
(193,021
|
)
|
|||
|
Foreign currency translation adjustments
|
(3,104
|
)
|
(4,933
|
)
|
|||
|
Undistributed earnings of foreign subsidiaries
|
(71
|
)
|
—
|
|
|||
|
Other
|
(19,747
|
)
|
(20,348
|
)
|
|||
|
Deferred tax liabilities
|
(236,497
|
)
|
(218,302
|
)
|
|||
|
Net deferred tax liabilities
|
$
|
(62,462
|
)
|
$
|
(359
|
)
|
|
|
Classification in the consolidated balance sheets:
|
|||||||
|
Current deferred tax assets
|
$
|
3,912
|
|
$
|
4,197
|
|
|
|
Current deferred tax liabilities
|
(2,853
|
)
|
(5,700
|
)
|
|||
|
Noncurrent deferred tax assets
|
65,667
|
|
64,512
|
|
|||
|
Noncurrent deferred tax liabilities
|
(129,188
|
)
|
(63,368
|
)
|
|||
|
Net deferred tax liabilities
|
$
|
(62,462
|
)
|
$
|
(359
|
)
|
|
Changes in the balance of our deferred tax asset valuation allowance are as follows (in thousands):
|
Year Ended December 31,
|
|||||||||||
|
2013
|
2012
|
2011
|
|||||||||
|
Balance at January 1
|
$
|
(49,562
|
)
|
$
|
(36,419
|
)
|
$
|
(39,802
|
)
|
||
|
Additions
|
(4,359
|
)
|
(20,182
|
)
|
(6,155
|
)
|
|||||
|
Deductions
|
20,164
|
|
7,039
|
|
9,538
|
|
|||||
|
Balance at December 31
|
$
|
(33,757
|
)
|
$
|
(49,562
|
)
|
$
|
(36,419
|
)
|
||
At
December 31, 2013
, we had approximately
$36.6 million
of domestic credits available to offset future payments of income taxes, expiring in varying amounts between
2016
and
2023
. We have established valuation allowances for
$3.2 million
of those domestic credits since we believe that it is more likely than not that the related deferred tax assets will not be realized. We believe that sufficient taxable income will be generated during the carryover period in order to utilize the other remaining credit carryovers.
At
December 31, 2013
, we have, on a pre-tax basis,
$31.6 million
of domestic net operating losses and
$279.8 million
of foreign net operating loss carryovers. We have established pre-tax valuation allowances for
$101.6 million
of those foreign net operating loss carryovers since we believe that it is more likely than not that the related deferred tax assets will not be realized. For the same reason, we established pre-tax valuation allowances for
$0.8 million
related to foreign deferred tax assets not related to net operating losses. The realization of the deferred tax assets is dependent on the generation of sufficient taxable income in the appropriate tax jurisdictions. Although realization is not assured, we believe it is more likely than not that the remaining deferred tax assets will be realized. However, the amount considered realizable could be reduced if estimates of
90
|
Albemarle Corporation and Subsidiaries
|
||
|
NOTES TO THE CONSOLIDATED FINANCIAL STATEMENTS
|
||
future taxable income change. We believe that it is more likely than not that the Company will generate sufficient taxable income in the future to fully utilize all other deferred tax assets.
Liabilities related to uncertain tax positions were
$29.8 million
and
$29.2 million
at
December 31, 2013
and
2012
, respectively, inclusive of interest and penalties of
$0.7 million
and
$0.8 million
at
December 31, 2013
and
2012
, respectively, and are reported in Other noncurrent liabilities as provided in Note 13. These liabilities at
December 31, 2013
and
2012
were reduced by
$25.7 million
and
$25.8 million
, respectively, for offsetting benefits from the corresponding effects of potential transfer pricing adjustments, state income taxes and rate arbitrage related to foreign structure. These offsetting benefits are recorded in Other assets as provided in Note 9. The resulting net liabilities of
$3.4 million
and
$2.6 million
at
December 31, 2013
and
2012
, respectively, if recognized and released, would favorably affect earnings.
The liabilities related to uncertain tax positions, exclusive of interest, were
$29.1 million
and
$28.4 million
at
December 31, 2013
and
2012
, respectively. The following is a reconciliation of our total gross liability related to uncertain tax positions for
2013
,
2012
and
2011
(in thousands):
|
Year Ended December 31,
|
|||||||||||
|
2013
|
2012
|
2011
|
|||||||||
|
Balance at January 1
|
$
|
28,398
|
|
$
|
29,789
|
|
$
|
20,949
|
|
||
|
Additions for tax positions related to prior years
|
—
|
|
4,242
|
|
—
|
|
|||||
|
Reductions for tax positions related to prior years
|
(348
|
)
|
—
|
|
(1,639
|
)
|
|||||
|
Additions for tax positions related to current year
|
2,061
|
|
3,639
|
|
10,802
|
|
|||||
|
Lapses in statutes of limitations
|
(473
|
)
|
(10,057
|
)
|
(323
|
)
|
|||||
|
Foreign currency translation adjustment
|
(495
|
)
|
785
|
|
—
|
|
|||||
|
Balance at December 31
|
$
|
29,143
|
|
$
|
28,398
|
|
$
|
29,789
|
|
||
We are subject to income taxes in the U.S. and numerous foreign jurisdictions. We are no longer subject to U.S. federal income tax audits by tax authorities for years prior to 2010 since the IRS has completed a review of our income tax returns through 2007 and our statute of limitations has expired for 2008 and 2009 except for the amount of any carryforward to 2010. We also are no longer subject to any U.S. state income tax audits prior to 2004.
With respect to jurisdictions outside the U.S., we are no longer subject to income tax audits for years prior to 2006. During 2013, the German tax authorities continued the audit of two of our German subsidiaries for 2006 through 2009 that began in 2011, and the Chinese tax authorities completed an audit of one of our Chinese subsidiaries for 2006 through 2010 that began in 2011. During 2011, we completed tax audits for one of our Belgian companies for 2008 and 2009, our Japanese company for 2006 through 2010, and two of our Chinese companies through 2010. No significant tax was assessed as a result of the completed audits.
While we believe we have adequately provided for all tax positions, amounts asserted by taxing authorities could be greater than our accrued position. Accordingly, additional provisions on federal and foreign tax-related matters could be recorded in the future as revised estimates are made or the underlying matters are settled or otherwise resolved.
Since the timing of resolutions and/or closure of tax audits is uncertain, it is difficult to predict with certainty the range of reasonably possible significant increases or decreases in the liability related to uncertain tax positions that may occur within the next twelve months. Our current view is that it is reasonably possible that we could record a decrease in the liability related to uncertain tax positions, relating to a number of issues, up to approximately
$2.8 million
as a result of closure of tax statutes.
91
|
Albemarle Corporation and Subsidiaries
|
||
|
NOTES TO THE CONSOLIDATED FINANCIAL STATEMENTS
|
||
Restructuring and other charges, net reported in the consolidated statements of income for the years ended
December 31, 2013
,
2012
and
2011
consist of the following (in thousands):
|
Year Ended December 31,
|
|||||||||||
|
2013
|
2012
|
2011
|
|||||||||
|
Charges in connection with global business realignment
(a)
|
$
|
33,361
|
|
$
|
—
|
|
$
|
—
|
|
||
|
Exit of phosphorus flame retardants business
(b)
|
—
|
|
100,777
|
|
—
|
|
|||||
|
Defined benefit pension plan curtailment gain, net
(c)
|
—
|
|
(4,507
|
)
|
—
|
|
|||||
|
Employer contribution to defined contribution plan
(c)
|
—
|
|
10,081
|
|
—
|
|
|||||
|
Other
(d)
|
—
|
|
5,334
|
|
—
|
|
|||||
|
Total Restructuring and other charges, net
|
$
|
33,361
|
|
$
|
111,685
|
|
$
|
—
|
|
||
|
(a)
|
In connection with the announced realignment of our operating segments effective January 1, 2014, in the fourth quarter of 2013 we initiated a workforce reduction plan which will result in a reduction of approximately
230
employees worldwide. In the fourth quarter of 2013 we recorded charges of
$33.4 million
(
$21.9 million
after income taxes) for termination benefits and other costs related to this workforce reduction plan. Payments under this workforce reduction plan are expected to occur through 2014.
|
|
(b)
|
In the second quarter of 2012 we recorded net charges amounting to
$94.7 million
(
$73.6 million
after income taxes), and in the fourth quarter we recorded net charges amounting to
$6.1 million
(
$2.5 million
after income taxes), in connection with our exit of the phosphorus flame retardants business, whose products were sourced mainly at our Avonmouth, United Kingdom and Nanjing, China manufacturing sites. The charges are comprised mainly of non-cash items consisting of net asset write-offs of approximately
$57 million
and write-offs of foreign currency translation adjustments of approximately
$12 million
, as well as accruals for future cash costs associated with related severance programs of approximately
$22 million
, estimated site remediation costs of approximately
$9 million
, other estimated exit costs of approximately
$3 million
, partly offset by a gain of approximately
$2 million
related to the sale of our Nanjing, China manufacturing site. Payments under this restructuring plan are expected to occur through 2014.
|
|
(c)
|
In the fourth quarter of 2012 we recorded a net curtailment gain of
$4.5 million
(
$2.9 million
after income taxes) and a one-time employer contribution to the Company’s defined contribution plan of
$10.1 million
(
$6.4 million
after income taxes), both in connection with various amendments to certain of our U.S. pension and defined contribution plans that were approved by our Board of Directors in the fourth quarter of 2012. See Note 17, “Pension Plans and Other Postretirement Benefits.”
|
|
(d)
|
In the fourth quarter of 2012 we recorded charges amounting to
$5.3 million
(
$4.3 million
after income taxes) related to changes in product sourcing and other items.
|
We had the following activity in our recorded workforce reduction liabilities for the years ended
December 31, 2013
,
2012
and
2011
(in thousands):
|
Year Ended December 31,
|
|||||||||||
|
2013
|
2012
|
2011
|
|||||||||
|
Balance, beginning of year
|
$
|
15,898
|
|
$
|
4,780
|
|
$
|
7,074
|
|
||
|
Workforce reduction charges
(a)
|
33,361
|
|
21,640
|
|
1,859
|
|
|||||
|
Payments
|
(8,915
|
)
|
(10,929
|
)
|
(4,292
|
)
|
|||||
|
Amount reversed to income
(b)
|
(1,209
|
)
|
(45
|
)
|
19
|
|
|||||
|
Foreign currency translation
|
(31
|
)
|
452
|
|
120
|
|
|||||
|
Balance, end of year
|
39,104
|
|
15,898
|
|
4,780
|
|
|||||
|
Less amounts reported in Accrued expenses
|
39,104
|
|
14,428
|
|
2,843
|
|
|||||
|
Amounts reported in Other noncurrent liabilities
|
$
|
—
|
|
$
|
1,470
|
|
$
|
1,937
|
|
||
|
(a)
|
The year ended December 31, 2013 includes charges amounting to
$33.4 million
in connection with the announced realignment of our operating segments effective January 1, 2014 as described above.
|
The year ended December 31, 2012 includes charges amounting to
$21.6 million
relating to reduction in force liabilities associated with our exit of the phosphorus flame retardants business noted above.
The year ended December 31, 2011 includes charges of
$1.9 million
related to restructuring programs at various manufacturing locations which are reflected in Cost of goods sold. Payments under these programs have been completed.
|
(b)
|
Amounts reversed to income reflect adjustments based on actual timing and amount of final settlements.
|
92
|
Albemarle Corporation and Subsidiaries
|
||
|
NOTES TO THE CONSOLIDATED FINANCIAL STATEMENTS
|
||
Also, the year ended December 31, 2012 includes a gain of
$8.1 million
(
$5.1 million
after income taxes) resulting from proceeds received in connection with the settlement of certain commercial litigation (net of estimated reimbursement of related legal fees of approximately
$0.9 million
). The litigation involved claims and cross-claims relating to alleged breaches of a purchase and sale agreement. The settlement resolves all outstanding issues and claims between the parties and they agreed to dismiss all outstanding litigation and release all existing and potential claims against each other that were or could have been asserted in the litigation. The year ended December 31, 2012 also includes an
$8 million
(
$5.1 million
after income taxes) charitable contribution to the Albemarle Foundation, a non-profit organization that sponsors grants, health and social projects, educational initiatives, disaster relief, matching gift programs, scholarships and other charitable initiatives in locations where our employees live and operate. These items are included in our consolidated Selling, general and administrative expenses for the year ended December 31, 2012.
In assessing the fair value of financial instruments, we use methods and assumptions that are based on market conditions and other risk factors existing at the time of assessment. Fair value information for our financial instruments is as follows:
Long-Term Debt—the fair values of our senior notes and other fixed rate foreign borrowings are estimated using Level 1 inputs and account for the majority of the difference between the recorded amount and fair value of our long-term debt. The carrying value of our remaining long-term debt reported in the accompanying condensed consolidated balance sheets approximates fair value as substantially all of such debt bears interest based on prevailing variable market rates currently available in the countries in which we have borrowings.
|
December 31,
|
|||||||||||||||
|
2013
|
2012
|
||||||||||||||
|
Recorded
Amount
|
Fair Value
|
Recorded
Amount
|
Fair Value
|
||||||||||||
|
(In thousands)
|
|||||||||||||||
|
Long-term debt
|
$
|
1,078,864
|
|
$
|
1,109,878
|
|
$
|
699,288
|
|
$
|
764,784
|
|
|||
Foreign Currency Forward Contracts—we enter into foreign currency forward contracts in connection with our risk management strategies in an attempt to minimize the financial impact of changes in foreign currency exchange rates. These derivative financial instruments are used to manage risk and are not used for trading or other speculative purposes. The fair values of our foreign currency forward contracts are estimated based on current settlement values. At
December 31, 2013
and
2012
, we had outstanding foreign currency forward contracts with notional values totaling
$321.4 million
and
$274.0 million
, respectively. At
December 31, 2013
,
$0.2 million
was included in Other accounts receivable associated with the fair value of our foreign currency forward contracts. At
December 31, 2012
,
$0.3 million
was included in Other accounts receivable and
$0.8 million
was included in Accrued expenses associated with the fair value of our foreign currency forward contracts.
Gains and losses on foreign currency forward contracts are recognized currently in Other (expenses) income, net; further, fluctuations in the value of these contracts are generally expected to be offset by changes in the value of the underlying exposures being hedged. For the years ended
December 31, 2013
,
2012
and
2011
we recognized (losses) gains of
$(1.1) million
,
$5.1 million
and
$1.0 million
, respectively, in Other (expenses) income, net in our consolidated statements of income related to the change in the fair value of our foreign currency forward contracts. These amounts are generally expected to be offset by changes in the value of the underlying exposures being hedged which are also reported in Other (expenses) income, net. Also, for the years ended
December 31, 2013
,
2012
and
2011
, we recorded
$1.1 million
,
$(5.1) million
and
$(1.0) million
, respectively, related to the change in the fair value of our foreign currency forward contracts, and net cash settlements of
$(1.8) million
,
$4.8 million
and
$(3.0) million
, respectively, in Other, net in our consolidated statements of cash flows.
93
|
Albemarle Corporation and Subsidiaries
|
||
|
NOTES TO THE CONSOLIDATED FINANCIAL STATEMENTS
|
||
Fair value is defined as the price that would be received to sell an asset or paid to transfer a liability in an orderly transaction between market participants at the measurement date (exit price). The inputs used to measure fair value are classified into the following hierarchy:
|
Level 1
|
Unadjusted quoted prices in active markets for identical assets or liabilities
|
|
Level 2
|
Unadjusted quoted prices in active markets for similar assets or liabilities, or
|
|
Unadjusted quoted prices for identical or similar assets or liabilities in markets that are not active, or
|
|
|
Inputs other than quoted prices that are observable for the asset or liability
|
|
|
Level 3
|
Unobservable inputs for the asset or liability
|
We endeavor to utilize the best available information in measuring fair value. Financial assets and liabilities are classified in their entirety based on the lowest level of input that is significant to the fair value measurement. Transfers between levels of the fair value hierarchy are deemed to have occurred on the date of the event or change in circumstance that caused the transfer. There were no transfers between Levels 1 and 2 during the year ended December 31, 2013. The following tables set forth our financial assets and liabilities that were accounted for at fair value on a recurring basis as of
December 31, 2013
and
2012
(in thousands):
|
December 31, 2013
|
Quoted Prices in
Active Markets
for Identical
Items
(Level 1)
|
Quoted Prices in
Active Markets
for Similar
Items
(Level 2)
|
Unobservable
inputs
(Level 3)
|
||||||||||||
|
Assets:
|
|||||||||||||||
|
Investments under executive deferred compensation
plan
(a)
|
$
|
23,030
|
|
$
|
23,030
|
|
$
|
—
|
|
$
|
—
|
|
|||
|
Equity securities
(b)
|
$
|
771
|
|
$
|
21
|
|
$
|
—
|
|
$
|
750
|
|
|||
|
Foreign currency forward contracts
(c)
|
$
|
161
|
|
$
|
—
|
|
$
|
161
|
|
$
|
—
|
|
|||
|
Pension assets
(d)
|
$
|
616,545
|
|
$
|
482,002
|
|
$
|
10,944
|
|
$
|
123,599
|
|
|||
|
Postretirement assets
(d)
|
$
|
5,620
|
|
$
|
—
|
|
$
|
5,620
|
|
$
|
—
|
|
|||
|
Liabilities:
|
|||||||||||||||
|
Obligations under executive deferred compensation
plan
(a)
|
$
|
23,030
|
|
$
|
23,030
|
|
$
|
—
|
|
$
|
—
|
|
|||
|
December 31, 2012
|
Quoted Prices in
Active Markets
for Identical
Items
(Level 1)
|
Quoted Prices in
Active Markets
for Similar
Items
(Level 2)
|
Unobservable
inputs
(Level 3)
|
||||||||||||
|
Assets:
|
|||||||||||||||
|
Investments under executive deferred compensation
plan
(a)
|
$
|
20,265
|
|
$
|
20,265
|
|
$
|
—
|
|
$
|
—
|
|
|||
|
Equity securities
(b)
|
$
|
25
|
|
$
|
25
|
|
$
|
—
|
|
$
|
—
|
|
|||
|
Foreign currency forward contracts
(c)
|
$
|
262
|
|
$
|
—
|
|
$
|
262
|
|
$
|
—
|
|
|||
|
Pension assets
(d)
|
$
|
563,303
|
|
$
|
247,463
|
|
$
|
245,011
|
|
$
|
70,829
|
|
|||
|
Postretirement assets
(d)
|
$
|
6,611
|
|
$
|
—
|
|
$
|
6,611
|
|
$
|
—
|
|
|||
|
Liabilities:
|
|||||||||||||||
|
Obligations under executive deferred compensation
plan
(a)
|
$
|
20,265
|
|
$
|
20,265
|
|
$
|
—
|
|
$
|
—
|
|
|||
|
Foreign currency forward contracts
(c)
|
$
|
771
|
|
$
|
—
|
|
$
|
771
|
|
$
|
—
|
|
|||
94
|
Albemarle Corporation and Subsidiaries
|
||
|
NOTES TO THE CONSOLIDATED FINANCIAL STATEMENTS
|
||
|
(a)
|
We maintain an EDCP that was adopted in 2001 and subsequently amended. The purpose of the EDCP is to provide current tax planning opportunities as well as supplemental funds upon the retirement or death of certain of our employees. The EDCP is intended to aid in attracting and retaining employees of exceptional ability by providing them with these benefits. We also maintain a Benefit Protection Trust (the Trust) that was created to provide a source of funds to assist in meeting the obligations of the EDCP, subject to the claims of our creditors in the event of our insolvency. Assets of the Trust are consolidated in accordance with authoritative guidance. The assets of the Trust consist primarily of mutual fund investments (which are accounted for as trading securities and are marked-to-market on a monthly basis through the consolidated statements of income) and cash and cash equivalents. As such, these assets and obligations are classified within Level 1.
|
|
(b)
|
Primarily consists of private equity securities classified as available-for-sale and are reported in Investments in the consolidated balance sheets. The changes in fair value are reported in Other in our consolidated statements of comprehensive income. Holdings in private equity securities are typically valued using the net asset valuations provided by the underlying private investment companies and as such are classified within Level 3.
|
|
(c)
|
As a result of our global operating and financing activities, we are exposed to market risks from changes in foreign currency exchange rates, which may adversely affect our operating results and financial position. When deemed appropriate, we minimize our risks from foreign currency exchange rate fluctuations through the use of derivative financial instruments. The foreign currency forward contracts are valued using broker quotations or market transactions in either the listed or over-the-counter markets. As such, these derivative instruments are classified within Level 2.
|
|
(d)
|
See Note 17 “Pension Plans and Other Postretirement Benefits” for further information about fair value measurements of our pension and postretirement plan assets.
|
On October 1, 2013, we acquired Cambridge Chemical Company, Ltd., for consideration of approximately
$3.6 million
. Cash payments related to this acquisition were
$2.3
million in 2013. On May 11, 2011, we announced that we had expanded our presence in the biofuels market with the acquisition of Catilin Inc. Cash payments related to this acquisition were
$4.5 million
in 2011. In the third quarter of 2010, we purchased certain property and equipment in Yeosu, South Korea in connection with our plans for building a metallocene polyolefin catalyst and TMG manufacturing site. Cash payments related to this acquisition were
$6.5 million
in 2011.
We have identified three reportable segments as required by current accounting guidance. Our Polymer Solutions segment is comprised of the flame retardants and stabilizers and curatives product areas. Our Catalysts segment is comprised of the refinery catalysts and performance catalyst solutions product areas. Our Fine Chemistry segment is comprised of the performance chemicals and fine chemistry services and intermediates product areas. Segment income represents Operating profit (adjusted for significant non-recurring items) and Equity in net income of unconsolidated investments and is reduced by Net income attributable to noncontrolling interests. Segment data includes intersegment transfers of raw materials at cost and allocations for certain corporate costs.
Summarized financial information concerning our reportable segments is shown in the following tables. The Corporate & other segment includes corporate-related items not allocated to the reportable segments. Pension and OPEB service cost (which represents the benefits earned by active employees during the period) and amortization of prior service cost or benefit are allocated to each segment whereas the remaining components of pension and OPEB benefits cost or credit are included in Corporate and other.
95
|
Albemarle Corporation and Subsidiaries
|
||
|
NOTES TO THE CONSOLIDATED FINANCIAL STATEMENTS
|
||
|
Year Ended December 31,
|
|||||||||||
|
2013
|
2012
|
2011
|
|||||||||
|
(In thousands)
|
|||||||||||
|
Net sales:
|
|||||||||||
|
Polymer Solutions
|
$
|
864,388
|
|
$
|
892,232
|
|
$
|
1,001,922
|
|
||
|
Catalysts
|
1,001,606
|
|
1,067,948
|
|
1,116,863
|
|
|||||
|
Fine Chemistry
|
750,422
|
|
785,240
|
|
750,220
|
|
|||||
|
Total net sales
|
$
|
2,616,416
|
|
$
|
2,745,420
|
|
$
|
2,869,005
|
|
||
|
Segment operating profit:
|
|||||||||||
|
Polymer Solutions
|
$
|
153,747
|
|
$
|
198,426
|
|
$
|
243,396
|
|
||
|
Catalysts
|
222,749
|
|
260,544
|
|
290,065
|
|
|||||
|
Fine Chemistry
|
153,629
|
|
182,690
|
|
162,726
|
|
|||||
|
Total segment operating profit
|
530,125
|
|
641,660
|
|
696,187
|
|
|||||
|
Equity in net income of unconsolidated investments:
|
|||||||||||
|
Polymer Solutions
|
8,875
|
|
6,416
|
|
7,696
|
|
|||||
|
Catalysts
|
22,854
|
|
31,651
|
|
36,259
|
|
|||||
|
Fine Chemistry
|
—
|
|
—
|
|
—
|
|
|||||
|
Corporate & other
|
—
|
|
—
|
|
(201
|
)
|
|||||
|
Total equity in net income of unconsolidated investments
|
31,729
|
|
38,067
|
|
43,754
|
|
|||||
|
Net (income) loss attributable to noncontrolling interests:
|
|||||||||||
|
Polymer Solutions
|
(4,753
|
)
|
(2,221
|
)
|
(9,803
|
)
|
|||||
|
Catalysts
|
—
|
|
—
|
|
—
|
|
|||||
|
Fine Chemistry
|
(21,910
|
)
|
(16,350
|
)
|
(18,306
|
)
|
|||||
|
Corporate & other
|
—
|
|
(20
|
)
|
26
|
|
|||||
|
Total net income attributable to noncontrolling interests
|
(26,663
|
)
|
(18,591
|
)
|
(28,083
|
)
|
|||||
|
Segment income:
|
|||||||||||
|
Polymer Solutions
|
157,869
|
|
202,621
|
|
241,289
|
|
|||||
|
Catalysts
|
245,603
|
|
292,195
|
|
326,324
|
|
|||||
|
Fine Chemistry
|
131,719
|
|
166,340
|
|
144,420
|
|
|||||
|
Total segment income
|
535,191
|
|
661,156
|
|
712,033
|
|
|||||
|
Corporate & other
(a)
|
86,145
|
|
(123,831
|
)
|
(178,568
|
)
|
|||||
|
Restructuring and other charges
(b)
|
(33,361
|
)
|
(111,685
|
)
|
—
|
|
|||||
|
Interest and financing expenses
|
(31,559
|
)
|
(32,800
|
)
|
(37,574
|
)
|
|||||
|
Other (expenses) income, net
|
(6,923
|
)
|
1,229
|
|
357
|
|
|||||
|
Income tax expense
|
(136,322
|
)
|
(82,533
|
)
|
(104,134
|
)
|
|||||
|
Net income attributable to Albemarle Corporation
|
$
|
413,171
|
|
$
|
311,536
|
|
$
|
392,114
|
|
||
|
(a)
|
For the years ended
December 31, 2013
,
2012
and
2011
, Corporate and other includes
$143.1 million
,
$(68.0) million
and
$(89.2) million
, respectively, of pension and OPEB plan credits (costs) (including mark-to-market actuarial gains and losses).
|
|
(b)
|
See Note 19, “Special Items.”
|
96
|
Albemarle Corporation and Subsidiaries
|
||
|
NOTES TO THE CONSOLIDATED FINANCIAL STATEMENTS
|
||
|
As of December 31,
|
|||||||||||
|
2013
|
2012
|
2011
|
|||||||||
|
(In thousands)
|
|||||||||||
|
Identifiable assets:
|
|||||||||||
|
Polymer Solutions
|
$
|
630,703
|
|
$
|
628,489
|
|
$
|
692,924
|
|
||
|
Catalysts
|
1,538,688
|
|
1,440,745
|
|
1,308,528
|
|
|||||
|
Fine Chemistry
|
655,567
|
|
613,655
|
|
512,676
|
|
|||||
|
Corporate & other
|
759,839
|
|
754,402
|
|
689,696
|
|
|||||
|
Total identifiable assets
|
$
|
3,584,797
|
|
$
|
3,437,291
|
|
$
|
3,203,824
|
|
||
|
Goodwill:
|
|||||||||||
|
Polymer Solutions
|
$
|
38,072
|
|
$
|
37,615
|
|
$
|
37,163
|
|
||
|
Catalysts
|
221,248
|
|
214,571
|
|
211,210
|
|
|||||
|
Fine Chemistry
|
24,883
|
|
24,780
|
|
24,772
|
|
|||||
|
Total goodwill
|
$
|
284,203
|
|
$
|
276,966
|
|
$
|
273,145
|
|
||
|
Year Ended December 31,
|
|||||||||||
|
2013
|
2012
|
2011
|
|||||||||
|
(In thousands)
|
|||||||||||
|
Depreciation and amortization:
|
|||||||||||
|
Polymer Solutions
|
$
|
28,589
|
|
$
|
28,992
|
|
$
|
30,436
|
|
||
|
Catalysts
|
46,028
|
|
43,876
|
|
43,978
|
|
|||||
|
Fine Chemistry
|
30,565
|
|
24,238
|
|
21,004
|
|
|||||
|
Corporate & other
|
2,188
|
|
1,914
|
|
1,335
|
|
|||||
|
Total depreciation and amortization
|
$
|
107,370
|
|
$
|
99,020
|
|
$
|
96,753
|
|
||
|
Capital expenditures:
|
|||||||||||
|
Polymer Solutions
|
$
|
36,667
|
|
$
|
43,195
|
|
$
|
51,186
|
|
||
|
Catalysts
|
57,529
|
|
117,111
|
|
63,478
|
|
|||||
|
Fine Chemistry
|
60,836
|
|
119,088
|
|
60,679
|
|
|||||
|
Corporate & other
|
314
|
|
1,479
|
|
15,231
|
|
|||||
|
Total capital expenditures
|
$
|
155,346
|
|
$
|
280,873
|
|
$
|
190,574
|
|
||
|
Year Ended December 31,
|
|||||||||||
|
2013
|
2012
|
2011
|
|||||||||
|
(In thousands)
|
|||||||||||
|
Net Sales:
(a)
|
|||||||||||
|
United States
|
$
|
1,022,220
|
|
$
|
1,053,068
|
|
$
|
1,106,580
|
|
||
|
Foreign
|
1,594,196
|
|
1,692,352
|
|
1,762,425
|
|
|||||
|
Total
|
$
|
2,616,416
|
|
$
|
2,745,420
|
|
$
|
2,869,005
|
|
||
|
(a)
|
No sales in a foreign country exceed
10%
of total net sales. Also, net sales are attributed to countries based upon shipments to final destination.
|
97
|
Albemarle Corporation and Subsidiaries
|
||
|
NOTES TO THE CONSOLIDATED FINANCIAL STATEMENTS
|
||
|
As of December 31,
|
|||||||||||
|
2013
|
2012
|
2011
|
|||||||||
|
(In thousands)
|
|||||||||||
|
Long-Lived Assets:
|
|||||||||||
|
United States
|
$
|
748,719
|
|
$
|
735,269
|
|
$
|
652,022
|
|
||
|
Netherlands
|
193,775
|
|
192,540
|
|
185,799
|
|
|||||
|
Jordan
|
227,818
|
|
209,133
|
|
141,725
|
|
|||||
|
Brazil
|
78,078
|
|
85,353
|
|
83,452
|
|
|||||
|
Germany
|
86,175
|
|
72,797
|
|
70,051
|
|
|||||
|
China
|
41,858
|
|
39,542
|
|
64,449
|
|
|||||
|
France
|
34,523
|
|
32,305
|
|
28,652
|
|
|||||
|
Korea
|
86,827
|
|
81,962
|
|
25,008
|
|
|||||
|
United Kingdom
|
3,665
|
|
—
|
|
12,436
|
|
|||||
|
Other foreign countries
|
47,139
|
|
33,598
|
|
46,323
|
|
|||||
|
Total
|
$
|
1,548,577
|
|
$
|
1,482,499
|
|
$
|
1,309,917
|
|
||
Net sales to external customers in each of the segments consists of the following:
|
Year Ended December 31,
|
|||||||||||
|
2013
|
2012
|
2011
|
|||||||||
|
(In thousands)
|
|||||||||||
|
Polymer Solutions:
|
|||||||||||
|
Flame Retardants
|
$
|
620,972
|
|
$
|
665,293
|
|
$
|
780,541
|
|
||
|
Stabilizers and Curatives
|
243,416
|
|
226,939
|
|
221,381
|
|
|||||
|
Total Polymer Solutions
|
$
|
864,388
|
|
$
|
892,232
|
|
$
|
1,001,922
|
|
||
|
Catalysts:
|
|||||||||||
|
Performance Catalyst Solutions
|
$
|
232,769
|
|
$
|
273,015
|
|
$
|
265,381
|
|
||
|
Refinery Catalysts
|
768,837
|
|
794,933
|
|
851,482
|
|
|||||
|
Total Catalysts
|
$
|
1,001,606
|
|
$
|
1,067,948
|
|
$
|
1,116,863
|
|
||
|
Fine Chemistry:
|
|||||||||||
|
Performance Chemicals
|
$
|
461,740
|
|
$
|
463,179
|
|
$
|
460,026
|
|
||
|
Fine Chemistry Services and Intermediates Business
|
288,682
|
|
322,061
|
|
290,194
|
|
|||||
|
Total Fine Chemistry
|
$
|
750,422
|
|
$
|
785,240
|
|
$
|
750,220
|
|
||
Effective January 1, 2014, the Company’s assets and businesses were realigned under
two
operating segments. The Performance Chemicals segment will include Fire Safety Solutions, Specialty Chemicals and Fine Chemistry Services, and the Catalyst Solutions segment will include Refinery Catalyst Solutions, Performance Catalyst Solutions and Antioxidants.
98
|
Albemarle Corporation and Subsidiaries
|
||
|
NOTES TO THE CONSOLIDATED FINANCIAL STATEMENTS
|
||
|
First
Quarter
|
Second
Quarter
|
Third
Quarter
|
Fourth
Quarter
|
||||||||||||
|
(In thousands, except per share amounts)
|
|||||||||||||||
|
2013
|
|||||||||||||||
|
Net sales
|
$
|
641,625
|
|
$
|
634,197
|
|
$
|
648,638
|
|
$
|
691,956
|
|
|||
|
Gross profit
|
$
|
199,590
|
|
$
|
196,639
|
|
$
|
211,649
|
|
$
|
253,527
|
|
|||
|
Restructuring and other charges, net
(a)
|
$
|
—
|
|
$
|
—
|
|
$
|
—
|
|
$
|
33,361
|
|
|||
|
Net income attributable to Albemarle Corporation
|
$
|
83,987
|
|
$
|
82,739
|
|
$
|
90,512
|
|
$
|
155,933
|
|
|||
|
Basic earnings per share
|
$
|
0.95
|
|
$
|
0.98
|
|
$
|
1.11
|
|
$
|
1.92
|
|
|||
|
Shares used to compute basic earnings per share
|
88,719
|
|
84,028
|
|
81,385
|
|
81,226
|
|
|||||||
|
Diluted earnings per share
|
$
|
0.94
|
|
$
|
0.98
|
|
$
|
1.11
|
|
$
|
1.91
|
|
|||
|
Shares used to compute diluted earnings per share
|
89,236
|
|
84,489
|
|
81,852
|
|
81,713
|
|
|||||||
|
First
Quarter
|
Second
Quarter
|
Third
Quarter
|
Fourth
Quarter
|
||||||||||||
|
(In thousands, except per share amounts)
|
|||||||||||||||
|
2012
|
|||||||||||||||
|
Net sales
|
$
|
711,704
|
|
$
|
684,894
|
|
$
|
661,226
|
|
$
|
687,596
|
|
|||
|
Gross profit
|
$
|
250,980
|
|
$
|
249,288
|
|
$
|
217,750
|
|
$
|
191,977
|
|
|||
|
Restructuring and other charges, net
(a)
|
$
|
—
|
|
$
|
94,703
|
|
$
|
—
|
|
$
|
16,982
|
|
|||
|
Net income attributable to Albemarle Corporation
|
$
|
114,262
|
|
$
|
50,089
|
|
$
|
109,459
|
|
$
|
37,726
|
|
|||
|
Basic earnings per share
|
$
|
1.28
|
|
$
|
0.56
|
|
$
|
1.23
|
|
$
|
0.42
|
|
|||
|
Shares used to compute basic earnings per share
|
88,997
|
|
89,414
|
|
89,327
|
|
89,018
|
|
|||||||
|
Diluted earnings per share
|
$
|
1.27
|
|
$
|
0.56
|
|
$
|
1.22
|
|
$
|
0.42
|
|
|||
|
Shares used to compute diluted earnings per share
|
89,947
|
|
90,051
|
|
89,879
|
|
89,660
|
|
|||||||
|
(a)
|
See Note 19, “Special Items.”
|
As discussed in Note 1, “Summary of Significant Accounting Policies,” actuarial gains and losses are recognized annually in our consolidated statements of income in the fourth quarter and whenever a plan is determined to qualify for a remeasurement during a fiscal year. See Note 17, “Pension Plans and Other Postretirement Benefits” for information about actuarial gains and losses recognized in our consolidated statements of income for the years ended
December 31, 2013
and
2012
.
99
|
Albemarle Corporation and Subsidiaries
|
||
|
Item 9.
|
Changes in and Disagreements with Accountants on Accounting and Financial Disclosure.
|
NONE
|
Item 9A.
|
Controls and Procedures.
|
Evaluation of Disclosure Controls and Procedures
Under the supervision and with the participation of our management, including our principal executive officer and principal financial officer, we conducted an evaluation of the effectiveness of the design and operation of our disclosure controls and procedures (as defined in Rules 13a-15(e) and 15d-15(e) under the Securities Exchange Act of 1934, as amended, or the Exchange Act) as of the end of the period covered by this report. Based on this evaluation, our principal executive officer and our principal financial officer concluded that, as of end of the period covered by this report, our disclosure controls and procedures are effective to ensure that information we are required to disclose in reports filed or submitted under the Exchange Act is recorded, processed, summarized and reported within the time periods specified in the SEC’s rules and forms, and that such information is accumulated and communicated to our management, including our principal executive officer and principal financial officer, as appropriate, to allow timely decisions regarding required disclosure.
Design and Evaluation of Internal Control over Financial Reporting
Our management is responsible for establishing and maintaining adequate internal control over financial reporting as defined in Exchange Act Rule 13a-15(f) and 15d-15(f). Our management assessed the effectiveness of our internal control over financial reporting as of
December 31, 2013
. In making this assessment, management used the criteria for effective internal control over financial reporting described in the “Internal Control-Integrated Framework” (1992) set forth by the Committee of Sponsoring Organizations of the Treadway Commission (COSO). Based on the assessment, management concluded that, as of
December 31, 2013
, our internal control over financial reporting was effective based on those criteria.
The effectiveness of our internal control over financial reporting as of
December 31, 2013
has been audited by PricewaterhouseCoopers LLP, an independent registered public accounting firm, as stated in their report, which is included herein. Management’s report and the independent registered public accounting firm’s report are included in Item 8 under the captions entitled “Management’s Report on Internal Control over Financial Reporting” and “Report of Independent Registered Public Accounting Firm” and are incorporated herein by reference.
Changes in Internal Control over Financial Reporting
No change in our internal control over financial reporting (as such term is defined in Exchange Act Rule 13a-15(f)) occurred during the fiscal quarter ended
December 31, 2013
that materially affected, or is reasonably likely to materially affect, our internal control over financial reporting.
|
Item 9B.
|
Other Information.
|
NONE
|
Item 10.
|
Directors, Executive Officers and Corporate Governance.
|
The information required by this Item 10 is contained in the Proxy Statement and is incorporated herein by reference. In addition, the information in “Executive Officers of the Registrant” appearing after Item 4 in Part I of this Annual Report, is incorporated herein.
Code of Business Conduct
We have adopted a code of business conduct and ethics for directors, officers and employees, known as the Albemarle Code of Business Conduct. The Albemarle Code of Business Conduct is available on our website at http://www.albemarle.com. Shareholders may also request a free copy of the Albemarle Code of Business Conduct from: Albemarle Corporation, Attention: Investor Relations, 451 Florida Street, Baton Rouge, Louisiana 70801. We will disclose any amendments to, or waivers from, a provision of our Code of Business Conduct that applies to the principal executive officer, principal financial officer, principal
100
|
Albemarle Corporation and Subsidiaries
|
||
accounting officer or controller, or persons performing similar functions that relates to any element of the Code of Business Conduct as defined in Item 406 of Regulation S-K by posting such information on our website.
New York Stock Exchange Certifications
Because our common stock is listed on the New York Stock Exchange (NYSE), our Chief Executive Officer is required to make, and he has made, an annual certification to the NYSE stating that he was not aware of any violation by us of the corporate governance listing standards of the NYSE. Our Chief Executive Officer made his annual certification to that effect to the NYSE as of
May 28, 2013
. In addition, we have filed, as exhibits to this Annual Report on Form 10-K, the certifications of our principal executive officer and principal financial officer required under Sections 906 and 302 of the Sarbanes Oxley Act of 2002 to be filed with the Securities and Exchange Commission regarding the quality of our public disclosure.
Additional information is contained in the Proxy Statement and is incorporated herein by reference.
|
Item 11.
|
Executive Compensation.
|
The information required by this Item 11 is contained in the Proxy Statement and is incorporated herein by reference.
|
Item 12.
|
Security Ownership of Certain Beneficial Owners and Management and Related Stockholder Matters.
|
The information required by this Item 12 is contained in the Proxy Statement and is incorporated herein by reference.
|
Item 13.
|
Certain Relationships and Related Transactions, and Director Independence.
|
The information required by this Item 13 is contained in the Proxy Statement and is incorporated herein by reference.
|
Item 14.
|
Principal Accountant Fees and Services.
|
The information required by this Item 14 is contained in the Proxy Statement and is incorporated herein by reference.
|
Item 15.
|
Exhibits and Financial Statement Schedules.
|
(a)(1) The following consolidated financial and informational statements of the registrant are included in Part II Item 8 on pages
53 to 99:
Management’s Report on Internal Control Over Financial Reporting
Report of Independent Registered Public Accounting Firm
Consolidated Balance Sheets as of
December 31, 2013
and
2012
Consolidated Statements of Income, Comprehensive Income, Changes in Equity and Cash Flows for the years ended
December 31, 2013
,
2012
and
2011
Notes to the Consolidated Financial Statements
(a)(2) No Financial Statement Schedules are provided in accordance with Item 15(a)(2) as the information is either not applicable, not required or has been furnished in the Consolidated Financial Statements or Notes thereto.
|
(a)(3)
|
Exhibits
|
||
|
The following documents are filed as exhibits to this Form 10-K pursuant to Item 601 of Regulation S-K:
|
|||
101
|
Albemarle Corporation and Subsidiaries
|
||
|
3.1
|
|
Amended and Restated Articles of Incorporation (including Amendment thereto) [filed as Exhibit 4.1 to the Company’s Registration Statement on Form S-3 (Registration No. 333-119723) and incorporated herein by reference].
|
|
|
3.2
|
|
Amended and Restated Bylaws of the registrant effective as of October 16, 2013 [filed as Exhibit 3.2 to the Company’s Quarterly Report on Form 10-Q for the quarter ended September 30, 2013 (No. 1-12658), and incorporated herein by reference].
|
|
|
4.1
|
|
Indenture, dated as of January 20, 2005, between the Company and The Bank of New York, as trustee [filed as Exhibit 4.1 to the Company’s Current Report on Form 8-K (No. 1-12658) filed on January 20, 2005, and incorporated herein by reference].
|
|
|
4.2
|
|
First Supplemental Indenture, dated as of January 20, 2005, between the Company and The Bank of New York, as trustee [filed as Exhibit 4.2 to the Company’s Current Report on Form 8-K (No. 1-12658) filed on January 20, 2005, and incorporated herein by reference].
|
|
|
4.3
|
|
Form of Global Security for the 5.10% Senior Notes due 2015 (included as Exhibit A to Exhibit 4.2 hereto).
|
|
|
4.4
|
|
Second Supplemental Indenture, dated as of December 10, 2010, between the Company and The Bank of New York Mellon Trust Company, N.A., as trustee [filed as Exhibit 4.2 to the Company’s Current Report on Form 8-K (No. 1-12658) filed on December 10, 2010, and incorporated herein by reference].
|
|
|
4.5
|
|
Form of Global Security for the 4.50% Senior Notes due 2020 [filed as Exhibit 4.3 to the Company’s Current Report on Form 8-K (No. 1-12658) filed on December 10, 2010, and incorporated herein by reference].
|
|
|
10.1
|
|
Credit Agreement, dated as of February 7, 2014, among Albemarle Corporation and Albemarle Global Finance Company SCA, as borrowers, and certain of the Company’s subsidiaries that from time to time become parties thereto, the several banks and other financial institutions as may from time to time become parties thereto, and Bank of America, N.A., as Administrative Agent, Swing Line Lender and L/C Issuer [filed as Exhibit 10.1 to the Company’s Current Report on Form 8-K (No. 1-12658) filed on February 7, 2014, and incorporated herein by reference].
|
|
|
10.2
|
|
2013 Stock Compensation and Deferral Election Plan for Non-Employee Directors of Albemarle Corporation [filed as Annex A to the Company’s definitive Proxy Statement on Schedule 14A (No. 1-12658) filed on March 28, 2013, and incorporated herein by reference].
|
|
|
10.3
|
|
Compensation Arrangement with Luther C. Kissam, IV, dated August 29, 2003 [filed as Exhibit 10.10 to the Company’s Annual Report on Form 10-K for the year ended December 31, 2005 (No. 1-12658), and incorporated herein by reference].
|
|
|
10.4
|
|
Albemarle Corporation 2003 Incentive Plan, adopted January 31, 2003 and approved by the shareholders on March 26, 2003 [filed as Annex A to the Company’s Definitive Proxy Statement on Schedule 14A (No. 1-12658) filed on February 26, 2003, and incorporated herein by reference].
|
|
|
10.5
|
|
First Amendment to the Albemarle Corporation 2003 Incentive Plan, dated as of December 13, 2006 [filed as Exhibit 10.3 to the Company’s Current Report on Form 8-K (No. 1-12658) filed on December 18, 2006, and incorporated herein by reference].
|
|
|
10.6
|
|
Albemarle Corporation Directors’ Deferred Compensation Plan, approved by shareholders on April 24, 1996 [filed as Exhibit 10.11 to the Company’s Annual Report on Form 10-K for the year ended December 31, 2003 (No. 1-12658), and incorporated herein by reference].
|
|
|
10.7
|
|
First Amendment to the Albemarle Corporation Directors’ Deferred Compensation Plan, dated as of December 13, 2006 [filed as Exhibit 10.7 to the Company’s Current Report on Form 8-K (No. 1-12658) filed on December 18, 2006, and incorporated herein by reference].
|
|
|
10.8
|
|
First Amendment to the Albemarle Corporation Directors’ Deferred Compensation Plan, dated as of May 13, 2009 [filed as Exhibit 10.36 to the Company’s Quarterly Report on Form 10-Q for the quarter ended June 30, 2009 (No. 1-12658), and incorporated herein by reference].
|
|
|
10.9
|
|
Form of Stock Option Agreement [filed as Exhibit 10.1 to the Company’s Current Report on Form 8-K (No. 1-12658), filed February 24, 2012, and incorporated herein by reference].
|
|
102
|
Albemarle Corporation and Subsidiaries
|
||
|
10.10
|
|
Form of Amendment to Outstanding Stock Option Agreements [filed as Exhibit 10.4 to the Company’s Current Report on Form 8-K (No. 1-12658) filed on December 18, 2006, and incorporated herein by reference].
|
|
|
10.11
|
|
Form of Restricted Stock Unit Agreement [filed as Exhibit 10.3 to the Company’s Current Report on Form 8-K (No. 1-12658), filed February 28, 2012, and incorporated herein by reference].
|
|
|
10.12
|
|
Form of Performance Stock Unit Agreement [filed as Exhibit 10.2 to the Company’s Current Report on Form 8-K (No. 1-12658), filed February 24, 2012, and incorporated herein by reference].
|
|
|
10.13
|
|
Notice of Performance Unit Award [filed as Exhibit 10.2 to the Company’s Current Report on Form 8-K (No. 1-12658) filed on February 25, 2013, and incorporated herein by reference].
|
|
|
10.14
|
|
Notice of Restricted Stock Unit Award [filed as Exhibit 10.3 to the Company’s Current Report on Form 8-K (No. 1-12658) filed on February 25, 2013, and incorporated herein by reference].
|
|
|
10.15
|
|
Notice of Option Grant [filed as Exhibit 10.1 to the Company’s Current Report on Form 8-K (No. 1-12658) filed on February 25, 2013, and incorporated herein by reference].
|
|
|
10.16
|
|
Form of Amendment to Outstanding Performance Unit Agreements [filed as Exhibit 10.5 to the Company’s Current Report on Form 8-K (No. 1-12658) filed on December 18, 2006, and incorporated herein by reference].
|
|
|
10.17
|
|
Amended and Restated Albemarle Corporation Supplemental Executive Retirement Plan, effective as of January 1, 2005 [filed as Exhibit 10.1 to the Company’s Current Report on Form 8-K (No. 1-12658) filed on December 14, 2005, and incorporated herein by reference].
|
|
|
10.18
|
|
Second Amendment to the Albemarle Corporation Supplemental Executive Retirement Plan, dated as of December 13, 2006 [filed as Exhibit 10.2 to the Company’s Current Report on Form 8-K (No. 1-12658) filed on December 18, 2006, and incorporated herein by reference].
|
|
|
10.19
|
|
Amended and Restated Albemarle Corporation Executive Deferred Compensation Plan, effective as of January 1, 2005 [filed as Exhibit 10.2 to the Company’s Current Report on Form 8-K (No. 1-12658) filed on December 14, 2005, and incorporated herein by reference].
|
|
|
10.20
|
|
First Amendment to the Albemarle Corporation Executive Deferred Compensation Plan, dated as of December 13, 2006 [filed as Exhibit 10.8 to the Company’s Current Report on Form 8-K (No. 1-12658) filed on December 18, 2006, and incorporated herein by reference].
|
|
|
10.21
|
|
2006 Stock Compensation Plan for Non-Employee Directors of Albemarle Corporation [filed as Exhibit 10.1 to the Company’s Current Report on Form 8-K (No. 1-12658) filed on April 20, 2006, and incorporated herein by reference].
|
|
|
10.22
|
|
Share Purchase Agreement, among Albemarle Corporation, Albemarle Overseas Development Corporation and International Chemical Investors, SA, dated August 31, 2006 [filed as Exhibit 10.1 to the Company’s Quarterly Report on Form 10-Q for the quarterly period ended September 30, 2006 (No. 1-12658), and incorporated herein by reference].
|
|
|
10.23
|
|
Form of Severance Compensation Agreement [filed as Exhibit 10.1 to the Company’s Current Report on Form 8-K (No. 1-12658) filed on December 12, 2011, and incorporated herein by reference].
|
|
|
10.24
|
|
Albemarle Corporation Severance Pay Plan, as revised effective as of December 13, 2006 [filed as Exhibit 10.6 to the Company’s Current Report on Form 8-K (No. 1-12658) filed on December 18, 2006, and incorporated herein by reference].
|
|
|
10.25
|
|
Amended and Restated Albemarle Corporation Benefits Protection Trust, effective as of December 13, 2006 [filed as Exhibit 10.9 to the Company’s Current Report on Form 8-K (No. 1-12658) filed on December 18, 2006, and incorporated herein by reference].
|
|
|
10.26
|
|
Albemarle Corporation 2008 Incentive Plan [filed as Annex A to the Company’s definitive Proxy Statement (No. 1-12658) filed on March 12, 2008, and incorporated herein by reference].
|
|
103
|
Albemarle Corporation and Subsidiaries
|
||
|
10.27
|
|
First Amendment to the Albemarle Corporation 2008 Incentive Plan [filed as Appendix A to the Company’s definitive Proxy Statement (No. 1-12658) filed on March 31, 2009, and incorporated herein by reference].
|
|
|
10.28
|
|
2008 Stock Compensation Plan for Non-Employee Directors of Albemarle Corporation [filed as Annex B to the Company’s definitive Proxy Statement (No. 1-12658) filed on March 12, 2008, and incorporated herein by reference].
|
|
|
10.29
|
|
Albemarle Corporation Employee Relocation Policy [filed as Exhibit 10.33 to the Company’s Quarterly Report on Form 10-Q for the quarter ended June 30, 2008 (No. 1-12658) filed on August 7, 2008, and incorporated herein by reference].
|
|
|
10.30
|
|
Albemarle Corporation 2008 Incentive Plan, as amended and restated as of April 20, 2010 [filed as Exhibit 10.1 to the Company’s Registration Statement on Form S-8 (No. 333-166828) filed on May 14, 2010, and incorporated herein by reference].
|
|
|
10.31
|
|
Second Amendment to the Albemarle Corporation 2008 Incentive Plan [filed as Appendix A to the Definitive Proxy Statement on Schedule 14A filed with the Commission on March 9, 2010 and incorporated herein by reference].
|
|
|
10.32
|
|
First Amendment to the Albemarle Corporation 2008 Stock Compensation Plan for Non-Employee Directors [filed as Appendix B to the Definitive Proxy Statement on Schedule 14A filed with the Commission on March 9, 2010 and incorporated herein by reference].
|
|
|
10.33
|
|
Second Amendment to the Albemarle Corporation Executive Deferred Compensation Plan, dated as of December 28, 2007 [filed as Exhibit 10.36 to the Company’s Form 10-K for the year ended December 31, 2012 (No. 1-12658), and incorporated herein by reference].
|
|
|
10.34
|
|
Third Amendment to the Albemarle Corporation Executive Deferred Compensation Plan, dated as of April 16, 2010 [filed as Exhibit 10.37 to the Company’s Form 10-K for the year ended December 31, 2012 (No. 1-12658), and incorporated herein by reference].
|
|
|
10.35
|
|
Fourth Amendment to the Albemarle Corporation Executive Deferred Compensation Plan, dated as of October 20, 2010 [filed as Exhibit 10.38 to the Company’s Form 10-K for the year ended December 31, 2012 (No. 1-12658), and incorporated herein by reference].
|
|
|
10.36
|
|
Fifth Amendment to the Albemarle Corporation Executive Deferred Compensation Plan, dated as of December 27, 2012 [filed as Exhibit 10.39 to the Company’s Form 10-K for the year ended December 31, 2012 (No. 1-12658), and incorporated herein by reference].
|
|
|
10.37
|
|
Second Amendment to the Albemarle Corporation Director’s Deferred Compensation Plan, dated as of December 12, 2012 [filed as Exhibit 10.40 to the Company’s Form 10-K for the year ended December 31, 2012 (No. 1-12658), and incorporated herein by reference].
|
|
|
*12.1
|
|
Statement of Computation of Ratio of Earnings to Fixed Charges.
|
|
|
*21.1
|
|
Subsidiaries of the Company.
|
|
|
*23.1
|
|
Consent of PricewaterhouseCoopers LLP.
|
|
|
*31.1
|
|
Certification of Chief Executive Officer pursuant to Rule 13a-15(e) and 15d-15(e) of the Securities Exchange Act, as amended.
|
|
|
*31.2
|
|
Certification of Chief Financial Officer pursuant to Rule 13a-15(e) and 15d-15(e) of the Securities Exchange Act, as amended.
|
|
|
*32.1
|
|
Certification of Chief Executive Officer pursuant to 18 U.S.C. 1350, as adopted pursuant to Section 906 of the Sarbanes-Oxley Act of 2002.
|
|
|
*32.2
|
|
Certification of Chief Financial Officer pursuant to 18 U.S.C. 1350, as adopted pursuant to Section 906 of the Sarbanes-Oxley Act of 2002.
|
|
|
*99.1
|
|
Five-Year Summary.
|
|
104
|
Albemarle Corporation and Subsidiaries
|
||
|
*101
|
|
Interactive Data Files (Annual Report on Form 10-K, for the fiscal year ended December 31, 2013, furnished in XBRL (eXtensible Business Reporting Language))
|
|
|
Attached as Exhibit 101 to this report are the following documents formatted in XBRL: (i) the Consolidated Statements of Income for the fiscal years ended December 31, 2013, 2012 and 2011, (ii) the Consolidated Statements of Comprehensive Income for the fiscal years ended December 31, 2013, 2012 and 2011, (iii) the Consolidated Balance Sheets at December 31, 2013 and 2012, (iv) the Consolidated Statements of Changes in Equity for the fiscal years ended December 31, 2013, 2012 and 2011, (v) the Consolidated Statements of Cash Flows for the fiscal years ended December 31, 2013, 2012 and 2011 and (vi) the Notes to Consolidated Financial Statements.
|
|||
|
*
|
Included with this filing.
|
105
|
Albemarle Corporation and Subsidiaries
|
||
SIGNATURES
Pursuant to the requirements of Section 13 or 15(d) of the Securities Exchange Act of 1934, the registrant has duly caused this report to be signed on its behalf by the undersigned thereunto duly authorized.
|
A
LBEMARLE
C
ORPORATION
(Registrant)
|
||
|
By:
|
/
S
/ L
UTHER
C. K
ISSAM
IV
|
|
|
(Luther C. Kissam IV)
|
||
|
President, Chief Executive Officer and Director
|
||
Dated:
February 25, 2014
Pursuant to the requirements of the Securities Exchange Act of 1934, this report has been signed below by the following persons on behalf of the registrant and in the capacities indicated as of
February 25, 2014
.
|
Signature
|
Title
|
|
|
/
S
/ L
UTHER
C. K
ISSAM
IV
|
President, Chief Executive Officer and Director (principal executive
|
|
|
(Luther C. Kissam IV)
|
officer)
|
|
|
/
S
/ S
COTT
A. T
OZIER
|
Senior Vice President, Chief Financial Officer and Chief Accounting Officer (principal financial and accounting officer)
|
|
|
(Scott A. Tozier)
|
||
|
/
S
/ W
ILLIAM
H. H
ERNANDEZ
|
Director
|
|
|
(William H. Hernandez)
|
||
|
/
S
/ J
OSEPH
M. M
AHADY
|
Director
|
|
|
(Joseph M. Mahady)
|
||
|
/
S
/ J
IM
W. N
OKES
|
Chairman of the Board
|
|
|
(Jim W. Nokes)
|
||
|
/
S
/ J
AMES
J. O’B
RIEN
|
Director
|
|
|
(James J. O’Brien)
|
||
|
/
S
/ B
ARRY
W. P
ERRY
|
Director
|
|
|
(Barry W. Perry)
|
||
|
/
S
/ J
OHN
S
HERMAN
, J
R
.
|
Director
|
|
|
(John Sherman, Jr.)
|
||
|
/
S
/ G
ERALD
A
.
S
TEINER
|
Director
|
|
|
(Gerald A. Steiner)
|
||
|
/
S
/ H
ARRIETT
T
EE
T
AGGART
|
Director
|
|
|
(Harriett Tee Taggart)
|
||
|
/
S
/ A
NNE
M. W
HITTEMORE
|
Director
|
|
|
(Anne M. Whittemore)
|
||
106
TABLE OF CONTENTS
Part IItem 1. BusinessItem 1A. Risk FactorsItem 1B. Unresolved Staff CommentsItem 2. PropertiesItem 3. Legal ProceedingsItem 4. Mine Safety DisclosuresPart IIItem 5. Market For The Registrant S Common Equity, Related Stockholder Matters and Issuer Purchases Of Equity SecuritiesItem 6. Selected Financial DataItem 7. Management S Discussion and Analysis Of Financial Condition and Results Of OperationsItem 7A. Quantitative and Qualitative Disclosures About Market RiskItem 8. Financial Statements and Supplementary DataNote 1 Summary Of Significant Accounting Policies:Note 2 Supplemental Cash Flow Information:Note 3 Earnings Per Share:Note 4 Other Accounts Receivable:Note 5 Inventories:Note 6 Other Current Assets:Note 7 Property, Plant and Equipment:Note 8 Investments:Note 9 Other Assets:Note 10 Goodwill and Other Intangibles:Note 11 Accrued Expenses:Note 12 Long-term Debt:Note 13 Other Noncurrent Liabilities:Note 14 Stock-based Compensation Expense:Note 15 Commitments and Contingencies:Note 16 Accumulated Other Comprehensive Income:Note 17 Pension Plans and Other Postretirement Benefits:Note 18 Income Taxes:Note 19 Special Items:Note 20 Fair Value Of Financial Instruments:Note 21 Fair Value Measurement:Note 22 Acquisitions:Note 23 Operating Segments and Geographic Area Information:Note 24 Quarterly Financial Summary (unaudited):Item 9. Changes in and Disagreements with Accountants on Accounting and Financial DisclosureItem 9A. Controls and ProceduresItem 9B. Other InformationPart IIIItem 10. Directors, Executive Officers and Corporate GovernanceItem 11. Executive CompensationItem 12. Security Ownership Of Certain Beneficial Owners and Management and Related Stockholder MattersItem 13. Certain Relationships and Related Transactions, and Director IndependenceItem 14. Principal Accountant Fees and ServicesPart IVItem 15. Exhibits and Financial Statement Schedules