UNITED STATES
SECURITIES AND EXCHANGE COMMISSION
WASHINGTON, DC 20549
FORM
20-F
|
|
|
REGISTRATION STATEMENT PURSUANT TO SECTION 12(b) or (g) OF THE SECURITIES EXCHANGE ACT OF 1934
|
|
OR
|
||
|
|
|
ANNUAL REPORT PURSUANT TO SECTION 13 OR 15(d) OF THE SECURITIES EXCHANGE ACT OF 1934 For the fiscal year ended December 31, 2019
|
|
OR
|
||
|
|
|
TRANSITION REPORT PURSUANT TO SECTION 13 OR 15(d) OF THE SECURITIES EXCHANGE ACT OF 1934
|
|
OR
|
||
|
|
|
SHELL COMPANY REPORT PURSUANT TO SECTION 13 OR 15(d) OF THE SECURITIES EXCHANGE ACT OF 1934 For the transition period from __________ to __________
|
Commission file number:
001-31269
(Exact name of Registrant as specified in its charter)
N/A
(Translation of Registrant's name into English)
(Jurisdiction of incorporation or organization)
(Address of principal executive office)
(Name, Telephone, Email and/or Facsimile number and Address of Company Contact Person)
Securities registered or to be registered pursuant to Section 12(b) of the Act.
|
|
Title of each class
|
Trading Symbol(s)
|
|
Name of each exchange on which registered
|
|
|
|
|
|
|
|
SIX Swiss Exchange
|
|
|
|
|
||||||
Securities registered or to be registered pursuant to Section 12(g) of the Act.
None
Securities for which there is a reporting obligation pursuant to Section 15(d) of the Act.
None
Indicate the number of outstanding shares of each of the issuer's classes of capital or common stock as of the close of the period covered by the annual report.
488,262,870
Indicate by check mark if the registrant is a well-known seasoned issuer, as defined in Rule 405 of the Securities Act. Yes
☐
No
☒
If this report is an annual or transition report, indicate by check mark if the registrant is not required to file reports pursuant to Section 13 or 15(d) of the Securities Exchange Act of 1934. Yes
☐
No
☒
Indicate by check mark whether the registrant (1) has filed all reports required to be filed by Section 13 or 15(d) of the Securities Exchange Act of 1934 during the preceding 12 months (or for such shorter period that the registrant was required to file such reports), and (2) has been subject to such filing requirements for the past 90 days.
Yes
☒
No
☐
Indicate by check mark whether the registrant has submitted electronically every Interactive Data File required to be submitted pursuant to Rule 405 of Regulation S-T (§ 232.405 of this chapter) during the preceding 12 months (or for such shorter period that the registrant was required to submit such files).
Yes
☒
No
☐
Indicate by check mark whether the registrant is a large accelerated filer, an accelerated filer, or a non-accelerated filer. See definition of "accelerated filer and large accelerated filer" in Rule 12b-2 of the Exchange Act. (Check one)
|
Large Accelerated Filer
|
☐
|
Accelerated Filer
|
☐
|
|
☒
|
Emerging Growth Company
|
|
If an emerging growth company that prepares its financial statements in accordance with U.S. GAAP, indicate by check mark if the registrant has elected not to use the extended period for complying with any new or revised financial accounting standards† provided pursuant to Section 13(a) of the Exchange Act.
☐
† The term "new or revised financial accounting standard" refers to any update issued by the Financial Accounting Standards Board to its Accounting Standards Codification after April 5, 2012.
Indicate by check mark which basis of accounting the registrant has used to prepare the financial statements included in this filing:
|
U.S. GAAP
|
☐
|
|
☒
|
Other
|
☐
|
|
as issued by the International Accounting Standards Board
|
|||||
If "Other" has been checked in response to the previous question, indicate by check mark which financial statement item the registrant has elected to follow. Item 17
☐
Item 18
☐
If this is an annual report, indicate by check mark whether the registrant is a shell company (as defined in Rule 12b-2 of the Exchange Act). Yes
☐
No
☒
|
INDEX
|
Page
|
|
|
Introduction and Use of Certain Terms
|
||
|
Market Information
|
||
|
Special Note About Forward-Looking Statements
|
||
|
PART I
|
||
|
Item 1.
|
Identity of Directors, Senior Management and Advisers
|
|
|
Item 2.
|
Offer Statistics and Expected Timetable
|
|
|
Item 3.
|
Key Information
|
|
|
Item 4.
|
Information on the Company
|
|
|
Item 4A.
|
Unresolved Staff Comments
|
|
|
Item 5.
|
Operating and Financial Review and Prospects
|
|
|
Item 6.
|
Directors, Senior Management and Employees
|
|
|
Item 7.
|
Major Shareholders and Related Party Transactions
|
|
|
Item 8.
|
Financial Information
|
|
|
Item 9.
|
The Offer and Listing
|
|
|
Item 10.
|
Additional Information
|
|
|
Item 11.
|
Quantitative and Qualitative Disclosures About Market Risk
|
|
|
Item 12.
|
Description of Securities Other than Equity Securities
|
|
|
PART II
|
||
|
Item 13.
|
Defaults, Dividend Arrearages and Delinquencies
|
|
|
Item 14.
|
Material Modifications to the Rights of Security Holders and Use of Proceeds
|
|
|
Item 15.
|
Controls and Procedures
|
|
|
Item 16A.
|
Audit Committee and Financial Expert
|
|
|
Item 16B.
|
Code of Ethics
|
|
|
Item 16C.
|
Principal Accountant Fees and Services
|
|
|
Item 16D.
|
Exemptions from the Listing Standards for Audit Committees
|
|
|
Item 16E.
|
Purchases of Equity Securities by the Issuer and Affiliated Purchasers
|
|
|
Item 16F.
|
Change in Registrant's Certifying Accountant
|
|
|
Item 16G.
|
Corporate Governance
|
|
|
Item 16H.
|
Mine Safety Disclosure
|
|
|
PART III
|
||
|
Item 17.
|
Financial Statements
|
|
|
Item 18.
|
Financial Statements
|
|
|
Item 19.
|
Exhibits
|
|
|
Consolidated Financial Statements of Alcon Inc.
|
||
INTRODUCTION AND USE OF CERTAIN TERMS
Alcon Inc. publishes Consolidated Financial Statements expressed in US dollars. Our Consolidated Financial Statements responsive to Item 18 of this Annual Report filed on Form 20-F with the US Securities and Exchange Commission (the "Annual Report") are prepared in accordance with International Financial Reporting Standards ("IFRS") as issued by the International Accounting Standards Board ("IASB"). "Item 5. Operating and Financial Review and Prospects", together with the sections on products in development and key development projects of our businesses (see "Item 4. Information on the Company—4.B. Business Overview"), constitute the Operating and Financial Review ("Rapport annuel"), as defined by the Swiss Code of Obligations.
Unless the context requires otherwise, the words "we", "our", "us", "Alcon", "Company" and similar words or phrases in this Annual Report refer to Alcon Inc. and its consolidated subsidiaries and the words "Novartis" and "Novartis Group" refer to Novartis AG and its consolidated affiliates. The term "Alcon Division" means the Alcon business as it was operated under Novartis. In this Annual Report, references to the "eye care market" are to the eye care market in which we participate, including the sale of ophthalmic surgical devices, contact lenses and ocular health products, but not including the sale of spectacles and prescription ophthalmic pharmaceutical products; references to "United States dollars", "US dollars", "USD" or "$" are to the lawful currency of the United States of America, and references to "CHF" are to Swiss francs, the lawful currency of Switzerland; references to "Latin America" are to Central and South America, including the Caribbean, unless the context otherwise requires; references to "associates" are to our employees; references to the "SEC" are to the US Securities and Exchange Commission, references to the "FDA" are to the US Food and Drug Administration, and references to "EMA" are to the European Medicines Agency, an agency of the EU; references to the "NYSE" are to the New York Stock Exchange; and references to the "SIX" are to the SIX Swiss Exchange; references to "AT-IOL" mean advanced technology intraocular lenses; and references to "Alcon shares" or "our shares" are to Alcon ordinary shares, nominal value CHF 0.04 per share.
All product names appearing in
italics
are trademarks owned by or licensed to Alcon or its subsidiaries. Product names identified by a "®" or a "™" are trademarks that are not owned by or licensed to Alcon or its subsidiaries and are the property of their respective owners.
MARKET INFORMATION
This Annual Report contains certain industry and market data that were obtained from third-party sources, such as industry surveys and industry publications, including, but not limited to, publications by Market Scope, GfK and Nielsen. This Annual Report also contains other industry and market data, including market sizing estimates, growth and other projections and information regarding our competitive position, prepared by our management on the basis of such industry sources and our management's knowledge of and experience in the industry and markets in which we operate (including management's estimates and assumptions relating to such industry and markets based on that knowledge). Our management has developed its knowledge of such industry and markets through its experience and participation in these markets.
In addition, industry surveys and industry publications generally state that the information they contain has been obtained from sources believed to be reliable but that the accuracy and completeness of such information is not guaranteed and that any projections they contain are based on a number of significant assumptions. Forecasts, projections and other forward-looking information obtained from these sources involve risks and uncertainties and are subject to change based on various factors, including those discussed in the section "Special Note About Forward-Looking Statements" below. You should not place undue reliance on these statements.
1
SPECIAL NOTE ABOUT FORWARD-LOOKING STATEMENTS
This Annual Report contains, and our officers and representatives may from time to time make, certain “forward-looking statements” withi
n the meaning of the safe harbor provisions of the US Private Securities Litigation Reform Act of 1995.
Forward-looking statements can be identified by words such as “anticipate,” “intend,” “commitment,” “look forward,” “maintain,” “plan,” “goal,” “seek,” “believe,” “project,” “estimate,” “expect,” “strategy,” “future,” “likely,” “may,” “should,” “will” and similar references to future periods. You should not place undue reliance on these statements.
Forward-looking statements are neither historical facts nor assurances of future performance. Instead, they are based only on Alcon’s current beliefs, expectations and assumptions regarding the future of its business, future plans and strategies, and other future conditions. Because forward-looking statements relate to the future, they are subject to inherent uncertainties and risks that are difficult to predict. Such forward-looking statements are subject to various risks and uncertainties facing Alcon, including:
|
▪
|
the commercial success of its products and its ability to maintain and strengthen its position in its markets;
|
|
▪
|
the success of its research and development efforts, including its ability to innovate to compete effectively;
|
|
▪
|
its success in completing and integrating strategic acquisitions;
|
|
▪
|
pricing pressure from changes in third party payor coverage and reimbursement methodologies;
|
|
▪
|
global economic, financial, legal, tax, political, and social change;
|
|
▪
|
ongoing industry consolidation;
|
|
▪
|
its ability to properly educate and train healthcare providers on its products;
|
|
▪
|
changes in inventory levels or buying patterns of its customers;
|
|
▪
|
disruption in its global supply chain or important facilities;
|
|
▪
|
ability to service its debt obligations;
|
|
▪
|
the uncertainty as to what interest rate benchmark will replace LIBOR;
|
|
▪
|
the need for additional financing through the issuance of debt or equity;
|
|
▪
|
its reliance on outsourcing key business functions;
|
|
▪
|
its ability to protect its intellectual property;
|
|
▪
|
the impact on unauthorized importation of its products from countries with lower prices to countries with higher prices;
|
|
▪
|
the effects of litigation, including product liability lawsuits, and governmental investigations;
|
|
▪
|
its ability to comply with all laws to which it may be subject;
|
|
▪
|
effect of product recalls or voluntary market withdrawals;
|
|
▪
|
data breaches or other disruptions of its information technology systems;
|
|
▪
|
the implementation of its enterprise resource planning system;
|
|
▪
|
its ability to attract and retain qualified personnel;
|
|
▪
|
the accuracy of its accounting estimates and assumptions, including pension plan obligations, the carrying value of intangible assets, and our separation and transformation programs cost;
|
|
▪
|
the ability to obtain regulatory clearance and approval of its products as well as compliance with any post-approval obligations, including quality control of its manufacturing;
|
|
▪
|
legislative and regulatory reform;
|
|
▪
|
the ability of Alcon Pharmaceuticals Ltd. to comply with its investment tax incentive agreement with the Swiss State Secretariat for Economic Affairs in Switzerland and the Canton of Fribourg, Switzerland;
|
|
▪
|
the impact of environmental, social, and governance matters;
|
|
▪
|
its ability to operate as a stand-alone company;
|
|
▪
|
whether the transitional services Novartis has agreed to provide Alcon are sufficient;
|
|
▪
|
the impact of being listed on two stock exchanges;
|
|
▪
|
the ability to declare and pay dividends;
|
|
▪
|
the different rights afforded to its shareholders as a Swiss corporation compared to a US corporation; and
|
|
▪
|
the effect of maintaining or losing its foreign private issuer status under US securities laws.
|
Some of these factors are discussed in more detail in this Annual Report, including under “Item 3. Key Information—3.D. Risk Factors”, “Item 4. Information on the Company” and “Item 5. Operating and Financial Review and Prospects”. Should one or more of these risks or uncertainties materialize, or should underlying assumptions prove incorrect, actual results may vary materially from those described in this Annual Report as anticipated, believed, estimated or expected. We provide the information in this Annual Report as of the date of its filing. We do not intend, and do not assume any obligation, to update any information or forward-looking statements set out in this Annual Report as a result of new information, future events or otherwise.
2
|
ITEM 1.
|
IDENTITY OF DIRECTORS, SENIOR MANAGEMENT AND ADVISERS
|
|
1.A.
|
DIRECTORS AND SENIOR MANAGEMENT
|
Not Applicable.
|
1.B.
|
ADVISERS
|
Not Applicable.
|
1.C.
|
AUDITORS
|
Not Applicable.
3
|
ITEM 2.
|
OFFER STATISTICS AND EXPECTED TIMETABLE
|
Not Applicable.
4
|
ITEM 3.
|
KEY INFORMATION
|
|
3.A.
|
SELECTED FINANCIAL DATA
|
The following selected financial data should be read together with the Consolidated Financial Statements and related Notes and "
Item 5. Operating and Financial Review and Prospects
".
The selected financial data in this section are not intended to replace the Consolidated Financial Statements and the related Notes. Our historical results could differ from those that would have resulted if we operated autonomously or as an entity independent of Novartis in the periods for which historical financial data is presented below prior to our spin-off from Novartis on April 9, 2019 ("Spin-off"), and such results are not necessarily indicative of the results that may be expected in the future.
For additional details regarding the preparation of the Consolidated Financial Statements, please see "
Item 5. Operating and Financial Review and Prospects
—
5.A. Operating Results
—Overview—Basis of Preparation", and "Note 2. Basis of Preparation" to the Consolidated Financial Statements.
The Consolidated Financial Statements are prepared in accordance with IFRS, as issued by the IASB.
Income statement data
|
($ millions except (loss)/earnings per share)
|
2019
|
|
2018
|
|
2017
|
|
2016
|
|
2015
|
|
|||||
|
Net sales to third parties
|
7,362
|
|
7,149
|
|
6,785
|
|
6,589
|
|
6,751
|
|
|||||
|
Net sales and other revenues
|
7,508
|
|
7,153
|
|
6,792
|
|
6,596
|
|
6,776
|
|
|||||
|
Operating (loss)/income
|
(187
|
)
|
(248
|
)
|
(77
|
)
|
10
|
|
417
|
|
|||||
|
Interest expense
|
(113
|
)
|
(24
|
)
|
(27
|
)
|
(31
|
)
|
(18
|
)
|
|||||
|
Other financial income & expense
|
(32
|
)
|
(28
|
)
|
(23
|
)
|
(92
|
)
|
(48
|
)
|
|||||
|
(Loss)/income before taxes
|
(332
|
)
|
(300
|
)
|
(127
|
)
|
(113
|
)
|
351
|
|
|||||
|
Taxes
|
(324
|
)
|
73
|
|
383
|
|
(57
|
)
|
(43
|
)
|
|||||
|
Net (loss)/income
|
(656
|
)
|
(227
|
)
|
256
|
|
(170
|
)
|
308
|
|
|||||
|
(Loss)/earnings per share
|
|||||||||||||||
|
Basic
|
(1.34
|
)
|
(0.46
|
)
|
0.52
|
|
(0.35
|
)
|
0.63
|
|
|||||
|
Diluted
|
(1.34
|
)
|
(0.46
|
)
|
0.52
|
|
(0.35
|
)
|
0.63
|
|
|||||
|
Weighted average number of shares outstanding (millions)
(1)
|
|||||||||||||||
|
Basic
|
488.2
|
|
488.2
|
|
488.2
|
|
488.2
|
|
488.2
|
|
|||||
|
Diluted
|
488.2
|
|
488.2
|
|
488.2
|
|
488.2
|
|
488.2
|
|
|||||
|
(1)
|
F
or periods prior to the Spin-off, the denominator for basic and diluted earnings per share was calculated using the
488.2 million
shares of common stock distributed in the Spin-off.
|
5
Balance sheet data
|
|
At December 31,
|
|||||||||||||
|
($ millions)
|
2019
|
|
2018
|
|
2017
|
|
2016
|
|
2015
|
|
||||
|
|
|
|
|
|
|
|
|
|||||||
|
Cash and cash equivalents
|
822
|
|
227
|
|
172
|
|
162
|
|
285
|
|
||||
|
Inventories
|
1,505
|
|
1,440
|
|
1,303
|
|
1,207
|
|
1,149
|
|
||||
|
Other current assets
|
1,909
|
|
1,732
|
|
1,812
|
|
1,650
|
|
1,540
|
|
||||
|
Non-current assets
|
23,419
|
|
23,663
|
|
24,101
|
|
24,721
|
|
25,228
|
|
||||
|
Total assets
|
27,655
|
|
27,062
|
|
27,388
|
|
27,740
|
|
28,202
|
|
||||
|
Trade payables
|
833
|
|
663
|
|
615
|
|
516
|
|
493
|
|
||||
|
Other current liabilities
|
1,467
|
|
1,230
|
|
1,163
|
|
1,149
|
|
1,150
|
|
||||
|
Non-current liabilities
|
6,052
|
|
2,530
|
|
2,581
|
|
3,063
|
|
2,922
|
|
||||
|
Total liabilities
|
8,352
|
|
4,423
|
|
4,359
|
|
4,728
|
|
4,565
|
|
||||
|
Equity
|
19,303
|
|
22,639
|
|
23,029
|
|
23,012
|
|
23,637
|
|
||||
|
Total equity and liabilities
|
27,655
|
|
27,062
|
|
27,388
|
|
27,740
|
|
28,202
|
|
||||
|
Net assets
|
19,303
|
|
22,639
|
|
23,029
|
|
23,012
|
|
23,637
|
|
||||
|
Outstanding share capital
|
20
|
|
—
|
|
—
|
|
—
|
|
—
|
|
||||
|
Total outstanding shares (millions)
(1)
|
488.3
|
|
488.2
|
|
488.2
|
|
488.2
|
|
488.2
|
|
||||
|
(1)
|
F
or periods prior to the Spin-off, the shares outstanding represent the
488.2 million
shares of common stock distributed in the Spin-off.
|
6
Exchange Rates
The following table shows, for the years and dates indicated, certain information concerning the rate of exchange of US dollar per Swiss franc based on exchange rate information found on Bloomberg Market System. The exchange rate in effect on February 21, 2020 as found on Bloomberg Market System was CHF 1.00 = USD 1.02.
|
($ per CHF)
|
Average
(1)
|
|
|
Year ended December 31, 2015
|
1.04
|
|
|
Year ended December 31, 2016
|
1.01
|
|
|
Year ended December 31, 2017
|
1.02
|
|
|
Year ended December 31, 2018
|
1.02
|
|
|
Year ended December 31, 2019
|
1.01
|
|
|
($ per CHF)
|
Low
(2)
|
|
High
(2)
|
|
|
|
January 2019
|
1.00
|
1.01
|
|||
|
February 2019
|
1.00
|
1.01
|
|||
|
March 2019
|
1.00
|
1.01
|
|||
|
April 2019
|
0.98
|
0.98
|
|||
|
May 2019
|
0.99
|
1.00
|
|||
|
June 2019
|
1.02
|
1.03
|
|||
|
July 2019
|
1.01
|
1.01
|
|||
|
August 2019
|
1.01
|
1.01
|
|||
|
September 2019
|
1.00
|
|
1.01
|
|
|
|
October 2019
|
1.01
|
|
1.01
|
|
|
|
November 2019
|
1.00
|
|
1.00
|
|
|
|
December 2019
|
1.03
|
|
1.04
|
|
|
|
January 2020
|
1.00
|
|
1.03
|
|
|
|
February 2020 (through February 21, 2020)
|
1.02
|
|
1.04
|
|
|
(1) Represents the average of the exchange rates on the last day of each month during the relevant time period.
(2) Represents the lowest and highest, respectively, of the exchange rates on the last day of each month during the year.
|
3.B.
|
|
Not Applicable.
|
3.C.
|
REASONS FOR THE OFFER AND USE OF PROCEEDS
|
Not applicable.
7
|
3.D.
|
RISK FACTORS
|
You should carefully consider the risks described below, together with all of the other information included in this Annual Report, in evaluating Alcon and our securities. The following risk factors could adversely affect our business, financial condition, results of operations and the price of our securities.
Risks Related to Our Business Generally
Our financial performance depends on the commercial success of our products and our ability to maintain our position in the markets in which we compete and to build and expand our markets.
Our financial performance depends heavily on the commercial success of our products. If any of our major products were to become subject to problems such as: decreases in growth rates for clinical procedures using our products; quality concerns; loss of intellectual property protection; pricing and reimbursement cuts; tax changes; supply chain issues or other product shortages; social or environmental concerns; regulatory actions; negative publicity affecting doctor, eye care professional or patient confidence in the product; unfavorable guidance from healthcare or other governmental agencies; material product liability litigation; pressure from new or existing competitive products; or if our products fail to meet consumer needs, the adverse impact on our revenue and profit could be significant. In addition, our revenue and profit could be significantly impacted by the timing and rate of commercial acceptance of our products.
The adverse impact on our results of operations from these factors could be compounded to the extent that we need to make significant additional investments such as in marketing and sales to counter these factors.
Furthermore, while we currently enjoy leading positions within our industry, our success highly depends on our ability to maintain or build on those leading positions. We continue to experience pressures across our businesses due to competitive activity, increased buying power of our healthcare industry customers and retail distributors, economic pressures experienced by the end-users of our vision care products, trade disputes among the countries in which we operate or sell our products, and the impact of managed care organizations and other third-party payors for our surgical products. These and other factors may adversely impact market sizes, as well as our position in the markets in which we compete, and the medical procedure volumes or average selling prices for our products.
Our financial performance also depends on our ability to successfully build and expand our markets. For example, while we currently expect our key markets to grow, particularly in multifocal contact lenses and AT-IOLs, the size of the markets in which we compete may not increase above existing levels, we may not be able to regain or gain market share, expand our market penetration or the size of the market for our products, or compete effectively, and the number of procedures in which our products are used may not increase above existing levels. Decreases in market sizes or our market share and declines in average selling prices or procedural volumes could materially adversely affect our results of operations or financial condition. Furthermore, our failure to expand our markets beyond existing levels could impact our ability to grow in line with or above current industry standards.
We operate in a highly competitive industry and if we fail to innovate, we may be unable to maintain our position in the markets in which we compete.
Our industry is highly competitive and, in both our surgical and vision care businesses, we face a mixture of competitors and intense competition from competitors' products. To compete effectively, we must continue to create, invest in, or acquire advanced technology, incorporate this technology into our proprietary products, obtain regulatory approvals in a timely manner where required, and manufacture and successfully market our products. We may experience design, manufacturing, marketing or other difficulties that could delay or prevent our development, introduction or marketing of new products or new versions of our existing products. As a result of such difficulties and delays, our development expenses may increase and, as a consequence, our results of operations could suffer. Our failure to respond to competitive pressures in a timely manner could have a material adverse effect on our business, financial condition and results of operations.
For example, in our surgical business, we face a mixture of competitors ranging from large manufacturers with multiple business lines to small manufacturers that offer a limited selection of specialized products. Development by other companies of new or improved products, processes, or technologies may make our products or proposed products less competitive or obsolete. We also face competition from providers of alternative medical therapies such as pharmaceutical companies that have the potential to disrupt core elements of our business. Competitive factors include:
|
▪
|
disruptive product technology;
|
|
▪
|
alternative treatment modalities;
|
|
▪
|
breadth of product lines and product services;
|
8
|
▪
|
ability to identify new market trends;
|
|
▪
|
acceptance of equipment and other products by ophthalmic surgeons;
|
|
▪
|
customer and clinical support;
|
|
▪
|
regulatory status and speed to market;
|
|
▪
|
price;
|
|
▪
|
product quality, reliability and performance;
|
|
▪
|
capacity to recruit engineers, scientists and other qualified associates;
|
|
▪
|
digital initiatives that change business models;
|
|
▪
|
reimbursement approval from governmental payors and private healthcare insurance providers; and
|
|
▪
|
reputation for technical leadership.
|
Shifts in industry market share can occur in connection with product issues, physician advisories, safety alerts, and publications about our products. In the current environment of managed care, consolidation among healthcare providers, increased competition and declining reimbursement rates, we are increasingly required to compete on the basis of price.
In addition, our vision care business operates within a highly competitive environment. In contact lenses, we face intense competition from competitors' products and may face increasing competition as other new products enter the market, for example with increased product entries from contact lens manufacturers in Asia. New market entrants and existing competitors are also challenging distribution models, with innovation in non-traditional, disruptive models such as direct-to-consumer, internet and other e-commerce sales opportunities, which could adversely impact the traditional eye care professional ("ECP") channel in which Alcon has a significant presence. Our major competitors in contact lenses offer competitive products and differentiated materials, plus a variety of other eye care products including ophthalmic pharmaceuticals, which may give them a competitive advantage in marketing their lenses. Our vision care business also competes with manufacturers of eyeglasses and providers of other forms of vision correction including ophthalmic surgery. The market for contact lenses is intensely competitive and is characterized by declining sales volumes for older and reusable product lines and growing demand for daily lenses and advanced materials lenses. As the market for contact lenses shifts toward daily lenses, we expect our sales in daily lenses to, at least in part, cannibalize sales of our reusable contact lenses and contact lens care offerings. Furthermore, our ocular health product category is also highly competitive. We cannot predict the timing or impact of the introduction of competitive products, including new market entries, "generic" versions of our approved products, or private label products that treat the same conditions as those of our products. In addition, the introduction of alternatives in medical devices and medical prescriptions could also alter the dry eye product market and impede our sales growth. Our ability to respond to these competitive pressures will depend on our ability to decrease our costs and maintain gross margins and operating results and to introduce new products successfully and on a timely basis, and to achieve manufacturing efficiencies and sufficient manufacturing capacity and capabilities for such products.
With respect to all of our other businesses, competitive pressures could decrease sales volumes for existing products or require us to decrease prices to respond to competitive pressures.
Our research and development efforts may not succeed in bringing new products to market, or may fail to do so in a cost-efficient manner, or in a manner sufficient to grow our business, replace lost revenue and income or take advantage of new technologies.
Our ability to continue to maintain and grow our business, to replace sales lost due to competition, and to bring to market products that take advantage of new and potentially disruptive technologies depends heavily on the success of our research and development activities. Our success relies on our ability to identify and successfully develop cost-effective new products that address unmet medical and consumer needs. To accomplish this, we commit substantial financial, human and capital resources to product research and development, both through our internal dedicated resources and through external investments, alliances, license arrangements, acquisitions and other transactions, which we collectively refer to as BD&L transactions. Developing and marketing new products involves a costly, lengthy and uncertain process. Even when our new product development projects make it to market, there have been, and in future may be, instances where projects are subsequently discontinued for technical, clinical, regulatory or commercial reasons. In spite of our investments, our research and development activities and external investments may not produce commercially successful new products that will enable us to replace income lost to our competitors or increase revenue to grow our business. We may not be able to successfully identify and obtain value from our external business development and strategic collaborative efforts. In addition, our new products may cannibalize a portion of the revenues we derive from existing products, therefore driving replacement revenue instead of incremental revenue.
Finally, even if we are able to secure regulatory approval and achieve initial commercial success of our products, our products may abruptly cease to be commercially viable due to the discovery of adverse health effects. See"—We may implement product recalls or voluntary market withdrawals of our products" below.
If we are unable to maintain a cost-effective flow of successful new products sufficient to maintain and grow our business, cover any sales erosion due to competition, and take advantage of market opportunities, this lack of innovation could have
9
a material adverse effect on our business, financial condition or results of operations. For a description of the government approval processes which must be followed to market our products, see "—Regulatory clearance and approval processes for our products are expensive, time-consuming and uncertain, and the failure to obtain and maintain required regulatory clearances and approvals could prevent us from commercializing our products" below and "Item 4. Information on the Company—4.B. Business Overview—Government Regulation".
Pricing pressure from changes in third-party payor coverage and reimbursement methodologies and potential regulatory price controls may adversely impact our ability to sell our products at prices necessary to support our current business strategy.
The prices, sales, and demand for some of our products, in particular our surgical products, could be adversely affected by the increased emphasis managed care organizations and governments continue to place on the delivery of more cost-effective medical therapies. For example, major third-party payors for hospital services, including government insurance programs, such as Medicare and Medicaid in the United States and certain private healthcare insurers, have substantially revised their payment methodologies during the last few years, resulting in stricter standards for, and lower levels of reimbursement of, hospital and outpatient charges for some clinical procedures. In addition, some third-party payors will not provide reimbursement for new products until we demonstrate the innovative value or improved patient outcome of the new product. If we are unable to demonstrate such innovative value or improved patient outcome, our products may not be eligible for reimbursement, which would severely impact our ability to grow the market for sales of those products. There have also been recent initiatives by third-party payors to challenge the prices charged for medical products. Physicians, eye care professionals and other healthcare providers may be reluctant to purchase our surgical products if they do not receive adequate reimbursement from third-party payors to cover the cost of those products and for procedures performed using those products. Reductions in the prices for our products in response to these trends could reduce our profit margins, which would adversely affect our ability to invest and grow our business.
Outside the US, governmental programs that typically reimburse at predetermined fixed rates may also decrease or otherwise limit amounts available through reimbursement. For example, in the EU, member states impose controls on whether products are reimbursable by national or regional health service providers and on the prices at which medical devices are reimbursed under state-run healthcare schemes. Some member states operate reference pricing systems in which they set national reimbursement prices by reference to those in other member states. Other governmental funding restrictions, legislative proposals and interpretations of policy may negatively impact amounts available through reimbursement, including by restricting payment increases to hospitals and other providers through reimbursement systems, or by restricting whether reimbursement is available for our products at all.
We expect that additional health care reform measures will be adopted in the future in the countries in which we operate, including those initiatives affecting coverage and reimbursement for our products, any of which could limit the amounts that governments will pay for health care products and services, which could adversely affect the growth of the market for our products or the demand for our products, or result in additional pricing pressures. We cannot predict the effect such reforms or the prospect of their enactment may have on our business.
Finally, the implementation of government price controls on our products or product categories in the jurisdictions in which we operate, or to which we may intend to expand in the future, could adversely affect the revenue we could obtain from sales of our products. For example, in India, the National Pharmaceutical Pricing Authority ("NPPA") controls the prices of drugs and medical devices listed under the National List of Essential Medicines and in 2017 imposed 75% to 85% price reductions on coronary stents (implantable medical devices intended to ensure an adequate flow of blood to the heart). The NPPA has begun to evaluate prices on other categories of medical devices, potentially including IOLs used in cataract surgeries. If the NPPA chooses to impose similar price reductions on IOLs from Alcon, this could have a negative impact on our surgical sales in India. It is also possible that regulatory agencies in other countries may consider similar or comparable price controls on our eye care products in the future, which could have an adverse impact on our business, financial condition and results of operations.
The unstable economic and financial environment in many countries and increasing global political and social instability may adversely impact our business.
We sell our products in more than 140 countries. As a result, local and regional economic and financial environments throughout the world influence and affect our results of operations and business.
Unpredictable political conditions currently exist in various parts of the world, including a backlash in certain areas against free trade, anti-immigrant sentiment, social unrest, a refugee crisis, terrorism and the risk of direct conflicts between nations. In addition, the current trade environment is extremely volatile, including the imposition of trade tariffs, trade or economic sanctions, or other restrictions. Changes in trade policy vis-à-vis countries that we operate in could affect our ability to and/or the cost of doing business in such countries. For example, we expect that the ongoing trade disputes between the United States and China and Russia, respectively, could potentially have an adverse effect on the export of our surgical equipment to either or both countries. In the United States, the current presidential administration's opposition to free trade agreements
10
could cause barriers to be raised to international trade, and the elimination of the Affordable Care Act's individual mandate could have a negative impact on individuals' ability to afford health insurance. Similarly, following the UK's "Brexit" vote and with the rise of nationalist, separatist and populist sentiment in various countries, there is a risk that barriers to free trade and the free movement of people may rise in Europe. As we have a sizable commercial presence in the UK, the uncertainty surrounding the implementation and effect of "Brexit" may impact our business in the UK and the rest of Europe, including our costs and the distribution of our products in those markets. Further, significant conflicts continue in parts of the Middle East, including conflicts involving Saudi Arabia and Iran, and with respect to places such as North Korea. Collectively, such difficult conditions could, among other things, disturb the international flow of goods and increase the costs and difficulties of international transactions.
In addition, local economic conditions may adversely affect the ability of payors, as well as our distributors, customers, suppliers and service providers, to pay for our products, or otherwise to buy necessary inventory or raw materials, and to perform their obligations under agreements with us. Although we make efforts to monitor these third parties' financial condition and their liquidity, our ability to do so is limited, and some of them may become unable to pay their bills in a timely manner, or may even become insolvent, which could negatively impact our business and results of operations. These risks may be elevated with respect to our interactions with fiscally-challenged government payors, or with third parties with substantial exposure to such payors. For example, we have significant outstanding receivable balances that are dependent upon either direct or indirect payment by various governmental and non-governmental entities across the world. The ultimate payment of these receivables is dependent on the ability of these governments to maintain liquidity primarily through borrowing capacity, particularly in the EU. If certain governments are not able to maintain access to liquidity through borrowing capacity, the ultimate payment of their respective portion of outstanding receivables could be at risk and impact profits and cash flow.
Economic conditions in our markets may also deteriorate due to epidemics or pandemics; natural and man-made disasters, including climatic events (including any potential effect of climate change), acts of war or terrorism, political unrest, fires or explosions; and other external factors over which we have no control. For example, an outbreak of a recent strain of coronavirus in China has resulted in thousands of cases in China and continues to spread in China and to other countries. As the Chinese government continues its attempts to contain the coronavirus by restricting the movement of goods and people in China, our business operations and ability to sell our products to customers and patients in China will be adversely impacted. In addition, if the coronavirus continues to spread outside of China, our activities worldwide could be adversely affected. These disruptions to our business could materially, adversely affect our revenues, financial condition, profitability, and cash flows. While we believe the coronavirus outbreak will have some negative impact on our near-term financial results as a result of a decline in surgical procedures and customer demand, the longer-term impact is difficult to assess or predict at this time.
To the extent that economic and financial conditions directly affect consumers, some of our businesses, including the elective surgical and contact lens businesses, may be particularly sensitive to declines in consumer spending, as the costs of elective surgical procedures and discretionary purchases of contact lenses are typically borne by individuals with limited reimbursement from their medical insurance providers or government programs. For example, while cataract surgery involving our monofocal IOLs is generally fully covered by medical insurance providers or government reimbursement programs, implantation of certain of our AT-IOL products may only be partially covered, with the individual paying out-of-pocket for the non-covered component. Accordingly, individuals may be less willing to incur the costs of these private pay or discretionary procedures or purchases in weak or uncertain economic conditions and may elect to forgo such procedures or products or to trade down to more affordable options.
Significant breaches of data security or disruptions of information technology systems and the use of Internet, social media and mobile technologies could adversely affect our business and expose people's personal information.
We are heavily dependent on critical, complex and interdependent information technology systems, including Internet-based systems, to support our business processes. In addition, Alcon and our associates rely on the Internet, social media tools, and mobile technologies as a means of communication and to gather information, which can include people's personal information. We are also increasingly seeking to develop technology-based products to improve patient welfare in a variety of ways, which could also result in us gathering personal information about patients and others electronically.
The size and complexity of these information technology systems, and, in some instances, their age, make them potentially vulnerable to external or internal security incidents, breakdowns, power outages, malicious intrusions, cybercrimes, including state-sponsored cybercrimes, malware, misplaced or lost data, programming or human errors, or other similar events. Furthermore, because cyber-threats continue to evolve, it is becoming increasingly difficult to detect and successfully defend against them. Consequently, there is a risk that a breach remains undetected for a period of time.
We also currently rely on a number of older legacy information systems that are increasingly harder to maintain as we began implementing our new ERP system. By attempting to implement new systems while maintaining the legacy systems, we may be unable to integrate all of our systems to work together. See the risk factor "-We may experience difficulties implementing our new enterprise resource planning system" below for more details on our ongoing implementation of a new ERP system.
11
Like many companies, we have experienced certain adverse incidents and expect to continue to experience them in the future and, as the external cyber-attack threat only keeps growing, we may not be able to prevent future breakdowns or breaches in our systems and we may not be able to prevent such events from having a material adverse effect on our business, financial condition, results of operations or reputation. Our risks are heightened because we are heavily reliant on our former parent company for operating and maintaining much of our information technology infrastructure until we are able to fully migrate our data and processes onto our own system. We must rely on our former parent company to invest in the latest security capabilities to protect our systems from threats and disruptions.
Any disruptive event could negatively impact important business processes, such as the conduct of scientific research and clinical trials, the submission of the results of such efforts to health authorities in support of requests for product approvals, the functioning of our manufacturing and supply chain processes, our compliance with legal obligations and our other key business activities, including our associates' ability to communicate with one another and with third parties. Such potential information technology issues could also lead to the loss of important information such as trade secrets or other intellectual property and could accelerate the development or manufacturing of competing products by third parties. Furthermore, malfunctions in software or in devices that make significant use of information technology, including our surgical equipment, could lead to a risk of harm to patients.
In addition, our routine business operations, including through the use of information technologies such as the Internet, social media, mobile technologies, and technology-based medical devices like our surgical equipment, also increasingly involve our gathering personal information (including sensitive personal information) about patients, vendors, customers, associates, collaborators and others. Breaches of our systems or those of our third-party contractors, or other failures to protect such information, could expose such people's personal information to unauthorized persons. Any such event could give rise to significant potential liability and reputational harm, including potentially substantial monetary penalties. We also make significant efforts to ensure that any international transfers of personal data are done in compliance with applicable law. We are subject to certain privacy laws, including Swiss privacy laws, the EU's General Data Protection Regulation and the California Consumer Privacy Act, which include operational and compliance requirements that are different than those previously in place and also includes significant penalties for non-compliance. Failure to comply with these laws could lead to significant liability. In addition, any additional restraints that may be placed on our ability to transfer such data could have a material adverse effect on our business, financial condition, results of operations and reputation.
We also use Internet, social media and mobile tools as a means to communicate with the public, including about our products or about the diseases our products are intended to treat. However, such uses create risks, such as the loss of trade secrets or other intellectual property. In addition, there continue to be significant uncertainties as to the rules and regulations that apply to such communications, and as to the interpretations that health authorities will apply in this context to the rules that do exist. As a result, despite our efforts to comply with applicable rules and regulations, there is a significant risk that our use of Internet, social media and mobile technologies for such purposes may cause us to nonetheless be found in violation of them.
Breaches of data security, technology disruptions, privacy violations, or similar issues could cause the loss of trade secrets or other intellectual property, expose personal information, interrupt our operations, all of which could result in enforcement actions or liability, including potential government fines, claims for damages, and shareholders' litigation. Any such events could require us to expend significant resources beyond those we already invest to further modify or enhance our protective measures, to remediate any damage, and to enable the continuity of our business.
We may experience difficulties implementing our new enterprise resource planning system.
We are engaged in a multi-year implementation of a new ERP system across our global commercial and manufacturing operations, which is intended to enhance and streamline our existing ERP system. ERP implementations are inherently complex and time-consuming projects that involve substantial expenditures on system software, implementation activities and business process reengineering. Any significant disruption or deficiency in the design and implementation of our new ERP system could adversely affect our ability to process orders, ship our products, provide services and customer support, fulfill contractual obligations or otherwise operate our business. For additional information, see "Item 4. Information on the Company—4.A. History and Development of the Company—Significant Acquisitions, Dispositions and other Events".
Financial markets, including inflation and volatile exchange rates, are unpredictable.
Financial market issues may also adversely affect our earnings, the return on our financial investments and the value of some of our assets. For example, inflation could accelerate, which could lead to higher interest rates, increasing our costs of raising capital. Uncertainties around future central bank and other economic policies in the United States and EU, as well as high debt levels in certain other countries, could also impact world trade. Sudden increases in economic, currency or financial market volatility in different countries have also impacted, and may continue to unpredictably impact, our business and results of operations, including the value of our investments in our pension plans. See also "—We may be underestimating our future pension plan obligations" below.
12
Changes in exchange rates between the US dollar, our reporting currency, and other currencies can also result in significant increases or decreases in our reported sales, costs and earnings as expressed in US dollars, and in the reported value of our assets, liabilities and cash flows. Despite any measures we may undertake in the future to reduce, or hedge against, foreign currency exchange risks, because a significant portion of our earnings and expenditures are in currencies other than the US dollar, and the fact that our expenditures in Swiss francs and US dollars are significantly higher than our revenue in Swiss francs and US dollars, respectively, any such exchange rate volatility may negatively and materially impact our business, results of operations and financial condition, and may impact the reported value of our net sales, earnings, assets and liabilities. The timing and extent of such volatility can be difficult to predict. Further, depending on the movements of particular foreign exchange rates, we may be materially adversely affected at a time when the same currency movements are benefiting some of our competitors. For more information on the effects of currency fluctuations on our Consolidated Financial Statements and on how we manage currency risk, see "Item 5. Operating and Financial Review and Prospects—5.A. Operating Results—Effects of Currency Fluctuations" and "Item 11. Quantitative and Qualitative Disclosures About Market Risk".
Countries facing financial difficulties, including countries experiencing high inflation rates and highly indebted countries facing large capital outflows, may impose controls on the exchange of foreign currency. Such exchange controls could limit our ability to distribute retained earnings from our local affiliates, or to pay intercompany payables due from those countries.
Ongoing consolidation among distributors, retailers and healthcare provider organizations could increase both the purchasing leverage of key customers and the concentration of credit risk.
Increasingly, a significant portion of our global sales are made to a relatively small number of distributors, retail chains and other purchasing organizations, as consolidation and vertical integration have the potential to disrupt existing channels. The recent trend, which is present globally including in the United States (our largest market), has been toward further consolidation among distributors, retailers and other eye care industry customers, such as eye care professionals, including through the acquisition of consolidated ophthalmology practices by private equity and other venture fund investors. As a result, our customers are gaining additional purchasing leverage, which increases the pricing pressures facing our businesses.
In our surgical business, healthcare providers, physician practices, hospitals, and surgery centers around the world continue to consolidate in response to declining reimbursement rates and intensifying pressure to reduce healthcare delivery expenses. This consolidation is increasing the ability of large groups to negotiate price, accelerating the transition of the decision maker from physicians to cost-focused professional buyers, and potentially increasing price transparency or price referencing in instances of consolidation across borders. Such consolidation in the surgical market adds considerable downward pricing pressure to our product sales and margins.
In vision care, private label growth and retailer-branded lenses may drive the commoditization of contact lenses and further boost the bargaining power of our distributors and retailers. Moreover, we could become exposed to a concentration of credit risk as a result of any such concentration among our customers. If our customers consolidate and one or more of our major customers experienced financial difficulties, the effect on us would be substantially greater than in the past, and could include a substantial loss of sales and an inability to collect amounts owed to us.
If we fail to properly educate and train healthcare providers on our products, then customers may not buy our products.
We market our surgical products to healthcare providers, including ECPs, public and private hospitals, ambulatory surgical centers, eye clinics and ophthalmic surgeons' offices and group purchasing organizations and our vision care products to retailers and distributors. We have developed, and strive to maintain, strong relationships with members of each of these groups who assist in product research and development and advise us on how to satisfy the full range of consumer and surgeon needs. We rely on these groups to recommend our products to their patients and to other members of their organizations.
Contact lens and lens care consumers have a tendency not to switch products regularly and are repeat consumers. As a result, the success of these products relies on an ECP’s initial recommendation of our products, which may be based on our ability to educate the ECP on our products. Even if we are successful at educating ECPs on our products, ECPs may continue to lose influence in the consumer's selection of contact lenses, which would cause our business to become more dependent upon the success of educating consumers directly. If we had to increase our direct-to-consumer marketing, we could potentially face challenges in maintaining our good relationships with ECPs, who may view our direct-to-consumer marketing as a threat to their business.
In our surgical business, ophthalmic surgeons play a significant role in determining the course of treatment and, ultimately, the type of products that will be used to treat a patient for cataracts, vitreoretinal conditions, refractive errors and glaucoma, among other things. As a result, it is important for us to properly and effectively market our surgical products to surgeons. Acceptance of our surgical products also depends on our ability to train ophthalmic surgeons and their clinical staff on the safe and appropriate use of our products, which takes time. This training process may take longer than expected and may therefore affect our ability to increase sales. Following completion of training, we rely on the trained ophthalmic surgeons to advocate the benefits of our products in the broader marketplace. Convincing ophthalmic surgeons to dedicate the time and energy necessary for adequate training is challenging, and we may not be successful in these efforts. If we are not
13
successful in convincing ophthalmic surgeons of the merits of our products or educating them on the use of our products, they may not use our products and we will be unable to fully commercialize or profit from such products.
Our inability to forecast demand accurately may adversely affect our sales and earnings and add to sales variability from quarter to quarter.
We balance the need to maintain inventory levels that are sufficient to ensure competitive lead times against the risk of inventory obsolescence because of changing customer requirements, fluctuating commodity prices, changes to our products, product transfers or the life cycle of our products. To successfully manage our inventories, we must estimate demand from our customers and produce products in sufficient quantity that substantially correspond to that demand. If we fail to adequately forecast demand for any product, or fail to determine the optimal product mix for production purposes, we may face production capacity issues in manufacturing sufficient quantities of a given product, such as our IOLs, daily contact lenses or certain ocular health products. In addition, failures in our information technology systems, issues created by the implementation of our new enterprise resource planning ("ERP") system or human error could also lead to inadequate forecasting of our overall demand or product mix.
As the number of unique products (SKUs) we offer grows, particularly an increasing number of IOL and contact lens styles with varying diopters, the demand forecasting precision required for us to avoid production capacity issues will also increase. Accordingly, the continued proliferation of unique SKUs in our surgical and vision care portfolios could increase the risk of product unavailability and lost sales. Moreover, an increasing number of SKUs could increase global inventory requirements, especially for consigned products such as IOLs, negatively impacting our working capital performance and leading to write-offs due to obsolescence and expired products.
Compounding the risk of inaccurate forecasts, the manufacturing process for our products have lengthy lead times to acquire and install new equipment and product lines to ramp up production. Thus, if we fail to adequately forecast demand, then we may be unable to scale production in a timely manner to meet unexpected higher demand. For example, in 2016, we experienced shortfalls in our inventory that resulted in a temporary disruption in our ability to timely deliver sufficient amounts of our IOL products in the US, which had an adverse impact on our business and reputation.
In addition, the manufacturing process for our products is technically complex (such as sterile products that require sophisticated environmental controls), which heightens the risk of production failures. As a result, as the chance of production failures and lengthy supply interruptions is increased, the risk of inadequate supply increases.
Finally, a significant portion of our vision care products are sold to major healthcare distributors and major retail chains in the United States. Consequently, our sales and quarterly growth comparisons, as well as our estimates for required inventory levels, may be affected by fluctuations in the buying patterns of such buyers. These fluctuations may result from seasonality, pricing, a recall of a competitor’s product, large retailers' and distributors' buying decisions or other factors. If we overestimate demand and produce too much of a particular product, we face a risk of inventory obsolescence, leaving us with inventory that we cannot sell profitably or at all. By contrast, if we underestimate demand and produce insufficient quantities of a product, we could be forced to choose between producing additional unexpected quantities of that product at a higher price or foregoing sales.
Disruptions in our global supply chain or important facilities could cause production interruptions, delays and inefficiencies.
We are engaged in manufacturing and sourcing of products and materials on a global scale. Our operations and those of our suppliers could be disrupted by a number of factors, including: disruptions in logistics; strikes and other labor disputes; loss or impairment of key manufacturing sites; loss of key suppliers; supplier capacity constraints; raw material and product quality or safety issues; industrial accidents or other occupational health and safety issues; the impact on our suppliers of tighter credit or capital markets; epidemics and pandemics; and natural and man-made disasters, including climatic events (including any potential effect of climate change), acts of war or terrorism, political unrest, fires or explosions and other external factors over which we have no control.
In addition, we single-source or rely on limited sources of supply for many components, raw materials and production services, such as sterilization, used in the production of our products. The loss of one of these suppliers or the inability of any such supplier to meet performance and quality specifications, requested quantities or delivery schedules could cause our sales and profitability to decline and have a negative impact on our customer relations. For example, some of our products and product components are sterilized using ethylene oxide (“EtO”), which we purchase from large-scale suppliers. Recent concerns about the impact of EtO on the environment when released at unsafe levels have led to regulatory enforcement activities against EtO suppliers, including closures of their facilities. Any facility closures or disruption to the operations of these EtO suppliers could delay or prevent our ability to commercialize our products and lead to product backorders for our customers, which could have a materially negative impact on our sales and profitability. In addition, any regulatory enforcement activities against us for our use of EtO could result in financial, legal, business, and reputational harm to us. Moreover, a price increase from a supplier where we do not have a supply alternative could cause our profitability to decline if we cannot increase our prices to our customers. To ensure sufficient supply, we may determine that we need to provide financing to some of our single-source suppliers, which could increase our financial exposure to such suppliers.
14
Finally, in some cases, we manufacture our products at a single manufacturing facility. In many cases, regulatory approvals of our products are limited to a specifically approved manufacturing facility. If we fail to produce enough of a product at a facility, or if our manufacturing process at that facility is disrupted, we may be unable to deliver that product to our customers on a timely basis. Problems may arise during the manufacturing process for a variety of reasons, including technical, labor or other difficulties, equipment malfunction, contamination, failure to follow specific protocols and procedures, destruction of or damage to any facility (as a result of a natural or man-made disaster, use and storage of hazardous materials or other events) or other reasons. In the event of a quality control issue, we may voluntarily, or our regulators may require us to, close a facility indefinitely. If any such problems arise, we may be unable to purchase substitute products from third-party manufacturers to make up any resulting shortfall in the production of a product, as such third-party manufacturers may only exist in limited numbers or appropriate substitutes may not be available. This risk is particularly relevant with respect to products for which we represent a substantial portion of the market, such as vitreoretinal equipment and other vitreoretinal-related products. A failure to deliver products on a timely basis could lead to customer dissatisfaction and damage to our reputation. Significant delays in the delivery of our products or a delay in the delivery of a key product could also negatively impact our sales and profitability.
Our existing debt may limit our flexibility to operate our business or adversely affect our business and our liquidity position.
We incurred $3.5 billion in total indebtedness in connection with the Spin-off. In addition, we may incur additional indebtedness in the future for various reasons, including fluctuations in operating results, capital expenditures and potential acquisitions. Our existing (and any future) debt requires us to dedicate a portion of our cash flows to service interest and principal payments and, if interest rates rise, this amount may increase.
Our indebtedness may:
|
▪
|
make it difficult for us to satisfy our obligations, including making interest payments on our debt obligations;
|
|
▪
|
require us to dedicate a portion of our cash flows to payments on our debt, reducing our ability to use our cash flows to fund capital expenditures, BD&L or other strategic transactions, working capital and other general operational requirements, or to pay dividends to our shareholders;
|
|
▪
|
limit our flexibility to plan for and react to changes in our business;
|
|
▪
|
negatively impact our credit rating and increase the cost of servicing our debt;
|
|
▪
|
place us at a competitive disadvantage relative to some of our competitors that have less debt than us;
|
|
▪
|
increase our vulnerability to general adverse economic and industry conditions, including changes in interest rates or a downturn in our business or the economy; and
|
|
▪
|
make it difficult to refinance our existing debt or incur new debt on terms that we would consider to be commercially reasonable, if at all.
|
The occurrence of any one of these events could have a material adverse effect on our business, financial condition or result of operations or cause a significant decrease in our liquidity and impair our ability to pay amounts due on our indebtedness.
Certain debt under our Facilities Agreement has a variable interest rate based on LIBOR.
On March 6, 2019, we entered into a $0.8 billion unsecured five-year term loan facility ("Facility B") and a $1.0 billion unsecured five-year committed multicurrency revolving credit facility (the "Revolving Facility”). The Revolving Facility was undrawn as of December 31, 2019. Facility B bears an interest rate equal to the interest rate benchmark (USD prevailing London Interbank Offered Rate (“LIBOR”)), plus an applicable margin.
On July 27, 2017, the UK’s Financial Conduct Authority, which regulates LIBOR, announced that it intends to stop persuading or compelling banks to submit rates for the calculation of LIBOR after 2021. The announcement indicates that the continuation of LIBOR on the current basis cannot and will not be guaranteed after 2021. It is impossible to predict whether and to what extent banks will continue to provide LIBOR submissions to the administrator of LIBOR, whether LIBOR rates will cease to be published or supported before or after 2021 or whether any additional reforms to LIBOR may be enacted in the UK or elsewhere.
Our Facilities Agreement provides for an alternative reference rate in the event LIBOR is discontinued. The alternative reference rate is based on the rate for which each of three reference banks could fund itself in USD for the relevant period with reference to the unsecured wholesale funding market. This alternative reference rate may perform differently than LIBOR for a number of reasons, including the fact that LIBOR is calculated using a greater number of participating banks. As a result, we may incur significant costs to transition our borrowing arrangements from LIBOR, which may have an adverse effect on our results of operations.
15
We may need to obtain additional financing which may not be available or, if it is available, may not be on favorable terms and may result in a reduction in the percentage ownership of our then-existing shareholders.
We may need to raise additional funds to:
|
▪
|
finance unanticipated working capital requirements or refinance our existing indebtedness;
|
|
▪
|
develop or enhance our infrastructure and our existing products and services;
|
|
▪
|
engage in mergers and acquisitions or strategic BD&L transactions;
|
|
▪
|
fund strategic relationships; and
|
|
▪
|
respond to competitive pressures.
|
If we raise additional funds by issuing equity or convertible debt securities, the percentage ownership of our then-existing shareholders may be diluted, and holders of these securities may have rights, preferences or privileges senior to those of our then-existing shareholders.
Our reliance on outsourcing key business functions to third parties heightens the risks faced by our businesses.
We outsource the performance of certain key business functions to third parties, and invest a significant amount of effort and resources into doing so. Such outsourced functions can include research and development collaborations, clinical trial activities, manufacturing operations, human resources, warehousing and distribution activities, certain finance functions, submission of regulatory applications, marketing activities, data management and others. Outsourcing of services to third parties could expose us to suboptimal quality of service delivery or deliverables and potentially result in repercussions such as missed deadlines or other timeliness issues, erroneous data, supply disruptions, non-compliance (including with applicable legal or regulatory requirements and industry standards) and/or reputational harm, with potential negative effects on our results.
For example, some of our products are manufactured or assembled fully or in part by third parties under contract. Business conditions and regulatory actions may lead to recalls of products assembled or manufactured by these companies over which we have no control, may result in delays in shipments of such products or may cause these contractors to abandon their contract manufacturing agreements. Also, in many developing countries, we rely heavily on third party distributors and other agents for the sales, marketing and distribution of our products. Our reliance on outsourcing may reduce the potential profitability of such products.
In addition, we continue to rely on our former parent company for certain key business functions, including certain transitional services that are covered under the Transitional Services Agreement, certain manufacturing needs that are covered under the Manufacturing and Supply Agreement and certain transitional distribution services that are covered under a Transitional Distribution and Services Agreement. For example, we continue to rely on our former parent company for the production of our entire supply of viscoelastics. We currently sell viscoelastics on a standalone basis for procedures using our products and also use them as a component in our surgical pack offerings. As a result, a shortage in our supply of viscoelastics could not only cause a failure in our ability to meet our commitments to our customers, but could also have significant collateral impacts on other parts of our business due to related decreases in the rates of procedures requiring viscoelastics that feature our equipment or other products.
Ultimately, if the third parties, including our former parent company, fail to meet their obligations to us, we may lose our investment in the collaborations and fail to receive the expected benefits of these arrangements. Contractual remedies may be inadequate to compensate us for the damage to our business or lost profits. In addition, many of the companies to which we outsource key business functions may have more limited resources compared to us, and, in particular, may not have internal compliance resources comparable to those within our organization. Should any of these third parties fail to carry out their contractual duties or regulatory obligations or fail to comply with the law, including laws relating to export and trade controls, or should they act inappropriately in the course of their performance of services for us, there is a risk that we could be held responsible for their acts, that our reputation may suffer, and that penalties may be imposed upon us. Any such failures by third parties could have a material adverse effect on our business, financial condition, results of operations or reputation.
Even if we protect our intellectual property to the fullest extent permitted by applicable law, our competitors and other third parties could develop and commercialize products similar or identical to ours, which could impair our ability to compete.
We rely on a combination of patents, trademarks, and copyrights to protect our intellectual property. The scope, strength and duration of those intellectual property rights can vary significantly from product to product and country to country. We also rely on a variety of trade secrets, know-how, and other confidential information to supplement these protections. In the aggregate, these intellectual property rights are of material importance to our business.
The protections afforded by these intellectual property rights may limit the ability of competitors to commercialize products covered by the applicable intellectual property rights, but they do not prevent competitors from marketing non-infringing products that compete with our products. In addition, these intellectual property rights may be challenged by third parties
16
and regulatory agencies, and intellectual property treated as trade secrets and protected through confidentiality agreements may be independently developed by third parties and/or subject to misappropriation by others. Furthermore, in certain countries, particularly in China, due to ambiguities in the law and enforcement difficulties, intellectual property rights may not be as effective as in Western Europe or the United States. Therefore, even if we protect our intellectual property to the fullest extent permitted by applicable law, competitors and other third parties may nonetheless develop and commercialize products similar or identical to ours, which could impair our ability to compete and have an adverse effect on our business, financial condition and results of operations.
Unauthorized or illegal activity may occur within the distribution channel for our products, which may result in lowering the prices we receive for our products and could harm our business and reputation.
In the United States and elsewhere, our products are subject to competition from lower priced versions of our products and competing products from countries where there are government imposed price controls or other market dynamics that make the products lower priced. Despite government regulations aimed at limiting such imports, the volume of imports may continue to rise in certain countries. This importation may adversely affect our profitability in the United States and elsewhere, and could become more significant in the future.
In addition, our industry continues to be challenged by the vulnerability of distribution channels to counterfeiting. Reports of increased levels of counterfeiting could materially affect consumer confidence in the authentic product and harm our business or lead to litigation. In addition, it is possible that adverse events caused by unsafe counterfeit products could mistakenly be attributed to the authentic product. If a product of ours was the subject of counterfeits, we could incur substantial reputational and financial harm.
We may not successfully complete and integrate strategic acquisitions to expand or complement our business.
As part of our growth strategy, we regularly evaluate and pursue strategic BD&L transactions to expand or complement our business. Such ventures may bring new technologies, products, or customers to enhance our prominent position in the ophthalmic industry. We may be unable to identify suitable acquisition candidates. Acquisition activities can be thwarted by overtures from competitors for the targeted candidates and governmental regulation (including market concentration limitations and other competition laws). Further, even if we are successful in completing an acquisition, successful integration of the venture can be complicated by corporate cultural differences, difficulties in retention of key personnel, customers and suppliers, coordination with other products and processes, and changing market preferences. Moreover, acquisitions demand significant company resources and could divert management's attention from our existing business, could result in liabilities being incurred that were not known at the time of acquisition or could create tax or accounting issues. We often acquire early-stage technologies, which may fail in the development process or proof-of-concept stage, or which we may not be able to integrate into or use to develop commercialized products. If we fail to timely recognize or address these matters or to devote adequate resources to them, we may fail to achieve our growth strategy or otherwise not realize the intended benefits of any acquisition.
Litigation, including product liability lawsuits, and governmental investigations may harm our business or otherwise distract our management.
We, from time to time, are, and may in the future be, subject to various investigations and legal proceedings that arise or may arise, such as proceedings regarding sales and marketing practices, pricing, corruption, trade regulation and embargo legislation (including laws relating to export and trade controls), product liability, commercial disputes, employment and wrongful discharge, business disputes, securities, insider trading, occupational health and safety, environmental, tax audits, cybersecurity, data privacy and intellectual property matters.
We also periodically receive inquiries from antitrust and competition authorities in various jurisdictions and, from time to time, are named as a defendant in antitrust lawsuits. For example, since the first quarter of 2015, more than 50 putative class action complaints have been filed in several courts across the US naming as defendants contact lens manufacturers, including Alcon, and alleging violations of federal antitrust law, as well as the antitrust, consumer protection and unfair competition laws of various states, in connection with the implementation of unilateral price policies by the defendants in the sale of contact lenses. The cases have been consolidated in the Middle District of Florida by the Judicial Panel on Multidistrict Litigation and the claims are being vigorously contested. See "Item 8. Financial Information—8.A. Consolidated Statements and Other Financial Information—Legal Proceedings".
In addition, from time to time, we are named as a defendant in product liability lawsuits and, to the extent we are, we may in the future incur material liabilities relating to such product liability claims, including claims alleging product defects and/or alleged failure to warn of product risks. The risk of material product liability litigation is increased in connection with product recalls and voluntary market withdrawals. We have voluntarily taken products off the market in the past, including global voluntary market withdrawal of the CyPass micro-stent. The combination of our insurance coverage, cash flows and reserves may not be adequate to satisfy product liabilities that we may incur in the future. Successful product liability claims brought against us or recalls of any of our products could have a material adverse effect on our business, results of operations or our financial condition.
17
Because of our extensive international operations, we could be adversely affected by violations of worldwide anti-bribery laws, including those that prohibit companies and their intermediaries from making improper payments to government officials or other third parties for the purpose of obtaining or retaining business, such as the U.S. Foreign Corrupt Practices Act (the “FCPA”), and laws that prohibit commercial bribery. Our internal control policies and procedures may not always protect us from reckless or criminal acts committed by our associates or agents. Violations of these laws, or allegations of such violations, could disrupt our business and adversely affect our reputation and our business, results of operations, cash flows and financial condition.
Substantial, complex or extended litigation could cause us to incur large expenditures, affect our ability to market and distribute our products and distract our management. For example, intellectual property litigation in which we are named as a defendant from time to time could result in significant damage awards and injunctions that could prevent the manufacture and sale of the affected products or require us to make significant royalty payments to continue to sell the affected products. Lawsuits by associates, shareholders, customers or competitors, or potential indemnification obligations and limitations of our director and officer liability insurance, could be very costly and substantially disrupt our business. Disputes with such companies or individuals from time to time are not uncommon, and we may be unable to resolve such disputes on terms favorable to us.
Even meritless claims could subject us to adverse publicity, hinder us from securing insurance coverage in the future or require us to incur significant legal costs. As a result, significant claims or legal proceedings to which we are a party could have a material adverse effect on our business, prospects, financial condition and results of operations.
Failure to comply with law, legal proceedings and government investigations may have a significant negative effect on our results of operations.
We are obligated to comply with the laws of all of the countries around the world in which we operate and sell products. These laws cover an extremely wide and growing range of activities. Such legal requirements can vary from country to country and new requirements may be imposed on us from time to time as government and public expectations regarding acceptable corporate behavior change, and enforcement authorities modify interpretations of legal and regulatory provisions and change enforcement priorities. In addition, our associates, independent contractors, consultants, commercial partners and vendors may engage in misconduct or other improper activities, including noncompliance with regulatory standards and requirements, in violation of such laws and public expectations.
For example, we are faced with increasing pressures, including new laws and regulations from around the world, to be more transparent with respect to how we do business, including with respect to our interactions with healthcare professionals and organizations. These laws and regulations include requirements that we disclose payments or other transfers of value made to healthcare professionals and organizations, including by our associates or third parties acting on our behalf, as well as with regard to the prices for our products. We are also subject to certain privacy laws, including Swiss privacy laws, the EU's General Data Protection Regulation, and the California Consumer Privacy Act, which include operational and compliance requirements that are different than those previously in place and also includes significant penalties for non-compliance.
In addition, we have significant activities in a number of developing countries around the world, both through our own associates, and through third parties retained to assist us. In some of these countries, a culture of compliance with law may not be as fully developed as in other countries.
To help us in our efforts to comply with the many requirements that impact us, we have a significant global ethics and compliance program in place, and we devote substantial time and resources to efforts to conduct our business in a lawful and publicly acceptable manner. Nonetheless, our ethics and compliance program may be insufficient or associates may fail to comply with the training they received, and any actual or alleged failure to comply with law or with heightened public expectations could lead to substantial liabilities that may not be covered by insurance, or to other significant losses, and could affect our business, financial position and reputation.
In particular, in recent years, there has been a trend of increasing government investigations, legal proceedings and law enforcement activities against companies and executives operating in our industry. Increasingly, such activities can involve criminal proceedings, and can retroactively challenge practices previously considered to be acceptable. For instance, in 2017 and 2018, Alcon and Novartis, as well as certain present and former executives and associates of Alcon and Novartis, received document requests and subpoenas from the US Department of Justice ("DoJ") and the SEC requesting information concerning Alcon accounting, internal controls and business practices in Asia and Russia, including revenue recognition for surgical equipment and related products and services and relationships with third-party distributors, both before and after Alcon became part of the Novartis Group. Alcon is cooperating with this investigation. Alcon aggregate net sales for its surgical and vision care businesses in the Asia and Russia region represented 25.8%, 24.2%, and 21.1% of Alcon total net sales during the years ended December 31, 2019, 2018 and 2017, respectively. For additional information, including with respect to certain Novartis obligations to indemnify Alcon, see "Item 8. Financial Information—8.A. Consolidated Statements and Other Financial Information—Legal Proceedings".
18
Such proceedings are inherently unpredictable, and large judgments or penalties sometimes occur. As a consequence, we may in the future incur judgments or penalties that could involve large cash payments, including the potential repayment of amounts allegedly obtained improperly, and other penalties, including enhanced damages. In addition, such proceedings may affect our reputation, create a risk of potential exclusion from government reimbursement programs, and may lead to civil litigation. As a result, having taken into account all relevant factors, we may in the future enter into major settlements of such claims without bringing them to final legal adjudication by courts or other such bodies, despite having potentially significant defenses against them, in order to limit the risks they pose to our business and reputation. Such settlements may require us to pay significant sums of money, and to enter into corporate integrity or similar agreements intended to regulate company behavior for a period of years, which can be costly to operate under.
Any such judgments or settlements, and any accruals that we may take with respect to potential judgments or settlements, could have a material adverse impact on our business, financial condition or results of operations, as well as on our reputation.
We may implement product recalls or voluntary market withdrawals of our products.
The manufacturing and marketing of medical devices, including surgical equipment and instruments, involve an inherent risk that our products may prove to be defective and cause a health risk. We are also subject to a number of laws and regulations requiring us to report adverse events associated with our products. Such adverse events and potential health risks identified in our monitoring efforts or from ongoing clinical studies may lead to voluntary or mandatory market actions, including recalls, product withdrawals or changes to the instructions for using our devices.
Governmental authorities throughout the world, including the FDA, have the authority to require the recall of our commercialized products in the event of material deficiencies or defects in, for example, design, labeling or manufacture. In the case of the FDA, it has the authority to require a recall of a medical device if there is a finding of a reasonable probability that the device would cause serious adverse health consequences or death.
We may also voluntarily initiate certain field actions, such as a correction or removal of our products in the future as a result of component failures, manufacturing errors, design or labeling defects or other deficiencies and issues. If a correction or removal of one of our devices is initiated to reduce a health risk posed by the device, or to remedy a violation of the Federal Food, Drug, and Cosmetic Act ("FDCA") caused by the device that may present a risk to health, the correction or removal must be reported to the FDA. Similarly, field actions conducted for safety reasons in the European Economic Area ("EEA") must be reported to the regulatory authority in each country where the field action occurs.
We have voluntarily taken products off the market in the past, including the global discontinuation of the AcrySof Cachet phakic IOL, the voluntary recall of AcrySof IQ ReSTOR, AcrySof IQ ReSTORToric, and certain AcrySof IQ Toric IOLs manufactured specifically for the Japan market, and the global voluntary market withdrawal of the CyPass micro-stent. In the year ended December 31, 2018, we recognized an impairment charge of $337 million in relation to the CyPass micro-stent market withdrawal. Based on this experience, we believe that the occurrence of a recall could result in significant costs to us, potential disruptions in the supply of our products to our customers and adverse publicity, all of which could harm our ability to market our products. A recall of one of our products or a similar competing product manufactured by another manufacturer could impair sales and subsequent regulatory approvals of other similar products we market and lead to a general loss of customer confidence in our products. A product recall could also lead to a health authority inspection or other regulatory action or to us being named as a defendant in lawsuits. See "—Litigation, including product liability lawsuits, and governmental investigations may harm our business or otherwise distract our management" above.
We may be unable to attract and retain qualified personnel.
We highly depend upon skilled personnel in key parts of our organization, and we invest heavily in recruiting, training and retaining qualified individuals, including significant efforts to enhance the diversity of our workforce. The loss of the service of key members of our organization—including senior members of our scientific and management teams, high-quality researchers and development specialists and skilled personnel in developing countries—could delay or prevent the achievement of major business objectives.
Our future growth will demand talented associates and leaders, yet the market for talent has become increasingly competitive. In particular, emerging markets are expected to continue to be an important source of growth, but in many of these countries there is a limited pool of executives with the training and international experience needed to work successfully in a global organization like Alcon.
The supply of talent for certain key functional and leadership positions is decreasing, and a talent gap is visible for some professions and geographies—engineers in Germany, for example. Recruitment is increasingly regional or global in specialized fields such as clinical development, biosciences, chemistry and information technology. In addition, the geographic mobility of talent is expected to decrease in the future, with talented individuals in developed and developing countries anticipating ample career opportunities closer to home than in the past. This decrease in mobility may be worsened by anti-immigrant sentiments in many countries, and laws discouraging immigration.
19
In addition, our ability to hire qualified personnel also depends on the flexibility to reward superior performance and to pay competitive compensation. Laws, regulations and customary practice on executive compensation, including legislation and customary practice in our home country, Switzerland, may restrict our ability to attract, motivate and retain the required level of qualified personnel. For example, pay benchmarks for Swiss and other European companies may be inconsistent with the current market in the United States, making it more difficult to recruit US talent. Further, certain functions are now maintained in Switzerland, which may require certain US associates to relocate to Switzerland. Alternatively, certain associates will be required to travel frequently between Switzerland and the US These associates may be unwilling or unable to make such a commitment.
We may be underestimating our future pension plan obligations.
We sponsor pension and other post-employment benefit plans in various forms. These plans cover a significant portion of our associates. While most of our plans are now defined contribution plans, certain of our associates remain under defined benefit plans. For these defined benefit plans, we are required to make significant assumptions and estimates about future events in calculating the present value of expected future plan expenses and liabilities. These include assumptions used to determine the discount rates we apply to estimated future liabilities and rates of future compensation increases. Assumptions and estimates we use may differ materially from the actual results we experience in the future, due to changing market and economic conditions, higher or lower withdrawal rates, or longer or shorter life spans of participants, among other variables. For example, in 2019, a decrease in the interest rate we apply in determining the present value of expected future total defined benefit plan obligations (consisting of pension and other post-employment benefit obligations) of one-quarter of one percent would have increased our year-end defined benefit obligation by $46 million. Any differences between our assumptions and estimates and our actual experience could require us to make additional contributions to our pension funds. Further, additional employer contributions might be required if plan funding falls below the levels required by local rules.
Our operations in emerging markets, particularly China, expose us to heightened risks associated with conditions in those markets.
Economic, social and political conditions, laws, practices and local customs vary widely among the countries, particularly in emerging markets, in which we sell our products. Our operations in emerging markets, particularly China, are subject to a number of heightened risks and potential costs, including lower profit margins, less stringent protection of intellectual property and economic, political and social uncertainty. For example, many emerging markets have currencies that fluctuate substantially. If currencies devalue and we cannot offset with price increases, our products may become less profitable. Inflation in emerging markets also can make our products less profitable and increase our exposure to credit risks. We have previously experienced currency fluctuations, unstable social and political conditions, inflation and volatile economic conditions in emerging markets, which have impacted our profitability in the emerging markets in which we operate and we may experience such impacts in the future.
Further, in many emerging markets, average income levels are relatively low, government reimbursement for the cost of healthcare products and services is limited and prices and demand are sensitive to general economic conditions. These challenges may prevent us from realizing the expected benefits of our investments in such emerging markets, which could have an adverse impact on our business, financial condition and results of operations.
Regulatory clearance and approval processes for our products are expensive, time-consuming and uncertain, and the failure to obtain and maintain required regulatory clearances and approvals could prevent us from commercializing our products.
Our businesses are subject to varying degrees of governmental regulation in the countries in which we operate, and the general trend is toward increasingly stringent regulation. The exercise of broad regulatory powers by the FDA continues to result in increases in the amounts of testing and documentation required for the commercialization of regulated products and a corresponding increase in the expense of product introduction. Similar trends are also evident in the EU and in other markets throughout the world. Compliance with these laws and regulations is costly and materially affects our business. Among other effects, health care regulations substantially increase the time, difficulty, and costs incurred in obtaining and maintaining approval to market newly developed and existing products.
Most of our products are regulated as medical devices and face difficult development and approval processes in most jurisdictions we operate in, particularly in the US and EU; however other products may be regulated as other categories such as lasers, drug products, dietary supplements, and medical foods. We discuss these regulations more thoroughly "Item 4. Information on the Company—4.B. Business Overview—Government Regulation—Product Approval and Monitoring
"
.
The process of developing new products and obtaining necessary FDA clearance or approval, CE marking, or other regulatory marketing authorization is lengthy, expensive, and uncertain. Our potential products could take a significantly longer time than we expect to gain marketing authorization or may never gain such marketing authorization. Regulatory authorities may require additional testing or clinical data to support marketing authorization, delaying authorization and market entry of our products. Even if the FDA or another regulatory agency or notified body approves a product, the approval may limit the indicated uses for a product, may otherwise limit our ability to promote, sell and distribute a product or may require post-
20
marketing studies or impose other post-marketing obligations. We may be unable to obtain the necessary regulatory clearances or approvals for any product on a timely basis or at all. If a regulatory authority delays authorization of a potentially significant product, our market value and operating results may decline. Similarly, if we are unable to obtain regulatory approval or CE marking of our products, we will not be able to market these products, which would result in a decrease in our sales.
We may be unable to successfully maintain the registrations, licenses, clearances or other authorizations we have received or may receive in the future. We also routinely make minor modifications to our products, labeling, instructions for use, manufacturing process and packaging that may trigger a requirement to notify regulatory authorities or to update such registrations or authorizations. This may subsequently require us to manage multiple versions of individual products around the world, depending on the status of any re-registration approvals. Managing such multiple versions may require additional inventory in the form of "bridging stock", extensive redress operations and inventory increases that could exceed our manufacturing capacity or supply chain ability at the time. This could result in prolonged product shortages that could negatively impact our sales, both in terms of any unavailable products and the potential loss of customers that opt for another supplier.
The loss of previously received clearances or approvals, or the failure to comply with existing or future regulatory requirements could also have a material adverse effect on our business. For example, we offer custom surgical pack products that combine both Alcon and third-party products. Changes in local regulatory statutes, health authority practices, or local importation laws, or the failure of Alcon or our suppliers comply with them, could result in our products being barred from importation into a given territory. Continued growth in our sales and profits will depend, in part, on the timely and successful introduction and marketing of some or all of the products for which we are currently pursuing approval.
The manufacture of our products is highly regulated and complex.
The manufacture of our product portfolio is complex and heavily regulated by governmental health authorities around the world, including the FDA. Whether our products are manufactured at our own dedicated manufacturing facilities or by third parties, we must ensure that all manufacturing processes comply with current Good Manufacturing Practices, quality system requirements, and other applicable regulations, as well as with our own high quality standards. In recent years, health authorities have substantially intensified their scrutiny of manufacturers' compliance with such requirements.
Any significant failure by us or our third-party suppliers to comply with these requirements or the health authorities' expectations may cause us to shut down our production facilities or production lines or we could be prevented from importing our products from one country to another. Moreover, if we fail to properly plan for manufacturing capacity, the complexity of our manufacturing process could lead to a long lead time to increase capacity. Any of these events could lead to product shortages, or to our being entirely unable to supply products to customers and consumers for an extended period of time. Such shortages or shutdowns have led to, and could continue to lead to, significant losses of sales revenue and to potential third-party litigation. In addition, health authorities have in some cases imposed significant penalties for such failures to comply with regulatory requirements. A failure to comply fully with regulatory requirements could also lead to a delay in the approval of new products to be manufactured at the impacted site.
We may be subject to penalties if we fail to comply with post-approval legal and regulatory requirements and our products could be subject to restrictions or withdrawal from the market.
The research, development, testing, manufacturing, sale and marketing of our products are subject to extensive governmental regulation. Government regulation includes inspection of and controls over testing, manufacturing, safety and environmental controls, efficacy, labeling, advertising, marketing, promotion, record keeping, tracking, reporting, distributing, import, export, samples, electronic records and electronic signatures.
Among other requirements, we are required to comply with applicable adverse event and malfunction reporting requirements for our products. For example, for our medical device products, in the US, we are required to report to the FDA any incident in which one of our marketed devices may have caused or contributed to a death or serious injury or has malfunctioned and the malfunction of the device or a similar device that we market would be likely to cause or contribute to death or serious injury if the malfunction were to recur. In addition, all manufacturers placing medical devices on the market in the EEA are legally required to report any serious or potentially serious incidents involving devices produced or sold by the manufacturer to the relevant authority in those jurisdictions where any such incident occurred.
Our advertising and promotional activities are also subject to stringent regulatory rules and oversight. The marketing approvals from the FDA and other regulators of certain of our products are, or are expected to be, limited to specific uses. We are prohibited from marketing or promoting any uncleared or unapproved use of our product, referred to as "off-label" use. In addition to promoting our products in a manner consistent with our clearances and approvals, we must have adequate substantiation for the claims we make for our products. If any of our claims are determined to be false, misleading or deceptive, we could be subject to enforcement action. As Alcon and our associates increasingly use social media to communicate, and given the speed of dissemination of information online, there is a heightened risk that Alcon or one of our associates sends a message that may be deemed inappropriate or prohibited by a regulatory authority. In addition, unsubstantiated claims
21
also present a risk of consumer class action or consumer protection litigation and competitor challenges. In the past, we have had to change or discontinue promotional materials because of regulatory agency requests, and we are exposed to that possibility in the future.
Failure to comply with statutes and regulations administered by the FDA and other regulatory bodies or failure to adequately respond to any notices of violation or any similar reports could result in, among other things, any of the following enforcement actions:
|
▪
|
warning letters or untitled letters issued by the FDA;
|
|
▪
|
fines, civil penalties, in rem forfeiture proceedings, injunctions, consent decrees and criminal prosecution;
|
|
▪
|
detention of imported products;
|
|
▪
|
delays in approving, or refusal to approve, our products;
|
|
▪
|
withdrawal or suspension of approval of our products or those of our third-party suppliers by the FDA or other regulatory bodies;
|
|
▪
|
product recall or seizure;
|
|
▪
|
operating restrictions or interruption of production; and
|
|
▪
|
inability to export to certain countries.
|
If any of these items were to occur, it could result in unanticipated expenditures to address or defend such actions, could harm our reputation and could adversely affect our business, financial condition and results of operations.
We are subject to laws targeting fraud and abuse in the healthcare industry.
We are subject to various global laws pertaining to healthcare fraud and abuse, including anti-kickback laws and physician self-referral laws. For example, the US federal healthcare program anti-kickback statute prohibits, among other things, knowingly and willfully offering, paying, soliciting or receiving remuneration to induce, or in return for, purchasing, leasing, ordering, arranging for or recommending the purchase, lease or order of any healthcare item or service reimbursable under Medicare, Medicaid or other federally financed healthcare programs. These US laws have been interpreted to apply to arrangements between medical device manufacturers, on the one hand, and prescribers, purchasers, formulary managers and other healthcare-related professionals, on the other hand. The US government may assert that a claim including items or services resulting from a violation of the federal anti-kickback statute constitutes a false or fraudulent claim for purposes of the false claims statutes. Pricing and rebate programs for drugs reimbursed under federal healthcare programs must comply with the Medicaid drug rebate requirements of the Omnibus Budget Reconciliation Act of 1990, as amended, the Veterans Health Care Act of 1992, as amended, and the Deficit Reduction Act of 2005, as amended. The statutes and regulations governing the various price reporting requirements are complex and have changed over time, and the US government has not given clear guidance on many issues. In addition, recent statutory and regulatory developments have not yet been applied by the government or courts to specific factual situations. We believe that we are in compliance with all applicable government price reporting requirements, but there is the potential that the Centers for Medicare & Medicaid Services ("CMS"), other regulatory and law enforcement agencies or a court could arrive at different interpretations, with adverse financial or other consequences for us. If products are made available to authorized users of the Federal Supply Schedule of the General Services Administration, additional laws and requirements apply. All of these activities are also potentially subject to federal and state consumer protection and unfair competition laws. Some European Union bodies and most European Union member states and Japan impose controls and restrictions that are similar in nature or effect to those described above.
In recent years, the US government and several US states have enacted legislation requiring medical device companies to establish marketing compliance programs and file other periodic reports. Similar legislation is being considered in other US states. Many of these requirements are new and uncertain, and available guidance is limited. We could face enforcement action, fines and other penalties and could receive adverse publicity, all of which could harm our business, if it is alleged that we have failed to fully comply with such laws and regulations. Similarly, if the physicians or other providers or entities that we do business with are found to have not complied with applicable laws, they may be subject to sanctions, which could also have a negative impact on our business.
Depending on the circumstances, failure to meet these applicable legal and regulatory requirements can result in criminal prosecution, fines or other penalties, injunctions, recall or seizure of products, total or partial suspension of production, denial or withdrawal of pre-marketing product approvals, private "qui tam" actions brought by individual whistleblowers in the name of the government, or refusal to allow us to enter into supply contracts, including government contracts, any of which could have a material adverse effect on our business, financial condition or results of operations.
Legislative and regulatory reforms may impact our ability to develop and commercialize our products.
The global regulatory environment is increasingly stringent and unpredictable. Unexpected changes can have an adverse impact on our business, financial condition and results of operations.
First, it could be costly and onerous to comply with changes or new requirements relating to the regulatory approval process or postmarket requirements applicable to our products in various jurisdictions. As discussed in "Item 4. Information on the
22
Company—4.B. Business Overview—Government Regulation—Product Approval and Monitoring" the EU has made recent changes to its regulatory regime. In addition, several countries that did not have regulatory requirements for medical devices have established such requirements in recent years, and other countries have expanded, or plan to expand, their existing regulations. While harmonization of global regulations has been pursued, requirements continue to differ significantly among countries. Further, the FDA is also pursuing various efforts to modernize its regulation of devices, including potential changes to the 510(k) pathway such as limiting reliance on older predicate devices and establishing an alternative 510(k) pathway that permits reliance on objective performance criteria. We expect this global regulatory environment to continue to evolve, which could impact the cost of, the time needed to approve, and ultimately, our ability to maintain existing approvals or obtain future approvals for, our products.
Second, new legislation and new regulations and interpretations of existing health care statutes and regulations are frequently adopted, any of which could affect our future business and results of operations. For example, in the US, there have been a number of health care reform legislative and regulatory measures proposed and adopted at the federal and state government levels that affect the health care system generally and that have had significant impact on our business.
Third, changes to current regulations in certain countries, including the United States, requiring a prescription for the purchase of contact lenses could have a significant impact on the way we market and distribute contact lens and contact lens care products, by limiting the role of the ECP as an intermediary in the sale of our vision care products. Such changes could require us to incur significant costs to update our marketing and distribution methodologies and could adversely affect the sales of our vision care products.
Finally, within our surgical business, a considerable portion of our sales and sales growth rely on patient-pay premium technologies, in markets where access to these technologies has been established. For example, in the US, two landmark rulings issued by the CMS established a bifurcated payment system for certain of our AT-IOLs pursuant to which part of the cost of the cataract surgery with such AT-IOLs would be reimbursed under Medicare, with the remaining cost paid out-of-pocket. For more details, see "Item 4. Information on the Company—4.B. Business Overview—Our Products—Surgical". To the extent regulatory bodies in the US, such as CMS, or other health authorities outside the US, decide to amend the regulations governing patient-pay reimbursement for advanced technologies, our sales and sales growth could be negatively impacted.
We are subject to environmental, health and safety laws and regulations.
We are subject to numerous national and local environmental, health and safety laws and regulations, including relating to the discharge of regulated materials into the environment, human health and safety, laboratory procedures and the generation, handling, use, storage, treatment, release and disposal of hazardous materials and wastes. Our operations involve the use of hazardous and flammable materials, including chemicals and biological materials. Our operations also produce hazardous waste products. We generally contract with third parties for the disposal of these hazardous materials and wastes. We cannot eliminate the risk of contamination or injury from these materials. In the event of contamination or injury resulting from our generation, handling, use, storage, treatment, release or disposal of hazardous materials or wastes, we could be held liable for any resulting damages, and any liability could materially adversely affect our business, operating results or financial condition. Our insurance may not provide adequate coverage against potential liabilities. If we fail to comply with applicable environmental, health and safety laws and regulations, we may face significant administrative, civil or criminal fines, penalties or other sanctions. In addition, we may incur substantial costs to comply with current or future environmental, health and safety laws and regulations, which have tended to become more stringent over time, including any potential laws and regulations that may be implemented in the future to address global climate change concerns. Compliance with current or future environmental, health and safety laws and regulations may increase our costs or impair our research, development or production efforts.
We must comply with certain tax incentive agreements in Switzerland.
While operating as a division of Novartis, our subsidiary, Alcon Pharmaceuticals Ltd. (“APL”), benefited from an investment tax incentive granted by the Swiss State Secretariat for Economic Affairs in Switzerland (the “SECO”) and the Canton of Fribourg, Switzerland in respect of both Swiss federal taxes and Fribourg cantonal / communal taxes for the fiscal years ended December 31, 2007 through December 31, 2017. This tax incentive is subject to a five year "claw-back" period if Alcon does not continue to meet certain requirements related to its operations in Fribourg.
In connection with the Spin-off, our former parent retained certain assets of APL related to APL’s former pharmaceutical business. As a result, Novartis agreed with the Canton of Fribourg that each of APL and a subsidiary of Novartis (Novartis Ophthalmics AG, Fribourg) will have separate and standalone obligations and potential liabilities in connection with the five year claw-back period relating to the Fribourg investment tax incentive granted to APL. In particular, APL may be required to pay a "claw-back" amount of up to CHF 1.3 billion to the Fribourg tax authorities if APL fails to continue certain business activities in Fribourg and if Alcon Inc., APL, and Alcon Services AG fail to (1) remain tax resident in Fribourg, and (2) employ a certain minimum number of associates in Fribourg. Since December 31, 2018, our "claw-back" obligation has begun to be reduced each year by 20% of the original maximum amount and will expire on December 31, 2022.
23
We intend to conduct APL's operations so as to comply with these requirements in all respects; however, we may be unable to meet, or the Canton of Fribourg may successfully challenge our compliance with, these requirements. If the Canton of Fribourg successfully challenges our compliance with these requirements, we would be required to pay all or a portion of the "claw-back" amount.
We are a multinational business that operates in numerous tax jurisdictions.
We conduct operations in multiple tax jurisdictions, and the tax laws of those jurisdictions generally require that the transfer prices between affiliated companies in different jurisdictions be the same as those between unrelated companies dealing at arm's length, and that such prices are supported by contemporaneous documentation. While we believe that we operate in compliance with applicable transfer pricing laws and intend to continue to do so, our transfer pricing procedures are not binding on applicable tax authorities. If tax authorities in any of these jurisdictions were to successfully challenge our transfer prices as not reflecting arm's length transactions, they could require us to adjust our transfer prices and thereby reallocate our income to reflect these revised transfer prices, which could result in a higher overall tax liability to us and possibly interest and penalties.
Additionally, the integrated nature of our worldwide operations can produce conflicting claims from tax authorities in different countries as to the profits to be taxed in the individual countries. The majority of the jurisdictions in which we operate have double tax treaties with other foreign jurisdictions, which provide a framework for mitigating the impact of double taxation on our revenues and capital gains. However, mechanisms developed to resolve such conflicting claims are largely untested, can be expected to be very lengthy, and do not always contain a mandatory dispute resolution clause.
In recent years, tax authorities around the world have increased their scrutiny of company tax filings, and have become more rigid in exercising any discretion they may have. As part of this, the Organization for Economic Co-operation and Development ("OECD") has proposed certain changes to the International tax standards that have resulted and will continue to result in local tax law changes under its Base Erosion and Profit Shifting ("BEPS") Action Plans to address issues of transparency, coherence and substance. Most recently, the OECD has released its plans for proposing further amendments to the international tax standards, including a new attribution of the right to tax corporate profits where customers are located and a mechanism ensuring that all corporate profits would be subject to a minimum taxation level.
At the same time, the EU Member States are implementing the European Commission’s Anti Tax Avoidance Directives I and II, which seek to prevent tax avoidance by companies and to ensure that companies pay appropriate taxes in the markets where profits are effectively made and business is effectively performed. The European Commission also continues to extend the application of its policies seeking to limit fiscal aid by Member States to particular companies, including by investigating Member States' practices regarding the issuance of rulings on tax matters relating to individual companies. Furthermore, new EU regulations introducing mandatory automatic exchange of information in relation to "reportable cross-border arrangements" entered into effect on June 25, 2018 and the Member States are required to transpose such regulation into their respective national legislation by December 31, 2019 and apply the new rules from July 1, 2020. The first automatic exchange of information in relation to "reportable cross-border arrangements" will have to take place by October 31, 2020. Over time, these new disclosure requirements may result in significant changes to the manner in which tax authorities and taxpayers view the application of established tax rules.
These OECD and EU tax reform initiatives require local country implementation, including in our home country of Switzerland, which may result in significant changes to established tax principles. Although we have taken steps to be in compliance with the evolving OECD and EU tax initiatives, and will continue to do so, significant uncertainties remain as to the outcome of these initiatives and their impact on us as a taxpayer.
Furthermore, Switzerland and the various Swiss cantons in which Alcon is present have adopted their own corporate tax reform. The main elements of the Swiss tax reform became effective in 2020 and will result in an increase in Alcon’s tax burden and effective tax rate in Switzerland.
In general, tax reform efforts, including with respect to tax base or rate, transfer pricing, intercompany dividends, cross border transactions, controlled corporations, and limitations on tax relief allowed on the interest on intercompany debt, will require us to continually assess our organizational structure and could lead to an increased risk of international tax disputes, an increase in our effective tax rate and an adverse effect on our financial condition.
Intangible assets and goodwill on our books may lead to significant impairment charges.
We carry a significant amount of goodwill and other intangible assets on our consolidated balance sheet, primarily due to the value of the Alcon brand name, but also intangible assets associated with our technologies, acquired research and development, currently marketed products, and marketing know-how. As a result, we may incur significant impairment charges if the fair value of the intangible assets and the groupings of cash generating units containing goodwill would be less than their carrying value on our consolidated balance sheet at any point in time.
We regularly review our long-lived intangible and tangible assets, including identifiable intangible assets, investments in associated companies and goodwill, for impairment. Goodwill, intangible assets with an indefinite useful life (such as the
24
Alcon brand name), acquired research projects not ready for use, and acquired development projects not yet ready for use are subject to impairment review at least annually. We review other long-lived assets for impairment when there is an indication that an impairment may have occurred.
For a detailed discussion of how we determine whether an impairment has occurred, what factors could result in an impairment and the impact of impairment charges on our results of operations, see "Note 3. Selected Accounting Policies—Goodwill and intangible assets—Impairment of goodwill, Alcon brand name and definite lived intangible assets" to our Consolidated Financial Statements included elsewhere in this Annual Report.
Our previously announced estimates for the costs we expect to incur in connection with our separation from Novartis and our previously announced transformation program may be inaccurate.
We have previously announced that we expect to incur costs of $500 million in connection with our separation from Novartis. We have also previously announced that we expect to incur costs of $300 million and realize savings of $200 to $225 million on an annualized run rate by 2023 in connection with our transformation program. While we believe that these estimates are reasonable under the circumstances, they are subject to significant uncertainties, some of which are beyond our control. In addition, we may not be able to obtain the estimated cost savings and benefits that were initially anticipated in connection with our transformation program in a timely manner or at all. Should any of these estimates or underlying assumptions change or prove to have been incorrect, it could adversely affect our results of operations.
Environmental, social and governance matters may impact our business and reputation.
Increasingly, in addition to the importance of their financial performance, companies are being judged by their performance on a variety of environmental, social and governance ("ESG") matters, which are considered to contribute to the long-term sustainability of companies’ performance.
A variety of organizations measure the performance of companies on such ESG topics, and the results of these assessments are widely publicized. In addition, investment in funds that specialize in companies that perform well in such assessments are increasingly popular, and major institutional investors have publicly emphasized the importance of such ESG measures to their investment decisions. Topics taken into account in such assessments include, among others, the company’s efforts and impacts on climate change and human rights, ethics and compliance with law, and the role of the company’s board of directors in supervising various sustainability issues. In addition to the topics typically considered in such assessments, in the healthcare industry, issues of the public’s ability to access our products and solutions are of particular importance.
We actively manage a broad range of such ESG matters, taking into consideration their expected impact on the sustainability of our business over time, and the potential impact of our business on society and the environment. However, in light of investors’ increased focus on ESG matters, there can be no certainty that we will manage such issues successfully, or that we will successfully meet society’s expectations as to our proper role. Any failure or perceived failure by us in this regard could have a material adverse effect on our reputation and on our business, share price, financial condition, or results of operations, including the sustainability of our business over time.
Risks Related to the Separation from Novartis
Our ability to operate our business effectively may suffer if we do not, quickly and cost effectively, establish our own administrative and support functions necessary to operate as a standalone public company.
As a division of Novartis, we historically relied on financial (including financial and compliance controls) and certain legal, administrative and other resources of Novartis to operate our business. In particular, Novartis Business Services ("NBS"), the Novartis shared service organization, historically provided us with services across the following service domains: human resources operations, real estate and facility services, procurement, information technology, commercial and medical support services and financial reporting and accounting operations.
Since our separation from Novartis, we have continued to expand our own financial, administrative, corporate governance and listed company compliance and other support systems, including for the services NBS had historically provided to us, or have contracted with third parties to replace Novartis systems that we are not establishing internally. This process has been complex, time consuming and costly.
Novartis will continue to provide support for certain of our key business functions until April 2021 pursuant to a Transitional Services Agreement and certain other agreements. Any failure or significant downtime in our own financial, administrative or other support systems or in the Novartis financial, administrative or other support systems during the transitional period in which Novartis provides us with support could negatively impact our results of operations or prevent us from paying our suppliers and associates, executing business combinations and foreign currency transactions or performing administrative or other services on a timely basis, which could negatively affect our results of operations.
25
In particular, our day-to-day business operations rely on our information technology systems. For example, our production facilities utilize information technology to increase efficiencies and limit costs. Furthermore, a significant portion of the communications among our personnel, customers and suppliers take place on our information technology platforms. While the transfer of information technology systems from Novartis to us has commenced, we expect that the full transfer to be complex, time consuming and costly. There is also a risk of data loss in the process of transferring information technology. As a result of our reliance on information technology systems, the cost of such information technology integration and transfer and any such loss of key data could have an adverse effect on our business, financial condition and results of operations.
The transitional services Novartis has agreed to provide us may not be sufficient for our needs. In addition, we or Novartis may fail to perform under various transaction agreements that will be executed as part of the separation or we may fail to have necessary systems and services in place when certain of the transaction agreements expire.
In connection with the separation, we entered into a Separation and Distribution Agreement and various other agreements with Novartis, including the Transitional Services Agreement, Tax Matters Agreement, Employee Matters Agreement, Manufacturing and Supply Agreement and other separation-related agreements. See "Item 10. Additional Information—10.C. Material Contracts—Our Agreements with Novartis". Certain of these agreements will provide for the performance of key business services by Novartis for our benefit for a period of time after the separation. These services may not be sufficient to meet our needs and the terms of such services may not be equal to or better than the terms we may have received from unaffiliated third parties, including our ability to obtain redress.
We rely on Novartis to satisfy its performance and payment obligations under these agreements. If Novartis does not satisfactorily perform its obligations under these agreements, including its indemnification obligations, we could incur operational difficulties or losses. If we do not have in place our own systems and services, or if we do not have agreements with other providers of these services once certain transitional agreements expire, we may not be able to operate our business effectively. In addition, after our agreements with Novartis expire, we may not be able to obtain these services at as favorable prices or on as favorable terms.
The separation and Spin-off could result in significant tax liability. In addition, we agreed to certain restrictions designed to preserve the tax treatment of the separation and Spin-off.
The relevant Swiss tax consequences of the separation and Spin-off have been taken up with the Swiss tax authorities. Novartis received written confirmations (the "Swiss Tax Rulings") from the Swiss Federal Tax Administration and from the tax administrations of the Canton of Basel-Stadt and the Canton of Fribourg addressing the relevant Swiss tax consequences of the separation and Spin-off. In addition, Novartis received a private letter ruling from the US Internal Revenue Service (the "IRS", and such ruling, the "IRS Ruling") and obtained a written opinion of Cravath, Swaine & Moore LLP, counsel to Novartis (the "Tax Opinion") to the effect that the separation and Spin-off should qualify for nonrecognition of gain and loss to Novartis and its shareholders under Section 355 of the Code.
If the separation and/or Spin-off were determined not to qualify for the treatments described in the Tax Rulings and Tax Opinion, or if any conditions in the Tax Rulings or Tax Opinion are not observed, then we could suffer adverse Swiss stamp duty and Novartis could suffer Swiss and US income, withholding and capital gains tax consequences and, under certain circumstances, we could have an indemnification obligation to Novartis with respect to some or all of the resulting tax to Novartis under the tax matters agreement (the "Tax Matters Agreement") we entered into with Novartis, as described in "Item 10. Additional Information—10.C. Material Contracts—Our Agreements with Novartis—Tax Matters Agreement".
In addition, under the Tax Matters Agreement, we agreed to certain restrictions designed to preserve the expected tax neutral nature of the separation and the Spin-off for Swiss tax and US federal income tax purposes. These restrictions may limit our ability to pursue strategic transactions or engage in new businesses or other transactions that might be beneficial and could discourage or delay strategic transactions that our shareholders may consider favorable. See "Item 10. Additional Information—10.C. Material Contracts—Our Agreements with Novartis—Tax Matters Agreement" for more information.
Risks related to the Ownership of our Shares
Your percentage ownership in Alcon may be diluted in the future.
In the future, your percentage ownership in Alcon may be diluted because of equity issuances from acquisitions, capital markets transactions or otherwise, including equity awards that we may grant to our directors, officers and associates under our associate participation plans. These additional issuances will have a dilutive effect on our earnings per share, which could adversely affect the market price of our shares.
26
Our maintenance of two exchange listings could result in pricing differentials of our ordinary shares between the two exchanges.
Our shares trade on the NYSE in US dollars and on the SIX in Swiss francs, which may result in price differentials between the two exchanges for a variety of factors, including fluctuations in the US dollar/Swiss franc exchange rate and differences in trading schedules.
We may not pay or declare dividends.
Although Alcon expects that it will recommend the payment of a regular cash dividend based upon the prior year’s core net income, we may not pay or declare dividends in the future. The declaration, timing, and amount of any dividends to be paid by Alcon will be subject to the approval of shareholders at the relevant General Meeting of shareholders. The determination by the Board as to whether to recommend a dividend and the approval of any such proposed dividend by the shareholders will depend upon many factors, including our financial condition, earnings, corporate strategy, capital requirements of our operating subsidiaries, covenants, legal requirements and other factors deemed relevant by the Board and shareholders.
In addition, any dividends that we may declare will be denominated in Swiss francs. Consequently, exchange rate fluctuations will affect the US dollar equivalent of dividends received by holders of shares held via DTC or shares directly registered with Computershare Trust Company, N.A. in the US If the value of the Swiss franc decreases against the US dollar, the value of the US dollar equivalent of any dividend will decrease accordingly.
See "Item 8. Financial Information—8.A. Consolidated Statements and Other Financial Information—Dividend Policy" for more information.
We are a foreign private issuer and, as a result, we are not subject to US proxy rules and are subject to Securities Exchange Act of 1934 ("Exchange Act") reporting obligations that, to some extent, are more lenient and less frequent than those of a US domestic public company.
We report under the Exchange Act as a non-US company with foreign private issuer status. Because we qualify as a foreign private issuer under the Exchange Act and although we are subject to Swiss laws and regulations with regard to such matters and intend to continue to furnish quarterly financial information to the SEC, we are exempt from certain provisions of the Exchange Act that are applicable to US domestic public companies, including (i) the sections of the Exchange Act regulating the solicitation of proxies, consents or authorizations in respect of a security registered under the Exchange Act, (ii) the sections of the Exchange Act requiring insiders to file public reports of their stock ownership and trading activities and liability for insiders who profit from trades made in a short period of time and (iii) the rules under the Exchange Act requiring the filing with the SEC of quarterly reports on Form 10-Q containing unaudited financial and other specified information, or current reports on Form 8-K, upon the occurrence of specified significant events. In addition, foreign private issuers are not required to file their annual report on Form 20-F until four months after the end of each financial year, while US domestic issuers that are large accelerated filers are required to file their annual report on Form 10-K within 60 days after the end of each fiscal year. Foreign private issuers are also exempt from the Regulation Fair Disclosure, aimed at preventing issuers from making selective disclosures of material information. As a result of the above, you may not have the same protections afforded to shareholders of companies that are not foreign private issuers.
In addition, as a foreign private issuer, we are entitled to rely on exceptions from certain corporate governance requirements of the NYSE. As a result, you may not have the same protections afforded to shareholders of companies that are not foreign private issuers.
Furthermore, we prepare our financial statements under IFRS. There are, and may continue to be, certain significant differences between IFRS and US Generally Accepted Accounting Principles, or US GAAP, including but not limited to potentially significant differences related to the accounting and disclosure requirements relating to associate benefits, nonfinancial assets, taxation and impairment of long-lived assets. As a result, our financial information and reported earnings for historical or future periods could be significantly different if they were prepared in accordance with US GAAP, and you may not be able to meaningfully compare our financial statements under IFRS with those companies that prepare financial statements under US GAAP.
We may lose our foreign private issuer status.
We are a foreign private issuer and therefore we are not required to comply with all of the periodic disclosure and current reporting requirements of the Exchange Act applicable to US domestic issuers. To maintain our status as a foreign private issuer, either (a) a majority of our shares must be directly or indirectly owned of record by non-residents of the United States or (b)(i) a majority of our executive officers or directors may not be United States citizens or residents, (ii) more than 50 percent of our assets cannot be located in the United States and (iii) our business must be administered principally outside the United States.
If we were to lose our foreign private issuer status, we would be required to comply with the Exchange Act reporting and other requirements applicable to US domestic issuers, which are more detailed and extensive than the requirements for
27
foreign private issuers. For instance, we would be required to change our basis of accounting from IFRS as issued by the IASB to US GAAP, which we expect would be difficult and costly and could also result in potentially material changes to historical financial statements previously prepared on the basis of IFRS. We may also be required to make changes in our corporate governance practices in accordance with various SEC and NYSE rules. The regulatory and compliance costs to us under US securities laws could be significantly higher than the costs we will incur as a foreign private issuer. As a result, a loss of foreign private issuer status would increase our legal and financial compliance costs and would make some activities highly time-consuming and costly. If we were required to comply with the rules and regulations applicable to US domestic issuers, it would make it more difficult and expensive for us to obtain director and officer liability insurance, and we could be required to accept reduced coverage or incur substantially higher costs to obtain coverage. These rules and regulations could also make it more difficult for us to attract and retain qualified members of our Board of Directors.
Our status as a Swiss corporation means that our shareholders enjoy certain rights that may limit our flexibility to raise capital, issue dividends and otherwise manage ongoing capital needs.
Swiss law reserves for approval by shareholders certain corporate actions over which a board of directors would have authority in some other jurisdictions. For example, shareholders must approve the payment of dividends and cancellation of treasury shares. Swiss law also requires that our shareholders themselves resolve to, or authorize our Board of Directors to, increase our share capital. While our shareholders may authorize share capital that can be issued by our Board of Directors without additional shareholder approval, Swiss law limits this authorization to 50% of the issued share capital at the time of the authorization. The authorization, furthermore, has a limited duration of up to two years and must be renewed by the shareholders from time to time thereafter in order to be available for raising capital. Additionally, Swiss law grants pre-emptive rights to existing shareholders to subscribe for new issuances of shares and advance-subscription rights to subscribe for convertible bonds or similar instruments with conversion or option rights. A resolution adopted at a shareholders' meeting by a qualified majority of two-thirds of the votes represented, and the absolute majority of the nominal value of the shares represented, may restrict or exclude such pre-emptive or advance-subscription rights in certain limited circumstances. Swiss law also does not provide as much flexibility in the various rights and regulations that can attach to different categories of shares as do the laws of some other jurisdictions. These Swiss law requirements relating to our capital management may limit our flexibility, and situations may arise where greater flexibility would have provided benefits to our shareholders.
It may be difficult to enforce US judgments against us.
We are organized under the laws of Switzerland. As a result, it may not be possible for investors to effect service of process within the United States upon us or upon such persons or to enforce against them judgments obtained in US courts, including judgments in actions predicated upon the civil liability provisions of the federal securities laws of the United States. We have been advised by our Swiss counsel that there is doubt as to the enforceability in Switzerland of original actions, or in actions for enforcement of judgments of US courts, of civil liabilities to the extent predicated upon the federal and state securities laws of the United States. Original actions against persons in Switzerland based solely upon the US federal or state securities laws are governed, among other things, by the principles set forth in the Swiss Federal Act on International Private Law. This statute provides that the application of provisions of non-Swiss law by the courts in Switzerland shall be precluded if the result is incompatible with Swiss public policy. Also, mandatory provisions of Swiss law may be applicable regardless of any other law that would otherwise apply.
Switzerland and the United States do not have a treaty providing for reciprocal recognition and enforcement of judgments in civil and commercial matters. The recognition and enforcement of a judgment of the courts of the United States in Switzerland are governed by the principles set forth in the Swiss Federal Act on Private International Law. This statute provides in principle that a judgment rendered by a non-Swiss court may be enforced in Switzerland only if:
|
▪
|
the non-Swiss court had jurisdiction pursuant to the Swiss Federal Act on Private International Law;
|
|
▪
|
the judgment of such non-Swiss court has become final and non-appealable;
|
|
▪
|
the judgment does not contravene Swiss public policy;
|
|
▪
|
the court procedures and the service of documents leading to the judgment were in accordance with the due process of law; and
|
|
▪
|
no proceeding involving the same position and the same subject matter was first brought in Switzerland, or adjudicated in Switzerland, or was earlier adjudicated in a third state and this decision is recognizable in Switzerland.
|
28
|
ITEM 4.
|
INFORMATION ON THE COMPANY
|
|
4.A.
|
HISTORY AND DEVELOPMENT OF THE COMPANY
|
General Corporate Information
Alcon is a stock corporation (
Aktiengesellschaft
) organized under the laws of Switzerland in accordance with article 620 et seq. of the Swiss Code of Obligations and registered with the Swiss Register of Commerce under registration number CHE‑234.781.164. Alcon is registered in the Swiss Register of Commerce under each of Alcon AG, Alcon SA and Alcon Inc., all of which are stated in Alcon's Articles of Incorporation (our "Articles of Incorporation") as our corporate name. Alcon was formed for an unlimited duration, effective as of the date of the registration of Alcon in the Swiss Register of Commerce on September 21, 2018. As a result of Novartis’ Spin-off of Alcon and its consolidated subsidiaries on April 9, 2019, Alcon became an independent, standalone corporation. Alcon’s shares are listed on the SIX and the NYSE under the ticker symbol “ALC.”
Alcon is domiciled in Fribourg, Switzerland and our registered office is located at Rue Louis‑d’Affry 6, 1701 Fribourg, Switzerland. Our headquarters is located in Geneva, Switzerland at the following address: Chemin de Blandonnet 8, 1214 Vernier, Geneva, Switzerland. Our telephone number is +41 58 911 2110. Our principal website is
www.alcon.com
. The information contained on our website is not a part of this Form 20‑F.
General Development of Business
Alcon was originally founded in 1945 by pharmacists Robert Alexander and William Conner, who opened a small pharmacy under the “Alcon” name in Fort Worth, Texas. In 1947, Alcon Laboratories, Inc. was first incorporated and began manufacturing specialty pharmaceutical products to address ocular health needs. In the succeeding years, Alcon began operating internationally with the opening of an office in Canada and first formed its surgical division.
In 1977, Alcon was acquired by a Swiss subsidiary of Nestlé S.A. and, consequently, Alcon began operating as a wholly owned subsidiary of Nestlé until 2002. In 2001, the name of the entity was officially changed to Alcon, Inc. and, on March 20, 2002, Nestlé completed an initial public offering of approximately 25% of the outstanding common shares of Alcon, Inc. From March 20, 2002 until its 2011 merger into Novartis discussed below, Alcon was publicly listed and traded on the New York Stock Exchange under the symbol “ACL”.
On July 7, 2008, Nestlé sold to Novartis approximately 25% of the then outstanding Alcon shares and granted Novartis an option for Novartis to acquire Nestlé’s remaining shares in Alcon beginning in 2010. On August 25, 2010, Novartis exercised its option and purchased the remaining approximately 52% of the total outstanding Alcon shares owned by Nestlé. Following this purchase, Novartis owned an approximate 77% interest in Alcon. On December 14, 2010, Novartis entered into a definitive agreement to acquire the remaining 23% of Alcon through a merger of Alcon, Inc. into Novartis in consideration for Novartis shares and a contingent value amount. The merger was consummated on April 8, 2011, creating the Alcon Division within Novartis. In connection with the Novartis acquisition of Alcon, Novartis also merged its then‑existing contact lens and contact lens care unit, CIBA Vision, and certain of its ophthalmic pharmaceutical products into Alcon, and moved the generic ophthalmic pharmaceutical business conducted by Alcon prior to the merger into the Sandoz Division of Novartis. In 2016, Novartis moved the management and reporting of Alcon ophthalmic pharmaceutical and over‑the‑counter ocular health products to the Innovative Medicines Division of Novartis. Subsequently, effective January 1, 2018, Novartis returned to Alcon the management and reporting of over‑the‑counter ocular health products and certain surgical diagnostic medications previously transferred from Alcon in 2016.
On June 29, 2018, Novartis announced its intention to seek shareholder approval for the Spin‑off of its Alcon Division, following the complete legal and structural separation of Alcon into a standalone company consisting of Alcon Inc. and its consolidated subsidiaries. Novartis shareholders approved the Spin-off on February 28, 2019, and the Spin-off transaction was consummated on April 9, 2019. Following the Spin-off, Alcon became a standalone, independent company.
Significant Acquisitions, Dispositions and other Events
In 2012, we began a multi‑year software implementation project to standardize our processes, enhance data transparency and globally integrate our fragmented and aging information technology systems across our commercial, supply and manufacturing operations worldwide, through a new foundation of Systems, Applications and Products in Data Processing ("SAP"), which is an Enterprise Resource Planning, or ERP, software platform. We expect to pay a total of approximately $850
29
million relating to the implementation of the new ERP system. Through December 31, 2019, the total amount paid with respect to the implementation was $584 million.
In addition, we have made significant investments in certain of our manufacturing facilities to enhance our production capabilities. For more information, see “Item 4.D. Property, Plants and Equipment—Major Facilities”.
In the past three years, we have also entered into certain acquisition transactions, including the acquisition of 100% of the outstanding shares and equity of ClarVista Medical, Inc. on September 20, 2017, TrueVision Systems, Inc. on December 19, 2018, Tear Film Innovations, Inc. on December 17, 2018 and PowerVision, Inc. on March 13, 2019. For further details on certain of our significant transactions in 2019, 2018 and 2017, see “Item 5. Operating and Financial Review and Prospects—5.A. Operating results—Factors Affecting Comparability of Period to Period”.
On September 23, 2019, we refinanced certain shorter-term borrowings through the issuance of Senior Notes (“Notes”) with maturity dates 2026, 2029, and 2049. The Notes were issued by Alcon Finance Corporation in a private placement and guaranteed by the Company. The total notional amount of the Notes is $2.0 billion. The Notes were issued at a discount totaling $7 million, which was recorded as a reduction to the carrying value of the Notes and will be amortized to Interest expense over the term of the Notes. AFC incurred $15 million of debt issuance costs, which were recorded as a reduction to the carrying value of the Notes and will be amortized to Other financial income & expense over the term of the Notes. The Notes consist of the following:
|
▪
|
Series 2026 Notes - $0.5 billion due in 2026 issued at 99.5%, 2.750% interest is payable twice per year in March and September, beginning in March 2020 (“2026 Notes”).
|
|
▪
|
Series 2029 Notes - $1.0 billion due in 2029 issued at 99.6%, 3.000% interest is payable twice per year in March and September, beginning March 2020 (“2029 Notes”).
|
|
▪
|
Series 2049 Notes - $0.5 billion due in 2049 issued at 99.8%, 3.800% interest is payable twice per year in March and September, beginning March 2020 (“2049 Notes”).
|
The funds borrowed through the issuance of the Notes were used to refinance the $1.5 billion Bridge Facility and $0.5 billion Facility A, both of which had been entered into on March 6, 2019. For more information on the Notes, see our Consolidated Financial Statements.
On November 19, 2019, we announced a multi-year transformation program including organizational realignment, process simplification, and the creation of global shared services designed to create efficiencies for reinvestment into key growth drivers. We estimate that the transformation program will result in total charges of approximately $300 million by 2023.
The SEC maintains an Internet website at
www.sec.gov
that contains reports, proxy and information statements and other information regarding companies that file documents electronically with the SEC. Our Internet website is
www.alcon.com
. The information included on our internet website or the information that might be accessed through such website is not included in this Annual Report and is not incorporated into this Annual Report by reference.
30
|
4.B.
|
BUSINESS OVERVIEW
|
Overview
Alcon is the largest eye care company in the world, with
$7.4 billion
in net sales during the year ended December 31, 2019. We research, develop, manufacture, distribute and sell a full suite of eye care products within two key businesses: Surgical and Vision Care. Based on sales for the year ended December 31, 2019, we are the number one company by global market share in the ophthalmic surgical market and the number two company by global market share in the vision care market. We employ over 20,000 associates from more than 90 nationalities, operating in over 70 countries and serving consumers and patients in over 140 countries. We believe our market leading position and global footprint allow us to benefit from economies of scale, maximize the potential of our commercialized products and pipeline and will permit us to effectively grow the market and expand into new product categories.
Our Surgical business is focused on ophthalmic products for cataract surgery, vitreoretinal surgery, refractive laser surgery and glaucoma surgery. Our broad surgical portfolio includes implantables, consumables and surgical equipment required for these procedures and supports the end-to-end needs of the ophthalmic surgeon. Our Vision Care business comprises daily disposable, reusable and color-enhancing contact lenses and a comprehensive portfolio of ocular health products, including devices and over-the-counter products for dry eye, over-the-counter products for contact lens care and ocular allergies, as well as ocular vitamins and redness relievers. Alongside our world-class products, Alcon provides best-in-class service, training, education and technical support for our customers.
Our Surgical and Vision Care businesses are complementary and benefit from synergies in R&D, manufacturing, distribution and consumer awareness and education. This allows us to position ourselves as a trusted partner for eye care products across the continuum of care from retail consumer, to optometry, to surgical ophthalmology. For example, in R&D, we can apply our expertise in material and surface chemistry to develop innovative next-generation products for both our IOL and contact lens product lines. Similarly, our global commercial footprint and expertise as a global organization provide us with product development, manufacturing, distribution and commercial promotion and marketing knowledge that can be applied to both of our businesses.
We are dedicated to providing innovative products that enhance quality of life by helping people see brilliantly. Our strong foundation is based on our longstanding success as a trusted brand, our legacy of industry firsts and advancements, our leading positions in the markets in which we compete and our continued commitment to substantial investment in innovation. With over 70 years of history in the ophthalmic industry, we believe the Alcon brand name is synonymous with innovation, quality, service and leadership among eye care professionals worldwide.
Our Markets
Overview
We currently operate in the global ophthalmic surgical and vision care markets, which are large, dynamic and growing. As the world population grows and ages, the need for quality eye care is expanding and evolving, and we estimate that the size of the eye care market in which we operate was approximately $25 billion and is projected to grow at approximately 4% to 5% per year from 2019 to 2024.
Although it is estimated that 80% of all visual impairments are currently preventable, treatable or curable, we operate in markets that have substantial unmet medical and consumer needs. For example, based on market research, it is estimated that there are currently 20 million people globally that are blind from treatable cataracts, 1.7 billion who suffer from presbyopia, 153 million with uncorrected refractive errors, 93 million with diabetic retinopathy, 67 million living with glaucoma and approximately 352 million affected by dry eye, among other unaddressed ocular health conditions. In addition, there are over 1 billion people living with some form of visual impairment, as well as 70% of the global population needing basic vision correction. Below is a brief description of these ocular disorders.
31

Our Surgical and Vision Care products are targeted at addressing many of these unmet medical and consumer needs. We expect the surgical and vision care markets to continue to grow, driven by multiple factors and trends, including but not limited to:
|
•
|
Aging population with growing eye care needs
: A growing aging population continues to drive the increased prevalence of eye care conditions worldwide, as the number of persons aged 60 years or over is expected to more than double by 2050, rising from 962 million globally in 2017 to 2.1 billion in 2050.
|
|
•
|
Innovation improving the quality of eye care
: Technology innovation in eye care is driving an increased variety of products that more effectively treat eye conditions. Given the importance of vision correction and preservation, which can provide a high return on healthcare spend, the resulting better patient outcomes are leading to increased coverage and reimbursement opportunities from governmental and private third-party payers, expanding patient access to such eye care products.
|
|
•
|
Increasing wealth and growth from emerging economies
: It is estimated that between 2015 and 2030, the middle class population in emerging markets will grow by approximately 1.5 billion people, from 2.0 billion to 3.5 billion; this major demographic shift is generating a large, new customer base with increased access to eye care products and services along with the resources to pay for them. The expansion of training opportunities for eye care professionals in emerging markets is also leading to increased patient awareness and access to premium eye care products and surgical procedures, facilitating their growth.
|
|
•
|
Increasing prevalence of myopia, progressive myopia and digital eye strain
: It is estimated that by 2050, half of the world's population (nearly five billion people) will be myopic. Further, the modern work environment, along with leisure preferences, have increased the number of hours people spend in front of a screen, adversely impacting vision and increasing the risk of progressive myopia and digital eye strain.
|
The Surgical Market
The surgical market in which we operate was estimated to be $10 billion and is projected to grow at 4% per year from 2019 to 2024. The surgical market includes sales of implantables, consumables, and surgical equipment, including associated technical, clinical and service support and training. Surgical implantables are medical devices designed to remain in the eye, such as monofocal and AT-IOLs placed in the eye during cataract surgery. Consumables include hand-held instruments, surgical solutions, equipment cassettes, patient interfaces and other disposable items typically used during a single ophthalmic surgical procedure. Finally, surgical equipment includes multi-use surgical consoles, lasers and diagnostic instruments used across procedures to enable surgeons to visualize and conduct ophthalmic surgeries.
The major conditions of the eye for which surgical products and equipment are offered include cataracts, vitreoretinal disorders, refractive errors such as myopia, hyperopia and astigmatism, glaucoma and corneal disease. For cataracts, surgical removal of the clouded lens followed by insertion of a transparent artificial replacement lens, called an intraocular lens, is the standard treatment. Vitreoretinal surgery, which allows a surgeon to operate directly on the retina or on membranes or tissues that have covered the retina, is indicated for the treatment of various conditions such as diabetic retinopathy, trauma, tumors, complications of surgery on the front of the eye and pediatric disorders. Finally, for treatment of myopia, hyperopia
32
and astigmatism, laser refractive surgery targeting the cornea, such as LASIK, offers an alternative to eyeglasses or contact lenses.
Cataract, vitreoretinal, refractive and glaucoma surgeries are generally performed in hospitals or ambulatory surgery centers and are supported through a network of eye clinics, ophthalmic surgery offices and group purchasing organizations. The primary ophthalmic surgical procedures for cataract, vitreoretinal, and glaucoma surgery are broadly reimbursed in most mature markets. Third-party coverage or patient co-pay options are also available for refractive laser correction and AT-IOLs. Finally, a growing private pay market for premium surgical devices provides a mutually beneficial environment for patients, providers and medical device companies by allowing patients to pay the non-reimbursable cost of a procedure associated with selecting premium devices, such as AT-IOLs.
The surgical market in which we participate is projected to grow at a compound annual growth rate of approximately 4% from 2019 through 2024. In particular, growth drivers in the surgical market include:
|
•
|
Global growth of cataract and vitreoretinal procedures, driven by an aging population;
|
|
•
|
Increased access to care, for example, in emerging markets and other markets outside the US where the cataract surgery rate is 3.2 procedures per 1,000 people as compared to 12.7 in the US;
|
|
•
|
Higher uptake of premium patient-pay technologies, for example AT-IOL penetration is only 7% outside the US versus 14% in the US;
|
|
•
|
Increased adoption of advanced technologies, for example, improved diagnostic instruments, surgical options for glaucoma management, and the growing use of phacoemulsification during cataract removal, which is utilized in less than 50% of cases in emerging markets versus over 95% in the US; and
|
|
•
|
Eye disease as a comorbidity linked to the global prevalence of diabetes, which has nearly doubled from 4.7% in 1980 to 8.5% in 2014, combined with improving diagnostics capabilities and new product innovations, driving uptake of premium procedures.
|
The Vision Care Market
The vision care market in which we operate was estimated to be $15 billion and is projected to grow at 5% per year from 2019 to 2024. The vision care market is comprised of products designed for ocular care and consumer use. Products are largely categorized across two product lines: contact lenses and ocular health.
Contact lenses are thin lenses placed directly on the surface of the eye that are commonly used to treat refractive errors such as myopia, hyperopia, astigmatism and presbyopia. They are also often worn for additional reasons, such as aesthetic or cosmetic enhancement, to improve peripheral vision or to achieve spectacle independence. Contact lenses are frequently classified according to their modality, with daily and reusable modalities being the most common. Daily contact lenses are designed for one-time use and are disposed of every day. Reusable contact lenses are designed for periodic use and require daily cleaning and maintenance. Contact lenses may also be classified by their design, with spherical, multifocal and toric designs being the most common. The majority of contact lenses have a spherical design to address the most common visual acuity needs (e.g., myopia). Beyond the standard spherical designs, contact lenses also come in designs to address astigmatism (called toric designs), presbyopia (called multifocal designs) and to change the appearance of the eye (called cosmetic lens designs). The contact lens market was estimated to be approximately $9 billion.
Maintaining ocular health is also an essential part of people's daily lives. Ocular health products can address conditions such as dry eye, ensure effective contact lens care, supplement overall eye health, or provide temporary relief from allergies and related symptoms, such as red eye. The ocular health market was estimated to be approximately $6 billion.
Dry eye is a common condition that occurs when the eye's natural tear film is disturbed or insufficient. It leads to discomfort and potentially serious and chronic vision deterioration and loss, which and can be addressed by artificial tear products and thermal pulsation devices among other treatments. In addition, the increased use of diagnostic tools can help improve the treatment recommendations of eye care professionals for dry eye.
Effective contact lens care is important for any reusable contact lens user, and is a significant factor in reducing the risk of infection and irritation associated with contact lens use. It is also an important factor in maintaining visual acuity and increasing the comfort of wearing reusable contact lenses. When used correctly, contact lens care products remove contaminants from the surface of the contact lens. Lens rewetting drops may also be used to rehydrate the lens during wear and to clear away surface material.
Ocular health is frequently supported by the use of ocular vitamins, which are dietary supplements often sold over the counter and formulated to support eye health. Finally, ocular health products also address allergic conjunctivitis, which occurs when the conjunctiva of the eye becomes swollen or inflamed due to a reaction to pollen, dander, mold, or other allergy-causing
33
substances. 'Allergy eyes' can become red and itchy very quickly. Treatment for allergy eye includes medications, such as antihistamines, and combinations of antihistamines and redness relievers.
The primary customers of the vision care market include optometrists, ophthalmologists, and other eye care professionals, retailers, optical chains and pharmacies, as well as distributors that resell directly to smaller retailers and eye care professionals, who sell the products to end-users. The vision care market is primarily private pay, with patients substantially paying for contact lenses and ocular health products out-of-pocket. Partial reimbursement is available in some countries for visits to eye care professionals and a portion of either spectacle or contact lens costs.
The vision care market in which we participate is projected to grow at a compound annual growth rate of approximately 5% from 2019 through 2024, driven mainly by:
|
•
|
Continued modality shift to daily disposable lenses from reusable lenses and the resulting sales premium (an increase of 2
-
3x sales per patient, after customary rebates and discounts) associated with daily disposable wearers as compared to users of reusable lenses;
|
|
•
|
Advancements in specialty lenses combined with increasing demand for toric, multifocal and cosmetic lenses, which command an approximately 15
-
30% pricing premium over spherical lenses, allowing patients to continue wearing contact lenses as they become older and helping to expand the market;
|
|
•
|
A significant population of approximately 194 million undiagnosed dry eye patients, with an additional 42 million self-diagnosed dry eye patients using unsuitable products for treatment, and advances in diagnostics and ocular health treatments, facilitating the increase in patient awareness of dry eye and treatment;
|
|
•
|
Growing access and consumption of vision care products in emerging markets such as Asia, which had an estimated single-digit contact lens penetration as compared to double digits in the developed world; and
|
|
•
|
Increasing consumer access through the expansion of distribution models, including internet sales and other direct-to-consumer channels.
|
Our Business
Overview
With
$7.4 billion
in net sales during the year ended December 31, 2019, we are the number one eye care company worldwide by revenues. Our broad range of products represents one of the most complete portfolios in the ophthalmic device industry, and comprises high-quality and technologically advanced products across all major product categories in the surgical and vision care markets. Our Surgical and Vision Care products are used in treating multiple ocular health conditions and offer leading eye care solutions for patients throughout their lives.
34
Our leadership position across most of our product categories enhances our ability to extend our product offering through the launch of new and innovative products, and to expand our geographic reach into ophthalmic markets worldwide. Our Surgical business had approximately
$4.2 billion
in net sales of implantables, consumables and equipment, as well as services and other surgical products, and our Vision Care business had approximately
$3.2 billion
in net sales of our contact lens and ocular health products, during the year ended December 31, 2019. The US accounted for
41%
of our sales during the year ended December 31, 2019.
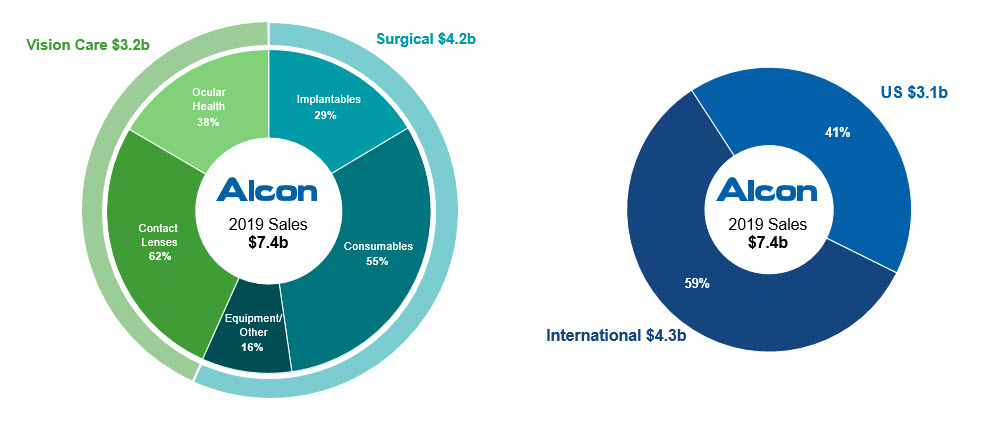
We believe the Alcon brand name is synonymous with innovation, quality, service and leadership among eye care professionals worldwide. In each of our markets, we rely on our strong relationships with eye care professionals and consumers to attract and retain customers and expand the market. We customize our selling efforts with the goal of surrounding eye care professionals with Alcon representatives that can help address each aspect of a customer's needs. Our field force supplements the direct promotion of our products by providing customers with access to clinical education programs, hands on training, data from clinical studies and technical service assistance.
We have 18 state-of-the-art manufacturing facilities that employ our proprietary technologies and know-how. We believe our global footprint, knowledge base in manufacturing, state-of-the-art facilities and capacity planning enable us to handle increased levels of product demand and product complexity. Furthermore, our global manufacturing and supply chain allows us to leverage economies of scale and reduce cost per unit as we ramp up production.
We have also made one of the largest commitments to research and development of any surgical and vision care company, with over 1,200 associates worldwide researching and developing treatments for vision conditions and eye diseases, and have sought innovation from both internal and external sources. In 2019, we invested
$656 million
in research and development, representing
9%
of our total 2019 net sales. In addition to our in-house R&D capabilities, we also consider external innovation opportunities and routinely screen for companies developing emerging technologies that we believe could enhance our existing product offerings or develop into innovative new products. We intend to continue to pursue acquisition, licensing and collaboration opportunities as part of our goal of remaining a market leader in innovation.
Our Surgical Business
We hold the number one position in the global surgical market, offering implantable products, consumables and equipment for use in surgical procedures to address cataracts, vitreoretinal conditions, refractive errors and glaucoma. Our Surgical business has the most complete line of ophthalmic surgical devices in the industry, creating a "one-stop shop" for our customers that we consider to be a key differentiator for our business. For the year ended December 31, 2019, our Surgical business had
$4.2 billion
in net sales.
35
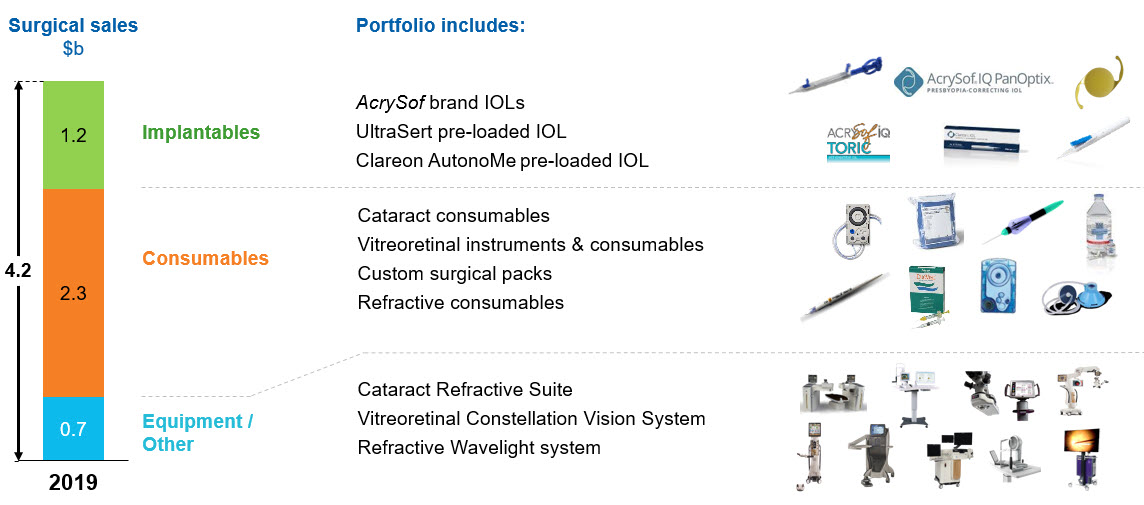
Our Surgical portfolio includes implantable devices, consumables and equipment, as well as services and other ancillary surgical products. We have the most extensive global installed base of surgical equipment in the industry, including the largest installed base of cataract phacoemulsification consoles and vitrectomy consoles. Our global installed equipment base drives pull-through sales of consumables specific to our equipment and helps cross-promote the sales of our implantable devices. Our key surgical equipment offerings include the
Centurion
vision system for phacoemulsification and cataract removal, our
Constellation
vision system for vitreoretinal surgery and our
WaveLight
refractive lasers used in LASIK and other laser-based vision correction procedures, including topography-guided procedures marketed under the
Contoura
brand. The key brands in our implantables portfolio include our
AcrySof
family of IOLs, with offerings from monofocal IOLs for basic cataract surgery to AT-IOLs for the correction of presbyopia, such as our
PanOptix
brand, and astigmatism at the time of cataract surgery. Our
UltraSert
and
Clareon AutonoMe
pre-loaded IOL delivery systems are intended to reduce lens handling and simplify the surgical procedure. Alongside our implantable business, we sell a broad line of consumable products that support ophthalmic surgical procedures, such as viscoelastic products, surgical solutions, incisional instruments, such as our
MIVS
platform, and dedicated consumables, including fluidics cassettes and patient interfaces, which work with Alcon equipment. The Alcon consumables portfolio also includes our
Custom Pak
surgical procedure pack, which can be custom built for the surgeon and which includes drapes, incisional instruments and all of the materials needed to perform a surgery.
Across our Surgical portfolio, we sell a tiered offering of products intended to meet the specific needs of customers in markets around the world at different price points. Newly launched offerings that bring considerable technology innovation to the market are typically introduced at a price premium to offset the cost of research and development. As these products age and/or competitive products advance, prices typically trend downward, requiring continuous innovation cycles to maintain and/or grow our margins. We also develop specific products to match customer needs in different customer segments, for example, premium-tier and mid-tier surgical consoles that can be manufactured and sold at different price points in different markets.
Our Vision Care Business
Our Vision Care business consists of an extensive portfolio of contact lens and ocular health products, aimed at helping consumers see better. Our product lines include daily disposable, reusable and color-enhancing contact lenses. We also offer a comprehensive portfolio of ocular health products, including devices and over-the-counter products for dry eye, over-the-counter products for contact lens care and ocular allergies, as well as ocular vitamins and redness relievers. With
$3.2 billion
in vision care net sales for the year ended December 31, 2019, we aim to continue to innovate across our vision care portfolio to improve the lives of consumers and eye care professionals around the world.
36
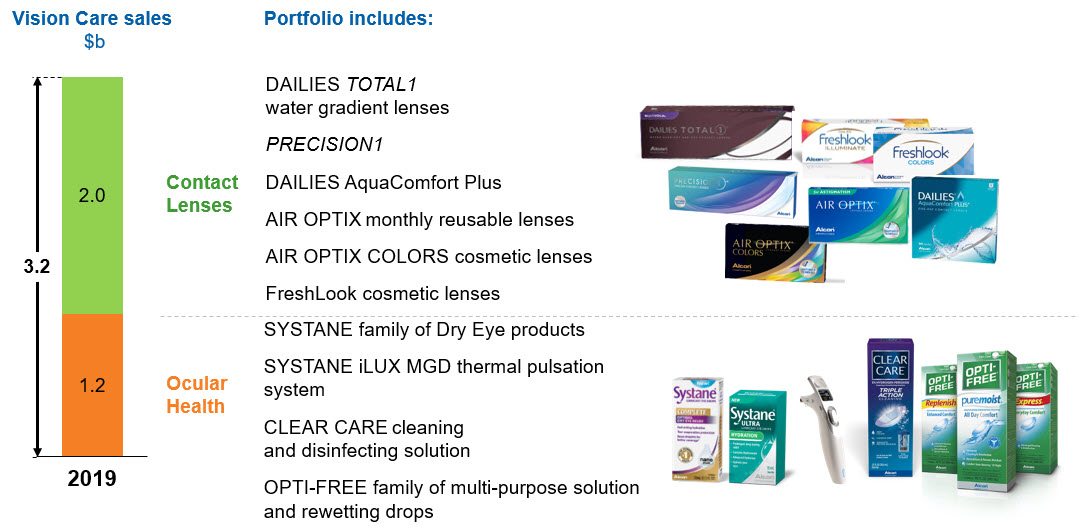
We have a broad portfolio of daily disposable, reusable and color-enhancing contact lenses, including
Dailies
and
Air Optix
, two of our key brands. Our
Dailies
product line includes
DAILIES AquaComfort PLUS
and
DAILIES TOTAL1
, the first and only water gradient contact lens in the market, which is also offered in a multifocal design to address the fast growing presbyopia market. We designed
DAILIES TOTAL1
to be a super-premium lens positioned to compete at a premium price point in the contact lens market.
PRECISION1
, recently launched in select markets, is a daily disposable lens priced in between the super-premium
DAILIES TOTAL1
and the more value-conscious
DAILIES AquaComfort PLUS
. Our
Air Optix
monthly replacement product line features silicone hydrogel contact lenses in monofocal, astigmatism-correcting, and multifocal options, as well as
Air Optix Colors
and
Air Optix plus HydraGlyde
contact lenses. Our key brands in our ocular health portfolio include the
Systane
family of artificial tear and related dry eye products, as well as the
Opti-Free
and
Clear Care
lines of multi-purpose and hydrogen peroxide disinfecting solutions, respectively.
Sales of our contact lens and ocular health products are influenced by optometrist and other eye care professional recommendations, our marketing and consumer education efforts and consumer preferences. In addition to price, contact lenses compete on functionality, design and comfort, while ocular health products compete largely on product attributes, brand familiarity and professional recommendations. For our contact lens and ocular health products, we typically compete in the premium price segments of the market and we use improvements in functionality, design and consumer convenience to maintain our pricing position over time.
Our Strengths
We have a strong foundation based on robust industry expertise, leading brands and excellence in customer service, backed by more than 70 years of history as a trusted brand. Our strengths include:
|
•
|
Global leader in highly attractive markets with the most complete brand portfolio.
With
$7.4 billion
in net sales in the year ended December 31, 2019, we are the leader in an attractive eye care market, which is supported by favorable population megatrends and is expected to grow at approximately 4% to 5% per year from 2019 to 2024. Our Surgical business is the market leader in sales of ophthalmic equipment used in the operating room and is supported by the largest installed base of equipment worldwide, which we use to cross-promote our surgical consumables and IOLs. In our Vision Care business, our extensive portfolio of contact lens and ocular health products includes well-recognized brands such as
Dailies
,
Systane
and
Opti-Free
. We believe our global leadership position and extensive brand portfolio allow us to benefit and build on the robust fundamentals driving growth in our markets.
|
|
•
|
Innovation-focused with market leading development capabilities and investment.
We have made one of the largest commitments to research and development in the eye care market, with proven R&D capabilities in the areas of optical design, material and surface chemistry, automation and equipment platforms. Currently, we employ over 1,200 individuals dedicated to our research and development efforts, including physicians, doctors of optometry and PhDs. In addition, we actively seek opportunities to collaborate with third parties on advanced technologies to support our eye care business.
|
37
|
•
|
Global scale and reach supported by high-quality manufacturing network.
We have an extensive global commercial footprint that provides us with the scale and reach to support future growth, maximize the potential of new launches, enter new geographies efficiently and to take advantage of the large, dynamic and growing surgical and vision care markets. Our commercial footprint, which includes operations in over 74 countries, reaches consumers and patients in over 140 countries and is supported by over 3,000 sales force associates, 18 state-of-the-art manufacturing facilities employing our proprietary technologies and know-how, and our extensive global regulatory capability. Our extensive sales and distribution network, supported by our market leadership position and focus on innovation and customer experience, enhances our ability to expand our geographic reach and extend our product offerings through the launch of new and innovative products worldwide.
|
|
•
|
Outstanding customer relationships and a trusted reputation for customer service, training and education.
We believe that maintaining the highest levels of service excellence in our customer experience is a critical success factor in our industry. In our Vision Care business, we regularly meet with eye care practitioners to gain feedback and insights on our products and consumers' needs. We also provide training support at our approximately 30 state-of-the-art interactive training centers around the world, as well as through numerous digital and event-based training programs that we provide for practitioners, clinical support staff, students, residents, patients and consumers. In each of our businesses, we have built and maintained our relationships with key stakeholders to establish our trusted reputation in the industry.
|
|
•
|
World leading expertise in eye care led by a first-class management team.
Our expertise in eye care is driven by our more than 70-year history in the industry and is supported by a high-quality workforce of more than 20,000 associates. We believe our institutional knowledge provides a competitive advantage because our associates' industry expertise, relationships with our customers and understanding of the development, manufacture and sale of our products helps us to better identify new customer needs, assess markets for entry and identify promising technologies. In addition, we believe the diverse experience of our management team in running complex businesses allows them to add significant value to our company. In particular, we benefit from having a management team with an extensive background in the medical device industry. Led by David J. Endicott, our Chief Executive Officer, our management team's deep knowledge of eye care has allowed us to build a more nimble medical device culture within Alcon and created excitement among our workforce for our mission.
|
Our Strategy
Our going-forward strategy builds on five key pillars in order to generate sustainable and profitable growth:
|
•
|
Maximize the potential of our near-term portfolio by growing key products.
In Surgical, we plan to build on our leading position in the IOL market through the launch of new AT-IOLs, where premium pricing drives market value. In addition, we expect improved diagnostics and new optical designs will address historical barriers to AT-IOL adoption to further grow this patient-pay market. We will also continue to invest behind our presbyopia-correcting products (e.g.
Panoptix
), and will continue to invest in our vitreoretinal equipment and consumables, where we also see meaningful opportunities for near-term growth. In Vision Care, we intend to maintain and grow our leading position in most of our product categories through increased eye care professional and consumer education, supported by continuous production innovation. We intend to expand our position in the daily disposable category behind our
DAILIES TOTAL1 and PRECISION1
family of products. We also aim to expand the dry eye product market by leveraging our well-recognized
Systane
family of eye drops and increasing investment in dry eye education and awareness, where we see a significant unmet need and an opportunity for robust market growth.
|
|
•
|
Accelerate innovation and deliver the next wave of technologies.
We are committed to accelerating innovation by continuing to be one of the market leaders in investment in ophthalmic research and development. The R&D activities of our Surgical business are focused on expanding our AT-IOL portfolio to further improve surgical and refractive outcomes, including through the use of advanced optics, light adjustable materials, accommodating lenses and modular platforms. We are also developing next-generation lasers, robotics and other equipment for cataract, vitreoretinal and laser-refractive surgery, as well as improved visualization equipment. In our Vision Care business, our focus is on developing and launching new contact lens materials, coatings and designs to extend our product lines and improve patient comfort, as well as on new products to expand our portfolio of dry eye diagnostic and treatment, presbyopia and ocular health products. Finally, we expect to continue to supplement our internal innovation investments by identifying and executing on attractive acquisition, licensing and collaboration opportunities with leading academic institutions and early-stage companies.
|
|
•
|
Capture opportunities to expand markets and pursue adjacencies.
We believe there is a significant opportunity for growth in markets around the world due to under-penetration of both premium surgical devices, such as AT-IOLs, and of our Vision Care portfolio. We intend to facilitate this growth by continued investment in promotion and
|
38
customer education across all of our markets. In emerging markets in particular, we believe that the growing number of eye care professionals and dedicated eye hospitals, increased levels of affluence, improving technology access and better patient awareness will increase the adoption of our products. In addition, we believe we have significant opportunities to expand into adjacent product categories in which Alcon has not significantly participated in the past, through a combination of internal development efforts and potential bolt-on mergers and acquisitions activity. These opportunities include office-based diagnostics, surgical visualization, pharmaceuticals, solutions for myopia control and consumer driven ocular health products, where we expect our eye care expertise and global commercial footprint will allow us to attract and retain new customers.
|
•
|
Support new business models to expand customer experience.
In Surgical, we intend to continue to identify new business models that benefit healthcare providers and improve access to leading Alcon products and technologies. For example, we are pursuing value-based business models that reward improved patient outcomes, as well as models that contract the entire procedure versus individual products. In Vision Care, where e-commerce entries have created some disruption of traditional sales channels, we believe that digital technology can address pain points experienced in existing paths to purchase. We intend to continue investing and innovating in digital capabilities to develop new business models in response to channel shifts and the increase in direct-to-consumer influence.
|
|
•
|
Leverage infrastructure to improve operating efficiencies and margin profile over time.
With the significant organizational and infrastructure investments we have made over the last several years, we believe we have established a stable foundation that will allow us to continue to enhance the productivity of our commercial resources and meaningfully improve our core operating income margins over time. Further, we intend to improve the mix of our products, implement further supply chain efficiency initiatives and support new lower-cost manufacturing platforms to drive future operating profit and cash flows.
|
Our Industry
Selected Conditions That Are Treated By Eye Surgery and Surgical Products
Below are the major conditions of the eye that are treated by surgeries for which we offer surgical products and equipment.
Cataracts
A cataract is the progressive clouding of the normally transparent natural lens in the eye. This clouding is usually caused by the aging process, although it can also be caused by heredity, diabetes, environmental factors and, in some cases, medications. As cataracts grow, they typically result in blurred vision and increased sensitivity to light. Cataract formations occur at different rates and may affect one or both eyes. Cataract surgery is one of the most frequently performed surgical procedures. According to the National Eye Institute, cataracts are the leading cause of blindness worldwide even though effective surgical treatment exists. Currently, surgical removal of the clouded lens followed by insertion of a transparent artificial replacement lens, called an IOL, is the preferred treatment for cataracts. The clouded lens is usually removed through a process known as phacoemulsification. During phacoemulsification, an ophthalmic surgeon makes a small surgical incision in the cornea (approximately 2
-
3 millimeters wide) and inserts an ultrasonic probe that breaks up, or emulsifies, the clouded lens while a hollow needle removes the pieces of the lens. Once the cataract is removed, the surgeon inserts an intraocular lens through the same surgical incision. An AT-IOL is a type of IOL that also corrects for refractive errors, like presbyopia and astigmatism, at the time of cataract surgery.
Retinal Disorders
Vitreoretinal procedures involve surgery on the back portion of the eye, namely the retina and surrounding structures. Vitrectomy is the removal of the gel-like substance, known as vitreous, that fills the back portion of the eye. Removal of the vitreous allows a vitreoretinal surgeon to operate directly on the retina or on membranes or tissues that have covered the retina. These procedures typically treat conditions such as diabetic retinopathy, retinal detachment / tears, macular holes, complications of surgery on the front of the eye, diabetic macular edema, trauma, tumors and pediatric disorders. Vitreoretinal surgery can also involve electronic surgical equipment, lasers and hand-held microsurgical instruments as well as gases and liquids that are injected into the eye.
Refractive Errors
Refractive errors, such as myopia, commonly known as near-sightedness, hyperopia, commonly known as farsightedness, and astigmatism, a condition in which images are not focused at any one point, result from an inability of the cornea and the lens to focus images on the retina properly. If the curvature of the cornea is incorrect, light passing through it onto the retina is not properly focused and a blurred image results. For many years, eyeglasses and contact lenses were the only
39
solutions for individuals afflicted with common visual impairments; however, they are not always convenient or attractive solutions. Laser refractive surgery offers an alternative to eyeglasses and contact lenses. Excimer lasers, which are low-temperature lasers that remove tissue without burning, are currently used to correct refractive errors by removing small amounts of tissue to reshape the cornea. These lasers remove tissue precisely without the use of heat and without affecting the surrounding tissue. In the LASIK procedure, the surgeon uses either a femtosecond laser or an automated microsurgical instrument, called a microkeratome, to create a thin corneal flap that remains hinged to the eye. The corneal flap is then folded back and excimer laser pulses are applied to the exposed layer of the cornea to change the shape of the cornea. The corneal flap is then returned to its normal position. LASIK has become the most commonly practiced form of laser refractive surgery globally.
Presbyopia
Presbyopia is another common refractive error in which the natural crystalline lens inside the eye becomes less flexible and loses the ability to focus on close objects. Presbyopia is a vision condition that accompanies the natural aging process of the eye. It cannot be prevented, and affects nearly two billion people worldwide. Although the onset of presbyopia among patients may seem to occur suddenly, generally becoming noticeable when patients reach their mid- to late 30s or early to mid-40s, sight reduction typically occurs gradually over time and continues for the rest of the patient's life. Some signs of presbyopia include difficulty reading materials held close to the reader, blurred vision while viewing a computer screen and eye fatigue along with headaches when reading. Presbyopia can be accompanied by other common vision conditions, such as myopia, hyperopia and astigmatism. Presbyopia, while most commonly managed with reading glasses, can be addressed surgically by the implantation of an AT-IOL that allows for the correction of presbyopia at the time of cataract surgery.
Surgical Glaucoma
Glaucoma, a group of eye conditions that damage the optic nerve, is the second leading cause of blindness worldwide, estimated to affect more than 90 million people around the globe, with only an estimated 32 million people (or approximately 35% of patients) diagnosed. While elevated intraocular pressure ("IOP") was historically considered to be synonymous with glaucoma, it is now known that many patients with glaucoma have normal IOP. Treating glaucoma is typically aimed at lowering IOP for patients with normal or elevated pressure.
Most commonly, glaucoma is managed using medication (e.g., drops). For cases requiring additional intervention, laser-based procedures and conventional surgical techniques, such as filtration surgery and tube shunts, have typically been used to lower IOP. Filtration surgeries, such as trabeculectomy, involve the creation of a new channel to drain aqueous humor from inside the eye. Similarly, tube shunts establish a route for fluid to exit through an implanted device. More recently, a new category of device and procedure-based surgical intervention, known as Micro-Invasive Glaucoma Surgery ("MIGS"), has emerged and is experiencing rapid adoption among both glaucoma and cataract specialists.
Selected Conditions and Eye Care Considerations That Are Addressed By Vision Care Products
Below are the major eye care conditions and considerations that are addressed, treated or supported by our contact lens and ocular health products.
Refractive Errors
Refractive errors such as myopia, hyperopia, astigmatism and presbyopia are commonly addressed by the use of contact lenses. Presbyopia, for example, can be addressed by the use of multifocal contact lenses.
Dry Eye Disease
Dry eye disease is a ubiquitous, complex, and multifactorial condition, and its effect on patients ranges from intermittent and annoying discomfort to a serious, chronic, progressive, and irreversible vision-threatening disorder. The incidence of dry eyes rises with age, and longer life spans and aging populations throughout the world are key contributors to increased demand for treatment. Evolving patterns of work and play also contribute to increased demand for treatment, as more people spend significant amounts of time working on computers and other digital devices. Wealthier, professional and urban population segments are expanding in rapidly emerging economies and other developing nations, and these populations have greater access to health care and more resources with which to acquire treatment. In addition, more sophisticated diagnostic tools and a greater variety of dry eye products and treatments, such as artificial tear products, are offering improved effectiveness and greater relief as they simultaneously stimulate demand.
40
Infections and Contamination due to Inadequate Contact Lens Care
Proper care of contact lenses through compliance with disinfection regimens is important in reducing the risk of infection and irritation associated with the use of reusable contact lenses, as contact lenses are subject to contamination from cosmetics, grease, bacteria, soaps, hand lotions and atmospheric pollutants, and from proteins contained in natural tears. When used properly, contact lens care products remove such contaminants from the surface of the contact lens. In addition, lens rewetting drops may be used to rehydrate the lens during wear and to clear away surface material.
Ocular Allergies
Allergic conjunctivitis occurs when the conjunctiva of the eye becomes swollen from inflammation due to a reaction to pollen, dander, mold or other allergy-causing substances. When the eyes are exposed to allergy-causing substances, which can vary from person-to-person and are often dependent on geography, a substance called histamine is released by the body and causes blood vessels in the conjunctiva to swell. 'Allergy eyes' can become red and itchy very quickly. Seasonal Allergic Conjunctivitis ("SAC") is the most common type of eye allergy. People affected by SAC experience symptoms during certain seasons of the year. Allergy eye can be treated with various ocular health products including medications, such as antihistamines, and combinations of antihistamines and redness relievers.
Our Products
We research, develop, manufacture, distribute and sell eye care products. Our broad range of products represents one of the strongest portfolios in the eye care industry, with high-quality and technologically advanced products across all major product categories in ophthalmic surgical devices and vision care. We are organized into two global business segments: Surgical and Vision Care.
Surgical
We hold the number one position in the global ophthalmic surgical market, offering implantable products, consumables and equipment for use in surgical procedures to address cataracts, vitreoretinal conditions, refractive errors and glaucoma. Our Surgical portfolio includes equipment, instrumentation and diagnostics, IOLs and other implantables, and a broad line of consumables, including viscoelastics, surgical solutions, incisional instruments, surgical custom packs, and other products. For the year ended December 31, 2019, net sales for our implantables, consumables and equipment and other surgical products were
$1.2 billion
,
$2.3 billion
and
$0.7 billion
, respectively.
Our installed base of equipment is core to our market leading position in our Surgical business, with best-in-class platforms in cataract and vitreoretinal equipment and the largest installed base of cataract phacoemulsification consoles, vitrectomy consoles and refractive lasers in the industry. These platforms each have long buying cycles that last approximately seven to ten years and act as anchoring technologies that drive recurring sales of our consumables and help cross-promote sales of our implantable devices.
Our cataract offerings include the
Centurion
vision system for phacoemulsification and cataract removal, the
LenSx
femtosecond laser used for specific steps in the cataract surgical procedure, the
LuxOR
ophthalmic microscope, the
Verion
imaged guided system for cataract surgery planning and image guidance throughout the cataract procedure, and the
ORA System
for intra-operative measurements, guidance and outcomes analysis/optimization. Our
AcrySof
family of IOLs includes offerings ranging from monofocal IOLs for basic cataract surgery to AT-IOLs under our
PanOptix
and
ReSTOR
brands for the correction of presbyopia and/or astigmatism at the time of cataract surgery. We also offer a collection of pre-loaded options with the
UltraSert
and
AutonoMe
IOL delivery devices. Beginning in 2017, we launched a new IOL material under the
Clareon
CE Mark in the EU, Japan, Brazil, and Australia and we intend to continue to launch worldwide following receipt of the necessary regulatory approvals in other countries.
Our vitreoretinal portfolio includes the
Constellation
vision system,
Grieshaber
DSP and
MIVS
instrumentation and
Ultravit
high speed vitrectomy probes, the
Purepoint
laser, and the
NGENUITY
3D visualization system.
Our refractive surgery portfolio includes
WaveLight
lasers and diagnostics used for LASIK and other laser-based vision correction procedures, including topography guided procedures marketed under the
Contoura
brand.
Our glaucoma portfolio includes the
EX-PRESS
glaucoma filtration device.
41
The following table lists certain key marketed Surgical products. While we intend to sell our marketed products throughout the world, not all products and indications are currently available in every country:
|
Cataract
|

|
AcrySof
family of IOLs, including:
AcrySof
IQ monofocal IOLs
|

|
UltraSert
pre-loaded IOL delivery system with the
AcrySof
IQ monofocal IOL
|
|
|
AcrySof
IQ Toric astigmatism-correcting IOLs
AcrySof
IQ
ReSTOR
presbyopia-correcting IOLs
AcrySof
IQ
ReSTOR
Toric presbyopia- and astigmatism-correcting IOLs
AcrySof
IQ
PanOptix
presbyopia-correcting IOLs
AcrySof
IQ
PanOptix
Toric presbyopia- and astigmatism-correcting IOLs
|
||

|
Clareon
monofocal IOL with the automated, disposable
AutonoMe
pre-loaded IOL delivery system
|
|
|
Cataract Refractive Suite by Alcon, including:
|
||
|
Centurion
vision system
LenSx
femtosecond laser
|
|
|
LuxOR
ophthalmic microscope
ORA
System for intra-operative measurements and guidance
Verion
imaged guided system
|
|
|
Surgical Procedure Packs
|
|
Custom Pak
surgical procedure packs
|
42
|
Vitreoretinal
|
|
Constellation
vision system
|

|
Grieshaber
DSP and
MIVS
instrumentation
|
|
|
Purepoint
laser
|
|

|
Ultravit
high speed vitrectomy probes
|
|
|
NGENUITY
3D visualization system
|
|
|
Refractive
|
|
WaveLight
EX500 excimer laser for LASIK and other refractive correction procedures
|
|
WaveLight Topolyzer
VARIO diagnostic device for measurement and planning before refractive surgery
|
||
|
WaveLight
FS200 femtosecond laser for refractive surgery
|
||
|
Glaucoma
|

|
EX-PRESS
glaucoma filtration device
|
Cataract Equipment
We maintain our market leadership in cataract surgical products by providing a comprehensive offering of surgical equipment, single-use and disposable products, viscoelastics, surgical solutions and surgical packs, all supported by our broad and experienced team of field service professionals. We currently market products for cataract surgery in substantially all of our markets.
Our strong installed base of equipment and extensive clinician relationships drive sales of our IOLs and consumables. We consider the quality and breadth of our portfolio to be a key differentiator as a "one-stop-shop" offering for our customers, synonymous with quality, reliability, and accessibility. Our Cataract Refractive Suite covers every stage of the surgical workflow from clinical planning to cataract removal and post-operative optimization.
In 2013, we launched our
Centurion
vision system for cataract surgery. This system includes Active Fluidics technology, an automated system that optimizes anterior chamber stability by allowing surgeons to proactively set and maintain target IOP within the eye during the cataract removal procedure, thereby delivering an unprecedented level of intraoperative control.
We also sell the
LenSx
laser system. The first femtosecond laser to receive FDA clearance for use in cataract surgery,
LenSx
is used to create incisions in the cornea, create a capsulorhexis, and complete lens fragmentation as part of the cataract procedure. This enables surgeons to perform some of the most delicate manual steps of cataract surgery with image-guided visualization and micron precision.
Our
Verion
reference unit and
Verion
digital marker together form an advanced surgical planning, imaging and guidance technology designed to provide greater accuracy and efficiency during cataract surgery. Our
ORA System
also provides key intra-operative measurements to improve the placement precision of an implanted IOL during cataract surgery, for example, by aligning the rotation of a toric IOL to the axis of astigmatism. Post-operatively, our
ORA System
aids with outcomes analysis and ongoing optimization for improved outcomes.
In addition, we launched the
NGENUITY
3D visualization system globally to provide surgeons improved visualization by combining a high-dynamic 3D camera, advanced high-speed image optimization, polarizing surgeon glasses and an ultra-
43
high definition 4K OLED 3D display that offers improved depth perception. Within visualization, we also sell the
LuxOR
surgical ophthalmic microscope (acquired from Endure Medical Systems) with its proprietary
ILLUMIN-i
technology, which provides an expanded illumination field with a 6x-larger, highly stable red reflex zone.
Cataract IOLs
Our
AcrySof
IOL is the most implanted intraocular lens in the world.
AcrySof
IOLs are made of the first material specifically engineered for use in an intraocular lens.
We have a longstanding record of innovation within the IOL market. In 2005, we introduced a new class of IOLs to correct presbyopia with our multifocal
AcrySof ReSTOR
offering. In 2006, we also launched the
AcrySof
Toric IOL, designed to correct various levels of preexisting astigmatism in cataract patients. In 2009, the
AcrySof
IQ Toric lens was launched globally, incorporating the aspheric technology into a toric design.
We have continued to grow our
ReSTOR
portfolio. In 2016, the
AcrySof
IQ
ReSTOR
3.0D Toric IOL was approved by the FDA and launched in the US to address presbyopia and preexisting astigmatism at the time of cataract surgery in adult patients who desire improved near, intermediate and distance vision with an increased potential for spectacle independence. In 2017, the
AcrySof
IQ
ReSTOR
+2.5D Toric IOL was approved by the FDA and launched in the US
In recent years, presbyopia correction lenses have evolved to include trifocal designs. In 2015, we launched the
AcrySof
IQ
PanOptix
trifocal IOL in select markets outside the US to complement our
ReSTOR
multifocal offering. This novel diffractive optic sends light to three foci to support near, intermediate and distance vision. In 2017, the
AcrySof
IQ
PanOptix
Toric lens was launched in select markets outside the US to address both astigmatism and presbyopia. We launched the
AcrySof
IQ
PanOptix
trifocal IOL in the US in 2019.
We have also introduced several innovations to the delivery device used for introducing an IOL into the capsular bag during cataract surgery. Our
UltraSert
pre-loaded IOL delivery system combines the control of a manually loaded device with the safety and convenience of a disposable, pre-loaded injector to optimize the implantation of the
AcrySof
IQ Aspheric IOL into the cataract patient's eye.
In 2017, we received a European CE Mark for the
Clareon
IOL with the
AutonoMe
delivery system.
AutonoMe
is the first automated, disposable, pre-loaded IOL delivery system that enables precise delivery of the IOL into the capsular bag in patients undergoing cataract surgery. The new device is being introduced with the
Clareon
IOL, a new material with an advanced design that enables sharp, crisp vision, low edge glare and unsurpassed optic clarity.
Our AT-IOLs provide significant visual benefits to patients above standard monofocal IOLs. Accordingly, the price for these AT-IOLs is higher than the price for monofocal styles. This impacts the market penetration of AT-IOLs in the majority of countries, as patients must pay incremental charges above the cost of traditional cataract surgery to obtain an AT-IOL and, in some markets, must pay out-of-pocket for the entire surgical procedure and the AT-IOL.
In the US, our monofocal IOLs are generally fully covered by medical insurance providers or government reimbursement programs, whereas certain of our AT-IOLs may only be partially covered. This payment model was established by two landmark rulings issued by CMS in May 2005 and January 2007. The CMS rulings provide Medicare beneficiaries a choice between cataract surgery with a monofocal IOL, which would be reimbursed as a covered benefit under Medicare, or cataract surgery with an AT-IOL, such as our
AcrySof ReSTOR
lens and
AcrySof
Toric lens, which would be partially reimbursed under Medicare and partially paid out-of-pocket. Many commercial insurance plans mirror the CMS rulings, although commercial plans may vary based on third-party payor. The bifurcated payment for the implantation of AT-IOLs has increased the market acceptance of our AT-IOLs in the US Outside the US, payment and reimbursement models vary widely from country to country, generally depending on the policy adopted by the relevant local healthcare authority on coverage and payment.
Surgical Procedure Packs
To provide convenience, efficiency and value for ophthalmic surgeons, Alcon offers
Custom Pak
surgical procedure packs for use in ophthalmic surgery. Unlike conventional surgical procedure packs, our
Custom Pak
surgical procedure packs allow individual surgeons to customize the products included in their pack. Our
Custom Pak
surgical procedure packs include both our single-use products as well as third-party items not manufactured by Alcon. We believe that our
Custom Pak
offering allows ophthalmic surgeons to improve their efficiency in the operating room, while avoiding the complexity and cost of having to kit surgical items for each respective procedure. We offer more than 11,000 configurations of our
Custom Pak
surgical procedure packs globally, using more than 2,500 components.
44
Vitreoretinal Surgery
Our vitreoretinal surgical product offering is one of the most comprehensive in the industry for surgical procedures for the back of the eye. We currently market our vitreoretinal surgical products in substantially all of the countries in which we sell products.
For vitrectomy procedures, we sell our
Constellation
vision system globally. We believe this system delivers a higher level of control to the physician through higher vitreous cutting rates and embedded laser technology. The
Constellation
vision system platform continues to drive our market share in the global premium segment of vitrectomy packs.
In addition to our
Constellation
vision system, we also sell a full line of vitreoretinal products, including procedure packs, lasers, and hand-held microsurgical instruments, as well as our
Grieshaber
and
MIVS
lines of disposable retinal surgery instruments. We also sell a full line of scissors, forceps, and micro-instruments in varying gauge sizes, as well as a range of medical grade vitreous tamponades, which replace vitreous humor during many retinal procedures.
We continue to advance our portfolio with smaller gauge (27+) instruments and higher cut speed vitrectomy probes. We also sell
Ultravit
high speed vitrectomy probes, which operate at a speed of 7,500 cuts per minute ("cpm"). This increased speed helps reduce traction that can cause iatrogenic tears and post-operative complications.
Refractive Surgery
Our refractive sales include lasers, disposable patient interfaces used during laser correction procedures, technology fees, and diagnostic devices necessary to plan the refractive procedure. Our
WaveLight
refractive suite includes the EX500 excimer laser, designed to reshape the cornea, and the FS200 femtosecond laser, designed to create a corneal flap and to deliver laser refractive therapy as part of the LASIK refractive procedure.
We also recently launched
Contoura
Vision, a topography-guided LASIK treatment designed to provide surgeons with the ability to perform more personalized laser procedures for patients with nearsightedness, or nearsightedness with astigmatism. This procedure is based on the unique corneal topography of each eye, as measured through the
WaveLight Topolyzer
VARIO diagnostic device.
Glaucoma Surgery
Our
EX-PRESS
glaucoma filtration device is approved and marketed in the US, Europe, Canada, Australia and several other markets. This shunt is implanted under the scleral flap to enhance outflow of aqueous humor and reduce intraocular pressure in patients with open-angle glaucoma. The
EX-PRESS
glaucoma filtration device creates consistent and predictable outcomes when used as part of a trabeculectomy.
Vision Care
Our Vision Care portfolio comprises daily disposable, reusable and color-enhancing contact lenses, as well as a comprehensive portfolio of ocular health products, including devices and over-the-counter products for dry eye, over-the-counter products for contact lens care and ocular allergies, as well as ocular vitamins and redness relievers. For the year ended December 31, 2019, net sales of our contact lens and ocular health products were
$2.0 billion
and
$1.2 billion
, respectively.
Our broad portfolio of daily disposable, reusable and color-enhancing contact lenses includes
TOTAL
,
PRECISION
,
Air Optix
, and
DAILIES AquaComfort PLUS
. Our
TOTAL
product line includes
DAILIES TOTAL1
, the first and only water gradient contact lens in the market, which is also offered in a multifocal design to address the fast growing presbyopia market.
DAILIES TOTAL1
is designed to be a super-premium lens positioned to compete at the highest levels across the contact lens market.
PRECISION1
, our new mainstream daily disposable Silicone-Hydrogel lens with aqueous extraction and surface treatment, was launched in select markets.
PRECISION1
is designed to provide vision that lasts until the end of day and longer-lasting lens surface moisture with easier handling. Our
Air Optix
monthly replacement product line features silicone hydrogel contact lenses in monofocal, astigmatism-correcting, and multifocal options, as well as
Air Optix Colors
and
Air Optix plus HydraGlyde
contact lenses.
Our key brands in our ocular health portfolio include the
Systane
family of artificial tear and related dry eye products, including the
Systane
iLux
MGD thermal pulsation system, as well as the
Opti-Free
and
Clear Care
lines of multi-purpose and hydrogen peroxide disinfecting solutions, respectively. Select ocular health products include artificial tear and related dry eye products marketed under the
Tears Naturale
and
Genteal
brands,
Naphcon-A
and
Zaditor
eye drops for the temporary relief of ocular itching due to allergies, and vitamins for ocular health marketed under the
ICAPS
and
Vitalux
brands.
The following table lists certain key marketed vision care products. While we intend to sell our marketed products throughout the world, not all products and indications are currently available in every country:
45
|
Contact Lenses
|

|
DAILIES TOTAL1
|

|
PRECISION1
|
|

|
DAILIES AquaComfort PLUS
|
|
|
Air Optix
family of silicone hydrogel contact lenses (including
Air Optix plus HydraGlyde
and
Air Optix Colors
lenses)
|
|

|
||

|
FreshLook
family of color contact lenses
|
|
|
Ocular Health
|
|
Clear Care
family of hydrogen peroxide contact lens care solution (
AOSEPT
PLUS
outside of North America)
|

|
Opti-Free
family of multi-purpose disinfecting contact lens care solution
|
|

|
Genteal
family of artificial tears
|
|

|
Systane
family of artificial tears and related dry eye products
|
|
|
Tears Naturale
family of lubricant eye drops
|
|

|
Systane iLux
Thermal Pulsation System
|
|
Contact Lenses
Alcon is the number two company in the branded contact lens market based on net sales in 2019. This position is driven largely by our core brands
Dailies
, and
Air Optix
. The growth of our portfolio is also driven by our market-leading soft contact lens technology
DAILIES TOTAL1.
Our market-leading multifocal offering provides a platform for expanding the presbyopia market, which we believe is a potential multibillion dollar opportunity for market participants, by combining the center-near precision profile aspheric design with
DAILIES TOTAL1
water gradient technology. The recent launch of
DAILIES TOTAL1
Multifocal has the potential to capture more presbyopes, including consumers who have traditionally dropped out of contact lenses due to discomfort. We continue to experience market growth due to trade-up to daily disposable lenses and premium silicone hydrogel ("SiHy") materials, uptake of toric and multifocal specialty lenses, as well as increasing penetration in emerging markets. We have a broad contact lens offering, ranging from entry-level disposable lenses to premium water gradient technology, in addition to colored options and reusable contact lenses. We continue to focus on core product performance
46
while increasing consumer investment behind a best-in-class innovation portfolio of key products, such as our
DAILIES TOTAL1
water gradient SiHy,
PRECISION1
,
Air Optix Colors
,
Air Optix plus HydraGlyde
and
FreshLook
contact lenses.
In 2016, we launched
Air Optix plus HydraGlyde
in the US and the EU, which is an innovation upgrade to monthly SiHy contact lenses featuring the
HydraGlyde
moisture matrix technology for longer lasting lens surface wettability. These contact lenses bring together two innovative technologies—
SmartShield
technology and
HydraGlyde
moisture matrix—for a unique combination of deposit protection and longer-lasting lens surface moisture.
SmartShield
technology is a patented, ultra-thin protective shield that helps the lens resist lipid deposits and delivers outstanding wettability. It also helps the lens resist changes from everyday cosmetic product use.
HydraGlyde
moisture matrix is a wetting agent specifically designed for SiHy lenses that helps attract lens surface moisture and retain lens surface hydration. This is the latest innovation in the
Air Optix
family of monthly replacement contact lenses, whose comprehensive portfolio includes monthly replacement clear and color contact lenses, overnight and flexible wear options, toric and multifocal lens correction.
In 2016, we launched
DAILIES TOTAL1
Multifocal contact lenses in the US and the EU to provide refractive correction for distance, intermediate and near vision for people with presbyopia. The
DAILIES TOTAL1
water gradient technology reduces end-of-day dryness, as the water content approaches nearly 100% at the outermost surface of the lens. The "hydrophilic" (water-loving) surface of the lens is almost as soft as the surface of the cornea (corneal epithelium) to enhance comfort, while the innovative optical design of this new multifocal lens offers a smooth progression of power designed to provide a seamless experience between distant, intermediate and near vision.
We also expect to continue launching our new line of contact lenses,
PRECISION1
, in different jurisdictions in 2020. We launched
PRECISION1
in the US in August 2019
. PRECISION1
is a daily disposable, SiHy contact lens intended to compete within the mainstream subcategory of the global daily disposable contact lens market. We believe that
PRECISION1
has been engineered for the highest visual clarity of any contact lens in its class.
Ocular Health
Alcon currently holds a market leading position in artificial tears. We continue to focus on core product performance while increasing promotion behind a best-in-class innovation portfolio under the brand leadership of
Systane
artificial tears. The
Systane
portfolio is a comprehensive offering of ocular health solutions, most of which are indicated for the temporary relief of burning and irritation due to dryness of the eye. The
Systane
portfolio includes products for daily and nighttime relief, as well as products for discomfort associated with contact lens wear.
In 2017,
Systane
COMPLETE lubricant eye drops received a CE Mark. This addition to the
Systane
product line offers fast hydration and long-lasting, optimal relief from various types of dry eye problems with nano-droplet technology for enhanced coverage. We launched
Systane
COMPLETE in the US, Canada and the EU in 2018.
In 2018, we added
Systane iLux
thermal pulsation dry eye devices to our ocular health portfolio. We intend to continue to add to our portfolio to address large unmet needs for dry eye and meibomian gland dysfunction patients.
Alcon is also a market leader in contact lens care in both multi-purpose and hydrogen peroxide solutions. The vast majority of our contact lens care products are comprised of disinfecting solutions to remove harmful micro-organisms on contact lenses, with a smaller amount of sales coming from cleaners to remove undesirable film and deposits from contact lenses and lens rewetting drops to improve wearing comfort for contact lenses. We also benefit from strong synergies between our contact lens business and our contact lens care products; however, we expect demand for disinfecting solutions to continue to decrease as contact lens wearers shift their preference from reusable contact lenses to daily disposable lenses.
In 2011, we received approval in the US to market
Opti-Free PureMoist
, our fastest growing multi-purpose disinfecting solution, which is approved for SiHy and all other soft contact lenses.
PureMoist
contains our patented
HydraGlyde
moisture matrix technology to provide long lasting comfort to contact lens wearers and is now our flagship brand in most key markets. In 2015, we received approval to add
HydraGlyde
moisture matrix technology to
Clear Care
, our market leading hydrogen peroxide contact lens care solution.
Clear Care
is branded
AOSEPT
PLUS in many markets outside of the US. We currently market these product in most major markets throughout the world.
Finally, our ocular health portfolio also includes artificial tear and related dry eye products marketed under the
Tears Naturale
and
Genteal
brands, products for the temporary relief of ocular itching due to ocular allergies marketed under the
Naphcon-A
and
Zaditor
brands and vitamins for the maintenance of general ocular health marketed under the
ICAPS
and
Vitalux
brands.
Our ocular health portfolio is typically over the counter but, in a small number of our markets, certain of our ocular health products require a prescription.
47
Principal Markets
Alcon serves consumers and patients in over 140 countries worldwide. The US is our largest market with
41%
of our net sales in 2019, see Note
5
.
Segment information
for net sales by geography. US sales of the vast majority of our products are not subject to material changes in seasonal demand. However, sales of certain of our vision care products, including those for allergies and dry eye, are subject to seasonal variation. In addition, sales of our surgical equipment are also subject to variation based on hospital or clinic purchasing cycles.
Research and Development
Alcon has made one of the largest commitments to research and development in the eye care market, with proven R&D capabilities in the areas of optical design, material and surface chemistry, automation and equipment platforms. Currently, our research and development organization employs over 1,300 individuals dedicated to our research and development efforts, including physicians, doctors of optometry and PhDs. Our researchers have extensive experience in the field of ophthalmology and frequently have academic or practitioner backgrounds to complement their product development expertise.
We organize cross-functional development teams to drive new innovations to our customers and our patients around the world. New projects for our Surgical and Vision Care pipelines originate either from concepts developed internally by staff scientists and engineers, ideas from eye care professionals in ophthalmology, or through strategic partnerships with academic institutions or other companies. We have designed our research and development organization to achieve global registration of products through the efforts of a global clinical and regulatory affairs organization.
In 2019, we invested
$656 million
in research and development, representing
9%
of our total 2019 net sales, and we invested approximately
$587 million
in 2018 and
$584 million
in 2017. In addition to our in-house R&D capabilities, as part of our efforts to pursue strategic R&D partnerships with third parties, our dedicated business development team has completed approximately 30 BD&L transactions since 2016. For example, in 2018 we acquired US-based PowerVision, Inc., which is developing fluid-based accommodating IOLs for cataract patients. In addition, we expect our recent partnership with Philips Healthcare to create a new digital health platform to support our cataract equipment that will allow us to deliver fully integrated information to ophthalmic surgeons. We continually review and refine our operating model to optimize for efficiency and productivity. Recent improvements in productivity coupled with a number of strategic partnerships have collectively led to more than 60% growth in the number of projects within our portfolio of internal and external innovation over the past four years. Across our Surgical and Vision Care pipelines, we have more than 110 pipeline projects in process as of December 31, 2019, including over 35 that have achieved positive proof of concept or are undergoing regulatory review.
Our research and development organization maintains an extensive network of relationships with top-tier scientists in academia and with leading healthcare professionals, surgeons, inventors and clinician-scientists working in ophthalmology. The principal purpose of these collaborative scientific interactions is to supplement our internal pipeline and leverage technological advancements in academia and the clinical setting.
While our primary focus is on delivering new products to our patients and customers, we also support the advancement of basic science through the Alcon Research Institute, which seeks to encourage, advance and support vision research. The Alcon Research Institute is one of the largest corporately funded research organizations devoted to vision research in the world. The Institute's activities are planned and directed by an autonomous Executive Steering Committee that is comprised of distinguished ophthalmologists and vision researchers. The institute has worldwide representation and operates under the premise that improvements in the diagnosis and treatment of ocular diseases are dependent upon advances in basic science and clinical research carried out by independent investigators in institutions throughout the world. The institute has also awarded more than 350 awards and research grants over the past 38 years.
Research and development activities within our Surgical business are focused on expanding intraocular lens capabilities to further improve surgical and refractive outcomes and on developing equipment and instrumentation for cataract, vitreoretinal, refractive and glaucoma surgeries, as well as new platforms for diagnostics and visualization. Our focus within the Vision Care business is on the research and development of new manufacturing platforms and novel contact lens materials, coatings and optical designs for various lens replacement schedules, with the ultimate goal of improving patient outcomes. In addition to our efforts to develop next-generation contact lens technologies, we are strengthening our ocular health portfolio with new products and novel technologies that safely provide relief from symptoms of dry eye and ocular allergies.
We continue to seek opportunities to collaborate with third parties on advanced technologies for various ophthalmic conditions. These include the potential to provide accommodative contact and intraocular lenses for patients living with presbyopia.
48
Marketing and Sales
Alcon conducts sales and marketing activities throughout the world. During the year ended December 31, 2019,
41%
of our sales were in the US. We are present in every significant market in the world where ophthalmology and optometry are practiced, with operations in over 74 countries supported by over 3,000 associates dedicated to direct sales and with products sold in over 140 countries.
Our global commercial capability is organized around sales and marketing organizations dedicated to our Surgical and Vision Care businesses and we customize these efforts to the medical practice needs of each customer. In addition to direct promotion of our products, our sales representatives provide customers with access to clinical education programs, data from clinical studies and technical service assistance. Our selling models also include focused efforts in key channels, including strategic accounts, key accounts and pharmacies.
In each of our markets, we rely on our strong relationships with eye care professionals to attract and retain customers. We engage healthcare professionals to serve as clinical consultants, to participate on advisory boards and to conduct presentations regarding our products. In addition, we have established or sponsor several long-standing programs that provide training and education to eye care professionals, including providing training support at our approximately 30 state-of-the-art interactive training centers around the world. These facilities introduce ophthalmologists to our surgical equipment and cataract products through hands-on training in surgical techniques while exposing them to leading ophthalmologists.
In our Surgical business, our marketing efforts are supported by global advertising campaigns, claims from clinical registration and post-approval studies and by the participation of marketing and sales representatives in regional and global medical conferences. Technical service after the sale is provided using an integrated customer relationship management system in place in many markets. All of our technical service in the US, and a high percentage of that service outside the US, is provided by service technicians employed directly by Alcon. In countries where we do not have local operations or a scientific office, we use distributors to sell and handle the physical distribution of our products. Within our Surgical business, the practices of our marketing and sales representatives continue to change to meet emerging market trends, namely consolidation of providers, increasing pricing pressures, proliferation of smaller competitors, increasing demands for outcome evidence, and a shift from relationship-based selling orientated toward physicians versus professional economic buyers focused on cost.
In our Vision Care business, we support our products with direct-to-consumer marketing campaigns, including advertising, promotions and other marketing materials, and with retailer-focused marketing and promotional materials. The fast-evolving landscape for our Vision Care business varies significantly by country. Three key trends in marketing and sales help drive the continuing evolution of our Vision Care business: (1) internet-based purchasing is increasing, as online players grow and the internet plays a bigger role as a source of consumer information and a platform for price referencing, (2) channel consolidation is accelerating, as chains grow in size and vertically integrate, and (3) independent eye care professionals vary in influence, as many align more closely with retailers. We see an opportunity to leverage digital technology to address pain points experienced by consumers and patients in existing paths to purchase. We also intend to continue investing and innovating in digital capabilities to develop new business models and practice implementation support in response to channel shifts and increases in direct-to-consumer influence.
While we market all of our products by calling on medical professionals, direct customers and distribution methods differ across our business lines. Surgical products are sold directly to hospitals and ambulatory surgical centers, although we sell through distributors in certain markets outside the US where we do not have local operations or a scientific office. In many countries, contact lenses are available only by prescription. Our contact lenses can be purchased from eye care professionals, optical chains and large retailers, subject to country regulation. Our ocular health products can be found in major drugstores, pharmacies, food stores and mass merchandising and optical retail chains globally, with access subject to country regulations, including free-sale, pharmacy-only and prescription regulations. No single customer accounted for more than 10% of our global sales in 2019.
Manufacturing and Supplies
Manufacturing
We generally organize our manufacturing facilities along product categories, with most plants being primarily dedicated to the manufacture of either our Surgical or Vision Care product offerings. As of December 2019, we employed approximately 4,000 people to manufacture surgical products at ten facilities in the US, Belgium, Switzerland, Ireland, Germany and Israel, and approximately 5,300 people to manufacture Vision Care products at eight facilities in the US, Germany, Singapore, Malaysia and Indonesia. Our functional division of plants reflects the unique differences in regulatory requirements governing the production of surgical medical devices as well as the different technical skills required of associates in these manufacturing environments. All of our manufacturing plants are ISO 13485 and ISO 14001:2015 certified. Currently, we manufacture
49
approximately 90% of our products internally and rely on third-party manufacturers (including Novartis) for a limited number of products.
The goal of our supply chain strategy is to efficiently produce and distribute high quality products. To that end, we employ cost-reduction programs, known as continuous improvement programs, involving activities such as cycle-time reductions, efficiency improvements, automation, plant consolidations and procurement savings programs as a means to reduce manufacturing and component costs. To comply with good manufacturing practices and to improve the skills of our associates, we train our direct labor manufacturing staff throughout the year. Our professional associates are trained in various aspects of management, regulatory and technical issues through a combination of in-house seminars, local university classes and trade meetings.
The manufacture of our products is complex, involves advanced technology and is heavily regulated by governmental health authorities around the world, including the FDA. Risks inherent to the medical device industry, specifically as they relate to Class III devices, are part of our operations. If we or our third-party manufacturers fail to comply fully with regulations, there could be a product recall or other shutdown or disruption of our production activities. We have implemented a global manufacturing strategy to maximize business continuity in case of such events or other unforeseen catastrophic events.
Supplies
The components used in certain of our Surgical products, such as viscoelastics, and our ocular health products, such as our products for dry eye, are sourced from facilities that meet the regulatory requirements of the FDA or other applicable health regulatory authorities. Because of the proprietary nature and complexity of the production of these components, a number of them are only available from a single or limited number of FDA-approved sources. The majority of active chemicals, biological raw materials and selected inactive chemicals used in our products are acquired pursuant to long term supply contracts. The sourcing of components used in our Surgical products differs widely due to the breadth and variety of products, with a number of the components sourced from a single or limited number of suppliers. When we rely upon a sole source or limited sources of supply for certain components, we try to maintain a sufficient inventory consistent with prudent practice and production lead-times and to take other steps necessary to ensure our continued supply. The prices of our supplies are generally not volatile.
Intellectual Property
We strive to protect our investment in the research, development, manufacturing and marketing of our products through the use of patents, trademarks, copyrights, trade secrets and other intellectual property. We own or have rights to a number of patents, trademarks, copyrights, trade secrets and other intellectual property directly related and important to our businesses. As of December 31, 2019, we owned approximately 1,900 patent families consisting of approximately 2,300 US patents and pending US patent applications and approximately 8,600 corresponding patents and patent applications outside the US.
We believe that our patents are important to our business but that no single patent, or group of related patents, currently is of material importance in relation to our business as a whole. Our strategy is to develop patent portfolios for our research and development projects in order to obtain market exclusivity for the innovative features of our products in our major markets. The scope and duration of protection provided by a patent can vary significantly from country to country. However, even after the expiration of all patents covering a product, we may continue to derive commercial benefits from such product.
We routinely monitor the activities of our competitors and other third parties with respect to their use of our intellectual property. When appropriate, we will enforce our intellectual property rights to ensure that we are receiving the protections they afford us. Similarly, we will staunchly defend our right to develop and market products against unfounded claims of infringement by others. We will aggressively pursue or defend our position in the appropriate courts if the dispute cannot otherwise be promptly resolved.
In addition to our patents and pending patent applications in the US and selected non-US markets, we rely on proprietary know-how and trade secrets in our businesses and work to ensure the confidentiality of this information, including through the use of confidentiality agreements with associates and third parties. In some instances, we also acquire, or obtain licenses to, intellectual property rights that are important to our businesses from third parties.
All of our major products are sold under trademarks that we consider in the aggregate to be important to our businesses as a whole. We consider trademark protection to be particularly important in the protection of our investment in the sales and marketing of our contact lens care and ocular health products. The scope and duration of trademark protection varies widely throughout the world.
50
We also rely on copyright protection in various jurisdictions to protect the software and printed materials our business relies upon, including software used in our surgical and diagnostic equipment. The scope and duration of copyright protection for these materials also varies widely throughout the world.
Competition
The eye care industry is highly competitive and subject to rapid technological change and evolving industry requirements and standards. We compete with a number of different companies across our two business segments-Surgical and Vision Care. Companies within our industry compete on technological leadership and innovation, quality and efficacy of their products, relationships with eye care professionals and healthcare providers, breadth and depth of product offerings and pricing. The presence of these factors varies across our Surgical and Vision Care product offerings. Our principal competitors also sometimes form strategic alliances and enter into co-marketing agreements in an effort to better compete. We face strong local competitors in some markets, especially in developed markets, such as the US, Western Europe and Japan.
Surgical
The surgical market is highly competitive. Superior technology and product performance give rise to category leadership in the surgical market. Service and long term relationships are also key factors in this competitive environment. Surgeons rely on the quality, convenience, value and efficiency of a product and the availability and quality of technical service. We primarily compete with Carl Zeiss Meditec AG, Bausch Health Companies Inc., Hoya Corporation, and Johnson & Johnson in the surgical market.
We expect to compete against companies that offer alternative surgical treatment methodologies, including multifocal and accommodating AT-IOL approaches, and companies that promote alternative approaches for responding to the conditions our products address. At any time, our known competitors and other potential market entrants may develop new devices or treatment alternatives that may compete directly with our products. In addition, they may gain a market advantage by developing and patenting competitive products or processes earlier than we can or by obtaining regulatory approvals / clearances or market registrations more rapidly than we can.
We believe that the principal competitive factors in our surgical market include:
|
•
|
disruptive product technology;
|
|
•
|
alternative treatment modalities;
|
|
•
|
breadth of product lines and product services;
|
|
•
|
ability to identify new market trends;
|
|
•
|
acceptance by ophthalmic surgeons;
|
|
•
|
customer and clinical support;
|
|
•
|
regulatory status and speed to market;
|
|
•
|
price;
|
|
•
|
product quality, reliability and performance;
|
|
•
|
capacity to recruit engineers, scientists and other qualified associates;
|
|
•
|
digital initiatives that change business models;
|
|
•
|
reimbursement approval from governmental payers and private healthcare insurance providers; and
|
|
•
|
reputation for technical leadership.
|
Shifts in industry market share can occur in connection with product issues, physician advisories, safety alerts, and publications about our products. In the current environment of managed care, with consolidation among healthcare providers, increased competition, and declining reimbursement rates, there is also increasing pressure on price.
Vision Care
The vision care market is also highly competitive, and our primary competitors are Johnson & Johnson, Bausch Health Companies, Inc. and The Cooper Companies, Inc. For ocular health, our largest competitor is Allergan, Inc.
In contact lenses, all companies continue to focus on growing the daily disposable SiHy segment due to the price trade-up opportunity from non-SiHy and reusable lenses. We believe our
DAILIES TOTAL1
provides the most advanced daily disposable SiHy contact lens with its advanced "water gradient" technology, but currently only caters to the premium market given its higher price point. We also compete with manufacturers of eyeglasses and with surgical procedures that correct visual defects. We believe that there are opportunities for contact lenses to attract new customers in the markets in which we operate, particularly in markets where the penetration of contact lenses in the vision correction market is low. Additionally, we compete with new market entrants with disruptive distribution models that could potentially innovate to challenge traditional models, including the eye care professional channel in which we have a significant presence. We also believe that laser vision correction
51
is not a significant threat to our sales of contact lenses based on the growth of the contact lens market over the past decade and our involvement in the laser vision correction market through our Surgical business.
In ocular health, the market is characterized by competition for market share through the introduction of products that provide superior effectiveness and reduced burden for treating eye conditions. Recommendations from eye care professionals and customer brand loyalty, as well as our product quality and price, are key factors in maintaining market share in these products.
Government Regulation
Overview
Our businesses are subject to varying degrees of governmental regulation in the countries in which we operate, and the general trend is toward increasingly stringent regulation. In the US, the drug, device and dietary supplement industries have long been subject to regulation by various federal and state agencies, primarily as to product safety, efficacy, manufacturing, advertising, labeling and safety reporting. The exercise of broad regulatory powers by the FDA continues to result in increases in the amounts of testing and documentation required for the commercialization of regulated products and a corresponding increase in the expense of product introduction. Similar trends are also evident in the EU and in other markets throughout the world. In addition to market access regulation, our businesses are also subject to other forms of regulation, such as those relating to anti-bribery, data privacy and cybersecurity and trade regulation matters. We are also subject to regulations related to environmental and safety matters, which are discussed in greater detail in "Item 4.D. Property, Plants and Equipment—Environmental Matters".
Product Approval and Monitoring
Most of our products are regulated as medical devices in the US and the EU. These jurisdictions each use a risk-based classification system to determine the type of information that must be provided to the local regulatory bodies in order to obtain the right to market a product. In the US, the FDA classifies devices into three classes: Class I (low risk), Class II (moderate risk) and Class III (high risk). Many of our devices are Class II or III devices that require premarket review by the FDA. The primary pathway for our Class II devices is FDA clearance of a premarket notification under section 510(k) of the FDCA. With a 510(k) submission, the manufacturer must submit a notification to the FDA that includes performance data that establish that the product is substantially equivalent to a "predicate device", which is typically another Class II previously-cleared device. Our Class III devices require FDA approval of a PMA application. With a PMA application, the manufacturer must submit extensive supporting evidence, including clinical data, sufficient to demonstrate a reasonable assurance that the device is safe and effective for its intended use.
In the EU, CE marking is required for all medical devices sold. Prior to affixing the CE Mark, the manufacturer must demonstrate that their device conforms to the relevant essential requirements of the EU's Medical Device Directive through a conformity assessment procedure. The nature of the assessment depends upon the classification of the device. The method of assessing conformity varies depending on the type and classification of the product. For most Class I devices, the assessment is a self-certification process by the manufacturer. For all other devices, the conformity assessment procedure requires review by a "notified body", which is authorized or licensed to perform conformity assessments by national device regulatory authorities. The conformity assessment procedures require a technical review of the manufacturer's product and an assessment of relevant clinical data. Notified bodies may also perform audits of the manufacturer's quality system. If satisfied that the product conforms to the relevant essential requirements, the notified body issues a certificate of conformity, which the manufacturer uses as a basis for its own declaration of conformity and application of the CE mark.
The EU published a new Medical Device Regulation in 2017 which will impose significant additional requirements on medical device manufacturers, including with respect to clinical development, labeling, technical documentation and quality management systems. The regulation has a three-year implementation period. Medical devices placed on the market in the EU after May 2020 will require certification according to these new requirements, except that devices with valid CE certificates, issued pursuant to the Medical Device Directives before May 2020, can be placed on the market until those certificates expire, at the latest in May 2024, provided there are no significant changes in the design or intended purpose of the device.
We also market products that are regulated in other product categories, including lasers, drug products, dietary supplements, and medical foods. These products are also subject to extensive government regulation, which vary by jurisdiction. For example, in the US, our drug products must either be marketed in compliance with an applicable over-the-counter drug monograph or receive FDA approval of a New Drug Application. In the EEA, our drug products must receive a marketing authorization from the competent regulatory authority before they may be placed on the market. There are various application procedures available, depending on the type of product involved.
52
Clinical trials may be required to support the marketing of our drug or device products. In the US, clinical trials must be conducted in accordance with FDA requirements, including informed consent from study participants, and review and approval by an institutional review board ("IRB"), among other requirements. Additionally, FDA authorization of an Investigational Device Exemption ("IDE") application must be obtained for studies involving significant risk devices prior to commencing the studies. In the EU, clinical trials usually require the approval of an ethics review board and the prior notification to, or authorization of the study from, the regulatory authority in each country in which the trial will be conducted.
Regulations of the FDA and other regulatory agencies in and outside the US impose extensive manufacturing requirements as well as postmarket compliance and monitoring obligations on our business. The manufacture of our device, drug and dietary supplement products is subject to extensive and complex good manufacturing practice and quality system requirements, which govern the methods used in, and the facilities and controls used for, the design, manufacture, packaging, storage, handling and servicing of our products. We are also subject to requirements for product labeling and advertising, recordkeeping, reporting of adverse experiences and other information to identify potential problems with our marketed products, as well as recalls and field actions. We are also subject to periodic inspections for compliance with these requirements. We expect this regulatory environment will continue to require significant technical expertise and capital investment to ensure compliance.
Medical device, drug, and dietary supplement manufacturers are also subject to taxes, as well as application, product, user, establishment, and other fees. For example, in 2010, the ACA imposed an excise tax on medical device manufacturers and importers. This excise tax was subsequently repealed in December 2018; however, other similar taxes can be imposed in the future.
Price Controls
The prices of our medical devices and drugs that require prescriptions are subject to reimbursement programs and price control mechanisms that vary from country to country. Due to increasing political pressure and governmental budget constraints, we expect these programs and mechanisms to remain robust, and to potentially even be strengthened. As a result, such programs and mechanisms could have a negative influence on the prices we are able to charge for our medical device products, particularly those used in cataract and vitreoretinal surgeries.
Regulations Governing Reimbursement
In the US, patient access to our drug and device products that require a prescription is determined in large part by the coverage and reimbursement policies of third-party health insurers, including government programs such as Medicare and Medicaid. Both government and commercial health insurers are increasingly focused on containing health care costs and have imposed, and are continuing to consider, additional measures to exert downward pressure on device and drug prices. Outside the US, global trends toward cost-containment measures likewise may influence prices for healthcare products in those countries. Adverse decisions relating to either coverage for our products or the amount of reimbursement for our products, could significantly reduce the acceptance of and demand for our products and the prices that our customers are willing to pay for them.
Health Care Fraud and Abuse; Anti-Bribery
We are subject to health care fraud and abuse and anti-bribery laws and regulations in the US and around the world, including state and federal anti-kickback, anti-self-referral, and false claims laws in the US These laws are complex and subject to evolving interpretation by government agencies and courts. For example, in the US, relationships between manufacturers of products paid for by federal and state healthcare programs and healthcare professionals are regulated by a series of federal and state laws and regulations, such as the Federal Anti-Kickback Statute, that restrict the types of financial relationships with referral sources that are permissible. As discussed in greater detail in "Item 4.B. Business Overview—Marketing and Sales", we engage in marketing activities targeted at healthcare professionals, which include among others the provision of training programs. If one or more of these activities were found to be in violation of the Federal Anti-Kickback Statute or comparable state laws, or if we otherwise generally fail to comply with any of the health care fraud and abuse and anti-bribery laws and regulations or any other law or governmental regulation, or there are changes to the interpretation of any of the foregoing, we could be subject to, among other things, civil and criminal penalties, damages, fines, exclusion from the Medicare and Medicaid programs and the curtailment or restructuring of our operations.
53
Data Privacy and Cybersecurity
The regulation of data privacy and security, and the protection of the confidentiality of certain personal information (including patient health information and financial information), is increasing. For example, the EU General Data Protection Regulation contains enhanced financial penalties for noncompliance. Similarly, the US Department of Health and Human Services has issued rules governing the use, disclosure and security of protected health information, and the FDA has issued further guidance concerning cybersecurity for medical devices.
In addition, certain countries have issued or are considering data localization laws, which limit companies' ability to transfer protected data across country borders. Failure to comply with data privacy and cybersecurity laws and regulations can result in enforcement actions, including civil or criminal penalties.
Trade Regulation
The movement of products, services, and investment across borders subject us to extensive trade regulations. A variety of laws and regulations in the countries in which we transact business apply to the sale, shipment and provision of goods, services and technology across borders. These laws and regulations govern, among other things, our import, export and other business activities. We are also subject to the risk that these laws and regulations could change in a way that would expose us to additional costs, penalties or liabilities. Some governments also impose economic sanctions against certain countries, persons or entities.
In addition to our need to comply with such regulations in connection with our direct activities, we also sell and provide goods, technology and services to agents, representatives and distributors who may export such items to customers and end-users. Failure by us or the third parties through which we do business to comply with applicable import, export control or economic sanctions laws and regulations may subject us to civil or criminal enforcement action, and varying degrees of liability.
54
|
4.C.
|
ORGANIZATIONAL STRUCTURE
|
Organizational Structure
See "Item 4.B. Business Overview” for additional information.
Significant Subsidiaries
Below is a list of subsidiaries that had, as of December 31, 2019, total assets exceeding 10% of our consolidated assets, or net sales in excess of 10% of our consolidated net sales:
|
Name
|
Country of formation
|
|
% of equity interest
|
|
|
Alcon Pharmaceuticals Ltd.
|
Switzerland
|
|
100
|
|
|
Alcon Vision, LLC
|
United States
|
|
100
|
|
|
Alcon Laboratories, Inc.
|
United States
|
|
100
|
|
|
4.D.
|
PROPERTY, PLANTS AND EQUIPMENT
|
Our corporate headquarters is located in Geneva, Switzerland. The principal office for our Swiss and international operations, which is also our registered office, is located in Fribourg, Switzerland, and the principal office for our US operations is located in Fort Worth, Texas.
We believe that our current manufacturing and production facilities have adequate capacity for our medium‑term needs. To ensure that we have sufficient manufacturing capacity to meet future production needs, we regularly review the capacity and utilization of our manufacturing facilities. The FDA and other regulatory agencies regulate the approval for use of manufacturing facilities for medical devices, and compliance with these regulations requires a substantial amount of validation time prior to start‑up and approval. Accordingly, it is important to our business that we ensure we have sufficient manufacturing capacity to meet our future production needs.
Major Facilities
The following table sets forth our most significant production and research and development facilities:
|
Location
|
Size of Site
(in m
2
)
|
Major Activity
|
|||
|
Fort Worth, Texas
|
315,200
|
|
Production, research and development for Surgical and Vision Care businesses
|
||
|
Johns Creek, Georgia
|
84,100
|
|
Production, research and development for Vision Care business
|
||
|
Grosswallstadt, Germany
|
82,300
|
|
Production, research and development for Vision Care business
|
||
|
Johor, Malaysia
|
43,900
|
|
Production for Vision Care business
|
||
|
Irvine, California
|
40,800
|
|
Production, research and development for Surgical business
|
||
|
Houston, Texas
|
37,400
|
|
Production for Surgical business
|
||
|
Batam, Indonesia
|
35,000
|
|
Production for Vision Care business
|
||
|
Singapore
|
35,000
|
|
Production for Vision Care business
|
||
|
Huntington, West Virginia
|
27,500
|
|
Production for Surgical business
|
||
|
Sinking Spring, Pennsylvania
|
21,800
|
|
Production for Surgical business
|
||
|
Cork, Ireland
|
13,600
|
|
Production for Surgical business
|
||
|
Puurs, Belgium
|
8,000
|
|
Production for Surgical business
|
||
|
Schaffhausen, Switzerland
|
4,100
|
|
Production for Surgical business
|
||
We launched an expansion of our Johns Creek, Georgia facility in 2017 to add three production lines of
DAILIES TOTAL1
contact lenses. We completed the project in 2019 and incurred costs of approximately $100 million.
55
In March 2018, we commenced the second phase of expansion of our Grosswallstadt, Germany and Singapore facilities relating to the production of contact lenses. We expect to pay a total amount of approximately $450 million on the Grosswallstadt project and approximately $125 million on the Singapore project, in each case for both the first and second phases of expansion. Through December 31, 2019, the total amount paid and committed on the Grosswallstadt project was approximately $350 million and the total amount paid and committed on the Singapore project was approximately $120 million.
In September 2019, we launched a further expansion of our Johns Creek, Georgia facility to add four production lines for
PRECISION1
contact lenses. This project is ongoing. We expect to pay a total amount of approximately $175 million on this project. Through December 31, 2019, the total amount paid and committed was approximately $90 million.
We funded each of the projects discussed above from working capital.
Environmental Matters
We integrate core values of environmental protection into our business strategy to protect the environment, to add value to the business, manage risk and enhance our reputation.
We are subject to laws and regulations concerning the environment, safety matters, regulation of chemicals and product safety in the countries where we manufacture and sell our products or otherwise operate our business. As a result, we have established internal policies and standards that aid our operations in systematically identifying relevant hazards, assessing and mitigating risks and communicating risk information. These internal policies and standards are in place to ensure our operations comply with relevant environmental, health and safety laws and regulations, and that periodic audits of our operations are conducted. The potential risks we identify are integrated into our business planning, including investments in reducing safety and health risks to our associates and reducing our impact on the environment. We have also dedicated resources to monitor legislative and regulatory developments and emerging issues to anticipate future requirements and undertake policy advocacy when strategically relevant.
|
ITEM 4A.
|
UNRESOLVED STAFF COMMENTS
|
None.
56
|
5.A.
|
OPERATING RESULTS
|
This operating and financial review should be read together with the section captioned "Item 3. Key Information —3.A Selected Financial Data", "Item 4. Information on the Company—4.B. Business Overview" and our Consolidated Financial Statements and the related notes to those statements included elsewhere in this Annual Report. Among other things, those financial statements include more detailed information regarding the basis of preparation for the following information. This discussion contains forward-looking statements that involve risks and uncertainties. As a result of many factors, such as those set forth under "Item 3. Key Information —3.D Risk Factors" and elsewhere in this Annual Report, Alcon actual results may differ materially from those anticipated in these forward-looking statements. Please see "Special Note About Forward-Looking Statements" in this Annual Report. “Item 5. Operating and Financial Review and Prospects”, together with “Item 4.B Business Overview” and “Item 6.D. Employees”, constitute the Operating and Financial Review (“Rapport annuel”), as defined by the Swiss Code of Obligations.
OVERVIEW
Alcon researches, develops, manufactures, distributes and sells a full suite of eye care products within two segments: Surgical and Vision Care. The Surgical segment is focused on ophthalmic products for cataract surgery, vitreoretinal surgery, refractive laser surgery and glaucoma surgery, and includes implantables, consumables and surgical equipment required for these procedures. The Vision Care segment comprises daily disposable, reusable and color-enhancing contact lenses and a comprehensive portfolio of ocular health products, including products for dry eye, contact lens care and ocular allergies, as well as ocular vitamins and redness relievers. Prior to April 9, 2019, Alcon was operated as a division of Novartis.
We are the largest eye care company in the world, based on 2019 net sales. We are dedicated to providing innovative products that enhance quality of life by helping people see better. Our strong foundation is based on our longstanding success as a trusted brand, our legacy of industry firsts and advancements, our leading positions in the markets in which we compete and our continued commitment to substantial investment in innovation. With over 70 years of history in the ophthalmic industry, we believe the Alcon brand name is synonymous with innovation, quality, service and leadership among eye care professionals worldwide. We employ over 20,000 associates from more than 90 nationalities, operating in over 74 countries and serving consumers and patients in over 140 countries.
Between 2011, when we were acquired by Novartis, and April 9, 2019, we operated as a division within Novartis. Novartis transferred to us substantially all of the assets and liabilities of its eye care devices business, consisting of our surgical and vision care businesses. Our financial statements include, in all periods presented, the assets, liabilities and results of operations of the ophthalmic over-the-counter products and a small portfolio of surgical diagnostics medications, which was transferred to Alcon from Novartis, effective as of January 1, 2018.
In 2019, Alcon achieved net sales to third parties of
$7.4 billion
. The United States accounted for
$3.1 billion
, or
41%
, of total net sales, Japan accounted for
$0.7 billion
, or
9%
, of total net sales, China accounted for $0.4 billion or 5%, of total net sales, Switzerland accounted for
$56 million
or
1%
, of total net sales, and the rest of the world accounted for $3.2 billion, or the remaining 44%, of total net sales.
Basis of Preparation
The Consolidated Financial Statements included elsewhere in this Annual Report, which present our financial position, results of operations, comprehensive income/(loss), and cash flows have been prepared in accordance with International Financial Reporting Standards ("IFRS") as issued by the International Accounting Standards Board ("IASB").
The preparation of the Consolidated Financial Statements requires management to make certain estimates and assumptions, either at the balance sheet date or during the year, that affect the reported amounts of assets and liabilities as well as revenues and expenses. Actual outcomes and results could differ from those estimates and assumptions.
The businesses of Alcon did not form a separate legal group of companies prior to the Spin-off. For periods prior to the Spin-off, the financial statements were prepared on a combined basis and are derived (carved-out) from the Novartis Consolidated Financial Statements and accounting records, as if Alcon was a stand-alone company for all periods presented. Our Consolidated Financial Statements include the assets and liabilities within Novartis subsidiaries in such historical periods
57
that are attributable to Alcon and exclude the assets and liabilities within Alcon subsidiaries in such historical periods not attributable to its businesses. For periods prior to the Spin-off, the Consolidated Financial Statements include charges and allocation of expenses related to certain Novartis business support functions across the following service domains: human resources operations, real estate and facility services, including site security and executive protection, procurement, information technology, commercial and medical support services and financial reporting and accounting operations. In addition, allocations were made for Novartis corporate general and administration functions in the areas of corporate governance, including board of directors, corporate responsibility and other corporate functions, such as tax, corporate governance and listed company compliance, investor relations, internal audit, treasury and communications functions.
Management believes that the allocation methodology used was reasonable and all allocations have been performed on a basis that reasonably reflects the services received by Alcon, the cost incurred on behalf of Alcon and the assets and liabilities of Alcon. Although the Consolidated Financial Statements reflect management's best estimate of all historical costs related to Alcon, this may however not necessarily reflect what the results of operations, financial position or cash flows of Alcon would have been had Alcon operated as an independent, publicly traded company for the periods prior to the Spin-off.
Agreements entered into between Alcon and Novartis in connection with the Spin-off govern the relationship between the parties following the Spin-off and provide for the allocation of various assets, liabilities, rights and obligations. These agreements also include arrangements for transition services to be provided on a temporary basis between the parties.
For further information on the basis of preparation of the Consolidated Financial Statements see Note
2
to the Consolidated Financial Statements included elsewhere in this Annual Report.
Items You Should Consider When Evaluating Our Consolidated Financial Statements
For periods prior to the Spin-off, our results of operations, financial position and cash flows could differ from those that would have resulted if we operated autonomously or as an entity independent of Novartis. As a result, you should consider the following facts when evaluating our historical results of operations:
|
•
|
For certain of the periods covered by our Consolidated Financial Statements, our business was operated within legal entities which hosted portions of other Novartis businesses. In addition, in all the periods presented, our Consolidated Financial Statements include the ophthalmic over-the-counter products and a small portfolio of surgical diagnostics medications, the management and reporting of which was transferred to Alcon from the Innovative Medicines Division of Novartis effective as of January 1, 2018.
|
|
•
|
For periods prior to the Spin-off, income taxes attributable to the Alcon Division were determined using the separate return approach, under which current and deferred income taxes were calculated as if a separate tax return had been prepared in each tax jurisdiction. In various tax jurisdictions, Alcon and Novartis businesses operated within the same legal entity and certain Alcon subsidiaries were part of a Novartis tax group. This required an assumption that the subsidiaries and operations of Alcon in those tax jurisdictions operated on a standalone basis and constitute separate taxable entities. Actual outcomes and results could differ from these separate tax return estimates, including those estimates and assumptions related to realization of tax benefits within these Novartis tax groups.
|
|
•
|
For periods prior to the Spin-off, our Consolidated Financial Statements also include an allocation and charges of expenses related to certain Novartis functions. However, the allocations and charges may not be indicative of the actual expense that would have been incurred had we operated as an independent, publicly traded company during those periods. For example, historically, our business has been charged with a significant portion of appropriate administrative costs, such as those related to services Alcon has received from Novartis across the following service domains: human resources operations, real estate and facility services, including site security and executive protection, procurement, information technology, commercial and medical support services and financial reporting and accounting operations, and these have been reflected in our Consolidated Financial Statements based on historical allocations and charges. Accordingly, these overhead costs were affected by the historical arrangements that existed between the historical reporting units of the Alcon Division and Novartis and typically did not include a profit margin.
|
|
•
|
For periods prior to the Spin-off, our Consolidated Financial Statements also include an allocation from Novartis of certain corporate related general and administrative expenses that we would have incurred as a publicly traded company. These include costs associated with corporate governance, including board of directors, corporate responsibility and other corporate functions, such as tax, corporate governance and listed company compliance, investor relations, internal audit, treasury and communications functions. The allocation of these additional expenses may not be indicative of the actual expense that would have been incurred had we operated as an independent, publicly traded company for those periods.
|
58
|
•
|
On August 28, 2018, we announced our immediate, voluntary market withdrawal of our
CyPass
micro-stent surgical glaucoma product from the global market. Our Consolidated Financial Statements include the sales of
CyPass
micro-stent products from and after the launch of the product in 2016 until our withdrawal of the product from the market in August 2018. As a result, in the year ended December 31, 2018, we recognized a one-time pre-tax charge of $282 million (after tax $206 million). This consisted of $11 million for the costs associated with the market withdrawal and $337 million for the impairment of the
CyPass
intangible assets. These charges were partially offset by the $66 million gain for the reduction in the related contingent consideration liability.
|
The preparation of financial statements requires management to make certain estimates and assumptions, either at the balance sheet date or during the period that affects the reported amounts of assets and liabilities as well as revenues and expenses. In particular, due to the fact that the presented Consolidated Financial Statements for periods prior to the Spin-off have been carved out from Novartis financial statements, actual outcomes and results could differ from those estimates and assumptions as indicated in the Critical accounting policies and estimates section of this document. See Note 3 to the Consolidated Financial Statements included elsewhere in this Annual Report and in the "Critical accounting policies and estimates" section within this Item 5.A.
Segment description
Alcon has two identified reporting segments: Surgical and Vision Care. Both segments are supported by Research and Development and Manufacturing and Technical Operations, whose results are incorporated into the respective segment contribution. Segment contribution excludes amortization and impairment costs for acquired product rights or other intangibles, general and administrative expenses for corporate activities, and certain other income and expense items such as spin readiness and separation costs, transformation program costs, and restructuring costs and legal settlements that are not attributable to a specific segment.
In Surgical, Alcon researches, develops, manufactures, distributes and sells ophthalmic products for cataract surgery, vitreoretinal surgery, refractive laser surgery and glaucoma surgery. The surgical portfolio also includes implantables, consumables and surgical equipment required for these procedures and supports the end-to-end procedure needs of the ophthalmic surgeon. Alcon also provides services, training, education and technical support for the Surgical business. In 2019, the Surgical segment accounted for $
4.2
billion, or
57%
, of Alcon net sales to third parties, and contributed $
923
million, or
62%
, of Alcon operating income (excluding unallocated income and expenses).
In Vision Care, Alcon researches, develops, manufactures, distributes and sells daily disposable, reusable, and color-enhancing contact lenses and a comprehensive portfolio of ocular health products, including products for dry eye, contact lens care and ocular allergies, as well as ocular vitamins and redness relievers. Alcon also provides services, training, education and technical support for the Vision Care business. In 2019, the Vision Care segment accounted for $
3.2
billion, or
43%
, of Alcon net sales to third parties, and contributed $
563
million, or
38%
, of Alcon operating income (excluding unallocated income and expenses).
OPPORTUNITY AND RISK SUMMARY
The surgical and vision care markets in which Alcon operates are large, dynamic and growing. As the world population grows and ages, the need for quality eye care is expanding and evolving. In addition, although it is estimated that 80% of all visual impairments are currently preventable, treatable or curable, we operate in markets that have substantial unmet medical and consumer needs. Our surgical and vision care products are targeted at addressing many of these unmet medical and consumer needs through products that are used in treating multiple ocular health conditions and offer leading eye care solutions for patients throughout their lives.
The surgical market in which we operate includes sales of implantables, consumables, and surgical equipment, including associated technical, clinical and service support and training, and is projected to grow at approximately 4% per year from 2019 to 2024. Growth drivers in the surgical market include: global growth of cataract and vitreoretinal procedures, driven by an aging population; increased access to care; higher uptake of premium patient-pay technologies; increased adoption of advanced technologies; and eye disease as a comorbidity linked to the global prevalence of diabetes.
The vision care market in which we operate is comprised of products designed for ocular care and consumer use, and is projected to grow at approximately 5% per year from 2019 to 2024. Growth drivers in the vision care market include: continued modality shift to daily disposable lenses from reusable lenses and the resulting sales premium; advancements in specialty lenses combined with increasing demand for toric, multifocal and cosmetic lenses; a significant population of approximately 194 million undiagnosed dry eye patients, with an additional 42 million self-diagnosed dry eye patients using unsuitable products for treatment; growing access and consumption of vision care products in emerging markets; and increasing consumer access through the expansion of distribution models.
59
In each of our markets, we rely on our strong relationships with eye care professionals and consumers to attract and retain customers and expand the market. We have also made one of the largest commitments to research and development in the eye care market, which we expect to continue through internal innovation investments and identifying and executing on attractive acquisition, licensing and collaboration opportunities.
We are in the middle of executing a turnaround plan to return Alcon to sustainable, profitable growth and address existing challenges. Prior to 2016, Alcon, as a division of Novartis, had experienced stagnating growth driven by challenges in maximizing investments in its pipeline, the need for additional investment in promotional activities for existing Alcon products, an aging information technology infrastructure and difficulties in optimizing customer service, training, field service and inventory levels. The goal of the turnaround plan was to first fix the Alcon foundation, then to execute the growth plan and, in future periods, accelerate innovation, expand markets and adjacencies and develop new business models. Our growth acceleration plan consists of three phases:
|
•
|
Fix the foundation (2016–2017)
: The initial phase of our growth plan in 2016 and 2017 focused on fixing the foundation of Alcon by investing in promotion, capital and systems, reinvigorating the innovation pipeline, and strengthening our customer relationships. Improving the culture at Alcon has also been a top priority, and the organization has responded with significant morale improvement. Strong results have followed, including sales returning to growth.
|
|
•
|
Execute the growth plan (2018–2020)
: We began the second phase of our growth plan in 2018, with a focus on superior execution, further investing in high-potential products and market segments and accelerating our product development cycle. We have begun to transform our company by cultivating a more nimble and agile culture. In our surgical business, we intend to continue to expand and grow the premium IOL market with our AT-IOL offerings and our
PanOptix
brand of presbyopia correcting IOLs ("PC-IOLs"). We also plan to expand our vitreoretinal business, in part through enhancing technology penetration in key markets and by accelerating conversion from optical to digital surgery. In our vision care business, we intend to grow our
DAILIES TOTAL1
family of products and expand the presbyopia category through increased consumer awareness, lens comfort and quality. We also plan to continue the global roll-out of our
Systane
COMPLETE product and grow consumer demand with investments in direct-to-consumer marketing.
|
|
•
|
Deliver leading-edge solutions (2021 and beyond)
: Following the completion of the second phase of our growth plan, the third phase will focus on accelerating innovation, capturing opportunities to expand markets and pursue adjacencies and developing new business models to improve access to our leading product portfolio.
|
Alcon future expectations are subject to various risks and uncertainties, including market dynamics in the surgical and vision care markets, general economic conditions and the pace of innovation in our industry, as well as successfully achieving our growth strategies and efficiency initiatives. These expectations were, in the view of management, prepared on a reasonable basis, reflect the best currently available estimates and judgments, and present, to the best of management's knowledge and belief, the expected future financial performance of Alcon. However, this information is not fact and should not be relied upon as necessarily indicative of future results, and you are cautioned not to place undue reliance on the prospective financial information. There will likely be differences between Alcon expectations and the actual results and those differences could be material. We can give no assurance that Alcon expectations will be achieved and we do not undertake any obligation to release publicly the results of any future revisions we may make to the expectations. When considering Alcon expectations, you should keep in mind the risk factors and other cautionary statements in "Item 3. Key Information —3.D Risk Factors" and "Special Note About Forward-Looking Statements" in this Annual Report.
Our financial results are affected to varying degrees by internal and external factors. For example, our ability to grow depends on the commercial success of our products and our ability to maintain our position in the highly competitive markets in which we operate. Even if we protect our intellectual property to the fullest extent permitted by applicable law, competitors may market products that compete with our products. Our ability to grow also depends on the success of our research and development efforts in bringing new products to market, as well as the commercial acceptance of our products. Increased pricing pressure in the healthcare industry in general could also impact our ability to generate returns and invest for the future. Additionally, our products are subject to competition from lower priced versions of our products, and our industry continues to be challenged by the vulnerability of distribution channels to counterfeiting. Product recalls or voluntary market withdrawals in connection with defects or unanticipated use of our products could also have a material adverse effect upon our business. We are also implementing new information technology systems and integrating those new systems into our legacy systems. All of our operations, including our information technology systems, can be vulnerable to a variety of business interruptions.
Further, our ability to grow may be impacted by the ongoing consolidation among distributors, retailers and healthcare provider organizations, which could increase both the purchasing leverage of key customers and the concentration of credit risk. We also may be adversely affected by changes in inventory levels or fluctuations in buying patterns by our large distributor and retail customers. If we overestimate demand and produce too much of a particular product, we face a risk of inventory
60
obsolescence. In addition, for certain materials, components and services, we rely on sole or limited sources of supply. Our customer relations could be negatively impacted by the loss of our significant suppliers or the inability of any such supplier to meet certain specifications or delivery schedules. Further, we have developed strong relationships with numerous healthcare providers, and rely on them to recommend our products to their patients and to other members of their organizations. Consumers in the eye health industry have a tendency not to switch products regularly and are repeat consumers, meaning that a physician's initial recommendation of our products, and a consumer's initial choice to use our products, have an impact on the success of our products. Therefore, it is important to our business and results of operations to retain and grow these relationships.
Given our global presence, our operations and business results are also influenced and affected by the global economic and financial environment, including unpredictable political conditions that currently exist in various parts of the world. Additionally, a portion of our operations are conducted in emerging markets and are subject to risks and potential costs such as economic, political and social uncertainty, as well as relatively low average income levels and limited government reimbursement for the cost of healthcare products and services. Our operations and business results are also affected by the varying degrees of governmental regulation in the countries in which we operate, making the process of developing new products and obtaining necessary regulatory marketing authorization lengthy, expensive and uncertain. The manufacture of our products is also highly regulated. Any changes or new requirements related to the regulatory approval process or postmarket requirements applicable to our products in any jurisdiction could be costly and onerous to comply with.
For more details on these trends and how they could impact our results, see "Item 3. Key Information—3.D. Risk Factors".
COMPONENTS OF RESULTS OF OPERATIONS
Net sales to third parties
Revenue on the sale of Alcon products and services, which is recorded as "Net sales to third parties" in the consolidated income statements, is recognized when a contractual promise to a customer (i.e., a performance obligation) has been fulfilled by transferring control over the promised goods and services to the customer, substantially all of which is at the point in time of shipment to or receipt of the products by the customer or when the services are performed. If contracts contain customer acceptance provisions, revenue would be recognized upon the satisfaction of acceptance criteria. The amount of revenue to be recognized is based on the consideration Alcon expects to receive in exchange for its goods and services which may be fixed or variable. Variable consideration may include rebates, discounts including cash discounts, and sales returns. Variable consideration is only recognized when it is highly probable that a significant reversal of cumulative sales will not occur.
Surgical equipment may be sold together with other products and services under a single contract. The total consideration is allocated to the separate performance obligations based on the relative standalone selling price for each performance obligation. Revenue is recognized upon satisfaction of each performance obligation under the contract.
Other revenues
"Other revenues" mainly include revenue from contract manufacturing services provided to our Former Parent which are recognized over time as the service obligations are completed. Associated costs incurred are recognized in "Cost of other revenues".
Inventories
Inventory is valued at acquisition or production cost determined on a first-in, first-out basis. This value is used for the "Cost of net sales" and "Cost of other revenues" in the consolidated income statements. Unsalable inventory is fully written off in the consolidated income statements under "Cost of net sales" and "Cost of other revenues".
Research & development
Internal research and development ("R&D") costs are fully charged to "Research & development" in the consolidated income statements in the period in which they are incurred. Alcon considers that regulatory and other uncertainties inherent in the development of new products preclude the capitalization of internal development expenses as an intangible asset until marketing approval from a regulatory authority is obtained in relevant major markets, such as the United States, the European Union, Switzerland or Japan.
CRITICAL ACCOUNTING POLICIES AND ESTIMATES
Selected accounting policies are set out in Note
3
to the Consolidated Financial Statements included elsewhere in this Annual Report, which are prepared in accordance with IFRS as issued by the IASB.
61
Given the uncertainties inherent in our business activities, we must make certain estimates and assumptions that require difficult, subjective and complex judgments. Because of uncertainties inherent in such judgments, actual outcomes and results may differ from our assumptions and estimates, which could materially affect our Consolidated Financial Statements. Application of the following accounting policies requires certain assumptions and estimates that have the potential for the most significant impact on the Consolidated Financial Statements.
Impairment of goodwill and intangible assets
We review long-lived intangible assets for impairment whenever events or changes in circumstance indicate that the asset's balance sheet carrying amount may not be recoverable. Goodwill, the Alcon brand name and intangible assets not yet ready for use are not amortized but are reviewed for impairment at least annually. Our annual impairment testing date is Alcon's year-end, December 31.
An asset is generally considered impaired when its balance sheet carrying amount exceeds its estimated recoverable amount, which is defined as the higher of its fair value less costs of disposal and its value in use. Usually, Alcon uses the fair value less costs of disposal method for its impairment evaluation. In most cases, no directly observable market inputs are available to measure the fair value less costs of disposal. Therefore, an estimate of fair value less costs of disposal is derived indirectly and is based on net present value techniques utilizing post-tax cash flows and discount rates. In the limited cases where the value in use method is applied, net present value techniques are utilized using pre-tax cash flows and discount rates.
Fair value reflects estimates of assumptions that market participants would be expected to use when pricing the asset and for this purpose management considers the range of economic conditions that are expected to exist over the remaining useful life of the asset. The estimates used in calculating net present values are highly sensitive and depend on assumptions, which includes the following:
|
•
|
the amount and timing of projected cash flows;
|
|
•
|
the timing and probability of regulatory and commercial success;
|
|
•
|
the royalty rate for the Alcon brand name;
|
|
•
|
the terminal growth rate; and
|
|
•
|
the discount rate.
|
Due to the above factors and those further described in the "
Opportunity and risk summary
" section above, actual cash flows and values could vary significantly from forecasted future cash flows and related values derived using discounting techniques.
The recoverable amount of the grouping of cash generating units to which goodwill and indefinite life intangible assets are allocated is based on fair value less costs of disposal. For additional information on intangible assets, see Note
10
to the Consolidated Financial Statements included elsewhere in this Annual Report.
Goodwill and other intangible assets represent a significant part of our consolidated balance sheet, primarily due to acquisitions. Although no significant additional impairments are currently anticipated, impairment evaluation could lead to material impairment charges in the future.
Business combinations
The acquisition method of accounting is used to account for all business combinations, regardless of whether equity instruments or other assets are acquired. Identifiable assets acquired and liabilities assumed in a business combination are measured initially at their fair values at the acquisition date. The excess of the consideration transferred over the fair value of the net identifiable assets acquired is recorded as goodwill, or directly in the income statement if it is a bargain purchase. Alcon primarily uses net present value techniques, utilizing post-tax cash flows and discount rates in calculating the fair value of net identifiable assets acquired when allocating the purchase consideration paid for the acquisition. The estimates in calculating fair values are highly sensitive and depend on assumptions, which include the following:
|
•
|
the amount and timing of projected cash flows;
|
|
•
|
long-term sales forecasts;
|
|
•
|
the timing and probability of regulatory and commercial success; and
|
|
•
|
the appropriate discount rate.
|
62
Contingent consideration
In a business combination, it is necessary to recognize contingent future payments to previous owners, representing contractually defined potential amounts as a liability. Usually for Alcon these are linked to milestone or royalty payments related to certain assets and are recognized as a financial liability at their fair value, which is then re-measured at each subsequent reporting date.
For the determination of the fair value of contingent consideration various unobservable inputs are used. A change in these inputs might result in a significantly higher or lower fair value measurement. The inputs used are, among others, the timing and probability of regulatory and commercial success, sales forecast and assumptions regarding the discount rate, timing and different scenarios of triggering events. The significance and usage of these inputs to each contingent consideration may vary due to differences in the timing and triggering events for payments or in the nature of the asset related to the contingent consideration. These estimations typically depend on factors such as technical milestones or market performance and are adjusted for the probability of their likelihood of payment and, if material, are appropriately discounted to reflect the impact of time.
Changes in the fair value of contingent consideration liabilities in subsequent periods are recognized in the consolidated income statements in "Cost of net sales" for currently marketed products and in "Research & development" for in-process research & development.
The effect of unwinding the discount over time is recognized in "Interest expense" in the consolidated income statements.
Taxes
The estimated amounts for current and deferred tax assets or liabilities, including any amounts related to any uncertain tax positions, are based on currently known facts and circumstances. Tax returns are based on an interpretation of tax laws and regulations and reflect estimates based on these judgments and interpretations. The tax returns are subject to examination by the competent taxing authorities which may result in an assessment being made requiring payments of additional tax, interest or penalties. Inherent uncertainties exist in the estimates of the tax positions.
Research & development
Internal research & development costs are fully charged to the income statement in the period in which they are incurred. Alcon considers that regulatory and other uncertainties inherent in the development of new products preclude the capitalization of internal development expenses as an intangible asset usually until marketing approval from the regulatory authority is obtained in a relevant major market, such as the United States, the European Union, Switzerland or Japan.
FACTORS AFFECTING COMPARABILITY OF PERIOD TO PERIOD RESULTS OF OPERATIONS
The comparability of the period to period results of our operations can be significantly affected by our Spin-off from Novartis, issuance and refinancing of financial debts and acquisitions. The transactions of significance during 2019 include the acquisition of PowerVision, Inc., Spin-off from Novartis through a dividend in kind distribution to Novartis shareholders, and refinancing of the bridge and term loans which had been issued in April 2019. Transactions of significance during 2018 and 2017 included the acquisitions of TrueVision Systems, Inc. and Tear Film Innovations, Inc. in 2018 and the acquisition of ClarVista Medical, Inc. in 2017. Refer to Note 4 to the Consolidated Financial Statements for details related to each of these significant transactions.
63
RESULTS OF OPERATIONS
In evaluating our performance, we consider not only the IFRS results, but also certain non-IFRS measures, including various "core" results and constant currency ("cc") results. These measures assist us in evaluating our ongoing performance from period to period and we believe this additional information is useful to investors in understanding the performance of our business. Refer to "Item
5.A. Operating Results
—
Non-IFRS measures as defined by the Company
" section for additional information and reconciliation tables. These measures are not intended to be substitutes for the equivalent measures of financial performance prepared in accordance with IFRS and may differ from similarly titled non-IFRS measures of other companies.
Key figures
|
2019 compared to 2018
|
2018 compared to 2017
|
||||||||||||||||||
|
Change %
|
Change %
|
||||||||||||||||||
|
($ millions unless indicated otherwise)
|
2019
|
|
2018
|
|
$
|
|
cc
(1)
|
|
2017
|
|
$
|
cc
(1)
|
|
||||||
|
|
|||||||||||||||||||
|
Net sales to third parties
|
7,362
|
|
7,149
|
|
3
|
|
5
|
|
6,785
|
|
5
|
5
|
|
||||||
|
Gross profit
|
3,662
|
|
3,192
|
|
15
|
|
19
|
|
3,204
|
|
—
|
(1
|
)
|
||||||
|
Operating (loss)
|
(187
|
)
|
(248
|
)
|
25
|
|
54
|
|
(77
|
)
|
nm
|
nm
|
|
||||||
|
Operating margin (%)
|
(2.5
|
)
|
(3.5
|
)
|
(1.1
|
)
|
|||||||||||||
|
Net (loss)/income
|
(656
|
)
|
(227
|
)
|
(189
|
)
|
(163
|
)
|
256
|
|
nm
|
nm
|
|
||||||
|
Basic and diluted (loss)/earnings per share ($)
(2)
|
(1.34
|
)
|
(0.46
|
)
|
(191
|
)
|
(163
|
)
|
0.52
|
|
nm
|
nm
|
|
||||||
|
Core results
(1)
|
|||||||||||||||||||
|
Core operating income
|
1,265
|
|
1,212
|
|
4
|
|
11
|
|
1,086
|
|
12
|
12
|
|
||||||
|
Core operating margin %
|
17.2
|
|
17.0
|
|
16.0
|
|
|||||||||||||
|
Core net income
|
925
|
|
974
|
|
(5
|
)
|
1
|
|
908
|
|
7
|
8
|
|
||||||
|
Core basic earnings per share ($)
(2)
|
1.89
|
|
2.00
|
|
(6
|
)
|
1
|
|
1.86
|
|
8
|
8
|
|
||||||
|
Core diluted earnings per share ($)
(3)
|
1.89
|
|
2.00
|
|
(6
|
)
|
1
|
|
1.86
|
|
8
|
8
|
|
||||||
nm = not meaningful
|
(1)
|
Core results and constant currencies (cc) as presented in this table are non-IFRS measures. Alcon uses certain non-IFRS metrics when measuring performance, including when measuring current period results against prior periods. Refer to "Item
5.A. Operating Results
—
Non-IFRS measures as defined by the Company
" section for additional information and reconciliation tables.
|
|
(2)
|
Calculated using
488.2
million shares for both current and prior year periods.
|
|
(3)
|
Calculated using
490.1
million weighted average diluted shares for the year ended December 31, 2019, and
488.2
million shares for the prior year periods.
|
64
All comments below focus on constant currencies (cc) movements for the year ended December 31, 2019 compared to 2018 unless otherwise noted. Commentary for the year ended December 31, 2018 compared to 2017 may be found in Item 5 of Amendment No. 6 to the Company's Registration Statement on Form 20-F filed with the Securities and Exchange Commission ("SEC") on March 22, 2019, ("2018 Form 20-F").
Net sales by segment
The following table provides an overview of net sales to third parties by segment:
|
2019 compared to 2018
|
2018 compared to 2017
|
|||||||||||||||
|
Change %
|
Change %
|
|||||||||||||||
|
($ millions unless indicated otherwise)
|
2019
|
|
2018
|
|
$
|
cc
(1)
|
2017
|
|
$
|
cc
(1)
|
||||||
|
|
||||||||||||||||
|
Surgical
|
|
|
|
|
|
|
|
|
||||||||
|
Implantables
|
1,210
|
|
1,136
|
|
7
|
9
|
1,045
|
|
9
|
9
|
||||||
|
Consumables
|
2,304
|
|
2,227
|
|
3
|
6
|
2,104
|
|
6
|
5
|
||||||
|
Equipment/other
|
660
|
|
636
|
|
4
|
6
|
584
|
|
9
|
9
|
||||||
|
Total Surgical
|
4,174
|
|
3,999
|
|
4
|
7
|
3,733
|
|
7
|
7
|
||||||
|
Vision Care
|
||||||||||||||||
|
Contact lenses
|
1,969
|
|
1,928
|
|
2
|
4
|
1,836
|
|
5
|
4
|
||||||
|
Ocular health
|
1,219
|
|
1,222
|
|
—
|
2
|
1,216
|
|
—
|
1
|
||||||
|
Total Vision Care
|
3,188
|
|
3,150
|
|
1
|
3
|
3,052
|
|
3
|
3
|
||||||
|
Net sales to third parties
|
7,362
|
|
7,149
|
|
3
|
5
|
6,785
|
|
5
|
5
|
||||||
|
(1)
|
Constant currencies is a non-IFRS measure. Refer to "Item
5.A. Operating Results
—
Non-IFRS measures as defined by the Company
" section for additional information.
|
Surgical
Surgical net sales were $
4.2 billion
(
+4%
,
+7%
cc) in 2019 as all key categories grew. Implantables grew (
+7%
,
+9%
cc), driven by continued strong demand for Advanced Technology IOLs, including
AcrySof IQ
PanOptix
trifocal IOLs, particularly with the recent launches in the US and Japan. Consumables grew (
+3%
,
+6%
cc)
,
driven by cataract and vitreoretinal consumables which continue to benefit from a strong global installed equipment base. Equipment/other grew (
+4%
,
+6%
cc), driven by growth in service revenue and procedural eye drops, while the base equipment sales remained broadly in line with prior year.
Vision Care
Vision Care net sales were $
3.2 billion
(
+1%
,
+3%
cc). Contact lenses grew (
+2%
,
+4%
cc), driven by continued double-digit growth of
DAILIES TOTAL1
globally, including multifocal lenses to treat presbyopia, partially offset by a decline in other contact lenses. Ocular health grew (
0%
,
+2%
cc), driven by artificial tears, primarily
Systane
in the US and Europe following the 2018 launch of
Systane COMPLETE
, partially offset by declines in contact lens care as the global market continues to shift to daily lens modalities.
65
Operating (loss)/income
|
2019 compared to 2018
|
2018 compared to 2017
|
|||||||||||||||
|
Change %
|
Change %
|
|||||||||||||||
|
($ millions unless indicated otherwise)
|
2019
|
|
2018
|
|
$
|
|
cc
(1)
|
|
2017
|
|
$
|
|
cc
(1)
|
|
||
|
Gross profit
|
3,662
|
|
3,192
|
|
15
|
|
19
|
|
3,204
|
|
—
|
|
(1
|
)
|
||
|
Selling, general & administration
|
(2,847
|
)
|
(2,801
|
)
|
(2
|
)
|
(4
|
)
|
(2,596
|
)
|
(8
|
)
|
(7
|
)
|
||
|
Research & development
|
(656
|
)
|
(587
|
)
|
(12
|
)
|
(12
|
)
|
(584
|
)
|
(1
|
)
|
—
|
|
||
|
Other income
|
55
|
|
47
|
|
17
|
|
19
|
|
47
|
|
—
|
|
1
|
|
||
|
Other expense
|
(401
|
)
|
(99
|
)
|
nm
|
|
nm
|
|
(148
|
)
|
33
|
|
33
|
|
||
|
Operating (loss)
|
(187
|
)
|
(248
|
)
|
25
|
|
54
|
|
(77
|
)
|
nm
|
|
nm
|
|
||
|
Operating margin (%)
|
(2.5
|
)
|
(3.5
|
)
|
(1.1
|
)
|
||||||||||
|
Core results
(1)
|
||||||||||||||||
|
Core gross profit
|
4,663
|
|
4,541
|
|
3
|
|
6
|
|
4,211
|
|
8
|
|
8
|
|
||
|
Core operating income
|
1,265
|
|
1,212
|
|
4
|
|
11
|
|
1,086
|
|
12
|
|
12
|
|
||
|
Core operating margin (%)
|
17.2
|
|
17.0
|
|
16.0
|
|
||||||||||
|
(1)
|
Core results and constant currencies are non-IFRS measures. Refer to "Item
5.A. Operating Results
—
Non-IFRS measures as defined by the Company
" section for additional information and reconciliation tables.
|
Operating loss was
$187 million
, compared to
$248 million
in the prior year period. The prior year period included an unfavorable impact of
$282 million
from the
CyPass
voluntary market withdrawal, including a
$337 million
expense for impairment of the intangible asset and
$11 million
in other costs, partially offset by a
$66 million
reduction of the contingent consideration liability. The current year period includes higher sales and improved gross margin which were more than offset by spin readiness costs, separation costs, transformation program costs, and investments in research and development and IT, including SAP implementation. There was a negative
1.0%
point impact on operating margin from currency in 2019.
Adjustments to arrive at core operating income were
$1.5 billion
, mainly due to
$1.0 billion
of amortization, $
237
million of separation costs,
$72 million
of spin readiness costs and
$52 million
of transformation program costs.
Core operating income was
$1.3 billion
(
+4%
,
+11%
cc), compared to
$1.2 billion
in the prior year period. Higher sales were partially offset by investments in research & development and IT, including the SAP implementation. Core gross margin was broadly in line with prior year, as improved surgical sales mix and vision care manufacturing efficiencies were offset by SAP implementation costs, vision care production expansion costs and China tariffs. There was a negative
0.6%
point impact on core operating margin from currency in 2019.
66
Segment contribution
(1)
|
2019 compared to 2018
|
2018 compared to 2017
|
|||||||||||||||
|
($ millions unless indicated otherwise)
|
Change %
|
Change %
|
||||||||||||||
|
2019
|
|
2018
|
|
$
|
|
cc
(2)
|
|
2017
|
|
$
|
|
cc
(2)
|
|
|||
|
Surgical segment contribution
|
923
|
|
813
|
|
14
|
|
19
|
|
691
|
|
18
|
|
18
|
|
||
|
As % of net sales
|
22.1
|
|
20.3
|
|
|
|
|
|
18.5
|
|
||||||
|
Vision Care segment contribution
|
563
|
|
594
|
|
(5
|
)
|
(1
|
)
|
625
|
|
(5
|
)
|
(5
|
)
|
||
|
As % of net sales
|
17.7
|
|
18.9
|
|
|
|
|
|
20.5
|
|
||||||
|
Not allocated to segments
|
(1,673
|
)
|
(1,655
|
)
|
(1
|
)
|
(1
|
)
|
(1,393
|
)
|
(19
|
)
|
(18
|
)
|
||
|
Operating (loss)
|
(187
|
)
|
(248
|
)
|
25
|
|
54
|
|
(77
|
)
|
nm
|
|
nm
|
|
||
|
Core results
(2)
|
||||||||||||||||
|
Core Surgical segment contribution
|
957
|
|
846
|
|
13
|
|
19
|
|
701
|
|
21
|
|
21
|
|
||
|
As % of net sales
|
22.9
|
|
21.2
|
|
|
|
|
|
18.8
|
|
||||||
|
Core Vision Care segment contribution
|
580
|
|
600
|
|
(3
|
)
|
1
|
|
625
|
|
(4
|
)
|
(3
|
)
|
||
|
As % of net sales
|
18.2
|
|
19.0
|
|
|
|
|
|
20.5
|
|
||||||
|
Core not allocated to segments
|
(272
|
)
|
(234
|
)
|
(16
|
)
|
(17
|
)
|
(240
|
)
|
3
|
|
3
|
|
||
|
Core operating income
|
1,265
|
|
1,212
|
|
4
|
|
11
|
|
1,086
|
|
12
|
|
12
|
|
||
nm = not meaningful
|
(1)
|
For additional information
regarding segment contribution please refer to Note
5
to the Consolidated Financial Statements.
|
|
(2)
|
Core results and constant currencies are non-IFRS measures. Refer to "Item
5.A. Operating Results
—
Non-IFRS measures as defined by the Company
" section for additional information and reconciliation tables.
|
Surgical
Surgical segment contribution was
$923 million
(
+14%
,
+19%
cc), compared to
$813 million
in the prior year period. Higher sales, improved gross margin, and improved selling, general & administrative expenses leverage, were partially offset by higher research & development investments.
Adjustments to arrive at core Surgical segment contribution were
$34 million
, primarily for business development charges and manufacturing sites consolidation activities partially offset by fair value adjustments to contingent consideration liabilities.
Core Surgical segment contribution was
$957 million
(
+13%
,
+19%
cc), compared to
$846 million
in the prior year period. Higher sales, improved gross margin, and improved selling, general & administrative expenses leverage, were partially offset by higher research & development investments. There was a negative
0.6%
point impact on core Surgical segment contribution margin from currency.
Vision Care
Vision Care segment contribution was
$563 million
(
-5%
,
-1%
cc), compared to
$594 million
in the prior year period. Higher sales and lower marketing and selling costs were offset by lower gross margin from product mix, production expansion costs, higher research & development investments, and separation costs.
Adjustments to arrive at core Vision Care segment contribution were
$17 million
primarily due to spin readiness and separation costs partially offset by fair value adjustments to contingent consideration liabilities.
Core Vision Care segment contribution was
$580 million
(
-3%
,
+1%
cc), compared to
$600 million
in the prior year period. Higher sales and lower marketing and selling costs were partially offset by lower gross margin from product mix, production expansion costs, and higher research & development investments. There was a negative
0.5%
point impact on core Vision Care segment contribution margin from currency.
67
Not allocated to segments
Operating loss not allocated to segments was
$1.7 billion
, broadly in line with the prior year period which was affected by the
CyPass
voluntary market withdrawal. The current year period included
$214 million
of separation costs, $62 million of spin readiness costs,
$52 million
of transformation program costs, and higher corporate costs, consisting of legal items and IT costs.
Core operating income not allocated to segments amounted to net core expense of
$272 million
, compared to
$234 million
in the prior year period, driven primarily by higher IT costs.
68
Non-operating income & expense
|
2019 compared to 2018
|
2018 compared to 2017
|
|||||||||||||||
|
Change %
|
Change %
|
|||||||||||||||
|
($ millions unless indicated otherwise)
|
2019
|
|
2018
|
|
$
|
|
cc
(1)
|
|
2017
|
|
$
|
|
cc
(1)
|
|
||
|
Operating (loss)
|
(187
|
)
|
(248
|
)
|
25
|
|
54
|
|
(77
|
)
|
nm
|
|
nm
|
|
||
|
Interest expense
|
(113
|
)
|
(24
|
)
|
nm
|
|
nm
|
|
(27
|
)
|
11
|
|
(2
|
)
|
||
|
Other financial income & expense
|
(32
|
)
|
(28
|
)
|
(14
|
)
|
(15
|
)
|
(23
|
)
|
(22
|
)
|
(29
|
)
|
||
|
(Loss) before taxes
|
(332
|
)
|
(300
|
)
|
(11
|
)
|
13
|
|
(127
|
)
|
(136
|
)
|
(129
|
)
|
||
|
Taxes
|
(324
|
)
|
73
|
|
nm
|
|
nm
|
|
383
|
|
(81
|
)
|
(81
|
)
|
||
|
Net (Loss)/income
|
(656
|
)
|
(227
|
)
|
(189
|
)
|
(163
|
)
|
256
|
|
nm
|
|
nm
|
|
||
|
Basic and diluted (loss)/earnings per share ($)
|
(1.34
|
)
|
(0.46
|
)
|
(191
|
)
|
(163
|
)
|
0.52
|
|
nm
|
|
nm
|
|
||
|
Core results
(1)
|
||||||||||||||||
|
Core taxes
|
(195
|
)
|
(186
|
)
|
(5
|
)
|
(12
|
)
|
(128
|
)
|
(45
|
)
|
(45
|
)
|
||
|
Core net income
|
925
|
|
974
|
|
(5
|
)
|
1
|
|
908
|
|
7
|
|
8
|
|
||
|
Core basic earnings per share ($)
|
1.89
|
|
2.00
|
|
(6
|
)
|
1
|
|
1.86
|
|
8
|
|
8
|
|
||
|
Core diluted earnings per share ($)
|
1.89
|
|
2.00
|
|
(6
|
)
|
1
|
|
1.86
|
|
8
|
|
8
|
|
||
nm = not meaningful
|
(1)
|
Core results and constant currencies are non-IFRS measures. Refer to "Item
5.A. Operating Results
—
Non-IFRS measures as defined by the Company
" section for additional information and reconciliation tables.
|
Interest expense
Interest expense was
$113 million
, compared with
$24 million
in the prior year period, driven by financial debts, including the bridge and other term loans, notes and local bilateral facilities, and the adoption of IFRS 16,
Leases
.
Other financial income & expense
Other financial income & expense was a net expense of
$32 million
, compared to
$28 million
in the prior year period, and consisted primarily of hedging costs and foreign currency exchange gains and losses. The current year period also included a $4 million write-off of unamortized deferred financing costs at the time of refinancing.
Taxes
Tax expense was
$324 million
, compared to a tax benefit of
$73 million
in the prior year period. The prior year period included a
$76 million
tax benefit for the release of the deferred tax liability associated with the
CyPass
intangible asset. Taxes recognized in the current period include
$304 million
in non-cash tax expense related to the re-measurement of deferred tax assets and liabilities as a result of Swiss tax reform, tax expense related to rate changes in the US following legal entity reorganizations executed related to the Spin-off, non-cash tax expense related to the re-measurement of deferred tax assets and liabilities following a tax rate change in India, and net changes in uncertain tax positions.
Adjustments to arrive at core tax expense were
$129 million
, primarily related to Swiss tax reform, partially offset by tax associated with operating income core adjustments.
Core tax expense was
$195 million
, compared to
$186 million
in the prior year period. The average core tax rate increased to
17.4%
from
16.0%
in the prior year period. The increase in the core effective tax rate is primarily driven by a loss of certain tax benefits in the US due to the Spin-off and the mix of pre-tax income across geographical tax jurisdictions.
69
Net (loss)/income and (loss)/earnings per share
Net loss was
$656 million
, compared to a net loss of
$227 million
in the prior year period. The increase was mainly attributable to an operating loss driven mainly by spin readiness costs, separation costs, and transformation program costs, higher interest and tax expense. The associated basic and diluted (loss) per share were
$(1.34)
, compared to
$(0.46)
in the prior year period.
Core net income was
$925 million
, compared to
$974 million
in the prior year period, as higher core operating income was offset by higher interest and tax expense. The associated core basic and diluted earnings per share were
$1.89
compared to
$2.00
in the prior year period.
70
EFFECTS OF CURRENCY FLUCTUATIONS
We prepare our Consolidated Financial Statements in US dollars. As a result, fluctuations in the exchange rates between the US dollar and other currencies can have a significant effect on both our results of operations as well as on the reported value of our assets, liabilities and cash flows. This in turn may significantly affect reported earnings (both positively and negatively) and the comparability of period-to-period results of operations.
For purposes of our consolidated balance sheets, we translate assets and liabilities denominated in other currencies into US dollars at the prevailing market exchange rates as of the relevant balance sheet date. For purposes of our consolidated income statements and statements of cash flows, revenue, expense and cash flow items in local currencies are translated into US dollars at average exchange rates prevailing during the relevant period. As a result, even if the amounts or values of these items remain unchanged in the respective local currency, changes in exchange rates have an impact on the amounts or values of these items in our Consolidated Financial Statements.
Alcon manages its global currency exposure by engaging in hedging transactions where management deems appropriate (forward contracts and swaps). Specifically, Alcon enters into various contracts that reflect the changes in the value of foreign currency exchange rates to preserve the value of assets.
There is also a risk that certain countries could devalue their currency. If this occurs, then it could impact the effective prices we would be able to charge for our products and also have an adverse impact on both our consolidated income statement and balance sheet. Alcon is exposed to a potential adverse devaluation risk on its intercompany funding and total investment in certain subsidiaries operating in countries with exchange controls.
The hyperinflationary economies in which we operate are Argentina and Venezuela. Venezuela was hyperinflationary for all years presented, and Argentina became hyperinflationary effective July 1, 2018, requiring implementation of hyperinflation accounting as of January 1, 2018. Refer to Note
3
to the Consolidated Financial Statements included elsewhere in this Annual Report for additional information.
71
Foreign exchange rates for foreign currency translation
The following tables set forth the foreign exchange rates of the US dollar against key currencies used for foreign currency translation when preparing the Consolidated Financial Statements:
|
|
Average for year
|
As of December 31
|
|||||||||||
|
($ per unit unless indicated otherwise)
|
2019
|
2018
|
Change %
|
|
2019
|
2018
|
Change %
|
|
|||||
|
AUD
|
0.695
|
0.748
|
(7
|
)
|
0.701
|
0.707
|
(1
|
)
|
|||||
|
BRL
|
0.254
|
0.275
|
(8
|
)
|
0.249
|
0.258
|
(3
|
)
|
|||||
|
CAD
|
0.754
|
0.772
|
(2
|
)
|
0.767
|
0.735
|
4
|
|
|||||
|
CHF
|
1.006
|
1.023
|
(2
|
)
|
1.032
|
1.014
|
2
|
|
|||||
|
CNY
|
0.145
|
0.151
|
(4
|
)
|
0.144
|
0.145
|
(1
|
)
|
|||||
|
EUR
|
1.120
|
1.181
|
(5
|
)
|
1.121
|
1.144
|
(2
|
)
|
|||||
|
GBP
|
1.277
|
1.336
|
(4
|
)
|
1.313
|
1.274
|
3
|
|
|||||
|
JPY (100)
|
0.917
|
0.906
|
1
|
|
0.920
|
0.907
|
1
|
|
|||||
|
RUB (100)
|
1.546
|
1.600
|
(3
|
)
|
1.613
|
1.437
|
12
|
|
|||||
|
|
Average for year
|
As of December 31
|
|||||||||||
|
($ per unit unless indicated otherwise)
|
2018
|
2017
|
Change %
|
|
2018
|
2017
|
Change %
|
|
|||||
|
AUD
|
0.748
|
0.766
|
(2
|
)
|
0.707
|
0.779
|
(9
|
)
|
|||||
|
BRL
|
0.275
|
0.313
|
(12
|
)
|
0.258
|
0.302
|
(15
|
)
|
|||||
|
CAD
|
0.772
|
0.771
|
—
|
|
0.735
|
0.797
|
(8
|
)
|
|||||
|
CHF
|
1.023
|
1.016
|
1
|
|
1.014
|
1.024
|
(1
|
)
|
|||||
|
CNY
|
0.151
|
0.148
|
2
|
|
0.145
|
0.154
|
(6
|
)
|
|||||
|
EUR
|
1.181
|
1.129
|
5
|
|
1.144
|
1.195
|
(4
|
)
|
|||||
|
GBP
|
1.336
|
1.288
|
4
|
|
1.274
|
1.347
|
(5
|
)
|
|||||
|
JPY (100)
|
0.906
|
0.892
|
2
|
|
0.907
|
0.888
|
2
|
|
|||||
|
RUB (100)
|
1.600
|
1.715
|
(7
|
)
|
1.437
|
1.734
|
(17
|
)
|
|||||
72
Currency impact on key figures
The following table provides a summary of the currency impact on key company figures due to their conversion into US dollars, Alcon's reporting currency, of the financial data from entities reporting in non-US dollars.
|
2019 compared to 2018
|
2018 compared to 2017
|
|||||||||||||||
|
Change %
|
Percentage point currency impact
|
|
Change %
|
Percentage point currency impact
|
|
|||||||||||
|
$
|
|
cc
(1)
|
|
$
|
|
cc
(1)
|
||||||||||
|
Net sales to third parties
|
3
|
|
5
|
|
(2
|
)
|
5
|
|
5
|
—
|
|
|||||
|
Gross profit
|
15
|
|
19
|
|
(4
|
)
|
—
|
|
(1)
|
1
|
|
|||||
|
Operating (loss)
|
25
|
|
54
|
|
(29
|
)
|
nm
|
|
nm
|
nm
|
|
|||||
|
Net (loss)/income
|
(189
|
)
|
(163
|
)
|
(26
|
)
|
nm
|
|
nm
|
nm
|
|
|||||
|
Basic and diluted (loss)/earnings per share
|
(191
|
)
|
(163
|
)
|
(28
|
)
|
nm
|
|
nm
|
nm
|
|
|||||
|
Core results
(1)
|
||||||||||||||||
|
Core operating income
|
4
|
|
11
|
|
(7
|
)
|
12
|
|
12
|
—
|
|
|||||
|
Core net income
|
(5
|
)
|
1
|
|
(6
|
)
|
7
|
|
8
|
(1
|
)
|
|||||
|
Core basic earnings per share
|
(6
|
)
|
1
|
|
(7
|
)
|
8
|
|
8
|
—
|
|
|||||
|
Core diluted earnings per share
|
(6
|
)
|
1
|
|
(7
|
)
|
8
|
|
8
|
—
|
|
|||||
|
(1)
|
Core results and constant currencies (cc) as presented in this table are non-IFRS measures. Alcon uses certain non-IFRS metrics when measuring performance, including when measuring current period results against prior periods. Refer to "Item
5.A. Operating Results
—
Non-IFRS measures as defined by the Company
" section for additional information.
|
A 1% movement in the USD versus our basket of currencies would result in a $40 million change in annual net sales and $15 million change in annual core operating income.
73
NON-IFRS MEASURES AS DEFINED BY THE COMPANY
Alcon uses certain non-IFRS metrics when measuring performance, including when measuring current period results against prior periods, including core results, percentage changes measured in constant currencies, EBITDA, free cash flow, and net liquidity/(debt).
Because of their non-standardized definitions, the non-IFRS measures (unlike IFRS measures) may not be comparable to the calculation of similar measures of other companies. These supplemental non-IFRS measures are presented solely to permit investors to more fully understand how Alcon management assesses underlying performance. These supplemental non-IFRS measures are not, and should not be viewed as, a substitute for IFRS measures.
Core results
Alcon core results, including core operating income and core net income, exclude all amortization and impairment charges of intangible assets, excluding software, net gains and losses on fund investments and equity securities valued at fair value through profit and loss ("FVPL"), fair value adjustments of financial assets in the form of options to acquire a company carried at FVPL, obligations related to product recalls, and certain acquisition related items. The following items that exceed a threshold of $10 million and are deemed exceptional are also excluded from core results: integration and divestment related income and expenses, divestment gains and losses, restructuring charges/releases and related items, legal related items, gains/losses on early extinguishment of debt or debt modifications, impairments of property, plant and equipment and software, as well as income and expense items that management deems exceptional and that are or are expected to accumulate within the year to be over a $10 million threshold.
Taxes on the adjustments between IFRS and core results take into account, for each individual item included in the adjustment, the tax rate that will finally be applicable to the item based on the jurisdiction where the adjustment will finally have a tax impact. Generally, this results in amortization and impairment of intangible assets and acquisition-related restructuring and integration items having a full tax impact. There is usually a tax impact on other items, although this is not always the case for items arising from legal settlements in certain jurisdictions.
Alcon believes that investor understanding of its performance is enhanced by disclosing core measures of performance because, since they exclude items that can vary significantly from period to period, the core measures enable a helpful comparison of business performance across periods. For this same reason, Alcon uses these core measures in addition to IFRS and other measures as important factors in assessing its performance.
A limitation of the core measures is that they provide a view of Alcon operations without including all events during a period, such as the effects of an acquisition, divestment, or amortization/impairments of purchased intangible assets and restructurings.
Constant currencies
Changes in the relative values of non-US currencies to the US dollar can affect Alcon financial results and financial position. To provide additional information that may be useful to investors, including changes in sales volume, we present information about changes in our net sales and various values relating to operating and net income that are adjusted for such foreign currency effects.
Constant currency calculations have the goal of eliminating two exchange rate effects so that an estimate can be made of underlying changes in the consolidated income statement excluding:
|
•
|
the impact of translating the income statements of consolidated entities from their non-US dollar functional currencies to the US dollar; and
|
|
•
|
the impact of exchange rate movements on the major transactions of consolidated entities performed in currencies other than their functional currency.
|
Alcon calculates constant currency measures by translating the current year's foreign currency values for sales and other income statement items into US dollars, using the average exchange rates from the prior year and comparing them to the prior year values in US dollars.
For additional information on the effects of foreign currencies, refer to "Item
5.A. Operating Results
-
Effects of currency fluctuations
" section.
74
EBITDA
Alcon defines earnings before interest, tax, depreciation and amortization ("EBITDA") as net (loss)/income excluding income taxes, depreciation of property, plant and equipment (including any related impairment charges), depreciation of right-of-use assets, amortization of intangible assets (including any related impairment charges), interest expense and other financial income and expense. Alcon management primarily uses EBITDA together with net (debt)/liquidity to monitor leverage associated with financial debts. For a reconciliation of EBITDA to the most directly comparable measure presented in accordance with IFRS, see "Item
5.B. Liquidity and Capital Resources
—
EBITDA (non-IFRS measure)
" section.
Free cash flow
Alcon defines free cash flow as net cash flows from operating activities less cash flow associated with the purchase or sale of property, plant and equipment. Free cash flow is presented as additional information because Alcon management believes it is a useful supplemental indicator of Alcon's ability to operate without reliance on additional borrowing or use of existing cash. Free cash flow is not intended to be a substitute measure for net cash flows from operating activities as determined under IFRS. For a reconciliation of free cash flow to the most directly comparable measure presented in accordance with IFRS, see "Item
5.B. Liquidity and Capital Resources
—
Free cash flow (non-IFRS measure)
" section.
Net liquidity/(debt)
Alcon defines net liquidity/(debt) as current and non-current financial debt less cash and cash equivalents, current investments and derivative financial instruments. Net liquidity/(debt) is presented as additional information because management believes it is a useful supplemental indicator of Alcon's ability to pay dividends, to meet financial commitments and to invest in new strategic opportunities, including strengthening its balance sheet. For a reconciliation of net liquidity/(debt) to the most directly comparable measure presented in accordance with IFRS, see "Item
5.B. Liquidity and Capital Resources
—
Net (debt)/liquidity (non-IFRS measure)
" section.
Growth rate and margin calculations
For ease of understanding, Alcon uses a sign convention for its growth rates such that a reduction in operating expenses or losses compared to the prior year is shown as a positive growth.
Gross margins, operating income/(loss) margins and core operating income margins are calculated based upon net sales to third parties unless otherwise noted.
75
RECONCILIATION OF IFRS RESULTS TO CORE RESULTS
Segment contribution
2019
|
($ millions)
|
IFRS results
|
|
Amortization of intangible assets
(1)
|
|
Separation costs
(2)
|
|
Transformation Costs
(3)
|
|
Legal items
(4)
|
|
Other items
(5)
|
|
Core results
|
|
|||||||
|
Surgical segment contribution
|
923
|
|
—
|
|
7
|
|
—
|
|
—
|
|
27
|
|
957
|
|
|||||||
|
Vision Care segment contribution
|
563
|
|
—
|
|
16
|
|
—
|
|
—
|
|
1
|
|
580
|
|
|||||||
|
Not allocated to segments
|
(1,673
|
)
|
1,040
|
|
214
|
|
52
|
|
32
|
|
63
|
|
(272
|
)
|
|||||||
|
Total operating (loss)/income
|
(187
|
)
|
1,040
|
|
237
|
|
52
|
|
32
|
|
91
|
|
1,265
|
|
|||||||
|
(1)
|
Includes recurring amortization for all intangible assets other than software.
|
|
(2)
|
Separation costs are expected to be incurred over the two to three-year period following the completion of the Spin-off from Novartis and primarily include costs related to IT and third party consulting fees.
|
|
(3)
|
Transformation costs, primarily related to restructuring and third party consulting fees, for the multi-year transformation program.
|
|
(4)
|
Includes legal settlement costs and certain external legal fees.
|
|
(5)
|
Surgical segment contribution includes
$85 million
for the amortization of option rights, manufacturing sites consolidation activities, post marketing study following a product's voluntary market withdrawal expenses, integration of recent acquisitions, and spin readiness costs and other items, partially offset by
$58 million
in fair value adjustments to contingent consideration liabilities. Vision Care segment contribution includes
$18 million
in spin readiness costs and the integration of recent acquisitions, partially offset by
$17 million
in fair value adjustments to contingent consideration liabilities. Not allocated to segments primarily includes spin readiness costs and fair value adjustments of a financial asset.
|
2018
|
($ millions)
|
IFRS results
|
|
Amortization of intangible assets
(1)
|
|
Impairments
(2)
|
|
Restructuring items
(3)
|
|
Legal items
(4)
|
|
Other items
(5)
|
|
Core results
|
|
||||||
|
Surgical segment contribution
|
813
|
|
—
|
|
—
|
|
—
|
|
—
|
|
33
|
|
846
|
|
||||||
|
Vision Care segment contribution
|
594
|
|
—
|
|
—
|
|
—
|
|
—
|
|
6
|
|
600
|
|
||||||
|
Not allocated to segments
|
(1,655
|
)
|
1,007
|
|
378
|
|
9
|
|
28
|
|
(1
|
)
|
(234
|
)
|
||||||
|
Total operating (loss)/income
|
(248
|
)
|
1,007
|
|
378
|
|
9
|
|
28
|
|
38
|
|
1,212
|
|
||||||
|
(1)
|
Includes recurring amortization for all intangible assets other than software.
|
|
(2)
|
Includes impairment charges related to intangible assets.
|
|
(3)
|
Includes restructuring income and charges and related items. Certain amounts previously reported under "restructuring items" in the 2018 Form 20-F have been reclassified to "other items" to conform with presentation in the current year.
|
|
(4)
|
Includes legal costs related to an investigation.
|
|
(5)
|
Surgical segment contribution includes
$99 million
for the amortization of option rights and charges and reversal of charges related to a product's voluntary market withdrawal, spin readiness costs, and other items, partially offset by a
$66 million
fair value adjustment to a contingent consideration liability due to a product's voluntary market withdrawal. Vision Care segment contribution includes spin readiness costs and other items. Not allocated to segments includes
$21 million
in fair value adjustments of a financial asset and other items, partially offset by
$20 million
spin readiness costs. Certain amounts previously reported under "restructuring items" in the 2018 Form 20-F have been reclassified to "other items" to conform with presentation in the current year.
|
76
2017
|
($ millions)
|
IFRS results
|
|
Amortization of intangible assets
(1)
|
|
Impairments
(2)
|
|
Restructuring items
(3)
|
|
Legal items
(4)
|
|
Other items
(5)
|
|
Core results
|
|
||||||
|
Surgical segment contribution
|
691
|
|
—
|
|
29
|
|
—
|
|
—
|
|
(19
|
)
|
701
|
|
||||||
|
Vision Care segment contribution
|
625
|
|
—
|
|
—
|
|
—
|
|
—
|
|
—
|
|
625
|
|
||||||
|
Not allocated to segments
|
(1,393
|
)
|
1,017
|
|
57
|
|
30
|
|
61
|
|
(12
|
)
|
(240
|
)
|
||||||
|
Total operating (loss)/income
|
(77
|
)
|
1,017
|
|
86
|
|
30
|
|
61
|
|
(31
|
)
|
1,086
|
|
||||||
|
(1)
|
Includes recurring amortization for all intangible assets other than software.
|
|
(2)
|
Includes impairment charges related to intangible and financial assets.
|
|
(3)
|
Includes restructuring income and charges and related items.
|
|
(4)
|
Includes an increase to a legal settlement provision and legal costs related to an investigation.
|
|
(5)
|
Includes fair value adjustments to contingent consideration liabilities, a gain from a Swiss pension plan amendment and the partial reversal of a prior period charge.
|
77
RECONCILIATION OF IFRS RESULTS TO CORE RESULTS
Operating (loss)/income, net (loss)/income, and (loss)/earnings per share
2019
|
($ millions except (loss)/earnings per share)
|
IFRS Results
|
|
Amortization of certain intangible assets
(1)
|
|
Separation costs
(2)
|
|
Transformation Costs
(3)
|
|
Legal items
(4)
|
|
Other items
(5)
|
|
Core Results
|
|
|
|
Gross profit
|
3,662
|
|
1,007
|
|
10
|
|
—
|
|
—
|
|
(16
|
)
|
4,663
|
|
|
|
Operating (loss)/income
|
(187
|
)
|
1,040
|
|
237
|
|
52
|
|
32
|
|
91
|
|
1,265
|
|
|
|
(Loss)/income before taxes
|
(332
|
)
|
1,040
|
|
237
|
|
52
|
|
32
|
|
91
|
|
1,120
|
|
|
|
Taxes
(6)
|
(324
|
)
|
(140
|
)
|
(54
|
)
|
(7
|
)
|
(8
|
)
|
338
|
|
(195
|
)
|
|
|
Net (loss)/income
|
(656
|
)
|
900
|
|
183
|
|
45
|
|
24
|
|
429
|
|
925
|
|
|
|
Basic (loss)/earnings per share
|
(1.34
|
)
|
|
|
|
|
|
|
|
|
|
|
1.89
|
|
|
|
Diluted (loss)/earnings per share
|
(1.34
|
)
|
|
|
|
|
|
|
|
|
|
|
1.89
|
|
|
|
Basic - weighted average shares outstanding
(7)
|
488.2
|
|
|
|
|
|
|
488.2
|
|
||||||
|
Diluted - weighted average shares outstanding
(7)
|
488.2
|
|
|
|
|
|
|
490.1
|
|
||||||
|
Adjustments to arrive at core operating income
|
|||||||||||||||
|
Selling, general & administration
|
(2,847
|
)
|
—
|
|
30
|
|
—
|
|
—
|
|
15
|
|
(2,802
|
)
|
|
|
Research & development
|
(656
|
)
|
33
|
|
4
|
|
—
|
|
—
|
|
35
|
|
(584
|
)
|
|
|
Other income
|
55
|
|
—
|
|
—
|
|
—
|
|
—
|
|
(9
|
)
|
46
|
|
|
|
Other expense
|
(401
|
)
|
—
|
|
193
|
|
52
|
|
32
|
|
66
|
|
(58
|
)
|
|
|
(1)
|
Includes recurring amortization for all intangible assets other than software.
|
|
(2)
|
Separation costs are expected to be incurred over the two to three-year period following the completion of the Spin-off from Novartis and primarily include costs related to IT and third party consulting fees.
|
|
(3)
|
Transformation costs, primarily related to restructuring and third party consulting fees, for the multi-year transformation program.
|
|
(4)
|
Includes legal settlement costs and certain external legal fees.
|
|
(5)
|
Gross Profit includes
$37 million
in fair value adjustments of contingent consideration liabilities, partially offset by
$21 million
in spin readiness costs, manufacturing sites consolidation activities, and integration of recent acquisitions. Selling, general & administration primarily includes spin readiness costs and the integration of recent acquisitions. Research & development includes
$73 million
for the amortization of option rights, post-marketing study following a product's voluntary market withdrawal, and the integration of recent acquisitions, partially offset by
$38 million
in fair value adjustments for contingent consideration liabilities. Other income primarily includes a realized gain on a financial asset. Other expense primarily includes spin readiness costs, fair value adjustments of a financial asset and other items.
|
|
(6)
|
Total tax adjustments of
$129 million
include tax associated with operating income core adjustments and discrete tax items. Tax associated with operating income core adjustments of
$1.5 billion
totaled
$215 million
with an average tax rate of
14.8%
.
|
Core tax adjustments for discrete items totaled
$344 million
, primarily including
$304 million
in non-cash tax expense for re-measurement of deferred tax balances as a result of Swiss tax reform, tax expense related to rate changes in the US following legal entity reorganizations executed related to the Spin-off, non-cash tax expense related to the re-measurement of deferred tax assets and liabilities following a tax rate change in India, and net changes in uncertain tax positions.
|
(7)
|
Core basic earnings per share is calculated using the weighted-average shares of common stock outstanding during the period. Core diluted earnings per share also contemplate dilutive shares associated with unvested equity-based awards as described in Note
8
to the Consolidated Financial Statements.
|
78
2018
|
($ millions except (loss)/earnings per share)
|
IFRS Results
|
|
Amortization of certain intangible assets
(1)
|
|
Impairments
(2)
|
|
Restructuring items
(3)
|
|
Legal items
(4)
|
|
Other items
(5)
|
|
Core Results
|
|
|
Gross profit
|
3,192
|
|
996
|
|
376
|
|
—
|
|
—
|
|
(23
|
)
|
4,541
|
|
|
Operating (loss)/income
|
(248
|
)
|
1,007
|
|
378
|
|
9
|
|
28
|
|
38
|
|
1,212
|
|
|
(Loss)/income before taxes
|
(300
|
)
|
1,007
|
|
378
|
|
9
|
|
28
|
|
38
|
|
1,160
|
|
|
Taxes
(6)
|
73
|
|
|
|
|
|
|
|
|
|
|
|
(186
|
)
|
|
Net (loss)/income
|
(227
|
)
|
|
|
|
|
|
|
|
|
|
|
974
|
|
|
Basic (loss)/earnings per share
|
(0.46
|
)
|
|
|
|
|
|
|
|
|
|
|
2.00
|
|
|
Diluted (loss)/earnings per share
|
(0.46
|
)
|
|
|
|
|
|
|
|
|
|
|
2.00
|
|
|
Basic - weighted average shares outstanding
(7)
|
488.2
|
|
|
|
|
|
|
|
|
|
|
|
488.2
|
|
|
Diluted - weighted average shares outstanding
(7)
|
488.2
|
|
|
|
|
|
|
|
|
|
|
|
488.2
|
|
|
Adjustments to arrive at core operating income
|
||||||||||||||
|
Selling, general & administration
|
(2,801
|
)
|
—
|
|
2
|
|
—
|
|
—
|
|
13
|
|
(2,786
|
)
|
|
Research & development
|
(587
|
)
|
11
|
|
—
|
|
—
|
|
—
|
|
47
|
|
(529
|
)
|
|
Other income
|
47
|
|
—
|
|
—
|
|
(4
|
)
|
—
|
|
(19
|
)
|
24
|
|
|
Other expense
|
(99
|
)
|
—
|
|
—
|
|
13
|
|
28
|
|
20
|
|
(38
|
)
|
|
(1)
|
Includes recurring amortization for all intangible assets other than software.
|
|
(2)
|
Includes impairment charges related to intangible assets.
|
|
(3)
|
Includes restructuring income and charges and related items. Certain amounts previously reported under "restructuring items" in the 2018 Form 20-F have been reclassified to "other items" to conform with presentation in the current year.
|
|
(4)
|
Includes legal costs related to an investigation.
|
|
(5)
|
Gross profit, selling, general & administration and research & development include charges and reversal of charges related to a product’s voluntary market withdrawal. Research & development also includes amortization of option rights and a fair value adjustment of a contingent consideration liability. Other income includes fair value adjustments on a financial asset. Other expense includes spin-readiness costs and other items. Certain amounts previously reported under "restructuring items" in the 2018 Form 20-F have been reclassified to "other items" to conform with presentation in the current year.
|
|
(6)
|
Total tax adjustments of $259 million included tax associated with operating income adjustments and discrete tax items. Tax associated with operating income adjustments of $1.5 billion totaled $237 million with average tax rate of 16.2%. Core tax adjustments for discrete items totaled $22 million, including a net out of period income tax benefit of $55 million partially offset by net changes in uncertain tax positions of $33 million.
|
|
(7)
|
For periods prior to the Spin-off, the denominator for both core basic and diluted earnings per share was calculated using the shares of common stock distributed in the Spin-off.
|
79
2017
|
($ millions except earnings per share)
|
IFRS
Results |
|
Amortization
of certain intangible
assets
(1)
|
|
Impairments
(2)
|
|
Restructuring
items
(3)
|
|
Legal
items
(4)
|
|
Other
items
(5)
|
|
Core
Results |
|
|
Gross profit
|
3,204
|
|
1,007
|
|
—
|
|
—
|
|
—
|
|
—
|
|
4,211
|
|
|
Operating (loss)/income
|
(77
|
)
|
1,017
|
|
86
|
|
30
|
|
61
|
|
(31
|
)
|
1,086
|
|
|
(Loss)/income before taxes
|
(127
|
)
|
1,017
|
|
86
|
|
30
|
|
61
|
|
(31
|
)
|
1,036
|
|
|
Taxes
(6)
|
383
|
|
(128
|
)
|
||||||||||
|
Net income
|
256
|
|
908
|
|
||||||||||
|
Basic earnings per share
|
0.52
|
|
1.86
|
|
||||||||||
|
Diluted earnings per share
|
0.52
|
|
1.86
|
|
||||||||||
|
Basic - weighted average shares outstanding
(7)
|
488.2
|
|
488.2
|
|
||||||||||
|
Diluted - weighted average shares outstanding
(7)
|
488.2
|
|
488.2
|
|
||||||||||
|
Adjustments to arrive at core operating income
|
||||||||||||||
|
Research & development
|
(584
|
)
|
10
|
|
86
|
|
—
|
|
—
|
|
(18
|
)
|
(506
|
)
|
|
Other income
|
47
|
|
—
|
|
—
|
|
(4
|
)
|
—
|
|
(13
|
)
|
30
|
|
|
Other expense
|
(148
|
)
|
—
|
|
—
|
|
34
|
|
61
|
|
—
|
|
(53
|
)
|
|
(1)
|
Includes recurring amortization for all intangible assets other than software.
|
|
(2)
|
Includes impairment charges related to intangible and financial assets.
|
|
(3)
|
Includes restructuring income and charges and related items.
|
|
(4)
|
Includes an increase to a legal settlement provision and legal costs related to an investigation.
|
|
(5)
|
Research & development includes fair value adjustments to contingent consideration liabilities; other income includes a gain from a Swiss pension plan amendment and the partial reversal of a prior period charge.
|
|
(6)
|
The required revaluation of the deferred tax assets and liabilities and a portion of current tax payables to the newly enacted tax rate at the date of enactment of the US enacted tax reform legislation (Tax Cuts and Jobs Act), resulted in a net tax income of $413 million that has been adjusted out of core taxes. Due to these factors and the differing effective tax rates in the various jurisdictions, the tax on the total adjustments of $1.2 billion to arrive at the core results before tax amounts to $98 million, excluding the tax income from US tax reform. The average tax rate on these adjustments is 8.4%.
|
|
(7)
|
For periods prior to the Spin-off, the denominator for both core basic and diluted earnings per share was calculated using the shares of common stock distributed in the Spin-off.
|
80
|
5.B.
|
LIQ
UI
DITY AND CAPITAL RESOURCES
|
Our sources of funds have consisted principally of cash flow from operations, bank debt, credit facilities with lenders, and other financial liabilities to our Former Parent. Our uses of those funds (other than for operations) have consisted principally of investments in our growth plan, capital expenditures, cash paid for acquisitions and associated expenses and other obligations.
We believe that we have adequate liquidity to meet our needs. At
December 31, 2019
, we had cash and cash equivalents of
$822 million
, compared to
$227 million
at
December 31, 2018
. At
December 31, 2019
we had current financial debt of
$261 million
, compared to
$47 million
at
December 31, 2018
, consisting of bank and other financial debt. At
December 31, 2019
we had non-current financial debt of
$3.2 billion
consisting of bank debt and senior notes primarily as a result of the Spin-off.
To date, all of our sales are generated by our subsidiaries and not directly by us. Thus, we are dependent on dividends, other payments or loans from our subsidiaries to meet our liquidity needs. Some of our subsidiaries may be subject to legal requirements of their respective jurisdictions of organization that may restrict their paying dividends or other payments, or making loans, to us.
Potential future uses of our liquidity include capital expenditures, acquisitions, debt repayments, dividend payments, and other general corporate purposes.
We use the US Dollar as our reporting currency and are therefore exposed to foreign currency exchange movements, primarily in Euros, Japanese Yen, Chinese Renminbi, Swiss Francs, and emerging market currencies. We manage our global currency exposure by engaging in hedging transactions where management deems appropriate (forward contracts and swaps) to preserve the value of assets. As of December 31, 2019, unsettled derivative positions included $1 million in unrealized gains and $16 million in unrealized losses.
All comments in this section relate to the year ended December 31, 2019 compared to 2018. Commentary for the year ended December 31, 2018 compared to 2017 may be found in Item 5 of the 2018 Form 20-F.
Cash flow and net (debt)/liquidity
|
($ millions)
|
2019
|
|
2018
|
|
|
|
Net cash flows from operating activities
|
920
|
|
1,140
|
|
|
|
Net cash flows used in investing activities
|
(1,011
|
)
|
(1,001
|
)
|
|
|
Net cash flows from/(used in) financing activities
|
659
|
|
(78
|
)
|
|
|
Effect of exchange rate changes on cash and cash equivalents
|
27
|
|
(6
|
)
|
|
|
Net change in cash and cash equivalents
|
595
|
|
55
|
|
|
|
Change in derivative financial instrument assets
|
1
|
|
—
|
|
|
|
Change in current and non-current financial debts
|
(3,432
|
)
|
18
|
|
|
|
Change in other financial liabilities to former parent
|
67
|
|
(21
|
)
|
|
|
Change in other financial receivables from former parent
|
(39
|
)
|
(26
|
)
|
|
|
Change in net (debt)
(1)
|
(2,808
|
)
|
26
|
|
|
|
Net liquidity at January 1
|
152
|
|
126
|
|
|
|
Net (debt)/liquidity at December 31
(1)
|
(2,656
|
)
|
152
|
|
|
|
(1)
|
The balances previously reported in "Financial debts" for a finance lease obligation have been reclassified from "Financial debts" to "Non-current lease liabilities". This reclassification resulted in an increase in Net liquidity as of January 1, 2019 and January 1, 2018 of
$89 million
and
$84 million
, respectively.
|
Net cash flows from operating activities amounted to
$920 million
in
2019
, compared to
$1.1 billion
in the prior year period. The decrease in operating cash flows was primarily attributable to spin readiness and separation costs, a legal settlement, and interest payments on our financial debts.
Changes in net working capital were primarily driven by an increase in Trade receivables in 2019 broadly in line with increased sales. The current year period has contract manufacturing receivables from our Former Parent, which are included within Other current assets. Trade payables and other current liabilities increased during the current reporting period primarily due
81
to various transition agreements and separation costs incurred. Refer to Note
21
to the Consolidated Financial Statements for additional details regarding changes within net working capital.
Net cash flows used in investing activities amounted to
$1.0 billion
in
2019
, in line with 2018. The cash outflows in the current period were primarily driven by
$553 million
for the purchase of property, plant and equipment,
$123 million
for intangible assets, and
$283 million
for the acquisition of PowerVision, Inc. in March 2019.
Net cash flows from financing activities amounted to
$659 million
in
2019
, compared to
$78 million
of net cash outflows in 2018. Cash inflows in the current period were attributable to proceeds from the issuance of non-current and current financial debts totaling $3.4 billion associated with borrowings from the bridge and other term loans and local bilateral facilities. This was partially offset by movements of financing provided to our Former Parent, which increased by
$2.5 billion
from the prior year period, due to $3.1 billion in cash payments made to our Former Parent and its affiliates prior to the Spin-off. The cash flows from financing activities also reflect the proceeds from the issuance of $2.0 billion senior notes and repayments of the $1.5 billion Bridge Facility and $0.5 billion Facility A in 2019. Refer to Notes
4
and
17
of the Consolidated Financial Statements for additional information.
Free cash flow (non-IFRS measure)
The following is a summary of Alcon free cash flow for 2019, 2018 and 2017, together with a reconciliation to net cash flows from operating activities, the most directly comparable IFRS measure.
|
($ millions)
|
2019
|
|
2018
|
|
2017
|
|
||
|
Net cash flows from operating activities
|
920
|
|
1,140
|
|
1,218
|
|
||
|
Purchase of property, plant & equipment
|
(553
|
)
|
(524
|
)
|
(415
|
)
|
||
|
Proceeds from sales of property, plant & equipment
|
—
|
|
—
|
|
1
|
|
||
|
Free cash flow
|
367
|
|
616
|
|
804
|
|
||
Free cash flow amounted to
$367
million in
2019
, compared to
$616
million in 2018, with the decrease mainly caused by lower cash flows from operating activities. For additional information refer to "Item
5.A. Operating Results
—
Non-IFRS measures as defined by the Company
".
Assets
Total non-current assets were
$23.4 billion
at
December 31, 2019
, a decrease of
$244 million
compared to
$23.7 billion
as of
December 31, 2018
. There was a decrease of
$448 million
in Intangible assets other than goodwill related to the amortization for the period offset by In-process research and development intangible assets acquired through the PowerVision acquisition, a decrease of
$316 million
in Deferred tax assets related to offsetting deferred tax liabilities within the same tax jurisdiction based on the legally enforceable right of offset following the Spin-off, and a decrease of
$81 million
in Financial assets primarily due to movement of balances to Other current assets as maturity has become less than twelve months and continued amortization of option rights. This was largely offset by increases of
$313 million
in Property, plant & equipment due to continued capital expenditures net of recurring depreciation and
$245 million
in Right-of-use assets from the adoption of IFRS 16,
Leases
as described in Note
16
to the Consolidated Financial Statements.
Total current assets were
$4.2 billion
as of
December 31, 2019
, an increase of
$837 million
when compared to
December 31, 2018
, mainly due to increases in Cash and cash equivalents of
$595 million
attributable to the net impact of operating, investing, and financing activities as described earlier in this section. Trade receivables of
$1.4 billion
increased
$137 million
broadly in line with sales, and Other current assets of
$0.5 billion
increased
$115 million
primarily due to movement of certain assets from non-current financial assets as maturity has become less than twelve months and contract manufacturing receivables. Inventories of
$1.5 billion
also increased
$65 million
in line with sales and new product launches.
We consider our doubtful debt provisions to be adequate. The majority of the outstanding trade receivables from Greece, Italy, Portugal, Spain, Brazil, Russia, Turkey, Saudi Arabia, and Argentina are due directly from local governments or from government-funded entities except for Russia, Brazil, and Turkey. We evaluate trade receivables in these countries for potential collection risk. Should there be a substantial deterioration in our economic exposure with respect to those countries, we may increase our level of provisions by updating our expected loss provision or may change the terms of trade on which we operate.
The gross trade receivables from these countries at
December 31, 2019
amount to
$209 million
($216 million at
December 31, 2018
), of which
$10 million
are past due for more than one year ($14 million at
December 31, 2018
) and for which provisions
82
of
$13 million
have been recorded ($16 million at
December 31, 2018
). At
December 31, 2019
, amounts past due for more than one year are not significant in any of these countries.
The following table summarizes the aging of trade receivables as of
December 31, 2019
and
2018
:
|
($ millions)
|
2019
|
|
2018
|
|
|
Not overdue
|
1,135
|
|
1,018
|
|
|
Past due for not more than one month
|
118
|
|
118
|
|
|
Past due for more than one month but less than three months
|
81
|
|
70
|
|
|
Past due for more than three months but less than six months
|
47
|
|
34
|
|
|
Past due for more than six months but less than one year
|
21
|
|
20
|
|
|
Past due for more than one year
|
36
|
|
47
|
|
|
Provisions for doubtful trade receivables
|
(48
|
)
|
(54
|
)
|
|
Total trade receivables, net
|
1,390
|
|
1,253
|
|
There is also a risk that certain countries could devalue their currency. Currency exposures are described in more detail in the "Item
5.A. Operating Results
—
Effects of currency fluctuations
" section.
Liabilities
Total non-current liabilities were
$6.1 billion
as of
December 31, 2019
, an increase of
$3.5 billion
when compared to
$2.5 billion
as of
December 31, 2018
. There was an increase to Financial debts of
$3.2 billion
due to borrowings immediately prior to Spin-off which were partially refinanced in September 2019. Provisions and other non-current liabilities increased
$255 million
primarily due to contingent consideration liabilities and employee benefit obligations. Lease liabilities also increased
$191 million
from the implementation of IFRS 16,
Leases
. Refer to Notes
4
,
16
, and
17
to the Consolidated Financial Statements for additional details related to contingent consideration, IFRS 16 adoption, and borrowings under the Notes and Facilities. Deferred tax liabilities decreased
$142 million
due to the net of the re-measurement of deferred tax liabilities associated with the Swiss tax reform and deferred tax assets offsetting deferred tax liabilities within the same tax jurisdiction, as discussed above.
Total current liabilities were
$2.3 billion
as of
December 31, 2019
, an increase of
$407 million
when compared to
$1.9 billion
as of
December 31, 2018
. There were increases in Financial debts of
$214 million
related to local bilateral facilities entered in different countries, Trade payables of
$170 million
due to various transition agreements and higher spend for separation costs, Provisions and other current liabilities of
$158 million
primarily for taxes other than income taxes, restructuring, and interest on financial debts, and Lease liabilities of
$61 million
from the implementation of IFRS 16,
Leases
. These increases were partially offset by decreases in Payables to former parent of
$85 million
, and Other financial liabilities to former parent of
$67 million
as a result of eliminating cash pooling arrangements with Novartis and Current income tax liabilities of
$44 million
due to timing of payments. While there is some uncertainty about the final taxes to be assessed in the major countries in which we operate, we believe that our estimated amounts for current income tax liabilities, including any amounts related to any uncertain tax positions, are appropriate based on currently known facts and circumstances. Refer to Notes
17
and
18
to the Consolidated Financial Statements for additional details related to financial debts.
Equity
Equity was
$19.3 billion
as of
December 31, 2019
, a decrease of
$3.3 billion
when compared to Invested capital of
$22.6 billion
as of
December 31, 2018
. The decrease was primarily attributable to
$3.1 billion
paid to Novartis and its affiliates immediately prior to the Spin-off, as described in Note
4
to the Consolidated Financial Statements.
83
Net (debt)/liquidity
(1)
(non-IFRS measure)
The following is a summary of net (debt)/liquidity as of
December 31, 2019
and
2018
, together with a reconciliation to total financial debt, the most directly comparable IFRS measure.
|
($ millions)
|
2019
|
|
2018
|
|
|
|
Current financial debt
|
(261
|
)
|
(47
|
)
|
|
|
Other financial liabilities to former parent
|
—
|
|
(67
|
)
|
|
|
Other financial receivables from former parent
|
—
|
|
39
|
|
|
|
Non-current financial debt
|
(3,218
|
)
|
—
|
|
|
|
Total financial debt
|
(3,479
|
)
|
(75
|
)
|
|
|
Less liquidity:
|
|||||
|
Cash and cash equivalents
|
822
|
|
227
|
|
|
|
Derivative financial instruments
|
1
|
|
—
|
|
|
|
Total liquidity
|
823
|
|
227
|
|
|
|
Net (debt)/liquidity
|
(2,656
|
)
|
152
|
|
|
|
(1)
|
The balance previously reported in "Financial debts" for a finance lease obligation has been reclassified from "Financial debts" to "Non-current lease liabilities". This reclassification resulted in an increase in Net (debt)/liquidity of
$89 million
as of December 31, 2018.
|
Alcon's liquidity amounted to
$823 million
as of
December 31, 2019
compared to
$227 million
as of
December 31, 2018
, while total financial debt increased to
$3.5 billion
as of
December 31, 2019
, compared to
$75 million
as of
December 31, 2018
. Net debt increased to
$2.7 billion
as of
December 31, 2019
compared to net liquidity of
$152 million
as of
December 31, 2018
.
The increase in financial debts is attributable to borrowings immediately prior to the Spin-off, which were partially refinanced in September 2019. Refer to Notes
4
and
17
to the Consolidated Financial Statements for additional information. For additional information regarding net (debt)/liquidity, which is a non-IFRS measure, see the explanation of non-IFRS measures in "
Item 5. Operating and Financial Review and Prospects
—
5.A. Operating Results
—
Non-IFRS measures as defined by the Company
".
EBITDA (non-IFRS measure)
|
($ millions)
|
2019
|
|
2018
|
|
2017
|
|
||
|
Net (loss)/income
|
(656
|
)
|
(227
|
)
|
256
|
|
||
|
Taxes
|
324
|
|
(73
|
)
|
(383
|
)
|
||
|
Depreciation of property, plant & equipment
|
267
|
|
239
|
|
215
|
|
||
|
Depreciation on right-of-use assets
|
66
|
|
—
|
|
—
|
|
||
|
Amortization of intangible assets
|
1,084
|
|
1,019
|
|
1,033
|
|
||
|
Impairments of property, plant & equipment, and intangible assets
|
8
|
|
380
|
|
57
|
|
||
|
Interest expense
|
113
|
|
24
|
|
27
|
|
||
|
Other financial income & expense
|
32
|
|
28
|
|
23
|
|
||
|
EBITDA
|
1,238
|
|
1,390
|
|
1,228
|
|
||
84
Liquidity and financial debt by currency
The following table summarizes liquidity and financial debts by currency as of December 31, 2019 and 2018.
|
Liquidity (%)
(1)
|
Financial debts (%)
(2)
|
||||||||||
|
2019
|
|
2018
|
|
2019
|
|
2018
|
|
||||
|
USD
|
63
|
|
35
|
|
80
|
|
5
|
|
|||
|
EUR
|
6
|
|
41
|
|
11
|
|
3
|
|
|||
|
CHF
|
1
|
|
8
|
|
—
|
|
—
|
|
|||
|
JPY
|
—
|
|
—
|
|
5
|
|
—
|
|
|||
|
Other
|
30
|
|
16
|
|
4
|
|
92
|
|
|||
|
Total
|
100
|
|
100
|
|
100
|
|
100
|
|
|||
|
(1)
|
Liquidity includes cash and cash equivalents and time deposits.
|
|
(2)
|
Financial debt includes non-current and current financial debts. The balances previously reported in "Financial debts" for a finance lease obligation have been reclassified from "Financial debts" to "Non-current lease liabilities". This reclassification has also been reflected in the computation of financial debts by currency.
|
|
5.C.
|
RESEARCH AND DEVELOPMENT, PATENTS AND LICENSES, ETC.
|
Alcon research & development spending totaled
$656 million
,
$587 million
and
$584 million
for the years
2019
,
2018
and
2017
, respectively. As described in the "Risk Factors" section and elsewhere in this Annual Report, we are subject to varying degrees of governmental regulation in the countries in which we operate, which makes the process of developing new products and obtaining necessary regulatory marketing authorization lengthy, expensive and uncertain. See "
Item 3. Key Information
—
3.D. Risk Factors
". For further information on Alcon research and development policies and additional product information, as well as a description of the regulatory approval process, see "
Item 4. Information on the Company
—
4.B. Business Overview
".
|
5.D.
|
TREND INFORMATION
|
Please see "Item
5.A. Operating Results
—
Opportunity and risk summary
" and "
Item 4. Information on the Company
—
4.B. Business Overview
" for trend information.
|
5.E.
|
OFF-BALANCE SHEET ARRANGEMENTS
|
We have no unconsolidated special purpose financing or partnership entities or other off balance sheet arrangements that have or are reasonably likely to have a current or future effect on our financial condition, changes in financial condition, revenues or expenses, results of operations, liquidity, capital expenditures or capital resources, that is material to investors. See also Note
26
to the Consolidated Financial Statements included elsewhere in this Annual Report and matters described in "Item
5.F. Aggregate Contractual Obligations
".
85
|
5.F.
|
AGGREGATE CONTRACTUAL OBLIGATIONS
|
The following table summarizes Alcon's undiscounted contractual obligations and other commercial commitments at December 31, 2019, as well as the effect these obligations and commitments are expected to have on our liquidity and cash flow in future periods.
|
|
Payments due by period
|
|||||||||||||
|
($ millions)
|
Total
|
|
1 year
|
|
2 - 3 years
|
|
4 - 5 years
|
|
After 5 years
|
|
||||
|
Financial debt
|
3,508
|
|
261
|
|
55
|
|
1,192
|
|
2,000
|
|
||||
|
Interest on financial debt
|
1,083
|
|
94
|
|
168
|
|
168
|
|
653
|
|
||||
|
Leases
|
449
|
|
73
|
|
109
|
|
67
|
|
200
|
|
||||
|
Pensions and other post-employment benefit plans
|
573
|
|
62
|
|
99
|
|
110
|
|
302
|
|
||||
|
Property, plant & equipment purchase commitments
|
212
|
|
194
|
|
18
|
|
—
|
|
—
|
|
||||
|
Research & development potential milestone commitments
|
181
|
|
28
|
|
45
|
|
37
|
|
71
|
|
||||
|
Other purchase commitments
|
169
|
|
42
|
|
68
|
|
49
|
|
10
|
|
||||
|
Total contractual cash obligations
|
6,175
|
|
754
|
|
562
|
|
1,623
|
|
3,236
|
|
||||
For other contingencies, see "
Item 4. Information on the Company
—
4.D. Property, Plants and Equipment
" section, "
Item 8. Financial Information
—
8.A. Consolidated Statements and Other Financial Information
" section and Notes
19
and
26
to the Consolidated Financial Statements included elsewhere in this Annual Report.
|
ITEM 6.
|
DIRECTORS, SENIOR MANAGEMENT AND EMPLOYEES
|
|
6.A.
|
DIRECTORS AND SENIOR MANAGEMENT
|
The information set forth under “Item 6.C. Board Practices—Corporate Governance—Board of Directors—Composition” and “Item 6.C. Board Practices—Corporate Governance—Executive Committee—Composition of the Executive Committee” is incorporated by reference.
86
|
6.B.
|
COMPENSATION
|
Introduction
Dear Shareholder
On behalf of the Board of Directors and the Compensation, Governance and Nomination Committee ("CGNC"), I am pleased to introduce the 2019 Compensation Report. It was an exciting year for Alcon because on April 9, 2019, Alcon was spun-off as an independent company with listings on both the SIX Swiss Exchange and the New York Stock Exchange ("NYSE"). This inaugural report outlines Alcon’s overall 2019 compensation framework and philosophy for the members of the Board of Directors as well as for the members of the Executive Committee of Alcon ("ECA").
The Compensation Report covers the financial year 2019 from January to December, including compensation prior to the Spin-off date of April 9, 2019.
Activities of the CGNC in 2019
We believe in a strong pay-for-performance compensation philosophy that motivates our senior executives to create value for the Company and its shareholders. During 2019, we evaluated our overall compensation structure, selected a peer group for executive compensation benchmarking and engaged in an active dialogue with shareholders.
Compensation Structure Review
For ECA compensation in 2019, we leveraged, with only slight modifications, the Novartis executive compensation framework, which remained broadly unchanged from the structure in place when Alcon was a division of Novartis. Following the Spin-off, we focused our efforts on creating a compensation framework and philosophy that considers Alcon's position as a newly-independent company with ambitious growth and business objectives and the realities of the competitive global market for executive talent. The compensation philosophy we developed serves as the foundation in establishing our pay for performance framework and guides us in our decision-making process. Key elements of our new compensation framework include:
|
•
|
Attracting exceptional executive talent to lead the Company, and retaining and motivating them over the long term through a mix of fixed and variable compensation elements;
|
|
•
|
Designing and structuring programs that appropriately incentivize executives to achieve short and long-term strategic business objectives established by our Board of Directors ("Board"); and
|
|
•
|
Aligning the interests of Alcon executives with those of shareholders.
|
By establishing our own compensation philosophy and framework early after our Spin-off, we set a strong course going forward for the Company and our shareholders.
Peer Group
The CGNC followed a comprehensive approach in selecting the companies to include in Alcon’s peer group for external compensation benchmarking. The peer group companies selected are a blend of European and North American companies and provide a good balance of industries, companies and geographies from which executive talent is sourced. The CGNC believes that benchmarking against a consistent and relevant set of peer companies that are similar to Alcon in size and scope will assist the Company in maintaining appropriate pay levels and benefits that will attract and retain the talent that has the experience and deep expertise needed to lead the Company.
Engagement with Shareholders on Compensation
Shareholder engagement and feedback is important to us as a newly established company and we undertook a formal outreach to engage shareholders beginning in the fall of 2019.
During that formal outreach initiative, we appreciated the opportunity to meet with shareholders who collectively hold over 40% of our shares. During these meetings we discussed our pay-for-performance orientation, sought feedback on our
87
compensation programs, and explained our approach to performance measurement. The 2019 Compensation Report provides additional insights into our 2020 compensation plans. We intend to continue this dialogue and evaluate and consider the feedback received to align our compensation structure with shareholder interests.
2020 Annual General Meeting
In line with the Articles of Incorporation, we will ask our shareholders to cast a binding vote on the maximum aggregate amount of compensation for members of the Board of Directors for their term of office from the 2020 AGM to the 2021 AGM. We will also ask our shareholders to cast a binding vote on the maximum aggregate amount of compensation for members of the ECA for the 2021 financial year. In addition, we will ask our shareholders to endorse this 2019 Compensation Report in an advisory vote.
On behalf of the Board of Directors and the members of the Compensation, Governance and Nomination Committee, we thank you for your trust in Alcon and for your feedback.
Sincerely,

Karen May
Chair of the Compensation, Governance and Nomination Committee
Chair of the Compensation, Governance and Nomination Committee
88
Compensation at a Glance
2019 ECA Compensation—Summary
Last year represented a transition year for Alcon as we became an independent, stand-alone company following the Spin-off from Novartis on April 9, 2019. We leveraged, with only slight modifications, the executive compensation program of our former parent company.
The compensation program consisted of a balanced set of fixed and variable elements rewarding short-term and long-term performance through the delivery of cash payments and equity awards. Performance goals were aligned to the strategic plan in a mix of absolute and relative measures including financial and non-financial metrics.
Exhibit 1
|
Annual Base Salary
|
Short-Term Incentive
(annual incentive) |
Long-Term Incentive
|
Benefits
|
|
|
Purpose
|
In line with global pay practices, reflects responsibilities, experience and skills
|
Rewards annual performance against key objectives
|
Rewards long-term value creation in line with Alcon’s strategy and business priorities
|
Retirement savings and insurances in line with local market practices and benefits associated with global mobility and international relocation
|
|
Payment
|
Cash
|
Cash and equity
|
Equity (Performance Stock Units)
|
Cash or in-kind, contributions to retirement savings and insurance policies
|
|
Performance
period |
—
|
One year
|
Three year cliff vesting
|
—
|
|
Performance
measures |
—
|
Three financial performance measures and individual performance rating
|
Four equally weighted performance measures including financial, external and innovation metrics
|
—
|
|
Payout range
|
0%-200% of the individual target award
|
0%-200% of the number of Performance Stock Units granted
|
||
|
Basis
|
Fixed
|
Variable
|
Variable
|
Fixed and variable
|
89
Total Compensation for 2019
From January 1, 2019 to December 31, 2019, we awarded the ECA members the amounts set out below. The amounts include payments made to the ECA members while they were employees of Novartis from January 1, 2019 through April 8, 2019. For more detailed information, see section "ECA Compensation 2019" in this 2019 Compensation Report.
Exhibit 2
|
Compensation
|
Fixed compensation
|
Variable compensation
|
Additional
compensation |
Totals
|
||||||||
|
From January 1, 2019 to December 31, 2019
|
Annual
base salary |
Pension and
insurance benefits |
2019 short-term
incentive |
2019-2021 long-term
incentive awards |
Other
benefits |
Total
compensation |
||||||
|
USD
|
Amount
in cash |
Total
amount |
Cash
amount |
RSU
1
value at grant |
PSU
2
target
value at grant |
Amount
|
Amount
|
|||||
|
David J. Endicott, CEO
|
1,134,358
|
279,851
|
745,380
|
745,380
|
2,738,036
|
1,177,487
|
6,820,492
|
|||||
|
Other ECA members
|
3,541,122
|
960,531
|
2,459,312
|
1,053,990
|
7,821,030
|
3,396,392
|
19,232,377
|
|||||
|
Totals in USD
3
|
4,675,480
|
1,240,382
|
3,204,692
|
1,799,370
|
10,559,066
|
4,573,879
|
26,052,869
|
|||||
|
Totals in CHF
4
|
4,647,132
|
1,232,862
|
3,185,262
|
1,788,460
|
10,495,046
|
4,546,148
|
25,894,910
|
|||||
|
1
|
Restricted Stock Units
|
|
2
|
Performance Stock Units
|
|
3
|
Includes the CEO and six other ECA members post Spin-off date, and the CEO and five other ECA members pre Spin-off date.
|
|
4
|
The amounts were converted at the rate of 1.0 CHF : 1.0061 USD.
|
2019 Board of Directors Compensation—Summary
We paid our Directors a fixed fee for services covering the term of their office from the date of Spin-off on April 9, 2019 to the 2020 Annual General Meeting ("2020 AGM").
The fixed compensation consists of a base fee for Board membership and additional fees for service on Board committees. Board members and the Board Chair receive fifty percent of their compensation in cash and fifty percent in unrestricted Alcon shares. On a voluntary basis, a Board member may opt to receive all or part of the cash portion in additional shares. Alcon does not provide any performance-based components of pay to the members of the Board.
90
Exhibit 3
|
Fee for the period
from April 9, 2019 to the 2020 AGM |
||
|
Board function
|
USD
1
|
CHF
|
|
Annual base fee:
|
||
|
Board Chair
|
955,795
|
950 000
|
|
Board member base fee (Board retainer fee)
|
201,220
|
200 000
|
|
Additional fees:
|
||
|
Vice Chair
|
40,244
|
40 000
|
|
Chair of the Audit and Risk Committee
|
70,427
|
70 000
|
|
Chair of the Compensation, Governance and Nomination Committee
|
50,305
|
50 000
|
|
Chair of the Innovation Committee
|
50,305
|
50 000
|
|
Member of the Audit and Risk Committee
|
35,214
|
35 000
|
|
Member of the Compensation, Governance and Nomination Committee
|
25,153
|
25 000
|
|
Member of the Innovation Committee
|
25,153
|
25 000
|
|
1
|
The Board fees are paid in Swiss Francs, converted at the rate of 1.0 CHF : 1.0061 USD.
|
Alcon Board Fee Payments in 2019
In 2019, Alcon paid the members of the Board the following total amounts.
Exhibit 4
|
Payment in
cash |
Payment in
shares |
Number of
shares |
Other
payments |
Total fees
|
|
|
Total fees paid in 2019
1
in USD
|
953,725
|
866,688
|
14,512
|
102,440
|
1,922,853
|
|
Total fees paid in 2019 in CHF
2
|
947,943
|
861,433
|
14,512
|
101,819
|
1,911,195
|
|
1
|
Represents compensation for nine out of ten members of the Board as David J. Endicott does not receive additional compensation for his service as a member of the Board.
|
|
2
|
The payments in cash were made in Swiss Francs (CHF) for consistency they are reported in USD as all compensation in this report. The amounts were converted at the rate of 1.0 CHF : 1.0061 USD. All amounts are before deduction of the social security contributions and income tax due by the Board member.
|
For more details regarding the compensation paid to the individual members of the Board, see section "Board of Directors 2019".
91
2020 Compensation Outlook
ECA compensation
The CGNC is committed to a pay-for-performance framework to align executive performance with shareholder interests. Following a thorough review of Alcon's compensation structures during 2019, we have made refinements to our overall compensation structures to better reflect Alcon's status as an independent, stand-alone company.
Headquartered in Switzerland, Alcon operates on a truly global basis. Our main business competitors are found in both Europe and North America, which is where we compete for talent. Consequently, our new executive compensation framework has been benchmarked against a carefully selected peer group, consisting of European and North American companies with a blend of similar size, industry and geographic characteristics to Alcon. The inclusion of European and North American companies reflects our global footprint and business mix. Based on Alcon’s strategic plan and our peer group analysis, we adopted the following key features of ECA compensation for 2020:
|
•
|
Substantially the same overall structure of ECA compensation as compared to 2019 (base pay, STI, LTI and benefits);
|
|
•
|
STI to be delivered in cash;
|
|
•
|
An additional profitability funding mechanism added to the 2019 STI metrics;
|
|
•
|
LTI metrics unchanged compared to 2019;
|
|
•
|
An increase to the CEO’s LTI award at target to align total compensation closer to the median of the blended peer group;
|
|
•
|
Broadly no significant change to the other ECA member’s compensation except slight adjustments;
|
|
•
|
Continuation of robust share ownership requirements; and
|
|
•
|
No material changes to benefits provisions.
|
Board compensation
The Board compensation framework will remain broadly unchanged for the upcoming term of office from the 2020 AGM to the 2021 AGM with the exception of the split of the CGNC described below, including:
|
•
|
Board Chair fee unchanged compared to 2019;
|
|
•
|
Same mix of fees payable in cash and shares as in 2019, including the option for a higher percentage of shares; and
|
|
•
|
Establishing fees for the new Governance and Nomination Committee’s Chair and members.
|
Effective as of the date of our 2020 AGM, the Board has split the current responsibilities of the Compensation, Governance and Nomination Committee (CGNC) into two separate committees: the Compensation Committee and the Governance and Nomination Committee. The Board recognized the heavy workload assigned to the CGNC since the Spin-off from Novartis; this split enables the two newly created committees to better focus on their respective key responsibilities. For the Governance and Nomination Committee, this includes a focus on leading governance practices and ESG topics in general. And for the Compensation Committee, this includes a focus on human resource strategy and executive compensation. Finally, this reorganization is line with best corporate governance standards. The annual fee for the Chair of the Governance and Nomination Committee will be USD 50,305 (CHF 50,000) and each member will receive USD 25,153 (CHF 25,000). The fees for the Compensation Committee will remain the same as the CGNC. These additional fees will increase the Board compensation budget subject to approval by vote at the 2020 AGM.
Corporate Governance
The Board makes decisions regarding Board compensation upon proposals from the CGNC. These proposals are based on analysis and review of board compensation practices, policies and benchmarking information. Similarly, the Board makes decisions regarding CEO compensation upon proposals from the CGNC. The CGNC makes decisions with regard to compensation of the other ECA members based upon the analysis of relevant executive compensation practices, policies and benchmarking information.
The Board is responsible for approving the Compensation Report and for the proposal of the aggregate budget of Board compensation and ECA compensation to the shareholders at the AGM. The Corporate Governance Report contained in Item 6.C. Board Practices of the 2019 Annual Report provides further details regarding the responsibilities of the CGNC.
92
Adherence to Strong Governance Practices
The CGNC evaluates many governance factors when designing and establishing compensation for members of the ECA. It uses these mechanisms to help guide its decisions to ensure that the Company is rewarding long-term success, discouraging excessive risk-taking and aligning executive and shareholder interests.
Exhibit 5
|
What we do
|
What we don’t do
|
|
•
Provide a majority of executive pay in variable, rather than fixed, compensation in order to ensure pay for performance
|
•
No severance agreements
|
|
•
Tie 100% of Short-Term and Long-Term Incentive awards to appropriately ambitious performance metrics
|
•
No single-trigger change in control payments
|
|
•
Follow best practices in executive compensation design
|
•
No change in control related excise tax gross ups
|
|
•
Prohibit hedging, pledging, and short sales of Company stock by executive officers and Directors
|
•
No termination notice period in excess of twelve months
|
|
•
Have robust share ownership requirements to reinforce alignment between executives and shareholders
|
•
No stock option awards
|
|
•
Include forfeiture and claw-back provisions for all variable compensation payments
|
•
No active defined benefit pension plans
|
|
•
Ensure that STI and LTI plans have target and maximum payout limits
|
•
No compensation guarantees
|
|
•
Award all equity grants at market value
|
|
|
•
Conduct ongoing investor outreach
|
|
93
ECA Compensation 2019
Compensation Program
As an independent company, we leveraged Novartis’ compensation framework for the ECA. That framework includes the strategic objectives of:
|
•
|
Paying for performance and the execution of the Alcon strategy;
|
|
•
|
Pursuing value for shareholders over the long-term;
|
|
•
|
Creating alignment in the interests of executives and shareholders; and
|
|
•
|
Motivating and retaining executives for the long-term.
|
The general principles for ECA compensation are defined in Articles 31 and 32 of our Articles of Incorporation (http://investor.alcon.com/governance//default.aspx). ECA compensation comprises fixed and variable elements. Fixed elements include an annual base salary and benefits. Variable compensation consists of elements from short-term and long-term incentive plans, which are subject to performance measures and caps.
Pay for Performance
Variable compensation represents a majority of total compensation and affirms our pay for performance philosophy (see more information in exhibits 10 and 17). Actual payout is contingent on the achievement of Company and individual performance goals. Performance metrics and goals are aligned with the Company’s business strategy and compensation philosophy as well as long-term value creation for shareholders.
Forfeiture and Claw-back Rules
Any variable compensation paid or payable to ECA members is subject to forfeiture and claw-back rules under our short-term incentive ("STI") and long-term incentive ("LTI") plans, which allow the Company to retain unpaid or unvested compensation (forfeiture) or even recover compensation already paid in cash or shares (claw-back). Such rules apply in cases where the action or behavior of an executive violates internal codes, guidelines or policies, or conflicts with management standards, including Company and accounting rules and regulations or violates laws. These forfeiture or claw-back rules apply to payments under both the STI and LTI plans. The action to retain or recover variable compensation is subject to applicable law of the jurisdiction involved.
Share Ownership Requirements for ECA Members
The Board has established share ownership requirements for members of the ECA in order to align executives’ interests with those of shareholders. The ownership requirement is expressed as a multiple of the executive’s annual base salary and is in line with the practices of our peer group. The following exhibit illustrates those requirements.
Exhibit 6
|
Leadership level
|
Share ownership requirement
|
|
David J. Endicott, CEO
|
5 times annual base salary
|
|
Other members of the ECA
|
3 times annual base salary
|
|
Members of the ELT (Executive Leadership Team)
|
2 times annual base salary
|
All members of the ECA and ELT must meet these requirements within five years of service from the later of the Spin-off or commencement of employment. If any of the ECA or ELT members fail to meet the requirement, or if they are not on track with the requirements, they will be prevented from selling Alcon shares until such time the requirement is met. At the end of 2019, each member of the ECA and ELT is on track to meet the applicable ownership requirement.
94
Compensation Governance
Authority for ECA Compensation Decisions
All decisions regarding CEO compensation and performance are made by the Board as a whole, excluding the CEO who is recused from such matters. The Board has delegated the authority to make compensation decisions for ECA members, excluding the CEO, to the CGNC.
The CEO makes recommendations to the CGNC regarding the executive compensation policy and principles and incentive plan design and makes proposals to the CGNC regarding the compensation and performance targets of members of the ECA. The CEO also makes proposals regarding the assessment of performance achievements of members of the ECA. The CEO does not make proposals regarding his own compensation or performance.
Exhibit 7
|
Authority levels in ECA compensation
|
CEO
|
CGNC
|
Board
|
AGM
|
|
ECA compensation policy and principles
|
R
|
A
|
||
|
CEO compensation and benefits
|
R
|
A
|
||
|
Other ECA member compensation and benefits
|
R
|
A
|
||
|
CEO performance targets and assessment of achievements
|
R
|
A
|
||
|
Other ECA members' performance targets and assessment of achievements
|
R
|
A
|
||
|
Share ownership requirements for the CEO and other members of the ECA
|
R
|
A
|
||
|
Maximum aggregate ECA compensation
|
R
|
P
|
A
1
|
|
|
Incentive plan design and rules
|
R
|
P
|
A
|
|
|
Compensation report of the Company
|
R
|
P
|
A
2
|
|
R Recommend P Propose A Approve
|
1
|
binding vote
|
|
2
|
advisory vote
|
Compensation Elements
Alcon’s compensation program has three broad components: annual base salary, variable compensation elements and employment benefits. Variable compensation elements are geared towards encouraging executives to deliver outstanding results and create sustainable shareholder value. They are also designed to prevent executives from taking excessive risks. The compensation program balances:
|
•
|
fixed and variable compensation elements;
|
|
•
|
short-term and long-term incentive compensation; and
|
|
•
|
Company and individual performance.
|
Exhibit 8
Annual Base Salary
|
Annual Base Salary
|
Annual base salary is set and reviewed considering:
•
Market value of the role
•
Benchmark information of peer companies
•
Market median within the peer companies
•
Executive’s role, performance, experience and potential
•
Increases in line with inflation and market
•
Business performance and the external environment
|
95
Exhibit 9
Variable Compensation
|
Short-Term Incentive
|
The Short-Term Incentive (STI) is designed and delivers awards based on:
Target value
•
Annual base salary ("ABS") x STI target (% of ABS) = STI target value in USD/CHF
Performance measurement
•
Measurement of financial performance (Business Performance Factor “BPF”) and individual performance (Individual Performance Factor “IPF”) (see the description of the STI below for more information)
Payout
•
Performance period: 1 year
•
Range 0%-200% of the target value
•
Payout formula: STI target value x IPF x BPF = STI payout
•
Paid in the first quarter of the following year
•
Delivered in cash and in Restricted Stock Units ("RSUs"), RSUs vest after 3 years
|
|
Long-Term Incentive
|
The Long-Term Incentive (LTI) is designed and delivers awards based on:
Target value
•
Annual Base Salary (ABS) x LTI target (% of ABS) = Target value in USD/CHF
Target award
•
Target value divided by the Alcon share price at grant date = number of Performance Stock Units ("PSUs") at target
•
Granted at the onset of the performance period
Performance measurement
•
Measurement of metrics (see the description of the LTI below for more information)
Payout
•
Performance period: 3 years
•
Range 0%-200% of the target number of PSUs
•
Payout formula: Target number of PSUs x LTI payout factor = number of PSUs vested
•
Cliff vesting of PSUs (e.g., all PSUs vest at the end of the performance period, subject to performance conditions)
•
Conversion of vested PSUs to Alcon shares
•
Payout delivered in unrestricted Alcon shares
•
Paid in the first quarter of the year following the performance period
•
PSUs carry dividend equivalents payable in shares at the end of the performance period based on the number of PSU vested
|
Variable compensation represents a majority of total direct compensation for ECA members. At target opportunity, the variable compensation represents 80% of the CEO’s total direct compensation. The average variable compensation of the other ECA members represents 72% of total direct compensation.
96
Exhibit 10
Mix of Fixed and Variable Compensation at Target
|
CEO
|
Other ECA members (excl. CEO)
|
|
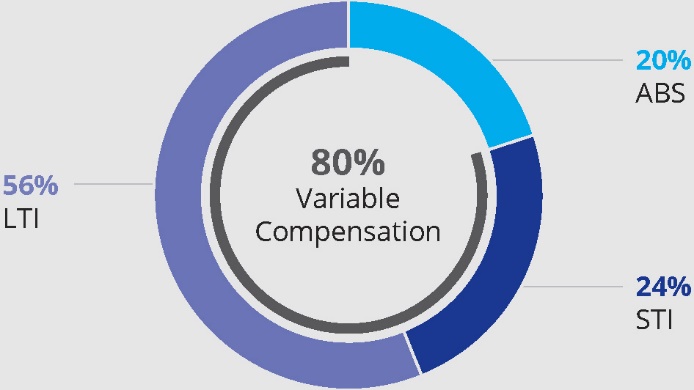
|
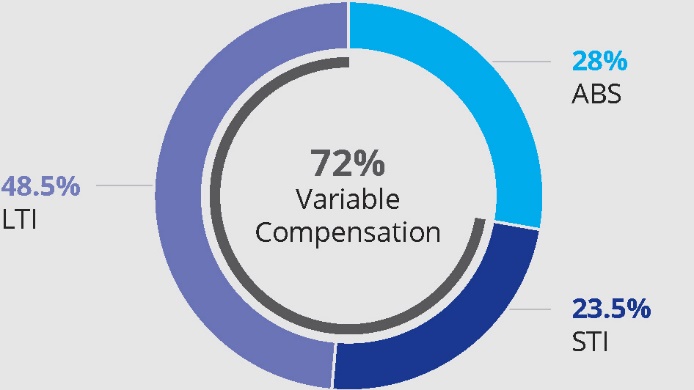
|
|
Abbreviations: ABS, Annual Base Salary; STI, Short Term Incentive; LTI, Long-Term Incentive
CEO ratios and average ratios of other ECA members are based on values 2019 of ABS, target STI and target 2019-2021 LTI (annualized)
Graphics exclude retirement savings and insurance benefits as well as any other benefits
CEO ratios and average ratios of other ECA members are based on values 2019 of ABS, target STI and target 2019-2021 LTI (annualized)
Graphics exclude retirement savings and insurance benefits as well as any other benefits
Short-Term Incentive
The short-term incentive compensation element is designed to reward the ECA members for their contribution towards achieving annual Company results and for their individual annual performance. The metrics used for the Business Performance Factor are the same for all ECA members. The Individual Performance Factor varies by individual. Based on this design, each member of the ECA participates in the overall Company’s success while also being rewarded for their individual contributions. The annual STI award value at target is based on a percentage of the ECA member’s annual base salary.
Exhibit 11
|
STI payout opportunity as a % of annual base salary
|
at target*
|
|
at maximum*
|
|
|
David J. Endicott, CEO
|
120
|
%
|
240
|
%
|
|
Other members of the ECA (average)
|
80
|
%
|
160
|
%
|
* Effective post-spin
The financial metrics for short-term performance in 2019 are set out in the exhibit below. The payout of STI is calculated by multiplying the target award by the BPF and IPF.
97
Exhibit 12
|
Financial metrics
1
|
Non-financial metric
|
|||||||||||||
|
Metric
|
Group Net Sales
|
Core Operating Income
|
Free Cash Flow
|
Individual performance
|
||||||||||
|
Definition
|
Measures the Company's top line performance
|
Measures the Company’s operating income
|
Measures the Company’s capacity to realize cash
|
Measures the achievement of individual objectives and individual values and behaviors
|
||||||||||
|
Rationale
|
Fosters the Company’s top line performance
|
Recognizes the primary indicator of Company performance and profitability
|
Indicates the cash realized from operating activities
|
Considers individual contribution to the Company’s results
|
||||||||||
|
Weighting
|
40%
|
40%
|
20%
|
100%
|
||||||||||
|
Performance factors
|
BPF (total weightings of financial metrics 100%)
|
IPF
|
||||||||||||
|
Payout formula
|
||||||||||||||
|
ABS
|
X
|
STI
Target |
X
|
BPF
|
X
|
IPF
|
=
|
STI
Payout |
||||||
|
BPF maximum 150% x IPF maximum 150% = maximum 225% (capped at 200%)
|
||||||||||||||
|
Payout range
|
0-200%
|
|||||||||||||
Note
|
1
|
Financial achievements are measured in constant currencies to reflect operational performance.
|
Performance, thresholds, targets and maximum values for the financial performance metrics are determined at the onset of the one-year performance period. In line with good governance practice, the Board and the CGNC set targets that are appropriately ambitious and in support of the Company’s business strategy and the Board’s strategic plan without encouraging the ECA member to take undue risks.
At the end of the performance period, the Board and the CGNC determine the financial performance achievements against the targets originally set and determine the BPF. In addition, they consider the Individual Performance Factor (IPF) of the ECA members. The IPF is determined by the achievement of individual objectives and the demonstration of values and behaviors. The performance rating is the basis for setting the IPF between 0% and 150%. The CEO and other ECA members are not present when their IPF are discussed and determined.
The Board and the CGNC may apply discretion in determining the final outcome of the STI payout. At the end of the performance period of each STI award, we intend to disclose in the applicable compensation report details of the outcome of the final STI payout.
Long-Term Incentive
The long-term incentive program is designed to make a significant portion of compensation of ECA members contingent on long-term Company performance and to ensure alignment with shareholders’ interests. LTI awards consist of PSUs, which convert to shares at vesting, contingent on the achievement of the performance measures. The annual LTI grant value at target is based on a percentage of the ECA member’s annual base salary.
Exhibit 13
|
LTI payout opportunity as a % of annual base salary
|
Below threshold
|
|
at target
|
|
at maximum
1
|
|
|
David J. Endicott, CEO
|
0
|
%
|
280
|
%
|
560
|
%
|
|
Other members of the ECA (average)
|
0
|
%
|
167
|
%
|
334
|
%
|
|
1
|
The maximum number of units that may be awarded is limited to 200% of the target number of units granted.
|
The financial metrics for the measurement of long-term performance are set out in the exhibit below. The payout is calculated by adding the weighted achievements of the individual financial targets in a range from 0-200% and multiplying the number
98
of PSUs granted by the resulting performance factor. At the end of the performance period of each LTI award, we intend to disclose in the applicable compensation report details of the outcome of the final LTI payout.
Exhibit 14
|
Performance metrics
|
||||||||||||||||||
|
Metric
|
Group Net Sales CAGR
1,2
|
Core EPS CAGR
2
|
Share of Peers
3
|
Innovation scorecard
4
|
||||||||||||||
|
Definition
|
Measures the Company's top
Line performance |
Measure of the profitability by the earnings per share
|
A set of measures to compare the Company to the market shares of competitors
|
Measure of key product pipeline and achievement of milestones
|
||||||||||||||
|
Rationale
|
Fosters the Company’s top line performance
|
Aligns ECA with shareholders by measuring earnings per share
|
Indicates relative competitive position against peers in terms of market share
|
Delivery of future products and key future growth drivers
|
||||||||||||||
|
Weighting
|
25%
|
25%
|
25%
|
25%
|
||||||||||||||
|
Payout formula
|
||||||||||||||||||
|
Metric
1 25% |
+
|
Metric
2 25% |
+
|
Metric
3 25% |
+
|
Metric
4 25% |
||||||||||||
|
ABS
|
X
|
LTI
Target |
X
|
Addition of weighted metrics
= Performance Factor |
=
|
Payout/Number of PSUs
|
||||||||||||
|
Weighted achievements of metrics = additive payout factor maximum 200% (cap)
|
||||||||||||||||||
|
Payout range
|
0-200%
|
|||||||||||||||||
Notes
|
1
|
CAGR means Compound Annual Growth Rate
|
|
2
|
Financial achievements are measured in constant currencies to reflect operational performance.
|
|
3
|
Metric “Share of peers” measures Alcon’s market share of key products in the Surgical and Vision Care segments against a peer group of competitors.
|
|
4
|
The innovation scorecard for 2019-2021 includes 10 milestones: one sales-related; one related to the cost of a development program; and eight related to the timeline of achievements. Each milestone is tied to a key internal development project. The LTI payout for the innovation metric will depend upon the number of milestones achieved within the relevant performance period. The milestones established are approved by the Board’s Innovation Committee.
|
Similar to the performance target-setting and measurement of the STI award, the thresholds, targets and maximum values for the LTI performance metrics are determined at the onset of the three-year performance period. In line with good governance practice, the Board and the CGNC set targets and ensure they are appropriately ambitious and in support of the strategic plan but do not encourage the ECA member to take undue risks.
At the end of the three-year performance period of each LTI award, the Board and the CGNC determine the performance achievements of each metric against the targets originally set, as well as assess the achievements and results of the innovation scorecard. The Board and the CGNC may apply discretion in determining the final outcome of the performance results used for the vesting of LTI awards. At the end of the performance period of each LTI award, we intend to disclose in the applicable compensation report details of the outcome of the final LTI payout.
99
Benefits
ECA members are enrolled in local benefit plans providing for retirement income savings and insurance for disability and loss of life. These plans are in line with local market practices and legislation, and are subject to the Company's plan rules and policies. The ECA members and the Company pay statutory contributions. The sole ECA member with an employment contract governed by US law is enrolled in a Company-provided health insurance plan.
Exhibit 15
|
Retirement savings
and insurance contributions |
Retirement and insurance benefits plan contributions provided in line with local market practice (most governed by legal provisions)
Employer-paid
•
Contributions to retirement savings plan
•
Insurance premiums for disability and survivor benefits
•
Health insurance (only in the US)
•
Contributions to mandatory social security systems
|
|
Other benefits
|
•
Expense and representation allowance in line with Swiss market practice (covering small expenses)
•
Mandatory allowances for children and education (only in Switzerland)
•
Car allowance
•
Employer-paid international benefits (e.g. relocation cost, cost of living adjustments, settling in allowance, international health insurance, housing, schooling/education fees) in line with Alcon’s global mobility policies
|
Alcon is a global company headquartered in Switzerland with multinational operations and international business strategies. As a result, from time to time, executives are relocated to Switzerland or will be relocated from their home country in the future. Relocated executives receive relocation support and are provided with international benefits in line with Alcon’s global mobility and relocation policies (e.g. relocation support, tax and social security equalization, benefit equalization, and other international benefits as appropriate).
Compensation Payments to the ECA Members in 2019
The following exhibit 16 sets forth the total compensation received by the CEO (highest paid member of the ECA) and the aggregate total compensation received by all of the other ECA members for the period from January 1, 2019 to December 31, 2019. The disclosed compensation includes payments made to six ECA members while they were executives of Alcon prior to the Spin-off on April 9, 2019. A seventh ECA member was appointed as of the Spin-off. In addition, the aggregate total of other ECA members includes the prorated compensation Alcon paid to the seventh ECA member.
The compensation Alcon paid to the ECA members in 2019 remained within the 2019 budget.
100
Exhibit 16
|
Compensation
|
Fixed compensation
|
Variable compensation
|
Additional
compensation |
Totals
|
|||||||||
|
From January 1, 2019 to December 31, 2019
|
Annual
base salary 1 |
Pension
and insurance 2 |
2019
short-term
incentive 3, 4 |
2019-2021
long-term
incentive 5-9 |
Other
benefits 10 |
Total
compensation 11 |
|||||||
|
Amount
in cash |
Amount/
value |
Amount
in cash |
RSU value
at grant |
PSU target
value FMV at grant |
Amount/
value |
Total
amount |
|||||||
|
David J. Endicott, CEO
12
|
1,134,358
|
279,851
|
745,380
|
745,380
|
2,738,036
|
1,177,487
|
6,820,492
|
||||||
|
Aggregate amount of 6 other ECA members
13
|
3,541,122
|
960,531
|
2,459,312
|
1,053,990
|
7,821,030
|
3,396,392
|
19,232,377
|
||||||
|
Totals in USD
14
|
4,675,480
|
1,240,382
|
3,204,692
|
1,799,370
|
10,559,066
|
4,573,879
|
26,052,869
|
||||||
|
Totals in CHF
14
|
4,647,132
|
1,232,862
|
3,185,262
|
1,788,460
|
10,495,046
|
4,546,148
|
25,894,910
|
||||||
Notes
|
1
|
The Annual Base Salaries of the six designated ECA members pre Spin-off date (including the CEO) and the seven active ECA members post Spin-off date (including the CEO) are based on their individual compensation arrangements pre and post Spin-off.
|
|
2
|
The retirement pension and insurance benefits are the actual contributions paid to benefit plans for the period from January 1 to December 31, 2019. It also includes the amount of USD 71,994 for mandatory contributions paid by Alcon to governmental social security systems for all ECA members, which provide the ECA members with the right to the maximum future insured government pension benefit. The aforementioned amount is a portion of a total amount of contributions of USD 622,142 paid by Alcon to the social security systems.
|
|
3
|
The STI award disclosed is the amount earned for the performance year 2019. It will be paid in March 2020. Fifty percent of the value of the STI award of the CEO will be paid in cash, and fifty percent in RSUs. For other ECA members, seventy percent of the value of the STI award will be paid in cash, and thirty percent in RSUs. RSUs are subject to a vesting period of 3 years. The deferred portions are shown at the value that will be delivered in RSUs based on the underlying Alcon share at the closing price on the future grant date in March 2020.
|
|
4
|
The aggregate Short-Term Incentive awards in cash disclosed for this period includes the STI award at target value of Alcon's former CFO who stepped down from the function when Alcon was still a division of Novartis on April 8, 2019. This individual did not join Alcon as an independent company and remained with the Novartis organization.
|
|
5
|
The amounts of the 2019-2021 LTI awards represent the total value of the target number of PSUs granted to the then designated members of the future ECA on January 22, 2019. The value of the PSUs is based on the closing price of the underlying Novartis share on the date of grant of USD 88.32 or CHF 88.14 respectively. The amount of the LTI awards disclosed includes also the award made to Alcon's former CFO who stepped down from the function when Alcon was still a division of Novartis on April 8, 2019, prorated for the period from the onset of the performance period 2019 through to April 8, 2019.
|
|
6
|
The amount includes the value of the target number of PSUs of the 2019-2021 LTI award granted to the seventh ECA member on January 22, 2019, pro-rated for the period from April 9, 2019 to the end of the performance period in 2021. The value of the PSUs is based on the underlying Novartis share price as described above.
|
|
7
|
The amount includes the value of the target number of PSUs of the 2019-2021 LTI award granted to the new incumbent of the CFO role on April 10, 2019, prorated to his period of service as acting member of the ECA within the performance period 2019-2021. The value of the PSUs is based on the closing price of the underlying Alcon share on the date of grant of CHF 58.05.
|
|
8
|
The amount includes the total value of the target PSUs of additional 2019-2021 LTI awards granted to the members of the ECA (excluding the CFO) on April 10, 2019 for increasing their pre Spin-off LTI awards to the new target LTI award levels effective from Spin-off date. The value of the PSUs is based on the closing price of the underlying Alcon share on the date of grant of USD 58.04 and CHF 58.05 respectively.
|
|
9
|
The amount includes further the value of the target number of PSUs of the special LTI award granted to the new incumbent of the CFO role on April 10, 2019, subject to the same performance conditions as the 2019-2021 LTI awards. The value of the PSUs is based on the closing price of the underlying Alcon share on the date of grant of CHF 58.05.
|
|
10
|
The amounts of other benefits include the Company-paid benefits, values of benefits in kind, payments made, and payments or values promised to ECA members for the relevant period in 2019. They include mostly benefits for relocation to the new Alcon headquarters in Switzerland (e.g. relocation support, housing, schooling, tax and social security equalization, benefit equalization, other international relocation benefits). The amounts of other benefits also includes cost to the Company for transferring the relevant ECA members to Switzerland such as immigration cost, search of housing, pre-visit to the location and other costs related to relocation.
|
|
11
|
The vesting and forfeiture of Novartis shares and their replacement by Alcon shares under the equity restoration plan did not provide additional values earned, paid or granted and therefore no value is included in the total compensation. The restoration of equity awards is outlined below in section "Alcon Equity Restoration Plan."
|
101
|
12
|
The total compensation of the CEO from January 1, 2019 to December 31, 2019 includes his compensation as designated CEO from January 1, 2019 to April 8, 2019 under the Novartis compensation structure and terms.
|
|
13
|
The compensation of the six other members of the ECA from January 1, 2019 to December 31, 2019 includes (i) the compensation of five designated members of the ECA from January 1, 2019 to April 8, 2019 under the Novartis compensation structure and terms, and (ii) the compensation of six active ECA members from April 9, 2019 to December 31, 2019 under Alcon's compensation terms.
|
|
14
|
Payments to ECA members were made in CHF and/or USD. The amounts were converted at the rate of 1.0 CHF : 1.0061 USD.
|
Alcon reports the 2019-2021 Long-Term Incentive Awards at the value at grant in accordance with Swiss market practice. The basis for disclosure is the target value of the PSU at grant, reflecting the assumption that the awards will vest at 100% achievement, excluding any share price movement that may occur over the performance period. The future payout will be determined only after the conclusion of the performance period in three years (i.e. at the end of 2021) and the awards will vest in January 2022. The payout range is between 0% and 200% of the target number of PSUs.
Outcome of Performance Awards 2019
2019 Short-Term Incentive
The Company generally achieved the financial targets for the 2019 STI payout. It slightly exceeded the targets for third party sales and core operating income and significantly exceeded the target for free cash flow. However, the CGNC and the Board recognized that evaluating performance against STI metrics over less than one year, including significant uncertainty and variability in the business due to the Spin-off from Novartis, was uniquely challenging.
The CGNC and the Board decided to apply discretion, as foreseen in the plan rules, and reduced the total Business Performance Factor to the target level (100%). This is seen as an appropriate reflection of the Company’s overall financial performance for the year. The 2019 STI award payouts made to the CEO and the ECA members averaged 122% of their target award. The value of the 2019 STI award for the CEO and the aggregate value of the 2019 STI awards for the other members of the ECA are disclosed in exhibit 16 above. The payment of the 2019 STI will be made in March 2020.
The values of financial targets and their achievements are not disclosed as they are commercially sensitive information and would give insights into confidential business strategies. This could result in a competitive disadvantage to the Company and its shareholders.
2017-2019 Long-Term Incentive
The LTI awards of the CEO and the other ECA members for the performance period 2017-2019 will vest in 2020. As a result of Alcon being spun-out from Novartis during the final year of this three-year LTI performance cycle, payouts under the program have been split into two periods. For the first twenty-seven months period when Alcon was still a division of Novartis, ECA payouts will be determined based upon Novartis performance. For the truncated nine-month period from Spin-off to the end of the performance period in December 2019 (Refill Awards), PSUs will be subject to Alcon performance. The performance factor for the post Spin-off period is based on Alcon's underlying financial measures and has resulted in a 100% of the target award vesting. The prorated award for twenty-seven months of service to Novartis prior to Spin-off is subject to achieved Novartis performance measures, which are not disclosed in Alcon’s 2019 Compensation Report.
The value of financial targets and their achievement used for the vesting of LTI awards are not disclosed for the same reason as the short-term incentive targets and achievements.
102
Fixed and Variable Compensation
Based on the compensation disclosed in exhibit 16 that ECA members received over the period from January 1, 2019 to December 31, 2019, the mix of fixed and variable compensation is as follows:
Exhibit 17
Mix of Fixed and Variable Compensation at Actual 2019 STI Payout and 2019-2021 LTI at Grant
|
CEO
|
Other ECA members (excl. CEO)
|
|
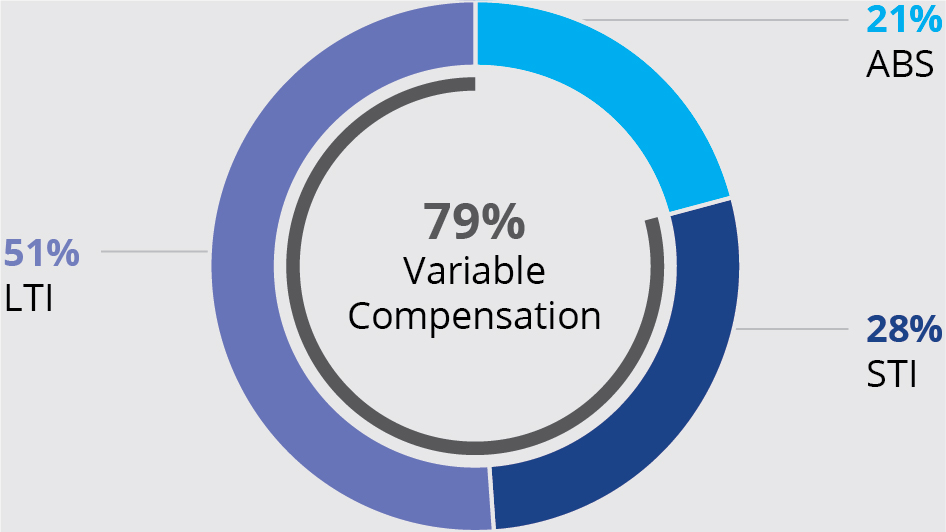
|
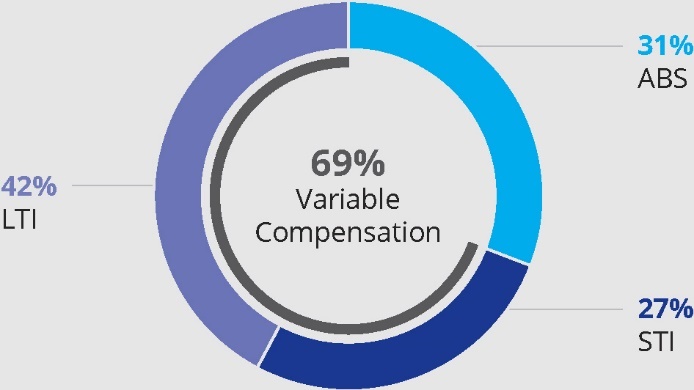
|
|
Abbreviations: ABS, Annual Base Salary; STI, Short Term Incentive; LTI, Long-Term Incentive.
Average ratios are based on, ABS, payout of 2019 STI (in March 2020), and grants of 2019-2021 LTI awards at grant value. Mix excludes retirement savings and insurance benefits as well as any other benefits.
Compensation Payments to the ECA Members in 2018
During 2018, Alcon was a division of Novartis. The compensation received by designated members of the then future ECA is unrelated to the current compensation of active members of the ECA. The compensation received in 2018 by the then designated members of the ECA was reported in Amendment No. 6 to the Company's Registration Statement on Form 20-F filed with the US Securities and Exchange Commission on March 22, 2019 ("2018 Form 20-F").
Alcon Equity Restoration Plan
Effective as of Spin-off, the Alcon equity restoration plan governed the transition of incentive awards denominated in Novartis share-based instruments into Alcon share-based instruments. Under this plan, the Novartis share-based awards were replaced and restored with Alcon share-based awards. These equity restoration awards did not provide any additional value to the ECA members. These awards only compensated for (i) the lost value of the original Novartis award resulting from holders not receiving the Spin-off dividend, and (ii) for the forfeiture of the awards for time of service to Alcon after Spin-off.
Keep Whole Awards
At the Alcon Spin-off from Novartis on April 9, 2019, all Alcon associates, including the ECA members, holding vested Novartis shares or unvested awards in the form of restricted Novartis shares received the dividend in kind resulting from the Spin-off. This dividend in kind was provided in a ratio of one Alcon share distributed for every five Novartis shares held.
ECA members who held unvested Restricted Stock Units and Performance Stock Units awarded under the Novartis Deferred Share Plan and/or the Novartis Long-Term Incentive Plans did not receive the dividend in kind resulting from the Spin-off. Because the value of the underlying Novartis share decreased due to the Alcon Spin-off, ECA members would have experienced a devaluation of the award value equal to their pro-rata share of the value of the Alcon business.
As a result, immediately following the Spin-off, Alcon granted equity awards to its associates, including ECA members, to compensate for the devaluation of their unvested awards in RSUs or PSUs. These awards were called “Keep Whole Awards”. Awards were granted in the same equity instrument as the underlying award and had a value equivalent to the dividend in kind that each PSU or RSU would have received had the unit been a Novartis share.
The “Keep Whole Award” value was determined by Novartis.
103
Refill Awards
The unvested Novartis PSU awards held by Alcon associates, including ECA members, granted under the LTI Plans were pro-rated for time of service to Novartis between the beginning of the performance period and the Spin-off date. The prorated amounts of Novartis PSUs for time of service to Alcon after Spin-off up to the end of the performance period forfeited under so called “good leaver” rules. The values of the forfeited Novartis PSU awards were replaced by Alcon PSU awards. The latter were called “Refill Awards”. The performance conditions of the Alcon PSUs for the period of service to Alcon following the Spin-off were defined by the Alcon Board. The pro-rated amounts of units for time of service to Novartis were retained in Novartis PSUs and remain subject to Novartis performance conditions and terms for the remainder of their performance period.
Unvested RSUs of Alcon associates, including ECA members, were subject to the same treatment as PSUs. The RSUs were replaced through Refill Awards in RSUs. The only differences between the treatment of RSU awards and PSU awards are that the pro-rated amounts of RSU awards for time of service to Novartis are calculated from the grant date, the vesting of the RSUs is not subject to Novartis performance conditions, and the “Refill Award” in Alcon RSU awards are not subject to Alcon performance conditions.
The value used for granting these “Refill Awards” was determined by Novartis.
The number of Alcon shares that ECA members received as Keep Whole Awards to replace the dividend in kind and as Refill Awards to replace the forfeited portion of the original Novartis PSU award are set out in the following section.
Equity Instruments Granted to the ECA Members in 2019
In the transition year 2019, the number of share-based units granted to the designated and active members of the ECA include grants in Novartis shares and grants in Alcon shares. The exhibits below set out the number of units granted.
Equity Grants in Novartis Shares
The LTI awards for the performance period 2019-2021 were granted on January 22, 2019 to the then designated members of the ECA prior to the Alcon Spin-off. The value of the award is based on the closing price of the underlying Novartis share on the date of grant and disclosed in section "Compensation Payments to the ECA Members in 2019."
Exhibit 18
|
Number of units granted to
|
PSUs
(target number) |
|
David J. Endicott, CEO
|
24,740
|
|
Other ECA members
1
|
32,086
|
|
Total
|
56,826
|
Note
|
1
|
Includes the number of PSUs granted to the Alcon's former CFO who stepped down from the function when Alcon was still a division of Novartis, prorated from January 1 to April 8, 2019, and the number of PSUs granted to the seventh ECA member, prorated from April 9, 2019 to the end of the performance period in 2021.
|
Equity Grants in Alcon Shares Post Spin-Off
(excluding the Number of Refill and Keep Whole Awards)
The ECA members’ LTI target value as a percentage of annual base salary increased effective from the Spin-off date to reflect their new responsibilities as executives of an independent public company. On April 10, 2019, each received a prorated additional LTI award in PSUs based on the underlying Alcon share at market value on the day of grant for the performance period 2019-2021. The additional Alcon PSUs increased their 2019-2021 LTI award to the new target levels.
The new CFO received a prorated 2019-2021 LTI award in PSUs based on the underlying Alcon share price on April 10, 2019. In addition, he received a special LTI award in PSUs subject to the same performance conditions as the 2019-2021 LTI award, based on the underlying Alcon share price on April 10, 2019.
104
Exhibit 19
|
Number of units granted to
|
Deferred Share Plan
RSUs based on the 2019 STI 1 |
PSUs based on the 2019-2021 LTI
target Award 2, 3 |
|
David J. Endicott, CEO
|
na
|
9,317
|
|
Other ECA members
|
na
|
85,086
|
|
Total
|
na
|
94,403
|
Notes
|
1
|
Number of RSUs that will be granted in 2020 based on a percentage of the 2019 STI delivered in Alcon equity is not available at the time of editing this 2019 Compensation Report (na) as the number of shares is dependent on the stock price when the STI award is paid in March 2020. The value that will be granted is set out in exhibit 16.
|
|
2
|
Number of PSUs granted to the new CFO of a prorated LTI award for the performance period 2019-2021, and of a special LTI award subject to the same the performance period and conditions.
|
|
3
|
Number of PSU granted to the ECA members (excluding the CFO) for increasing their pre Spin-off target LTI award to the new target award level effective from Spin-off.
|
Equity Restoration, Keep Whole and Refill Awards in Alcon Shares
The following exhibit sets out the number of Alcon share-based instruments granted to ECA members pursuant to the Alcon equity restoration plan.
Exhibit 20
|
Number of units granted to
|
Alcon equity units granted as
Refill awards 1 |
Alcon equity units
granted as
Keep Whole awards
2
|
|
David, J. Endicott, CEO
|
124,062
|
23,639
|
|
Other ECA members
|
222,966
|
39,764
|
|
Total
|
347,028
|
63,403
|
Notes
|
1
|
Number of Alcon shares granted to replace the forfeited value of Novartis share-based instruments.
|
|
2
|
Number of Alcon shares granted to compensate for the dividend in kind based on Novartis unvested PSUs and RSUs.
|
Equity Instruments Granted to the ECA Members in 2018
During 2018, Alcon was a division of Novartis. The numbers of Novartis equity instruments received by designated members of the future ECA were reported in Alcon’s 2018 Form 20-F.
105
Share Ownership of the ECA Members as of December 31, 2019
The number of Alcon shares or share-based units held by ECA members and “persons closely linked” (as defined below) to them as of December 31, 2019 is set out in the exhibit below. As of this same date, no ECA members, either individually or together with “persons closely linked”, owned 1% or more of the outstanding shares of Alcon.
Exhibit 21
|
Number of units
|
Vested shares
|
Unvested RSUs
|
Unvested target PSUs
|
Total
|
|
David J. Endicott
|
25,346
|
69,798
|
82,187
|
177,331
|
|
Laurent Attias
|
0
|
24,855
|
22,435
|
47,290
|
|
Ian Bell
|
0
|
36,432
|
27,836
|
64,268
|
|
Leon Sergio Duplan Fraustro
|
4,183
|
29,393
|
26,595
|
60,171
|
|
Rajkumar Narayanan
|
0
|
21,293
|
19,380
|
40,673
|
|
Michael Onuscheck
|
6,424
|
36,524
|
35,877
|
78,825
|
|
Tim C. Stonesifer
|
0
|
0
|
61,672
|
61,672
|
|
Total
|
35,953
|
218,295
|
275,982
|
530,230
|
Additional Disclosures
Employment Agreements
The Company and the members of the ECA entered into employment agreements for an indefinite period of time. Six of seven ECA members’ employment agreements are governed by Swiss law. The seventh ECA member’s employment agree-ment is governed by US law.
All employment contracts with ECA members provide that termination of employment requires a 12-months advance notice in accordance with our Articles of Incorporation. None of the employment agreements with the ECA members provide for any severance payment.
Such employment agreements also prohibit the ECA member from competing against Alcon for a period up to 12 months after termination in accordance with our Articles of Incorporation.
Payments to Current or Former Members of the ECA
During 2019, no payments (or waivers of claims) other than those set out in the exhibit 16 (including the related notes) under section "Compensation payments to the ECA members in 2019" were made to current or former members of the ECA or to “persons closely linked” to them.
Loans to Members of the ECA
Alcon’s Articles of Incorporation and corporate policies do not permit loans to current or former members of the ECA or to “persons closely linked” to them. As a result, no loans were granted in 2019, and none were outstanding as of December 31, 2019.
106
Persons Closely Linked
Persons closely linked to members of the ECA are (i) their spouse, (ii) their children below age 18, (iii) any legal entities that they own or otherwise control, and (iv) any legal or natural person who is acting as their fiduciary or agent.
Compensation Expense 2019
The total expense for the year 2019 for compensation awarded to ECA members, using International Financial Reporting Standards (IFRS) measurement rules, is presented in Note 25 to the Company’s audited consolidated financial statements. The numbers of compensation expense in the Note 25 may differ from the numbers reported in this 2019 Compensation Report due to the accounting and disclosure standards applied.
Alcon Share-based Units Awarded to Alcon Associates in 2019
In the financial year 2019, the total of approximately 5 million restricted shares, RSUs and target PSUs (all unvested) were granted, and approximately 0.1 million Alcon shares vested and were delivered to Alcon associates under the various equity-based incentive or participation plans. Current unvested equity instruments (restricted shares, RSUs and target PSUs) represent approximately 1% of issued shares. Alcon delivers treasury shares to associates to fulfill these obligations.
107
Board of Directors Compensation 2019
Compensation Framework
Novartis, as our sole shareholder prior to the Spin-off, established the compensation of the Alcon non-executive members of the Board for the term of office from the Spin-off to the 2020 AGM. The Board compensation was set at a level that allowed for the attraction and appointment of high-caliber talent for Board roles with the relevant background and skills, including global experience in the medical devices and ophthalmology industry. The Board is comprised of both Swiss and international members.
Non-executive Board members are awarded a base fee. Further, they are entitled to additional fees for their roles of Chair and/or member on the Board committees. The Vice Chair also receives an additional fee. The Board Chair does not receive such additional fees for work in committees. David J. Endicott, the CEO of Alcon, does not receive any additional fees for his Board membership. He is compensated as a member of the ECA and his compensation is disclosed in section "ECA Compensation 2019."
Prior to the Spin-off date, the then designated non-executive members of the future Alcon Board invested a significant amount of time by attending a number of planning meetings. Each director, other than the Board Chair, received a one-time fee of CHF 10,000 (USD 10,061) for their on-boarding activities.
The following table sets out the compensation for the non-executive members of the Board from the Spin-off date to the 2020 AGM:
Exhibit 22
|
Fee for the period from
April 9, 2019 to the 2020 AGM
|
||
|
Board function
|
USD
1
|
CHF
|
|
Annual base fee:
|
||
|
Board Chair
|
955,795
|
950 000
|
|
Board member base fee (Board retainer fee)
|
201,220
|
200 000
|
|
Additional fees:
|
||
|
Vice Chair
|
40,244
|
40 000
|
|
Chair of the Audit and Risk Committee
|
70,427
|
70 000
|
|
Chair of the Compensation, Governance and Nomination Committee
|
50,305
|
50 000
|
|
Chair of the Innovation Committee
|
50,305
|
50 000
|
|
Member of the Audit and Risk Committee
|
35,214
|
35 000
|
|
Member of the Compensation, Governance and Nomination Committee
|
25,153
|
25 000
|
|
Member of the Innovation Committee
|
25,153
|
25 000
|
|
One-off fee (on-boarding fee)
2
|
10,061
|
10 000
|
Notes:
|
1
|
Converted into USD at a rate of CHF 1.0 = USD 1.0061
|
|
2
|
Fee for services to prepare the Spin-off (on-boarding fee)
|
In 2019, the following framework applied to the compensation of non-executive Board members:
|
•
|
Fifty percent of the total fees is paid in shares on a mandatory basis in two installments: September 2019 and March 2020
|
|
•
|
Fifty percent of the total fees is paid in cash in four installments: June, September, and December 2019 and March 2020
|
|
•
|
Each board member may elect to receive up to one hundred percent of their fees in shares
|
|
•
|
The fees are paid in Swiss Francs
|
|
•
|
The shares delivered are unrestricted (free shares) listed at the SIX Swiss Exchange
|
108
|
•
|
The members of the Board are subject to share ownership requirements (see below)
|
|
•
|
Board members bear the full cost of their own social security contributions
|
|
•
|
Board members do not receive variable compensation, in line with their focus on corporate strategy, supervision and governance. Their payment in shares is in unrestricted shares. They do not receive share options or other share-based instruments.
|
The general principles of compensation of the members of the Board are defined in our Articles of Incorporation. According to our Articles of Incorporation, Alcon may enter into agreements with members of the Board relating to their compensation for a fixed term of up to one year.
Share Ownership Requirements for Members of the Board
Board members are committed to align their interests with those of shareholders. The Board has set forth share ownership requirements which apply to the non-executive members of the Board.
Each member of the Board, including the Board Chair, is required to own Alcon shares that represent the value of his or her annual base fee. This requirement needs to be met within four years in office.
Exhibit 23
|
Board level
|
Share ownership requirement
|
|
Board Chair
|
1 times annual base fee, within 4 years
|
|
Other Board members
|
1 times annual base fee, within 4 years
|
Each member of the Board is on track to meet the ownership requirement. Board members are prohibited from hedging or pledging their ownership positions in Alcon shares that are part of the share ownership requirement.
Compensation Governance
Authority for Board Compensation Decisions
Decisions regarding Board compensation are taken by the Board upon proposals from the CGNC. The CGNC's proposals are based on analysis and review of compensation practices, policies and benchmarking information.
The Board is responsible for approving the Compensation Report and for proposing the aggregate budget of Board compensation subject to a shareholders’ vote at the applicable AGM.
Exhibit 24
|
Authority levels in Board compensation
|
CGNC
|
Board
|
AGM
|
|
Board compensation policy and principles
|
P
|
A
|
|
|
Board Chair compensation
|
P
|
A
|
|
|
Other Board member compensation
|
P
|
A
|
|
|
Share ownership requirements for Board members
|
P
|
A
|
|
|
Maximum aggregate compensation of the Board members
|
R
|
P
|
A
1
|
|
Compensation Report of the company
|
R
|
P
|
A
2
|
R Recommend P Propose A Approve
|
1
|
binding vote
|
|
2
|
advisory vote
|
The Corporate Governance Report in Item 6.C. Board Practices of this Annual Report provides further details to the authorities of the CGNC.
109
Independence of Members of the Compensation, Governance and Nomination Committee
Each of the members of the CGNC meets the independence criteria set forth in our Board Regulations. From Spin-off, the CGNC has been comprised of the following four members: Karen J. May (Chair), Thomas H. Glanzmann, D. Keith Grossman, and Ines Pöschel. At the AGM, the shareholders elect the CGNC Chair and its members individually for a term of office of one year. Our Articles of Incorporation permit re-election. The 2019 Corporate Governance Report in Item 6.B. of the Alcon 2019 Annual Report provides details regarding the members of the Board and the independence criteria for Board members. The Board Chair, the CEO and the Secretary of the Board attend the CGNC meetings by invitation. None is present when decisions relating to their own interest are taken.
The Compensation, Governance and Nomination Committee’s External Advisors
Commencing in April 2019, the CGNC retained Willis Towers Watson as its external compensation advisor. The CGNC also retained HCM International (Switzerland) for advice with regard to Swiss compensation matters. The CGNC appointed each of them following a thorough process of evaluating proposals from various consulting firms.
At the end of 2019, the CGNC conducted a review of the support received from the retained external advisors and is satisfied with the result of the first nine months of work. At least annually, the CGNC will evaluate the quality of the consulting services received and the need to use an additional advisor for specific matters.
Compensation of the Members of the Board of Directors in 2019
The following exhibit 25 sets out the total compensation received by non-executive members of the Board during 2019. The compensation disclosed in this exhibit was received for their service on the Board from April 9, 2019 to December 31, 2019, and includes the one-time fee of USD 10,061 (CHF 10,000) paid in March 2019 for activities prior to the Spin-off date. Board members participated in multi-day on-boarding sessions with management in the months prior to Spin-off in order to prepare for their service on the Board.
The disclosed compensation in the blue-shaded portion of the table in exhibit 25 represents only a part of their total fees they will receive for their service on the Board for the term of office from April 9, 2019 to the 2020 AGM. In accordance with our normal payout schedule, a further payment of fees in cash and shares will be made in March 2020, which is reflected in the unshaded columns of the table in exhibit 25.
110
The CEO of Alcon, David J. Endicott, is not included in this exhibit as he is not compensated for his Board membership. His compensation is disclosed as CEO and member of the ECA in section "ECA Compensation 2019."
Exhibit 25
|
Board members, functions
9
|
Payment in
cash 1,2 |
Payment in
shares 3 |
Number of
shares 4 |
Other
payments 5 |
|
Total
fees 2019 |
Fee payable March 2020
6
|
Total fees
for term
7
|
|
F. Michael Ball
Board Chair
|
418,206
|
179,166
|
3,000
|
—
|
|
597,372
|
358,423
|
955,795
|
|
Lynn D. Bleil
Member ARC and IC
|
83,685
|
73,518
|
1,231
|
—
|
|
157,203
|
114,444
|
271,647
|
|
Arthur B. Cummings
Member IC
|
112,486
|
39,058
|
654
|
89,243
|
|
240,787
|
84,890
|
325,677
|
|
Thomas H. Glanzmann
Chair IC, member CGNC
|
16,474
|
131,926
|
2,209
|
4,399
|
|
152,799
|
138,339
|
291,138
|
|
D. Keith Grossman
Vice Chair, member CGNC, IC
|
137,711
|
54,706
|
916
|
—
|
|
192,417
|
109,413
|
301,830
|
|
Scott H. Maw
Chair ARC
|
44,058
|
101,826
|
1,705
|
—
|
|
145,884
|
135,824
|
281,708
|
|
Karen J. May
Chair CGNC, member ARC
|
45,930
|
107,500
|
1,800
|
—
|
|
153,430
|
143,369
|
296,799
|
|
Ines Pöschel
Member CGNC
|
77,980
|
67,904
|
1,137
|
4,399
|
|
150,283
|
90,549
|
240,832
|
|
Dieter P. Spälti
Member ARC
|
17,195
|
111,084
|
1,860
|
4,399
|
|
132,678
|
118,217
|
250,895
|
|
Total fees paid in 2019 in USD
|
953,725
|
866,688
|
14,512
|
102,440
|
|
1,922,853
|
1,293,468
|
3,216,321
|
|
Total fees paid in 2019 in CHF
8
|
947,943
|
861,433
|
14,512
|
101,819
|
|
1,911,195
|
1,285,626
|
3,196,820
|
Notes
|
1
|
The amounts include the USD 10,061 (CHF 10,000) on-boarding fee paid in March 2019.
|
|
2
|
The amounts represent the fees paid in cash or the value of tax and, if applicable, social security withheld upon the allocation of shares to be paid in cash to the applicable authorities.
|
|
3
|
The amounts in USD represent the converted value in CHF based on the Alcon shares granted on September 11, 2019 at the closing price of CHF 59.36 per share on the date of grant. The shares granted are listed at the SIX Swiss Exchange.
|
|
4
|
The number of shares reported were delivered to each Board member in the first installment of shares in September 2019. The second and final installment in shares for the services from the Spin-off date April 9, 2019 to the 2020 AGM will be delivered in March 2020.
|
|
5
|
Includes (i) an amount of USD 17,596 for mandatory employer contributions for all Board members paid by Alcon to governmental social security systems, which provides a right to the maximum future insured government pension benefit for the relevant Board members (this amount is a part out of total employer contributions of USD 47,826 to the governmental social security systems) and (ii) USD 84,844 paid to Dr. Cummings (or his related entities) for consulting services, including assistance with clinical trials that Dr. Cummings, as an ophthalmologist, provided to Alcon (these services were unrelated to Dr. Cummings' board service).
|
|
6
|
Fees payable in March 2020, the final installment of the total fees payable for service from the Spin-off to the 2020 AGM, which includes both shares and cash portions.
|
|
7
|
Total fees that will be paid for the Board members' term of office from the Spin-off to the 2020 AGM.
|
|
8
|
The payments in cash were made in Swiss Francs (CHF). For consistency they are reported in USD as all compensation in this 2019 Compensation Report. The amounts in CHF were converted to USD at the exchange rate of 1.0 CHF : 1.0061 USD. All amounts are before deductions of social security contributions and income tax paid by the Board members.
|
|
9
|
Board Committees: “ARC” Audit and Risk Committee; “CGNC” Compensation, Governance and Nomination Committee; “IC” Innovation Committee.
|
Compensation of the Members of the Board of Directors in 2018
Information on compensation of the Board as a company of the Novartis Group in 2018 is not available. Individuals who served as directors of Alcon Inc. from its incorporation in 2018 until the Spin-off date in 2019, during which time it was a company of the Novartis Group, did not receive compensation for their service on the Board.
All members of the current Board of Alcon have taken their office from the Spin-off date of April 9, 2019. No payments (or waivers of claims) were made to them in 2018.
111
Share Ownership of the Board Members
The number of Alcon shares held by members of the Board and “persons closely linked” to them as of December 31, 2019 are set out in the exhibit below. As of this same date, no Board member, either individually or together with “persons closely linked”, owned 1% or more of the outstanding shares of Alcon. The CEO of Alcon and Board member, David J. Endicott, is not included in this exhibit as his share ownership is disclosed in exhibit 21.
Exhibit 26
|
Board member
|
Total shares
|
|
F. Michael Ball
|
13,202
|
|
D. Keith Grossman
|
916
|
|
Lynn D. Bleil
|
1,231
|
|
Arthur B. Cummings
|
787
|
|
Thomas H. Glanzmann
|
2,473
|
|
Scott H. Maw
|
1,705
|
|
Karen J. May
|
1,800
|
|
Ines Pöschel
|
1,679
|
|
Dieter P. Spälti
|
8,860
|
|
Total
|
32,653
|
Additional Disclosures
Loans to Board Members
Alcon’s Articles of Incorporation and corporate policies do not permit loans to current or former members of the Board or to persons closely linked to them. No loans were granted in 2019, and none were outstanding as of December 31, 2019.
Other Payments to Board Members
No payments (or waivers of claims) other than those set out in exhibit 25 (including the related notes) under section "Compensation of the Members of the Board of Directors in 2019" were made to current Board members or to persons closely linked to them.
Persons Closely Linked
Persons closely linked to members of the Board are (i) their spouse, (ii) their children below age 18, (iii) any legal entities that they own or otherwise control, and (iv) any legal or natural person who is acting as their fiduciary or agent.
Payments to Former Board Members
The current members of the Board have served in such capacity since the date of Spin-off, April 9, 2019. The individuals serving as board members of Alcon Inc. from the Company's incorporation in 2018 until April 8, 2019 included F. Michael Ball our current Board Chair and three individuals employed by Novartis. None of these individuals received any additional compensation for service in such capacity.
The payments made to F. Michael Ball as former member of the Executive Committee of Novartis are disclosed in the 2018 and 2019 compensation reports of Novartis AG. His compensation received prior to his term of office as Board Chair of Alcon is not related to Alcon as an independent company. It is therefore not disclosed in this 2019 Compensation Report. He did not receive any compensation for his role as designated Board Chair of Alcon prior to April 9, 2019.
112
Outlook for 2020
Compensation Philosophy and Principles
The Company has developed a compensation philosophy which:
|
•
|
Ensures a broadly competitive level of remuneration appropriate to each executives’ scale of responsibility and individual performance
|
|
•
|
Attracts, retains and motivates a world-class executive team to drive performance
|
|
•
|
Supports long-term value creation for shareholders
|
|
•
|
Considers the geographic and industry-specific nature of our talent pool and the medical device industry
|
|
•
|
Aligns the compensation program for the senior executives with the broader management and employee population
|
|
•
|
Fully embraces Swiss governance expectations and follows principles of simplicity and transparency
|
Exhibit 27
|
Pay for performance
|
•
Programs are designed to compensate short-term performance and long-term success
•
Rewards are achieved if financial and non-financial performance metrics are met
|
|
Alignment with shareholders
|
•
A significant part of compensation is delivered in Alcon equity
•
Executives are expected to hold a meaningful level of Alcon shares
|
|
Market competitiveness
|
•
Overall compensation is competitive with other companies in the medical device and other industries in which Alcon competes for talent
•
Total opportunity is targeted at market median
|
|
Motivation and retention
|
•
Compensation is designed to attract, retain and motivate executives to achieve Company objectives
•
Compensation is reviewed periodically to ensure competitiveness and alignment to key strategic objectives
|
Peer Group
External peer compensation is an important reference point for consideration of market competitive compensation for the members of the ECA, including our CEO. The CGNC adopted a comprehensive approach to peer group construction and, at the onset of Alcon as an independent company, identified a global peer group for executive compensation benchmarking. It provides a good balance of industries, companies and geographies from which executive talent is drawn. The global peer group consists of a blend of both European and North American companies, which are similar in size and scope and compete with Alcon for talent.
The CGNC believes that a consistent and relevant set of peer companies that are similar in size and scope enables shareholders to assess the appropriate levels and practices of compensation and allows for pay-for-performance comparisons. Alcon’s revenue and market capitalization place it at approximately the median of the peer group companies.
113
Exhibit 28
|
Global Peer Group
|
|
|
•
Agilent Technologies Inc.
•
Align Technology Inc.
•
Allergan plc
•
Bausch Health Companies Inc.
•
Baxter International Inc.
•
Becton Dickinson & Company
•
Biogen Inc.
•
Boston Scientific Corporation
•
Dentsply Sirona Inc.
•
Edwards Lifesciences Corporation
|
•
EssilorLuxottica
•
Fresenius Medical Care
•
Givaudan
•
Lonza Group
•
Merck KGaA
•
Smith & Nephew
•
Stryker Corporation
•
The Cooper Companies Inc.
•
UCB
•
Zimmer Biomet Holding Inc.
|

|

|
The CGNC considers compensation practices, structures, and levels based on benchmarking information and advice provided by the committee’s independent external advisors (see more information under the section "Compensation Governance"). The annual total compensation of ECA members is targeted to the market median of benchmarks for comparable roles within this group.
The CGNC and the Board will review the compensation of the CEO and the other ECA members periodically and consider relevant benchmark information. The CGNC will also review periodically the peer group and make adjustments to its composition as appropriate.
ECA Compensation
Based on the Company’s business strategy, the compensation philosophy and framework and the analysis of peer group compensation practices, the Board has adopted the following key features of ECA compensation in 2020:
|
•
|
The overall structure of ECA compensation including annual base salary, variable compensation elements STI and LTI, and benefits will remain unchanged in 2020;
|
|
•
|
Slight adjustments will be made to some ECA member’s total target compensation but overall it will broadly remain unchanged;
|
|
•
|
The 2020 STI payouts will be delivered in cash to align it with peer group compensation practices;
|
|
•
|
The LTI award target percent of the CEO will be increased, to align his total compensation with the median of the peer group;
|
|
•
|
An additional profitability funding mechanism will be added to the current STI metrics to align the measurements better with company performance;
|
|
•
|
The performance metrics of the 2019-2021 LTI cycle will also be used for the performance measurement of the 2020-2022 LTI cycle (group net sales CAGR; Core EPS CAGR; Share of Peers; and Innovation);
|
|
•
|
The robust share ownership requirements will continue to apply; and
|
|
•
|
There will be no material change to benefit provisions.
|
114
Board Compensation
The Board compensation framework will remain broadly unchanged for the upcoming term of office from the 2020 AGM to the 2021 AGM, including:
|
•
|
The overall framework of Board compensation from Spin-off date in 2019 to the 2020 AGM will be carried forward to the term from the 2020 AGM to 2021 AGM;
|
|
•
|
The Board Chair fee will remain unchanged;
|
|
•
|
The payment of fifty percent in shares (mandatory) and a voluntary election of a higher percentage in shares will continue; and
|
|
•
|
As a result of the split of the CGNC into two separate committees, fees for an additional Board committee Chair and members will be added to the Board compensation framework.
|
During 2020, the Board intends to undertake a comprehensive review of the compensation of its members, including the Board Chair, based on an assessment of the benchmark data of a peer group and on advice regarding compensation practices prepared by its external advisors.
Effective as of the date of our 2020 AGM, the Board has split the current responsibilities of the Compensation, Governance and Nomination Committee (CGNC) into two separate committees. The Board recognized the heavy workload assigned to the CGNC since the Spin-off from Novartis; this split will enable the two newly created committees to better focus on their respective key responsibilities. For the Governance and Nomination Committee, this includes a focus on leading governance practices and ESG topics in general. And for the new Compensation Committee, this includes a focus on human resource strategy and executive compensation. Finally, this reorganization is in line with best corporate governance standards. The annual fee for the Chair of the Governance and Nomination Committee will be USD 50,305 (CHF 50,000), and each member will receive USD 25,153 (CHF 25,000). The Compensation Committee will retain the current levels of Chair and member fees of USD 50,305 (CHF 50,000) and USD 25,153 (CHF 25,000) respectively. These committee fees will be included in the budget of Board compensation from the 2020 AGM to the 2021 AGM, subject to approval by the binding vote of shareholders at the 2020 AGM.
Shareholder Vote at the 2020 AGM
In accordance with Article 29 of the Articles of Incorporation (http://investor.alcon.com/governance//default.aspx), the Board will ask shareholders at the 2020 AGM meeting to cast a binding vote on:
|
•
|
The aggregate amount of compensation payable to non-executive members of the Board for their term of office from the 2020 AGM to the 2021 AGM;
|
|
•
|
The aggregate amount of compensation payable to ECA members in the financial year 2021.
|
In addition, the Board will ask shareholders to cast an advisory vote on the 2019 Compensation Report.
The procedures of voting on the compensation of ECA members and the Board are defined in our Articles of Incorporation. Our Articles allow for an additional amount of compensation to be used when promoting or adding new members to the ECA.
115
The exhibit below depicts the voting at the 2020 AGM and the respective period of the compensation affected by the vote.
Exhibit 29
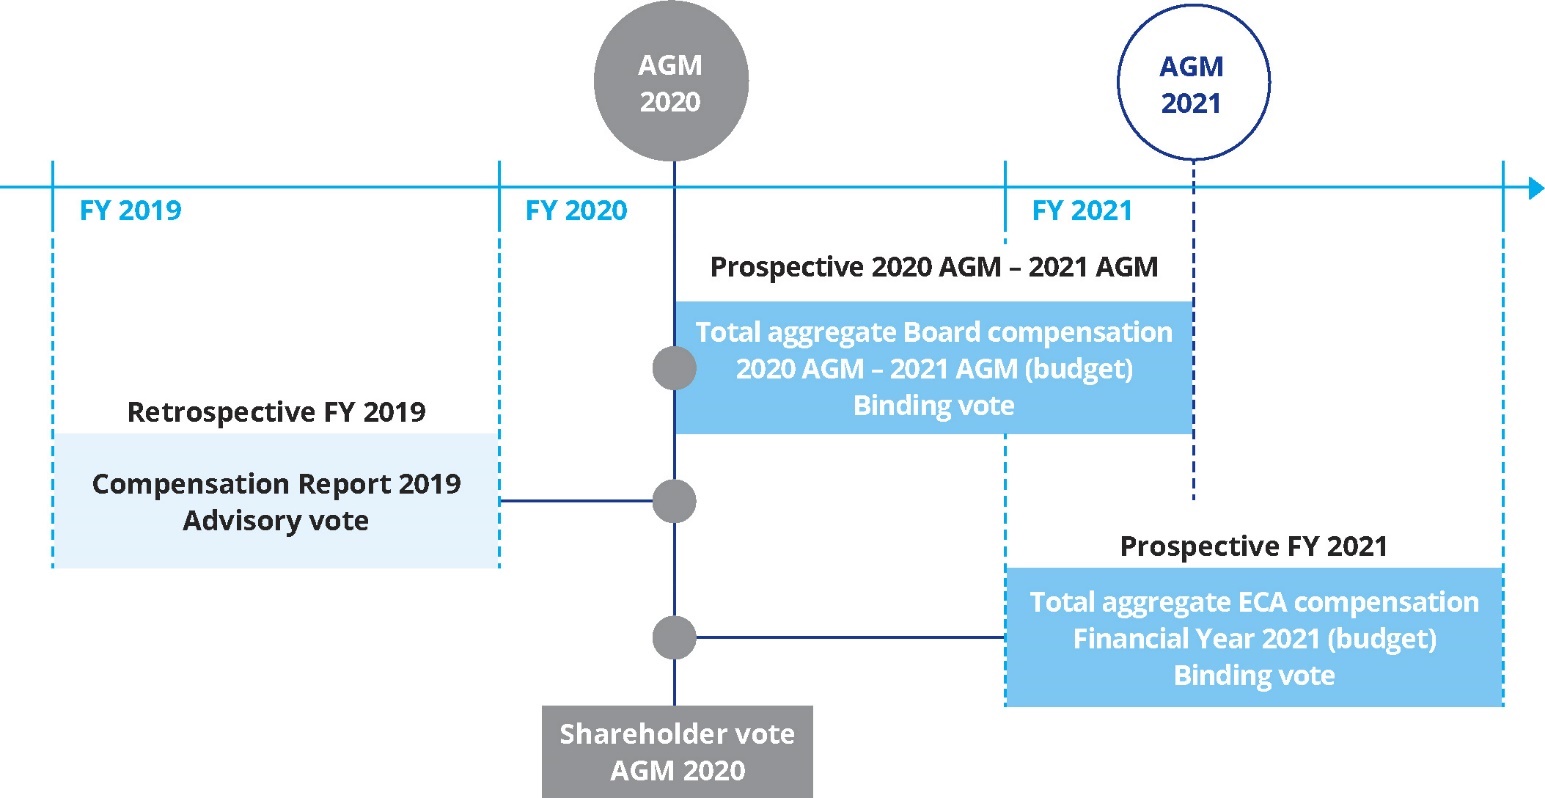
116
(This page has been left blank intentionally.)
117
|
6.C.
|
BOARD PRACTICE
|
Corporate Governance
Group Structure and Shareholders
Operational Group Structure
The Company, with its registered office at Rue Louis-d’Affry 6, 1701 Fribourg, Switzerland, is a corporation organized under Swiss law and is the ultimate parent company of Alcon. As of December 31, 2019, the market capitalization of the Company was $27.622 billion (CHF 26.758 billion).
Alcon is the largest eye care company in the world, with $7.4 billion in net sales during the year ended December 31, 2019. We research, develop, manufacture, distribute and sell a full suite of eye care products within two key businesses: Surgical and Vision Care. Our Surgical business is focused on ophthalmic products for cataract surgery, vitreoretinal surgery, refractive laser surgery and glaucoma surgery. Our Vision Care business comprises various contact lenses and a comprehensive portfolio of ocular health products, including devices and over-the-counter products for dry eye, contact lens care and ocular allergies, as well as ocular vitamins and redness relievers. Further information is available under "Item 4. Information on the Company".
Listed and Non-listed Companies Belonging to the Alcon Group
The registered shares of the Company are listed on the SIX Swiss Exchange (Valor 43249246 / ISIN code CH0432492467) and the New York Stock Exchange (CUSIP code H01301128). The Company owns directly or indirectly all consolidated entities of Alcon, none of which has its shares otherwise listed.
The following table lists the most significant subsidiaries of the Company, being those entities with total assets or net sales to third parties in excess of 5% of the Company’s consolidated total assets or net sales to third parties, as applicable, at December 31, 2019. The referenced share capital may not reflect the taxable share capital and does not include any paid in surplus. Further information regarding the Company’s subsidiaries is disclosed in Note 28 of the Consolidated Financial Statements. The combination of the Company’s subsidiaries disclosed in the table below and in Note 28 of the Consolidated Financial Statements does not cover all subsidiaries of the Company.
|
Country of Organization/ Entity Name
|
Equity Interest
|
Principal Place of Business
|
Share Capital
|
|
Japan
|
|||
|
Alcon Japan Ltd.
|
100%
|
Tokyo
|
JPY 500,000,000
|
|
Switzerland
|
|||
|
Alcon Pharmaceuticals Ltd.
|
100%
|
Fribourg
|
CHF 200,000
|
|
United States
|
|||
|
Alcon Finance Corporation
|
100%
|
Fort Worth, TX
|
USD 1
|
|
Alcon Laboratories, Inc.
|
100%
|
Fort Worth, TX
|
USD 1
|
|
Alcon Research, LLC
|
100%
|
Fort Worth, TX
|
USD 12.5
|
|
Alcon Vision, LLC
|
100%
|
Fort Worth, TX
|
USD 1,000
|
Significant Shareholders
According to the Alcon share register, the following nominee shareholders held more than 3% of the share capital of Alcon Inc. as of December 31, 2019:
|
Holder
|
Number of Shares
|
Percentage
|
|
|
Chase Nominee Ltd., London (UK)
|
84,771,429
|
17.24%
|
|
|
Cede & Co (DTC nominee), New York, NY (USA)
|
82,425,818
|
16.76%
|
|
In addition, according solely to disclosure of shareholdings notifications filed with Alcon and the SIX Swiss Exchange ("SIX Threshold Notifications") pursuant to the obligations set forth in the Swiss Federal Act on Financial Market Infrastructure and
118
Market Conduct in Securities and Derivatives Trading ("FMIA") and the rules and regulations promulgated thereunder, there are three shareholders that held shares representing at least 3% of the Company’s total share capital as of December 31, 2019, but were not registered with the Alcon share register. Those three shareholders are identified in the table below.
The information required to be included in the SIX Threshold Notifications regarding these shareholders varies from the information required to be included in beneficial ownership statements filed with the SEC (“SEC Notifications”).
Interested persons can access the relevant SIX Threshold Notifications online at the SIX Swiss Exchange:https://www.six-exchange-regulation.com/en/home/publications/significant-shareholders.html.
The below table shows the information available to the Company, based on both notification regimes, with respect to shareholders reported to have significant positions in Alcon’s share capital as of December 31, 2019:
|
Holder
|
Number of shares and voting rights as per SIX Threshold Notification
|
Percentage as per SIX Threshold Notification
1
|
Number of shares beneficially owned as per SEC Notification
2
|
Percentage as per SEC Notification
3
|
|
|
T. Rowe Price Associates, Inc. 100 East Pratt Street, Baltimore, MD 21202
|
26,641,206
4
|
5.45 %
|
49,485,411
5
|
10.1 %
|
|
|
The Capital Group Companies, Inc.
333 South Hope Street, Los Angeles, CA 90071
|
25,357,346
6
|
5.19 %
|
31,824,542
7
|
6.5 %
|
|
|
BlackRock, Inc. c/o BlackRock Investment Management (UK) Limited 12 Throgmorton Ave, London, EC2N 2DL, UK
|
24,679,231
8
|
5.06 %
|
--
|
--
|
|
|
1
|
Percentages indicated in this column have been established based on the share capital of the Company registered with the commercial register of the Canton of Fribourg on the date on which the respective disclosure obligation pursuant to the FMIA was triggered. Furthermore, according to the FMIA, these shareholders are required to notify Alcon and the SIX Swiss Exchange only at the time they reach, exceed or fall below any of the thresholds set forth in the FMIA; therefore, their shareholding as of December 31, 2019 may differ from the figures indicated as per the contents of the relevant SIX Threshold Notifications.
|
|
2
|
In general, under SEC rules, "beneficial ownership", for the purposes of this column, refers to shares that an entity had the power to vote or the power to dispose of, and shares that such entity or individual had the right to acquire within 60 days after December 31, 2019.
|
|
3
|
Percentage ownership is calculated by dividing the number of shares reported as beneficially owned by such entity by the 488,349,066 shares of our common stock outstanding as of January 31, 2020.
|
|
4
|
Based solely on a SIX Threshold Notification dated May 1, 2019.
|
|
5
|
Based solely on a Statement on Schedule 13G filed on January 10, 2020. Such filing indicates that T. Rowe Price Associates, Inc. has sole voting power with respect to 17,419,268 shares and sole dispositive power with respect to 49,485,111 shares.
|
|
6
|
Based solely on a SIX Threshold Notification dated October 25, 2019.
|
|
7
|
Based solely on a Statement on Schedule 13G filed on February 14, 2020. Such filing indicates that The Capital Group Companies, Inc. has sole voting power with respect to 31,808,983 shares and sole dispositive power with respect to 31,824,542 shares.
|
|
8
|
Based solely on a SIX Threshold Notification dated November 9, 2019. This figure does not include its derivative position.
|
Cross-Shareholdings
Neither the Company nor any of its consolidated entities has any shareholdings exceeding 5% of the holdings of capital or voting rights in any entity that also has shareholdings exceeding 5% of the holdings of the capital or voting rights in the Company or any of its consolidated entities.
Capital Structure
Share Capital
As of December 31, 2019, the share capital of Alcon Inc. was CHF 19,668,000, fully paid-in and divided into 491,700,000 registered shares, each with a nominal value of CHF 0.04.
119
Authorized and Conditional Share Capital
On January 29, 2019, the Company’s annual general meeting approved the creation of an authorized share capital. According to this shareholder resolution, the Board was authorized, at any time until January 29, 2021, to increase the Company’s share capital by a maximum of CHF 977,400 through the issue of up to 24,435,000 fully paid up new shares of CHF 0.04 nominal value each for the purpose of any share-based incentive or other participation plans, schemes or arrangements for directors, associates or advisors of the Company or its consolidated subsidiaries (“Employees Participation Plans”). Additional terms and conditions of this authorized share capital are set forth in Article 4a of the Articles of Incorporation (http://investor.alcon.com/governance//default.aspx).
The Board resolved on November 19, 2019 to increase the share capital by CHF 120,000 through the issuance of 3,000,000 new registered shares under the authorized share capital in order to comply with Alcon’s obligations under the relevant Employees Participation Plans. These new shares were listed on December 4, 2019.
As of December 31, 2019, the Board remained authorized, at any time until January 29, 2021, to further increase the Company’s share capital by a maximum of CHF 857,400 through the issue of up to 21,435,000 fully paid up new shares of CHF 0.04 nominal value each for the purpose of any Employees Participation Plans.
The Company did not have any conditional share capital available on December 31, 2019.
Changes in Capital
The Company was formed on September 21, 2018 with a share capital of CHF 100,000 divided into 2,500,000 registered shares with a nominal value of CHF 0.04 each. In view of the contemplated Spin-off from the Novartis group, the Company’s share capital was increased on January 29, 2019 to amount to CHF 19,548,000 divided into 488,700,000 registered shares with a par value of CHF 0.04 each. Following the increase through the authorized share capital, as described above under
“Authorized and conditional share capital”
, the share capital of the Company was, as of December 31, 2019, CHF 19,668,000 divided into 491,700,000 registered shares.
No other historical data is available regarding changes in capital during the last three financial years.
Shares, Participation Certificates and Profit-sharing Certificates
The Company has a single class of shares, being registered shares in the form of uncertificated securities (in the sense of the Swiss Code of Obligations). A portion of these uncertificated shares is issued as intermediated securities (
titres intermédiés
) within the meaning of the Swiss Federal Intermediated Securities Act via the settlement system operated by SIX SIS, with the remaining shares directly held through Computershare Trust Company, N.A. in the U.S. (including shares held through Computershare Trust Company, N.A. at DTC). All Alcon shares have equal voting rights and carry equal entitlements to dividends. No participation certificates (
bons de participations
) or profit-sharing certificates (
bons de jouissance
) have been issued.
Based solely upon shares registered in the Alcon share registry, as of December 31, 2019, approximately 16.7% of the Company's total share capital was held in Switzerland by 95,198 registered shareholders.
Limitations on Transferability and Nominees Registrations
The Articles of Incorporation of the Company do not provide for any limitation on transferability of shares or nominees registration.
Convertible Bonds and Options
As of December 31, 2019, Alcon did not have any convertible bonds, warrants, options or other securities granting rights to Alcon shares.
120
Board of Directors
Composition
The Board consists of eight to 13 members according to the Articles of Incorporation. As of December 31, 2019, the size of the Board was 10 members and the Board was comprised of the following members:

|
F. Michael Ball, Chairman
F. Michael Ball held the position of Chief Executive Officer of the Alcon Division and served as a member of the Novartis Executive Committee from February 1, 2016 until June 30, 2018. He previously served as Chief Executive Officer of Hospira, Inc. from 2011 to 2015. Prior to that, Mr. Ball held a number of senior leadership positions at Allergan, Inc., including President from 2006 to 2011. Before joining Allergan, Inc. in 1995, he held roles of increasing responsibility in marketing and sales at Syntex Corporation and Eli Lilly & Co. He has served on the board of the ICO Foundation since January 2016. Mr. Ball served on the board of directors of several organizations, including Kythera Biopharmaceuticals Inc., Hospira, Inc., IntraLase Corp., AdvaMed and sTec, Inc. He began his career in the healthcare industry in 1981.
He holds a Bachelor of Science and a Master of Business Administration from Queen’s University in Canada.
|
|
Age:
64
Nationality:
American
Year of initial
appointment: 2019
Expiration of current
term of office: 2020 |
|

|
Lynn D. Bleil
Lynn D. Bleil has been a member of the boards of directors of Stericycle, Inc. since 2015 (where she chairs the Nominating & Governance Committee), Sonova Holding AG since 2016, and Amicus Therapeutics, Inc. since 2018. Ms. Bleil has also served on the advisory boards of private healthcare companies, including Navigen Pharmaceuticals and Halo Neuroscience since 2016. She is a former member of the board of directors of DST Systems Inc and Auspex Pharmaceuticals (until their sale to SS&C Technologies) and Teva Pharmaceuticals. She also has served as vice chair of the governing board of Intermountain’s Park City Hospital since 2014. From 1985 through 2013, Ms. Bleil was a Senior Partner at McKinsey & Company where she led the West Coast healthcare practice and advised CEOs and boards of directors in the healthcare and life sciences industry.
Ms. Bleil holds a Bachelor of Science in Chemical Engineering from Princeton University, U.S., and a Master of Business Administration from the Stanford Graduate School of Business, U.S.
|
|
Age:
56
Nationality:
American
Year of initial
appointment: 2019
Expiration of current
term of office: 2020 |
|
121

|
Arthur Cummings, M.D.
Arthur Cummings, M.D., has been Consultant Ophthalmologist at Beacon Hospital, since 2007, and Owner and Medical Director at Wellington Eye Clinic, since 1998, both in Dublin, Ireland. Also, he has been Owner of Arthur Cummings Eye Clinic Ltd. since 2014 and a member of the board of directors of Beacon Audiology Ltd. since 2015.
Dr. Cummings holds a Bachelor of Science in Medicine and Surgery (MB. ChB.), and a Master of Medicine in Ophthalmology (M. Med) from the University of Pretoria, South Africa. Dr. Cummings is a Fellow of the College of Surgeons in South Africa (FCS SA) in Ophthalmology, and a Fellow of the Royal College of Surgeons of Edinburgh (FRCSEd) in Ophthalmology.
|
|
Age:
57
Nationality:
Irish and South African
Year of initial
appointment: 2019
Expiration of current
term of office: 2020 |
|

|
David J. Endicott
David J. Endicott is the Chief Executive Officer of the Alcon Group. He joined the Alcon Division, when still operating under the Novartis group, in July 2016 as President, Commercial and Innovation, and Chief Operating Officer. Prior to joining the Alcon Division in 2016, Mr. Endicott was President of Hospira Infusion Systems, a Pfizer company. Before joining Hospira, Mr. Endicott served as an officer and executive committee member of Allergan, Inc. where he spent more than 25 years of his career in leadership roles across Europe, Asia and Latin America, as well as the U.S. Mr. Endicott served on the board of directors of Zeltiq, Inc. and Orexigen Therapeutics, Inc. He currently serves on the board of AdvaMed.
He holds an undergraduate degree in Chemistry from Whitman College and a Master’s degree in Business Administration from the University of Southern California, both in the United States.
|
|
Age:
54
Nationality:
American
Year of initial
appointment: 2019
Expiration of current
term of office: 2020 |
|
122

|
Thomas Glanzmann
Thomas Glanzmann is the Founder and has been a Partner at Medtech Ventures Partners since 2016. He has been a member of the board of directors of Grifols S.A. since 2006, including serving as Vice Chairman since 2017, and a member of the healthcare advisory board of Madison Dearborn Partners, LLC since 2011. He is also Chairman of Glanzmann Enterprises AG. He was President and Chief Executive Officer of Gambro AB from 2006 to 2011, and Chief Executive Officer and Managing Director of HemoCue AB from 2005 to 2006. Mr. Glanzmann was Senior Advisor to the Executive Chairman and Acting Managing Director of the World Economic Forum from 2004 to 2005. From 1988 to 2004, Mr. Glanzmann worked in various positions at Baxter International Inc., including President of Baxter Bioscience, Chief Executive Officer of Immuno International Co., Ltd. and President of Europe Biotech Group. In 2004, he was a Senior Vice President and Corporate Officer of Baxter AG.
He holds a Bachelor of Science in Political Science from Dartmouth College, U.S., a Master of Business Administration from the IMD Business School, Switzerland and a Board of Directors Certification from the UCLA Anderson School of Management, U.S.
|
|
Age:
61
Nationality:
Swiss
Year of initial
appointment: 2019
Expiration of current
term of office: 2020 |
|

|
D. Keith Grossman
D. Keith Grossman has been the Chairman, Chief Executive Officer, and President of Nevro, Inc. since March 2019. He has also been Chairman of the board of directors of Outset Medical, Inc. since 2014 and a member of the board of directors of ViewRay, Inc. since 2018. He was President and Chief Executive Officer of Thoratec Corporation from 1996 to 2006 and from 2014 to 2015, and was a member of the board of directors from 1996 to 2015. Mr. Grossman was Chief Executive Officer and a member of the board of directors at Conceptus, Inc. from 2011 to 2013. He was Managing Director and Senior Advisor at TPG Capital, L.P. from 2007 to 2011. Mr. Grossman also served as a member of the board of directors of Zeltiq, Inc., as Lead Director, from 2013 to 2017, of Intuitive Surgical, Inc. from 2004 to 2010 and of Kyphon Inc. in 2007, and served on a number of private boards of directors.
Mr. Grossman holds a Bachelor of Science in Animal Sciences from The Ohio State University, U.S., and Master of Business Administration in Finance from Pepperdine Graziadio Business School at Pepperdine University, U.S.
|
|
Age:
59
Nationality:
American
Year of initial
appointment: 2019
Expiration of current
term of office: 2020 |
|
123

|
Scott Maw
Scott Maw has been managing director of WestRiver Group since September 2019. Previously, he was Executive Vice President and Chief Financial Officer at Starbucks Corporation from 2014 until the end of 2018. He was also Senior Vice President in Corporate Finance at Starbucks Corporation from 2012 to 2013, and Senior Vice President and Global Controller from 2011 to 2012. Since 2016, he has been a member of the board of directors of Avista Corporation, and since 2019, a member of the board of directors of Chipotle Mexican Grill Inc. Mr. Maw is also member of the board of trustees of Gonzaga University. From 2010 to 2011, he was Senior Vice President and Chief Financial Officer of SeaBright Holdings, Inc. From 2008 to 2010, he was Senior Vice President and Chief Financial Officer of the Consumer Bank at JP Morgan Chase and Company. Prior to this, Mr. Maw held leadership positions in finance at Washington Mutual, Inc. from 2003 to 2008, and GE Capital from 1994 to 2004.
Mr. Maw holds a Bachelor of Business Administration in Accounting from Gonzaga University,
|
|
Age:
52
Nationality:
American
Year of initial
appointment: 2019
Expiration of current
term of office: 2020 |
|

|
Karen May
Karen May has been a member of the board of directors of Ace Hardware Corporation, where she is Chair of the Audit Committee, since 2017. Previously, Ms. May was on the board of directors of MB Financial, Inc., where she served as Chair of the Compensation Committee until 2019. From 2012 to 2018, she was Executive Vice President and Chief Human Resources Officer at Mondelez International, Inc. (name changed from Kraft Foods, Inc. after the spin-off of selected Kraft North American businesses in 2012). From 2005 to 2012, Ms. May was the Executive Vice President and Chief Human Resources Officer of Kraft Foods, Inc. Between 1990 and 2005, she held various positions in Human Resources and Finance at Baxter International Inc., including Corporate Vice President and Chief Human Resources Officer and Vice President, International Finance. Prior to Baxter International Inc., Ms. May was a Certified Public Accountant in the audit practice of Price Waterhouse.
Ms. May holds a Bachelor of Science in Accounting from the University of Illinois, U.S., and was a licensed Certified Public Accountant in the U.S. from 1980 to 1990.
|
|
Age:
61
Nationality:
American
Year of initial
appointment: 2019
Expiration of current
term of office: 2020 |
|
124

|
Ines Pöschel
Ines Pöschel has been a Partner at Kellerhals Carrard Zurich KIG since 2007. She has been a member of the board of directors of Implenia AG since 2016 and Graubündner Kantonalbank since 2018, and serves on the board of directors of the non-listed Swiss companies of Reichle Holding, Wirz Partner Holding and Bioengineering Holding. Ms. Pöschel is also a member of the Swiss Federal expert commission for commercial register. From 2002 to 2007, Ms. Pöschel was a Senior Associate at Bär & Karrer AG. She was a Senior Manager at Andersen Legal LLC from 1999 to 2002.
Ms. Pöschel has a Master in Law from the University of Zurich, Switzerland, and passed the Swiss Bar Exam in 1996.
|
|
Age:
51
Nationality:
Swiss
Year of initial
appointment: 2019
Expiration of current
term of office: 2020 |
|

|
Dieter Spälti, Ph.D.
Dieter Spälti has been Chief Executive Officer and a member of the board of directors at Spectrum Value Management Ltd., Switzerland since 2006. He was Managing Partner from 2002 to 2006. He has been a member of the board of directors at LafargeHolcim Ltd. since 2003. He has also been a member of the board of directors at SCI (Schweizerische Cement Industrie AG) since 2003. Dr. Spälti has been Chairman of the board of directors at Dorsay Development Corporation, Canada, since 2003. He has also served as Vice Chairman of the board of directors at Grand Resort Bad Ragaz AG, Switzerland, since 2005 and Vice Chairman of the board of directors at IHAG Holding AG, Switzerland, since 2002. Dr. Spälti served, or continues to serve, on the board of directors of various non-listed Swiss and international companies that are controlled by the same beneficial owner. Dr. Spälti was a Partner at McKinsey and Company from 1993 to 2001.
He holds a Ph.D. in Law from the University of Zurich, Switzerland.
|
|
Age:
58
Nationality:
Swiss
Year of initial
appointment: 2019
Expiration of current
term of office: 2020 |
|
125
Independence and Executive Function
Independence of Board members is a key element of Alcon’s corporate governance framework. Therefore, Alcon has developed a strong set of independence criteria for its board members based on international best practice standards, including the Swiss Code of Best Practices for Corporate Governance and the NYSE standards, which can be found in the Alcon Board Regulations, available under the investor relations portion of the Alcon website (https://investor.alcon.com/governance/governance/default.aspx).
The Board assesses the independence of its Board members on a regular basis, at least annually. As of December 31, 2019, all Board members qualified as independent, except for F. Michael Ball, David J. Endicott and Dr. Arthur Cummings.
Other than (i) F. Michael Ball, who previously served as Chief Executive Officer of the Alcon Division of Novartis and as a member of the Novartis Executive Committee from February 1, 2016 until June 30, 2018 and (ii) David J. Endicott, who currently serves as Alcon’s Chief Executive Officer, no Board member was a member of the management of the Company or any other Alcon consolidated subsidiary in the last three financial years up to December 31, 2019.
Other than Dr. Arthur Cummings, who, in his capacity as an ophthalmologist, provides certain consulting services, including assistance with various clinical trials, to Alcon, no Board member has a significant business relationship with the Company or with any other Alcon consolidated subsidiary.
David J. Endicott is an executive member of the Board of Directors by reason of his function as Chief Executive Officer of Alcon. All other members of the Board are non-executive directors since none of them carries out operational management tasks within Alcon.
Limitations of Number of Mandates
No member of the Board may hold more than 10 additional mandates in other companies, of which no more than four shall be in other listed companies. Chairs of the board of directors of other listed companies count as two mandates. Mandates in different legal entities which are under joint control are deemed one mandate. Further details can be found in Article 34 of the Articles of Incorporation, available under https://investor.alcon.com/governance/governance/default.aspx.
Elections and Terms of Office
The Board members, the Chair of the Board of Directors and the members of the Compensation Committee shall be elected individually by the General Meeting of Shareholders for a term of office lasting until completion of the next Annual General Meeting of Shareholders.
There is no mandatory term limit for Board members.
Internal Organizational Structure
General Principles and Areas of Responsibilities
The Board constitutes itself in compliance with legal requirements and taking into consideration the resolutions of the General Meeting of Shareholders. It shall elect one or two Vice-Chairs. It shall appoint a secretary, who need not be a member of the Board of Directors.
The Board is the ultimate governance body of the Company, under the leadership of the Chairman. F. Michael Ball has been the Chairman of the Board since the Spin-off from Novartis. In this role, Mr. Ball leads the Board to represent the interests of all stakeholders. The Vice Chair has been held by D. Keith Grossman, also acting in this role as the Senior Independent Director. The duties of Mr. Ball and Mr. Grossman in their respective functions are laid out in Articles 20 and 21, respectively, of the Alcon Board Regulations.
126
The Board is responsible for the duties assigned to it by the Articles of Incorporation and the Alcon Board Regulations, which include the overall direction and supervision of management. It holds the ultimate decision-making authority for Alcon, with the exception of any decisions reserved to the shareholders. In performing its tasks, the Board follows the highest standards of ethics, integrity and governance. It undertakes annually a self-assessment process to evaluate its performance, the performance of its committees and the individual performance of its members.
Within the limits of the law and the Articles of Incorporation, the Alcon Board has delegated certain of its duties to the Executive Committee and the Board’s Committees.
Delegation to the Executive Committee
The Alcon Board has delegated to the Executive Committee the management of the business in accordance with the terms set forth in the Alcon Board Regulations. Such delegation has been formalized in Article 12 of the Alcon Board Regulations and further regulated in a set of internal regulations. Under the lead of the Chief Executive Officer, the Executive Committee is responsible for the management of the business and functions as a coordination committee, independent of any legal entity of the Alcon Group. A non-exhaustive list of the duties assigned to the Executive Committee can be found in Article 23 of the Alcon Board Regulations.
Delegation to the Board’s Committees
The Board’s Committees enable the Alcon Board to work in an efficient and effective manner, ensuring a thorough review and discussion of issues, while giving the Alcon Board more time for deliberation and decision-making. For this purpose, the Alcon Board has delegated certain of its duties to each of its three permanent committees, i.e. the Audit and Risk Committee, the Compensation, Governance and Nomination Committee and the Innovation Committee.
Details of the duties and responsibilities of each committee can be found in the respective committee’s charter, contained in the Alcon Board Regulations, available under https://investor.alcon.com/governance/governance/default.aspx.
In 2019, the composition of the respective Board’s Committees was as follows:
|
Name
|
Audit and Risk Committee
|
Compensation, Governance and
Nomination Committee |
Innovation Committee
|
|
F. Michael Ball
|
|||
|
Lynn D. Bleil
|
Member
|
Member
|
|
|
Arthur Cummings
|
Member
|
||
|
David J. Endicott
|
|||
|
Thomas Glanzmann
|
Member
|
Chair
|
|
|
D. Keith Grossman
|
Member
|
Member
|
|
|
Scott Maw
|
Chair
|
||
|
Karen May
|
Member
|
Chair
|
|
|
Ines Pöschel
|
Member
|
||
|
Dieter Spälti
|
Member
|
||
On February 18, 2020, the Board approved the split of the Compensation, Governance and Nomination Committee (“CGNC”) into two distinct committees, a Compensation Committee (“CC”) and a Governance and Nomination Committee (“GNC”). The Board recognized the heavy workload assigned to the CGNC since the Spin-off from Novartis; this split will enable the two newly created committees to better focus on their respective key responsibilities. For the Governance and Nomination Committee, this includes a focus on leading governance practices and ESG topics in general. And for the new Compensation Committee, this includes a focus on human resource strategy and executive compensation. Finally, this reorganization is line with best corporate governance standards. The split will be effective as of the date of our 2020 AGM.
127
Audit and Risk Committee
The Audit and Risk Committee consisted of four members in 2019, all of whom were determined by the Board of Directors as being independent and in possession of the financial literacy and accounting or related financial management expertise, as defined in the NYSE standards. The Audit and Risk Committee meets and consults regularly with the management, the Alcon Internal Audit function, the independent external auditors and external consultants. The Audit and Risk Committee regularly reports to the full Board on its decisions and deliberations.
The primary responsibilities of this committee include:
|
•
|
Supervising external auditors, and selecting and nominating external auditors for election at the Annual General Meeting of shareholders
|
|
•
|
Overseeing internal auditors
|
|
•
|
Overseeing accounting policies, financial controls, and compliance with accounting and internal control standards
|
|
•
|
Approving quarterly financial statements and financial results releases
|
|
•
|
Overseeing internal control and compliance processes and procedures
|
|
•
|
Overseeing compliance with laws, and external and internal regulations
|
|
•
|
Ensuring that Alcon has implemented an appropriate and effective risk management system and process
|
|
•
|
Ensuring that all necessary steps are taken to foster a culture of risk-adjusted decision-making without constraining reasonable risk-taking and innovation
|
|
•
|
Approving guidelines and reviewing policies and processes
|
|
•
|
Reviewing with management, internal auditors and external auditors the identification, prioritization and management of risks; the accountabilities and roles of the functions involved in risk management; the risk portfolio; and the related actions implemented by management.
|
Compensation, Governance and Nomination Committee
The Compensation, Governance and Nomination Committee consisted of four members in 2019, all of whom were determined by the Board of Directors as being independent. The Compensation, Governance and Nomination Committee meets and consults regularly with management and external consultants. The Compensation, Governance and Nomination Committee regularly reports to the full Board on its decisions and deliberations.
The primary responsibilities of this committee include:
|
•
|
Designing, reviewing and recommending corporate governance principles to the Alcon Board
|
|
•
|
Identifying candidates for election as Directors
|
|
•
|
Assessing existing Directors and recommending to the Alcon Board whether they should stand for re-election
|
|
•
|
Preparing and reviewing the succession plan for the Chief Executive Officer of Alcon
|
|
•
|
Developing and reviewing an onboarding program for new Directors, and an ongoing education plan for existing Directors
|
|
•
|
Reviewing on a regular basis the Articles of Incorporation with a view to reinforcing shareholder rights
|
|
•
|
Reviewing on a regular basis the composition and size of the Alcon Board and its committees
|
|
•
|
Reviewing annually the independence status of each Director
|
|
•
|
Reviewing directorships and agreements of Directors for conflicts of interest, and dealing with conflicts of interest
|
|
•
|
Overseeing Alcon strategy and governance on corporate responsibility
|
|
•
|
Designing, reviewing and recommending to the Alcon Board compensation policies and programs
|
|
•
|
Advising the Alcon Board on the compensation of Directors and the Chief Executive Officer of Alcon
|
|
•
|
Determining the compensation of ECA members
|
|
•
|
Preparing the annual compensation report and submitting it to the Alcon Board for approval.
|
Innovation Committee
The Innovation Committee consisted of four members in 2019. The Innovation Committee meets and consults regularly with management. The Innovation Committee regularly reports to the full Board on its decisions and deliberations.
The primary responsibilities of this committee include:
|
•
|
Providing counsel and know-how to the Alcon Board and management in the area of technology, application of technology and new business models
|
|
•
|
Assisting the Alcon Board with oversight and evaluation of management’s development and implementation of Alcon technology and innovation strategies and its alignment with Alcon overall strategy and objectives
|
|
•
|
Informing the Alcon Board on a periodic basis about emerging scientific trends, research and development programs and opportunities and activities critical to the success of the Alcon product development pipeline
|
|
•
|
Advising the Alcon Board on scientific, technological and research development matters
|
128
|
•
|
Reviewing and discussing significant emerging science and technology issues and trends
|
|
•
|
Reviewing such other matters in relation to Alcon research and development, technology and innovation programs as the committee may, in its own discretion, deem desirable in connection with its responsibilities
|
Frequency, duration and attendance of the meetings of the Board of Directors and its Committees
The Board of Directors and its Committees are convened as often as the conduct of the business may require. The Charters of the respective committees set forth the minimum number of meetings required for a full calendar year.
In 2019, the Board of Directors and its Committees met as follows:
|
Board of Directors
|
Audit and Risk
Committee |
Compensation,
Governance and Nomination Committee |
Innovation
Committee |
|
|
Number of meetings
1
|
6
|
6
|
6
|
3
|
|
Approximate average duration
2
|
6 hrs 35 min
|
2 hrs 20 min
|
1 h 50 min
|
2 hrs
|
|
Overall attendance
|
98%
|
96%
|
100%
|
100%
|
The members of the Board of Directors and its Committees attended the respective meetings as follows:
|
Meeting attendance
|
Board of Directors
|
Audit and Risk
Committee |
Compensation,
Governance and Nomination Committee |
Innovation
Committee |
|
Number of Meetings
6 |
Number of Meetings
6 |
Number of Meetings
6 |
Number of Meetings
3 |
|
|
F. Michael Ball
|
6
|
|||
|
Lynn D. Bleil
|
5
|
6
|
3
|
|
|
Arthur Cummings
|
6
|
3
|
||
|
David J. Endicott
|
6
|
|||
|
Thomas Glanzmann
|
6
|
6
|
3
|
|
|
D. Keith Grossman
|
6
|
6
|
3
|
|
|
Scott Maw
|
6
|
6
|
||
|
Karen May
|
6
|
6
|
6
|
|
|
Ines Pöschel
|
6
|
6
|
||
|
Dieter Spälti
|
6
|
5
|
||
|
1
|
The
number of meetings includes physical meetings as well as meetings held through videoconference or conference call, but excludes any meetings prior to April 9, 2019, the effective date of the current Board of Directors' appointment.
|
|
2
|
The approximate average duration does not include dinners, lunches and breaks. Meetings held through videoconference or conference calls had in principle a shorter duration than physically held meetings.
|
129
Information and Control System of the Board vis-à-vis the Management
The Alcon Board ensures that it receives through several channels sufficient information from the Executive Committee to perform its supervisory duties and to make the decisions that are reserved to it by law, i.e. its non-delegable decisions.
Information to the Board of Directors
Prior to Alcon’s Spin-off from Novartis in April of 2019, the designated Directors for the new company met with Alcon management for a series of multi-day onboarding sessions. These sessions served to introduce the designated Directors to the ECA and key management personnel; provided information about the company’s products in a hands-on fashion; and provided in-depth presentations on the company’s strategy, control mechanisms, risks and opportunities. Among other matters, the designated Directors received in-depth briefings on: financial controls and internal audit; manufacturing footprint and strategies; compliance programs; quality systems; research and development programs and product pipeline and IT systems and controls.
The Alcon Board Regulations confer to the members of the Alcon Board the right to have full and unrestricted access to management and employees of the Company and its subsidiaries in the execution of their duties. Also, the Chief Executive Officer regularly informs the Alcon Board on business developments, including significant transactions and risk issues. The Alcon Board and its Committees meet as often as required with the Chief Executive Officer and members of the Executive Committee or other members of the senior management. Further, the Alcon Board may invite, in accordance with the Alcon Board Regulations, external advisors to attend board or committee meetings in order to obtain a third party independent perspective on certain topics. Information is further communicated to the Alcon Board through regular reports (please refer to the section below “
Alcon Management Information System
”).
Alcon Management Information System
The Alcon Board receives monthly reports on the financial performance of the Company, including the performance of the Surgical and Vision Care franchises. On a quarterly basis, prior to the release of each quarter’s results, the Board receives the consolidated financial statement information and an outlook of the full-year results in accordance with IFRS and “core” results together with related commentary.
On an annual basis, the Board receives and approves the financial targets for the following year. Mid-year, the Board met for a strategic review of the business and approved the strategic plan for the next five years.
Additionally, throughout the year, the Board directly or through its Committees also received reports on, among other things:
|
•
|
The Enterprise Risk Management program and risk assessment reports
|
|
•
|
The Compliance Program
|
|
•
|
The Internal Audit function
|
|
•
|
Manufacturing and Technical Operations
|
|
•
|
Research & Development and product pipeline
|
|
•
|
Commercial strategies and product launches
|
In matters of significance, the Board receives direct, immediate information.
Internal Audit
The purpose of the internal audit function is to review the financial, operational, IT and compliance activities of Alcon. Internal audit is led by the Chief Audit Executive (“CAE”), who functionally reports to the Audit and Risk Committee. The CAE is responsible for the development, review and modification to the audit policies and procedures for such audits’ conduct. The CAE shall ensure effectiveness and efficiency of the internal control framework with existing policies and regulations and propose remediation actions where deficiencies were identified. The CAE periodically submits to the Audit and Risk Committee reports on the activities of the internal audit function. In 2019, since the Spin-off from Novartis on April 9, they have carried out audits, all of which have been reported to the Audit and Risk Committee.
Internal Control System
Alcon's internal control system is designed to provide reasonable assurance to the Board and management regarding the reliability of financial reporting and accounting policies and the preparation and the presentation of the Company’s financial statements. In 2019, Alcon designed an internal control system that is in process of being fully tested for effectiveness. The Audit and Risk Committee has ultimate responsibility to oversee the adequacy and effectiveness of internal control over financial reporting.
130
Risk Management
The Audit and Risk Committee has the responsibility to ensure the implementation of an appropriate and effective risk management system and process and to foster a culture of risk-adjusted decision-making without constraining reasonable risk taking and innovation. It shall approve guidelines and review policies and processes. Also, the Audit and Risk Committee shall review with management, internal auditors and external auditors, the identification, prioritization and management of the risks, the accountabilities and roles of the functions involved with risk management, the risk portfolio and the related actions implemented by management. The Executive Committee and the Board shall be informed by the Audit and Risk Committee on a periodic basis on the risk management system and on the most significant risks and how these are managed. The CAE shall support the Audit and Risk Committee and perform appropriate reviews of Alcon's risk management strategy.
Alcon’s key risk management tool is the Enterprise Risk Management ("ERM") program, the purpose of which is to help execute on Alcon’s strategy within the boundaries of regulations and improve the probability for achieving Alcon’s strategic and financial objectives. Alcon’s vision is to design a simple, sustainable and appropriately scaled ERM program to proactively manage existing and emerging threats and opportunities to the business. The ERM program aims in particular to provide the business with (i) operation discipline and rigor to enable business continuity, creation and preservation of value, (ii) forums for frequent risk discussions and escalation of relevant items with leadership, and (iii) guidance, techniques and support to identify, assess, manage, monitor and report on major risks.
Compliance Function
As part of its global control system, Alcon has also established a comprehensive global integrity and compliance program, under the supervision of the Audit and Risk Committee. The program is led by the Global Head, Integrity and Compliance under the functional leadership of Alcon’s General Counsel and is intended to prevent, detect and mitigate compliance risk across the organization. The program is built on a culture and expectation of compliance at all levels. The fundamental elements of the program include dedicated resources to address compliance globally, formal compliance governance, a global intake process to receive questions and concerns, written standards, communications, training, multiple levels of risk-based auditing and monitoring, review of alleged misconduct and corrective/disciplinary actions for violations. The Audit and Risk Committee of the Board receives periodic updates on the performance of the Integrity and Compliance program and compliance related matters. The program also includes compliance committees, which have been established at the corporate, regional and country-levels and include participation by the Executive Committee and other senior leadership to provide strategic direction and oversight relating to the management of compliance risks for Alcon. Policies are reviewed and updated on a regular basis to address changes in laws and regulations and to strengthen compliance.
131
Executive Committee
Composition of the Executive Committee
As of December 31, 2019, the Executive Committee of Alcon was composed of the following members:

|
David J. Endicott, Chief Executive Officer
Please refer to the biography set forth under "Board of Directors".
|
|
Age:
54
Nationality:
American |
|

|
Tim C. Stonesifer, Chief Financial Officer
Mr. Stonesifer has been the Chief Financial Officer of Alcon since April 2019. Prior to joining Alcon, he served as Executive Vice President and Chief Financial Officer at Hewlett Packard Enterprise. He had served in that role from November 2015 through September 2018. Prior to that role, Mr. Stonesifer acted as Senior Vice President and Chief Financial Officer, Enterprise Group at HP Co. from February 2014 to November 2015.
Before joining HP Co., he served as Chief Financial Officer of General Motors’ International Operations from May 2011 to January 2014. Previously, he served as Chief Financial Officer of Alegco Scotsman, a storage company, from June 2010 to May 2011.
Prior to that, Mr. Stonesifer served as Chief Financial Officer of Sabic Innovative Plastics (formerly GE Plastics) from August 2007 to June 2010 after having served in various other positions at General Electric since joining the company in 1989.
Mr. Stonesifer holds a Bachelor of Arts in Economics from the University of Michigan in the U.S.
|
|
Age:
52
Nationality:
American |
|
132

|
Laurent Attias, Head Corporate Development, Strategy, Business Development and Licensing (BD&L) and Mergers and Acquisitions (M&A)
Laurent Attias is Head of Corporate Development, Strategy, BD&L and M&A of Alcon. In this role, Mr. Attias leads the development of long-term strategic plans for the Surgical and Vision Care franchises of Alcon. He is also responsible for the Alcon’s BD&L, M&A, partnerships and alliance activities.
Mr. Attias joined Alcon in March 1994. During his more than 25 years with Alcon, Mr. Attias progressed through the Sales and Marketing organizations by defining key strategic directions for Surgical and Pharmaceutical flagship brands. Starting in 2002, Mr. Attias held the position of Vice President, Refractive Sales and Marketing, where he helped define Alcon’s participation in the laser refractive market.
Mr. Attias moved to Europe in 2009 to assume the role of Vice President, Central & Eastern Europe, Italy and Greece. In 2010, Mr. Attias was promoted to President, EMEA. Previously, Mr. Attias served as Vice President/General Manager of Alcon Canada, an international relocation role he assumed in 2007.
Mr. Attias holds both a Bachelor of Business Administration in Marketing and a Master of Business Administration from Texas Christian University in the U.S.
|
|
Age:
52
Nationality:
American and French |
|

|
Ian Bell, President International
Ian Bell is the President-International of Alcon, overseeing the Europe, Russia, Middle East and Africa, Asia Pacific, Japan and Latin America and Caribbean markets. He joined Alcon in March 2016 as President of Europe, Middle East and Africa (“EMEA”). Mr. Bell brings more than 20 years of experience in the medical device and pharmaceutical industries. Mr. Bell joined Alcon from Hospira, where he served as Corporate Vice President and President of the EMEA region.
Prior to his work at Hospira, Mr. Bell was Corporate Vice President and President of Allergan, Inc.’s Asia Pacific region, based in Singapore, from 2008 to 2014. Mr. Bell joined Allergan, Inc. in 2005 as Vice President and Managing Director of its neurosciences division for the EMEA region.
Mr. Bell began his career at GlaxoSmithKline, where he held roles of increasing responsibility and scope in sales, marketing and strategy for more than 10 years.
Mr. Bell was awarded the degree of Bachelor of Arts with honors in Economics from the University of York in the United Kingdom.
|
|
Age:
49
Nationality:
British |
|
133

|
Leon Sergio Duplan Fraustro, President North America
Sergio Duplan is President-North America of Alcon, overseeing the United States and Canada markets. He leads about 3,000 associates across these two unique markets and the Surgical and Vision Care franchises of Alcon. He is a board member of The Alcon Foundation.
Mr. Duplan began his career with Novartis in 2004, as Vice President of Sales in General Medicines, in Mexico. In 2006, he was promoted to Head of Marketing and Sales for Latin America, General Medicines, Pharma. In 2008, he became Country Pharma Organization Head and Country President of Novartis Mexico. Mr. Duplan joined Alcon in August 2012.
Prior to his current role, Mr. Duplan was President of Latin America and Canada for Alcon for three years. He was appointed to his current role in August 2015.
Prior to joining Novartis, Mr. Duplan held several positions of increasing responsibility in Sales, Finance and Country Management at Procter & Gamble and Eli Lilly & Co.
Mr. Duplan holds a Bachelor degree in Industrial Engineering from Universidad Iberoamericana in Mexico and a Master of Business Administration from The Wharton School at the University of Pennsylvania in the U.S.
|
|
Age:
52
Nationality:
American and Mexican |
|

|
Michael Onuscheck, President Global Businesses and Innovation
Michael Onuscheck is the President-Global Businesses and Innovation of Alcon. Mr. Onuscheck joined Alcon in January 2015, as President and General Manager of the Global Surgical franchise. He joined Alcon from Boston Scientific, where he spent 10 years in leadership positions of increasing responsibility. Prior to joining Alcon, Mr. Onuscheck most recently held the position of President of Boston Scientific, overseeing the company’s business operations in Europe and Russia. He previously served as Senior Vice President and President of Boston Scientific’s Neuromodulation division, with responsibility for research and development, manufacturing, marketing, sales, clinical research and customer service.
Prior to joining Boston Scientific, Mr. Onuscheck held a variety of management positions at Medtronic in spinal reconstructive surgery and stereotactic image guided surgery, and various sales and marketing positions for Pfizer.
Mr. Onuscheck earned his degree in Business Administration and Psychology from Washington and Jefferson College in the U.S.
|
|
Age:
53
Nationality:
American |
|
134

|
Rajkumar Narayanan, Operational Strategy and Chief Transformation Officer
Mr. Narayanan is the Senior Vice President Operational Strategy and Chief Transformation Officer of Alcon and is responsible for leading the development and implementation of Alcon’s Transformation program. He has over 25 years’ experience in pharmaceutical / medical devices businesses. He joined Alcon in June 2017 as President Asia Pacific Region and moved into his current role in April 2019.
Mr. Narayanan joined Alcon from Allergan Inc., where he worked for 22 years in roles of increasing responsibility, initially in the Finance function and subsequently in the commercial organization. He was Senior Vice President Asia Pacific Region between 2015-2017. Prior to this role, he was Vice President and Managing Director of the Medical Aesthetic Franchise for Europe Africa and Middle East from 2011-2014. He served as Vice-President, Greater China & Japan between 2008-2011. Between 1995 and 2007, Mr. Narayanan was a part of Allergan’s Finance function in a number of Country, Region and Corporate Finance roles. Mr. Narayanan started his career with Hindustan Unilever India in 1987 and worked in a number of roles in the Finance function.
Mr. Narayanan holds a Bachelor of Science degree in Accounting and Finance from Mumbai University. He is also Chartered Accountant and Cost and Works Accountant from India.
|
|
Age:
55
Nationality:
American |
|
Role of the Executive Committee
The members of the Executive Committee are appointed by the Alcon Board. In accordance with the Articles of Incorporation and the Alcon Board Regulations, the Alcon Board delegated the responsibility for the management of the business to the Executive Committee, under the lead of the Chief Executive Officer.
The Executive Committee shall in particular (i) develop strategies and policies and implement those upon approval by the Alcon Board, (ii) coordinate and monitor the group’s functions to achieve the business targets, (iii) ensure the efficient operation of the group, (iv) manage the proper provision and use of capacity and financial and other resources within the group and (v) ensure the development and succession of the senior management.
Alcon has not entered into any management agreements with any third parties pursuant to which Alcon would delegate any business management responsibilities to any such third parties.
Limitations of Number of Mandates
No member of the Executive Committee may hold more than 6 additional mandates in other companies, of which no more than 2 additional mandates shall be in other listed companies. Each of these mandates shall be subject to approval by the Board of Directors. Members of the Executive Committee are not allowed to hold chairs of the board of directors of other listed companies. Further details can be found in Article 34 of the Articles of Incorporation, available under https://investor.alcon.com/governance/governance/default.aspx.
Compensation, Shareholdings and Loans
Please refer to "Item 6.B - Compensation".
135
Shareholders’ Participations Rights
Voting-right Restrictions and Representation
Alcon has not imposed any restriction regarding share ownership or voting rights. Nominees shareholdings are not subject to any limitations. The right to vote at Alcon general meetings may only be exercised by a shareholder, usufructuary or nominee who is duly registered in Alcon share register on the record date for the applicable general meeting. Shareholders can be represented at general meetings by the independent proxy or by a third person authorized by written proxy who does not need to be a shareholder. As required by law, shareholders will also be given the opportunity to issue their voting instructions to the independent proxy electronically through an online voting platform.
Each Alcon share has the right to one vote. Shares held by the Company or any of its consolidated subsidiaries are not entitled to vote. Votes are taken either by a show of hands or by electronic voting, unless the General Meeting of Shareholders resolves to have a ballot or where a ballot is ordered by the chairman of the meeting.
Statutory Quorums
Unless otherwise required by law, the general meeting passes resolutions and elections with the absolute majority of the votes duly represented. As a result, abstentions have the effect of votes against such resolutions.
According to Article 704 of the Swiss Code of Obligation, the following shareholders’ resolutions require the approval of at least two thirds of the votes represented at a General Meeting of Shareholders: (1) an alteration of Alcon’s corporate purpose; (2) the creation of shares with increased voting powers; (3) an implementation of restrictions on the transfer of registered shares and the removal of such restrictions; (4) an authorized or conditional increase of the share capital; (5) an increase of the share capital by conversion of equity, by contribution in kind, or for the purpose of an acquisition of property or the grant of special rights; (6) a restriction or an exclusion of shareholders’ pre-emptive rights; (7) a change of Alcon’s registered office; (8) Alcon’s dissolution; or (9) any amendment to the Articles of Incorporation which would create or eliminate a supermajority requirement.
Swiss law further provides for a qualified majority for certain special resolutions, such as in case of merger or demerger.
Convocation of General Meetings
The Annual General Meeting shall be held within six months after the close of the financial year of the Company. Extraordinary General Meetings may be convened upon request of the Alcon Board, the auditors or one or more shareholders representing in aggregate not less than 10% of the Company’s share capital. At least 20 days before the general meeting, the invitation including the agenda is published in the Swiss Gazette of Commerce and mailed to the registered shareholders.
Agenda
One or more Alcon shareholders whose combined shareholdings represent an aggregate nominal value of at least CHF 1 million may demand that an item be included in the agenda of a General Meeting of Shareholders. Such a demand must be made in writing at the latest 45 days before the meeting and shall specify the items and the proposals of such a shareholder.
Registration in the Share Register
The share register of the Company is a non-public register, subject to confidentiality and privacy and data protections imposed on Alcon to protect registered shareholders. Alcon shares can be voted only if their relevant holder is registered in the Alcon share register by the record date determined by the Alcon Board. The Articles of Incorporation do not provide for any specific rule regarding the closure of the share register.
136
Changes of Control and Defense Measures
Duty to Make an Offer
Under the Swiss Financial Market Infrastructure Act, shareholders and groups of shareholders acting in concert who acquire more than 33.3% of Alcon shares would be under an obligation to make an offer to acquire all remaining Alcon shares. Alcon has neither opted out from the mandatory takeover offer obligation nor opted to increase the threshold for mandatory takeover offers in the Articles of Incorporation.
Clauses on Change of Control
In accordance with the rules of the Ordinance against Excessive Compensation in Listed Companies, Alcon does not provide severance payments upon a change of control or “golden parachute” provisions in its agreements with its Directors, Executive Committee members or other members of senior management. Alcon’s Long Term Incentive Plan and Deferred Bonus Stock Plan, each applicable to all employee participants including Executive Committee members, provide for double trigger accelerated vesting of outstanding stock awards in the event a participant leaves the company for “good reason” or Alcon terminates the employee without “cause,” as such terms are defined in the plans, within two years following a change of control. If such a double trigger event occurs, the participant’s outstanding unvested awards would vest in full. In the case of Performance Share Units, awards less than 50% vested would vest at target and awards more than 50% vested would vest in accordance with Alcon’s actual performance, as determined by the CGNC.
Auditors
Duration of the Mandate and Terms of Office of the Auditors
PricewaterhouseCoopers SA, Switzerland (“PwC Switzerland”), is the statutory auditor of the Company and shall conduct the audit activities required by Swiss law and the related SIX regulations. It was elected on January 29, 2019 for a term of one year until the 2020 Company’s Annual General Meeting. Mike Foley has been the auditor in charge of the statutory audit since 2019. Alcon has a policy to rotate the lead audit partner of the statutory auditor at least every five years.
Separately, on April 29, 2019, the Company appointed PricewaterhouseCoopers LLP, United States (“PwC US”), for a term of one year, as its independent registered accounting firm to conduct the audit activities required by US law and the related NYSE regulations. The appointment of PwC US does not require approval of the Company’s shareholders.
Auditing Fees and Additional Fees
The following table sets forth the amount of audit fees, audit-related fees, tax fees and all other fees billed or expected to be billed in aggregate by PwC Switzerland, PwC US and any other member firm of PricewaterhouseCoopers International Limited that rendered audit and relates services to any member of Alcon, for the fiscal years ended December 31, 2019 and December 31, 2018:
|
($ millions)
|
Year ended
December 31, 2019 |
Year ended
December 31, 2018 |
|
Audit fees
|
11.7
|
7.0
|
|
Audit related fees
|
0.2
|
0.5
|
|
Tax fees
|
–
|
–
|
|
All other fees
|
–
|
–
|
|
Total
|
11.9
|
7.5
|
Audit fees
include fees billed for professional services rendered for audits of our annual consolidated and standalone financial statements, reviews of consolidated quarterly financial information and statutory audits of the Company (including in particular the Compensation Report) and our subsidiaries.
Audit-related fees
include fees billed for assurance and related services such as due diligence, accounting consultations and audits in connection with mergers and acquisitions, employee benefit plan audits, internal control reviews, and consultations concerning financial accounting and reporting standards.
137
Tax fees
include fees billed for professional services for tax compliance, tax advice, and tax planning.
All other fees
include fees billed for products and services other than as reported above.
Control Measures over the Activities of the Auditors
The Alcon Board has delegated to the Audit and Risk Committee ("ARC") the oversight of the activities of the external auditors. The ARC shall in particular evaluate on an annual basis the qualifications and performance of our auditors and determine whether PwC Switzerland should be proposed to the general meeting to stand for re-election. The criteria applicable of the performance assessment of our auditors include professional competence, sufficiency of resources to complete the audit mandate, independence and objectivity, capability to provide effective and pragmatic recommendations and coordination with the ARC and other functions of the Alcon group, including internal audit.
Upon recommendation of the ARC, the Alcon Board proposed to the shareholders the acceptance of the audited consolidated financial statements of the Alcon group and the financial statements of the Company.
The ARC is further responsible for the compensation of our auditors and pre-approve all auditing services, internal control-related services and non-audit services permitted under applicable statutory law, regulations and listing requirements.
In 2019, our auditors participated in four meetings of the ARC in order to discuss auditing matters and present the 2019 audit strategy and audit results. Our auditors shall render to the ARC at least once a year a report regarding (i) the external auditor’s internal quality-control procedures, (ii) any material issues raised by quality-control reviews or any inquiry or investigation by governmental or professional authorities, (iii) any step taken to deal with such issues and (iv) all relationships between the external auditor and the Alcon group.
Information Policy
Alcon is committed to pursuing an open and transparent communication with shareholders, suppliers, customers and other stakeholders. It publishes information in a professional manner in accordance with best practices and legal requirements.
Investor Relations
Effective communication with shareholders is an important part of Alcon's governance framework. The Chairman and the CEO, supported by the Investor Relations team, are responsible for actively engaging with shareholders and keeping them informed about Alcon's business, governance, strategy and performance, in accordance with applicable laws and regulations. The Company believes good engagement and dialogue with the financial community is critical in securing support and confidence in management's leadership and Board's governance of Alcon. The Investor Relations team regularly organizes opportunities to learn about the Company through in-person and virtual meetings and product showcases throughout the year, subject to its quiet period policy.
Communications
Financial information is published in the form of annual and quarterly financial results, in accordance with internationally recognized accounting standards. Related material, including annual reports, Form 20-Fs, quarterly results releases, presentations and conference call webcasts are available on the Alcon website. From time to time, Alcon issues press releases regarding business developments. Investors may subscribe to receive via email distributions providing news and notification about Alcon. The dissemination of material information about business developments is made in accordance with the rules of the SIX and the NYSE.
Information contained in reports and releases may only be deemed accurate in any material respect at the time of the publication. Past releases are not updated to reflect subsequent events.
138
Alcon's website provides regular information and updates about the Company at
www.alcon.com
. Detailed information regarding certain topics may be found as follows:
|
Topic
|
Website
|
|
Investor relations
|
https://www.alcon.com/about-us#investors
|
|
Media releases
|
https://www.alcon.com/about-us#media-releases
|
|
Leadership
|
https://www.alcon.com/about-us#leadership
|
|
Governance
|
https://investor.alcon.com/governance/governance/default.aspx
|
|
Financials
|
https://investor.alcon.com/financials/quarterly-results/default.aspx
|
Differences from Corporate Governance Standards Relevant to US-listed Companies
According to the NYSE listing standards on corporate governance, listed foreign private issuers are required to disclose any significant ways in which their corporate governance practices differ from those governance practices that must be followed by NYSE-listed U.S. domestic companies. We briefly summarize those differences in the following paragraphs.
Responsibility of the Audit Committee with regard to Independent Auditors
Our Audit and Risk Committee is responsible for the compensation, retention and oversight of our independent statutory auditors. It assesses the performance and qualification of our statutory auditors and submits its proposal for appointment, reappointment or removal of our statutory auditors to the full Board. As required by the Swiss Code of Obligations, our Board then submits its proposal to the shareholders for their vote at the Annual General Meeting (AGM). In contrast, under NYSE listing standards, the audit committee for U.S. domestic companies is also responsible for the appointment of the independent auditors.
Supervision of the Internal Audit Function
The CFO and the Audit and Risk Committee share the supervisory responsibility with respect to the internal audit function. In contrast, under NYSE standards, only the audit committee supervises the internal audit function.
Responsibility of the Compensation Committee for Performance Evaluations of Senior Management
In line with Swiss law, our Compensation, Governance and Nomination Committee, together with the Board, proposes for shareholder approval at the AGM the maximum aggregate amount of compensation for the Board and the maximum aggregate amount of fixed and variable compensation for the Executive Committee of Alcon. Our shareholders elect each of the members of the Compensation, Governance and Nomination Committee at the Annual General Meeting. In contrast, under NYSE standards, it is the responsibility of the compensation committee to evaluate senior management performance and to determine and approve, as a committee or together with the other independent directors, the compensation for senior officers and the board. U.S. domestic companies listed on NYSE are only required to provide shareholders a periodic advisory non-binding vote on a company’s executive compensation practices.
Shareholders’ Votes on Equity Compensation Plans
Swiss law authorizes the Board to approve equity-based compensation plans. Shareholder approval is only mandatory if equity-based compensation plans require an increase in capital. No shareholder approval is required if shares for issuance under such plans are purchased by the issuer in the open market. In contrast, the NYSE standards require shareholder approval for the establishment of and material revisions to all equity compensation plans.
139
|
6.D.
|
EMPLOYEES
|
The table below sets forth the breakdown of the total year-end number of our full-time equivalent employees by main category of activity for the past three years.
|
|
For the year ended December 31,
|
|||||||
|
|
2019
|
|
2018
(1)
|
|
2017
(1)
|
|
||
|
Marketing & Sales
|
7,301
|
|
7,162
|
|
6,595
|
|
||
|
Production & Supply
|
11,026
|
|
10,655
|
|
10,218
|
|
||
|
Research & Development
|
1,695
|
|
1,431
|
|
1,356
|
|
||
|
General & Administration
|
2,120
|
|
1,133
|
|
961
|
|
||
|
Total full-time equivalent employees
|
22,142
|
|
20,381
|
|
19,130
|
|
||
|
(1)
|
Alcon historically received certain services from NBS, the shared service organization of Novartis. The corresponding full time equivalents providing such services were part of NBS and have therefore not been included in the table above for 2018 and 2017.
|
Unions or works councils represent a significant number of our associates. We have not experienced any material work stoppages in recent years, and we consider our employee relations to be good.
|
6.E.
|
SHARE OWNERSHIP
|
The information set forth under “Item 6.B. Compensation” is incorporated by reference. Also, refer to Note 24 to the Consolidated Financial Statements for a discussion of our equity-based compensation programs.
|
ITEM 7.
|
MAJOR SHAREHOLDERS AND RELATED PARTY TRANSACTIONS
|
|
7.A.
|
MAJOR SHAREHOLDERS
|
The information set forth under “Item 6. Directors, Senior Management and Employees—6.C. Board Practices—Corporate Governance” is incorporated by reference.
|
7.B.
|
RELATED PARTY TRANSACTIONS
|
Dr. Arthur Cummings, an Alcon director, in his capacity as an ophthalmologist, provides certain consulting services, including assistance with various clinical trials to Alcon. In 2019, Alcon paid to Dr. Cummings (or his related entities) approximately $84,844.
|
7.C.
|
INTERESTS OF EXPERTS AND COUNSEL
|
Not Applicable.
140
|
ITEM 8.
|
FINANCIAL INFORMATION
|
|
8.A.
|
CONSOLIDATED STATEMENTS AND OTHER FINANCIAL INFORMATION
|
Please refer to the financial statements beginning on page F-1 of this Annual Report.
Legal Proceedings
From time to time, we may become involved in litigation or may receive inquiries from regulatory authorities, including antitrust and competition authorities in various jurisdictions relating to matters arising from the ordinary course of business. In addition, we are from time to time and may in the future be subject to audit or investigation by tax authorities in the ordinary course of business in the various jurisdictions in which we operate. Our management believes that, except as described below, there are currently no claims or actions pending against us, the ultimate disposition of which could have a material adverse effect on our results of operations, financial condition or cash flows. In addition, under the Separation and Distribution Agreement we entered into with Novartis, we and Novartis have agreed, subject to certain conditions and except to the extent otherwise described below with respect to any matter, to indemnify the other party and its directors, officers, employees and other representatives against any pending or future liabilities or claims that constitute either a Novartis liability, in the case of Novartis, or an Alcon liability, in the case of Alcon, under the terms of the Separation and Distribution Agreement, based on whether such claim or liability relates to the Novartis business and products or our business and products. For more information, see "Item 10. Additional Information—10.C. Material Contracts—Our Agreements with Novartis".
Southern District of New York / Western District of New York Healthcare Fraud Investigation.
In 2011, Alcon received a subpoena from the United States Department of Health & Human Services relating to an investigation into allegations of healthcare fraud and potential off-label promotion of certain products. The subpoena requested the production of documents relating to marketing practices and the remuneration of healthcare providers in connection with surgical equipment and certain Novartis products (Vigamox®, Nevanac®, Omnipred®, Econopred®). Alcon has cooperated with this investigation.
Asia / Russia Investigation.
In 2017 and 2018, Alcon and Novartis, as well as certain present and former executives and associates of Alcon and Novartis, received document requests and subpoenas from the DoJ and the SEC requesting information concerning Alcon accounting, internal controls and business practices in Asia and Russia, including revenue recognition for surgical equipment and related products and services and relationships with third-party distributors, both before and after Alcon was acquired by Novartis. Alcon is cooperating with this investigation. Under the Separation and Distribution Agreement, Novartis must indemnify Alcon in respect of defined direct monetary liabilities relating to the current scope of the ongoing investigation by the DoJ and the SEC relating to certain business practices in Asia and Russia and related accounting treatment.
Contact Lenses Class Actions
Since the first quarter of 2015, more than 50 class action complaints have been filed in several courts across the US naming as defendants contact lens manufacturers, including Alcon, and alleging violations of federal antitrust law, as well as the antitrust, consumer protection and unfair competition laws of various states, in connection with the implementation of unilateral price policies by the defendants in the sale of contact lenses. The cases have been consolidated in the Middle District of Florida by the Judicial Panel on Multidistrict Litigation and the claims are being vigorously contested.
Dividend Policy
Alcon expects that it will recommend to shareholders the payment of a regular annual cash dividend based on the prior year’s core net income; however, the declaration, timing, and amount, including potential increases, of any dividends will be subject to the approval of our shareholders at a General Meeting. The determination of the Board as to whether to recommend a dividend and the approval of any such proposed dividend by our shareholders will depend upon many factors, including our financial condition, earnings, corporate strategy, capital requirements of our operating subsidiaries, covenants, legal requirements and other factors deemed relevant by the Board and shareholders. For additional information, see "Item 3. Key Information—3.D. Risk Factors—Risks related to the Ownership of our Shares—We may not pay or declare dividends".
For information about deduction of the withholding tax or other duties from dividend payments, see "Item 10. Additional Information—10.E. Taxation—Swiss Taxation—Swiss Residents—Withholding Tax on Dividends" and "Item 10. Additional Information—10.E. Taxation—US Federal Income Taxation—Distributions on the Shares".
141
Past Dividends
Since the formation of Alcon, which became effective as of the date of the registration of Alcon in the Swiss Register of Commerce on September 21, 2018, Alcon has not paid any dividends.
|
8.B.
|
SIGNIFICANT CHANGES
|
A discussion of significant changes in our business can be found under "
Item 4. Information on the Company
—
4.A. History and Development of the Company
", "
Item 4. Information on the Company
—
4.B. Business Overview
" and "
Item 5. Operating and Financial Review and Prospects
—
5.A. Operating Results
".
|
ITEM 9.
|
THE OFFER AND LISTING
|
|
9.A.
|
OFFER AND LISTING DETAILS
|
Alcon Inc. shares are listed on the SIX and the NYSE as global registered shares under the trading ticker “ALC”. As such, they can be traded and transferred across applicable borders, without the need for conversion, with identical shares traded on different stock exchanges in different currencies. During 2019, the average daily trading volume of Alcon Inc. shares was approximately 2.0 million shares on the SIX and approximately 1.3 million shares on the NYSE.
As of the date of this Annual Report, our shares are included in a number of indices, including the “Swiss Market Index”, or SMI, the principal Swiss index published by the SIX. This index contains 20 of the largest and most liquid stocks based on market capitalization and the most active stocks listed on the SIX. The SMI indicates trends in the Swiss stock market as a whole and is one of the most widely followed stock price indices in Switzerland.
|
9.B.
|
PLAN OF DISTRIBUTION
|
Not applicable.
|
9.C.
|
MARKETS
|
See “Item 9.A. Offer and listing Details.”
|
9.D.
|
SELLING SHAREHOLDERS
|
Not applicable.
|
9.E.
|
DILUTION
|
Not applicable.
|
9.F.
|
EXPENSES OF THE ISSUE
|
Not applicable.
142
|
ITEM 10.
|
ADDITIONAL INFORMATION
|
|
10.A.
|
SHARE CAPITAL
|
Not Applicable.
|
10.B.
|
MEMORANDUM AND ARTICLES OF ASSOCIATION
|
We incorporate by reference into this Annual Report the description of our Articles of Incorporation and our Regulations of the Board of Directors contained in our
Registration Statement on Form 20-F, as amended, initially filed with the SEC on November 13, 2018 (File No. 001-31269)
.
|
10.C.
|
MATERIAL CONTRACTS
|
Our Agreements with Novartis
F
ollowing the separation and the Spin‑off, we and Novartis operate separately, each as an independent public company. Prior to the completion of the Spin‑off, we entered into a Separation and Distribution Agreement and several other agreements with Novartis to effect the separation and provide a framework for our relationship with Novartis after the Spin‑off. These agreements govern the relationships between Novartis and and are attributable to periods prior to, at and after the separation. In addition to the Separation and Distribution Agreement (which contains many of the key provisions related to our separation from Novartis and the distribution of the Alcon shares to holders of Novartis shares and ADRs), these agreements include:
|
▪
|
tax matters agreement;
|
|
▪
|
employee matters agreement;
|
|
▪
|
manufacturing and supply agreements;
|
|
▪
|
transitional services agreement; and
|
|
▪
|
certain IP arrangements.
|
The material agreements described below have been filed as exhibits to this Form 20‑F and the summaries below set forth the terms of the agreements that we believe are material. These summaries are qualified in their entireties by reference to the full text of the applicable agreements, which are incorporated by reference into this Form 20‑F.
In addition, we entered into other agreements with Novartis prior to the completion of the Spin‑off that are not material to our business. These agreements include agreements relating to information sharing and access rights, data transfer, confidentiality and systems access, transfer of marketing authorizations, certain manufacturing quality control and pharmacovigilance matters, certain leases to Novartis and certain transitional distribution and other services matters, including shared premises services, as well as a third party claims and investigations management agreement.
Separation and Distribution Agreement
The Separation and Distribution Agreement sets forth our agreements with Novartis regarding the principal actions taken in connection with the separation and the Spin‑off.
Transfer of Assets and Assumption of Liabilities
.
The Separation and Distribution Agreement identified the assets to be transferred, liabilities to be assumed and contracts to be assigned to each of Novartis and Alcon as part of the internal transactions effected prior to the distribution, the purpose of which was to ensure that, at the time of the distribution, each of Alcon and Novartis held the assets required to operate their respective businesses and retained or assumed (as applicable) liabilities, including pending and future claims, which relate to such business (whether arising prior to, at or after the date of execution of the Separation and Distribution Agreement), subject to certain limited exceptions set out under the heading “Asia/Russia Investigation” below.
The Distribution
.
The Separation and Distribution Agreement governed the rights and obligations of the parties with respect to the distribution.
Intercompany Arrangements
.
All agreements, arrangements, commitments and understandings, including most intercompany accounts payable or accounts receivable, between us, on the one hand, and Novartis, on the other hand, terminated effective
143
as of completion of the separation, except specified agreements and arrangements that survived completion of the separation that were either transactional in nature or at arms’ length terms.
Representations and Warranties
.
We and Novartis each provided customary warranties as to our respective capacity to enter into the Separation and Distribution Agreement. Except as expressly set forth in the Separation and Distribution Agreement or any ancillary agreement, neither we nor Novartis made any representation or warranty as to the assets, business or liabilities transferred or assumed as part of the separation, or as to the legal sufficiency of any assignment, document or instrument delivered to convey title to any asset or thing of value transferred in connection with the separation. Except as expressly set forth in the Separation and Distribution Agreement and certain other ancillary agreements, all assets were transferred on an “as is”, “where is” basis.
Indemnification
.
We and Novartis each agreed to indemnify the other and each of the other’s directors, officers, managers, members, agents and employees against certain liabilities incurred in connection with the Spin‑off and our and Novartis respective businesses. The amount of either Novartis or our indemnification obligations will be reduced by any insurance proceeds the party being indemnified receives.
Asia/Russia Investigation
.
Novartis indemnified Alcon in respect of defined direct monetary liabilities relating to the current scope of the ongoing investigation by the DoJ and the SEC relating to certain business practices in Asia and Russia and related accounting treatment. See the section entitled “Asia Investigation” in the Separation and Distribution Agreement attached as Exhibit 4.1 to this Form 20‑F.
Release of Claims
.
We and Novartis each agreed to release the other and its affiliates, successors and assigns, and all persons that, prior to completion of the Spin‑off, were the other’s shareholders, directors, officers, managers, members, agents or employees, and their respective heirs, executors, administrators, successors and assigns, from any claims against any of them that arise out of or relate to our respective businesses. These releases are subject to limited exceptions set forth in the Separation and Distribution Agreement (including in respect of fraud and criminal conduct).
Term / Termination
.
Neither we nor Novartis may rescind the Separation and Distribution Agreement in any circumstances whatsoever following the completion of the distribution.
Switch Rights
.
Novartis granted us the right, from the date of separation, to switch certain specified olopatadine products from prescription products to over‑the‑counter products and to develop, manufacture and commercialize such products as over‑the‑counter products going forward. This right is exercisable on notice and, for jurisdictions outside US, subject to Novartis consent. We have provided notice to Novartis to exercise our right to develop, manufacture and commercialize certain of those products in the US. The FDA approved Pataday Twice Daily Relief (0.1%) and Pataday Once Daily Relief (0.2%) in February 2020.
Brazil and Belgian Sites
.
Novartis and we each granted each other a right of last look in respect of any third party disposal of our portion of the Puurs site and Novartis granted us a right of last look in respect of any third party disposal by Novartis of its portion of the Brazilian manufacturing facility.
Other matters governed by the Separation and Distribution Agreement
.
Other matters governed by the Separation and Distribution Agreement include, without limitation, insurance arrangements, confidentiality, mutual assistance and information sharing after completion of the distribution, treatment and replacement of credit support, and transfer of and post‑separation access to certain books and records.
Tax Matters Agreement
We entered into a Tax Matters Agreement with Novartis prior to completion of the Spin‑off. The Tax Matters Agreement imposed certain restrictions on us (including restrictions on share issuances, business combinations, sales of assets and similar transactions) designed to preserve the tax‑neutral nature of the Spin‑off for Swiss tax and US federal income tax purposes. Nonetheless, we are able to engage in an otherwise restricted action if we obtain appropriate advice from counsel or a ruling from a competent taxing authority. However, our indemnification obligation to Novartis, as discussed below, is still applicable in circumstances in which we are permitted to engage in an otherwise restricted action.
The Tax Matters Agreement provides that we will indemnify Novartis if our breach of a representation or covenant that serves as the basis for the Tax Opinion or the Tax Rulings or our taking, or failure to take, certain actions results in the failure of the Spin‑off or certain internal restructuring steps to qualify for tax‑neutral treatment under Swiss tax or US federal income tax laws, as applicable. The Tax Matters Agreement also provides that we will generally indemnify Novartis for any taxes of Novartis and its subsidiaries to the extent such taxes are attributable to the Alcon Division, and Novartis will generally indemnify us for any of our or our subsidiaries’ taxes to the extent such taxes are attributable to the Novartis retained businesses, in each case whether accruing before, on or after the date of the Spin‑off.
144
Employee Matters Agreement
We entered into an Employee Matters Agreement with Novartis prior to completion of the Spin‑off. The Employee Matters Agreement sets forth our agreements with Novartis regarding the identification of the employees transferred to and retained by each of Novartis and Alcon as part of the operational separation prior to the Spin‑off, as well as the allocation of liabilities and responsibilities with respect to certain employee matters.
Allocation of employment liabilities
.
Subject to certain exceptions, the general principle for the allocation of employment and service‑related liabilities is that (i) Alcon assumes all such liabilities relating to Alcon employees and former employees of the Novartis Group who worked wholly or substantially in the Alcon Division as of the date immediately prior to the termination of their employment (“former Alcon employees”) and (ii) Novartis retains all such liabilities relating to all other current and former employees of the Novartis Group (including employees who are identified as Alcon employees, but did not in fact transfer to Alcon), in each case, regardless of when such liabilities arise.
Terms and conditions of Alcon employees
.
Until January 1, 2021, Alcon will provide each current Alcon employee with the same basic salary and contractual benefits that are substantially comparable, taken as a whole, to the contractual benefits received prior to the date of his or her transfer to Alcon (excluding share‑based incentive schemes and long‑term incentive plans). If the employment of any Alcon employee is terminated by reason of redundancy within 24 months following the date of his or her transfer, Alcon will provide severance benefits that are no less favorable than those that would have been provided prior to the date of his or her transfer.
Employee benefit and cash bonus plans
.
Alcon employees were generally, as of the date of the Spin‑off, eligible to participate in Alcon employee benefit plans and cash bonus plans that are the same as, or comparable to, those that apply to them prior to the date of the Spin‑off.
Share‑based incentive schemes
.
Awards granted under share‑based incentive schemes were treated as follows:
|
▪
|
Holders of unvested awards in the form of restricted Novartis shares received the dividend in‑kind resulting from the Spin‑off.
|
|
▪
|
Holders of unvested RSUs and PSUs did not receive the dividend in‑kind resulting from the Spin‑off, and such awards were treated as described in the section entitled “Item 6. Directors, Senior Management and Employees—6.B. Compensation—Section 3—ECA Compensation 2019—Section 3.6—Alcon Equity Restoration Plan”.
|
In addition, Alcon was required to establish, and employees were eligible to participate in, new Alcon equity plans in relation to Alcon shares following the Spin‑off.
Restrictions on post‑Spin‑off employee employment and engagement.
|
▪
|
Subject to certain exceptions, Novartis agreed that each member of the Novartis Group will not, for a period of two years following the Spin‑off, directly or indirectly: (i) solicit or induce certain senior Alcon employees to become employed or engaged by any member of the Novartis Group; or (ii) knowingly induce or encourage such employees to no longer be employed or engaged by Alcon.
|
|
▪
|
Subject to certain exceptions, Novartis agreed that it would not, and would undertake to procure that each member of the Novartis Group would not, for a period of two years following the Spin‑off, employ or engage certain senior Alcon employees.
|
Long‑term employee benefits
.
As of the date of the Spin‑off, Alcon generally assumed sponsorship of and responsibility for any standalone long‑term employee benefit arrangements relating to Alcon employees and former Alcon employees. Further, subject to certain exceptions, the accrued (past service) liabilities relating to the Alcon employees and former Alcon employees under Novartis Group‑wide plans providing retirement, disability or death, old‑age part‑time retirements or jubilee benefits, transfered to Alcon. In the UK, Novartis paid to Alcon a sum equal to the liabilities and expenses incurred, sustained or paid by Alcon, after the date of the Spin‑off, arising pursuant to section 75 of the UK Pensions Act 1995 in respect of Alcon or of any Alcon subsidiary’s cessation of participation in the Novartis UK Pension Scheme.
Manufacturing and Supply Agreements
We entered into manufacturing and supply agreements with Novartis prior to the completion of the Spin‑off. The manufacturing and supply agreements set forth our agreements with Novartis pursuant to which we and Novartis each manufacture, label, package and supply products for the other and conduct relevant quality control, assurance and testing activities for the other in relation to the manufacture and supply of applicable products (the “Forward and Reverse MSAs”). The terms of the manufacturing and supply agreements, including terms relating to pricing, were determined at arm’s length and are based on the prevailing cost of manufacturing with mutually agreed mark‑ups and adjustment mechanisms.
145
The terms of the Forward and Reverse MSAs are equivalent, except where specific provision is required to address a manufacturing site or product specific issue. The Forward and Reverse MSAs each include a transfer plan specifically addressing the relocation and transfer of certain products between the parties and manufacturing sites, key milestones in relation to product technical transfer and the anticipated date of expiration of the relevant Forward and Reverse MSA for those products, as required to achieve separation of the relevant Novartis and Alcon Division following the distribution. The Forward and Reverse MSAs additionally contain customary provisions for the transfer of manufacturing technology and processes to the other party (or other manufacturers where applicable) for all products for the benefit of the relevant purchasing party. For products not included in the transfer plan the Forward and Reverse MSAs have an initial term of three years, with automatic renewal subject to rights of termination on three years’ notice from the relevant purchaser party and five years’ notice from the relevant supplier party. The Forward and Reverse MSAs contain customary fault based termination triggers (such as an insolvency related event or a material breach (which if curable is uncured)) and customary liability provisions.
The Forward and Reverse MSAs also contain certain capacity reservation and minimum volume off‑take obligations on each party that reflect the movement of products in the transfer plan and the agreed use of existing capacities at the related sites. Failure to meet volume forecasts and minimum off‑take obligations will result in price adjustment and take or pay obligations in respect of certain products.
The manufacturing and supply obligations will generally be performed under the Forward and Reverse MSAs on the basis of total product cost plus a margin with certain adjustments where volume, inflation and materials cost criteria are met. Certain products are to be supplied from Novartis to Alcon through toll manufacturing.
Transitional Services Agreement
We entered into a Transitional Services Agreement with Novartis prior to completion of the Spin‑off pursuant to which we and Novartis, to the extent that shared business functions have not been separated prior to the Spin‑off, each provide to the other various services and support on an interim transitional basis until such time as we (or Novartis in the case of services we will provide to Novartis) have developed the capability to provide the relevant services and support ourselves or have appointed a third party provider to provide those services and support.
The Transitional Services Agreement sets forth the agreement with Novartis regarding the provision of these transitional services and support. The Transitional Services Agreement is two‑way and reciprocal. Services and support are provided on substantially the same basis as prior to the Spin‑off. The charges for the services are on a costs‑plus basis (with a mark‑up to reflect the management and administrative cost of providing the services). The services generally commenced on the date of the Spin‑off and are intended to terminate within 24 months of the date of the Spin‑off. The recipient of the services will generally have the ability to: (i) extend the term that a service is provided for, subject to a maximum aggregate service term of 24 months; and (ii) terminate a service early in whole or, with the service provider’s agreement, in part, in each case subject to a specified notice period. Each party has standard termination rights for unremedied material breach or insolvency.
Subject to standard limitations and exceptions, the liability of each of Alcon and Novartis as service provider under the Transitional Services Agreement is capped, for all claims in each 12 month period of the agreement, at the level of service charges payable to the service provider in that 12 month period.
The services and support provided by Novartis to us includes: information technology, human resources, real estate and facilities, non‑strategic corporate services and financial reporting and accounting services. The services to be provided by us to Novartis include information technology and real estate and facilities support.
IP Arrangements
Assignment of Alcon intellectual property rights
.
We entered into assignment agreements with Novartis prior to, or with effect from, completion of the Spin‑off, under which:
|
•
|
Novartis transferred to us: (i) all intellectual property rights owned by the Novartis Group and used exclusively within the Alcon Division; and (ii) certain intellectual property rights owned by the Novartis Group used within both the Alcon Division and the other businesses of Novartis including, but not limited to, the Alcon brand; and
|
|
•
|
We transferred to Novartis: (i) all intellectual property rights owned by Alcon and used exclusively within the Novartis businesses; and (ii) certain intellectual property rights owned by the Alcon group used within both the Alcon Division and the other businesses of Novartis.
|
Perpetual shared intellectual property rights license agreements
.
In connection with any intellectual property rights owned by Alcon or Novartis and which are used by both Alcon and Novartis in our respective businesses following the completion of the Spin‑off, we entered into reciprocal licenses with Novartis under which we and Novartis were each granted the right to
146
continue to use those shared intellectual property rights in connection with our respective businesses. The intellectual property rights covered by these licenses will include trade‑marks, patents, know‑how and other forms of intellectual property rights. The licenses are on a perpetual, worldwide, and royalty‑free basis. The licenses contain standard termination rights for material breach or insolvency.
Transitional trademark license agreements
.
We agreed with Novartis that we will each phase out our respective use of a limited number of corporate and product marks which are owned by the other party following completion of the Spin‑off. We entered into reciprocal transitional trademark license agreements with Novartis under which each party grants the other a royalty‑free, worldwide non‑exclusive license to use certain corporate and product trademarks following the Spin‑off on substantially the same basis as currently used. Each license permits the licensee to continue using the licensed trademarks for a transitional period to provide the licensee with sufficient time to rebrand or phase out its use of the licensed trademarks, subject in most cases to a longstop date of three years. The licenses contain standard termination rights for material breach or insolvency.
Trademark co‑existence agreement
.
In addition, we entered into a perpetual co‑existence agreement with Novartis regulating our respective use of the Alcon CIBA VISION and Novartis CIBA brands with the objective of mitigating any potential customer confusion in connection with our respective use of those brands and addressing certain related trade mark formalities, including in connection with the registration of new trade mark applications.
2019 Bond Offering
On September 23, 2019, Alcon Finance Corporation (the “Issuer”), an indirect, wholly owned subsidiary of Alcon, completed an offering of $500,000,000 aggregate principal amount of its 2026 Notes, $1,000,000,000 aggregate principal amount of its 2029 Notes, and $500,000,000 aggregate principal amount its 2049 Notes. The Notes were issued under an Indenture, dated September 23, 2019 (the “Indenture”), by and among the Issuer, Alcon Inc. and Citibank, N.A., as trustee (the “Trustee”). The Notes are senior unsecured obligations of the Issuer and are fully and unconditionally guaranteed on a senior basis by Alcon.
Interest is payable on the Notes on March 23 and September 23 of each year, beginning on March 23, 2020. The 2026 Notes will mature on September 23, 2026, the 2029 Notes will mature on September 23, 2029 and the 2049 Notes will mature on September 23, 2049.
The Issuer may redeem the 2026 Notes prior to July 23, 2026 (the date that is two months prior to their maturity date), the 2029 Notes prior to June 23, 2029 (the date that is three months prior to their maturity date) or the 2049 Notes prior to March 23, 2049 (the date that is six months prior to their maturity date) at a redemption price equal to 100% of the principal amount of the applicable series of Notes plus a “make-whole premium” and accrued and unpaid interest, if any, up to, but excluding, the redemption date. The Issuer may also redeem the 2026 Notes on or after the date that is two months prior to their maturity date, the 2029 Notes on or after the date that is three months prior to their maturity date or the 2049 Notes on or after the date that is six months prior to their maturity date at a redemption price equal to 100% of their principal amount plus accrued and unpaid interest, if any, to, but excluding, the redemption date.
In addition, the Issuer may redeem any series of the Notes at its option, in whole, but not in part, for cash, at any time prior to their respective maturities at a price equal to 100% of the outstanding principal amount of such Notes, plus accrued and unpaid interest, to, but excluding, the redemption date, if certain tax events occur that would obligate the Issuer to pay additional amounts as described in the Indenture.
Subject to certain limitations, in the event of a change of control triggering event, the Issuer will be required to make an offer to purchase each series of the Notes at a price equal to 101% of the principal amount of the Notes, plus accrued and unpaid interest, if any, to, but excluding, the date of repurchase.
The Indenture also contains certain limitations on the Issuer’s ability to incur liens, as well as customary events of default.
Bridge Loan, Term Loan and Revolving Credit Facilities
In connection with the Spin‑off, we entered into a $1.5 billion unsecured 364‑day bridge loan facility with two extension options, each for a period of 180 days (the “Bridge Facility”), a $0.5 billion unsecured three‑year term loan facility (“Facility A”), a $0.8 billion unsecured five‑year term loan facility (“Facility B”), a $0.4 billion (or the equivalent in EUR) unsecured five‑year term loan facility (“Facility C”) and a $1.0 billion unsecured five‑year committed multicurrency revolving credit facility (the “Revolving Facility” and, together with the Bridge Facility, Facility A, Facility B and Facility C, the “Facilities” and the related agreement, the “Group Facilities Agreement”).
We and certain of our subsidiaries are borrowers under the Facilities. We guarantee the borrowings of such subsidiaries under the Facilities. In addition, the Revolving Facility includes a mechanism through which certain of our subsidiaries, as approved by the lenders, can accede as a borrower.
147
Prior to the Spin‑off, we borrowed an aggregate of approximately $3.2 billion under the Facilities and paid to Novartis approximately $3.0 billion of the net proceeds of the Bridge Facility, Facility A, Facility B and Facility C, including in satisfaction of certain intercompany indebtedness owed by Alcon and its subsidiaries to Novartis and its affiliates. We retained the remaining net proceeds of such Facilities for general corporate and working capital purposes. In September 2019, we used the proceeds of our Notes Offering to pay off in full the Bridge Facility and Facility A. The Bridge Facility and Facility A are no longer available to us for borrowings.
We are permitted to voluntarily prepay loans under the Facilities, in whole or in part, without penalty or premium subject to certain minimum prepayment amounts and the payment of accrued interest on the amount prepaid and customary breakage costs.
The terms of the Facilities include certain events of default and covenants customary for investment grade credit facilities, including restrictive covenants that limit, among other things, the grant or incurrence of security interests over any of our assets, the incurrence of certain indebtedness and entry into certain fundamental change transactions. The Facilities do not contain any financial covenants.
The Facilities bear interest at a rate equal to the interest rate benchmark (EURIBOR in the case of loans denominated in EUR, USD LIBOR in the case of loans denominated in USD and CHF LIBOR in the case of loans denominated in CHF), plus an applicable margin.
As of December 31, 2019, $1.2 billion of borrowings was outstanding under the Facilities. Such indebtedness requires us to dedicate a portion of our future cash flows to payments on our debt, reducing our ability to use our cash flows to pay dividends, fund capital expenditures, BD&L or other strategic transactions, working capital and other general operational requirements.
|
10.D.
|
EXCHANGE CONTROLS
|
There are no Swiss governmental laws, decrees or regulations that restrict, in a manner material to Alcon, the export or import of capital, including any foreign exchange controls, or that generally affect the remittance of dividends or other payments to non-residents or non-citizens of Switzerland who hold Alcon shares.
|
10.E.
|
TAXATION
|
The taxation discussion set forth below is intended only as a descriptive summary and does not purport to be a complete analysis or listing of all potential tax effects relevant to the ownership or disposition of our shares. The statements of US and Swiss tax laws set forth below are based on the laws and regulations in force as of the date of this Annual Report, including the current Convention Between the United States and the Swiss Confederation for the Avoidance of Double Taxation with Respect to Taxes on Income, entered into force on December 19, 1997 (the "Treaty"), and the US Internal Revenue Code of 1986, as amended (the "Code"), Treasury Regulations, rulings, judicial decisions and administrative pronouncements, and may be subject to any changes in US and Swiss law, and in any double taxation convention or treaty between the United States and Switzerland occurring after that date, which changes may have retroactive effect.
Swiss Taxation
The following is a general summary of certain tax consequences relating to owning and disposing of Alcon shares based on the Swiss tax laws and regulations and regulatory practices in force on the date of this Annual Report. Tax consequences are subject to changes in applicable law (or subject to changes in interpretation), including changes that could have a retroactive effect.
This is not a complete summary of the potential Swiss tax effects relevant to the Alcon shares nor does the summary take into account or discuss the tax laws of any jurisdiction other than Switzerland. For example, this summary does not address estate, gift, inheritance, capital or wealth taxes. It also does not take into account investors' individual circumstances. This summary does not purport to be a legal opinion or to address all tax aspects that may be relevant to any particular investor.
YOU ARE URGED TO CONSULT YOUR OWN TAX ADVISOR WITH RESPECT TO ACQUIRING, OWNING AND DISPOSING OF ALCON SHARES.
Swiss Residents
Withholding Tax on Dividends
Dividends that we pay and any similar cash or in-kind distributions we may make to a holder of our shares (including distributions of liquidation proceeds in excess of the nominal value, stock dividends and, under certain circumstances, proceeds from repurchases of shares by us in excess of the nominal value) are generally subject to a Swiss federal withholding tax (the "Withholding Tax") at a current rate of 35%. Under certain circumstances distributions out of capital contribution
148
reserves made by shareholders after December 31, 1996 are exempt from the Withholding Tax. We are required to withhold this Withholding Tax from the gross distribution and to pay the Withholding Tax to the Swiss Federal Tax Administration. The Withholding Tax is refundable in full to Swiss residents who are the beneficial owners of the taxable distribution at the time it is resolved and duly report the gross distribution received on their personal tax return or in their financial statements for tax purposes, as the case may be.
The Swiss corporate tax reform, which entered into force on January 1, 2020, requires that Swiss listed companies must make distributions as dividends subject to Withholding Tax to the extent distributions are made out of capital contribution reserves, which, as described above, are not subject to Withholding Tax.
Swiss Issuance Stamp Duty
Switzerland levies a one-time Issuance Stamp Duty (
Emissionsabgabe
) on the issuance of corporate equity capital by Swiss companies. A 1% Swiss Issuance Stamp Duty applies to capital contributions received for the issuance of corporate shares, non-voting shares, participation rights, as well as informal capital contributions in cash or in kind for no consideration.
Swiss Transfer Stamp Duty upon Transfer of Securities
The sale of our shares, whether by Swiss residents or Non-resident Holders, may be subject to federal securities Transfer Stamp Duty (
Umsatzabgabe
) of 0.15%, calculated on the gross sale proceeds, if the sale occurs through or with a Swiss bank or other Swiss securities dealer (
Effektenhändler
), as defined in the Swiss Federal Stamp Duty Act. The Transfer Stamp Duty has to be paid by the securities dealer and may be charged to the parties in a taxable transaction who are not securities dealers. In addition to this Transfer Stamp Duty, the sale of shares by or through a member of the SIX may be subject to a minor stock exchange levy.
Income Tax on Dividends
A Swiss Holder who holds Alcon shares as private assets ("Swiss Resident Private Shareholder") is required to report the receipt of dividends and similar distributions (including stock dividends and liquidation surplus) in its individual income tax returns and is subject to Swiss federal, cantonal and communal income tax on any net taxable income for the relevant tax period.
A Swiss Holder who is Swiss resident for tax purposes, a non-Swiss individual who is subject to Swiss income tax for reasons other than residency and a legal entity tax resident in Switzerland, in each case that holds Alcon shares as business assets, and a non-Swiss tax resident legal entity that holds Alcon shares as part of a Swiss permanent establishment or fixed place of business (each, a "Swiss Resident Commercial Shareholder") is required to recognize dividends and similar distributions (including stock dividends and liquidation surplus) on Alcon shares in its income statement for the relevant taxation period and is subject to Swiss federal, cantonal and communal individual or corporate income tax, as the case may be, on any net taxable earnings for such taxation period. The same tax treatment also applies to a Swiss Holder who, for income tax purposes, is classified as a "professional securities dealer" for reasons of,
inter alia,
frequent dealing, or leveraged investments, in shares and other securities. Swiss Resident Commercial Shareholders who are corporate taxpayers may be eligible for a participation deduction (
Beteiligungsabzug
) in respect of dividends if the Alcon shares held by them as part of a Swiss business have an aggregate market value of at least CHF 1 million.
Taxes upon Disposition of Alcon Shares
Capital gains realized on the sale or other disposal of Alcon shares held by a Swiss Resident Private Shareholder are generally not subject to any federal, cantonal or communal income taxation. However, gain realized upon a repurchase of shares by us may be characterized as taxable dividend income if certain conditions are met. Capital gains realized on shares held by a Swiss Resident Commercial Shareholder are, in general, included in the taxable income of such person.
Residents of Other Countries
Recipients of dividends and similar distributions on our shares who are neither residents of Switzerland for tax purposes nor holding shares as part of a business conducted through a permanent establishment situated in Switzerland ("Non-resident Holders") are not subject to Swiss income taxes in respect of such distributions. Moreover, gain realized by such recipients upon the disposal of our shares is not subject to Swiss income tax.
Non-resident Holders of our shares are, however, subject to the Withholding Tax on dividends and similar distributions mentioned above and under certain circumstances to the Transfer Stamp Duty described above. Such Non-resident Holders may be entitled to a partial refund of the Withholding Tax if the country in which they reside has entered into a bilateral treaty for the avoidance of double taxation with Switzerland. Non-resident Holders should be aware that the procedures for claiming treaty refunds (and the time frame required for obtaining a refund) may differ from country to country. Non-resident Holders should consult their own tax advisors regarding the receipt, ownership, purchase, sale or other dispositions of our shares and the procedures for claiming a refund of the Withholding Tax.
149
A Non-resident Holder of our shares will not be liable for any Swiss taxes other than the Withholding Tax described above and, if the transfer occurs through or with a Swiss bank or other Swiss securities dealer, the Transfer Stamp Duty described above. If, however, the shares of Non-resident Holders can be attributed to a permanent establishment or a fixed place of business maintained by such person within Switzerland during the relevant tax year, the shares may be subject to Swiss income taxes in respect of income and gains realized on the shares and such person may qualify for a full refund of the Withholding Tax based on Swiss tax law.
Residents of the United States
Non-resident Holders who are residents of the United States for purposes of the Treaty are eligible for a reduced rate of tax on dividends equal to 15% of the dividend, provided that such holders qualify for benefits under the Treaty and do not conduct business through a permanent establishment or fixed base in Switzerland to which our shares are attributable. Such holders should consult their own tax advisors regarding their eligibility to claim the reduced rate and the procedures for claiming a refund of the amount of the Withholding Tax in excess of the 15% Treaty rate.
International Automatic Exchange of Information in Tax Matters
On November 19, 2014, Switzerland signed the Multilateral Competent Authority Agreement, which is based on article 6 of the OECD/Council of Europe administrative assistance convention and is intended to ensure the uniform implementation of automatic exchange of information (the "AEOI"). The Federal Act on the International Automatic Exchange of Information in Tax Matters (the "AEOI Act") entered into force on January 1, 2017. The AEOI Act is the legal basis for the implementation of the AEOI standard in Switzerland.
The AEOI is being introduced in Switzerland through bilateral agreements or multilateral agreements. The agreements have been, and will be, concluded on the basis of guaranteed reciprocity, compliance with the principle of specialty (i.e. the information exchanged may only be used to assess and levy taxes (and for criminal tax proceedings)) and adequate data protection. The United States is not a treaty state.
Based on such multilateral agreements and bilateral agreements and the implementing laws of Switzerland, Switzerland has begun to collect data in respect of financial assets (including shares) held in, and income derived thereon and credited to, accounts or deposits with a paying agent in Switzerland for the benefit of individuals resident in a EU member state or in a treaty state from, depending on the effective date of the respective agreement, 2017 or 2018, as the case may be, and will begin to exchange such data in 2018 or 2019, as the case may be.
US Federal Income Taxation
The following discussion is a general summary of the US federal income tax consequences of the ownership and disposition of our shares. It applies only to US Holders (as defined below) that hold our shares as capital assets (generally, property held for investment purposes) and is of a general nature. This summary should not be construed to constitute legal or tax advice to any particular US Holder.
This summary does not apply to or address US Holders subject to special rules, including, without limitation, brokers, dealers in securities or currencies, traders in securities that elect to use a mark-to-market method of accounting for securities holdings, tax-exempt organizations, insurance companies, banks, thrifts and other financial institutions, persons liable for alternative minimum tax, persons that hold an interest in an entity that holds our shares, persons that will own, or will have owned, directly, indirectly or constructively 10% or more (by vote or value) of our stock, persons that hold our shares as part of a hedging, integration, conversion or constructive sale transaction or a straddle, or persons whose functional currency is not the US dollar.
This summary does not purport to be a complete analysis of all of the potential US federal income tax considerations that may be relevant to US Holders in light of their particular circumstances. Further, it does not address any aspect of foreign, state, local or estate or gift taxation or the 3.8% surtax imposed on certain net investment income.
Each holder of our shares should consult its own tax advisor as to the US federal, state, local, foreign and any other tax consequences of the ownership and disposition of our shares
.
This summary is based on the Code, its legislative history, US Treasury Regulations, IRS rulings, published court decisions, and the Treaty, all as in effect as of the date hereof, and any of which may be repealed, revoked or modified (possibly with retroactive effect) so as to result in US federal income tax consequences different from those discussed below. This summary is applicable to US Holders who are residents of the United States for purposes of the Treaty and who qualify for the full benefits of the Treaty.
A “US Holder” is a beneficial owner of our shares who, for US federal income tax purposes, is a citizen or individual resident of the United States, a corporation (or other entity that is classified as a corporation for US federal income tax purposes) that is created or organized in or under the laws of the United States or any State thereof or the District of Columbia, an estate whose income is subject to US federal income tax regardless of its source, or a trust (i) if a US court can exercise primary supervision over the trust’s administration and one or more US persons are authorized to control all substantial decisions of the trust, or (ii) that validly elects to be treated as a US person for US federal income tax purposes.
150
If a partnership or other pass-through entity holds our shares, the US federal income tax treatment of a partner, beneficiary, or other stakeholder in such pass-through entity will generally depend on the status of that person and the tax treatment of the pass-through entity. A partner, beneficiary, or other stakeholder in a pass-through entity holding our shares should consult its own tax advisor with regard to the US federal income tax treatment of its investment in our shares.
Distributions on the Shares
Subject to the passive foreign investment company (“PFIC”) rules discussed below, the gross amount of any distribution received by a US Holder with respect to our shares (including any amounts withheld to pay Swiss withholding taxes) will be included in the gross income of the US Holder as a dividend to the extent attributable to the Company’s current or accumulated earnings and profits, as determined under US federal income tax principles. The Company may not calculate its earnings and profits under US federal income tax rules. Accordingly, US Holders should expect that a distribution generally will be treated as a dividend for US federal income tax purposes. Unless the Company is treated as a PFIC for the taxable year in which it pays a distribution or in the preceding taxable year (see “Passive foreign investment company rules” below), the Company believes that it may qualify as a “qualified foreign corporation,” in which case distributions treated as dividends and received by non-corporate US Holders may be eligible for a preferential tax rate. Distributions on our shares generally will not be eligible for the dividends received deduction available to US Holders that are corporations.
The amount of any dividend paid in Swiss francs (including any amounts withheld to pay Swiss withholding taxes) will equal the US dollar value of the Swiss francs calculated by reference to the exchange rate in effect on the date the dividend is actually or constructively received by the US Holder, regardless of whether the Swiss francs are converted into US dollars. A US Holder will have a tax basis in the Swiss francs equal to their US dollar value on the date of receipt. If the Swiss francs received are converted into US dollars on the date of receipt, the US Holder should generally not be required to recognize foreign currency gain or loss in respect of the distribution. If the Swiss francs received are not converted into US dollars on the date of receipt, a US Holder may recognize foreign currency gain or loss on a subsequent conversion or other disposition of the Swiss francs. Such gain or loss will be treated as US source ordinary income or loss.
A US Holder may be entitled to deduct or credit Swiss withholding tax imposed on dividends paid to a US Holder, subject to applicable limitations in the Code. The rules governing the foreign tax credit are complex. US Holders are urged to consult their own tax advisors regarding the availability of the foreign tax credit under their particular circumstances.
Sale, Exchange or Other Taxable Disposition of Our Shares
Subject to the PFIC rules discussed below, a US Holder will recognize a capital gain or loss on the sale, exchange or other taxable disposition of our shares in an amount equal to the difference between the amount realized for the shares and the US Holder’s adjusted tax basis in the shares. Capital gains of non-corporate US Holders derived with respect to capital assets held for more than one year are eligible for reduced rates of taxation. The deductibility of capital losses is subject to limitations. Any capital gain or loss recognized by a US Holder generally will be treated as US source gain or loss for US foreign tax credit purposes.
Passive Foreign Investment Company Rules
A foreign corporation will be considered a PFIC for any taxable year in which (i) 75% or more of its gross income is “passive income” or (ii) 50% or more of the average quarterly value of its assets produce (or are held for the production of) “passive income.” For this purpose, “passive income” generally includes interest, dividends, rents, royalties and certain gains. We currently do not believe that we were a PFIC in the taxable year ending December 31, 2019, nor do we anticipate that we will be a PFIC in the current taxable year or in future taxable years. However, the determination as to whether we are a PFIC for any taxable year is based on the application of complex US federal income tax rules, which are subject to differing interpretations, and is not determinable until after the end of such taxable year. Further, the determination is based in part on the mix, use and value of our assets, which values may be treated as changing for US federal income tax purposes as our market capitalization changes. Because of the above described uncertainties, there can be no assurance that the IRS will not challenge the determination made by us concerning our PFIC status or that we will not be a PFIC for any taxable year. If we were classified as a PFIC in any taxable year during which a US Holder owns our shares, certain adverse tax consequences could apply to such US Holder. Certain elections may be available to US Holders of our shares that may mitigate some of the adverse consequences resulting from our treatment as a PFIC. US Holders should consult their own tax advisors regarding the application of the PFIC rules to their investments in our shares and whether to make an election or protective election.
Required Disclosure with Respect to Foreign Financial Assets
Certain US Holders are required to report information relating to an interest in our shares, subject to certain exceptions (including an exception for shares held in accounts maintained by certain financial institutions), by attaching a completed IRS Form 8938, Statement of Specified Foreign Financial Assets, with their tax return for each year in which they hold an interest in our shares. US Holders should consult their own tax advisors regarding information reporting requirements relating to their ownership of our shares.
151
|
10.F.
|
DIVIDENDS AND PAYING AGENTS
|
Not applicable.
|
10.G.
|
STATEMENTS BY EXPERTS
|
Not applicable.
|
10.H.
|
DOCUMENTS ON DISPLAY
|
We maintain a website at the following address:
www.alcon.com
. The information on our website is not incorporated by reference in this Annual Report. We make available on or through our website certain reports and amendments to those reports that we file with or furnish to the SEC in accordance with the Exchange Act. We make this information available on our website free of charge as soon as reasonably practicable after we electronically file the information with, or furnish it to, the SEC.
You may read and copy any reports or other information that we file through the Electronic Data Gathering, Analysis and Retrieval (EDGAR) system through the SEC’s website on the Internet at
www.sec.gov
.
We also make certain other documents available to the public (such as our Board committee charters, press releases, and investor presentations) on our website (
www.alcon.com
).
Any statement in this Annual Report about any of our contracts or other documents is not necessarily complete. If the contract or document is filed as an exhibit to this Annual Report, the contract or document is deemed to modify the description contained in this Annual Report. You must review the exhibits themselves for a complete description of the contract or document.
Unless stated otherwise in this Annual Report, none of these documents form part of this Annual Report.
|
10.I.
|
SUBSIDIARY INFORMATION
|
Not applicable.
|
ITEM 11.
|
QUANTITATIVE AND QUALITATIVE DISCLOSURES ABOUT MARKET RISK
|
The major financing risks faced by Alcon are managed by the Alcon treasury function. For information about the effects of currency and interest rate fluctuations and how we manage currency and interest risk, see "Item 5. Operating and Financial Review and Prospects—5.A. Operating Results" and "—5.B. Liquidity and Capital Resources". Please also see the information set forth under Note 18 to the Consolidated Financial Statements and related notes included elsewhere in this Annual Report.
152
|
ITEM 12.
|
DESCRIPTION OF SECURITIES OTHER THAN EQUITY SECURITIES
|
|
12.A.
|
DEBT SECURITIES
|
Not applicable.
|
12.B.
|
WARRANTS AND RIGHTS
|
Not applicable.
|
12.C.
|
OTHER SECURITIES
|
Not applicable.
|
12.D.
|
AMERICAN DEPOSITARY SHARES
|
Not applicable.
153
|
ITEM 13.
|
DEFAULTS, DIVIDEND ARREARAGES AND DELINQUENCIES
|
None.
154
|
ITEM 14.
|
MATERIAL MODIFICATIONS TO THE RIGHTS OF SECURITY HOLDERS AND USE OF PROCEEDS
|
None.
155
|
ITEM 15.
|
CONTROLS AND PROCEDURES
|
Disclosure Controls and Procedures
As of December 31, 2019, the end of the period covered by this Annual Report, our management, including our Chief Executive Officer and Chief Financial Officer, evaluated the effectiveness of our disclosure controls and procedures (as defined in Rule 13a-15(e) under the Exchange Act). Based upon that evaluation, our Chief Executive Officer and Chief Financial Officer concluded that as of December 31, 2019, the end of the period covered by this Annual Report, we maintained effective disclosure controls and procedures.
Management’s Annual Report on Internal Control Over Financial Reporting
This Annual Report does not include a report of management’s assessment regarding internal control over financial reporting due to a transition period established by rules of the SEC for newly public companies.
Attestation Report of the Registered Public Accounting Firm
This Annual Report does not include an attestation report of our registered public accounting firm due to a transition period established by rules of the SEC for newly public companies.
Changes in Internal Control Over Financial Reporting
There were no changes in our internal control over financial reporting (as defined in Rules 13a-15(f) under the Exchange Act) that occurred during the fiscal year ended December 31, 2019 that have materially affected, or were reasonably likely to materially affect, our internal control over financial reporting.
156
|
ITEM 16A.
|
AUDIT COMMITTEE AND FINANCIAL EXPERT
|
Our Board of Directors has determined that Lynn D. Bleil, Scott Maw, Karen May, and Dieter Spälti who serve on our Audit and Risk Committee ("ARC"), are independent for purposes of serving on the audit committee under Rule 10A-3 and the listing standards promulgated by the New York Stock Exchange, and are audit committee financial experts.
|
ITEM 16B.
|
CODE OF ETHICS
|
Our Chief Executive Officer, Chief Financial Officer, and Chief Accounting Officer are bound to adhere to our Code of Business Conduct, which applies to all of our associates and members of our Board of Directors. Our Code of Business Conduct is available on our website at
www.alcon.com/about-us/responsible-business-practice
.
|
ITEM 16C.
|
PRINCIPAL ACCOUNTANT FEES AND SERVICES
|
The information set forth under “Item 6. Directors, Senior Management and Employees—6.C. Board Practices—Corporate Governance—Auditors—Auditing Fees and Additional Fees" is incorporated by reference.
Policy on Audit and Risk Committee Pre-Approval of Services of Principal Accountant
The Audit and Risk Committee has established a written policy to pre-approve, on an annual basis, all anticipated audit and nonaudit services provided by our independent auditors (“Pre-Approval Policy”). These services may include audit services, audit-related services, tax services, and other services. Pre-approval is generally provided for up to 12 months from the date of pre-approval, and any pre-approval is detailed as to the particular service or category of services and is generally subject to a specific budget.
The Pre-Approval Policy provides that the independent auditors may not perform any services for Alcon unless the independent auditors are engaged pursuant to the Pre-Approval Policy. In addition, the Pre-Approval Policy prohibits the Audit and Risk Committee from pre-approving certain non-audit services that are prohibited from being performed by the independent auditors by applicable securities laws. Management is required to periodically report to the Audit and Risk Committee regarding the extent of services provided by the independent auditors. In 2019, all audit-related, tax and other services provided by PwC were pre-approved.
In connection with its review and evaluation of non-audit services, the Audit and Risk Committee is required to and does consider and conclude that the provision of the non-audit services is compatible with maintaining the independence of the independent auditor.
157
|
ITEM 16D.
|
EXEMPTIONS FROM THE LISTING STANDARDS FOR AUDIT COMMITTEES
|
Not applicable.
158
|
ITEM 16E.
|
PURCHASES OF EQUITY SECURITIES BY THE ISSUER AND AFFILIATED PURCHASERS
|
The following table sets forth purchases of our Ordinary Shares by us and our affiliated purchasers during the fiscal year ended December 31, 2019:
|
Period
|
Total Number of
Shares Purchased
|
Average Price
Paid per Share
(USD)
|
Total Number
of Shares
Purchased
as part of
Publicly
Announced
Plans or
Programs
|
Maximum Number (or Approximate
Dollar Value) of Shares that may yet be
Purchased Under the Plans or Programs
|
||
|
January 1-31
|
—
|
—
|
—
|
—
|
||
|
February 1-28
|
—
|
—
|
—
|
—
|
||
|
March 1-31
|
—
|
—
|
—
|
—
|
||
|
April 1-30
|
—
|
—
|
—
|
—
|
||
|
May 1-31
|
—
|
—
|
—
|
—
|
||
|
June 1-30
|
—
|
—
|
—
|
—
|
||
|
July 1-31
|
—
|
—
|
—
|
—
|
||
|
August 1-31
|
—
|
—
|
—
|
—
|
||
|
September 1-30
|
—
|
—
|
—
|
—
|
||
|
October 1-31
|
—
|
—
|
—
|
—
|
||
|
November 1-30
|
20,000
|
|
56.65
|
|
—
|
—
|
|
December 1-31
|
7,000
|
|
56.03
|
|
—
|
—
|
|
Total
|
27,000
|
|
56.49
|
|
—
|
—
|
159
|
ITEM 16F.
|
CHANGE IN REGISTRANT'S CERTIFYING ACCOUNTANT
|
Following the Spin-off of Alcon from Novartis, the Audit and Risk Committee determined that PricewaterhouseCoopers LLP (“PwC US”), the US member firm of PricewaterhouseCoopers International Limited (“PwCIL”), would become our Principal Auditor as set forth in the audit standard guidance of the Public Company Accounting Oversight Board (PCAOB). As required under Swiss law and as mandated by our shareholders, PricewaterhouseCoopers SA (“PwC CH”), the Swiss member firm of PwCIL, would remain the auditor under International Standards on Auditing (ISA) for purposes of the group and company statutory IFRS statements issued for SIX and Swiss regulatory purposes. Consequently, on April 29, 2019 the Committee approved the appointment of PwC US as our independent registered public accounting firm for the year ending December 31, 2019. Simultaneously, the Committee dismissed PwC CH as our independent registered public accounting firm.
The reports of PwC CH on our Consolidated Financial Statements as of and for the years ended December 31, 2017 and 2018 did not contain an adverse opinion or a disclaimer of opinion, and were not qualified or modified as to uncertainty, audit scope or accounting principles.
PwC US participated in a portion of the audit of our Consolidated Financial Statements for the years ended December 31, 2017 and 2018. During the Company’s fiscal years ended December 31, 2017 and 2018 and in the subsequent interim period through April 29, 2019, there were (i) no disagreements between the Company and PwC CH on any matter of accounting principles or practices, financial statement disclosure, or auditing scope or procedure, which disagreements, if not resolved to the satisfaction of PwC CH, would have caused PwC CH to make reference to the subject matter of the disagreements in its audit reports as defined in Item 16F(a)(1)(iv) of Form 20-F (and the related instructions thereto); and (ii) no “reportable events” as defined in Item 16F(a)(1)(v) of Form 20-F.
The Company has provided PwC CH with a copy of this Form 20-F and requested that PwC CH provide the Company with a letter addressed to the SEC stating whether it agrees with the above statements. A copy of PwC CH’s letter, dated February 25, 2020 is attached as Exhibit 15.3 to this Form 20-F.
During the Company’s fiscal years ended December 31, 2017 and 2018 and in the subsequent interim period through April 29, 2019, other than in the normal course of the audit, neither the Company nor anyone on its behalf consulted with PwC US, on either (i) the application of accounting principles to a specified transaction, either completed or proposed, or the type of audit opinion that might be rendered on the Company’s financial statements, and neither a written report nor oral advice was provided to the Company that PwC US concluded was an important factor considered by the Company in reaching a decision as to any accounting, auditing or financial reporting issue; or (ii) any matter that was either the subject of a “disagreement”, as defined in Item 16F(a)(1)(iv) of Form 20-F (and the related instructions thereto), or a “reportable event” as defined in Item 16F(a)(1)(v) of Form 20-F.
160
|
ITEM 16G.
|
CORPORATE GOVERNANCE
|
The information set forth under “Item 6. Directors, Senior Management and Employees—6.C. Board Practices—Corporate Governance—Differences from Corporate Governance Standards Relevant to US-listed Companies" is incorporated by reference.
|
ITEM 16H.
|
MINE SAFETY DISCLOSURE
|
Not applicable.
161
|
ITEM 17.
|
FINANCIAL STATEMENTS
|
See response to "Item 18. Financial Statements."
|
ITEM 18.
|
FINANCIAL STATEMENTS
|
Please refer to the financial statements beginning on page F-1 of this Annual Report.
162
|
ITEM 19.
|
EXHIBITS
|
|
Exhibit
Number
|
Description
|
||
|
1.1
|
|
||
|
1.2
|
|
||
|
2.1
|
|
||
|
2.2
|
|
The total amount of long-term debt securities authorized under any instrument does not exceed 10% of the total assets of Alcon and its subsidiaries on a consolidated basis. We hereby agree to furnish to the SEC, upon its request, a copy of any instrument defining the rights of holders of long-term debt of Alcon or of its subsidiaries for which consolidated or unconsolidated financial statements are required to be filed.
|
|
|
4.1
|
|
||
|
4.2
|
|
||
|
4.3
|
|
||
|
4.4
|
|
||
|
4.5
|
|
||
|
4.6
|
|
||
|
4.7
|
|
||
|
4.8
|
|
||
|
4.9
|
|
||
|
4.10
|
|
||
|
4.11
|
|
||
|
4.12
|
|
||
163
|
4.13
|
|
||
|
4.14
|
|
||
|
4.15
|
|
||
|
4.16
|
|
||
|
8.1
|
|
For a list of all principal subsidiaries of Alcon Inc., see "Item 18. Financial Statements-Note 28. Alcon subsidiaries".
|
|
|
12.1
|
|
||
|
12.2
|
|
||
|
13.1
|
|
||
|
13.2
|
|
||
|
15.1
|
|
||
|
15.2
|
|
||
|
15.3
|
|
||
|
101.SCH
|
|
Inline XBRL Taxonomy Extension Schema
|
|
|
101.CAL
|
|
Inline XBRL Taxonomy Extension Calculation
|
|
|
101.DEF
|
|
Inline XBRL Taxonomy Extension Definition
|
|
|
101.LAB
|
|
Inline XBRL Taxonomy Extension Label
|
|
|
101.PRE
|
|
Inline XBRL Taxonomy Extension Presentation
|
|
|
104
|
|
Cover Page Interactive Data File (formatted as Inline XBRL and contained in Exhibit 101)
|
|
164
Signatures
The registrant hereby certifies that it meets all of the requirements for filing on Form 20-F and that it has duly caused and authorized the undersigned to sign this registration statement on its behalf.
|
Alcon Inc.
|
|||
|
By:
|
/s/ David J. Endicott
|
||
|
|
Name:
|
David J. Endicott
|
|
|
|
Title:
|
Authorized Representative
|
|
|
By:
|
/s/ Timothy C. Stonesifer
|
||
|
|
Name:
|
Timothy C. Stonesifer
|
|
|
|
Title:
|
Authorized Representative
|
|
Date: February 25, 2020
165
CONSOLIDATED FINANCIAL STATEMENTS OF ALCON INC.
|
Audited Consolidated Financial Statements
|
|
|
Consolidated Income Statements
|
|
|
Consolidated Statements of Comprehensive (Loss)/Income
|
|
|
Consolidated Balance Sheets
|
|
|
Consolidated Statements of Changes in Equity
|
|
|
Consolidated Statements of Cash Flows
|
|
|
Notes to Consolidated Financial Statements
|
|
|
Report of Independent Registered Public Accounting Firm
|
|
|
Report of Predecessor Independent Registered Public Accounting Firm
|
|
F-1
CONSOLIDATED FINANCIAL STATEMENTS OF ALCON INC.
(For the years ended
December 31, 2019
,
2018
and
2017
)
|
($ millions except (loss)/earnings per share)
|
Note
|
2019
|
|
2018
|
|
2017
|
|
|||
|
Net sales to third parties
|
5
|
|
|
|
|
|
|
|||
|
Sales to former parent
|
25
|
|
|
|
|
|
|
|||
|
Other revenues
|
5
|
|
|
|
|
|
|
|||
|
Net sales and other revenues
|
|
|
|
|
|
|
||||
|
Cost of net sales
|
(
|
)
|
(
|
)
|
(
|
)
|
||||
|
Cost of other revenues
|
(
|
)
|
|
|
|
|
||||
|
Gross profit
|
|
|
|
|
|
|
||||
|
Selling, general & administration
|
(
|
)
|
(
|
)
|
(
|
)
|
||||
|
Research & development
|
(
|
)
|
(
|
)
|
(
|
)
|
||||
|
Other income
|
|
|
|
|
|
|
||||
|
Other expense
|
(
|
)
|
(
|
)
|
(
|
)
|
||||
|
Operating (loss)
|
(
|
)
|
(
|
)
|
(
|
)
|
||||
|
Interest expense
|
6
|
(
|
)
|
(
|
)
|
(
|
)
|
|||
|
Other financial income & expense
|
6
|
(
|
)
|
(
|
)
|
(
|
)
|
|||
|
(Loss) before taxes
|
(
|
)
|
(
|
)
|
(
|
)
|
||||
|
Taxes
|
7
|
(
|
)
|
|
|
|
|
|||
|
Net (loss)/income
|
(
|
)
|
(
|
)
|
|
|
||||
|
(Loss)/earnings per share
|
||||||||||
|
Basic
|
8
|
(
|
)
|
(
|
)
|
|
|
|||
|
Diluted
|
8
|
(
|
)
|
(
|
)
|
|
|
|||
|
Weighted average number of shares outstanding (millions)
(1)
|
||||||||||
|
Basic
|
8
|
|
|
|
|
|
|
|||
|
Diluted
|
8
|
|
|
|
|
|
|
|||
|
(1)
|
For periods prior to the Spin-off, the denominator for basic and diluted earnings per share was calculated using
|
The accompanying Notes form an integral part of the Consolidated Financial Statements.
F-2
CONSOLIDATED FINANCIAL STATEMENTS OF ALCON INC. (Continued)
CONSOLIDATED STATEMENTS OF COMPREHENSIVE (LOSS)/INCOME
(For the years ended
December 31, 2019
,
2018
and
2017
)
|
($ millions)
|
2019
|
|
2018
|
|
2017
|
|
||
|
Net (loss)/income
|
(
|
)
|
(
|
)
|
|
|
||
|
Other comprehensive income to be eventually recycled into the consolidated income statement:
|
||||||||
|
Fair value adjustments on marketable securities, net of taxes
(1)
|
|
|
|
|
|
|
||
|
Currency translation effects
|
(
|
)
|
(
|
)
|
|
|
||
|
Total of items to eventually recycle
|
(
|
)
|
(
|
)
|
|
|
||
|
Other comprehensive income never to be recycled into the consolidated income statement:
|
||||||||
|
Actuarial (losses)/gains from defined benefit plans, net of taxes
(2)
|
(
|
)
|
|
|
|
|
||
|
Fair value adjustments on equity securities, net of taxes
(3)
|
(
|
)
|
(
|
)
|
|
|
||
|
Total of items never to be recycled
|
(
|
)
|
(
|
)
|
|
|
||
|
Total comprehensive (loss)/income
|
(
|
)
|
(
|
)
|
|
|
||
|
(1)
|
|
|
(2)
|
Amounts are net of tax benefit of
$
|
|
(3)
|
Amount is net of tax benefit of
$
|
The accompanying Notes form an integral part of the Consolidated Financial Statements.
F-3
CONSOLIDATED FINANCIAL STATEMENTS OF ALCON INC. (Continued)
CONSOLIDATED BALANCE SHEETS
(At
December 31, 2019
and
2018
)
|
($ millions)
|
Note
|
2019
|
|
2018
|
|
||
|
Assets
|
|
|
|
||||
|
Non-current assets
|
|
|
|
||||
|
Property, plant & equipment
(1)(2)
|
9
|
|
|
|
|
||
|
Right-of-use assets
(1)(2)
|
16
|
|
|
|
|
||
|
Goodwill
|
10
|
|
|
|
|
||
|
Intangible assets other than goodwill
|
10
|
|
|
|
|
||
|
Deferred tax assets
|
11
|
|
|
|
|
||
|
Financial assets
|
12
|
|
|
|
|
||
|
Other non-current assets
|
12
|
|
|
|
|
||
|
Total non-current assets
|
|
|
|
|
|||
|
Current assets
|
|||||||
|
Inventories
|
13
|
|
|
|
|
||
|
Trade receivables
|
14
|
|
|
|
|
||
|
Receivables from former parent
|
25
|
|
|
|
|
||
|
Income tax receivables
|
|
|
|
|
|||
|
Other financial receivables from former parent
|
25
|
|
|
|
|
||
|
Cash and cash equivalents
|
18
|
|
|
|
|
||
|
Other current assets
|
15
|
|
|
|
|
||
|
Total current assets
|
|
|
|
|
|||
|
Total assets
|
|
|
|
|
|||
|
Equity and liabilities
|
|||||||
|
Equity
|
|||||||
|
Invested capital
|
|
|
|
|
|||
|
Share capital
|
8.1
|
|
|
|
|
||
|
Reserves
|
|
|
|
|
|||
|
Total equity
|
|
|
|
|
|||
|
Liabilities
|
|||||||
|
Non-current liabilities
|
|||||||
|
Financial debts
(1)(2)
|
17
|
|
|
|
|
||
|
Lease liabilities
(1)(2)
|
16
|
|
|
|
|
||
|
Deferred tax liabilities
|
11
|
|
|
|
|
||
|
Provisions and other non-current liabilities
|
19
|
|
|
|
|
||
|
Total non-current liabilities
|
|
|
|
|
|||
|
Current liabilities
|
|||||||
|
Trade payables
|
|
|
|
|
|||
|
Payables to former parent
|
25
|
|
|
|
|
||
|
Financial debts
|
17
|
|
|
|
|
||
|
Lease liabilities
|
16
|
|
|
|
|
||
|
Other financial liabilities to former parent
|
25
|
|
|
|
|
||
|
Current income tax liabilities
|
|
|
|
|
|||
|
Provisions and other current liabilities
|
20
|
|
|
|
|
||
|
Total current liabilities
|
|
|
|
|
|||
|
Total liabilities
|
|
|
|
|
|||
|
Total equity and liabilities
|
|
|
|
|
|||
|
(1)
|
Alcon adopted IFRS 16,
Leases
as of January 1, 2019 using the modified retrospective approach as described in Notes
3
and
16
to these Consolidated Financial Statements. Under the modified retrospective approach, comparative information was not restated.
|
|
(2)
|
The December 31, 2018 balances previously reported for a finance lease liability and corresponding asset of
$
|
The accompanying Notes form an integral part of the Consolidated Financial Statements.
F-4
CONSOLIDATED FINANCIAL STATEMENTS OF ALCON INC. (Continued)
CONSOLIDATED STATEMENTS OF CHANGES IN EQUITY
(For the years ended
December 31, 2019
,
2018
and
2017
)
|
($ millions)
|
Share Capital
|
|
Other Reserves
|
|
Former parent net investment
(1)
|
|
Fair value adjustments on marketable securities
|
|
Fair value adjustments on equity securities
|
|
Actuarial (losses)/gains from defined benefit plans
|
|
Cumulative currency translation effects
|
|
Total value adjustments
(2)
|
|
Equity
(1)
|
|
|
Balance as of January 1, 2017
|
|
|
|
|
|
|
|
|
|
|
(
|
)
|
(
|
)
|
(
|
)
|
|
|
|
Net income
|
|
|
|
|
||||||||||||||
|
Other comprehensive income
|
|
|
—
|
|
|
|
|
|
|
|
|
|
||||||
|
Total comprehensive income
|
—
|
|
—
|
|
|
|
|
|
—
|
|
|
|
|
|
|
|
|
|
|
Movements of financing provided to former parent, net
|
(
|
)
|
(
|
)
|
||||||||||||||
|
Other transactions with former parent
|
(
|
)
|
(
|
)
|
||||||||||||||
|
Total Other movements
|
—
|
|
—
|
|
(
|
)
|
—
|
|
—
|
|
—
|
|
—
|
|
—
|
|
(
|
)
|
|
Balance as of December 31, 2017, as previously reported
|
|
|
|
|
|
|
|
|
|
|
(
|
)
|
|
|
|
|
|
|
|
Impact of change in accounting policies
(3)
|
|
|
(
|
)
|
—
|
|
—
|
|
—
|
|
(
|
)
|
—
|
|
||||
|
Restated balance as of January 1, 2018
|
|
|
|
|
|
|
|
|
|
|
(
|
)
|
|
|
|
|
|
|
|
Net (loss)
|
(
|
)
|
(
|
)
|
||||||||||||||
|
Other comprehensive (loss)
|
—
|
|
—
|
|
(
|
)
|
|
|
(
|
)
|
(
|
)
|
(
|
)
|
||||
|
Total comprehensive (loss)
|
—
|
|
—
|
|
(
|
)
|
—
|
|
(
|
)
|
|
|
(
|
)
|
(
|
)
|
(
|
)
|
|
Movements of financing provided to former parent, net
|
(
|
)
|
(
|
)
|
||||||||||||||
|
Other transactions with former parent
|
|
|
|
|
||||||||||||||
|
Other movements
(4)
|
|
|
|
|
||||||||||||||
|
Total Other movements
|
—
|
|
—
|
|
(
|
)
|
—
|
|
—
|
|
—
|
|
—
|
|
—
|
|
(
|
)
|
|
Balance as of December 31, 2018
|
|
|
|
|
|
|
|
|
(
|
)
|
(
|
)
|
|
|
(
|
)
|
|
|
|
Net (loss)
|
(
|
)
|
(
|
)
|
|
|
|
|
|
(
|
)
|
|||||||
|
Other comprehensive (loss)
|
—
|
|
(
|
)
|
(
|
)
|
(
|
)
|
(
|
)
|
(
|
)
|
||||||
|
Total comprehensive (loss)
|
—
|
|
(
|
)
|
(
|
)
|
—
|
|
(
|
)
|
(
|
)
|
(
|
)
|
(
|
)
|
(
|
)
|
|
Movements of financing provided to former parent, net
|
(
|
)
|
(
|
)
|
||||||||||||||
|
Other transactions with former parent
|
(
|
)
|
(
|
)
|
||||||||||||||
|
Reclassification of deferred equity-compensation
|
(
|
)
|
(
|
)
|
||||||||||||||
|
Distribution by former parent of share capital
|
|
|
|
|
(
|
)
|
|
|
||||||||||
|
Equity-based compensation
|
|
|
—
|
|
|
|
||||||||||||
|
Other movements
(4)
|
|
|
|
|
|
|
||||||||||||
|
Total Other movements
|
|
|
|
|
(
|
)
|
—
|
|
—
|
|
—
|
|
—
|
|
—
|
|
(
|
)
|
|
Balance as of December 31, 2019
|
|
|
|
|
|
|
|
|
(
|
)
|
(
|
)
|
|
|
(
|
)
|
|
|
|
(1)
|
|
|
(2)
|
"Total value adjustments" recorded through Comprehensive Income are presented net of the corresponding tax effects.
|
|
(3)
|
|
|
(4)
|
Activity relates to hyperinflationary accounting (see Note
3
to the Consolidated Financial Statements).
|
The accompanying Notes form an integral part of the Consolidated Financial Statements.
F-5
CONSOLIDATED FINANCIAL STATEMENTS OF ALCON INC. (Continued)
(For the years ended
December 31, 2019
,
2018
and
2017
)
|
($ millions)
|
Note
|
2019
|
|
2018
|
|
2017
|
|
|||
|
Net (loss)/income
|
(
|
)
|
(
|
)
|
|
|
||||
|
Adjustments to reconcile net (loss)/income to net cash flows from operating activities
|
|
|
|
|||||||
|
Depreciation, amortization, impairments and fair value adjustments
|
21.1
|
|
|
|
|
|
|
|||
|
Equity-based compensation expense
|
|
|
|
|
|
|
||||
|
Non-cash change in provisions and other non-current liabilities
|
|
(
|
)
|
(
|
)
|
|
|
|||
|
Losses on disposal and other adjustments on property, plant & equipment and other non-current assets, net
|
|
|
|
|
|
|
|
|||
|
Interest expense
|
|
|
|
|
|
|
|
|||
|
Other financial income & expense
|
|
|
|
|
|
|
|
|||
|
Taxes
|
|
|
|
(
|
)
|
(
|
)
|
|||
|
Interest received
|
|
|
|
|
|
|
|
|||
|
Interest paid
|
|
(
|
)
|
(
|
)
|
(
|
)
|
|||
|
Other financial payments
|
|
(
|
)
|
(
|
)
|
(
|
)
|
|||
|
Taxes paid
|
|
(
|
)
|
(
|
)
|
(
|
)
|
|||
|
Net cash flows before working capital changes and net payments out of provisions and other non-current liabilities
|
|
|
|
|
|
|
||||
|
Net payments out of provisions and other cash movements in non-current liabilities
|
(
|
)
|
(
|
)
|
(
|
)
|
||||
|
Change in net current assets and other operating cash flow items
|
21.2
|
(
|
)
|
|
|
|
|
|||
|
Net cash flows from operating activities
|
|
|
|
|
|
|
||||
|
Purchase of property, plant & equipment
|
|
(
|
)
|
(
|
)
|
(
|
)
|
|||
|
Proceeds from sales of property, plant & equipment
|
|
|
|
|
|
|
|
|||
|
Purchase of intangible assets
|
|
(
|
)
|
(
|
)
|
(
|
)
|
|||
|
Purchase of financial assets
|
|
(
|
)
|
(
|
)
|
(
|
)
|
|||
|
Proceeds from sales of financial assets
|
|
|
|
|
|
|
|
|||
|
Purchase of other non-current assets
|
|
(
|
)
|
|
|
(
|
)
|
|||
|
Acquisitions of businesses, net
|
21.3
|
(
|
)
|
(
|
)
|
(
|
)
|
|||
|
Net cash flows used in investing activities
|
(
|
)
|
(
|
)
|
(
|
)
|
||||
|
Movements of financing provided to former parent, net
|
(
|
)
|
(
|
)
|
(
|
)
|
||||
|
Proceeds from non-current financial debts, net of issuance costs
|
21.4
|
|
|
|
|
|
|
|||
|
Proceeds from Bridge Facility, net of issuance costs
|
21.4
|
|
|
|
|
|
|
|||
|
Repayment of non-current financial debts
|
21.4
|
(
|
)
|
|
|
|
|
|||
|
Repayment of Bridge Facility
|
21.4
|
(
|
)
|
|
|
|
|
|||
|
Change in current financial debts
|
21.4
|
|
|
(
|
)
|
(
|
)
|
|||
|
Lease payments
|
(
|
)
|
|
|
|
|
||||
|
Change in other financial receivables from former parent
|
21.4
|
|
|
|
|
(
|
)
|
|||
|
Change in other financial liabilities to former parent
|
21.4
|
(
|
)
|
|
|
|
|
|||
|
Other financing cash flows
|
(
|
)
|
|
|
|
|
||||
|
Net cash flows from/(used in) financing activities
|
|
|
(
|
)
|
(
|
)
|
||||
|
Effect of exchange rate changes on cash and cash equivalents
|
|
|
(
|
)
|
|
|
||||
|
Net change in cash and cash equivalents
|
|
|
|
|
|
|
||||
|
Cash and cash equivalents at January 1
|
|
|
|
|
|
|
||||
|
Cash and cash equivalents at December 31
|
|
|
|
|
|
|
||||
The accompanying Notes form an integral part of the Consolidated Financial Statements.
F-6
NOTES TO CONSOLIDATED FINANCIAL STATEMENTS OF ALCON INC.
1
.
Description of business
Alcon Inc. (the "Company") and the subsidiaries it controls (collectively "Alcon") is a leading eye care company globally. Alcon is a multinational company specializing in the research, development, manufacturing and marketing of a broad range of eye care products within
two
businesses: Surgical and Vision Care. Alcon is a stock corporation organized under the laws of Switzerland, domiciled in Fribourg, Switzerland, with global headquarters located in Geneva, Switzerland.
On February 28, 2019, Novartis AG (“Novartis” or “Former Parent”) shareholders at their Annual General Meeting approved the proposed 100% spin-off of Alcon through the distribution of a dividend-in-kind of new Alcon shares to Novartis shareholders and Novartis American Depositary Receipt (“ADR”) holders (the “Spin-off”), subject to completion of certain conditions precedent to the distribution. Amendment No. 6 to the Company's Registration Statement on Form 20-F filed with the Securities and Exchange Commission ("SEC") on March 22, 2019, ("2018 Form 20-F"), was declared effective by the SEC on that same day. On April 9, 2019 (the “Distribution Date”), the Company became an independent, publicly-traded company as a result of the Spin-off and the shares of the Company are listed on the SIX Swiss Stock Exchange ("SIX") and on the New York Stock Exchange ("NYSE") under the symbol “ALC”. Each Novartis shareholder of record as of April 8, 2019 and each holder of Novartis’ ADR of record as of April 1, 2019 received one share of Alcon common stock for every
five
shares of Novartis common stock or Novartis ADR held.
The Consolidated Financial Statements of Alcon are comprised of Consolidated Balance Sheets as of
December 31, 2019
and
2018
and the Consolidated Income Statements, Consolidated Statements of Comprehensive (Loss)/Income, Consolidated Statements of Changes in Equity and Consolidated Statements of Cash Flows for the
three
years ended
December 31, 2019
,
2018
and
2017
.
2
.
Basis of preparation
The accompanying Consolidated Financial Statements present our historical financial position, results of operations, comprehensive income/(loss), and cash flows in accordance with International Financial Reporting Standards (“IFRS”) as issued by the International Accounting Standards Board (“IASB”), including the basis of preparation as described in this Note and with the accounting policies as described in Note
3
to these Consolidated Financial Statements.
The preparation of Consolidated Financial Statements requires management to make certain estimates and assumptions, either at the balance sheet date or during the year that affect the reported amounts of assets and liabilities as well as revenues and expenses. Actual outcomes and results could differ from those estimates and assumptions.
Relationship with Former Parent and affiliates prior to Spin-off
The financial statements for periods prior to the Spin-off were prepared on a combined basis because the business of Alcon did not form a separate legal group until the Spin-off occurred. The information in the financial statements for periods prior to the Spin-off was derived from Novartis’ Consolidated Financial Statements and accounting records, which were prepared in accordance with IFRS. Through the date of the Spin-off, all revenues and expenses as well as assets and liabilities directly associated with Alcon have been included in the financial statements. For periods prior to the Spin-off, the financial statements also include allocations of certain expenses for services provided by Novartis to Alcon and allocations of related assets, liabilities, and the Former Parent’s invested capital, as applicable. The allocations were determined on a reasonable basis; however, the amounts are not necessarily representative of the amounts that would have been reflected in the financial statements had Alcon been an entity that operated independently of Novartis during the applicable periods.
IFRS does not provide principles for the preparation of combined financial statements for carve-out financial statements, and accordingly in preparing the financial statements for periods prior to the Spin-off certain accounting and allocation conventions commonly used in practice for the preparation of carve-out financial statements were applied. The assets and liabilities included in the balance sheets prior to Spin-off were measured at the carrying amounts recorded in Novartis Group Consolidated Financial Statements.
F-7
NOTES TO CONSOLIDATED FINANCIAL STATEMENTS OF ALCON INC. (Continued)
The financial statements for periods prior to the Spin-off include all Alcon subsidiaries and all Alcon business operated within Novartis Group subsidiaries over which Alcon has control, by applying the principles of IFRS 10,
Consolidated Financial Statements
. Alcon controls an entity when it is exposed to, or has rights to, variable returns from its involvement with the entity and has the ability to affect those returns through its power over the entity.
The financial statements for the periods prior to the Spin-off include the assets and liabilities within Novartis subsidiaries that were attributable to the Alcon business and excluded the assets and liabilities within Alcon subsidiaries not attributable to the Alcon business.
In addition, the financial statements include, for the periods prior to the Spin-off, the assets, liabilities and results of operations of the ophthalmic over-the-counter products and a small portfolio of surgical diagnostics products that in connection with a Novartis Group business reorganization, effective as of January 1, 2018, were transferred to Alcon from the Innovative Medicines Division of Novartis.
Certain Novartis manufacturing sites performed production services for both the Alcon and Innovative Medicines Divisions of Novartis Group ("multi-divisional manufacturing sites"). The financial statements, for periods prior to the Spin-off include the carrying value of the manufacturing sites where the majority of the production is attributable to Alcon and where such sites were transferred to Alcon in connection with the Spin-off. The inventory, sales and production costs of these multi-divisional manufacturing sites that were attributable to the products of the Alcon and Innovative Medicines Divisions of Novartis Group were accounted for and reported separately by the Alcon and Innovative Medicines Divisions of Novartis Group within Novartis Group accounting systems. The supply chains of the Alcon and Innovative Medicines Divisions of Novartis Group each managed separately the distribution of their respective products produced in these multi-divisional manufacturing sites. As a result, there was no requirement for inter-divisional trading arrangements between the Alcon and Innovative Medicines Divisions of Novartis Group for the products produced in these multi-divisional manufacturing sites. Manufacturing costs attributable to the Alcon business' products produced in these multi-divisional manufacturing sites were recognized in the financial statements for periods prior to the Spin-off at cost of production.
For periods prior to the Spin-off, the financial statements include the attribution of certain assets and liabilities that were historically held at the Novartis corporate level that were specifically identifiable or attributable to Alcon on a standalone basis and were recognized on the pre-Spin-off balance sheets through retained earnings in invested capital. The most significant of which were defined benefit plans, current and deferred income taxes, financial debts, financial investments and the Alcon brand name. The Alcon brand name was used to market the products of Alcon and the products within Novartis Innovative Medicines Divisions' ophthalmology pharmaceutical business. The Novartis Group transferred the full rights to the Alcon brand name to Alcon in connection with the Spin-off. As a result, the carrying value of the Alcon brand name was fully attributed to Alcon in the financial statements.
The income and expenses related to the hedging transactions prior to the Spin-off were allocated to Alcon based on the estimated currency exposure of Alcon and are recorded to Other financial income & expense in the income statements and recognized directly through retained earnings in Invested capital.
The majority of Alcon's subsidiaries were party to Novartis cash pooling arrangements with several financial institutions to maximize the availability of cash for general operating and investing purposes. Under these cash pooling arrangements, cash balances were swept by Novartis regularly from Alcon's bank accounts. The net position with the Novartis cash pooling accounts at the end of each reporting period prior to the Spin-off are reflected in the balance sheet in Other financial receivables from former parent or Other financial liabilities to former parent.
Financing transactions between Novartis and Alcon, except for receivables and payables against the Novartis cash pool described above, were excluded from the financial statements in the periods prior to the Spin-off, as none of the financing transactions were specifically related to the operation of Alcon's business. The exclusion of these financing transactions was recognized through retained earnings in Invested capital.
Dividend and other equity transactions between Alcon and Novartis were recognized directly to retained earnings in Invested capital.
Novartis third-party debt and the related interest expense were not allocated to Alcon when Alcon's subsidiaries were not the legal obligor of the debt and when Novartis borrowings were not directly attributable to Alcon's
F-8
NOTES TO CONSOLIDATED FINANCIAL STATEMENTS OF ALCON INC. (Continued)
business. The financial statements for periods prior to the Spin-off include third-party debt and the related interest expense when Alcon's subsidiaries were the legal obligor of the debt and when the borrowings were directly attributable to Alcon's business. Refer to Note
17
to these Consolidated Financial Statements.
Both before and after the Spin-off, Alcon's associates participate in defined benefit pension and other postretirement plans sponsored by Novartis; in some countries these are single employer plans dedicated to the Alcon business associates and in other countries these are plans where associates of Alcon and associates of the Novartis Group are participants. The net defined benefit and other postretirement plan liabilities and pension costs attributable to Alcon are included in the Consolidated Financial Statements for periods prior to and after the Spin-off, to the extent that the corresponding pension obligations and plan assets under those plans transferred to Alcon at the time of Spin-off or will subsequently transfer pursuant to the Employee Matters Agreement entered into with Novartis. Refer to Note
23
to these Consolidated Financial Statements for additional disclosure on post-employment benefits for associates.
Income taxes attributable to the Alcon business in the financial statements were determined using the separate return approach, under which current and deferred income taxes are calculated as if a separate tax return had been prepared in each tax jurisdiction. In various tax jurisdictions, Alcon and Novartis businesses operated within the same legal entity and certain Alcon subsidiaries were part of a Novartis tax group. This required an assumption that the subsidiaries and operations of Alcon in those tax jurisdictions operated on a standalone basis and constitute separate taxable entities. Actual outcomes and results could differ from these separate tax return estimates, including those estimates and assumptions related to realization of tax benefits within these Novartis tax groups. Refer to Note
7
and Note
11
to these Consolidated Financial Statements for additional disclosures on income taxes.
Alcon's Invested capital in the financial statements for the periods prior to Spin-off represents the excess of total assets over total liabilities and, in addition to the items described above, was impacted by the following:
|
•
|
Currency translation adjustments of the Novartis Group multi-divisional subsidiaries were allocated between Alcon and the Novartis retained businesses by applying allocation keys based on net assets of each respective business.
|
|
•
|
Other transactions with Novartis Group as shown on the Consolidated Statements of Changes in Equity represents the movements in Invested capital resulting from the preparation of the financial statements in accordance with the basis of preparation described in this Note.
|
|
•
|
Movements of financing provided to Novartis Group as shown on the Consolidated Statements of Changes in Equity and on the Consolidated Statements of Cash Flows primarily represent the net contributions from Alcon to Novartis Group.
|
For the periods prior to the Spin-off, the financial statements include charges and allocation of expenses related to certain Novartis business support functions and Novartis corporate general and administration functions. Alcon considers the charges and allocation methodology and results to be reasonable. However, the charges and allocations may not be indicative of the actual expense that would have been incurred had Alcon operated as an independent, publicly traded company for the periods prior to the Spin-off. The following is a brief description of the nature of these charges and allocations:
|
•
|
Alcon received services from Novartis Business Services (“NBS”), the shared service organization of Novartis Group, across the following service domains: human resources operations, real estate and facility services, including site security and executive protection, procurement, information technology, commercial and medical support services and financial reporting and accounting operations. The financial statements include the appropriate costs related to the services rendered, without profit margin, in accordance with the historical arrangements that existed between Novartis and the Alcon business prior to the Spin-off. Refer to Note
25
to these Consolidated Financial Statements for additional disclosures.
|
|
•
|
Certain Novartis corporate general and administrative functions costs, in the areas of corporate governance, including board of directors, corporate responsibility and other corporate functions, such as tax, corporate governance and listed company compliance, investor relations, internal audit, treasury, communications functions and the net interest on the net defined benefit liability were not charged or allocated to the Alcon business in the past. The financial statements include a reasonable allocation of these Novartis corporate general and administrative functions costs and net interest on the net defined
|
F-9
NOTES TO CONSOLIDATED FINANCIAL STATEMENTS OF ALCON INC. (Continued)
benefit liability, based on reasonable assumptions and estimates. The corporate general and administrative function costs allocations were based on the direct and indirect costs incurred to provide the respective services. When specific identification was not practicable, a proportional cost allocation method was used, primarily based on sales, or headcount. Management believes that the allocations reasonably approximate the corporate general and administrative functions costs Alcon may have incurred had it operated as a standalone company. However, the allocations may not be indicative of the actual expense that would have been incurred had Alcon operated on a standalone basis prior to the Spin-off. Refer to Note
25
to these Consolidated Financial Statements for additional disclosures.
Management believes that all allocations were performed on a reasonable basis and reflect the services received by Alcon, the costs incurred on behalf of Alcon and the assets and liabilities of Alcon. Although the financial statements for the periods prior to the Spin-off reflect management's best estimate of all historical costs related to Alcon, this may not necessarily reflect what the results of operations, financial position, or cash flows would have been had Alcon been a separate entity prior to the Spin-off.
Agreements entered into between Alcon and Novartis in connection with the Spin-off govern the relationship between the parties following the Spin-off and provide for the allocation of various assets, liabilities, rights and obligations. These agreements also include arrangements for transition services to be provided on a temporary basis between the parties.
Following the Spin-off, the Consolidated Financial Statements include the accounts of Alcon and no longer include any allocations from Novartis.
3
.
Selected accounting policies
Principles of consolidation
The Consolidated Financial Statements include the accounts of the Company and its wholly owned subsidiaries. In the event that the Company has an interest in another entity that is not wholly owned, the assets, liabilities, results of operations and cash flows of such entity are included in the Company's Consolidated Financial Statements, if the Company is exposed or has rights to variable returns from its involvement with the entity and has the ability to affect those returns through its power over the entity. The Consolidated Financial Statements of the Company are prepared in accordance with IFRS as issued by the IASB. They are prepared in accordance with the historical cost convention except for items that are required to be accounted for at fair value. All intercompany transactions and accounts within Alcon were eliminated.
The Company's financial year-end is
December 31
, which is also the annual closing date of the individual entities' financial statements incorporated into the Consolidated Financial Statements.
Foreign currencies
The Consolidated Financial Statements are presented in US dollars ("USD"). The functional currency of individual entities incorporated into the Consolidated Financial Statements are generally the local currency of the respective entity. The functional currency used for the reporting of certain Swiss entities is USD instead of their respective local currencies. This reflects the fact that the cash flows and transactions of these entities are primarily denominated in these currencies.
For entities not operating in hyperinflationary economies, the entities results, financial position and cash flows that do not have USD as their functional currency are translated into USD using the following exchange rates:
|
•
|
Income, expense and cash flows using for each month the average exchange rate with the USD values for each month being aggregated during the year.
|
|
•
|
Balance sheets using year-end exchange rates.
|
|
•
|
Resulting exchange rate differences are recognized in other comprehensive income.
|
The hyperinflationary economies in which Alcon operates are Argentina and Venezuela. Venezuela was hyperinflationary for all years presented, and Argentina became hyperinflationary effective July 1, 2018, requiring retroactive implementation of hyperinflation accounting as of January 1, 2018.
F-10
NOTES TO CONSOLIDATED FINANCIAL STATEMENTS OF ALCON INC. (Continued)
The impact of the restatement of the non-monetary assets and liabilities with the general price index at the beginning of the period is recorded in "Other Reserves" in equity. The subsequent gains or losses resulting from the restatement of non-monetary assets are recorded in "Other financial income & expense" in the consolidated income statements.
Acquisition of assets
Acquired assets are initially recognized on the balance sheet at cost if they meet the criteria for capitalization. The capitalized cost of the asset includes the purchase price and any directly attributable costs for bringing the asset into the condition to operate as intended. Expected costs for obligations to dismantle and remove property, plant and equipment when it is no longer used are included in their cost.
Property, plant and equipment
Property, plant and equipment are depreciated on a straight-line basis over their estimated useful lives. Freehold land is not depreciated. The related depreciation expense is included in the costs of the functions using the asset or "Cost of net sales" in the consolidated income statements.
Property, plant and equipment are assessed for impairment whenever there is an indication that the balance sheet carrying amount may not be recoverable using cash flow projections for the useful life.
The following table shows the respective useful lives for property, plant and equipment:
|
|
Useful life
|
|
Buildings
|
20 to 40 years
|
|
Machinery and other equipment
|
|
|
Machinery and equipment
|
7 to 20 years
|
|
Furniture and vehicles
|
5 to 10 years
|
|
Computer hardware
|
3 to 7 years
|
Business combinations
The acquisition method of accounting is used to account for all business combinations, regardless of whether equity instruments or other assets are acquired. The consideration transferred for the acquisition of a subsidiary may include:
|
•
|
fair values of the assets transferred;
|
|
•
|
liabilities incurred to the former owners of the acquired business;
|
|
•
|
equity interests issued by the Company;
|
|
•
|
fair value of an asset or liability resulting from a contingent consideration arrangement; and
|
|
•
|
fair value of any pre-existing equity interest in the subsidiary.
|
Identifiable assets acquired and liabilities assumed in a business combination are measured initially at their fair values at the acquisition date. The excess of the consideration transferred over the fair value of the net identifiable assets acquired is recorded as goodwill, or directly in the income statement if it is a bargain purchase. Alcon primarily uses net present value techniques, utilizing post-tax cash flows and discount rates in calculating the fair value of net identifiable assets acquired when allocating the purchase consideration paid for the acquisition. The estimates in calculating fair values are highly sensitive and depend on assumptions, which includes the amount and timing of projected cash flows, long-term sales forecasts, the timing and probability of regulatory and commercial success, and the appropriate discount rate.
Acquisition related costs are expensed as incurred.
Goodwill and intangible assets
The
annual impairment testing date is Alcon's financial year-end, December 31.
F-11
NOTES TO CONSOLIDATED FINANCIAL STATEMENTS OF ALCON INC. (Continued)
Goodwill
Goodwill arises in a business combination and is the excess of the consideration transferred to acquire a business over the underlying fair value of the net identified assets acquired. It is allocated to groups of cash generating units ("CGUs") which are usually represented by the reported segments. Goodwill is tested for impairment annually at the level of these groups of CGUs, and any impairment charges are recorded under "Other expense" in the consolidated income statements.
Intangible assets available for use
Alcon has the following classes of available-for-use intangible assets: Currently marketed products, Marketing know-how, Technologies, Other intangible assets (including computer software) and the Alcon brand name.
Currently marketed products represent the composite value of acquired intellectual property, patents, and distribution rights and product trade names.
Marketing know-how represents the value attributable to the expertise acquired for marketing and distributing Alcon surgical products.
Technologies represent identified and separable acquired know-how used in the research, development and production processes.
Significant investments in internally developed and acquired software are capitalized and included in the "Other" category and amortized once available for use.
The Alcon brand name is shown separately as it is the only Alcon intangible asset that is available for use with an indefinite useful life. Alcon considers it appropriate that the brand name has an indefinite life since the branded products have a history of strong revenue and cash flow performance, and Alcon has the intent and ability to support the brand with spending to maintain its value for the foreseeable future.
Except for the Alcon brand name, intangible assets available for use are amortized over their estimated useful lives on a straight-line basis and evaluated for potential impairment whenever facts and circumstances indicate that their carrying value may not be recoverable. The Alcon brand name is not amortized, but evaluated for potential impairment annually.
The following table shows the respective useful lives for available-for-use intangible assets and the location in the consolidated income statements in which the respective amortization and any potential impairment charge is recognized:
|
|
Useful life
|
Income statement location for
amortization and impairment charges
|
|
Currently marketed products
|
5 to 20 years
|
"Cost of net sales"
|
|
Marketing know-how
|
25 years
|
"Cost of net sales"
|
|
Technologies
|
10 to 20 years
|
"Cost of net sales" or "Research and Development"
|
|
Other (including software)
|
3 to 10 years
|
In the respective functional expense
|
|
Alcon brand name
|
Not amortized, indefinite useful life
|
"Other expense"
|
From July 1, 2019, the useful life of Alcon's new SAP ERP software was extended from
7
years
to
10
years
on a prospective basis based on Alcon's multi-year transformation program which centers on one ERP platform across the organization. This change in estimate resulted in a
$
5
million
reduction in amortization expense during the six months ended December 31, 2019 and will reduce amortization expense up to
$
10
million
per year during the remaining useful life of the SAP ERP software assets placed in service at the time of the change.
The corresponding "Intangible assets available for use" portion of the accounting policy was updated to reflect that the useful life for Other intangible assets (including software) was extended from
3
to
7
years
to
3
to
10
years
.
F-12
NOTES TO CONSOLIDATED FINANCIAL STATEMENTS OF ALCON INC. (Continued)
Acquired In-Process Research & Development ("IPR&D")
Acquired research and development intangible assets, which are still under development and have accordingly not yet obtained marketing approval, are recognized as IPR&D.
IPR&D is not amortized, but evaluated for potential impairment on an annual basis or when facts and circumstances warrant. IPR&D is considered impaired when its balance sheet carrying amount exceeds its estimated recoverable amount, which is defined as the higher of its fair value less costs of disposal ("FVLCOD") and its value in use ("VIU"). Usually, Alcon applies the FVLCOD method for its impairment assessments. Under this approach when evaluating IPR&D for potential impairment, FVLCOD is estimated using net present value techniques utilizing post-tax cash flows and discount rates as there are no direct or indirect observable prices in active markets for identical or similar assets. The estimates used in calculating the net present values are highly sensitive and depend on assumptions, including amount and timing of projected future cash flows, long-term sales forecasts, discount rate, and the timing and probability of regulatory and commercial success. In the limited cases where the VIU method would be applied, net present value techniques would be applied using pre-tax cash flows and discount rates.
Any impairment charge is recorded in the consolidated income statements under "Research & development".
Once a project included in IPR&D has been successfully developed it is transferred to the "Currently marketed products" category.
Impairment of goodwill, Alcon brand name and definite lived intangible assets
An asset is considered impaired when its balance sheet carrying amount exceeds its estimated recoverable amount, which is defined as the higher of its FVLCOD and its VIU. If the recoverable amount of an asset is less than its carrying amount, the carrying amount of the asset shall be reduced to its recoverable amount. That reduction is an impairment loss. Usually, Alcon applies the FVLCOD method for its impairment assessment. In most cases no direct or indirect observable market prices for identical or similar assets are available to measure the fair value less costs of disposal. Therefore, an estimate of FVLCOD is based on net present value techniques utilizing post-tax cash flows and discount rates. In the limited cases where the VIU method would be applied, net present value techniques would be applied using pre-tax cash flows and discount rates.
FVLCOD reflects estimates of assumptions that market participants would be expected to use when pricing the asset or CGUs, and for this purpose management considers the range of economic conditions that are expected to exist over the remaining useful life of the asset.
The estimates used in calculating the net present values are highly sensitive and depend on assumptions, which includes the following:
|
•
|
Amount and timing of projected future cash flows;
|
|
•
|
Long-term sales forecasts for periods of up to 25 years including sales growth rates;
|
|
•
|
Royalty rate for the Alcon brand name;
|
|
•
|
Terminal growth rate; and
|
|
•
|
Discount rate.
|
Other assumptions used in the net present values calculation include:
|
•
|
Future tax rate;
|
|
•
|
Actions of competitors (launch of competing products, marketing initiatives, etc.); and
|
|
•
|
Outcome of R&D activities and forecast of related costs (future product developments).
|
Generally, for intangible assets with a definite useful life Alcon uses cash flow projections for the whole useful life of these assets. For goodwill and the Alcon brand name, Alcon generally utilizes cash flow projections for a
five
-year period based on management forecasts, with a terminal value based on cash flow projections considering the long-term expected inflation rates and impact of demographic trends of the population to which Alcon products are prescribed, for later periods. Probability-weighted scenarios are typically used.
F-13
NOTES TO CONSOLIDATED FINANCIAL STATEMENTS OF ALCON INC. (Continued)
Discount rates used consider Alcon estimated weighted average cost of capital adjusted for specific country and currency risks associated with cash flow projections to approximate the weighted average cost of capital of a comparable market participant. Actual cash flows and values could vary significantly from forecasted future cash flows and related values derived using discounting techniques.
Cash and cash equivalents
Cash and cash equivalents includes cash on hand, deposits held at call with financial institutions, and other short-term and highly liquid investments with original or weighted-average maturities of three months or less which are readily convertible to known amounts of cash and which are subject to an insignificant risk of changes in value. Bank overdrafts are usually presented within current financial debts on the consolidated balance sheets except in cases where a right of offset has been agreed with a bank which then allows for presentation on a net basis.
Financial assets
Non-current financial assets such as loans and long-term receivables from customers, primarily related to surgical equipment sales arrangements, advances and other deposits, are carried at amortized cost, which reflects the time value of money, less any allowances for uncollectable amounts.
Alcon assesses on a forward-looking basis the expected credit losses associated with its non-current financial assets valued at amortized cost.
For loans, advances and other deposits valued at amortized costs, impairments, which are based on their expected credit losses, and exchange rate losses are included in "Other expense" in the consolidated income statements and exchange rate gains and interest income, using the effective interest rate method, are included in "Other income" in the consolidated income statements.
For long-term receivables from customers, provisions for uncollectable amounts, which are based on their expected credit losses, are recorded as marketing and selling costs recognized in the consolidated income statements within "Selling, general & administration" expenses.
Fund investments are valued at fair value through profit and loss ("FVPL"). Unrealized gains and losses, including exchange gains and losses, are recognized in the consolidated income statements in "Other income" for gains and "Other expense" for losses.
Equity securities and convertible notes receivable held as strategic investments are generally designated at the date of acquisition as financial assets valued at fair value through other comprehensive income with no subsequent recycling through profit and loss. Unrealized gains and losses, including exchange gains and losses, are recorded as a fair value adjustment in the consolidated statements of comprehensive income. They are reclassified to "Other Reserves" when the equity security is sold. If these equity securities and convertible notes receivable are not designated at the date of acquisition as financial assets valued at fair value through other comprehensive income, they are valued at FVPL, as described above for fund investments. Changes in fair value of options to acquire development stage companies are charged to research and development expense.
Derivative financial instruments are initially recognized in the consolidated balance sheets at fair value and are remeasured to their current fair value at the end of each subsequent reporting period. The valuation of forward exchange rate contracts and foreign exchange swaps are based on the discounted cash flow model, using interest curves and spot rates at the reporting date as observable inputs. Unsettled forward contracts and swaps are measured at fair value at quarter-end with changes in fair value recorded to the consolidated income statements as unrealized gains or losses in "Other financial income & expense". Settled forward contracts and swaps are measured at maturity date at fair value with corresponding realized gains or losses recognized in the consolidated income statements in "Other financial income & expense". No hedge accounting is applied for these arrangements.
Inventories
Inventory is valued at acquisition or production cost determined on a first-in, first-out basis. This value is used for the "Cost of net sales" and "Cost of other revenues" in the consolidated income statements. Unsalable inventory is fully written off in the consolidated income statements under "Cost of net sales" and "Cost of other revenues."
F-14
NOTES TO CONSOLIDATED FINANCIAL STATEMENTS OF ALCON INC. (Continued)
Trade receivables
Trade receivables are initially recognized at their invoiced amounts, including any related sales taxes less adjustments for estimated revenue deductions such as chargebacks and cash discounts.
Provisions for expected credit losses are established using an expected credit loss model ("ECL"). The provisions are based on a forward-looking ECL, which includes possible default events on the trade receivables over the entire holding period of the trade receivable. These provisions represent the difference between the trade receivable's carrying amount in the consolidated balance sheets and the estimated net collectible amount. Charges for doubtful trade receivables are recorded as marketing and selling costs recognized in the consolidated income statements within "Selling, general & administration" expenses.
Leases
From January 1, 2019, with the implementation of the new standard IFRS 16,
Leases
, Alcon's accounting policy for leases is as follows:
As lessee, Alcon assesses whether a contract contains a lease at inception of a contract based on whether the contract conveys the right to control the use of an identified asset for a period of time in exchange for consideration. Alcon recognizes a right-of-use asset and a corresponding lease liability for all arrangements in which it is a lessee, except for leases with a term of twelve months or less (short-term leases) and low value leases for which Alcon has elected the recognition exemptions allowed under IFRS 16.
Right-of-use assets
Right-of-use assets are initially recognized at cost, which is comprised of the amount of the initial measurement of the corresponding lease liabilities, adjusted for any lease payments made at or prior to the commencement date of the lease, lease incentives received and initial direct costs incurred, as well as any expected costs for obligations to dismantle and remove right-of-use assets when they are no longer used.
Right-of-use assets are depreciated on a straight-line basis over the shorter of the useful life of the right-of-use asset or the end of the lease term.
Right-of-use assets are assessed for impairment whenever there is an indication that the balance sheet carrying amount may not be recoverable using cash flow projections for the useful life.
Lease liabilities
Lease liabilities are accounted for at amortized cost and are initially measured at the present value of future lease payments and are classified as current or non-current based on the due dates of the underlying principal payments. In determining the lease term, Alcon evaluates the renewal options and termination options reasonably certain to be exercised. Lease payments are discounted using the interest rate implicit in the lease or, if not readily determinable, the incremental borrowing rate Alcon would be expected to pay within the respective markets, on a borrowing with a similar term and security. Interest in the period is recorded within "Interest expense" in Alcon's consolidated income statements.
Lease liabilities are remeasured for changes in estimated lease term, future lease payments arising from a change in an index or rate, amounts expected to be payable under a residual value guarantee, or in assessment of whether Alcon will exercise a purchase, extension or termination option. Changes to initial lease contract terms are assessed to determine their impact on the scope of lease, and any modifications increasing the scope of the lease are treated as new contracts under the initial measurement principles, while modifications that do not increase or that decrease the scope of the lease result in an adjustment to the right-of-use asset which is remeasured as of the date of the modification.
Principal payments made on lease liabilities and any initial direct costs paid are classified as financing cash outflows, while interest payments are classified as operating cash outflows.
Payments associated with short-term leases and leases of low-value assets are recognized on a straight-line basis as an expense in the consolidated income statements and are classified as cash flows from operating activities. Short-term leases are leases with a lease term of twelve months in duration or less.
F-15
NOTES TO CONSOLIDATED FINANCIAL STATEMENTS OF ALCON INC. (Continued)
Prior to the adoption of IFRS 16 on January 1, 2019, Alcon's accounting policy for leases was as follows:
As lessee, Alcon classified leases of property, plant & equipment where Alcon had substantially all the risks and rewards of ownership as finance leases. Finance leases were capitalized at the lease's inception at the fair value of the leased asset or, if lower, the present value of the minimum lease payments. The corresponding lease liabilities, net of finance charges, were classified as current and non-current based on the due dates of the underlying principal payments. Each lease payment was allocated between the liability and interest expense. The interest expense was charged to Alcon's consolidated income statements over the lease period so as to produce a constant periodic rate of interest on the remaining balance of the liability for each period. The asset acquired under the finance lease was depreciated over the shorter of the asset’s useful life and the lease term.
Alcon classified leases in which a significant portion of the risks and rewards of ownership were not transferred to Alcon as operating leases. Payments made under operating leases (net of any incentives received from the lessor) were recognized in the consolidated income statements on a straight-line basis over the period of the lease.
Refer to the "Impact of adopting significant new IFRS standards in 2019" section in this Note and Note
16
for additional details on the impact of adoption.
Legal liabilities
Alcon and its subsidiaries are subject to contingencies arising in the ordinary course of business such as patent litigation and other product-related litigation, commercial litigation, and governmental investigations and proceedings. Provisions are recorded where a reliable estimate can be made of the probable outcome of legal or other disputes against the subsidiary.
Contingent consideration
In a business combination, it is necessary to recognize contingent future payments to previous owners representing contractually defined potential amounts as a liability. Usually for Alcon, these are linked to milestone or royalty payments related to certain assets and are recognized as a financial liability at their fair value, which is then re-measured at each subsequent reporting date.
For the determination of the fair value of a contingent consideration various unobservable inputs are used. A change in these inputs might result in a significantly higher or lower fair value measurement. The inputs used are, among others, the timing and probability of regulatory and commercial success, sales forecast and assumptions regarding the discount rate, timing and different scenarios of triggering events. The significance and usage of these inputs to each contingent consideration may vary due to differences in the timing and triggering events for payments or in the nature of the asset related to the contingent consideration. These estimations typically depend on factors such as technical milestones or market performance and are adjusted for the probability of their likelihood of payment, and if material, appropriately discounted to reflect the impact of time.
Changes in the fair value of contingent consideration liabilities in subsequent periods are recognized in the consolidated income statements in "Cost of net sales" for currently marketed products and in "Research & development" for IPR&D.
The effect of unwinding the discount over time is recognized in "Interest expense" in the consolidated income statements.
Defined benefit pension plans and other post-employment benefits
The liability or asset recognized in the balance sheet in respect of defined benefit pension plans and other post-employment benefits is the present value of the defined benefit obligation at the end of the reporting period less the fair value of plan assets. The defined benefit obligation is calculated annually by independent actuaries using the projected unit credit method.
The present value of the defined benefit obligation is determined by discounting the estimated future cash outflows using interest rates of high-quality corporate bonds that are denominated in the currency in which the benefits will be paid, and that have terms approximating to the terms of the related obligation. In countries where there is no sufficient market for such bonds, the market rates on government bonds are used.
F-16
NOTES TO CONSOLIDATED FINANCIAL STATEMENTS OF ALCON INC. (Continued)
The current service cost for such post-employment benefit plans is included in the personnel expenses of the various functions where the associates are employed. The net interest on the net defined benefit liability is recognized as "Other expense" or "Other income". The net interest cost is calculated by applying the discount rate to the net balance of the defined benefit obligation and the fair value of plan assets.
Remeasurement gains and losses arising from experience adjustments and changes in actuarial assumptions are recognized in the period in which they occur, directly in other comprehensive income/(loss).
Defined contribution plans
For defined contribution plans, Alcon contributes to publicly or privately administered plans. Alcon has no further payment obligations once the contributions have been paid. The contributions are included in the personnel expenses of the various functions where the associates are employed.
Financial debts
Financial debts are initially recognized at fair value, net of transaction costs incurred. Financial debts are subsequently measured at amortized cost. Any difference between the proceeds (net of transaction costs and discounts) and the redemption amount is recognized in the consolidated income statements over the period of the financial debts using the effective interest method. Fees paid on the establishment of credit facilities are recognized as transaction costs of the financial debt to the extent that it is probable that some or all of the facility will be drawn down. In this case, the fee is deferred until the draw down occurs. To the extent that there is no evidence that it is probable that some or all of the facility will be drawn down, the fee is capitalized as a prepayment for liquidity services and amortized over the period of the facility to which it relates, and is recognized in "Other financial income & expense" in the consolidated income statements.
Financial debts are derecognized from the balance sheet when the obligation specified in the contract is discharged, cancelled or expired. The difference between the carrying amount of a financial debt that has been extinguished and the consideration paid, including any non-cash assets transferred or liabilities assumed, is recognized in "Other financial income & expense" in the consolidated income statements.
Revenue
Net sales to third parties
Revenue on the sale of Alcon products and services, which is recorded as "Net sales to third parties" in the consolidated income statements, is recognized when a contractual promise to a customer (performance obligation) has been fulfilled by transferring control over the promised goods and services to the customer, substantially all of which is at the point in time of shipment to or receipt of the products by the customer or when the services are performed. If contracts contain customer acceptance provisions, revenue would be recognized upon the satisfaction of acceptance criteria. The amount of revenue to be recognized is based on the consideration Alcon expects to receive in exchange for its goods and services. If a contract contains more than one performance obligation, the consideration is allocated based on the relative standalone selling price of each performance obligation.
Surgical equipment may be sold together with other products and services under a single contract and may be structured as an outright cash sale, an installment sale, or lease. Surgical equipment installment sales and leases have a fixed payment amount which the customer may pay either in fixed intervals or as the customer purchases consumables and/or implantables. Revenues are recognized upon satisfaction of each of the performance obligations in the contract and the consideration is allocated based on the relative standalone selling price of each performance obligation.
|
•
|
Surgical equipment revenue from outright cash sales and installment sales arrangements is recognized at the point in time when control is transferred to the customer. Current portion of long-term receivables from customers and long-term receivables from customers for installment sales arrangements are recorded in "Other current assets" (see "Current portion of long-term receivables from customers" in Note
15
of these Consolidated Financial Statements) and "Financial assets" (see "Long-term receivables
|
F-17
NOTES TO CONSOLIDATED FINANCIAL STATEMENTS OF ALCON INC. (Continued)
from customers" in Note
12
of these Consolidated Financial Statements), respectively. Financing income for installment sales arrangements longer than twelve months is recognized over the term of the arrangement in "Other Income". Alcon applies the practical expedient under IFRS 15 to installment sales arrangements that are twelve months or less in duration.
|
•
|
In addition to cash and installment sales, revenue is recognized under finance and operating lease arrangements. Leases in which Alcon transfers substantially all the risks and rewards incidental to ownership to the customer are treated as finance lease arrangements. Revenue from finance lease arrangements is recognized at amounts equal to the fair value of the equipment, which approximates the present value of the minimum lease payments under the arrangements. As interest rates embedded in lease arrangements are approximately market rates, revenue under finance lease arrangements is comparable to revenue for outright sales. Finance income for arrangements longer than twelve months is deferred and subsequently recognized based on a pattern that approximates the use of the effective interest method and recorded in "Other income". Operating lease revenue for equipment rentals is recognized on a straight-line basis over the lease term in "Net sales to third parties".
|
The consideration Alcon receives in exchange for its goods or services may be fixed or variable. Variable consideration is only recognized when it is highly probable that a significant reversal of cumulative sales will not occur. The most common elements of variable consideration are listed below:
|
•
|
Rebates and discounts granted to government agencies, wholesalers, retail pharmacies and other customers are provisioned and recorded as a deduction from revenue at the time the related revenues are recorded or when the incentives are offered. They are calculated on the basis of historical experience and the specific terms in the individual agreements.
|
|
•
|
Cash discounts are offered to customers to encourage prompt payment and are provisioned and recorded as revenue deductions at the time the related sales are recorded.
|
|
•
|
Sales returns provisions are recognized and recorded as revenue deductions when there is historical experience of Alcon agreeing to customer returns and Alcon can reasonably estimate expected future returns. In doing so, the estimated rate of return is applied, determined based on historical experience of customer returns and considering any other relevant factors. This is applied to the amounts invoiced, also considering the amount of returned products to be destroyed versus products that can be placed back in inventory for resale. Where shipments are made on a re-sale or return basis, without sufficient historical experience for estimating sales returns, revenue is only recorded when there is evidence of consumption or when the right of return has expired.
|
Provisions for revenue deductions are adjusted to actual amounts as rebates, discounts and returns are processed. The provision represents estimates of the related obligations, requiring the use of judgment when estimating the effect of these sales deductions.
Prior to Alcon's adoption of IFRS 15 on January 1, 2018, Alcon's accounting policy for revenue recognition was substantially consistent with the revenue recognition principles under IFRS 15.
Other revenues
"Other revenues" include revenue from contract manufacturing services provided to the Former Parent which are recognized over time as the service obligations are completed and third party royalty income. Associated costs for contract manufacturing services are recognized in "Cost of other revenues".
Research & development
Internal research & development ("R&D") costs are fully charged to "Research & development" in the consolidated income statements in the period in which they are incurred. Alcon considers that regulatory and other uncertainties inherent in the development of new products preclude the capitalization of internal development expenses as an intangible asset until marketing approval from a regulatory authority is obtained in a major market such as the United States, the European Union, Switzerland or Japan.
Payments made to third parties to in-license or acquire intellectual property rights and products, including initial upfront and subsequent milestone payments, are capitalized as intangible assets. If additional payments are made to the originator company to continue to perform R&D activities, an evaluation is made as to the nature
F-18
NOTES TO CONSOLIDATED FINANCIAL STATEMENTS OF ALCON INC. (Continued)
of the payments. Such additional payments will be expensed if they are deemed to be compensation for subcontracted R&D services not resulting in an additional transfer of intellectual property rights to Alcon. Such additional payments will be capitalized if they are deemed to be compensation for the transfer to Alcon of additional intellectual property developed at the risk of the originator company. Subsequent internal R&D costs in relation to IPR&D and other assets are expensed until such time that technical feasibility can be proven, as demonstrated by the receipt of marketing approval for the related product from a regulatory authority in a major market.
Equity-based compensation
Each of the periods presented include expense related to incentive compensation provided to eligible Alcon associates in the form of equity-settled or equity-based awards including restricted stock units ("RSUs") and performance stock units ("PSUs").
Alcon expenses the fair values of RSUs and PSUs granted to associates as compensation over the related vesting periods within the various functions where the associates are employed. The fair values of the awards are determined on their grant dates and are adjusted to account for the specific provisions of each of the corresponding grant agreements.
Alcon RSUs do not entitle the recipients to dividends. As such, the fair value upon grant is therefore based on the Alcon share price at the grant date adjusted for potential future dividends to be paid within the holding period. The fair value of these grants, after making adjustments for assumptions related to their forfeiture during the vesting period, is expensed on a straight-line basis over the respective vesting period.
PSUs are subject to certain performance criteria being achieved during the vesting period and require plan participants to provide services during the vesting period. PSUs granted under Alcon's plans are subject to performance criteria based on internal performance metrics. The expense is determined taking into account assumptions concerning performance during the period relative to targets and expected forfeitures due to plan participants not meeting their service conditions. These assumptions are periodically adjusted. Any change in estimates for past services is recorded immediately as an expense or income in the consolidated income statements and amounts for future periods are expensed over the remaining vesting period. As a result, at the end of the vesting period, the total charge during the whole vesting period represents the amount that will finally vest. The number of equity instruments that finally vest is determined at the vesting date.
If a plan participant leaves Alcon for reasons other than retirement, disability or death, then unvested restricted shares, RSUs and PSUs are forfeited, unless determined otherwise by the provision of the plan rules or by the Compensation, Governance and Nomination Committee of the Alcon Board of Directors, for example, in connection with a reorganization.
Restructuring charges
Restructuring provisions are recognized for the direct expenditures arising from the restructuring, where the plans are sufficiently detailed and where appropriate communication to those affected has been made.
Charges to increase restructuring provisions are included in "Other expense" in the consolidated income statements. Corresponding releases are recorded in "Other income" in the consolidated income statements.
Taxes
Taxes on income are expensed in the same periods as the revenues and expenses to which they relate and include any interest and penalties incurred during the period. Deferred taxes are determined using the comprehensive liability method and are calculated on the temporary differences that arise between the tax base of an asset or liability and its carrying value in the balance sheet prepared for purposes of these Consolidated Financial Statements, except for those temporary differences related to investments in subsidiaries where the timing of their reversal can be controlled and it is probable that the difference will not reverse in the foreseeable future. Since the retained earnings are reinvested, withholding or other taxes on eventual distribution of a subsidiary's retained earnings are only taken into account when a dividend has been planned.
The estimated amounts for current and deferred tax assets or liabilities, including any amounts related to any uncertain tax positions, are based on currently known facts and circumstances. Tax returns are based on an interpretation of tax laws and regulations and reflect estimates based on these judgments and interpretations.
F-19
NOTES TO CONSOLIDATED FINANCIAL STATEMENTS OF ALCON INC. (Continued)
The tax returns are subject to examination by the competent taxing authorities which may result in an assessment being made requiring payments of additional tax, interest or penalties. Inherent uncertainties exist in the estimates of the tax positions.
Earnings (loss) per share
Basic earnings (loss) per share is based on the weighted average number of common shares outstanding. Diluted earnings (loss) per share is based on the weighted average number of common shares outstanding and all dilutive potential common shares outstanding.
Impact of adopting significant new IFRS standards in 2019
Effective January 1, 2019, Alcon implemented IFRS 16,
Leases
, which provides a new model for lessee accounting in which substantially all leases are now recognized on the balance sheet as Right-of-use assets with corresponding Lease liabilities. The standard replaces IAS 17,
Leases
.
Upon adoption of IFRS 16, right-of-use assets are recognized based on the amount of the lease liability adjusted for payments made before the lease commencement date, lease incentives and other items related to the lease agreements. Lease liabilities are recognized based on the net present value of remaining lease payments and are classified as current or non-current based on the due dates of the underling principal payments. Upon adoption of the new standard, a portion of the annual operating lease costs previously fully recognized as a functional expense is recorded as interest expense. In addition, the portion of the lease payments representing a reduction of the lease liability is recognized in the cash flow statement as an outflow from financing activities, which was previously fully recognized as an outflow from operating activities for operating leases.
IFRS 16 substantially carries forward the lessor accounting requirements under IAS 17 such that adoption of the standard did not have a significant impact upon Alcon's accounting for surgical equipment leases where Alcon is the lessor and for which Alcon's accounting policy is included in the Revenue accounting policy in this Note to the Consolidated Financial Statements.
Alcon applied the modified retrospective method, with right-of-use assets measured at an amount equal to the lease liability, adjusted by the amount of the prepaid or accrued lease payments relating to those leases recognized in the balance sheet immediately before the date of initial application. In applying IFRS 16 for the first time, Alcon has used the practical expedients discussed in Note
16
of these Consolidated Financial Statements. The adoption of the standard did not have an impact on "Other Reserves" in the period of adoption and prior years were not restated.
Refer to Note
16
to these Consolidated Financial Statements for further information on the impact of adoption of IFRS 16,
Leases.
New standards and interpretations not yet adopted
Amendments to IFRS 3,
Business
Combinations
, are effective for transactions occurring after January 1, 2020. The amendments change the definition of a business in evaluating business combinations and asset acquisitions, and also provide Alcon an option to apply a concentration test to determine if the fair value of gross assets acquired is concentrated in a single asset or a group of similar assets. Under the concentration test, where substantially all of the fair value of gross assets acquired is concentrated in a single asset (or a group of similar assets), the assets acquired would not represent a business. The changes to the definition of a business will likely result in Alcon accounting for more acquisitions as asset acquisitions.
There are no other IFRS standards or interpretations not yet effective that would be expected to have a material impact on Alcon.
F-20
NOTES TO CONSOLIDATED FINANCIAL STATEMENTS OF ALCON INC. (Continued)
4
.
Significant transactions
Significant transactions in 2019
Refinancing of Bridge Facility and Facility A financial debts
On September 23, 2019, Alcon through its wholly-owned subsidiary, Alcon Finance Corporation ("AFC"), refinanced
$
2
billion
of the bridge and term loans, which had been issued in April 2019, with
$
500
million
of
2.750
%
senior notes due 2026,
$
1
billion
of
3.000
%
senior notes due 2029, and
$
500
million
of
3.800
%
senior notes due 2049. The bridge and term loans, notes, and refinancing are described in
Note
17
of these Consolidated Financial Statements.
Completion of Spin-off from Novartis through a dividend in kind distribution to Novartis shareholders
The Spin-off was executed on April 9, 2019 as described in Note
1
.
The below transactions occurred in April 2019, immediately preceding the Spin-off.
On April 2, 2019, Alcon borrowed
$
3.2
billion
against the bridge and other term loans which were executed on March 6, 2019
and are described in Note
17
of these Consolidated Financial Statements. These borrowings increased the Company's third party financial debts to
$
3.5
billion
at the date of Spin-off. Through a series of intercompany transactions, Alcon then paid approximately
$
3.1
billion
in cash to Novartis and its affiliates prior to the Spin-off, decreasing Alcon's net assets to approximately
$
20.0
billion
at the date of Spin-off.
Surgical-Acquisition of PowerVision, Inc.
On March 13, 2019, Alcon acquired
100
%
of the outstanding shares and equity of PowerVision, Inc. ("PowerVision"), a privately-held, US-based company focused on developing accommodative, implantable intraocular lenses. This technology allows the intraocular lens to respond to natural muscular movements in the eye to alter shape and focus. The PowerVision acquisition was executed as part of Alcon's commitment to innovation in advanced technology intraocular lenses ("AT-IOLs").
The fair value of the total purchase consideration was
$
424
million
. This amount consisted of an initial cash payment of
$
289
million
and the fair value of the probability weighted contingent consideration of
$
135
million
due to PowerVision shareholders, which they are eligible to receive upon the achievement of specified regulatory and commercialization milestones. The purchase price allocation resulted in net identifiable assets of
$
418
million
, which consisted of in-process research & development intangible assets of
$
505
million
, a net deferred tax liability of
$
93
million
, and other net assets of
$
6
million
. Goodwill of
$
6
million
was also recognized which is attributable to the assembled workforce. Cash paid for the acquisition, net of cash acquired, was
$
283
million
. The 2019 results of operations since the date of acquisition and transaction costs for the acquisition were not material.
Significant transactions in 2018
Surgical-Acquisition of TrueVision Systems, Inc.
On December 19, 2018, Alcon acquired
100
%
of the outstanding shares and equity of TrueVision Systems, Inc. ("TrueVision"), a privately held US-based company. TrueVision developed the 3D scope technology currently used in the commercially marketed Alcon product
NGENUITY
. This technology allows retina surgery specialists to have a 3D visualization of the back of the eye with greater depth and detail than traditional microscopes.
The fair value of the total purchase consideration was
$
146
million
. This amount consists of an initial cash payment of
$
110
million
and the fair value of the probability weighted contingent consideration of
$
36
million
due to TrueVision shareholders, which they are eligible to receive upon the achievement of specified development and commercialization milestones. The purchase price allocation resulted in net identifiable assets of
$
144
million
, which consisted of intangible assets of
$
172
million
, net deferred tax liability of
$
29
million
and other net assets of
$
1
million
. Goodwill of
$
2
million
was also recognized which is attributable to the assembled workforce. The 2018 results of operations following the date of acquisition were not material.
F-21
NOTES TO CONSOLIDATED FINANCIAL STATEMENTS OF ALCON INC. (Continued)
Vision Care-Acquisition of Tear Film Innovations, Inc.
On December 17, 2018, Alcon acquired
100
%
of the outstanding shares and equity of Tear Film Innovations, Inc. ("Tear Film"), a privately held US-based company. Tear Film is the manufacturer of the
iLux
device, an innovative therapeutic device used to treat Meibomian Gland Dysfunction, a leading cause of dry eye.
The fair value of the total purchase consideration was
$
145
million
. This amount consists of an initial cash payment of
$
79
million
and the fair value of the probability weighted contingent consideration of
$
66
million
due to Tear Film previous owners, which they are eligible to receive upon the achievement of specified development and commercialization milestones. The purchase price allocation resulted in net identifiable assets of
$
143
million
, which consisted of intangible assets of
$
174
million
, net deferred tax liability of
$
37
million
, cash of
$
5
million
and other net assets of
$
1
million
. Goodwill of
$
2
million
was also recognized which is attributable to the assembled workforce. The 2018 results of operations following the date of acquisition were not material.
Significant transactions in 2017
Surgical-Acquisition of ClarVista Medical, Inc.
On September 20, 2017, Alcon acquired
100
%
of the outstanding shares and equity of ClarVista Medical, Inc., a privately held California, US-based company focused on developing the HARMONI Modular IOL System, a novel intraocular lens ("IOL") used to restore vision after cataract surgery.
The fair value of the total purchase consideration was
$
125
million
. This amount consists of an initial cash payment of
$
71
million
and the net present value of the contingent consideration of
$
54
million
due to ClarVista shareholders, which they are eligible to receive upon the achievement of specified development and commercialization milestones. The purchase price allocation resulted in net identifiable assets of
$
123
million
, which consisted of intangible assets of
$
178
million
, deferred tax assets of
$
8
million
, cash and cash equivalents of
$
1
million
and deferred tax liabilities of
$
64
million
. Goodwill of
$
2
million
was also recognized which is attributable to the assembled workforce. The 2017 results of operations since the date of acquisition were not material.
F-22
NOTES TO CONSOLIDATED FINANCIAL STATEMENTS (Continued)
5
.
Segment information
The segment information disclosed in these Consolidated Financial Statements reflects historical results consistent with the identifiable reporting segments of Alcon and financial information that the Chief Operating Decision Maker ("CODM") reviews to evaluate segmental performance and allocate resources among the segments. The CODM is the Executive Committee of Alcon.
The businesses of Alcon are divided operationally on a worldwide basis into
two
identified reporting segments, Surgical and Vision Care. As indicated below, certain income and expenses are not allocated to segments.
Reporting segments are presented in a manner consistent with the internal reporting to the CODM. The reporting segments are managed separately due to their distinct needs and activities for research, development, manufacturing, distribution, and commercial execution.
The Executive Committee of Alcon is responsible for allocating resources and assessing the performance of the reporting segments.
In Surgical, Alcon researches, develops, manufactures, distributes and sells ophthalmic products for cataract surgery, vitreoretinal surgery, refractive laser surgery and glaucoma surgery. The surgical portfolio also includes implantables, consumables and surgical equipment required for these procedures and supports the end-to-end procedure needs of the ophthalmic surgeon.
In Vision Care, Alcon researches, develops, manufactures, distributes and sells daily disposable, reusable, and color-enhancing contact lenses and a comprehensive portfolio of ocular health products, including products for dry eye, contact lens care and ocular allergies, as well as ocular vitamins and redness relievers.
Alcon also provides services, training, education and technical support for both the Surgical and Vision Care businesses.
The basis of preparation described in Note
2
, and the selected accounting policies mentioned in Note
3
are used in the reporting of segment results.
The Executive Committee of Alcon evaluates segmental performance and allocates resources among the segments primarily based on net sales and segment contribution.
Net identifiable assets are not assigned to the segments in the internal reporting to the CODM, and are not considered in evaluating the performance of the business segments by the Executive Committee of Alcon.
Segment contribution excludes amortization and impairment costs for acquired product rights or other intangibles, general and administrative expenses for corporate activities, and certain other income and expense items.
General & administration (corporate) includes the costs of the Alcon corporate headquarters, including all related corporate function costs. For the historical comparative period only, the related corporate function costs were allocated to Alcon from its Former Parent.
Other expense, net of other income, includes other items of income and expense such as spin readiness and separation costs, transformation program costs, restructuring costs and legal settlements that are not attributable to a specific segment.
F-23
NOTES TO CONSOLIDATED FINANCIAL STATEMENTS OF ALCON INC. (Continued)
Segmentation - Consolidated income statements
|
|
Surgical
|
Vision Care
|
Company
|
||||||||||||||
|
($ millions)
|
2019
|
|
2018
|
|
2019
|
|
2018
|
|
2019
|
|
2018
|
|
|||||
|
Net sales to third parties
|
|
|
|
|
|
|
|
|
|
|
|
|
|||||
|
Sales to former parent
|
|
|
|
|
|
|
|
|
|
|
|
|
|||||
|
Other revenues
|
|
|
|
|
|
|
|
|
|
|
|
|
|||||
|
Net sales and other revenues
|
|
|
|
|
|
|
|
|
|
|
|
|
|||||
|
Segment contribution
(1)
|
|
|
|
|
|
|
|
|
|
|
|
|
|||||
|
Amortization of intangible assets
|
(
|
)
|
(
|
)
|
|||||||||||||
|
Impairment charges on intangible assets
|
|
|
(
|
)
|
|||||||||||||
|
General & administration (corporate)
|
(
|
)
|
(
|
)
|
|||||||||||||
|
Other (expense)/income, net
|
(
|
)
|
(
|
)
|
|||||||||||||
|
Operating (loss)
|
(
|
)
|
(
|
)
|
|||||||||||||
|
Interest expense
|
(
|
)
|
(
|
)
|
|||||||||||||
|
Other financial income & expense
|
(
|
)
|
(
|
)
|
|||||||||||||
|
(Loss) before taxes
|
(
|
)
|
(
|
)
|
|||||||||||||
Included in segment contribution are
:
|
Surgical
|
Vision Care
|
Not allocated
|
Total
|
||||||||||||||||||||
|
($ millions)
|
2019
|
|
2018
|
|
2019
|
|
2018
|
|
2019
|
|
2018
|
|
2019
|
|
2018
|
|
|||||||
|
Depreciation of property, plant & equipment
|
(
|
)
|
(
|
)
|
(
|
)
|
(
|
)
|
|
|
|
|
(
|
)
|
(
|
)
|
|||||||
|
Depreciation of right-of-use assets
|
(
|
)
|
|
|
(
|
)
|
|
|
|
|
|
|
(
|
)
|
|
|
|||||||
|
Impairment charges on property, plant & equipment, net
|
(
|
)
|
(
|
)
|
(
|
)
|
(
|
)
|
|
|
|
|
(
|
)
|
(
|
)
|
|||||||
|
Equity-based compensation
(2)
|
(
|
)
|
(
|
)
|
(
|
)
|
(
|
)
|
(
|
)
|
(
|
)
|
(
|
)
|
(
|
)
|
|||||||
|
(1)
|
The segment contribution corresponds to Net sales and Other revenues less Cost of net sales, Cost of other revenues, Selling, general & administration and Research & development attributable to segments, excluding amortization and impairments on intangible assets.
|
|
(2)
|
Equity-based compensation not allocated to segments in 2018 reflects an estimate of the allocation for corporate functions in the historical period based on 2019 actual percentages.
|
F-24
NOTES TO CONSOLIDATED FINANCIAL STATEMENTS OF ALCON INC. (Continued)
|
|
Surgical
|
Vision Care
|
Company
|
||||||||||||||
|
($ millions)
|
2018
|
|
2017
|
|
2018
|
|
2017
|
|
2018
|
|
2017
|
|
|||||
|
Net sales to third parties
|
|
|
|
|
|
|
|
|
|
|
|
|
|||||
|
Sales to former parent
|
|
|
|
|
|
|
|
|
|
|
|
|
|||||
|
Other revenues
|
|
|
|
|
|
|
|
|
|
|
|
|
|||||
|
Net sales and other revenues
|
|
|
|
|
|
|
|
|
|
|
|
|
|||||
|
Segment contribution
(1)
|
|
|
|
|
|
|
|
|
|
|
|
|
|||||
|
Amortization of intangible assets
|
(
|
)
|
(
|
)
|
|||||||||||||
|
Impairment charges on intangible assets
|
(
|
)
|
(
|
)
|
|||||||||||||
|
General & administration (corporate)
|
(
|
)
|
(
|
)
|
|||||||||||||
|
Other (expense)/income, net
|
(
|
)
|
(
|
)
|
|||||||||||||
|
Operating (loss)
|
(
|
)
|
(
|
)
|
|||||||||||||
|
Interest expense
|
(
|
)
|
(
|
)
|
|||||||||||||
|
Other financial income and expense
|
(
|
)
|
(
|
)
|
|||||||||||||
|
(Loss) before taxes
|
(
|
)
|
(
|
)
|
|||||||||||||
Included in segment contribution are:
|
Surgical
|
Vision Care
|
Not allocated
|
Company
|
||||||||||||||||||||
|
($ millions)
|
2018
|
|
2017
|
|
2018
|
|
2017
|
|
2018
|
|
2017
|
|
2018
|
|
2017
|
|
|||||||
|
Depreciation of property, plant & equipment
|
(
|
)
|
(
|
)
|
(
|
)
|
(
|
)
|
|
|
|
|
(
|
)
|
(
|
)
|
|||||||
|
Impairment charges on property, plant & equipment, net
|
(
|
)
|
|
|
(
|
)
|
|
|
|
|
|
|
(
|
)
|
|
|
|||||||
|
Equity-based compensation
(2)
|
(
|
)
|
(
|
)
|
(
|
)
|
(
|
)
|
(
|
)
|
(
|
)
|
(
|
)
|
(
|
)
|
|||||||
|
(1)
|
The segment contribution corresponds to Net sales and Other revenues less Cost of net sales, Cost of other revenues, Selling, general & administration and Research & development attributable to segments, excluding amortization and impairments on intangible assets.
|
|
(2)
|
Equity-based compensation not allocated to segments in 2018 and 2017 reflects an estimate of the allocation for corporate functions in the historical periods based on 2019 actual percentages.
|
Segmentation - Additional balance sheet disclosure
|
Surgical
|
Vision Care
|
Not allocated
(1)
|
Total
|
||||||||||||||||||||
|
($ millions)
|
2019
|
|
2018
|
|
2019
|
|
2018
|
|
2019
|
|
2018
|
|
2019
|
|
2018
|
|
|||||||
|
Goodwill
|
|
|
|
|
|
|
|
|
|
|
|
|
|
|
|
|
|||||||
|
Intangible assets other than goodwill
|
|
|
|
|
|
|
|
|
|
|
|
|
|
|
|
|
|||||||
F-25
NOTES TO CONSOLIDATED FINANCIAL STATEMENTS OF ALCON INC. (Continued)
Net sales by segment
|
($ millions)
|
2019
|
|
2018
|
|
2017
|
|
||
|
|
||||||||
|
Surgical
|
|
|
|
|
|
|
||
|
Implantables
|
|
|
|
|
|
|
||
|
Consumables
|
|
|
|
|
|
|
||
|
Equipment/other
|
|
|
|
|
|
|
||
|
Total Surgical
|
|
|
|
|
|
|
||
|
Vision Care
|
||||||||
|
Contact lenses
|
|
|
|
|
|
|
||
|
Ocular health
|
|
|
|
|
|
|
||
|
Total Vision Care
|
|
|
|
|
|
|
||
|
Net sales to third parties
|
|
|
|
|
|
|
||
Geographical information
The following table shows the United States, International and countries that accounted for more than 5% of at least one of the respective Alcon totals, for net sales for the years ended
December 31, 2019
,
2018
and
2017
, and for selected non-current assets at
December 31, 2019
, and
2018
:
|
|
Net sales
(1)
|
Total of selected
non-current assets
(2)
|
|||||||||||||||||||||||||||
|
($ millions unless indicated otherwise)
|
2019 |
2018 |
2017 |
2019
|
2018
|
||||||||||||||||||||||||
|
|
|||||||||||||||||||||||||||||
|
Country
|
|
|
|
|
|
|
|
|
|
|
|
|
|
|
|
|
|
|
|
|
|||||||||
|
United States
|
|
|
|
%
|
|
|
|
%
|
|
|
|
%
|
|
|
|
%
|
|
|
|
%
|
|||||||||
|
International
|
|
|
|
%
|
|
|
|
%
|
|
|
|
%
|
|
|
|
%
|
|
|
|
%
|
|||||||||
|
thereof:
|
|||||||||||||||||||||||||||||
|
Switzerland (country of domicile)
|
|
|
|
%
|
|
|
|
%
|
|
|
|
%
|
|
|
|
%
|
|
|
|
%
|
|||||||||
|
Japan
|
|
|
|
%
|
|
|
|
%
|
|
|
|
%
|
|
|
|
%
|
|
|
|
%
|
|||||||||
|
China
|
|
|
|
%
|
|
|
|
%
|
|
|
|
%
|
|
|
|
%
|
|
|
|
%
|
|||||||||
|
Other
|
|
|
|
%
|
|
|
|
%
|
|
|
|
%
|
|
|
|
%
|
|
|
|
%
|
|||||||||
|
Company total
|
|
|
|
%
|
|
|
|
%
|
|
|
|
%
|
|
|
|
%
|
|
|
|
%
|
|||||||||
|
(1)
|
Net sales from operations by location of third-party customer.
|
|
(2)
|
Includes property, plant & equipment, right-of-use assets, goodwill and other intangible assets.
|
No customer accounted for 10% or more of Alcon's net sales.
F-26
NOTES TO CONSOLIDATED FINANCIAL STATEMENTS (Continued)
6
.
Interest expense and other financial income & expense
For the years ended
December 31, 2019
,
2018
and
2017
, "Interest expense" and "Other financial income & expense" are:
Interest expense
|
($ millions)
|
2019
|
|
2018
|
|
2017
|
|
||
|
Interest expense on financial debts
|
(
|
)
|
(
|
)
|
(
|
)
|
||
|
Interest expense from discounting long-term liabilities
|
(
|
)
|
(
|
)
|
(
|
)
|
||
|
Interest expense on lease liabilities
(1)
|
(
|
)
|
(
|
)
|
(
|
)
|
||
|
Total interest expense
|
(
|
)
|
(
|
)
|
(
|
)
|
||
|
(1)
|
For the years ended
December 31, 2018
and
2017
, interest expense on finance leases was included in "Interest expense on lease liabilities".
|
Other financial income & expense
|
($ millions)
|
2019
|
|
2018
|
|
2017
|
|
||
|
Interest income
|
|
|
|
|
|
|
||
|
Loss on extinguishment of financial debt
|
(
|
)
|
|
|
|
|
||
|
Other financial expense
|
(
|
)
|
(
|
)
|
(
|
)
|
||
|
Monetary loss from hyperinflation accounting
|
(
|
)
|
(
|
)
|
|
|
||
|
Currency result, net
|
(
|
)
|
(
|
)
|
(
|
)
|
||
|
Total other financial income & expense
|
(
|
)
|
(
|
)
|
(
|
)
|
||
F-27
NOTES TO CONSOLIDATED FINANCIAL STATEMENTS OF ALCON INC. (Continued)
7
.
Taxes
(Loss) before taxes
|
($ millions)
|
2019
|
|
2018
|
|
2017
|
|
||
|
Switzerland
|
(
|
)
|
(
|
)
|
(
|
)
|
||
|
Foreign
|
(
|
)
|
(
|
)
|
(
|
)
|
||
|
Total (loss) before taxes
|
(
|
)
|
(
|
)
|
(
|
)
|
||
Current and deferred income tax (expense)/income
|
($ millions)
|
2019
|
|
2018
|
|
2017
|
|
||
|
Switzerland
|
(
|
)
|
(
|
)
|
(
|
)
|
||
|
Foreign
|
(
|
)
|
(
|
)
|
(
|
)
|
||
|
Current income tax expense
|
(
|
)
|
(
|
)
|
(
|
)
|
||
|
Switzerland
|
(
|
)
|
|
|
|
|
||
|
Foreign
|
|
|
|
|
|
|
||
|
Deferred tax (expense)/income
|
(
|
)
|
|
|
|
|
||
|
Total income tax (expense)/income
|
(
|
)
|
|
|
|
|
||
F-28
NOTES TO CONSOLIDATED FINANCIAL STATEMENTS OF ALCON INC. (Continued)
Analysis of tax rate
Alcon's overall applicable tax rate can change each year since it is calculated as the weighted average tax rate based on pre-tax (loss)/income of each subsidiary.
The main elements contributing to the difference between Alcon's overall applicable tax rate and the effective tax rate are summarized in the below table.
|
|
2019
|
2018
|
2017
|
||||||||||||||
|
|
$ m
|
|
%
|
|
$ m
|
|
%
|
|
$ m
|
|
%
|
|
|||||
|
Applicable tax rate
|
|
|
|
%
|
|
|
|
%
|
|
|
|
%
|
|||||
|
Effect of disallowed expenditures
|
(
|
)
|
(
|
)%
|
(
|
)
|
(
|
)%
|
(
|
)
|
(
|
)%
|
|||||
|
Effect of share based compensation
|
(
|
)
|
(
|
)%
|
(
|
)
|
(
|
)%
|
(
|
)
|
(
|
)%
|
|||||
|
Effect of income taxed at reduced rates
|
|
|
|
%
|
|
|
|
%
|
|
|
|
|
|||||
|
Effect of tax credits and allowances
|
|
|
|
%
|
|
|
|
%
|
|
|
|
%
|
|||||
|
Effect of adjustments to contingent consideration liabilities
|
|
|
|
%
|
|
|
|
%
|
(
|
)
|
(
|
)%
|
|||||
|
Effect of option payments
|
(
|
)
|
(
|
)%
|
(
|
)
|
(
|
)%
|
(
|
)
|
(
|
)%
|
|||||
|
Effect of liquidation of a subsidiary
|
|
|
|
|
|
|
|
|
(
|
)
|
(
|
)%
|
|||||
|
Effect of tax benefits expiring in 2017
(1)
|
|
|
|
|
|
|
|
|
(
|
)
|
(
|
)%
|
|||||
|
Effect of tax rate changes
(2)
|
(
|
)
|
(
|
)%
|
(
|
)
|
(
|
)%
|
|
|
|
|
|||||
|
Effect of changes in uncertain tax positions
|
|
|
|
%
|
(
|
)
|
(
|
)%
|
(
|
)
|
(
|
)%
|
|||||
|
Effect of other items
|
(
|
)
|
(
|
)%
|
(
|
)
|
(
|
)%
|
(
|
)
|
(
|
)%
|
|||||
|
Effect of prior year items
(3)
|
(
|
)
|
(
|
)%
|
|
|
|
%
|
|
|
|
%
|
|||||
|
Effect of tax rate change on current and deferred tax assets and liabilities from US tax reform
(4)
|
|
|
|
%
|
|
|
|
%
|
|
|
|
%
|
|||||
|
Effective tax rate
|
(
|
)
|
(
|
)%
|
|
|
|
%
|
|
|
|
%
|
|||||
|
(1)
|
Effect of tax benefits expiring in
2017
relates to a Swiss subsidiary that was not subject to income tax through the end of calendar year 2017.
|
|
(2)
|
Effect of tax rate changes in 2019 relates primarily to (i) the adoption of the Swiss Tax Reform which has resulted in a non-cash tax increase in the tax expense of
$
|
|
(3)
|
In 2019, the prior year items relate to changes in certain estimates which resulted in a
$
|
|
(4)
|
Effect of tax rate change on US current and deferred tax assets and liabilities in 2017 relate to the enactment of the Tax Cuts and Jobs Act by the US, which reduced the corporate tax rate from 35% to 21% effective January 1, 2018. This required a re-measurement of the deferred tax balances and a portion of the current tax payables.
|
Alcon has a substantial business presence in many countries and is therefore subject to different income and expense items that are non-taxable (permanent differences) or are taxed at different rates in those tax jurisdictions. This results in a difference between Alcon's applicable tax rate and effective tax rate as shown in the table above.
The applicable tax rate in
2019
,
2018
and
2017
was impacted by pre-tax losses in certain tax jurisdictions. The fluctuation in the taxes and the effective tax rates, excluding Swiss and US tax reform, is primarily due to the geographical pre-tax income and loss mix across certain tax jurisdictions relative to Alcon's consolidated (loss)/income before taxes, changes in uncertain tax positions and certain non-recurring items.
8
.
Share capital and earnings/(loss) per share
8.1 Share capital
The share capital of the Company as of
December 31, 2019
is
CHF
20
million
, which is comprised of
491.7
million
common shares, nominal value of
CHF
0.04
per share.
On April 9, 2019, the date of the Spin-off,
488.2
million
shares of the Company's common stock were distributed to Novartis shareholders and Novartis ADR holders. The shares were distributed from the Company's existing
F-29
NOTES TO CONSOLIDATED FINANCIAL STATEMENTS OF ALCON INC. (Continued)
share capital of
488.7
million
shares. On November 19, 2019, the Board of Directors approved an increase of CHF
120,000
out of the Company’s authorized share capital through the issuance of
3.0
million
additional shares, nominal value
CHF
0.04
per share, to fulfill the future vesting of existing and future equity-based awards. These additional shares were issued as Treasury shares in December 2019 as part of the Company’s authorized share capital according to the authority granted by the shareholders at the Company’s last Annual General Meeting held on January 29, 2019 and reflected in the Company’s Articles of Incorporation. While the transaction increases the number of shares available for delivery under the Company’s equity-based compensation plans, there is no immediate impact on the number of shares outstanding or earnings per share calculations until shares are delivered to plan participants under the plans.
During the period,
0.1
million
shares were delivered for awards vesting under the Company's equity incentive programs. At
December 31, 2019
, the Company had
488.3
million
outstanding common shares and
3.4
million
shares held in the Company's treasury share accounts. Of the Company's
3.4
million
shares held in treasury,
3.0
million
may only be used to fulfill the future vesting of existing and future equity-based awards.
8.2 Earnings/(loss) per share
Basic earnings/(loss) per share is computed by dividing net (loss)/income for the period by the weighted average number of common shares outstanding during the period. For the year ended
December 31, 2019
, the weighted average number of shares outstanding was
488.2
million
shares. For periods prior to the Spin-off, the denominator for basic earnings/(loss) per share uses the number of shares distributed on the date of the Spin-off.
The only potentially dilutive securities are the outstanding unvested equity-based awards under the Company's equity-based incentive plans, as described in Note
24
to these Consolidated Financial Statements. Except when the effect would be anti-dilutive, the calculation of diluted earnings/(loss) per common share includes the weighted average net impact of unvested equity-based awards. For the year ended
December 31, 2019
,
1.9
million
shares related to unvested equity-based awards have been excluded from the calculation of diluted net loss per share as their effect would be anti-dilutive. For periods prior to the Spin-off, the denominator for diluted earnings per share uses the number of shares distributed on the date of the Spin-off.
F-30
NOTES TO CONSOLIDATED FINANCIAL STATEMENTS OF ALCON INC. (Continued)
9
.
Property, plant & equipment
The following table summarizes the movements of property, plant & equipment during
2019
:
|
($ millions)
|
Land
|
|
Buildings
|
|
Construction
in progress |
|
Machinery &
other equipment |
|
Total
|
|
||||
|
Cost
|
|
|
|
|
|
|
|
|
|
|
||||
|
January 1, 2019
|
|
|
|
|
|
|
|
|
|
|
||||
|
Additions
(1)
|
|
|
|
|
|
|
|
|
||||||
|
Impact of business combinations
|
|
|
|
|
||||||||||
|
Disposals and derecognitions
(2)
|
(
|
)
|
(
|
)
|
(
|
)
|
(
|
)
|
||||||
|
Transfers with former parent
|
|
|
|
|
|
|
|
|
||||||
|
Reclassifications for assets placed in service
|
|
|
|
|
(
|
)
|
|
|
|
|
||||
|
Other reclassifications
|
(
|
)
|
(
|
)
|
||||||||||
|
Currency translation effects
|
|
|
(
|
)
|
|
|
(
|
)
|
(
|
)
|
||||
|
December 31, 2019
|
|
|
|
|
|
|
|
|
|
|
||||
|
Accumulated depreciation
|
||||||||||||||
|
January 1, 2019
|
(
|
)
|
(
|
)
|
(
|
)
|
(
|
)
|
(
|
)
|
||||
|
Depreciation charge
|
|
|
(
|
)
|
|
|
(
|
)
|
(
|
)
|
||||
|
Impairment charge
|
|
|
|
|
(
|
)
|
(
|
)
|
(
|
)
|
||||
|
Disposals and derecognitions
(2)
|
|
|
|
|
|
|
||||||||
|
Transfers with former parent
|
(
|
)
|
(
|
)
|
(
|
)
|
||||||||
|
Other reclassifications
|
|
|
|
|
||||||||||
|
Currency translation effects
|
|
|
|
|
|
|
|
|
|
|
||||
|
December 31, 2019
|
|
|
(
|
)
|
(
|
)
|
(
|
)
|
(
|
)
|
||||
|
Net book value at December 31, 2019
|
|
|
|
|
|
|
|
|
|
|
||||
|
(1)
|
Includes
$
|
|
(2)
|
Derecognition of assets that are no longer used and are not considered to have a significant disposal value or other alternative use.
|
As of December 31, 2019, commitments for purchases of property, plant & equipment were
$
212
million
. There were no capitalized borrowing costs.
F-31
NOTES TO CONSOLIDATED FINANCIAL STATEMENTS OF ALCON INC. (Continued)
The following table summarizes the movements of property, plant and equipment during
2018
:
|
($ millions)
|
Land
|
|
Buildings
|
|
Construction
in progress |
|
Machinery &
other equipment |
|
Total
|
|
||||
|
Cost
|
|
|
|
|
|
|
|
|
|
|
||||
|
January 1, 2018
|
|
|
|
|
|
|
|
|
|
|
||||
|
Additions
|
|
|
|
|
|
|
|
|
||||||
|
Impact of business combinations
|
|
|
|
|
|
|
|
|
|
|
||||
|
Disposals and derecognitions
(1)
|
|
|
(
|
)
|
|
|
(
|
)
|
(
|
)
|
||||
|
Reclassifications and transfers with former parent
|
|
|
|
|
(
|
)
|
|
|
|
|
||||
|
Reclassification to right-of-use assets
(2)
|
(
|
)
|
(
|
)
|
||||||||||
|
Currency translation effects
|
(
|
)
|
(
|
)
|
(
|
)
|
(
|
)
|
(
|
)
|
||||
|
December 31, 2018
|
|
|
|
|
|
|
|
|
|
|
||||
|
Accumulated depreciation
|
|
|
|
|
|
|
|
|
|
|
||||
|
January 1, 2018
|
(
|
)
|
(
|
)
|
|
|
(
|
)
|
(
|
)
|
||||
|
Depreciation charge
|
|
|
(
|
)
|
|
|
(
|
)
|
(
|
)
|
||||
|
Impairment charge
|
(
|
)
|
(
|
)
|
(
|
)
|
||||||||
|
Disposals and derecognitions
(1)
|
|
|
|
|
|
|
|
|
|
|
||||
|
Transfers with former parent
|
(
|
)
|
(
|
)
|
(
|
)
|
(
|
)
|
(
|
)
|
||||
|
Reclassification to right-of-use assets
(2)
|
|
|
|
|
||||||||||
|
Currency translation effects
|
|
|
|
|
|
|
|
|
|
|
||||
|
December 31, 2018
|
(
|
)
|
(
|
)
|
(
|
)
|
(
|
)
|
(
|
)
|
||||
|
Net book value at December 31, 2018
|
|
|
|
|
|
|
|
|
|
|
||||
|
(1)
|
Derecognition of assets that are no longer used and are not considered to have a significant disposal value or other alternative use.
|
|
(2)
|
The December 31, 2018 balance previously reported for a finance lease asset of
$
|
As of December 31, 2018, commitments for purchases of property, plant & equipment were
$
93
million
and capitalized borrowing costs were
$
1
million
.
F-32
NOTES TO CONSOLIDATED FINANCIAL STATEMENTS OF ALCON INC. (Continued)
10
.
Goodwill and intangible assets
The following table summarizes the movements of goodwill and other intangible assets in
2019
:
|
|
Intangible assets other than goodwill
|
||||||||||||||||||||||
|
($ millions)
|
Goodwill
|
|
Alcon
brand name |
|
Acquired
research & development |
|
Technologies
|
|
Currently
marketed products |
|
Marketing
know-how |
|
Other
intangible assets (including software) |
|
Total
|
|
|||||||
|
Cost
|
|
|
|
|
|
|
|
|
|
|
|
|
|
|
|
|
|||||||
|
January 1, 2019
|
|
|
|
|
|
|
|
|
|
|
|
|
|
|
|
|
|||||||
|
Impact of business combinations
|
|
|
|
|
|
|
|
|
|
|
|
|
|
|
|
|
|||||||
|
Additions
|
|
|
|
|
|
|
|
|
|
|
|
|
|
|
|
|
|||||||
|
Reclassifications
|
—
|
|
—
|
|
(
|
)
|
—
|
|
—
|
|
—
|
|
|
|
|
|
|||||||
|
Disposals and derecognitions
(1)
|
|
|
|
|
|
|
|
|
|
|
|
|
(
|
)
|
(
|
)
|
|||||||
|
December 31, 2019
|
|
|
|
|
|
|
|
|
|
|
|
|
|
|
|
|
|||||||
|
Accumulated amortization
|
|||||||||||||||||||||||
|
January 1, 2019
|
|
|
|
|
(
|
)
|
(
|
)
|
(
|
)
|
(
|
)
|
(
|
)
|
(
|
)
|
|||||||
|
Amortization charge
|
|
|
|
|
|
|
(
|
)
|
(
|
)
|
(
|
)
|
(
|
)
|
(
|
)
|
|||||||
|
Accumulated amortization on disposals and derecognitions
(1)
|
|
|
|
|
|
|
|
|
|
|
|
|
|
|
|
|
|||||||
|
December 31, 2019
|
|
|
|
|
(
|
)
|
(
|
)
|
(
|
)
|
(
|
)
|
(
|
)
|
(
|
)
|
|||||||
|
Net book value at December 31, 2019
|
|
|
|
|
|
|
|
|
|
|
|
|
|
|
|
|
|||||||
|
(1)
|
Derecognitions of assets that are no longer used or being developed and are not considered to have a significant disposal value or other alternative use.
|
The following table summarizes the allocation of the net book values of goodwill and other intangible assets by reporting segment at
December 31, 2019
:
|
|
Intangible assets other than goodwill
|
||||||||||||||||||||||
|
($ millions)
|
Goodwill
|
|
Alcon
brand name |
|
Acquired
research & development |
|
Technologies
|
|
Currently
marketed products |
|
Marketing
know-how |
|
Other
intangible assets (including software) |
|
Total
|
|
|||||||
|
Surgical
|
|
|
|
|
|
|
|
|
|
|
|
|
|
|
|||||||||
|
Vision Care
|
|
|
|
|
|
|
|
|
|
|
|
|
|
|
|||||||||
|
Not allocated to segment
(1)
|
|
|
|
|
|
|
|
|
|
|
|
|
|
|
|
|
|||||||
|
Net book value at December 31, 2019
|
|
|
|
|
|
|
|
|
|
|
|
|
|
|
|
|
|||||||
The Surgical and Vision Care segments' cash generating units, to which goodwill is allocated are comprised of a group of smaller cash generating units. The valuation method of the recoverable amount of the cash generating units, to which goodwill is allocated, is based on the fair value less costs of disposal.
The Alcon brand name is an intangible asset with an indefinite life. The intangible asset is not allocated to the segments as it is used to market the Alcon-branded products of both the Surgical and Vision Care businesses. Net sales of these products together are the grouping of cash generating units, which is used to determine the recoverable amount. The valuation method is based on the fair value less costs of disposal.
F-33
NOTES TO CONSOLIDATED FINANCIAL STATEMENTS OF ALCON INC. (Continued)
The following assumptions are used in the calculations for the recoverable amounts of goodwill and the Alcon brand name:
|
(As a percentage)
|
Surgical
|
Vision Care
|
|
|
Terminal growth rate
|
|
|
|
|
Discount rate (post-tax)
|
|
|
|
The Surgical and Vision Care segments' terminal growth rate assumption of
3
%
takes into consideration how the industry is expected to grow, analysis of industry expert reports, and expected relevant changes in demographics for various markets. The discount rates for both Surgical and Vision Care segments consider Alcon's weighted average cost of capital, adjusted to approximate the weighted average cost of capital of comparable market participants. Both the terminal growth rate and the discount rate are consistent with external sources of information.
The fair value less costs of disposal, for all groupings of cash generating units containing goodwill or indefinite life intangible assets, is reviewed for the impact of reasonably possible changes in key assumptions. In particular Alcon considered an increase in the discount rate, a decrease in the terminal growth rate and certain negative impacts on the forecasted cash flows. These reasonably possible changes in key assumptions did not indicate an impairment.
Refer to "Impairment of goodwill, Alcon brand name and definite lived intangible assets" in Note
3
in these Consolidated Financial Statements for additional disclosures on how Alcon performs goodwill and intangible asset impairment testing.
The following table summarizes the movements of goodwill and other intangible assets in
2018
:
|
|
Intangible assets other than goodwill
|
||||||||||||||||||||||
|
($ millions)
|
Goodwill
|
|
Alcon
brand name |
|
Acquired
research & development |
|
Technologies
|
|
Currently
marketed products |
|
Marketing
know-how |
|
Other
intangible assets (including software) |
|
Total
|
|
|||||||
|
Cost
|
|
|
|
|
|
|
|
|
|
|
|
|
|
|
|
|
|||||||
|
January 1, 2018
|
|
|
|
|
|
|
|
|
|
|
|
|
|
|
|
|
|||||||
|
Impact of business combinations
|
|
|
|
|
|
|
|
|
|
|
|
|
|
|
|
|
|||||||
|
Additions
|
|
|
|
|
|
|
|
|
|
|
|
|
|
|
|
|
|||||||
|
Disposals and derecognitions
(1)
|
|
|
|
|
(
|
)
|
|
|
|
|
|
|
(
|
)
|
(
|
)
|
|||||||
|
December 31, 2018
|
|
|
|
|
|
|
|
|
|
|
|
|
|
|
|
|
|||||||
|
Accumulated amortization
|
|
|
|
|
|
|
|
|
|
|
|
|
|
|
|||||||||
|
January 1, 2018
|
|
|
|
|
(
|
)
|
(
|
)
|
(
|
)
|
(
|
)
|
(
|
)
|
(
|
)
|
|||||||
|
Amortization charge
|
|
|
|
|
|
|
(
|
)
|
(
|
)
|
(
|
)
|
(
|
)
|
(
|
)
|
|||||||
|
Accumulated amortization on disposals and derecognitions
(1)
|
|
|
|
|
|
|
|
|
|
|
|
|
|
|
|
|
|||||||
|
Impairment charge
|
|
|
|
|
(
|
)
|
(
|
)
|
(
|
)
|
|
|
|
|
(
|
)
|
|||||||
|
December 31, 2018
|
|
|
|
|
(
|
)
|
(
|
)
|
(
|
)
|
(
|
)
|
(
|
)
|
(
|
)
|
|||||||
|
Net book value at December 31, 2018
|
|
|
|
|
|
|
|
|
|
|
|
|
|
|
|
|
|||||||
|
(1)
|
Derecognitions of assets that are no longer used or being developed and are not considered to have a significant disposal value or other alternative use.
|
The following table summarizes the allocation of the net book values of goodwill and other intangible assets by reporting segment at
December 31, 2018
:
F-34
NOTES TO CONSOLIDATED FINANCIAL STATEMENTS OF ALCON INC. (Continued)
|
|
Intangible assets other than goodwill
|
||||||||||||||||||||||
|
($ millions)
|
Goodwill
|
|
Alcon
brand name |
|
Acquired
research & development |
|
Technologies
|
|
Currently
marketed products |
|
Marketing
know-how |
|
Other
intangible assets (including software) |
|
Total
|
|
|||||||
|
Surgical
|
|
|
|
|
|
|
|
|
|
|
|
|
|
|
|
|
|||||||
|
Vision Care
|
|
|
|
|
|
|
|
|
|
|
|
|
|
|
|
|
|||||||
|
Not allocated to segment
|
|
|
|
|
|
|
|
|
|
|
|
|
|
|
|
|
|||||||
|
December 31, 2018
|
|
|
|
|
|
|
|
|
|
|
|
|
|
|
|
|
|||||||
Intangible asset impairment charges
The following table shows the intangible asset impairment charges for
2019
and
2018
:
|
($ millions)
|
2019
|
|
2018
|
|
|
|
Surgical
|
|
|
(
|
)
|
|
|
Vision Care
|
|
|
|
|
|
|
Total
|
|
|
(
|
)
|
|
F-35
NOTES TO CONSOLIDATED FINANCIAL STATEMENTS OF ALCON INC. (Continued)
11
.
Deferred tax assets and liabilities
|
($ millions)
|
Property,
plant & equipment |
|
Intangible
assets |
|
Pensions and
other benefit obligations of associates |
|
Inventories
|
|
Tax loss
carry- forwards |
|
Other
assets, provision and accruals |
|
Total
|
|
||||||
|
Gross deferred tax assets at December 31, 2018
|
|
|
|
|
|
|
|
|
|
|
|
|
|
|
||||||
|
Gross deferred tax liabilities at December 31, 2018
|
(
|
)
|
(
|
)
|
(
|
)
|
(
|
)
|
|
|
(
|
)
|
(
|
)
|
||||||
|
Net deferred tax balance at December 31, 2018
|
(
|
)
|
(
|
)
|
|
|
|
|
|
|
|
|
(
|
)
|
||||||
|
At December 31, 2018
|
(
|
)
|
(
|
)
|
|
|
|
|
|
|
|
|
(
|
)
|
||||||
|
(Charged)/credited to income
|
(
|
)
|
(
|
)
|
|
|
|
|
|
|
(
|
)
|
(
|
)
|
||||||
|
Credited to equity
|
|
|
|
|
||||||||||||||||
|
Credited to other comprehensive income
|
|
|
|
|
|
|
||||||||||||||
|
Impact of business combinations
|
(
|
)
|
|
|
(
|
)
|
||||||||||||||
|
Other movements
|
(
|
)
|
|
|
(
|
)
|
(
|
)
|
(
|
)
|
|
|
|
|
||||||
|
Net deferred tax balance at December 31, 2019
|
(
|
)
|
(
|
)
|
|
|
|
|
|
|
|
|
(
|
)
|
||||||
|
Gross deferred tax assets at December 31, 2019
|
|
|
|
|
|
|
|
|
|
|
|
|
|
|
||||||
|
Gross deferred tax liabilities at December 31, 2019
|
(
|
)
|
(
|
)
|
(
|
)
|
(
|
)
|
|
|
(
|
)
|
(
|
)
|
||||||
|
Net deferred tax balance at December 31, 2019
|
(
|
)
|
(
|
)
|
|
|
|
|
|
|
|
|
(
|
)
|
||||||
The below table presents the Net deferred tax balance as of December 31, 2019 after offsetting
$
578
million
of deferred tax assets and liabilities within the same tax jurisdiction.
|
($ millions)
|
At December 31, 2019
|
|
|
Deferred tax assets
|
|
|
|
Deferred tax liabilities
|
(
|
)
|
|
Net deferred tax balance
|
(
|
)
|
F-36
NOTES TO CONSOLIDATED FINANCIAL STATEMENTS OF ALCON INC. (Continued)
|
($ millions)
|
Property,
plant &
equipment
|
|
Intangible
assets
|
|
Pensions and
other benefit
obligations of
associates
|
|
Inventories
|
|
Tax loss
carry-
forwards
|
|
Other
assets,
provisions
and
accruals
|
|
Total
|
|
||||||
|
Gross deferred tax assets at January 1, 2018
|
|
|
|
|
|
|
|
|
|
|
|
|
||||||||
|
Gross deferred tax liabilities at January 1, 2018
|
(
|
)
|
(
|
)
|
(
|
)
|
(
|
)
|
(
|
)
|
(
|
)
|
||||||||
|
Net deferred tax balance at January 1, 2018
|
(
|
)
|
(
|
)
|
|
|
|
|
|
|
|
|
(
|
)
|
||||||
|
At January 1, 2018
|
(
|
)
|
(
|
)
|
|
|
|
|
|
|
|
|
(
|
)
|
||||||
|
Credited/(charged) to income
|
(
|
)
|
|
|
|
|
|
|
|
|
|
|
|
|
||||||
|
Charged to equity
|
(
|
)
|
(
|
)
|
||||||||||||||||
|
Charged to other comprehensive income
|
(
|
)
|
(
|
)
|
||||||||||||||||
|
Impact of business combinations
|
(
|
)
|
|
|
(
|
)
|
||||||||||||||
|
Other movements
|
(
|
)
|
(
|
)
|
|
|
(
|
)
|
|
|
||||||||||
|
Net deferred tax balance at December 31, 2018
|
(
|
)
|
(
|
)
|
|
|
|
|
|
|
|
|
(
|
)
|
||||||
|
Gross deferred tax assets at December 31, 2018
|
|
|
|
|
|
|
|
|
|
|
|
|
||||||||
|
Gross deferred tax liabilities at December 31, 2018
|
(
|
)
|
(
|
)
|
(
|
)
|
(
|
)
|
|
|
(
|
)
|
(
|
)
|
||||||
|
Net deferred tax balance at December 31, 2018
|
(
|
)
|
(
|
)
|
|
|
|
|
|
|
|
|
(
|
)
|
||||||
The below table presents the Net deferred tax balance as of December 31, 2018 after offsetting
$
3
million
of deferred tax assets and liabilities within the same tax jurisdiction.
|
($ millions)
|
At December 31, 2018
|
|
|
Deferred tax assets
|
|
|
|
Deferred tax liabilities
|
(
|
)
|
|
Net deferred tax balance
|
(
|
)
|
The below table presents deferred tax assets and deferred tax liabilities expected to have an impact on current taxes payable after more than twelve months.
|
($ billions)
|
At December 31, 2019
|
|
At December 31, 2018
|
|
|
|
Deferred tax assets
|
|
|
|
|
|
|
Deferred tax liabilities
|
|
|
|
|
|
For foreign unremitted earnings retained by consolidated entities for reinvestment, which amounted to
$
7
billion
as of December 31, 2019, no provision is made for income taxes that would be payable upon the distribution of these earnings. If these earnings were remitted, an income tax charge could result based on the tax statutes currently in effect.
Temporary differences on which no deferred tax has been provided as they are permanent in nature relate to goodwill from acquisitions and amounted to
$
9
billion
as of December 31, 2019 and 2018.
The gross value of tax loss carry forwards capitalized as deferred tax assets amount to
$
521
million
(2018:
$
146
million
), of which
$
33
million
expire in five years and
$
488
million
expire in more than
five years
. All tax loss carry forwards have been capitalized as deferred tax assets in 2019 as it is probable that sufficient taxable income will be available for the foreseeable future.
F-37
NOTES TO CONSOLIDATED FINANCIAL STATEMENTS OF ALCON INC. (Continued)
Swiss tax reform
On June 30, 2019, Swiss voters approved the Swiss Tax Reform and Old Age Insurance financing bill ("Swiss tax reform"). As a result, the corporate income tax rate applicable to Alcon’s Swiss profits as of January 1, 2020 will increase from approximately 9.4% in 2019 to approximately 14.2% beginning in 2020. This change resulted in a non-cash increase in tax expense of
$
304
million
related to the re-measurement of Swiss deferred tax assets and liabilities in 2019.
US tax reform
On December 22, 2017, the US enacted tax reform legislation (Tax Cuts and Jobs Act), which among other provisions, reduced the US corporate tax rate from 35% to 21%, effective January 1, 2018. This required a revaluation of the deferred tax assets and liabilities and a portion of current tax payables to the newly enacted tax rates at the date of enactment. This resulted in the recognition of a
$
413
million
credit to income and an
$
18
million
charge to equity in 2017.
12
.
Financial and other non-current assets
The below tables provide details related to Financial assets and Other non-current assets as of December 31, 2019 and 2018.
Financial assets
|
($ millions)
|
2019
|
|
2018
|
|
|
|
Long-term financial investments measured at FVOCI
|
|
|
|
|
|
|
Long-term financial investments measured at FVPL
|
|
|
|
|
|
|
Long-term receivables from customers
|
|
|
|
|
|
|
Minimum lease payments from finance lease agreements
|
|
|
|
|
|
|
Long-term loans, advances, and security deposits
|
|
|
|
|
|
|
Total financial assets
|
|
|
|
|
|
The following table shows the receivables of the gross investments in finance leases and the net present value of the minimum lease payments, as well as unearned finance income, related to surgical equipment lease arrangements. The finance income is recorded in "Other income".
|
2019
|
2018
|
||||||||||||||||||||||||||||
|
($ millions)
|
Total
future payments |
|
Unearned
interest income |
|
Present
value |
|
Provision
|
|
Net
book value |
|
Total
future payments |
|
Unearned
interest income |
|
Present
value |
|
Provision
|
|
Net
book value |
|
|||||||||
|
Not later than one year
(1)
|
|
|
(
|
)
|
|
|
(
|
)
|
|
|
|
|
(
|
)
|
|
|
(
|
)
|
|
|
|||||||||
|
Between one and five years
|
|
|
(
|
)
|
|
|
(
|
)
|
|
|
|
|
(
|
)
|
|
|
(
|
)
|
|
|
|||||||||
|
Later than five years
|
|
|
(
|
)
|
|
|
(
|
)
|
|
|
|
|
(
|
)
|
|
|
(
|
)
|
|
|
|||||||||
|
Total
|
|
|
(
|
)
|
|
|
(
|
)
|
|
|
|
|
(
|
)
|
|
|
(
|
)
|
|
|
|||||||||
(1) The current portion of the minimum lease payments is recorded in trade receivables or other current assets (to the extent not yet invoiced).
F-38
NOTES TO CONSOLIDATED FINANCIAL STATEMENTS OF ALCON INC. (Continued)
Other non-current assets
|
($ millions)
|
2019
|
|
2018
|
|
|
|
Deferred compensation plans
|
|
|
|
|
|
|
Prepaid post-employment benefit plans
|
|
|
|
|
|
|
Other non-current assets
|
|
|
|
|
|
|
Total other non-current assets
|
|
|
|
|
|
13
.
Inventories
The amount of inventory recognized as an expense in "Cost of net sales" in the consolidated income statements during
2019
amounted to
$
2.2
billion
(
2018
:
$
2.2
billion
,
2017
:
$
2.1
billion
). The amount of inventory recognized as an expense in "Cost of other revenues" in the consolidated income statements during
2019
amounted to
$
127
million
(
2018
:
$
0
million
,
2017
:
$
0
million
).
|
($ millions)
|
2019
|
|
2018
|
|
||
|
Raw material, consumables
|
|
|
|
|
||
|
Work in progress
|
|
|
|
|
||
|
Finished products
|
|
|
|
|
||
|
Total inventories
|
|
|
|
|
||
Alcon recognized inventory provisions amounting to
$
140
million
in
2019
(
2018
:
$
148
million
,
2017
:
$
73
million
) and reversed inventory provisions amounting to
$
65
million
(
2018
:
$
56
million
,
2017
:
$
15
million
). Inventory provisions mainly relate to the adjustment of inventory balances to their net realizable value based on the forecasted sales. Reversals are made when the products become saleable.
F-39
NOTES TO CONSOLIDATED FINANCIAL STATEMENTS OF ALCON INC. (Continued)
14
.
Trade receivables
The following table provides details related to Trade receivables as of December 31, 2019 and 2018:
|
($ millions)
|
2019
|
|
2018
|
|
|
|
Total gross trade receivables
|
|
|
|
|
|
|
Provisions for doubtful trade receivables
|
(
|
)
|
(
|
)
|
|
|
Total trade receivables, net
|
|
|
|
|
|
The following table summarizes the movement in the provision for doubtful trade receivables:
|
($ millions)
|
2019
|
|
2018
|
|
2017
|
|
||
|
January 1
|
(
|
)
|
(
|
)
|
(
|
)
|
||
|
Transfers with former parent
|
|
|
|
|
|
|
||
|
Provisions for doubtful trade receivables charged to the consolidated income statement
|
(
|
)
|
(
|
)
|
(
|
)
|
||
|
Utilization of provisions for doubtful trade receivables
|
|
|
|
|
|
|
||
|
Reversal of provisions for doubtful trade receivables
|
|
|
|
|
|
|
||
|
Currency translation effects
|
|
|
|
|
(
|
)
|
||
|
December 31
|
(
|
)
|
(
|
)
|
(
|
)
|
||
The following sets forth the trade receivables that are not overdue as specified in the payment terms and conditions established with Alcon's customers, as well as an analysis of overdue amounts and related provisions for doubtful trade receivables:
|
($ millions)
|
2019
|
|
2018
|
|
|
|
Not overdue
|
|
|
|
|
|
|
Past due for not more than one month
|
|
|
|
|
|
|
Past due for more than one month but less than three months
|
|
|
|
|
|
|
Past due for more than three months but less than six months
|
|
|
|
|
|
|
Past due for more than six months but less than one year
|
|
|
|
|
|
|
Past due for more than one year
|
|
|
|
|
|
|
Provisions for doubtful trade receivables
|
(
|
)
|
(
|
)
|
|
|
Total trade receivables, net
|
|
|
|
|
|
Trade receivable balances include sales to wholesalers, retailers, doctor groups, private health systems, government agencies, pharmacy benefit managers and government-supported healthcare systems.
We consider our doubtful debt provisions to be adequate. The majority of the outstanding trade receivables from Greece, Italy, Portugal, Spain, Brazil, Russia, Turkey, Saudi Arabia, and Argentina (the closely monitored countries) are due directly from local governments or from government-funded entities except for Russia, Brazil, and Turkey. We evaluate trade receivables in these countries for potential collection risk. Should there be a substantial deterioration in our economic exposure with respect to those countries, we may increase our level of provisions by updating our expected loss provision or may change the terms of trade on which we operate.
The following table shows the gross trade receivables balance from these closely monitored countries as of
December 31, 2019
and
2018
, the amounts that are past due for more than one year and the related amount of the provisions for doubtful trade receivables that have been recorded:
F-40
NOTES TO CONSOLIDATED FINANCIAL STATEMENTS OF ALCON INC. (Continued)
|
($ millions)
|
2019
|
|
2018
|
|
|
|
Total balance of gross trade receivables from closely monitored countries
|
|
|
|
|
|
|
Past due for more than one year
|
|
|
|
|
|
|
Provisions for doubtful trade receivables
|
(
|
)
|
(
|
)
|
|
Trade receivables include amounts denominated in the following major currencies:
|
($ millions)
|
2019
|
|
2018
|
|
|
|
US dollar (USD)
|
|
|
|
|
|
|
Euro (EUR)
|
|
|
|
|
|
|
Japanese yen (JPY)
|
|
|
|
|
|
|
Chinese yuan (CNY)
|
|
|
|
|
|
|
Indian rupee (INR)
|
|
|
|
|
|
|
Canadian dollar (CAD)
|
|
|
|
|
|
|
Australian dollar (AUD)
|
|
|
|
|
|
|
British pound (GBP)
|
|
|
|
|
|
|
Russian ruble (RUB)
|
|
|
|
|
|
|
South Korean won (KRW)
|
|
|
|
|
|
|
Other currencies
|
|
|
|
|
|
|
Total trade receivables, net
|
|
|
|
|
|
15
.
Other current assets
The following table provides details related to Other current assets as of December 31, 2019 and 2018:
|
($ millions)
|
2019
|
|
2018
|
|
|
|
Current portion of long-term financial investments measured at FVPL
|
|
|
|
|
|
|
Current portion of long-term receivables from customers
|
|
|
|
|
|
|
Current portion of minimum lease payments from finance lease agreements
|
|
|
|
|
|
|
Prepaid expenses
|
|
|
|
|
|
|
Other receivables, security deposits and current assets
|
|
|
|
|
|
|
Derivative financial instruments
|
|
|
|
|
|
|
VAT receivable
|
|
|
|
|
|
|
Total other current assets
|
|
|
|
|
|
16
.
Right-of-use assets and Lease liabilities
Alcon adopted IFRS 16,
Leases
effective January 1, 2019, as described in Note
3
to these Consolidated Financial Statements.
Alcon has applied the modified retrospective method, with right-of-use assets measured at an amount equal to the lease liability, adjusted by the amount of the prepaid or accrued lease payments relating to those leases recognized in the balance sheet immediately before the date of initial application.
In applying IFRS 16 for the first time, Alcon has used the following practical expedients on a lease by lease basis as permitted by the standard:
|
•
|
contracts previously identified as leases by applying IAS 17,
Leases
and IFRIC 4,
Determining whether an Arrangement contains a Lease
, have not been re-assessed under IFRS 16,
|
|
•
|
leases with a remaining lease term less than
twelve months
from the date of adoption and leases of low-value assets have not been recognized as right-of-use assets and lease liabilities,
|
F-41
NOTES TO CONSOLIDATED FINANCIAL STATEMENTS OF ALCON INC. (Continued)
|
•
|
measurement of right-of-use assets at the date of adoption excluded the initial direct costs, and
|
|
•
|
use of hindsight in determining the lease term for contracts containing options to extend or terminate the lease.
|
Right-of-use assets
Right-of-use assets as of
December 31, 2019
and January 1, 2019 were comprised of the following:
|
($ millions)
|
December 31, 2019
|
|
January 1, 2019
|
|
|
|
Land
|
|
|
|
|
|
|
Buildings
|
|
|
|
|
|
|
Machinery & equipment and other assets
|
|
|
|
|
|
|
Total right-of-use assets
(1)
|
|
|
|
|
|
|
(1)
|
Right-of-use assets, related to operating leases at the date of implementation of IFRS 16, were higher than the lease liabilities at the date of implementation of IFRS 16 by
$
|
Depreciation charges of
$
66
million
for the year ended
December 31, 2019
are shown in the table below by underlying class of asset:
|
($ millions)
|
2019
|
|
|
Land
|
|
|
|
Buildings
|
|
|
|
Machinery & equipment and other assets
|
|
|
|
Total
|
|
|
Additions to right-of-use assets amounted to
$
116
million
for the year ended
December 31, 2019
.
Lease liabilities
Lease liabilities of
$
286
million
were recorded on January 1, 2019.
The reconciliation of lease commitments disclosed as of
December 31, 2018
and lease liabilities recorded on January 1, 2019 is as follows:
|
($ millions)
|
||
|
Operating lease commitments as of December 31, 2018
|
|
|
|
Effect of discounting
|
(
|
)
|
|
Operating leases discounted using the incremental borrowing rate
(1)
|
|
|
|
Finance lease liabilities recognized as at December 31, 2018
|
|
|
|
Recognition exemption for short term and low-value leases
|
(
|
)
|
|
Lease liabilities as of January 1, 2019
|
|
|
|
(1)
|
|
F-42
NOTES TO CONSOLIDATED FINANCIAL STATEMENTS OF ALCON INC. (Continued)
Lease liabilities totaled
$
341
million
as of
December 31, 2019
, including
$
61
million
in current lease liabilities and
$
280
million
in non-current lease liabilities.
The contractual maturities of the undiscounted lease liabilities as of
December 31, 2019
, are as follows:
|
($ millions)
|
Lease liabilities undiscounted
|
|
|
Not later than one year
|
|
|
|
Between one and five years
|
|
|
|
Later than five years
|
|
|
|
Total lease liabilities undiscounted
|
|
|
|
($ millions)
|
Lease liabilities
|
|
|
Not later than one year
|
|
|
|
Between one and five years
|
|
|
|
Later than five years
|
|
|
|
Total lease liabilities
|
|
|
The following table provides additional disclosures related to right-of-use assets and lease liabilities:
|
($ millions)
|
2019
|
|
|
Interest expense on lease liabilities
|
|
|
|
Expense on short-term and low value leases
|
|
|
|
Total cash outflows for leases
|
|
|
|
Thereof:
|
||
|
Lease liability payments
(1)
|
|
|
|
Interest payments
(2)
|
|
|
|
Short-term and low value lease payments
(2)
|
|
|
|
(1)
|
Reported as cash outflows from financing activities net of lease incentives received
|
|
(2)
|
Included within total net cash flows from operating activities
|
F-43
NOTES TO CONSOLIDATED FINANCIAL STATEMENTS OF ALCON INC. (Continued)
Prior to the adoption of IFRS 16, Alcon prepared the required disclosures for operating lease commitments and finance lease future minimum lease payments.
Operational lease commitments as of December 31, 2018, were as follows:
|
($ millions)
|
2018
|
|
|
Not later than one year
|
|
|
|
Between one and five years
|
|
|
|
Later than five years
|
|
|
|
Total operational lease commitments
|
|
|
Future minimum lease payments under finance leases, together with the present value of the minimum lease payments as of December 31, 2018, were as follows:
|
($ millions)
|
2018
|
|
|
Not later than one year
|
|
|
|
Between one and five years
|
|
|
|
Later than five years
|
|
|
|
Total minimum lease liabilities
|
|
|
|
Less future finance charges
|
(
|
)
|
|
Present value of minimum lease payments
|
|
|
F-44
NOTES TO CONSOLIDATED FINANCIAL STATEMENTS OF ALCON INC. (Continued)
17
.
Non-current and current financial debts
The below table summarizes current and non-current Financial debts outstanding as of
December 31, 2019
and
2018
.
|
($ millions)
|
2019
|
|
2018
|
|
|
Non-current financial debts
|
||||
|
Facility B
|
|
|
|
|
|
Facility C
|
|
|
|
|
|
Local facilities (Japan)
|
|
|
|
|
|
Series 2026 notes
|
|
|
|
|
|
Series 2029 notes
|
|
|
|
|
|
Series 2049 notes
|
|
|
|
|
|
Revolving facility
|
|
|
|
|
|
Total non-current financial debts
|
|
|
|
|
|
Current financial debts
|
||||
|
Local facilities:
|
||||
|
Japan
|
|
|
|
|
|
All others
|
|
|
|
|
|
Other short-term financial debts
|
|
|
|
|
|
Derivatives
|
|
|
|
|
|
Total current financial debts
|
|
|
|
|
|
Total financial debts
|
|
|
|
|
Alcon entered into the below borrowing arrangements in connection with the Spin-off, as described in Note
4
to these Consolidated Financial Statements, and refinanced a portion of those borrowing arrangements, as further described below. Interest expense recognized for Financial debts, excluding lease liabilities, was
$
81
million
,
$
10
million
and
$
12
million
for the years ended
December 31, 2019
,
2018
and
2017
, respectively. The weighted average interest rate on Financial debts was
2.9
%
in 2019 and
17.4
%
in
2018
.
Bridge Loan, Term Loan, and Revolving Credit Facilities
On March 6, 2019, Alcon entered into a
$
1.5
billion
unsecured
364-day
bridge loan facility with
two
extension options, each for a period of
180
days
(the "Bridge Facility"), a
$
0.5
billion
unsecured
three-year
term loan facility ("Facility A"), a
$
0.8
billion
unsecured
five-year
term loan facility ("Facility B"), a
$
0.4
billion
(or the equivalent in EUR) unsecured
five-year
term loan facility ("Facility C") and a
$
1.0
billion
unsecured
five-year
committed multicurrency revolving credit facility (the "Revolving Facility" and, together with the Bridge Facility, Facility A, Facility B and Facility C, the "Facilities"). On April 2, 2019, Alcon borrowed
$
3.2
billion
against the bridge and other term loans. The Revolving Facility was undrawn as of
December 31, 2019
.
The Facilities bear interest rates equal to the interest rate benchmark (prevailing Euro Interbank Offered Rate (“EURIBOR”) in the case of loans denominated in EUR, USD prevailing London Interbank Offered Rate (“LIBOR”) in the case of loans denominated in USD and CHF LIBOR in the case of loans denominated in CHF), plus an applicable margin.
Alcon and certain of its subsidiaries are the borrowers under the Facilities and Alcon guarantees the borrowings of such subsidiaries under the Facilities. In addition, the Revolving Facility includes a mechanism through which certain subsidiaries, as approved by the lenders, can accede as a borrower.
Alcon is permitted to voluntarily prepay loans under the Facilities, in whole or in part, without penalty or premium subject to certain minimum prepayment amounts and the payment of accrued interest on the amount prepaid and customary breakage costs. The Bridge Facility had a mandatory prepayment provision, pursuant to which
F-45
NOTES TO CONSOLIDATED FINANCIAL STATEMENTS OF ALCON INC. (Continued)
Alcon would have to apply proceeds from relevant debt capital markets transactions in prepayment under the Bridge Facility.
The terms of the Facilities include certain events of default and covenants customary for investment grade credit facilities, including restrictive covenants that will limit, among other things, the grant or incurrence of security interests over any of Alcon's assets, the incurrence of certain indebtedness and entry into certain fundamental change transactions. The Facilities do not contain any financial covenants.
Refinancing of Bridge Facility and Facility A
On
September 23, 2019
, AFC issued Senior Notes ("Notes") with maturity dates in
2026
,
2029
, and
2049
, which are guaranteed by the Company. The Notes are unsecured senior obligations of AFC issued in a private placement. The total notional amount of the Notes is
$
2.0
billion
. The Notes were issued at a discount totaling
$
7.0
million
, which was recorded as a reduction to the carrying value of the Notes and will be amortized to Interest expense over the term of the Notes. AFC incurred
$
15
million
of debt issuance costs, which were recorded as a reduction to the carrying value of the Notes and will be amortized to Other financial income & expense over the term of the Notes.
The Notes consist of the following:
|
•
|
Series 2026 Notes -
$
|
|
•
|
Series 2029 Notes -
$
|
|
•
|
Series 2049 Notes -
$
|
The funds borrowed through the issuance of the Notes were used to repay the
$
1.5
billion
Bridge Facility and
$
0.5
billion
Facility A. The transaction was accounted for as an extinguishment of a liability. Alcon recognized a loss of
$
4
million
associated with the write-off of unamortized deferred financing costs due to extinguishment of the original financing. This loss on extinguishment was recognized in Other financial income & expense.
The following table provides details on the maturity of the contractual undiscounted cash flows for Alcon's borrowings as of
December 31, 2019
:
|
($ millions)
|
Nominal amount - Current and non-current financial debt
|
|
Derivatives
|
|
Total
|
|
||
|
Not later than one year
|
|
|
|
|
|
|
||
|
Between one and five years
|
|
|
|
|
|
|
||
|
Later than five years
|
|
|
|
|
|
|
||
|
Total cash flows
|
|
|
|
|
|
|
||
|
Unamortized debt discount and issuance costs
|
(
|
)
|
|
|
(
|
)
|
||
|
Total carrying value
|
|
|
|
|
|
|
||
The following table provides details on the maturity of the future contractual interest payments commitments:
|
($ millions)
|
Interest
|
|
|
Not later than one year
|
|
|
|
Between one and five years
|
|
|
|
Later than five years
|
|
|
|
Total cash flows
|
|
|
As of
December 31, 2018
, the contractual undiscounted cash flows for borrowings was
$
47
million
for the current financial debts reflected in Financial debts on the Consolidated Balance Sheets.
F-46
NOTES TO CONSOLIDATED FINANCIAL STATEMENTS OF ALCON INC. (Continued)
Local Bilateral Facilities
In February 2019, Alcon entered into a number of local bilateral facilities in different countries, with the largest share of borrowings in Japan. A total of
$
0.3
billion
was drawn including
$
0.2
billion
in two lines for Japan. All local bilateral lines are classified as current with a maturity date in
one year
or less, with the exception of one line in Japan with a maturity date in 2021 which is classified as non-current. As of
December 31, 2019
, there was
$
35
million
undrawn on the facility in Japan.
Derivatives
As of
December 31, 2019
, the net value of unsettled positions for derivative forward contracts and swaps was
$
15
million
, including
$
1
million
of unrealized gains in Other current assets and
$
16
million
of unrealized losses in Current financial debts. Master agreements were executed with several banking counterparties for derivatives financial instruments, however, there were no derivative financial instruments meeting the offsetting criteria under IFRS as of
December 31, 2019
. Alcon did not hold derivative financial instruments as of
December 31, 2018
.
F-47
NOTES TO CONSOLIDATED FINANCIAL STATEMENTS OF ALCON INC. (Continued)
18
.
Financial instruments - additional disclosures
The below table provides detail related to financial instruments as of
December 31, 2019
and
2018
.
|
($ millions)
|
Note
|
2019
|
|
2018
|
|
||
|
Cash and cash equivalents
|
|||||||
|
Cash in current accounts
|
|
|
|
|
|||
|
Cash held in time deposits and money market funds
|
|
|
|
|
|||
|
Total Cash and cash equivalents
|
|
|
|
|
|||
|
Financial assets - measured at fair value through other comprehensive income ("FVOCI")
|
|||||||
|
Long-term financial investments
|
12
|
|
|
|
|
||
|
Total financial assets - measured at FVOCI
|
|
|
|
|
|||
|
Financial assets - measured at amortized costs
(1)
|
|||||||
|
Trade receivables
|
14
|
|
|
|
|
||
|
Receivables from former parent
|
25
|
|
|
|
|
||
|
Income tax receivables
|
|
|
|
|
|
||
|
Other financial receivables from former parent
|
25
|
|
|
|
|
||
|
Other current assets (excluding prepaid expenses and other current assets measured at FVPL)
|
15
|
|
|
|
|
||
|
Long-term receivables from customers
|
12
|
|
|
|
|
||
|
Non-current minimum lease payments from finance lease agreements
|
12
|
|
|
|
|
||
|
Long-term loans, advances, and security deposits
|
12
|
|
|
|
|
||
|
Total financial assets - measured at amortized costs
|
|
|
|
|
|||
|
Financial assets - measured at fair value through profit and loss ("FVPL")
|
|||||||
|
Current portion of long-term financial investments
|
15
|
|
|
|
|
||
|
Derivative fInancial instruments
|
15
|
|
|
|
|
||
|
Long-term financial investments
|
12
|
|
|
|
|
||
|
Total financial assets - measured at FVPL
|
|
|
|
|
|||
|
Total financial assets
|
|
|
|
|
|||
|
Financial liabilities - measured at amortized cost or cost
(1)
|
|||||||
|
Current financial liabilities
|
|||||||
|
Financial debts
|
17
|
|
|
|
|
||
|
Lease liabilities
|
16
|
|
|
|
|
||
|
Trade payables
|
|
|
|
|
|||
|
Payables to former parent
|
25
|
|
|
|
|
||
|
Other financial liabilities to former parent
|
25
|
|
|
|
|
||
|
Total current financial liabilities - measured at amortized cost or cost
|
|
|
|
|
|||
|
Non-current financial liabilities
|
|||||||
|
Financial debts
|
17
|
|
|
|
|
||
|
Lease liabilities
|
16
|
|
|
|
|
||
|
Total non-current financial liabilities - measured at amortized cost or cost
|
|
|
|
|
|||
|
Total financial liabilities - measured at amortized cost or cost
|
|
|
|
|
|||
|
Financial liabilities - measured at FVPL
|
|||||||
|
Contingent consideration liabilities
|
19/20
|
|
|
|
|
||
|
Derivative financial instruments
|
17
|
|
|
|
|
||
|
Total financial liabilities - measured at FVPL
|
|
|
|
|
|||
|
Total financial liabilities
|
|
|
|
|
|||
|
Net financial assets and financial liabilities
|
(
|
)
|
|
|
|||
|
(1)
|
The carrying amount is a reasonable approximation of fair value, with the exception of the Series 2026, 2029 and 2049 notes recorded in Non-current financial debts with a fair value of
$
|
F-48
NOTES TO CONSOLIDATED FINANCIAL STATEMENTS OF ALCON INC. (Continued)
Fair value by hierarchy
As required by IFRS, financial assets and liabilities recorded at fair value in the Consolidated Financial Statements are categorized based upon the level of judgment associated with the inputs used to measure their fair value.
There are three hierarchical levels, based on an increasing amount of judgment associated with the inputs to derive fair value for these financial assets and liabilities, which are as follows:
Financial assets and liabilities carried at Level 1 fair value hierarchy are listed in active markets.
Financial assets and liabilities carried at Level 2 fair value hierarchy are valued using corroborated market data.
As of
December 31, 2019
, Level 1 financial assets include money market funds . There were no financial liabilities carried at Level 1 fair value, and Level 2 financial assets and liabilities include derivative financial instruments. As of
December 31, 2018
, there were no financial assets or liabilities carried at Level 1 fair value or Level 2 fair value.
Investments in money market funds are classified within Level 1 of the fair value hierarchy because they are valued using quoted market prices. The investments are classified as Cash & cash equivalents within our Consolidated Balance Sheets.
Level 3 inputs are unobservable for the financial asset or liability. The financial assets and liabilities generally included in Level 3 fair value hierarchy are equity securities and convertible notes receivable measured at FVOCI, and fund investments, options to acquire private companies, and contingent consideration liabilities measured at FVPL.
F-49
NOTES TO CONSOLIDATED FINANCIAL STATEMENTS OF ALCON INC. (Continued)
The following tables summarize financial assets and liabilities measured at fair value on a recurring basis or at amortized cost or cost as of December 31, 2019 and 2018.
|
|
December 31, 2019
|
|||||||||||||
|
($ millions)
|
Level 1
|
|
Level 2
|
|
Level 3
|
|
Valued at amortized cost or cost
|
|
Total
|
|
||||
|
Non-current financial assets
|
||||||||||||||
|
Long-term financial investments measured at FVOCI
|
|
|
|
|
|
|
—
|
|
|
|
||||
|
Long-term financial investments measured at FVPL
|
|
|
|
|
|
|
—
|
|
|
|
||||
|
Long-term receivables from customers
|
|
|
|
|
|
|
|
|
|
|
||||
|
Non-current minimum lease payments from finance lease agreements
|
|
|
|
|
|
|
|
|
|
|
||||
|
Long-term loans, advances, and security deposits
|
|
|
|
|
|
|
|
|
|
|
||||
|
Total non-current financial assets
|
|
|
|
|
|
|
|
|
|
|
||||
|
Current financial assets
|
||||||||||||||
|
Money market funds
|
|
|
|
|
|
|
—
|
|
|
|
||||
|
Current portion of long-term financial investments measured at FVPL
(1)
|
|
|
|
|
|
|
—
|
|
|
|
||||
|
Current portion of long-term receivables from customers
(1)
|
|
|
|
|
|
|
|
|
|
|
||||
|
Current portion of minimum lease payments from finance lease agreements
(1)
|
|
|
|
|
|
|
|
|
|
|
||||
|
Other receivables, security deposits and current assets
(1)
|
|
|
|
|
|
|
|
|
|
|
||||
|
VAT receivables
(1)
|
|
|
|
|
|
|
|
|
|
|
||||
|
Derivative financial instruments
(1)
|
|
|
|
|
|
|
—
|
|
|
|
||||
|
Total current financial assets
|
|
|
|
|
|
|
|
|
|
|
||||
|
Total financial assets at fair value and amortized cost or cost
|
|
|
|
|
|
|
|
|
|
|
||||
|
Financial liabilities
|
||||||||||||||
|
Contingent consideration liabilities
|
|
|
|
|
(
|
)
|
—
|
|
(
|
)
|
||||
|
Non-current financial debt
|
|
|
|
|
|
|
(
|
)
|
(
|
)
|
||||
|
Current financial debt
|
|
|
|
|
|
|
(
|
)
|
(
|
)
|
||||
|
Derivative financial instruments
|
|
|
(
|
)
|
|
|
—
|
|
(
|
)
|
||||
|
Total financial liabilities at fair value and amortized cost
|
|
|
(
|
)
|
(
|
)
|
(
|
)
|
(
|
)
|
||||
|
(1)
|
Recorded in Other current assets.
|
F-50
NOTES TO CONSOLIDATED FINANCIAL STATEMENTS OF ALCON INC. (Continued)
|
December 31, 2018
|
||||||||||||||
|
($ millions)
|
Level 1
|
|
Level 2
|
|
Level 3
|
|
Valued at amortized cost or cost
|
|
Total
|
|
||||
|
Non-current financial assets
|
||||||||||||||
|
Long-term financial investments measured at FVOCI
|
|
|
|
|
|
|
—
|
|
|
|
||||
|
Long-term financial investments measured at FVPL
|
|
|
|
|
|
|
—
|
|
|
|
||||
|
Long-term receivables from customers
|
|
|
|
|
|
|
|
|
|
|
||||
|
Non-current minimum lease payments from finance lease agreements
|
|
|
|
|
|
|
|
|
|
|
||||
|
Long-term loans, advances, and security deposits
|
|
|
|
|
|
|
|
|
|
|
||||
|
Total non-current financial assets
|
|
|
|
|
|
|
|
|
|
|
||||
|
Current financial assets
(1)
|
||||||||||||||
|
Current portion of long-term financial investments measured at FVPL
|
|
|
|
|
|
|
—
|
|
|
|
||||
|
Current portion of long-term receivables from customers
|
|
|
|
|
|
|
|
|
|
|
||||
|
Current portion of minimum lease payments from finance lease agreements
|
|
|
|
|
|
|
|
|
|
|
||||
|
Other receivables, security deposits and current assets
|
|
|
|
|
|
|
|
|
|
|
||||
|
VAT receivables
|
|
|
|
|
|
|
|
|
|
|
||||
|
Derivative financial instruments
|
|
|
|
|
|
|
—
|
|
|
|
||||
|
Total current financial assets
|
|
|
|
|
|
|
|
|
|
|
||||
|
Total financial assets at fair value and amortized cost or cost
|
|
|
|
|
|
|
|
|
|
|
||||
|
Financial liabilities
|
||||||||||||||
|
Contingent consideration liabilities
|
|
|
|
|
(
|
)
|
—
|
|
(
|
)
|
||||
|
Non-current financial debt
|
|
|
|
|
|
|
|
|
|
|
||||
|
Current financial debt
|
|
|
|
|
|
|
(
|
)
|
(
|
)
|
||||
|
Derivative financial instruments
|
|
|
|
|
|
|
—
|
|
|
|
||||
|
Total financial liabilities at fair value and amortized cost
|
|
|
|
|
(
|
)
|
(
|
)
|
(
|
)
|
||||
|
(1)
|
Current financial assets referenced in the above table are recorded in Other current assets.
|
There were no transfers of financial instruments between levels in the fair value hierarchy during the year ended
December 31, 2019
and
2018
.
Certain prior period amounts have been reclassified to reflect the inclusion of options to acquire private companies measured at FVPL in Level 3 of the fair value hierarchy to conform with current period presentation.
F-51
NOTES TO CONSOLIDATED FINANCIAL STATEMENTS OF ALCON INC. (Continued)
Level 3 financial instruments measured at fair value on a recurring basis
Financial assets
|
Long-term financial investments measured
at FVOCI |
Financial investments
measured at FVPL |
||||||||||
|
($ millions)
|
2019
|
|
2018
|
|
2019
|
|
2018
|
|
|||
|
Balance as of January 1
(1)
|
|
|
|
|
|
|
|
|
|||
|
Additions
|
|
|
|
|
|
|
|
|
|||
|
Cash receipts and payments
|
|
|
|
|
(
|
)
|
(
|
)
|
|||
|
Gains/(losses) recognized in consolidated statements of comprehensive (loss)/income
|
(
|
)
|
(
|
)
|
|
|
|
|
|||
|
Unrealized gains/(losses) in consolidated income statements
|
|
|
|
|
(
|
)
|
|
|
|||
|
Amortization
|
|
|
|
|
(
|
)
|
(
|
)
|
|||
|
Reclassification
|
|
|
|
|
|
|
|
|
|||
|
Balance as of December 31
|
|
|
|
|
|
|
|
|
|||
|
(1)
|
January 1, 2018 balances reflected in this table are as adjusted for adoption of IFRS 9,
Financial Instruments
.
|
If the pricing parameters for the Level 3 input were to change for Long-term financial investments measured at FVOCI and Financial investments measured at FVPL by
10
%
positively or negatively, this would change the amount recorded in the
2019
Consolidated Statements of Comprehensive Loss by
$
3
million
.
Financial liabilities
|
Contingent consideration liabilities
|
|||||
|
($ millions)
|
2019
|
|
2018
|
|
|
|
Balance as of January 1
|
(
|
)
|
(
|
)
|
|
|
Additions
|
(
|
)
|
(
|
)
|
|
|
Accretion for passage of time
|
(
|
)
|
(
|
)
|
|
|
Adjustments for changes in assumptions
|
|
|
|
|
|
|
Payments
|
|
|
|
|
|
|
Balance as of December 31
|
(
|
)
|
(
|
)
|
|
Contingent consideration additions of
$
135
million
relate to the acquisition of PowerVision, Inc. in March 2019 as described in Note
4
of these Consolidated Financial Statements. Adjustments for changes in assumptions of
$
75
million
are primarily related to revised expectations for achievement of commercial milestones and changes in assumptions related to the expected timing of settlement for development milestones. As of
December 31, 2019
, the maximum remaining potential payments related to contingent consideration from business combinations is
$
510
million
plus other amounts calculated as a percentage of commercial sales in cases where there is not a specified maximum contractual payment amount.
Changes in the contingent consideration liability balance for the same period in prior year included additions of
$
102
million
related to the acquisitions as described in Note 4 to these Consolidated Financial Statements. Adjustments for changes in assumptions of
$
62
million
are primarily related to revised expectations for achievement of milestones due to a product's voluntary market withdrawal.
Contingent consideration liabilities are reported in “Provisions & other non-current liabilities" and "Provisions & other current liabilities” based on the projected timing of settlement which is estimated to range from 2020 through 2029 for contingent consideration obligations as of
December 31, 2019
.
For the determination of the fair value of a contingent consideration various unobservable inputs are used. A change in these inputs might result in a significantly higher or lower fair value measurement. The inputs used
F-52
NOTES TO CONSOLIDATED FINANCIAL STATEMENTS OF ALCON INC. (Continued)
are, among others, the probability of success, sales forecast and assumptions regarding the discount rate, timing and different scenarios of triggering events. The significance and usage of these inputs to each contingent consideration may vary due to differences in the timing and triggering events for payments or in the nature of the asset related to the contingent consideration.
If the most significant parameters for the Level 3 input were to change by
10
%
positively or negatively, or where the probability of success is the most significant input parameter
10
%
were added or deducted from the applied probability of success, for contingent consideration payables, this would change the amounts recorded in the
2019
Consolidated Income Statements by
$
34
million
and
$
32
million
respectively.
Nature and extent of risks arising from financial instruments
Market risk
Alcon is exposed to market risk, primarily related to foreign currency exchange rates, interest rates and the market value of the investments of liquid funds. Alcon actively monitors and seeks to reduce, where it deems it appropriate to do so, fluctuations in these exposures. It is Alcon policy and practice to enter into a variety of derivative financial instruments to manage the volatility of these exposures and to enhance the yield on the investment of liquid funds. Alcon does not enter into any financial transactions containing a risk that cannot be quantified at the time the transaction is concluded. In addition, Alcon does not sell short assets it does not have, or does not know it will have, in the future. Alcon only sells existing assets or enters into transactions and future transactions (in the case of anticipatory hedges) that it confidently expects it will have in the future, based on past experience. In the case of liquid funds, Alcon writes call options on assets it has, or writes put options on positions it wants to acquire and has the liquidity to acquire. Alcon expects that any loss in value for these instruments generally would be offset by increases in the value of the underlying transactions.
Foreign currency exchange rate risk
Alcon uses the US Dollar as its reporting currency and is therefore exposed to foreign currency exchange movements, primarily in Euros, Japanese Yen, Chinese Renminbi, Swiss Francs, and emerging market currencies. Fluctuations in the exchange rate between the US Dollar and other currencies can have a significant effect on both the Alcon’s results of operations, including reported sales and earnings, as well as on the reported value of our assets, liabilities and cash flows. This, in turn, may significantly affect the comparability of period-to-period results of operations.
Alcon manages its global currency exposure by engaging in hedging transactions where management deems appropriate (forward contracts and swaps). Specifically, Alcon enters into various contracts that reflect the changes in the value of foreign currency exchange rates to preserve the value of assets.
Interest rate risk
Alcon's exposure to cash flow interest rate risks arises mainly from non-current financial debts at variable rates. Alcon may enter into interest rate swap agreements, in which it exchanges periodic payments based on a notional amount and agreed-upon fixed and variable rate interests. If the interest rates had been higher / lower by
1
%
, the loss before taxes would have been higher / lower by
$
12
million
from the impacts of interest expense and interest income based on the change in the interest rate.
Commodity price risk
Alcon has only a very limited exposure to price risk related to anticipated purchases of certain commodities used as raw materials by Alcon's businesses. A change in those prices may alter the gross margin of a specific business, but generally by not more than
10
%
of the margin and thus below Alcon's risk management tolerance levels. Accordingly, Alcon does not enter into significant forward and option contracts to manage fluctuations in prices of anticipated purchases.
Credit risk
Credit risks arise from the possibility that customers may not be able to settle their obligations as agreed. To manage this risk, Alcon periodically assesses credit risk, assigns individual credit limits, and takes actions to mitigate credit risk where appropriate. For further information, refer to Note
14
of these Consolidated Financial Statements.
F-53
NOTES TO CONSOLIDATED FINANCIAL STATEMENTS OF ALCON INC. (Continued)
No
customer accounted for
10%
or more of Alcon's net sales in
2019
,
2018
, or
2017
.
Liquidity risk
Liquidity risk is defined as the risk that Alcon could not be able to settle or meet its obligations on time or at a reasonable price. Alcon Treasury is responsible for liquidity, funding and settlement management. In addition, liquidity and funding risks, and related processes and policies, are overseen by management. Alcon manages its liquidity risk on a consolidated basis according to business needs, tax, capital or regulatory considerations, if applicable, through numerous sources of financing in order to maintain flexibility. Management monitors Alcon's net debt or liquidity position through rolling forecasts on the basis of expected cash flows. For further information on maturity of the contractual undiscounted cash flows for Alcon's borrowings and interest on borrowing, refer to Note
17
of these Consolidated Financial Statements.
F-54
NOTES TO CONSOLIDATED FINANCIAL STATEMENTS OF ALCON INC. (Continued)
19
.
Provisions and other non-current liabilities
The below table provides details related to Provisions and other non-current liabilities as of
December 31, 2019
, and
2018
.
|
($ millions)
|
2019
|
|
2018
|
|
|
|
Accrued liability for employee benefits:
|
|
|
|
|
|
|
Defined benefit pension plans
(1)
|
|
|
|
|
|
|
Other long-term employee benefits and deferred compensation
|
|
|
|
|
|
|
Other post-employment benefits
(1)
|
|
|
|
|
|
|
Provisions for product liabilities, governmental investigations and other legal matters
|
|
|
|
|
|
|
Contingent consideration
(2)
|
|
|
|
|
|
|
Other non-current liabilities
|
|
|
|
|
|
|
Total provisions and other non-current liabilities
|
|
|
|
|
|
|
(1)
|
Note
23
to these Consolidated Financial Statements provides additional disclosures related to post-employment benefits.
|
|
(2)
|
Note
18
to these Consolidated Financial Statements provides additional disclosures related to contingent consideration.
|
Alcon believes that its total provisions are adequate based upon currently available information. However, given the inherent difficulties in estimating liabilities in this area, Alcon may incur additional costs beyond the amounts provided. Management believes that such additional amounts, if any, would not be material to Alcon's financial condition but could be material to the results of operations or cash flows in a given period.
Provisions for product liabilities, governmental investigations and other legal matters
Alcon has established provisions for certain product liabilities, governmental investigations and other legal matters, where a potential cash outflow is probable and a reliable estimate can be made of the amount of the outflow. These provisions represent the current best estimate of the total financial effect for the matters described below and for other less significant matters. Potential cash outflows reflected in a provision may be fully or partially off-set by insurance in certain circumstances.
Alcon has not established provisions for potential damage awards for certain additional legal claims if Alcon currently believes that a payment is either not probable or cannot be reliably estimated. A number of other legal matters are in such early stages or the issues presented are such that Alcon has not made any provisions since it cannot currently estimate either a potential outcome or the amount of any potential losses. For these reasons, among others, Alcon generally is unable to make a reliable estimate of possible loss with respect to such cases. It is therefore not practicable to provide information about the potential financial impact of those cases.
There might also be cases for which Alcon was able to make a reliable estimate of the possible loss or the range of possible loss, but Alcon believes that publication of such information on a case-by-case basis would seriously prejudice Alcon's position in ongoing legal proceedings or in any related settlement discussions. Accordingly, in such cases, information has been disclosed with respect to the nature of the contingency, but no disclosure is provided as to an estimate of the possible loss or range of possible loss.
Note
26
contains additional information on contingencies.
Summary of significant legal proceedings
Under the Separation and Distribution Agreement Alcon entered into with Novartis in connection with the separation and the Spin-off, Alcon and Novartis agreed, subject to certain conditions and except to the extent otherwise described below with respect to any matter, to indemnify the other party and its directors, officers, associates and other representatives against any pending or future liabilities or claims that constitute either a Novartis Group liability, in the case of Novartis, or an Alcon liability, in the case of Alcon, under the terms of the Separation and Distribution Agreement, based on whether such claim or liability relates to the Novartis business and products or Alcon's respective business and products.
A number of Alcon companies are, and will likely continue to be, subject to various legal proceedings and investigations that arise from time to time, including proceedings regarding product liability, sales and marketing
F-55
NOTES TO CONSOLIDATED FINANCIAL STATEMENTS OF ALCON INC. (Continued)
practices, commercial disputes, employment, and wrongful discharge, antitrust, securities, health and safety, environmental, tax, international trade, privacy, and intellectual property matters. As a result, Alcon may become subject to substantial liabilities that may not be covered by insurance and could affect our business, financial position and reputation. While Alcon does not believe that any of these legal proceedings will have a material adverse effect on its financial position, litigation is inherently unpredictable and large judgments sometimes occur. As a consequence, Alcon may in the future incur judgments or enter into settlements of claims that could have a material adverse effect on its results of operations or cash flow. The following is a summary as of February 25, 2020 of significant legal proceedings of the Alcon business to which Alcon or its subsidiaries are a party.
Southern District of New York / Western District of New York healthcare fraud investigation
In 2011, Alcon received a subpoena from the United States Department of Health & Human Services relating to an investigation into allegations of healthcare fraud and potential off-label promotion of certain products. The subpoena requests the production of documents relating to marketing practices and the remuneration of healthcare providers in connection with surgical equipment and certain Novartis products (Vigamox®, Nevanac®, Omnipred®, Econopred®). Alcon is cooperating with this investigation.
Asia / Russia investigation
In
2017
and
2018
, Alcon and Novartis, as well as certain present and former executives and associates of Alcon and Novartis, received document requests and subpoenas from the US Department of Justice ("DoJ") and the US SEC requesting information concerning Alcon accounting, internal controls and business practices in Asia and Russia, including revenue recognition for surgical equipment and related products and services and relationships with third party distributors, both before and after Alcon was acquired by Novartis. Alcon is cooperating with this investigation. Under the Separation and Distribution Agreement, Novartis must indemnify Alcon in respect of defined direct monetary liabilities relating to the current scope of the ongoing investigation by the DoJ and the SEC relating to certain business practices in Asia and Russia and related accounting treatment.
Contact lenses class actions
Since the first quarter of 2015, more than
50
class action complaints have been filed in several courts across the US naming as defendants contact lens manufacturers, including Alcon, and alleging violations of federal antitrust law, as well as the antitrust, consumer protection and unfair competition laws of various states, in connection with the implementation of unilateral price policies by the defendants in the sale of contact lenses. The cases have been consolidated in the Middle District of Florida by the Judicial Panel on Multidistrict Litigation and the claims are being vigorously contested.
MIVS platform patent infringement investigation
In June 2015, Johns Hopkins University ("JHU") filed a patent infringement lawsuit against certain Alcon entities alleging that the use of certain Alcon surgical products, principally by third parties, infringes a patent directed to certain methods of ocular surgery. In March 2019, Alcon and JHU entered into a settlement agreement in full settlement of all claims relating to this proceeding.
LenSx laser system and WaveLight FS200 laser patent infringement litigations
TCPA matter
In April 2016, a putative class action lawsuit was filed in Illinois federal court alleging that the defendants, Alcon and Novartis Pharmaceuticals Corporation ("NPC"), sent unsolicited facsimiles in violation of the Telephone Consumer Protection Act, and seeking to certify a representative putative nationwide class of affected consumers. The claims are being vigorously contested.
F-56
NOTES TO CONSOLIDATED FINANCIAL STATEMENTS OF ALCON INC. (Continued)
Product liability, governmental investigations and other legal matters provision movements
|
($ millions)
|
2019
|
|
2018
|
|
2017
|
|
||
|
January 1
|
|
|
|
|
|
|
||
|
Additions to provisions
|
|
|
|
|
|
|
||
|
Cash payments
|
(
|
)
|
(
|
)
|
(
|
)
|
||
|
Releases of provisions
|
(
|
)
|
(
|
)
|
(
|
)
|
||
|
December 31
|
|
|
|
|
|
|
||
|
Less current portion
|
|
|
(
|
)
|
(
|
)
|
||
|
Non-current provisions for product liabilities, governmental investigations and other legal matters at December 31
|
|
|
|
|
|
|
||
Alcon believes that its total provisions for investigations, product liability, arbitration and other legal matters are adequate based upon currently available information. However, given the inherent difficulties in estimating liabilities, there can be no assurance that additional liabilities and costs will not be incurred beyond the amounts provided.
20
.
Provisions and other current liabilities
The following table provides details related to Provisions and other current liabilities as of December 31, 2019 and 2018:
|
($ millions)
|
2019
|
|
2018
|
|
|
Taxes other than income taxes
|
|
|
|
|
|
Restructuring provisions
|
|
|
|
|
|
Accrued expenses for goods and services received but not invoiced
|
|
|
|
|
|
Accruals for royalties
|
|
|
|
|
|
Accruals for deductions from revenue
|
|
|
|
|
|
Accruals for compensation and benefits including social security
|
|
|
|
|
|
Deferred income
|
|
|
|
|
|
Provisions for product liabilities, governmental investigations and other legal matters
(1)
|
|
|
|
|
|
Accrued share-based payments
|
|
|
|
|
|
Accrued interest on financial debts
|
|
|
|
|
|
Contingent considerations
(2)
|
|
|
|
|
|
Other payables
|
|
|
|
|
|
Total provisions and other current liabilities
|
|
|
|
|
|
(1)
|
Note
19
to these Consolidated Financial Statements provides additional disclosures related to legal provisions.
|
|
(2)
|
Note
18
to these Consolidated Financial Statements provides additional disclosures related to contingent consideration.
|
Provisions and accruals are based upon management's best estimate and adjusted for actual experience. Such adjustments to the historic estimates have not been material.
F-57
NOTES TO CONSOLIDATED FINANCIAL STATEMENTS OF ALCON INC. (Continued)
Accruals for deductions from revenue
The following table shows the movement of the accruals for deductions from revenue:
|
($ millions)
|
2019
|
|
2018
|
|
2017
|
|
|
|
January 1
|
|
|
|
|
|
|
|
|
Additions
|
|
|
|
|
|
|
|
|
Payments/utilizations
|
(
|
)
|
(
|
)
|
(
|
)
|
|
|
Changes in offset against gross trade receivables
|
|
|
|
|
|
|
|
|
Currency translation effects
|
|
|
(
|
)
|
|
|
|
|
December 31
|
|
|
|
|
|
|
|
Restructuring provisions
The following table shows the movement of the restructuring provisions:
|
($ millions)
|
2019
|
|
2018
|
|
2017
|
|
|
|
January 1
|
|
|
|
|
|
|
|
|
Additions
|
|
|
|
|
|
|
|
|
Cash payments
|
(
|
)
|
(
|
)
|
(
|
)
|
|
|
Releases
|
(
|
)
|
(
|
)
|
(
|
)
|
|
|
Currency translation effects
|
|
|
|
|
|
|
|
|
December 31
|
|
|
|
|
|
|
|
In 2019, additions to restructuring provisions of
$
32
million
were related to the multi-year transformation program announced by Alcon on November 19, 2019. The additions to restructuring provisions in 2019 were related to accrued severance for the associates whose positions will be eliminated.
In
2018
, additions to restructuring provisions of
$
13
million
were related to initiatives aimed at improving the efficiency and agility of Alcon's operating model.
In 2017,
no
additions to restructuring provisions were recorded. Alcon continued initiatives to realign its operations to focus on the surgical and vision care business after the opthamology pharmaceutical business transfer to the Novartis Innovative Medicines Division.
21
.
Consolidated statements of cash flows - additional details
The Consolidated Statements of Cash Flows were prepared in accordance with IAS 7,
Statement of Cash Flows.
The below tables provide additional detail supporting select line items in the Consolidated Statements of Cash Flows.
21.1
Depreciation, amortization, impairments and fair value adjustments
|
($ millions)
|
2019
|
|
2018
|
|
2017
|
|
||
|
Property, plant & equipment
|
|
|
|
|
|
|
||
|
Right-of-use assets
|
|
|
|
|
|
|
||
|
Intangible assets
|
|
|
|
|
|
|
||
|
Financial assets
|
|
|
(
|
)
|
|
|
||
|
Total
|
|
|
|
|
|
|
||
F-58
NOTES TO CONSOLIDATED FINANCIAL STATEMENTS OF ALCON INC. (Continued)
21.2
Change in net current assets and other operating cash flow items
|
($ millions)
|
2019
|
|
2018
|
|
2017
|
|
||
|
(Increase) in inventories
|
(
|
)
|
(
|
)
|
(
|
)
|
||
|
(Increase)/decrease in trade receivables
|
(
|
)
|
|
|
(
|
)
|
||
|
Increase in trade payables
|
|
|
|
|
|
|
||
|
Net change in other current assets
|
(
|
)
|
|
|
|
|
||
|
Net change in other current liabilities
|
|
|
|
|
|
|
||
|
Total
|
(
|
)
|
|
|
|
|
||
21.3
Acquisitions of businesses, net
|
($ millions)
|
2019
|
|
2018
|
|
2017
|
|
|||
|
Net assets recognized as a result of business combinations
|
(
|
)
|
(
|
)
|
(
|
)
|
|||
|
Payables contingent consideration
|
|
|
|
|
|
|
|||
|
Other payments
|
|
|
(
|
)
|
|||||
|
Cash flows
|
(
|
)
|
(
|
)
|
(
|
)
|
|||
Notes
4
and
22
to these Consolidated Financial Statements provide further information regarding acquisitions of businesses. All acquisitions were for cash.
21.4
Reconciliation of assets and liabilities arising from financing activities
|
Financial Assets
|
Financial Liabilities
|
|||||||||||||
|
($ millions)
|
Other financial receivables from former parent
|
|
Non-current financial debts
|
|
Current financial debts
|
|
Other financial liabilities to former parent
|
|
Total
|
|
||||
|
January 1, 2019
|
(
|
)
|
|
|
|
|
|
|
|
|
||||
|
Proceeds from non-current financial debts, net of issuance costs
|
|
|
|
|
|
|
|
|
|
|
||||
|
Repayment of non-current financial debts
|
|
|
(
|
)
|
|
|
(
|
)
|
||||||
|
Proceeds from Bridge Facility, net of issuance costs
|
|
|
|
|
||||||||||
|
Repayment of Bridge Facility
|
(
|
)
|
(
|
)
|
||||||||||
|
Change in current financial debts
|
|
|
|
|
|
|
|
|
|
|
||||
|
Non-cash changes in derivatives and other fair value adjustments
|
|
|
|
|
|
|
|
|
|
|
||||
|
Change in other financial receivables from former parent
|
|
|
|
|
|
|
|
|
|
|
||||
|
Change in other financial liabilities to former parent
|
|
|
|
|
|
|
(
|
)
|
(
|
)
|
||||
|
Currency translation effects
|
|
|
|
|
(
|
)
|
|
|
(
|
)
|
||||
|
December 31, 2019
|
|
|
|
|
|
|
|
|
|
|
||||
F-59
NOTES TO CONSOLIDATED FINANCIAL STATEMENTS OF ALCON INC. (Continued)
|
Financial Assets
|
Financial Liabilities
|
|||||||||||||
|
($ millions)
|
Other financial receivables from former parent
|
|
Non-current financial debts
|
|
Current financial debts
|
|
Other financial liabilities to former parent
|
|
Total
|
|
||||
|
January 1, 2018
|
(
|
)
|
|
|
|
|
|
|
|
|
||||
|
Change in current financial debts
|
(
|
)
|
(
|
)
|
||||||||||
|
Change in other financial receivables from former parent
|
|
|
||||||||||||
|
Change in other financial liabilities to former parent
|
|
|
|
|
||||||||||
|
Non-cash change in finance lease obligation
|
|
|
|
|
||||||||||
|
Currency translation effects
|
(
|
)
|
(
|
)
|
||||||||||
|
Reclassification from non-current financial debts to lease liabilities
|
(
|
)
|
(
|
)
|
||||||||||
|
December 31, 2018
|
(
|
)
|
|
|
|
|
|
|
|
|
||||
22
.
Acquisitions of businesses
Fair value of assets and liabilities arising from acquisitions
|
($ millions)
|
2019
|
|
2018
|
|
2017
|
|
||
|
Property, plant & equipment
|
|
|
|
|
|
|
||
|
Currently marketed products
|
|
|
|
|
|
|
||
|
Acquired research & development
|
|
|
|
|
|
|
||
|
Deferred tax assets
|
|
|
|
|
|
|
||
|
Inventories
|
|
|
|
|
|
|
||
|
Trade receivables and other current assets
|
|
|
|
|
|
|
||
|
Cash and cash equivalents
|
|
|
|
|
|
|
||
|
Deferred tax liabilities
|
(
|
)
|
(
|
)
|
(
|
)
|
||
|
Trade payables and other liabilities
|
(
|
)
|
(
|
)
|
|
|
||
|
Net identifiable assets acquired
|
|
|
|
|
|
|
||
|
Acquired liquidity
|
(
|
)
|
(
|
)
|
(
|
)
|
||
|
Goodwill
|
|
|
|
|
|
|
||
|
Net assets recognized as a result of business combinations
|
|
|
|
|
|
|
||
Note
4
of these Consolidated Financial Statements details significant acquisitions of businesses, which were PowerVision in
2019
, TrueVision and Tear Film in
2018
and ClarVista in
2017
.
No
goodwill from
2019
,
2018
or
2017
is tax-deductible.
23
.
Post-employment benefits for associates
Defined benefit plans
In addition to the legally required social security schemes, Alcon has sponsored numerous independent pension and other post-employment benefit plans and participates in plans of Novartis. In most cases, these plans are externally funded in entities that are legally separate from Alcon. For certain subsidiaries, however, no independent plan assets exist for the pension and other post-employment benefit obligations of associates. In these cases the related unfunded liability is included in the consolidated balance sheet. The value of the post-employment benefits promised under the pension and other post-employment benefit plans is represented by the defined benefit obligation ("DBO"), which is measured based on the projected unit credit method ("PUC").
F-60
NOTES TO CONSOLIDATED FINANCIAL STATEMENTS OF ALCON INC. (Continued)
Independent actuaries reappraise the DBOs of all major pension and other post-employment benefit plans annually. Plan assets are recognized at fair value.
The major plans are based in Switzerland, the United States, Germany, and the United Kingdom. They represent
87
%
of Alcon's total DBO. Details of the plans in those significant countries are provided below.
The pension plans in Switzerland represent the most significant portion of Alcon's total DBO and the largest component of Alcon's total plan assets. The principal plans in Switzerland are funded. Following the Spin-off, all Alcon Swiss associates are continuing to participate in the Novartis pension funds in which they were previously participating for a temporary period. It is expected that Alcon's employee benefit obligation will be transferred to an Alcon sponsored pension arrangement in early 2021. For the principal plans, active insured members born on or after January 1, 1956, or having joined the plans after December 31, 2010, their benefits are partially linked to the contributions paid into the plan. Certain features of Swiss pension plans required by law preclude the plans from being categorized as defined contribution plans. These factors include a minimum interest guarantee on retirement savings accounts, a pre-determined factor for converting the accumulated savings account balance into a pension and embedded death and disability benefits.
All benefits granted under Swiss-based principal pension plans are vested, and Swiss legislation prescribes that the employer has to contribute a fixed percentage of an associate's pay to an external pension fund. Additional employer contributions may be required whenever the plan's statutory funding ratio falls below a certain level. The associate also contributes to the plan. The pension plans are run by separate legal entities, each governed by a board of trustees, that, for the principal plans, consists of representatives nominated by Alcon's Former Parent and the active insured associates. The boards of trustees are responsible for the plan design and asset investment strategy.
The United States pension plans represent the second largest component of Alcon's total pension DBO and the third largest component of Alcon's total plan assets. The principal plans (Qualified Plans) are funded, whereas the plan providing additional benefits for executives (Defined Benefit Restoration Plan) is unfunded. Employer contributions are required for Qualified Plans whenever the statutory funding ratio falls below a certain level. Furthermore, associates in the United States are covered under other post-employment benefit plans which represent
99
%
of the total DBO for other post-employment benefit plans. These benefits in the US primarily consist of post-employment healthcare which has been closed to new members since 2015. Part of the costs of these plans is reimbursable under the Medicare Prescription Drug, Improvement, and Modernization Act of 2003. There is no statutory funding requirement for these plans.
The major pension arrangements in Germany are governed by the Occupational Pensions Act ("BetrAVG") and represent the third largest component of Alcon's total pensions DBO. The plans are partly funded by a Contractual Trust arrangement or direct insurances. The employer is responsible for contributing the premiums to the insurances and paying certain benefits when they fall due. All plans are closed for new entrants and the benefits are fully vested for all participants. For some participants the benefits are based on final salary and length of employment, and for others the benefit is earned each year based on the current salary in the year of service. Associates do not contribute towards the cost of the benefits.
The pension plans in the United Kingdom represent the fourth largest component of Alcon's total DBO and the second largest component of Alcon's total plan assets. The Alcon United Kingdom Pension Scheme is governed and administered by a board of trustees in accordance with its Trust Deed. United Kingdom legislation requires that pension schemes are funded prudently (i.e., to a level in excess of the "best estimate" expected cost of providing benefits). Funding is assessed on a triennial basis using (prudent) assumptions agreed by the board of trustee(s) and Alcon. The board of trustees are responsible for jointly agreeing with Alcon the level of contributions needed to eliminate any shortfall over a reasonable period of time, typically not exceeding
10
years
. Under the governing documentation, if a surplus remains once liabilities have been settled it would be refunded to Alcon.
One of Alcon's pension plans has a surplus that is not recognized, on the basis that future economic benefits are not available to the entity in the form of a reduction in future contributions or a cash refund.
F-61
NOTES TO CONSOLIDATED FINANCIAL STATEMENTS OF ALCON INC. (Continued)
The following tables summarize the funded and unfunded DBO for pension and other post-employment benefit plans of Alcon associates at
December 31, 2019
and
2018
:
|
|
Pension plans
|
Other post-employment
benefit plans
|
|||||||||
|
($ millions)
|
2019
|
|
2018
|
|
2019
|
|
2018
|
|
|||
|
Benefit obligation at January 1
|
|
|
|
|
|
|
|
|
|||
|
Current service cost
|
|
|
|
|
|
|
|
|
|||
|
Interest cost
|
|
|
|
|
|
|
|
|
|||
|
Past service costs and settlements
|
|
|
|
|
|
|
|
|
|||
|
Administrative expenses
|
|
|
|
|
|
|
|
|
|||
|
Remeasurement losses/(gains) arising from changes in financial assumptions
|
|
|
(
|
)
|
|
|
(
|
)
|
|||
|
Remeasurement losses/(gains) arising from changes in demographic assumptions
|
|
|
|
|
(
|
)
|
|
|
|||
|
Experience-related remeasurement (gains)/losses
|
(
|
)
|
|
|
(
|
)
|
(
|
)
|
|||
|
Currency translation effects
|
|
|
(
|
)
|
|
|
|
|
|||
|
Benefit payments
|
(
|
)
|
(
|
)
|
(
|
)
|
(
|
)
|
|||
|
Contributions of associates
|
|
|
|
|
|
|
|
|
|||
|
Effect of acquisitions, divestments or transfers
|
(
|
)
|
|
|
|
|
|
|
|||
|
Benefit obligation at December 31
|
|
|
|
|
|
|
|
|
|||
|
Fair value of plan assets at January 1
|
|
|
|
|
|
|
|
|
|||
|
Interest income
|
|
|
|
|
|
|
|
|
|||
|
Return on plan assets excluding interest income
|
|
|
(
|
)
|
|
|
(
|
)
|
|||
|
Currency translation effects
|
|
|
(
|
)
|
|
|
|
|
|||
|
Employer contributions
|
|
|
|
|
(
|
)
|
(
|
)
|
|||
|
Contributions of associates
|
|
|
|
|
|
|
|
|
|||
|
Settlements
|
|
|
(
|
)
|
|
|
|
|
|||
|
Benefit payments
|
(
|
)
|
(
|
)
|
(
|
)
|
(
|
)
|
|||
|
Effect of acquisitions, divestments or transfers
|
(
|
)
|
(
|
)
|
|
|
|
|
|||
|
Fair value of plan assets at December 31
|
|
|
|
|
|
|
|
|
|||
|
Funded status
|
(
|
)
|
(
|
)
|
(
|
)
|
(
|
)
|
|||
|
Limitation on recognition of fund surplus at January 1
|
(
|
)
|
(
|
)
|
|
|
|
|
|||
|
Change in limitation on recognition of fund surplus (including exchange rate differences)
|
(
|
)
|
|
|
|
|
|
|
|||
|
Limitation on recognition of fund surplus at December 31
|
(
|
)
|
(
|
)
|
|
|
|
|
|||
|
Net liability in the balance sheet at December 31
|
(
|
)
|
(
|
)
|
(
|
)
|
(
|
)
|
|||
F-62
NOTES TO CONSOLIDATED FINANCIAL STATEMENTS OF ALCON INC. (Continued)
The reconciliation of the net liability from January 1 to
December 31
is as follows:
|
|
Pension plans
|
Other post-employment
benefit plans
|
|||||||||
|
($ millions)
|
2019
|
|
2018
|
|
2019
|
|
2018
|
|
|||
|
Net liability at January 1
|
(
|
)
|
(
|
)
|
(
|
)
|
(
|
)
|
|||
|
Current service cost
|
(
|
)
|
(
|
)
|
(
|
)
|
(
|
)
|
|||
|
Net interest expense
|
(
|
)
|
(
|
)
|
(
|
)
|
(
|
)
|
|||
|
Administrative expenses
|
(
|
)
|
(
|
)
|
|
|
|
|
|||
|
Past service costs and settlements
|
(
|
)
|
(
|
)
|
|
|
|
|
|||
|
Remeasurements
|
(
|
)
|
|
|
(
|
)
|
|
|
|||
|
Currency translation effects
|
|
|
|
|
|
|
|
|
|||
|
Employer contributions
|
|
|
|
|
(
|
)
|
(
|
)
|
|||
|
Effect of acquisitions, divestments or transfers
|
|
|
(
|
)
|
|
|
|
|
|||
|
Change in limitation on recognition of fund surplus
|
(
|
)
|
|
|
|
|
|
|
|||
|
Net liability at December 31
|
(
|
)
|
(
|
)
|
(
|
)
|
(
|
)
|
|||
|
Amounts recognized in the balance sheet
|
|||||||||||
|
Prepaid benefit cost
|
|
|
|
|
|
|
|
|
|||
|
Accrued benefit liability
|
(
|
)
|
(
|
)
|
(
|
)
|
(
|
)
|
|||
The following tables show a breakdown of the DBO for pension plans by geography and type of member and the breakdown of plan assets into the geographical locations in which they are held:
|
|
2019
|
||||||||||||||||
|
($ millions)
|
Switzerland
|
|
United
States |
|
Germany
|
|
United
Kingdom |
|
Rest of
the world |
|
Total
|
|
|||||
|
Benefit obligation at December 31
|
|
|
|
|
|
|
|
|
|
|
|
|
|||||
|
Thereof: unfunded plans
|
|
|
|
|
|
|
|
|
|
|
|
|
|||||
|
Thereof: unfunded portion of funded plans
(1)
|
|
|
|
|
|
|
|
|
|
|
|
|
|||||
|
By type of member
|
|||||||||||||||||
|
Active
|
|
|
|
|
|
|
|
|
|
|
|
|
|||||
|
Deferred pensioners
|
|
|
|
|
|
|
|
|
|
|
|
|
|||||
|
Pensioners
|
|
|
|
|
|
|
|
|
|
|
|
|
|||||
|
Fair value of plan assets at December 31
|
|
|
|
|
|
|
|
|
|
|
|
|
|||||
|
Funded status
|
(
|
)
|
(
|
)
|
(
|
)
|
|
|
(
|
)
|
(
|
)
|
|||||
F-63
NOTES TO CONSOLIDATED FINANCIAL STATEMENTS OF ALCON INC. (Continued)
|
|
2018
|
||||||||||||||||
|
($ millions)
|
Switzerland
|
|
United
States |
|
Germany
|
|
United
Kingdom |
|
Rest of
the world |
|
Total
|
|
|||||
|
Benefit obligation at December 31
|
|
|
|
|
|
|
|
|
|
|
|
|
|||||
|
Thereof: unfunded plans
|
|
|
|
|
|
|
|
|
|
|
|
|
|||||
|
Thereof: unfunded portion of funded plans
(1)
|
|
|
|
|
|
|
|
|
|
|
|
|
|||||
|
By type of member
|
|||||||||||||||||
|
Active
|
|
|
|
|
|
|
|
|
|
|
|
|
|||||
|
Deferred pensioners
|
|
|
|
|
|
|
|
|
|
|
|
|
|||||
|
Pensioners
|
|
|
|
|
|
|
|
|
|
|
|
|
|||||
|
Fair value of plan assets at December 31
|
|
|
|
|
|
|
|
|
|
|
|
|
|||||
|
Funded status
|
(
|
)
|
(
|
)
|
(
|
)
|
|
|
(
|
)
|
(
|
)
|
|||||
The following table shows the principal weighted average actuarial assumptions used for calculating defined benefit plans and other post-employment benefits of Alcon associates:
|
|
Pension plans
|
Other post-employment
benefit plans |
|||||||||
|
|
2019
|
|
2018
|
|
2019
|
|
2018
|
|
|||
|
Discount rate
|
|
%
|
|
%
|
|
%
|
|
%
|
|||
|
Expected rate of pension increase
|
|
%
|
|
%
|
|
|
|
|
|||
|
Expected rate of salary increase
|
|
%
|
|
%
|
|
|
|
|
|||
|
Interest on savings account
|
|
%
|
|
%
|
|
|
|
|
|||
|
Current average life expectancy for a 65-year-old male (in years)
|
|
|
|
|
|
|
|
|
|||
|
Current average life expectancy for a 65-year-old female (in years)
|
|
|
|
|
|
|
|
|
|||
Changes in the aforementioned actuarial assumptions can result in significant volatility in the accounting for the pension plans in the Consolidated Financial Statements. This can result in substantial changes in Alcon's other comprehensive income, non-current liabilities and prepaid pension assets.
The DBO is significantly impacted by assumptions related to the rate used to discount the actuarially determined post-employment benefit liability. This rate is based on yields of high-quality corporate bonds in the country of the plan. Decreasing corporate bond yields decrease the discount rate, so that the DBO increases and the funded status decreases.
In Switzerland, an increase in the DBO due to lower discount rates is slightly offset by lower future benefits expected to be paid on the associate's savings account where the assumption on interest accrued changes in line with the discount rate.
The impact of decreasing interest rates on a plan's assets is more difficult to predict. A significant part of the plan assets is invested in bonds. Bond values usually rise when interest rates decrease and may therefore partially compensate for the decrease in the funded status. Furthermore, pension assets also include significant holdings of equity instruments. Share prices tend to rise when interest rates decrease and therefore often counteract the negative impact of the rising DBO on the funded status (although the correlation of interest rates with equities is not as strong as with bonds, especially in the short term).
The expected rate for pension increases significantly affects the DBO of most plans in Switzerland, Germany and the United Kingdom. Such pension increases also decrease the funded status, although there is no strong correlation between the value of the plan assets and pension/inflation increases.
F-64
NOTES TO CONSOLIDATED FINANCIAL STATEMENTS OF ALCON INC. (Continued)
Assumptions regarding life expectancy significantly impact the DBO. An increase in longevity increases the DBO. There is no offsetting impact from the plan assets, as no longevity bonds or swaps are held by the pension funds. Generational mortality tables are used where this data is available.
The following table shows the sensitivity of the defined benefit pension and other post-employment benefit obligations to the principal actuarial assumptions as of
December 31, 2019
:
|
($ millions)
|
Change in 2019 year-end
|
|
|
25 basis point increase in discount rate
|
(
|
)
|
|
25 basis point decrease in discount rate
|
|
|
|
1 year increase in life expectancy
|
|
|
|
25 basis point increase in rate of pension increase
|
|
|
|
25 basis point decrease in rate of pension increase
|
(
|
)
|
|
25 basis point increase of interest on savings account
|
|
|
|
25 basis point decrease of interest on savings account
|
(
|
)
|
|
25 basis point increase in rate of salary increase
|
|
|
|
25 basis point decrease in rate of salary increase
|
(
|
)
|
The above sensitivity analyses are based on a change in an assumption while holding all other assumptions constant. In practice, this is unlikely to occur, and changes of the assumptions may be correlated. When calculating the sensitivity of the DBO to significant actuarial assumptions the same method (present value of the defined benefit obligation calculated with the PUC method at the end of the reporting period) has been applied as when calculating the net liability recognized in the Consolidated Balance Sheets.
The healthcare cost trend rate assumptions used for other post-employment benefits are as follows:
|
2019
|
|
2018
|
|
2017
|
|
|||
|
Healthcare cost trend rate assumed for next year
|
|
%
|
|
%
|
|
%
|
||
|
Rate to which the cost trend rate is assumed to decline
|
|
%
|
|
%
|
|
%
|
||
|
Year that the rate reaches the ultimate trend rate
|
2028
|
|
2028
|
|
2025
|
|
||
The following table shows the weighted average plan asset allocation of funded defined benefit pension plans at
December 31, 2019
, and
2018
:
|
Pension plans
|
|||||||
|
(as a percentage)
|
Long-term
target minimum |
Long-term
target maximum |
2019
|
2018
|
|||
|
Equity securities
|
|
|
|
|
|||
|
Debt securities
|
|
|
|
|
|||
|
Real estate
|
|
|
|
|
|||
|
Alternative investments
|
|
|
|
|
|||
|
Cash and other investments
|
|
|
|
|
|||
|
Total
|
|
|
|||||
Cash and most of the equity and debt securities have a quoted market price in an active market. Real estate and alternative investments, which include hedge fund and private equity investments, usually do not have a quoted market price.
The strategic allocation of assets of the different pension plans is determined with the objective of achieving an investment return that, together with employer contributions and contributions of associates, is sufficient to
F-65
NOTES TO CONSOLIDATED FINANCIAL STATEMENTS OF ALCON INC. (Continued)
maintain reasonable control over the various funding risks of the plans. Based upon the market and economic environments, actual asset allocations may temporarily be permitted to deviate from policy targets.
The weighted average duration of the DBO is
15.6
years
(2018:
16.9
years
).
Alcon's ordinary contribution to the various pension plans is based on the rules of each plan. Additional contributions are made whenever required by statute or law (i.e., usually when statutory funding levels fall below pre-determined thresholds).
The following table summarizes expected future cash flows for pension and other post-employment benefit plans as of
December 31, 2019
:
|
($ millions)
|
Pension plans
|
|
Other
post-employment benefit plans |
|
|
|
Employer contributions
|
|
|
|
|
|
|
2020 (estimated)
|
|
|
|
|
|
|
Expected future benefit payments
|
|
|
|
|
|
|
2020
|
|
|
|
|
|
|
2021
|
|
|
|
|
|
|
2022
|
|
|
|
|
|
|
2023
|
|
|
|
|
|
|
2024
|
|
|
|
|
|
|
2025-2029
|
|
|
|
|
|
Defined contribution plans
In many subsidiaries, associates are covered by defined contribution plans. Contributions charged to the
2019
Consolidated Income Statement for the defined contribution plans were
$
128
million
(
2018
:
$
105
million
;
2017
:
$
97
million
).
24
.
Equity-based compensation
For the year ended
December 31, 2019
, Alcon recorded equity-based compensation expense of
$
114
million
(
2018
:
$
93
million
,
2017
:
$
71
million
).
Liabilities from cash-settled equity-based compensation plans were
$
10
million
as of
December 31, 2019
(
2018
:
$
6
million
).
On April 9, 2019, Alcon adopted various equity-based incentive plans, under which Alcon may grant awards in the form of restricted stock units ("RSUs"), performance-based restricted stock units ("PSUs"), restricted stock awards ("RSAs"), or any other form of award at the discretion of the Board. Certain associates in select countries may also participate in share ownership savings plans.
Prior to the Spin-off, Alcon associates participated in Novartis equity-based participation plans, which included stock options, RSUs, PSUs, RSAs and certain share savings ownership plans. Such awards were settled in shares or options of the Former Parent. For periods prior to the Spin-off, the Consolidated Income Statements reflect the compensation expense for the Novartis’s equity-based incentive plans in which Alcon associates participated.
Replacement awards
Concurrent with the Spin-off, certain outstanding Novartis awards granted to Alcon associates under Novartis’ equity-based incentive plans vested in Novartis equity on a pro rata basis, in proportion to the amount of the vesting period completed. The remaining unvested Novartis awards were replaced and restored with Alcon awards as governed by the Alcon equity restoration plan with terms and vesting schedules substantially similar to the replaced Novartis awards.
F-66
NOTES TO CONSOLIDATED FINANCIAL STATEMENTS OF ALCON INC. (Continued)
The pro rata vesting of Novartis awards and replacement of forfeited unvested Novartis awards with Alcon awards represents a modification under IFRS 2,
Share-based Payment
. Alcon measured the fair value of the awards immediately prior to and subsequent to the modification and concluded that no incremental fair value was provided to associates. Accordingly, Alcon continues to recognize as an expense the amount of unrecognized compensation cost of the original awards over the remaining vesting periods. Alcon issued
4.2
million
unvested equity-based awards in connection with the modification at the time of the the Spin-off.
The replacement awards consist primarily of RSUs and PSUs, and vest over a period consistent with the original vesting schedule of the awards which they replaced. In addition to the replacement awards, Alcon has granted additional equity-based awards under the newly-established Alcon incentive plans which were also granted in the form of RSUs and PSUs that will settle in Alcon Inc. shares upon vesting.
Summary of unvested share movements
Alcon granted
0.7
million
unvested equity-based awards subsequent to the Spin-off. There were
4.7
million
unvested equity-based Alcon awards outstanding as of
December 31, 2019
after giving effect to
0.1
million
equity-based awards vested and
0.1
million
awards forfeited during the period.
The below table summarizes unvested share movements for all Alcon equity-based incentive plans from the Spin-off through December 31, 2019:
|
|
2019
|
|||||||
|
Number of
shares in thousand |
|
Weighted average
fair value at grant date in $ |
|
Fair value in
$ thousand |
|
|||
|
Replacement awards issued at Spin-off
(1)
|
|
|
n/a
|
|
|
|
||
|
Granted
|
||||||||
|
Restricted awards
|
|
|
|
|
|
|
||
|
Performance awards
|
|
|
|
|
|
|
||
|
Vested
(1)
|
(
|
)
|
n/a
|
|
(
|
)
|
||
|
Forfeited
(1)
|
(
|
)
|
n/a
|
|
(
|
)
|
||
|
Unvested shares at December 31
|
|
|
|
|
|
|
||
|
(1)
|
Based on estimated fair value per share at the time of Spin-off.
|
The remaining weighted-average vesting period of unvested equity-based awards as of
December 31, 2019
was
1.5
years
.
Alcon equity-based incentive plans
The table below discloses the number of shares authorized under the plans as of December 31, 2019:
|
(thousands)
|
2019
|
|
|
Long-term Incentive Plan
|
|
|
|
Deferred Bonus Stock Plan
|
|
|
|
Swiss Employee Share Ownership Plan
|
|
|
|
Other share savings plans
|
|
|
|
Authorized as of December 31, 2019
|
|
|
F-67
NOTES TO CONSOLIDATED FINANCIAL STATEMENTS OF ALCON INC. (Continued)
Long-Term Incentive Plan ("LTIP")
-
Restricted Stock Units and Restricted Stock Awards
Under Alcon's LTIP, certain eligible executives and management personnel may receive grants of RSUs and RSAs (together "Restricted awards"). The awards generally vest on the third anniversary of the award and are generally forfeited if the employment relationship with Alcon terminates prior to vesting. Recipients of RSU awards do not have any shareholder rights, such as voting or dividend rights, until the shares are delivered. Alcon associates receiving grants of RSAs are entitled to the dividend equivalents that may be declared and paid over the vesting period only if the associates vest in such award.
For the periods prior to the Spin-off, Alcon associates participated in the Former Parent's "Select" plan. The Company's LTIP plan is substantially similar to and replaced the Former Parent plan.
LTIP
-
Performance Stock Units
The Alcon CEO and Alcon Top Leaders ("ATLs") participate in Alcon's long-term performance program. PSUs granted under the LTIP each convert to one unrestricted Alcon Inc. share at vesting, subject to the achievement of performance measures.
PSUs awarded to plan participants are granted at target incentive ranges from
30
%
to
280
%
of base compensation and vest over a
three
-year period. The payout between
0
%
and
200
%
of target is dependent upon
four
equally weighted performance metrics which are determined at the onset of the performance period by the Alcon Inc. Board of Directors. The metrics include cumulative annual growth rate of Net sales, Core EPS, market share, and innovation. The Alcon Inc. Board of Directors and the Compensation, Governance and Nomination Committee assess the performance against the defined measures and approve the final payout. PSUs granted under the performance plan do not carry voting rights, but do carry dividend equivalents that are paid in Alcon Inc. shares at vesting, provided participants remain associates of Alcon.
For the periods prior to the Spin-off, Alcon associates participated in the Former Parent's Long-Term Performance Plan ("LTPP") and Long-Term Relative Performance Plan ("LTRPP"), which were substantially similar to Alcon's LTIP performance program.
Deferred Bonus Stock Plan ("DBSP")
The Alcon CEO's annual incentive is paid
50
%
in cash in the year following the performance period, and
50
%
in Alcon Inc. RSUs or RSAs. ATLs receive
70
%
of their annual incentive in cash and
30
%
in Alcon Inc. RSUs or RSAs. The RSUs and RSAs are granted in first quarter of the year following the performance period, which are deferred and restricted for
three years
. Each RSU is converted into one Alcon Inc. share at the vesting date. RSUs granted under the DBSP do not carry any dividend, dividend equivalent or voting rights. Executives in certain countries may elect to also receive some or all of their cash incentive in shares or share units that are not subject to vesting conditions.
The Alcon DBSP is substantially similar to and replaces the Annual Incentive plan, which existed in the periods prior to the Spin-off.
Swiss Employee Share Ownership Plan and other share savings plans
Alcon associates in certain countries are encouraged to invest their annual incentive in a share savings plans. Under the share savings plans, participants may elect to receive some or all of their annual incentive in Alcon Inc. shares in lieu of cash. Subject to plan rules and limitations, as a reward for their participation in the share savings plans, at no additional cost to the participant, Alcon may fully or partially match their investments in shares after a holding period of
three
or
five years
.
Prior to the Spin-off, Alcon associates participated in the Former Parent's share savings plans, which were substantially similar to and replaced by Alcon's share savings plans.
F-68
NOTES TO CONSOLIDATED FINANCIAL STATEMENTS OF ALCON INC. (Continued)
Equity-based incentive plans under Former Parent
The below table summarizes unvested share movements for all plans under the Former Parent for the year ended December 31, 2018 (Novartis AG RSAs, RSUs, and PSUs):
|
|
2018
|
|||||||
|
|
Number of
shares in thousand |
|
Weighted average fair value at grant
date in $
|
|
Fair value in
$ thousand |
|
||
|
Unvested shares at January 1
|
|
|
|
|
|
|
||
|
Granted
|
||||||||
|
Annual incentive
|
|
|
|
|
|
|
||
|
Share savings plans
|
|
|
|
|
|
|
||
|
Select North America
|
|
|
|
|
|
|
||
|
Select outside North America
|
|
|
|
|
|
|
||
|
Long-Term Performance Plan
|
|
|
|
|
|
|
||
|
Long-Term Relative Performance Plan
|
|
|
|
|
|
|
||
|
Other share awards
|
|
|
|
|
|
|
||
|
Vested
|
(
|
)
|
|
|
(
|
)
|
||
|
Forfeited
|
(
|
)
|
|
|
(
|
)
|
||
|
Unvested shares at December 31
|
|
|
|
|
|
|
||
Until 2013, participants in the Former Parent's "Select" plan could also elect to receive part or all of their grant in the form of Novartis AG tradable share options. Novartis AG tradable share options expire on their tenth anniversary from the grant date. Each Novartis AG tradable share option entitles the holder to purchase after vesting (and before the tenth anniversary from the grant date) one Novartis AG share at a stated exercise price that equals the closing market price of the underlying Novartis AG share at the grant date.
Options under Novartis equity plan "Select" outside North America
The following table shows the activity associated with the Novartis AG share options during the year ended December 31, 2018. The weighted average prices in the table below are translated from Swiss francs into USD at historical rates.
|
|
2018
|
|||||||
|
|
Options
(millions) |
|
Weighted average
exercise price ($) |
|
Weighted average
intrinsic value ($) |
|
||
|
Options outstanding at January 1
|
|
|
|
|
|
|
||
|
Sold or exercised
|
(
|
)
|
|
|
|
|
||
|
Outstanding at December 31
|
|
|
|
|
|
|
||
|
Exercisable at December 31
|
|
|
|
|
|
|
||
All Novartis AG share options were granted at an exercise price that was equal to the closing market price of the Novartis AG shares at the grant date. The weighted average Novartis AG share price at the dates of sale or exercise was
$
86.2
.
F-69
NOTES TO CONSOLIDATED FINANCIAL STATEMENTS OF ALCON INC. (Continued)
The following table summarizes information about Novartis AG share options outstanding at
December 31, 2018
:
|
|
Options outstanding
|
||||||
|
Range of exercise prices($)
|
Number
outstanding (thousand) |
|
Average remaining
contractual life (years) |
Weighted average
exercise price ($) |
|
||
|
45 - 55
|
|
|
|
|
|
||
|
56 - 66
|
|
|
|
|
|
||
|
Total
|
|
|
|
|
|
||
Options under Novartis equity plan "Select" for North America
The following table shows the activity associated with the Novartis AG American Depositary Receipts ("ADR") options during the period:
|
|
2018
|
|||||||
|
|
ADR
options
(millions) |
|
Weighted average
exercise price ($) |
|
Weighted average
intrinsic value ($) |
|
||
|
Options outstanding at January 1
|
|
|
|
|
|
|
||
|
Sold or exercised
|
(
|
)
|
|
|
|
|
||
|
Outstanding at December 31
|
|
|
|
|
|
|
||
|
Excercisable at December 31
|
|
|
|
|
|
|
||
All ADR options were granted at an exercise price that was equal to the closing market price of the ADRs at the grant date. The weighted average ADR price at the dates of sale or exercise was
$
81.4
.
The following table summarizes information about ADR options outstanding at
December 31, 2018
:
|
|
ADR options outstanding
|
||||||
|
Range of exercise prices ($)
|
Number
outstanding (thousand) |
|
Average remaining
contractual life (years) |
Weighted average
exercise price
($)
|
|
||
|
45 - 55
|
|
|
|
|
|
||
|
56 - 66
|
|
|
|
|
|
||
|
Total
|
|
|
|
|
|
||
25
.
Related parties transactions
Prior to the Spin-off, the Alcon business was a segment of Novartis such that transactions with Novartis were considered related party transactions. In connection with the Spin-off, Alcon entered into a separation and distribution agreement as well as various other agreements governing relationships with Novartis going forward, including manufacturing and supply, transitional services, tax matters, employee matters, and patent and know-how license and brand license agreements. Information included in this Note with respect to Novartis is strictly limited to related party transactions with Novartis prior to the Spin-off on April 9, 2019.
Transactions with Novartis (up to April 9, 2019)
Transactions from trading activities related to products and services invoiced between other Novartis Group companies and Alcon's business, have been retained in the historical Consolidated Financial Statements. The ultimate controlling parent of both, the other Novartis Group companies and Alcon's business, was Novartis AG until the Spin-off.
F-70
NOTES TO CONSOLIDATED FINANCIAL STATEMENTS OF ALCON INC. (Continued)
The following table summarizes amounts for the years ended
December 31, 2019
,
2018
, and
2017
:
|
($ millions)
|
2019
(1)
|
|
2018
|
|
2017
|
|
|
Sales to former parent
|
|
|
|
|
|
|
|
Contract manufacturing revenues from former parent
|
|
|
|
|
|
|
|
Purchases from former parent
|
|
|
|
|
|
|
|
($ millions)
|
December 31, 2018
(1)
|
|
|
Trade and other receivables from former parent
|
|
|
|
Trade and other payables to former parent
|
|
|
|
Other financial receivables from former parent
|
|
|
|
Other financial liabilities to former parent
|
|
|
|
(1)
|
Activity presented strictly relates to the period during which Novartis was a related party (up to April 9, 2019).
|
Sales to and purchases from former parent
Beginning in 2019, product sales to Novartis are recorded in Other revenues in line with Alcon's contract manufacturing arrangement executed with Novartis. Other revenues in 2019 prior to the Spin-off were
$
47
million
. Purchases of products from Novartis under the contract manufacturing arrangement totaled
$
19
million
in 2019 prior to the Spin-off.
Other financial receivables and payables related to former parent
Prior to the Spin-off, the majority of Alcon's subsidiaries were party to Novartis cash pooling arrangements with several financial institutions to maximize the availability of cash for general operating and investing purposes. Under these cash pooling arrangements, cash balances were swept by Novartis regularly from Alcon's bank accounts, and the net position with the Novartis cash pooling accounts at the end of each reporting period was reflected in the consolidated balance sheet in Other financial receivables from former parent or Other financial liabilities to former parent. These cash pooling arrangements were eliminated during the three months ended March 31, 2019 in anticipation of the Spin-off and replaced with third party financing arrangements as needed.
Novartis Business Services ("NBS") Charges, Corporate Overhead and Other Allocations from Novartis
Prior to January 1, 2019, Novartis Group provided Alcon certain services from NBS, the shared service organization of Novartis Group, across the following service domains: human resources operations, real estate and facility services, including site security and executive protection, procurement, information technology, commercial and medical support services and financial reporting and accounting operations. The Consolidated Financial Statements include the appropriate costs related to the services rendered, without profit margin, in accordance with the historical arrangements that existed between the Alcon business and NBS.
Further, certain general and administrative costs of Novartis Group were not charged or allocated to the Alcon business in the past. For the purpose of the 2017 and 2018 financial statements, such costs were allocated based on reasonable assumptions and estimates, based on the direct and indirect costs incurred to provide the respective service. When specific identification was not practicable, a proportional cost method was used, primarily based on sales or headcount.
These NBS charges, corporate overhead and other allocations amounted to
$
553
million
in 2018 and
$
535
million
in 2017.
During 2018, Alcon formed its own business and corporate support functions, including its own service organization, such that certain activities and associates were transferred from Novartis to Alcon, operationally effective January 1, 2019. Services provided by Novartis Group to Alcon in 2019 prior to the Spin-off totaled
$
40
million
and primarily related to human resources operations, real estate and facility services, and information technology.
Management believes that the net charges and methods used for allocations to Alcon were performed on a reasonable basis and reflect the services received by Alcon and the cost incurred on behalf of Alcon. Although the Consolidated Financial Statements reflect management's best estimate of all historical costs related to Alcon,
F-71
NOTES TO CONSOLIDATED FINANCIAL STATEMENTS OF ALCON INC. (Continued)
this may however not necessarily reflect what the results of operations, financial position, or cash flows would have been had Alcon been a separate entity, nor the future results of Alcon as it exists following completion of the separation on April 9, 2019.
Transactions with members of the Board of Directors
Dr. Arthur Cummings, an Alcon Board of Director, in his capacity as an ophthalmologist, provides certain consulting services, including assistance with various clinical trials to Alcon. In 2019, Alcon paid to Dr. Cummings (or his related entities) approximately
$
84,844
.
Executive officers
The following table summarizes compensation information for key management personnel (
7
members for all years presented):
|
($ millions)
|
2019
|
|
2018
|
|
2017
|
|
|
Cash and other compensation
|
|
|
|
|
|
|
|
Post-employment benefits
|
|
|
|
|
|
|
|
Equity-based compensation
|
|
|
|
|
|
|
|
Total
|
|
|
|
|
|
|
26
.
Commitments and contingencies
Commitments
Research & development
Alcon has entered into long-term research agreements with various institutions which provide for potential milestone payments and other payments by Alcon that may be capitalized.
As of
December 31, 2019
, the commitments to make payments under those agreements, and their estimated timing, were as follows:
|
($ millions)
|
2019
|
|
|
2020
|
|
|
|
2021
|
|
|
|
2022
|
|
|
|
2023
|
|
|
|
2024
|
|
|
|
Thereafter
|
|
|
|
Total
|
|
|
Other
Alcon entered into various purchase commitments for services and materials as well as for equipment in the ordinary course of business. These commitments are generally entered into at current market prices and reflect normal business operations. For disclosure of Property, plant and equipment purchase commitments, see Note
9
.
Contingencies
The Alcon companies have to observe the laws, government orders and regulations of the country in which they operate.
A number of Alcon companies are, and will likely continue to be, subject to various legal proceedings and investigations that arise from time to time, including proceedings regarding product liability, sales and marketing practices, commercial disputes, employment, and wrongful discharge, antitrust, securities, health and safety, environmental, tax, international trade, privacy, and intellectual property matters. As a result, Alcon may become subject to substantial liabilities that may not be covered by insurance and could affect our business, financial position and reputation. While Alcon does not believe that any of these legal proceedings will have a material
F-72
NOTES TO CONSOLIDATED FINANCIAL STATEMENTS OF ALCON INC. (Continued)
adverse effect on its financial position, litigation is inherently unpredictable and large judgments sometimes occur. As a consequence, Alcon may in the future incur judgments or enter into settlements of claims that could have a material adverse effect on its results of operations or cash flow.
Governments and regulatory authorities around the world have been stepping up their compliance and law enforcement activities in recent years in key areas, including marketing practices, pricing, corruption, trade restrictions, embargo legislation, insider trading, antitrust, cyber security and data privacy. Further, when one government or regulatory authority undertakes an investigation, it is not uncommon for other governments or regulators to undertake investigations regarding the same or similar matters. Responding to such investigations is costly and requires an increasing amount of management's time and attention. In addition, such investigations may affect Alcon's reputation, create a risk of potential exclusion from government reimbursement programs in the United States and other countries, and may lead to (or arise from) litigation. These factors have contributed to decisions by Alcon and other companies in the medical device and healthcare industry, when deemed in their interest, to enter into settlement agreements with governmental authorities around the world prior to any formal decision by the authorities or a court. Those government settlements have involved and may continue to involve, in current government investigations and proceedings, large cash payments, sometimes in the hundreds of millions of dollars or more, including the potential repayment of amounts allegedly obtained improperly and other penalties, including treble damages. In addition, settlements of government healthcare fraud cases often require companies to enter into corporate integrity agreements, which are intended to regulate company behavior for a period of years. Also, matters underlying governmental investigations and settlements may be the subject of separate private litigation.
While provisions have been made for probable losses, which management deems to be reasonable or appropriate, there are uncertainties connected with these estimates. Note
19
contains additional information on these matters.
Alcon is involved in legal proceedings concerning intellectual property rights. The inherent unpredictability of such proceedings means that there can be no assurances as to their ultimate outcome. A negative result in any such proceeding could potentially adversely affect the ability of certain Alcon companies to sell their products, or require the payment of substantial damages or royalties.
Alcon's potential for environmental remediation liability is assessed based on a risk assessment and investigation of the various sites identified by Alcon as at risk for environmental remediation exposure. Alcon's future remediation expenses are affected by a number of uncertainties. These uncertainties include, but are not limited to, the method and extent of remediation, the percentage of material attributable to Alcon at the remediation sites relative to that attributable to other parties, and the financial capabilities of the other potentially responsible parties.
Alcon has
no
significant environmental liabilities as at
December 31, 2019
and
2018
and has incurred
no
significant remediation costs for the years ended
December 31, 2019
,
2018
and
2017
.
F-73
NOTES TO CONSOLIDATED FINANCIAL STATEMENTS OF ALCON INC. (Continued)
27
.
Subsequent events
Subsequent to December 31, 2019, the Revolving Facility was extended to March 2025. The Revolving Facility remained undrawn as of February 25, 2020.
On February 25, 2020, the Alcon Board of Directors approved the proposal to submit the 2019 financial statements of Alcon Inc. and these Consolidated Financial Statements for approval at the Annual General Meeting on May 6, 2020. Additionally on February 25, 2020, the Board proposed a dividend of CHF
0.19
per share to be approved at the same Annual General Meeting. If approved, the total dividend payments would amount to approximately
$
95
million
using the CHF/USD exchange rate as of February 21,2020.
The Board of Directors has evaluated subsequent events as they relate to Alcon for potential recognition or disclosures from January 1, 2020 to the date of the approval of these Consolidated Financial Statements and has determined there are no additional subsequent events to be reported in these Consolidated Financial Statements.
F-74
NOTES TO CONSOLIDATED FINANCIAL STATEMENTS OF ALCON INC. (Continued)
28
.
Alcon subsidiaries
The following table lists the Alcon legal entities with Total assets or Net sales to third parties in excess of
$
5
million
included in the Consolidated Financial Statements at and for the year ended December 31, 2019, respectively. The equity interest percentage shown in the table represents Alcon's share in voting rights in those entities. Unless otherwise stated, each entity has share capital consisting of equity held directly by the Company or another of its consolidated subsidiaries.
|
|
|
||
|
Country of organization/Entity name
|
Place of business
|
Equity
interest |
|
|
Argentina
|
|||
|
Alcon Laboratorios Argentina S.A.
|
Buenos Aires
|
|
%
|
|
Australia
|
|||
|
Alcon Laboratories (Australia) Pty Ltd
|
Frenchs Forest, NSW
|
|
%
|
|
Austria
|
|||
|
Alcon Ophthalmika GmbH
|
Wein
|
|
%
|
|
Belgium
|
|||
|
Alcon Laboratories Belgium BVBA
|
Puurs
|
|
%
|
|
N.V. Alcon S.A.
|
Vilvoorde
|
|
%
|
|
Canada
|
|||
|
Alcon Canada Inc.
|
Mississauga, Ontario
|
|
%
|
|
Chile
|
|||
|
Alcon Laboratorios Chile Ltd.
|
Santiago de Chile
|
|
%
|
|
China
|
|||
|
Alcon (China) Ophthalmic Product Co., Ltd.
|
Beijing
|
|
%
|
|
Alcon Hong Kong Limited
|
Hong Kong
|
|
%
|
|
Colombia
|
|||
|
Laboratorios Alcon de Colombia S.A.
|
Santafé de Bogotá
|
|
%
|
|
Czech Republic
|
|||
|
Alcon Pharmaceuticals (Czech Republic) s.r.o.
|
Prague
|
|
%
|
|
Denmark
|
|||
|
Alcon Nordic A/S
|
Copenhagen
|
|
%
|
|
Dominican Republic
|
|||
|
Alcon Dominicana, SRL
|
Santo Domingo
|
|
%
|
|
Ecuador
|
|||
|
AlconLab Ecuador S.A.
|
Quito
|
|
%
|
|
France
|
|||
|
Laboratoires Alcon S.A.S.
|
Rueil-Malmaison
|
|
%
|
|
Germany
|
|||
|
Alcon Pharma GmbH
|
Freiburg im Breisgau
|
|
%
|
|
CIBA Vision GmbH
|
Grosswallstadt
|
|
%
|
|
WaveLight GmbH
|
Erlangen
|
|
%
|
|
Greece
|
|||
|
Alcon Laboratories Hellas- Single Member Commercial and Industrial S.A.C.I.
|
Maroussi, Athens
|
|
%
|
|
Hungary
|
|||
|
Alcon Hungary Pharmaceuticals Trading Limited Liability Company
|
Budapest
|
|
%
|
|
India
|
|||
|
Alcon Laboratories (India) Private Limited
|
Bangalore
|
|
%
|
|
Indonesia
|
|||
|
PT. CIBA Vision Batam
|
Batam
|
|
%
|
|
Ireland
|
|||
|
Alcon Laboratories Ireland Limited
|
Cork City
|
|
%
|
|
Israel
|
|||
|
Optonol Ltd.
|
Neve-Ilan
|
|
%
|
F-75
NOTES TO CONSOLIDATED FINANCIAL STATEMENTS OF ALCON INC. (Continued)
|
|
|
||
|
Country of organization/Entity name
|
Place of business
|
Equity
interest |
|
|
Italy
|
|||
|
Alcon Italia S.p.A.
|
Milano
|
|
%
|
|
Japan
|
|||
|
Alcon Japan Ltd.
|
Tokyo
|
|
%
|
|
Malaysia
|
|||
|
Alcon Laboratories (Malaysia) Sdn. Bhd.
|
Petaling Jaya
|
|
%
|
|
CIBA Vision Johor Sdn. Bhd.
|
Kuala Lumpur
|
|
%
|
|
Mexico
|
|||
|
Alcon Laboratorios, S.A. de C.V.
|
Ciudad de Mexico
|
|
%
|
|
Morocco
|
|||
|
Alcon Maroc SARL D´Associé Unique
|
Casablanca
|
|
%
|
|
Netherlands
|
|||
|
Alcon Nederland B.V.
|
Arnhem
|
|
%
|
|
New Zealand
|
|||
|
Alcon Laboratories (New Zealand) Ltd.
|
Auckland
|
|
%
|
|
Panama
|
|||
|
Alcon Centroamerica S.A.
|
Panama City
|
|
%
|
|
Peru
|
|||
|
Alcon Pharmaceutical del Peru S.A.
|
Lima
|
|
%
|
|
Philippines
|
|||
|
Alcon Laboratories (Philippines), Inc.
|
Manila
|
|
%
|
|
Poland
|
|||
|
Alcon Polska Sp. z o.o.
|
Warszawa
|
|
%
|
|
Portugal
|
|||
|
Alcon Portugal-Produtos e Equipamentos Oftalmológicos Lda.
|
Porto Salvo
|
|
%
|
|
Puerto Rico
|
|||
|
Alcon (Puerto Rico), Inc.
|
Cataño, PR
|
|
%
|
|
Romania
|
|||
|
Alcon Romania S.R.L.
|
Bucharest
|
|
%
|
|
Russian Federation
|
|||
|
Alcon Farmacevtika LLC
|
Moscow
|
|
%
|
|
Singapore
|
|||
|
Alcon Pte Ltd
|
Singapore
|
|
%
|
|
Alcon Singapore Manufacturing Pte Ltd
|
Singapore
|
|
%
|
|
CIBA Vision Asian Manufacturing and Logistics Pte Ltd.
|
Singapore
|
|
%
|
|
South Africa
|
|||
|
Alcon Laboratories (South Africa) (Pty) Ltd.
|
Midrand
|
|
%
|
|
South Korea
|
|||
|
Alcon Korea Ltd.
|
Seoul
|
|
%
|
|
Spain
|
|||
|
Alcon Healthcare S.A.
|
Barcelona
|
|
%
|
|
Switzerland
|
|||
|
Alcon Inc.
|
Fribourg
|
|
%
|
|
Alcon Grieshaber AG
|
Schaffhausen
|
|
%
|
|
Alcon Management SA
|
Vernier
|
|
%
|
|
Alcon Pharmaceuticals Ltd.
|
Fribourg
|
|
%
|
|
Alcon Services AG
|
Fribourg
|
|
%
|
|
Alcon Switzerland SA
|
Risch
|
|
%
|
|
Thailand
|
|||
|
Alcon Laboratories (Thailand) Limited
|
Bangkok
|
|
%
|
|
Turkey
|
|||
|
Alcon Laboratuvarlari Ticaret A.S.
|
Istanbul
|
|
%
|
F-76
NOTES TO CONSOLIDATED FINANCIAL STATEMENTS OF ALCON INC. (Continued)
|
|
|
||
|
Country of organization/Entity name
|
Place of business
|
Equity
interest |
|
|
Ukraine
|
|||
|
Alcon Ukraine LLC
|
Kiev
|
|
%
|
|
United Kingdom
|
|||
|
Alcon Eye Care UK Limited
|
Frimley/Camberley
|
|
%
|
|
United States of America
|
|||
|
Alcon Finance Corporation
|
Wilminton, DE
|
|
%
|
|
Alcon Laboratories, Inc.
|
Wilminton, DE
|
|
%
|
|
Alcon RefractiveHorizons, LLC
|
Fort Worth, TX
|
|
%
|
|
Alcon Research, LLC
|
Fort Worth, TX
|
|
%
|
|
Alcon Vision, LLC
|
Fort Worth, TX
|
|
%
|
|
CIBA Vision, LLC
|
Duluth, GA
|
|
%
|
|
WaveLight, Inc.
|
Sterling, VA
|
|
%
|
|
ClarVista Medical, Inc.
|
Aliso Viejo, CA
|
|
%
|
|
PowerVision, Inc.
|
Fort Worth, TX
|
|
%
|
|
Tear Film Innovations, Inc.
|
Fort Worth, TX
|
|
%
|
|
TrueVision Systems, Inc.
|
Fort Worth, TX
|
|
%
|
|
Alcon Lensx, Inc.
|
Fort Worth, TX
|
|
%
|
The list below shows the principal Novartis legal entities containing assets, liabilities and results of operations attributable to the Alcon business with Total assets or Net sales to third parties in excess of
$
5
million
included in the Consolidated Financial Statements.
|
Brazil
(1)
|
|
Novartis Biociências S.A.
|
|
Mexico
|
|
Novartis Farmacéutica, S.A. de C.V.
|
F-77
REPORT OF INDEPENDENT REGISTERED PUBLIC ACCOUNTING FIRM
To the Board of Directors and Shareholders of Alcon Inc.
Opinion on the Financial Statements
We have audited the accompanying consolidated balance sheet of Alcon Inc. and its subsidiaries (the “Company”) as of December 31, 2019, and the related consolidated statements of income, comprehensive (loss)/income, changes in equity and cash flows for the year then ended, including the related notes (collectively referred to as the “consolidated financial statements”). In our opinion, the consolidated financial statements present fairly, in all material respects, the financial position of the Company as of December 31, 2019, and the results of its operations and its cash flows for the year then ended in conformity with International Financial Reporting Standards as issued by the International Accounting Standards Board.
We also have audited the effects of disclosing earnings/(loss) per share information, as described in Note 8.2. In our opinion, such disclosures are appropriate and have been properly applied. We were not engaged to audit, review, or apply any procedures to the 2018 or 2017 financial statements of the Company other than with respect to the earnings/(loss) per share disclosures and, accordingly, we do not express an opinion or any other form of assurance on the 2018 or 2017 financial statements taken as a whole.
Change in Accounting Principle
As discussed in Note 3 to the consolidated financial statements, the Company changed the manner in which it accounts for leases in 2019.
Basis for Opinion
These consolidated financial statements are the responsibility of the Company’s management. Our responsibility is to express an opinion on the Company’s consolidated financial statements based on our audit. We are a public accounting firm registered with the Public Company Accounting Oversight Board (United States) (PCAOB) and are required to be independent with respect to the Company in accordance with the U.S. federal securities laws and the applicable rules and regulations of the Securities and Exchange Commission and the PCAOB.
We conducted our audit of these consolidated financial statements in accordance with the standards of the PCAOB. Those standards require that we plan and perform the audit to obtain reasonable assurance about whether the consolidated financial statements are free of material misstatement, whether due to error or fraud.
Our audit included performing procedures to assess the risks of material misstatement of the consolidated financial statements, whether due to error or fraud, and performing procedures that respond to those risks. Such procedures included examining, on a test basis, evidence regarding the amounts and disclosures in the consolidated financial statements. Our audit also included evaluating the accounting principles used and significant estimates made by management, as well as evaluating the overall presentation of the consolidated financial statements. We believe that our audit provides a reasonable basis for our opinion.
/s/PricewaterhouseCoopers LLP
Fort Worth, Texas
February 25, 2020
We have served as the Company's auditor since 2019.
F-78
REPORT OF INDEPENDENT REGISTERED PUBLIC ACCOUNTING FIRM
To the Board of Directors and Shareholders of Alcon Inc.
Opinion on the Financial Statements
We have audited the balance sheet of Alcon Inc. (formerly known as the Novartis AG Alcon business)(the ‘‘Company’’), as of December 31, 2018, and the related income statements, statements of comprehensive income, statements of changes in equity, and statements of cash flow for each of the two years in the period ended December 31, 2018, including the related notes (collectively referred to as the ‘‘financial statements’’) before the effects of disclosing earnings/(loss) per share information discussed in Note 8.2. In our opinion, the financial statements, before the effects of disclosing earnings/(loss) per share information discussed in Note 8.2, present fairly, in all material respects, the financial position of the Company as of December 31, 2018, and the results of its operations and its cash flows for each of the two years in the period ended December 31, 2018 in conformity with International Financial Reporting Standards as issued by the International Accounting Standards Board (the 2018 financial statements before the effects of disclosing earnings/(loss) per share information discussed in Note 8.2 are not presented herein).
We were not engaged to audit, review, or apply any procedures to the earnings/(loss) per share information described in Note 8.2 and accordingly, we do not express an opinion or any other form of assurance about whether such disclosures are appropriate and have been properly applied. Those disclosures were audited by other auditors.
Basis for Opinion
These financial statements are the responsibility of the Company’s management. Our responsibility is to express an opinion on the Company’s financial statements, before the effects of disclosing earnings/(loss) per share information described above, based on our audits. We are a public accounting firm registered with the Public Company Accounting Oversight Board (United States) (PCAOB) and are required to be independent with respect to the Company in accordance with the U.S. federal securities laws and the applicable rules and regulations of the Securities and Exchange Commission and the PCAOB.
We conducted our audits of these financial statements in accordance with the standards of the PCAOB. Those standards require that we plan and perform the audit to obtain reasonable assurance about whether the financial statements are free of material misstatement, whether due to error or fraud.
Our audits included performing procedures to assess the risks of material misstatement of the financial statements, whether due to error or fraud, and performing procedures that respond to those risks. Such procedures included examining, on a test basis, evidence regarding the amounts and disclosures in the financial statements. Our audits also included evaluating the accounting principles used and significant estimates made by management, as well as evaluating the overall presentation of the financial statements. We believe that our audits provide a reasonable basis for our opinion.
/s/ PricewaterhouseCoopers SA
Geneva, Switzerland
February 28, 2019
We served as the Company’s auditor from 2017 to 2019.
F-79
TABLE OF CONTENTS
Part IItem 1. Identity Of Directors, Senior Management and AdvisersItem 2. Offer Statistics and Expected TimetableItem 3. Key InformationItem 5. Operating and Financial Review and ProspectsItem 4. Information on The CompanyItem 4A. Unresolved Staff CommentsItem 8. Financial InformationItem 6. Directors, Senior Management and EmployeesItem 7. Major Shareholders and Related Party TransactionsItem 9. The Offer and ListingItem 10. Additional InformationItem 11. Quantitative and Qualitative Disclosures About Market RiskItem 12. Description Of Securities Other Than Equity SecuritiesPart IIItem 13. Defaults, Dividend Arrearages and DelinquenciesItem 14. Material Modifications To The Rights Of Security Holders and Use Of ProceedsItem 15. Controls and ProceduresItem 16A. Audit Committee and Financial ExpertItem 16B. Code Of EthicsItem 16C. Principal Accountant Fees and ServicesItem 16D. Exemptions From The Listing Standards For Audit CommitteesItem 16E. Purchases Of Equity Securities By The Issuer and Affiliated PurchasersItem 16F. Change in Registrant's Certifying AccountantItem 16G. Corporate GovernanceItem 16H. Mine Safety DisclosurePart IIIItem 17. Financial StatementsItem 18. Financial StatementsItem 19. ExhibitsNote 23 To These Consolidated Financial Statements Provides Additional Disclosures Related To Post-employment BenefitsNote 18 To These Consolidated Financial Statements Provides Additional Disclosures Related To Contingent ConsiderationNote 26 Contains Additional Information on ContingenciesNote 19 To These Consolidated Financial Statements Provides Additional Disclosures Related To Legal Provisions