ALAMO GROUP INC
10-Ks and 10-Qs
|
|
|
|
|
|
|
|
|
|
|
|
|
|
|
|
|
|
|
|
|
|
|
|
|
|
|
|
|
|
|
|
|
|
|
|
|
|
|
|
|
|
|
|
|
|
|
|
|
|
|
|
|
|
|
|
UNITED STATES
SECURITIES AND EXCHANGE COMMISSION
WASHINGTON, D.C. 20549
Form 10-K
|
[X]
|
ANNUAL REPORT PURSUANT TO SECTION 13 OR 15(d)
|
|
|
|
OF THE SECURITIES EXCHANGE ACT OF 1934
|
|
|
|
|
|
|
[ ]
|
FOR THE FISCAL YEAR ENDED DECEMBER 31, 2017
|
|
|
TRANSITION REPORT PURSUANT TO SECTION 13 OR 15(d)
|
||
|
|
OF THE SECURITIES EXCHANGE ACT OF 1934
|
|
Commission file number 0-21220
ALAMO GROUP INC.
(Exact name of registrant as specified in its charter)
|
DELAWARE
|
74-1621248
|
|
(State or other jurisdiction of
|
(I.R.S. Employer
|
|
incorporation or organization)
|
Identification Number)
|
1627 East Walnut, Seguin, Texas 78155
(Address of principal executive offices, including zip code)
830-379-1480
(Registrant’s telephone number, including area code)
Securities registered pursuant to Section 12(b) of the Act
:
|
Title of each class
|
Name of each exchange
|
|
Common Stock, par value
|
on which registered
|
|
$.10 per share
|
New York Stock Exchange
|
SECURITIES REGISTERED PURSUANT TO SECTION 12(g) OF THE ACT: NONE
Indicate by check mark if the registrant is a well-known seasoned issuer, as defined in Rule 405 of the Securities Act. Yes [X] No [ ]
Indicate by check mark if the registrant is not required to file reports pursuant to Section 13 or Section 15(d) of the Exchange Act. Yes [ ] No [X]
Indicate by check mark whether the registrant (1) has filed all reports required to be filed by Section 13 or 15(d) of the Securities Exchange Act of 1934 during the preceding 12 months (or for such shorter period that the registrant was required to file such reports), and (2) has been subject to such filing requirement for the past 90 days. Yes [X] No [ ]
Indicate by check mark whether the registrant has submitted electronically and posted on its corporate Web site, if any, every Interactive Data File required to be submitted and posted pursuant to Rule 405 of Regulation S-T during the preceding 12 months (or for such shorter period that the registrant was required to submit and post such files). Yes [X] No [ ]
Indicate by check mark if disclosure of delinquent filers pursuant to Item 405 of Regulation S-K is not contained herein, and will not be contained, to the best of Registrant’s knowledge, in definitive proxy or information statements incorporated by reference in Part III of this Form 10-K or any amendment to this Form 10-K. [ ]
Indicate by check mark whether registrant is a large accelerated filer, an accelerated filer, a non-accelerated filer, a smaller reporting company or an emerging growth company. See definitions of “large accelerated filer,” “accelerated filer,” “smaller reporting company,” and an "emerging growth company" in Rule 12b-2 of the Exchange Act.
|
Large accelerated filer
|
[X]
|
Accelerated filer
|
[ ]
|
|
|
Non-accelerated filer
|
[ ]
|
Smaller reporting company
|
[ ]
|
|
|
Emerging Growth Company
|
[ ]
|
|||
Indicate by check mark whether the registrant is a shell company (as defined in Rule 12b-2 of the Exchange Act). Yes [ ] No [X]
The aggregate market value of the voting stock (which consists solely of shares of common stock) held by non-affiliates of the registrant as of
June 30, 2017
(based upon the last reported sale price of $
90.81
per share) was approximately
$864,040,623
on such date.
If an emerging growth company, indicate by check mark if the registrant has elected noy to use the extended transition period for complying with any new or revised financial accounting standards provided pursuant to Section 13(a) of the Exchange Act. [ ]
The number of shares of the registrant’s common stock, par value $.10 per share, outstanding as of
February 23, 2018
was
11,648,925
shares.
Documents incorporated by reference: Portions of the registrant’s proxy statement relating to the
2018
Annual Meeting of Stockholders to be held on
May 3, 2018
have been incorporated by reference herein in response to Part III.
ALAMO GROUP INC. AND CONSOLIDATED SUBSIDIARIES
FORM 10-K
TABLE OF CONTENTS
|
|
PART I
|
Page
|
|
Item 1.
|
||
|
Item 1A.
|
||
|
Item 1B.
|
||
|
Item 2.
|
||
|
Item 3.
|
||
|
Item 4.
|
||
|
|
PART II
|
|
|
Item 5.
|
||
|
Item 6.
|
||
|
Item 7.
|
||
|
Item 7A.
|
||
|
Item 8.
|
||
|
Item 9.
|
||
|
Item 9A.
|
||
|
Item 9B.
|
||
|
|
PART III
|
|
|
Item 10.
|
||
|
Item 11.
|
||
|
Item 12.
|
||
|
Item 13.
|
||
|
Item 14.
|
||
|
|
PART IV
|
|
|
Item 15.
|
||
|
|
Index to Consolidated Financial Statements
|
|
|
Item 16.
|
||
2
Unless the context otherwise requires, the terms “the Company,” “we,” “our” and “us” refer to Alamo Group Inc. and its subsidiaries on a consolidated basis.
General
The Company is a leader in the design and manufacture of high quality agricultural equipment and infrastructure maintenance equipment for governmental and industrial use. The Company’s products include tractor-mounted mowing and other vegetation maintenance equipment, street sweepers, excavators, vacuum trucks, snow removal equipment, leaf collection equipment, pothole patchers, zero turn radius mowers, agricultural implements and related aftermarket parts. The Company emphasizes high quality, cost-effective products for its customers and strives to develop and market innovative products while constantly monitoring and seeking to contain its manufacturing and overhead costs. The Company has a long-standing strategy of supplementing its internal growth through acquisitions of businesses or product lines that currently complement, command, or have the potential to achieve a meaningful share of their niche markets. The Company has approximately
3,280
employees and operates a total of twenty-five plants in North America, Europe, Australia and Brazil. The Company sells its products primarily through a network of independent dealers and distributors to governmental end-users, related independent contractors, as well as to the agricultural and commercial turf markets. The primary markets for our products are North America, Europe, South America and Australia.
The predecessor corporation to Alamo Group Inc. was incorporated in the State of Texas in 1969, as a successor to a business that began selling mowing equipment in 1955, and Alamo Group Inc. was reincorporated in the State of Delaware in 1987.
History
Since its founding in 1969, the Company has focused on satisfying customer needs through geographic market expansion, product development and refinement, and selected acquisitions. The Company’s first products were based on rotary cutting technology. Through acquisitions, the Company added flail cutting technology in 1983 and sickle-bar cutting technology in 1984. The Company added to its presence in the industrial and governmental vegetation markets with the acquisition of Tiger Corporation
(“Tiger”)
in late 1994.
The Company entered the agricultural mowing markets in 1986 with the acquisition of Rhino Products Inc.
(“Rhino”)
, a leading manufacturer in this field. With this acquisition, the Company embarked on a strategy to increase the
Rhino
dealer distribution network during a period of industry contraction. The addition of M&W Gear Company
(“M&W”)
in early 1995 allowed the Company to enter into the manufacturing and distribution of tillage equipment, which complements the
Rhino
distribution network.
M&W
has been integrated into the agricultural marketing group.
In 1991, the Company began its international expansion with the acquisition of McConnel Ltd
. (“McConnel”)
, a United Kingdom (“U.K.”) manufacturer of vegetation maintenance equipment, principally hydraulic boom-mounted hedge and grass cutters and related parts. Bomford-Turner Ltd
. (“Bomford”)
, also a U.K. company, was acquired in 1993.
Bomford
is a manufacturer of heavy-duty, tractor-mounted grass and hedge mowing equipment.
McConnel
and
Bomford
sell their products to dealers and distributors through their respective sales forces.
In 1994, the Company acquired Signalisation Moderne Autoroutiere S.A
. (“SMA”)
located in Orleans, France.
SMA
manufactures and sells principally a line of heavy-duty, tractor-mounted grass and hedge mowing equipment and associated replacement parts primarily to departments of the French government. This acquisition, along with the acquisitions of Forges Gorce, a flail blade manufacturer in France, in 1996 and Rousseau Holdings S.A. (“
Rousseau
”), a leading French manufacturer of hedge and verge mowers, in 2004, when combined with
McConnel
and
Bomford,
has made the Company one of the largest manufacturers in the European market for the kind of equipment sold by the Company.
In 1995, the Company expanded its business in the agricultural market with the acquisition of Herschel Corporation
(“Herschel”)
, a manufacturer and distributor of aftermarket farm equipment replacement and wear parts.
3
In 2000, the Company acquired Schwarze Industries, Inc
. (“Schwarze”)
.
Schwarze
is a manufacturer of a broad range of street sweeping equipment which is sold to governmental agencies and contractors. The Company believes the
Schwarze
sweeper products fit the Company’s strategy of identifying product offerings with brand recognition in the industrial markets the Company serves. In 2004, the Company purchased the pothole patcher product line from Wildcat Manufacturing, Inc. The product line was merged into the
Schwarze
operation and is complementary to its current product offerings.
In 2000, the Company purchased the product line and associated assets of Twose of Tiverton Ltd.
(“Twose”)
a small regional manufacturer of power arm flail mowers and parts, as well as harrows and rollers, in the U.K. They consolidated their operations into the existing facilities at
McConnel
and
Bomford
.
In 2000, the Company acquired Schulte Industries Ltd. and its related entities
(“Schulte”)
.
Schulte
is a Canadian manufacturer of mechanical rotary mowers, snow blowers, and rock removal equipment.
Schulte
strengthened the Company’s Canadian presence in both marketing and manufacturing. It also expanded the Company’s range of large, heavy-duty rotary mowers.
In 2001, the Company acquired all of the assets of SMC Corporation
(“SMC”). SMC
manufactures front-end loaders and backhoes principally for Original Equipment Manufacturer (“OEM”) customers and its own
SMC
brand. This acquisition expanded the product range of our agricultural division and has since been consolidated into the Company's Gibson City, Illinois location.
In 2002, the Company purchased inventory, fixed assets and certain other assets of Valu-Bilt Tractor Parts
(“Valu-Bilt”)
, a subsidiary of Quality Stores, Inc., located in Des Moines, Iowa.
Valu-Bilt
is a distributor of new, used and rebuilt tractor parts and other agricultural spare and wear parts sold directly to customers through its catalog and the internet and on a wholesale basis to dealers. Subsequent to the purchase, the operations of
Valu-Bilt
in Des Moines, Iowa, were consolidated into the Company’s
Herschel
facility in Indianola, Iowa.
In 2005, the Company, through its European subsidiary Alamo Group (EUR) Ltd., acquired 100% of the issued and outstanding stock of Spearhead Machinery Limited
(“Spearhead”)
and subsequently merged its manufacturing operations into
Bomford
’
s
facility.
Spearhead
manufactures a range of tractor-mounted vegetation maintenance equipment, including reach mowers, flail mowers and rotary cutters. This acquisition extended our product lines and market coverage in Europe.
In early 2006, the Company purchased substantially all of the assets of the Gradall excavator business
(“Gradall”)
of JLG Industries, Inc., including their manufacturing plant in New Philadelphia, Ohio.
Gradall
is a leading manufacturer of both wheeled and crawler telescopic excavators in North America. This acquisition enhanced our Industrial Division product offering sold to governmental buyers and related contractors for maintenance along right-of-ways.
In 2006, the Company purchased the vacuum truck and sweeper lines of Clean Earth Environmental Group, LLC and Clean Earth Kentucky, LLC (collectively referred to as
“VacAll”
)
.
This included the product lines, inventory and certain other assets that relate to this business. The production of the vacuum truck and sweeper lines were moved to the
Gradall
facility in New Philadelphia, Ohio.
In 2006, the Company acquired 100% of the ownership interests in Nite-Hawk Sweepers LLC
(“Nite-Hawk”)
, a manufacturer of truck mounted sweeping equipment primarily for the contract sweeping market, which expanded our presence in that market and complements our
Schwarze
sweeper line.
In 2007, the Company purchased Henke Manufacturing Corporation
(“Henke”)
, a manufacturer of specialty snow removal attachments.
Henke’s
products are mounted on both heavy industrial equipment and medium to heavy-duty trucks. The primary end-users are governmental agencies, related contractors and other industrial users.
In 2008, the Company acquired Rivard Developpement S.A.S.
(“Rivard”)
, a leading French manufacturer of vacuum trucks, high pressure cleaning systems and trenchers. The acquisition broadened the Company’s product offering to our customers in Europe and other markets we serve.
4
In 2009, the Company acquired substantially all the assets of Bush Hog, LLC
(“Bush Hog”)
, a leading agricultural equipment manufacturer of rotary cutters, finishing mowers, zero turn radius mowers, front-end loaders, backhoes, landscape equipment and a variety of other implements. This acquisition, combined with the Company’s existing range of agricultural mowers, created one of the largest manufacturers of agricultural mowers in the world.
In 2011, the Company acquired substantially all of the assets and assumed certain specified liabilities of Tenco Group, Inc. (
"Tenco"
) and its subsidiaries.
Tenco
is a Canadian-based manufacturer of snow removal equipment including snow blades, blowers, dump bodies, spreaders and associated parts and service.
Tenco
has operations in Quebec as well as New York and Vermont. The equipment is sold primarily through dealers to governmental end-users as well as snow removal contractors.
In 2013, the Company acquired substantially all of the assets and assumed certain specified liabilities of Superior Equipment Australia PTY LTD (
"Superior"
).
Superior
is a small Australian-based manufacturer of agricultural mowing equipment and other attachments, parts, and services. The equipment is sold through dealers primarily to agricultural end-users with some sold to governmental entities in Australia. The
Superior
operations have been consolidated with the Company's
Fieldquip
location.
In 2014, the Company acquired Kellands Agricultural Ltd. and its subsidiary Multidrive Tractors Ltd. (
"Kellands"
).
Kellands
is a U.K.-based manufacturer of self-propelled sprayers and a range of multi-purpose load-carrying tractor vehicles. This acquisition enhanced our manufacture and distribution of agricultural machinery in our European operations and allowed the Company to enter into the self-propelled sprayer market.
In 2014, the Company acquired Fieldquip Australia PTY LTD (
"Fieldquip"
), a manufacturer of rotary cutters as well as a distributor of various agricultural products. This acquisition allowed the Company to broaden its presence in both the manufacturing and distribution of agricultural machinery in Australia.
In 2014, the Company acquired all of the operating units of Specialized Industries LP. The purchase included the businesses of Super Products LLC (
"Super Products"
), Wausau-Everest LP ("
Wausau
" & "
Everest
") and Howard P. Fairfield LLC ("
H.P. Fairfield
") as well as several related entities (
"Specialized"
), including all brand names and related product names and trademarks. The primary reason for the
Specialized
acquisition was to broaden the Company's existing equipment lines. This acquisition increased our product offering and enhanced our market position both in vacuum trucks and snow removal equipment primarily in North America.
In 2015, the Company acquired Herder Implementos e Maquinas Agricolas Ltda. (
"Herder"
).
Herder
is a manufacturer of flail mowers and other agricultural implements which are sold direct and through dealers to a wide variety of agricultural markets as well as the roadside maintenance market. This acquisition allowed the Company to establish a presence in Brazil, one of the largest agricultural markets in the world.
On June 6, 2017, the Company acquired 100% of the outstanding shares of Santa Izabel Agro Industria. Ltda. (
"Santa Izabel"
).
Santa Izabel
designs, manufactures and markets a variety of agricultural implements and trailers sold throughout Brazil. This acquisition along with our existing
Herder
operation in Brazil, augmented our product portfolio and improved our manufacturing capabilities in one of the world's largest agricultural markets.
On June 26, 2017, the Company acquired substantially all of the assets and assumed certain specified liabilities of Old Dominion Brush Company, Inc. (
"ODB"
).
ODB
manufactures leaf collection equipment as well as replacement brooms for street sweepers, both which are sold to municipalities, contractors and commercial landscape markets in North America.
ODB
is based in Richmond, Virginia and has an assembly and warehouse operation in Missouri. This acquisition provided new and complementary products to our existing range of infrastructure maintenance equipment and parts.
On August 8, 2017, the Company acquired R.P.M. Tech Inc. ("
RPM
"), a manufacturer of heavy duty snow removal equipment and associated parts.
RPM
primarily sells to governmental agencies, related contractors, airports and other industrial users.
RPM's
operations are in Drummondville, Quebec and will work in close proximity to the Company's nearby
Tenco
operations. This acquisition complements our existing range of snow removal products with
RPM's
range of heavy duty snow removal equipment including their line of mechanical snow blowers.
5
Sales and Marketing Strategy
The Company believes that within the U.S. it is a leading supplier to governmental markets, a leading supplier in the U.S. agricultural market, and one of the largest suppliers in the European market for its key niche product offerings. The Company’s products are sold through the Company’s various marketing organizations and extensive worldwide dealer and distributor networks under the
Alamo Industrial
®
, Terrain King
®
,
Tiger
®
, Gradall
®
,
VacAll
®
, Schwarze
®
, NiteHawk
®
, Henke
®
, Tenco
®
,
Super Products
®
, Wausau-Everest
™
, H.P. Fairfield
™
, ODB
™
, R.P.M. Tech
™
, Bush Hog
®
, Rhino
®
, Earthmaster
®
, RhinoAg
™
,
Herschel
®
,
Valu-Bilt
®
,
CT Farm & Country
™
,
Schulte
®
, Superior
®
, Fieldquip
®
, Herder
®
, Santa Izabel
™
, McConnel
®
, Bomford
®
, Spearhead
™
, Twose
™
, Kellands
®
, SMA
®
,
Forges Gorce
™
, Faucheux
™
, Rousseau
™
and Rivard
®
trademarks (some with related designs) as well as other trademarks and trade names.
Products and Distribution Channels
Industrial Division
Alamo Industrial
equipment is principally sold through independent dealers to governmental end-users, related independent contractors and, to a lesser extent, utility and other dealers serving infrastructure maintenance operators and other applications in the U.S. and other countries. Governmental agencies and contractors that perform services for such agencies purchase primarily hydraulically-powered, tractor-mounted mowers, including boom-mounted mowers, other types of cutters and replacement parts for heavy-duty, intensive use applications, including maintenance around highway, airport, recreational and other public areas. A portion of
Alamo Industrial’s
sales includes tractors, which are not manufactured by
Alamo Industrial.
Tiger
equipment includes heavy duty, tractor- and truck-mounted mowing and vegetation maintenance equipment and replacement parts.
Tiger
sells to state, county and local governmental entities and related contractors, primarily through a network of independent dealers.
Tiger’s
dealer distribution network is independent of
Alamo Industrial’s
dealer distribution network. A portion of
Tiger’s
sales includes tractors, which are not manufactured by
Tiger.
Schwarze
equipment includes truck-mounted air vacuum, mechanical broom, and regenerative air sweepers, pothole patchers and replacement parts.
Schwarze
sells its products primarily to governmental agencies and independent contractors, either directly or through its independent dealer network. A portion of
Schwarze’s
sales includes truck chassis which are not manufactured by
Schwarze
. The Company believes that
Schwarze
complements
Alamo
Industrial
because the dealer and/or end-user for both products in many cases are the same
.
ODB
manufactures and sells leaf collection equipment and replacement brooms for street sweepers, both of which are sold to municipalities, contractors and commercial landscape markets in North America.
Nite-Hawk
manufactures parking lot sweepers with unique and innovative hydraulic designs. By eliminating the auxiliary engine,
Nite-Hawk
sweepers have proven to be fuel-efficient, environmentally conscious, and cost-effective to operate.
Nite-Hawk
focuses mainly on and sells direct to parking lot contractors. A portion of
Nite-Hawk’s
sales includes truck chassis which are not manufactured by
Nite-Hawk
.
Gradall
produces a range of excavators based on high-pressure hydraulic telescoping booms which are sold through dealers primarily to governmental agencies and related contractors, and to a lesser extent the mining industry, steel mills and other specialty applications in the U.S. and other countries. Many of these products are designed for excavation, grading, shaping and similar tasks involved in land clearing, road building or maintenance. These products are available mounted on various types of undercarriages: wheels for full-speed highway travel, wheels for on/off road use, and crawlers. A portion of
Gradall’s
sales includes truck chassis which are not manufactured by
Gradall
.
VacAll
produces catch basin cleaners and roadway debris vacuum systems. These units are powerful and versatile with uses including, but not limited to, removal of wet and dry debris, spill elimination, and cleaning of sludge beds.
VacAll
also offers a line of sewer cleaners. Its products are primarily sold through dealers to industrial and commercial contractors as well as governmental agencies. A portion of
VacAll’s
sales includes truck chassis which are not manufactured by the Company.
6
Super Products
produces truck-mounted vacuum trucks, combination sewer cleaners and hydro excavators. Its products are sold to municipalities, utilities and contractors through a nationwide distributor network.
Super Products
also operates a network of rental stores that provide short and long-term rental contracts for its products. Rental customers are primarily contractors serving the petrochemical, petroleum production and refining industries. A portion of the sales of
Super Products
includes truck chassis which are not manufactured by the Company.
Wausau
designs and manufactures a comprehensive range of snow removal and ice control products. Products include snowplows, snow blowers, snow throwers, brooms, deicers, brine sprayers and other related accessories and parts. Wausau sells its products through its established dealer network to both governmental and non-governmental end-users and sells directly to airports and fixed-base operators.
Everest
designs and manufactures a range of snow removal and ice control products including snowplows, wing systems, spreader bodies, and other related accessories and parts.
Everest
also manufactures custom-engineered underground construction forms for vehicular, water/sewage and hydro-electric tunnels.
Henke
designs and manufactures snow plows and heavy duty snow removal equipment, hitches and attachments for trucks, loaders and graders sold primarily through independent truck and industrial equipment dealers.
Henke’s
primary end-users are governmental agencies, related contractors and other industrial users.
Tenco
and
RPM
both design and manufacture a heavy-duty line of snow removal equipment, including truck-mounted snow plows, snow blowers, dump bodies and spreaders. Their products are primarily sold through independent dealers. End-users are governmental agencies, contractors, airports and other industrial users.
H.P. Fairfield
is a full-service distributor of public works and runway maintenance products, parts and service, whose sales and service outlets are located in the northeastern part of the U.S.
H.P. Fairfield’s
offerings include custom municipal snow and ice removal equipment, a range of salt spreaders and truck bodies, street sweepers, a line of industrial rotary, flail and boom mowers, solid waste and recycling equipment, water and sewer maintenance equipment, municipal tractors and attachments, and asphalt maintenance patchers, some of which are sourced from other Alamo Group companies. Certain of the products distributed and sold by
H.P. Fairfield
include Alamo Group products.
H.P. Fairfield
also provides truck up-fitting services as part of its business.
Agricultural Division
Bush Hog,
Rhino
and
Earthmaster
equipment is generally sold to farmers, ranchers and other end-users to clear brush, mow grass, maintain pastures and unused farmland, shred crops, till fields, and for haymaking and other applications.
Bush Hog
and
Rhino
equipment consists principally of a comprehensive line of tractor-powered equipment, including rotary mowers, finishing mowers, flail mowers, disc mowers, front-end loaders, backhoes, rotary tillers, posthole diggers, scraper blades and replacement parts. The equipment also includes a range of self-propelled zero turn radius mowers.
Herschel/Valu-Bilt
aftermarket replacement parts are sold for many types of farm equipment and tractors and certain types of mowing and construction equipment.
Herschel
products include a wide range of cutting parts, plain and hard-faced replacement tillage tools, disc blades and fertilizer application components.
Herschel
replacement tools and parts are sold throughout the United States, Canada and Mexico to five major customer groups: farm equipment dealers; fleet stores; wholesale distributors; OEMs; and construction equipment dealers.
Valu-Bilt
complements the
Herschel
product lines while also expanding the Company’s offering of aftermarket agricultural parts and added catalog and internet sales direct to end-users.
Schulte
equipment includes heavy-duty mechanical rotary mowers, snow blowers, rock removal equipment and related replacement parts.
Schulte
serves both the agricultural and governmental markets primarily in Canada and the U.S. It also sells some of the Company’s other product lines in their markets and some of its products through independent distributors throughout the world.
Fieldquip
and
Superior
together broaden the Company's presence in Australia. Both companies sell a variety of agricultural equipment, specifically rotary mowers and tractor attachments.
Fieldquip
sells to customers ranging from large agricultural and commercial operators to small farm hobbyist and residential users.
Superior's
customers are generally agricultural dealers who service owners and operators in the turf, golf, park and airport industries and growers with orchards, vineyards and plantations in Australia and the South Pacific.
7
Herder
and
Santa Izabel
give the Company a presence in the Brazilian agricultural market. With our recent acquisition of Santa Izabel, we have strengthened our market position in Brazil which allows us to further pursue organic growth and additional acquisitions.
Herder
manufactures and distributes flail mowers and various other agricultural equipment, direct and through dealers. Its products are used in a wide variety of agricultural and governmental markets.
Santa Izabel
designs, manufactures and markets a variety of agricultural implements, including trailers sold throughout Brazil.
European Division
McConnel
equipment principally includes a broad line of hydraulic, boom-mounted hedge and grass cutters, as well as other tractor attachments and implements such as hydraulic backhoes, cultivators, subsoilers, buckets and other digger implements and related replacement parts.
McConnel
equipment is sold primarily in the U.K., Ireland and France and in other parts of Europe and, to a lesser extent, throughout the world, through independent dealers and distributors.
Bomford
equipment includes hydraulic, boom-mounted hedge and hedgerow cutters, industrial grass mowers, agricultural seedbed preparation cultivators and related replacement parts.
Bomford
equipment is sold to governmental agencies, contractors and agricultural end-users in the U.K., Ireland and France and, to a lesser extent, other countries in Europe, North America, Australia and Asia.
Bomford’s
sales network is similar to that of
McConnel
in the U.K.
Spearhead
manufactures a range of tractor-mounted vegetation maintenance equipment, including reach mowers, flail mowers and rotary cutters. These products are manufactured in the Company's Bomford facility.
Kellands
equipment which are being rebranded and sold as McConnel, includes a range of self-propelled sprayers and a variety of multi-drive load-carrying vehicles. These products are sold through an existing dealer network as well as various marketing groups within the European Division.
SMA
equipment includes hydraulic, boom-mounted hedge and hedgerow cutters and related replacement parts.
SMA’s
principal customers are French local authorities.
SMA’s
product offerings include certain quick-attach boom mowers manufactured by the Company in the U.K. to expand its presence in agricultural dealerships. The Company consolidated its
SMA
operations located in Orleans, France, and production was relocated to its manufacturing facility near Lyon, France.
Forges Gorce
manufactures cutting blades which are sold to some of the Company’s subsidiaries as well as to other customers.
Rousseau
sells hydraulic and mechanical boom mowers, primarily in France, through its own sales force and dealer distribution network mainly to agricultural and governmental markets. These products have also been introduced into other markets outside of France.
Rivard
manufactures vacuum trucks, high pressure cleaning systems and trenchers.
Rivard’s
equipment is sold primarily in France and certain other markets, mainly in Europe, the Middle East and North Africa, and to governmental entities and related contractors. It also complements our product offerings in North America. The majority of
Rivard's
customers provide their own truck chassis.
Replacement Parts
The Company derives a significant portion of its revenues from sales of replacement parts for each of its wholegoods lines. Replacement parts represented approximately
19%
,
18%
and
18%
of the Company’s total sales for the years ended December 31,
2017
,
2016
and
2015
, respectively. Proprietary replacement parts generally are more profitable and less cyclical than wholegoods.
8
Product Development
The Company’s ability to provide innovative responses to customer needs, to develop and manufacture new products, and to enhance existing product lines is important to its success. The Company continually conducts research and development activities in an effort to improve existing products and develop new products. As of
December 31, 2017
, the Company employed
186
people in its various engineering departments,
102
of whom are degreed engineers and the balance of whom are support staff. Amounts expended on research and development activities were approximately $
9,849,000
in
2017
, $
8,847,000
in
2016
and $
8,590,000
in
2015
. As a percentage of sales, research and development was approximately
1.1%
in
2017
,
1.0%
in
2016
and
1.0%
in
2015
, and is expected to continue at similar levels in
2018
.
Seasonality
The Company’s unit sales are fairly constant quarter to quarter. However, replacement parts are generally higher in the second and third quarters of the year, because a substantial number of the Company’s products are used for maintenance activities such as vegetation maintenance, highway right-of-way maintenance, construction, and street and parking lot sweeping. Usage of this equipment is typically lower in harsh weather. The Company utilizes an annual twelve-month sales forecast provided by the Company’s marketing departments which is updated quarterly in order to develop a production plan for its manufacturing facilities. In addition, many of the Company’s marketing departments attempt to equalize demand for products throughout the calendar year by offering seasonal sales programs which may provide additional incentives, including discounts and extended payment terms.
Competition
The Company’s products are sold in highly competitive markets throughout the world. The principal competitive factors are price, quality, availability, service and reputation. The Company competes with several large national and international companies that offer a broad range of equipment and replacement parts, as well as with numerous small, privately-held manufacturers and suppliers of a limited number of products, mainly on a regional basis. Some of the Company’s competitors are significantly larger than the Company and have substantially greater financial and other resources at their disposal. The Company believes that it is able to compete successfully in its markets by effectively managing its manufacturing costs, offering high quality products, developing and designing innovative products and, to some extent, avoiding direct competition with significantly larger potential competitors. There can be no assurance that the Company’s competitors will not substantially increase the resources devoted to the development and marketing of products competitive with the Company’s products or that new competitors with greater resources will not enter the Company’s markets.
Unfilled Orders
As of
December 31, 2017
, the Company had unfilled customer orders of $
218,158,000
compared to $
147,245,000
at
December 31, 2016
. Management expects that substantially all of the Company’s unfilled orders as of
December 31, 2017
will be shipped during fiscal year
2018
. The amount of unfilled orders at a particular time is affected by a number of factors, including manufacturing and shipping schedules which, in most instances, are dependent on the Company’s seasonal sales programs and the requirements of its customers. Certain of the Company’s orders are subject to cancellation at any time before shipment; therefore, a comparison of unfilled orders from period to period is not necessarily meaningful and may not be indicative of future actual shipments. No single customer or group of customers is responsible for 10% or more of the aggregate revenue of the Company.
Sources of Supply
The principal raw materials used by the Company include steel, other metal components, hydraulic hoses, paint and tires. During
2017
, the raw materials needed by the Company were available from a variety of sources in adequate quantities and at prevailing market prices.
While the Company manufactures many of the parts for its products, a significant percentage of parts, including most drivelines, gearboxes, industrial engines, and hydraulic components, are purchased from outside suppliers which manufacture to the Company’s specifications. In addition, the Company, through its subsidiaries, purchases tractors and truck chassis as a number of the Company’s products are mounted and shipped with a tractor or truck chassis. Tractors and truck chassis are generally available, but some delays in receiving tractors or truck chassis
9
can occur throughout the year. The Company sources its purchased goods from international and domestic suppliers. No one supplier is responsible for supplying more than 10% of the principal raw materials or purchased goods used by the Company.
Patents and Trademarks
The Company owns various U.S. and international patents and trademarks. While the Company considers its patents to be advantageous to its business, it is not dependent on any single patent or trademark or group of patents and trademarks. The net book value of patents and trademarks was
$29,215,000
and
$26,642,000
as of
December 31, 2017
and
2016
, respectively.
Environmental and Other Governmental Regulations
Like other manufacturers, the Company is subject to a broad range of federal, state, local and foreign laws and requirements, including those concerning air emissions, discharges into waterways, and the generation, handling, storage, transportation, treatment and disposal of hazardous substances and waste materials, as well as the remediation of contamination associated with releases of hazardous substances at the Company’s facilities and off-site disposal locations, workplace safety and equal employment opportunities. These laws and regulations are constantly changing, and it is impossible to predict with accuracy the effect that changes to such laws and regulations may have on the Company in the future. Like other industrial concerns, the Company’s manufacturing operations entail the risk of noncompliance, and there can be no assurance that the Company will not incur material costs or other liabilities as a result thereof.
The Company knows that its Indianola, Iowa property is contaminated with chromium which most likely resulted from chrome plating operations which were discontinued before the Company purchased the property. Chlorinated volatile organic compounds have also been detected in water samples on the property, though the source is unknown at this time. The Company voluntarily worked with an environmental consultant and the state of Iowa with respect to these issues and believes it completed its remediation program in June 2006. The work was accomplished within the Company’s environmental liability reserve balance. We requested a “no further action” classification from the state. In January 2009, we received a "no further action" letter from the Iowa Department of Natural Resources, according to which the Iowa property will be subject to certain ongoing environmental covenants that create restrictions regarding the use and future development of the property.
Certain assets of the Company contain asbestos that may have to be remediated over time. The Company believes that any subsequent change in the liability associated with the asbestos removal will not have a material adverse effect on the Company’s consolidated financial position or results of operations.
The Company is subject to various other federal, state, and local laws affecting its business, as well as a variety of regulations relating to such matters as working conditions, equal employment opportunities, and product safety. A variety of state laws regulate the Company’s contractual relationships with its dealers, some of which impose restrictive standards on the relationship between the Company and its dealers, including events of default, grounds for termination, non-renewal of dealer contracts, and equipment repurchase requirements. The Company believes it is currently in material compliance with all such applicable laws and regulations.
Employees
As of
December 31, 2017
, the Company employed approximately
3,280
employees. In North America, the Company has collective bargaining agreements at the
Gradall
facility which cover
188
employees and will expire on
March 11, 2018
, and at the
Tenco
facility in Canada covering
83
employees which will expire on
December 31, 2020
. The Company’s European operations,
McConnel,
Bomford
,
Spearhead, AMS-UK, Kellands, SMA Faucheux
,
Forges Gorce,
Rousseau
and
Rivard,
also have various collective bargaining agreements covering
888
employees. The Company considers its employee relations to be satisfactory.
Financial Information about Segments
See
Note 16
of the accompanying consolidated financial statements.
10
International Operations and Geographic Information
See
Note 17
of the accompanying consolidated financial statements.
Available Information
The Company files annual, quarterly and current reports, proxy statements and other information with the Securities and Exchange Commission (the “SEC”). You may read and copy any document we file with the SEC at the SEC’s Public Reference Room at 100 F Street, NE, Washington, D.C. 20549. Please call the SEC at 1-800-SEC-0330 for information on the operation of the Public Reference Room. The SEC maintains a website that contains annual, quarterly and current reports, proxy and information statements, and other information that issuers (including the Company) file electronically with the SEC. The SEC’s website is www.sec.gov.
The Company’s website is www.alamo-group.com. The Company makes available free of charge through its website, via a link to the SEC’s website at www.sec.gov, its annual report on Form 10-K, quarterly reports on Form 10-Q, current reports on Form 8-K and any amendments to those reports filed or furnished pursuant to Section 13(a) or 15(d) of the Securities Exchange Act of 1934, as amended (the “Exchange Act”), as soon as reasonably practicable after such material is electronically filed with, or furnished to, the SEC. The Company also makes available through its website, via a link to the SEC’s website, statements of beneficial ownership of the Company’s equity securities filed by its directors, officers, 10% or greater shareholders, and others required to file under Section 16 of the Exchange Act.
The Company also makes available free of charge on its website its most recent annual report on Form 10-K, its quarterly reports on Form 10-Q for the current fiscal year, its most recent proxy statement and its most recent annual report to stockholders, although in some cases these documents are not available on our site as soon as they are available on the SEC’s site. You will need to have on your computer the Adobe Acrobat Reader
®
software to view the documents, which are in PDF format. In addition, the Company posts on its website its Charters for its Audit Committee, Compensation Committee and Nominating/Corporate Governance Committee, as well as its Corporate Governance Policies and its Code of Conduct and Ethics for its directors, officers and employees. You can obtain a written copy of these documents, excluding exhibits, at no cost, by sending your request to the Corporate Secretary, Alamo Group Inc., 1627 E. Walnut Street, Seguin, Texas 78155, which is the principal corporate office of the Company. The telephone number is (830) 379-1480. The information on the Company’s website is not incorporated by reference into this report.
Forward-Looking Information
Part I of this Annual Report on Form 10-K and the “Management’s Discussion and Analysis of Financial Condition and Results of Operations” included in Part II of this Annual Report contain forward-looking statements within the meaning of Section 27A of the Securities Act of 1933 and Section 21E of the Securities Exchange Act of 1934. In addition, forward-looking statements may be made orally or in press releases, conferences, reports or otherwise, in the future by or on behalf of the Company.
Statements that are not historical are forward-looking. When used by us or on our behalf, the words "expect," “will,” “estimate,” “believe,” “intend,” "would," “could,” "predict," “should,” “anticipate,” “project,” “forecast,” “plan,” “may” and similar expressions generally identify forward-looking statements made by us or on our behalf. Forward-looking statements involve risks and uncertainties. These uncertainties include factors that affect all businesses operating in a global market, as well as matters specific to the Company and the markets we serve. Certain particular risks and uncertainties that continually face us include the following:
|
•
|
budget constraints and revenue shortfalls which could affect the purchases of our type of equipment by governmental customers and related contractors in both domestic and international markets;
|
|
•
|
market acceptance of new and existing products;
|
|
•
|
our ability to maintain good relations with our employees;
|
|
•
|
our ability to develop and manufacture new and existing products profitably;
|
|
•
|
the inability of our suppliers, creditors, public utility providers and financial and other service organizations to deliver or provide their products or services to us;
|
|
•
|
legal actions and litigation;
|
11
|
•
|
impairment in the carrying value of goodwill;
|
|
•
|
our ability to successfully integrate acquisitions and operate acquired businesses or assets, including our ability to successfully integrate and operate
Santa Izabel, Old Dominion
, and
RPM;
|
|
•
|
our ability to hire and retain quality employees; and
|
|
•
|
changes in the prices of agricultural commodities, which could affect our customers’ income
|
levels.
In addition, we are subject to risks and uncertainties facing the industry in general, including the following:
|
•
|
changes in business and political conditions and the economy in general in both domestic and international markets;
|
|
•
|
an increase in unfunded pension plan liability due to financial market deterioration;
|
|
•
|
price and availability of energy and critical raw materials, particularly steel and steel products;
|
|
•
|
increased competition;
|
|
•
|
repercussions from the pending exit by the U.K. from the European Union (EU);
|
|
•
|
adverse weather conditions such as droughts, floods, snowstorms, etc., which can affect the buying patterns of our customers and end-users;
|
|
•
|
increased costs of complying with new regulations, including compliance with the European General Data Protection Regulation (GDPR), and potential fines and penalties;
|
|
•
|
the potential effects on the buying habits of our customers due to animal disease outbreaks;
|
|
•
|
adverse market conditions and credit constraints which could affect our customers and end-users, such as cutbacks on dealer stocking levels;
|
|
•
|
changes in market demand;
|
|
•
|
cyber security risks including the potential loss of proprietary data or data security breaches and related fines, penalties and other liabilities;
|
|
•
|
financial market changes including changes in interest rates and fluctuations in foreign exchange rates;
|
|
•
|
abnormal seasonal factors in our industry;
|
|
•
|
changes in domestic and foreign governmental policies and laws, including increased levels of government regulation and changes in agricultural policies, including the amount of farm subsidies and farm payments;
|
|
•
|
government actions, including but not limited to budget levels, change in tax laws, regulations and legislation, relating to the environment, commerce, infrastructure spending, health and safety;
|
|
•
|
risk of governmental defaults and resulting impact on the global economy and particularly financial institutions.
|
We wish to caution readers not to place undue reliance on any forward-looking statement and to recognize that the statements are not predictions of actual future results. Actual results could differ materially from those anticipated in the forward-looking statements and from historical results, due to the risks and uncertainties described above and under “Risk Factors,” as well as others not now anticipated. The foregoing statements are not exclusive and further information concerning us and our businesses, including factors that could potentially materially affect our financial results, may emerge from time to time. It is not possible for management to predict all risk factors or to assess the impact of such risk factors on the Company’s businesses.
12
Executive Officers of the Company
Certain information is set forth below concerning the executive officers of the Company, each of whom has been appointed to serve until the
2018
annual meeting of directors or until his successor is duly appointed and qualified.
|
Name
|
Age
|
Position
|
||
|
Ronald A. Robinson
|
65
|
President and Chief Executive Officer
|
||
|
Dan E. Malone
|
57
|
Executive Vice President and Chief Financial Officer
|
||
|
Robert H. George
|
71
|
Vice President, Secretary and Treasurer
|
||
|
Richard J. Wehrle
|
61
|
Vice President and Corporate Controller
|
||
|
Edward T. Rizzuti
|
48
|
Vice President and General Counsel
|
||
|
Geoffrey Davies
|
70
|
Executive Vice President, Alamo Group Inc. and Managing Director, Alamo Group (EUR) Ltd., European Division
|
||
|
Richard H. Raborn
|
52
|
Executive Vice President, Alamo Group Inc. and Executive Vice President Alamo Group (USA) Inc., Agricultural Division
|
||
|
Jeffery A. Leonard
|
58
|
Executive Vice President, Alamo Group Inc. and Executive Vice President Alamo Group (USA) Inc., Industrial Division
|
||
Ronald A. Robinson was appointed President, Chief Executive Officer and a director of the Company on July 7, 1999. Mr. Robinson had previously been President of Svedala Industries, Inc., the U.S. subsidiary of Svedala Industries AB of Malmo, Sweden, a leading manufacturer of equipment and systems for the worldwide construction, mineral processing and materials handling industries. Mr. Robinson joined Svedala in 1992 when it acquired Denver Equipment Company of which he was Chairman and Chief Executive Officer.
Dan E. Malone was appointed Executive Vice President, Chief Financial Officer on January 15, 2007. Prior to joining the Company, Mr. Malone held the position of Executive Vice President, Chief Financial Officer & Corporate Secretary at Igloo Products Corporation, a manufacturer of insulated consumer goods, from 2002 to January 2007. Mr. Malone was Vice President and Chief Financial Officer of The York Group, Inc. from 2000 to 2002, and held various financial positions from 1987 to 2000 with Cooper Industries, Inc. and its various subsidiaries.
Robert H. George joined the Company in May 1987 as Vice President and Secretary/Treasurer and has served the Company in various executive capacities since that time. Prior to joining the Company, Mr. George was Senior Vice President of Frost National Bank, a national bank association, from 1978 to 1987.
Richard J. Wehrle has been Vice President and Controller of the Company since May 2001. Prior to his appointment, Mr. Wehrle served in various accounting management capacities within the Company since 1988.
Edward T. Rizzuti was appointed Vice President and General Counsel of Alamo Group Inc. effective July 15, 2015. Prior to joining the Company, Mr. Rizzuti previously served from 2010 to 2015 as Vice President, General Counsel and Secretary for Erickson Incorporated, a publicly traded aircraft manufacturing and operating company based in Portland, Oregon.
Geoffrey Davies, OBE and PhD, has been Managing Director of Alamo Group (EUR) Ltd. since December 1993 and was appointed Vice President of the Company in February 2003. From 1988 to 1993, Dr. Davies served
McConnel
Ltd., a U.K. company acquired by Alamo Group in 1991, in various capacities including serving as its Marketing Director from February 1992 until December 1993.
Richard H. Raborn was appointed Executive Vice President of Alamo Group Inc. effective April 6, 2015. Mr. Raborn is also Executive Vice President of Alamo Group (USA) Inc. and is in charge of the Agricultural Division.
13
Prior to joining the Company, Mr. Raborn was Vice President and General Manager of the Powertrain Metal Division for Illinois Tool Works (ITW) from 2009 to 2015. ITW is one of the world's leading diversified manufacturers of specialized industrial equipment, consumables and related service business.
Jeffery A. Leonard joined Alamo Group in September 2011 as Executive Vice President of Alamo Group Inc. and Executive Vice President of Alamo Group (USA) Inc., in charge of the Industrial Division. Mr. Leonard previously was Senior Vice President of Metso Minerals Industries Inc., a supplier of technology and services for mining, construction power generation, automation, recycling, and pulp and paper industries.
You should carefully consider each of the risks described below, together with all of the other information contained in this Annual Report on Form 10-K, before making an investment decision with respect to the Company’s securities. If any of the following risks develop into actual events, the Company’s business, financial condition or results from operations could be materially and adversely affected and you could lose all or part of your investment.
Risks related to our business
Deterioration of industry conditions could harm our business, results of operations and financial condition.
Our business depends to a large extent upon the prospects for the mowing, right-of-way maintenance and agricultural markets in general. Future prospects of the industry depend largely on factors outside of our control. Any of those factors could adversely impact demand for our products, which could adversely impact our business, results of operations and financial condition. These factors include the following:
|
•
|
weakness in the worldwide economy;
|
|
•
|
the price and availability of raw materials, purchased components and energy;
|
|
•
|
budget constraints and revenue shortfalls for our governmental customers;
|
|
•
|
changes in domestic and foreign governmental policies and laws, including increased levels of governmental regulation and associated liabilities;
|
|
•
|
the levels of interest rates;
|
|
•
|
the value of the U.S. dollar relative to the foreign currencies in countries where we sell our products but don’t have a manufacturing presence;
|
|
•
|
impact of tighter credit markets on the Company, its dealers and end-users;
|
|
•
|
impairment in the carrying value of goodwill; and
|
|
•
|
increase in unfunded pension plan liability due to financial market deterioration.
|
In addition, our business is susceptible to a number of factors that specifically affect agricultural customer spending patterns, including the following:
|
•
|
animal disease outbreaks, epidemics and crop pests;
|
|
•
|
weather conditions, such as droughts, floods and snowstorms;
|
|
•
|
changes in farm incomes;
|
|
•
|
cattle and agricultural commodity prices;
|
|
•
|
changes in governmental agricultural policies worldwide;
|
|
•
|
the level of worldwide farm output and demand for farm products; and
|
|
•
|
limits on agricultural imports/exports.
|
A downturn in general economic conditions and outlook in the United States and around the world could adversely affect our net sales and earnings.
The strength and profitability of our business depends on the overall demand for our products and upon economic conditions and outlook, including but not limited to economic growth rates; consumer spending levels; financing availability, pricing and terms for our dealers and end-users; employment rates; interest rates; inflation; consumer confidence and general economic and political conditions and expectations in the United States and the other economies in which we conduct business. Slow or negative growth rates, inflationary/deflationary pressures, higher commodity costs and energy prices, reduced credit availability or unfavorable credit terms for our dealers
14
and end-user customers, increased unemployment rates, and recessionary economic conditions and outlook could cause consumers to reduce spending, which may cause them to delay or forgo purchases of our products and could have an adverse effect on our net sales and earnings.
The pending exit by the U.K. from the European Union (“Brexit”) and the impact of the withdrawal may adversely affect business activity, political stability and economic conditions in the U.K., the European Union and elsewhere. The economic conditions and outlook could be further adversely affected by the uncertainty concerning the timing and terms of the exit and new or modified trading arrangements between the U.K. and other countries. Any of these developments, or the perception that any of these developments are likely to occur, could negatively affect economic growth or business activity in the U.K., the European Union and elsewhere, and could materially and adversely affect our business and results of operations.
Changes in U.S. tax legislation could have a material adverse impact on our results of operations.
On December 22, 2017, President Trump signed into law legislation known as the Tax Cuts and Jobs Act of 2017 ("TCJA") that significantly reforms the Internal Revenue Code of 1986, as amended. We are currently evaluating provisions of TCJA, which among other things, lowers the U.S. corporate tax rate from 35% to 21%, moves the country towards a territorial tax system with a one-time mandatory tax on previously deferred foreign earnings of foreign subsidiaries, imposes significant additional limitations on the deductibility of interest expense and executive compensation, creates taxes such as the base erosion anti-abuse tax (“BEAT”) and Global Intangible Low Taxed Income (“GILTI”) tax, and allows for the expensing of certain capital expenditures. As we do not have all the necessary information to analyze all income tax effects of TCJA, we have recorded a provisional amount which we believe represents a reasonable estimate of the accounting implications of TCJA. We will continue to evaluate and adjust the provisional amounts as additional information is obtained. We may not understand the full effect that this tax reform legislation will have on our business and it is possible that the impact of the legislation could adversely and materially impact our results of operations. We expect to complete our detailed analysis no later than the fourth quarter of 2018. For further information, see
Note 12
to the consolidated financial statements.
We depend on governmental sales and a decrease in such sales could adversely affect our business, results of operations and financial condition.
A substantial portion of our revenues is derived from sales to federal, state and local governmental entities and related contractors, both in the U.S. and in other countries in which we sell our products. These sales depend primarily on the levels of budgeted and appropriated expenditures for highway, airport, roadside and parks maintenance by various governmental entities and are affected by changes in local and national economic conditions.
Our dependence on, and the price and availability of, raw materials as well as purchased components may adversely affect our business, results of operations and financial condition.
We are subject to fluctuations in market prices for raw materials such as steel and energy. In addition, although most of the raw materials and purchased components we use are commercially available from a number of sources, we could experience disruptions in the availability of such materials. If we are unable to purchase materials we require or are unable to pass on price increases to our customers or otherwise reduce our cost of goods sold, our business, results of operations and financial condition may be adversely affected. In addition, higher energy costs could negatively affect spending by farmers, including their purchases of our products.
Impairment in the carrying value of goodwill could negatively impact our consolidated results of operations and net worth.
The Company estimates the fair value of its reporting units using a discounted cash flow analysis. This analysis requires the Company to make significant assumptions and estimates about the extent and timing of future cash flows, discount rates and growth rates. The cash flows are estimated over a significant future period of time, which makes those estimates and assumptions subject to an even higher degree of uncertainty. The Company also utilizes market valuation models and other financial ratios, which require the Company to make certain assumptions and estimates regarding the applicability of those models to its assets and businesses. As of
December 31, 2017
, goodwill was $
84,761,000
, which represents
13%
of total assets.
15
The Company recognized no goodwill impairment in
2017
,
2016
or
2015
. During the third quarter of 2015, the Company changed its annual goodwill and intangible assets impairment testing date from December 31 to October 1. During the
2017
impairment analysis review, we performed a sensitivity analysis for goodwill impairment with respect to each of our reporting units and determined that a hypothetical 15% decline in the fair value of each reporting unit as of October 1,
2017
would not result in an impairment of goodwill for any of the reporting units. If we were to have a significant goodwill impairment caused by a greater than a 15% decline in fair value, it could impact our results of operations as well as our net worth.
We are significantly dependent on information technology.
We rely on information technology networks and systems, including the Internet, to process, transmit, and store electronic and financial information, to manage a variety of business processes and activities, and to comply with regulatory, legal, and tax requirements. We also depend on our information technology infrastructure for digital marketing activities and for electronic communications among our locations, personnel, customers, and suppliers. These information technology systems (some of which are provided and maintained by third parties) may be susceptible to damage, disruptions, or shutdowns due to hardware failures, computer viruses, hacker attacks, telecommunication failures, user errors, catastrophic events or other factors. If our information technology systems suffer severe damage, disruption or shutdown, and our business continuity plans do not effectively resolve the issues in a timely manner, we could experience business disruptions, transaction errors, processing inefficiencies, and the loss of customers and sales, causing our product sales, financial condition, and operating results to be adversely affected and the reporting of our financial results to be delayed.
In addition, in the ordinary course of our business, we collect and store sensitive data, including our intellectual property, our proprietary business information and that of our customers, suppliers and business partners, and personally identifiable information or other sensitive information of our customers and employees. The secure processing, maintenance and transmission of this information is critical to our operations and business strategy. Despite the information security measures we have taken, our information technology and infrastructure may be vulnerable to attacks by hackers or breached due to employee error, malfeasance or other disruptions. Any such breach could compromise our networks and the information stored there could be accessed, publicly disclosed, lost or stolen. Any such access, disclosure or other loss of information could result in legal claims or proceedings, liability under laws that protect the privacy of personal information, regulatory fines and penalties, disruption of our operations and the services we provide to customers, damage to our reputation, and a loss of confidence in our products and services, which could adversely affect our business and operating results.
Changes in the European regulatory environment regarding privacy and data protection regulations could have a material adverse impact on our results of operations.
The EU has recently adopted a comprehensive overhaul of its data protection regime in the form of the General Data Protection Regulation (“GDPR”), which comes into effect in May of 2018. GDPR extends the scope of the existing EU data protection law to foreign companies processing personal data of EU residents. The regulation imposes a strict data protection compliance regime with severe penalties of 4% of worldwide turnover or €20 million, whichever is greater, and includes new rights such as the right of erasure of personal data. Although the GDPR will apply across the EU, as has been the case under the current data protection regime, EU Member States have some national derogations and local data protection authorities (“DPAs”) will still have the ability to interpret the GDPR, which has the potential to create inconsistencies on a country-by-country basis. Implementation of, and compliance with the GDPR could increase our cost of doing business and/or force us to change our business practices in a manner adverse to our business. In addition, violations of the GDPR may result in significant fines, penalties and damage to our brand and business which could, individually or in the aggregate, materially harm our business and reputation.
We operate in a highly competitive industry, and some of our competitors and potential competitors have greater resources than we do.
Our products are sold in highly competitive markets throughout the world. We compete with several large national and international companies that offer a broad range of equipment and replacement parts that compete with our products, as well as with numerous small, privately-held manufacturers and suppliers of a limited number of products mainly on a regional basis. Some of our competitors are significantly larger than we are and have substantially greater financial and other resources at their disposal. We believe that we are able to compete successfully in our markets by, to some extent, avoiding direct competition with significantly larger potential
16
competitors. There can be no assurance that our competitors will not substantially increase the resources devoted to the development and marketing of products competitive with our products or that new competitors with greater resources will not enter our markets. Any failure to effectively compete could have an adverse effect on our business, results of operations and financial condition.
Failure to develop new products or keep pace with technological developments may have a material adverse impact on our results of operations
.
Our industry is affected by future technological developments. The introduction of new products or processes with innovative technologies could render our existing products or processes obsolete or unmarketable. Our success depends, to some extent, upon our ability to develop, market and sell cost-effective new products and applications that keep pace with technological developments in the markets we serve. We may not be successful in identifying, developing and marketing new products and applications or we may experience difficulties that could delay or prevent the successful development, introduction and marketing of such new products and applications, which could have a material adverse impact on our business and results of operations.
We operate and source internationally, which exposes us to the political, economic and other risks of doing business abroad.
We have operations in a number of countries outside of the United States and we source raw materials and components globally. Our international operations are subject to the risks normally associated with conducting business in foreign countries, including but not limited to the following:
|
•
|
limitations on ownership and on repatriation of earnings;
|
|
•
|
import and export restrictions, tariffs and quotas;
|
|
•
|
additional expenses relating to the difficulties and costs of staffing and managing international operations;
|
|
•
|
labor disputes and uncertain political and economic environments and the impact of foreign business cycles;
|
|
•
|
changes in laws or policies;
|
|
•
|
changes in any international trade agreements, such as any changes in European Union membership;
|
|
•
|
delays in obtaining or the inability to obtain necessary governmental permits;
|
|
•
|
potentially adverse consequences resulting from the applicability of foreign tax laws;
|
|
•
|
cultural differences;
|
|
•
|
increased expenses due to inflation;
|
|
•
|
weak economic conditions in foreign markets where our subsidiaries distribute their products;
|
|
•
|
changes in currency exchange rates;
|
|
•
|
disruptions in transportation and port authorities; and
|
|
•
|
regulations involving international freight shipments.
|
Operating in the international marketplace exposes us to a number of risks, including the need to comply with U.S. and foreign laws and regulations applicable to our foreign operations, including anti-corruption laws such as the Foreign Corrupt Practices Act and the U.K. Bribery Act, United States export control laws, and data privacy laws such as the recently enacted European GDPR. The costs of compliance with these various laws, regulations and policies can be significant and penalties for noncompliance could significantly and adversely impact our business. Our international operations may also be adversely affected by laws and policies affecting foreign trade, investment, taxation, and our ability to effectively source components and raw materials internationally. For example, any significant changes in U.S. trade policy, including the introduction of any new or expanded tariffs, could increase the cost of critical materials and supplies that we source internationally or negatively impact international sales of our products, which would have an adverse effect on our net sales and earnings.
In addition, political developments and governmental regulations and policies in the countries in which we operate directly affect the demand for our products. For example, decreases or delays in farm subsidies to our agricultural customers, or changes in environmental policies aimed at limiting mowing activities, could adversely affect our business, results of operations and financial condition.
17
Our acquisition strategy may not be successful, which may adversely affect our business, results of operations and financial condition.
We intend to grow internally and through the acquisition of businesses and assets that will complement our current businesses. To date, a material portion of our growth has come through acquisitions. We cannot be certain that we will be able to identify attractive acquisition targets, obtain financing for acquisitions on satisfactory terms or successfully acquire identified targets. Competition for acquisition opportunities may also increase our costs of making acquisitions or prevent us from making certain acquisitions. These and other acquisition-related factors may adversely impact our business, results of operations and financial condition.
We may be unable to complete or integrate existing or future acquisitions effectively, and businesses we have acquired, or may acquire in the future, may not perform as expected.
We may not be successful in integrating acquired businesses into our existing operations and achieving projected synergies. We could face many risks in integrating acquired businesses, including but not limited to the following:
|
•
|
we may incur substantial costs, delays or other operational or financial challenges in integrating acquired businesses, including integrating each company's accounting, information technology, human resource and other administrative systems to facilitate effective management;
|
|
•
|
we may be unable to achieve expected cost reductions, to take advantage of cross-selling opportunities, or to eliminate redundant operations, facilities and systems;
|
|
•
|
we may need to implement or improve controls, procedures and policies appropriate for a public company which could take a significant amount of time and expense;
|
|
•
|
acquisitions may divert our management’s attention from the operation of our existing businesses;
|
|
•
|
we may not be able to retain key personnel of acquired businesses;
|
|
•
|
there may be cultural challenges associated with integrating management and employees from the acquired businesses into our organization; and
|
|
•
|
we may encounter unanticipated events, circumstances and legal risk and associated liabilities.
|
Our integration of acquired businesses requires significant efforts from the management of each entity, including coordinating existing business plans and research and development efforts. Integrating operations may distract management’s attention from the day-to-day operation of the combined companies. Ultimately, our attempts to integrate the operations, technology and personnel of acquired businesses may not be successful. If we are unable to successfully integrate acquired businesses, our future results may be negatively impacted.
In addition, we may be adversely affected if businesses that we have acquired, or that we acquire in the future, do not perform as expected. An acquired business could perform below our expectations for a number of reasons, including legislative or regulatory changes that affect the areas in which the acquired business specializes, the loss of customers and dealers, general economic factors that directly affect the acquired business, and the cultural incompatibility of its management team. Any or all of these reasons could adversely affect our business, results of operation and financial condition.
The agricultural industry and the infrastructure maintenance industry are seasonal and are affected by the weather, and seasonal fluctuations may cause our results of operations and working capital to fluctuate from quarter to quarter.
In general, agricultural and governmental end-users typically purchase new equipment during the first and second calendar quarters. Other products such as street sweepers, excavators, snow removal equipment, front-end loaders and pothole patchers have different seasonal patterns, as do replacement parts in general. In attempting to achieve efficient utilization of manpower and facilities throughout the year, we estimate seasonal demand months in advance and manufacturing capacity is scheduled in anticipation of such demand. We utilize an annual plan with updated quarterly sales forecasts provided by our marketing divisions and order backlog in order to develop a production plan for our manufacturing facilities. In addition, many of our marketing departments attempt to equalize demand for their products throughout the calendar year by offering seasonal sales programs which may provide additional incentives, including discounts and extended payment terms, on equipment that is ordered during off-season periods. Because we spread our production and wholesale shipments throughout the year to take into account the factors described above, sales in any given period may not reflect the timing of dealer orders and retail demand.
18
Weather conditions and general economic conditions may affect the timing of purchases and actual industry conditions might differ from our forecasts. Consequently, sudden or significant declines in industry demand could adversely affect our working capital or results of operations.
If we do not retain key personnel and attract and retain other highly skilled employees, our business may suffer.
Our continued success will depend on, among other things, the efforts and skills of our executive officers, including our president and chief executive officer, and our ability to attract and retain additional highly qualified managerial, technical, manufacturing, and sales and marketing personnel. We do not maintain “key man” life insurance for any of our employees, and all of our senior management are employed at will. We cannot assure you that we will be able to attract and hire suitable replacements for any of our key employees. We believe the loss of a key executive officer or other key employee could have an adverse effect on our business, results of operations, and financial condition.
We may not be able to realize the potential or strategic benefits of the acquisitions we complete, or we may not be able to successfully address problems encountered in connection with acquisitions.
Acquisitions are an important part of our growth strategy. We have completed a number of acquisitions over the past several years. We expect to consider opportunities and make additional acquisitions in the future, but we may not find suitable acquisition targets or be able to consummate desired acquisitions due to among other things, unfavorable credit markets or other risks, which could harm our operating results. Acquisitions can be difficult, time-consuming, and pose a number of risks, including:
|
•
|
potential negative impact on our earnings per share;
|
|
•
|
failure of acquired products to achieve projected sales;
|
|
•
|
problems in integrating the acquired products with our products;
|
|
•
|
potential downward pressure on operating margins due to lower operating margins of acquired businesses,
|
|
•
|
increased headcount costs and other expenses associated with adding and supporting new products;
|
|
•
|
difficulties in retaining and integrating key employees;
|
|
•
|
failure to realize expected synergies or cost savings;
|
|
•
|
disruption of ongoing business operations, including diversion of management’s attention and uncertainty for employees and customers, particularly during the post-acquisition integration process;
|
|
•
|
potential negative impact on our relationships with customers, distributors and vendors; and
|
|
•
|
the assumption of liabilities that are unknown to us at the time of closing.
|
If we do not manage these risks, the acquisitions that we complete may have an adverse effect on our business, our results of operations, or financial condition.
Increasingly stringent engine emission regulations could impact our ability to sell certain of our products into the market and appropriately price certain of our products, which could negatively affect our competitive position and financial results.
The products we manufacture or sell, particularly engines, are subject to increasingly stringent environmental emissions regulations. For instance, the EPA has adopted increasingly stringent engine emissions regulations, including Tier 4 emission requirements applicable to diesel engines in specified horsepower ranges that are used in some of our products. As of January 1, 2012, such requirements expanded to additional horsepower categories and, accordingly, apply to more of the products we sell. While we have developed and implemented plans to achieve full and timely compliance with these requirements, our ability to meet the Tier 4 requirements is subject to many variables, some of which are beyond our direct control. If we fail to meet the Tier 4 requirements and any other EPA emission standards that are currently in place or that may be introduced in the future, our ability to sell our products into the market may be limited, which could have a material adverse effect on our competitive position and financial results.
19
We are subject on an ongoing basis to the risk of product liability claims and other litigation arising in the ordinary course of business.
Like other manufacturers, we are subject to various claims, including product liability claims, arising in the ordinary course of business, and we are a party to various legal proceedings that constitute routine litigation incidental to our business. We may be exposed to product liability claims in the event that the use of our products results, or is alleged to result, in bodily injury, property damage, or both. We cannot assure you that we will not experience any material product liability losses in the future or that we will not incur significant costs to defend the Company against such claims. While we currently have product liability insurance, we cannot assure you that our product liability insurance coverage will be adequate for any liabilities that may ultimately be incurred or that it will continue to be available on terms acceptable to us. A successful claim brought against us in excess of available insurance coverage or a requirement to participate in a product recall may have a materially adverse effect on our business.
We are subject to environmental, health and safety and employment laws and regulations and related compliance expenditures and liabilities.
Like other manufacturers, the Company is subject to a broad range of federal, state, local and foreign laws and requirements, including those concerning air emissions, discharges into waterways, and the generation, handling, storage, transportation, treatment and disposal of hazardous substances and waste materials, as well as the remediation of contamination associated with releases of hazardous substances at the Company’s facilities and offsite disposal locations, workplace safety and equal employment opportunities. These laws and regulations are constantly changing, and it is impossible to predict with accuracy the effect that changes to such laws and regulations may have on the Company in the future. Like other industrial concerns, the Company’s manufacturing operations entail the risk of noncompliance, and there can be no assurance that the Company will not incur material costs or other liabilities as a result thereof.
Certain properties of the Company contain asbestos that may have to be remediated over time and it could be additional expense to the Company.
The Company is subject to various other federal, state, and local laws affecting its business, as well as a variety of regulations relating to such matters as working conditions, equal employment opportunities, and product safety. A variety of state laws regulate the Company’s contractual relationships with its dealers, some of which impose restrictive standards on the relationship between the Company and its dealers, including events of default, grounds for termination, non-renewal of dealer contracts, and equipment repurchase requirements.
If we are unable to comply with the terms of our credit arrangements, especially the financial covenants, our credit arrangements could be terminated.
We cannot assure you that we will be able to comply with all of the terms of our credit arrangements, especially the financial covenants. Our ability to comply with such terms depends on the success of our business and our operating results. Various risks, uncertainties, and events beyond our control could affect our ability to comply with the terms of our credit arrangements. If we were out of compliance with any covenant required by our credit arrangements following any applicable cure periods, the banks could terminate their commitments unless we could negotiate a covenant waiver. The banks could condition such waiver on amendments to the terms of our credit arrangements that may be unfavorable to us, including a potential increase to the interest rate we currently pay on outstanding debt under our credit arrangements could increase, which could adversely affect our operating results.
Fluctuations in currency exchange rates may adversely affect our financial results.
Our earnings are affected by fluctuations in the value of the U.S. dollar as compared to foreign currencies, predominantly in European countries, Canada and Australia, as a result of the sale of our products in international markets. While we do enter into foreign exchange contracts to protect against such fluctuations to an extent (primarily in the U.K. market), we cannot assure you that we will be able to effectively manage these risks. Significant long-term fluctuations in relative currency values, such as a devaluation of the Euro against the U.S. dollar, could have an adverse effect on our future results of operations or financial condition.
20
Risks related to investing in our common stock
Because the price of our common stock may fluctuate significantly, it may be difficult for you to resell our common stock when desired or at attractive prices.
The trading price of our common stock has and may continue to fluctuate. The closing prices of our common stock on the New York Stock Exchange during
2017
ranged from $
119.29
to $
72.22
per share, and during
2016
from $
77.60
to $
49.33
per share. Our stock price may fluctuate in response to the risk factors set forth herein and to a number of events and factors, such as quarterly variations in operating and financial results, litigation, changes in financial estimates and recommendations by securities analysts, the operating and stock performance of other companies that investors may deem comparable to us, news reports relating to us or trends in our industry or general economic conditions. The stock price volatility and trading volume may make it difficult for you to resell your shares of our common stock when desired or at attractive prices.
You may experience dilution of your ownership interests due to the future issuance of additional shares of our common stock.
We may issue shares of our previously authorized and unissued securities which will result in the dilution of the ownership interests of our present stockholders. We are currently authorized to issue 20,000,000 shares of common stock. On
December 31, 2017
,
11,640,100
shares of our common stock were issued and outstanding, and there were outstanding options and restricted stock awards totaling an additional
302,927
shares of our common stock. We also have additional shares available for grant under our 2015 Incentive Stock Option Plan and our 2009 Equity Incentive Plan. Additional stock option or other compensation plans or amendments to existing plans for employees and directors may be adopted. Issuance of these shares of common stock may dilute the ownership interests of our then existing stockholders. We may also issue additional shares of our common stock in connection with the hiring of personnel, future acquisitions, such as the 1,700,000 shares issued as consideration for the acquisition of
Bush Hog
in 2009, future private placements of our securities for capital raising purposes, or for other business purposes. This would further dilute the interests of our existing stockholders.
There is no assurance that we will continue declaring dividends or have the available cash to make dividend payments.
On January 2, 2018, the Board of Directors of the Company increased its quarterly dividend from $.10 per share to $.11 per share. Although we have paid a cash dividend in each quarter since becoming a public company in 1993, there can be no assurance that we will continue to declare dividends or that funds will continue to be available for this purpose in the future. The declaration and payment of dividends are restricted by the terms of our amended and restated revolving credit agreement, are subject to the discretion of our Board of Directors, are not cumulative, and will depend upon our profitability, financial condition, capital needs, future prospects, and other factors deemed relevant by our Board of Directors.
Provisions of our corporate documents may have anti-takeover effects that could prevent a change in control.
Provisions of our charter, bylaws and Delaware law could make it more difficult for a third party to acquire us, even if doing so would be beneficial to our stockholders. These provisions include prohibiting stockholders from calling stockholder meetings and prohibiting shareholder actions by written consent. Our Certificate of Incorporation and By-laws state that any amendment to certain provisions, including those provisions regarding limitations on action by written consent discussed above, be approved by the holders of at least two-thirds of our common stock. We are also afforded the protections of Section 203 of the Delaware General Corporation Law, which would prevent us from engaging in a business combination with a person who becomes a 15% or greater shareholder for a period of three years from the date such person acquired such status unless certain board or shareholder approvals were obtained.
21
Future sales, or the possibility of future sales, of a substantial amount of our common stock may depress the price of the shares of our common stock.
Future sales, or the availability for sale in the public market, of substantial amounts of our common stock could adversely affect the prevailing market price of our common stock and could impair our ability to raise capital through future sales of equity securities. If we or our existing stockholders sell substantial amounts of our common stock in the public market, or if there is a perception that these sales may occur, the market price of our common stock could decline.
Certain stockholders own a significant amount of our common stock, and their interests may conflict with those of our other stockholders.
As of
December 31, 2017
, three investors - BlackRock, Inc., Henry Crown and Company, and Dimensional Fund Advisors LP - beneficially owned approximately
38%
of our outstanding common stock. As a result, the major stockholders combined could be able to significantly influence the direction of the Company, the election of our Board of Directors and the outcome of any other matter requiring stockholder approval, including mergers, consolidations and the sale of all or substantially all of our assets, and together with other beneficially owned investors, to prevent or cause a change in control of the Company. Also, pursuant to contractual obligations, affiliates of Henry Crown and Company, were entitled to certain rights with respect to the registration of the common stock owned by them under the Securities Act. Pursuant
to such registration rights, on March 12, 2012, we filed a registration statement related to the common stock owned by such entities and such registration statement was declared effective by the SEC. The interests of the major stockholders may conflict with the interests of our other stockholders.
The Company has no unresolved staff comments to report pursuant to Item 1B.
22
As of
December 31, 2017
, the Company utilized fourteen principal manufacturing plants located in the United States, five in Europe, four in Canada, one in Australia and one in Brazil. The facilities are listed below:
|
Facility
|
Square
Footage
|
|
Principal Types of Products
Manufactured And Assembled
|
|
|
Selma, Alabama*
|
767,700
|
|
Owned
|
Mechanical Rotary Mowers, Finishing Mowers, Zero Turn Radius Mowers, Backhoes, Front-End Loaders for
Bush Hog
|
|
New Philadelphia, Ohio*
|
430,000
|
|
Owned
|
Telescopic Excavators for
Gradall
and Vacuum Trucks for
VacAll
|
|
Gibson City, Illinois*
|
275,000
|
|
Owned
|
Mechanical Mowers, Blades, Post Hole Diggers, Deep Tillage Equipment, front-end loaders, backhoes, and other implements for
Rhino
,
Bush
Hog
and OEM's
|
|
Seguin, Texas*
|
230,000
|
|
Owned
|
Hydraulic and Mechanical Rotary and Flail Mowers, Sickle-Bar Mowers, and Boom-Mounted Equipment for
Alamo Industrial
|
|
Indianola, Iowa*
|
200,000
|
|
Owned
|
Distribution and Manufacturing of Aftermarket Farm Equipment Replacement and Wear Parts for
Herschel/Valu-Bilt
|
|
Neuville, France*
|
195,000
|
|
Owned
|
Hydraulic and Mechanical Boom-Mounted Hedge and Grass Cutters for
Rousseau
and
SMA
|
|
Ludlow, England*
|
160,000
|
|
Owned
|
Hydraulic Boom-Mounted Hedge and Grass Cutters and other Equipment for
McConnel
and
Twose
|
|
Salford Priors, England*
|
157,000
|
|
Owned
|
Tractor-Mounted Power Arm Flails and other Equipment for
Bomford
and
Twose
and
Spearhead
|
|
Richmond, Virginia*
|
157,000
|
|
Leased
|
Leaf Collection Equipment and Replacement Brooms for Street Sweepers for
ODB
|
|
Sao Joao da Boa Vista, Brazil*
|
138,000
|
|
Leased
|
Agriculture Mowing Equipment and other Attachments for
Santa Izabel
|
|
Chartres, France
|
136,000
|
|
Owned
|
Property held for sale
|
|
Huntsville, Alabama*
|
136,000
|
|
Owned
|
Air and Mechanical Sweeping Equipment for
Schwarze
|
|
New Berlin, Wisconsin*
|
120,000
|
|
Owned
|
Municipal Snow Removal and Ice Control Equipment for
Wausau
|
|
St. Valerien, Quebec, Canada*
|
100,000
|
|
Owned
|
Snow and Ice Removal Equipment for
Tenco
|
|
Daumeray, France*
|
100,000
|
|
Leased
|
Vacuum Trucks, High Pressure Cleaning Systems and Trenchers for
Rivard
|
|
Englefeld, Saskatchewan, Canada*
|
85,000
|
|
Owned
|
Mechanical Rotary Mowers, Snow Blowers, and Rock Removal Equipment for
Schulte
|
|
Leavenworth, Kansas*
|
70,000
|
|
Owned
|
Snow Plows and Heavy-Duty Snow Removal Equipment for
Henke
|
|
Sioux Falls, South Dakota*
|
66,000
|
|
Owned
|
Hydraulic and Mechanical Mowing Equipment for
Tiger
|
|
New Berlin, Wisconsin*
|
55,000
|
|
Owned
|
Truck-Mounted Vacuum Trucks for
Super Products
|
|
Skowhegan, Maine
|
47,000
|
|
Owned
|
Distributor of Public Works and Runway Maintenance Products for
H.P. Fairfield
|
|
New Berlin, Wisconsin*
|
46,000
|
|
Leased
|
Truck-Mounted Vacuum Trucks for
Super Products
|
|
Kent, Washington*
|
42,800
|
|
Leased
|
Truck-Mounted Sweeping Equipment for the contractor market branded
Nite-Hawk
|
|
Fond du Lac, Wisconsin*
|
38,000
|
|
Owned
|
Municipal Snow Removal and Ice Control Equipment for
Wausau
|
|
Ayer's Cliff, Quebec, Canada*
|
35,000
|
|
Owned
|
Municipal Snow Removal and Ice Control Equipment for
Everest
|
|
Peschadoires, France*
|
22,000
|
|
Owned
|
Replacement Parts for Blades, Knives and Shackles for
Forges Gorce
|
|
Oakey, Australia*
|
18,000
|
|
Leased
|
Agriculture Mowing Equipment and other Attachments for
Fieldquip
and
Superior
|
|
Drummondville, Quebec, Canada*
|
17,000
|
|
Owned
|
Heavy-Duty Snow Removal Equipment for
RPM
|
|
Birdlip, England
|
14,000
|
|
Leased
|
Self-propelled Sprayers and a variety of Multi-Drive Load Carrying Equipment for
Kellands
|
|
Matao, Brazil
|
12,000
|
|
Leased
|
Agriculture Mowing Equipment and other Attachments for
Herder
|
|
Installation & Rental Facilities, Warehouses & Sales
|
277,200
|
|
Leased
|
Services Parts Distribution, Installation Facilities and Sales Office
|
|
Offices, Seguin, Texas
|
15,200
|
|
Owned
|
Corporate Office
|
|
Total
|
4,161,900
|
|
0.8065787261
|
|
* Principal manufacturing plants
Approximately
81%
of the manufacturing, warehouse and office space is owned. In November of 2016, the Company restructured and consolidated the
Faucheux
facility in Chartres, France into its
Rousseau
location and the Company listed the Chartres property for sale or lease. On January 30, 2018, the Company purchased the
23
property at the
NiteHawk
facility location in Kent, Washington. The Company considers each of these facilities to be well maintained, in good operating condition and adequate for its present level of operations.
Like other manufacturers, the Company is subject to a broad range of federal, state, local and foreign laws and requirements, including those concerning air emissions, discharges into waterways, and the generation, handling, storage, transportation, treatment and disposal of hazardous substances and waste materials, as well as the remediation of contamination associated with releases of hazardous substances at the Company’s facilities and off-site disposal locations, workplace safety and equal employment opportunities. These laws and regulations are constantly changing, and it is impossible to predict with accuracy the effect that changes to such laws and regulations may have on the Company in the future. Like other industrial concerns, the Company’s manufacturing operations entail the risk of noncompliance, and there can be no assurance that the Company will not incur material costs or other liabilities as a result thereof.
The Company knows that its Indianola, Iowa property is contaminated with chromium which most likely resulted from chrome plating operations which were discontinued before the Company purchased the property. Chlorinated volatile organic compounds have also been detected in water samples on the property, though the source is unknown at this time. The Company voluntarily worked with an environmental consultant and the state of Iowa with respect to these issues and believes it completed its remediation program in June 2006. The work was accomplished within the Company’s environmental liability reserve balance. We requested a “no further action” classification from the state. In January 2009, we received a "no further action" letter from the Iowa Department of Natural Resources, according to which the Iowa property will be subject to certain ongoing environmental covenants that create restrictions regarding the use and future development of the property.
Not applicable.
The Company’s common stock trades on the New York Stock Exchange under the symbol: ALG. On
February 23, 2018
, there were
11,648,925
shares of common stock outstanding, held by approximately
62
holders of record, but the total number of beneficial owners of the Company’s common stock exceeds this number. On
February 23, 2018
, the closing price of the common stock on the New York Stock Exchange was
$115.75
per share.
The following table sets forth, for the period indicated, on a per share basis, the range of high and low sales prices for the Company’s common stock as quoted by the New York Stock Exchange. These price quotations reflect inter-dealer prices, without adjustment for retail markups, markdowns or commissions, and may not necessarily represent actual transactions.
|
2017
|
2016
|
|||||||||||||||||||||||||||
|
|
|
Cash
|
|
|
|
Cash
|
||||||||||||||||||||||
|
|
Sales Price
|
Dividends
|
|
Sales Price
|
Dividends
|
|||||||||||||||||||||||
|
Quarter Ended
|
High
|
Low
|
Declared
|
Quarter Ended
|
High
|
Low
|
Declared
|
|||||||||||||||||||||
|
March 31, 2017
|
$
|
79.50
|
|
$
|
71.20
|
|
$
|
.10
|
|
March 31, 2016
|
$
|
61.82
|
|
$
|
48.26
|
|
$
|
.09
|
|
|||||||||
|
June 30, 2017
|
92.67
|
|
71.72
|
|
.10
|
|
June 30, 2016
|
66.01
|
|
52.82
|
|
.09
|
|
|||||||||||||||
|
September 30, 2017
|
107.69
|
|
86.80
|
|
.10
|
|
September 30, 2016
|
68.04
|
|
61.49
|
|
.09
|
|
|||||||||||||||
|
December 31, 2017
|
119.50
|
|
104.87
|
|
.10
|
|
December 31, 2016
|
78.91
|
|
59.55
|
|
.09
|
|
|||||||||||||||
On January 2, 2018, the Board of Directors of the Company declared a quarterly dividend of $.11 per share which was paid on January 29, 2018 to holders of record as of January 16, 2018.
The Company expects to continue its policy of paying regular cash dividends, although there is no assurance as to future dividends as they
24
depend on future earnings, capital requirements and financial condition. In addition, the payment of dividends is subject to restrictions under the Company’s bank revolving credit agreement. See “Management’s Discussion and Analysis of Financial Condition and Results of Operations - Liquidity and Capital Resources” in
Item 7
of Part II of this Annual Report on Form 10
-
K for a further description of the bank revolving credit agreement.
Information relating to compensation plans under which equity securities of the Company are authorized for issuance is set forth in Part III,
Item 12
of this Annual Report on Form 10-K.
25
Stock Price Performance Graph
The information contained in this Stock Performance Graph section shall not be deemed to be “soliciting material” or “filed” with the SEC or subject to the liabilities of Section 18 of the Exchange Act except to the extent that Alamo Group Inc. specifically incorporates it by reference into a document filed under the Securities Act or the Exchange Act.
The following graph and table set forth the cumulative total return to the Company's stockholders of our Common Stock during a five-year period ended
December 31, 2017
, as well as the performance of an overall stock market index (the
S&P SmallCap 600
Index) and the Company's selected peer group index (the
Russell 2000
Index).
The Company believes a representative industry peer group of companies with a similar business segment profile does not exist. The SEC has indicated that companies may use a base other than industry or line of business for determining its peer group index, such as an index of companies with similar market capitalization. Accordingly, the Company has selected the
Russell 2000
Index, a widely used small market capitalization index, to use as a representative peer group.
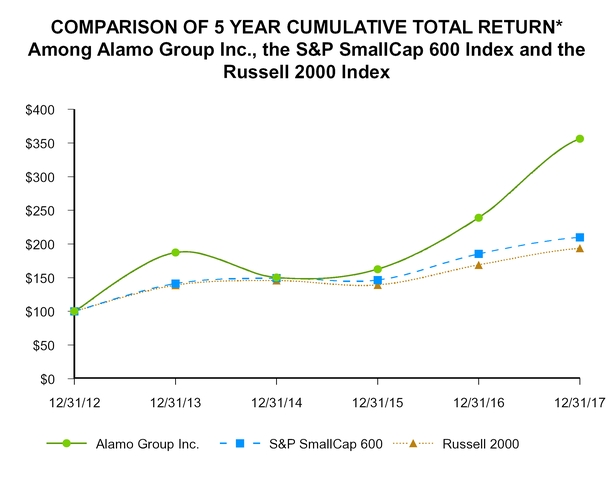
|
*$100 invested on 12/31/12 in stock or index, including reinvestment of dividends.
|
|
Fiscal year ending December 31.
|
|
Copyright© 2018 Standard & Poor's, a division of S&P Global. All rights reserved.
|
|
Copyright© 2018 Russell Investment Group. All rights reserved.
|
|
|
12/12
|
12/13
|
12/14
|
12/15
|
12/16
|
12/17
|
||||||
|
Alamo Group Inc.
|
100.00
|
187.25
|
150.30
|
162.67
|
239.07
|
356.23
|
||||||
|
S&P SmallCap 600
|
100.00
|
141.31
|
149.45
|
146.50
|
185.40
|
209.94
|
||||||
|
Russell 2000
|
100.00
|
138.82
|
145.62
|
139.19
|
168.85
|
193.58
|
||||||
26
The following selected financial data is derived from the consolidated financial statements of Alamo Group Inc. and its subsidiaries. The data should be read in conjunction with the consolidated financial statements, related notes and other financial information included herein.
|
|
Fiscal Year Ended December 31,
(1)
|
||||||||||||||
|
(in thousands, except per share amounts)
|
2017
|
2016
|
2015
|
2014
|
2013
|
||||||||||
|
Operations:
|
|
|
|
|
|
|
|
||||||||
|
Net sales
|
$
|
912,380
|
|
$
|
844,748
|
|
$
|
879,577
|
|
$
|
839,055
|
|
$
|
682,090
|
|
|
Income before income taxes
|
82,367
|
|
62,189
|
|
66,867
|
|
60,605
|
|
51,388
|
|
|||||
|
Net income
|
44,315
|
|
40,045
|
|
43,209
|
|
41,151
|
|
36,094
|
|
|||||
|
Percent of sales
|
4.9
|
%
|
4.7
|
%
|
4.9
|
%
|
4.9
|
%
|
5.3
|
%
|
|||||
|
Earnings per share
|
|
|
|
|
|
|
|
|
|||||||
|
Basic
|
3.84
|
|
3.50
|
|
3.81
|
|
3.47
|
|
3.00
|
|
|||||
|
Diluted
|
3.79
|
|
3.46
|
|
3.76
|
|
3.42
|
|
2.96
|
|
|||||
|
Dividends per share
|
0.40
|
|
0.36
|
|
0.32
|
|
0.28
|
|
0.28
|
|
|||||
|
Average common shares
|
|
|
|
|
|
|
|
|
|||||||
|
Basic
|
11,549
|
|
11,434
|
|
11,349
|
|
11,875
|
|
12,050
|
|
|||||
|
Diluted
|
11,682
|
|
11,565
|
|
11,482
|
|
12,039
|
|
12,212
|
|
|||||
|
Financial Position:
|
|
|
|
|
|||||||||||
|
Total assets
|
$
|
639,671
|
|
$
|
552,776
|
|
$
|
603,503
|
|
$
|
632,886
|
|
$
|
438,476
|
|
|
Short-term debt and current maturities
|
82
|
|
73
|
|
77
|
|
551
|
|
420
|
|
|||||
|
Long-term debt, excluding current maturities
|
60,000
|
|
70,017
|
|
144,006
|
|
190,024
|
|
8
|
|
|||||
|
Stockholders’ equity
|
$
|
449,108
|
|
$
|
387,717
|
|
$
|
360,469
|
|
$
|
337,670
|
|
$
|
350,465
|
|
(1)
Includes the results of operations of companies acquired from the closing dates of acquisitions.
27
and Results of Operations
Outlook
This report contains forward-looking statements that are based on Alamo Group’s current expectations. Actual results in future periods may differ materially from those expressed or implied because of a number of risks and uncertainties which are discussed below and in the Forward-Looking Information section beginning on page 11.
In 2017 we experienced several market factors that helped drive positive results in our business including, among other things, strengthening agricultural markets, improving non-governmental sales and rentals of vacuum truck equipment, a strengthening European market and a softening U.S. dollar. While the Company believes that these market forces are showing some signs of stability for 2018, we remain cautious in terms of our outlook since market conditions can and do change regularly. As a result of overall improving market conditions our backlog substantially increased during the course of 2017 and, as of December 31, 2017, was in excess of $218 million. While this level of backlog is encouraging, the potential effect this level of demand will have on our production lead times has given us some cause for concern. As a response to this concern, in 2018 we are increasing our focus on ongoing operational improvement initiatives and will likely increase our capital expenditure levels above the average capital expenditure levels of the past several years. We also expect that inflation pressures may be more of a negative factor in 2018 as labor availability tightens and some commodity prices, such as the price of steel, increase. We may also be negatively affected by several other unanticipated factors such as a weakness in the overall economy; significant changes in currency exchange rates; changes in trade policy, increased levels of government regulations; weakness in the agricultural sector; acquisition integration issues; budget constraints or revenue shortfalls in governmental entities; and other risks and uncertainties as described in “Risk Factors.”
The following discussion should be read in conjunction with the consolidated financial statements of the Company and the notes thereto included elsewhere in this Annual Report on Form 10-K.
The following tables set forth, for the periods indicated, certain financial data:
|
|
Fiscal Year Ended December 31,
|
|||||||||||
|
Net sales (data in thousands):
|
2017
|
2016
|
2015
|
|||||||||
|
Industrial
|
$
|
522,706
|
|
$
|
484,088
|
|
$
|
498,761
|
|
|||
|
Agricultural
|
227,389
|
|
205,834
|
|
208,257
|
|
||||||
|
European
|
162,285
|
|
154,826
|
|
172,559
|
|
||||||
|
Total net sales
|
$
|
912,380
|
|
$
|
844,748
|
|
$
|
879,577
|
|
|||
|
Cost and profit margins, as percentages of net sales:
|
|
|
|
|||||||||
|
Cost of sales
|
74.3
|
%
|
75.7
|
%
|
77.0
|
%
|
||||||
|
Gross profit
|
25.7
|
%
|
24.3
|
%
|
23.0
|
%
|
||||||
|
Selling, general and administrative expenses
|
16.0
|
%
|
16.3
|
%
|
15.5
|
%
|
||||||
|
Income from operations
|
9.7
|
%
|
8.0
|
%
|
7.6
|
%
|
||||||
|
Income before income taxes
|
9.0
|
%
|
7.4
|
%
|
7.6
|
%
|
||||||
|
Net income
|
4.9
|
%
|
4.7
|
%
|
4.9
|
%
|
||||||
Results of Operations
Fiscal
2017
compared to Fiscal
2016
The Company’s net sales in the fiscal year ended
December 31, 2017
(“
2017
”) were $
912,380,000
, an increase of $
67,632,000
or
8.0%
compared to $
844,748,000
for the fiscal year ended
December 31, 2016
(“
2016
”). The increase was mainly attributable to the increased demand for our products in all three of the Company's Divisions.
28
Also contributing to the increase in sales were the acquisitions of
Santa Izabel
,
ODB
and
RPM
in the amount of $25,488,000.
Net Industrial sales were $
522,706,000
in
2017
compared to $
484,088,000
in
2016
, an increase of $
38,618,000
or
8.0%
. The increase primarily came from higher sales of mowing equipment, sweepers, excavators and vacuum trucks. Also contributing to the increase were the acquisitions of
ODB
and
RPM
which together added $19,759,000. These increases were offset by lower sales of snow removal products due to mild weather conditions during the early part of 2017.
Net Agricultural sales were $
227,389,000
in
2017
compared to $
205,834,000
in
2016
, representing an increase of $
21,555,000
or
10.5%
. The increase resulted from higher demand for our products despite some continued softness in the overall agricultural market. Also contributing to the increase was the acquisition of
Santa Izabel
in the amount of $5,729,000.
Net European sales increased $
7,459,000
or
4.8%
to $
162,285,000
in
2017
compared to $
154,826,000
in
2016
. The increase was primarily due to improved sales in the U.K. and French agricultural markets as well as increased sales from
Rivard
vacuum trucks. Negatively affecting European sales in 2017 were currency translation rates.
Gross profit for
2017
was $
234,693,000
(
25.7%
of net sales) compared to $
205,099,000
(
24.3%
of net sales) in
2016
, an increase of $
29,594,000
. The increase in gross profit for 2017 came from higher equipment and part sales in all three of the Company's divisions and, to a lesser extent, the acquisitions of
Santa Izabel
,
ODB
and
RPM
. The increased higher margin percentage for 2017 came from productivity improvements, pricing actions, and purchasing initiatives.
Selling, general and administrative expenses (“SG&A”) were
$145,955,000
(
16.0%
of net sales) in
2017
compared to
$137,479,000
(
16.3%
of net sales) in
2016
, an increase of $8,476,000. The increase in SG&A was primarily the result of the acquisitions of
Santa Izabel
,
ODB
and
RPM
in the amount of $4,491,000 and to a lesser extent higher commissions and other selling expenses due to increased sales as well as transactional costs relating to the acquisitions.
Interest expense for
2017
was $
4,839,000
compared to $
5,914,000
in
2016
, a decrease of $
1,075,000
or
18.2%
.The decrease in expense in
2017
came from lower debt levels despite a marginal increase in interest rates during 2017.
Other income (expense), net was expense of $
1,868,000
during
2017
compared to income of $
269,000
in
2016
. The expense in
2017
and the income in
2016
were primarily the result of changes in exchange rates.
Provision for income taxes was $
38,052,000
(
46.2%
of income before income taxes) for
2017
compared to $
22,144,000
(
35.6%
of income before income taxes) in
2016
. The increases in both income taxes and the effective tax rate were primarily due to a $10,236,000 tax expense in 2017 resulting from the implementation of the provisions under the TCJA signed into law on December 22, 2017. The effective rate for 2017, excluding the impact of the $10,236,000 expense related to TCJA, was 33.8%.
See
Note12
of the consolidated financial statements for additional information about the TCJA and $10,236,000 expense recorded by the Company.
Net income for
2017
was $
44,315,000
compared to $
40,045,000
in
2016
, due to the factors described above.
Fiscal 2016 compared to Fiscal 2015
The Company’s net sales in the fiscal year ended December 31, 2016 (“2016”) were $844,748,000, a decrease of $34,829,000 or 4.0% compared to $879,577,000 for the fiscal year ended December 31, 2015 (“2015”). The Industrial Division was down 2.9% which was affected by soft market conditions, mainly from lower sales of vacuum trucks specifically to non-governmental end users. Sales of excavators, sweepers, mowing equipment and to a lesser extent, snow removal products were up in 2016 compared to 2015. Agricultural Division sales were down 1.2% for 2016 due to a continued weak agricultural market compared to the same period in 2015. Sales in the European Division were down 10.3% as sales of products manufactured in the U.K. were negatively affected by soft
29
market conditions and currency translation rates which the Company believed was due, in part, to the uncertainty created by the recent Brexit vote in the U.K.
Net Industrial sales were $484,088,000 in 2016 compared to $498,761,000 in 2015, a decrease of $14,673,000 or 2.9%. The decrease came from lower vacuum trucks sales to non-governmental end users. Increased sales from sweeper, excavator, mowing equipment and snow removal equipment product lines were not enough to offset the decline in sales of vacuum truck products.
Net Agricultural sales were $205,834,000 in 2016 compared to $208,257,000 in 2015, representing a decrease of $2,423,000 or 1.2%. The decrease in sales for 2016 compared to 2015 was from the continued softness in the overall agricultural market.
Net European sales decreased $17,733,000 or 10.3% to $154,826,000 in 2016 compared to $172,559,000 in 2015. The decrease in 2016 was primarily due to the negative effect on sales from changes in currency translation rates. The European Division continued to be faced with challenging market conditions in the U.K. Rivard vacuum equipment and the French agricultural products had increased sales in 2016 compared to 2015 from improvements in operational execution.
Gross margins for 2016 were $205,099,000 (24.3% of net sales) compared to $202,448,000 (23.0% of net sales) in 2015, an increase of $2,651,000. Despite lower sales volume, the gross profit increase was due to continuous improvement in production efficiencies as well as lower material costs. Negatively affecting both the gross profit and margin percent during 2015 was $2,740,000 in higher cost of goods sold related to the initial step-up in fair value of inventory in the
Specialized
business divisions acquired in 2014.
Selling, general and administrative expenses (“SG&A”) were $137,479,000 (16.3% of net sales) in 2016 compared to $135,920,000 (15.5% of net sales) in 2015. The increase in SG&A was primarily the result of a $2,889,000 in pension expense related to cumulative actuarial losses related to the closure of the Gradall Hourly Employees' Savings and Investment Plan that had been previously deferred in Other comprehensive income and Deferred taxes.
Interest expense for 2016 was $5,914,000 compared to $6,724,000 in 2015, a decrease of $810,000 or 12.0%.The decrease in 2016 came from the Company's reduction in borrowings which resulted in lower interest costs.
Other income (expense), net was income of $269,000 during 2016 compared to income of $6,874,000 in 2015. The income in 2016 was primarily the result of changes in exchange rates. The income in 2015 was primarily from the gain on the sale of excess land in the U.K. in the amount of $3,796,000 and changes in exchange rates.
Provision for income taxes was $22,144,000 (35.6% of income before income taxes) for 2016 compared to $23,658,000 (35.4% of income before income taxes) in 2015.
Net income for 2016 was $40,045,000 compared to $43,209,000 in 2015 due to the factors described above.
Liquidity and Capital Resources
In addition to normal operating expenses, the Company has ongoing cash requirements which are necessary to conduct the Company’s business, including inventory purchases and capital expenditures. The Company’s inventory and accounts payable levels, particularly in its Agricultural Division, build in the first quarter and early spring and, to a lesser extent, in the fourth quarter in anticipation of the spring and fall selling seasons. Accounts receivable historically build in the first and fourth quarters of each year as a result of pre-season sales and year round sales programs. These sales, primarily in the Agricultural Division, help balance the Company’s production during the first and fourth quarters.
As of
December 31, 2017
, the Company had working capital of $
291,164,000
, which represents an increase of $
42,246,000
from working capital of $
248,918,000
as of
December 31, 2016
. The increase in working capital was primarily due to sales growth and to a lesser extent the acquisitions of
Santa Izabel
,
ODB
and
RPM
.
30
Capital expenditures were $
13,490,000
for
2017
, compared to $
9,711,000
for
2016
which included the purchase of the land and buildings at the Company's
Wausau
facility in the amount of $4,745,000. The Company expects to fund capital expenditures from operating cash flows or through its revolving credit facility, described below.
In conjunction with our implementation of the provisions of TCJA, and as more fully described in
Note 12
to the consolidated financial statements, we recorded a liability in 2017 for the estimated U.S. federal tax due on the deemed repatriation of the accumulated earnings and profits of our international subsidiaries not previously distributed. We will pay this liability over the eight-year period permitted by the TCJA provisions. The deemed repatriation of these accumulated earnings and profits are no longer subject to any U.S. federal income tax consequences associated with the repatriation of the Company's
$23,019,000
in cash and cash equivalents held by its foreign subsidiaries as of
December 31, 2017
. The majority of these funds are at our French and Canadian facilities.
As a result of the fundamental changes to the taxation of multinational corporations created by TCJA, we no longer intend to permanently reinvest all of the historical undistributed earnings of our foreign affiliates. While the Company intends to use some of these funds for working capital and capital expenditures outside the U.S., recent changes in the U.S. tax laws have substantially mitigated the cost of repatriation. Consequently, the Company now intends to repatriate foreign cash and cash equivalents in excess of amounts needed to fund foreign operating and investing activities. Repatriated funds will initially be used to reduce funded debt levels under the Company's current credit facility and subsequently used to fund working capital, capital investments and acquisitions company-wide.
Net cash provided by operating activities was $
70,804,000
for
2017
, compared to $
75,784,000
for
2016
. The decrease of cash from operating activities came primarily from changes in working capital due to sales growth in all three Divisions
.
Net cash used in investing activities was
$51,276,000
for
2017
, compared to
$8,656,000
for
2016
. The increase in cash used in investing activities was primarily due to the acquisitions of
Santa Izabel
,
ODB
and
RPM
.
Net cash used by financing activities was $
12,400,000
for
2017
, compared to net cash used of $
77,347,000
for
2016
. The decrease in cash used in financing activities was due to significant reductions of outstanding indebtedness under the Company's revolving credit facility during 2016.
The Company maintains an unsecured revolving credit facility with certain lenders under its Amended and Restated Revolving Credit Agreement ("Agreement"). The aggregate commitments from lenders under this Agreement are
$250,000,000
and, subject to certain conditions, the Company has the option to request an increase in aggregate commitments of up to an additional
$50,000,000
. The Agreement requires us to maintain various financial covenants including a minimum earnings before interest and tax to interest expense ratio, a maximum leverage ratio and a minimum asset coverage ratio. The Agreement also contains various covenants relating to limitations on indebtedness, limitations on investments and acquisitions, limitations on sale of properties, and limitations on liens and capital expenditures. The Agreement also contains other customary covenants, representations and events of defaults. Effective December 20, 2016, the Company amended its revolving credit facility to extend the termination date, reduce LIBOR interest margin and to modify certain financial and other covenants in order to meet the ongoing needs of the Company's business and to allow for greater flexibility in relation to future acquisitions. The expiration date of the revolving credit facility is
December 20, 2021
. As of
December 31, 2017
,
$60,000,000
was outstanding under the Agreement. On
December 31, 2017
,
$1,655,000
of the revolver capacity was committed to irrevocable standby letters of credit issued in the ordinary course of business as required by vendors' contracts resulting in
$188,345,000
in available borrowings. As of
December 31, 2017
, the Company was in compliance with the terms and conditions of the Agreement.
Management believes the revolving credit facility and the Company’s ability to internally generate funds from operations should be sufficient to meet the Company’s cash requirements for the foreseeable future. However, challenges affecting the banking industry and credit markets in general can potentially cause changes to credit availability, which creates a level of uncertainty.
Inflation
The Company believes that inflation generally has not had a material impact on its operations or liquidity. The Company is exposed to the risk that the price of energy, steel and other purchased components may increase and
31
the Company may not be able to increase the price of its products correspondingly. If this occurs, the Company’s results of operations would be adversely impacted.
Accounting Pronouncements Not Yet Adopted
In May 2014, the Financial Accounting Standards Board ("FASB") issued Accounting Standards Update (“ASU”) No. 2014-09, “Revenue from Contracts with Customers” (Topic 606), which supersedes the revenue recognition requirements in Accounting Standards Codification ("ASC") Topic 605, “Revenue Recognition,” and most industry-specific guidance and clarifies the principles for recognizing revenue. This ASU is based on the principle that revenue is recognized to depict the transfer of goods or services to customers in an amount that reflects the consideration to which the entity expects to be entitled in exchange for those goods or services. The ASU also requires additional disclosure about the nature, amount, timing and uncertainty of revenue and cash flows arising from customer contracts, including significant judgments and changes in judgments, and assets recognized from costs incurred to obtain or fulfill a contract.
This new standard is effective for annual reporting periods beginning after December 15, 2017, including interim reporting periods within those annual periods. We have completed our evaluation of the provisions of this standard and concluded that our adoption will not change the amount or timing of revenue recognized by us, nor will it affect our financial position. Revenue from contracts with customers are recognized at the point we satisfy our performance obligation. Revenue is measured as the amount of consideration we expect to receive in exchange for providing the service.
We will adopt this new standard effective January 1, 2018 using the modified retrospective method of adoption as permitted by the standard. Under this method, the cumulative effect of initially applying the standard is recognized as an adjustment to the opening balance of stockholders’ equity, and revenues reported in the periods prior to the date of adoption are not changed. We will not, however, make such an adjustment to stockholder’s’ equity as result of our evaluation. The adoption of Topic 606 will not have a material impact on our financial position, results of operations, stockholders’ equity or cash flows.
In February 2016, the FASB issued ASU No. 2016-02, “Leases.” This update requires that a lessee recognize in the statement of financial position a liability to make lease payments and a right-of-use asset representing its right to use the underlying asset for the lease term. For leases with a term of 12 months or less, a lessee is permitted to make an accounting policy election by class of underlying asset not to recognize lease assets and lease liabilities. Similar to current guidance, the update continues to differentiate between finance leases and operating leases, however this distinction now primarily relates to differences in the manner of expense recognition over time and in the classification of lease payments in the statement of cash flows. The updated guidance leaves the accounting for leases by lessors largely unchanged from existing GAAP. Entities are required to use a modified retrospective adoption, with certain relief provisions, for leases that exist or are entered into after the beginning of the earliest comparative period in the financial statements when adopted. The guidance will become effective for us on January 1, 2019. The impacts that adoption of the ASU is expected to have on our consolidated financial statements and related disclosures are being evaluated. Additionally, we have not yet determined the effect of the ASU on our internal control over financial reporting or other changes in business practices and processes.
In June 2016, the FASB issued ASU No. 2016-13, “Financial Instruments - Credit Losses,” to improve information on credit losses for financial instruments. The ASU replaces the current incurred loss impairment methodology with a methodology that reflects expected credit losses. The ASU is effective for the Company for fiscal years beginning after December 15, 2019, including interim periods within those fiscal years. Early adoption is permitted beginning in fiscal years beginning after December 18, 2018. The Company has not yet evaluated the effect the adoption of this ASU will have on its consolidated financial statements.
In March 2017, the FASB issued ASU 2017-07 “Improving the Presentation of Net Periodic Pension Cost and Net Periodic Post-retirement Benefit Cost” to provide income statement classification guidance for components of the net benefit cost. The ASU requires entities to disaggregate the current-service-cost component from the other components of net benefit cost (the “other components”) and present it with other current compensation costs for related employees in the income statement. Furthermore, entities should present the other components elsewhere in the income statement and outside of income from operations if such a subtotal is presented. The ASU is to be adopted retrospectively and is effective for the Company for fiscal years beginning after December 15, 2017, including interim periods within those fiscal years and may be early adopted. The Company expects that adoption will result in a reclassification of the non-service components of pension and post-retirement costs, primarily from
32
cost of sales and selling, general and administrative expenses to other income (loss) on the consolidated statements of income. The Company’s pensions, including net periodic cost, is disclosed in
Note 15
.
In February 2018, the FASB issued ASU 2018-02, “Reclassification of Certain Tax Effects from Accumulated Other Comprehensive Income,” to allow reclassification from accumulated other comprehensive income to retained earnings for stranded tax effects resulting from the Tax Cuts and Jobs Act. Upon adoption of the ASU, entities will be required to disclose a description of the accounting policy for releasing income tax effects from accumulated other comprehensive income. The standard is required to be adopted for periods beginning after December 15, 2018, with early adoption available for any set of financial statements that have yet to be issued or made available for issuance including retrospectively for any period in which the effect of the change is the U.S. corporate income tax rate in the TCJA is recognized.
Off-Balance Sheet Arrangements
There are currently no off-balance sheet arrangements that have or are currently likely to have a current or future material effect on our financial condition.
Contractual and Other Obligations
The following table shows the Company’s approximate obligations and commitments to make future payments under contractual obligations as of
December 31, 2017
:
|
|
Payment due by period
|
|||||||||||||||||||
|
(in thousands)
|
|
Less than
|
1-3
|
3-5
|
More than
|
|||||||||||||||
|
Contractual Obligations
|
Total
|
1 Year
|
Years
|
Years
|
5 Years
|
|||||||||||||||
|
Long-term debt obligations
|
$
|
60,082
|
|
$
|
82
|
|
$
|
—
|
|
$
|
60,000
|
|
$
|
—
|
|
|||||
|
Interest obligations
|
7,048
|
|
1,778
|
|
3,552
|
|
1,718
|
|
—
|
|
||||||||||
|
Operating lease obligations
|
9,144
|
|
3,899
|
|
4,289
|
|
901
|
|
55
|
|
||||||||||
|
Purchase obligations
|
100,468
|
|
100,468
|
|
—
|
|
—
|
|
—
|
|
||||||||||
|
Total
|
$
|
176,742
|
|
$
|
106,227
|
|
$
|
7,841
|
|
$
|
62,619
|
|
$
|
55
|
|
|||||
Definitions:
|
(A)
|
Long-term debt obligation
means a principal payment obligation under long-term borrowings.
|
|
(B)
|
Interest obligation
represents interest due on long-term debt and capital lease obligations. Interest on long-term debt assumes all floating rates of interest remain the same as those in effect at
December 31, 2017
.
|
|
(C)
|
Operating lease obligation
means a payment obligation under a lease classified as an operating lease.
|
|
(D)
|
Purchase obligation
means an agreement to purchase goods or services that is enforceable and legally binding on the registrant that specifies all significant terms, including: fixed or minimum quantities to be purchased; fixed, minimum or variable price provisions; and the approximate timing of the transactions.
|
Critical Accounting Estimates
Management’s Discussion and Analysis of Financial Condition and Results of Operations are based upon our Consolidated Financial Statements, which have been prepared in accordance with U.S. Generally Accepted Accounting Principles (“GAAP”). The preparation of these financial statements requires management to make estimates and assumptions that affect the reported amounts of assets, liabilities, revenue and expenses, and related disclosure of contingent assets and liabilities. Management bases its estimates on historical experience and on various other assumptions that are believed to be reasonable under the circumstances, the results of which form the basis for making judgments about the carrying values of assets and liabilities that are not readily apparent from other sources. Actual results may differ from these estimates under different assumptions or conditions.
Critical Accounting Policies
An accounting policy is deemed to be critical if it requires an accounting estimate to be made based on assumptions about matters that are highly uncertain at the time the estimate is made, and if different estimates that reasonably could have been used, or changes in the accounting estimates that are reasonably likely to occur periodically, could materially impact the financial statements. Management believes the following critical accounting policies reflect its more significant estimates and assumptions used in the preparation of the Consolidated Financial
33
Statements. For further information on the critical accounting policies, see
Note 1
of our Notes to Consolidated Financial Statements.
Business Combinations
Business acquisitions are accounted for by the acquisition method of accounting. Under this method, the purchase price is allocated to the assets acquired and the liabilities assumed based on the fair value at the time of the acquisition. Any excess purchase price over the fair value of identifiable assets acquired and liabilities assumed is recorded as goodwill. We believe the fair values assigned to the assets acquired and liabilities assumed are based on reasonable assumptions; however, these assumptions may be incomplete or inaccurate, and unanticipated events and circumstances may occur.
Tangible assets are typically valued using a replacement or reproduction cost approach, considering factors such as current prices of the same or similar equipment, the age of the equipment, and economic obsolescence. In making other assumptions on valuation and useful lives, we considered the unique nature of the acquisition and we utilized a third-party valuation firm to assist us in the valuation of the acquired intangibles and the resulting allocation of purchase price for the acquisition.
Sales Discounts
On
December 31, 2017
, the Company had $
15,652,000
in reserves for sales discounts compared to $
13,488,000
on
December 31, 2016
on product shipped to our customers under various promotional programs. The Company reviews the reserve quarterly based on analysis made on each program outstanding at the time.
The Company bases its reserves on historical data relating to discounts taken by the customer under each program. Historically, between 85% and 95% of the Company’s customers who qualify for each program actually take the discount that is available.
Inventories – Obsolete and Slow Moving
The Company had a reserve of $
6,932,000
on
December 31, 2017
and $
7,262,000
on
December 31, 2016
to cover obsolete and slow moving inventory. The decrease in the reserve was primarily attributable to reductions of obsolete inventory in the Company's Industrial Division. The obsolete and slow moving inventory policy states that the reserve is to be calculated as follows: 1) no inventory usage over a three-year period is deemed obsolete and reserved at 100 percent; and 2) slow moving inventory with little usage requires a 100 percent reserve on items that have a quantity greater than a three-year supply. There are exceptions to the obsolete and slow moving classifications if approved by an officer of the Company, based on specific identification of an item or items that are deemed to be either included or excluded from this classification. In cases where there is no historical data, management makes a judgment based on a specific review of the inventory in question to determine what reserves, if any, are appropriate. New products or parts are generally excluded from the reserve policy until a three-year history has been established.
The reserve is reviewed and, if necessary, adjustments are made on a quarterly basis. The Company relies on historical information when available to support its reserve. The Company does not adjust the reserve balance until the inventory is liquidated.
Warranty
The Company’s warranty policy is generally to provide its customers warranty for up to one year on all wholegood divisions and 90 days on parts, though some components can have warranty for longer terms.
Warranty reserve, as a percentage of sales, is generally calculated by looking at the current twelve months’ expenses and prorating that amount based on twelve months’ sales with a ninety-day to six-month lag period. The Company’s historical experience is that an end-user takes approximately 90 days to six months from the receipt of the division to file a warranty claim. A warranty reserve is established for each different marketing group. Reserve balances are evaluated on a quarterly basis and adjustments made when required.
34
The current liability warranty reserve balance was $
5,335,000
on
December 31, 2017
and $
5,262,000
on
December 31, 2016
.
Goodwill Impairment
Goodwill represents the excess of the purchase price of acquired businesses over the estimated fair value of the identifiable net assets acquired. Goodwill is not amortized but is tested at least annually for impairment at the reporting unit level. Definite-lived intangible assets are also tested for impairment at the reporting unit level whenever events or circumstances make it likely that an impairment may have occurred. Reporting units are operating segments or components of operating segments for which discrete financial information is available. To evaluate goodwill, the fair value of each reporting unit is compared to its carrying value. Where the carrying value is greater than the fair value, the implied fair value of the reporting unit goodwill is determined by allocating the fair value of the reporting unit to all the assets and liabilities of the reporting unit with any remainder being allocated to goodwill. The implied fair value of the reporting unit goodwill is then compared to the carrying value of that goodwill to determine whether an impairment loss exists. Any impairment loss is recognized in earnings.
We typically measure the fair value of each reporting unit using a discounted cash flow analysis (income approach) based on assumptions that market participants would apply. Because the business is assumed to continue in perpetuity, the discounted cash flows include a terminal value. Cash flows to perpetuity are forecast based on projected revenue growth and our planned business strategies in future periods. Examples of planned strategies would include a plant or line expansion at an existing facility; a reduction of working capital at a specific location; and price increases or cost reductions within a reporting unit. The discount rate is based on a reporting unit’s targeted weighted-average cost of capital, which is not necessarily the same as our weighted-average cost of capital.
We perform our annual test for goodwill impairment in the fourth quarter of each fiscal year. In 2017 a qualitative testing was performed and the Company determined there was no goodwill impairment related to our reporting units. During
2016
and
2015
, we determined that none of the goodwill associated with our reporting units were impaired in any of those years which was based on the quantitative testing. These reporting units would be most likely affected by changes in the Company’s assumptions and estimates. The calculation of fair value could increase or decrease depending on changes in the inputs and assumptions used, such as changes in the reporting unit’s future growth rates, discount rates, etc.
These assumptions and projections underlying the fair value estimates are subject to change and are impacted by our ability to achieve our forecasts and by economic conditions that may impact future results and result in projections not being attained. A change in any of these estimates and assumptions could produce a different fair value, which could have a material impact on our results of operations. Each year we re-evaluate the assumptions used to reflect changes in the business environment.
Tax Matters
Due to the significant and complex changes to the Code from Tax Reform, including the
need for regulatory guidance from the IRS to properly account for many of the changes, we recorded income
taxes for items where reasonable estimates could be made and we applied the Code on a pre-Tax Reform
basis for items where reasonable estimates could not be made, as permitted by Staff Accounting Bulletin
No. 118, Income Tax Accounting Implications of the Tax Cuts and Jobs Act, issued by the SEC. As a result,
we will record the effect in 2018 for items where we were unable to make a reasonable estimate in 2017,
and we may revise estimates that we recorded in 2017. These amounts could be material. See
Note 12
of
Notes to Consolidated Financial Statements for a further discussion of our tax liabilities and the impact from
Tax Reform on those liabilities.
35
The Company is exposed to various financial market risks. Market risk is the potential loss arising from adverse changes in market prices and rates. The Company does not enter into derivative or other financial instruments for trading or speculative purposes.
Foreign Currency Risk
International Sales
A portion of the Company’s operations consists of manufacturing and sales activities in international jurisdictions. The Company manufactures its products primarily in the United States, the U.K., France, Canada, Brazil and Australia. The Company sells its products primarily within the markets where the products are produced, but certain of the Company’s sales from its U.K. and Canadian operations are denominated in other currencies. As a result, the Company’s financials, specifically the value of its foreign assets, could be affected by factors such as changes in foreign currency exchange rates in the U.K. and Canada or weak economic conditions in the other markets in which the subsidiaries of the Company distribute their products.
To mitigate the short-term effect of changes in currency exchange rates on the Company’s functional currency-based sales, the Company’s U.K. and Canadian subsidiaries regularly enter into foreign exchange contracts for over 90% of their future net foreign currency cash receipts over a period of six months. As of
December 31, 2017
, the Company had a notional amount of $
1,142,000
in outstanding forward exchange contracts related to accounts receivable. A 15% fluctuation in exchange rates for these currencies would change the fair value by approximately $
171,000
. However, since these contracts offset foreign currency denominated transactions, any change in the fair value of the contracts should be offset by changes in the underlying value of the transaction.
Exposure to Exchange Rates
The Company’s earnings are affected by fluctuations in the value of the U.S. dollar as compared to foreign currencies, predominantly in European countries and Canada and, to a lesser extent, Australia and Brazil, as a result of the sale of its products in international markets. Foreign currency forward exchange contracts in the U.K. are used to offset the earnings effects of such fluctuations. On
December 31, 2017
, the result of a uniform 10% strengthening in the value of the U.S. dollar relative to the currencies in which the Company’s sales are denominated would have been a decrease in gross profit of $
6,564,000
. Comparatively, on
December 31, 2016
, the result of a uniform 10% strengthening in the value of the dollar relative to the currencies in which the Company’s sales are denominated would have been a decrease in gross profit of approximately $
5,755,000
. This calculation assumes that each exchange rate would change in the same direction relative to the U.S. dollar. In addition to the direct effects of changes in exchange rates, which are a changed dollar value of the resulting sales, changes in exchange rates may also affect the volume of sales or the foreign currency sales price as competitors’ products become more or less attractive. The Company’s sensitivity analysis of the effects of changes in foreign currency exchange rates does not factor in a potential change in sales levels or local currency prices. The translation adjustment during
2017
was a gain of
$16,966,000
. On
December 31, 2017
, the British pound closed at
0.7400
relative to the U.S. dollar, and the Euro closed at
0.8331
relative to the U.S. dollar. By comparison, on
December 31, 2016
, the British pound closed at
0.8100
relative to the U.S. dollar, and the Euro closed at
0.9506
relative to the U.S. dollar. No assurance can be given as to future valuation of the British pound or Euro or how further movements in those or other currencies could affect future earnings or the financial position of the Company.
Interest Rate Risk
The majority of the Company’s long-term debt bears interest at variable rates. Accordingly, the Company’s net income is affected by changes in interest rates. Assuming the average level of borrowings at variable rates and a two hundred basis point change in the
2017
average interest rate under these borrowings, the Company’s
2017
interest expense would have changed by approximately $
2,535,000
. In the event of an adverse change in interest rates, management could take actions to mitigate its exposure. Further, this analysis does not consider the effects of the change in the level of overall economic activity that could exist in such an environment. However, challenges affecting the banking industry and credit markets in general can potentially cause changes to credit availability and cost of borrowing, which creates a level of uncertainty.
36
The financial statements and supplementary data described in
Item 15
of this report and included on pages
48
through 81 of this report are incorporated herein by reference.
None.
Disclosure Controls and Procedures
. An evaluation was carried out, under the supervision and with the participation of the Company's management, including our President and Chief Executive Officer, Executive Vice President and Chief Financial Officer (Principal Financial Officer), and Vice President and Corporate Controller (Principal Accounting Officer), of the effectiveness of the design and operation of our disclosure controls and procedures (as defined in Rule 13a-15(e) under the Securities Exchange Act of 1934). Based upon the evaluation, the President & Chief Executive Officer, Executive Vice President & Chief Financial Officer (Principal Financial Officer), and Vice President & Corporate Controller (Principal Accounting Officer) concluded that the Company’s disclosure controls and procedures were effective at the end of the period covered by this report.
Management’s Annual Report on Internal Control over Financial Reporting
. Management’s report on the Company’s internal control over financial reporting is included on page
45
of this Annual Report on Form 10-K and incorporated by reference herein. The Company’s independent registered public accounting firm has audited and issued a report on the Company’s internal control over financial reporting which is included on page
46
of this Annual Report on Form 10-K and incorporated by reference herein.
Changes in Internal Controls over Financial Reporting.
There have not been any changes in the Company's internal control over financial reporting (as such term is defined by paragraph (d) of Rule 13a-15 under the Securities Exchange Act) during the fourth fiscal quarter that have materially affected, or are reasonably likely to materially affect, the Company's internal control over financial reporting.
2018 Amended and Restated Executive Incentive Plan
The Amended and Restated Alamo Group Inc. Executive Incentive Plan (the “Plan”) under which executive officers and other employees will be eligible to receive annual cash incentive awards based on the achievement of objective and subjective performance goals for performance periods commencing on or after January 1, 2018 was approved by the Board of Directors on March 1, 2018. The Plan is similar to the Executive Incentive Plan approved by the Board of Directors on March 7, 2013 and approved by the stockholders of the Company at the Company’s 2013 annual meeting of shareholders, but it has been modified as a result of recent changes in U.S. federal tax law.
The purpose of the Plan is to retain and motivate officers and other employees of the Company who are designated by the Company to participate in the Plan for a specified performance period commencing on or after January 1, 2018 (a “Performance Period”) by providing such designated officers and employees with the opportunity to earn incentive payments based upon the extent to which specified performance goals have been achieved or exceeded for that Performance Period. The following is a brief summary of some of the material terms of the Plan:
All officers of the Company and its subsidiaries are eligible to be designated for participation in the Plan. The Compensation Committee will designate the eligible employees who will participate in the Plan for a specified Performance Period, and will do so not later than 90 days after the beginning of the Performance Period or, if earlier, the date on which 25% of the Performance Period has been completed (the “Applicable Period”). Under the Plan, payment awards to participating employees are subject to the attainment of specific performance goals and other terms and conditions established by the Compensation Committee for each Performance Period during the Applicable Period. A participant may receive an award under the Plan based upon the achievement of stated subjective performance measures or the achievement of stated performance goals using one or more objective corporate-wide or subsidiary, division, operating unit or individual measures. Objective performance goals shall be based on one or more of the following measures: earnings per share; adjusted earnings per share; earnings before
37
interest and taxes (“EBIT”); earnings before interest, taxes, depreciation and amortization (“EBITDA”); earnings as determined other than in accordance with generally accepted accounting principles (“GAAP”); stock price; price per share of common stock; market share; economic value; financial return ratios, consisting of return on invested capital, return on assets, debt to total capital, return on stockholders' equity, and return on sales; the ratio of EBIT to capital; the ratio of EBITDA to capital; net income; adjusted net income; operating income; revenues; profit margin; cash flow(s); expense reduction; working capital ratios; achievement of balance sheet or income statement objectives; inventory reductions; inventory turns; successful implementation of strategic initiatives; customer satisfaction measures; and successful integration of acquisitions. Each such goal may be expressed on an absolute or relative basis and may include comparisons based on current internal targets, the past performance of the Company (including the performance of one or more subsidiaries, divisions, or operating units) or the past or current performance of other companies (or a combination of such past and current performance). In the case of earnings-based measures, in addition to the ratios specifically enumerated above, performance goals may include comparisons relating to capital (including, but not limited to, the cost of capital). If the relevant performance goals are attained during the Performance Period, a participant will be eligible to receive a cash award.
Determination of the performance compensation awarded to each participant is to be made at a time determined by the Compensation Committee after the last day of each Performance Period. During the Applicable Period, the Compensation Committee will establish terms regarding the timing of the payment awards. The Compensation Committee may delegate its responsibilities under the Plan to our chief executive officer or such other executive officer of the Company as it deems appropriate, except that the Compensation Committee may not delegate its responsibilities with respect to the bonuses payable to “covered employees” as such term is defined under Section 162(m) of the Internal Revenue Code of 1986, as amended. The Board of Directors may terminate the Plan at any time.
There are incorporated in this Item 10, by reference, those portions of the Company’s definitive proxy statement for the
2018
Annual Meeting of Stockholders which appear therein under the captions “Proposal 1 - Election of Directors,” “Nominees for Election to the Board of Directors,” “Information Concerning Directors,” “Meetings and Committees of the Board,” “The Audit Committee,” “The Nominating/Corporate Governance Committee” and “Section 16(a) Beneficial Ownership Reporting Compliance.” See also the information under the caption “Executive Officers of the Company” in Part I of this Report.
The Board of Directors has delegated certain responsibilities to three Committees of the Board. The Committees are the Audit Committee, Compensation Committee and Nominating/Corporate Governance Committee. The Board of Directors has also adopted Corporate Governance guidelines and a Code of Business Conduct and Ethics for all employees, including the Chief Executive Officer, Principal Financial Officer, Principal Accounting Officer and those individuals performing similar functions.
The Committee Charters, Code of Business Conduct and Ethics, and Corporate Governance Guidelines may be found on the Company’s website
(www.alamo-group.com)
under the “Our Commitment” tab and are also available in printed form at no charge by sending a request to the Corporate Secretary, Alamo Group Inc., 1627 E. Walnut Street, Seguin, Texas 78155, which is the principal executive office of the Company. The telephone number is (830) 379-1480. The Company will post any amendments to the Code of Conduct and Ethics, and any waivers that are required to be disclosed by the rules of either the SEC or the New York Stock Exchange, on the Company’s website.
There are incorporated in this Item 11, by reference, those portions of the Company’s definitive proxy statement for the
2018
Annual Meeting of Stockholders which appear therein under the captions “Executive Compensation,” “The Compensation Committee,” “Compensation Discussion and Analysis,” "Compensation Committee Report” and “Director Compensation during
2017
.”
38
There is incorporated in this Item 12, by reference, that portion of the Company’s definitive proxy statement for the
2018
Annual Meeting of Stockholders which appears under the caption “Beneficial Ownership of Common Stock.”
Information on Alamo Group Inc.’s Equity Compensation Plans
The following table provides information on the shares that are available under the Company’s stock compensation plans and, in the case of plans where stock options may be granted, the number of shares of common stock issuable upon exercise of those stock options. The Company currently does not have an Equity Compensation Plan not approved by the Stockholders.
The numbers in the table are as of
December 31, 2017
, the last day of Alamo Group Inc.’s
2017
fiscal year.
|
|
A
|
B
|
C
|
|||
|
Equity Compensation
Plan Category
|
Number of Securities to be issued upon
exercise of outstanding
options, warrants and rights
|
Weighted-average exercise
price of outstanding
options, warrants and
rights
|
Number of Securities
that remain
available for future
issuance
under equity
compensation plans
(excluding securities
reflected in column A)
|
|||
|
Plans approved by stockholders
|
|
|
|
|||
|
First Amended and Restated 1999 Non-Qualified Stock Option Plan
|
8,000
|
$11.45
|
—
|
|||
|
2005 Incentive Stock Option Plan
|
122,075
|
$37.15
|
—
|
|||
|
2009 Equity Incentive Plan
|
122,052
|
$58.75
|
176,294
|
|||
|
2015 Incentive Stock Option Plan
|
50,800
|
$60.14
|
344,950
|
|||
|
Plans not approved by stockholders
|
—
|
—
|
—
|
|||
|
Total
|
302,927
|
|
521,244
|
|||
Information regarding certain relationships and related transactions is set forth under the caption “Certain Relationships and Related Transactions” in the Company’s definitive proxy statement for the
2018
Annual Meeting of Stockholders, and such information is incorporated by reference herein. There were no such reportable relationships or related party transactions in the fiscal year ended
December 31, 2017
.
Information regarding director independence is set forth under the caption “Information Concerning Directors” in the Company’s definitive proxy statement for the
2018
Annual Meeting of Stockholders, and such information is incorporated by reference herein.
Information regarding principal accountant fees and services is set forth under the caption “Proposal 3 – Ratification of Appointment of Independent Auditors” in the Company’s definitive proxy statement for the
2018
Annual Meeting of Stockholders, and such information is incorporated by reference herein.
39
Financial Statements
|
|
|
Page
|
|
|
|
|
|
|
||
|
|
||
|
|
||
|
|
||
|
|
||
|
|
||
|
|
||
Financial Statement Schedules
All schedules for which a provision is made in the applicable accounting regulation of the Securities and Exchange Commission are omitted because they are not required or because the required information is included in the consolidated financial statements or notes thereto.
None.
40
Exhibits
Exhibits – The following exhibits are incorporated by reference to the filing indicated or are included following the index to Exhibits.
INDEX TO EXHIBITS
|
|
|
|
|
Incorporated by Reference
|
|
|
|
|
|
|
From the Following
|
|
|
Exhibits
|
|
Exhibit Title
|
|
Documents
|
|
|
|
|
|
|
||
|
3.1
|
|
—
|
Certificate of Incorporation, as amended, of Alamo Group Inc.
|
|
Filed as Exhibit 3.1 to Form S-1, February 5, 1993
|
|
3.2
|
|
—
|
By-Laws of Alamo Group Inc. as amended
|
|
|
|
10.1
|
|
—
|
Form of indemnification agreements with Directors of Alamo Group Inc.
|
|
|
|
10.2
|
|
—
|
Form of indemnification agreements with certain executive officers of Alamo Group Inc.
|
|
|
|
*10.3
|
|
—
|
Incentive Compensation Plan, adopted on December 9, 1997
|
|
|
|
*10.4
|
|
—
|
401(k) Restoration Plan for Highly Compensated Employees, adopted on December 9, 1997
|
|
|
|
*10.5
|
|
—
|
Amended and Restated 1994 Incentive Stock Option Plan adopted by the Board of Directors on July 7, 1999
|
|
|
|
*10.6
|
|
—
|
First Amended and Restated 1999 Non-Qualified Stock Option Plan, adopted by the Board of Directors on February 13, 2001
|
|
|
|
*10.7
|
|
—
|
2005 Incentive Stock Option Plan, adopted by the Board of Directors on May 4, 2005
|
|
|
|
*10.8
|
|
—
|
2009 Equity Incentive Plan, adopted by the Board of Directors on May 7, 2009
|
|
|
|
10.9
|
|
—
|
Amended and Restated Revolving Credit Agreement, dated August 25, 2004, between the Company and Bank of America, N.A., JPMorgan Chase Bank and Guaranty Bank
|
|
|
|
10.10
|
|
—
|
Third Amendment of the Amended and Restated Revolving Credit Agreement, dated February 3, 2006 between the Company and Bank of America, N.A., Chase Manhattan Bank, and Guaranty Bank
|
|
|
|
10.11
|
|
—
|
Fourth Amendment of the Amended and Restated Revolving Credit Agreement, dated March 30, 2006, between the Company and Bank of America, N.A., JPMorgan Chase Bank and Guaranty Bank
|
|
|
|
10.12
|
|
—
|
Fifth Amendment of the Amended and Restated Revolving Credit Agreement, dated May 7, 2007, between the Company and Bank of America, N.A., JPMorgan Chase Bank, Guaranty Bank and Rabobank
|
|
|
|
10.13
|
|
—
|
Sixth Amendment of and Waiver under Amended and Restated Revolving Credit Agreement, dated October 14, 2008, between the Company and Bank of America, N.A., JPMorgan Chase Bank, Guaranty Bank and Rabobank
|
|
|
41
|
10.14
|
|
—
|
Seventh Amendment of the Amended and Restated Revolving Credit Agreement, dated November 6, 2009, between the Company and Bank of America, N.A., Wells Fargo Bank, N.A., BBVA Compass Bank, and Rabobank
|
|
|
|
10.15
|
|
—
|
Eighth Amendment of the Amended and Restated Revolving Credit Agreement, dated March 28, 2011, between the Company and Bank of America, N.A., Wells Fargo Bank, N.A., BBVA Compass Bank, and Rabobank
|
|
|
|
10.16
|
|
—
|
Ninth Amendment of the Amended and Restated Revolving Credit Agreement, dated May 12, 2014, between the Company and Bank of America, N.A., Wells Fargo Bank, N.A., BBVA Compass Bank, Rabobank, and Amegy Bank.
|
|
|
|
10.17
|
|
—
|
Tenth Amendment of the Amended and Restated Revolving Credit Agreement, dated December 20, 2016, between the Company and Bank of America, N.A., Wells Fargo Bank, N.A., BBVA Compass Bank, Rabobank, and Amegy Bank.
|
|
|
|
*10.18
|
|
—
|
Form of Restricted Stock Award Agreement under the 2009 Equity Incentive Plan
|
|
|
|
*10.19
|
|
—
|
Form of Restricted Stock Unit Award Agreement under the 2009 Equity Incentive Plan
|
|
|
|
*10.20
|
|
—
|
Form of Nonqualified Stock Option Agreement under the 2009 Equity Incentive Plan
|
|
|
|
*10.21
|
|
—
|
Form of Nonqualified Stock Option Agreement under the First Amended and Restated 1999 Nonqualified Stock Option Plan
|
|
|
|
*10.22
|
|
—
|
Form of Stock Option Agreement under the 2005 Stock Option Plan
|
|
|
|
10.23
|
|
—
|
Investor Rights Agreement, dated October 22, 2009, between Alamo Group Inc. and Bush Hog, LLC
|
|
|
|
*10.24
|
|
—
|
Supplemental Executive Retirement Plan
|
|
|
|
*10.25
|
|
—
|
Executive Incentive Plan
|
||
|
*10.26
|
|
—
|
Amended and Restated Executive Incentive Plan
|
||
|
*10.27
|
|
—
|
2015 Incentive Stock Option Plan, adopted by the Board of Directors on May 7, 2015
|
|
|
|
21.1
|
|
—
|
Subsidiaries of the Registrant
|
|
|
|
23.1
|
|
—
|
Consent of KPMG LLP
|
|
|
|
31.1
|
|
—
|
Certification by Ronald A. Robinson under Section 302 of the Sarbanes-Oxley Act of 2002
|
|
|
|
31.2
|
|
—
|
Certification by Dan E. Malone under Section 302 of the Sarbanes-Oxley Act of 2002
|
|
|
|
31.3
|
|
—
|
Certification by Richard J. Wehrle under Section 302 of the Sarbanes-Oxley Act of 2002
|
|
|
|
32.1
|
|
—
|
Certification by Ronald A. Robinson under Section 906 of the Sarbanes-Oxley Act of 2002
|
|
|
|
32.2
|
|
—
|
Certification by Dan E. Malone under Section 906 of the Sarbanes-Oxley Act of 2002
|
|
|
|
32.3
|
|
—
|
Certification by Richard J. Wehrle under Section 906 of the Sarbanes-Oxley Act of 2002
|
|
|
|
101.INS
|
|
—
|
XBRL Instance Document
|
|
Filed Herewith
|
|
101.SCH
|
|
—
|
XBRL Taxonomy Extension Schema Document
|
|
Filed Herewith
|
42
|
101.CAL
|
|
—
|
XBRL Taxonomy Extension Calculation Linkbase Document
|
|
Filed Herewith
|
|
101.LAB
|
|
—
|
XBRL Taxonomy Extension Label Linkbase Document
|
|
Filed Herewith
|
|
101.PRE
|
|
—
|
XBRL Taxonomy Extension Presentation Linkbase Document
|
|
Filed Herewith
|
|
101.DEF
|
|
—
|
XBRL Taxonomy Extension Definition Linkbase Document
|
|
Filed Herewith
|
________________________________________________________________________________________________________________________
*Compensatory Plan
43
SIGNATURES
Pursuant to the requirements of Section 13 or 15(d) of the Securities Exchange Act of 1934, the registrant has duly caused this report to be signed on its behalf by the undersigned, thereunto duly authorized.
|
|
ALAMO GROUP INC.
|
|
|
Date:
|
March 1, 2018
|
|
|
|
/s/ Ronald A. Robinson
|
|
|
|
Ronald A. Robinson
|
|
|
|
President & Chief Executive Officer
|
|
Pursuant to the requirements of the Securities Exchange Act of 1934, this report has been signed below by the following persons on behalf of the registrant and in their capacities and on
1
st day of March,
2018
.
|
Signature
|
|
Title
|
|
|
|
|
|
|
|
|
|
/s/
RONALD A. ROBINSON
Ronald A. Robinson
|
|
President, Chief Executive Officer & Interim Chairman of the Board (Principal Executive Officer)
|
|
|
|
|
|
|
|
|
|
/s/
DAN E. MALONE
Dan E. Malone
|
|
Executive Vice President & Chief Financial Officer (Principal Financial Officer)
|
|
|
|
|
|
|
|
|
|
/s/
RICHARD J. WEHRLE
Richard J. Wehrle
|
|
Vice President & Corporate Controller
(Principal Accounting Officer)
|
|
|
|
|
|
|
|
|
|
/s/
RODERICK R. BATY
Roderick R. Baty
|
|
Director
|
|
|
|
/s/
ROBERT P. BAUER
Robert P. Bauer
|
|
Director
|
||
|
/s/
ERIC P. ETCHART
Eric P. Etchart |
|
Director
|
|
|
|
/s/
DAVID W. GRZELAK
David W. Grzelak |
|
Director
|
|
|
|
|
|
|
|
|
|
/s/
TRACY C. JOKINEN
Tracy C. Jokinen
|
|
Director
|
|
|
|
/s/
RICHARD W. PAROD
Richard W. Parod
|
|
Director
|
||
44
Report of Management on Internal Control over Financial Reporting
The Company’s management is responsible for establishing and maintaining adequate internal control over financial reporting, as such term is defined in Rules 13a-15(f) and 15d-15(f) under the Securities Exchange Act of 1934. The Company’s internal control over financial reporting is designed to provide reasonable assurance regarding the reliability of financial reporting and the preparation of financial statements for external purposes in accordance with U.S. Generally Accepted Accounting Principles.
Because of its inherent limitations, internal controls over financial reporting may not prevent or detect misstatements. Also, projections of any evaluation of effectiveness to future periods are subject to risk that controls may become inadequate because of changes in conditions, or that the degree of compliance with the policies or procedures may deteriorate.
The Company’s management assessed the effectiveness of the Company’s internal control over financial reporting as of
December 31, 2017
using the criteria established in Internal Control – Integrated Framework (2013) issued by the Committee of Sponsoring Organizations of the Treadway Commission (COSO). Based on this assessment, the Company’s management concludes that, as of
December 31, 2017
, the Company’s internal controls over financial reporting were effective based on these criteria.
Alamo Group Inc. acquired Santa Izabel Agro Industria. Ltda. (
Santa Izabel
), Old Dominion Brush Company, Inc. (
ODB
), and R.P.M. Tech Inc. (
RPM
) during 2017, and management excluded from its assessment of the effectiveness of Alamo Group Inc.’s internal control over financial reporting as of December 31, 2017,
Santa Izabel’s, ODB’s and RPM’s
internal control over financial reporting associated with total assets of $47 million and total net sales of $25 million included in the consolidated financial statements of Alamo Group Inc. and subsidiaries as of and for the year ended December 31, 2017.
KPMG LLP, an independent registered public accounting firm, has issued an attestation report on the effectiveness of internal control over financial reporting, which is included herein.
|
Date:
|
March 1, 2018
|
/s/
Ronald A. Robinson
|
|
|
President, Chief Executive Officer & Director (Principal Executive Officer)
|
|
|
|
|
|
|
|
/s/Dan E. Malone
|
|
|
|
Executive Vice President & Chief Financial Officer (Principal Financial Officer)
|
|
|
|
||
|
|
|
|
|
|
/s/Richard J. Wehrle
|
|
|
|
Vice President & Corporate Controller (Principal Accounting Officer)
|
|
45
Report of Independent Registered Public Accounting Firm
To the Stockholders and Board of Directors
Alamo Group Inc.:
Opinion on the Consolidated Financial Statements
We have audited the accompanying consolidated balance sheets of Alamo Group Inc. and subsidiaries (“the Company”) as of December 31, 2017 and 2016, the related consolidated statements of income, comprehensive income, stockholders’ equity, and cash flows for each of the years in the three-year period ended December 31, 2017, and the related notes (collectively referred to as the “consolidated financial statements”). In our opinion, the consolidated financial statements present fairly, in all material respects, the financial position of the Company as of December 31, 2017 and 2016, and the results of its operations and its cash flows for each of the years in the three-year period ended December 31, 2017, in conformity with U.S. generally accepted accounting principles.
We also have audited, in accordance with the standards of the Public Company Accounting Oversight Board (United States) (“PCAOB”), the Company’s internal control over financial reporting as of December 31, 2017, based on criteria established in
Internal Control - Integrated Framework (2013)
issued by the Committee of Sponsoring Organizations of the Treadway Commission, and our report dated March 1, 2018 expressed an unqualified opinion on the effectiveness of the Company’s internal control over financial reporting.
Basis for Opinion
These consolidated financial statements are the responsibility of the Company’s management. Our responsibility is to express an opinion on these consolidated financial statements based on our audits. We are a public accounting firm registered with the PCAOB and are required to be independent with respect to the Company in accordance with the U.S. federal securities laws and the applicable rules and regulations of the Securities and Exchange Commission and the PCAOB.
We conducted our audits in accordance with the standards of the PCAOB. Those standards require that we plan and perform the audit to obtain reasonable assurance about whether the consolidated financial statements are free of material misstatement, whether due to error or fraud. Our audits included performing procedures to assess the risks of material misstatement of the consolidated financial statements, whether due to error or fraud, and performing procedures that respond to those risks. Such procedures included examining, on a test basis, evidence regarding the amounts and disclosures in the consolidated financial statements. Our audits also included evaluating the accounting principles used and significant estimates made by management, as well as evaluating the overall presentation of the consolidated financial statements. We believe that our audits provide a reasonable basis for our opinion.
|
|
/s/KPMG LLP
|
|
|
We have served as the Company’s auditor since 2009.
|
||
|
San Antonio, Texas
|
||
|
March 1, 2018
|
|
|
46
Report of Independent Registered Public Accounting Firm
To the Stockholders and Board of Directors
Alamo Group Inc.:
Opinion on Internal Control Over Financial Reporting
We have audited Alamo Group Inc. and subsidiaries (the “Company”) internal control over financial reporting as of December 31, 2017, based on criteria established in
Internal Control - Integrated Framework
(2013)
issued by the Committee of Sponsoring Organizations of the Treadway Commission. In our opinion, the Company maintained, in all material respects, effective internal control over financial reporting as of December 31, 2017, based on criteria established in Internal Control - Integrated Framework (2013) issued by the Committee of Sponsoring Organizations of the Treadway Commission.
We also have audited, in accordance with the standards of the Public Company Accounting Oversight Board (United States) (“PCAOB”), the consolidated balance sheets of the Company as of December 31, 2017 and 2016, the related consolidated statements of income, comprehensive income, stockholders’ equity, and cash flows for each of the years in the three-year period ended December 31, 2017, and the related notes (collectively, “the consolidated financial statements”), and our report dated March 1, 2018 expressed an unqualified opinion on those consolidated financial statements
.
The Company acquired Santa Izabel Agro Industria Ltda. (Santa Izabel), Old Dominion Brush Company (Old Dominion) and R.P.M. Tech Inc. (RPM Tech) during 2017, and management excluded from its assessment of the effectiveness of the Company’s internal control over financial reporting as of December 31, 2017, Santa Izabel’s, Old Dominion’s and RPM Tech’s internal control over financial reporting associated with total assets of $47 million and total revenues of $25 million included in the consolidated financial statements of the Company as of and for the year ended December 31, 2017. Our audit of internal control over financial reporting of the Company also excluded an evaluation of the internal control over financial reporting of Santa Izabel, Old Dominion and RPM Tech.
Basis for Opinion
The Company’s management is responsible for maintaining effective internal control over financial reporting and for its assessment of the effectiveness of internal control over financial reporting, included in the accompanying Report of Management on Internal Control over Financial Reporting. Our responsibility is to express an opinion on the Company’s internal control over financial reporting based on our audit. We are a public accounting firm registered with the PCAOB and are required to be independent with respect to the Company in accordance with the U.S. federal securities laws and the applicable rules and regulations of the Securities and Exchange Commission and the PCAOB.
We conducted our audit in accordance with the standards of the PCAOB. Those standards require that we plan and perform the audit to obtain reasonable assurance about whether effective internal control over financial reporting was maintained in all material respects. Our audit of internal control over financial reporting included obtaining an understanding of internal control over financial reporting, assessing the risk that a material weakness exists, and testing and evaluating the design and operating effectiveness of internal control based on the assessed risk. Our audit also included performing such other procedures as we considered necessary in the circumstances. We believe that our audit provides a reasonable basis for our opinion.
Definition and Limitations of Internal Control Over Financial Reporting
A company’s internal control over financial reporting is a process designed to provide reasonable assurance regarding the reliability of financial reporting and the preparation of financial statements for external purposes in accordance with generally accepted accounting principles. A company’s internal control over financial reporting includes those policies and procedures that (1) pertain to the maintenance of records that, in reasonable detail, accurately and fairly reflect the transactions and dispositions of the assets of the company; (2) provide reasonable assurance that transactions are recorded as necessary to permit preparation of financial statements in accordance with generally accepted accounting principles, and that receipts and expenditures of the company are being made only in accordance with authorizations of management and directors of the company; and (3) provide reasonable assurance regarding prevention or timely detection of unauthorized acquisition, use, or disposition of the company’s assets that could have a material effect on the financial statements.
Because of its inherent limitations, internal control over financial reporting may not prevent or detect misstatements. Also, projections of any evaluation of effectiveness to future periods are subject to the risk that controls may become inadequate because of changes in conditions, or that the degree of compliance with the policies or procedures may deteriorate.
|
|
/s/KPMG LLP
|
|
|
San Antonio, Texas
|
||
|
March 1, 2018
|
|
|
47
Alamo Group Inc. and Subsidiaries
|
|
Year Ended December 31,
|
|||||||
|
(in thousands, except per share amounts)
|
2017
|
2016
|
||||||
|
ASSETS
|
|
|
||||||
|
Current assets:
|
|
|
|
|||||
|
Cash and cash equivalents
|
$
|
25,373
|
|
$
|
16,793
|
|
||
|
Accounts receivable, net
|
205,767
|
|
170,329
|
|
||||
|
Inventories, net
|
155,568
|
|
135,760
|
|
||||
|
Prepaid expenses
|
5,336
|
|
4,725
|
|
||||
|
Income tax receivable
|
483
|
|
11
|
|
||||
|
Total current assets
|
392,527
|
|
327,618
|
|
||||
|
Rental equipment, net
|
28,493
|
|
30,970
|
|
||||
|
Property, plant and equipment
|
202,293
|
|
180,041
|
|
||||
|
Less: Accumulated depreciation
|
(125,629
|
)
|
(113,412
|
)
|
||||
|
|
76,664
|
|
66,629
|
|
||||
|
Goodwill
|
84,761
|
|
74,825
|
|
||||
|
Intangible assets, net
|
52,872
|
|
50,038
|
|
||||
|
Deferred income taxes
|
992
|
|
619
|
|
||||
|
Other assets
|
3,362
|
|
2,077
|
|
||||
|
Total assets
|
$
|
639,671
|
|
$
|
552,776
|
|
||
|
LIABILITIES AND STOCKHOLDERS’ EQUITY
|
|
|
||||||
|
Current liabilities:
|
|
|
||||||
|
Trade accounts payable
|
$
|
55,825
|
|
$
|
43,136
|
|
||
|
Income taxes payable
|
5,002
|
|
2,333
|
|
||||
|
Accrued liabilities
|
40,454
|
|
33,158
|
|
||||
|
Current maturities of long-term debt and capital lease obligations
|
82
|
|
73
|
|
||||
|
Total current liabilities
|
101,363
|
|
78,700
|
|
||||
|
Long-term debt and capital lease obligation, net of current maturities
|
60,000
|
|
70,017
|
|
||||
|
Long-term tax liability
|
12,316
|
|
—
|
|
||||
|
Accrued pension liabilities
|
1,225
|
|
2,929
|
|
||||
|
Other long-term liabilities
|
7,291
|
|
6,969
|
|
||||
|
Deferred income taxes
|
8,368
|
|
6,444
|
|
||||
|
Stockholders’ equity:
|
|
|
|
|
||||
|
Common stock, $.10 par value, 20,000,000 shares authorized; 11,577,048 and 11,462,484 outstanding at December 31, 2017 and December 31, 2016, respect
ively
|
1,158
|
|
1,146
|
|
||||
|
Additional paid-in capital
|
103,864
|
|
99,765
|
|
||||
|
Treasury stock, at cost; 42,600 shares at December 31, 2017 and December 31, 2016
|
(426
|
)
|
(426
|
)
|
||||
|
Retained earnings
|
374,678
|
|
334,988
|
|
||||
|
Accumulated other comprehensive loss
|
(30,166
|
)
|
(47,756
|
)
|
||||
|
Total stockholders’ equity
|
449,108
|
|
387,717
|
|
||||
|
Total liabilities and stockholders’ equity
|
$
|
639,671
|
|
$
|
552,776
|
|
||
See accompanying notes.
48
Alamo Group Inc. and Subsidiaries
|
Year Ended December 31,
|
||||||||||||
|
(in thousands, except per share amounts)
|
2017
|
2016
|
2015
|
|||||||||
|
Net sales:
|
|
|
|
|||||||||
|
Industrial
|
$
|
522,706
|
|
$
|
484,088
|
|
$
|
498,761
|
|
|||
|
Agricultural
|
227,389
|
|
205,834
|
|
208,257
|
|
||||||
|
European
|
162,285
|
|
154,826
|
|
172,559
|
|
||||||
|
Total net sales
|
912,380
|
|
844,748
|
|
879,577
|
|
||||||
|
Cost of sales
|
677,687
|
|
639,649
|
|
677,129
|
|
||||||
|
Gross profit
|
234,693
|
|
205,099
|
|
202,448
|
|
||||||
|
Selling, general and administrative expenses
|
145,955
|
|
137,479
|
|
135,920
|
|
||||||
|
Income from operations
|
88,738
|
|
67,620
|
|
66,528
|
|
||||||
|
Interest expense
|
(4,839
|
)
|
(5,914
|
)
|
(6,724
|
)
|
||||||
|
Interest income
|
336
|
|
214
|
|
189
|
|
||||||
|
Other income
|
(1,868
|
)
|
269
|
|
6,874
|
|
||||||
|
Income before income taxes
|
82,367
|
|
62,189
|
|
66,867
|
|
||||||
|
Provision for income taxes
|
38,052
|
|
22,144
|
|
23,658
|
|
||||||
|
Net income
|
$
|
44,315
|
|
$
|
40,045
|
|
$
|
43,209
|
|
|||
|
Net income per common share:
|
|
|
|
|
|
|
||||||
|
Basic
|
$
|
3.84
|
|
$
|
3.50
|
|
$
|
3.81
|
|
|||
|
Diluted
|
$
|
3.79
|
|
$
|
3.46
|
|
$
|
3.76
|
|
|||
|
Average common shares:
|
||||||||||||
|
Basic
|
11,549
|
|
11,434
|
|
11,349
|
|
||||||
|
Diluted
|
11,682
|
|
11,565
|
|
11,482
|
|
||||||
See accompanying notes.
49
Alamo Group Inc. and Subsidiaries
Consolidated Statements of Comprehensive Income
|
Year Ended December 31,
|
||||||||||||||
|
(in thousands, except per share amounts)
|
2017
|
2016
|
2015
|
|||||||||||
|
Net income
|
$
|
44,315
|
|
$
|
40,045
|
|
$
|
43,209
|
|
|||||
|
Other comprehensive income (loss):
|
||||||||||||||
|
Foreign currency translation adjustment
|
16,966
|
|
(13,156
|
)
|
(20,112
|
)
|
||||||||
|
Net gain (loss) on pension and other post-retirement benefits
|
987
|
|
2,369
|
|
544
|
|
||||||||
|
Other comprehensive income (loss) before income tax (benefit) expense
|
17,953
|
|
(10,787
|
)
|
(19,568
|
)
|
||||||||
|
Income tax (expense) benefit related to items of other comprehensive (loss) income
|
(363
|
)
|
(890
|
)
|
(152
|
)
|
||||||||
|
Other comprehensive income (loss)
|
$
|
17,590
|
|
$
|
(11,677
|
)
|
$
|
(19,720
|
)
|
|||||
|
Comprehensive income
|
$
|
61,905
|
|
$
|
28,368
|
|
$
|
23,489
|
|
|||||
See accompanying notes.
50
Alamo Group Inc. and Subsidiaries
Consolidated Statements of Stockholders’ Equity
|
|
Common Stock
|
Additional
Paid-in Capital
|
Treasury Stock
|
Retained Earnings
|
Accumulated
Other
Comprehensive Income
|
Total Stock-
holders’ Equity
|
||||||||||||||||
|
(in thousands)
|
Shares
|
Amount
|
||||||||||||||||||||
|
Balance at December 31, 2014
|
11,264
|
|
$
|
1,130
|
|
$
|
93,849
|
|
$
|
(426
|
)
|
$
|
259,476
|
|
$
|
(16,359
|
)
|
$
|
337,670
|
|
||
|
Net income
|
—
|
|
—
|
|
—
|
|
—
|
|
43,209
|
|
—
|
|
43,209
|
|
||||||||
|
Translation adjustment
|
—
|
|
—
|
|
—
|
|
—
|
|
—
|
|
(20,112
|
)
|
(20,112
|
)
|
||||||||
|
Net actuarial loss arising during period net of taxes
|
—
|
|
—
|
|
—
|
|
—
|
|
—
|
|
392
|
|
392
|
|
||||||||
|
Tax effect of exercised non-qualified stock options
|
—
|
|
—
|
|
(142
|
)
|
—
|
|
—
|
|
—
|
|
(142
|
)
|
||||||||
|
Stock-based compensation
|
—
|
|
—
|
|
1,057
|
|
—
|
|
—
|
|
—
|
|
1,057
|
|
||||||||
|
Exercise of stock options
|
86
|
|
9
|
|
2,014
|
|
—
|
|
—
|
|
—
|
|
2,023
|
|
||||||||
|
Dividends paid ($0.32 per share)
|
—
|
|
—
|
|
—
|
|
—
|
|
(3,628
|
)
|
—
|
|
(3,628
|
)
|
||||||||
|
Balance at December 31, 2015
|
11,350
|
|
$
|
1,139
|
|
$
|
96,778
|
|
$
|
(426
|
)
|
$
|
299,057
|
|
$
|
(36,079
|
)
|
$
|
360,469
|
|
||
|
Net income
|
—
|
|
—
|
|
—
|
|
—
|
|
40,045
|
|
—
|
|
40,045
|
|
||||||||
|
Translation adjustment
|
—
|
|
—
|
|
—
|
|
—
|
|
—
|
|
(13,156
|
)
|
(13,156
|
)
|
||||||||
|
Net actuarial gain arising during period net of taxes
|
—
|
|
—
|
|
—
|
|
—
|
|
—
|
|
1,479
|
|
1,479
|
|
||||||||
|
Tax effect of exercised non-qualified stock options
|
—
|
|
—
|
|
230
|
|
—
|
|
—
|
|
—
|
|
230
|
|
||||||||
|
Stock-based compensation
|
—
|
|
—
|
|
1,414
|
|
—
|
|
—
|
|
—
|
|
1,414
|
|
||||||||
|
Exercise of stock options
|
70
|
|
7
|
|
1,362
|
|
—
|
|
—
|
|
—
|
|
1,369
|
|
||||||||
|
Repurchased shares
|
—
|
|
—
|
|
(19
|
)
|
—
|
|
—
|
|
—
|
|
(19
|
)
|
||||||||
|
Dividends paid ($0.36 per share)
|
—
|
|
—
|
|
—
|
|
—
|
|
(4,114
|
)
|
—
|
|
(4,114
|
)
|
||||||||
|
Balance at December 31, 2016
|
11,420
|
|
$
|
1,146
|
|
$
|
99,765
|
|
$
|
(426
|
)
|
$
|
334,988
|
|
$
|
(47,756
|
)
|
$
|
387,717
|
|
||
|
Net income
|
—
|
|
—
|
|
—
|
|
—
|
|
44,315
|
|
—
|
|
44,315
|
|
||||||||
|
Translation adjustment
|
—
|
|
—
|
|
—
|
|
—
|
|
—
|
|
16,966
|
|
16,966
|
|
||||||||
|
Net actuarial gain arising during period net of taxes
|
—
|
|
—
|
|
—
|
|
—
|
|
—
|
|
624
|
|
624
|
|
||||||||
|
Stock-based compensation
|
—
|
|
—
|
|
1,869
|
|
—
|
|
—
|
|
—
|
|
1,869
|
|
||||||||
|
Exercise of stock options
|
114
|
|
12
|
|
2,385
|
|
—
|
|
—
|
|
—
|
|
2,397
|
|
||||||||
|
Repurchased shares
|
—
|
|
—
|
|
(166
|
)
|
—
|
|
—
|
|
—
|
|
(166
|
)
|
||||||||
|
Other
|
—
|
|
—
|
|
11
|
|
—
|
|
(11
|
)
|
—
|
|
—
|
|
||||||||
|
Dividends paid ($0.40 per share)
|
—
|
|
—
|
|
—
|
|
—
|
|
(4,614
|
)
|
—
|
|
(4,614
|
)
|
||||||||
|
Balance at December 31, 2017
|
11,534
|
|
$
|
1,158
|
|
$
|
103,864
|
|
$
|
(426
|
)
|
$
|
374,678
|
|
$
|
(30,166
|
)
|
$
|
449,108
|
|
||
See accompanying notes.
51
Alamo Group Inc. and Subsidiaries
|
|
Year Ended December 31,
|
||||||||||
|
(in thousands)
|
2017
|
2016
|
2015
|
||||||||
|
Operating Activities
|
|
|
|
||||||||
|
Net income
|
$
|
44,315
|
|
$
|
40,045
|
|
$
|
43,209
|
|
||
|
Adjustments to reconcile net income to cash provided by
operating activities:
|
|
|
|
|
|
|
|||||
|
Provision for doubtful accounts
|
187
|
|
482
|
|
965
|
|
|||||
|
Depreciation - PP&E
|
11,616
|
|
11,267
|
|
11,381
|
|
|||||
|
Depreciation - Rental
|
5,531
|
|
6,429
|
|
7,607
|
|
|||||
|
Amortization of intangibles
|
3,317
|
|
3,104
|
|
3,113
|
|
|||||
|
Amortization of debt issuance
|
203
|
|
213
|
|
214
|
|
|||||
|
Stock-based compensation expense
|
1,869
|
|
1,414
|
|
1,057
|
|
|||||
|
Provision for deferred income tax expense
|
1,328
|
|
2,620
|
|
2,804
|
|
|||||
|
Gain on sale of property, plant and equipment
|
(341
|
)
|
(345
|
)
|
(4,046
|
)
|
|||||
|
Changes in operating assets and liabilities, net of effect of acquisitions:
|
|
|
|
|
|
|
|||||
|
Accounts receivable
|
(23,134
|
)
|
3,876
|
|
(9,657
|
)
|
|||||
|
Inventories
|
142
|
|
12,340
|
|
9,759
|
|
|||||
|
Rental equipment
|
(3,054
|
)
|
315
|
|
(11,699
|
)
|
|||||
|
Prepaid expenses and other
|
2,845
|
|
(5,634
|
)
|
(3,521
|
)
|
|||||
|
Trade accounts payable and accrued liabilities
|
11,688
|
|
(5,382
|
)
|
(1,708
|
)
|
|||||
|
Income taxes payable
|
2,357
|
|
2,908
|
|
3,700
|
|
|||||
|
Long term tax payable
|
12,478
|
|
—
|
|
—
|
|
|||||
|
Other assets and liabilities, net
|
(543
|
)
|
2,132
|
|
(760
|
)
|
|||||
|
Net cash provided by operating activities
|
70,804
|
|
75,784
|
|
52,418
|
|
|||||
|
Investing Activities
|
|
|
|
|
|
|
|||||
|
Acquisitions, net of cash acquired
|
(38,553
|
)
|
(188
|
)
|
(3,465
|
)
|
|||||
|
Purchase of property, plant and equipment
|
(13,490
|
)
|
(9,711
|
)
|
(15,479
|
)
|
|||||
|
Proceeds from sale of property, plant and equipment
|
767
|
|
1,293
|
|
4,246
|
|
|||||
|
Purchase of patents
|
—
|
|
(50
|
)
|
—
|
|
|||||
|
Net cash used in investing activities
|
(51,276
|
)
|
(8,656
|
)
|
(14,698
|
)
|
|||||
|
Financing Activities
|
|
|
|
|
|||||||
|
Borrowings on bank revolving credit facility
|
143,000
|
|
79,000
|
|
79,000
|
|
|||||
|
Repayment on bank revolving credit facility
|
(153,000
|
)
|
(153,000
|
)
|
(125,000
|
)
|
|||||
|
Principal payments on long-term debt and capital leases
|
(17
|
)
|
(38
|
)
|
(449
|
)
|
|||||
|
Proceeds from issuance of long-term debt
|
—
|
|
48
|
|
—
|
|
|||||
|
Debt issuance cost
|
—
|
|
(593
|
)
|
—
|
|
|||||
|
Dividends paid
|
(4,614
|
)
|
(4,114
|
)
|
(3,628
|
)
|
|||||
|
Proceeds from exercise of stock options
|
2,397
|
|
1,369
|
|
2,023
|
|
|||||
|
Common stock repurchased
|
(166
|
)
|
(19
|
)
|
—
|
|
|||||
|
Net cash used in financing activities
|
(12,400
|
)
|
(77,347
|
)
|
(48,054
|
)
|
|||||
|
Effect of exchange rate changes on cash
|
1,452
|
|
90
|
|
(2,277
|
)
|
|||||
|
Net change in cash and cash equivalents
|
8,580
|
|
(10,129
|
)
|
(12,611
|
)
|
|||||
|
Cash and cash equivalents at beginning of the year
|
16,793
|
|
26,922
|
|
39,533
|
|
|||||
|
Cash and cash equivalents at end of the year
|
$
|
25,373
|
|
$
|
16,793
|
|
$
|
26,922
|
|
||
|
Cash paid during the year for:
|
|
|
|
|
|
|
|||||
|
Interest
|
$
|
5,217
|
|
$
|
5,796
|
|
$
|
6,936
|
|
||
|
Income taxes
|
$
|
23,175
|
|
$
|
16,637
|
|
$
|
18,709
|
|
||
See accompanying notes.
52
Alamo Group Inc. and Subsidiaries
Notes to Consolidated Financial Statements
1. SIGNIFICANT ACCOUNTING POLICIES
Description of the Business and Segments
The Company manufactures, distributes and services high quality tractor-mounted mowing and other vegetation maintenance equipment, street sweepers, excavators, vacuum trucks, snow removal equipment, pothole patchers, zero turn radius mowers, agricultural implements and related aftermarket parts and services.
The Company manages its business through
three
principal reporting segments: Industrial, Agricultural and European, which are discussed in
Note 16
.
Basis of Presentation and Principles of Consolidation
The accompanying consolidated financial statements include the accounts of Alamo Group Inc. and its subsidiaries (the “Company” or “Alamo Group”), all of which are wholly owned. All intercompany accounts and transactions have been eliminated in consolidation.
Use of Estimates
The preparation of financial statements in conformity with U.S. Generally Accepted Accounting Principles requires management to make estimates and assumptions that affect the amount of assets, liabilities, revenues, and expenses reported in the financial statements and accompanying notes. Judgments related to asset impairment and certain reserves are particularly subject to change. Actual results could differ from those estimates. Such estimates include, but are not limited to, allowance for doubtful accounts, reserve for sales discounts, estimated realizable value on obsolete and slow-moving inventory, warranty reserve, estimates related to pension accounting; estimates related to fair value for purposes of assessing goodwill, long-lived assets and intangible assets for impairment; estimates related to income taxes; and estimates related to contingencies.
Foreign Currency
The Company translates the assets and liabilities of foreign-owned subsidiaries at rates in effect at the end of the year. Revenues and expenses are translated at average rates in effect during the reporting period. Translation adjustments are included in accumulated other comprehensive income (loss).
The Company enters into foreign currency forward contracts to limit its exposure to certain foreign currency transactions. The Company does not hold or issue financial instruments for trading purposes.
Cash Equivalents
The Company considers all highly liquid investments with original maturities of three months or less from the date of purchase to be cash equivalents. As of
December 31, 2017
and
December 31, 2016
, there was
no
restricted cash.
Concentrations of Credit Risk
Financial instruments which potentially subject the Company to concentrations of credit risk consist principally of accounts receivable. The credit risk is limited because of the large numbers and types of customers and their geographic dispersion.
Inventories
Inventories of U.S. operating subsidiaries are stated at the lower of cost (last-in, first-out method) (“LIFO”) or market, and the Company’s international subsidiaries’ inventories are stated at the lower of cost (first-in, first-out) (“FIFO”) or market. Inventory costs include those costs directly attributable to products, including raw materials, labor and overhead.
53
Property, Plant and Equipment
Property, plant, and equipment are stated on the basis of cost. Major renewals and betterments are charged to the property accounts while replacements, maintenance and repairs, which do not improve or extend the lives of the respective assets, are expensed to the current period. Depreciation is provided at amounts calculated to amortize the cost of the assets over their estimated useful economic lives using the straight-line method.
Impairment of Long-Lived Assets
Long-lived assets, such as property, plant and equipment, rental equipment, and purchased intangibles subject to amortization, are reviewed for impairment whenever events or changes in circumstances indicate that the carrying amount of an asset may not be recoverable. If circumstances require a long-lived asset or asset group to be tested for possible impairment, the Company first compares non-discounted cash flows expected to be generated by that asset group to its carrying amount. If the carrying amount of the long-lived asset or asset group is not recoverable on a non-discounted cash flow basis, an impairment is recognized to the extent that the carrying amount exceeds fair value. Fair value is determined through various valuation techniques including discounted cash flow models, quoted market values and third-party independent appraisals, as considered necessary.
Goodwill
In January 2017, the Financial Accounting Standards Board ("FASB") issued Accounting Standard Update ("ASU") No. 2017-04 - Intangibles-Goodwill and Other (Topic 350): Simplifying the Test for Goodwill Impairment. This ASU simplifies the subsequent measurement of goodwill, the FASB eliminated Step 2 from the goodwill impairment test. Under the amendments in this ASU, an entity should perform its annual, or interim, goodwill impairment test by comparing the fair value of a reporting unit with its carrying amount. An entity should recognize an impairment charge for the amount by which the carrying amount exceeds the reporting unit’s fair value; however, the loss recognized should not exceed the total amount of goodwill allocated to that reporting unit. Additionally, an entity should consider income tax effects from any tax deductible goodwill on the carrying amount of the reporting unit when measuring the goodwill impairment loss, if applicable. An entity still has the option to perform the qualitative assessment for a reporting unit to determine if the quantitative impairment test is necessary. A public business entity that is an SEC filer should adopt the amendments in this Update for its annual or any interim goodwill impairment tests in fiscal years beginning after December 15, 2019. Early adoption is permitted for interim or annual goodwill impairment tests performed on testing dates after January 1, 2017. ASU 2017-04 was early adopted by the Company for the year beginning January 1, 2017 and did not have a material impact on the Company's consolidated financial statements.
Goodwill represents the excess of the purchase price over the estimated fair value of the identifiable net assets acquired. Goodwill is not amortized but is instead tested for impairment at least annually, or whenever events or circumstances change between the annual impairment tests that make it likely that an impairment may have occurred, such as a significant adverse change in the business climate or a decision to sell all or a portion of a reporting unit. The Company performs its annual test for goodwill impairment related to its reporting units on October 1 of each fiscal year. Impairment testing for goodwill is done at the reporting unit level. A reporting unit is an operating segment or one level below an operating segment (also known as a component). A component of an operating segment is a reporting unit if the component constitutes a business for which discrete financial information is available, and segment management regularly reviews the operating results of that component.
We perform a qualitative assessment for all of our reporting units to determine whether it is more likely than not that an impairment exists. Factors considered include macroeconomic, industry and competitive conditions, legal and regulatory environment, historical financial performance and significant changes in the reporting unit. If the qualitative assessment indicates that it is more likely than not that an impairment exists, then a quantitative assessment is performed. Alternatively, we may also bypass the qualitative assessment and go ahead and perform step 1 to determine if the carrying amount exceeds the reporting unit’s fair value. If the fair value of the reporting unit is lower than its carrying amount, goodwill is written down for the amount by which the carrying amount exceeds the fair value. However, the loss recognized cannot exceed the carrying amount of goodwill. We typically use discounted cash flow models to determine the fair value of a reporting unit. The assumptions used in these models are consistent with those we believe a hypothetical marketplace participant would use.
See
Note 7
to the Consolidated Financial Statements for more information regarding goodwill.
54
Intangible Assets
The Company has intangible assets with both definite and indefinite useful lives. The definite-lived assets are trade names and trademarks, customer and dealer relationships, and patents and drawings that are subject to amortization with useful lives ranging from
3
years to
25
years. Impairment of definite-lived assets is discussed as part of the
Impairment of Long-Lived Assets
paragraph above.
The indefinite-lived assets not subject to amortization consist of trade names. The Company tests its indefinite-lived intangible assets for impairment on an annual basis at year-end, or more frequently if an event occurs or circumstances change that indicate that the fair value of an indefinite-lived intangible asset could be below its carrying amount. The impairment test consists of comparing the fair value of the indefinite-lived intangible asset, determined using the relief from royalty method, with its carrying amount. An impairment loss would be recognized for the carrying amount in excess of its fair value.
See
Note 8
to the Consolidated Financial Statements for more information regarding intangible assets.
Pensions
The Company records annual amounts relating to its pension and post-retirement plans based on calculations that incorporate various actuarial and other assumptions, including discount rates, mortality, assumed rates of return, compensation increases, turnover rates and health care cost trend rates. The Company reviews its assumptions on an annual basis and makes modifications to the assumptions based on current rates and trends when it is appropriate to do so. The effect of modifications to those assumptions is recorded in accumulated other comprehensive income (loss) and amortized to net periodic cost over future periods using the corridor method. The Company believes that the assumptions utilized in recording its obligations under its plans are reasonable based on its experience and market conditions.
The net periodic costs are recognized as employees render the services necessary to earn the
post-retirement benefits.
Revenue Recognition
The Company recognizes revenue when each of the following four criteria are met: 1) a contract or sales arrangement exists; 2) products have been shipped per agreed terms and title has been transferred or services have been rendered; 3) the prices of the products or services are fixed or determinable; and 4) collectability is reasonably assured. Pre-season sales orders are solicited in the fall in advance of the dealer’s sales season in the spring and summer. Revenue from sales is recorded net of a provision for discounts that are anticipated to be earned and deducted at time of payment by the customer. These approximated discounts are estimated using an average of historical discounts taken and are adjusted as program terms are changed.
Sales taxes collected from customers and remitted to governmental authorities are accounted for on a net basis and therefore are excluded from revenues in the consolidated statements of operations.
Rental Equipment
The Company enters into operating lease agreements with customers related to the rental of certain equipment. In accounting for these leases, the cost of the equipment purchased or manufactured by the Company is recorded as an asset, and is depreciated over its estimated useful life. Accumulated depreciation relating to the rental equipment was
$9,413,000
and
$10,430,000
on
December 31, 2017
and
December 31, 2016
, respectively.
Shipping and Handling Costs
The Company’s policy is to include shipping and handling costs in costs of goods sold.
Advertising
We charge advertising costs to expense as incurred. Advertising and marketing expense related to operations for fiscal years
2017
,
2016
, and
2015
was approximately $
9,566,000
, $
7,742,000
and $
7,670,000
, respectively. Advertising and marketing expenses are included in Selling, General and Administrative expenses (“SG&A”).
55
Research and Development
Product development and engineering costs charged to SG&A amounted to $
9,849,000
, $
8,847,000
, and $
8,590,000
for the years ended
December 31, 2017
,
2016
, and
2015
, respectively.
Commitments and Contingencies
Liabilities for loss contingencies arising from claims, assessments, litigation, fines and penalties and other sources are recorded when it is probable that a liability has been incurred and the amount can be reasonably estimated. The Company's policy is to accrue for legal costs expected to be incurred in connection with loss contingencies.
Income Taxes
Deferred tax assets and liabilities are determined based on differences between the financial reporting basis and tax basis of assets and liabilities, and are measured by applying enacted statutory tax rates applicable to the future years in which deferred tax assets or liabilities are expected to be settled or realized. In assessing the realizability of deferred tax assets, management considers whether it is more likely than not that some portion or all of the deferred tax assets will be realized. The ultimate realization of deferred tax assets is dependent upon the generation of future taxable income during the periods in which those temporary differences become deductible. Management considers the scheduled reversals of deferred tax liabilities, projected future taxable income, available tax carry backs and tax planning strategies in making this assessment other than those which we have reserved.
We previously considered substantially all of the earnings in our foreign subsidiaries to be permanently reinvested and, accordingly, recorded no deferred income taxes on such earnings. As a result of the fundamental changes to the taxation of multinational corporations as a result of TCJA, we no longer intend to permanently reinvest all of the historical undistributed earnings of our foreign subsidiaries. We will distribute earnings from our European subsidiaries, while maintaining our permanent reinvestment for our other foreign subsidiaries. GAAP requires recognition of a deferred tax liability in the reporting period in which its intent to no longer permanently reinvest its historical undistributed foreign earnings is made. There will generally be no U.S. federal taxes imposed on such future distributions of foreign earnings and, due to treaties between the various countries, we do not expect the cash transfer will be subject to foreign withholding or other local taxes.
Stock-Based Compensation
The Company has granted options to purchase its common stock to certain employees and directors of the Company and its affiliates under various stock option plans at no less than the fair market value of the underlying stock on the date of grant. These options are granted for a term not exceeding
ten
years and are forfeited in the event that the employee or director terminates his or her employment or relationship with the Company or one of its affiliates other than by retirement or death. These options generally vest over
five
years. All option plans contain anti-dilutive provisions that permit an adjustment of the number of shares of the Company’s common stock represented by each option for any change in capitalization. Excess tax benefits or awards that are recognized in equity related to stock option exercises are reflected as cash flows from financing activities in the statement of cash flows.
The fair value of each stock option is estimated on the date of grant using the Black-Scholes valuation method with the following assumptions noted:
|
1.
|
The risk-free rate is based on the U.S. Treasury rate over the expected life of the option at the time of the grant.
|
|
2.
|
The dividend yield is calculated as the ratio of dividends paid per share of common stock to the stock price on the date of the grant.
|
|
3.
|
The expected volatility factors are based on the historical movement of the Company’s common stock price over the expected life of the option.
|
|
4.
|
The expected life is the average length of time in which officers, other employees, and non-employee directors are expected to exercise their options, and which are primarily based on historical experience.
|
56
The Company calculated the fair value for options with the following weighted-average assumptions for
2017
,
2016
, and
2015
:
|
|
December 31,
|
||||||||
|
|
2017
|
2016
|
2015
|
||||||
|
Risk-free interest rate
|
2.23
|
%
|
1.54
|
%
|
2.00
|
%
|
|||
|
Dividend yield
|
0.5
|
%
|
0.6
|
%
|
0.6
|
%
|
|||
|
Volatility factors
|
37.6
|
%
|
48.5
|
%
|
48.8
|
%
|
|||
|
Weighted-average expected life
|
8.0 years
|
|
8.0 years
|
|
8.0 years
|
|
|||
Earnings per Common Share (“EPS”)
Basic EPS is computed using the weighted-average number of common shares outstanding during the year. The treasury stock method is used to compute diluted EPS which gives effect to the potential dilution of earnings that could have occurred if additional shares were issued for awards granted under the Company’s incentive stock option plans. The treasury stock method assumes proceeds obtained upon exercise of awards granted under the incentive stock option plans are used to purchase outstanding common stock at the average market price during the period.
2. BUSINESS COMBINATIONS
Santa Izabel Agro Industria Ltda.
On June 6, 2017, the Company completed the acquisition of Santa Izabel Agro Industria Ltda. ("Santa Izabel"). Santa Izabel designs, manufactures and markets a variety of agricultural implements and trailers sold throughout Brazil. The primary reason for the Santa Izabel acquisition was to broaden the Company's presence in the manufacturing and distribution of agricultural machinery in Brazil. The acquisition price was approximately
$10 million
. Revenues and earnings subsequent to the acquisition are immaterial during 2017.
Old Dominion Brush Company
On June 26, 2017, the Company completed the acquisition of Old Dominion Brush Company, Inc. ("Old Dominion"). Old Dominion manufactures and sells replacement brooms for street sweepers and leaf vacuum equipment. The acquisition price was approximately
$18 million
. The primary reason for the ODB acquisition was to increase the Company's presence in the sweeper market and broaden our product offerings.
In the period between the closing date and December 31, 2017, ODB has generated approximately
$14.0 million
of net sales and
$.9 million
of net income.
R.P.M. Tech Inc.
On August 8, 2017, the Company completed the acquisition of R.P.M. Tech Inc. ("R.P.M."). R.P.M. manufactures and sells heavy duty snow removal equipment. The primary reason for the R.P.M acquisition was to strengthen the Company's offering in industrial snowblowers. The acquisition price was approximately
$13 million
. Revenues and earnings subsequent to the acquisition are immaterial during 2017.
Consolidated Acquisitions
The Company has included the operating results of ODB, Santa Izabel, and R.P.M. in its consolidated financial statements since its acquisition. Certain estimated values are not yet finalized and are subject to change, which could be significant. The Company will finalize the amounts once the necessary information is obtained and the analysis is complete. These acquisitions are being accounted for in accordance with ASC Topic 805. Accordingly, the total purchase price has been allocated on a preliminary basis to assets acquired and liabilities assumed, including deferred taxes, based on their estimated fair values as of the completion of the acquisitions. These allocations reflect various provisional estimates that were available at the time and are subject to change during the
57
purchase price allocation period as valuations are finalized. The following are the estimated fair value of the assets acquired and liabilities for all
three
acquisitions assumed as of the Acquisition date (in thousands):
|
Cash
|
$
|
2,547
|
|
|
|
Accounts receivable
|
7,111
|
|
||
|
Inventory
|
15,471
|
|
||
|
Prepaid expenses
|
134
|
|
||
|
Property, plant & equipment
|
5,902
|
|
||
|
Intangible assets
|
5,875
|
|
||
|
Other assets
|
1,053
|
|
||
|
Other liabilities assumed
|
(4,735
|
)
|
||
|
|
|
|||
|
Net assets assumed
|
$
|
33,358
|
|
|
|
|
||||
|
Goodwill
|
7,741
|
|
||
|
Acquisition Price
|
$
|
41,099
|
|
|
3. EARNINGS PER SHARE
The following table sets forth the reconciliation from basic to diluted average common shares and the calculations of net income per common share. Net income for basic and diluted calculations does not differ.
|
(in thousands, except per share amounts)
|
2017
|
2016
|
2015
|
||||||||
|
Net income
|
$
|
44,315
|
|
$
|
40,045
|
|
$
|
43,209
|
|
||
|
Average common shares:
|
|
|
|
|
|
|
|||||
|
Basic (weighted-average outstanding shares)
|
11,549
|
|
11,434
|
|
11,349
|
|
|||||
|
Dilutive potential common shares from stock options
|
133
|
|
131
|
|
133
|
|
|||||
|
Diluted (weighted-average outstanding shares)
|
11,682
|
|
11,565
|
|
11,482
|
|
|||||
|
Basic earnings per share
|
$
|
3.84
|
|
$
|
3.50
|
|
$
|
3.81
|
|
||
|
Diluted earnings per share
|
$
|
3.79
|
|
$
|
3.46
|
|
$
|
3.76
|
|
||
Stock options totaling
1,565
shares in
2017
,
21,491
shares in
2016
, and
61,690
shares in
2015
were not included in the diluted earnings per share calculation because the effect would have been anti-dilutive.
58
4. VALUATION AND QUALIFYING ACCOUNTS
Valuation and qualifying accounts included the following:
|
(in thousands)
|
Balance
Beginning of
Year
|
Net
Charged to
Costs and
Expenses
|
Translations,
Reclassifications
and Acquisitions
|
Net Write-Offs or
Discounts Taken
|
Balance
End of
Year
|
||||||||||||||||
|
2017
|
|
|
|
|
|
|
|||||||||||||||
|
Reserve for sales discounts
|
$
|
13,488
|
|
$
|
82,724
|
|
$
|
166
|
|
$
|
(80,726
|
)
|
$
|
15,652
|
|
||||||
|
Reserve for inventory obsolescence
|
7,262
|
|
3,007
|
|
886
|
|
(4,223
|
)
|
6,932
|
|
|||||||||||
|
Reserve for warranty
|
5,262
|
|
7,224
|
|
567
|
|
(7,718
|
)
|
5,335
|
|
|||||||||||
|
2016
|
|
|
|
|
|
|
|
|
|
|
|||||||||||
|
Reserve for sales discounts
|
$
|
15,094
|
|
$
|
77,126
|
|
$
|
(109
|
)
|
$
|
(78,623
|
)
|
$
|
13,488
|
|
||||||
|
Reserve for inventory obsolescence
|
9,675
|
|
2,041
|
|
295
|
|
(4,749
|
)
|
7,262
|
|
|||||||||||
|
Reserve for warranty
|
5,566
|
|
7,867
|
|
(49
|
)
|
(8,122
|
)
|
5,262
|
|
|||||||||||
|
2015
|
|
|
|
|
|
|
|
|
|
|
|||||||||||
|
Reserve for sales discounts
|
$
|
15,999
|
|
$
|
78,304
|
|
$
|
(145
|
)
|
$
|
(79,064
|
)
|
$
|
15,094
|
|
||||||
|
Reserve for inventory obsolescence
|
7,601
|
|
5,209
|
|
(454
|
)
|
(2,681
|
)
|
9,675
|
|
|||||||||||
|
Reserve for warranty
|
5,913
|
|
7,732
|
|
(325
|
)
|
(7,754
|
)
|
5,566
|
|
|||||||||||
Sales Discounts
On
December 31, 2017
, the Company had $
15,652,000
in reserves for sales discounts compared to $
13,488,000
on
December 31, 2016
on product shipped to our customers under various promotional programs. The Company reviews the reserve quarterly based on analysis made on each program outstanding at the time.
The Company bases its reserves on historical data relating to discounts taken by the customer under each program. Historically, between
85%
and
95%
of the Company’s customers who qualify for each program actually take the discount that is available.
Inventories – Obsolete and Slow Moving
The Company had a reserve of $
6,932,000
on
December 31, 2017
and $
7,262,000
on
December 31, 2016
to cover obsolete and slow moving inventory. The decrease in the reserve was primarily attributable to reductions of obsolete inventory in the Company's Industrial Division. The obsolete and slow moving inventory policy states that the reserve is to be calculated as follows: 1) no inventory usage over a
three
-year period is deemed obsolete and reserved at
100 percent
; and 2) slow moving inventory with little usage requires a
100 percent
reserve on items that have a quantity greater than a
three
-year supply. There are exceptions to the obsolete and slow moving classifications if approved by an officer of the Company, based on specific identification of an item or items that are deemed to be either included or excluded from this classification. In cases where there is no historical data, management makes a judgment based on a specific review of the inventory in question to determine what reserves, if any, are appropriate. New products or parts are generally excluded from the reserve policy until a
three
-year history has been established.
Warranty
The Company’s warranty policy is generally to provide its customers warranty for up to
one
year on all wholegood units and
90
days on parts, though some components can have warranty for longer terms.
Warranty reserve, as a percentage of sales, is generally calculated by looking at the current
twelve
months’ expenses and prorating that amount based on
twelve
months’ sales with a
ninety
-day to
six
-month lag period. The Company’s historical experience is that an end-user takes approximately
90
days to
six
months from the receipt of the unit to file a warranty claim. A warranty reserve is established for each different marketing group. Reserve balances are evaluated on a quarterly basis and adjustments made when required.
59
The current liability warranty reserve balance was $
5,335,000
on
December 31, 2017
and $
5,262,000
on
December 31, 2016
and is included in
Note 9
.
5. INVENTORIES
Inventories valued at LIFO represented
62%
and
49%
of total inventory for the years ended
December 31, 2017
and
2016
, respectively. The excess of current costs (market value) over LIFO-valued inventories was $
7,919,000
and $
8,123,000
on
December 31, 2017
and
December 31, 2016
, respectively. Inventories consisted of the following on a cost basis, net of reserves for obsolescence and LIFO:
|
|
December 31,
|
|||||||
|
(in thousands)
|
2017
|
2016
|
||||||
|
Finished goods and parts
|
$
|
133,161
|
|
$
|
116,667
|
|
||
|
Work in process
|
10,243
|
|
9,431
|
|
||||
|
Raw materials
|
12,164
|
|
9,662
|
|
||||
|
Inventory, net
|
$
|
155,568
|
|
$
|
135,760
|
|
||
6. PROPERTY, PLANT AND EQUIPMENT
Property, plant and equipment consist of the following:
|
|
December 31,
|
|
||||||||
|
(in thousands)
|
2017
|
2016
|
Useful
Lives
|
|||||||
|
Land
|
$
|
9,920
|
|
$
|
9,063
|
|
|
|||
|
Buildings and improvements
|
82,412
|
|
75,610
|
|
5-20 yrs.
|
|||||
|
Machinery and equipment
|
83,445
|
|
71,028
|
|
3-10 yrs.
|
|||||
|
Office furniture and equipment
|
8,153
|
|
7,165
|
|
3-7 yrs.
|
|||||
|
Computer software
|
12,500
|
|
11,889
|
|
3-7 yrs.
|
|||||
|
Transportation equipment
|
5,863
|
|
5,286
|
|
3 yrs.
|
|||||
|
Property, plant and equipment, at cost
|
202,293
|
|
180,041
|
|
|
|||||
|
Accumulated depreciation
|
(125,629
|
)
|
(113,412
|
)
|
|
|||||
|
Property, plant and equipment, net
|
$
|
76,664
|
|
$
|
66,629
|
|
|
|||
7. GOODWILL
The changes in the carrying amount of goodwill for the twelve months ended
December 31, 2015
,
2016
, and
2017
are as follows:
|
Industrial
|
Agricultural
|
European
|
Consolidated
|
||||||||||||||||
|
(in thousands)
|
|
|
|||||||||||||||||
|
Balance at December 31, 2014
|
$
|
57,320
|
|
$
|
695
|
|
$
|
17,676
|
|
$
|
75,691
|
|
|||||||
|
Translation adjustment
|
(1,027
|
)
|
(710
|
)
|
(1,444
|
)
|
(3,181
|
)
|
|||||||||||
|
Goodwill acquired
|
—
|
|
2,999
|
|
—
|
|
2,999
|
|
|||||||||||
|
Balance at December 31, 2015
|
$
|
56,293
|
|
$
|
2,984
|
|
$
|
16,232
|
|
$
|
75,509
|
|
|||||||
|
Translation adjustment
|
154
|
|
505
|
|
(1,343
|
)
|
(684
|
)
|
|||||||||||
|
Balance at December 31, 2016
|
$
|
56,447
|
|
$
|
3,489
|
|
$
|
14,889
|
|
$
|
74,825
|
|
|||||||
|
Translation adjustment
|
389
|
|
(27
|
)
|
1,833
|
|
2,195
|
|
|||||||||||
|
Goodwill acquired
|
4,846
|
|
2,895
|
|
—
|
|
7,741
|
|
|||||||||||
|
Balance at December 31, 2017
|
$
|
61,682
|
|
$
|
6,357
|
|
$
|
16,722
|
|
$
|
84,761
|
|
|||||||
60
8. DEFINITE- AND INDEFINITE-LIVED INTANGIBLE ASSETS
The following is a summary of both the Company's definite- and indefinite-lived intangible assets net of the accumulated amortization:
|
(in thousands)
|
Estimated Useful Lives
|
December 31,
2017 |
December 31, 2016
|
||||||||
|
Definite:
|
|||||||||||
|
Trade names and trademarks
|
25 years
|
$
|
25,574
|
|
$
|
21,914
|
|
||||
|
Customer and dealer relationships
|
10-14 years
|
31,356
|
|
28,822
|
|
||||||
|
Patents and drawings
|
3-12 years
|
1,982
|
|
1,954
|
|
||||||
|
Total at cost
|
58,912
|
|
52,690
|
|
|||||||
|
Less accumulated amortization
|
(11,540
|
)
|
(8,152
|
)
|
|||||||
|
Total net
|
47,372
|
|
44,538
|
|
|||||||
|
Indefinite:
|
|||||||||||
|
Trade names and trademarks
|
5,500
|
|
5,500
|
|
|||||||
|
Total Intangible Assets
|
$
|
52,872
|
|
$
|
50,038
|
|
|||||
The Company's net carrying value at
December 31, 2017
of intangible assets with definite useful lives consists of trade names and trademarks at
$22,331,000
, customer and dealer relationships at
$23,657,000
, and patents and drawings at
$1,384,000
. As of
December 31, 2017
, the related accumulated amortization balance for the definite- lived assets were
$3,243,000
for trade names and trademarks,
$7,699,000
for customer and dealer relationships, and
$598,000
for patents and drawings. The Company estimates amortization expense to be
$3,500,000
for each of the next five years.
Indefinite-lived trade names and trademarks consisted of the
Gradall
trade name with a carrying value of
$3,600,000
and the
Bush Hog
trade name with a carrying value of
$1,900,000
.
9. ACCRUED LIABILITIES
Accrued liabilities consist of the following balances:
|
|
December 31,
|
|||||||
|
(in thousands)
|
2017
|
2016
|
||||||
|
Salaries, wages and bonuses
|
$
|
27,073
|
|
$
|
19,368
|
|
||
|
Warranty
|
5,335
|
|
5,262
|
|
||||
|
State taxes
|
905
|
|
2,284
|
|
||||
|
Other
|
7,141
|
|
6,244
|
|
||||
|
Accrued Liabilities
|
$
|
40,454
|
|
$
|
33,158
|
|
||
10. FAIR VALUE OF FINANCIAL INSTRUMENTS
Fair value is defined as the exchange price that would be received for an asset or paid to transfer a liability (an exit price) in the principal or most advantageous market for the asset or liability in an orderly transaction between market participants. There is a three-tier fair value hierarchy based upon the observability of inputs used in valuation techniques. Observable inputs (highest level) reflect market data obtained from independent sources, while unobservable inputs (lowest level) reflect internally developed market assumptions. In fair value, measurements are classified under the following hierarchy:
Level 1
– Quoted prices for identical assets or liabilities in active markets.
Level 2
– Quoted prices for similar instruments in active markets; quoted prices for identical or similar instruments in markets that are not active; and model-derived valuations in which all significant inputs or significant value-drivers are observable in active markets.
Level 3
– Model-derived valuations in which one or more significant inputs or significant value-drivers are unobservable.
61
When measuring fair value, the Company maximizes use of observable inputs and minimizes the use of unobservable inputs.
Fair value measurements are classified to the lowest level input or value-driver that is significant to the valuation. A measurement may therefore be classified within Level 3 even though there may be significant inputs that are readily observable.
The carrying values of certain financial instruments, including cash and cash equivalents, accounts receivable, accounts payable, and accrued expenses, approximate fair value because of the short-term nature of these items. The carrying value of our debt approximates the fair value as of
December 31, 2017
and
2016
, as the floating rates on our outstanding balances approximate current market rates. This conclusion was made based on Level 2 inputs. Other than the investments held by the retirement benefit plans, as described in
Note 15
to the Consolidated Financial Statements, the Company does not have any other significant financial assets or liabilities measured at fair value on a recurring basis.
Fair value measurements are also used in connection with nonrecurring valuations performed in connection with impairment assessments and acquisition accounting. In completing the analysis of the fair values of certain assets acquired as part of business acquisitions, discounted cash flow models were used, which were principally based upon internal assumptions. In valuing certain of the acquired intangible assets, we used an excess earnings methodology, which is a form of a discounted cash flow analysis.
All of our nonrecurring valuations use significant unobservable inputs and therefore fall under Level 3 of the fair value hierarchy.
The components of long-term debt are as follows:
|
|
December 31,
|
|||||||
|
(in thousands)
|
2017
|
2016
|
||||||
|
Bank revolving credit facility
|
$
|
60,000
|
|
$
|
70,000
|
|
||
|
Capital lease obligations
|
—
|
|
—
|
|
||||
|
Other notes payable
|
82
|
|
90
|
|
||||
|
Total debt
|
60,082
|
|
70,090
|
|
||||
|
Less current maturities
|
82
|
|
73
|
|
||||
|
Total long-term debt
|
$
|
60,000
|
|
$
|
70,017
|
|
||
Effective December 20, 2016, the Company amended its revolving credit facility to extend the termination date, reduce LIBOR interest margin, and to modify certain financial and other covenants in order to meet the ongoing needs of the Company's business and to allow for greater flexibility in relation to future acquisitions.
The Company maintains an unsecured revolving credit facility with certain lenders under its Amended and Restated Revolving Credit Agreement ("Agreement"). The aggregate commitments from lenders under this Agreement are
$250,000,000
and, subject to certain conditions, the Company has the option to request an increase in aggregate commitments of up to an additional
$50,000,000
. The Agreement requires us to maintain various financial covenants including a minimum earnings before interest and tax to interest expense ratio, a maximum leverage ratio, and a minimum asset coverage ratio. The Agreement also contains various covenants relating to limitations on indebtedness, limitations on investments and acquisitions, limitations on sale of properties, and limitations on liens and capital expenditures. The Agreement also contains other customary covenants, representations and events of defaults. The expiration date of the revolving credit facility is
December 20, 2021
. As of
December 31, 2017
,
$60,000,000
was outstanding under the Agreement. On
December 31, 2017
,
$1,655,000
of the revolver capacity was committed to irrevocable standby letters of credit issued in the ordinary course of business as required by vendors' contracts resulting in
$188,345,000
in available borrowings.
62
The aggregate maturities of long-term debt, as of
December 31, 2017
, are as follows: $
82,000
in
2018
;
zero
in
2019
and
2020
;
$60,000,000
in
2021
; and
zero
thereafter.
The carrying value of our debt approximates the fair value as of
December 31, 2017
and
2016
, as our borrowings bear interest based upon short-term floating market interest rates. The fair value measurement for these liabilities is categorized as Level 2 in the fair value hierarchy. Fair values determined by Level 2 utilize inputs that are observable for the asset or liability, either directly or indirectly. These include quoted prices for similar assets or liabilities in active markets and quoted prices for identical or similar assets or liabilities in markets that are not active.
12. INCOME TAXES
On December 22, 2017, the U.S. enacted the Tax Cuts and Jobs Act (“TCJA”) that institutes fundamental changes to the U.S. Internal Revenue Code of 1986, as amended ("the Code"). TCJA includes changes to the taxation of foreign earnings by implementing a dividend exemption system, an expansion of the current anti-deferral rules, a minimum tax on low-taxed foreign earnings and new measures to deter base erosion. TCJA also includes a permanent reduction in the U.S. corporate tax rate to 21%, repeal of the corporate alternative minimum tax, certain expensing of capital investment, and a limitation of the deductions for interest expense and executive compensation. Furthermore, as part of the transition to the new tax system, a one-time transition tax is imposed on a U.S. shareholder’s historical undistributed earnings of foreign subsidiaries. Although TCJA is generally effective January 1, 2018, GAAP requires recognition of the tax effects of new legislation during the reporting period that includes the enactment date, which was December 22, 2017.
Due to the significant and complete changes to the Code from the TCJA, the SEC issued staff Accounting Bulletin No. 118, "Income Tax Accounting Implications of the Tax Cuts and Jobs Act," (SAB 118). SAB 118 provides measurement period for up to one year for adjustments to be made to account for the effects of the TCJA. The Company reflected the income tax effects of those aspects of TCJA for which the accounting is complete. To the extent that the Company’s accounting for certain income tax effects of TCJA is incomplete but the Company is able to determine a reasonable estimate, the Company recorded a provisional estimate in the financial statements. For those items where a reasonable estimate could not be made, a provisional amount was not recorded and the Company continued to apply the provisions of the tax laws that were in effect immediately before the enactment of TCJA.
The primary impacts of TCJA relate to the re-measurement of deferred tax assets and liabilities resulting from the change in the U.S. corporate tax rate and the one-time mandatory transition tax. For the year ended December 31, 2017, we recorded a tax benefit of approximately
$3,334,000
due to the decrease in the U.S. corporate tax rate from 35% to 21% and a tax charge of
$13,104,000
for the one-time transition tax on the deemed repatriation of previously undistributed accumulated earnings and profits of our international subsidiaries.
In accordance with TCJA, we will elect to pay the tax liability over a period of eight years, with the first installment of
$1,048,000
due in 2018; the remainder of the balance is recorded in Long-term tax liabilities. The transition tax is a provisional amount because certain information related to the computation of earnings and profits is not readily available and there is limited information from federal and state taxing authorities regarding the application and interpretation of the recently enacted legislation. We will disclose the impact to the provisional amount in the reporting period in which the accounting is completed, which will not exceed one year from the date of enactment of TCJA.
In addition to the changes described above, TCJA imposes a U.S. tax on Global Intangible Low Taxed Income (“GILTI”) that is earned by certain foreign affiliates owned by a U.S. shareholder. The computation of GILTI is still subject to interpretation and additional clarifying guidance is expected, but is generally intended to impose tax on the earnings of a foreign corporation that are deemed to exceed a certain threshold return relative to the underlying business investment. In accordance with guidance issued by Financial Accounting Standards Board ("FASB"), we are still evaluating whether to make a policy election to treat the GILTI tax as a period expense or to provide U.S. deferred taxes on temporary differences that are expected to generate GILTI income when they reverse in future years.
63
The jurisdictional components of income before taxes consist of the following:
|
|
December 31,
|
|||||||||||
|
(in thousands)
|
2017
|
2016
|
2015
|
|||||||||
|
Income before income taxes:
|
|
|
|
|||||||||
|
Domestic
|
$
|
61,329
|
|
$
|
44,446
|
|
$
|
52,313
|
|
|||
|
Foreign
|
21,038
|
|
17,743
|
|
14,554
|
|
||||||
|
|
$
|
82,367
|
|
$
|
62,189
|
|
$
|
66,867
|
|
|||
The components of income tax expense (benefit) consist of the following:
|
|
December 31,
|
|||||||||||
|
(in thousands)
|
2017
|
2016
|
2015
|
|||||||||
|
Current:
|
|
|
|
|||||||||
|
Domestic
|
$
|
26,713
|
|
$
|
11,958
|
|
$
|
13,293
|
|
|||
|
Foreign
|
6,222
|
|
5,491
|
|
4,614
|
|
||||||
|
State
|
3,789
|
|
2,075
|
|
2,947
|
|
||||||
|
|
36,724
|
|
19,524
|
|
20,854
|
|
||||||
|
Deferred:
|
|
|
|
|
|
|
||||||
|
Domestic
|
1,711
|
|
1,580
|
|
3,481
|
|
||||||
|
Foreign
|
(155
|
)
|
934
|
|
(718
|
)
|
||||||
|
State
|
(228
|
)
|
106
|
|
41
|
|
||||||
|
|
1,328
|
|
2,620
|
|
2,804
|
|
||||||
|
Total income taxes
|
$
|
38,052
|
|
$
|
22,144
|
|
$
|
23,658
|
|
|||
64
The difference between income tax expense (benefit) for financial statement purposes and the amount of income tax expense computed by applying the domestic statutory income tax rate of
35%
to income before income taxes consists of the following:
|
|
December 31,
|
|||||||||||
|
(in thousands)
|
2017
|
2016
|
2015
|
|||||||||
|
Domestic statutory rate at 35%
|
$
|
28,828
|
|
$
|
21,766
|
|
$
|
23,403
|
|
|||
|
Increase (reduction) from:
|
|
|
|
|
|
|
||||||
|
Jurisdictional rate differences
|
(1,863
|
)
|
(1,936
|
)
|
(2,192
|
)
|
||||||
|
Valuation allowance
|
308
|
|
1,731
|
|
797
|
|
||||||
|
Stock based compensation
|
(778
|
)
|
275
|
|
257
|
|
||||||
|
U.S. state taxes
|
2,463
|
|
1,295
|
|
1,942
|
|
||||||
|
Domestic production deduction
|
(1,039
|
)
|
(618
|
)
|
(518
|
)
|
||||||
|
R&D credit
|
(500
|
)
|
(329
|
)
|
(475
|
)
|
||||||
|
Other, net
|
397
|
|
(40
|
)
|
444
|
|
||||||
|
Provision for income taxes before tax reform
|
$
|
27,816
|
|
$
|
22,144
|
|
$
|
23,658
|
|
|||
|
Effective tax rate
|
34
|
%
|
36
|
%
|
35
|
%
|
||||||
|
Tax Reform:
|
||||||||||||
|
Rate change of deferreds
|
(3,334
|
)
|
—
|
|
—
|
|
||||||
|
Mandatory deemed repatriation expense
|
13,104
|
|
—
|
|
—
|
|
||||||
|
Other
|
466
|
|
—
|
|
—
|
|
||||||
|
Impact of tax reform
|
$
|
10,236
|
|
$
|
—
|
|
$
|
—
|
|
|||
|
Provision for income tax
|
$
|
38,052
|
|
$
|
22,144
|
|
$
|
23,658
|
|
|||
|
Effective tax rate
|
46
|
%
|
36
|
%
|
35
|
%
|
||||||
65
Deferred income taxes arise from temporary differences between the financial statement carrying amounts of existing assets and liabilities and their respective tax basis. The components of the Company’s deferred income tax assets and liabilities consist of the following:
|
|
December 31,
|
|||||||
|
(in thousands)
|
2017
|
2016
|
||||||
|
Deferred income tax assets:
|
|
|
||||||
|
Inventory basis difference
|
$
|
571
|
|
$
|
1,568
|
|
||
|
Accounts receivable reserve
|
310
|
|
231
|
|
||||
|
Rental equipment and Property, plant and equipment
|
4
|
|
—
|
|
||||
|
Stock based compensation
|
549
|
|
937
|
|
||||
|
Pension liability
|
2,859
|
|
3,947
|
|
||||
|
Employee benefit accrual
|
2,193
|
|
1,481
|
|
||||
|
Product liability and warranty reserves
|
1,211
|
|
1,600
|
|
||||
|
Expenses not currently deductible for tax purposes
|
—
|
|
28
|
|
||||
|
Foreign net operating loss
|
4,266
|
|
3,513
|
|
||||
|
State net operating loss
|
286
|
|
102
|
|
||||
|
Foreign tax credit
|
4,106
|
|
—
|
|
||||
|
Other
|
216
|
|
94
|
|
||||
|
Total deferred income tax assets
|
$
|
16,571
|
|
$
|
13,501
|
|
||
|
Less: Valuation allowance
|
(8,519
|
)
|
(3,382
|
)
|
||||
|
Net deferred income tax assets
|
$
|
8,052
|
|
$
|
10,119
|
|
||
|
|
|
|
|
|||||
|
Deferred income tax liabilities:
|
|
|
|
|
||||
|
Inventory basis differences
|
$
|
—
|
|
$
|
(16
|
)
|
||
|
Rental equipment and Property, plant and equipment
|
(7,477
|
)
|
(5,289
|
)
|
||||
|
Intangible assets
|
(7,064
|
)
|
(10,046
|
)
|
||||
|
Expenses not currently deductible for tax purposes
|
(887
|
)
|
(593
|
)
|
||||
|
|
|
|
|
|||||
|
Total deferred income tax liabilities
|
$
|
(15,428
|
)
|
$
|
(15,944
|
)
|
||
|
Net deferred income taxes
|
$
|
(7,376
|
)
|
$
|
(5,825
|
)
|
||
As of
December 31, 2017
, the Company had foreign deferred tax assets consisting of foreign net operating losses and other tax benefits available to reduce future taxable income in a foreign jurisdiction. These foreign jurisdictions’ net operating loss carry-forwards are in the approximate amount of
$10,680,000
with an unlimited carry-forward period, and
$3,759,000
with a carry-forward expiring in 2035. The Company also has U.S. state net operating loss carry-forwards in the amount of
$4,602,000
which will expire between 2018 and 2029.
We have recorded a valuation allowance as of
December 31, 2017
and
2016
due to uncertainties related to our ability to utilize some of the deferred income tax assets, primarily consisting of international operating losses and foreign tax credits generated by the transition tax, before they expire. The valuation allowance is based on estimates of taxable income in the various jurisdictions in which we operate and the period over which deferred income tax assets will be recoverable. The realization of net deferred income tax assets recorded as of
December 31, 2017
is primarily dependent upon the ability to generate future taxable income in certain U.S. states and international jurisdictions. The Company released a valuation allowance of
$147,000
in Canada related to restructuring.
66
Unrecognized tax benefits in the amount of
$234,000
and
$235,000
for
2017
and
2016
, respectively, are included in other non-current liabilities on the balance sheet. The unrecognized tax benefits, if recognized, would favorably impact our effective tax rate in a future period. We do not expect our unrecognized tax benefits disclosed above to change significantly over the next 12 months.
|
|
December 31,
|
|||||||
|
2017
|
2016
|
|||||||
|
Balance as of beginning of year
|
$
|
235,000
|
|
$
|
301,000
|
|
||
|
Additions for tax positions related to the current year
|
62,000
|
|
51,000
|
|
||||
|
Additions for tax positions related to prior years
|
—
|
|
—
|
|
||||
|
Reduction due to lapse of statute of limitations
|
(63,000
|
)
|
(117,000
|
)
|
||||
|
Balance as of end of year
|
$
|
234,000
|
|
$
|
235,000
|
|
||
The Company adopted the policy to include interest and penalty expense related to income taxes as interest and other expense, respectively. As of December 31, 2017, no interest or penalties has been accrued. The Company’s open tax years for its federal and state income tax returns are for the tax years ended 2013 through 2017. The Company’s open tax years for its foreign income tax returns are for the tax years ended 2011 through 2017. The Company is currently under audit for tax years 2014 and 2015 for the State of New York and for tax year 2011 and 2016 for certain subsidiaries in Canada.
The Company previously considered substantially all of the earnings in our foreign subsidiaries to be permanently reinvested and, accordingly, recorded no deferred income taxes on such earnings. As a result of the fundamental changes to the taxation of multinational corporations created by TCJA, we no longer intend to permanently reinvest all of the historical undistributed earnings of our foreign affiliates. We will distribute earnings from our European subsidiaries, while maintaining our permanent reinvestment for our other foreign subsidiaries. There will generally be no U.S. corporate taxes imposed on such future distributions of foreign earnings or foreign withholding and other local taxes. For the amounts we continue to assert permanent reinvestment, if the amounts were distributed, the company would be subject to approximately
$2,540,000
in withholding taxes.
13. COMMON STOCK
On January 2, 2018, the Board of Directors of the Company declared a quarterly dividend of $.11 per share which was paid on January 29, 2018 to holders of record as of January 16, 2018.
14. STOCK OPTIONS
Incentive Stock Option Plan
On May 7, 2015, the stockholders of the Company approved the 2015 Incentive Stock Option Plan (“2015 ISO Plan”) and the Company reserved
400,000
shares of common stock for options to be issued under the 2015 ISO Plan. Each option becomes vested and exercisable for up to
20%
of the total optioned shares
one
year following the grant of the option and for an additional
20%
of the total optioned shares after each succeeding year until the option is fully exercisable at the end of the fifth year.
We also maintain other incentive option plans that have expired, under which previously granted awards remain outstanding. No additional grants may be awarded under these plans.
67
Following is a summary of activity in the Incentive Stock Option Plans for the periods indicated:
|
|
2017
|
2016
|
2015
|
|||||||||||||||
|
|
Shares
|
Exercise
Price*
|
Shares
|
Exercise
Price*
|
Shares
|
Exercise
Price*
|
||||||||||||
|
Options outstanding at beginning of year
|
220,820
|
|
$
|
37.39
|
|
254,195
|
|
$
|
34.64
|
|
301,800
|
|
$
|
30.73
|
|
|||
|
Granted
|
10,750
|
|
83.99
|
|
21,000
|
|
54.87
|
|
29,500
|
|
53.95
|
|
||||||
|
Exercised
|
(54,945
|
)
|
24.83
|
|
(43,775
|
)
|
26.59
|
|
(75,355
|
)
|
26.11
|
|
||||||
|
Canceled
|
(3,750
|
)
|
54.57
|
|
(10,600
|
)
|
50.68
|
|
(1,750
|
)
|
53.61
|
|
||||||
|
Options outstanding at end of year
|
172,875
|
|
43.91
|
|
220,820
|
|
37.39
|
|
254,195
|
|
34.64
|
|
||||||
|
Options exercisable at end of year
|
111,875
|
|
$
|
36.44
|
|
136,220
|
|
$
|
29.66
|
|
143,345
|
|
$
|
25.69
|
|
|||
|
Options available for grant at end of year
|
344,950
|
|
|
|
353,450
|
|
|
|
370,750
|
|
|
|
||||||
*Weighted Averages
Options outstanding and exercisable at
December 31, 2017
were as follows:
|
Qualified Stock Options
|
Options Outstanding
|
Options Exercisable
|
|||||||||||||
|
|
Shares
|
Remaining Contractual Life (yrs)*
|
Exercise Price*
|
Shares
|
Exercise Price*
|
||||||||||
|
Range of Exercise Price
|
|
|
|
|
|
|
|
|
|
||||||
|
$11.45 - $22.55
|
12,575
|
|
0.79
|
$
|
17.78
|
|
12,575
|
|
$
|
17.78
|
|
||||
|
$24.69 - $42.70
|
80,650
|
|
4.38
|
$
|
34.57
|
|
73,850
|
|
$
|
33.82
|
|
||||
|
$49.44 - $83.99
|
79,650
|
|
7.50
|
$
|
57.48
|
|
25,450
|
|
$
|
53.27
|
|
||||
|
Total
|
172,875
|
|
|
|
|
111,875
|
|
|
|
||||||
*Weighted Averages
The weighted-average grant-date fair values of options granted during
2017
,
2016
, and
2015
were $
36.00
, $
27.48
and $
27.63
, respectively. Stock option expense was $
597,000
, $
787,000
and $
735,000
for years ending
2017
,
2016
, and
2015
, respectively. As of
December 31, 2017
, there was $
998,000
of total unrecognized compensation cost related to non-vested share-based compensation arrangements granted under the plans. That cost is expected to be recognized over a period of
five
years.
Equity Incentive Plan
Under the Company's 2009 Equity Incentive Plan the Company reserved
400,000
shares of common stock for options to purchase shares of common stock may be granted to non-employee directors. Options become vested and exercisable for up to
20%
of the total optioned shares
one
year following the grant of the option and for an additional
20%
of the total optioned shares after each succeeding year until the option is fully exercisable at the end of the fifth year.
|
|
2017
|
2016
|
2015
|
|
Options available for grant at end of year
|
176,294
|
207,608
|
232,522
|
We also maintain other incentive option plans that have expired, under which previously granted awards remain outstanding. No additional grants may be awarded under these plans.
68
Non-Qualified Options
Following is a summary of activity in the Non-Qualified Stock Option Plans for the periods indicated:
|
|
2017
|
2016
|
2015
|
|||||||||||||||
|
|
Shares
|
Exercise Price*
|
Shares
|
Exercise Price*
|
Shares
|
Exercise Price*
|
||||||||||||
|
Options outstanding at beginning of year
|
112,400
|
|
$
|
34.48
|
|
127,300
|
|
$
|
32.05
|
|
132,100
|
|
$
|
31.30
|
|
|||
|
Granted
|
—
|
|
—
|
|
—
|
|
—
|
|
—
|
|
—
|
|
||||||
|
Exercised
|
(45,400
|
)
|
22.73
|
|
(14,900
|
)
|
13.73
|
|
(4,800
|
)
|
11.45
|
|
||||||
|
Canceled
|
—
|
|
—
|
|
—
|
|
—
|
|
—
|
|
—
|
|
||||||
|
Options outstanding at end of year
|
67,000
|
|
42.43
|
|
112,400
|
|
34.48
|
|
127,300
|
|
32.05
|
|
||||||
|
Options exercisable at end of year
|
50,400
|
|
$
|
39.86
|
|
85,000
|
|
$
|
29.61
|
|
83,100
|
|
$
|
24.54
|
|
|||
*Weighted Averages
Options outstanding and exercisable as of
December 31, 2017
were as follows:
|
Non-Qualified Stock Options
|
Options Outstanding
|
Options Exercisable
|
|||||||||||||
|
|
Shares
|
Remaining Contractual Life (yrs)*
|
Exercise Price*
|
Shares
|
Exercise Price*
|
||||||||||
|
Range of Exercise Price
|
|
|
|
|
|
|
|
|
|
||||||
|
$11.45 - $22.55
|
8,000
|
|
1.36
|
$
|
11.45
|
|
8,000
|
|
$
|
11.45
|
|
||||
|
$24.69 - $42.70
|
30,000
|
|
5.02
|
39.99
|
|
25,000
|
|
39.45
|
|
||||||
|
$49.44 - $83.99
|
29,000
|
|
6.37
|
$
|
53.51
|
|
17,400
|
|
$
|
53.51
|
|
||||
|
Total
|
67,000
|
|
|
|
|
50,400
|
|
|
|
||||||
*Weighted Averages
There were no options granted in
2015
,
2016
or
2017
. Stock option expense was $
22,000
, $
27,000
and $
35,000
for years ending
2017
,
2016
, and
2015
, respectively. As of
December 31, 2017
, there was $
30,000
of total unrecognized compensation cost related to non-vested share-based compensation arrangements granted under the plans. That cost is expected to be recognized over a period of
five
years.
During
2017
,
2016
, and
2015
,
45,400
,
14,900
, and
4,800
non-qualified options were exercised, respectively,
$1,032,000
,
$205,000
, and
$55,000
of cash receipts were received, respectively, and tax deductions of
zero
, $
657,000
, and $
187,000
were realized, respectively, for the tax deductions from option exercises.
Restricted Stock Awards
Following is a summary of activity in the Restricted Stock Awards for the periods indicated:
|
|
2017
|
2016
|
2015
|
|||||||||||||||
|
|
Shares
|
Exercise Price*
|
Shares
|
Exercise Price*
|
Shares
|
Exercise Price*
|
||||||||||||
|
Options outstanding at beginning of year
|
45,621
|
|
$
|
54.58
|
|
32,616
|
|
$
|
53.31
|
|
12,043
|
|
$
|
44.10
|
|
|||
|
Granted
|
33,620
|
|
84.34
|
|
27,440
|
|
55.17
|
|
26,004
|
|
54.14
|
|
||||||
|
Exercised
|
(16,189
|
)
|
56.03
|
|
(11,909
|
)
|
52.67
|
|
(5,431
|
)
|
36.85
|
|
||||||
|
Canceled
|
—
|
|
—
|
|
(2,526
|
)
|
53.57
|
|
—
|
|
—
|
|
||||||
|
Options outstanding at end of year
|
63,052
|
|
70.08
|
|
45,621
|
|
54.58
|
|
32,616
|
|
53.31
|
|
||||||
*Weighted Averages
69
Restricted stock awards vest
25%
after
one
year following the award date and for an additional
25%
of total awarded shares each succeeding year until fully vested. The weighted-average remaining contractual life in years for
2017
,
2016
, and
2015
was
2.69
,
2.89
and
3.11
, respectively. Stock option expense was $
1,250,000
, $
600,000
and $
287,000
for years ending
2017
,
2016
, and
2015
, respectively. As of
December 31, 2017
, there was $
3,544,000
of total unrecognized compensation cost related to non-vested share-based compensation arrangements granted under the plans. That cost is expected to be recognized over a period of
four
years.
15. RETIREMENT BENEFIT PLANS
Defined Benefit Plans
In connection with the February 3, 2006 purchase of all the net assets of the
Gradall
excavator business, the Company assumed sponsorship of
two
Gradall
non-contributory defined benefit pension plans, both of which are frozen with respect to both future benefit accruals and future new entrants.
The
Gradall
Company Employees’ Retirement Plan covers approximately
250
former employees and
70
current employees who (i) were formerly employed by JLG Industries, Inc., (ii) were not covered by a collective bargaining agreement and (iii) first participated in the plan before December 31, 2004. An amendment ceasing future benefit accruals for certain participants was effective December 31, 2004. A second amendment discontinued all future benefit accruals for all participants effective April 24, 2006.
The
Gradall
Company Hourly Employees’ Pension Plan covered former employees and current employees who (i) were formerly employed by JLG Industries, Inc., (ii) were covered by a collective bargaining agreement and (iii) first participated in the plan before April 6, 1997. An amendment ceasing all future benefit accruals was effective April 6, 1997.
On April 6, 2016, the Company notified all participants in the
Gradall
Company Hourly Employees’ Pension Plan of our decision to terminate the plan. Participants in the plan did not lose any benefits but were given a choice between obtaining certain continued annuity benefits that match the benefits offered under the plan or receiving an immediate one-time lump sum payment in total settlement of benefits. The Company made a final contribution of
$622,000
and met all legal requirements to effectuate a proper termination of the plan before December 31, 2016. The Company expensed
$2,889,000
related to accumulative pension actuarial losses relating to the closure of the Gradall Hourly Employees' Savings and Investment Plan that had been previously deferred in Other comprehensive income and deferred taxes.
70
The following tables set forth the change in plan assets, change in projected benefit obligation, rate assumptions and components of net periodic benefit cost as of December 31 with respect to these plans. The measurement dates of the assets and liabilities of both plans were December 31 of the respective years presented.
|
|
Year Ended December 31, 2017
|
|||||||||||||
|
(in thousands)
|
Hourly
Employees’ Pension Plan |
Employees’
Retirement
Plan
|
Total
|
|||||||||||
|
Change in projected benefit obligation
|
|
|
|
|
|
|
||||||||
|
Benefit obligation at beginning of year
|
$
|
—
|
|
$
|
20,787
|
|
$
|
20,787
|
|
|||||
|
Service cost
|
—
|
|
4
|
|
4
|
|
||||||||
|
Interest cost
|
—
|
|
831
|
|
831
|
|
||||||||
|
Liability actuarial (gain) loss
|
—
|
|
866
|
|
866
|
|
||||||||
|
Benefits paid
|
—
|
|
(936
|
)
|
(936
|
)
|
||||||||
|
Benefit obligation at end of year
|
—
|
|
21,552
|
|
21,552
|
|
||||||||
|
Change in fair value of plan assets
|
|
|
|
|||||||||||
|
Fair value of plan assets at beginning of year
|
—
|
|
17,858
|
|
17,858
|
|
||||||||
|
Return on plan assets
|
—
|
|
2,505
|
|
2,505
|
|
||||||||
|
Employer contributions
|
—
|
|
900
|
|
900
|
|
||||||||
|
Benefits paid
|
—
|
|
(936
|
)
|
(936
|
)
|
||||||||
|
Fair value of plan assets at end of year
|
—
|
|
20,327
|
|
20,327
|
|
||||||||
|
Underfunded status - December 31, 2017
|
$
|
—
|
|
$
|
(1,225
|
)
|
$
|
(1,225
|
)
|
|||||
|
|
Year Ended December 31, 2016
|
|||||||||||||
|
(in thousands)
|
Hourly
Employees’
Pension Plan
|
Employees’
Retirement
Plan
|
Total
|
|||||||||||
|
Change in projected benefit obligation
|
|
|
|
|
|
|
||||||||
|
Benefit obligation at beginning of year
|
$
|
9,649
|
|
$
|
20,561
|
|
$
|
30,210
|
|
|||||
|
Service cost
|
8
|
|
4
|
|
12
|
|
||||||||
|
Interest cost
|
401
|
|
886
|
|
1,287
|
|
||||||||
|
Liability actuarial (gain)
|
(148
|
)
|
204
|
|
56
|
|
||||||||
|
Benefits paid
|
(575
|
)
|
(868
|
)
|
(1,443
|
)
|
||||||||
|
Settlements
|
(9,335
|
)
|
—
|
|
(9,335
|
)
|
||||||||
|
Benefit obligation at end of year
|
—
|
|
20,787
|
|
20,787
|
|
||||||||
|
Change in fair value of plan assets
|
|
|
|
|||||||||||
|
Fair value of plan assets at beginning of year
|
9,019
|
|
16,692
|
|
25,711
|
|
||||||||
|
Return on plan assets
|
119
|
|
1,284
|
|
1,403
|
|
||||||||
|
Employer contributions
|
772
|
|
750
|
|
1,522
|
|
||||||||
|
Benefits paid
|
(575
|
)
|
(868
|
)
|
(1,443
|
)
|
||||||||
|
Settlements
|
(9,335
|
)
|
—
|
|
(9,335
|
)
|
||||||||
|
Fair value of plan assets at end of year
|
—
|
|
17,858
|
|
17,858
|
|
||||||||
|
Underfunded status - December 31, 2016
|
$
|
—
|
|
$
|
(2,929
|
)
|
$
|
(2,929
|
)
|
|||||
The Company recognizes the overfunded or underfunded status (i.e., the difference between the fair value of plan assets and the projected benefit obligations) of defined benefit postretirement plans as an asset or liability in its consolidated balance sheet and recognizes changes in the funded status in the year in which the changes occur. The Company measures the funded status of a plan as of the date of the year-end consolidated balance sheet.
71
The underfunded status of the plans of
$1,225,000
and
$2,929,000
as of
December 31, 2017
and
2016
, respectively, is recognized in the accompanying consolidated balance sheets as long-term accrued pension liability because plan assets are less than the value of benefit obligations expected to be paid.
The accumulated benefit obligation for our pension plans represents the actuarial present value of benefits based on employee service and compensation as of a certain date and does not include an assumption about future compensation levels.
In determining the projected benefit obligation and the net pension cost, we used the following significant weighted-average assumptions:
Assumptions used to determine benefit obligations at December 31:
|
|
Hourly Employees’
Pension Plan
|
Employees’
Retirement Plan
|
||||
|
|
2017
|
2016
|
2017
|
2016
|
||
|
Discount rate
|
N/A
|
N/A
|
3.60%
|
4.10%
|
||
|
Composite rate of compensation increase
|
N/A
|
N/A
|
N/A
|
N/A
|
||
Assumptions used to determine net periodic benefit cost for the years ended December 31:
|
|
Hourly Employees’
Pension Plan
|
Employees’
Retirement Plan
|
||||
|
|
2017
|
2016
|
2017
|
2016
|
||
|
Discount rate
|
N/A
|
4.30%
|
4.10%
|
4.40%
|
||
|
Long-term rate of return on plan assets
|
N/A
|
7.25%
|
7.25%
|
7.25%
|
||
|
Composite rate of compensation increase
|
N/A
|
N/A
|
N/A
|
N/A
|
||
The Company employs a building block approach in determining the expected long-term rate of return on plan assets. Historical markets are studied and long-term historical relationships between equities and fixed income are preserved consistent with the widely accepted capital market principle that assets with higher volatility generate a greater return over the long run. Current market factors such as inflation and interest rates are evaluated before long-term market assumptions are determined. The long-term portfolio return is established via a building block approach with proper consideration of diversification and rebalancing. Peer data and historical returns are reviewed to check for reasonability and appropriateness.
72
The following tables present the components of net periodic benefit cost (gains are denoted with parentheses and losses are not):
|
|
Year Ended December 31, 2017
|
|||||||||||||
|
(in thousands)
|
Hourly Employees’
Pension Plan
|
Employees’
Retirement Plan
|
Total
|
|||||||||||
|
Service cost
|
$
|
—
|
|
$
|
4
|
|
$
|
4
|
|
|||||
|
Interest cost
|
—
|
|
831
|
|
831
|
|
||||||||
|
Expected return on plan assets
|
—
|
|
(1,275
|
)
|
(1,275
|
)
|
||||||||
|
Amortization of net loss
|
—
|
|
433
|
|
433
|
|
||||||||
|
Net periodic benefit cost
|
$
|
—
|
|
$
|
(7
|
)
|
$
|
(7
|
)
|
|||||
|
|
Year Ended December 31, 2016
|
|||||||||||||
|
(in thousands)
|
Hourly Employees’
Pension Plan
|
Employees’
Retirement Plan
|
Total
|
|||||||||||
|
Service cost
|
$
|
8
|
|
$
|
4
|
|
$
|
12
|
|
|||||
|
Interest cost
|
401
|
|
886
|
|
1,287
|
|
||||||||
|
Expected return on plan assets
|
(648
|
)
|
(1,196
|
)
|
(1,844
|
)
|
||||||||
|
Amortization of net loss
|
284
|
|
440
|
|
724
|
|
||||||||
|
Recognition of Settlement
|
2,889
|
|
—
|
|
2,889
|
|
||||||||
|
Net periodic benefit cost
|
$
|
2,934
|
|
$
|
134
|
|
$
|
3,068
|
|
|||||
The Company estimates that $
346,000
of unrecognized actuarial expense will be amortized from accumulated other comprehensive income (loss) into net periodic benefit costs during
2018
.
The Company employs a total return investment approach whereby a mix of equities and fixed income investments are used to maximize the long-term return of plan assets for a prudent level of risk. Risk tolerance is established through careful consideration of plan liabilities, plan funded status, and corporate financial condition. The investment portfolio contains a diversified blend of equity and fixed income investments. Furthermore, equity investments are diversified across U.S. and non-U.S. stocks, as well as growth, value, and small and large capitalizations. Other assets such as real estate, private equity, and hedge funds are used judiciously to enhance long-term returns while improving portfolio diversification. Derivatives may be used to gain market exposure in an efficient and timely manner; however, derivatives may not be used to leverage the portfolio beyond the market value of the underlying investments. Investment risk is measured and monitored on an ongoing basis through quarterly investment portfolio reviews, annual liability measurements, and periodic asset/liability studies. Our current asset allocations are consistent with our targeted allocations.
The pension plans' weighted-average asset allocations as a percentage of plan assets at December 31 are as follows:
|
|
Hourly Employees’
Pension Plan
|
Employees’ Retirement
Plan
|
||||
|
|
2017
|
2016
|
2017
|
2016
|
||
|
Equity securities
|
—%
|
—%
|
55%
|
54%
|
||
|
Debt securities
|
—%
|
—%
|
38%
|
38%
|
||
|
Short-term investments
|
—%
|
—%
|
2%
|
3%
|
||
|
Other
|
—%
|
—%
|
5%
|
5%
|
||
|
Total
|
—%
|
—%
|
100%
|
100%
|
||
73
The following table presents the hierarchy levels for our postretirement benefit plan investments as of December 31 as described in
Note 1
to the Consolidated Financial Statements:
|
(in thousands) |
December 31, 2017
|
Quoted
Prices in Active
Markets for
Identical Assets
(Level 1)
|
Significant
Other
Observable
Inputs
(Level 2)
|
Significant
Unobservable
Inputs
(Level 3)
|
||||||||||||||||
|
Mutual Funds:
|
|
|
|
|
||||||||||||||||
|
Mid Cap
|
$
|
1,321
|
|
$
|
1,321
|
|
$
|
—
|
|
$
|
—
|
|
||||||||
|
Large Cap
|
2,930
|
|
2,930
|
|
—
|
|
—
|
|
||||||||||||
|
International
|
2,300
|
|
2,300
|
|
—
|
|
—
|
|
||||||||||||
|
Common/Collective Trusts:
|
||||||||||||||||||||
|
Liability Driven Solution
|
2,845
|
|
—
|
|
2,845
|
|
—
|
|
||||||||||||
|
Wells Fargo BlackRock International Equity
|
859
|
|
—
|
|
859
|
|
—
|
|
||||||||||||
|
Wells Fargo Core Bond
|
1,416
|
|
—
|
|
1,416
|
|
—
|
|
||||||||||||
|
Wells Fargo/Causeway
|
861
|
|
—
|
|
861
|
|
—
|
|
||||||||||||
|
Wells Fargo BlackRock Large Cap Growth Index Fund
|
1,146
|
|
—
|
|
1,146
|
|
—
|
|
||||||||||||
|
Wells Fargo BlackRock Large Cap Value Index Fund
|
1,146
|
|
—
|
|
1,146
|
|
—
|
|
||||||||||||
|
Wells Fargo Multi-Manager Small Cap
|
1,387
|
|
—
|
|
1,387
|
|
—
|
|
||||||||||||
|
Wells Fargo Russell 2000 Index Fund
|
636
|
|
—
|
|
636
|
|
—
|
|
||||||||||||
|
Wells Fargo S&P Mid Cap Index Fund
|
715
|
|
—
|
|
715
|
|
—
|
|
||||||||||||
|
Wells Fargo/MFS Value CIT F
|
578
|
|
—
|
|
578
|
|
—
|
|
||||||||||||
|
Wells Fargo/T. Rowe Price I Large-Cap Growth Managed CIT
|
577
|
|
—
|
|
577
|
|
—
|
|
||||||||||||
|
Wells Fargo/T. Rowe Price Equity Income
|
577
|
|
—
|
|
577
|
|
—
|
|
||||||||||||
|
Wells Fargo Voya Large Cap Growth CIT F
|
577
|
|
—
|
|
577
|
|
—
|
|
||||||||||||
|
Cash & Short-term Investments
|
456
|
|
456
|
|
—
|
|
—
|
|
||||||||||||
|
Total
|
$
|
20,327
|
|
$
|
7,007
|
|
$
|
13,320
|
|
$
|
—
|
|
||||||||
74
|
(in thousands) |
December 31, 2016
|
Quoted
Prices in Active
Markets for
Identical Assets
(Level 1)
|
Significant
Other
Observable
Inputs
(Level 2)
|
Significant
Unobservable
Inputs
(Level 3)
|
||||||||||||||||
|
Mutual Funds:
|
|
|
|
|
||||||||||||||||
|
Mid Cap
|
$
|
680
|
|
$
|
680
|
|
$
|
—
|
|
$
|
—
|
|
||||||||
|
Large Cap
|
3,553
|
|
3,553
|
|
—
|
|
—
|
|
||||||||||||
|
International
|
2,010
|
|
2,010
|
|
—
|
|
—
|
|
||||||||||||
|
Common/Collective Trusts:
|
||||||||||||||||||||
|
Liability Driven Solution
|
2,522
|
|
—
|
|
2,522
|
|
—
|
|
||||||||||||
|
Wells Fargo BlackRock International Equity
|
727
|
|
—
|
|
727
|
|
—
|
|
||||||||||||
|
Wells Fargo Core Bond
|
1,254
|
|
—
|
|
1,254
|
|
—
|
|
||||||||||||
|
Wells Fargo/Causeway
|
741
|
|
—
|
|
741
|
|
—
|
|
||||||||||||
|
Wells Fargo BlackRock Large Cap Growth Index Fund
|
1,009
|
|
—
|
|
1,009
|
|
—
|
|
||||||||||||
|
Wells Fargo BlackRock Large Cap Value Index Fund
|
1,006
|
|
—
|
|
1,006
|
|
—
|
|
||||||||||||
|
Wells Fargo Multi-Manager Small Cap
|
1,189
|
|
—
|
|
1,189
|
|
—
|
|
||||||||||||
|
Wells Fargo Russell 2000 Index Fund
|
560
|
|
—
|
|
560
|
|
—
|
|
||||||||||||
|
Wells Fargo S&P Mid Cap Index Fund
|
630
|
|
—
|
|
630
|
|
—
|
|
||||||||||||
|
Wells Fargo/MFS Value CIT F
|
501
|
|
—
|
|
501
|
|
—
|
|
||||||||||||
|
Wells Fargo/T. Rowe Price I Large-Cap Growth Managed CIT
|
505
|
|
—
|
|
505
|
|
—
|
|
||||||||||||
|
T. Rowe Price Equity Income
|
504
|
|
—
|
|
504
|
|
—
|
|
||||||||||||
|
Cash & Short-term Investments
|
467
|
|
467
|
|
—
|
|
—
|
|
||||||||||||
|
Total
|
$
|
17,858
|
|
$
|
6,710
|
|
$
|
11,148
|
|
$
|
—
|
|
||||||||
Our interests in the common collective trust investments are managed by one custodian. Consistent with our investment policy, the custodian has invested the assets across a widely diversified portfolio of U.S. and international equity and fixed income securities. Fair values of each security within the collective trust as of
December 31, 2017
were obtained from the custodian and are based on quoted market prices of individual investments; however, since the fund itself does not have a quoted market price, these assets are considered Level 2.
The common collective funds noted in the above table have estimated fair value using the net asset value per share of investments. Investments can be redeemed immediately at the current net asset value per share based on the fair value of the underlying assets. Redemption frequency is daily. The categories contain investments in equity securities of smaller growing companies, medium-sized U.S. companies, large value-oriented and growth-oriented companies, and foreign companies traded on international markets.
75
Expected benefit payments are estimated using the same assumptions used in determining our benefit obligation as of
December 31, 2017
. The following table illustrates the estimated pension benefit payments that are projected to be paid:
|
(in thousands)
|
Employees’
Retirement Plan
|
||||
|
2018
|
$
|
1,125
|
|
||
|
2019
|
1,146
|
|
|||
|
2020
|
1,160
|
|
|||
|
2021
|
1,220
|
|
|||
|
2022
|
1,253
|
|
|||
|
Years 2023 through 2027
|
6,348
|
|
|||
Supplemental Retirement Plan
The Board of Directors of the Company adopted the Alamo Group Inc. Supplemental Executive Retirement Plan (the “SERP”), effective as of January 3, 2011. The SERP will benefit certain key management or other highly compensated employees of the Company and/or certain subsidiaries who are selected by the Compensation Committee and approved by the Board to participate.
The SERP is intended to provide a benefit from the Company upon retirement, death or disability, or a change in control of the Company. Accordingly, the SERP obligates the Company to pay to a participant a Retirement Benefit (as defined in the SERP) upon the occurrence of certain payment events to the extent a participant has a vested right thereto. A participant’s right to his or her Retirement Benefit becomes vested in the Company’s contributions upon
10
years of Credited Service (as defined in the SERP) or a change in control of the Company. The Retirement Benefit is based on
20%
of the final
three
-year average salary of each participant on or after his or her normal retirement age (
65
years of age). In the event of the participant’s death or a change in control, the participant’s vested retirement benefit will be paid in a lump sum to the participant or his or her estate, as applicable, within
90
days after the participant’s death or a change in control, as applicable. In the event that the participant is entitled to a benefit from the SERP due to disability, retirement or other termination of employment, the benefit will be paid in monthly installments over a period of
fifteen
years.
The Company records amounts relating to the SERP based on calculations that incorporate various actuarial and other assumptions, including discount rates, rate of compensation increases, retirement dates and life expectancies. The net periodic costs are recognized as employees render the services necessary to earn the SERP benefits.
In May of 2015, the Board amended the SERP to allow the Board to modify the retirement benefit percentage either higher or lower than 20%. In May of 2016, the Board added additional highly compensated employees to the plan. As of
December 31, 2017
, the current retirement benefit (as defined in the plan) for the participants ranges from
10%
to
20%
.
The change in the Projected Benefit Obligation (PBO) as of
December 31, 2017
and
2016
, is shown below:
|
Year Ended December 31,
|
||||||||
|
(in thousands)
|
2017
|
2016
|
||||||
|
Benefit obligation at January 1,
|
$
|
5,387
|
|
$
|
3,962
|
|
||
|
Service cost
|
198
|
|
176
|
|
||||
|
Interest cost
|
204
|
|
175
|
|
||||
|
Liability actuarial loss (gain)
|
247
|
|
183
|
|
||||
|
Benefits paid
|
(91
|
)
|
(67
|
)
|
||||
|
Plan amendments
|
—
|
|
958
|
|
||||
|
Benefit obligation at December 31,
|
$
|
5,945
|
|
$
|
5,387
|
|
||
76
The components of net periodic pension expense were as follows:
|
Year Ended December 31,
|
||||||||
|
(in thousands)
|
2017
|
2016
|
||||||
|
Service cost
|
$
|
198
|
|
$
|
176
|
|
||
|
Interest cost
|
204
|
|
175
|
|
||||
|
Amortization of prior service cost
|
406
|
|
364
|
|
||||
|
Net periodic benefit cost
|
$
|
808
|
|
$
|
715
|
|
||
The Company estimates that
$501,000
of unrecognized actuarial expense will be amortized from accumulated other comprehensive income into net periodic benefit costs during
2018
.
In determining the projected benefit obligation and the net pension cost, we used the following significant weighted-average assumptions:
Assumptions used to determine benefit obligations at December 31:
|
|
2017
|
2016
|
|
|
Discount rate
|
3.45%
|
3.85%
|
|
|
Composite rate of compensation increase
|
3.00%
|
3.00%
|
|
Assumptions used to determine net periodic benefit cost for the years ended December 31:
|
|
2017
|
2016
|
|
|
Discount rate
|
3.85%
|
4.05%
|
|
|
Composite rate of compensation increase
|
3.00%
|
3.00%
|
|
|
Long-term rate of return on plan assets
|
N/A
|
N/A
|
|
Future estimated benefits expected to be paid from the plan over the next
ten
years as follows in thousands:
|
2018
|
$
|
291
|
|
|
2019
|
294
|
|
|
|
2020
|
315
|
|
|
|
2021
|
317
|
|
|
|
2022
|
366
|
|
|
|
Years 2023 through 2027
|
2,355
|
|
|
Defined Contribution Plans
The Company has
two
defined contribution plans, The
Gradall
Salaried Employees’ Savings and Investment Plan (“Salary Plan”) and The International Association of Machinist and Aerospace Workers Retirement Plan (“IAM Plan”). The Company contributed $
408,000
and $
435,000
to the IAM Plan for the plan years ended
December 31, 2017
and
2016
, respectively. The Company converted the Salary Plan into its 401(k) retirement and savings plan and put the Hourly Plan into a separate 401(k) retirement and savings plan.
The Company provides a defined contribution 401(k) retirement and savings plan for eligible U.S. employees. Company matching contributions are based on a percentage of employee contributions. Company contributions to the plan during
2017
,
2016
and
2015
were $
1,942,000
, $
1,900,000
, and $
1,871,000
, respectively.
Three
of the Company’s international subsidiaries also participate in a defined contribution and savings plan covering eligible employees. The Company’s international subsidiaries contribute between
0%
and
10%
of the participant’s salary up to a specific limit. Total contributions made to the above plans were $
716,000
, $
735,000
, and $
864,000
for the years ended
December 31, 2017
,
2016
and
2015
, respectively.
77
16. SEGMENT REPORTING
The Company has
three
reportable segments: Industrial, Agricultural and European. The Company’s sales are principally within the United States, United Kingdom, France, Canada and Australia. The Company sells its products primarily through a network of independent dealers and distributors to governmental end-users, related independent contractors, as well as to the agricultural and commercial turf markets.
The Company has included a summary of the financial information by reporting segment. The following table presents the revenues and income from operations by reporting segment for the years ended
December 31, 2017
,
2016
, and
2015
:
|
|
December 31,
|
||||||||||
|
(in thousands)
|
2017
|
2016
|
2015
|
||||||||
|
Net Revenue
|
|
|
|
||||||||
|
Industrial
|
$
|
522,706
|
|
$
|
484,088
|
|
$
|
498,761
|
|
||
|
Agricultural
|
227,389
|
|
205,834
|
|
208,257
|
|
|||||
|
European
|
162,285
|
|
154,826
|
|
172,559
|
|
|||||
|
Consolidated
|
$
|
912,380
|
|
$
|
844,748
|
|
$
|
879,577
|
|
||
|
Income from Operations
|
|
|
|
|
|
|
|||||
|
Industrial
|
$
|
51,914
|
|
$
|
35,984
|
|
$
|
42,194
|
|
||
|
Agricultural
|
24,059
|
|
20,720
|
|
17,295
|
|
|||||
|
European
|
12,765
|
|
10,916
|
|
7,039
|
|
|||||
|
Consolidated
|
$
|
88,738
|
|
$
|
67,620
|
|
$
|
66,528
|
|
||
The following table presents the goodwill and total identifiable assets by reporting segment for the years ended
December 31, 2017
and
2016
:
|
(in thousands)
|
December 31, 2017
|
December 31, 2016
|
|||||
|
Goodwill
|
|||||||
|
Industrial
|
$
|
61,682
|
|
$
|
56,447
|
|
|
|
Agricultural
|
6,357
|
|
3,489
|
|
|||
|
European
|
16,722
|
|
14,889
|
|
|||
|
Consolidated
|
$
|
84,761
|
|
$
|
74,825
|
|
|
|
Total Identifiable Assets
|
|||||||
|
Industrial
|
$
|
369,271
|
|
$
|
339,064
|
|
|
|
Agricultural
|
141,023
|
|
111,120
|
|
|||
|
European
|
129,377
|
|
102,592
|
|
|||
|
Consolidated
|
$
|
639,671
|
|
$
|
552,776
|
|
|
78
17. INTERNATIONAL OPERATIONS AND GEOGRAPHIC INFORMATION
Following is selected financial information on the Company’s international operations, which include Europe, Canada and Australia:
|
|
December 31,
|
||||||||||
|
(in thousands)
|
2017
|
2016
|
2015
|
||||||||
|
Net sales
|
$
|
254,144
|
|
$
|
232,291
|
|
$
|
243,108
|
|
||
|
Income from operations
|
23,110
|
|
18,544
|
|
9,682
|
|
|||||
|
Income before income taxes
|
22,476
|
|
18,720
|
|
15,840
|
|
|||||
|
Identifiable assets
|
227,758
|
|
167,990
|
|
194,839
|
|
|||||
Following is other selected geographic financial information on the Company’s operations:
|
|
December 31,
|
||||||||||
|
(in thousands)
|
2017
|
2016
|
2015
|
||||||||
|
Geographic net sales:
|
|
|
|
||||||||
|
United States
|
$
|
663,600
|
|
$
|
615,028
|
|
$
|
635,923
|
|
||
|
United Kingdom
|
44,416
|
|
45,184
|
|
59,621
|
|
|||||
|
France
|
86,443
|
|
79,070
|
|
80,762
|
|
|||||
|
Canada
|
52,332
|
|
48,357
|
|
44,388
|
|
|||||
|
Australia
|
12,778
|
|
13,580
|
|
13,801
|
|
|||||
|
Other
|
52,811
|
|
43,529
|
|
45,082
|
|
|||||
|
Total net sales
|
$
|
912,380
|
|
$
|
844,748
|
|
$
|
879,577
|
|
||
|
Geographic location of long-lived assets:
|
|
|
|
|
|||||||
|
United States
|
$
|
171,048
|
|
$
|
166,707
|
|
$
|
174,811
|
|
||
|
United Kingdom
|
18,948
|
|
16,254
|
|
20,338
|
|
|||||
|
France
|
19,324
|
|
16,772
|
|
18,755
|
|
|||||
|
Canada
|
24,302
|
|
19,435
|
|
21,466
|
|
|||||
|
Australia
|
917
|
|
1,401
|
|
1,189
|
|
|||||
|
Brazil
|
11,558
|
|
3,621
|
|
2,742
|
|
|||||
|
Total long-lived assets
|
$
|
246,097
|
|
$
|
224,190
|
|
$
|
239,301
|
|
||
Net sales are attributed to countries based on the location of customers.
79
18. COMMITMENTS AND CONTINGENCIES
Leases
The Company leases office space and equipment under various operating leases, which generally are expected to be renewed or replaced by other leases. In 2016, all previously disclosed capital leases ended. The Company did not enter into any new capital leases. As of
December 31, 2017
, future minimum lease payments under these non-cancelable leases are:
|
(in thousands)
|
Operating
Leases
|
|||
|
2018
|
$
|
3,899
|
|
|
|
2019
|
2,787
|
|
||
|
2020
|
1,502
|
|
||
|
2021
|
724
|
|
||
|
2022
|
177
|
|
||
|
Thereafter
|
55
|
|
||
|
Total minimum lease payments
|
$
|
9,144
|
|
|
Rental expense for operating leases was $
4,788,000
for
2017
, $
4,060,000
for
2016
, and $
4,295,000
for
2015
.
Other Commitments
Like other manufacturers, the Company is subject to a broad range of federal, state, local and foreign laws and requirements, including those concerning air emissions, discharges into waterways, and the generation, handling, storage, transportation, treatment and disposal of hazardous substances and waste materials, as well as the remediation of contamination associated with releases of hazardous substances at the Company’s facilities and off-site disposal locations, workplace safety and equal employment opportunities. These laws and regulations are constantly changing, and it is impossible to predict with accuracy the effect that changes to such laws and regulations may have on the Company in the future. Like other industrial concerns, the Company’s manufacturing operations entail the risk of noncompliance, and there can be no assurance that the Company will not incur material costs or other liabilities as a result thereof.
The Company knows that its Indianola, Iowa property is contaminated with chromium which most likely resulted from chrome plating operations which were discontinued before the Company purchased the property. Chlorinated volatile organic compounds have also been detected in water samples on the property, though the source is unknown at this time. The Company voluntarily worked with an environmental consultant and the state of Iowa with respect to these issues and believes it completed its remediation program in June 2006. The work was accomplished within the Company’s environmental liability reserve balance. We requested a “no further action” classification from the state. In January 2009, we received a "no further action" letter from the Iowa Department of Natural Resources, according to which the Iowa property will be subject to certain ongoing environmental covenants that create restrictions regarding the use and future development of the property.
80
19. QUARTERLY FINANCIAL DATA (Unaudited)
Summarized quarterly financial data for
2017
and
2016
are presented below. Seasonal influences affect the Company’s sales and profits, with heavier business occurring in May through August.
(in thousands, except per share amounts)
|
|
2017
|
2016
|
|||||||||||||||||||||||
|
|
First
|
Second
|
Third
|
Fourth
(1)
|
First
|
Second
|
Third
|
Fourth
|
|||||||||||||||||
|
Sales
|
$
|
215,389
|
|
$
|
213,276
|
|
$
|
240,455
|
|
$
|
243,260
|
|
$
|
210,971
|
|
$
|
211,489
|
|
$
|
216,766
|
|
$
|
205,522
|
|
|
|
Gross profit
|
54,164
|
|
54,679
|
|
64,939
|
|
60,911
|
|
50,277
|
|
52,178
|
|
54,711
|
|
47,933
|
|
|||||||||
|
Net income
|
12,167
|
|
12,316
|
|
16,592
|
|
3,240
|
|
8,659
|
|
10,562
|
|
13,236
|
|
7,588
|
|
|||||||||
|
Earnings per share
|
|
|
|
|
|
|
|
|
|
|
|
|
|
|
|
|
|||||||||
|
Diluted
|
$
|
1.05
|
|
$
|
1.05
|
|
$
|
1.42
|
|
$
|
0.27
|
|
$
|
0.75
|
|
$
|
0.92
|
|
$
|
1.14
|
|
$
|
0.65
|
|
|
|
Average shares
|
|
|
|
|
|
|
|
|
|
|
|
|
|
|
|
|
|||||||||
|
Diluted
|
11,620
|
|
11,671
|
|
11,708
|
|
11,727
|
|
11,507
|
|
11,550
|
|
11,595
|
|
11,608
|
|
|||||||||
|
Dividends per share
|
$
|
0.10
|
|
$
|
0.10
|
|
$
|
0.10
|
|
$
|
0.10
|
|
$
|
0.09
|
|
$
|
0.09
|
|
$
|
0.09
|
|
$
|
0.09
|
|
|
|
Market price of
common stock
|
|
|
|
|
|
|
|
|
|
|
|
|
|
|
|
|
|||||||||
|
High
|
$
|
79.50
|
|
$
|
92.67
|
|
$
|
107.69
|
|
$
|
119.50
|
|
$
|
61.82
|
|
$
|
66.01
|
|
$
|
68.04
|
|
$
|
78.91
|
|
|
|
Low
|
$
|
71.20
|
|
$
|
71.72
|
|
$
|
86.80
|
|
$
|
104.87
|
|
$
|
48.26
|
|
$
|
52.82
|
|
$
|
61.49
|
|
$
|
59.55
|
|
|
(1) The Net income for the fourth quarter of 2017 includes a one-time charge of
$10.1 million
relating to the U.S. tax reform act.
The sum of quarterly earnings per share may not equal total year earnings per share due to rounding of earnings per share amounts, and differences in weighted-average shares and equivalent shares outstanding for each of the periods presented.
81
TABLE OF CONTENTS
Part IItem 1. BusinessItem 1A. Risk FactorsItem 1B. Unresolved Staff CommentsItem 2. PropertiesItem 3. Legal ProceedingsItem 4. Mine Safety DisclosuresPart IIItem 5. Market For Registrant S Common Equity, Related Stockholder Matters and Issuer Purchases Of Equity SecuritiesItem 6. Selected Financial DataItem 7. Management S Discussion and Analysis Of Financial ConditionItem 7A. Quantitative and Qualitative Disclosures About Market RiskItem 8. Financial Statements and Supplementary DataItem 9. Changes in and Disagreements with Accountants on Accounting and Financial DisclosureItem 9A. Controls and ProceduresItem 9B. Other InformationPart IIIItem 10. Directors, Executive Officers and Corporate GovernanceItem 11. Executive CompensationItem 12. Security Ownership Of Certain Beneficial Owners and Management and Related Stockholder MattersItem 13. Certain Relationships, Related Transactions and Director IndependenceItem 14. Principal Accountant Fees and ServicesPart IVItem 15. Exhibits and Financial Statement SchedulesItem 16. Summary