ALIGN TECHNOLOGY INC
10-Ks and 10-Qs
|
|
|
|
|
|
|
|
|
|
|
|
|
|
|
|
|
|
|
|
|
|
|
|
|
|
|
|
|
|
|
|
|
|
|
|
|
|
|
|
|
|
|
|
|
|
|
|
|
|
|
|
|
|
|
|
SECURITIES AND EXCHANGE COMMISSION
Washington, D.C. 20549
________________________________________________________________________
FORM 10-K
________________________________________________________________________
(Mark One)
|
ý
|
ANNUAL REPORT PURSUANT TO SECTION 13 OR 15(d) OF THE SECURITIES EXCHANGE ACT OF 1934
|
For the fiscal year ended
December 31, 2014
Or
|
¨
|
TRANSITION REPORT PURSUANT TO SECTION 13 OR 15(d) OF THE SECURITIES EXCHANGE ACT OF 1934
|
For the transition period from to
Commission file number: 0-32259
_____________________________________________________________________
ALIGN TECHNOLOGY, INC.
(Exact name of registrant as specified in its charter)
_____________________________________________________________________
|
Delaware
|
|
94-3267295
|
|
(State or other jurisdiction of
incorporation or organization)
|
|
(I.R.S. Employer
Identification Number)
|
2560 Orchard Parkway
San Jose, California 95131
(Address of principal executive offices)
(408) 470-1000
(Registrant’s telephone number, including area code)
Securities registered pursuant to Section 12(b) of the Act:
______________________________________________________
|
Title of each class
|
|
Name of each exchange on which registered
|
|
Common Stock, $0.0001 par value
(Including associated Preferred Stock Purchase Rights)
|
|
The NASDAQ Stock Market LLC
(NASDAQ Global Market)
|
Securities registered pursuant to Section 12(g) of the Act:
None
Indicate by check mark if the registrant is a well-known seasoned issuer, as defined in Rule 405 of the Securities Act. Yes
ý
No
¨
Indicate by check mark if the registrant is not required to file reports pursuant to Section 13 or Section 15(d) of the Exchange Act. Yes
¨
No
ý
Indicate by check mark whether the registrant (1) has filed all reports required to be filed by Section 13 or 15(d) of the Securities Exchange Act of 1934 during the preceding 12 months (or for such shorter period that the registrant was required to file such reports), and (2) has been subject to such filing requirements for the past 90 days. Yes
ý
No
¨
Indicate by check mark whether the registrant has submitted electronically and posted on its corporate Web site, if any, every Interactive Data File required to be submitted and posted pursuant to Rule 405 of Regulation S-T (§232.405 of this chapter) during the preceding 12 months (or for such shorter period that the registrant was required to submit and post such files). Yes
ý
No
¨
Indicate by check mark if disclosure of delinquent filers pursuant to Item 405 of Regulation S-K is not contained herein, and will not be contained, to the best of registrant’s knowledge, in definitive proxy or information statements incorporated by reference in Part III of this Form 10-K or any amendment to this Form 10-K.
ý
Indicate by check mark whether the registrant is a large accelerated filer, an accelerated filer, a non-accelerated filer, or a smaller reporting company. See definitions of “large accelerated filer,” “accelerated filer,” and “smaller reporting company” in Rule 12b-2 of the Exchange Act. (Check one):
|
Large accelerated filer
x
|
Accelerated filer
o
|
|
|
Non-accelerated filer
o
|
(Do not check if a smaller reporting company)
|
Smaller reporting company
o
|
Indicate by check mark whether the registrant is a shell company (as defined in Rule 12b-2 of the Exchange Act). Yes
¨
No
ý
The aggregate market value of the registrant’s common stock held by non-affiliates of the registrant was $
4,457,461,725
as of
June 30, 2014
based on the closing sale price of the registrant’s common stock on the NASDAQ Global Market on such date. Shares held by persons who may be deemed affiliates have been excluded. This determination of affiliate status is not necessarily a conclusive determination for other purposes.
On
February 20, 2015
,
80,720,243
shares of the registrant’s common stock were outstanding.
DOCUMENTS INCORPORATED BY REFERENCE
Portions of the registrant’s definitive Proxy Statement relating to its 2014 Annual Stockholders’ Meeting to be filed pursuant to Regulation 14A within 120 days after the registrant’s fiscal year end of
December 31, 2014
are incorporated by reference into Part III of this Annual Report on Form 10-K.
1
ALIGN TECHNOLOGY, INC.
FORM 10-K
For the Year Ended
December 31, 2014
TABLE OF CONTENTS
|
|
|
Page
|
|
Item 1.
|
Business
|
|
|
Executive Officers of the Registrant
|
||
|
Item 1A.
|
Risk Factors
|
|
|
Item 1B.
|
Unresolved Staff Comments
|
|
|
Item 2.
|
Properties
|
|
|
Item 3.
|
Legal Proceedings
|
|
|
Item 4.
|
Mine Safety Disclosures
|
|
|
Item 5.
|
Market for Registrant’s Common Equity, Related Stockholder Matters and Issuer Purchases of Equity Securities
|
|
|
Item 6.
|
Selected Consolidated Financial Data
|
|
|
Item 7.
|
Management’s Discussion and Analysis of Financial Condition and Results of Operations
|
|
|
Item 7A.
|
Quantitative and Qualitative Disclosures About Market Risk
|
|
|
Item 8.
|
Consolidated Financial Statements and Supplementary Data
|
|
|
Item 9.
|
Changes In and Disagreements With Accountants on Accounting and Financial Disclosure
|
|
|
Item 9A.
|
Controls and Procedures
|
|
|
Item 9B.
|
Other Information
|
|
|
PART III
|
||
|
Item 10.
|
Directors, Executive Officers and Corporate Governance
|
|
|
Item 11.
|
Executive Compensation
|
|
|
Item 12.
|
Security Ownership of Certain Beneficial Owners and Management and Related Stockholder Matters
|
|
|
Item 13.
|
Certain Relationships and Related Transactions and Director Independence
|
|
|
Item 14.
|
Principal Accounting Fees and Services
|
|
|
PART IV
|
||
|
Item 15.
|
Exhibits, Financial Statement Schedules
|
|
|
Signatures
|
||
Invisalign, Align, the Invisalign logo, ClinCheck, Invisalign Assist, Invisalign Teen, Vivera, SmartForce, SmartTrack, SmartStage, Power Ridge, iTero, Orthocad, iCast and iRecord, among others, are trademarks and/or service marks of Align Technology, Inc. or one of its subsidiaries or affiliated companies and may be registered in the United States and/or other countries.
2
In addition to historical information, this annual report on Form 10-K contains forward-looking statements within the meaning of Section 27A of the Securities Act of 1933 and Section 21E of the Securities Exchange Act of 1934. These statements include, among other things, our expectations regarding the anticipated impact of our new products and product enhancements including Invisalign G5 and ClinCheck Pro will have on doctor utilization and our market share, our expectations regarding product mix and product adoption, our expectations regarding the existence and impact of seasonality, our expectations regarding the financial and strategic benefits of our iTero scanner, our expectations regarding the continued expansion of our international markets the level of our operating expenses and gross margins, and other factors beyond our control, as well as other statements regarding our future operations, financial condition and prospects and business strategies. These statements may contain words such as “expects,” “anticipates,” “intends,” “plans,” “believes,” “estimates,” or other words indicating future results. These forward-looking statements are subject to certain risks and uncertainties that could cause actual results to differ materially from those reflected in the forward-looking statements. Factors that could cause or contribute to such differences include, but are not limited to, those discussed in Item 2 “Management’s Discussion and Analysis of Financial Condition and Results of Operations”, and in particular, the risks discussed below in Part I, Item 1A “Risk Factors”. We undertake no obligation to revise or update these forward-looking statements. Given these risks and uncertainties, readers are cautioned not to place undue reliance on such forward-looking statements.
ITEM 1.
BUSINESS
Our Company
Align Technology, Inc (“We”, “Our”, “Align”) designs, manufactures and markets a system of clear aligner therapy, intra-oral scanners and CAD/CAM (computer-aided design and computer-aided manufacturing) digital services used in dentistry, orthodontics, and dental records storage. Align Technology was founded in March 1997 and incorporated in Delaware in April 1997. Our headquarters are located at 2560 Orchard Parkway, San Jose, California 95131, and our telephone number is 408-470-1000. Our internet address is www.aligntech.com. Our international headquarters are located in Amsterdam, the Netherlands.
We have two operating segments: (1) Clear Aligner, known as the Invisalign System; and (2) Scanners and Services ("Scanner"), known as the iTero intra-oral scanner and OrthoCAD services and formerly referred to as our Scanners and CAD/CAM Services segment ("SCCS"). For the year ended
December 31, 2014
, Clear Aligner revenues represent approximately 94 percent of worldwide revenue, while Scanners represent the remaining 6 percent of worldwide revenues. We distribute the vast majority of our products directly to our customers: orthodontists and general practitioner dentists ("GPs"), as well as to restorative dentists, including prosthodontists, periodontists, and oral surgeons.
We received 510(k) clearance from the United States Food and Drug Administration (“FDA”) to market the Invisalign System in 1998. The Invisalign System is regulated by the FDA as a Class II medical device. In order to provide Invisalign treatment to their patients, orthodontists and GPs must initially complete an Invisalign training course. The Invisalign System is primarily sold through a direct sales force in the United States ("U.S."), Canada, Europe, and certain Asia Pacific countries including Australia, New Zealand, China and Japan. We use a distributor model for the sale of our products in non-core country markets in the Asia Pacific, Europe, Middle East and Africa ("EMEA"), and Latin America regions.
We acquired the iTero digital intra-oral scanner and CAD/CAM services business, our Scanner segment, in April 2011. Our iTero scanner is used by dental professionals and/or labs and services for restorative and orthodontic digital procedures as well as Invisalign digital impression submission. We received 501(k) clearance from the FDA to market iTero software for expanded indications in 2013. Scanners and CAD/CAM Services are primarily sold through our direct sales force in North America and in select international markets primarily through distribution partners.
Clear Aligner Segment
Malocclusion and Traditional Orthodontic Treatment
Malocclusion, or the misalignment of teeth, is one of the most prevalent clinical dental conditions, affecting nearly a billion people, or approximately 50% to 75% of the population of major developed countries. Approximately 6.8 million people annually elect treatment by orthodontists worldwide, of which approximately 2.6 million have mild to moderate malocclusion and are applicable to Invisalign treatment - our served market.
3
In the U.S., orthodontists and GPs treat malocclusion primarily with metal arch wires and brackets, referred to as braces, and augment braces with elastics, metal bands, headgear and other ancillary devices as needed. Available options for improving treatment aesthetics include the use of ceramic, tooth-colored brackets or bonding brackets on the inside, or lingual surface, of the patient’s teeth. The average treatment takes approximately 12 to 24 months to complete and requires several hours of direct dental professional involvement, known in the industry as “chair time,” including the initial diagnosis, creation of an appropriate treatment plan and bonding of the brackets to the patient’s teeth, and attachment of arch wires to the brackets. Subsequent visits involve tightening or otherwise adjusting the braces approximately every six weeks until the final visit when the dental professional removes each bracket and residual bonding agent from the patient’s teeth. Upon completion of the treatment, the dental professional may, at his or her discretion, have the patient use a retainer.
The Invisalign System
The Invisalign System is a proprietary method for treating malocclusion based on a series of doctor-prescribed, custom manufactured, clear plastic removable orthodontic aligners. The Invisalign System offers a range of treatment options, specialized services, and proprietary software for treatment visualization and is comprised of the following phases:
Orthodontic diagnosis and transmission of treatment data to us
. The dental professional prepares and sends us a patient’s treatment data package which consists of a prescription form, a polyvinyl-siloxane, (or "PVS") impression of the relevant dental arches, photographs of the patient and, at the dental professional’s election, x-rays of the patient’s dentition. The dental professional can also submit an intra-oral scan or “digital impression” instead of a physical PVS impression through either iTero or 3M True Definition, currently the only other Invisalign qualified intra-oral scanner.
Preparation of 3D computer models of the patient’s initial malocclusion
. Upon receipt, we use the treatment data package to construct digital models of the patient’s dentition. In cases where a PVS impression has been submitted, we use computed tomography, known as CT scanning to develop a digital, three-dimensional computer model of the patient’s current dentition. In cases where the dental professional submits a digital impression, this step in the process is eliminated.
Preparation of computer-simulated treatment and viewing of treatment using ClinCheck software
. We transform this initial digital model into a proposed custom, three-dimensional treatment plan, called a ClinCheck treatment plan. The ClinCheck plan simulates appropriate tooth movement broken down into a series of two-week increments, and details timing and placement of any attachments that will be used during treatment. Attachments are tooth-colored “buttons” that are sometimes used to increase the biomechanical force on a specific tooth or teeth in order to effect the desired movement. The patient’s ClinCheck treatment plan is then made available to the prescribing dental professional via the Invisalign Doctor Site which enables the dental professional to project tooth movement with a level of accuracy not previously possible with metal arch wires and brackets. By reviewing and amending the treatment simulation, the dental professional retains control over the treatment plan. ClinCheck Pro is the next generation Invisalign treatment software tool, designed to provide more precise control over final tooth position and to help Invisalign providers achieve their treatment goals. This latest software innovation features interactive 3D controls that, for the first time, allow Invisalign providers to make adjustments to the position of individual teeth directly on the 3D model and to visualize the effects on the whole dentition in real time.
Construction of molds corresponding to each step of treatment
. Upon the dental professional’s approval of the ClinCheck treatment plan, we use the data underlying the simulation, in conjunction with stereolithography technology, to construct a series of molds depicting the future position of the patient’s teeth. Each mold is a replica of the patient’s teeth at each two-week stage of the simulated course of treatment.
Manufacture of aligners and shipment to the dental professional
. From these molds, aligners are fabricated by pressure-forming polymeric sheets over each mold. Aligners are thin, clear plastic, removable dental appliances that are custom manufactured in a series to correspond to each two-week stage of the ClinCheck animation. Aligners are generally worn for consecutive two-week periods which correspond to the approved ClinCheck treatment plan. After two weeks of use, the patient replaces them with the next pair in the series, advancing tooth movement with each aligner stage. Throughout treatment, the doctor may place attachments or use other auxiliaries to achieve desired tooth movements, per the doctor’s original prescription and resulting ClinCheck treatment plan.
Retention
. Upon completion of the treatment, the patient may be prescribed our single clear retainer product or our Vivera Retainer product.
4
Scanners and Services Segment
Although advancements have been made in materials used for taking dental impressions since their introduction one hundred years ago, the overall impression process has remained relatively unchanged. Shortcomings such as voids, pulls, and the general margin for error have remained inherent in conventional impressions, and subsequent retakes create unnecessary costs for a clinical practice. Intra-oral scanning is an emerging technology that we believe will have substantial impact on the future of dentistry. By enabling the dental practitioner to create a 3D image of the patient’s teeth using a handheld intra-oral scanner inside the mouth, intra-oral scanning is more efficient and precise and more comfortable for patients, compared to the mess, discomfort, and subjective nature of taking physical impressions. The digital model created with an intra-oral scanner is more accurate than a physical impression and substantially reduces the rate of restoration “remakes” so patients are recalled less often and the appointment time for the restoration is shorter because of fewer adjustments, which results in greater overall patient satisfaction.
As the only intra-oral scanner in the market based on parallel confocal imaging, the iTero intra-oral scanner utilizes laser and optical scanning to capture the contours of the patient’s dentition, gingival structures and the bite. iTero captures 100,000 points of laser light in perfect focus without the use of powder to coat the teeth, allowing for contact of the wand and tooth. The benefit of contact scanning for the clinician is that it eliminates the challenge of hovering over the teeth at a specific distance which can be complicated. For the patient, they enjoy a more comfortable powder free experience which allows the clinician to provide a very comfortable patient centric experience. Within minutes, an accurate 3D digital impression can be viewed on the screen. The 3D digital model file can be used for various procedures and services including fabrication of physical dental models for use by labs to create restorative units such as veneers, inlays, onlays, crowns, bridges and implant abutments; Invisalign digital impression submission; digital records storage; orthodontic diagnosis; and orthodontic retainers and appliances.
The iTero intra-oral scanner consists of a mobile computer unit, display screen, control foot pedal and wand to scan and capture a patient’s dentition (full or partial dental arch). iTero software features include occlusal map, eraser tool, edge trim tool, real-time modeling and an option to submit scans for Invisalign treatment. iTero provides doctors and labs with an open choice to export generic digital files of their digital impression to use with other third party dental service providers. This allows the digital impression to integrate with cone beam CT images for implant and orthodontic treatment planning. In-office training on the system and features is provided after the unit is delivered to the practice.
Our Products and Services
Our net revenues are generated from the sale of the following product offerings:
|
Fiscal Year
|
||||||||
|
Percentage of Net Revenues by Product
|
2014
|
2013
|
2012
|
|||||
|
Invisalign Full Products
|
77
|
%
|
75
|
%
|
78
|
%
|
||
|
Invisalign Express Products
|
11
|
|
11
|
|
9
|
|
||
|
Invisalign Non-case*
|
6
|
|
7
|
|
5
|
|
||
|
Scanners and Services
|
6
|
|
7
|
|
8
|
|
||
|
Total net revenues
|
100
|
%
|
100
|
%
|
100
|
%
|
||
|
*
|
Non-case net revenues include retainers, training revenues, and ancillary offerings under our Clear Aligner product lines
|
Clear Aligner Products
Invisalign Full
. Used for a wide range of malocclusion, the Invisalign Full treatment consists of the number of aligners necessary to achieve the doctor’s treatment goals. Invisalign Full treatment aligners are manufactured and then delivered to the dental professionals in a single shipment. Invisalign Full is sold in the U.S., Canada, and our international regions. The Invisalign Full product is included in "Invisalign Full Products."
Invisalign Teen.
The Invisalign Teen treatment includes all the features of Invisalign Full treatment, plus additional features that address the orthodontic needs of teenage patients such as compliance indicators, compensation for tooth eruption and six free single arch replacement aligners. This product is predominantly marketed to orthodontists who treat the vast majority of malocclusion in teenage patients. Invisalign Teen treatment aligners (other than the replacement aligners) are manufactured and
5
then delivered to the dental professionals in a single shipment. Invisalign Teen is sold in the U.S., Canada, and our international regions. The Invisalign Teen product is included in "Invisalign Full Products".
Invisalign Assist.
Used for anterior alignment and aesthetically-oriented cases, the Invisalign Assist treatment offers added support to our dental practitioners throughout the treatment process, including progress tracking that allows the dental professional to submit new impressions every nine stages. When the progress tracking feature is selected, aligners are shipped to the dental professional after every nine stages thereby helping to achieve successful treatment outcomes. Predominantly marketed to GPs, Invisalign Assist is intended to make it easier to select appropriate cases for their experience level or treatment approach, submit cases more efficiently and manage appointments with suggested tasks. Invisalign Assist is sold in the U.S. and Canada. The Invisalign Assist product is included in "Invisalign Full Products".
Invisalign Express (10 and 5) and Invisalign Lite/i7.
Invisalign Express treatment, Invisalign Lite treatment and Invisalign i7 treatment are lower-cost solutions for less complex orthodontic cases, non-comprehensive treatment relapse cases, or straightening prior to restorative or cosmetic treatments such as veneers. Invisalign Express 10 and Invisalign Express 5, which are sold in the U.S. and Canada, uses up to 10 and 5 sets of aligners, respectively. Invisalign Lite and Invisalign i7, sold in our international regions, uses up to 14 and 7 sets of aligners, respectively. For Invisalign Express/Lite/i7, aligners are manufactured and then delivered to the dental professionals in a single shipment. The Invisalign Express (10 and 5) products and Invisalign Lite /i7 products are included in "Invisalign Express Products".
Retention
. We offer two products for post treatment retention. The first is a single set of custom clear aligner retainers. The second is offered as a set of four custom clear aligners called Vivera Retainers made with proprietary material strong enough to maintain tooth position and correct minor relapse if necessary. Each set of Vivera Retainers is intended to be used for three consecutive months and deliver one year of retention. Doctors can prescribe Vivera Retainers for their Invisalign and their non-Invisalign patients.
Invisalign non-case revenues
. Invisalign non-case revenues represent retainer products discussed above, Invisalign training fees and sales of ancillary products, such as cleaning material and adjusting tools used by dental professionals during the course of treatment.
Feature Enhancements.
We have consistently introduced enhanced features across the Invisalign System over the past several years, such as Invisalign G3 (launched in October 2010), Invisalign G4 (launched in November 2011), and Invisalign G5 (launched in February 2014). Most recently, in November 2014, we announced the upcoming release of Invisalign G6 clinical innovations for first premolar extraction. These feature enhancements are a collection of clinical innovations designed to address some of the most significant treatment challenges doctors encounter.
Invisalign G5 is our first set of innovations designed specifically as an integrated solution to enhance treatment predictability for deep bite, a specific type of malocclusion. Invisalign G5 feature enhancements include:
|
•
|
Precision Cuts, which are custom mesial and distal hooks used to provide anchorage for elastics and button cutouts to accommodate buttons bonded to the tooth aimed to help treat patients with Class II and Class III malocclusion; and
|
|
•
|
SmartForce features engineered to achieve more predictable tooth movements using custom optimized attachments and Power Ridges designed to provide additional force in cases where certain types of root movement are prescribed.
|
|
•
|
Precision aligner bite ramps designed to disocclude the posterior teeth for improved efficiency in deep bite treatments.
|
Invisalign G6 is engineered to improve clinical outcomes for orthodontic treatment of severe crowding and bimaxillary protrusion. Invisalign G6 clinical innovations will be available to Invisalign-trained providers beginning in the first quarter of 2015 with limited commercialization, followed by full commercialization in Asia Pacific, Europe, Middle East and Africa, and Latin America geographies throughout 2015 and North America in early 2016. Invisalign G6 feature enhancements include:
|
•
|
New SmartStage programmed tooth movements that optimize the progression of tooth movements and provide aligner activation, engineered to eliminate unwanted tipping and unwanted anterior extrusion during retraction.
|
|
•
|
New SmartForce features that are designed to deliver the force systems necessary to achieve predictable tooth movements. These new features include Optimized Retraction Attachments, designed to work with SmartStage technology for effective bodily movement during canine retraction, with or without elastics, and new Optimized Anchorage Attachments, designed to work with SmartStage technology to maximize posterior anchorage.
|
6
SmartTrack
™
Aligner Material.
SmartTrack, the next generation of Invisalign clear aligner material is a proprietary, custom-engineered material that delivers gentle, more constant force considered ideal for orthodontic tooth movements. Conventional aligner materials relax and lose a substantial percent of energy in the initial days of aligner wear, but SmartTrack maintains more constant force over the two weeks that a patient wears the aligners. The flexible SmartTrack material also more precisely conforms to tooth morphology, attachments, and interproximal spaces to improve control of tooth movement throughout treatment. SmartTrack became the new standard clear aligner material for Invisalign products in North America beginning January 2013 and in February 2013 for Europe and other international markets where we have obtained regulatory approval.
Scanners and Services Products
Scanners
iTero Scanner
. The iTero scanner is available as a single hardware platform with software options for restorative or orthodontic procedures. The iTero scanner includes our innovative powderless technology and features a modern design, scanning wand and easy-to-use keyboard design with full color model rendering, enabling clinicians to show patients a life-like final model of their scanned dentition. We market and sell the iTero in North America and in select international markets.
The iTero scanner is interoperable with our Invisalign treatment such that a full arch digital scan can be submitted for the Invisalign case submission process treatment. In January 2014, we announced that we qualified the 3M™ True Definition scanner for use with Invisalign case submissions. This qualification enables Invisalign providers with a True Definition scanner to submit a digital impression in place of a traditional PVS impression as part of the Invisalign case submission process. We support an open systems approach to digital impressions and continue to work with intraoral scanning companies interested in developing interoperability for use with Invisalign treatment.
Restorative software for iTero.
Software designed for GPs, prosthodontists, periodontists, and oral surgeons which includes features for restorative procedures commonly performed in their practices such as veneers, inlays, onlays, crowns, bridges and implants. The iTero restorative software provides the ability to scan quadrants and full arches, and allows simple powder-free capture of digital impressions for single-unit cases as well as more complex restorative and implant treatment plans. The iTero software also contains Invisalign interoperability to support clear aligner orthodontic treatment.
In the past year, we have expanded the digital workflow options to include several partnerships which provide our customers with a broader spectrum of CAD/CAM options. Connectivity partnership announcements include:
|
•
|
IOS Technologies Inc, a wholly owned subsidiary of Glidewell Laboratories, provides the option to mill same-day restorations in the office.
|
|
•
|
DENTSPLY Implants featuring connectivity with ATLANTIS™ custom abutments.
|
|
•
|
Zimmer Dental, Inc. with connectivity with Zimmer Zfx custom abutments for implants.
|
Orthodontic software for iTero.
Software designed for orthodontists for digital records storage, orthodontic diagnosis, Invisalign digital impression submission, and for the fabrication of printed models and retainers. The iTero orthodontic software digitally captures the contours of the dentition and the gingival structures, providing an accurate, powder-free digital orthodontic scan in just minutes. This digital impression procedure ensures a more comfortable patient experience and produces a precise scan that can be seamlessly integrated with Invisalign treatment, OrthoCAD iCast, and OrthoCAD iRecord which allows a doctor to utilize sophisticated measurement and treatment planning tools.
CAD/CAM Services
iTero Models and Dies.
An accurate physical model and dies are manufactured based on the digital scan and sent to the laboratory of the dentist’s choice for completion of the needed restoration. The laboratory also has the option to export the digital file for immediate production of coping and full-contour restorations on their laboratory CAD/CAM systems. The laboratory conducts then completes the ceramic buildup or staining and glazing and delivers the end result - a precisely fitting restoration. iTero prosthetics have a near-zero remake rate.
OrthoCAD iCast.
iCast provides a digital alternative to traditional stone cast models which allows for simplified storage and digital record retrieval. The iCast digital model contains a full American Board of Orthodontics ("ABO") base and is available from an iTero scan or from a traditional alginate impression.
7
OrthoCAD iRecord.
iRecord provides a digital alternative to traditional stone cast models which allows for simplified storage and digital record retrieval. This simplified model without an ABO base is an economical option for record retention. iRecord is available exclusively from an iTero scan.
Chair Side Applications
Invisalign Outcome Simulator
. In January 2013, we announced the commercial availability of the Invisalign Outcome Simulator, our first Invisalign chair-side application powered by the iTero scanner. The interactive application provides GPs and orthodontists an enhanced platform for patient education and is designed to increase treatment acceptance by helping patients visualize the benefits possible with Invisalign treatment. As the only Invisalign chair-side intra-oral scanning application on the market, the Invisalign Outcome Simulator's unique dual view layout shows a prospective patient an image of his/her own current dentition next to his/her simulated final position of how their teeth may look after Invisalign treatment. Using a full arch Invisalign scan, the Invisalign Outcome Simulator takes a few minutes to run and may be viewed chair-side, on the scanner, or from a computer using MyAlignTech.com. Intuitive tools allow doctors to make real-time adjustments to individual teeth during consultations that increase patient education and the likelihood of patient acceptance.
Our iTero scanner includes orthodontic software, restorative software, or both, and the Invisalign Outcome Simulator. The orthodontic or restorative software may also be purchased subsequently for an upgrade fee. The Invisalign Outcome Simulator is not available for sale separately.
Other proprietary software mentioned in this Annual Report on Form 10-K such as ClinCheck and ClinCheck Pro software, the Invisalign Doctor Site,
and enhanced feature solutions such as Invisalign G5 are included as part of the Invisalign System and are not sold separately nor do they contribute as individual items of revenue.
Business Strategy
Our goal is to establish Invisalign clear aligners as the standard method for treating malocclusion and to establish the iTero intra-oral scanner as the preferred scanning protocol for 3D digital scans, ultimately driving increased product adoption by dental professionals. We intend to achieve this by continued focus and execution of our strategic growth drivers: Market Expansion, Doctor Preference, and Brand Strength.
|
1.
|
Market Expansion
. We expect to continue to grow and expand our business by investing in resources, infrastructure, and initiatives that will drive growth from both a geographic and market segment standpoint. From a geographic standpoint, we focus our efforts on expanding our sales territory coverage in all of our direct sales geographies, with particular emphasis in our highest growth areas such as Europe and the Asia Pacific region. We strive to make sure that our new geographies and our expanded territories internationally have everything they need from the products, to the support, to the people, in order to successfully establish Invisalign as the treatment of choice for orthodontics in each geographic market. From a market segment standpoint, we are focused on two important markets: adults and teenagers. We believe expansion in these two markets can be achieved through product innovations that can expand the types of indications our Invisalign products can treat, as well as by expanding the overall market for orthodontics, primarily with adults who would not otherwise seek treatment with traditional wires and brackets. We believe continued market expansion can be achieved by having the right products, services, and communications worldwide to give our doctors the confidence they need to treat with Invisalign more often and attract potential patients to their practice so they ask for Invisalign by name.
|
In parallel with these investments, we also engage in professional marketing, clinical support and education initiatives that support doctor practice development and facilitate the continued growth of their practices.
In our iTero scanner business, we leverage our combined sales and marketing resources to facilitate the adoption and penetration of each product into our doctors’ practices. Many of our customers recognize that having an iTero scanner at chair-side improves practice effectiveness for Invisalign as evidenced by higher Invisalign utilization rates among customers with an iTero scanner.
|
2.
|
Doctor Preference.
We want all of our doctors to have the confidence and motivation to lead with Invisalign for every patient that walks into their practice. We strive to achieve this by investing in two areas. First, continuing to improve product predictability and applicability for more complex cases thereby expanding the types of malocclusion that our Invisalign products can treat. As an example, we launched Invisalign G5 in February 2014, which represented our first set of features engineered specifically to treat deep bite malocclusion. We estimate that deep bite manifests itself in approximately 30% to 40% of the orthodontic cases treated worldwide depending on geography. We also recently
|
8
announced the upcoming release of Invisalign G6 clinical innovations for first premolar extractions. The nature of malocclusion that requires first premolar tooth extraction is an orthodontic problem that affects more than 50% of people in Asia, 20% in Europe and 12% in North America. Secondly, enhancing the customer’s experience by making it easier to treat with and integrate Invisalign into their practices. As an example, we launched ClinCheck Pro in February 2014, the next generation Invisalign treatment software tool, designed to simplify the treatment process and help our doctors achieve their treatment goals.
|
3.
|
Brand Strength.
Our goal is to make Invisalign a highly recognized name brand worldwide by creating awareness for Invisalign treatment among consumers and motiving potential patients to seek treatment from an Invisalign provider. In support of this objective, we invest in initiatives designed to strengthen our global brand name recognition and drive consumer purchase intent. We accomplish this objective through an integrated consumer marketing strategy that includes television, media, social networking and event marketing.
|
Manufacturing and Suppliers
Our manufacturing facilities are located in Juarez, Mexico, where we conduct our aligner fabrication, distribute and repair our scanners, perform our CAD/CAM services, and in Or Yehuda, Israel where we produce our handheld intra-oral scanner wand. The final assembly of our iTero scanner is performed by a third party manufacturer located in Israel. Our Invisalign digital treatment planning and interpretation for iTero restorative cases are conducted primarily at our facility located in San Jose, Costa Rica. Information regarding risks associated with our manufacturing process and foreign operations may be found in
Item 1A of this Annual Report on Form 10-K under the heading “Risk Factors.”
Our quality system is required to be in compliance with the Quality System regulations enforced by the FDA, and similar regulations enforced by other worldwide regulatory authorities. We are certified to EN ISO 13485:2003, an internationally recognized standard for medical device manufacturing. We have a formal, documented quality system by which quality objectives are defined, understood and achieved. Systems, processes and procedures are implemented to ensure high levels of product and service quality. We monitor the effectiveness of the quality system based on internal data and direct customer feedback and strive to continually improve our systems and processes, taking corrective action, as needed.
Since the manufacturing process of our products requires substantial and varied technical expertise, we believe that our manufacturing capabilities are important to our success. In order to produce our highly customized, highly precise, medical quality products in volume, we have developed a number of proprietary processes and technologies. These technologies include complex software algorithms and solutions, CT scanning, stereolithography and automated aligner fabrication. To increase the efficiency of our manufacturing processes, we continue to focus our efforts on software development and the improvement of rate-limiting processes, or bottlenecks. We continuously upgrade our proprietary, three-dimensional treatment planning software to enhance computer analysis of treatment data and to reduce time spent on manual and judgmental tasks for each case, thereby increasing the efficiency of our technicians in Costa Rica. In addition, to improve efficiency and increase the scale of our operations, we continue to invest in the development of automated systems for the fabrication and packaging of aligners.
We are highly dependent on manufacturers of specialized scanning equipment, rapid prototyping machines, resin and other advanced materials for our aligners, as well as the optics, electronic and other mechanical components of our intra-oral scanners. We maintain single supply relationships for many of these machines and materials technologies. In particular, our CT scanning and stereolithography equipment used in our aligner manufacturing and many of the critical components for the optics of our intra-oral scanners are provided by single suppliers. We are also committed to purchasing all of our resin and polymer, the primary raw materials used in our manufacturing process for clear aligners, from a single source. The need to replace one of our single source suppliers could cause a disruption in our ability to timely deliver certain of our products or increase costs. See Item 1A Risk Factors
— “We maintain single supply relationships for certain of our key machines and materials technologies, and our business and
operating results could be harmed if supply is restricted or ends or the price of raw materials used in our manufacturing process increases.”
Sales and Marketing
Our sales efforts are focused primarily on the Invisalign System and continuing to increase adoption and utilization by orthodontists and GPs worldwide. In North America, Europe and certain Asia Pacific country markets, we have direct sales and support organizations, which includes quota carrying sales representatives, sales management, and sales administration.
Currently, we have several distribution partners that sell the Invisalign System in smaller non-core country markets in the EMEA, Asia Pacific and Latin America regions. We evaluate adding distribution partners in other non-core country markets on a case-by-case basis or assess modifying our current distribution agreements, as our international business grows. We continued
9
to expand in our existing markets through targeted investments in sales coverage, professional marketing and education programs, along with consumer marketing in selected country markets. In addition, given the significant long term potential the EMEA geography represents and the support we can now provide by utilizing our direct coverage model in Europe, beginning in February 2014, we began the transition of a small number of countries into direct sales regions. We continued the transition of additional smaller countries during the year which will continue through February 2015. We expect to leverage our existing infrastructure and resources to bring sales coverage and customer support to these countries, most of which are adjacent to our directly covered European countries. Due to the small volume of business from our EMEA distributor, we do not anticipate that this transition will have a material effect on our financial results in the next several years.
For the iTero scanner, we have a small team of direct sales representatives in North America. Our intra-oral scanner sales team leverages leads generated by our Invisalign sales and marketing resources, including customer events and industry trade-shows. We sell the iTero scanner in select country markets internationally and will look to grow the scanner business over time.
We market Invisalign by communicating the benefits of the Invisalign System to dental professionals through our training programs, online and traditional mail campaigns, trade shows, trade journals and print. We also promote the benefits of Invisalign through our integrated consumer marketing platform which combines traditional print and broadcast media with a balanced mix of public relations, event marketing, and social media. The goal of this platform is to raise awareness of Invisalign as the best options for a healthy, beautiful smile among adults and teenagers. In addition, our consumer marketing platform enables us to help prospective patients find a great Invisalign treatment practice that can meet their needs. For intra-oral scanners, in addition to leveraging Invisalign customer events and industry trade-shows to communicate the benefits of digital scanning to dental professionals, we also have training programs, educational websites and limited print advertising.
We provide training, marketing and clinical support to orthodontists and GPs. In
2014
, we had approximately 43,340 active Invisalign providers.
Research and Development
We are committed to investing in world-class technology development, which we believe is critical to achieving our goal of establishing the Invisalign System as the standard method for treating malocclusion and our intra-oral scanning platform as the preferred scanning protocol for 3D digital scans. Our research and development expenses were
$52.8 million
,
$44.1 million
, and
$42.9 million
for the year ended
December 31, 2014
,
2013
and
2012
, respectively.
Our research and development activities are directed toward developing the technology innovations that we believe will deliver our next generation of products and platforms. Our research and development activities range from accelerating product and clinical innovation, to developing manufacturing process improvements, to researching future technologies and products.
In an effort to demonstrate Invisalign’s broad treatment capabilities, various clinical case studies and articles have been published that highlight the clinical applicability of Invisalign to malocclusion cases, including those of severe complexity. We undertake pre-commercialization trials and testing of our technological improvements to the product and manufacturing process.
Intellectual Property
We believe our intellectual property position represents a substantial business advantage. As of
December 31, 2014
, we had 352 issued U.S. patents, 97 pending U.S. patent applications, and 257 foreign issued patents, as well as 108 pending foreign patent applications.
We continue to pursue further intellectual property protection through U.S. and foreign patent applications and non-disclosure agreements. We also seek to protect our software, documentation and other written materials under trade secret and copyright laws. We cannot be certain that patents will be issued as a result of any patent application or that patents that have been issued to us or that may be issued in the future will be found to be valid and enforceable and sufficient to protect our technology or products. Our intellectual property rights may not be successfully asserted in the future or may be invalidated, circumvented or challenged. In addition, the laws of various foreign countries do not protect our intellectual property rights to the same extent as U.S. laws. Our inability to protect our proprietary information could harm our business. Information regarding risks associated with failing to protect our proprietary technology and our intellectual property rights may be found in
Item 1A of this Annual Report on Form 10-K under the heading “Risk Factors.”
10
Seasonal Fluctuations
General economic conditions impact our business and financial results, and we experience seasonal trends related to our two operating segments, customer channels and the geographic locations that we serve. For example, European sales of Invisalign treatment are often weaker in the summer months due to our customers and their patients being on holiday. In North America, summer is typically the busiest season for orthodontists with practices that have a high percentage of adolescent and teenage patients as many parents want to get their teenagers started in treatment before the start of the school year; however, many GPs are on vacation during this time and therefore tend to start fewer cases. For our Scanner segment, capital equipment sales are often stronger in the fourth calendar quarter. Consequently, these seasonal trends have caused and may continue to cause, fluctuations in our quarterly results, including fluctuations in sequential revenue growth rates.
Backlog
Due to the individualized nature of an Invisalign treatment which is prescribed by a doctor, no two cases are alike, and we maintain relatively low levels of backlog. The period from which a treatment data package (or “a case”) is received until the acceptance of the digital ClinCheck treatment plan is dependent on the dental professional’s discretion to modify, accept or cancel the treatment plan. Therefore, we consider the case a firm order to manufacture aligners once the dental professional has approved the ClinCheck treatment plan. Our Invisalign backlog consists of ClinCheck treatment plans that have been accepted but not yet shipped. Because aligners are shipped shortly after the ClinCheck treatment plan has been accepted, we believe that backlog is not a good indicator of future Invisalign sales. Our quarterly Invisalign revenues can be impacted by the timing of the ClinCheck treatment plan acceptances and our ability to ship those cases in the same quarter. We define our intra-oral scanner backlog as orders where payment is reasonably assured and credit and financing is approved but the scanner has not yet shipped. Our intra-oral scanner backlog as of
December 31, 2014
was not material.
Competition
We operate in a highly competitive market and we encounter a wide variety of competitors, including larger companies or divisions of larger companies with substantial sales, marketing, research and financial capabilities. We also face competition from early stage companies. Although the number of competitors varies by segment, currently our products compete directly against products manufactured and distributed by various companies, both within and outside the U.S., including Danaher Corporation, 3M, Sirona Dental Systems, Inc. and Dentsply International, Inc. Information regarding risks associated with increased competition may be found in
Item 1A
of this Annual Report on Form 10-K under the heading “Risk Factors.”
Key competitive factors include:
|
•
|
effectiveness of treatment;
|
|
•
|
price;
|
|
•
|
software features;
|
|
•
|
aesthetic appeal of the treatment method;
|
|
•
|
customer support;
|
|
•
|
customer online interface;
|
|
•
|
brand awareness;
|
|
•
|
innovation;
|
|
•
|
distribution network;
|
|
•
|
comfort associated with the treatment method;
|
|
•
|
oral hygiene;
|
|
•
|
ease of use; and
|
|
•
|
dental professionals’ chair time.
|
We believe that our products compare favorably with our competitors’ products with respect to each of these factors.
11
Government Regulation
In order for us to market our products, we must obtain regulatory authorization and comply with extensive product and quality system regulations. These regulations, including the requirements for approvals or clearance and the time required for regulatory review, vary from country to country. Failure to obtain regulatory approval and to meet all local requirements including language and specific safety standards in any country in which we currently market or plan to market our products could prevent us from marketing products in such countries or subject us to sanctions and fines. The approval by government authorities is unpredictable and uncertain and may not be granted on a timely basis, if at all. Delays in receipt of, or a failure to receive, such approvals or clearances, or the loss of any previously received approvals or clearances, could have a material adverse effect on our business, financial condition, and results of operations.
We believe we are in compliance with all FDA, federal and state laws and International regulatory requirements that are applicable to our products and manufacturing operations. Country-specific regulatory framework and requirements are highlighted in the following examples:
U.S.
In the U.S., the Medical Device Amendments of 1976 to the Federal Food, Drug and Cosmetic Act ("FDA Act") and its subsequent amendments, and the regulations, provide the FDA with authority over medical devices and the research, clinical testing, manufacture, labeling, distribution, sale, and promotion of such devices. Medical devices are classified into one of three classes (Class I, II or III). The class to which the device is assigned determines, among other things, the type of pre-marketing submission/application required for market authorization. Our Invisalign aligners and intra-oral scanners are classified as Class II medical devices and we have obtained applicable 510(k) clearances for our marketed products.
The FDA Act also requires manufactured devices to comply with applicable Quality System Regulations which impose certain procedural and documentation requirements upon us with respect to design, development, manufacturing and quality assurance activities, including the reporting of adverse experiences with the use of the device. We are subject to unannounced inspections by regulatory authorities to determine compliance with applicable regulations, and these inspections may include the manufacturing facilities of our subcontractors. Labeling and promotion activities are subject to scrutiny by the FDA and, in certain instances, by the Federal Trade Commission. The FDA actively enforces regulations prohibiting marketing of products for unapproved uses. Noncompliance with applicable requirements can result in, among other things, warning letters, fines, injunctions, civil penalties, recall or seizures of products, total or partial suspension of production, failure of the government to grant pre-market clearance or approval for devices, withdrawal of marketing approvals, and criminal prosecution. The FDA also has the authority to request repair, replacement or refund of the cost of any medical device manufactured or distributed by us.
European Union
The member states of the European Union ("EU") have adopted the European Medical Device Directives (MDD 93/42/EEC) that form a single set of medical device regulations for all EU member countries. The MDD defines the quality system, safety, and performance requirements to be met by manufacturers for their products, called the Essential Requirements. Certification to ISO 13485, an international standard for quality management systems, demonstrates compliance with the quality system requirements outlined in the MDD. Our Quality Management System is ISO 13485 certified by the British Standards Institute, an approved full scope Notified Body (as defined in the regulations).
Canada
In Canada, the system of approval for medical devices is governed by the Medical Device Regulations of the Department of Justice (SOR/98-282), including quality system requirements based on ISO 13485, facility registration, and device licensing. The scope of our Quality Management System certification includes the additional requirements defined by Health Canada.
Japan
In Japan, the Ministry of Health, Labour, and Welfare (MHLW), regulates medical devices under the Pharmaceutical Affairs Law ("PAL"). Manufacturers with no local presence in Japan must appoint a Marketing Authorization Holder ("MAH") to manage their device registration process and liaise with the Pharmaceutical and Medical Devices Agency ("PMDA"), Japan’s medical device market regulator. Manufacturers of Class II, III and IV devices must implement a quality system compliant with the PAL and MHLW Ordinance #169 (Japan QMS Regulation) and submit QMS Conformity Assessment Application. The scope of our
12
Quality Management System certification includes the additional requirements defined by PAL and Invisalign has been authorized for sale.
China
In China, the China Food and Drug Administration ("CFDA") regulates medical devices. The device classification process in China differs significantly from those in the EU and the U.S., and approval of the medical device in the country of origin is required before beginning the registration process. Compliance with U.S. FDA Quality System Requirements and/or ISO 13485 will satisfy CFDA quality management system requirements. CFDA has approved our submission for Invisalign.
Other Government Oversight
We are also subject to various laws inside and outside the U.S. concerning our relationships with healthcare professionals and government officials, price reporting and regulation, the promotion, sales and marketing of our products and services, the importation and exportation of our products, the operation of our facilities and distribution of our products. As a global company, we are subject to varying degrees of government regulation in the various countries in which we do business, and the general trend is toward increasingly stringent oversight and enforcement. Initiatives sponsored by government agencies, legislative bodies, and the private sector to limit the growth of healthcare expenses generally are ongoing in markets where we do business. It is not possible to predict at this time the long-term impact of such cost containment measures on our future business.
Our customers are healthcare providers that may be reimbursed by federally funded programs such as Medicaid or a foreign national healthcare program, each of which may offer some degree of oversight. Many government agencies, both domestic and foreign, have increased their enforcement activities with respect to healthcare providers and companies in recent years. Enforcement actions and associated defense can be expensive, and any resulting findings carry the risk of significant civil and criminal penalties. For example, the U.S. Federal Physician Payment Sunshine Act went into effect in 2014 which requires public transparency of transfers of value to physicians.
We are also subject to numerous data protection requirements that span from individual state and national laws in the US to multinational requirements in the EU. In the U.S., final regulations implementing amendments to the Health Insurance Portability and Accountability Act of 1996 (“HIPAA”) became effective in the latter part of 2013 with the HIPAA Omnibus Rule. The EU is currently considering a proposal to enact legislation governing data protection which would transform the current mix of European countries’ laws to one overarching multinational law. Meanwhile, the Asia Pacific region has also seen rapid development of privacy laws, including in Singapore, Hong Kong, and Australia. We believe we have designed our product and service offerings to be compliant with the requirements of applicable data protection laws and regulations. Maintaining systems that are compliant with these laws and regulations is costly and could require complex changes in the way we do business or provide services to our customers and their patients. Additionally, our success may be dependent on the success of healthcare providers in managing data protection requirements.
Employees
As of
December 31, 2014
, we had approximately 3,580 employees, including 2,320 in manufacturing and operations, 730 in sales and marketing which includes customer care, 260 in research and development and 270 in general and administrative functions.
Available Information
Our website is located at
www.aligntech.com
, and our investor relations website is located at
http://investor.aligntech.com
. The information on or accessible through our websites is not part of this Annual Report on Form 10-K. Our Annual Reports on Form 10-K, Quarterly Reports on Form 10-Q, Current Reports on Form 8-K, our proxy statement on Schedule 14A for our annual stockholders’ meeting and amendments to such reports are available, free of charge, on our investor relations website as soon as reasonably practicable after we electronically file or furnish such material with the SEC. Further, a copy of this Annual Report on Form 10-K is located at the SEC’s Public Reference Room at 100 F Street, NE, Washington, D.C. 20549. Information on the operation of the Public Reference Room can be obtained by calling the SEC at 1-800-SEC-0330. The SEC maintains an internet site that contains reports, proxy and information statements and other information regarding our filings at
www.sec.gov
.
13
Executive Officers of the Registrant
The following table sets forth certain information regarding our executive officers as of
February 26, 2015
:
|
Name
|
Age
|
Position
|
|
Thomas M. Prescott
|
59
|
President and Chief Executive Officer
|
|
David L. White
|
59
|
Chief Financial Officer
|
|
Jennifer M. Erfurth
|
45
|
Vice President, Global Human Resources
|
|
Roger E. George
|
49
|
Vice President, Corporate and Legal Affairs and General Counsel
|
|
John P. Graham
|
46
|
Vice President, Marketing and Chief Marketing Officer
|
|
Timothy A. Mack
|
56
|
Vice President, Business Development
|
|
Raphael Pascaud
|
43
|
Vice President, International
|
|
Christopher C. Puco
|
54
|
Vice President, North American Sales
|
|
Zelko Relic
|
50
|
Vice President, Research & Development
|
|
Emory M. Wright
|
45
|
Vice President, Operations
|
Thomas M. Prescott
has served as our President and Chief Executive Officer and as a member of our Board of Directors since March 2002. Prior to joining us, Mr. Prescott was President and Chief Executive Officer of Cardiac Pathways, Inc., a publicly-traded medical device company, from May 1999 until its acquisition by Boston Scientific in August 2001. Mr. Prescott then worked as a consultant for Boston Scientific Corporation until January 2002. Prior to working at Cardiac Pathways, Mr. Prescott held various sales, general management and executive roles at Nellcor Puritan Bennett, Inc. from April 1994 to May 1999.
David L. White
has served as our Chief Financial Officer ("CFO") since August 2013. Prior to joining us, Mr. White was CFO of Enecsys, Ltd., a privately-held supplier of solar micro inverters and monitoring systems from June 2012. Prior to Enecsys, he was Executive Vice President and CFO at NVIDIA Corporation, a fabless semiconductor company known for its development of advanced graphics and high performance computing processors from February 2009 to June 2011. Prior to NVIDIA, he was Executive Vice President of Finance and CFO at SANMINA-SCI Corporation, which provides contract design, supply chain, and manufacturing services from 2004 to 2009. He also served as CFO at Asyst Technologies Corporation, CEO at Candescent Technologies Corporation, and Senior Vice President of Finance at Connor Peripherals.
Jennifer M. Erfurth
has served as our Vice President, Global Human Resources since October 2012. Prior to joining us, Ms. Erfurth was Senior Vice President of Shared Services at Dyno Nobel, Inc., a manufacturer and supplier of industrial explosives, from July 2011 to July 2012, and was Vice President, Human Resources for Federal Signal Corporation prior to that. From 2001 to 2010, Ms. Erfurth held positions of increasing responsibility at Schawk, Inc., most recently as Global Senior Vice President of Human Resources, a position she held from 2007 until her departure in 2010. Earlier in her career, she served as Director of Human Resources at CINTAS Corporation and World Color.
Roger E. George
has served as our Vice President, Corporate and Legal Affairs and General Counsel since July 2002. Prior to joining us, Mr. George was the Chief Financial Officer, Vice President of Finance and Legal Affairs and General Counsel of SkyStream Networks, a privately held broadband and broadcast network equipment company. Prior to SkyStream, Mr. George was a partner at Wilson Sonsini Goodrich & Rosati, P.C. in Palo Alto, California.
John P. Graham
has served as our Vice President, Marketing and Chief Marketing Officer since July 2013. From 2011 until he joined us, Mr. Graham was Vice President and Chief Marketing Officer at GlaxoSmithKline Consumer Healthcare, a global healthcare company. Prior to GlaxoSmithKline, he was with Johnson & Johnson for 15 years in multiple marketing leadership roles, including Vice President, U.S. Marketing for Johnson & Johnson Vision Care.
Timothy A. Mack
has served as our Vice President, Marketing and Business Development since May 2012. He served as Vice President, Business Development since our acquisition of Cadent Holdings, Inc. in April 2011. At Cadent, he was President and Chief Executive Officer since 2009. He joined Cadent in 2005, as Executive Vice President & General Manager where he led the introduction and adoption of Cadent’s new 3D digital imaging technology into the market. Prior to Cadent, Mr. Mack was Vice President and General Manager of DENTSPLY Ceramco, a wholly-owned subsidiary of DENTSPLY International. Prior to DENTSPLY, Mr. Mack held a series of management positions in the U.S. and Europe within Consumer Electronics and Medical Imaging Divisions at Eastman Kodak Company.
14
Raphael Pascaud
was appointed Vice President, International in January 2014. He joined Align in 2010 as Vice President and Managing Director for the Europe, Middle East and Africa Region, ("EMEA"). Prior to Align, Mr. Pascaud spent 14 years in various management positions within DePuy, a Johnson & Johnson family of companies, including Vice President Orthopedics of EMEA and Vice President Marketing of International.
Christopher C. Puco
has served as our Vice President, North America Sales since December 2012. He joined Align in 2006 as a sales director and in 2008 became senior director for the Eastern sales area. Most recently, as Vice President of Sales Strategy, he led Align's go-to-market strategy and managed the integration of the North American scanner and CAD/CAM services sales organization. Mr. Puco has more than 20 years of experience in the medical device industry, holding sales management positions in both starts-ups and established corporate environments. Prior to Align, he was with United States Surgical Corporation, General Surgical Innovations, Baxter BioSurgery and Fusion Medical Technologies.
Zelko Relic
was appointed Vice President, Research & Development in December 2013. Prior to joining Align, Mr. Relic was Vice President, Engineering for Datalogic Automation, a global leader in automatic data capture and industrial automation markets from 2012. Mr. Relic was previously Vice President, Engineering at Danaher Corporation, Accu-Sort Systems business from 2010 to 2012 before it was acquired by Datalogic Automation. From 2005 to 2010, he was at Siemens Medical Solutions USA, most recently as Vice President, and from 2002 to 2004 he held senior management positions in engineering at Kulicke & Soffa Industries, designers and manufactures of semiconductor products. He also held management positions at KLA-Tencor, manufacturer of metrology tools from 1994 to 2000.
Emory M. Wright
has served as our Vice President, Operations since December 2007. He has been with us since March 2000, predominantly in manufacturing and operations roles. Previously, Mr. Wright served as Vice President, Manufacturing and, most recently, was General Manager of New Product Development. Prior to joining us, Mr. Wright was Senior Manufacturing Manager at Metrika, Inc. a medical device manufacturer, from May 1999 to March 2000. From July 1994 to May 1999, Mr. Wright served as Manager of Manufacturing and Process Development for Metra Biosystems Inc.
ITEM 1A.
RISK FACTORS
We depend on the sale of the Invisalign system for the vast majority of our net revenues, and any decline in sales of Invisalign treatment for any reason, a continued weakness in general economic conditions, or a decline in average selling prices would adversely affect net revenues, gross margin and net income.
We expect that net revenues from the sale of the Invisalign System, primarily Invisalign Full and Invisalign Teen, will continue to account for the vast majority of our total net revenues for the foreseeable future. Continued and widespread market acceptance of Invisalign by orthodontists, GPs and consumers is critical to our future success. If orthodontists and GPs experience a reduction in consumer demand for orthodontic services, if consumers prove unwilling to adopt Invisalign as rapidly as we anticipate or in the volume that we anticipate, if orthodontists or GPs choose to use a competitive product rather than Invisalign or if the average selling price of our product declines, our operating results would be harmed.
Demand for our products may not increase as rapidly as we anticipate due to a variety of factors including a weakness in general economic conditions.
Consumer spending habits are affected by, among other things, prevailing economic conditions, levels of employment, salaries and wage rates, gas prices, consumer confidence and consumer perception of economic conditions. A general slowdown in the U.S. economy and certain international economies or an uncertain economic outlook would adversely affect consumer spending habits which may, among other things, result in a decrease in the number of overall orthodontic case starts, reduced patient traffic in dentists’ offices, reduction in consumer spending on higher value procedures or a reduction in the demand for dental services generally, each of which would have a material adverse effect on our sales and operating results. Weakness in the global economy results in a challenging environment for selling dental technologies and dentists may postpone investments in capital equipment, such as intra-oral scanners. In addition, Invisalign treatment, which currently accounts for the vast majority of our net revenues, represents a significant change from traditional orthodontic treatment, and customers and consumers may be reluctant to accept it or may not find it preferable to traditional treatment. We have generally received positive feedback from orthodontists, GPs and consumers regarding Invisalign treatment as both an alternative to braces and as a clinical method for the treatment of malocclusion, but a number of dental professionals believe that the Invisalign treatment is appropriate for only a limited percentage of their patients. Increased market acceptance of all of our products will depend in part upon the recommendations of dental professionals, as well as other factors including effectiveness, safety, ease of use, reliability, aesthetics, and price compared to competing products.
15
The frequency of use of the Invisalign system by orthodontists or GPs may not increase at the rate that we anticipate or at all.
One of our key objectives is to continue to increase utilization, or the adoption and frequency of use, of the Invisalign System by new and existing customers. If utilization of the Invisalign System by our existing and newly trained orthodontists or GPs does not occur or does not occur as quickly as we anticipate, our operating results could be harmed.
We may experience declines in average selling prices of our products which may decrease our net revenues.
We provide volume based discount programs to our doctors. In addition, we sell a number of products at different list prices. If we introduce any price reductions or consumer rebate programs; if we expand our discount programs in the future or participation in these programs increases; if our product mix shifts to lower priced products or products that have a higher percentage of deferred revenue our average selling prices would be adversely affected and our net revenues, gross profit, gross margin and net income may be reduced. Furthermore, although the U.S. dollar is our reporting currency, a portion of our net revenues and net income are generated in foreign currencies. Net revenues and net income generated by subsidiaries operating outside of the U.S. are translated into U.S. dollars using exchange rates effective during the respective period and are affected by changes in exchange rates. As a result, negative movements in currency exchange rates against the U.S. dollar will adversely affect our average selling price and consequently the amount of net revenues and net income in our consolidated financial statements.
As we continue to grow, we are subject to growth related risks, including risks related to excess or constrained capacity at our existing facilities.
We are subject to growth related risks, including excess or constrained capacity and pressure on our internal systems and personnel. In order to manage current operations and future growth effectively, we will need to continue to implement and improve our operational, financial and management information systems and to hire, train, motivate, manage and retain employees. We may be unable to manage such growth effectively. Any such failure could have a material adverse impact on our business, operations and prospects.
Because we cannot immediately adapt our production capacity and related cost structures to changing market conditions, our manufacturing capacity may at times exceed or fall short of our production requirements. In addition, if product demand decreases or we fail to forecast demand accurately, we could be required to write off inventory or record excess capacity charges, which would lower our gross margin. Any or all of these problems could result in the loss of customers, provide an opportunity for competing products to gain market acceptance and otherwise harm our business and financial results.
If we fail to sustain or increase profitability or revenue growth in future periods, the market price for our common stock may decline.
If we are to sustain or increase profitability in future periods, we will need to continue to increase our net revenues, while controlling our expenses. Because our business is evolving, it is difficult to predict our future operating results or levels of growth, and we have in the past not been and may in the future not be able to sustain our historical growth rates. If we do not increase profitability or revenue growth or otherwise meet the expectations of securities analysts or investors, the market price of our common stock will likely decline.
Our financial results have fluctuated in the past and may fluctuate in the future which may cause volatility in our stock price.
Our operating results have fluctuated in the past and we expect our future quarterly and annual operating results to fluctuate as we focus on increasing doctor and consumer demand for our products. These fluctuations could cause our stock price to decline or significantly fluctuate. Some of the factors that could cause our operating results to fluctuate include:
|
•
|
limited visibility into and difficulty predicting the level of activity in our customers’ practices from quarter to quarter;
|
|
•
|
weakness in consumer spending as a result of the slowdown in the U.S. economy and global economies;
|
|
•
|
changes in relationships with our distributors;
|
|
•
|
changes in the timing of receipt of Invisalign case product orders during a given quarter which, given our cycle time and the delay between case receipts and case shipments, could have an impact on which quarter revenue can be recognized;
|
|
•
|
fluctuations in currency exchange rates against the U.S. dollar;
|
|
•
|
changes in product mix;
|
16
|
•
|
our inability to predict from period to period the number of trainers or the availability of doctors required to complete intra-oral scanner installations, which may impact the timing of when revenue is recognized;
|
|
•
|
if participation in our customer rebate program increases our average selling price will be adversely affected;
|
|
•
|
seasonal fluctuations in the number of doctors in their offices and their availability to take appointments;
|
|
•
|
success of or changes to our marketing programs from quarter to quarter;
|
|
•
|
our reliance on our contract manufacturers for the production of sub-assemblies for our intra-oral scanners;
|
|
•
|
timing of industry tradeshows;
|
|
•
|
changes in the timing of when revenue is recognized, including as a result of the introduction of new products or promotions, modifications to our terms and conditions or as a result of changes to critical accounting estimates or new accounting pronouncements;
|
|
•
|
changes to our effective tax rate;
|
|
•
|
unanticipated delays in production caused by insufficient capacity or availability of raw materials;
|
|
•
|
any disruptions in the manufacturing process, including unexpected turnover in the labor force or the introduction of new production processes, power outages or natural or other disasters beyond our control;
|
|
•
|
the development and marketing of directly competitive products by existing and new competitors;
|
|
•
|
major changes in available technology or the preferences of customers may cause our current product offerings to become less competitive or obsolete;
|
|
•
|
aggressive price competition from competitors;
|
|
•
|
costs and expenditures in connection with litigation;
|
|
•
|
the timing of new product introductions by us and our competitors, as well as customer order deferrals in anticipation of enhancements or new products;
|
|
•
|
disruptions to our business due to political, economic or other social instability, including the impact of an epidemic any of which results in changes in consumer spending habits, consumers unable or unwilling to visit the orthodontist or general practitioners office, as well as any impact on workforce absenteeism;
|
|
•
|
inaccurate forecasting of net revenues, production and other operating costs; and
|
|
•
|
investments in research and development to develop new products and enhancements.
|
To respond to these and other factors, we may need to make business decisions that could adversely affect our operating results such as modifications to our pricing policy, business structure or operations. Most of our expenses, such as employee compensation and lease payment obligations, are relatively fixed in the short term. Moreover, our expense levels are based, in part, on our expectations regarding future revenue levels. As a result, if our net revenues for a particular period fall below our expectations, whether caused by changes in consumer spending, consumer preferences, weakness in the U.S. or global economies, changes in customer behavior related to advertising and prescribing our product, or other factors, we may be unable to adjust spending quickly enough to offset any shortfall in net revenues. Due to these and other factors, we believe that quarter-to-quarter comparisons of our operating results may not be meaningful. You should not rely on our results for any one quarter as an indication of our future performance.
Our future success may depend on our ability to develop, successfully introduce and achieve market acceptance of new products.
Our future success may depend on our ability to develop, manufacture, market, and obtain regulatory approval or clearance of new products. There can be no assurance that we will be able to successfully develop, sell and achieve market acceptance of these and other new products and applications and enhanced versions of our existing product or software. The extent of, and rate at which, market acceptance and penetration are achieved by future products is a function of many variables, which include, among other things, our ability to:
17
|
•
|
correctly identify customer needs and preferences and predict future needs and preferences;
|
|
•
|
include functionality and features that address customer requirements;
|
|
•
|
ensure compatibility of our computer operating systems and hardware configurations with those of our customers;
|
|
•
|
allocate our research and development funding to products with higher growth prospects;
|
|
•
|
anticipate and respond to our competitors’ development of new products and technological innovations;
|
|
•
|
differentiate our offerings from our competitors’ offerings;
|
|
•
|
innovate and develop new technologies and applications;
|
|
•
|
the availability of third-party reimbursement of procedures using our products;
|
|
•
|
obtain adequate intellectual property rights; and
|
|
•
|
encourage customers to adopt new technologies.
|
If we fail to accurately predict customer needs and preferences or fail to produce viable technologies, we may invest heavily in research and development of products that do not lead to significant revenue. Even if we successfully innovate and develop new products and produce enhancements, we may incur substantial costs in doing so, and our profitability may suffer. In addition, even if our new products are successfully introduced, it is unlikely that they will rapidly gain market share and acceptance primarily due to the relatively long period of time it takes to successfully treat a patient with Invisalign. Since it takes approximately 12 to 24 months to treat a patient, our customers may be unwilling to rapidly adopt our new products until they successfully complete at least one case or until more historical clinical results are available.
Our ability to market and sell new products may also be subject to government regulation, including approval or clearance by the FDA, and foreign government agencies. Any failure in our ability to successfully develop and introduce or achieve market acceptance of our new products or enhanced versions of existing products could have a material adverse effect on our operating results and could cause our net revenues to decline.
A disruption in the operations of our primary freight carrier or higher shipping costs could cause a decline in our net revenues or a reduction in our earnings.
We are dependent on commercial freight carriers, primarily UPS, to deliver our products to our customers. If the operations of these carriers are disrupted for any reason, we may be unable to deliver our products to our customers on a timely basis. If we cannot deliver our products in an efficient and timely manner, our customers may reduce their orders from us and our net revenues and operating profits could materially decline. In a rising fuel cost environment, our freight costs will increase. If freight costs materially increase and we are unable to pass that increase along to our customers for any reason or otherwise offset such increases in our cost of net revenues, our gross margin and financial results could be adversely affected.
We are dependent on our international operations, which exposes us to foreign operational, political and other risks that may harm our business.
Our key production steps are performed in operations located outside of the U.S. At our facility in San Jose, Costa Rica, technicians use a sophisticated, internally developed computer-modeling program to prepare digital treatment plans, which are then transmitted electronically to Juarez, Mexico. These digital files form the basis of the ClinCheck treatment plan and are used to manufacture aligner molds. Our order acquisition, aligner fabrication and shipping operations are conducted in Juarez, Mexico. In addition to the research and development efforts conducted in our San Jose, California facility, we also carry out research and development at locations in Moscow, Russia. In addition, our customer-care, accounts receivable, credit and collections and customer event registration organizations are located at our facility in San Jose, Costa Rica. We also have operations in Israel where the design and wand assembly and our intra-oral scanner are manufactured. Our reliance on international operations exposes us to risks and uncertainties that may affect our business or results of operation, including:
|
•
|
difficulties in hiring and retaining employees generally, as well as difficulties in hiring and retaining employees with the necessary skills to perform the more technical aspects of our operations;
|
|
•
|
difficulties in managing international operations, including any travel restrictions to or from our facilities located in Russia and Israel;
|
18
|
•
|
fluctuations in currency exchange rates;
|
|
•
|
increased income taxes, and other restrictions and limitations, if we were to decide to repatriate any of our foreign cash balances back to the U.S.;
|
|
•
|
import and export license requirements and restrictions;
|
|
•
|
controlling production volume and quality of the manufacturing process;
|
|
•
|
political, social and economic instability, including as a result of increased levels of violence in Juarez, Mexico or the Middle East. We cannot predict the effect on us of any future armed conflict, political instability or violence in these regions. In addition, some of our employees in Israel are obligated to perform annual reserve duty in the Israeli military and are subject to being called for additional active duty under emergency circumstances. We cannot predict the full impact of these conditions on us in the future, particularly if emergency circumstances or an escalation in the political situation occurs. If many of our employees are called for active duty, our operations in Israel and our business may not be able to function at full capacity;
|
|
•
|
acts of terrorism and acts of war;
|
|
•
|
geopolitical risks around the Ukraine and the possibility of additional sanctions against Russia which continue to bring uncertainty to this region;
|
|
•
|
interruptions and limitations in telecommunication services;
|
|
•
|
product or material transportation delays or disruption, including as a result of increased levels of violence, acts of terrorism, acts of war or health epidemics restricting travel to and from our international locations or as a result of natural disasters, such as earthquakes or volcanic eruptions;
|
|
•
|
burdens of complying with a wide variety of local country and regional laws;
|
|
•
|
trade restrictions and changes in tariffs; and
|
|
•
|
potential adverse tax consequences.
|
If any of these risks materialize in the future, we could experience production delays and lost or delayed revenue.
We earn an increasingly larger portion of our total revenues from international sales and face risks attendant to those operations.
We earn an increasingly larger portion of our total revenues from international sales generated through our foreign direct and indirect operations. As a result of these sales operations, we face a variety of risks, including:
|
•
|
local political and economic instability;
|
|
•
|
the engagement of activities by our employees, contractors, partners and agents, especially in countries with developing economies, that are prohibited by international and local trade and labor laws and other laws prohibiting corrupt payments to government officials, including the Foreign Corrupt Practices Act, the UK Bribery Act of 2010 and export control laws, in spite of our policies and procedures designed to ensure compliance with these laws;
|
|
•
|
although it is our intention to indefinitely reinvest earnings outside the U.S., restrictions on the transfer of funds held by our foreign subsidiaries, including with respect to restrictions on our ability to repatriate foreign cash to the U.S at favorable tax rates;
|
|
•
|
fluctuations in currency exchange rates; and
|
|
•
|
increased expense of developing, testing and making localized versions of our products.
|
Any of these factors, either individually or in combination, could materially impact our international operations and adversely affect our business as a whole.
19
A key step in our manufacturing process relies on sophisticated computer technology that requires new technicians to undergo a relatively long training process. If we are unable to accurately predict our volume growth, and fail to hire a sufficient number of technicians in advance of such demand, the delivery time of our products could be delayed which could adversely affect our results of operations.
Training production technicians takes approximately 90 to 120 days. As a result, if we are unable to accurately predict our volume growth, we may not have a sufficient number of trained technicians to deliver our products within the timeframe our customers expect. Such a delay could cause us to lose existing customers or fail to attract new customers. This could cause a decline in our net revenues and net income and could adversely affect our results of operations.
Our headquarters, digital dental modeling processes, and other manufacturing processes are principally located in regions that are subject to earthquakes and other natural disasters.
Our digital dental modeling is processed in our facility located in San Jose, Costa Rica. The operations team in Costa Rica creates ClinCheck treatment plans using sophisticated computer software. In addition, our customer facing operations are located in Costa Rica. Our aligner molds and finished aligners are fabricated in Juarez, Mexico. Both locations in Costa Rica and Mexico are in earthquake zones and may be subject to other natural disasters. If there is a major earthquake or any other natural disaster in a region where one of these facilities is located, our ability to create ClinCheck treatment plans, respond to customer inquiries or manufacture and ship our aligners could be compromised which could result in our customers experiencing a significant delay in receiving their completed aligners and a decrease in service levels for a period of time. In addition, our headquarters facility in California is located in the San Francisco Bay Area. An earthquake or other natural disaster in this region could result in a disruption in our operations. Any such business interruption could materially and adversely affect our business, financial condition and results of operations.
Our information technology systems are critical to our business. System integration and implementation issues and system security risks could disrupt our operations, which could have a material adverse impact on our business and operating results.
We rely on the efficient and uninterrupted operation of complex information technology systems. All information technology systems are vulnerable to damage or interruption from a variety of sources. As our business has grown in size and complexity, the growth has placed, and will continue to place, significant demands on our information technology systems. To effectively manage this growth, our information systems and applications require an ongoing commitment of significant resources to maintain, protect and enhance existing systems and develop new systems to keep pace with continuing changes in information processing technology, evolving industry and regulatory standards and changing customer preferences. We are in the process of implementing a multi-year, company-wide program to transform certain business processes or extend established processes, including the transition to a single enterprise resource planning ("ERP") software system to perform various functions. The implementation of additional functionality in the ERP system entails certain risks, including difficulties with changes in business processes that could disrupt our operations, such as our ability to track orders and timely ship products, manage our supply chain and aggregate financial and operational data. During transitions we must continue to rely on legacy information systems, which may be costly or inefficient, while the implementation of new initiatives may not achieve the anticipated benefits and may divert management's attention from other operational activities, negatively affect employee morale, or have other unintended consequences. Additionally, if we are not able to accurately forecast expenses and capitalized costs related to the project, this may have an adverse impact on our financial condition and operating results.
If the information we rely upon to run our businesses were to be found to be inaccurate or unreliable, if we fail to properly maintain our information systems and data integrity, or if we fail to develop new capabilities to meet our business needs in a timely manner, we could have operational disruptions, have customer disputes, lose our ability to produce timely and accurate reports, have regulatory or other legal problems, have increases in operating and administrative expenses, lose existing customers, have difficulty in attracting new customers or in implementing our growth strategies, or suffer other adverse consequences. In addition, experienced computer programmers and hackers may be able to penetrate our network security and misappropriate our confidential information or that of third parties, create system disruptions or cause shutdowns. Furthermore, sophisticated hardware and operating system software and applications that we either internally develop or procure from third parties which we depend upon may contain defects in design and manufacture, including “bugs” and other problems that can unexpectedly interfere with the operation of the system. The costs to eliminate or alleviate security problems, viruses and bugs could be significant, and the efforts to address these problems could result in interruptions that may have a material adverse impact on our operations, net revenues and operating results.
System upgrades and enhancements require significant expenditures and allocation of valuable employee resources. Delays in integration or disruptions to our business from implementation of these new or upgraded systems could have a material adverse impact on our financial condition and operating results.
20
Additionally, we continuously upgrade our customer facing software applications, specifically the ClinCheck and MyAligntech software. Software applications frequently contain errors or defects, especially when they are first introduced or when new versions are released. The discovery of a defect or error or the incompatibility with the computer operating system and hardware configurations of customers in a new upgraded version or the failure of our primary information systems may result in the following consequences, among others: loss of revenue or delay in market acceptance, damage to our reputation or increased service costs, any of which could have a material adverse effect on our business, financial condition or results of operations.
Furthermore, our business requires the secure transmission of confidential information over public networks. Because of the confidential health information we store and transmit, security breaches could expose us to a risk of regulatory action, litigation, possible liability and loss. Our security measures may be inadequate to prevent security breaches, and our business operations and profitability would be adversely affected by, among other things, loss of customers and potential criminal and civil sanctions if they are not prevented.
There can be no assurance that our process of improving existing systems, developing new systems to support our expanding operations, integrating new systems, protecting confidential patient information, and improving service levels will not be delayed or that additional systems issues will not arise in the future. Failure to adequately protect and maintain the integrity of our information systems and data may result in a material adverse effect on our financial position, results of operations and cash flows.
Competition in the markets for our products is intense and we expect aggressive competition from existing competitors and other companies that may introduce new technologies in the future.
Currently, our products compete directly against products manufactured and distributed by various companies, both within and outside the U.S. Many of these manufacturers, including Danaher Corporation, 3M, Sirona Dental Systems, Inc. and Dentsply International, have substantially greater financial resources and manufacturing and marketing experience than we do and may, in the future, attempt to develop an orthodontic system similar to ours or combine technologies that make our product economically unattractive. The expiration of certain key patents commencing in 2017 owned by us may result in additional competition. Large consumer product companies may also enter the orthodontic supply market. Furthermore, we may face competition in the future from new companies that may introduce new technologies. We may be unable to compete with these competitors and one or more of these competitors may render our technology obsolete or economically unattractive. If we are unable to compete effectively with existing products or respond effectively to any products developed by new or existing competitors, our business could be harmed. Increased competition has resulted in the past and may in the future result in volume discounting and price reductions, reduced gross margins, reduced profitability and loss of market share, and reduce dental professionals’ efforts and commitment to expand their use of our products, any of which could have a material adverse effect on our net revenues, volume growth, net income and stock price. We cannot assure you that we will be able to compete successfully against our current or future competitors or that competitive pressures will not have a material adverse effect on our business, results of operations and financial condition.
If the security of our customer and patient information is compromised, patient care could suffer, and we could be liable for related damages, and our reputation could be impaired.
We retain confidential customer and patient information in our processing centers. Therefore, it is critical that our facilities and infrastructure remain secure and that our facilities and infrastructure are perceived by the marketplace and our customers to be secure. Despite the implementation of security measures, our infrastructure may be vulnerable to physical break-ins, computer viruses, programming errors, attacks by third parties or similar disruptive problems. If we fail to meet our clients’ expectations regarding the security of healthcare information, we could be liable for damages and our reputation could be impaired. In addition, patient care could suffer, and we could be liable if our systems fail to deliver correct information in a timely manner. Our insurance may not protect us from this risk.
Our success depends in part on our proprietary technology, and if we are unable to successfully enforce our intellectual property rights, our competitive position may be harmed. Litigating claims of this type is costly and could distract our management and cause a decline in our results of operations and stock price.
Our success will depend in part on our ability to maintain existing intellectual property and to obtain and maintain further intellectual property protection for our products, both in the U.S. and in other countries. Our inability to do so could harm our competitive position. As of
December 31, 2014
, we had issued 352 U.S. patents, 97 pending U.S. patent applications, and 257 foreign issued patents, and 108 pending foreign patent applications.
We intend to rely on our portfolio of issued and pending patent applications in the U.S. and in other countries to protect a large part of our intellectual property and our competitive position; however, our currently pending or future patent filings may not result in the issuance of patents. Additionally, any patents issued to us may be challenged, invalidated, held unenforceable,
21
circumvented, or may not be sufficiently broad to prevent third parties from producing competing products similar in design to our products. In addition, any protection afforded by foreign patents may be more limited than that provided under U.S. patents and intellectual property laws. We also rely on protection of our copyrights, trade secrets, know-how and proprietary information. We generally enter into confidentiality agreements with our employees, consultants and our collaborative partners upon commencement of a relationship with us; however, these agreements may not provide meaningful protection against the unauthorized use or disclosure of our trade secrets or other confidential information, and adequate remedies may not exist if unauthorized use or disclosure were to occur. Our inability to maintain the proprietary nature of our technology through patents, copyrights or trade secrets would impair our competitive advantages and could have a material adverse effect on our operating results, financial condition and future growth prospects. In particular, a failure to protect our proprietary rights might allow competitors to copy our technology, which could adversely affect our pricing and market share. In addition, in an effort to protect our intellectual property we have in the past been and may in the future be involved in litigation. The potential effects on our business operations resulting from litigation that we may participate in the future, whether or not ultimately determined in our favor or settled by us, are costly and divert the efforts and attention of our management and technical personnel from normal business operations.
Litigation is subject to inherent uncertainties and unfavorable rulings could occur. An unfavorable ruling could include monetary damages or, in cases where injunctive relief is sought, an injunction prohibiting us from selling our products. Any of these results from our litigation could adversely affect our results of operations and stock price.
While we believe we currently have adequate internal control over financial reporting, we are required to assess our internal control over financial reporting on an annual basis and any future adverse results from such assessment could result in a loss of investor confidence in our financial reports and have an adverse effect on our stock price.
Pursuant to the Sarbanes-Oxley Act of 2002 and the rules and regulations promulgated by the SEC, we are required to furnish in our Form 10-K a report by our management regarding the effectiveness of our internal control over financial reporting. The report includes, among other things, an assessment of the effectiveness of our internal control over financial reporting as of the end of our fiscal year, including a statement as to whether or not our internal control over financial reporting is effective. This assessment must include disclosure of any material weaknesses in our internal control over financial reporting identified by management. While we believe our internal control over financial reporting is currently effective, the effectiveness of our internal controls in future periods is subject to the risk that our controls may become inadequate because of changes in conditions, and, as a result, the degree of compliance of our internal control over financial reporting with the existing policies or procedures may become ineffective. Establishing, testing and maintaining an effective system of internal control over financial reporting requires significant resources and time commitments on the part of our management and our finance staff, may require additional staffing and infrastructure investments, and would increase our costs of doing business. If we are unable to assert that our internal control over financial reporting is effective in any future period (or if our auditors are unable to express an opinion on the effectiveness of our internal controls or conclude that our internal controls are ineffective), we could lose investor confidence in the accuracy and completeness of our financial reports, which could have an adverse effect on our stock price.
If we lose our key personnel or are unable to attract and retain key personnel, we may be unable to pursue business opportunities or develop our products.
We are highly dependent on the key employees in our clinical engineering, technology development, sales, training and marketing personnel and management teams. The loss of the services provided by those individuals may significantly delay or prevent the achievement of our product development and other business objectives and could harm our business. Our future success will also depend on our ability to identify, recruit, train and retain additional qualified personnel, including orthodontists. Few orthodontists are accustomed to working in a manufacturing environment since they are generally trained to work in private practices, universities and other research institutions. Thus, we may be unable to attract and retain personnel with the advanced qualifications necessary for the further development of our business. Furthermore, we may not be successful in retaining our key personnel or their services. If we are unable to attract and retain key personnel, our business could be materially harmed. In addition, our ability to recognize revenue on the direct sales of our intra-oral scanners depends in part upon our ability to schedule and staff trainings. The loss of the services provided by these individuals or our ability to timely hire such personnel in sufficient numbers based on our volume growth, may harm our business. If we are unable to retain our trainers or replace such individuals with persons having equivalent technical expertise and qualifications, or if we are unable to successfully instill such technical expertise in newly hired personnel or accurately predict the number of such personnel needed, our net revenues could be materially harmed.
If we infringe the patents or proprietary rights of other parties or are subject to a patent infringement claim, our ability to grow our business may be severely limited.
Extensive litigation over patents and other intellectual property rights is common in the medical device industry. We have been sued for infringement of third party’s patents in the past and we may be the subject of patent or other litigation in the future.
22
From time to time, we have received and may in the future receive letters from third parties drawing our attention to their patent rights. While we do not believe that we infringe upon any valid and enforceable rights that have been brought to our attention, there may be other more pertinent rights of which we are presently unaware. The defense and prosecution of intellectual property suits, interference proceedings and related legal and administrative proceedings could result in substantial expense to us and significant diversion of effort by our technical and management personnel. An adverse determination of any litigation or interference proceeding to which we may become a party could subject us to significant liabilities. An adverse determination of this nature could also put our patents at risk of being invalidated or interpreted narrowly or require us to seek licenses from third parties. Licenses may not be available on commercially reasonable terms or at all, in which event, our business would be materially adversely affected.
We maintain single supply relationships for certain of our key machines and materials technologies, and our business and operating results could be harmed if supply is restricted or ends or the price of raw materials used in our manufacturing process increases.
We are highly dependent on manufacturers of specialized scanning equipment, rapid prototyping machines, resin and other advanced materials, as well as the optics, electronic and other mechanical components of our intra-oral scanners. We maintain single supply relationships for many of these machines and materials technologies. In particular, our CT scanning and stereolithography equipment used in our aligner manufacturing and many of the critical components for the optics of our scanners are provided by single suppliers. We are also committed to purchasing the vast majority of our resin and polymer, the primary raw materials used in our manufacturing process for clear aligners, from a single source. If these or other suppliers encounter financial, operating or other difficulties or if our relationship with them changes, we might not be able to quickly establish or qualify replacement sources of supply and could face production interruptions, delays and inefficiencies. In addition, technology changes by our vendors could disrupt access to required manufacturing capacity or require expensive, time consuming development efforts to adapt and integrate new equipment or processes. Our growth may exceed the capacity of one or more of these manufacturers to produce the needed equipment and materials in sufficient quantities to support our growth. Conversely, in order to secure supplies for production of products, we sometimes enter into non-cancelable purchase commitments with vendors, which could impact our ability to adjust our inventory to reflect declining market demands. If demand for our products is less than we expect, we may experience additional excess and obsolete inventories and be forced to incur additional charges and our profitability may suffer. In the event of technology changes, delivery delays, or shortages of or increases in price for these items, our business and growth prospects may be harmed.
We depend on a single contract manufacturer and supplier of parts used in our iTero scanner and any disruption in this relationship may cause us to fail to meet the demands of our customers and damage our customer relationships.
We rely on a third party manufacturer in Israel to assemble our iTero scanner. As a result, if this third party manufacturer fails to deliver its components or if we lose its services, we may be unable to deliver our products in a timely manner and our business may be harmed. Any difficulties encountered by the third party manufacturer with respect to hiring personnel, and maintaining acceptable manufacturing standards, controls, procedures and policies could disrupt our ability to deliver our products in a timely manner. Finding a substitute manufacturer may be expensive, time-consuming or impossible and could result in a significant interruption in the supply of our intra-oral scanning products. Any failure by our contract manufacturer that results in delays in our fulfillment of customer orders may cause us to lose revenues and suffer damage to our customer relationships.
We primarily rely on our direct sales force to sell our products, and any failure to maintain our direct sales force could harm our business.
Our ability to sell our products and generate revenues primarily depends upon our direct sales force within our North American and international markets. As of
December 31, 2014
, our North American sales organization consisted of approximately 280 people. Internationally, we had approximately 160 people engaged in direct sales and sales support as of
December 31, 2014
. We do not have any long-term employment contracts with the members of our direct sales force. The loss of the services provided by these key personnel may harm our business. If we are unable to retain our direct sales force personnel or replace them with individuals of equivalent technical expertise and qualifications, or if we are unable to successfully instill such technical expertise or if we fail to establish and maintain strong relationships with our customers within a relatively short period of time, our net revenues and our ability to maintain market share could be materially harmed. In addition, due to our large and fragmented customer base, we may not be able to provide all of our customers with product support immediately upon the launch of a new product. As a result, adoption of new products by our customers may be slower than anticipated and our ability to grow market share and increase our net revenues may be harmed.
23
If our distributor relationships are not successful, our ability to market and sell our products would be harmed and our financial performance will be adversely affected.
We depend on relationships with distributors for the marketing and sales of our products in various geographic regions, and we have a limited ability to influence their efforts. Relying on distributors for our sales and marketing could harm our business for various reasons, including:
|
•
|
agreements with distributors may terminate prematurely due to disagreements or may result in litigation between the partners;
|
|
•
|
we may not be able to renew existing distributor agreements on acceptable terms;
|
|
•
|
our distributors may not devote sufficient resources to the sale of products;
|
|
•
|
our distributors may be unsuccessful in marketing our products;
|
|
•
|
our existing relationships with distributors may preclude us from entering into additional future arrangements with other distributors; and
|
|
•
|
we may not be able to negotiate future distributor agreements on acceptable terms.
|
Complying with regulations enforced by the FDA and other regulatory authorities is an expensive and time-consuming process, and any failure to comply could result in substantial penalties.
Our products are considered medical devices and are subject to extensive regulation in the U.S. and internationally. FDA regulations are wide ranging and govern, among other things:
|
•
|
product design, development, manufacturing and testing;
|
|
•
|
product labeling;
|
|
•
|
product storage;
|
|
•
|
pre-market clearance or approval;
|
|
•
|
complaint handling and corrective actions;
|
|
•
|
advertising and promotion; and
|
|
•
|
product sales and distribution.
|
Our failure to comply with applicable regulatory requirements could result in enforcement action by the FDA or state agencies, which may include any of the following sanctions:
|
•
|
warning letters, fines, injunctions, consent decrees and civil penalties;
|
|
•
|
repair, replacement, refunds, recall or seizure of our products;
|
|
•
|
operating restrictions or partial suspension or total shutdown of production;
|
|
•
|
refusing our requests for 510(k) clearance or pre-market approval of new products, new intended uses, or modifications to existing products;
|
|
•
|
withdrawing clearance or pre-market approvals that have already been granted; and
|
|
•
|
criminal prosecution.
|
If any of these events were to occur, they could harm our business. We must comply with facility registration and product listing requirements of the FDA and adhere to applicable Quality System regulations. The FDA enforces its Quality System regulations through periodic unannounced inspections. Our failure to take satisfactory corrective action in response to an adverse inspection or the failure to comply with applicable manufacturing regulations could result in enforcement action, and we may be required to find alternative manufacturers, which could be a long and costly process. Any FDA enforcement action could have a material adverse effect on us.
24
Before we can sell a new medical device in the U.S., or market a new use of or claim for an existing product we must obtain FDA clearance or approval, unless an exemption applies. Obtaining regulatory clearances or approvals can be a lengthy and time-consuming process. Even though the devices we market have obtained the necessary clearances from the FDA, we may be unable to maintain such clearances in the future. Furthermore, we may be unable to obtain the necessary clearances for new devices that we intend to market in the future. Our inability to maintain or obtain regulatory clearances or approvals could materially harm our business.
In addition, as part of the Dodd-Frank Wall Street Reform and Consumer Protection Act, the SEC adopted disclosure requirements regarding the use of certain minerals, known as conflict minerals, which are mined from the Democratic Republic of Congo and adjoining countries, as well as procedures regarding a manufacturer's efforts to identify and discourage the sourcing of such minerals and metals produced from those minerals. Additional reporting obligations are being considered by the European Union. The implementation of the existing U.S. requirements and any additional requirements in Europe could affect the sourcing and availability of metals used in the manufacture of a limited number of parts (if any) contained in our products. For example, the implementation of these disclosure requirements may decrease the number of suppliers capable of supplying our needs for certain metals, thereby negatively affecting our ability to obtain products in sufficient quantities or at competitive prices. Our material sourcing is broad based and multi-tiered, and we may be unable to conclusively verify the origins for all metals used in our products. We may suffer financial and reputational harm if customers require, and we are unable to deliver, certification that our products are conflict free. Regardless, we will incur additional costs associated with compliance with these disclosure requirements, including time-consuming and costly efforts to determine the source of any conflict minerals used in our products.
If compliance with healthcare regulations becomes costly and difficult for our customers or for us, we may not be able to grow our business.
Participants in the healthcare industry are subject to extensive and frequently changing regulations under numerous laws administered by governmental entities at the federal, state and local levels, some of which are, and others of which may be, applicable to our business. In response to perceived increases in health care costs in recent years, Congress passed health care reform legislation that President Obama signed into law in March 2010. This legislation contains many provisions designed to generate the revenues necessary to fund the coverage expansions. The most relevant of these provisions are those that impose fees or taxes on certain health-related industries, including medical device manufacturers. Effective January 1, 2013, as a medical device manufacturer, we were required to pay an excise tax on the price for which we sell our medical devices in the U.S. This Medical Device Excise Tax ("MDET") applies to most medical devices, including our products, which could have a material, negative impact on our results of operations and our cash flows.
During March 2014, Align had extensive discussions with the IRS and they informed us that our aligners are not subject to the MDET; however, our scanners are still subject to the MDET. As a result of these discussions, beginning in March 2014, we ceased expensing and paying the MDET for aligners, which reduced our general and administrative expense for the year ended
December 31, 2014
by approximately $6.8 million compared to the prior year period. The excise tax expense was $7.1 million for the year ended December 31, 2013; however, MDET for year ended
December 31, 2014
was reduced to $0.3 million due to the changes noted above. Additionally, we are in process of claiming a $6.8 million refund of MDET paid in 2013 related to our aligners; however, because this claim is subject to review and approval by the IRS, we have not recorded a receivable as the outcome of the audit is undeterminable. Any future changes in the applicability of the MDET as it applies to us or refunds of amounts previously paid will be recorded as an additional expense or a credit to the consolidated statement of operations in the period in which it becomes probable and reasonably estimable. The MDET is included in general and administrative expenses in the consolidated statements of operations.
Furthermore, our healthcare provider customers are also subject to a wide variety of laws and regulations that could affect the nature and scope of their relationships with us. The healthcare market itself is highly regulated and subject to changing political, economic and regulatory influences. Regulations implemented pursuant to the Health Insurance Portability and Accountability Act ("HIPAA"), including regulations affecting the security and privacy of patient healthcare information held by healthcare providers and their business associates may require us to make significant and unplanned enhancements of software applications or services, result in delays or cancellations of orders, or result in the revocation of endorsement of our products and services by healthcare participants. The effect of HIPAA and newly enforced regulations on our business is difficult to predict, and there can be no assurance that we will adequately address the business risks created by HIPAA and its implementation or that we will be able to take advantage of any resulting business opportunities.
25
Extensive and changing government regulation of the healthcare industry may be expensive to comply with and exposes us to the risk of substantial government penalties.
In addition to medical device laws and regulations, numerous state and federal healthcare-related laws regulate our business, covering areas such as:
|
•
|
storage, transmission and disclosure of medical information and healthcare records;
|
|
•
|
prohibitions against the offer, payment or receipt of remuneration to induce referrals to entities providing healthcare services or goods or to induce the order, purchase or recommendation of our products; and
|
|
•
|
the marketing and advertising of our products.
|
Complying with these laws and regulations could be expensive and time-consuming, and could increase our operating costs or reduce or eliminate certain of our sales and marketing activities or our revenues.
We face risks related to our international sales, including the need to obtain necessary foreign regulatory clearance or approvals.
Outside of North America, we currently sell our products in Europe, Asia Pacific, Latin America and the Middle East and may expand into other countries from time to time. For sales of our products outside the U.S., we are subject to foreign regulatory requirements that vary widely from country to country. The time required to obtain clearances or approvals required by other countries may be longer than that required for FDA clearance or approval, and requirements for such approvals may differ from FDA requirements. We may be unable to obtain regulatory approvals in one or more of the other countries in which we do business or in which we may do business in the future. We may also incur significant costs in attempting to obtain and maintain foreign regulatory approvals. If we experience delays in receipt of approvals to market our products outside of the U.S., or if we fail to receive these approvals, we may be unable to market our products or enhancements in international markets in a timely manner, if at all.
Our business exposes us to potential product liability claims, and we may incur substantial expenses if we are subject to product liability claims or litigation.
Medical devices involve an inherent risk of product liability claims and associated adverse publicity. We may be held liable if any product we develop or any product that uses or incorporates any of our technologies causes injury or is otherwise found unsuitable. Although we intend to continue to maintain product liability insurance, adequate insurance may not be available on acceptable terms, if at all, and may not provide adequate coverage against potential liabilities. A product liability claim, regardless of its merit or eventual outcome, could result in significant legal defense costs. These costs would have the effect of increasing our expenses and diverting management’s attention away from the operation of our business, and could harm our business.
Historically, the market price for our common stock has been volatile.
The market price of our common stock could be subject to wide price fluctuations in response to various factors, many of which are beyond our control. The factors include:
|
•
|
quarterly variations in our results of operations and liquidity;
|
|
•
|
changes in recommendations by the investment community or in their estimates of our net revenues or operating results;
|
|
•
|
speculation in the press or investment community concerning our business and results of operations;
|
|
•
|
strategic actions by our competitors, such as product announcements or acquisitions;
|
|
•
|
announcements of technological innovations or new products by us, our customers or competitors; and
|
|
•
|
general economic market conditions.
|
In addition, the stock market in general, and the market for technology and medical device companies in particular, have experienced extreme price and volume fluctuations that have often been unrelated to or disproportionate to the operating performance of those companies. These broad market and industry factors may seriously harm the market price of our common stock, regardless
26
of our operating performance. Historically, class action litigation is often brought against an issuing company following periods of volatility in the market price of a company’s securities.
Future sales of significant amounts of our common stock may depress our stock price.
A large percentage of our outstanding common stock is currently owned by a small number of significant stockholders. These stockholders have sold in the past, and may sell in the future, large amounts of common stock over relatively short periods of time. Sales of substantial amounts of our common stock in the public market by our existing stockholders may adversely affect the market price of our common stock. Such sales could create public perception of difficulties or problems with our business and may depress our stock price.
If our goodwill or long-lived assets become impaired, we may be required to record a significant charge to earnings.
Under Generally Accepted Accounting Principles in the United States (“U.S. GAAP”), we review our goodwill and asset group for impairment when events or changes in circumstances indicate the carrying value may not be recoverable. Additionally, goodwill is required to be tested for impairment at least annually. The qualitative and quantitative analysis used to test goodwill are dependent upon various assumptions and reflect management’s best estimates. Changes in certain assumptions including revenue growth rates, discount rates, earnings multiples and future cash flows may cause a change in circumstances indicating that the carrying value of goodwill or the asset group may be impaired. We may be required to record a significant charge to earnings in the financial statements during the period in which any impairment of goodwill or asset group are determined.
Changes in, or interpretations of, accounting rules and regulations, could result in unfavorable accounting charges.
We prepare our consolidated financial statements in conformity with U.S. GAAP. These principles are subject to interpretation by the SEC and various bodies formed to interpret and create appropriate accounting policies. A change in these policies can have a significant effect on our reported results and may even retroactively affect previously reported transactions. Our accounting policies that recently have been or may be affected by changes in the accounting rules are as follows:
|
•
|
revenue recognition; and
|
|
•
|
leases.
|
If we fail to manage our exposure to global financial and securities market risk successfully, our operating results and financial statements could be materially impacted.
The primary objective of most of our investment activities is to preserve principal. To achieve this objective, a majority of our marketable investments are investment grade, liquid, fixed-income securities and money market instruments denominated in U.S. dollars. If the carrying value of our investments exceeds the fair value, and the decline in fair value is deemed to be other-than-temporary, we will be required to write down the value of our investments, which could materially harm our results of operations and financial condition. Moreover, the performance of certain securities in our investment portfolio correlates with the credit condition of the U.S. financial sector. In a current unstable credit environment, we might incur significant realized, unrealized or impairment losses associated with these investments.
We have adopted a shareholders rights’ plan to limit the possibility that we are acquired, which may mean that a transaction that shareholders are in favor of or are benefited by may be prevented.
Our Board of Directors has the authority to issue up to 5,000,000 shares of preferred stock and to determine the rights, preferences, privileges and restrictions of such shares without any further vote or action by our shareholders. To date, our Board has designated 200,000 shares as Series A participating preferred stock in connection with our shareholder rights’ plan. The issuance of preferred stock under certain circumstances could have the effect of delaying or preventing an acquisition of Align or otherwise adversely affecting the rights of the holders of our stock. The shareholder rights’ plan may have the effect of rendering more difficult or discouraging an acquisition of our company which is deemed undesirable by our board of directors. The shareholder rights’ plan may cause substantial dilution to a person or group attempting to acquire us on terms or in a manner not approved by our board of directors, except pursuant to an offer conditioned on the negation, purchase or redemption of the rights issued under the shareholder rights’ plan.
Our effective tax rate may vary significantly from period to period.
Various internal and external factors may have favorable or unfavorable effects on our future effective tax rate. These factors include, but are not limited to, changes in tax laws, regulations and/or rates, non-deductible goodwill impairments, changing interpretations of existing tax laws or regulations, changes in the relative proportions of revenues and income before taxes in the
27
various jurisdictions in which we operate that have differing statutory tax rates, the future levels of tax benefits of stock option deductions relating to incentive stock options and employee stock purchase plans, settlement of income tax audits, and changes in overall levels of pretax earnings.
In June 2009, the Costa Rica Ministry of Foreign Trade, an agency of the Government of Costa Rica, granted a twelve year extension of various income tax incentives, which were previously granted in 2002. The incentive tax rates will expire in various years beginning in 2017. Under these incentives, all of the income in Costa Rica during these twelve year incentive periods is subject to reduced rates of Costa Rica income tax. In order to receive the benefit of these incentives, we must hire specified numbers of employees and maintain certain minimum levels of fixed asset investment in Costa Rica. If we do not fulfill these conditions for any reason, our incentive could lapse, and our income in Costa Rica would be subject to taxation at higher rates, which could have a negative impact on our operating results. The Costa Rica corporate income tax rate that would apply, absent the incentives, is 30% for 2014. As a result of these incentives, our income taxes were reduced by $32.5 million and $27.7 million for the year ended December 31, 2014 and 2013, respectively, representing a benefit to diluted net income per share of $0.40 and $0.34 in 2014 and 2013, respectively. Income taxes were reduced by $9.7 million in both the three months ended December 31, 2014 and 2013, representing a benefit to diluted net income per share of $0.12 in each period. Our subsidiary in Israel is under audit by the local tax authorities for calendar years 2006 through 2012.
ITEM 1B.
UNRESOLVED STAFF COMMENTS
None.
ITEM 2.
PROPERTIES
We occupy several leased and owned facilities with total office and manufacturing area of over 870,000 square feet. At
December 31, 2014
, the significant facilities were occupied as follows:
|
Location
|
Lease/Own
|
Primary Use
|
Segment
|
Expiration of lease
|
|
San Jose, California
|
Lease
|
Office for corporate headquarters, research & development and administrative personnel
|
Clear Aligner and Scanner
|
September 2017
|
|
San Jose, Costa Rica
|
Lease
|
Office for administrative personnel, manufacturing personnel, and customer care
|
Clear Aligner and Scanner
|
November 2017
|
|
Juarez, Mexico
|
Own
|
Manufacturing and office facility for manufacturing and administrative personnel
|
Clear Aligner and Scanner
|
N/A
|
|
Or Yehuda, Israel
|
Lease
|
Manufacturing and office for manufacturing, administrative personnel, and research and development
|
Scanner
|
October 2017
|
|
Amsterdam, The Netherlands
|
Lease
|
Office for international headquarters, sales and marketing and administrative personnel
|
Clear Aligner
|
April 2017
|
|
Moscow, Russia
|
Lease
|
Office for research and development
|
Clear Aligner and Scanner
|
April 2017
|
In February 2015, we purchased another facility in Juarez, Mexico in order to expand our manufacturing capacity to support additional growth. We believe that our facilities are adequate to meet current requirements and that additional or substitute space will be available as needed to accommodate any expansion of operations.
ITEM 3.
LEGAL PROCEEDINGS
Securities Class Action Lawsuit
On November 28, 2012, plaintiff City of Dearborn Heights Act 345 Police & Fire Retirement System filed a lawsuit against Align, Thomas M. Prescott (“Mr. Prescott”), Align’s President and Chief Executive Officer, and Kenneth B. Arola (“Mr. Arola”), Align’s former Vice President, Finance and Chief Financial Officer, in the United States District Court for the Northern District of California on behalf of a purported class of purchasers of our common stock (the “Securities Action”). On July 11, 2013, an amended complaint was filed, which named the same defendants, on behalf of a purported class of purchasers of our common stock between January 31, 2012 and October 17, 2012. The amended complaint alleged that Align, Mr. Prescott and Mr. Arola violated Section 10(b) of the Securities Exchange Act of 1934 and Rule 10b-5 promulgated thereunder, and that Mr. Prescott and Mr. Arola violated Section 20(a) of the Securities Exchange Act of 1934. Specifically, the amended complaint alleged that during
28
the purported class period defendants failed to take an appropriate goodwill impairment charge related to the April 29, 2011 acquisition of Cadent Holdings, Inc. in the fourth quarter of 2011, the first quarter of 2012 or the second quarter of 2012, which rendered our financial statements and projections of future earnings materially false and misleading and in violation of U.S. GAAP. The amended complaint sought monetary damages in an unspecified amount, costs and attorneys’ fees. On December 9, 2013, the court granted defendants’ motion to dismiss with leave for plaintiff to file a second amended complaint. Plaintiff filed a second amended complaint on January 8, 2014 on behalf of the same purported class. The second amended complaint states the same claims as the amended complaint. On August 22, 2014, the court granted our motion to dismiss without leave to amend. On September 22, 2014, Plaintiff filed a notice of appeal to the Ninth Circuit Court of Appeals. Align intends to vigorously defend itself against these allegations. Align is currently unable to predict the outcome of this amended complaint and therefore cannot determine the likelihood of loss nor estimate a range of possible loss, if any.
Shareholder Derivative Lawsuit
On February 1, 2013, plaintiff Gary Udis filed a shareholder derivative lawsuit against several of Align’s current and former officers and directors in the Superior Court of California, County of Santa Clara. The complaint alleges that our reported income and earnings were materially overstated because of a failure to timely write down goodwill related to the April 29, 2011 acquisition of Cadent Holdings, Inc., and that defendants made allegedly false statements concerning our forecasts. The complaint asserts various state law causes of action, including claims of breach of fiduciary duty, unjust enrichment, and insider trading, among others. The complaint seeks unspecified damages on behalf of Align, which is named solely as nominal defendant against whom no recovery is sought. The complaint also seeks an order directing Align to reform and improve its corporate governance and internal procedures, and seeks restitution in an unspecified amount, costs, and attorneys’ fees. On July 8, 2013, an Order was entered staying this derivative lawsuit until an initial ruling on our first motion to dismiss the Securities Action. On January 15, 2014, an Order was entered staying this derivative lawsuit until an initial ruling on our second motion to dismiss the Securities Action. On October 14, 2014, an Order was entered staying this derivative lawsuit until a ruling by the Ninth Circuit in the Securities Action discussed above. Align is currently unable to predict the outcome of this complaint and therefore cannot determine the likelihood of loss nor estimate a range of possible losses.
In addition, in the course of Align's operations, Align is involved in a variety of claims, suits, investigations, and proceedings, including actions with respect to intellectual property claims, patent infringement claims, government investigations, labor and employment claims, breach of contract claims, tax, and other matters. Regardless of the outcome, these proceedings can have an adverse impact on us because of defense costs, diversion of management resources, and other factors. Although the results of complex legal proceedings are difficult to predict and Align's view of these matters may change in the future as litigation and events related thereto unfold; Align currently does not believe that these matters, individually or in the aggregate, will materially affect Align's financial position, results of operations or cash flows.
ITEM 4.
MINE SAFETY DISCLOSURES
Not applicable.
29
ITEM 5.
MARKET FOR REGISTRANT’S COMMON EQUITY, RELATED STOCKHOLDER MATTERS AND ISSUER PURCHASES OF EQUITY SECURITIES
Price Range of Common Stock
Our common stock is quoted on the NASDAQ Global Select Market under the symbol “ALGN.” The following table sets forth the range of high and low per share sales prices as reported for each period indicated:
|
High
|
Low
|
||||||
|
Year Ended December 31, 2014:
|
|||||||
|
Fourth quarter
|
$
|
57.72
|
|
$
|
43.27
|
|
|
|
Third quarter
|
$
|
57.79
|
|
$
|
51.29
|
|
|
|
Second quarter
|
$
|
57.50
|
|
$
|
47.22
|
|
|
|
First quarter
|
$
|
65.10
|
|
$
|
50.37
|
|
|
|
Year Ended December 31, 2013
|
|||||||
|
Fourth quarter
|
$
|
60.00
|
|
$
|
41.83
|
|
|
|
Third quarter
|
$
|
49.08
|
|
$
|
36.92
|
|
|
|
Second quarter
|
$
|
38.74
|
|
$
|
29.53
|
|
|
|
First quarter
|
$
|
33.70
|
|
$
|
25.61
|
|
|
On February 20, 2015, the closing price of our common stock on the NASDAQ Global Market was $56.81 per share. As of January 31, 2015 there were approximately 110 holders of record of our common stock. Because the majority of our shares of outstanding common stock are held by brokers and other institutions on behalf of stockholders, we are unable to estimate the total number of stockholders represented by these record holders.
We have never declared or paid any cash dividends on our common stock. We currently intend to retain any future earnings to fund the development and growth of our business and do not anticipate paying any cash dividends in the foreseeable future.
Performance Graph
Notwithstanding any statement to the contrary in any of our previous or future filings with the SEC, the following information relating to the price performance of our common stock shall not be deemed “filed” with the SEC or “Soliciting Material” under the Securities Exchange Act of 1934, as amended, or subject to Regulation 14A or 14C, or to liabilities of Section 18 of the Exchange Act except to the extent we specifically request that such information be treated as soliciting material or to the extent we specifically incorporate this information by reference.
The graph below matches our cumulative 5-year total shareholder return on common stock with the cumulative total returns of the NASDAQ Composite index, and the S&P 1500 Composite Health Care Equipment & Supplies index. The graph tracks the performance of a $100 investment in our common stock, in the peer group, and the index (with the reinvestment of all dividends) from December 31, 2009 to
December 31, 2014
.
30
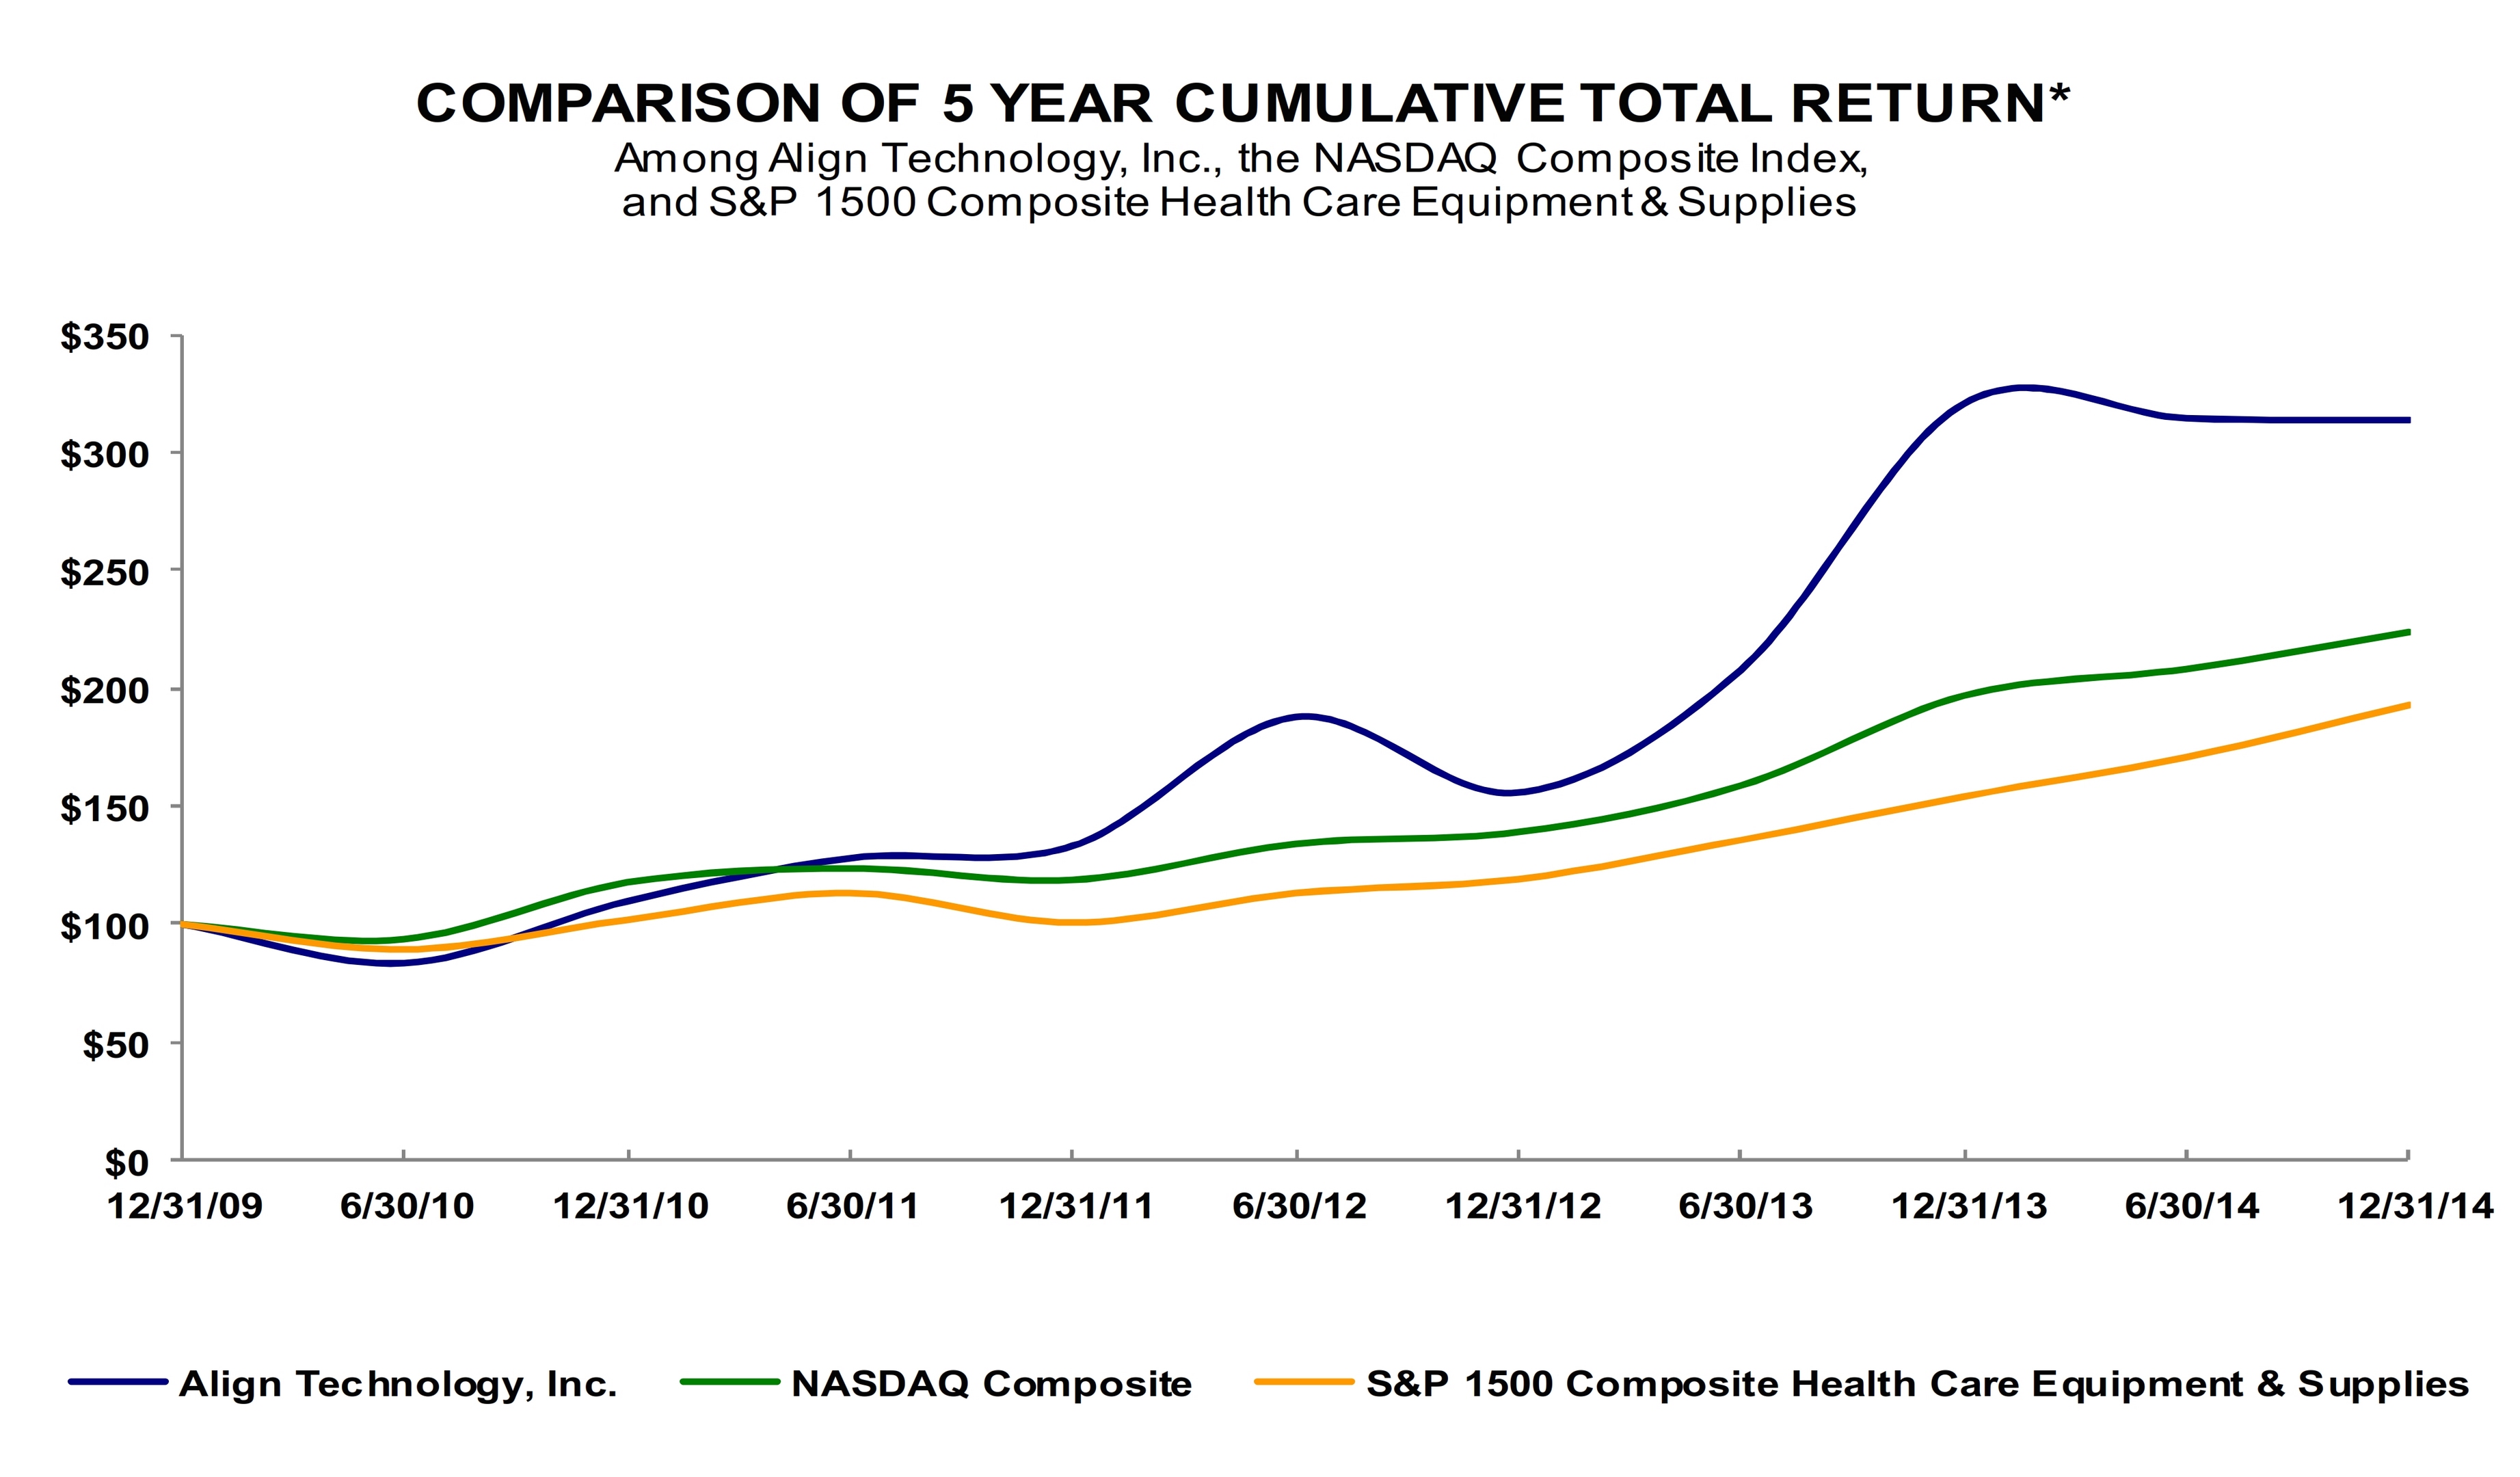
*$100 invested on 12/31/09 in stock or index, including reinvestment of dividends.
Fiscal year ending December 31.
Fiscal year ending December 31.
UNREGISTERED SALES OF EQUITY SECURITIES AND USE OF PROCEEDS
Following is a summary of stock repurchases for the three months ended December 31, 2014:
|
Period
|
Total Number of Shares Repurchased
|
Average Price Paid per Share
|
Total Number of Shares Repurchased as Part of Publicly Announced Program
(1)
|
Approximate Dollar Value of Shares that May Yet Be Repurchased Under the Program
(1)
|
||||||||||
|
October 1, 2014 through October 31, 2014
|
280,015
|
|
$
|
47.59
|
|
280,015
|
|
$
|
209,257,956
|
|
||||
|
November 1, 2014 through November 30, 2014
|
85,584
|
|
$
|
53.31
|
|
85,584
|
|
$
|
204,695,591
|
|
||||
|
December 1, 2014 through December 31, 2014
|
51,900
|
|
$
|
56.40
|
|
51,900
|
|
$
|
201,768,477
|
|
||||
(1)
On April 23, 2014, we announced that our Board of Directors had authorized a stock repurchase program pursuant to which we may purchase up to $300.0 million of our common stock over the next three years, with $100.0 million of that amount authorized to be purchased over the first twelve months. Any purchases under this stock repurchase program may be made, from time-to-time, pursuant to open market purchases (including pursuant to Rule 10b5-1 plans), privately-negotiated transactions, accelerated stock repurchases, block trades or derivative contracts or otherwise in accordance with applicable federal securities laws, including Rule 10b-18 of the Securities Exchange Act of 1934.
In addition, in January 2015, our Board of Directors has authorized the next $100 million under the program to be repurchased which we anticipate completing within twelve months. We expect to finance future stock repurchases with current cash on hand.
31
ITEM 6.
SELECTED CONSOLIDATED FINANCIAL DATA
The following tables set forth the selected consolidated financial data for each of the years in the five-year period ended
December 31, 2014
. The selected consolidated financial data should be read in conjunction with the Consolidated Financial Statements and accompanying notes and
Management’s Discussion and Analysis of Financial Condition and Results of Operations
. We have derived the statement of operations data for the year ended
December 31, 2014
,
2013
and
2012
and the balance sheet data as of
December 31, 2014
and
2013
from the consolidated audited financial statements included elsewhere in this Annual Report on Form 10-K. The statement of operations data for the year ended December 31, 2011 and 2010 and the balance sheet data as of
December 31, 2012
, 2011 and 2010 were derived from the consolidated audited financial statements that are not included in this Annual Report on Form 10-K.
SELECTED CONSOLIDATED FINANCIAL DATA
(in thousands, except per share data)
|
|
Year Ended December 31,
|
||||||||||||||||||
|
|
2014
|
2013
|
2012
|
2011
|
2010
|
||||||||||||||
|
|
|||||||||||||||||||
|
Net revenues
1
|
$
|
761,653
|
|
$
|
660,206
|
|
$
|
560,041
|
|
$
|
479,741
|
|
$
|
387,126
|
|
||||
|
Gross profit
2
|
$
|
578,443
|
|
$
|
498,106
|
|
$
|
416,388
|
|
$
|
361,283
|
|
$
|
303,417
|
|
||||
|
Income from operations
3
|
193,576
|
|
94,212
|
|
85,592
|
|
90,360
|
|
102,734
|
|
|||||||||
|
Other income (expense), net
|
(3,207
|
)
|
(1,073
|
)
|
(1,296
|
)
|
(419
|
)
|
(731
|
)
|
|||||||||
|
Net income before provision for income taxes
3
|
190,369
|
|
93,139
|
|
84,296
|
|
89,941
|
|
102,003
|
|
|||||||||
|
Provision for income taxes
|
44,537
|
|
28,844
|
|
25,605
|
|
23,225
|
|
27,750
|
|
|||||||||
|
Net income
3
|
$
|
145,832
|
|
$
|
64,295
|
|
$
|
58,691
|
|
$
|
66,716
|
|
$
|
74,253
|
|
||||
|
Net income per share
|
|||||||||||||||||||
|
Basic
|
$
|
1.81
|
|
$
|
0.80
|
|
$
|
0.73
|
|
$
|
0.86
|
|
$
|
0.98
|
|
||||
|
Diluted
|
$
|
1.77
|
|
$
|
0.78
|
|
$
|
0.71
|
|
$
|
0.83
|
|
$
|
0.95
|
|
||||
|
Shares used in computing net income per share:
|
|||||||||||||||||||
|
Basic
|
80,754
|
|
80,551
|
|
80,529
|
|
77,988
|
|
75,825
|
|
|||||||||
|
Diluted
|
82,283
|
|
82,589
|
|
83,040
|
|
80,294
|
|
78,080
|
|
|||||||||
|
|
December 31,
|
||||||||||||||||||
|
|
2014
|
2013
|
2012
|
2011
|
2010
|
||||||||||||||
|
|
|||||||||||||||||||
|
Working capital
4
|
$
|
455,349
|
|
$
|
369,338
|
|
$
|
330,022
|
|
$
|
236,699
|
|
$
|
295,637
|
|
||||
|
Total assets
|
987,997
|
|
832,147
|
|
756,312
|
|
649,264
|
|
476,943
|
|
|||||||||
|
Total long-term liabilities
|
33,415
|
|
22,839
|
|
19,224
|
|
10,366
|
|
6,222
|
|
|||||||||
|
Stockholders’ equity
|
$
|
752,771
|
|
$
|
633,970
|
|
$
|
581,317
|
|
$
|
490,781
|
|
$
|
377,747
|
|
||||
|
1
|
Net revenues for the year ended December 31, 2011 include eight months of revenues from our Scanners and Services segment of approximately $28.0 million as a result of our acquisition of Cadent Holdings, Inc. on April 29, 2011. Net revenues for the year ended December 31, 2010 include a $14.3 million release of previously deferred revenue for Invisalign Teen replacement aligners.
|
|
2
|
Gross profit includes:
|
|
•
|
$1.7 million out of period adjustment in 2013 (See Note 1 in the Financial Statements)
|
|
•
|
$0.2 million acquisition and integration related costs, $0.9 million amortization of intangible assets, and $0.5 million of exit costs in 2012
|
32
|
•
|
$0.4 million acquisition and integration related costs, $0.7 million amortization of intangible assets, and $0.8 million for exit costs in 2011
|
|
•
|
$14.3 million release of previously deferred revenue for Invisalign Teen replacement aligners and $0.8 million for amortization of prepaid royalties related to the litigation settlement with Ormco in 2010
|
|
3
|
Income from operations, net income before provision for income taxes, and net income includes the following, net of taxes:
|
|
•
|
$1.8 million out of period income tax adjustment in 2014 (see Note 1 in the Financial Statements)
|
|
•
|
$40.7 million and $26.3 million of goodwill and long-lived asset impairment, respectively, in 2013
|
|
•
|
$1.9 million, net of tax, out of period adjustment in 2013 (see Note 1 in the Financial Statements)
|
|
•
|
$36.6 million of goodwill impairment, $1.3 million acquisition and integration related costs, $4.5 million of amortization of intangible assets, and $0.8 million of exit costs in 2012
|
|
•
|
|
|
•
|
$10.0 million acquisition and integration related costs, $3.2 million of amortization of intangible assets, and exit costs of $1.1 million in 2011
|
|
•
|
$14.3 million release of previously deferred revenue for Invisalign Teen replacement aligners in 2010
|
|
•
|
$0.8 million of amortization of prepaid royalties related to the litigation settlement with Ormco in 2010
|
|
•
|
$4.5 million related to the class action litigation settlement with Leiszler in 2010
|
|
•
|
$8.7 million benefit related to an insurance settlement over a disputed coverage under our general liability umbrella that was not previously reimbursed by our insurer related to the OrthoClear litigation in 2010
|
|
4
|
Working capital is calculated as the difference between total current assets and total current liabilities.
|
33
ITEM 7.
MANAGEMENT’S DISCUSSION AND ANALYSIS OF FINANCIAL CONDITION AND RESULTS OF OPERATIONS
The following discussion and analysis of our financial condition and results of operations should be read together with “Selected Consolidated Financial Data” and our consolidated financial statements and related notes included elsewhere in this Annual Report on Form 10-K.
Overview
Align Technology, Inc. is a global medical device company that advanced the invisible orthodontics market with the introduction of the Invisalign System in 1999. Today, we are focused on designing, manufacturing and marketing innovative technology-rich products to help dental professionals achieve the clinical results they expect and deliver effective, convenient cutting-edge dental treatment options to their patients. Align Technology was founded in March 1997 and is headquartered in San Jose, California with offices worldwide. Our international headquarters are located in Amsterdam, the Netherlands. We have two operating segments: (1) Clear Aligner, known as the Invisalign System; and (2) Scanner and Services ("Scanner"), known as the iTero intra-oral scanners and OrthoCAD services (which we previously referred to as Scanner and CAD/CAM Services ("SCCS")).
We received FDA clearance in 1998 and began our first commercial sales of Invisalign to U.S. orthodontists in 1999 followed by U.S. General Practitioner Dentists ("GPs") in 2002. Over the next decade, we introduced Invisalign to the European market and Japan, added distribution partners in Asia Pacific, Latin America, and Europe Middle East and Africa ("EMEA"), and introduced a full range of treatment options including Invisalign Express 10, Invisalign Teen, Invisalign Assist, and Vivera Retainers. By 2011, we launched significant new aligner and software features across all Invisalign products that make it easier for doctors to use Invisalign on more complex cases, and introduced Invisalign to the People’s Republic of China. In 2013, we launched SmartTrack, the next generation of Invisalign clear aligner material, which became the new standard aligner material for Invisalign products in North America, Europe and other international markets where we have obtained regulatory approval. Over the last several years’ we have continued to build upon our technology and expertise to deliver enhanced clinical innovations aimed at helping our customers treat some of the most challenging cases. These innovations, both launched in early 2014, include Invisalign G5, specifically designed for treatment of deep bite malocclusion, as well as ClinCheck Pro, the next generation Invisalign treatment software tool designed to help Invisalign providers achieve their treatment goals. Most recently, in November 2014, we announced the upcoming release of Invisalign G6 clinical innovations for first premolar extraction.
We also sell iTero intra-oral scanners and provide computer-aided design and computer-aided manufacturing ("CAD/CAM") services. Intra-oral scanners provide a dental “chair-side” platform for accessing valuable digital diagnosis and treatment tools, with potential for enhancing accuracy of records, treatment efficiency, and the overall patient experience. We believe there are numerous benefits for customers and the opportunity to accelerate the adoption of Invisalign through interoperability with our intra-oral scanners. The use of digital technologies such as CAD/CAM for restorative dentistry or in-office restorations has been growing rapidly and intra-oral scanning is a critical part of enabling these new digital technologies and procedures in dental practices. In late 2012, we commercially launched the Invisalign Outcome Simulator, the first Invisalign chair-side application powered by the iTero scanner. The interactive application provides dentists and orthodontists an enhanced platform for patient education and is designed to increase treatment acceptance by helping patients visualize the benefits possible with Invisalign treatment. In January 2014, we announced that the 3M™ True Definition scanner was qualified for use with Invisalign case submissions. This qualification enables Invisalign providers with a True Definition scanner to submit a digital impression in place of a traditional PVS impression as part of the Invisalign case submission process. The 3M True Definition scanner is currently the only third-party scanner that has been qualified for use with Invisalign treatment. We continue to believe in an open systems approach to digital impressions, and are committed to working with other intra-oral scanning companies interested in developing interoperability for use with Invisalign treatment.
The Invisalign System is offered in more than 80 countries and has been used to treat more than 3.0 million patients. Our iTero intra-oral scanner, which is primarily sold in North America, provides dental professionals with an open choice to send digital impressions to any laboratory-based CAD/CAM system or to any of the more than 2,400 dental labs worldwide.
Our goal is to establish Invisalign clear aligners as the standard method for treating malocclusion and to establish the iTero intra-oral scanner as the preferred scanning device for 3D digital scans, ultimately driving increased product adoption by dental professionals. We intend to achieve this by continued focus and execution of our strategic growth drivers set forth in the
Business Strategy
section in our Annual Report on Form 10-K.
34
The successful execution of our business strategy and our results in 2014 and beyond may be affected by a number of other factors, which are updated below:
|
•
|
New Products, Feature Enhancements and Technology Innovation
. Product innovation drives greater treatment predictability and clinical applicability, and ease of use for our customers, which supports adoption of Invisalign in their practices. Increasing applicability and treating more complex cases requires that we move away from individual features to more comprehensive solutions so that Invisalign providers can more predictably treat the whole case, such as with Invisalign G5 for deep bite treatment. Launched in February 2014, Invisalign G5 was engineered to help doctors achieve even better clinical outcomes when treating patients with deep bites - a prevalent orthodontic problem. In North America, in February 2014, we also launched ClinCheck Pro, the next generation Invisalign treatment software tool, designed to provide more precise control over final tooth position and to help Invisalign providers achieve their treatment goals. We intend to launch ClinCheck Pro in our other country markets in the first quarter of 2015. Most recently, in November 2014, we announced the upcoming release of Invisalign G6 clinical innovations for first premolar extraction. Invisalign G6 is engineered to improve clinical outcomes for orthodontic treatment of severe crowding and bimaxillary protrusion. Invisalign G6 clinical innovations will be available to Invisalign-trained providers beginning in the first quarter of 2015 with limited commercialization, followed by full commercialization in Asia Pacific, Europe, Middle East and Africa ("EMEA"), and Latin America geographies throughout 2015 and North America in early 2016. We believe that over the long-term, clinical solutions and treatment tools will increase adoption of Invisalign; however, it is difficult to predict the rate of adoption which may vary by region and channel.
|
|
•
|
Invisalign Utilization rates.
Our goal is to establish Invisalign as the treatment of choice for treating malocclusion ultimately driving increased product adoption and frequency of use by dental professionals, also known as "utilization rates." Our quarterly utilization rates for the previous 9 quarters are as follows:
|
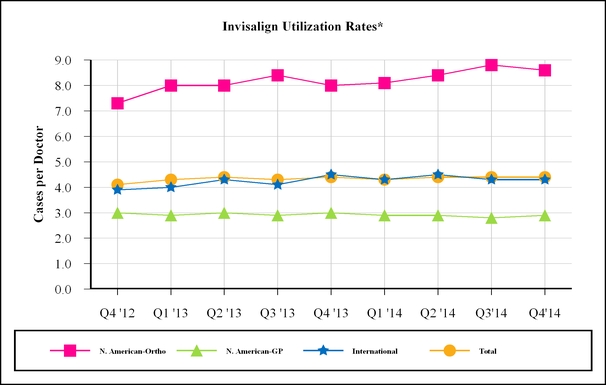
*
Invisalign Utilization rates = # of cases shipped divided by # of doctors cases were shipped to
Total utilization in the fourth quarter of 2014 was 4.4 cases per doctor which is flat when compared to the third quarter of 2014; however, in the fourth quarter of 2013, utilization rates increased for our International doctors which was offset by a decrease in utilization by our North American orthodontic doctors. The decrease by our North American orthodontic doctors reflects a seasonal decline in the number of teen-aged cases shipped as summer is typically the busiest season for orthodontists with practices that have a high percentage of adolescent and teenage patients as many parents want to get their teenagers started in treatment before the start of the school year. On a year-over-year basis, total utilization of 4.4 cases per doctor in the fourth quarter of 2014 remained flat compared to the
35
fourth quarter of 2013. We expect that over the long-term our utilization rates will gradually improve as a result of advancements in product and technology, which continue to strengthen our doctors’ clinical confidence in the use of Invisalign, along with the implementation of our Go-To-Market strategy (as discussed below). However, we expect that our utilization rates may fluctuate from period to period.
|
•
|
Number of new Invisalign doctors trained.
We continue to expand our Invisalign customer base through the training of new doctors. In 2014, Invisalign growth was driven primarily by increased utilization by our North American orthodontist doctors and International doctors as well as by the continued expansion of our customer base as we trained a total of 9,440 new Invisalign doctors, of which 56% were trained internationally. GPs are one of the keys to driving growth in the adult segment, and, in 2014, we launched Invisalign Fundamentals, a new training course, designed to improve practice integration and increase utilization for newly trained doctors. We have implemented this new Invisalign Fundamentals program across North America and will look for opportunities to adjust our international training programs as we work to help our GP practices worldwide more successfully adopt Invisalign into their practices. We believe that this new training approach has the potential to increase the number of doctors submitting cases 90-days post-training, as well as the number of cases submitted per doctor.
|
|
•
|
International Clear Aligner.
We will continue to focus our efforts towards increasing adoption of our products by dental professionals in our direct international markets. International volume increased 28.6% in 2014 from 2013 driven primarily by growth in Europe as well as by strong performance in the Asia Pacific region. In 2015, we are continuing to expand in our existing markets through targeted investments in sales coverage and professional marketing and education programs, along with consumer marketing in selected country markets. We expect international revenues to continue to grow at a faster rate than North America for the foreseeable future due to our continued investment in international market expansion, the size of the market opportunity, and our relatively low market penetration in this region.
|
|
•
|
Go-To-Market Evolution.
In order to provide more comprehensive sales and service coverage, we are currently implementing an updated go-to-market strategy with an expanded team and new structure in North America. In order to ensure our North America sales and marketing team can increase time in-office and help each practice become more successful, we are in the process of adding approximately 50 sales team members in 2015, the majority of which are in place as of the date of this Form 10-K. We believe that these investments in a refined go-to-market strategy and the strategic deployment of more people will improve adoption and utilization of Invisalign by our customers.
|
|
•
|
Operating Expenses.
We expect operating expenses to increase in 2015 compared to 2014 due in part to:
|
|
▪
|
the increase in North American sales force coverage discussed above, as well as additions to our sales force in EMEA and Asia Pacific regions
|
|
▪
|
infrastructure investments, including a project to implement a new enterprise resource planning system which we started in late 2014 with expected "go-live" for various modules and subsidiaries throughout 2016; and
|
|
▪
|
investments in new products and markets like our recently announced intention to develop new products for dentists who treat mild to moderate obstructive sleep apnea with oral appliance therapy.
|
We believe that these investments will position us to increase our revenue and continue to grow our market share.
|
•
|
Increase in Invisalign Selling Price.
We have historically invested in research and development and continuous product innovation. In order to continue and even accelerate this product innovation cycle, we recently announced a price increase of $50 per treatment, or approximately 3%, on Invisalign Full and Invisalign Teen products, effective April 1, 2015 in North America. The prices for Invisalign Assist, Invisalign Express 10 and Invisalign Express 5 products will remain unchanged.
|
|
•
|
Foreign exchange rates.
Although the U.S. dollar is our reporting currency, a portion of our net revenues and income are generated in foreign currencies. Net revenues and income generated by subsidiaries operating outside of the U.S. are translated into U.S. dollars using exchange rates effective during the respective period and as a result are affected by changes in exchange rates. We have generally accepted the exposure to exchange rate movements without using derivative financial instruments to manage this risk; therefore, both positive and negative movements in currency exchange rates against the U.S. dollar will continue to affect the reported amount of net revenues and income in our consolidated financial statements. In the third and fourth quarter of 2014 combined, our net revenues were negatively impacted by $3.1 million, and we incurred foreign currency translation net losses of $4.1 million in Interest and Other Income (Expense) net, primarily due to the weakening of the Euro and other foreign currencies relative to the
|
36
U.S. Dollar. If the U.S. Dollar continues to strengthen compared to other foreign currencies, including the Euro, our reported amount of net revenues and income will be negatively impacted compared to the same period last year.
|
•
|
Medical Device Excise Tax
. During March 2014, Align had extensive discussions with the IRS and they informed us that our aligners are not subject to the medical device excise tax ("MDET") which we had been paying and expensing in general and administrative expenses in the consolidated statements of operations since January 1, 2013; however, our scanners are still subject to the MDET. As a result of these discussions, beginning in March 2014, we ceased expensing and paying the MDET for aligners. In June 2014, we received a $1.2 million refund for MDET paid in 2014 related to our aligners which reduced general and administrative expenses for the three months ended June 30, 2014. For the year ended December 31, 2014, MDET expense was lower by approximately $6.8 million compared to the prior year. Additionally, we are in process of claiming a $6.8 million refund of MDET paid in 2013 related to our aligners; however, because this claim is subject to review and approval by the IRS, we have not recorded a receivable as the outcome of the audit is uncertain. Any future changes in the applicability of the MDET as it applies to us or refunds of amounts previously paid will be recorded as an additional expense or a credit to the consolidated statement of operations in the period in which it becomes probable and reasonably estimable.
|
|
•
|
Stock Repurchase Authorization.
On April 23, 2014, we announced that our Board of Directors had authorized a stock repurchase program pursuant to which we may purchase up to $300.0 million of our common stock over the next three years, with $100.0 million of that amount authorized to be purchased over the first twelve months. Any purchases under this stock repurchase program may be made, from time-to-time, pursuant to open market purchases (including pursuant to Rule 10b5-1 plans), privately-negotiated transactions, accelerated stock repurchases, block trades or derivative contracts or otherwise in accordance with applicable federal securities laws, including Rule 10b-18 of the Securities Exchange Act of 1934. The program does not obligate Align to acquire any particular amount of common stock and depending on market conditions or other factors these purchases may be commenced or suspended at any time, or from time-to-time without prior notice. The
authorization or continuance of any repurchases under stock repurchase programs is contingent on a variety of factors, including our financial condition, results of operations, business requirements, and our Board of Directors' continuing determination that such stock repurchases are in the best interests of our stockholders and in compliance with all laws and applicable agreements. Additionally, there can be no assurance that our stock repurchase program will have a beneficial impact on our stock price.
As of December 31, 2014, there is approximately $201.8 million remaining under the April 2014 stock repurchase program, of which $1.8 million was repurchased in January 2015. In addition, in January 2015, our Board of Directors has authorized the next $100.0 million under the program to be repurchased which we anticipate completing within twelve months. We expect to finance future stock repurchases with current cash on hand.
|
Results of Operations
Net revenues by Reportable Segment Comparison for Year Ended
December 31, 2014
,
2013
and
2012
:
We group our operations into two reportable segments: Clear Aligner segment and Scanner and Services segment.
|
•
|
Our Clear Aligner segment consists of our Invisalign system which includes Invisalign Full, Teen and Assist ("Full Products"), Express/Lite ("Express Products"),Vivera retainers, along with our training and ancillary products for treating malocclusion.
|
|
•
|
Our Scanner and Services segment consists of intra-oral scanning systems and additional services available with the intra-oral scanners that provide digital alternatives to the traditional cast models. This segment includes our iTero scanner and OrthoCAD services.
|
Net revenues for our Clear Aligner segment by region and product and our Scanner segment by region for the year ended
December 31, 2014
,
2013
and
2012
is as follows (in millions):
37
|
|
Year Ended
|
Year Ended
|
|||||||||||||||||||||||||||
|
December 31,
2014
|
December 31,
2013
|
Change
|
December 31,
2013
|
December 31,
2012
|
Change
|
||||||||||||||||||||||||
|
Clear Aligner
|
|||||||||||||||||||||||||||||
|
Region and Channel
|
|||||||||||||||||||||||||||||
|
North America
|
$
|
446.6
|
|
$
|
408.2
|
|
$
|
38.4
|
|
9.4
|
%
|
$
|
408.2
|
|
$
|
361.1
|
|
$
|
47.1
|
|
13.0
|
%
|
|||||||
|
International
|
219.7
|
|
161.7
|
|
$
|
58.0
|
|
35.9
|
%
|
161.7
|
|
124.8
|
|
36.9
|
|
29.6
|
%
|
||||||||||||
|
Invisalign non-case net revenues
|
46.2
|
|
44.7
|
|
$
|
1.5
|
|
3.4
|
%
|
44.7
|
|
30.7
|
|
14.0
|
|
45.6
|
%
|
||||||||||||
|
Total Clear Aligner net revenues
1
|
$
|
712.5
|
|
$
|
614.6
|
|
$
|
97.9
|
|
15.9
|
%
|
$
|
614.6
|
|
$
|
516.6
|
|
$
|
98.0
|
|
19.0
|
%
|
|||||||
|
Product
|
|||||||||||||||||||||||||||||
|
Invisalign Full Products
|
$
|
585.7
|
|
$
|
497.5
|
|
$
|
88.2
|
|
17.7
|
%
|
$
|
497.5
|
|
$
|
434.4
|
|
$
|
63.1
|
|
14.5
|
%
|
|||||||
|
Invisalign Express Products
|
80.6
|
|
72.4
|
|
8.2
|
|
11.3
|
%
|
72.4
|
|
51.5
|
|
20.9
|
|
40.6
|
%
|
|||||||||||||
|
Invisalign non-case net revenues
|
46.2
|
|
44.7
|
|
1.5
|
|
3.4
|
%
|
44.7
|
|
30.7
|
|
14.0
|
|
45.6
|
%
|
|||||||||||||
|
Total Clear Aligner net revenues
|
$
|
712.5
|
|
$
|
614.6
|
|
$
|
97.9
|
|
15.9
|
%
|
$
|
614.6
|
|
$
|
516.6
|
|
$
|
98.0
|
|
19.0
|
%
|
|||||||
|
Scanner:
|
|||||||||||||||||||||||||||||
|
Region
|
|||||||||||||||||||||||||||||
|
North America
|
$
|
48.7
|
|
$
|
45.3
|
|
$
|
3.4
|
|
7.5
|
%
|
$
|
45.3
|
|
$
|
42.2
|
|
$
|
3.1
|
|
7.3
|
%
|
|||||||
|
International
|
0.4
|
|
0.3
|
|
0.1
|
|
33.3
|
%
|
0.3
|
|
1.2
|
|
(0.9
|
)
|
(75.0
|
)%
|
|||||||||||||
|
Total Scanner net revenues
|
$
|
49.1
|
|
$
|
45.6
|
|
$
|
3.5
|
|
7.7
|
%
|
$
|
45.6
|
|
$
|
43.4
|
|
$
|
2.2
|
|
5.1
|
%
|
|||||||
|
Total net revenues
|
$
|
761.6
|
|
$
|
660.2
|
|
$
|
101.4
|
|
15.4
|
%
|
$
|
660.2
|
|
$
|
560.0
|
|
$
|
100.2
|
|
17.9
|
%
|
|||||||
Changes and percentages are based on actual values. Certain tables may not sum or recalculate due to rounding.
|
1
|
In the fourth quarter of 2012, we identified an error that the actual case refinement usage rate was lower than our estimate and, as a result, we recorded a net revenue release of $4.9 million previously deferred for case refinement of which $5.2 million was a correction of an error of which $4.5 million related to the first three quarters for the fiscal year 2012 and $0.7 million related to the fiscal year 2011. The adjustment was not material to any quarter within 2012. The net amount of $4.9 million is not material to the results of operations for twelve months ended December 31, 2012.
|
Clear Aligner Case Volume by Channel and Product
Case volume data which represents Invisalign case shipments by region and product, for the year ended
December 31, 2014
,
2013
and
2012
as follows (in millions):
|
|
Year Ended
|
Year Ended
|
|||||||||||||||||||||
|
Region and Channel
|
December 31,
2014
|
December 31,
2013
|
Change
|
December 31,
2013
|
December 31,
2012
|
Change
|
|||||||||||||||||
|
North American Invisalign
|
338.5
|
|
313.9
|
|
24.6
|
|
7.8
|
%
|
313.9
|
|
276.7
|
|
37.2
|
|
13.4
|
%
|
|||||||
|
International Invisalign
|
139.5
|
|
108.5
|
|
31.0
|
|
28.6
|
%
|
108.5
|
|
86.8
|
|
21.7
|
|
25.0
|
%
|
|||||||
|
Total Invisalign case volume
|
478.0
|
|
422.4
|
|
55.6
|
|
13.2
|
%
|
422.4
|
|
363.5
|
|
58.9
|
|
16.2
|
%
|
|||||||
|
Product
|
|||||||||||||||||||||||
|
Invisalign Full Product Group
|
395.1
|
|
343.4
|
|
51.7
|
|
15.1
|
%
|
343.4
|
|
304.8
|
|
38.6
|
|
12.7
|
%
|
|||||||
|
Invisalign Express Product Group
|
82.9
|
|
79.0
|
|
3.9
|
|
4.9
|
%
|
79.0
|
|
58.7
|
|
20.3
|
|
34.6
|
%
|
|||||||
|
Total Invisalign case volume
|
478.0
|
|
422.4
|
|
55.6
|
|
13.2
|
%
|
422.4
|
|
363.5
|
|
58.9
|
|
16.2
|
%
|
|||||||
Changes and percentages are based on actual values. Certain tables may not sum or recalculate due to rounding.
38
Fiscal Year
2014
compared to Fiscal Year
2013
Total net revenues increased by
$101.4 million
in
2014
as compared to
2013
primarily as a result of Invisalign case volume growth across all regions and products as well as increased Invisalign non-case revenue.
Clear Aligner
Clear Aligner North America net revenues increased by
$38.4 million
, or
9.4%
, in 2014 compared to 2013 primarily due to Invisalign case volume growth of approximately $32.1 million across all channels and products, and, to a lesser extent, higher average selling prices ("ASP") which contributed approximately $6.3 million to the increase in net revenues. The increase in ASP was primarily a result of increased mid-course correction revenue from higher usage as well as a product mix shift towards higher priced Invisalign products in 2014 compared to 2013. This increase was offset in part by higher promotional discounts in 2014 as compared to 2013.
Clear Aligner international net revenues increased by
$58.0 million
, or
35.9%
, in 2014 compared to 2013 primarily driven by Invisalign case volume growth of $46.2 million along with higher ASP which contributed approximately $11.8 million to the increase in net revenues. The increase in ASP was primarily due to the impact from acquiring our distributor in the Asia Pacific region on April 30, 2013 when we began recognizing direct sales of Invisalign products sold in that region at our full ASP rather than the discounted ASP under the distributor agreement, as well as the price increases which were effective July 2013 along with a favorable impact from foreign exchange rates. Foreign exchange rates had a favorable impact to revenues in 2014 as compared to 2013, despite the weakening of the Euro to the U.S. dollar in the last six months of 2014.
Invisalign non-case net revenues, consisting of training fees and ancillary product revenues, increased by
$1.5 million
in 2014 as compared to 2013 primarily due to the consolidation of our Vivera product shipments in North America from four shipments per year to one shipment along with increased Vivera volume both in North America and international.
Scanner and Services
Scanner and Services net revenues increased by
$3.5 million
, or
7.7%
, in 2014 compared to 2013 due to an increase in both services revenue as well as scanner revenue.
The increase in services revenue was primarily due to an increase in the volume of CAD/CAM services resulting from a larger installed base of scanners. The increase in scanner revenue was primarily due to an increase in the number of scanners recognized offset in part by lower scanner ASP as a result of promotional discounts as well as permanent price reductions. The increase was partially offset as 2013 had higher net revenues due to the release of $1.4 million of revenue previously reserved for the iTero upgrade program which was completed in the first quarter of 2013.
Fiscal Year
2013
compared to Fiscal Year
2012
Total net revenues increased by $100.2 million in
2013
as compared to
2012
primarily as a result of Invisalign case volume growth across all regions and products as well as increased Invisalign non-case revenue.
Clear Aligner
Clear Aligner North America net revenues increased by $47.1 million, or 13.0%, in 2013 compared to 2012 primarily due to Invisalign case volume growth of approximately $48.5 million across all channels and products, offset in part, by lower average selling prices ("ASP") which decreased net revenues by approximately $1.4 million. The decrease in ASP was a result of product mix shift towards lower priced Invisalign Express products combined with the revenue deferral for free mid-course correction as a result of our policy change in June 2013. Beginning June 15, 2013, we included up to three free mid-course correction orders in our list prices for Invisalign Full and Invisalign Teen.
Clear Aligner international net revenues increased by $36.9 million, or 29.6%, in 2013 compared to 2012 primarily driven by Invisalign case volume growth of $31.1 million along with higher ASP, which resulted in approximately $5.8 million increase in net revenues. The increase in ASP was primarily due to the impact from acquiring our distributor in the APAC region on April 30, 2013, as well as a favorable impact of foreign exchange rates. By bringing the APAC region direct, we began to recognize
39
direct sales of Invisalign products sold in that region at our full ASP rather than the discounted ASP under the distributor agreement. The increase in ASP was offset in part due to a product mix shift towards lower priced Invisalign Lite products.
Invisalign non-case net revenues, consisting of training fees and ancillary product revenues, increased by $14.0 million, or 45.6%, in 2013 as compared to 2012 primarily due to the consolidation of our Vivera product shipments in North America from four shipments per year to one shipment along with increased Vivera volume both in North America and international.
Scanner and Services
Scanner and Services net revenues increased by $2.2 million, or 5.1%, in 2013 compared to 2012 primarily due to an increase in scanner revenues, partially offset by a decrease in CAD/CAM services net revenues as a result of the discontinuation of the OrthoCAD iQ services during the fourth quarter of 2012. The increase in scanner revenues in 2013 was as a result of the increase in number of scanners sales recognized in 2013 as compared to 2012 as well as the release of $1.4 million of revenue previously reserved for the new iTero upgrade program which was completed in the first quarter of 2013.
Cost of net revenues and gross profit (in millions):
|
|
Year Ended
|
Year Ended
|
|||||||||||||||||||||
|
|
December 31,
2014
|
December 31,
2013
|
Change
|
December 31,
2013
|
December 31,
2012
|
Change
|
|||||||||||||||||
|
Clear Aligner
|
|||||||||||||||||||||||
|
Cost of net revenues
|
$
|
149.7
|
|
$
|
129.8
|
|
$
|
19.9
|
|
$
|
129.8
|
|
$
|
110.6
|
|
$
|
19.2
|
|
|||||
|
% of net segment revenues
|
21.0
|
%
|
21.1
|
%
|
21.1
|
%
|
21.4
|
%
|
|
|
|||||||||||||
|
Gross profit
|
$
|
562.9
|
|
$
|
484.8
|
|
$
|
78.1
|
|
$
|
484.8
|
|
$
|
406.0
|
|
$
|
78.8
|
|
|||||
|
Gross margin %
|
79.0
|
%
|
78.9
|
%
|
78.9
|
%
|
78.6
|
%
|
|||||||||||||||
|
Scanner
|
|||||||||||||||||||||||
|
Cost of net revenues
|
$
|
33.6
|
|
$
|
32.3
|
|
$
|
1.3
|
|
$
|
32.3
|
|
$
|
33.0
|
|
$
|
(0.7
|
)
|
|||||
|
% of net segment revenues
|
68.3
|
%
|
70.9
|
%
|
70.9
|
%
|
75.9
|
%
|
|
|
|||||||||||||
|
Gross profit
|
$
|
15.6
|
|
$
|
13.3
|
|
$
|
2.3
|
|
$
|
13.3
|
|
$
|
10.4
|
|
$
|
2.9
|
|
|||||
|
Gross margin %
|
31.7
|
%
|
29.1
|
%
|
29.1
|
%
|
24.1
|
%
|
|||||||||||||||
|
Total cost of net revenues
|
$
|
183.2
|
|
$
|
162.1
|
|
$
|
21.1
|
|
$
|
162.1
|
|
$
|
143.6
|
|
$
|
18.5
|
|
|||||
|
% of net revenues
|
24.1
|
%
|
24.6
|
%
|
24.6
|
%
|
25.7
|
%
|
|||||||||||||||
|
Gross profit
|
$
|
578.4
|
|
$
|
498.1
|
|
$
|
80.3
|
|
$
|
498.1
|
|
$
|
416.4
|
|
$
|
81.7
|
|
|||||
|
Gross margin %
|
75.9
|
%
|
75.4
|
%
|
75.4
|
%
|
74.3
|
%
|
|||||||||||||||
Changes and percentages are based on actual values. Certain tables may not sum or recalculate due to rounding.
Cost of net revenues for our Clear Aligner and Scanner segments includes salaries for staff involved in the production process, the cost of materials, packaging, shipping costs, depreciation on capital equipment used in the production process, amortization of acquired intangible assets from Cadent, training costs and stock-based compensation.
Fiscal Year
2014
compared to Fiscal Year
2013
Clear Aligner
The gross margin percentage improved slightly in 2014 compared to 2013 due to higher ASP. The ASP improvement was mostly offset by increased manufacturing costs in 2014 when compared to 2013 which benefited from an out of period adjustment (see Note 1 in the Financial Statements).
Scanner
The gross margin percentage increased in 2014 compared to 2013 due to increased absorption of manufacturing spend from higher production volumes, lower product costs due to product mix and lower inventory reserves. These were partially offset by a lower ASP as a result of price reductions.
40
Fiscal Year
2013
compared to Fiscal Year
2012
Clear Aligner
The gross margin percentage improved slightly in 2013 compared to 2012 primarily due to lower warranty costs as a result of reduced warranty claims corresponding with the change in our mid-course correction policy in June 2013. In addition, gross margins benefited to a lessor extent from an out of period adjustment (see Note 1 in the Financial Statements) which was partially offset by increased material costs, primarily related to our new SmartTrack material. In addition, we incurred higher inventory reserves for our prior aligner material which has been substantially replaced by our new SmartTrack aligner material.
Scanner
The gross margin percentage increased in 2013 compared to 2012 primarily as a result of the release of revenue for amounts previously reserved in 2012 for the new 2.9 iTero scanner upgrade program which was completed in the first quarter of 2013. In addition, we had lower manufacturing costs as a result of the closure of our New Jersey facility, which was completed by October 2012, and a reduction in training costs; however, these savings were partially offset by higher third party labor service costs and lower manufacturing cost absorption.
Sales and marketing (in millions):
|
|
Year Ended
|
Year Ended
|
|||||||||||||||||||||
|
|
December 31,
2014
|
December 31,
2013
|
Change
|
December 31,
2013
|
December 31,
2012
|
Change
|
|||||||||||||||||
|
Sales and marketing
|
$
|
217.3
|
|
$
|
180.0
|
|
$
|
37.3
|
|
$
|
180.0
|
|
$
|
152.0
|
|
$
|
28.0
|
|
|||||
|
% of net revenues
|
28.5
|
%
|
27.3
|
%
|
27.3
|
%
|
27.1
|
%
|
|||||||||||||||
Changes and percentages are based on actual values. Certain tables may not sum or recalculate due to rounding.
Sales and marketing expense includes sales force and marketing compensation (including travel-related costs), media and advertising, clinical education, trade shows and industry events, product marketing, stock-based compensation and allocations of corporate overhead expenses including facilities and IT.
Sales and marketing expense increased in 2014 compared to 2013 primarily
due to higher compensation costs of $19.4 million due to increased headcount, including the additional headcount from the acquisition of our APAC distributor. In addition, we incurred higher advertising and marketing expenses as a result of increased advertising production and marketing campaigns combined with higher costs for trade shows and our Europe and APAC Summits.
Sales and marketing expense increased in 2013 compared to 2012 due primarily to higher compensation costs of $16.4 million largely related to increased headcount, including additional employees as a result of the acquisition of our APAC distributor, higher sales commissions and stock-based compensation. In addition, we incurred higher advertising and media costs primarily related to network and television media campaigns.
General and administrative (in millions):
|
|
Year Ended
|
Year Ended
|
|||||||||||||||||||||
|
|
December 31,
2014
|
December 31,
2013
|
Change
|
December 31,
2013
|
December 31,
2012
|
Change
|
|||||||||||||||||
|
General and administrative
|
$
|
114.8
|
|
$
|
112.8
|
|
$
|
2.0
|
|
$
|
112.8
|
|
$
|
99.3
|
|
$
|
13.5
|
|
|||||
|
% of net revenues
|
15.1
|
%
|
17.1
|
%
|
17.1
|
%
|
17.7
|
%
|
|||||||||||||||
Changes and percentages are based on actual values. Certain tables may not sum or recalculate due to rounding.
General and administrative expense primarily includes administrative personnel compensation costs including stock-based compensation, outside consulting services, legal expenses, depreciation and amortization expense, the medical device excise tax ("MDET") effective January 2013 and allocations of corporate overhead expenses including facilities and IT.
General and administrative expense for 2014 increased compared to 2013 primarily due to higher stock-based compensation of $4.7 million as well as increases in consulting expenses and credit card processing fees; however, these increases were offset
41
by lower MDET of $6.8 million as our aligners are no longer subject to the excise tax in 2014 as well as lower outside litigation costs. As previously noted, in March 2014, the IRS informed us that our aligners are not subject to the MDET, which we had been paying and expensing in general and administrative expenses in the consolidated statements of operations since January 1, 2013; however, our scanners are still subject to the MDET but are not material. There is no expense in the current year period for MDET related to our aligners. Additionally, we are in process of claiming a $6.8 million refund of MDET paid in 2013 related to our aligners; however, because this claim is subject to review and approval by the IRS, we have not recorded a receivable as the outcome of the audit is uncertain. Any future changes in the applicability of the MDET as it applies to us or refunds of amounts previously paid will be recorded as an additional expense or a credit to the consolidated statement of operations in the period in which is becomes probable and reasonably estimable.
General and administrative expense for 2013 increased compared to 2012 primarily due to higher compensation related costs of $7.6 million as a result of higher stock-based compensation expense and increased salaries. Additionally we incurred $7.1 million of medical device excise tax as a result of new tax regulations effective January 1, 2013. These costs were partially offset by lower outside legal expenses.
Research and development (in millions):
|
|
Year Ended
|
Year Ended
|
|||||||||||||||||||||
|
|
December 31,
2014
|
December 31,
2013
|
Change
|
December 31,
2013
|
December 31,
2012
|
Change
|
|||||||||||||||||
|
Research and development
|
$
|
52.8
|
|
$
|
44.1
|
|
$
|
8.7
|
|
$
|
44.1
|
|
$
|
42.9
|
|
$
|
1.2
|
|
|||||
|
% of net revenues
|
6.9
|
%
|
6.7
|
%
|
6.7
|
%
|
7.7
|
%
|
|||||||||||||||
Changes and percentages are based on actual values. Certain tables may not sum or recalculate due to rounding.
Research and development expense includes the personnel-related costs and outside consulting expenses associated with the research and development of new products and enhancements to existing products, corporate allocations, facility and facility related costs and stock-based compensation expense.
Research and development expense increased during 2014 compared to 2013 almost entirely due to higher compensation costs as a result of higher bonuses, stock-based compensation and salaries primarily due to additional headcount.
Research and development expense increased slightly during 2013 compared to 2012 due to higher facilities related expenses primarily related to our Russia research and development facility and compensation costs offset in part by lower clinical and product innovation research program costs.
Impairment of goodwill (in millions):
|
|
Year Ended
|
Year Ended
|
|||||||||||||||||||||
|
|
December 31,
2014
|
December 31,
2013
|
Change
|
December 31,
2013
|
December 31,
2012
|
Change
|
|||||||||||||||||
|
Impairment of goodwill
|
$
|
—
|
|
$
|
40.7
|
|
$
|
(40.7
|
)
|
$
|
40.7
|
|
$
|
36.6
|
|
$
|
4.1
|
|
|||||
|
% of net revenues
|
—
|
%
|
6.2
|
%
|
6.2
|
%
|
6.5
|
%
|
|||||||||||||||
Changes and percentages are based on actual values. Certain tables may not sum or recalculate due to rounding.
There was no impairment of goodwill charge recorded in the year ended December 31, 2014.
During the first quarter of 2013, we determined that the goodwill for our Scanner and Services reporting unit should be tested for impairment between annual tests due to changes in the competitive environment for intra-oral scanners which included announcements of new low-priced scanners targeted at orthodontist and GP dentist in North America. As a result, this caused us to lower our expectations for growth and profitability for our Scanner and Services reporting unit that would more likely than not reduce the fair value of our Scanner and Services reporting unit below its carrying amount. As a result of our analysis, we recorded a goodwill impairment charge of $40.7 million in the first quarter of 2013, none of which was deductible for tax purposes. Refer to Note 5 for details of the impairment analysis.
During the third quarter of 2012, we determined that the goodwill for our Scanner and Services reporting unit should be tested for impairment between annual tests since an event occurred or circumstances changed that would more likely than not reduce the fair value of our Scanner and Services reporting unit below its carrying amount. As a result of our analysis, we recorded a preliminary goodwill impairment charge during the third quarter of 2012 of
$24.7 million
and an additional
$11.9 million
during
42
the fourth quarter of 2012, representing a change in estimate upon finalizing our 2013 annual budget process, for a total impairment charge of
$36.6 million
. None of the goodwill impairment charge was deductible for tax purposes, and there was no additional impairment that resulted from our annual goodwill impairment test during the fourth quarter of 2012. Refer to Note 5 for details of the impairment analysis.
Impairment of long-lived assets (in millions):
|
|
Year Ended
|
Year Ended
|
||||||||||||||||||||
|
|
December 31,
2014
|
December 31,
2013
|
Change
|
December 31,
2013
|
December 31,
2012
|
Change
|
||||||||||||||||
|
Impairment of long-lived assets
|
$
|
—
|
|
$
|
26.3
|
|
$
|
(26.3
|
)
|
$
|
26.3
|
|
—
|
|
$
|
26.3
|
|
|||||
|
% of net revenues
|
—
|
%
|
4.0
|
%
|
4.0
|
%
|
—
|
%
|
||||||||||||||
Changes and percentages are based on actual values. Certain tables may not sum or recalculate due to rounding.
There was no impairment of long-lived assets charge recorded in the year ended December 31, 2014.
The impairment of our long-lived assets in 2013 was the result of changes in the competitive environment for intra-oral scanners which included announcements of new low-priced scanners targeted at orthodontist and GP dentist in North America that caused us to lower our expectations for growth and profitability for our Scanner and Services reporting unit. As a result, we determined that the carrying value of the long-lived assets was not recoverable and therefore recorded an impairment charge of $26.3 million. Refer to Note 5 for details of the impairment analysis.
Interest and Other income (expense), net (in millions):
|
|
Year Ended
|
Year Ended
|
|||||||||||||||||||||
|
|
December 31,
2014
|
December 31,
2013
|
Change
|
December 31,
2013
|
December 31,
2012
|
Change
|
|||||||||||||||||
|
Interest and other income (expense), net
|
$
|
(3.2
|
)
|
$
|
(1.1
|
)
|
$
|
(2.1
|
)
|
$
|
(1.1
|
)
|
$
|
(1.3
|
)
|
$
|
0.2
|
|
|||||
Interest and other income (expense), net, includes foreign currency translation gains and losses, interest income earned on cash, cash equivalents and investment balances and other miscellaneous charges.
Interest and Other income (expense), net, in 2014 decreased due to higher foreign exchange losses primarily as a result of the weakening of the Euro to the U.S. dollar offset slightly by increased interest income earned on higher balances of cash, cash equivalents and investments.
Interest and Other income (expense), net, in 2013 increased slightly due to increased interest income earned on higher balances of cash, cash equivalents and investments offset slightly by higher foreign exchange losses.
Provision for income taxes (in millions):
|
|
Year Ended
|
Year Ended
|
|||||||||||||||||||||
|
|
December 31,
2014
|
December 31,
2013
|
Change
|
December 31,
2013
|
December 31,
2012
|
Change
|
|||||||||||||||||
|
Provision for income taxes
|
$
|
44.5
|
|
$
|
28.8
|
|
$
|
15.7
|
|
$
|
28.8
|
|
$
|
25.6
|
|
$
|
3.2
|
|
|||||
|
Effective tax rates
|
23.4
|
%
|
31.0
|
%
|
31.0
|
%
|
30.4
|
%
|
|||||||||||||||
Changes and percentages are based on actual values. Certain tables may not sum or recalculate due to rounding.
Our provision for income taxes was $44.5 million, $28.8 million and $25.6 million for the year ended December 31, 2014, 2013 and 2012, respectively. This represents effective tax rates of 23.4%, 31.0% and 30.4%, respectively. Our effective tax rates in these fiscal years differ from the statutory federal income tax rate of 35% due to certain foreign earnings, primarily from Costa Rica, which are subject to a lower tax rate, partially offset by higher state income tax expense, the tax impact of certain stock-based compensation charges and unrecognized tax benefits. Our provision for income taxes for the year ended December 31, 2014 also reflects a negative impact from a $1.8 million adjustment related to prior years, which was recorded during the three months ended June 30, 2014. The effective tax rate for the year ended December 31, 2013 and 2012 also reflects a non-deductible goodwill impairment charge of $40.7 million and $36.6 million, respectively.
As of December 31, 2014, approximately $260.9 million of undistributed earnings from non-U.S. operations held by our foreign subsidiaries are designated as indefinitely reinvested outside the U.S. Accordingly, no additional U.S. income taxes or
43
additional foreign withholding taxes have been provided thereon. We have sufficient cash reserves in the U.S. and do not intend to repatriate our foreign earnings. We intend to use the undistributed earnings for local operating expansions and to meet local operating working capital needs. If these earnings were distributed in the form of dividends or otherwise, or if the shares of the relevant foreign subsidiaries were sold or otherwise transferred, we would be subject to additional U.S. income taxes subject to an adjustment for foreign tax credits and foreign withholding taxes. Determination of the amount of unrecognized deferred tax liability related to these earnings is not practicable.
We assess the likelihood that we will be able to realize our deferred tax assets quarterly. Should there be a change in our ability to realize our deferred tax assets, our tax provision would increase in the period in which we determine that it is more likely than not that we cannot realize our deferred tax assets. We consider all available evidence, both positive and negative, including historical levels of income, expectations and risks associated with estimates of future taxable income and ongoing prudent and feasible tax planning strategies in assessing the need for a valuation allowance. If it is more likely than not that we do not expect to realize our deferred tax assets, we will increase our provision for taxes by recording a valuation allowance against the deferred tax assets that we estimate will not ultimately be realizable. The available positive evidence at December 31, 2014 included historical operating profits, a projection of future income and other objectively verifiable evidence. As of December 31, 2014, we believed, except for the items noted in the subsequent paragraph, that is was more likely than not that the amount of deferred tax assets recorded on the balance sheet will be realized.
As of December 31, 2014, we had a valuation allowance of $32.5 million against our deferred tax assets which primarily relates to foreign net operating loss and capital loss carryforwards. The valuation allowance decreased from December 31, 2013 by $2.6 million due to $1.8 million related to foreign net operating loss carryforwards and $0.8 million related to the release of the valuation allowance related to Japan and China deferred tax assets.
At December 31, 2014, we have California net operating loss carryforwards of approximately $37.3 million, which, if not used, will begin to expire in 2015. These net operating loss carryforwards are subject to an annual limitation under Internal Revenue Code §382, but are expected to be fully realized. At December 31, 2014, we had California research credit carryforwards of approximately $3.8 million that can be carried forward indefinitely.
We account for uncertain tax positions pursuant to authoritative guidance based on a two-step approach to recognize and measure uncertain tax positions taken or expected to be taken in a tax return. We first determine whether it is more likely than not that a tax position will be sustained upon audit based on its technical merits. If a tax position meets the more-likely-than-not recognition threshold it is then measured to determine the amount of benefit to recognize in the financial statements. The tax position is measured as the largest amount of benefit that is more than 50 percent likely to be realized upon ultimate settlement. We adjust our uncertain tax positions due to changing facts and circumstances, such as the closing of a tax audit, or refinement of estimates due to new information. To the extent the final outcome of these matters is different than the amounts recorded, such differences will impact our tax provision in our Consolidated Statements of Operations in the period in which such determination is made.
During fiscal year 2014, the amount of gross unrecognized tax benefits increased by $6.4 million. The total amount of unrecognized tax benefits was $33.1 million as of December 31, 2014, all of which would impact our effective tax rate if recognized. We have elected to recognize interest and penalties related to unrecognized tax benefits as a component of income tax expense. The penalties and interest accrued as of December 31, 2014 and 2013 are immaterial. We do not expect any significant changes to the amount of unrecognized tax benefits within the next twelve months.
During the first quarter of 2014, we adopted ASU 2013-11, "Presentation of an Unrecognized Tax Benefit when a Net Operating Loss Carryforward, a Similar Tax Loss, or a Tax Credit Carryforward Exists (a consensus of the FASB Emerging Issues Task Force)." The adoption of this standard had the effect of reducing our accruals for uncertain tax positions by $8.4 million, with an offsetting reduction in our long term deferred tax assets, but had no effect on net income.
We file U.S. federal, U.S. state, and non-U.S. tax returns. Our major tax jurisdictions are U.S. federal and the State of California. For U.S. federal and state tax returns, we are no longer subject to tax examinations for years before 2000. With few exceptions, we are no longer subject to examination by foreign tax authorities for years before 2007.
44
Liquidity and Capital Resources
We fund our operations from product sales and the proceeds from the sale of our common stock. As of
December 31, 2014
and
2013
, we had the following cash and cash equivalents, and short-term and long-term investments (in thousands):
|
|
Year Ended December 31,
|
||||||
|
|
2014
|
2013
|
|||||
|
Cash and cash equivalents
|
$
|
199,871
|
|
$
|
242,953
|
|
|
|
Short-term investments
|
254,787
|
|
127,040
|
|
|||
|
Long-term investments
|
147,892
|
|
101,978
|
|
|||
|
Total
|
$
|
602,550
|
|
$
|
471,971
|
|
|
Cash flows
(in thousands):
|
|
Year Ended December 31,
|
||||||||||
|
|
2014
|
2013
|
2012
|
||||||||
|
Net cash flow provided by (used in):
|
|||||||||||
|
Operating activities
|
$
|
226,899
|
|
$
|
185,976
|
|
$
|
133,778
|
|
||
|
Investing activities
|
(201,627
|
)
|
(210,734
|
)
|
(78,300
|
)
|
|||||
|
Financing activities
|
(66,420
|
)
|
(38,171
|
)
|
10,205
|
|
|||||
|
Effects of exchange rate changes on cash and cash equivalents
|
(1,934
|
)
|
(504
|
)
|
28
|
|
|||||
|
Net increase (decrease) in cash and cash equivalents
|
$
|
(43,082
|
)
|
$
|
(63,433
|
)
|
$
|
65,711
|
|
||
As of
December 31, 2014
, we had
$602.6 million
in cash, cash equivalents, and short-term and long-term marketable securities. Cash equivalents and marketable securities are comprised of money market funds and highly liquid debt instruments which primarily include commercial paper, corporate bonds, U.S. dollar denominated foreign corporate bonds, U.S. government agency bonds, municipal bonds and asset-backed securities.
As of
December 31, 2014
, approximately $338.2
million of cash, cash equivalents and short-term and long-term marketable securities was held by our foreign subsidiaries. Amounts held by foreign subsidiaries are generally subject to U.S. income taxation on repatriation to the U.S. The costs to repatriate our foreign earnings to the U.S. would likely be material; however, our intent is to permanently reinvest our earnings from foreign operations, and our current plans do not require us to repatriate them to fund our U.S. operations as we generate sufficient domestic operating cash flow and have access to external funding under our current revolving line of credit.
On April 23, 2014, we announced that our Board of Directors had authorized a stock repurchase program pursuant to which we may purchase up to $300.0 million of our common stock over the next three years, with $100.0 million of that amount authorized to be purchased over the next twelve months. Any purchases under this stock repurchase program may be made, from time-to-time, pursuant to open market purchases (including pursuant to Rule 10b5-1 plans), privately-negotiated transactions, accelerated stock repurchases, block trades or derivative contracts or otherwise in accordance with applicable federal securities laws, including Rule 10b-18 of the Securities Exchange Act of 1934. As part of this repurchase program, on April 28, 2014, we entered into an accelerated share repurchase agreement ("ASR") with Goldman, Sachs & Co. to repurchase $70.0 million of our common stock. Under the terms of the ASR, we agreed to repurchase in total $70.0 million of our common stock and received an initial delivery of approximately 1.0 million shares based on the then current market price, which were retired. The ASR was completed on July 29, 2014 with a final delivery of approximately 0.4 million shares. We received a total of 1.4 million shares under the ASR for an average purchase price per share of $51.46. The final number of shares repurchased was based on our volume-weighted average stock price during the term of the transaction, less an agreed upon discount. In addition, during 2014, we repurchased on the open market approximately 0.6 million shares of our common stock at an average price of $50.93 per share, including commissions, for an aggregate purchase price of approximately $28.2 million. All repurchased shares were retired. As of December 31, 2014, we have $201.8 million remaining under the April 2014 stock repurchase program, $1.8 million of which we expect to purchase over the next three months. In addition, in January 2015, our Board of Directors has authorized the next $100.0 million under the program to be repurchased which we anticipate completing within twelve months. We expect to finance future stock repurchases with current cash on hand.
45
On March 22, 2013, we entered into a credit facility with Wells Fargo Bank. The credit facility provides for a $50.0 million revolving line of credit, with a $10.0 million letter of credit sublimit, and has a maturity date on March 22, 2016. The credit facility also requires us to maintain a minimum unrestricted cash balance of $50.0 million and comply with specific financial conditions and performance requirements. The loan bears interest, at our option, at a fluctuating rate per annum equal to the daily one-month adjusted LIBOR rate plus a spread of 1.75% or an adjusted LIBOR rate (based on one, three, six or twelve-month interest periods) plus a spread of 1.75%. As of December 31, 2014, we had no outstanding borrowings under this credit facility and were in compliance with the conditions and performance requirements.
We believe that our current cash and cash equivalents and marketable securities combined with our positive cash flows from operations will be sufficient to fund our operations and stock repurchases for at least the next 12 months. If we are unable to generate adequate operating cash flows, we may need to suspend our stock repurchase program or seek additional sources of capital through equity or debt financing, collaborative or other arrangements with other companies, bank financing and other sources in order to realize our objectives and to continue our operations. There can be no assurance that we will be able to obtain additional debt or equity financing on terms acceptable to us, or at all. If adequate funds are not available, we may need to make business decisions that could adversely affect our operating results such as modifications to our pricing policy, business structure or operations. Accordingly, the failure to obtain sufficient funds on acceptable terms when needed could have a material adverse effect on our business, results of operations and financial condition.
Operating Activities
For the year ended
December 31, 2014
, cash flows from operations of
$226.9 million
resulted primarily from our net income of approximately
$145.8 million
as well as the following:
Significant non-cash activities
|
•
|
Stock-based compensation was
$39.8 million
related to our equity incentive compensation granted to employees and directors.
|
|
•
|
Deferred taxes of
$25.5 million
primarily due to the utilization of deferred tax assets.
|
|
•
|
Excess tax benefits from our share-based compensation arrangements of
$21.4 million
.
|
|
•
|
Depreciation and amortization of
$17.9 million
related to our fixed assets and acquired intangible assets.
|
Significant changes in working capital
|
•
|
an increase of
$27.2 million
in accounts receivable which is a result of the increase in net revenues,
|
|
•
|
an increase of
$22.7 million
in accrued and other long-term liabilities primarily due to an increase in income tax payable along with other accruals due to timing of payment, and
|
|
•
|
an increase of
$15.8 million
in deferred revenues corresponding to the increases in revenues.
|
For the year ended December 31, 2013, cash flows from operations of
$186.0 million
resulted primarily from our net income of approximately
$64.3 million
as well as the following:
Significant non-cash activities
|
•
|
Impairment of goodwill related to our Scanner and Services reporting unit was
$40.7 million
.
|
|
•
|
Impairment of long-lived assets related to our Scanner and Services reporting unit was
$26.3 million
.
|
|
•
|
Excess tax benefits from our share-based compensation arrangements of
$27.1 million
.
|
|
•
|
Stock-based compensation was
$26.4 million
related to our equity incentive compensation granted to employees and directors.
|
|
•
|
Depreciation and amortization of
$16.8 million
related to our fixed assets and acquired intangible assets.
|
|
•
|
Deferred taxes of
$21.2 million
primarily due to the utilization of deferred tax assets.
|
Significant changes in working capital
|
•
|
an increase of
$12.0 million
in accounts receivable due to the increase in net revenues,
|
46
|
•
|
an increase of
$9.7 million
in accrued and other long-term liabilities due to compensation and bonuses accruals along with higher sales rebates, and
|
|
•
|
an increase of
$14.9 million
in deferred revenue primarily due to higher product sales along with additional deferrals as a result of our mid-course correction policy change in June 2013.
|
For the year ended December 31, 2012, cash flows from operations of
$133.8 million
resulted primarily from our net income of approximately
$58.7 million
and the following reasons:
Significant non-cash activities
|
•
|
Impairment of goodwill related to our Scanner and Services reporting unit was $36.6 million.
|
|
•
|
Stock-based compensation was $21.5 million related to our equity incentive compensation granted to employees and directors.
|
|
•
|
Depreciation and amortization of $17.8 million related to our fixed assets and acquired intangible assets.
|
|
•
|
Deferred taxes of $17.8 million primarily due to the utilization of deferred tax assets.
|
|
•
|
Excess tax benefits from our share-based payments were $17.2 million.
|
Significant changes in working capital
|
•
|
an increase of $11.7 million in accounts receivable due to the increase in revenues during 2012,
|
|
•
|
an increase of $5.7 million in inventories primarily due to increased production volumes for our intra-oral scanner products in anticipation of the move to our new facility in Israel as well as procuring the new SmartTrack material for our clear aligners,
|
|
•
|
an increase of $3.9 million in prepaid expenses and other assets primarily due to the timing of software license and insurance policy renewals,
|
|
•
|
an increase of $2.9 million in accrued and other long-term liabilities primarily due to higher deferred tax liabilities, and
|
|
•
|
an increase of $12.4 million in deferred revenue primarily due to higher sales with deferred revenue components in 2012.
|
Investing Activities
Net cash used in investing activities was
$201.6
million for the year ended
December 31, 2014
, primarily consisted of purchases of marketable securities of
$437.2 million
and property, plant and equipment purchases of
$24.1 million
. These uses were partially offset by
$259.8 million
of maturities and sales of our marketable securities.
For 2015, we expect to invest $70.0 million to $80.0 million on capital expenditures primarily for additional manufacturing capacity and infrastructure including a project to implement a new enterprise resource planning system which we started in late 2014 with expected go-live for various modules and subsidiaries throughout 2016. Although we believe our current investment portfolio has little risk of impairment, we cannot predict future market conditions or market liquidity and can provide no assurance that our investment portfolio will remain unimpaired.
Net cash used in investing activities was
$210.7
million for the year ended
December 31, 2013
, primarily consisted of our purchase of marketable securities of
$303.9 million
and property and equipment purchases of
$19.4 million
along with $7.7 million for the acquisition of our Asia Pacific distributor in April 2013. These uses were partially offset by $122.7 million of maturities and sales of our marketable securities.
Net cash used in investing activities was
$78.3
million for the year ended
December 31, 2012
, primarily consisted of our purchase of marketable securities of $67.5 million and property and equipment purchases of $38.3 million. These costs were partially offset by maturities and sales of marketable securities of $25.2 million and the release of $2.5 million of funds related to unclaimed merger consideration for the acquisition of Cadent on April 29, 2011 included in Other Investing Activities.
Financing Activities
Net cash used by financing activities was
$66.4
million for the year ended
December 31, 2014
resulting from repurchases of our common stock of
$98.2 million
and
$7.6 million
of payroll taxes paid for our employees' vesting of restricted stock units
47
through share withholdings, partially off-set by proceeds from issuance of common stock of
$18.0 million
and
$21.4 million
from excess tax benefit from our share-based compensation arrangements.
Net cash used by financing activities was
$38.2 million
for the year ended
December 31, 2013
resulting from repurchases of our common stock of
$95.1 million
and
$4.4 million
of payroll taxes paid for our employees' vesting of restricted stock units through share withholdings, partially off-set by proceeds from issuance of common stock of $34.2 million and $27.1 million from excess tax benefit from our share-based compensation arrangements.
Net cash provided by financing activities was
$10.2 million
for the year ended
December 31, 2012
resulting from approximately $42.3 million in proceeds from the issuance of our common stock and approximately $17.2 million from excess tax benefit from our share-based compensation arrangements. These proceeds were partially offset by approximately $47.2 million common stock repurchases and $2.1 million of payroll taxes paid for our employees’ vesting of restricted stock units through share withholdings.
Net proceeds from the issuance of our common stock related to the exercise of employee stock options have historically been a significant component of our liquidity; however, in 2006, we began granting restricted stock units (“RSUs”) which, unlike stock options, do not generate cash from exercises. As a result, we will continue to generate less cash from the proceeds of the sale of our common stock in future periods. In addition, because restricted stock units are taxable to the individuals when they vest, the number of shares we issue to each of our employees will be net of applicable withholding taxes which will be paid by us on their behalf. During
2014
,
2013
and
2012
, we paid
$7.6
million,
$4.4
million and
$2.1
million, respectively, for taxes related to restricted stock units that vested during the periods.
Stock Repurchase
On October 27, 2011, we announced that our Board of Directors approved a stock repurchase program pursuant to which we may repurchase up to
$150.0 million
of common stock. Purchases under the stock repurchase program may be made from time to time in the open market.
During 2012, we repurchased approximately
1.7 million
shares of common stock at an average price of
$27.28
per share for an aggregate purchase price of approximately $47.2 million, including commissions. The common stock repurchases reduced additional paid-in capital by approximately
$15.4 million
and increased accumulated deficit by
$31.8 million
. During 2013, we repurchased approximately
2.7
million shares of our common stock at an average price of
$34.95
per share, including commissions, for an aggregate purchase price of approximately
$95.1 million
. The common stock repurchases reduced additional paid-in capital by approximately
$24.5 million
and increased accumulated deficit by
$70.6 million
. All repurchased shares were retired. The October 2011 program was complete as of December 31, 2013.
On April 23, 2014, we announced that our Board of Directors had authorized a stock repurchase program pursuant to which we may purchase up to $300.0 million of our common stock over the next three years, with $100.0 million of that amount authorized to be purchased over the first twelve months. Any purchases under this stock repurchase program may be made, from time-to-time, pursuant to open market purchases (including pursuant to Rule 10b5-1 plans), privately-negotiated transactions, accelerated stock repurchases, block trades or derivative contracts or otherwise in accordance with applicable federal securities laws, including Rule 10b-18 of the Securities Exchange Act of 1934.
As part of our $300.0 million stock repurchase program, we entered into an accelerated share repurchase agreement ("ASR") with Goldman, Sachs & Co. on April 28, 2014 to repurchase $70.0 million of our common stock. We paid $70.0 million on April 29, 2014 and received an initial delivery of approximately 1.0 million shares. The ASR was completed on July 29, 2014 with a final delivery of approximately 0.4 million shares. We received a total of approximately 1.4 million shares under the ASR for an average purchase price per share of $51.46, which all shares were retired. The final number of shares repurchased was based on our volume-weighted average stock price during the term of the transaction, less an agreed upon discount.
During 2014, we repurchased on the open market approximately 0.6 million shares of our common stock at an average price of $50.93 per share, including commissions, for an aggregate purchase price of approximately $28.2 million. All repurchased shares were retired. As of December 31, 2014, we have $201.8 million remaining under the April 2014 stock repurchase program, of which $1.8 million was repurchased in January 2015. In addition, in January 2015, our Board of Directors has authorized the next $100.0 million under the program to be repurchased which we anticipate completing within twelve months. We expect to finance future stock repurchases with current cash on hand.
48
Contractual Obligations/Off Balance Sheet Arrangements
The impact that our contractual obligations as of
December 31, 2014
are expected to have on our liquidity and cash flows in future periods is as follows (in thousands):
|
|
|
Payments Due by Period
|
|||||||||||||||||
|
|
Total
|
Less than
1 Year
|
1-3
Years
|
3-5
Years
|
More than
5 Years
|
||||||||||||||
|
Operating lease obligations
|
$
|
24,046
|
|
$
|
9,130
|
|
$
|
12,952
|
|
1,754
|
|
210
|
|
||||||
|
Unconditional purchase obligations
|
49,802
|
|
49,802
|
|
—
|
|
—
|
|
—
|
|
|||||||||
|
Total contractual cash obligations
|
$
|
73,848
|
|
$
|
58,932
|
|
$
|
12,952
|
|
$
|
1,754
|
|
$
|
210
|
|
||||
Our contractual obligations table above excludes approximately $33.1 million of non-current uncertain tax benefits which are included in other long-term obligations and deferred tax assets on our balance sheet as of
December 31, 2014
. We have not included this amount because we cannot make a reasonably reliable estimate regarding the timing of settlements with taxing authorities, if any.
We had no off-balance sheet arrangements as defined in Regulation S-K Item 303(a) (4) as of
December 31, 2014
.
We believe that our current cash and cash equivalents and marketable debt securities combined with our positive cash flows from operations will be sufficient to fund our operations for at least the next 12 months. If we are unable to generate adequate operating cash flows, we may need to seek additional sources of capital through equity or debt financing, collaborative or other arrangements with other companies, bank financing and other sources in order to realize our objectives and to continue our operations. There can be no assurance that we will be able to obtain additional debt or equity financing on terms acceptable to us, or at all. If adequate funds are not available, we may need to make business decisions that could adversely affect our operating results such as modifications to our pricing policy, business structure or operations. Accordingly, the failure to obtain sufficient funds on acceptable terms when needed could have a material adverse effect on our business, results of operations and financial condition.
Indemnification Provisions
In the normal course of business to facilitate transactions in our services and products, we indemnify customers, vendors, lessors, and other parties with respect to certain matters, including, but not limited to, services to be provided by us and intellectual property infringement claims made by third parties. In addition, we have entered into indemnification agreements with our directors and certain of our officers that will require us, among other things, to indemnify them against certain liabilities that may arise by reason of their status or service as directors or officers. Several of these agreements limit the time within which an indemnification claim can be made and the amount of the claim.
It is not possible to make a reasonable estimate of the maximum potential amount under these indemnification agreements due to the unique facts and circumstances involved in each particular agreement. Additionally, we have a limited history of prior indemnification claims and the payments we have made under such agreements have not had a material adverse effect on our results of operations, cash flows, or financial position. However, to the extent that valid indemnification claims arise in the future, future payments by us could be significant and could have a material adverse effect on our results of operations or cash flows in a particular period. As of
December 31, 2014
, we did not have any material indemnification claims that were probable or reasonably possible.
Critical Accounting Policies and Estimates
Management’s discussion and analysis of our financial condition and results of operations is based upon our consolidated financial statements, which have been prepared in accordance with accounting principles generally accepted in the United States of America. The preparation of financial statements requires management to make estimates and judgments that affect the reported amounts of assets and liabilities, revenues and expenses and disclosures at the date of the financial statements. We evaluate our estimates on an on-going basis, including those related to revenue recognition, stock-based compensation, goodwill and finite-lived assets and related impairment, and income taxes. We use authoritative pronouncements, historical experience and other assumptions as the basis for making estimates. Actual results could differ from those estimates.
49
We believe the following critical accounting policies and estimates affect our more significant judgments used in the preparation of our consolidated financial statements.
Revenue Recognition
We measure and allocate revenue according to the accounting guidance for multiple-deliverable revenue arrangements in Accounting Standards Update (“ASU”) 2009-13,
Multiple-Deliverable Revenue Arrangements-a consensus of the Financial Accounting Standard Board (“FASB”) Emerging Issues Task Force
.
Multiple-Element Arrangements (“MEAs”):
Arrangements with customers may include multiple deliverables, including any combination of products/equipment and services. The deliverables included in the MEAs are separated into more than one unit of accounting when (i) the delivered product/equipment has value to the customer on a stand-alone basis, and (ii) delivery of the undelivered service element(s) is probable and substantially in our control. Arrangement consideration is then allocated to each unit, delivered or undelivered, based on the relative selling price (“RSP”) of each unit of accounting based first on vendor-specific objective evidence (“VSOE”) if it exists, second on third-party evidence (“TPE”) if it exists, and on best estimated selling price (“BESP”) if neither VSOE or TPE exist.
|
•
|
VSOE – In most instances, products are sold separately in stand-alone arrangements. Services are also sold separately through renewals of contracts with varying periods. We determine VSOE based on pricing and discounting practices for the specific product or service when sold separately, considering geographical, customer, and other economic or marketing variables, as well as renewal rates or stand-alone prices for the service element(s).
|
|
•
|
TPE – If we cannot establish VSOE of selling price for a specific product or service included in a multiple-element arrangement, we use third-party evidence of selling price. We determine TPE based on sales of comparable amount of similar products or service offered by multiple third parties considering the degree of customization and similarity of product or service sold.
|
|
•
|
BESP – The best estimated selling price represents the price at which we would sell a product or service if it were sold on a stand-alone basis. When VSOE or TPE do not exist for all elements, we determine BESP for the arrangement element based on sales, cost and margin analysis, as well as other inputs based on our pricing practices. Adjustments for other market and Company-specific factors are made as deemed necessary in determining BESP.
|
Provisions for discounts and rebates to customers are provided for in the same period that the related product sales are recorded based upon historical discounts and rebates.
Clear Aligner
We enter into arrangements (“treatment plans”) that involve multiple future product deliverables. Invisalign Full, Invisalign Teen, and Invisalign Assist products include up to three optional case refinements. Case refinement is a finishing tool used to adjust a patient's teeth to the desired final position. Case refinement may be elected by the dental professional at any time during treatment however it is generally ordered in the last stages of orthodontic treatment. Beginning June 15, 2013, Invisalign Full and Invisalign Teen products also include up to three optional mid-course corrections. Mid-course correction is a treatment adjustment during active treatment if the case is not tracking to the original treatment plan or goals. Mid-course correction gives doctors the ability to "adjust course" based on the needs of the individual patient. Invisalign Teen also includes up to six optional replacement aligners in the price of the product and may be ordered any time throughout treatment.
We determined that our treatment plans, except Invisalign Assist with progress tracking, comprise the following deliverables which also represent separate units of accounting: single-batched aligners, case refinement mid-course correction and replacement aligners. We allocate revenue for each treatment plan based on each unit's relative selling price based on BESP and recognize the revenue upon the delivery of each unit in the treatment plan. We regularly review our estimates of selling price and maintain internal controls over the establishment and update of these estimates.
For Invisalign Assist with the progress tracking feature, aligners and services are provided to the dental professional every nine stages (“a batch”). Beginning January 1, 2011, we were able to reliably estimate the number of batches which are expected to be shipped for each case based upon our historical experience. The amounts allocated to this deliverable are recognized on a prorated basis as each batch is shipped.
Prior to 2013, the Vivera Retainer included four shipments per year, and revenue was recognized ratably as each shipment occurred. In the first quarter of 2013, we consolidated Vivera Retainer product shipments down to one shipment per year.
50
Scanners and Services
We recognize revenues from the sales of iTero intra-oral scanners and CAD/CAM services. CAD/CAM services include scanning services, extended warranty for the intra-oral scanners, a range of iTero restorative services, and OrthoCAD services such as OrthoCAD iRecord. We sell intra-oral scanners and services through both our direct sales force and distribution partners. The intra-oral scanner sales price includes one year of warranty, and for additional fees, the customer may select an unlimited scanning service agreement over a fixed period of time or extended warranty periods. Revenue is recognized when persuasive evidence of the arrangement exists, the price is fixed or determinable, collectability is reasonably assured, title and risk of loss has passed to customers based on the shipping terms, no significant obligations remain, and allowances for discounts, returns, and customer incentives can be reliably estimated. When intra-oral scanners are sold with either an unlimited scanning service agreement and/or extended warranty, we allocate revenue based on each element's relative selling price. We estimate the selling price of each element, as if it is sold on a stand-alone basis, taking into consideration historical prices as well as our discounting strategies. Scanner revenue, net of related discounts and allowances, is recognized when products or equipment have been shipped, installed and on-site training completed. For certain distributors who provide installation and training to the customer, we recognize scanner revenue when the intra-oral scanner is shipped to the distributor assuming all of the other revenue recognition criteria have been met.
Discounts are deducted from revenue at the time of sale or when the discount is offered, whichever is later and free cases or training is included as a deliverable in the multiple-element arrangement assessment. Returns of products, excluding warranty related returns, are infrequent and insignificant.
Service revenue, including iTero restorative and all OrthoCAD services are recognized upon delivery or ratably over the contract term as the specified services are performed. If a customer selects a pay per use basis for scanning service fees, the revenue is recognized as the service is provided.
We offer customers an option to purchase extended warranties on certain products. We recognize revenue on these extended warranty contracts ratably over the life of the contract. The costs associated with these extended warranty contracts are recognized when incurred.
Stock-based Compensation Expense
We recognize stock-based compensation cost for only those shares ultimately expected to vest on a straight-line basis over the requisite service period of the award. We use the Black-Scholes option pricing model to determine the fair value of stock options and employee stock purchase plan shares. We estimate the fair value of market-performance based restricted stock units using a Monte Carlo simulation model which requires the input of assumptions, including expected term, stock price volatility and the risk-free rate of return. In addition, judgment is required in estimating the number of stock-based awards that are expected to be forfeited. Forfeitures are estimated based on historical experience at the time of grant and revised, if necessary, in subsequent periods if actual forfeitures differ from those estimates. The assumptions used in calculating the fair value of share-based payment awards represent management’s best estimates, but these estimates involve inherent uncertainties and the application of management’s judgment. As a result, if factors change and we use different assumptions, our stock-based compensation expense could be materially different in the future.
Goodwill and finite-lived acquired intangible assets
Goodwill represents the excess of the purchase price paid over the fair value of tangible and identifiable intangible net assets acquired in business combinations and is allocated to the reporting units based on relative synergies generated.
Our intangible assets primarily consist of intangible assets acquired as part of acquisitions and are amortized using the straight-line method over their estimated useful lives, reflecting the period in which the economic benefits of the assets are expected to be realized.
Impairment of goodwill, finite-lived acquired intangible assets and long-lived assets
Goodwill
We evaluate goodwill for impairment at least annually on November 30th or more frequently if indicators are present, an event occurs or circumstances changes that suggest an impairment may exist and that it would more likely than not reduce the fair
51
value of a reporting unit below its carrying amount. The allocation of goodwill to the respective reporting unit is based on relative synergies generated as a result of an acquisition.
We perform an initial assessment of qualitative factors to determine whether the existence of events and circumstances leads to a determination that it is more likely than not that the fair value of a reporting unit is less than its carrying amount. In performing the qualitative assessment, we identify and consider the significance of relevant key factors, events, and circumstances that affect the fair value of our reporting units. These factors include external factors such as macroeconomic, industry, and market conditions, as well as entity-specific factors, such as our actual and planned financial performance. We also give consideration to the difference between the reporting unit fair value and carrying value as of the most recent date a fair value measurement was performed. If, after assessing the totality of relevant events and circumstances, we determine that it is more likely than not that the fair value of the reporting unit exceeds its carrying value and there is no indication of impairment, no further testing is performed; however, if we conclude otherwise, the first step of the two-step impairment test is performed by estimating the fair value of the reporting unit and comparing it with its carrying value, including goodwill.
Step one of the goodwill impairment test consists of a comparison of the fair value of a reporting unit against its carrying amount, including the goodwill allocated to each reporting unit. We determine the fair value of our reporting units based on the present value of estimated future cash flows under the income approach of the reporting units as well as various price or market multiples applied to the reporting unit's operating results along with the appropriate control premium under the marketing approach, both of which are classified as level 3 within the fair value hierarchy (as described in Note 2 in our consolidated financial statements). If the carrying amount of the reporting unit is in excess of its fair value, step two requires the comparison of the implied fair value of the reporting unit’s goodwill against the carrying amount of the reporting unit’s goodwill. Any excess of the carrying value of the reporting unit’s goodwill over the implied fair value of the reporting unit’s goodwill is recorded as an impairment loss.
During March 2013, changes in the competitive environment for intra-oral scanners, including announcements from our competitors of new low-priced scanners targeted at orthodontists and general practitioner dentists in North America, caused us to lower our expectations for growth and profitability for our Scanner and Services reporting unit. The impairment analysis performed for goodwill requires several estimates in computing the estimated fair value of a reporting unit. We use a discounted cash flow (“DCF”) approach to estimate the fair value of a reporting unit, utilizing harvest model, which we believe is the most reliable indicator of fair value of this business, and is most consistent with the approach a market place participant would use. As a result, we determined that goodwill related only to our Scanner and Services reporting unit should be tested for impairment as of March 31, 2013 due to these facts and circumstances which would more likely than not reduce the fair value of our Scanner and Services reporting unit below its carrying amount. Based on our analysis, there was no implied goodwill for the Scanner and Services reporting unit; therefore, we recorded a goodwill impairment charge of $40.7 million in the three months ended March 31, 2013, which represented the entire goodwill balance in the Scanner and Services reporting unit. There was no triggering event related to the Clear Aligner goodwill. Refer to Note 5 for details of the impairment analysis.
The remaining goodwill is entirely attributable to our Clear Aligner reporting unit. During the fourth quarter of fiscal 2014, we performed the annual goodwill impairment testing using the qualitative approach discussed above and found no impairment as the fair value of our Clear Aligner reporting unit was significantly in excess of the carrying value.
Finite-lived intangible assets and long-lived assets
We evaluate long-lived assets (including finite-lived intangible assets) for impairment whenever events or changes in circumstances indicate that the carrying amount of an asset group may not be recoverable. An asset or asset group is considered impaired if its carrying amount exceeds the future undiscounted net cash flows the asset or asset group is expected to generate. If an asset or asset group is considered to be impaired, the impairment to be recognized is calculated as the amount by which the carrying amount of the asset or asset group exceeds its fair market value. Our estimates of future cash flows attributable to our long-lived assets require significant judgment based on our historical and anticipated results and are subject to many factors. Factors we consider important which could trigger an impairment review include significant negative industry or economic trends, significant loss of customers and changes in the competitive environment. In 2013, we used a DCF approach to estimate the fair value of a reporting unit, utilizing harvest model, which we believe is the most reliable indicator of fair value of a business, and is most consistent with the approach of a marketplace participant would use. The estimation of fair value utilizing a DCF approach includes numerous uncertainties which require our significant judgment when making assumptions of expected growth rates and the selection of discount rates, as well as assumptions regarding general economic and business conditions, and the structure that would yield the highest economic value, among other factors. Key assumptions used in measuring the fair values of Scanner and Services reporting unit included the discount rate (based on the weighted-average cost of capital) and revenue growth. The fair value of Scanner and Services trademark was determined using a risk-adjusted DCF model under the relief-from-royalty method. The royalty rate used was based on a consideration of market rates. The fair value of Scanner and Services finite-lived customer
52
relationships was determined using a DCF model under the multi-period excess earnings method. We recorded a long-lived asset impairment in the quarter ended March 31, 2013 due to changes in the competitive environment for our intra-oral scanners, including announcements from our competitors of new low-priced scanners targeted at orthodontists and general practitioner dentists in North America. There was no triggering event related to the Clear Aligner asset group. Refer to Note 5 for details of the impairment analysis.
Accounting for Income Taxes
We make certain estimates and judgments in determining income tax expense for financial statement purposes. These estimates and judgments occur in the calculation of certain tax assets and liabilities, which arise from differences in the timing of recognition of revenue and expense for tax and financial statement purposes.
As part of the process of preparing our Consolidated Financial Statements, we are required to estimate our income taxes in each of the jurisdictions in which we operate. This process involves us estimating our current tax exposure under the applicable tax laws and assessing temporary differences resulting from differing treatment of items for tax and accounting purposes. These differences result in deferred tax assets and liabilities, which are included in our Consolidated Balance Sheet.
We account for uncertainty in income taxes pursuant to authoritative guidance based on a two-step approach to recognize and measure uncertain tax positions taken or expected to be taken in a tax return. The first step is to determine if the weight of available evidence indicates that it is more likely than not that the tax position will be sustained on audit based on its technical merits, including resolution of any related appeals or litigation processes. The second step is to measure the tax benefit as the largest amount that is more than 50% likely to be realized upon ultimate settlement. We adjust reserves for our uncertain tax positions due to changing facts and circumstances, such as the closing of a tax audit, or refinement of estimates due to new information. To the extent that the final outcome of these matters is different than the amounts recorded, such differences will impact our tax provision in our Consolidated Statements of Operations in the period in which such determination is made.
We assess the likelihood that we will be able to realize our deferred tax assets. Should there be a change in our ability to realize our deferred tax assets, our tax provision would increase in the period in which we determine that it is more likely than not that we cannot realize our deferred tax assets. We consider all available evidence, both positive and negative, including historical levels of income, expectations and risks associated with estimates of future taxable income and ongoing prudent and feasible tax planning strategies in assessing the need for a valuation allowance. If it is more likely than not that we will not realize our deferred tax assets, we will increase our provision for taxes by recording a valuation allowance against the deferred tax assets that we estimate will not ultimately be realized. The available positive evidence at
December 31, 2014
included historical operating profits and a projection of future income sufficient to realize most of our remaining deferred tax assets. As of
December 31, 2014
, it was considered more likely than not that our deferred tax assets would be realized with the exception of certain foreign loss carryovers as we are unable to forecast sufficient future profits to realize the deferred tax assets.
Accounting guidance for stock-based compensation prohibits recognition of a deferred income tax asset for excess tax benefits due to stock option exercises that have not yet been realized through a reduction in income taxes payable. Such unrecognized deferred tax benefits totaled $1.4 million as of December 31, 2014 and will be accounted for as a credit to additional paid-in capital, if and when realized through a reduction in income taxes payable. We follow the tax law ordering method to determine when excess tax benefits have been realized and consider only the direct impacts of awards when calculating the amount of windfalls or shortfalls.
As of
December 31, 2014
, U.S. income taxes and foreign withholding taxes associated with the repatriation of undistributed earnings of foreign subsidiaries were not provided for on a cumulative total of
$260.9 million
. We intend to reinvest these earnings indefinitely in our foreign subsidiaries. If these earnings were distributed in the form of dividends or otherwise, or if the shares of the relevant foreign subsidiaries were sold or otherwise transferred, we would be subject to additional U.S. income taxes subject to an adjustment for foreign tax credits, and foreign withholding taxes. Determination of the amount of unrecognized deferred income tax liability related to these earnings is not practicable.
Recent Accounting Pronouncements
See
Note 1
“
Summary of Significant Accounting Policies” in the Notes to our Consolidated Financial Statements
in
Item 8
for a full description of recent accounting pronouncements, including the expected dates of adoption and estimated effects on results of operations and financial condition, which is incorporated herein.
53
ITEM 7A.
QUANTITATIVE AND QUALITATIVE DISCLOSURES ABOUT MARKET RISK
In the normal course of business, we are exposed to foreign currency exchange rate and interest rate risks that could impact our financial position and results of operations.
Interest Rate Risk
Changes in interest rates could impact our anticipated interest income on our cash equivalents and investments in marketable securities. Our cash equivalents and investments are fixed-rate short-term and long-term securities. Fixed-rate securities may have their fair market value adversely impacted due to a rise in interest rates, and as a result, our future investment income may fall short of expectations due to changes in interest rates or we may suffer losses in principal if forced to sell securities which have declined in market value due to changes in interest rates. As of
December 31, 2014
, we had approximately
$402.7 million
invested in available-for-sale marketable securities. An immediate 10% change in interest rates would not have a material adverse impact on our future operating results and cash flows.
We do not have interest bearing liabilities as of
December 31, 2014
, and, therefore, we are not subject to risks from immediate interest rate increases.
Currency Rate Risk
We operate in North America, Europe, Asia Pacific, Costa Rica and Israel. As a result of our international business activities, our financial results could be affected by factors such as changes in foreign currency exchange rates or economic conditions in foreign markets, and there is no assurance that exchange rate fluctuations will not harm our business in the future. We sell our products in the local currency for the respective countries. This provides some natural hedging because most of the subsidiaries’ operating expenses are denominated in their local currencies as discussed further below. Regardless of this natural hedging, our results of operations may be adversely impacted by the exchange rate fluctuation. Although we will continue to monitor our exposure to currency fluctuations, and, where appropriate, may use financial hedging techniques in the future to minimize the effect of these fluctuations, we are not currently engaged in any financial hedging transactions. The impact of an aggregate change of 10% in foreign currency exchange rates relative to the U.S. dollar on our results of operations and financial position could be material.
ITEM 8.
CONSOLIDATED FINANCIAL STATEMENTS AND SUPPLEMENTARY DATA
Quarterly Results of Operations
|
|
Three Months Ended
|
||||||||||||||||||||||||||||||
|
|
2014
|
2013
|
|||||||||||||||||||||||||||||
|
|
December 31, 2014
|
September 30, 2014
|
June 30, 2014
|
March 31, 2014
|
December 31, 2013
|
September 30, 2013
|
June 30, 2013
|
March 31, 2013
|
|||||||||||||||||||||||
|
(in thousands, except per share data)
(unaudited )
|
|||||||||||||||||||||||||||||||
|
Net revenues
|
$
|
198,600
|
|
$
|
189,876
|
|
$
|
192,531
|
|
$
|
180,646
|
|
$
|
178,292
|
|
$
|
164,506
|
|
$
|
163,828
|
|
$
|
153,580
|
|
|||||||
|
Gross profit
|
150,662
|
|
145,054
|
|
145,476
|
|
137,251
|
|
136,476
|
|
125,090
|
|
123,691
|
|
112,849
|
|
|||||||||||||||
|
Income from operations
1
|
51,493
|
|
51,547
|
|
48,732
|
|
41,804
|
|
52,923
|
|
41,464
|
|
37,901
|
|
(38,075
|
)
|
|||||||||||||||
|
Net income
1 2 3
|
39,541
|
|
38,247
|
|
35,600
|
|
32,444
|
|
42,422
|
|
34,537
|
|
29,320
|
|
(41,983
|
)
|
|||||||||||||||
|
Net income per share:
|
|||||||||||||||||||||||||||||||
|
Basic
|
$
|
0.49
|
|
$
|
0.47
|
|
$
|
0.44
|
|
$
|
0.40
|
|
$
|
0.53
|
|
$
|
0.43
|
|
$
|
0.36
|
|
$
|
(0.52
|
)
|
|||||||
|
Diluted
|
$
|
0.48
|
|
$
|
0.47
|
|
$
|
0.43
|
|
$
|
0.39
|
|
$
|
0.51
|
|
$
|
0.42
|
|
$
|
0.36
|
|
$
|
(0.52
|
)
|
|||||||
|
Shares used in computing net income per share:
|
|||||||||||||||||||||||||||||||
|
Basic
|
80,266
|
|
80,629
|
|
81,027
|
|
81,120
|
|
80,432
|
|
79,967
|
|
80,576
|
|
81,248
|
|
|||||||||||||||
|
Diluted
|
81,691
|
|
82,014
|
|
82,341
|
|
82,817
|
|
82,438
|
|
81,848
|
|
82,149
|
|
81,248
|
|
|||||||||||||||
|
1
|
Income from operations included $40.7 million and $26.3 million of goodwill and long-lived asset impairment, respectively, in the three months ended March 31, 2013. Net income included these same items, net of tax.
|
|
2
|
In the three months ended December 31, 2013, we recorded an out of period correction that resulted in decreases in cost of net revenues of approximately $1.3 million and operating expense of $1.5 million offset in part by an increase in the provision
|
54
for income taxes of $0.6 million. The overall increase of $2.2 million in net income related to the out of period correction was not material to the consolidated financial statements for any quarter within 2013.
3
In the three months ended June 30, 2014, we recorded an out of period correction that resulted in an increase in the provision for income taxes of $2.1 million, which $1.8 million related to prior years and $0.3 million related to the three months ended March 31, 2014. The out of period correction was not material to the consolidated financial statements for any quarter within 2014.
55
INDEX TO CONSOLIDATED FINANCIAL STATEMENTS
|
|
Page
|
|
Report of Management on Internal Control over Financial Reporting
|
|
|
Report of Independent Registered Public Accounting Firm
|
|
|
Consolidated Statements of Operations
|
|
|
Consolidated Statements of Comprehensive Income
|
|
|
Consolidated Balance Sheets
|
|
|
Consolidated Statements of Stockholders’ Equity
|
|
|
Consolidated Statements of Cash Flows
|
|
|
Notes to Consolidated Financial Statements
|
|
56
REPORT OF MANAGEMENT ON INTERNAL CONTROL OVER FINANCIAL REPORTING
Management of Align is responsible for establishing and maintaining adequate internal control over financial reporting as defined in Rules 13a-15(f) and 15d-15(f) under the Securities Exchange Act of 1934. Our internal control over financial reporting is designed by, or under supervision of, our CEO and CFO, and effected by the board of directors, management and other personnel to provide reasonable assurance regarding the reliability of financial reporting and the preparation of financial statements for external purposes in accordance with generally accepted accounting principles. Internal control over financial reporting includes those policies and procedures that:
|
•
|
pertain to the maintenance of records that, in reasonable detail, accurately and fairly reflect the transactions and dispositions of the assets of Align;
|
|
•
|
provide reasonable assurance that transactions are recorded as necessary to permit preparation of financial statements in accordance with generally accepted accounting principles, and that receipts and expenditures of Align are being made only in accordance with authorizations of management and directors of Align; and
|
|
•
|
provide reasonable assurance regarding prevention or timely detection of unauthorized acquisition, use or disposition of Align's assets that could have a material effect on the financial statements.
|
Because of its inherent limitations, internal control over financial reporting may not prevent or detect misstatements. In addition, projections of any evaluation of effectiveness to future periods are subject to the risk that controls may become inadequate because of changes in conditions or that the degree of compliance with the policies or procedures may deteriorate.
Management assessed the effectiveness of our internal control over financial reporting as of
December 31, 2014
. In making this assessment, management used the criteria set forth in
Internal Control-Integrated Framework
(2013)
issued by the Committee of Sponsoring Organizations of the Treadway Commission (COSO).
Based on its assessment, management has concluded that, as of
December 31, 2014
, our internal control over financial reporting was effective based on criteria in
Internal Control - Integrated Framework (2013) issued by the COSO
.
The effectiveness of our internal control over financial reporting as of
December 31, 2014
has been audited by PricewaterhouseCoopers LLP, an independent registered public accounting firm, as stated in their report which is included herein.
|
/
S
/ THOMAS M. PRESCOTT
|
|
Thomas M. Prescott
|
|
President and Chief Executive Officer
|
|
February 26, 2015
|
|
/S/ DAVID L. WHITE
|
|
David L. White
|
|
Chief Financial Officer
|
|
February 26, 2015
|
57
REPORT OF INDEPENDENT REGISTERED PUBLIC ACCOUNTING FIRM
To the Stockholders and Board of Directors of Align Technology, Inc.:
In our opinion, the consolidated financial statements listed in the index appearing under Item 15(a)(1), present fairly, in all material respects, the financial position of Align Technology, Inc. and its subsidiaries at
December 31, 2014
and
December 31, 2013
, and the results of their operations and their cash flows for each of the three years in the period ended
December 31, 2014
in conformity with accounting principles generally accepted in the United States of America. In addition, in our opinion, the financial statement schedule listed in the index appearing under Item 15(a)(2) presents fairly, in all material respects, the information set forth therein when read in conjunction with the related consolidated financial statements. Also in our opinion, the Company maintained, in all material respects, effective internal control over financial reporting as of
December 31, 2014
, based on criteria established in
Internal Control—Integrated Framework
(2013)
issued by the Committee of Sponsoring Organizations of the Treadway Commission (COSO). The Company’s management is responsible for these financial statements and financial statement schedule, for maintaining effective internal control over financial reporting and for its assessment of the effectiveness of internal control over financial reporting, included in the accompanying Report of Management on Internal Control over Financial Reporting. Our responsibility is to express opinions on these financial statements, on the financial statement schedule, and on the Company’s internal control over financial reporting based on our integrated audits. We conducted our audits in accordance with the standards of the Public Company Accounting Oversight Board (United States). Those standards require that we plan and perform the audits to obtain reasonable assurance about whether the financial statements are free of material misstatement and whether effective internal control over financial reporting was maintained in all material respects. Our audits of the financial statements included examining, on a test basis, evidence supporting the amounts and disclosures in the financial statements, assessing the accounting principles used and significant estimates made by management, and evaluating the overall financial statement presentation. Our audit of internal control over financial reporting included obtaining an understanding of internal control over financial reporting, assessing the risk that a material weakness exists, and testing and evaluating the design and operating effectiveness of internal control based on the assessed risk. Our audits also included performing such other procedures as we considered necessary in the circumstances. We believe that our audits provide a reasonable basis for our opinions.
A company’s internal control over financial reporting is a process designed to provide reasonable assurance regarding the reliability of financial reporting and the preparation of financial statements for external purposes in accordance with generally accepted accounting principles. A company’s internal control over financial reporting includes those policies and procedures that (i) pertain to the maintenance of records that, in reasonable detail, accurately and fairly reflect the transactions and dispositions of the assets of the company; (ii) provide reasonable assurance that transactions are recorded as necessary to permit preparation of financial statements in accordance with generally accepted accounting principles, and that receipts and expenditures of the company are being made only in accordance with authorizations of management and directors of the company; and (iii) provide reasonable assurance regarding prevention or timely detection of unauthorized acquisition, use, or disposition of the company’s assets that could have a material effect on the financial statements.
Because of its inherent limitations, internal control over financial reporting may not prevent or detect misstatements. Also, projections of any evaluation of effectiveness to future periods are subject to the risk that controls may become inadequate because of changes in conditions, or that the degree of compliance with the policies or procedures may deteriorate.
/s/ PricewaterhouseCoopers LLP
San Jose, California
February 26, 2015
58
ALIGN TECHNOLOGY, INC. AND SUBSIDIARIES
CONSOLIDATED STATEMENTS OF OPERATIONS
(in thousands, except per share data)
|
|
Year Ended December 31,
|
||||||||||
|
|
2014
|
2013
|
2012
|
||||||||
|
Net revenues
|
$
|
761,653
|
|
$
|
660,206
|
|
$
|
560,041
|
|
||
|
Cost of net revenues
|
183,210
|
|
162,100
|
|
143,653
|
|
|||||
|
Gross profit
|
578,443
|
|
498,106
|
|
416,388
|
|
|||||
|
Operating expenses:
|
|||||||||||
|
Sales and marketing
|
217,262
|
|
180,046
|
|
152,041
|
|
|||||
|
General and administrative
|
114,806
|
|
112,752
|
|
99,295
|
|
|||||
|
Research and development
|
52,799
|
|
44,083
|
|
42,869
|
|
|||||
|
Impairment of goodwill
|
—
|
|
40,693
|
|
36,591
|
|
|||||
|
Impairment of long lived assets
|
—
|
|
26,320
|
|
—
|
|
|||||
|
Total operating expenses
|
384,867
|
|
403,894
|
|
330,796
|
|
|||||
|
Income from operations
|
193,576
|
|
94,212
|
|
85,592
|
|
|||||
|
Interest and other income (expense), net
|
(3,207
|
)
|
(1,073
|
)
|
(1,296
|
)
|
|||||
|
Net income before provision for income taxes
|
190,369
|
|
93,139
|
|
84,296
|
|
|||||
|
Provision for income taxes
|
44,537
|
|
28,844
|
|
25,605
|
|
|||||
|
Net income
|
$
|
145,832
|
|
$
|
64,295
|
|
$
|
58,691
|
|
||
|
Net income per share:
|
|||||||||||
|
Basic
|
$
|
1.81
|
|
$
|
0.80
|
|
$
|
0.73
|
|
||
|
Diluted
|
$
|
1.77
|
|
$
|
0.78
|
|
$
|
0.71
|
|
||
|
Shares used in computing net income per share:
|
|||||||||||
|
Basic
|
80,754
|
|
80,551
|
|
80,529
|
|
|||||
|
Diluted
|
82,283
|
|
82,589
|
|
83,040
|
|
|||||
The accompanying notes are an integral part of these consolidated financial statements.
59
ALIGN TECHNOLOGY, INC. AND SUBSIDIARIES
CONSOLIDATED STATEMENTS COMPREHENSIVE INCOME
(in thousands)
|
|
Year Ended December 31,
|
||||||||||
|
|
2014
|
2013
|
2012
|
||||||||
|
Net income
|
$
|
145,832
|
|
$
|
64,295
|
|
$
|
58,691
|
|
||
|
Net change in cumulative translation adjustment
|
(196
|
)
|
62
|
|
129
|
|
|||||
|
Change in unrealized gains (losses) on available-for sale securities, net of tax
|
(238
|
)
|
29
|
|
28
|
|
|||||
|
Other comprehensive income (loss)
|
(434
|
)
|
91
|
|
157
|
|
|||||
|
Comprehensive income
|
$
|
145,398
|
|
$
|
64,386
|
|
$
|
58,848
|
|
||
The accompanying notes are an integral part of these consolidated financial statements.
60
ALIGN TECHNOLOGY, INC. AND SUBSIDIARIES
CONSOLIDATED BALANCE SHEETS
(in thousands, except per share data)
|
December 31,
|
|||||||
|
2014
|
2013
|
||||||
|
ASSETS
|
|||||||
|
Current assets:
|
|||||||
|
Cash and cash equivalents
|
$
|
199,871
|
|
$
|
242,953
|
|
|
|
Marketable securities, short-term
|
254,787
|
|
127,040
|
|
|||
|
Accounts receivable, net of allowance for doubtful accounts and returns of $1,563 and $1,733, respectively
|
129,751
|
|
113,250
|
|
|||
|
Inventories
|
15,928
|
|
13,968
|
|
|||
|
Prepaid expenses and other current assets
|
19,770
|
|
18,829
|
|
|||
|
Deferred tax assets
|
37,053
|
|
28,636
|
|
|||
|
Total current assets
|
657,160
|
|
544,676
|
|
|||
|
Marketable securities, long-term
|
147,892
|
|
101,978
|
|
|||
|
Property, plant and equipment, net
|
90,125
|
|
75,743
|
|
|||
|
Goodwill and intangible assets, net
|
82,056
|
|
85,362
|
|
|||
|
Deferred tax assets
|
3,099
|
|
15,766
|
|
|||
|
Other assets
|
7,665
|
|
8,622
|
|
|||
|
Total assets
|
$
|
987,997
|
|
$
|
832,147
|
|
|
|
LIABILITIES AND STOCKHOLDERS’ EQUITY
|
|||||||
|
Current liabilities:
|
|||||||
|
Accounts payable
|
$
|
23,247
|
|
$
|
17,718
|
|
|
|
Accrued liabilities
|
87,880
|
|
80,345
|
|
|||
|
Deferred revenues
|
90,684
|
|
77,275
|
|
|||
|
Total current liabilities
|
201,811
|
|
175,338
|
|
|||
|
Income tax payable
|
30,483
|
|
18,326
|
|
|||
|
Other long-term liabilities
|
2,932
|
|
4,513
|
|
|||
|
Total liabilities
|
235,226
|
|
198,177
|
|
|||
|
Commitments and contingencies (Notes 6 and 8)
|
|
|
|||||
|
Stockholders’ equity:
|
|||||||
|
Preferred stock, $0.0001 par value (5,000 shares authorized; none issued)
|
—
|
|
—
|
|
|||
|
Common stock, $0.0001 par value (200,000 shares authorized; 80,205 and 80,583 issued and outstanding at 2014 and 2013, respectively)
|
8
|
|
8
|
|
|||
|
Additional paid-in capital
|
783,410
|
|
729,578
|
|
|||
|
Accumulated other comprehensive income (loss), net
|
(140
|
)
|
294
|
|
|||
|
Accumulated deficit
|
(30,507
|
)
|
(95,910
|
)
|
|||
|
Total stockholders’ equity
|
752,771
|
|
633,970
|
|
|||
|
Total liabilities and stockholders’ equity
|
$
|
987,997
|
|
$
|
832,147
|
|
|
The accompanying notes are an integral part of these consolidated financial statements.
61
ALIGN TECHNOLOGY, INC. AND SUBSIDIARIES
CONSOLIDATED STATEMENTS OF STOCKHOLDERS’ EQUITY
For the year ended December 31, 2014, 2013 and 2012
(in thousands)
|
Common Stock
|
Additional
Paid in
Capital
|
Accumulated
Other
Comprehensive
Income (Loss)
|
Accumulated
Deficit
|
Total
|
||||||||||||||||||
|
Shares
|
Amount
|
|||||||||||||||||||||
|
Balances at December 31, 2011
|
78,776
|
|
$
|
8
|
|
$
|
607,240
|
|
$
|
46
|
|
$
|
(116,513
|
)
|
$
|
490,781
|
|
|||||
|
Net income
|
—
|
|
—
|
|
—
|
|
—
|
|
58,691
|
|
58,691
|
|
||||||||||
|
Net change in unrealized gain from available-for sale securities
|
—
|
|
—
|
|
—
|
|
28
|
|
—
|
|
28
|
|
||||||||||
|
Net change in cumulative translation adjustment
|
—
|
|
—
|
|
—
|
|
129
|
|
—
|
|
129
|
|
||||||||||
|
Issuance of common stock relating to employee equity compensation plans
|
3,565
|
|
—
|
|
42,327
|
|
—
|
|
—
|
|
42,327
|
|
||||||||||
|
Tax withholdings related to net share settlement of restricted stock units
|
—
|
|
—
|
|
(2,106
|
)
|
—
|
|
—
|
|
(2,106
|
)
|
||||||||||
|
Common stock repurchased and retired
|
(1,730
|
)
|
—
|
|
(15,399
|
)
|
—
|
|
(31,804
|
)
|
(47,203
|
)
|
||||||||||
|
Excess tax provision from share based payment arrangements
|
—
|
|
—
|
|
17,187
|
|
—
|
|
—
|
|
17,187
|
|
||||||||||
|
Stock based compensation
|
—
|
|
—
|
|
21,483
|
|
—
|
|
—
|
|
21,483
|
|
||||||||||
|
Balances at December 31, 2012
|
80,611
|
|
8
|
|
670,732
|
|
203
|
|
(89,626
|
)
|
581,317
|
|
||||||||||
|
Net income
|
—
|
|
—
|
|
—
|
|
—
|
|
64,295
|
|
64,295
|
|
||||||||||
|
Net change in unrealized gain from available-for sale securities
|
—
|
|
—
|
|
—
|
|
29
|
|
—
|
|
29
|
|
||||||||||
|
Net change in cumulative translation adjustment
|
—
|
|
—
|
|
—
|
|
62
|
|
—
|
|
62
|
|
||||||||||
|
Issuance of common stock relating to employee equity compensation plans
|
2,694
|
|
—
|
|
34,196
|
|
—
|
|
—
|
|
34,196
|
|
||||||||||
|
Tax withholdings related to net share settlements of restricted stock units
|
—
|
|
—
|
|
(4,363
|
)
|
—
|
|
—
|
|
(4,363
|
)
|
||||||||||
|
Common stock repurchased and retired
|
(2,722
|
)
|
—
|
|
(24,528
|
)
|
—
|
|
(70,579
|
)
|
(95,107
|
)
|
||||||||||
|
Excess tax benefit from share based payment arrangements
|
—
|
|
—
|
|
27,103
|
|
—
|
|
—
|
|
27,103
|
|
||||||||||
|
Stock based compensation
|
—
|
|
—
|
|
26,438
|
|
—
|
|
—
|
|
26,438
|
|
||||||||||
|
Balances at December 31, 2013
|
80,583
|
|
8
|
|
729,578
|
|
294
|
|
(95,910
|
)
|
633,970
|
|
||||||||||
|
Net income
|
—
|
|
—
|
|
—
|
|
—
|
|
145,832
|
|
145,832
|
|
||||||||||
|
Net change in unrealized gain from available-for sale securities
|
—
|
|
—
|
|
—
|
|
(238
|
)
|
—
|
|
(238
|
)
|
||||||||||
|
Net change in cumulative translation adjustment
|
—
|
|
—
|
|
—
|
|
(196
|
)
|
—
|
|
(196
|
)
|
||||||||||
|
Issuance of common stock relating to employee equity compensation plans
|
1,536
|
|
—
|
|
18,028
|
|
—
|
|
—
|
|
18,028
|
|
||||||||||
|
Tax withholdings related to net share settlements of restricted stock units
|
—
|
|
—
|
|
(7,608
|
)
|
—
|
|
—
|
|
(7,608
|
)
|
||||||||||
|
Common stock repurchased and retired
|
(1,914
|
)
|
—
|
|
(17,804
|
)
|
—
|
|
(80,429
|
)
|
(98,233
|
)
|
||||||||||
|
Excess tax benefit from share based payment arrangements
|
—
|
|
—
|
|
21,393
|
|
—
|
|
—
|
|
21,393
|
|
||||||||||
|
Stock based compensation
|
—
|
|
—
|
|
39,823
|
|
—
|
|
—
|
|
39,823
|
|
||||||||||
|
Balances at December 31, 2014
|
80,205
|
|
$
|
8
|
|
$
|
783,410
|
|
$
|
(140
|
)
|
$
|
(30,507
|
)
|
$
|
752,771
|
|
|||||
The accompanying notes are an integral part of these consolidated financial statements.
62
ALIGN TECHNOLOGY, INC. AND SUBSIDIARIES
(in thousands)
|
|
Year Ended December 31,
|
||||||||||
|
|
2014
|
2013
|
2012
|
||||||||
|
CASH FLOWS FROM OPERATING ACTIVITIES:
|
|||||||||||
|
Net income
|
$
|
145,832
|
|
$
|
64,295
|
|
$
|
58,691
|
|
||
|
Adjustments to reconcile net income to net cash provided by operating activities:
|
|||||||||||
|
Deferred taxes
|
25,481
|
|
21,204
|
|
17,783
|
|
|||||
|
Depreciation and amortization
|
17,856
|
|
16,825
|
|
17,811
|
|
|||||
|
Stock-based compensation
|
39,823
|
|
26,438
|
|
21,483
|
|
|||||
|
Excess tax benefit from share-based payment arrangements
|
(21,393
|
)
|
(27,103
|
)
|
(17,187
|
)
|
|||||
|
Impairment of goodwill
|
—
|
|
40,693
|
|
36,591
|
|
|||||
|
Impairment of long-lived assets
|
—
|
|
26,320
|
|
—
|
|
|||||
|
Other non-cash operating activities
|
10,106
|
|
4,142
|
|
4,517
|
|
|||||
|
Changes in assets and liabilities, excluding the effects of business combinations:
|
|||||||||||
|
Accounts receivable
|
(27,229
|
)
|
(11,981
|
)
|
(11,666
|
)
|
|||||
|
Inventories
|
(1,999
|
)
|
1,158
|
|
(5,718
|
)
|
|||||
|
Prepaid expenses and other assets
|
(2,924
|
)
|
(392
|
)
|
(3,853
|
)
|
|||||
|
Accounts payable
|
2,887
|
|
(186
|
)
|
(6
|
)
|
|||||
|
Accrued and other long-term liabilities
|
22,692
|
|
9,662
|
|
2,943
|
|
|||||
|
Deferred revenues
|
15,767
|
|
14,901
|
|
12,389
|
|
|||||
|
Net cash provided by operating activities
|
226,899
|
|
185,976
|
|
133,778
|
|
|||||
|
CASH FLOWS FROM INVESTING ACTIVITIES:
|
|||||||||||
|
Acquisition, net of cash acquired
|
—
|
|
(7,652
|
)
|
—
|
|
|||||
|
Purchase of property, plant and equipment
|
(24,092
|
)
|
(19,412
|
)
|
(38,333
|
)
|
|||||
|
Purchase of marketable securities
|
(437,152
|
)
|
(303,917
|
)
|
(67,511
|
)
|
|||||
|
Proceeds from maturities of marketable securities
|
176,810
|
|
90,917
|
|
24,901
|
|
|||||
|
Proceeds from sales of marketable securities
|
82,990
|
|
31,741
|
|
297
|
|
|||||
|
Other investing activities
|
(183
|
)
|
(2,411
|
)
|
2,346
|
|
|||||
|
Net cash used in investing activities
|
(201,627
|
)
|
(210,734
|
)
|
(78,300
|
)
|
|||||
|
CASH FLOWS FROM FINANCING ACTIVITIES:
|
|||||||||||
|
Proceeds from issuance of common stock
|
18,028
|
|
34,196
|
|
42,327
|
|
|||||
|
Common stock repurchase
|
(98,233
|
)
|
(95,107
|
)
|
(47,203
|
)
|
|||||
|
Excess tax benefit from share-based payment arrangements
|
21,393
|
|
27,103
|
|
17,187
|
|
|||||
|
Employees’ taxes paid upon the vesting of restricted stock units
|
(7,608
|
)
|
(4,363
|
)
|
(2,106
|
)
|
|||||
|
Net cash (used in) provided by financing activities
|
(66,420
|
)
|
(38,171
|
)
|
10,205
|
|
|||||
|
Effect of foreign exchange rate changes on cash and cash equivalents
|
(1,934
|
)
|
(504
|
)
|
28
|
|
|||||
|
Net (decrease) increase in cash and cash equivalents
|
(43,082
|
)
|
(63,433
|
)
|
65,711
|
|
|||||
|
Cash and cash equivalents, beginning of year
|
242,953
|
|
306,386
|
|
240,675
|
|
|||||
|
Cash and cash equivalents, end of year
|
$
|
199,871
|
|
$
|
242,953
|
|
$
|
306,386
|
|
||
The accompanying notes are an integral part of these consolidated financial statements.
63
ALIGN TECHNOLOGY, INC. AND SUBSIDIARIES
NOTES TO CONSOLIDATED FINANCIAL STATEMENTS
Business Description
Align Technology, Inc. (“We”, “Our”, or “Align”) was incorporated in April 1997 in Delaware and focuses on designing, manufacturing and marketing innovative, technology-rich products to help dental professionals achieve the clinical results they expect and deliver effective, convenient cutting-edge dental treatment options to their patients. We are headquartered in San Jose, California with offices worldwide. Our international headquarters are located in Amsterdam, the Netherlands. We have
two
operating segments, (1) Clear Aligner, known as the Invisalign System, and (2) Scanners and Services ("Scanner"), known as the iTero intra-oral scanner and OrthoCAD services.
Basis of presentation and preparation
The consolidated financial statements include the accounts of Align and our wholly-owned subsidiaries after elimination of intercompany transactions and balances. Certain amounts in prior periods have been reclassified to conform with the current period presentation. These reclassifications had no impact on previously reported gross profit or financial position.
In connection with the preparation of the consolidated financial statements, we evaluated events subsequent to the balance sheet date through the financial statement issuance date and determined that all material transactions have been recorded and disclosed properly.
Out of period adjustment
In 2013, we recorded an out of period correction that resulted in decreases in cost of net revenues of approximately
$1.7 million
and operating expense of
$0.7 million
offset in part by an increase in the provision for income taxes of
$0.5 million
. We do not believe the increase of
$1.9 million
to net income related to the out of period adjustment is material to the consolidated financial statements for the fiscal year ended December 31, 2013 or to any prior years' consolidated financial statements.
In 2014, we recorded an out of period correction that resulted in an increase in the provision for income taxes of
$1.8 million
. We do not believe the decrease to net income related to the out of period adjustment is material to the consolidated financial statements for the fiscal year ended December 31, 2014 or to any prior years' consolidated financial statements.
Use of estimates
The preparation of financial statements in conformity with accounting principles generally accepted in the United States of America (“U.S.”) requires our management to make estimates and assumptions that affect the amounts reported in the consolidated financial statements and accompanying notes. Actual results could differ materially from those estimates. On an ongoing basis, we evaluate our estimates, including those related to the fair values of financial instruments, intangible assets and goodwill, useful lives of intangible assets and property and equipment, stock-based compensation, revenue recognition, income taxes, and contingent liabilities, among others. We base our estimates on historical experience and on various other assumptions that are believed to be reasonable, the results of which form the basis for making judgments about the carrying values of assets and liabilities.
Fair value of financial instruments
The carrying amounts of our cash, accounts receivable, accounts payable and other current liabilities approximate their fair value.
We measure our cash equivalents, marketable securities, and our Israeli severance fund at fair value. Fair value is the price that would be received from selling an asset or paid to transfer a liability in an orderly transaction between market participants at the measurement date. Fair value is estimated by applying the following hierarchy, which prioritizes the inputs used to measure fair value into three levels and bases the categorization within the hierarchy upon the lowest level of input that is available and significant to the fair value measurement:
Level 1
— Quoted (unadjusted) prices in active markets for identical assets or liabilities.
Level 2
— Observable inputs other than quoted prices included in Level 1, such as quoted prices for similar assets or liabilities in active markets; quoted prices for identical or similar assets or liabilities in markets that are not active; or other inputs that are observable or can be corroborated by observable market data for substantially the full term of the asset or liability.
64
ALIGN TECHNOLOGY, INC. AND SUBSIDIARIES
NOTES TO CONSOLIDATED FINANCIAL STATEMENTS—(Continued)
Level 3
– Inputs that are generally unobservable and typically reflect management’s estimate of assumptions that market participants would use in pricing the asset or liability.
Cash and cash equivalents
We consider currency on hand, demand deposits, time deposits, and all highly liquid investments with an original maturity of
three months
or less at the date of purchase to be cash and cash equivalents. Cash and cash equivalents are held in various financial institutions in the U.S. and internationally.
Restricted cash
Our restricted cash balance as of
December 31, 2014
was
$3.8 million
, of which
$3.6 million
was classified as a long term asset and
$0.2 million
as a current asset. Our restricted cash balance as of December 31, 2013 was
$4.0 million
and was classified as a long term asset. The restricted cash primarily consisted of funds reserved for legal requirements.
Marketable securities
We invest primarily in money market funds, commercial paper, corporate bonds, U.S. government agency bonds, asset-backed securities, municipal bonds, U.S. dollar dominated foreign corporate bonds, U.S. government treasury bonds and certificates of deposits.
Marketable securities are classified as available-for-sale and are carried at fair value. Marketable securities classified as current assets have maturities of less than one year. Unrealized gains or losses on such securities are included in accumulated other comprehensive income, net in stockholders’ equity. Realized gains and losses from maturities of all such securities are reported in earnings and computed using the specific identification cost method. Realized gains or losses and charges for other-than-temporary declines in value, if any, on available-for-sale securities are reported in Interest and other income (expense), net as incurred. We periodically evaluate these investments for other-than-temporary impairment.
Foreign currency
For our international subsidiaries where the U.S. dollar is the functional currency, we analyze on an annual basis or more often if necessary, if a significant change in facts and circumstances indicate that the primary economic currency has changed. Adjustments from translating certain European and Asia Pacific subsidiaries’ financial statements from the local currency to the U.S. dollar are recorded as a separate component of accumulated other comprehensive income (loss), net in the stockholders’ equity section of the Consolidated Balance Sheet. This foreign currency translation adjustment reflects the translation of the balance sheet at period end exchange rates, and the income statement at an average exchange rate in effect during the period. As of
December 31, 2014
and
2013
, there were no material amounts in accumulated other comprehensive income, net related to the translation of our foreign subsidiaries’ financial statements.
Our other international entities operate in a U.S. dollar functional currency environment, and therefore, the foreign currency assets and liabilities are remeasured into the U.S. dollar at current exchange rates except for non-monetary assets and liabilities which are remeasured at historical exchange rates. Revenues and expenses are generally remeasured at an average exchange rate in effect during each period. Gains or losses from foreign currency remeasurement are included in Interest and other income (expense), net. For the year ended
December 31, 2014
, we had foreign currency net losses of
$3.8 million
. For year ended December 31, 2013, foreign currency gains and losses were not significant.
Certain risks and uncertainties
Our operating results depend to a significant extent on our ability to market and develop our products. The life cycles of our products are difficult to estimate due, in part, to the effect of future product enhancements and competition. Our inability to successfully develop and market our products as a result of competition or other factors would have a material adverse effect on our business, financial condition and results of operations.
Our cash and investments are held primarily by
two
financial institutions. Financial instruments which potentially expose us to concentrations of credit risk consist primarily of cash equivalents, marketable securities and accounts receivable. We invest excess cash primarily in money market funds of major financial institutions, U.S. government agencies, U.S. dollar dominated foreign corporate bonds and domestic corporate bonds. If the carrying value of our investments exceeds the fair value, and the
65
ALIGN TECHNOLOGY, INC. AND SUBSIDIARIES
NOTES TO CONSOLIDATED FINANCIAL STATEMENTS—(Continued)
decline in fair value is deemed to be other-than-temporary, we will be required to write down the value of our investments, which could materially harm our results of operations and financial condition. Moreover, the performance of certain securities in our investment portfolio correlates with the credit condition of the U.S. economy. We provide credit to customers in the normal course of business. Collateral is not required for accounts receivable, but ongoing evaluations of customers’ credit worthiness are performed. We maintain reserves for potential credit losses and such losses have been within management’s expectations. No individual customer accounted for 10% or more of our accounts receivable at
December 31, 2014
or
2013
, or net revenues for the year ended
December 31, 2014
,
2013
, or
2012
.
In the U.S., the Food and Drug Administration (“FDA”) regulates the design, manufacture, distribution, pre-clinical and clinical study, clearance and approval of medical devices. Products developed by us may require approvals or clearances from the FDA or other international regulatory agencies prior to commercialized sales. There can be no assurance that our products will receive any of the required approvals or clearances. If we were denied approval or clearance or such approval was delayed, it may have a material adverse impact on us.
We have manufacturing operations located outside the U.S. We currently rely on our manufacturing facility in Costa Rica to prepare digital treatment plans using a sophisticated, internally developed computer-modeling program. In addition, we manufacture our clear aligners and distribute our intra-oral scanners at our facility in Juarez, Mexico, and we produce our handheld scanner wand in Or Yehuda, Israel. Our reliance on international operations exposes us to related risks and uncertainties, including difficulties in staffing and managing international operations such as hiring and retaining qualified personnel; controlling production volume and quality of manufacture; political, social and economic instability, particularly as a result of increased levels of violence in Juarez, Mexico and Israel; interruptions and limitations in telecommunication services; product and material transportation delays or disruption; trade restrictions and changes in tariffs; import and export license requirements and restrictions; fluctuations in foreign currency exchange rates; and potential adverse tax consequences. If any of these risks materialize, our international manufacturing operations, as well as our operating results, may be harmed.
We purchase certain inventory from sole suppliers. Additionally, we rely on a limited number of hardware manufacturers. The inability of any supplier or manufacturer to fulfill our supply requirements could materially and adversely impact our future operating results.
Inventories
Inventories are valued at the lower of cost or market, with cost computed using either standard cost (which approximates actual cost) or average and actual cost on a first-in-first-out basis. Excess and obsolete inventories are determined primarily based on future demand forecasts, and write-downs of excess and obsolete inventories are recorded as a component of cost of revenues.
Property, plant and equipment
Property, plant and equipment are stated at historical cost less accumulated depreciation and amortization. Depreciation and amortization are computed using the straight-line method over the estimated useful lives of the assets, generally
three
to
ten
years. We amortize leasehold improvements over the shorter of the remaining lease term or the estimated useful lives of the assets. We depreciate buildings over periods up to
20
years. Land is not depreciated. Construction in progress ("CIP") is related to the construction or development of property (including land) and equipment that have not yet been placed in service for their intended use. Upon sale or retirement, the asset’s cost and related accumulated depreciation are removed from the general ledger and any related gains or losses are reflected in operating expenses. Maintenance and repairs are expensed as incurred.
Goodwill and finite-lived acquired intangible assets
Goodwill represents the excess of the purchase price paid over the fair value of tangible and identifiable intangible net assets acquired in business combinations and is allocated to the respective reporting units based on relative synergies generated.
Our intangible assets primarily consist of intangible assets acquired as part of the Cadent acquisition. These assets are amortized using the straight-line method over their estimated useful lives ranging from
one
to
fifteen
years, reflecting the period in which the economic benefits of the assets are expected to be realized.
Impairment of goodwill and long-lived assets
Goodwill
66
ALIGN TECHNOLOGY, INC. AND SUBSIDIARIES
NOTES TO CONSOLIDATED FINANCIAL STATEMENTS—(Continued)
We evaluate goodwill for impairment at least annually on November 30th or more frequently if indicators are present, an event occurs or circumstances changes that suggest an impairment may exist and that it would more likely than not reduce the fair value of a reporting unit below its carrying amount. The allocation of goodwill to the respective reporting unit is based on relative synergies generated as a result of an acquisition.
We perform an initial assessment of qualitative factors to determine whether the existence of events and circumstances leads to a determination that it is more likely than not that the fair value of a reporting unit is less than its carrying amount. In performing the qualitative assessment, we identify and consider the significance of relevant key factors, events, and circumstances that affect the fair value of our reporting units. These factors include external factors such as macroeconomic, industry, and market conditions, as well as entity-specific factors, such as our actual and planned financial performance. We also give consideration to the difference between the reporting unit fair value and carrying value as of the most recent date a fair value measurement was performed. If, after assessing the totality of relevant events and circumstances, we determine that it is more likely than not that the fair value of the reporting unit exceeds its carrying value and there is no indication of impairment, no further testing is performed; however, if we conclude otherwise, the first step of the two-step impairment test is performed by estimating the fair value of the reporting unit and comparing it with its carrying value, including goodwill.
Step one of the goodwill impairment test consists of a comparison of the fair value of a reporting unit against its carrying amount, including the goodwill allocated to each reporting unit. We determine the fair value of our reporting units based on the present value of estimated future cash flows under the income approach of the reporting units as well as various price or market multiples applied to the reporting unit's operating results along with the appropriate control premium under the marketing approach, both of which are classified as level 3 within the fair value hierarchy (as described in Note 2 in our consolidated financial statements). If the carrying amount of the reporting unit is in excess of its fair value, step two requires the comparison of the implied fair value of the reporting unit’s goodwill against the carrying amount of the reporting unit’s goodwill. Any excess of the carrying value of the reporting unit’s goodwill over the implied fair value of the reporting unit’s goodwill is recorded as an impairment loss.
During March 2013, changes in the competitive environment for intra-oral scanners, including announcements from our competitors of new low-priced scanners targeted at orthodontists and general practitioner dentists ("GPs") in North America, caused us to lower our expectations for growth and profitability for our Scanner reporting unit. As a result, we determined that goodwill related only to our Scanner reporting unit should be tested for impairment as of March 31, 2013 due to these facts and circumstances which would more likely than not reduce the fair value of our Scanner reporting unit below its carrying amount. There was no triggering event related to the Clear Aligner goodwill. Refer to Note 5 for details of the impairment analysis.
The remaining goodwill is entirely attributable to our Clear Aligner reporting unit. During the fourth quarter of fiscal 2014, we performed the annual goodwill impairment testing using the qualitative approach discussed above and found no impairment as the fair value of our Clear Aligner reporting unit was significantly in excess of the carrying value.
Finite-lived intangible assets and long-lived assets
We evaluate long-lived assets (including finite-lived intangible assets) for impairment whenever events or changes in circumstances indicate that the carrying amount of an asset group may not be recoverable. An asset or asset group is considered impaired if its carrying amount exceeds the future undiscounted net cash flows the asset or asset group is expected to generate. If an asset or asset group is considered to be impaired, the impairment to be recognized is calculated as the amount by which the carrying amount of the asset or asset group exceeds its fair market value. Our estimates of future cash flows attributable to our long-lived assets require significant judgment based on our historical and anticipated results and are subject to many factors. Factors we consider important which could trigger an impairment review include significant negative industry or economic trends, significant loss of customers and changes in the competitive environment. In 2013, we used a DCF approach, utilizing harvest model, to estimate the fair value of a reporting unit, which we believe is the most reliable indicator of fair value of a business, and is most consistent with the approach of a marketplace participant would use. The estimation of fair value utilizing a DCF approach includes numerous uncertainties which require our significant judgment when making assumptions of expected growth rates and the selection of discount rates, as well as assumptions regarding general economic and business conditions, and the structure that would yield the highest economic value, among other factors. Key assumptions used in measuring the fair values of Scanner reporting unit included the discount rate (based on the weighted-average cost of capital) and revenue growth. The fair value of Scanner’s trademark was determined using a risk-adjusted DCF model under the relief-from-royalty method. The royalty
67
ALIGN TECHNOLOGY, INC. AND SUBSIDIARIES
NOTES TO CONSOLIDATED FINANCIAL STATEMENTS—(Continued)
rate used was based on a consideration of market rates. The fair value of Scanner’s finite-lived customer relationships was determined using a DCF model under the multi-period excess earnings method. We recorded a long-lived asset impairment in the quarter ended March 31, 2013 due to changes in the competitive environment for our intra-oral scanners, including announcements from our competitors of new low-priced scanners targeted at orthodontists and general practitioner dentists in North America. There was no triggering event related to the Clear Aligner asset group. Refer to Note 5 for details of the impairment analysis.
There were no further triggering events in 2014 that would cause further impairments of our long-lived assets.
Development costs for internal use software
Internally developed software includes enterprise-level business software that we are customizing to meet our specific operational needs. Such capitalized costs include external direct costs utilized in developing or obtaining the applications and payroll and payroll-related costs for employees, who are directly associated with the development of the applications. In 2014, we started an enterprise resource planning ("ERP") project which we have capitalized
$2.6 million
of costs as of December 31, 2014 which is included in construction in progress ("CIP"). When the ERP is placed into production, these costs will be amortized over
10
years. Internal development costs for internal use software for 2013 were not material.
The costs to develop software that is marketed externally have not been capitalized as we believe our current software development process is essentially completed concurrent with the establishment of technological feasibility. As such, all related software development costs are expensed as incurred and included in research and development expense in our consolidated statement of operations.
Product Warranty
Clear Aligner
We warrant our Invisalign products against material defects until the Invisalign case is complete. We accrue for warranty costs in cost of net revenues upon shipment of products. The amount of accrued estimated warranty costs is primarily based on historical experience as to product failures as well as current information on replacement costs. Actual warranty costs could differ materially from the estimated amounts. We regularly review the accrued balances and update these balances based on historical warranty cost trends.
Scanners and Services
We warrant our intra-oral scanners for a period of
one
year, which include materials and labor. We accrue for these warranty costs based on average historical repair costs. An extended warranty may be purchased for additional fees.
Allowance for Doubtful Accounts and Returns
We maintain allowances for doubtful accounts, for customers that are not able to make payments, and for sales returns. We periodically review these allowances, including an analysis of the customers’ payment history and information regarding the customers’ creditworthiness, as well as historical sales returns as a percentage of revenue. Actual write-offs have not materially differed from the estimated allowance.
Revenue Recognition
We measure and allocate revenue according to the accounting guidance for multiple-deliverable revenue arrangements in Accounting Standards Update (“ASU”) 2009-13,
Multiple-Deliverable Revenue Arrangements-a consensus of the Financial Accounting Standard Board (“FASB”) Emerging Issues Task Force
.
Multiple-Element Arrangements (“MEAs”):
Arrangements with customers may include multiple deliverables, including any combination of products/equipment and services. The deliverables included in the MEAs are separated into more than one unit of accounting when (i) the delivered product/equipment has value to the customer on a stand-alone basis, and (ii) delivery of the undelivered service element(s) is probable and substantially in our control. Arrangement consideration is then allocated to each unit, delivered or undelivered, based on the relative selling price (“RSP”) of each unit of accounting based first on vendor-specific objective evidence (“VSOE”) if it exists, second on third-party evidence (“TPE”) if it exists, and on best estimated selling price (“BESP”) if neither VSOE or TPE exist.
68
ALIGN TECHNOLOGY, INC. AND SUBSIDIARIES
NOTES TO CONSOLIDATED FINANCIAL STATEMENTS—(Continued)
|
•
|
VSOE – In most instances, products are sold separately in stand-alone arrangements. Services are also sold separately through renewals of contracts with varying periods. We determine VSOE based on its pricing and discounting practices for the specific product or service when sold separately, considering geographical, customer, and other economic or marketing variables, as well as renewal rates or stand-alone prices for the service element(s).
|
|
•
|
TPE – If we cannot establish VSOE of selling price for a specific product or service included in a multiple-element arrangement, we use third-party evidence of selling price. We determine TPE based on sales of comparable amount of similar products or service offered by multiple third parties considering the degree of customization and similarity of product or service sold.
|
|
•
|
BESP – The best estimated selling price represents the price at which we would sell a product or service if it were sold on a stand-alone basis. When VSOE or TPE do not exist for all elements, we determine BESP for the arrangement element based on sales, cost and margin analysis, as well as other inputs based on its pricing practices. Adjustments for other market and Company-specific factors are made as deemed necessary in determining BESP
.
|
Provisions for discounts and rebates to customers are provided for in the same period that the related product sales are recorded based upon historical discounts and rebates.
Clear Aligner
We enter into arrangements (“treatment plans”) that involve multiple future product deliverables. Invisalign Full, Invisalign Teen, and Invisalign Assist include up to three optional case refinements. Case refinement is a finishing tool used to adjust a patient's teeth to the desired final position. Case refinement may be elected by the dental professional at any time during treatment however it is generally ordered in the last stages of orthodontic treatment. Beginning June 15, 2013, Invisalign Full and Invisalign Teen also include up to three optional mid-course corrections. Mid-course correction is a treatment adjustment during active treatment if the case is not tracking to the original treatment plan or goals. Mid-course correction gives doctors the ability to "adjust course' based on the needs of the individual patient. Invisalign Teen also includes up to six optional replacement aligners in the price of the product and may be ordered any time throughout treatment.
We determined that our treatment plans, except Invisalign Assist with progress tracking, comprise the following deliverables which also represent separate units of accounting: single-batched aligners, case refinement, mid-course correction and replacement aligners. We allocate revenue for each treatment plan based on each unit's relative selling price based on BESP and recognize the revenue upon the delivery of each unit in the treatment plan. We regularly review our estimates of selling price and maintain internal controls over the establishment and update of these estimates.
For Invisalign Assist with the progress tracking feature, aligners and services are provided to the dental professional every nine stages (“a batch”). We estimate the number of batches which are expected to be shipped for each case based upon our historical experience. The amounts allocated to this deliverable are recognized on a prorated basis as each batch is shipped.
Prior to 2013, the Vivera Retainer included four shipments per year, and revenue was recognized ratably as each shipment occurred. In the first quarter of 2013, we consolidated Vivera Retainer product shipments down to one shipment per year.
Scanners and Services
We recognize revenues from the sales of iTero intra-oral scanners and CAD/CAM services. CAD/CAM services include scanning services, extended warranty for the intra-oral scanners, a range of iTero restorative services, and OrthoCAD services such as OrthoCAD iRecord. We sell intra-oral scanners and services through both our direct sales force and distribution partners. The intra-oral scanner sales price includes one year of warranty, and for additional fees, the customer may select an unlimited scanning service agreement over a fixed period of time or extended warranty periods. Revenue is recognized when persuasive evidence of the arrangement exists, the price is fixed or determinable, collectability is reasonably assured, title and risk of loss has passed to customers based on the shipping terms, no significant obligations remain, and allowances for discounts, returns, and customer incentives can be reliably estimated. When intra-oral scanners are sold with either an unlimited scanning service agreement and/or extended warranty, we allocate revenue based on each element's relative selling price. We estimate the selling price of each element, as if it is sold on a stand-alone basis, taking into consideration historical prices as well as our discounting strategies. Scanner revenue, net of related discounts and allowances, is recognized when products or equipment have been shipped, installed and on-site training completed. For certain distributors who provide installation and training to the
69
ALIGN TECHNOLOGY, INC. AND SUBSIDIARIES
NOTES TO CONSOLIDATED FINANCIAL STATEMENTS—(Continued)
customer, we recognize scanner revenue when the intra-oral scanner is shipped to the distributor assuming all of the other revenue recognition criteria have been met.
Discounts are deducted from revenue at the time of sale or when the discount is offered, whichever is later, and free cases or training is included as a deliverable in the multiple-element arrangement assessment. Returns of products, excluding warranty related returns, are infrequent and insignificant.
Service revenue, including iTero restorative and all OrthoCAD services are recognized upon delivery or ratably over the contract term as the specified services are performed. If a customer selects a pay per use basis for scanning service fees, the revenue is recognized as the service is provided.
We offer customers an option to purchase extended warranties on certain products. We recognize revenue on these extended warranty contracts ratably over the life of the contract. The costs associated with these extended warranty contracts are recognized when incurred.
Shipping and Handling Costs
Shipping and handling charges to customers are included in net revenues, and the associated costs incurred are recorded in cost of revenues.
Legal Proceedings and Litigations
We are involved in legal proceedings on an ongoing basis. If we believe that a loss arising from such matters is probable and can be reasonably estimated, we accrue the estimated liability in our financial statements. If only a range of estimated losses can be determined, we accrue an amount within the range that, in our judgment, reflect the most likely outcome; if none of the estimates within that range is a better estimate than any other amount, we accrue the low end of the range.
Research and development
Research and development expense is expensed as incurred and includes the costs associated with the research and development of new products and enhancements to existing products. These costs primarily include compensation costs, including stock-based compensation expense, outside consulting expenses, costs associated with conducting clinical and pre-commercialization trial and testing, allocations of corporate overhead expenses including facilities and IT costs, equipment costs and depreciation and amortization.
Advertising costs
The cost of advertising and media is expensed as incurred. For the year ended
December 31, 2014
,
2013
and
2012
advertising costs totaled
$26.9 million
,
$26.0 million
and
$23.6 million
, respectively.
Common stock repurchase
We repurchase our own common stock from time to time in the open market when our Board of Directors approve a stock repurchase program. We account for these repurchases under the accounting guidance for equity where we allocate the total repurchase value that are in excess over par between additional paid in capital and retained earnings. All shares repurchased are retired.
Operating leases
We currently lease office spaces, automobiles and equipment under operating leases with original lease periods of up to
9
years. Certain of these leases have free or escalating rent payment provisions and lease incentives provided by the landlord. We recognize rent expense under such leases on a straight-line basis over the term of the lease as certain leases have adjustments for market provisions.
70
ALIGN TECHNOLOGY, INC. AND SUBSIDIARIES
NOTES TO CONSOLIDATED FINANCIAL STATEMENTS—(Continued)
Income taxes
We make certain estimates and judgments in determining income tax expense for financial statement purposes. These estimates and judgments occur in the calculation of certain tax assets and liabilities, which arise from differences in the timing of recognition of revenue and expense for tax and financial statement purposes.
As part of the process of preparing our Consolidated Financial Statements, we are required to estimate our income taxes in each of the jurisdictions in which we operate. This process involves us estimating our current tax exposure under the applicable tax laws and assessing temporary differences resulting from differing treatment of items for tax and accounting purposes. These differences result in deferred tax assets and liabilities, which are included in our Consolidated Balance Sheets.
We account for uncertainty in income taxes pursuant to authoritative guidance based on a two-step approach to recognize and measure uncertain tax positions taken or expected to be taken in a tax return. The first step is to determine if the weight of available evidence indicates that it is more likely than not that the tax position will be sustained on audit based on its technical merits, including resolution of any related appeals or litigation processes. The second step is to measure the tax benefit as the largest amount that is more than 50% likely to be realized upon ultimate settlement. We adjust reserves for our uncertain tax positions due to changing facts and circumstances, such as the closing of a tax audit, or refinement of estimates due to new information. To the extent that the final outcome of these matters is different than the amounts recorded, such differences will impact our tax provision in our Consolidated Statements of Operations in the period in which such determination is made.
We assess the likelihood that we will be able to realize our deferred tax assets. Should there be a change in our ability to realize our deferred tax assets, our tax provision would increase in the period in which we determine that it is more likely than not that we cannot realize our deferred tax assets. We consider all available evidence, both positive and negative, including historical levels of income, expectations and risks associated with estimates of future taxable income and ongoing prudent and feasible tax planning strategies in assessing the need for a valuation allowance. If it is more likely than not that we will not realize our deferred tax assets, we will increase our provision for taxes by recording a valuation allowance against the deferred tax assets that we estimate will not ultimately be realizable. The available positive evidence at
December 31, 2014
included historical operating profits and a projection of future income sufficient to realize most of our remaining deferred tax assets. As of
December 31, 2014
, it was considered more likely than not that our deferred tax assets would be realized with the exception of certain foreign loss carryovers as we are unable to forecast sufficient future profits to realize the deferred tax assets.
As of
December 31, 2014
, U.S. income taxes and foreign withholding taxes associated with the repatriation of undistributed earnings of foreign subsidiaries were not provided for on a cumulative total of
$260.9 million
. We intend to reinvest these earnings indefinitely in our foreign subsidiaries. If these earnings were distributed in the form of dividends or otherwise, or if the shares of the relevant foreign subsidiaries were sold or otherwise transferred, we would be subject to additional U.S. income taxes subject to an adjustment for foreign tax credit, and foreign withholding taxes. Determination of the amount of unrecognized deferred income tax liability related to these earnings is not practicable.
Accounting guidance for stock-based compensation prohibits recognition of a deferred income tax asset for excess tax benefits due to stock option exercises that have not yet been realized through a reduction in income taxes payable. We follow the tax law ordering method to determine when excess tax benefits have been realized and consider only the direct impacts of awards when calculating the amount of windfalls or shortfalls.
Stock-based compensation
We recognize stock-based compensation cost for only those shares ultimately expected to vest on a straight-line basis over the requisite service period of the award. We use the Black-Scholes option pricing model to determine the fair value of stock options and employee stock purchase plan shares. We estimate the fair value of market-performance based restricted stock units using a Monte Carlo simulation model which requires the input of assumptions, including expected term, stock price volatility and the risk-free rate of return. In addition, judgment is also required in estimating the number of stock-based awards that are expected to be forfeited. Forfeitures are estimated based on historical experience at the time of grant and revised, if necessary, in subsequent periods if actual forfeitures differ from those estimates. The assumptions used in calculating the fair value of share-based payment awards represent management’s best estimates, but these estimates involve inherent uncertainties and the application of management’s judgment. As a result, if factors change and we use different assumptions, our stock-based compensation expense could be materially different in the future.
71
ALIGN TECHNOLOGY, INC. AND SUBSIDIARIES
NOTES TO CONSOLIDATED FINANCIAL STATEMENTS—(Continued)
Consolidation of Variable Interest Entities
For an entity in which we have variable interests, we focus on identifying which entity has the power to direct the activities that most significantly impact the variable interest entity’s economic performance and which enterprise has the obligation to absorb losses or the right to receive benefits from the variable interest entity. If we are the primary beneficiary of a variable interest entity, the assets, liabilities, and results of operations of the variable interest entity will be included in our Consolidated Financial Statements. For fiscal year 2014, 2013 and 2012, we did not have any material variable interest entities and did not consolidate any variable interest entities, because we are not a primary beneficiary.
Medical Device Excise Taxes
In accordance with the Patient Protection and Affordable Care Act, effective January 1, 2013, we began to incur an excise tax on sales of medical devices in the U.S. In March 2014, we were informed by IRS that our aligners are not subject to the medical device excise tax ("MDET") which we had been paying and expensing in general and administrative expenses in the consolidated statements of operations since January 1, 2013; however, our scanners are still subject to the MDET. Beginning in March 2014, we ceased expensing and paying the MDET for aligners. We are currently in process of claiming a
$6.8 million
refund of MDET paid in 2013 related to our aligners; however, because this claim is subject to review and approval by the IRS, we have not recorded a receivable as the outcome of the audit is uncertain. Any future changes in the applicability of the MDET as it applies to us or refunds of amounts previously paid will be recorded as an additional expense or a credit to the consolidated statement of operations in the period in which is becomes probable and reasonably estimable.
Comprehensive income
Comprehensive income includes all changes in equity during a period from non-owner sources. Comprehensive income, including unrealized gains and losses on available-for-sale securities and foreign currency translation adjustments, are reported net of their related tax effect.
Recent Accounting Pronouncements
In May 2014, the Financial Accounting Standards Board ("FASB") issued Accounting Standards Update ("ASU") 2014-09, “Revenue from Contracts with Customers,” requiring an entity to recognize the amount of revenue to which it expects to be entitled for the transfer of promised goods or services to customers. The updated standard will replace most existing revenue recognition guidance in U.S. GAAP when it becomes effective and permits the use of either the retrospective or cumulative effect transition method. Early adoption is not permitted. The updated standard becomes effective for us in the first quarter of fiscal 2017. We have not yet selected a transition method and we are currently evaluating the effect that the updated standard will have on our consolidated financial statements and related disclosures.
As of
December 31, 2014
and
2013
, the estimated fair value of our short-term and long-term investments, classified as available for sale, are as follows (in thousands):
Short-term
72
ALIGN TECHNOLOGY, INC. AND SUBSIDIARIES
NOTES TO CONSOLIDATED FINANCIAL STATEMENTS—(Continued)
|
December 31, 2014
|
Amortized
Cost
|
Gross
Unrealized
Gains
|
Gross
Unrealized
Losses
|
Fair
Value
|
|||||||||||
|
Commercial paper
|
$
|
33,998
|
|
$
|
—
|
|
$
|
—
|
|
$
|
33,998
|
|
|||
|
Corporate bonds
|
152,055
|
|
27
|
|
(116
|
)
|
151,966
|
|
|||||||
|
U.S. dollar dominated foreign corporate bonds
|
901
|
|
—
|
|
—
|
|
901
|
|
|||||||
|
Municipal securities
|
9,147
|
|
13
|
|
—
|
|
9,160
|
|
|||||||
|
U.S. government agency bonds
|
41,574
|
|
14
|
|
(1
|
)
|
41,587
|
|
|||||||
|
U.S. government treasury bonds
|
15,770
|
|
7
|
|
—
|
|
15,777
|
|
|||||||
|
Certificates of Deposit
|
1,398
|
|
—
|
|
—
|
|
1,398
|
|
|||||||
|
Total Marketable Securities, Short-Term
|
$
|
254,843
|
|
$
|
61
|
|
$
|
(117
|
)
|
$
|
254,787
|
|
|||
Long-term
|
December 31, 2014
|
Amortized
Cost
|
Gross
Unrealized
Gains
|
Gross
Unrealized
Losses
|
Fair
Value
|
|||||||||||
|
U.S. government agency bonds
|
$
|
48,233
|
|
$
|
12
|
|
$
|
(28
|
)
|
$
|
48,217
|
|
|||
|
Corporate bonds
|
57,195
|
|
6
|
|
(112
|
)
|
57,089
|
|
|||||||
|
U.S. dollar dominated foreign corporate bonds
|
523
|
|
—
|
|
(2
|
)
|
521
|
|
|||||||
|
U.S. government treasury bonds
|
20,814
|
|
5
|
|
(6
|
)
|
20,813
|
|
|||||||
|
Municipal securities
|
9,552
|
|
5
|
|
(6
|
)
|
9,551
|
|
|||||||
|
Asset-backed securities
|
11,713
|
|
—
|
|
(12
|
)
|
11,701
|
|
|||||||
|
Total Marketable Securities, Long-Term
|
$
|
148,030
|
|
$
|
28
|
|
$
|
(166
|
)
|
$
|
147,892
|
|
|||
Short-term
|
December 31, 2013
|
Amortized
Cost
|
Gross
Unrealized
Gains
|
Gross
Unrealized
Losses
|
Fair Value
|
|||||||||||
|
Commercial paper
|
$
|
54,318
|
|
$
|
10
|
|
$
|
—
|
|
$
|
54,328
|
|
|||
|
Corporate bonds
|
29,079
|
|
10
|
|
(4
|
)
|
29,085
|
|
|||||||
|
U.S. dollar dominated foreign corporate bonds
|
13,959
|
|
12
|
|
—
|
|
13,971
|
|
|||||||
|
Municipal securities
|
7,006
|
|
11
|
|
(3
|
)
|
7,014
|
|
|||||||
|
U.S. government agency bonds
|
16,693
|
|
10
|
|
—
|
|
16,703
|
|
|||||||
|
Asset-backed securities
|
5,937
|
|
2
|
|
—
|
|
5,939
|
|
|||||||
|
Total Marketable Securities, Short-Term
|
$
|
126,992
|
|
$
|
55
|
|
$
|
(7
|
)
|
$
|
127,040
|
|
|||
Long-term
|
December 31, 2013
|
Amortized
Cost
|
Gross
Unrealized
Gains
|
Gross
Unrealized
Losses
|
Fair Value
|
|||||||||||
|
U.S. government agency bonds
|
$
|
38,138
|
|
$
|
1
|
|
$
|
(21
|
)
|
$
|
38,118
|
|
|||
|
Corporate bonds
|
23,308
|
|
14
|
|
(9
|
)
|
23,313
|
|
|||||||
|
U.S. dollar dominated foreign corporate bonds
|
19,485
|
|
27
|
|
(17
|
)
|
19,495
|
|
|||||||
|
U.S. government treasury bonds
|
6,916
|
|
3
|
|
—
|
|
6,919
|
|
|||||||
|
Municipal securities
|
8,326
|
|
13
|
|
(8
|
)
|
8,331
|
|
|||||||
|
Asset-backed securities
|
5,800
|
|
4
|
|
(2
|
)
|
5,802
|
|
|||||||
|
Total Marketable Securities, Long-Term
|
$
|
101,973
|
|
$
|
62
|
|
$
|
(57
|
)
|
$
|
101,978
|
|
|||
73
ALIGN TECHNOLOGY, INC. AND SUBSIDIARIES
NOTES TO CONSOLIDATED FINANCIAL STATEMENTS—(Continued)
For the year ended
December 31, 2014
and
2013
, realized losses were immaterial. Cash and cash equivalents were not included in the table above as the gross unrealized gains and losses were not material. We have no material short-term or long-term investments that have been in continuous unrealized loss positions for greater than twelve months as of
December 31, 2014
. Amounts reclassified to earnings from unrealized gain or losses were immaterial in
2014
and
2013
.
Our fixed-income securities investment portfolio consists of corporate bonds, U.S. dollar dominated foreign corporate bonds, commercial paper, municipal securities, U.S. government agency bonds and asset-backed securities that have a maximum maturity of
two
years. The securities that we invest in are generally deemed to be low risk based on their credit ratings from the major rating agencies. The longer the duration of these securities, the more susceptible they are to changes in market interest rates and bond yields. As interest rates increase, those securities purchased at a lower yield show a mark-to-market unrealized loss. The unrealized losses are due primarily to changes in credit spreads and interest rates. We expect to realize the full value of all these investments upon maturity or sale. The weighted average remaining duration of these securities was approximately
10 months
and
11 months
as of
December 31, 2014
and 2013, respectively.
As the carrying value approximates the fair value for our short-term and long-term marketable securities shown in the tables above, the following table summarizes the fair value of our short-term and long-term marketable securities classified by maturity as of
December 31, 2014
and
2013
(in thousands):
|
December 31,
|
December 31,
|
|||||||
|
2014
|
2013
|
|||||||
|
One year or less
|
$
|
254,787
|
|
$
|
127,040
|
|
||
|
Due in greater than one year
|
147,892
|
|
101,978
|
|
||||
|
Total available for short-term and long-term marketable securities
|
$
|
402,679
|
|
$
|
229,018
|
|
||
Fair Value Measurements
We measure the fair value of our cash equivalents and marketable securities as the price that would be received from selling an asset or paid to transfer a liability in an orderly transaction between market participants at the measurement date. We use the U.S. GAAP fair value hierarchy that prioritizes the inputs to valuation techniques used to measure fair value. This hierarchy requires an entity to maximize the use of observable inputs and minimize the use of unobservable inputs when measuring fair value. The three levels of inputs that may be used to measure fair value:
Level 1
—Quoted (unadjusted) prices in active markets for identical assets or liabilities.
Our Level 1 assets consist of money market funds and U.S government treasury bonds. We did not hold any Level 1 liabilities as of
December 31, 2014
or
2013
.
Level 2
—Observable inputs other than quoted prices included in Level 1, such as quoted prices for similar assets or liabilities in active markets; quoted prices for identical or similar assets or liabilities in markets that are not active; or other inputs that are observable or can be corroborated by observable market data for substantially the full term of the asset or liability.
Our Level 2 assets consist of commercial paper, corporate bonds, U.S. dollar denominated foreign corporate bonds, municipal securities, U.S. government agency bonds, certificate of deposits, asset-backed securities, and our Israeli funds that are mainly invested in insurance policies. We obtain these fair values for level 2 investments from our asset manager for each of our portfolios. Our custody bank and asset managers independently use professional pricing services to gather pricing data which may include quoted market prices for identical or comparable financial instruments, or inputs other than quoted prices that are observable either directly or indirectly, and we are ultimately responsible for these underlying estimates.
We did not hold any Level 2 liabilities as of
December 31, 2014
or
2013
.
Level 3
—Unobservable inputs to the valuation methodology that are supported by little or no market activity and that are significant to the measurement of the fair value of the assets or liabilities. Level 3 assets and liabilities include those whose fair value measurements are determined using pricing models, discounted cash flow ("DCF") methodologies or similar valuation techniques, as well as significant management judgment or estimation.
We did not hold any Level 3 assets or liabilities as of
December 31, 2014
or
2013
.
74
ALIGN TECHNOLOGY, INC. AND SUBSIDIARIES
NOTES TO CONSOLIDATED FINANCIAL STATEMENTS—(Continued)
Non-Recurring Fair Value Measurements
During 2013, we recorded an impairment charge to our long-lived assets and goodwill of
$26.3 million
and
$40.7 million
, respectively, related to our Scanner and Services ("Scanner") reporting unit as a triggering event occurred and circumstances changed that led us to perform an impairment analysis prior to our annual test which required us to determine the fair value of the Scanner reporting unit (Refer to Note 5). These fair value measurements were calculated using unobservable inputs, using the income approach which is classified as Level 3 within the fair value hierarchy. Inputs for the income approach includes the amount and timing of future cash flows based on our most recent operational budgets, strategic plans, terminal growth rates assumptions and other estimates.
The following tables summarizes our financial assets measured at fair value on a recurring basis as of
December 31, 2014
and
2013
(in thousands):
|
Description
|
Balance as of
December 31, 2014
|
Quoted Prices in
Active Markets for
Identical Assets
(Level 1)
|
Significant Other
Observable Inputs
(Level 2)
|
||||||||
|
Cash equivalents:
|
|||||||||||
|
Money market funds
|
$
|
80,786
|
|
$
|
80,786
|
|
$
|
—
|
|
||
|
Commercial paper
|
21,997
|
|
—
|
|
21,997
|
|
|||||
|
Corporate bonds
|
1,745
|
|
—
|
|
1,745
|
|
|||||
|
Short-term investments:
|
|||||||||||
|
Commercial paper
|
33,998
|
|
—
|
|
33,998
|
|
|||||
|
Corporate bonds
|
151,966
|
|
—
|
|
151,966
|
|
|||||
|
U.S. dollar denominated foreign corporate bonds
|
901
|
|
—
|
|
901
|
|
|||||
|
Municipal securities
|
9,160
|
|
—
|
|
9,160
|
|
|||||
|
U.S. government agency bonds
|
41,587
|
|
—
|
|
41,587
|
|
|||||
|
U.S. government treasury bonds
|
15,777
|
|
15,777
|
|
—
|
|
|||||
|
Certificate of Deposits
|
1,398
|
|
—
|
|
1,398
|
|
|||||
|
Long-term investments:
|
|||||||||||
|
Corporate bonds
|
57,089
|
|
—
|
|
57,089
|
|
|||||
|
U.S. government agency bonds
|
48,217
|
|
—
|
|
48,217
|
|
|||||
|
U.S. dollar denominated foreign corporate bonds
|
521
|
|
—
|
|
521
|
|
|||||
|
U.S. government treasury bonds
|
20,813
|
|
20,813
|
|
—
|
|
|||||
|
Municipal securities
|
9,551
|
|
—
|
|
9,551
|
|
|||||
|
Asset-backed securities
|
11,701
|
|
—
|
|
11,701
|
|
|||||
|
Long-term other assets:
|
|||||||||||
|
Israeli funds
|
2,307
|
|
—
|
|
2,307
|
|
|||||
|
$
|
509,514
|
|
$
|
117,376
|
|
$
|
392,138
|
|
|||
75
ALIGN TECHNOLOGY, INC. AND SUBSIDIARIES
NOTES TO CONSOLIDATED FINANCIAL STATEMENTS—(Continued)
|
Description
|
Balance as of
December 31, 2013
|
Quoted Prices in
Active Markets for
Identical Assets
(Level 1)
|
Significant Other
Observable Inputs
(Level 2)
|
||||||||
|
Cash equivalents:
|
|||||||||||
|
Money market funds
|
$
|
143,540
|
|
$
|
143,540
|
|
$
|
—
|
|
||
|
Commercial paper
|
15,398
|
|
—
|
|
15,398
|
|
|||||
|
Short-term investments:
|
|||||||||||
|
Commercial paper
|
54,328
|
|
—
|
|
54,328
|
|
|||||
|
Corporate bonds
|
29,085
|
|
—
|
|
29,085
|
|
|||||
|
U.S. dollar denominated foreign corporate bonds
|
13,971
|
|
—
|
|
13,971
|
|
|||||
|
Municipal securities
|
7,014
|
|
—
|
|
7,014
|
|
|||||
|
U.S. government agency bonds
|
16,703
|
|
—
|
|
16,703
|
|
|||||
|
Asset-backed securities
|
5,939
|
|
—
|
|
5,939
|
|
|||||
|
Long-term investments:
|
|||||||||||
|
Corporate bonds
|
23,313
|
|
—
|
|
23,313
|
|
|||||
|
U.S. government agency bonds
|
38,118
|
|
—
|
|
38,118
|
|
|||||
|
U.S. dollar denominated foreign corporate bonds
|
19,495
|
|
—
|
|
19,495
|
|
|||||
|
U.S. government treasury bonds
|
6,919
|
|
6,919
|
|
—
|
|
|||||
|
Municipal securities
|
8,331
|
|
—
|
|
8,331
|
|
|||||
|
Asset-backed securities
|
5,802
|
|
—
|
|
5,802
|
|
|||||
|
Long-term other assets:
|
|||||||||||
|
Israeli funds
|
2,193
|
|
—
|
|
2,193
|
|
|||||
|
$
|
390,149
|
|
$
|
150,459
|
|
$
|
239,690
|
|
|||
Inventories
Inventories consist of the following (in thousands):
|
December 31,
|
|||||||
|
2014
|
2013
|
||||||
|
Raw materials
|
$
|
8,143
|
|
$
|
5,172
|
|
|
|
Work in process
|
2,970
|
|
4,241
|
|
|||
|
Finished goods
|
4,815
|
|
4,555
|
|
|||
|
Total Inventories
|
$
|
15,928
|
|
$
|
13,968
|
|
|
Work in process includes costs to produce our clear aligner and intra-oral scanner products. Finished goods primarily represent our intra-oral scanners and ancillary products that support our clear aligner products.
76
ALIGN TECHNOLOGY, INC. AND SUBSIDIARIES
NOTES TO CONSOLIDATED FINANCIAL STATEMENTS—(Continued)
Property, plant and equipment
Property, plant and equipment consist of the following (in thousands):
|
December 31,
|
||||||||
|
2014
|
2013
|
|||||||
|
Clinical and manufacturing equipment
|
$
|
107,707
|
|
$
|
104,373
|
|
||
|
Computer hardware
|
24,092
|
|
24,851
|
|
||||
|
Computer software
|
22,044
|
|
21,286
|
|
||||
|
Furniture and fixtures
|
7,386
|
|
7,275
|
|
||||
|
Leasehold improvements
|
15,358
|
|
14,996
|
|
||||
|
Building
|
1,868
|
|
1,868
|
|
||||
|
Land
|
1,162
|
|
1,162
|
|
||||
|
CIP
|
18,310
|
|
5,438
|
|
||||
|
Total
|
197,927
|
|
181,249
|
|
||||
|
Less: Accumulated depreciation and amortization and impairment charges
1
|
(107,802
|
)
|
(105,506
|
)
|
||||
|
Total Property, plant and equipment, net
|
$
|
90,125
|
|
$
|
75,743
|
|
||
|
1
|
We recorded an impairment of our long-lived assets in 2013 which was a result of changes in the competitive environment for intra-oral scanners which included announcements of new low-priced scanners targeted at orthodontists and GPs in North America that caused us to lower our expectations for growth and profitability for our Scanner reporting unit. As a result, we determined that the carrying value of the long-lived assets was not recoverable and therefore recorded an impairment charge of
$26.3 million
, of which
$7.0 million
related to property and equipment. Refer to Note 5 for details of the impairment analysis.
|
As of
December 31, 2014
, CIP consists primarily of costs for capital equipment to be placed in service in the next year; however, in late 2014 we started an ERP project and have capitalized
$2.6 million
as of December 31, 2014, which we anticipate will be placed in service in 2016. Depreciation and amortization was
$14.8 million
,
$13.9 million
, and
$13.4 million
, for the year ended
December 31, 2014
, 2013 and 2012, respectively.
Accrued liabilities
Accrued liabilities consist of the following (in thousands):
|
|
December 31,
|
||||||
|
|
2014
|
2013
|
|||||
|
Accrued payroll and benefits
|
$
|
44,610
|
|
$
|
43,029
|
|
|
|
Accrued sales rebate
|
11,110
|
|
10,100
|
|
|||
|
Accrued sales and marketing expenses
|
5,979
|
|
3,893
|
|
|||
|
Accrued accounts payable
|
5,736
|
|
4,053
|
|
|||
|
Accrued sales tax and value added tax
|
5,456
|
|
6,215
|
|
|||
|
Accrued warranty
|
3,148
|
|
3,104
|
|
|||
|
Accrued professional fees
|
2,494
|
|
1,892
|
|
|||
|
Accrued income taxes
|
2,027
|
|
1,205
|
|
|||
|
Other accrued liabilities
|
7,320
|
|
6,854
|
|
|||
|
Total Accrued Liabilities
|
$
|
87,880
|
|
$
|
80,345
|
|
|
Warranty
We regularly review the accrued balances and update these balances based on historical warranty trends. Actual warranty costs incurred have not materially differed from those accrued. However, future actual warranty costs could differ from the estimated amounts.
77
ALIGN TECHNOLOGY, INC. AND SUBSIDIARIES
NOTES TO CONSOLIDATED FINANCIAL STATEMENTS—(Continued)
Clear Aligner
We warrant our Invisalign products against material defects until the Invisalign case is complete. We accrue for warranty costs in cost of net revenues upon shipment of products. The amount of accrued estimated warranty costs is primarily based on historical experience as to product failures as well as current information on replacement costs.
Scanners
We warrant our scanners for a period of
one
year from the date of training and installation. We accrue for these warranty costs which includes materials and labor based on estimated historical repair costs. Extended service packages may be purchased for additional fees.
Warranty accrual as of
December 31, 2014
and
2013
consists of the following activity (in thousands):
|
Warranty accrual, December 31, 2012
|
$
|
4,050
|
|
|
Charged to cost of revenues
|
2,850
|
|
|
|
Actual warranty expenditures
|
(3,796
|
)
|
|
|
Warranty accrual, December 31, 2013
|
3,104
|
|
|
|
Charged to cost of revenues
|
1,990
|
|
|
|
Actual warranty expenditures
|
(1,946
|
)
|
|
|
Warranty accrual, December 31, 2014
|
$
|
3,148
|
|
Cadent
On April 29, 2011, we completed the acquisition of Cadent, a 3D digital scanning solution for orthodontics and dentistry, for an aggregate cash purchase price of approximately
$187.6 million
. We recorded goodwill of
$135.3 million
as a result of the acquisition, which represents the excess of the purchase price over the fair value of the underlying net tangible and identifiable intangible assets, and represents the expected synergies of the transaction and the knowledge and experience of the workforce in place. None of the goodwill is deductible for tax purposes. In connection with the acquisition, we allocated approximately
$77.3 million
of the goodwill from the Cadent acquisition to our Scanner and Services ("Scanner") reporting unit and approximately
$58.0 million
to our Clear Aligner reporting unit based on the expected relative synergies generated by the acquisition. During the third quarter of 2012, we determined that goodwill for our Scanner reporting unit should be tested for impairment between annual impairment tests since an event occurred or circumstances changed that would more likely than not reduce the fair value of our Scanner reporting unit below its carrying amount. We recorded a total impairment charge of
$36.6 million
for the Scanner for 2012 after finalizing step two of our analysis. Further, during March 2013, changes in the competitive environment for intra-oral scanners, including announcements from our competitors of new low-priced scanners targeted at orthodontists and general practitioner dentists in North America, caused us to lower our expectations for growth and profitability for our Scanner reporting unit. As a result, we determined that goodwill related only to our Scanner reporting unit should be tested for impairment as of March 2013 due to these facts and circumstances which would more likely than not reduce the fair value of our Scanner reporting unit below its carrying amount. Based on our analysis, there was no implied goodwill for the Scanner reporting unit; therefore, we recorded a goodwill impairment charge of
$40.7 million
in the three months ended March 31, 2013, which represents the remaining goodwill balance in the Scanner reporting unit. All remaining goodwill from the Cadent acquisition as of
December 31, 2014
is attributable to the Clear Aligner segment. See Note 5 for discussion of our goodwill impairment.
ICA Holdings Pty Limited
On April 30, 2013, we completed the acquisition of ICA Holdings Pty Limited ("ICA") upon the expiration of the distribution agreement between certain subsidiaries of ICA and Align Technology B.V., for a total cash consideration of approximately
$8.6 million
, of which
$7.4 million
was attributed to assets acquired,
$2.4 million
in liabilities assumed and
$3.6 million
to goodwill. Goodwill as a result of this acquisition represents the excess of the purchase price over the fair value of the underlying net assets acquired and represents the knowledge and experience of the workforce in place. None of this goodwill will be deductible for tax
78
ALIGN TECHNOLOGY, INC. AND SUBSIDIARIES
NOTES TO CONSOLIDATED FINANCIAL STATEMENTS—(Continued)
purposes. Under the applicable accounting guidance, goodwill will not be amortized but will be tested for impairment on an annual basis or more frequently if certain indicators are present.
Pro forma results of operations for this acquisition have not been presented as it is not material to our results of operations, either individually or in aggregate, for the year ended
2013
.
Goodwill
The change in the carrying value of goodwill for the year ended
December 31, 2014
by our reportable segments, which are also our reporting units, are as follows (in thousands):
|
Clear Aligner
|
Scanners and
Services
|
Total
|
|||||||||
|
Balance as of December 31, 2012
|
$
|
58,543
|
|
$
|
40,693
|
|
$
|
99,236
|
|
||
|
Goodwill from ICA acquisition
|
3,558
|
|
—
|
|
3,558
|
|
|||||
|
Impairment of goodwill
|
—
|
|
(40,693
|
)
|
(40,693
|
)
|
|||||
|
Adjustments
1
|
(478
|
)
|
—
|
|
(478
|
)
|
|||||
|
Balance as of December 31, 2013
|
61,623
|
|
—
|
|
61,623
|
|
|||||
|
Goodwill from ICA acquisition
|
—
|
|
—
|
|
—
|
|
|||||
|
Adjustments
1
|
(254
|
)
|
—
|
|
(254
|
)
|
|||||
|
Balance as of December 31, 2014
|
$
|
61,369
|
|
$
|
—
|
|
$
|
61,369
|
|
||
|
1
|
The adjustments to goodwill were a result of foreign currency translation.
|
Impairment of Goodwill
We evaluate goodwill for impairment at least annually on November 30th or more frequently if indicators are present, an event occurs or circumstances changes that suggest an impairment may exist and that it would more likely than not reduce the fair value of a reporting unit below its carrying amount. The allocation of goodwill to the respective reporting unit is based on relative synergies generated as a result of an acquisition.
2012 Impairment
During the third quarter of 2012, we determined that the goodwill for our Scanner reporting unit should be tested for impairment between annual impairment tests since an event occurred/circumstances changed that would more likely than not reduce the fair value of our Scanner reporting unit below its carrying amount. These indicators included the termination of an exclusive distribution arrangement with Straumann for iTero intra-oral scanners in Europe, as well as the termination of their non-exclusive distribution arrangement for iTero intra-oral scanners in North America, together with market conditions and business trends within the Scanner reporting unit. While we continued to expect revenue growth in our Scanner business, our expectations for future growth and profitability rates projected for the Scanner reporting unit were lower than our previous estimates primarily driven by overall lower than expected financial results.
As a result, we performed step one analysis for our Scanner reporting unit, which consists of a comparison of the fair value of the Scanner reporting unit against its carrying amount, including the goodwill allocated to it. In deriving the fair value of the Scanner reporting unit, we utilized a combination of both the income and market approach, which are classified as level 3 within the fair value hierarchy. The income approach provides an estimate of fair value based on discounted expected future cash flows. The market approach provides an estimate of fair value using various prices or market multiples applied to the reporting unit's operating results and then applies an appropriate control premium in order to reconcile to our market capitalization. As a result of our step one analysis, we concluded that the fair value of the Scanner reporting unit was less than its carrying value, therefore, we proceeded to perform step two of the goodwill impairment analysis.
79
ALIGN TECHNOLOGY, INC. AND SUBSIDIARIES
NOTES TO CONSOLIDATED FINANCIAL STATEMENTS—(Continued)
Step two of the goodwill impairment analysis measures the impairment charge by allocating the reporting unit's fair value to all of the assets and liabilities of the reporting unit in a hypothetical analysis that calculates the implied fair value of goodwill in the same manner as if the reporting unit was being acquired in a business combination. This allocation process was performed only for the purposes of measuring the goodwill impairment, and not to adjust the carrying values of the recognized tangible assets and liabilities. Any excess of the carrying value of the reporting unit's goodwill over the implied fair value of the reporting unit's goodwill is recorded as an impairment loss. Based on our analysis, the implied fair value of goodwill was substantially lower than the carrying value of the goodwill for the Scanner reporting unit. We recorded a preliminary goodwill impairment charge during the third quarter of 2012 of
$24.7 million
and an additional
$11.9 million
during the fourth quarter of 2012, representing a change in estimate upon finalizing our 2013 annual budget process, for a total impairment charge of
$36.6 million
. None of the goodwill impairment charge was deductible for tax purposes.
2013 Impairment
During March 2013, changes in the competitive environment for intra-oral scanners, including announcements from our competitors of new low-priced scanners targeted at orthodontists and general practitioner dentists in North America, caused us to lower our expectations for growth and profitability for our Scanner reporting unit. As a result, we determined that goodwill related only to our Scanner reporting unit should be tested for impairment as of March 2013 due to these facts and circumstances which would more likely than not reduce the fair value of our Scanner reporting unit below its carrying amount. There was no triggering event related to the Clear Aligner goodwill.
We performed a step one analysis for our Scanner reporting unit which consists of a comparison of the fair value of the Scanner reporting unit against its carrying amount, including the goodwill allocated to it. In deriving the fair value of the Scanner reporting unit, we utilized the income approach which is classified as Level 3 within the fair value hierarchy. This approach provides an estimated fair value based on discounted expected future cash flows, which are based on management's estimates of revenue growth rates and operating margins, taking into consideration industry and market conditions. The discount rate used is based on a weighted average cost of capital adjusted for the relevant risk associated with the characteristics of the business and the projected cash flows.
As a result of our step one analysis, we concluded that the fair value of the Scanner reporting unit was less than its carrying value; therefore, we proceeded to step two of the goodwill impairment analysis. Step two of the goodwill impairment analysis measures the impairment charge by allocating the reporting unit's fair value to all of the assets and liabilities of the reporting unit in a hypothetical analysis that calculates the implied fair value of goodwill in the same manner as if the reporting unit was being acquired in a business combination. This allocation process was performed only for the purposes of measuring the goodwill impairment and not to adjust the carrying values of the recognized tangible assets and liabilities. Any excess of the carrying value of the reporting unit's goodwill over the implied fair value of the reporting unit's goodwill is recorded as an impairment loss. We use a discounted cash flow (“DCF”) approach to estimate the fair value of a reporting unit, utilizing the harvest model, which we believe is the most reliable indicator of fair value of this business, and is most consistent with the approach a market place participant would use. Based on our analysis, there was no implied goodwill for the Scanner reporting unit; therefore, we recorded a goodwill impairment charge of
$40.7 million
in the three months ended March 31, 2013, which represents the remaining goodwill balance in the Scanner reporting unit. None of the goodwill impairment charge was deductible for tax purposes.
Annual Impairment Test
The remaining goodwill is entirely attributable to our Clear Aligner reporting unit. During the fourth quarter of fiscal 2014, we performed the annual goodwill impairment testing and found no impairment events as the fair value of our Clear Aligner reporting unit was significantly in excess of the carrying value.
Acquired Intangible Assets
We amortize our intangible assets over their estimated useful lives. We evaluate long-lived assets, which includes property, plant and equipment and intangible assets, for impairment whenever events or changes in circumstances indicate the carrying value of an asset may not be recoverable. The carrying value is not recoverable if it exceeds the undiscounted cash flows resulting from the use of the asset and its eventual disposition. Our estimates of future cash flows attributable to our long-lived assets require significant judgment based on our historical and anticipated results and are subject to many factors. Factors we consider important which could trigger an impairment review include significant negative industry or economic trends, significant loss of customers and changes in the competitive environment of our intra-oral scanning business.
80
ALIGN TECHNOLOGY, INC. AND SUBSIDIARIES
NOTES TO CONSOLIDATED FINANCIAL STATEMENTS—(Continued)
During March 2013, changes in the competitive environment for intra-oral scanners, including announcements from our competitors of new low-priced scanners targeted at orthodontists and general practitioner dentists in North America, that caused us to lower our expectations for growth and profitability for our Scanner reporting unit. As a result, we determined that the carrying value of the Scanner long-lived assets was not recoverable as compared to the value of the undiscounted cash flows of our revised projections for the asset group. In order to determine the impairment amount of our long-lived assets, we fair valued each key component of our long-lived assets within the asset group, which involved the use of significant estimates and assumptions including replacement costs, revenue growth rates, operating margins, and plant and equipment cost trends. We use a DCF approach, utilizing the harvest model, to estimate the fair value of a reporting unit, which we believe is the most reliable indicator of fair value of a business, and is most consistent with the approach of a marketplace participant would use. The estimation of fair value utilizing a DCF approach includes numerous uncertainties which require our significant judgment when making assumptions of expected growth rates and the selection of discount rates, as well as assumptions regarding general economic and business conditions, and the structure that would yield the highest economic value, among other factors. Key assumptions used in measuring the fair values of Scanner reporting unit included the discount rate (based on the weighted-average cost of capital) and revenue growth. The fair value of Scanner’s trademark was determined using a risk-adjusted DCF approach under the relief-from-royalty method. The royalty rate used was based on a consideration of market rates. The fair value of Scanner’s finite-lived customer relationships was determined using a DCF approach under the multi-period excess earnings method. We determined our long-lived asset group within the Scanner reporting unit to be primarily finite-lived intangible assets, plant and equipment. Upon completion of this analysis, we recorded a total impairment charge of
$26.3 million
of which
$19.3 million
represented the impairment related to our Scanner intangible assets and
$7.0 million
related to plant and equipment. There was no triggering event related to the Clear Aligner asset group.
There were no triggering events in 2014 that would cause further impairments of our long-lived assets.
Intangible assets arising either as a direct result from the Cadent acquisition or individually acquired are being amortized as follows (in thousands):
|
Weighted Average Amortization Period (in years)
|
Gross Carrying Amount as of
December 31, 2014
|
Accumulated
Amortization
|
Impairment Charge
|
Net Carrying
Value as of
December 31, 2014
|
|||||||||||||
|
Trademarks
|
15
|
$
|
7,100
|
|
$
|
(1,354
|
)
|
$
|
(4,179
|
)
|
$
|
1,567
|
|
||||
|
Existing technology
|
13
|
12,600
|
|
(3,015
|
)
|
(4,328
|
)
|
5,257
|
|
||||||||
|
Customer relationships
|
11
|
33,500
|
|
(9,095
|
)
|
(10,751
|
)
|
13,654
|
|
||||||||
|
Other
|
8
|
285
|
|
(76
|
)
|
—
|
|
209
|
|
||||||||
|
Total Intangible Assets
|
$
|
53,485
|
|
$
|
(13,540
|
)
|
$
|
(19,258
|
)
|
$
|
20,687
|
|
|||||
|
Weighted Average Amortization Period (in years)
|
Gross Carrying
Amount as of
December 31, 2013
|
Accumulated
Amortization
|
Impairment Charge
|
Net Carrying
Value as of
December 31, 2013
|
|||||||||||||
|
Trademarks
|
15
|
$
|
7,100
|
|
$
|
(1,100
|
)
|
$
|
(4,179
|
)
|
$
|
1,821
|
|
||||
|
Existing technology
|
13
|
12,600
|
|
(2,236
|
)
|
(4,328
|
)
|
6,036
|
|
||||||||
|
Customer relationships
|
11
|
33,500
|
|
(7,112
|
)
|
(10,751
|
)
|
15,637
|
|
||||||||
|
Other
|
8
|
285
|
|
(40
|
)
|
—
|
|
245
|
|
||||||||
|
Total Intangible Assets
|
$
|
53,485
|
|
$
|
(10,488
|
)
|
$
|
(19,258
|
)
|
$
|
23,739
|
|
|||||
81
ALIGN TECHNOLOGY, INC. AND SUBSIDIARIES
NOTES TO CONSOLIDATED FINANCIAL STATEMENTS—(Continued)
The total estimated annual future amortization expense for these acquired intangible assets as of
December 31, 2014
is as follows (in thousands):
|
Fiscal Year
|
|
||
|
2015
|
$
|
2,600
|
|
|
2016
|
2,600
|
|
|
|
2017
|
2,600
|
|
|
|
2018
|
2,600
|
|
|
|
2019
|
2,600
|
|
|
|
Thereafter
|
7,687
|
|
|
|
Total
|
$
|
20,687
|
|
Securities Class Action Lawsuit
On November 28, 2012, plaintiff City of Dearborn Heights Act 345 Police & Fire Retirement System filed a lawsuit against Align, Thomas M. Prescott (“Mr. Prescott”), Align’s President and Chief Executive Officer, and Kenneth B. Arola (“Mr. Arola”), Align’s former Vice President, Finance and Chief Financial Officer, in the United States District Court for the Northern District of California on behalf of a purported class of purchasers of our common stock (the “Securities Action”). On July 11, 2013, an amended complaint was filed, which named the same defendants, on behalf of a purported class of purchasers of our common stock between January 31, 2012 and October 17, 2012. The amended complaint alleged that Align, Mr. Prescott and Mr. Arola violated Section 10(b) of the Securities Exchange Act of 1934 and Rule 10b-5 promulgated thereunder, and that Mr. Prescott and Mr. Arola violated Section 20(a) of the Securities Exchange Act of 1934. Specifically, the amended complaint alleged that during the purported class period defendants failed to take an appropriate goodwill impairment charge related to the April 29, 2011 acquisition of Cadent Holdings, Inc. in the fourth quarter of 2011, the first quarter of 2012 or the second quarter of 2012, which rendered our financial statements and projections of future earnings materially false and misleading and in violation of U.S. GAAP. The amended complaint sought monetary damages in an unspecified amount, costs and attorneys’ fees. On December 9, 2013, the court granted defendants’ motion to dismiss with leave for plaintiff to file a second amended complaint. Plaintiff filed a second amended complaint on January 8, 2014 on behalf of the same purported class. The second amended complaint states the same claims as the amended complaint. On August 22, 2014, the court granted our motion to dismiss without leave to amend. On September 22, 2014, Plaintiff filed a notice of appeal to the Ninth Circuit Court of Appeals. Align intends to vigorously defend itself against these allegations. Align is currently unable to predict the outcome of this amended complaint and therefore cannot determine the likelihood of loss nor estimate a range of possible loss, if any.
Shareholder Derivative Lawsuit
On February 1, 2013, plaintiff Gary Udis filed a shareholder derivative lawsuit against several of Align’s current and former officers and directors in the Superior Court of California, County of Santa Clara. The complaint alleges that our reported income and earnings were materially overstated because of a failure to timely write down goodwill related to the April 29, 2011 acquisition of Cadent Holdings, Inc., and that defendants made allegedly false statements concerning our forecasts. The complaint asserts various state law causes of action, including claims of breach of fiduciary duty, unjust enrichment, and insider trading, among others. The complaint seeks unspecified damages on behalf of Align, which is named solely as nominal defendant against whom no recovery is sought. The complaint also seeks an order directing Align to reform and improve its corporate governance and internal procedures, and seeks restitution in an unspecified amount, costs, and attorneys’ fees. On July 8, 2013, an Order was entered staying this derivative lawsuit until an initial ruling on our first motion to dismiss the Securities Action. On January 15, 2014, an Order was entered staying this derivative lawsuit until an initial ruling on our second motion to dismiss the Securities Action. On October 14, 2014, an Order was entered staying this derivative lawsuit until a ruling by the Ninth Circuit in the Securities Action discussed above. Align is currently unable to predict the outcome of this complaint and therefore cannot determine the likelihood of loss nor estimate a range of possible losses.
In addition, in the course of Align's operations, Align is involved in a variety of claims, suits, investigations, and proceedings, including actions with respect to intellectual property claims, patent infringement claims, government investigations, labor and employment claims, breach of contract claims, tax, and other matters. Regardless of the outcome, these proceedings can have an
82
adverse impact on us because of defense costs, diversion of management resources, and other factors. Although the results of complex legal proceedings are difficult to predict and Align's view of these matters may change in the future as litigation and events related thereto unfold; Align currently does not believe that these matters, individually or in the aggregate, will materially affect Align's financial position, results of operations or cash flows.
On March 22, 2013, we entered into a credit facility with Wells Fargo Bank. The credit facility provides for a
$50.0 million
revolving line of credit, with a
$10.0 million
letter of credit sublimit, and has a maturity date on March 22, 2016. The credit facility also requires us to maintain a minimum unrestricted cash balance of
$50.0 million
and comply with specific financial conditions and performance requirements. The loans bear interest, at our option, at a fluctuating rate per annum equal to the daily one-month adjusted LIBOR rate plus a spread of
1.75%
or an adjusted LIBOR rate (based on one, three, six or twelve-month interest periods) plus a spread of
1.75%
. As of December 31, 2014, we had
no
outstanding borrowings under this credit facility and were in compliance with the conditions and performance requirements.
Operating leases
We lease our facilities and certain equipment and automobiles under non-cancelable operating lease arrangements that expire at various dates through 2022 and provide for pre-negotiated fixed rental rates during the terms of the lease. The terms of some of our leases provide for rental payments on a graduated scale. We recognize rent expense on a straight-line basis over the lease period and accrue for any rent expense incurred but not paid. Total rent expense was
$7.6 million
,
$7.3 million
and
$6.9 million
, for the year ended
December 31, 2014
,
2013
and
2012
, respectively.
Minimum future lease payments for non-cancelable leases as of
December 31, 2014
, are as follows (in thousands):
|
Fiscal Year
|
Operating leases
|
||
|
2015
|
$
|
9,130
|
|
|
2016
|
8,293
|
|
|
|
2017
|
4,659
|
|
|
|
2018
|
1,545
|
|
|
|
2019
|
209
|
|
|
|
Thereafter
|
210
|
|
|
|
Total minimum lease payments
|
$
|
24,046
|
|
Off-balance Sheet Arrangements
As of
December 31, 2014
, we had no off-balance sheet arrangements that have, or are reasonably likely to have, a current or future material effect on our consolidated financial condition, results of operations, liquidity, capital expenditures or capital resources.
Indemnification Provisions
In the normal course of business to facilitate transactions in our services and products, we indemnify certain parties: customers, vendors, lessors, and other parties with respect to certain matters, including, but not limited to, services to be provided by us and intellectual property infringement claims made by third parties. In addition, we have entered into indemnification agreements with our directors and certain of our officers that will require us, among other things, to indemnify them against certain liabilities that may arise by reason of their status or service as directors or officers. Several of these agreements limit the time within which an indemnification claim can be made and the amount of the claim.
It is not possible to make a reasonable estimate of the maximum potential amount under these indemnification agreements due to the unique facts and circumstances involved in each particular agreement. Additionally, we have a limited history of prior indemnification claims and the payments we have made under such agreements have not had a material adverse effect on our results of operations, cash flows, or financial position. However, to the extent that valid indemnification claims arise in the future, future payments by us could be significant and could have a material adverse effect on our results of operations or cash flows in a particular period. As of
December 31, 2014
, we did not have any material indemnification claims that were probable or reasonably possible.
83
ALIGN TECHNOLOGY, INC. AND SUBSIDIARIES
NOTES TO CONSOLIDATED FINANCIAL STATEMENTS—(Continued)
Preferred Stock Rights Agreement
The Preferred Stock Rights Agreement (the “Rights Agreement”) is intended to protect stockholders from unfair or coercive takeover practices. In accordance with the Rights Agreement, the Board of Directors declared a dividend distribution of
one
preferred stock purchase right (a “Right”) for each outstanding share of our common stock to stockholders of record on
November 22, 2005
. Each Right entitles stockholders to buy one one-thousandth of a share of our Series A Participating Preferred Stock, par value
$0.0001
per share, at an exercise price of
$37.00
, subject to adjustment. Rights will become exercisable upon the occurrence of certain events, including a person or group acquiring or the announcing the intention to acquire beneficial ownership of
15%
or more of the then outstanding common stock without the approval of the Board of Directors. Each holder of a Right will have the right to receive, upon exercise, shares of common stock having a value equal to
two
times the purchase price. The Rights will expire on
November 22, 2015
or upon the exercise of the Rights, whichever occurs earlier.
Common Stock
The holders of common stock are entitled to receive dividends whenever funds are legally available and when and if declared by the Board of Directors. We have never declared or paid dividends on our common stock.
Stock-based Compensation Plans
Our 2005 Incentive Plan, as amended, provides for the granting of incentive stock options, non-statutory stock options, restricted stock units, market stock units, stock appreciation rights, performance units and performance shares to employees, non-employee directors, and consultants. Shares granted on or after May 16, 2013 as an award of restricted stock, restricted stock unit, market stock units, performance share or performance unit ("full value awards") are counted against the authorized share reserve as
one and nine-tenths
(1
9/10
) shares for every one (1) share subject to the award, and any shares canceled that were counted as
one and nine-tenths
against the plan reserve will be returned at the same ratio. Full value awards granted prior to May 16, 2013 were counted against the authorized share reserve as
one and one half
(1
1/2
) share for every one (1) share subject to the award, and any shares canceled that were counted as
one and one half
against the plan reserve will be returned at this same ratio.
As of December 31, 2014, the 2005 Incentive Plan (as amended) has a total reserve of
23,283,379
shares for issuance of which
7,325,130
shares are available for issuance, plus up to an aggregate of
5,000,000
shares that would have been returned to our 2001 Stock Incentive Plan as a result of termination of options on or after March 28, 2005. No shares were added to the plan in 2014. We issue new shares from our pool of authorized but unissued shares to satisfy the exercise and vesting obligations of our stock-based compensation plans.
Stock-based Compensation
Stock-based compensation is based on the estimated fair value of awards, net of estimated forfeitures, and recognized over the requisite service period. Estimated forfeitures are based on historical experience at the time of grant and may be revised, if necessary, in subsequent periods if actual forfeitures differ from those estimates. The stock-based compensation related to all of our stock-based awards and employee stock purchases for the year ended
December 31, 2014
,
2013
and
2012
is as follows (in thousands):
|
|
For the Year Ended December 31,
|
||||||||||
|
|
2014
|
2013
|
2012
|
||||||||
|
Cost of net revenues
|
$
|
3,616
|
|
$
|
2,565
|
|
$
|
1,843
|
|
||
|
Sales and marketing
|
11,646
|
|
7,093
|
|
5,581
|
|
|||||
|
General and administrative
|
17,979
|
|
13,261
|
|
10,361
|
|
|||||
|
Research and development
|
6,582
|
|
3,519
|
|
3,698
|
|
|||||
|
Total stock-based compensation
|
$
|
39,823
|
|
$
|
26,438
|
|
$
|
21,483
|
|
||
Stock Options
84
ALIGN TECHNOLOGY, INC. AND SUBSIDIARIES
NOTES TO CONSOLIDATED FINANCIAL STATEMENTS—(Continued)
Options are granted for terms not to exceed
seven
years and generally vest over
four
years with
25%
vesting
one
year from the date of grant and 1/48th each month thereafter. Activity for the year ended
December 31, 2014
, under the stock option plans are set forth below (in thousands, except years and per share amounts):
|
|
Stock Options
|
|||||||||||
|
|
Number of
Shares
Underlying
Stock Options
|
Weighted
Average
Exercise
Price per Share
|
Weighted Average
Remaining
Contractual Term
(in years )
|
Aggregate
Intrinsic
Value
|
||||||||
|
Outstanding as of December 31, 2013
|
1,321
|
|
16.08
|
|
||||||||
|
Granted
|
—
|
|
—
|
|
||||||||
|
Exercised
|
(648
|
)
|
16.58
|
|
||||||||
|
Cancelled or expired
|
(5
|
)
|
18.32
|
|
||||||||
|
Outstanding as of December 31, 2014
|
668
|
|
$
|
15.57
|
|
2.92
|
$
|
26,933
|
|
|||
|
Vested and expected to vest at December 31, 2014
|
668
|
|
$
|
15.57
|
|
2.92
|
$
|
26,930
|
|
|||
|
Exercisable at December 31, 2014
|
655
|
|
$
|
15.43
|
|
2.92
|
$
|
26,504
|
|
|||
The aggregate intrinsic value in the table above represents the total pre-tax intrinsic value (the difference between our closing stock price on the last trading day in
2014
and the exercise price, multiplied by the number of in-the-money options) that would have been received by the option holders had all option holders exercised their options on
December 31, 2014
. This amount will fluctuate based on the fair market value of our stock. The total intrinsic value of stock options exercised for the year ended
December 31, 2014
, 2013 and 2012 was $
24.5 million
,
$46.7 million
and
$50.9 million
, respectively. The total fair value of the options vested during the year ended
December 31, 2014
, 2013 and 2012 was
$0.7 million
,
$3.7 million
,
$5.0 million
, respectively. There were no stock options granted in 2014, 2013 and 2012.
As of
December 31, 2014
, the total unamortized compensation costs related to stock options was not material. For the year ended
December 31, 2014
, the total recognized tax effect from exercised options was
$1.9 million
.
Restricted Stock Units
The fair value of nonvested restricted stock units (“RSUs”) is based on our closing stock price on the date of grant. A summary for the year ended
December 31, 2014
, is as follows (in thousands, except years and per share amounts):
|
Shares
Underlying RSUs
|
Weighted Average Grant Date Fair Value
|
Weighted
Remaining
Vesting Period
(in years)
|
Aggregate
Intrinsic
Value
|
|||||||||
|
Nonvested as of December 31, 2013
|
2,044
|
|
$
|
31.88
|
|
|||||||
|
Granted
|
981
|
|
53.72
|
|
||||||||
|
Vested and released
|
(728
|
)
|
30.22
|
|
||||||||
|
Forfeited
|
(173
|
)
|
37.59
|
|
||||||||
|
Nonvested as of December 31, 2014
|
2,124
|
|
$
|
42.08
|
|
1.33
|
$
|
118,727
|
|
|||
The aggregate intrinsic value in the table above represents the total pre-tax intrinsic value (calculated by multiplying our closing stock price on the last trading day of
2014
by the number of nonvested RSUs) that would have been received by the unit holders had all RSUs been vested and released on
December 31, 2014
. This amount will fluctuate based on the fair market value of our stock. During
2014
, of the
727,679
shares vested and released,
114,468
vested shares were withheld for employee minimum statutory tax obligations, resulting in a net issuance of
613,211
shares.
The total intrinsic value of RSUs vested and released during
2014
,
2013
and
2012
was
$38.9 million
,
$20.3 million
and
$12.5 million
, respectively. The total fair value RSUs vested during the year ended
December 31, 2014
,
2013
, and
2012
was
$22.0 million
,
$13.2 million
,
$7.8 million
, respectively. As of
December 31, 2014
, there was
$32.1 million
of total unamortized compensation costs, net of estimated forfeitures, related to RSUs, and these costs are expected to be recognized over a weighted average period of
2.2
years.
85
ALIGN TECHNOLOGY, INC. AND SUBSIDIARIES
NOTES TO CONSOLIDATED FINANCIAL STATEMENTS—(Continued)
On an annual basis, we grant market-performance based restricted stock units (“MSUs”) to our executive officers. Each MSU represents the right to one share of Align’s common stock and will be issued through our amended 2005 Incentive Plan. The actual number of MSUs which will be eligible to vest will be based on the performance of Align’s stock price relative to the performance of the NASDAQ Composite Index over the vesting period, generally
two
to
three years
, up to
150%
of the MSUs initially granted.
The following table summarizes the MSU performance as of
December 31, 2014
:
|
Number of Shares
Underlying MSUs
(in thousands)
|
Weighted Average Grant Date Fair Value
|
Weighted Average
Remaining
Vesting Period
(in years )
|
Aggregate
Intrinsic Value
(in thousands)
|
||||||||
|
Nonvested as of December 31, 2013
|
307
|
|
31.96
|
|
|
|
|
||||
|
Granted
|
244
|
|
50.46
|
|
|||||||
|
Vested and released
|
(53
|
)
|
22.41
|
|
|||||||
|
Nonvested as of December 31, 2014
|
498
|
|
42.00
|
|
1.38
|
$
|
27,815
|
|
|||
The aggregate intrinsic value in the table above represents the total pre-tax intrinsic value (calculated by multiplying our closing stock price on the last trading day of 2014 by the number of non-vested MSUs) that would have been received by the unit holders had all MSUs been vested and released on
December 31, 2014
. This amount will fluctuate based on the fair market value of our stock. During
2014
, of the
52,575
shares vested and released
25,214
shares were withheld for tax payments, resulting in a net issuance of
27,361
shares.
The total intrinsic value of MSUs vested and released during
2014
was
$2.9 million
. The total fair value MSUs vested during the year ended
December 31, 2014
was
$1.2 million
. As of
December 31, 2014
, we expect to recognize
$6.2 million
of total unamortized compensation cost, net of estimated forfeitures, related to MSUs over a weighted average period of
1.4
years.
The fair value of the MSUs is estimated at the grant date using a Monte Carlo simulation that includes factors for market conditions. The following weighted-average assumptions used in the Monte Carlo simulation were as follows:
|
|
Year Ended December 31,
|
||||||||||
|
|
2014
|
2013
|
2012
|
||||||||
|
Expected term (in years)
|
3
|
|
3
|
|
3
|
|
|||||
|
Expected volatility
|
46.0
|
%
|
47.0
|
%
|
54.0
|
%
|
|||||
|
Risk-free interest rate
|
0.7
|
%
|
0.4
|
%
|
0.4
|
%
|
|||||
|
Expected dividends
|
—
|
|
—
|
|
—
|
|
|||||
|
Weighted average fair value per share at grant date
|
$
|
50.46
|
|
$
|
35.49
|
|
$
|
29.45
|
|
||
Total payments to tax authorities for payroll taxes related to RSUs, including MSUs, that vested during the period, were
$7.6 million
,
$4.4 million
and
$2.1 million
in
2014
,
2013
and
2012
, respectively, reflected as a financing activity in the Consolidated Statements of Cash Flows.
Employee Stock Purchase Plan
In May 2010, our shareholders approved the 2010 Employee Stock Purchase Plan (the “2010 Purchase Plan”), replacing our 2001 Employee Stock Purchase Plan, which consists of consecutive overlapping
twenty-four
month offering periods with
four
six-month purchase periods in each offering period. Employees purchase shares at
85%
of the fair market value of the common stock at either the beginning of the offering period or the end of the purchase period, whichever is lower. The 2010 Purchase Plan will continue until terminated by either the Board or its administrator. The maximum number of shares available for issuance under the 2010 Purchase Plan is
2,400,000
shares. During the year ended
December 31, 2014
,
2013
and
2012
, we issued
247,343
,
288,675
, and
336,382
shares, respectively, at average prices of
$29.24
,
$21.96
and
$17.98
, respectively. As of
December 31, 2014
,
1,363,827
shares remain available for future issuance.
86
ALIGN TECHNOLOGY, INC. AND SUBSIDIARIES
NOTES TO CONSOLIDATED FINANCIAL STATEMENTS—(Continued)
The fair value of the option component of the Purchase Plan shares was estimated at the grant date using the Black-Scholes option pricing model with the following weighted average assumptions:
|
|
Year Ended December 31,
|
||||||||||
|
|
2014
|
2013
|
2012
|
||||||||
|
Employee Stock Purchase Plan:
|
|||||||||||
|
Expected term (in years)
|
1.2
|
|
1.2
|
|
1.2
|
|
|||||
|
Expected volatility
|
38.8
|
%
|
44.9
|
%
|
49.7
|
%
|
|||||
|
Risk-free interest rate
|
0.2
|
%
|
0.2
|
%
|
0.2
|
%
|
|||||
|
Expected dividends
|
—
|
|
—
|
|
—
|
|
|||||
|
Weighted average fair value at grant date
|
$
|
17.15
|
|
$
|
11.69
|
|
$
|
11.10
|
|
||
We recognized stock-based compensation expense of
$2.6 million
,
$3.4 million
,
$2.0 million
related to our employee stock purchase plans for the year ended
December 31, 2014
, 2013 and 2012, respectively. As of
December 31, 2014
, there was
$0.8 million
of total unamortized compensation costs related to employee stock purchases. These costs are expected to be recognized over a weighted average period of
0.3
years.
On October 27, 2011, we announced that our Board of Directors approved a stock repurchase program pursuant to which we may repurchase up to
$150.0 million
of common stock. Purchases under the stock repurchase program were made from time to time in the open market.
During 2012, we repurchased approximately
1.7 million
shares of common stock at an average price of
$27.28
per share for an aggregate purchase price of approximately
$47.2 million
, including commissions. The common stock repurchases reduced additional paid-in capital by approximately
$15.4 million
and increased accumulated deficit by
$31.8 million
. During 2013, we repurchased approximately
2.7 million
shares of our common stock at an average price of
$34.95
per share, including commissions, for an aggregate purchase price of approximately
$95.1 million
. The common stock retirements reduced additional paid-in capital by approximately
$24.5 million
and increased accumulated deficit by
$70.6 million
. All repurchased shares were retired. No further authorization for repurchases remains outstanding as we completed the repurchases under this program as of December 31, 2013.
On April 23, 2014, we announced that our Board of Directors had authorized a stock repurchase program pursuant to which we may purchase up to
$300.0 million
of our common stock over the next three years, with
$100.0 million
of that amount authorized to be purchased over the first twelve months. Any purchases under this stock repurchase program may be made, from time-to-time, pursuant to open market purchases (including pursuant to Rule 10b5-1 plans), privately-negotiated transactions, accelerated stock repurchases, block trades or derivative contracts or otherwise in accordance with applicable federal securities laws, including Rule 10b-18 of the Securities Exchange Act of 1934.
As part of our
$300.0 million
stock repurchase program, we
entered into an accelerated share repurchase agreement ("ASR") with Goldman, Sachs & Co. on April 28, 2014 to repurchase
$70.0 million
of our common stock. We paid
$70.0 million
on April 29, 2014 and received an initial delivery of approximately
1.0 million
shares. The ASR was completed on July 29, 2014 with a final delivery of approximately
0.4 million
shares. We received a total of approximately
1.4 million
shares under the ASR for an average purchase price per share of
$51.46
, which all shares were retired. The final number of shares repurchased was based on our volume-weighted average stock price during the term of the transaction, less an agreed upon discount.
During 2014, we repurchased on the open market approximately
0.6 million
shares of our common stock at an average price of
$50.93
per share, including commissions, for an aggregate purchase price of approximately
$28.2 million
. All repurchased shares were retired. As of December 31, 2014, we have
$201.8 million
remaining under the April 2014 stock repurchase program, of which
$1.8 million
was repurchased in January 2015. In addition, in January 2015, our Board of Directors has authorized the next
$100.0 million
under the program to be repurchased which we anticipate completing within twelve months. We expect to finance future stock repurchases with current cash on hand.
87
ALIGN TECHNOLOGY, INC. AND SUBSIDIARIES
NOTES TO CONSOLIDATED FINANCIAL STATEMENTS—(Continued)
401(k) Plan
In January 1999, we adopted a defined contribution retirement plan under Section 401(k) of the Internal Revenue Code for our U.S. employees. This plan covers substantially all U.S. employees who meet minimum age and service requirements and allows participants to defer a portion of their annual compensation on a pre-tax basis. In 2009, our Board of Directors authorized us to match
50%
of our employee’s salary deferral contributions up to a
6%
of the employee’s eligible compensation effective 2010. We contributed approximately
$2.2 million
,
$2.1 million
and
$1.9 million
to the 401(k) plan during
2014
,
2013
and
2012
, respectively.
Israeli Funds
Under the Israeli severance fund law, we are required to make payments to dismissed employees and employees leaving employment in certain circumstances. The funding is calculated based on the salary of the employee multiplied by the number of years of employment as of the applicable balance sheet date. Our Israeli employees are entitled to one month’s salary for each year of employment, or a pro-rata portion thereof. We fund the liability through monthly deposits into funds, and the values of these contributions are recorded in other long-term current assets.
As of
December 31, 2014
and
2013
, the accrued funds liability was approximately
$2.5 million
and
$2.4 million
, respectively.
88
ALIGN TECHNOLOGY, INC. AND SUBSIDIARIES
NOTES TO CONSOLIDATED FINANCIAL STATEMENTS—(Continued)
Income before provision for income taxes consisted of the following (in thousands):
|
|
Year ended December 31,
|
||||||||||
|
|
2014
|
2013
|
2012
|
||||||||
|
Domestic
|
$
|
94,784
|
|
$
|
31,993
|
|
$
|
32,341
|
|
||
|
Foreign
|
95,585
|
|
61,146
|
|
51,955
|
|
|||||
|
Total Income before provision for income taxes
|
$
|
190,369
|
|
$
|
93,139
|
|
$
|
84,296
|
|
||
The provision for income taxes consisted of the following (in thousands):
|
|
Year Ended December 31,
|
||||||||||
|
|
2014
|
2013
|
2012
|
||||||||
|
Federal
|
|||||||||||
|
Current
|
$
|
1,569
|
|
$
|
26
|
|
$
|
—
|
|
||
|
Deferred
|
37,570
|
|
24,262
|
|
22,382
|
|
|||||
|
39,139
|
|
24,288
|
|
22,382
|
|
||||||
|
State
|
|||||||||||
|
Current
|
2,162
|
|
1,235
|
|
438
|
|
|||||
|
Deferred
|
971
|
|
1,158
|
|
1,486
|
|
|||||
|
3,133
|
|
2,393
|
|
1,924
|
|
||||||
|
Foreign
|
|||||||||||
|
Current
|
1,596
|
|
3,113
|
|
1,173
|
|
|||||
|
Deferred
|
669
|
|
(950
|
)
|
126
|
|
|||||
|
2,265
|
|
2,163
|
|
1,299
|
|
||||||
|
Provision for income taxes
|
$
|
44,537
|
|
$
|
28,844
|
|
$
|
25,605
|
|
||
The differences between income taxes using the federal statutory income tax rate of
35%
and our effective tax rate were as follows:
|
|
Year Ended December 31,
|
|||||||
|
|
2014
|
2013
|
2012
|
|||||
|
U.S. federal statutory income tax rate
|
35.0
|
%
|
35.0
|
%
|
35.0
|
%
|
||
|
State income taxes, net of federal tax benefit
|
1.6
|
|
2.5
|
|
2.4
|
|
||
|
Impact of differences in foreign tax rates
|
(16.4
|
)
|
(20.4
|
)
|
(20.0
|
)
|
||
|
Goodwill Impairment
|
—
|
|
15.3
|
|
15.2
|
|
||
|
Stock-based compensation
|
1.0
|
|
0.5
|
|
(1.2
|
)
|
||
|
Other items not individually material
|
2.2
|
|
(1.9
|
)
|
(1.0
|
)
|
||
|
23.4
|
%
|
31.0
|
%
|
30.4
|
%
|
|||
Other items not individually material for the year ended December 31, 2014 includes an out of period correction that resulted in an increase in the provision for income taxes of
$1.8 million
. We do not believe the out of period adjustment is material to the consolidated financial statements for the fiscal year ended December 31, 2014 or to any prior years' consolidated financial statements.
As of
December 31, 2014
, U.S. income taxes and foreign withholding taxes associated with the repatriation of undistributed earnings of foreign subsidiaries were not provided for on a cumulative total of
$260.9 million
. We intend to reinvest these earnings indefinitely in our foreign subsidiaries. If these earnings were distributed in the form of dividends or otherwise, or if the shares of the relevant foreign subsidiaries were sold or otherwise transferred, we would be subject to additional U.S. income taxes and foreign withholding taxes, net of related foreign tax credits. Determination of the amount of unrecognized deferred income tax liability related to these earnings is not practicable.
89
ALIGN TECHNOLOGY, INC. AND SUBSIDIARIES
NOTES TO CONSOLIDATED FINANCIAL STATEMENTS—(Continued)
In June 2009, the Costa Rica Ministry of Foreign Trade, an agency of the Government of Costa Rica, granted a
twelve
year extension of certain tax incentives, which were previously granted in 2002. The incentive tax rates will expire in various years
beginning in 2017
. Under these incentives, all of the income in Costa Rica during these twelve year incentive periods is subject to reduced rates of Costa Rica income tax. In order to receive the benefit of the incentives, we must hire specified numbers of employees and maintain minimum levels of fixed asset investment in Costa Rica. If we do not fulfill these conditions for any reason, our incentive could lapse and our income in Costa Rica would be subject to taxation at higher rates, which could have a negative impact on our operating results. The Costa Rica corporate income tax rate that would apply, absent the incentives, is
30%
for
2014
. As a result of these incentives, income taxes were reduced by
$32.5 million
,
$27.7 million
, and
$21.8 million
in
2014
,
2013
, and
2012
, respectively. The benefit of the tax holiday on diluted net income per share was
$0.40
,
$0.34
, and
$0.26
in
2014
,
2013
and
2012
, respectively.
As of
December 31, 2014
and
2013
, the significant components of our deferred tax assets and liabilities were (in thousands):
|
|
Year Ended December 31,
|
||||||
|
|
2014
|
2013
|
|||||
|
Deferred tax assets:
|
|||||||
|
Net operating loss and capital loss carryforwards
|
$
|
33,202
|
|
$
|
39,978
|
|
|
|
Credit carryforwards
|
1,446
|
|
9,362
|
|
|||
|
Reserves and accruals
|
32,888
|
|
26,729
|
|
|||
|
Translation gains
|
637
|
|
48
|
|
|||
|
Stock-based compensation
|
11,964
|
|
9,100
|
|
|||
|
80,137
|
|
85,217
|
|
||||
|
Deferred tax liabilities:
|
|||||||
|
Prepaid expenses
|
709
|
|
557
|
|
|||
|
Depreciation and amortization
|
6,878
|
|
5,320
|
|
|||
|
7,587
|
|
5,877
|
|
||||
|
Net deferred tax assets before valuation allowance
|
72,550
|
|
79,340
|
|
|||
|
Valuation allowance
|
(32,498
|
)
|
(35,108
|
)
|
|||
|
Net deferred tax assets
|
$
|
40,052
|
|
$
|
44,232
|
|
|
We assess the likelihood that we will be able to realize our deferred tax assets quarterly. We consider all available evidence, both positive and negative, including historical levels of income, expectations and risks associated with estimates of future taxable income and ongoing prudent and feasible tax planning strategies in assessing the need for a valuation allowance. If it is more likely than not that we do not expect to realize our deferred tax assets, we will increase our provision for income taxes by recording a valuation allowance against the deferred tax assets that we estimate will not ultimately be realizable. As of December 31, 2014, we believed, except for the items noted in the subsequent paragraph, that it was more likely than not that the amount of deferred tax assets recorded on the balance sheet will be realized.
The
$32.5 million
total valuation allowance provided against our deferred tax assets at
December 31, 2014
, relates primarily to foreign net operating loss and capital loss carryforwards. At December 31, 2014, the valuation allowance decreased by a net
$2.6 million
, due to a
$1.8 million
decrease related to foreign net operating loss carryforwards, and a decrease of
$0.8 million
due to the release of valuation allowance related to Japan and China deferred tax assets.
At
December 31, 2014
, we had fully utilized net operating loss carryforwards for federal purposes and have net operating loss carryforwards of
$37.3 million
for California state tax purposes. If not utilized, these carryforwards will begin to expire in 2015 for California purposes. In addition, we had foreign net operating loss carryforwards of approximately
$125.5 million
, which, if not utilized will expire beginning in 2017.
Our net operating loss carryforwards associated with the exercise of employee stock options totaled
$23.8 million
as of
December 31, 2014
for California state tax purposes, which was not included in our deferred tax assets. The reduction of income taxes payable by the tax benefits associated with the exercise of employee stock options during the fiscal year, and utilization of net operating loss carryover applicable to stock options were approximately
$21.4 million
,
$27.1 million
, and
$17.2 million
in
90
ALIGN TECHNOLOGY, INC. AND SUBSIDIARIES
NOTES TO CONSOLIDATED FINANCIAL STATEMENTS—(Continued)
2014, 2013, and 2012, respectively. The benefits applicable to stock options were credited directly to stockholders’ equity when realized. We follow the tax law ordering method to determine when excess tax benefits have been realized and consider only the direct impacts of awards when calculating the amount of windfalls or shortfalls.
At December 31, 2014, we have California research credit carryforwards of approximately
$3.8 million
which can be carried forward indefinitely.
In the event of a change in ownership, as defined under federal and state tax laws, our net operating loss and tax credit carryforwards may be subject to annual limitations. The annual limitations may result in the expiration of the net operating loss and tax credit carryforwards before utilization.
The changes in the balance of gross unrecognized tax benefits, which exclude interest and penalties, for fiscal year ended December 31,
2014
,
2013
, and
2012
, is as follows (in thousands):
|
Unrecognized tax benefit as of December 31, 2011
|
$
|
15,472
|
|
|
Tax positions related to current year:
|
|||
|
Additions for uncertain tax positions
|
5,087
|
|
|
|
Tax positions related to prior year:
|
|||
|
Additions for uncertain tax positions
|
80
|
|
|
|
Unrecognized tax benefit as of December 31, 2012
|
20,639
|
|
|
|
Tax positions related to current year:
|
|||
|
Additions for uncertain tax positions
|
6,110
|
|
|
|
Tax positions related to prior year:
|
|||
|
Decreases for uncertain tax positions
|
(81
|
)
|
|
|
Unrecognized tax benefit as of December 31, 2013
|
26,668
|
|
|
|
Tax positions related to current year:
|
|||
|
Additions for uncertain tax positions
|
6,659
|
|
|
|
Tax positions related to prior year:
|
|||
|
Decreases for uncertain tax positions
|
(260
|
)
|
|
|
Unrecognized tax benefit as of December 31, 2014
|
$
|
33,067
|
|
We account for uncertain tax positions pursuant to authoritative guidance based on a two-step approach to recognize and measure uncertain tax positions taken or expected to be taken in a tax return. We first determine whether it is more likely than not that a tax position will be sustained upon audit based on its technical merits. If a tax position meets the more-likely-than-not recognition threshold it is then measured to determine the amount of benefit to recognize in the financial statements. The tax position is measured as the largest amount of benefit that is more than 50 percent likely to be realized upon ultimate settlement. We adjust our uncertain tax positions due to changing facts and circumstances, such as the closing of a tax audit, or refinement of estimates due to new information. To the extent the final outcome of these matters is different than the amounts recorded, such differences will impact our tax provision in our Consolidated Statements of Operations in the period in which such determination is made.
During fiscal year
2014
, the amount of gross unrecognized tax benefits increased by
$6.4 million
. The total amount of unrecognized tax benefits was
$33.1 million
as of
December 31, 2014
, all of which would impact our effective tax rate if recognized. We have elected to recognize interest and penalties related to unrecognized tax benefits as a component of income tax expense. The penalties and interest accrued as of
December 31, 2014
and
2013
are immaterial. We do not expect any significant changes to the amount of unrecognized tax benefits within the next twelve months.
We file U.S. federal, U.S. state, and non-U.S. tax returns. Our major tax jurisdictions are U.S. federal and the State of California. For U.S. federal and state tax returns, we are no longer subject to tax examinations for years before 2000. With few exceptions, we are no longer subject to examination by foreign tax authorities for years before 2007.
91
ALIGN TECHNOLOGY, INC. AND SUBSIDIARIES
NOTES TO CONSOLIDATED FINANCIAL STATEMENTS—(Continued)
Basic net income per share is computed using the weighted average number of shares of common stock outstanding during the period. Diluted net income per share is computed using the weighted average number of shares of common stock, adjusted for any dilutive effect of potential common stock. Potential common stock, computed using the treasury stock method, includes stock options, RSUs, MSUs and our ESPP.
The following table sets forth the computation of basic and diluted net income per share attributable to common stock (in thousands, except per share amounts):
|
|
Year Ended December 31,
|
||||||||||
|
|
2014
|
2013
|
2012
|
||||||||
|
Numerator:
|
|||||||||||
|
Net income
|
$
|
145,832
|
|
$
|
64,295
|
|
$
|
58,691
|
|
||
|
Denominator:
|
|||||||||||
|
Weighted-average common shares outstanding, basic
|
80,754
|
|
80,551
|
|
80,529
|
|
|||||
|
Dilutive effect of potential common stock
|
1,529
|
|
2,038
|
|
2,511
|
|
|||||
|
Total shares, diluted
|
82,283
|
|
82,589
|
|
83,040
|
|
|||||
|
Net income per share, basic
|
$
|
1.81
|
|
$
|
0.80
|
|
$
|
0.73
|
|
||
|
Net income per share, diluted
|
$
|
1.77
|
|
$
|
0.78
|
|
$
|
0.71
|
|
||
For the year ended
December 31, 2014
,
2013
and
2012
, the anti-dilutive effect on net income per share from stock options, RSUs, MSUs and our employee stock purchase plan were not material.
The supplemental cash flow information consists of the following (in thousands):
|
|
Year Ended December 31,
|
||||||||||
|
|
2014
|
2013
|
2012
|
||||||||
|
Taxes paid
|
$
|
5,666
|
|
$
|
4,125
|
|
$
|
2,825
|
|
||
|
Non-cash investing and financing activities:
|
|||||||||||
|
Fixed assets acquired with accounts payable or accrued liabilities
|
$
|
4,899
|
|
$
|
2,308
|
|
$
|
940
|
|
||
|
Unclaimed merger consideration liability
|
$
|
—
|
|
$
|
—
|
|
$
|
1,575
|
|
||
Segment Information
Operating segments are defined as components of an enterprise for which separate financial information is available that is evaluated regularly by the Chief Operating Decision Maker (“CODM”), or decision-making group, in deciding how to allocate resources and in assessing performance. Our CODM is our Chief Executive Officer. We report segment information based on the management approach. The management approach designates the internal reporting used by CODM for decision making and performance assessment as the basis for determining our reportable segments. The performance measures of our reportable segments include net revenues and gross profit.
We have grouped our operations into
two
reportable segments which are also our reporting units: Clear Aligner segment and Scanner segment.
|
•
|
Our Clear Aligner segment consists of our Invisalign System which includes Invisalign Full, Express/Lite, Teen, Assist, Vivera Retainers, along with our training and ancillary products for treating malocclusion.
|
|
•
|
Our Scanner segment consists of intra-oral scanning systems and additional services available with the intra-oral scanners that provide digital alternatives to the traditional cast models. This segment includes our iTero scanner and OrthoCAD services.
|
92
ALIGN TECHNOLOGY, INC. AND SUBSIDIARIES
NOTES TO CONSOLIDATED FINANCIAL STATEMENTS—(Continued)
These reportable operating segments are based on how our CODM views and evaluates our operations as well as allocation of resources. The following information relates to these segments (in thousands):
|
|
For the Year Ended December 31,
|
||||||||||
|
Net Revenues
|
2014
|
2013
|
2012
|
||||||||
|
Clear Aligner
|
|||||||||||
|
Invisalign Full Products
|
$
|
585,721
|
|
$
|
497,507
|
|
$
|
434,432
|
|
||
|
Invisalign Express Products
|
80,598
|
|
72,418
|
|
51,486
|
|
|||||
|
Invisalign non-case revenues
|
46,230
|
|
44,724
|
|
30,663
|
|
|||||
|
Scanner
|
|||||||||||
|
Scanners and Services
|
49,104
|
|
45,557
|
|
43,460
|
|
|||||
|
Total net revenues
|
$
|
761,653
|
|
$
|
660,206
|
|
|
$
|
560,041
|
|
|
|
Gross Profit
|
|||||||||||
|
Clear Aligner
|
$
|
562,889
|
|
$
|
484,835
|
|
$
|
405,970
|
|
||
|
Scanners and Services
|
15,554
|
|
13,271
|
|
10,418
|
|
|||||
|
Total gross profit
|
$
|
578,443
|
|
$
|
498,106
|
|
$
|
416,388
|
|
||
Geographical Information
Net revenues and tangible long-lived assets are presented below by geographic area (in thousands):
|
|
For the Year Ended December 31,
|
||||||||||
|
|
2014
|
2013
|
2012
|
||||||||
|
Net revenues
1
:
|
|||||||||||
|
United States
|
$
|
532,569
|
|
$
|
491,410
|
|
$
|
427,929
|
|
||
|
the Netherlands
|
156,817
|
|
122,494
|
|
105,942
|
|
|||||
|
Other international
|
72,267
|
|
46,302
|
|
26,170
|
|
|||||
|
Total net revenues
|
$
|
761,653
|
|
$
|
660,206
|
|
$
|
560,041
|
|
||
|
1
|
Net revenues are attributed to countries based on location of where revenue is recognized.
|
|
|
As of December 31,
|
||||||
|
|
2014
|
2013
|
|||||
|
Long-lived assets
2
:
|
|||||||
|
United States
|
$
|
76,511
|
|
$
|
61,439
|
|
|
|
Mexico
|
6,229
|
|
6,291
|
|
|||
|
the Netherlands
|
874
|
|
1,630
|
|
|||
|
Other international
|
6,511
|
|
6,383
|
|
|||
|
Total long-lived assets
|
$
|
90,125
|
|
$
|
75,743
|
|
|
|
2
|
Long-lived assets are attributed to countries based on entity that owns the assets.
|
93
ITEM 9.
CHANGES IN AND DISAGREEMENTS WITH ACCOUNTANTS ON ACCOUNTING AND FINANCIAL DISCLOSURE
None
ITEM 9A.
CONTROLS AND PROCEDURES
Evaluation of disclosure controls and procedures.
Under the supervision and with the participation of our management, including our Chief Executive Officer and our Chief Financial Officer, we have evaluated the effectiveness of the design and operation of our disclosure controls and procedures (as defined in Rules 13a-15(e) and 15d-15(e) under the Exchange Act). Based upon that evaluation, our Chief Executive Officer and our Chief Financial Officer have concluded that our disclosure controls and procedures are effective as of
December 31, 2014
to provide reasonable assurance that information required to be disclosed by us in the reports that we file or submit under the Exchange Act is accumulated and communicated to our management, including our Chief Executive Officer and our Chief Financial Officer, as appropriate, to allow timely decisions regarding required disclosure, and that such information is recorded, processed, summarized and reported within the time periods specified in the Securities and Exchange Commission rules and forms.
Management's annual report on internal control over financial reporting.
See “Report of Management on Internal Control over Financial Reporting” of this Annual Report on Form 10-K.
Changes in internal control over financial reporting.
There have been no changes in our internal control over financial reporting during the quarter ended
December 31, 2014
that have materially affected or are reasonably likely to materially affect, our internal control over financial reporting.
ITEM 9B.
OTHER INFORMATION
None.
94
Certain information required by Part III is omitted from this Form 10-K because we intend to file a definitive Proxy Statement for our 2014 Annual Meeting of Stockholders (the “Proxy Statement”) not later than 120 days after the end of the fiscal year covered by this Annual Report on Form 10-K, and certain information to be included therein is incorporated herein by reference.
ITEM 10.
DIRECTORS, EXECUTIVE OFFICERS AND CORPORATE GOVERNANCE
The information required by Item 401 of Regulation S-K concerning our directors is incorporated by reference to the Proxy Statement under the section captioned “Election of Directors.” The information required by Item 401 of Regulation S-K concerning our executive officers is set forth in
Item 1—“Business” of this Annual Report on Form 10-K
. The information required by Item 405 of Regulation S-K is incorporated by reference to the section entitled “Section 16(a) Beneficial Ownership Reporting Compliance” contained in the Proxy Statement. The information required by Item 407(d)(5) of Regulation S-K is incorporated by reference to the Proxy Statement under the section entitled “Corporate Governance—Board of Directors & Committee Meetings—Audit Committee”.
Code of Ethics
We have a code of ethics that applies to all of our employees, including our principal executive officer, principal financial officer and principal accounting officer. This code of ethics is posted on our Internet website. The Internet address for our website is
www.aligntech.com
, and the code of ethics may be found on the “Corporate Governance” section of our “Investor Relations” webpage.
We intend to satisfy the disclosure requirement under Item 5.05 of Form 8-K regarding an amendment to, or waiver from, a provision of this code of ethics by posting such information on our website, at the address and location specified above, or as otherwise required by the NASDAQ Global Market.
ITEM 11.
EXECUTIVE COMPENSATION
The information required by Item 402 of Regulation S-K is incorporated by reference to the Proxy Statement under the section captioned “Executive Compensation.” The information required by Items 407(e)(4) and (e)(5) is incorporated by reference to the Proxy Statement under the section captioned “Corporate Governance—Compensation Committee Interlocks” and “Compensation Committee Report,” respectively.
ITEM 12.
SECURITY OWNERSHIP OF CERTAIN BENEFICIAL OWNERS AND MANAGEMENT AND RELATED STOCKHOLDER MATTERS
The information required by Item 403 of Regulation S-K is incorporated by reference to the Proxy Statement under the section captioned “Security Ownership of Certain Beneficial Owners and Management.”
Equity Compensation Plan Information
The following table provides information as of
December 31, 2014
about our common stock that may be issued upon the exercise of options and rights granted to employees, consultants or members of our Board of Directors under all existing equity compensation plans, including the 1997 Equity Incentive Plan, the Employee Stock Purchase Plan ("ESPP"), the 2001 Stock Incentive Plan and the 2005 Incentive Plan, each as amended, and certain individual arrangements. Please see
Note 10 “Stockholders’ Equity” in the Notes to our Consolidated Financial Statements
for description of equity compensation plans.
95
|
Plan Category
|
Number of securities
to be issued upon exercise
of outstanding options
and restricted stock
units(a)
|
Weighted average
exercise price of
outstanding
options(b)
|
Number of securities
remaining available for
future issuance under
equity compensation plans
(excluding securities
reflected in column(a))
|
|||||||
|
Equity compensation plans approved by security holders
|
3,288,512
|
|
1
|
$
|
15.43
|
|
8,688,957
|
|
2, 3
|
|
|
Equity compensation plans not approved by security holders
|
—
|
|
—
|
|
—
|
|
||||
|
Total
|
3,288,512
|
|
$
|
15.43
|
|
8,688,957
|
|
|||
|
1
|
Includes 2,123,351 restricted stock units, including 497,500 market-performance based restricted stock units at target, which have an exercise price of zero.
|
|
2
|
Includes 1,363,827 shares available for issuance under our ESPP. We are unable to ascertain with specificity the number of securities to be issued upon exercise of outstanding rights or the weighted average exercise price of outstanding rights under the ESPP.
|
|
3
|
Excludes 418,187 of potentially issuable MSUs if performance targets are achieved at maximum payout.
|
ITEM 13.
CERTAIN RELATIONSHIPS AND RELATED TRANSACTIONS, AND DIRECTOR INDEPENDENCE
The information required by Item 404 and Item 407 of Regulation S-K is incorporated by reference to the Proxy Statement under the sections captioned “Certain Relationships and Related Party Transactions” and “Corporate Governance—Director Independence,” respectively.
ITEM 14.
PRINCIPAL ACCOUNTING FEES AND SERVICES
The information required by Item 9(e) of Schedule 14A of the Securities Act of 1934, as amended, is incorporated by reference to the Proxy Statement under the section captioned “Ratification of Appointment of Independent Registered Public Accountants.”
96
ITEM 15.
EXHIBITS, FINANCIAL STATEMENT SCHEDULES
|
(a)
|
Financial Statements
|
|
1.
|
Consolidated Financial Statements
|
The following documents are filed as part of this Annual Report on Form 10-K:
|
Report of Independent Registered Public Accounting Firm
|
|
|
Consolidated Statement of Operations for the year ended December 31, 2014, 2013 and 2012
|
|
|
Consolidated Statement of Comprehensive Income for the year ended December 31, 2014, 2013 and 2012
|
|
|
Consolidated Balance Sheet as of December 31, 2014 and 2013
|
|
|
Consolidated Statement of Stockholders’ Equity for the year ended December 31, 2014, 2013 and 2012
|
|
|
Consolidated Statement of Cash Flows for the year ended December 31, 2014, 2013 and 2012
|
|
|
Notes to Consolidated Financial Statements
|
|
|
2.
|
The following financial statement schedule is filed as part of this Annual Report on Form 10-K:
|
Schedule II—Valuation and Qualifying Accounts and Reserves
All other schedules have been omitted as they are not required, not applicable, or the required information is otherwise included.
SCHEDULE II: VALUATION AND QUALIFYING ACCOUNTS AND RESERVES
|
Balance at
Beginning
of Period
|
Additions
(reductions)
to Costs
and
Expenses
|
Write
offs
|
Charged to
Other
Accounts
1
|
Reclass
from
Other
Accounts
|
Balance at
End of Period
|
||||||||||||||||||
|
|
(in thousands)
|
||||||||||||||||||||||
|
Allowance for doubtful accounts and returns:
|
|||||||||||||||||||||||
|
Year ended December 31, 2012
|
$
|
1,500
|
|
$
|
4,417
|
|
$
|
(2,735
|
)
|
$
|
—
|
|
$
|
(15
|
)
|
$
|
3,167
|
|
|||||
|
Year ended December 31, 2013
|
$
|
3,167
|
|
$
|
2,116
|
|
$
|
(3,550
|
)
|
$
|
—
|
|
$
|
—
|
|
$
|
1,733
|
|
|||||
|
Year ended December 31, 2014
|
$
|
1,733
|
|
$
|
6,563
|
|
$
|
(6,733
|
)
|
$
|
—
|
|
$
|
—
|
|
$
|
1,563
|
|
|||||
|
Valuation Allowance for deferred tax assets:
|
|||||||||||||||||||||||
|
Year ended December 31, 2012
|
$
|
20,224
|
|
$
|
8,507
|
|
$
|
(1,675
|
)
|
$
|
—
|
|
$
|
—
|
|
$
|
27,056
|
|
|||||
|
Year ended December 31, 2013
|
$
|
27,056
|
|
$
|
9,806
|
|
$
|
(1,754
|
)
|
$
|
—
|
|
$
|
—
|
|
$
|
35,108
|
|
|||||
|
Year ended December 31, 2014
|
$
|
35,108
|
|
$
|
(1,793
|
)
|
$
|
(817
|
)
|
$
|
—
|
|
$
|
—
|
|
$
|
32,498
|
|
|||||
97
|
(b)
|
The following Exhibits are included in this Annual Report on Form 10-K:
|
|
Exhibit
Number
|
Description
|
Form
|
Date
|
Exhibit
Number
Incorporated
by reference
herein
|
Filed
herewith
|
|
|
3.1
|
Amended and Restated Certificate of Incorporation of registrant
|
Form S-1, as amended (File No. 333-49932)
|
12/28/2000
|
3.1
|
||
|
3.2
|
Amended and Restated Bylaws of registrant
|
Form 8-K
|
2/29/2012
|
3.2
|
||
|
3.3
|
Certificate of Designations of Rights, Preferences and Privileges of Series A Participating Preferred Stock registrant
|
Form 8-K
|
10/27/2005
|
3.1
|
||
|
4.1
|
Form of Specimen Common Stock Certificate
|
Form S-1, as amended (File No. 333-49932)
|
1/17/2001
|
4.1
|
||
|
4.2
|
Preferred Stock Rights Agreement dated October 25 between the registrant and EquiServe Trust Company, N.A.
|
Form 8-K
|
10/27/2005
|
4.1
|
||
|
10.1†
|
Registrant’s 2001 Stock Incentive Plan
|
Form S-1
as amended (File
No. 333-49932)
|
12/28/2000
|
10.13
|
||
|
10.2†
|
Form of option agreement under Align’s 2001 Stock Incentive Plan
|
Form 10-Q
|
11/5/2004
|
10/13/2001
|
||
|
10.3†
|
Registrant’s Employee Stock Purchase Plan.
|
Form S-8
|
2/5/2001
|
99.2
|
||
|
10.4
|
Align’s 2010 Employee Stock Purchase Plan
|
Form 8-K
|
5/25/2010
|
10.2
|
||
|
10.5†
|
Form of Indemnification Agreement by and between registrant and its Board of Directors and its executive officers
|
Form S-1 as amended (File No. 333-49932)
|
1/17/2001
|
10.15
|
||
|
10.6†
|
Amended and restated 2005 Incentive Plan (as amended May 19, 2011
|
Form 8-K
|
5/25/2010
|
10.1
|
||
|
10.7†
|
Form of restricted stock unit award agreement under registrant’s 2005 Incentive Plan (General Form; Officer Form: Director Form)
|
Form 10-Q
|
11/5/2007
|
10.1A,
10.1B, 10.1C |
||
|
10.8†
|
Form of option award agreement under registrant’s 2005 Incentive Plan
|
Form 10-Q
|
8/4/2005
|
10.4
|
||
|
10.9†
|
Form of restricted stock unit award agreement under registrant’s 2005 Incentive Plan with Thomas M. Prescott
|
Form 10-K
|
3/12/2007
|
10.14C
|
||
|
10.10†
|
Form of restricted stock unit award agreement amendment under registrant’s 2005 Incentive Plan with Thomas M. Prescott
|
Form 10-K
|
3/12/2007
|
10.14D
|
||
|
10.11†
|
Amended and Restated Employment Agreement dated November 8, 2012 between Thomas M. Prescott and registrant
|
Form 10-Q
|
5/8/2008
|
10.3
|
||
|
10.12†
|
Form of Amended and Restated Employment Agreement entered into by and between registrant and each of executive officer (other than CEO)
|
Form 10-Q
|
5/8/2008
|
10.2
|
||
|
10.13
|
Credit Agreement dated March 22, 2013 between registrant and Wells Fargo National Association
|
Form 8-K
|
3/27/2013
|
10.1
|
||
98
|
Exhibit
Number
|
Description
|
Form
|
Date
|
Exhibit
Number
Incorporated
by reference
herein
|
Filed
herewith
|
|
|
10.14
|
Lease Agreement dated February 26, 2003 between KPMG FIDES (Costa Rica) S.A., Parque Global S.A.A. and registrant
|
Form 10-Q
|
5/13/2003
|
10.36
|
||
|
10.15
|
Omnibus Amendment to Lease and Service Agreement between KPMG FIDES (Costa Rica) S.A., Parque Global S.A. and Align dated June 24, 2008
|
Form 8-K
|
6/26/2008
|
10.1
|
||
|
10.16
|
Lease Agreement between Align and Carr N.P. Properties, L.L.C. dated January 26, 2010
|
Form 8-K
|
1/29/2010
|
10.1
|
||
|
10.17
|
Settlement Agreement dated as of August 16, 2009 between Align Technology, Inc. and Ormco Corporation
|
Form 10-Q/A
|
2/24/2010
|
10.1
|
||
|
10.18
|
Stock Purchase Agreement dated as of the 16th day of August by and between Align Technology, Inc. and Danaher Corporation
|
Form 10-Q
|
11/5/2009
|
10.2
|
||
|
10.19††
|
Joint Development, Marketing and Sales Agreement entered in as of August 16, 2009 by and between Align Technology, Inc. and Ormco Corporation
|
Form 10-Q/A
|
2/24/2010
|
10.3
|
||
|
10.20†
|
Summary of 2013 Incentive Awards for Named Executive Officers.
|
Form 8-K
|
2/8/2014
|
|||
|
10.21†
|
Form of Market Stock Unit Agreement (officer)
|
Form 8-K
|
2/23/2011
|
10.1
|
||
|
10.22†
|
Form of Market Stock Unit Agreement (CEO)
|
Form 8-K
|
2/23/2011
|
10.2
|
||
|
10.23†
|
Description of Executive Officer Incentive Plan
|
Form 8-K
|
2/23/2011
|
Item 5.02
|
||
|
10.24
|
Agreement of Plan Merger between Registrant and Cadent Holdings, Inc. amongst other dated March 29, 2011
|
Form 8-K
|
4/1/2011
|
10.1
|
||
|
10.25
|
Credit Agreement dated March 22, 2013 between Align Technology, Inc. and Wells Fargo Bank, National Association
|
Form 8-K
|
3/27/2013
|
10.1
|
||
|
10.26
|
Transition Agreement dated March 4, 2013 between Align Technology, Inc. and Kenneth B. Arola
|
Form 10-Q
|
5/3/2013
|
10.1
|
||
|
10.27
|
Offer Letter dated June 12, 2013 between Align Technology, Inc. and David L. White
|
Form 8-K
|
7/18/2013
|
10.1
|
||
|
10.28
|
Employment Agreement between Align Technology, Inc. and David L. White
|
Form 8-K
|
8/5/2013
|
10.1
|
||
|
10.29
|
Fixed Dollar Accelerated Repurchase Transaction Agreement dated April 28, 2014 between Goldman, Sachs & Co. and registrant
|
Form 10-Q
|
7/31/2014
|
10.29
|
||
|
21.1
|
Subsidiaries of Align Technology, Inc.
|
*
|
||||
|
23.1
|
Consent of PricewaterhouseCoopers LLP, Independent Registered Public Accounting Firm
|
*
|
||||
|
31.1
|
Certifications of Chief Executive Officer pursuant to Exchange Act Rules 13a-14(a) and 15d-14(a), as adopted pursuant to Section 302 of the Sarbanes-Oxley Act of 2003
|
*
|
||||
|
31.2
|
Certifications of Chief Financial Officer pursuant to Exchange Act Rules 13a-14(a) and 15d-14(a), as adopted pursuant to Section 302 of the Sarbanes-Oxley Act of 2003
|
*
|
||||
|
32
|
Certification of Chief Executive Officer and Chief Financial Officer pursuant to 18 U.S.C. Section 1350, as adopted pursuant to Section 906 of the Sarbanes-Oxley Act of 2003
|
*
|
||||
|
101.INS
|
XBRL Instance Document
|
*
|
||||
|
101.SCH
|
XBRL Taxonomy Extension Schema Document
|
*
|
||||
|
101.CAL
|
XBRL Taxonomy Extension Calculation Linkbase Document
|
*
|
||||
|
101.DEF
|
XBRL Taxonomy Extension Definition Linkbase Document
|
*
|
||||
99
|
Exhibit
Number
|
Description
|
Form
|
Date
|
Exhibit
Number
Incorporated
by reference
herein
|
Filed
herewith
|
|
|
101.LAB
|
XBRL Taxonomy Extension Label Linkbase Document
|
*
|
||||
|
101.PRE
|
XBRL Taxonomy Extension Presentation Linkbase Document
|
*
|
||||
__________________________________
|
†
|
Management contract or compensatory plan or arrangement filed as an Exhibit to this form pursuant to Items 14(a) and 14(c) of Form 10-K.
|
|
††
|
Portions of the exhibit have been omitted pursuant to a request for confidential treatment. The confidential portions have been filed with the SEC.
|
100
SIGNATURES
Pursuant to the requirements of Section 13 or 15(d) of the Securities Exchange Act of 1934, the Registrant has duly caused this report to be signed on its behalf by the undersigned, thereunto duly authorized, on
February 26, 2015
.
|
ALIGN TECHNOLOGY, INC.
|
|
|
By:
|
/
S
/ T
HOMAS
M. P
RESCOTT
|
|
Thomas M. Prescott
|
|
|
President and Chief Executive Officer
|
|
Know All Men By These Presents, that each person whose signature appears below constitutes and appoints Thomas M. Prescott, his or her attorney-in-fact, with the power of substitution, for him or her in any and all capacities, to sign any amendments to this Report on Form 10-K and to file the same, with exhibits thereto and other documents in connection therewith, with the Securities and Exchange Commission, hereby ratifying and confirming all that each of said attorneys-in-fact, or his or her substitute or substitutes, may do or cause to be done by virtue hereof.
Pursuant to the requirements of the Securities Exchange Act of 1934, this report has been signed below by the following persons on behalf of the Registrant and in the capacities and on the dates indicated.
|
Signature
|
|
Title
|
|
Date
|
|
/S/ THOMAS M. PRESCOTT
|
|
President and Chief Executive Officer (Principal Executive Officer)
|
|
February 26, 2015
|
|
Thomas M. Prescott
|
||||
|
/S/ DAVID L.WHITE
|
|
Chief Financial Officer (Principal Financial Officer and Principal Accounting Officer)
|
|
February 26, 2015
|
|
David L. White
|
||||
|
/S/ JOSEPH LACOB
|
|
Director
|
|
February 26, 2015
|
|
Joseph Lacob
|
||||
|
/S/ C. RAYMOND LARKIN
|
|
Director
|
|
February 26, 2015
|
|
C. Raymond Larkin
|
||||
|
/S/ GEORGE J. MORROW
|
|
Director
|
|
February 26, 2015
|
|
George J. Morrow
|
||||
|
/S/ DAVID C. NAGEL
|
|
Director
|
|
February 26, 2015
|
|
David C. Nagel
|
||||
|
/S/ ANDREA L. SAIA
|
Director
|
February 26, 2015
|
||
|
Andrea L. Saia
|
||||
|
/S/ GREG J. SANTORA
|
|
Director
|
|
February 26, 2015
|
|
Greg J. Santora
|
||||
|
/S/ WARREN S. THALER
|
|
Director
|
|
February 26, 2015
|
|
Warren S. Thaler
|
||||
101
Exhibit Index
|
Exhibit
Number
|
Description
|
Form
|
Date
|
Exhibit
Number
Incorporated
by reference
herein
|
Filed
herewith
|
|
|
3.1
|
Amended and Restated Certificate of Incorporation of registrant
|
Form S-1, as amended (File No. 333-49932)
|
12/28/2000
|
3.1
|
||
|
3.2
|
Amended and Restated Bylaws of registrant
|
Form 8-K
|
2/29/2012
|
3.2
|
||
|
3.3
|
Certificate of Designations of Rights, Preferences and Privileges of Series A Participating Preferred Stock registrant
|
Form 8-K
|
10/27/2005
|
3.1
|
||
|
4.1
|
Form of Specimen Common Stock Certificate
|
Form S-1, as amended (File No. 333-49932)
|
1/17/2001
|
4.1
|
||
|
4.2
|
Preferred Stock Rights Agreement dated October 25 between the registrant and EquiServe Trust Company, N.A.
|
Form 8-K
|
10/27/2005
|
4.1
|
||
|
10.1†
|
Registrant’s 2001 Stock Incentive Plan
|
Form S-1
as amended (File
No. 333-49932)
|
12/28/2000
|
10.13
|
||
|
10.2†
|
Form of option agreement under Align’s 2001 Stock Incentive Plan
|
Form 10-Q
|
11/5/2004
|
10/13/2001
|
||
|
10.3†
|
Registrant’s Employee Stock Purchase Plan.
|
Form S-8
|
2/5/2001
|
99.2
|
||
|
10.4
|
Align’s 2010 Employee Stock Purchase Plan
|
Form 8-K
|
5/25/2010
|
10.2
|
||
|
10.5†
|
Form of Indemnification Agreement by and between registrant and its Board of Directors and its executive officers
|
Form S-1 as amended (File No. 333-49932)
|
1/17/2001
|
10.15
|
||
|
10.6†
|
Amended and restated 2005 Incentive Plan (as amended May 19, 2011
|
Form 8-K
|
5/25/2010
|
10.1
|
||
|
10.7†
|
Form of restricted stock unit award agreement under registrant’s 2005 Incentive Plan (General Form; Officer Form: Director Form)
|
Form 10-Q
|
11/5/2007
|
10.1A,
10.1B, 10.1C |
||
|
10.8†
|
Form of option award agreement under registrant’s 2005 Incentive Plan
|
Form 10-Q
|
8/4/2005
|
10.4
|
||
|
10.9†
|
Form of restricted stock unit award agreement under registrant’s 2005 Incentive Plan with Thomas M. Prescott
|
Form 10-K
|
3/12/2007
|
10.14C
|
||
|
10.10†
|
Form of restricted stock unit award agreement amendment under registrant’s 2005 Incentive Plan with Thomas M. Prescott
|
Form 10-K
|
3/12/2007
|
10.14D
|
||
|
10.11†
|
Amended and Restated Employment Agreement dated November 8, 2012 between Thomas M. Prescott and registrant
|
Form 10-Q
|
5/8/2008
|
10.3
|
||
|
10.12†
|
Form of Amended and Restated Employment Agreement entered into by and between registrant and each of executive officer (other than CEO)
|
Form 10-Q
|
5/8/2008
|
10.2
|
||
|
10.13
|
Credit Agreement dated March 22, 2013 between registrant and Wells Fargo National Association
|
Form 8-K
|
3/27/2013
|
10.1
|
||
|
10.14
|
Lease Agreement dated February 26, 2003 between KPMG FIDES (Costa Rica) S.A., Parque Global S.A.A. and registrant
|
Form 10-Q
|
5/13/2003
|
10.36
|
||
102
|
Exhibit
Number
|
Description
|
Form
|
Date
|
Exhibit
Number
Incorporated
by reference
herein
|
Filed
herewith
|
|
|
10.15
|
Omnibus Amendment to Lease and Service Agreement between KPMG FIDES (Costa Rica) S.A., Parque Global S.A. and Align dated June 24, 2008
|
Form 8-K
|
6/26/2008
|
10.1
|
||
|
10.16
|
Lease Agreement between Align and Carr N.P. Properties, L.L.C. dated January 26, 2010
|
Form 8-K
|
1/29/2010
|
10.1
|
||
|
10.17
|
Settlement Agreement dated as of August 16, 2009 between Align Technology, Inc. and Ormco Corporation
|
Form 10-Q/A
|
2/24/2010
|
10.1
|
||
|
10.18
|
Stock Purchase Agreement dated as of the 16th day of August by and between Align Technology, Inc. and Danaher Corporation
|
Form 10-Q
|
11/5/2009
|
10.2
|
||
|
10.19††
|
Joint Development, Marketing and Sales Agreement entered in as of August 16, 2009 by and between Align Technology, Inc. and Ormco Corporation
|
Form 10-Q/A
|
2/24/2010
|
10.3
|
||
|
10.20†
|
Summary of 2013 Incentive Awards for Named Executive Officers.
|
Form 8-K
|
2/8/2014
|
|||
|
10.21†
|
Form of Market Stock Unit Agreement (officer)
|
Form 8-K
|
2/23/2011
|
10.1
|
||
|
10.22†
|
Form of Market Stock Unit Agreement (CEO)
|
Form 8-K
|
2/23/2011
|
10.2
|
||
|
10.23†
|
Description of Executive Officer Incentive Plan
|
Form 8-K
|
2/23/2011
|
Item 5.02
|
||
|
10.24
|
Agreement of Plan Merger between Registrant and Cadent Holdings, Inc. amongst other dated March 29, 2011
|
Form 8-K
|
4/1/2011
|
10.1
|
||
|
10.25
|
Credit Agreement dated March 22, 2013 between Align Technology, Inc. and Wells Fargo Bank, National Association
|
Form 8-K
|
3/27/2013
|
10.1
|
||
|
10.26
|
Transition Agreement dated March 4, 2013 between Align Technology, Inc. and Kenneth B. Arola
|
Form 10-Q
|
5/3/2013
|
10.1
|
||
|
10.27
|
Offer Letter dated June 12, 2013 between Align Technology, Inc. and David L. White
|
Form 8-K
|
7/18/2013
|
10.1
|
||
|
10.28
|
Employment Agreement between Align Technology, Inc. and David L. White
|
Form 8-K
|
8/5/2013
|
10.1
|
||
|
10.29
|
Fixed Dollar Accelerated Repurchase Transaction Agreement dated April 28, 2014 between Goldman, Sachs & Co. and registrant
|
Form 10-Q
|
7/31/2014
|
10.29
|
||
|
21.1
|
Subsidiaries of Align Technology, Inc.
|
*
|
||||
|
23.1
|
Consent of PricewaterhouseCoopers LLP, Independent Registered Public Accounting Firm
|
*
|
||||
|
31.1
|
Certifications of Chief Executive Officer pursuant to Exchange Act Rules 13a-14(a) and 15d-14(a), as adopted pursuant to Section 302 of the Sarbanes-Oxley Act of 2003
|
*
|
||||
|
31.2
|
Certifications of Chief Financial Officer pursuant to Exchange Act Rules 13a-14(a) and 15d-14(a), as adopted pursuant to Section 302 of the Sarbanes-Oxley Act of 2003
|
*
|
||||
|
32
|
Certification of Chief Executive Officer and Chief Financial Officer pursuant to 18 U.S.C. Section 1350, as adopted pursuant to Section 906 of the Sarbanes-Oxley Act of 2003
|
*
|
||||
|
101.INS
|
XBRL Instance Document
|
*
|
||||
|
101.SCH
|
XBRL Taxonomy Extension Schema Document
|
*
|
||||
|
101.CAL
|
XBRL Taxonomy Extension Calculation Linkbase Document
|
*
|
||||
|
101.DEF
|
XBRL Taxonomy Extension Definition Linkbase Document
|
*
|
||||
|
101.LAB
|
XBRL Taxonomy Extension Label Linkbase Document
|
*
|
||||
103
|
Exhibit
Number
|
Description
|
Form
|
Date
|
Exhibit
Number
Incorporated
by reference
herein
|
Filed
herewith
|
|
|
101.PRE
|
XBRL Taxonomy Extension Presentation Linkbase Document
|
*
|
||||
__________________________________
|
†
|
Management contract or compensatory plan or arrangement filed as an Exhibit to this form pursuant to Items 14(a) and 14(c) of Form 10-K.
|
|
††
|
Portions of the exhibit have been omitted pursuant to a request for confidential treatment. The confidential portions have been filed with the SEC.
|
104
TABLE OF CONTENTS
Part IItem 1. BusinessItem 1A Of This Annual Report on Form 10-k Under The Heading Risk FactorsItem 1A. Risk FactorsItem 1B. Unresolved Staff CommentsItem 2. PropertiesItem 3. Legal ProceedingsItem 4. Mine Safety DisclosuresPart IIItem 5. Market For Registrant S Common Equity, Related Stockholder Matters and Issuer Purchases Of Equity SecuritiesItem 6. Selected Consolidated Financial DataItem 7. Management S Discussion and Analysis Of Financial Condition and Results Of OperationsItem 7A. Quantitative and Qualitative Disclosures About Market RiskItem 8. Consolidated Financial Statements and Supplementary DataNote 1. Summary Of Significant Accounting PoliciesNote 2. Marketable Securities and Fair Value MeasurementsNote 3. Balance Sheet ComponentsNote 4. Business CombinationsNote 5. Goodwill and Intangible AssetsNote 6. Legal ProceedingsNote 7. Credit FacilitiesNote 8. Commitments and ContingenciesNote 9. Stockholders EquityNote 10. Common Stock Repurchase ProgramNote 11. Employee Benefit PlansNote 12. Income TaxesNote 13. Net Income Per ShareNote 14. Supplemental Cash Flow InformationNote 15. Segments and Geographical InformationItem 9. Changes in and Disagreements with Accountants on Accounting and Financial DisclosureItem 9A. Controls and ProceduresItem 9B. Other InformationPart IIIItem 10. Directors, Executive Officers and Corporate GovernanceItem 1 Business Of This Annual Report on Form 10-kItem 11. Executive CompensationItem 12. Security Ownership Of Certain Beneficial Owners and Management and Related Stockholder MattersNote 10 Stockholders Equity in The Notes To Our Consolidated Financial StatementsItem 13. Certain Relationships and Related Transactions, and Director IndependenceItem 14. Principal Accounting Fees and ServicesPart IVItem 15. Exhibits, Financial Statement Schedules