ALIGN TECHNOLOGY INC
10-Ks and 10-Qs
|
|
|
|
|
|
|
|
|
|
|
|
|
|
|
|
|
|
|
|
|
|
|
|
|
|
|
|
|
|
|
|
|
|
|
|
|
|
|
|
|
|
|
|
|
|
|
|
|
|
|
|
|
|
|
|
UNITED STATES
SECURITIES AND EXCHANGE COMMISSION
Washington, D.C. 20549
____________________________
FORM 10-Q
____________________________
(Mark One)
|
x
|
QUARTERLY REPORT PURSUANT TO SECTION 13 OR 15(d) OF THE SECURITIES EXCHANGE ACT OF 1934
|
For the quarterly period ended
September 30, 2013
OR
|
¨
|
TRANSITION REPORT PURSUANT TO SECTION 13 OR 15(d) OF THE SECURITIES EXCHANGE ACT OF 1934
|
For the transition period from to
Commission file number: 0-32259
____________________________
ALIGN TECHNOLOGY, INC.
(Exact name of registrant as specified in its charter)
____________________________
|
Delaware
|
94-3267295
|
|
(State or other jurisdiction of
incorporation or organization)
|
(I.R.S. Employer
Identification Number)
|
2560 Orchard Parkway
San Jose, California 95131
(Address of principal executive offices)
(408) 470-1000
(Registrant’s telephone number, including area code)
____________________________
Indicate by check mark whether the registrant (1) has filed all reports required to be filed by Section 13 or 15(d) of the Securities Exchange Act of 1934 during the preceding 12 months (or for such shorter period that the registrant was required to file such reports), and (2) has been subject to such filing requirements for the past 90 days. Yes
x
No
¨
Indicate by check mark whether the registrant has submitted electronically and posted on its corporate Web site, if any, every Interactive Data File required to be submitted and posted pursuant to Rule 405 of Regulation S-T (§232.405 of this chapter) during the preceding 12 months (or for such shorter period that the registrant was required to submit and post such files). Yes
x
No
¨
Indicate by check mark whether the registrant is a large accelerated filer, an accelerated filer, a non-accelerated filer, or a smaller reporting company. See definitions of “large accelerated filer,” “accelerated filer,” and “smaller reporting company” in Rule 12b-2 of the Exchange Act. (Check one):
|
Large accelerated filer
|
x
|
Accelerated filer
|
¨
|
|
Non-accelerated filer
|
o
(Do not check if a smaller reporting company)
|
Smaller reporting company
|
¨
|
Indicate by check mark whether the registrant is a shell company (as defined in Rule 12b-2 of the Exchange Act). Yes
¨
No
x
The number of shares outstanding of the registrant’s Common Stock, $0.0001 par value, as of October 25, 2013 was
80,318,743
.
ALIGN TECHNOLOGY, INC.
INDEX
|
PART I
|
||
|
ITEM 1.
|
||
|
ITEM 2.
|
||
|
ITEM 3.
|
||
|
ITEM 4.
|
||
|
PART II
|
||
|
ITEM 1.
|
||
|
ITEM 1A.
|
||
|
ITEM 2.
|
||
|
ITEM 3.
|
||
|
ITEM 4.
|
||
|
ITEM 5.
|
||
|
ITEM 6.
|
||
Invisalign, Align, ClinCheck, Invisalign Assist, Invisalign Teen, Invisalign Express, Invisalign Lite, Vivera, SmartForce, SmartTrack, Power Ridges, iTero, Orthocad iCast and Orthocad iRecord amongst others, are trademarks belonging to Align Technology, Inc., and/or its subsidiaries and are pending or registered in the United States and other countries.
2
ALIGN TECHNOLOGY, INC.
(in thousands, except per share data)
(unaudited)
|
Three Months Ended
|
Nine Months Ended
|
||||||||||||||
|
|
September 30,
|
September 30,
|
|||||||||||||
|
|
2013
|
2012
|
2013
|
2012
|
|||||||||||
|
Net revenues
|
$
|
164,506
|
|
$
|
136,496
|
|
$
|
481,914
|
|
$
|
417,201
|
|
|||
|
Cost of net revenues
|
39,416
|
|
36,146
|
|
120,284
|
|
107,291
|
|
|||||||
|
Gross profit
|
125,090
|
|
100,350
|
|
361,630
|
|
309,910
|
|
|||||||
|
Operating expenses:
|
|||||||||||||||
|
Sales and marketing
|
45,224
|
|
36,468
|
|
135,352
|
|
114,272
|
|
|||||||
|
General and administrative
|
27,487
|
|
24,762
|
|
84,862
|
|
71,294
|
|
|||||||
|
Research and development
|
10,915
|
|
9,952
|
|
33,113
|
|
31,158
|
|
|||||||
|
Impairment of goodwill
|
—
|
|
24,665
|
|
40,693
|
|
24,665
|
|
|||||||
|
Impairment of long-lived assets
|
—
|
|
—
|
|
26,320
|
|
—
|
|
|||||||
|
Total operating expenses
|
83,626
|
|
95,847
|
|
320,340
|
|
241,389
|
|
|||||||
|
Income from operations
|
41,464
|
|
4,503
|
|
41,290
|
|
68,521
|
|
|||||||
|
Interest and other income (expenses), net
|
449
|
|
(353
|
)
|
(874
|
)
|
(624
|
)
|
|||||||
|
Net income before provision for income taxes
|
41,913
|
|
4,150
|
|
40,416
|
|
67,897
|
|
|||||||
|
Provision for income taxes
|
7,376
|
|
4,494
|
|
18,542
|
|
18,765
|
|
|||||||
|
Net income (loss)
|
$
|
34,537
|
|
$
|
(344
|
)
|
$
|
21,874
|
|
$
|
49,132
|
|
|||
|
Net income (loss) per share:
|
|||||||||||||||
|
Basic
|
$
|
0.43
|
|
$
|
(0.00
|
)
|
$
|
0.27
|
|
$
|
0.61
|
|
|||
|
Diluted
|
$
|
0.42
|
|
$
|
(0.00
|
)
|
$
|
0.26
|
|
$
|
0.59
|
|
|||
|
Shares used in computing net income (loss) per share:
|
|||||||||||||||
|
Basic
|
79,967
|
|
81,437
|
|
80,592
|
|
80,356
|
|
|||||||
|
Diluted
|
81,848
|
|
81,437
|
|
82,549
|
|
83,016
|
|
|||||||
The accompanying notes are an integral part of these unaudited condensed consolidated financial statements.
3
ALIGN TECHNOLOGY, INC.
CONDENSED CONSOLIDATED STATEMENTS OF COMPREHENSIVE INCOME (LOSS)
(in thousands)
(unaudited)
|
Three Months Ended
|
Nine Months Ended
|
||||||||||||||
|
|
September 30,
|
September 30,
|
|||||||||||||
|
|
2013
|
2012
|
2013
|
2012
|
|||||||||||
|
Net income (loss)
|
$
|
34,537
|
|
$
|
(344
|
)
|
$
|
21,874
|
|
$
|
49,132
|
|
|||
|
Net change in cumulative translation adjustment
|
171
|
|
248
|
|
109
|
|
(108
|
)
|
|||||||
|
Change in unrealized gains on available-for-sale securities, net of tax
|
203
|
|
73
|
|
20
|
|
43
|
|
|||||||
|
Other comprehensive income (loss)
|
374
|
|
321
|
|
129
|
|
(65
|
)
|
|||||||
|
Comprehensive income (loss)
|
$
|
34,911
|
|
$
|
(23
|
)
|
$
|
22,003
|
|
$
|
49,067
|
|
|||
The accompanying notes are an integral part of these unaudited condensed consolidated financial statements.
4
ALIGN TECHNOLOGY, INC.
(in thousands, except per share data)
|
September 30,
2013 |
December 31,
2012 |
||||||
|
(unaudited)
|
|||||||
|
ASSETS
|
|||||||
|
Current assets:
|
|||||||
|
Cash and cash equivalents
|
$
|
175,839
|
|
$
|
306,386
|
|
|
|
Marketable securities, short-term
|
147,740
|
|
28,485
|
|
|||
|
Accounts receivable, net of allowances for doubtful accounts, credit reserves and returns of $1,724 and $3,167, respectively
|
109,179
|
|
98,992
|
|
|||
|
Inventories
|
14,662
|
|
15,122
|
|
|||
|
Prepaid expenses and other current assets
|
34,839
|
|
36,808
|
|
|||
|
Total current assets
|
482,259
|
|
485,793
|
|
|||
|
Marketable securities, long-term
|
76,836
|
|
21,252
|
|
|||
|
Property, plant and equipment, net
|
76,552
|
|
79,191
|
|
|||
|
Goodwill
|
61,745
|
|
99,236
|
|
|||
|
Intangible assets, net
|
24,362
|
|
45,777
|
|
|||
|
Deferred tax assets
|
28,822
|
|
21,609
|
|
|||
|
Other assets
|
8,630
|
|
3,454
|
|
|||
|
Total assets
|
$
|
759,206
|
|
$
|
756,312
|
|
|
|
LIABILITIES AND STOCKHOLDERS’ EQUITY
|
|||||||
|
Current liabilities:
|
|||||||
|
Accounts payable
|
$
|
19,157
|
|
$
|
19,549
|
|
|
|
Accrued liabilities
|
73,714
|
|
74,247
|
|
|||
|
Deferred revenues
|
70,397
|
|
61,975
|
|
|||
|
Total current liabilities
|
163,268
|
|
155,771
|
|
|||
|
Other long-term liabilities
|
20,254
|
|
19,224
|
|
|||
|
Total liabilities
|
183,522
|
|
174,995
|
|
|||
|
Commitments and contingencies (Note 8)
|
|
|
|||||
|
Stockholders’ equity:
|
|||||||
|
Preferred stock, $0.0001 par value (5,000 shares authorized; none issued)
|
—
|
|
—
|
|
|||
|
Common stock, $0.0001 par value (200,000 shares authorized; 80,114 and 80,611 issued and outstanding at 2013 and 2012, respectively)
|
8
|
|
8
|
|
|||
|
Additional paid-in capital
|
713,676
|
|
670,732
|
|
|||
|
Accumulated other comprehensive income
|
332
|
|
203
|
|
|||
|
Accumulated deficit
|
(138,332
|
)
|
(89,626
|
)
|
|||
|
Total stockholders’ equity
|
575,684
|
|
581,317
|
|
|||
|
Total liabilities and stockholders’ equity
|
$
|
759,206
|
|
$
|
756,312
|
|
|
The accompanying notes are an integral part of these unaudited condensed consolidated financial statements.
5
ALIGN TECHNOLOGY, INC.
(in thousands)
(unaudited)
|
|
Nine Months Ended
|
||||||
|
September 30,
|
|||||||
|
|
2013
|
2012
|
|||||
|
CASH FLOWS FROM OPERATING ACTIVITIES:
|
|||||||
|
Net income
|
$
|
21,874
|
|
$
|
49,132
|
|
|
|
Adjustments to reconcile net income to net cash provided by operating activities:
|
|||||||
|
Deferred taxes
|
14,501
|
|
13,165
|
|
|||
|
Depreciation and amortization
|
12,647
|
|
12,544
|
|
|||
|
Stock-based compensation
|
21,265
|
|
15,504
|
|
|||
|
Excess tax benefit from share-based compensation arrangements
|
(21,849
|
)
|
(18,140
|
)
|
|||
|
Impairment of goodwill
|
40,693
|
|
24,665
|
|
|||
|
Impairment of long-lived assets
|
26,320
|
|
—
|
|
|||
|
Provision for doubtful accounts, credit reserves and returns
|
1,200
|
|
2,660
|
|
|||
|
Other non-cash income
|
—
|
|
80
|
|
|||
|
Changes in assets and liabilities, net of effects of acquisition:
|
|||||||
|
Accounts receivable
|
(5,936
|
)
|
(17,352
|
)
|
|||
|
Inventories
|
467
|
|
(5,735
|
)
|
|||
|
Prepaid expenses and other assets
|
256
|
|
(1,620
|
)
|
|||
|
Accounts payable
|
(318
|
)
|
(3,888
|
)
|
|||
|
Accrued and other long-term liabilities
|
(671
|
)
|
(669
|
)
|
|||
|
Deferred revenues
|
8,415
|
|
12,674
|
|
|||
|
Net cash provided by operating activities
|
118,864
|
|
83,020
|
|
|||
|
CASH FLOWS FROM INVESTING ACTIVITIES:
|
|||||||
|
Acquisition, net of cash acquired
|
(7,652
|
)
|
—
|
|
|||
|
Purchase of property, plant and equipment
|
(15,172
|
)
|
(31,485
|
)
|
|||
|
Purchase of marketable securities
|
(213,990
|
)
|
(53,862
|
)
|
|||
|
Proceeds from maturities of marketable securities
|
32,229
|
|
16,067
|
|
|||
|
Proceeds from sales of marketable securities
|
6,943
|
|
1,296
|
|
|||
|
Other investing activities
|
(2,347
|
)
|
2,336
|
|
|||
|
Net cash used in investing activities
|
(199,989
|
)
|
(65,648
|
)
|
|||
|
CASH FLOWS FROM FINANCING ACTIVITIES:
|
|||||||
|
Proceeds from issuance of common stock
|
28,291
|
|
40,194
|
|
|||
|
Common stock repurchase
|
(95,105
|
)
|
(9,796
|
)
|
|||
|
Excess tax benefit from share-based compensation arrangements
|
21,849
|
|
18,140
|
|
|||
|
Employees’ taxes paid upon the vesting of restricted stock units
|
(3,931
|
)
|
(1,719
|
)
|
|||
|
Other payments for financing activities
|
(6
|
)
|
—
|
|
|||
|
Net cash (used in) provided by financing activities
|
(48,902
|
)
|
46,819
|
|
|||
|
Effect of foreign exchange rate changes on cash and cash equivalents
|
(520
|
)
|
41
|
|
|||
|
Net increase (decrease) in cash and cash equivalents
|
(130,547
|
)
|
64,232
|
|
|||
|
Cash and cash equivalents, beginning of the period
|
306,386
|
|
240,675
|
|
|||
|
Cash and cash equivalents, end of the period
|
$
|
175,839
|
|
$
|
304,907
|
|
|
The accompanying notes are an integral part of these unaudited condensed consolidated financial statements.
6
ALIGN TECHNOLOGY, INC.
NOTES TO CONDENSED CONSOLIDATED FINANCIAL STATEMENTS
(unaudited)
Basis of presentation
The accompanying unaudited Condensed Consolidated Financial Statements have been prepared by Align Technology, Inc. (“we”, “our”, or “Align”) in accordance with the rules and regulations of the Securities and Exchange Commission ("SEC") and contain all adjustments, including normal recurring adjustments, necessary to present fairly our results of operations for the
three
and
nine
months ended
September 30, 2013
and
2012
, our comprehensive income (loss) for the
three
and
nine
months ended
September 30, 2013
and
2012
, our financial position as of
September 30, 2013
and our cash flows for the
nine
months ended
September 30, 2013
and
2012
. The Condensed Consolidated Balance Sheet as of
December 31, 2012
was derived from the
December 31, 2012
audited financial statements. Net revenues by geographic area for prior period amounts in Note 13 have been reclassified to conform with the current period presentation. These reclassifications had no impact on our financial position for the
three
and
nine
months ended
September 30, 2013
and
2012
.
The results of operations for the
three
and
nine
months ended
September 30, 2013
are not necessarily indicative of the results that may be expected for the year ending
December 31, 2013
or any other future period, and we make no representations related thereto. The information included in this Quarterly Report on Form 10-Q should be read in conjunction with “Management’s Discussion and Analysis of Financial Condition and Results of Operations,” “Quantitative and Qualitative Disclosures About Market Risk” and the Consolidated Financial Statements and notes thereto included in Items 7, 7A and 8, respectively, in our Annual Report on Form 10-K for the year ended
December 31, 2012
.
Use of estimates
The preparation of financial statements in conformity with generally accepted accounting principles ("GAAP") in the United States of America (“U.S.”) requires our management to make estimates and assumptions that affect the amounts reported in the consolidated financial statements and accompanying notes. Actual results could differ materially from those estimates. On an ongoing basis, we evaluate our estimates, including those related to the fair values of financial instruments, long-lived assets and goodwill, useful lives of intangible assets and property and equipment, stock-based compensation, income taxes, and contingent liabilities, among others. We base our estimates on historical experience and on various other assumptions that are believed to be reasonable, the results of which form the basis for making judgments about the carrying values of assets and liabilities.
Recent Accounting Pronouncements
In February 2013, the Financial Accounting Standards Board ("FASB") issued Accounting Standards Update ("ASU") 2013-02, “Reporting of Amounts Reclassified Out of Accumulated Other Comprehensive Income ("AOCI")”. This standard requires reporting, in one place, information about reclassifications out of AOCI by component. An entity is required to present, either on the face of the financial statements or in the notes, significant amounts reclassified out of AOCI by the respective line items of net income, but only if the amount is reclassified in its entirety in the same reporting period. For amounts that are not required to be reclassified to net income in their entirety, an entity is required to cross-reference to other currently required disclosures that provide additional detail about those amounts. The information required by this standard must be presented in one place, either parenthetically on the face of the financial statements by income statement line item or in a note. The adoption of this guidance during our first quarter of 2013 did not have a material impact to our condensed consolidated financial statements.
In July 2013, FASB issued ASU 2013-11, "Presentation of an Unrecognized Tax Benefit when a Net Operating Loss Carryforward, a Similar Tax Loss, or a Tax Credit Carryforward Exists (a consensus of the FASB Emerging Issues Task Force)." The amendments in this ASU provide guidance on the financial statements presentation of an unrecognized tax benefit when a net operating loss carryforward, a similar tax loss, or a tax credit carryforward exists. An unrecognized tax benefit should be presented in the financial statements as a reduction to a deferred tax asset for a net operating loss carryforward, a similar tax loss, or a tax credit carryforward with certain exceptions, in which case such an unrecognized tax benefit should be presented in the financial statements as a liability. The amendments in this ASU do not require new recurring disclosures and are effective for fiscal years, and interim periods within those years, beginning after December 15, 2013. We are currently assessing the impact of this ASU on our consolidated financial statements.
7
Our short-term and long-term marketable securities as of
September 30, 2013
and
December 31, 2012
are as follows (in thousands):
Short-term
|
September 30, 2013
|
Amortized
Cost
|
Gross
Unrealized
Gains
|
Gross
Unrealized
Losses
|
Fair Value
|
|||||||||||
|
Corporate bonds
|
$
|
32,439
|
|
$
|
16
|
|
$
|
(6
|
)
|
$
|
32,449
|
|
|||
|
U.S. dollar dominated foreign corporate bonds
|
15,728
|
|
5
|
|
(3
|
)
|
15,730
|
|
|||||||
|
Commercial paper
|
57,906
|
|
16
|
|
(1
|
)
|
57,921
|
|
|||||||
|
Municipal securities
|
1,150
|
|
—
|
|
(1
|
)
|
1,149
|
|
|||||||
|
U.S. government agency bonds
|
37,474
|
|
13
|
|
—
|
|
37,487
|
|
|||||||
|
Asset-backed securities
|
3,005
|
|
—
|
|
(1
|
)
|
3,004
|
|
|||||||
|
Total Marketable Securities, Short-Term
|
$
|
147,702
|
|
$
|
50
|
|
$
|
(12
|
)
|
$
|
147,740
|
|
|||
Long-term
|
September 30, 2013
|
Amortized
Cost
|
Gross
Unrealized
Gains
|
Gross
Unrealized
Losses
|
Fair Value
|
|||||||||||
|
Corporate bonds
|
$
|
19,836
|
|
$
|
6
|
|
$
|
(20
|
)
|
$
|
19,822
|
|
|||
|
U.S. government agency bonds
|
6,148
|
|
5
|
|
—
|
|
6,153
|
|
|||||||
|
U.S. dollar dominated foreign corporate bonds
|
16,169
|
|
12
|
|
(2
|
)
|
16,179
|
|
|||||||
|
U.S. government treasury bonds
|
11,274
|
|
4
|
|
—
|
|
11,278
|
|
|||||||
|
Municipal securities
|
14,252
|
|
17
|
|
(12
|
)
|
14,257
|
|
|||||||
|
Asset-backed securities
|
9,150
|
|
1
|
|
(4
|
)
|
9,147
|
|
|||||||
|
Total Marketable Securities, Long-Term
|
$
|
76,829
|
|
$
|
45
|
|
$
|
(38
|
)
|
$
|
76,836
|
|
|||
Short-term
|
December 31, 2012
|
Amortized
Cost
|
Gross
Unrealized
Gains
|
Gross
Unrealized
Losses
|
Fair Value
|
|||||||||||
|
Corporate bonds
|
$
|
18,767
|
|
$
|
7
|
|
$
|
(4
|
)
|
$
|
18,770
|
|
|||
|
Commercial paper
|
4,646
|
|
1
|
|
—
|
|
4,647
|
|
|||||||
|
U.S. dollar dominated foreign corporate bonds
|
5,060
|
|
9
|
|
(1
|
)
|
5,068
|
|
|||||||
|
Total Marketable Securities, Short-Term
|
$
|
28,473
|
|
$
|
17
|
|
$
|
(5
|
)
|
$
|
28,485
|
|
|||
Long-term
|
December 31, 2012
|
Amortized
Cost
|
Gross
Unrealized
Gains
|
Gross
Unrealized
Losses
|
Fair Value
|
|||||||||||
|
Corporate bonds
|
$
|
16,132
|
|
$
|
16
|
|
$
|
(7
|
)
|
$
|
16,141
|
|
|||
|
U.S. government agency bonds
|
2,069
|
|
1
|
|
—
|
|
2,070
|
|
|||||||
|
U.S. dollar dominated foreign corporate bonds
|
3,038
|
|
4
|
|
(1
|
)
|
3,041
|
|
|||||||
|
Total Marketable Securities, Long-Term
|
$
|
21,239
|
|
$
|
21
|
|
$
|
(8
|
)
|
$
|
21,252
|
|
|||
For the
three
and
nine
months ended
September 30, 2013
and 2012, realized losses were immaterial. Unrealized gains and losses for our available for sale securities as of
September 30, 2013
and December 31, 2012 were also immaterial. Cash and cash equivalents are not included in the table above as the gross unrealized gains and losses are not material. We have no material short-term or long-term investments that have been in a continuous unrealized loss position for greater than twelve months as of
September 30, 2013
and December 31, 2012. Amounts reclassified to earnings from accumulated other
8
comprehensive income related to unrealized gain or losses were immaterial for the
three
and
nine
months ended
September 30, 2013
and 2012.
Our fixed-income securities investment portfolio consists of corporate bonds, U.S. dollar dominated foreign corporate bonds, commercial paper, municipal securities, U.S. government agency bonds and asset-backed securities that have a maximum maturity of
two
years. The securities that we invest in are generally deemed to be low risk based on their credit ratings from the major rating agencies. The longer the duration of these securities, the more susceptible they are to changes in market interest rates and bond yields. As interest rates increase, those securities purchased at a lower yield show a mark-to-market unrealized loss. The unrealized losses are due primarily to changes in credit spreads and interest rates. We expect to realize the full value of all these investments upon maturity or sale. The weighted average remaining duration of these securities was approximately
8 months
and
10 months
as of
September 30, 2013
and December 31, 2012, respectively.
As the carrying value approximates the fair value for our short-term and long-term marketable securities shown in the tables above, the following table summarizes the fair value of our short-term and long-term marketable securities classified by maturity as of
September 30, 2013
and December 31, 2012 (in thousands):
|
September 30,
|
December 31,
|
||||||
|
2013
|
2012
|
||||||
|
Due in one year or less
|
$
|
147,740
|
|
$
|
28,485
|
|
|
|
Due in one to two years
|
76,836
|
|
21,252
|
|
|||
|
Total available for sale short-term and long-term securities
|
$
|
224,576
|
|
$
|
49,737
|
|
|
Fair Value Measurements
We measure the fair value of our cash equivalents and marketable securities as the price that would be received from selling an asset or paid to transfer a liability in an orderly transaction between market participants at the measurement date. We use the GAAP fair value hierarchy that prioritizes the inputs to valuation techniques used to measure fair value. This hierarchy requires an entity to maximize the use of observable inputs and minimize the use of unobservable inputs when measuring fair value. The three levels of inputs that may be used to measure fair value:
Level 1
— Quoted (unadjusted) prices in active markets for identical assets or liabilities.
Our Level 1 assets consist of money market funds, commercial paper and U.S. government treasury bonds. We did not hold any Level 1 liabilities as of
September 30, 2013
or December 31, 2012.
Level 2
— Observable inputs other than quoted prices included in Level 1, such as quoted prices for similar assets or liabilities in active markets, quoted prices for identical or similar assets or liabilities in markets that are not active, or other inputs that are observable or can be corroborated by observable market data for substantially the full term of the asset or liability.
Our Level 2 assets consist of commercial paper, corporate bonds, U.S. dollar dominated foreign corporate bonds, U.S. government agency bonds, municipal securities, asset-backed securities and our Israeli severance funds that are mainly invested in insurance policies. We obtain fair values for level 2 investments from our asset manager for each of our portfolios. Our custody bank and asset managers independently use professional pricing services to gather pricing data which may include quoted market prices for identical or comparable financial instruments, or inputs other than quoted prices that are observable either directly or indirectly, and we are ultimately responsible for these underlying estimates.
We did not hold any Level 2 liabilities as of
September 30, 2013
or December 31, 2012.
Level 3
— Unobservable inputs to the valuation methodology that are supported by little or no market activity and that are significant to the measurement of the fair value of the assets or liabilities. Level 3 assets and liabilities include those whose fair value measurements are determined using pricing models, discounted cash flow methodologies or similar valuation techniques, as well as significant management judgment or estimation.
We did not hold any Level 3 assets or liabilities as of
September 30, 2013
or December 31, 2012.
9
Non-Recurring Fair Value Measurements
During the three months ended March 31, 2013, we recorded an impairment charge to our long-lived assets and goodwill of
$26.3 million
and
$40.7 million
, respectively, related to our Scanner and CAD/CAM Services ("SCCS") reporting unit as an event occurred and circumstances changed that led us to perform an impairment analysis prior to our annual test which required us to determine the fair value of the SCCS reporting unit (Refer to Note 5). These fair value measurements were calculated using unobservable inputs, using the income approach which is classified as Level 3 within the fair value hierarchy. Inputs for the income approach includes the amount and timing of future cash flows based on our most recent operational budgets, strategic plans, terminal growth rates assumptions and other estimates.
Recurring Fair Value Measurements
The following table summarizes our financial assets measured at fair value on a recurring basis as of
September 30, 2013
(in thousands):
|
Description
|
Balance as of
September 30, 2013
|
Quoted Prices in
Active Markets for
Identical Assets
(Level 1)
|
Significant Other
Observable Inputs
(Level 2)
|
||||||||
|
Cash equivalents:
|
|||||||||||
|
Money market funds
|
$
|
77,484
|
|
$
|
77,484
|
|
$
|
—
|
|
||
|
Commercial paper
|
13,247
|
|
—
|
|
13,247
|
|
|||||
|
Short-term investments:
|
|||||||||||
|
Commercial paper
|
57,921
|
|
—
|
|
57,921
|
|
|||||
|
Corporate bonds
|
32,449
|
|
—
|
|
32,449
|
|
|||||
|
U.S. dollar dominated foreign corporate bonds
|
15,730
|
|
—
|
|
15,730
|
|
|||||
|
Municipal securities
|
1,149
|
|
—
|
|
1,149
|
|
|||||
|
U.S. government agency bonds
|
37,487
|
|
—
|
|
37,487
|
|
|||||
|
Asset-backed securities
|
3,004
|
|
—
|
|
3,004
|
|
|||||
|
Long-term investments:
|
|||||||||||
|
Corporate bonds
|
19,822
|
|
—
|
|
19,822
|
|
|||||
|
U.S. government agency bonds
|
6,153
|
|
—
|
|
6,153
|
|
|||||
|
U.S. dollar dominated foreign corporate bonds
|
16,179
|
|
—
|
|
16,179
|
|
|||||
|
U.S. government treasury bonds
|
11,278
|
|
11,278
|
|
—
|
|
|||||
|
Municipal securities
|
14,257
|
|
—
|
|
14,257
|
|
|||||
|
Asset-backed securities
|
9,147
|
|
—
|
|
9,147
|
|
|||||
|
Other assets:
|
|||||||||||
|
Israeli severance funds
|
2,422
|
|
—
|
|
2,422
|
|
|||||
|
$
|
317,729
|
|
$
|
88,762
|
|
$
|
228,967
|
|
|||
10
The following table summarizes our financial assets measured at fair value on a recurring basis as of
December 31, 2012
(in thousands):
|
Description
|
Balance as of
December 31, 2012
|
Quoted Prices in
Active Markets for
Identical Assets
(Level 1)
|
Significant Other
Observable Inputs
(Level 2)
|
||||||||
|
Cash equivalents:
|
|||||||||||
|
Money market funds
|
$
|
86,166
|
|
$
|
86,166
|
|
$
|
—
|
|
||
|
Commercial paper
|
950
|
|
—
|
|
950
|
|
|||||
|
Short-term investments:
|
|||||||||||
|
Commercial paper
|
4,647
|
|
—
|
|
4,647
|
|
|||||
|
Corporate bonds
|
18,770
|
|
—
|
|
18,770
|
|
|||||
|
U.S. government agency bonds
|
5,068
|
|
—
|
|
5,068
|
|
|||||
|
Long-term investments:
|
|||||||||||
|
U.S. government agency bonds
|
2,070
|
|
—
|
|
2,070
|
|
|||||
|
Corporate bonds
|
16,141
|
|
—
|
|
16,141
|
|
|||||
|
U.S. dollar denominated foreign corporate bonds
|
3,041
|
|
—
|
|
3,041
|
|
|||||
|
Other assets:
|
|||||||||||
|
Israeli severance funds
|
2,218
|
|
—
|
|
2,218
|
|
|||||
|
$
|
139,071
|
|
$
|
86,166
|
|
$
|
52,905
|
|
|||
Inventories
Inventories are comprised of (in thousands):
|
September 30,
2013 |
December 31,
2012 |
||||||
|
Raw materials
|
$
|
6,779
|
|
$
|
7,629
|
|
|
|
Work in process
|
3,474
|
|
3,889
|
|
|||
|
Finished goods
|
4,409
|
|
3,604
|
|
|||
|
Total Inventories
|
$
|
14,662
|
|
$
|
15,122
|
|
|
Work in process includes costs to produce our clear aligner and intra-oral products. Finished goods primarily represent our intra-oral scanners and ancillary products that support our clear aligner products.
11
Accrued liabilities
Accrued liabilities consist of the following (in thousands):
|
September 30,
2013 |
December 31,
2012 |
||||||
|
Accrued compensation and benefits
|
$
|
38,270
|
|
$
|
39,621
|
|
|
|
Accrued sales rebates
|
9,383
|
|
8,333
|
|
|||
|
Accrued sales tax and value added tax
|
5,341
|
|
5,253
|
|
|||
|
Accrued sales and marketing expenses
|
3,868
|
|
4,088
|
|
|||
|
Accrued warranty
|
3,806
|
|
4,050
|
|
|||
|
Accrued accounts payable
|
3,915
|
|
2,866
|
|
|||
|
Accrued professional fees
|
1,485
|
|
2,349
|
|
|||
|
Accrued income taxes
|
1,317
|
|
572
|
|
|||
|
Other accrued liabilities
|
6,329
|
|
7,115
|
|
|||
|
Total Accrued Liabilities
|
$
|
73,714
|
|
$
|
74,247
|
|
|
Warranty
We regularly review and update the accrued warranty balances and update these balances based on historical warranty trends. Actual warranty costs incurred have not materially differed from those accrued; however, future actual warranty costs could differ from the estimated amounts.
Clear Aligner
We warrant our Invisalign products against material defects until the Invisalign case is complete. We accrue for warranty costs in cost of net revenues upon shipment of products. The amount of accrued estimated warranty costs is primarily based on historical experience as to product failures as well as current information on replacement costs.
Scanners
We warrant our scanners for a period of
one
year from the date of training and installation. We accrue for these warranty costs which includes materials and labor based on estimated historical repair costs. Extended service packages may be purchased for additional fees.
The following table reflects the change in our warranty accrual during the nine months ended
September 30, 2013
and
2012
(in thousands):
|
|
Nine Months Ended
September 30,
|
||||||
|
|
2013
|
2012
|
|||||
|
Balance at beginning of period
|
$
|
4,050
|
|
$
|
3,177
|
|
|
|
Charged to cost of net revenues
|
2,813
|
|
3,647
|
|
|||
|
Actual warranty expenditures
|
(3,057
|
)
|
(2,694
|
)
|
|||
|
Balance at end of period
|
$
|
3,806
|
|
$
|
4,130
|
|
|
On April 30, 2013, we completed the acquisition of ICA Holdings Pty Limited ("ICA") upon the expiration of the distribution agreement between certain subsidiaries of ICA and Align Technology B.V., for a total cash consideration of approximately
$8.6 million
, of which
$7.4 million
was attributed to assets acquired,
$2.3 million
in liabilities assumed and
$3.5 million
to goodwill. Goodwill as a result of this acquisition represents the excess of the purchase price over the fair value of the underlying net assets acquired and represents the knowledge and experience of the workforce in place. None of this goodwill will be deductible for tax purposes. Under the applicable accounting guidance, goodwill will not be amortized but will be tested for impairment on an annual basis or more frequently if certain indicators are present.
12
We believe that the transition from our distributor arrangement to a direct sales model as a result of the acquisition of ICA will increase our net revenues in the region as we will experience higher average selling price(s) (“ASP”) as compared to our discounted ASP under the prior distribution agreement.
Pro forma results of operations for this acquisition have not been presented as it is not material to our results of operations, either individually or in aggregate, for the
three
and
nine
months ended September 30, 2013 and 2012.
Goodwill
The change in the carrying value of goodwill for the nine months ended
September 30, 2013
by our reportable segments, which are also our reporting units, is as follows (in thousands):
|
Clear Aligner
|
SCCS
|
Total
|
|||||||||
|
Balance as of December 31, 2012
|
$
|
58,543
|
|
$
|
40,693
|
|
$
|
99,236
|
|
||
|
Goodwill from ICA acquisition
|
3,509
|
|
—
|
|
3,509
|
|
|||||
|
Impairment of goodwill
|
—
|
|
(40,693
|
)
|
(40,693
|
)
|
|||||
|
Adjustments
1
|
(307
|
)
|
—
|
|
(307
|
)
|
|||||
|
Balance as of September 30, 2013
|
$
|
61,745
|
|
$
|
—
|
|
$
|
61,745
|
|
||
1
The adjustments to goodwill during the
nine
months ended
September 30, 2013
were due to foreign currency translation.
Impairment of Goodwill
We test our goodwill balances for impairment annually on November 30th or more frequently if indicators are present or circumstances change that suggest it is more likely than not that the fair value of the reporting unit is less than the carrying amount. During March 2013, changes in the competitive environment for intra-oral scanners, including announcements from our competitors of new low-priced scanners targeted at orthodontists and general practitioner dentists in North America, that caused us to lower our expectations for growth and profitability for our SCCS reporting unit. As a result, we determined that goodwill for our SCCS reporting unit should be tested for impairment as of March 2013 due to these facts and circumstances which would more likely than not reduce the fair value of our SCCS reporting unit below its carrying amount.
We performed a step one analysis for our SCCS reporting unit which consists of a comparison of the fair value of the SCCS reporting unit against its carrying amount, including the goodwill allocated to it. In deriving the fair value of the SCCS reporting unit, we utilized the income approach which is classified as Level 3 within the fair value hierarchy. This approach provides an estimated fair value based on discounted expected future cash flows, which are based on management's estimates of revenue growth rates and operating margins, taking into consideration industry and market conditions. The discount rate used is based on a weighted average cost of capital adjusted for the relevant risk associated with the characteristics of the business and the projected cash flows.
As a result of our step one analysis, we concluded that the fair value of the SCCS reporting unit was less than its carrying value; therefore, we proceeded to step two of the goodwill impairment analysis. Step two of the goodwill impairment analysis measures the impairment charge by allocating the reporting unit's fair value to all of the assets and liabilities of the reporting unit in a hypothetical analysis that calculates the implied fair value of goodwill in the same manner as if the reporting unit was being acquired in a business combination. This allocation process was performed only for the purposes of measuring the goodwill impairment and not to adjust the carrying values of the recognized tangible assets and liabilities. Any excess of the carrying value of the reporting unit's goodwill over the implied fair value of the reporting unit's goodwill is recorded as an impairment loss. Based on our analysis, there was no implied goodwill for the SCCS reporting unit; therefore, we recorded a goodwill impairment charge of
$40.7 million
in the three months ended March 31, 2013, which represents the remaining goodwill balance in the SCCS reporting unit. None of the goodwill impairment charge was deductible for tax purposes.
13
Long-lived Assets
Impairment of Long-lived Assets
We amortize our intangible assets over their estimated useful lives. We evaluate long-lived assets, which includes property, plant and equipment and intangible assets, for impairment whenever events or changes in circumstances indicate the carrying value of an asset may not be recoverable. The carrying value is not recoverable if it exceeds the undiscounted cash flows resulting from the use of the asset and its eventual disposition. Our estimates of future cash flows attributable to our long-lived assets require significant judgment based on our historical and anticipated results and are subject to many factors. Factors we consider important which could trigger an impairment review include significant negative industry or economic trends, significant loss of customers and changes in the competitive environment of our intra-oral scanning business.
During March 2013, changes in the competitive environment for intra-oral scanners, including announcements from our competitors of new low-priced scanners targeted at orthodontists and general practitioner dentists in North America, that caused us to lower our expectations for growth and profitability for our SCCS reporting unit. As a result, we determined that the carrying value of the SCCS long-lived assets was not recoverable as compared to the value of the undiscounted cash flows of our revised projections for the asset group. In order to determine the impairment amount of our long-lived assets, we fair valued each key component of our long-lived assets within the asset group, which involved the use of significant estimates and assumptions including replacement costs, revenue growth rates, operating margins, and plant and equipment cost trends. We determined our long-lived asset group within the SCCS reporting unit to be primarily finite-lived intangible assets, plant and equipment. Upon completion of this analysis, we recorded a total impairment charge of
$26.3 million
of which
$19.3 million
represented the impairment related to our SCCS intangible assets and
$7.0 million
related to plant and equipment.
Intangible assets arising either as a direct result from the Cadent acquisition or individually acquired are being amortized as follows (in thousands):
|
Weighted Average Amortization Period (in years)
|
Gross Carrying Amount as of
September 30, 2013
|
Accumulated
Amortization
|
Accumulated
Impairment Loss
|
Net Carrying
Value as of
September 30, 2013
|
|||||||||||||
|
Trademarks
|
15
|
$
|
7,100
|
|
$
|
(1,069
|
)
|
$
|
(4,179
|
)
|
$
|
1,852
|
|
||||
|
Existing technology
|
13
|
12,600
|
|
(2,109
|
)
|
(4,328
|
)
|
6,163
|
|
||||||||
|
Customer relationships
|
11
|
33,500
|
|
(6,657
|
)
|
(10,751
|
)
|
16,092
|
|
||||||||
|
Other
|
7
|
285
|
|
(30
|
)
|
—
|
|
255
|
|
||||||||
|
$
|
53,485
|
|
$
|
(9,865
|
)
|
$
|
(19,258
|
)
|
$
|
24,362
|
|
||||||
|
Weighted Average Amortization Period (in years)
|
Gross Carrying
Amount as of
December 31, 2012
|
Accumulated
Amortization
|
Net Carrying
Value as of
December 31, 2012
|
||||||||||
|
Trademarks
|
15
|
$
|
7,100
|
|
$
|
(895
|
)
|
$
|
6,205
|
|
|||
|
Existing technology
|
13
|
12,600
|
|
(1,642
|
)
|
10,958
|
|
||||||
|
Customer relationships
|
11
|
33,500
|
|
(5,002
|
)
|
28,498
|
|
||||||
|
Other
|
8
|
125
|
|
(9
|
)
|
116
|
|
||||||
|
$
|
53,325
|
|
$
|
(7,548
|
)
|
$
|
45,777
|
|
|||||
14
The total estimated annual future amortization expense for these acquired intangible assets as of
September 30, 2013
is as follows (in thousands):
|
Fiscal Year Ending December 31,
|
|
||
|
Remainder of 2013
|
$
|
662
|
|
|
2014
|
2,635
|
|
|
|
2015
|
2,629
|
|
|
|
2016
|
2,629
|
|
|
|
2017
|
2,629
|
|
|
|
Thereafter
|
13,178
|
|
|
|
Total
|
$
|
24,362
|
|
On March 22, 2013, we entered into a credit facility with Wells Fargo Bank. The credit facility provides for a
$50.0 million
revolving line of credit, with a
$10.0 million
letter of credit sublimit, and has a maturity date on March 22, 2016. The credit facility also requires us to maintain a minimum unrestricted cash balance of
$50.0 million
and comply with specific financial conditions and performance requirements. The loans bear interest, at our option, at a fluctuating rate per annum equal to the daily one-month adjusted LIBOR rate plus a spread of
1.75%
or an adjusted LIBOR rate (based on one, three, six or twelve-month interest periods) plus a spread of
1.75%
. As of
September 30, 2013
, we had
no
outstanding borrowings under this credit facility and were in compliance with the conditions and performance requirements.
Securities Class Action Lawsuit
On November 28, 2012, plaintiff City of Dearborn Heights Act 345 Police & Fire Retirement System filed a lawsuit against Align, Thomas M. Prescott (“Mr. Prescott”), Align's President and Chief Executive Officer, and Kenneth B. Arola (“Mr. Arola”), Align's former Vice President, Finance and Chief Financial Officer, in the United States District Court for the Northern District of California on behalf of a purported class of purchasers of our common stock (the "Securities Action"). On July 11, 2013, an amended complaint was filed, which names the same defendants, on behalf of a purported class of purchasers of our common stock between January 31, 2012 and October 17, 2012. The amended complaint alleges that Align, Mr. Prescott and Mr. Arola violated Section 10(b) of the Securities Exchange Act of 1934 and Rule 10b-5 promulgated thereunder, and that Mr. Prescott and Mr. Arola violated Section 20(a) of the Securities Exchange Act of 1934. Specifically, the amended complaint alleges that during the purported class period defendants failed to take an appropriate goodwill impairment charge related to the April 29, 2011 acquisition of Cadent Holdings, Inc. in the fourth quarter of 2011, the first quarter of 2012 or the second quarter of 2012, which rendered our financial statements and projections of future earnings materially false and misleading and in violation of GAAP. The amended complaint seeks monetary damages in an unspecified amount, costs and attorney's fees. Align filed a motion to dismiss the amended complaint on August 22, 2013. The hearing on this motion has been scheduled for November 20, 2013. Align intends to vigorously defend itself against these allegations. Align is currently unable to predict the outcome of this amended complaint and therefore cannot determine the likelihood of loss nor estimate a range of possible loss.
Shareholder Derivative Lawsuit
On February 1, 2013, plaintiff Gary Udis filed a shareholder derivative lawsuit against several of Align's current and former officers and directors in the Superior Court of California, County of Santa Clara. The complaint alleges that our reported income and earnings were materially overstated because of a failure to timely write down goodwill related to the April 29, 2011 acquisition of Cadent Holdings, Inc., and that defendants made allegedly false statements concerning our forecasts. The complaint asserts various state law causes of action, including claims of breach of fiduciary duty, unjust enrichment, and insider trading, among others. The complaint seeks unspecified damages on behalf of Align, which is named solely as nominal defendant against whom no recovery is sought. The complaint also seeks an order directing Align to reform and improve its corporate governance and internal procedures, and seeks restitution in an unspecified amount, costs, and attorney's fees. On July 8, 2013, an Order was entered staying this derivative lawsuit until there is an initial ruling on our first motion to dismiss the Securities Action. Align is currently unable to predict the outcome of this complaint and therefore cannot determine the likelihood of loss nor estimate a range of possible losses.
15
In addition to the foregoing matters, in the course of Align's operations, Align is involved in a variety of claims, suits, investigations, and proceedings, including actions with respect to intellectual property claims, patent infringement claims, government investigations, labor and employment claims, breach of contract claims, tax, and other matters. Regardless of the outcome, these proceedings can have an adverse impact on us because of defense costs, diversion of management resources, and other factors. Although the results of complex legal proceedings are difficult to predict and Align's view of these matters may change in the future as litigation and events related thereto unfold, Align currently does not believe that these matters, individually or in the aggregate, will materially affect Align's financial position, results of operations or cash flows.
Operating Leases
As of
September 30, 2013
, minimum future lease payments for non-cancelable operating leases are as follows (in thousands):
|
Fiscal Year Ending December 31,
|
Operating leases
|
|||
|
Remainder of 2013
|
$
|
2,289
|
|
|
|
2014
|
8,239
|
|
||
|
2015
|
7,451
|
|
||
|
2016
|
6,870
|
|
||
|
2017
|
3,948
|
|
||
|
Thereafter
|
1,755
|
|
||
|
Total minimum future lease payments
|
$
|
30,552
|
|
|
Off-balance Sheet Arrangements
As of
September 30, 2013
, we had no off-balance sheet arrangements that have, or are reasonably likely to have, a current or future material effect on our consolidated financial condition, results of operations, liquidity, capital expenditures or capital resources.
Indemnification Provisions
In the normal course of business to facilitate transactions in our services and products, we indemnify certain parties: customers, vendors, lessors and other parties with respect to certain matters, including, but not limited to, services to be provided by us and intellectual property infringement claims made by third parties. In addition, we have entered into indemnification agreements with our directors and certain of our officers that will require us, among other things, to indemnify them against certain liabilities that may arise by reason of their status or service as directors or officers. Several of these agreements limit the time within which an indemnification claim can be made and the amount of the claim.
It is not possible to make a reasonable estimate of the maximum potential amount under these indemnification agreements due to the unique facts and circumstances involved in each particular agreement. Additionally, we have a limited history of prior indemnification claims and the payments we have made under such agreements have not had a material adverse effect on our results of operations, cash flows or financial position. However, to the extent that valid indemnification claims arise in the future, future payments by us could be significant and could have a material adverse effect on our results of operations or cash flows in a particular period. As of
September 30, 2013
, we did not have any material indemnification claims that were probable or reasonably possible.
Summary of stock-based compensation expense
On May 16, 2013, the Stockholders approved an increase of
7,000,000
shares to the 2005 Incentive Plan (as amended) for a total reserve of
23,283,379
shares for issuance, plus up to an aggregate of
5,000,000
shares that would have been returned to our 2001 Stock Incentive Plan as a result of termination of options on or after March 28, 2005.
16
Stock-based compensation expense is based on the estimated fair value of awards, net of estimated forfeitures, and recognized over the requisite service period. Estimated forfeitures are based on historical experience at the time of grant and may be revised, if necessary, in subsequent periods if actual forfeitures differ from those estimates. The stock-based compensation expense related to all of our stock-based awards and employee stock purchases for the
three
and
nine
months ended
September 30, 2013
and 2012 is as follows (in thousands):
|
|
Three Months Ended
September 30,
|
Nine Months Ended
September 30,
|
|||||||||||||
|
|
2013
|
2012
|
2013
|
2012
|
|||||||||||
|
Cost of net revenues
|
$
|
664
|
|
$
|
445
|
|
$
|
1,881
|
|
$
|
1,365
|
|
|||
|
Sales and marketing
|
2,215
|
|
1,448
|
|
5,238
|
|
4,066
|
|
|||||||
|
General and administrative
|
3,687
|
|
2,657
|
|
11,170
|
|
7,579
|
|
|||||||
|
Research and development
|
1,024
|
|
812
|
|
2,976
|
|
2,494
|
|
|||||||
|
Total stock-based compensation expense
|
$
|
7,590
|
|
$
|
5,362
|
|
$
|
21,265
|
|
$
|
15,504
|
|
|||
Options
Activity for the
nine
month period ended
September 30, 2013
under the stock option plans is set forth below (in thousands, except years and per share amounts):
|
Stock Options
Number of
Shares
Underlying
Stock Options
|
Weighted
Average
Exercise
Price per Share
|
Weighted Average
Remaining
Contractual Term
|
Aggregate
Intrinsic
Value
|
|||||||||
|
(in years )
|
||||||||||||
|
Outstanding as of December 31, 2012
|
3,276
|
|
||||||||||
|
Granted
|
—
|
|
||||||||||
|
Exercised
|
(1,430
|
)
|
||||||||||
|
Cancelled or expired
|
(79
|
)
|
||||||||||
|
Outstanding as of September 30, 2013
|
1,767
|
|
$
|
15.53
|
|
3.77
|
$
|
57,550
|
|
|||
|
Vested and expected to vest at September 30, 2013
|
1,760
|
|
$
|
15.51
|
|
3.77
|
$
|
57,368
|
|
|||
|
Exercisable at September 30, 2013
|
1,561
|
|
$
|
15.02
|
|
3.74
|
$
|
51,635
|
|
|||
There were
no
stock options granted during the
three
and
nine
months ended
September 30, 2013
and 2012.
As of
September 30, 2013
, the total unamortized compensation cost related to stock options, net of estimated forfeitures, is
$2.1 million
, which we expect to recognize over a weighted average period of
1.0
year.
Restricted Stock Units (“RSU”)
A summary of the RSU activity for the
nine
months ended
September 30, 2013
is as follows (in thousands, except years):
|
Number of Shares
Underlying RSU
|
Weighted Remaining
Vesting Period
|
Aggregate
Intrinsic Value
|
||||||
|
|
|
(in years)
|
|
|||||
|
Nonvested as of December 31, 2012
|
1,500
|
|
||||||
|
Granted
|
1,130
|
|
||||||
|
Vested and released
|
(529
|
)
|
||||||
|
Forfeited
|
(98
|
)
|
||||||
|
Nonvested as of September 30, 2013
|
2,003
|
|
1.59
|
$
|
96,335
|
|
||
As of
September 30, 2013
, the total unamortized compensation cost related to RSU, net of estimated forfeitures, was
$44.3 million
, which we expect to recognize over a weighted average period of
2.7
years.
17
On February 20, 2013 and 2012, we granted market-performance based restricted stock units (“MSU”) to our executive officers. Each MSU represents the right to one share of Align’s common stock and will be issued through our amended 2005 Incentive Plan. The actual number of MSU which will be eligible to vest will be based on the performance of Align’s stock price relative to the performance of the NASDAQ Composite Index over the vesting period, generally
two
to
three
years, up to
150%
of the MSU initially granted.
The following table summarizes the MSU activity for the
nine
months ended
September 30, 2013
(in thousands, except years):
|
Number of Shares
Underlying MSU
|
Weighted Average
Remaining
Vesting Period
|
Aggregate
Intrinsic Value
|
||||||
|
|
(in years )
|
|||||||
|
Nonvested as of December 31, 2012
|
266
|
|
||||||
|
Granted
|
225
|
|
||||||
|
Vested and released
|
(96
|
)
|
||||||
|
Forfeited
|
(43
|
)
|
||||||
|
Nonvested as of September 30, 2013
|
352
|
|
1.83
|
$
|
16,950
|
|
||
As of
September 30, 2013
, the total unamortized compensation costs related to the MSU, net of estimated forfeitures, was
$6.8 million
, which we expect to recognize over a weighted average period of
1.8
years.
Employee Stock Purchase Plan ("ESPP")
In May 2010, our stockholders approved the 2010 Employee Stock Purchase Plan which will continue until terminated by either the Board of Directors or its administrator. The maximum number of shares available for purchase under the 2010 Purchase Plan is
2,400,000
shares. As of
September 30, 2013
, there remains
1,611,170
shares available for purchase under the 2010 Purchase Plan.
The fair value of the option component of the Purchase Plan shares was estimated at the grant date using the Black-Scholes option pricing model with the following weighted average assumptions:
|
|
Three Months Ended September 30,
|
Nine Months Ended September 30,
|
|||||||||||||
|
|
2013
|
2012
|
2013
|
2012
|
|||||||||||
|
Employee Stock Purchase Plan:
|
|||||||||||||||
|
Expected term (in years)
|
1.2
|
|
1.2
|
|
1.2
|
|
1.2
|
|
|||||||
|
Expected volatility
|
37.3
|
%
|
48.0
|
%
|
44.9
|
%
|
49.7
|
%
|
|||||||
|
Risk-free interest rate
|
0.2
|
%
|
0.2
|
%
|
0.2
|
%
|
0.2
|
%
|
|||||||
|
Expected dividends
|
—
|
|
—
|
|
—
|
|
—
|
|
|||||||
|
Weighted average fair value at grant date
|
$
|
13.84
|
|
$
|
11.99
|
|
$
|
11.70
|
|
$
|
11.10
|
|
|||
As of
September 30, 2013
, the total unamortized compensation cost related to employee purchases we expect to recognize was
$1.8 million
over a weighted average period of
0.9
year.
On October 27, 2011, we announced that our Board of Directors approved a stock repurchase program pursuant to which we may repurchase up to
$150.0 million
of common stock. Purchases under the stock repurchase program were made from time to time in the open market. During the nine months ended
September 30, 2013
, we repurchased approximately
2.7 million
shares of our common stock at an average price of
$34.95
per share, including commissions, for an aggregate purchase price of approximately
$95.1 million
. All repurchased shares were retired. The common stock retirements reduced additional paid-in capital by approximately
$24.5 million
and increased accumulated deficit by
$70.6 million
. No shares are available for repurchase as we completed the repurchases under this program as of
September 30, 2013
.
18
Our provision for income taxes was
$7.4 million
and
$4.5 million
for the three months ended September 30, 2013 and 2012, respectively. This represents effective tax rates of
17.6%
and
108.3%
, respectively. The increase in provision for income taxes was primarily due to higher pre-tax income, which was partially offset by a
$1.3 million
discrete benefit related to the filing of our 2012 U.S. tax return as well as a jurisdictional shift in forecasted earnings from the U.S. to lower-tax non-U.S. jurisdictions. The effective tax rate for the three months ended September 30, 2012 reflects a non-deductible goodwill impairment charge of
$24.7 million
.
Our provision for income taxes was
$18.5 million
and
$18.8 million
for the nine months ended September 30, 2013 and 2012, respectively. This represents effective tax rates of
45.9%
and
27.6%
, respectively. The decrease in provision for income taxes was primarily due to a jurisdictional shift in forecasted earnings from the U.S. to lower-tax non-U.S. jurisdictions and a
$1.3 million
discrete benefit related to the filing of our 2012 U.S. tax return, partially offset by a
$5.8 million
tax expense related to the impairment of goodwill and long-lived assets. The
$5.8 million
, which was recorded as a discrete item during the three months ended March 31, 2013, was comprised of a
$9.7 million
tax expense due to a non-deductible goodwill impairment charge offset by a
$3.9 million
tax benefit associated with the impairment of long-lived assets. The effective tax rate for the nine months ended September 30, 2013 reflects a non-deductible goodwill impairment charge of
$40.7 million
recorded during the three months ended March 31, 2013.
On January 2, 2013, the American Taxpayer Relief Act of 2012 (H.R. 8, as amended) was signed into law. This Act extends the federal research and development credit through December 31, 2013. The federal research and development credit was reinstated retroactively to January 1, 2012. The tax benefit of the federal research and development credit for the twelve months ended December 31, 2012 resulted in a discrete tax benefit of
$0.5 million
in the first quarter of fiscal year 2013, the period in which the reinstatement was enacted into law.
We exercise significant judgment in regards to estimates of future market growth, forecasted earnings and projected taxable income, in determining the provision for income taxes, and for purposes of assessing our ability to utilize any future benefit from deferred tax assets.
As of
September 30, 2013
, we maintained a valuation allowance of
$30.3 million
against deferred tax assets primarily related to foreign net operating loss carryforwards and capital loss carryforwards. These net operating and capital loss carryforwards would result in an income tax benefit if we were to conclude it is more likely than not that the related deferred tax assets will be realized.
During the three months ended September 30, 2013, the change in our gross unrecognized tax benefits was not material. The total amount of gross unrecognized tax benefits was
$23.7 million
as of
September 30, 2013
, all of which would impact our effective tax rate if recognized. We have elected to recognize interest and penalties related to unrecognized tax benefits as a component of income taxes. The change in accrued interest and penalties during the three months ended September 30, 2013, was not material. We do not expect any significant changes to the amount of unrecognized tax benefit within the next twelve months.
We are subject to taxation in the U.S., and various states and foreign jurisdictions. All of our tax years will be open to examination by the U.S. federal and most state tax authorities due to our net operating loss and overall credit carryforward position. With few exceptions, we are no longer subject to examination by foreign tax authorities for years before 2006. Our subsidiaries in Israel and Germany are under audit by the local tax authorities for calendar years 2006 through 2011 and 2007 through 2011, respectively.
In June 2009, the Costa Rica Ministry of Foreign Trade, an agency of the Government of Costa Rica, granted a twelve year extension of various income tax incentives, which had been previously granted to us in 2002. The incentive tax rates will expire in various years beginning in 2017. Under these incentives, all of the income we earn in Costa Rica during the twelve year incentive period is exempt from Costa Rica income tax. In order to receive the benefit of these incentives, we must hire specified numbers of employees and maintain certain minimum levels of fixed asset investments in Costa Rica. If we do not fulfill these conditions for any reason, our incentive could lapse, and our income in Costa Rica would be subject to taxation at higher rates. The Costa Rica Corporate income tax rate that would apply, absent the incentives, is
30%
for 2013. As a result of these incentives, the provision for income taxes were reduced by
$18.0 million
and
$17.0 million
for the nine months ended September 30, 2013 and 2012, respectively, representing a benefit to diluted net income per share of
$0.22
and
$0.20
in 2013 and 2012, respectively. For the three months ended September 30, 2013 and 2012, the provision for income taxes was reduced by
$6.1 million
and
$6.9 million
, respectively, representing a benefit to diluted net income per share of
$0.08
and
$0.08
, respectively.
19
Basic net income (loss) per share is computed using the weighted average number of shares of common stock outstanding during the period. Diluted net income per share is computed using the weighted average number of shares of common stock, adjusted for the dilutive effect of potential common stock. Potential common stock, computed using the treasury stock method, includes stock options, RSU, MSU and ESPP.
The following table sets forth the computation of basic and diluted net income (loss) per share attributable to common stock (in thousands, except per share amounts):
|
|
Three Months Ended,
September 30,
|
Nine Months Ended,
September 30,
|
|||||||||||||
|
|
2013
|
2012
|
2013
|
2012
|
|||||||||||
|
Numerator:
|
|||||||||||||||
|
Net income (loss)
|
$
|
34,537
|
|
$
|
(344
|
)
|
$
|
21,874
|
|
$
|
49,132
|
|
|||
|
Denominator:
|
|||||||||||||||
|
Weighted-average common shares outstanding, basic
|
79,967
|
|
81,437
|
|
80,592
|
|
80,356
|
|
|||||||
|
Dilutive effect of potential common stock
|
1,881
|
|
—
|
|
1,957
|
|
2,660
|
|
|||||||
|
Total shares, diluted
|
81,848
|
|
81,437
|
|
82,549
|
|
83,016
|
|
|||||||
|
Net income (loss) per share, basic
|
$
|
0.43
|
|
$
|
(0.00
|
)
|
$
|
0.27
|
|
$
|
0.61
|
|
|||
|
Net income (loss) per share, diluted
|
$
|
0.42
|
|
$
|
(0.00
|
)
|
$
|
0.26
|
|
$
|
0.59
|
|
|||
For the
three
and
nine
months ended
September 30, 2013
, the anti-dilutive affect from RSU were not material.
For the
three
months ended
September 30, 2012
, stock options, RSU, MSU and ESPP totaling
2.5 million
of potentially dilutive shares have been excluded from the total diluted shares because there was a net loss during the period.
For the
three
and
nine
months ended
September 30, 2012
, the anti-dilutive affect from stock options and RSU were not material.
Segment Information
Operating segments are defined as components of an enterprise for which separate financial information is available that is evaluated regularly by the Chief Operating Decision Maker (“CODM”), or decision-making group, in deciding how to allocate resources and in assessing performance. Our CODM is our Chief Executive Officer. We report segment information based on the management approach. The management approach designates the internal reporting used by CODM for decision making and performance assessment as the basis for determining our reportable segments. The performance measures of our reportable segments include net revenues and gross profit.
We have grouped our operations into
two
reportable segments which are also our reporting units: Clear Aligner segment and SCCS segment.
|
•
|
Our Clear Aligner segment consists of our Invisalign system which includes Invisalign Full, Express/Lite, Teen, Assist, Vivera retainers, along with our training and ancillary products for treating malocclusion.
|
|
•
|
Our SCCS segment consists of intra-oral scanning systems and additional services available with the intra-oral scanners that provide digital alternatives to the traditional cast models. This segment includes our iTero scanner and OrthoCAD services.
|
These reportable operating segments are based on how our CODM views and evaluates our operations as well as allocation of resources (in thousands):
20
|
|
For the Three Months Ended September 30,
|
For the Nine Months Ended September 30,
|
|||||||||||||
|
Net Revenues
|
2013
|
2012
|
2013
|
2012
|
|||||||||||
|
Clear Aligner
|
|||||||||||||||
|
Invisalign Full
|
$
|
93,945
|
|
$
|
80,294
|
|
$
|
275,621
|
|
$
|
251,335
|
|
|||
|
Invisalign Express/Lite
|
17,702
|
|
12,779
|
|
52,943
|
|
38,217
|
|
|||||||
|
Invisalign Teen
|
23,779
|
|
19,144
|
|
62,289
|
|
50,672
|
|
|||||||
|
Invisalign Assist
|
7,445
|
|
7,051
|
|
23,418
|
|
21,495
|
|
|||||||
|
Invisalign non-case revenues
|
10,679
|
|
7,457
|
|
34,154
|
|
22,003
|
|
|||||||
|
SCCS
|
|||||||||||||||
|
Scanners
|
5,538
|
|
4,023
|
|
17,190
|
|
15,416
|
|
|||||||
|
CAD/CAM Services
|
5,418
|
|
5,748
|
|
16,299
|
|
18,063
|
|
|||||||
|
Total net revenues
|
$
|
164,506
|
|
$
|
136,496
|
|
$
|
481,914
|
|
$
|
417,201
|
|
|||
|
Gross profit
|
|||||||||||||||
|
Clear Aligner
|
$
|
122,663
|
|
$
|
98,334
|
|
$
|
352,114
|
|
$
|
301,340
|
|
|||
|
Scanners and CAD/CAM Services
|
2,427
|
|
2,016
|
|
9,516
|
|
8,570
|
|
|||||||
|
Total gross profit
|
$
|
125,090
|
|
$
|
100,350
|
|
$
|
361,630
|
|
$
|
309,910
|
|
|||
Geographical Information
Net revenues and tangible long-lived assets are presented below by geographic area (in thousands):
|
|
For the Three Months Ended September 30,
|
For the Nine Months Ended September 30,
|
|||||||||||||
|
|
2013
|
2012
|
2013
|
2012
|
|||||||||||
|
Net revenues:
(1)
|
|||||||||||||||
|
U.S.
|
$
|
123,904
|
|
$
|
105,173
|
|
$
|
365,596
|
|
$
|
319,269
|
|
|||
|
the Netherlands
|
26,494
|
|
24,193
|
|
89,952
|
|
79,273
|
|
|||||||
|
Rest of the world
|
14,108
|
|
7,130
|
|
26,366
|
|
18,659
|
|
|||||||
|
Total net revenues
|
$
|
164,506
|
|
$
|
136,496
|
|
$
|
481,914
|
|
$
|
417,201
|
|
|||
(1)
Net revenues are attributed to countries based on location of where revenue is recognized.
|
|
As of September 30,
|
As of December 31,
|
|||||
|
|
2013
|
2012
|
|||||
|
Long-lived assets:
(2)
|
|||||||
|
U.S.
|
$
|
62,241
|
|
$
|
60,098
|
|
|
|
Rest of the world
|
14,311
|
|
19,093
|
|
|||
|
Total long-lived assets
|
$
|
76,552
|
|
$
|
79,191
|
|
|
(2)
L
ong-lived assets are attributed to the countries that purchased the asset
.
21
ITEM 2.
MANAGEMENT’S DISCUSSION AND ANALYSIS OF FINANCIAL CONDITION AND RESULTS OF OPERATIONS.
In addition to historical information, this quarterly report on Form 10-Q contains forward-looking statements within the meaning of Section 27A of the Securities Act of 1933 and Section 21E of the Securities Exchange Act of 1934. These statements include, among other things, our expectations regarding the anticipated impact that our new products and product enhancements will have on doctor utilization and our market share, our expectations regarding product mix and product adoption, our expectations regarding the existence and impact of seasonality, our expectations regarding the financial and strategic benefits of the scanner and CAD/CAM services business, our expectations to increase our investment in manufacturing capacity, our expectations regarding the continued expansion of our international markets, the anticipated number of new doctors trained and their impact on volumes, the impact of the termination of our Asia Pacific distributor relationship and reverting to a direct sales model in that region by acquiring the distributor business, the level of our operating expenses and gross margins, and other factors beyond our control, as well as other statements regarding our future operations, financial condition and prospects and business strategies. These statements may contain words such as “expects,” “anticipates,” “intends,” “plans,” “believes,” “estimates,” or other words indicating future results. These forward-looking statements are subject to certain risks and uncertainties that could cause actual results to differ materially from those reflected in the forward-looking statements. Factors that could cause or contribute to such differences include, but are not limited to, those discussed in Item 2 “Management’s Discussion and Analysis of Financial Condition and Results of Operations”, and in particular, the risks discussed below in Part II, Item 1A “Risk Factors”. We undertake no obligation to revise or update these forward-looking statements. Given these risks and uncertainties, readers are cautioned not to place undue reliance on such forward-looking statements.
The following discussion and analysis of our financial condition and results of operations should be read together with our Condensed Consolidated Financial Statements and related notes included elsewhere in this Quarterly Report on Form 10-Q.
Overview
Align Technology, Inc. is a global medical device company that pioneered the invisible orthodontics market with the introduction of the Invisalign system in 1999. Today, we are focused on designing, manufacturing and marketing innovative, technology-rich products to help dental professionals achieve the clinical results they expect and deliver effective, convenient cutting-edge dental treatment options to their patients. Align Technology was founded in March 1997 and is headquartered in San Jose, California with offices worldwide. Our international headquarters are located in Amsterdam, the Netherlands. We have two operating segments: (1) Clear Aligner, known as the Invisalign system; and (2) Scanner and CAD/CAM Services ("SCCS"), known as the iTero intra-oral scanners and OrthoCAD services.
We received Food and Drug Administration ("FDA") clearance in 1998 and began our first commercial sales of Invisalign to U.S. Orthodontists in 1999 followed by U.S General Practitioner Dentists (GPs) in 2002. Over the next decade, we introduced Invisalign to the European market, as well as in Japan and the Asia Pacific, Latin America, Middle East and Africa regions, and introduced a full range of treatment options including Invisalign Express (10 and 5), Invisalign Teen, Invisalign Assist, Vivera retainers, Invisalign Lite and Invisalign i7. By 2011, we launched Invisalign G3 and Invisalign G4, which include significant new aligner and software features across all Invisalign products that make it easier for doctors to use Invisalign on more complex cases and introduced Invisalign in the People’s Republic of China. Most recently, we launched SmartTrack, the next generation of Invisalign clear aligner material which became the new standard aligner material for Invisalign clear aligner products in North America and Europe beginning January 21, 2013 and for other international markets where we received regulatory approval.
22
In 2011, we acquired Cadent Holdings, Inc., a leading provider of 3D digital scanning solutions for orthodontics and dentistry and makers of the iTero intra-oral scanner and OrthoCAD services. We believe that the combination of Align’s and Cadent’s technologies and capabilities creates greater growth opportunities for Align by bringing innovative new Invisalign treatment tools to customers and by extending the value of intra-oral scanning in dental practices. Intra-oral scanners provide a dental “chair-side” platform for accessing valuable digital diagnosis and treatment tools, with potential for enhancing accuracy of records, treatment efficiency, and the overall patient experience. We believe there are numerous benefits for customers and the opportunity to accelerate the adoption of Invisalign through interoperability with our intra-oral scanners. The use of digital technologies such as CAD/CAM for restorative dentistry or in-office restorations has been growing rapidly and intra-oral scanning is a critical part of enabling these new digital technologies and procedures in dental practices. Since the acquisition, we have launched significant product options and software enhancements to the scanner product line. In late 2012, we commercially launched the Invisalign Outcome Simulator, the first Invisalign chair-side application powered by the iTero scanner. The interactive application provides dentists and orthodontists an enhanced platform for patient education and is designed to increase treatment acceptance by helping patients visualize the benefits possible with Invisalign treatment. The new iTero scanner was available in North America beginning in February 2013 and is now available in select international markets as a single hardware platform with software options for restorative or orthodontic procedures.
The Invisalign system is offered in more than 45 countries and has been used to treat more than 2.0 million patients. Our iTero intra-oral scanner is available in over 25 countries and provides dental professionals with an open choice to send digital impressions to any laboratory-based CAD/CAM system or to any of the more than 1,800 dental labs worldwide.
Our goal is to establish the Invisalign system as the standard method for treating malocclusion and to establish our intra-oral scanning platform as the preferred scanning protocol for 3D digital scans, ultimately driving increased product adoption by dental professionals. We intend to achieve this by focusing on the key strategic initiatives set forth in our Annual Report on Form 10-K.
In addition to the successful execution of our business strategy, there are a number of other factors which may affect our results in 2013 and beyond, which are updated below:
|
•
|
Product innovation and clinical effectiveness
. In October 2012, we announced the introduction of SmartTrack, a proprietary, custom engineered aligner material, designed to deliver gentle, more constant force to improve control of tooth movements with Invisalign clear aligner treatment. This will build on the success we have seen with Invisalign G3/G4 and encourage even greater confidence and adoption in our customers’ practices. Although the introduction of SmartTrack has resulted in higher cost of net revenues due to higher material costs in our clear aligner segment in 2013, we believe these innovations are important contributors to increase utilization across our channels worldwide. Additionally, in January 2013, we introduced the new iTero scanner, which is a single hardware platform with software options for restorative or orthodontic procedures, Invisalign interoperability, as well as the Invisalign Outcome Simulator, our first chair-side application powered by our iTero scanner. We believe that over the long-term these types of product and clinical innovations will increase adoption of Invisalign and increase sales of our intra-oral scanners; however, it is difficult to predict the rate of adoption, which may vary by region and channel.
|
|
•
|
Invisalign Utilization rates.
Our goal is to establish Invisalign as the treatment of choice for treating malocclusion ultimately driving increased product adoption and frequency of use by dental professionals, or utilization. Our quarterly utilization rates for the current quarter and for the previous ten quarters are as follows:
|
23
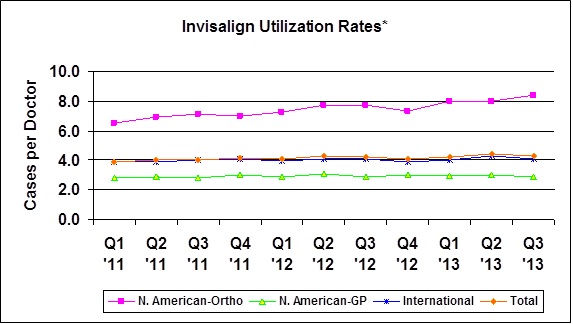
*
Invisalign Utilization rates = # of cases shipped divided by # of doctors cases were shipped to
Total utilization in the third quarter of 2013 increased slightly to 4.3 cases per doctor compared to 4.2 cases in the third quarter of 2012 driven primarily by North American Orthodontists. Utilization increased from 7.7 in the third quarter of 2012 to 8.4 cases per doctor among our North American orthodontist customers reflecting our continued success in driving adoption and increasing utilization of Invisalign into the teenage orthodontic market especially during the seasonally busier summer period for most orthodontic practices. Utilization among our North American General Practitioner ("GP") and International doctors was flat. As doctors increase their utilization, we anticipate higher participation in our volume rebate program which may result in lower average selling prices of our products.
|
•
|
Seasonal Trends
. Typically the third quarter reflects the peak season for teenage Orthodontic case starts as many parents want to get their teenagers started in treatment before the start of the school year. However, we also experience a seasonally slower quarter as our North American GP and international doctors and their patients are on summer vacation and therefore tend to start fewer cases. The fourth quarter is often a slower period for North American Orthodontists s as fewer teenagers start orthodontic treatment once the school year has started. As such, we expect North American Orthodontists to be down sequentially during the fourth quarter. Offsetting this trend, our fourth quarter has historically been a stronger quarter for our international doctors and North American GPs as they rebound from a seasonally slower summer quarter. We expect volume for both international and North American GPs to be up sequentially in the fourth quarter. Consequently, we expect that our Invisalign volume in the fourth quarter of 2013 will be up slightly compared to the third quarter. In addition, we expect a mix shift in the fourth quarter to lower priced Invisalign products, specifically we expect to sell less Invisalign Teen, and more Invisalign Express due to fewer teenage patients starting treatment in this quarter.
|
|
•
|
Number of new Invisalign doctors trained.
We continue to expand our Invisalign customer base by training new doctors. In 2012, Invisalign growth was driven primarily by the continued expansion of our customer base as we trained a total of 6,840 new orthodontists and GPs in North America and internationally. We expect to train approximately 7,220 doctors in 2013 and during the first three quarters of 2013, we trained a total of 5,445 doctors worldwide. In the third quarter of 2013, we trained a total of 1,635 new Invisalign doctors, adding 90 North American Orthodontists, 705 North American GPs and 840 international doctors.
|
24
|
•
|
International Clear Aligner.
We will continue to focus our efforts towards increasing adoption of our products by dental professionals in our core European markets as well as expanding into new markets. On a year-over-year basis, international volume increased 22% compared to the third quarter of 2012, reflecting growth in our direct business in Europe despite widespread economic changes as well as strong volume growth in the Asia Pacific ("APAC") region which benefited from our recently acquired direct business in the region. In the second quarter of 2013, we successfully completed the transition of countries managed by our APAC distributor back to a direct sales model by acquiring the distributor business. Now four of the largest indirect country markets of Australia, New Zealand, Hong Kong and Singapore are direct sales regions, and we began to recognize direct sales of Invisalign products sold in that region at our full average selling price(s) ("ASP") rather than at the discounted ASP under the distribution agreement. In 2012, this distributor accounted for approximately 3% of worldwide net revenues, and we expect the region to become an even more meaningful contributor to revenue growth in 2013. In the near term, however, our assumption of the direct operating costs in the region will offset the uplift from the higher ASP. Although we expect volumes and revenues will increase over time, we may experience difficulties in achieving the anticipated financial benefits. We continue to serve other countries under a distribution model.
|
|
•
|
Increased Sales Force Coverage.
Our direct sales organization in North America is comprised of a team of territory managers, and to a lesser extent, territory specialists. These territory specialists are used to enhance coverage in larger territories, especially with our lower volume GP customers. Due to the success of this sales coverage model, we have added approximately 20 sales representatives in 2013, predominantly in North America. In addition, with the transition of our APAC distributor to a direct sales model in May 2013 as a result of acquiring the distributor business, we acquired approximately 15 additional sales representatives in that region.
|
|
•
|
Change to Mid-Course Correction Policy
. We seek to continually evaluate and improve our products, our customer support processes and policies to support those goals. Mid-course correction provides our customers with the option of requesting a treatment correction during active treatment if the case is not tracking to the original treatment plan or goals. Based on customer feedback, beginning June 15, 2013, we no longer charge a fee associated with our mid-course correction orders. We now include up to three free mid-course correction orders per case in our list prices for Invisalign Full and Invisalign Teen. Based on an historical usage rate, we defer a portion of our revenue for mid-course corrections which will be subsequently recognized when mid-course corrections orders are shipped. As a result of this policy change, we have experienced an increase in mid-course correction cases in the third quarter of 2013 and consequently increased our revenue deferral by approximately $2.8 million. During the same period, we also experienced a corresponding reduction in our warranty claims, which resulted in a decrease in our warranty reserve by approximately $1.7 million. The net impact of these two changes resulted in a decrease in gross profit of approximately $1.1 million; however, the impact on gross margin was favorable by about 0.7 basis points.
|
|
•
|
SCCS business.
In October 2012, we reached a mutual agreement to terminate the exclusive distribution arrangement with Straumann for iTero intra-oral scanners in Europe, as well as the non-exclusive distribution agreement for iTero intra-oral scanners in North America effective December 31, 2012. The global market for restorative dentistry is far more fragmented and complex than for orthodontics, involving hundreds of thousands of labs, suppliers, general dentists and specialists. In Europe, adoption of digital restorative technology has been slowed due to challenging economic conditions and reluctance to invest in capital equipment. In view of these conditions, we expect to have very few scanner sales internationally in the near term as we determine the most effective way to re-stage growth in this market. Our direct sales model remains unchanged in North America where most of the SCCS net revenues are generated. In North America, we expect revenue in the SCCS segment to be flat sequentially in the fourth quarter of 2013 compared to the third quarter despite an increasingly competitive environment.
|
25
|
•
|
Increase in Invisalign Selling Price
. In recent years, we have significantly increased investment in research and development resulting in product innovations, such as Invisalign G3, Invisalign G4 and SmartTrack clear aligner material. We have also continued to increase our consumer advertising spending to drive more patient demand. In addition, beginning January 1, 2013, the U.S. Federal Government imposed a new excise tax on medical device manufacturers enacted into law as part of the comprehensive healthcare reform legislation in March 2010, which Invisalign clear aligners are considered a taxable medical device. As a result of this new tax and our continued investments in research and development and consumer advertising, effective January 1, 2013, we increased our Invisalign pricing by adding $26.00 to $50.00 per case or approximately 3% to 5% compared to 2012 prices. For 2013, we expect that the impact on our ASP from this price increase will be offset somewhat by an expected increase in our rebate program due to the anticipated increase in utilization by our customers, increased volume from our lower price products, including Invisalign Express 5 and Invisalign i7, as well as slightly higher material costs for the SmartTrack clear aligner material. The prices for Invisalign Teen, Invisalign retainers and Vivera retainers remain unchanged.
|
|
•
|
2013 Operating expenses.
We expect operating expenses to increase in 2013 compared to 2012 due to the increase in our North American sales force coverage, the addition of the direct sales force in APAC due to acquiring the distributor business and the inclusion of the medical device excise tax as a result of new tax regulations effective January 1, 2013.
|
|
•
|
Foreign exchange rates.
Although the U.S. dollar is our reporting currency, a portion of our net revenues and net income are generated in foreign currencies. Net revenues and net income generated by subsidiaries operating outside of the U.S. are translated into U.S. dollars using exchange rates effective during the respective period and as a result are affected by changes in exchange rates. We have generally accepted the exposure to exchange rate movements without using derivative financial instruments to manage this risk. Therefore, both positive and negative movements in currency exchange rates against the U.S. dollar will continue to affect the reported amount of net revenues and net income in our condensed consolidated financial statements.
|
Results of Operations
Net revenues by Reportable Segment
We group our operations into two reportable segments: Clear Aligner segment and SCCS segment.
|
•
|
Our Clear Aligner segment consists of our Invisalign system which includes Invisalign Full, Express/Lite, Teen, Assist, Vivera retainers, along with our training and ancillary products for treating malocclusion.
|
|
•
|
Our SCCS segment consists of intra-oral scanning systems and additional services available with the intra-oral scanners that provide digital alternatives to the traditional cast models. This segment includes our iTero scanners, iOC scanners, and OrthoCAD services.
|
26
The below represents net revenues for our Clear Aligner segment by region, channel, and product and our SCCS segment by region and product for the
three
and
nine
months ended
September 30, 2013
and 2012 as follows (in millions):
|
|
Three Months Ended September 30,
|
Nine Months Ended September 30,
|
|||||||||||||||||||||||||||
|
Clear Aligner:
|
2013
|
2012
|
Net
Change
|
%
Change
|
2013
|
2012
|
Net
Change
|
%
Change
|
|||||||||||||||||||||
|
Region and Channel
|
|||||||||||||||||||||||||||||
|
North America
|
|||||||||||||||||||||||||||||
|
Ortho
|
$
|
52.5
|
|
$
|
43.1
|
|
$
|
9.4
|
|
21.8
|
%
|
$
|
151.9
|
|
$
|
128.7
|
|
$
|
23.2
|
|
18.0
|
%
|
|||||||
|
GP
|
51.4
|
|
46.4
|
|
5.0
|
|
10.8
|
%
|
151.3
|
|
140.7
|
|
10.6
|
|
7.5
|
%
|
|||||||||||||
|
Total North America
|
103.9
|
|
89.5
|
|
14.4
|
|
16.1
|
%
|
303.2
|
|
269.4
|
|
33.8
|
|
12.5
|
%
|
|||||||||||||
|
International
|
38.9
|
|
29.7
|
|
9.2
|
|
31.0
|
%
|
111.0
|
|
92.3
|
|
18.7
|
|
20.3
|
%
|
|||||||||||||
|
Invisalign non-case net revenues
|
10.7
|
|
7.5
|
|
3.2
|
|
42.7
|
%
|
34.2
|
|
22.0
|
|
12.2
|
|
55.5
|
%
|
|||||||||||||
|
Total Clear Aligner net revenues
|
$
|
153.5
|
|
$
|
126.7
|
|
$
|
26.8
|
|
21.2
|
%
|
$
|
448.4
|
|
$
|
383.7
|
|
$
|
64.7
|
|
16.9
|
%
|
|||||||
|
Product
|
|||||||||||||||||||||||||||||
|
Invisalign Full
|
$
|
93.9
|
|
$
|
80.3
|
|
$
|
13.6
|
|
16.9
|
%
|
$
|
275.6
|
|
$
|
251.3
|
|
$
|
24.3
|
|
9.7
|
%
|
|||||||
|
Invisalign Express/Lite
|
17.7
|
|
12.8
|
|
4.9
|
|
38.3
|
%
|
53.0
|
|
38.2
|
|
14.8
|
|
38.7
|
%
|
|||||||||||||
|
Invisalign Teen
|
23.8
|
|
19.1
|
|
4.7
|
|
24.6
|
%
|
62.3
|
|
50.7
|
|
11.6
|
|
22.9
|
%
|
|||||||||||||
|
Invisalign Assist
|
7.4
|
|
7.0
|
|
0.4
|
|
5.7
|
%
|
23.3
|
|
21.5
|
|
1.8
|
|
8.4
|
%
|
|||||||||||||
|
Invisalign non-case net revenues
|
10.7
|
|
7.5
|
|
3.2
|
|
42.7
|
%
|
34.2
|
|
22.0
|
|
12.2
|
|
55.5
|
%
|
|||||||||||||
|
Total Clear Aligner net revenues
|
$
|
153.5
|
|
$
|
126.7
|
|
$
|
26.8
|
|
21.2
|
%
|
$
|
448.4
|
|
$
|
383.7
|
|
$
|
64.7
|
|
16.9
|
%
|
|||||||
|
SCCS:
|
|||||||||||||||||||||||||||||
|
Region
|
|||||||||||||||||||||||||||||
|
North America
|
$
|
10.9
|
|
$
|
9.4
|
|
$
|
1.5
|
|
16.0
|
%
|
$
|
33.2
|
|
$
|
32.3
|
|
$
|
0.9
|
|
2.8
|
%
|
|||||||
|
International
|
0.1
|
|
0.4
|
|
(0.3
|
)
|
(75.0
|
)%
|
0.3
|
|
1.2
|
|
(0.9
|
)
|
(75.0
|
)%
|
|||||||||||||
|
Total SCCS net revenues
|
$
|
11.0
|
|
$
|
9.8
|
|
$
|
1.2
|
|
12.2
|
%
|
$
|
33.5
|
|
$
|
33.5
|
|
$
|
—
|
|
—
|
%
|
|||||||
|
Product
|
|||||||||||||||||||||||||||||
|
Scanners
|
$
|
5.5
|
|
$
|
4.0
|
|
$
|
1.5
|
|
37.5
|
%
|
$
|
17.1
|
|
$
|
15.4
|
|
$
|
1.7
|
|
11.0
|
%
|
|||||||
|
CAD/CAM Services
|
5.5
|
|
5.8
|
|
(0.3
|
)
|
(5.2
|
)%
|
16.4
|
|
18.1
|
|
(1.7
|
)
|
(9.4
|
)%
|
|||||||||||||
|
Total SCCS net revenues
|
$
|
11.0
|
|
$
|
9.8
|
|
$
|
1.2
|
|
12.2
|
%
|
$
|
33.5
|
|
$
|
33.5
|
|
$
|
—
|
|
—
|
%
|
|||||||
|
Total net revenues
|
$
|
164.5
|
|
$
|
136.5
|
|
$
|
28.0
|
|
20.5
|
%
|
$
|
481.9
|
|
$
|
417.2
|
|
$
|
64.7
|
|
15.5
|
%
|
|||||||
Total net revenues increased by $28.0 million and $64.7 million for the
three
and
nine
months ended
September 30, 2013
, respectively, as compared to the same period in 2012 primarily as a result of Invisalign case volume growth across all regions and most products as well as increased Invisalign non-case net revenues. Also, beginning June 15, 2013, we include up to three mid-course correction orders per case in our list prices for Invisalign Full and Invisalign Teen. As a result of this policy change, we have experienced an increase in mid-course correction cases in the three months ended September 30, 2013 and consequently increased our revenue deferral by $2.8 million.
27
Clear Aligner Case Volume by Channel and Product
Case volume data which represents Invisalign case shipments by channel and product, for the
three
and
nine
months ended
September 30, 2013
and 2012 is as follows (in thousands):
|
|
Three Months Ended September 30,
|
Nine Months Ended September 30,
|
|||||||||||||||||||||
|
Region and Channel
|
2013
|
2012
|
Net
Change
|
%
Change
|
2013
|
2012
|
Net
Change
|
%
Change
|
|||||||||||||||
|
North America:
|
|||||||||||||||||||||||
|
Ortho
|
41.6
|
|
35.9
|
|
5.7
|
|
15.9
|
%
|
119.1
|
|
103.5
|
|
15.6
|
|
15.1
|
%
|
|||||||
|
GP
|
38.5
|
|
34.7
|
|
3.8
|
|
11.0
|
%
|
114.5
|
|
105.0
|
|
9.5
|
|
9.0
|
%
|
|||||||
|
Total North American Invisalign
|
80.1
|
|
70.6
|
|
9.5
|
|
13.5
|
%
|
233.6
|
|
208.5
|
|
25.1
|
|
12.0
|
%
|
|||||||
|
International Invisalign
|
26.8
|
|
21.9
|
|
4.9
|
|
22.4
|
%
|
77.6
|
|
64.5
|
|
13.1
|
|
20.3
|
%
|
|||||||
|
Total Invisalign case volume
|
106.9
|
|
92.5
|
|
14.4
|
|
15.6
|
%
|
311.2
|
|
273.0
|
|
38.2
|
|
14.0
|
%
|
|||||||
|
Product
|
|||||||||||||||||||||||
|
Invisalign Full
|
64.6
|
|
57.4
|
|
7.2
|
|
12.5
|
%
|
191.4
|
|
177.0
|
|
14.4
|
|
8.1
|
%
|
|||||||
|
Invisalign Express/Lite
|
19.2
|
|
14.6
|
|
4.6
|
|
31.5
|
%
|
59.4
|
|
42.8
|
|
16.6
|
|
38.8
|
%
|
|||||||
|
Invisalign Teen
|
17.7
|
|
15.3
|
|
2.4
|
|
15.7
|
%
|
44.2
|
|
37.1
|
|
7.1
|
|
19.1
|
%
|
|||||||
|
Invisalign Assist
|
5.4
|
|
5.2
|
|
0.2
|
|
3.8
|
%
|
16.2
|
|
16.1
|
|
0.1
|
|
0.6
|
%
|
|||||||
|
Total Invisalign case volume
|
106.9
|
|
92.5
|
|
14.4
|
|
15.6
|
%
|
311.2
|
|
273.0
|
|
38.2
|
|
14.0
|
%
|
|||||||
Clear Aligner
In the three months ended September 30, 2013, Clear Aligner North America net revenues increased by $14.4 million or 16.1% compared to the same period in 2012 primarily due to Invisalign case volume growth of approximately $12.1 million across all channels and products and, to a lesser extent, higher ASP which contributed approximately $2.3 million to the increase in net revenues. The increase in ASP was as a result of lower promotional discounts during the period along with the impact from our price increases effective January 2013, which were offset in part by higher revenue deferrals for mid-course correction as a result of our policy change in June 2013.
In the nine months ended September 30, 2013, Clear Aligner North America net revenues increased by $33.8 or 12.5% compared to the same period in 2012 mainly due to Invisalign case volume growth of $32.5 million and, to a lesser extent, an increase in ASP. The increased ASP was a result of lower promotional discounts as well as price increases which were effective January 2013, which were partly offset by a decrease in net revenues due to a product mix shift towards lower priced Invisalign Express products as well as the increase in the revenue deferrals related to mid-course corrections.
In the three months ended September 30, 2013, Clear Aligner international net revenues increased by $9.2 million or 31.0% compared to the same period in 2012 primarily driven by Invisalign case volume growth of $6.6 million along with higher ASP. The increased ASP was due to the impact from acquiring our distributor in the APAC region on April 30, 2013, as we began to recognize direct sales of Invisalign products sold in that region at our full ASP rather than the discounted ASP under the distributor agreement, as well as a favorable impact from foreign exchange rates.
In the nine months ended September 30, 2013, Clear Aligner international net revenues increased $18.7 million or 20.3% compared to the same period in 2012 primarily driven by Invisalign case volume growth of $18.6 million.
Invisalign non-case net revenues, consisting of training fees and ancillary product revenues, increased 42.7% and 55.5% for the three and nine months ended September 30, 2013, respectively, compared to the same periods in 2012, primarily due to the consolidation of our Vivera product shipments in North America from four shipments per year to one combined shipment along with increased Vivera volume both in North America and international.
28
SCCS
SCCS net revenues increased 12.2% for the three months ended September 30, 2013 compared to the same period in 2012 due to an increase in the number of scanners recognized partially offset by a decrease in CAD/CAM services net revenues as a result of the discontinuation of the OrthoCAD iQ services during the fourth quarter of 2012 as well lower scanner ASP.
SCCS net revenues was consistent for the nine months ended September 30, 2013 compared to the same period in 2012 as the increase in scanner revenues for the nine month period ending September 30, 2013 was fully offset by the decrease in CAD/CAM services net revenues for the same period. The increase in scanner revenues was primarily as a result of $1.4 million release of revenue which was previously reserved for the new iTero upgrade program which was completed in the first quarter of 2013, and the decline in CAD/CAM services net revenues was primarily the result of the discontinuation of the OrthoCAD iQ services during the fourth quarter of 2012.
Cost of net revenues and gross profit (in millions):
|
|
Three Months Ended September 30,
|
Nine Months Ended September 30,
|
|||||||||||||||||||||
|
|
2013
|
2012
|
Change
|
2013
|
2012
|
Change
|
|||||||||||||||||
|
Clear Aligner
|
|||||||||||||||||||||||
|
Cost of net revenues
|
$
|
30.9
|
|
$
|
28.4
|
|
$
|
2.5
|
|
$
|
96.3
|
|
$
|
82.4
|
|
$
|
13.9
|
|
|||||
|
% of net segment revenues
|
20.1
|
%
|
22.4
|
%
|
21.5
|
%
|
21.5
|
%
|
|||||||||||||||
|
Gross profit
|
$
|
122.7
|
|
$
|
98.3
|
|
$
|
24.4
|
|
$
|
352.1
|
|
$
|
301.3
|
|
$
|
50.8
|
|
|||||
|
Gross margin %
|
79.9
|
%
|
77.6
|
%
|
78.5
|
%
|
78.5
|
%
|
|||||||||||||||
|
SCCS
|
|||||||||||||||||||||||
|
Cost of net revenues
|
$
|
8.5
|
|
$
|
7.8
|
|
$
|
0.7
|
|
$
|
24.0
|
|
$
|
24.9
|
|
$
|
(0.9
|
)
|
|||||
|
% of net segment revenues
|
77.8
|
%
|
79.4
|
%
|
71.6
|
%
|
74.4
|
%
|
|||||||||||||||
|
Gross profit
|
$
|
2.4
|
|
$
|
2.0
|
|
$
|
0.4
|
|
$
|
9.5
|
|
$
|
8.6
|
|
$
|
0.9
|
|
|||||
|
Gross margin %
|
22.2
|
%
|
20.6
|
%
|
28.4
|
%
|
25.6
|
%
|
|||||||||||||||
|
Total cost of net revenues
|
$
|
39.4
|
|
$
|
36.2
|
|
$
|
3.2
|
|
$
|
120.3
|
|
$
|
107.3
|
|
$
|
13.0
|
|
|||||
|
% of net revenues
|
24.0
|
%
|
26.5
|
%
|
25.0
|
%
|
25.7
|
%
|
|||||||||||||||
|
Gross profit
|
$
|
125.1
|
|
$
|
100.3
|
|
$
|
24.8
|
|
$
|
361.6
|
|
$
|
309.9
|
|
$
|
51.7
|
|
|||||
|
Gross margin %
|
76.0
|
%
|
73.5
|
%
|
75.0
|
%
|
74.3
|
%
|
|||||||||||||||
Cost of net revenues for our Clear Aligner and SCCS segments includes salaries for staff involved in the production process, cost of materials, packaging, shipping costs, depreciation on capital equipment used in the production process, amortization of acquired intangible assets, training costs and stock-based compensation expense.
Clear Aligner
Gross margin increased for the three months ended
September 30, 2013
compared to the same period in 2012 due to higher ASP, increased fixed cost absorption due to higher volumes and lower warranty costs as a result of reduced claims corresponding with the change in our mid-course correction policy. These gross margin improvements were partially offset by increased material costs, primarily related to our new SmartTrack material.
Gross margins were flat for the nine months ended
September 30, 2013
compared to the same period in 2012 due to favorable margin impact from higher ASP which was offset by an increase in material costs primarily related to our new SmartTrack material. In addition, we incurred higher inventory reserves for our prior aligner material which has been substantially replaced by our new SmartTrack aligner material.
SCCS
Gross margin increased for the three months ended
September 30, 2013
compared to the same period in 2012 due to lower manufacturing costs as a result of the closure of our New Jersey facility, which was completed by October 2012, lower training costs and lower inventory reserves. These gross margin improvements were partially offset by lower margins on sales of our older scanner model and an increase in warranty costs.
29
Gross margin increased for the nine months ended
September 30, 2013
compared to the same period in 2012 primarily from higher scanner ASP as a result of the $1.4 million release of revenue for amounts previously reserved for the new iTero scanner upgrade program which was completed in the first quarter of 2013. We also reduced our manufacturing costs as a result of the closure of our New Jersey facility, which was completed by October 2012, and a reduction in training costs; however, these savings were offset by lower manufacturing cost absorption.
Sales and marketing (in millions):
|
|
Three Months Ended September 30,
|
Nine Months Ended September 30,
|
|||||||||||||||||||||
|
|
2013
|
2012
|
Change
|
2013
|
2012
|
Change
|
|||||||||||||||||
|
Sales and marketing
|
$
|
45.2
|
|
$
|
36.5
|
|
$
|
8.7
|
|
$
|
135.4
|
|
$
|
114.3
|
|
$
|
21.1
|
|
|||||
|
% of net revenues
|
27.5
|
%
|
26.7
|
%
|
28.1
|
%
|
27.4
|
%
|
|||||||||||||||
Sales and marketing expense includes sales force and marketing compensation (including travel-related costs), media and advertising, clinical education, trade shows and industry events, product marketing and stock-based compensation expense.
Our sales and marketing expense for the three months ended
September 30, 2013
increased compared to the same period in 2012 primarily due to higher compensation costs of $6.7 million largely related to increased headcount, higher sales commissions and stock-based compensation. In addition, we incurred higher advertising and media costs of approximately $1.8 million related to network and television media campaigns.
Our sales and marketing expense for the nine months ended
September 30, 2013
increased compared to the same period in 2012 primarily due to higher compensation costs of $12.4 million largely related to increased headcount, higher sales commissions and stock-based compensation. In addition, we incurred higher advertising and media costs of approximately $4.9 million related to network and television media campaigns and higher clinical education costs of $1.5 million largely as a result of our bi-annual Invisalign European Summit which was held during the second quarter of 2013.
General and administrative (in millions):
|
|
Three Months Ended September 30,
|
Nine Months Ended September 30,
|
|||||||||||||||||||||
|
|
2013
|
2012
|
Change
|
2013
|
2012
|
Change
|
|||||||||||||||||
|
General and administrative
|
$
|
27.5
|
|
$
|
24.8
|
|
$
|
2.7
|
|
$
|
84.9
|
|
$
|
71.3
|
|
$
|
13.6
|
|
|||||
|
% of net revenues
|
16.7
|
%
|
18.1
|
%
|
17.6
|
%
|
17.1
|
%
|
|||||||||||||||
General and administrative expense includes salaries for administrative personnel, outside consulting services, legal expenses and stock-based compensation expense.
General and administrative expense increased for the three months ended
September 30, 2013
compared to the same period in 2012 primarily due to higher compensation costs of $2.0 million as a result of higher stock-based compensation and increased headcount. Additionally, we incurred $1.8 million of medical device excise tax as a result of new tax regulations effective January 1, 2013. These costs were partially offset by lower legal fees of $2.2 million.
General and administrative expense increased for the nine months ended
September 30, 2013
primarily due to higher compensation costs of $7.0 million as a result of higher stock-based compensation and increased headcount along with $5.3 million of medical device excise tax.
Research and development (in millions):
|
|
Three Months Ended September 30,
|
Nine Months Ended September 30,
|
|||||||||||||||||||||
|
|
2013
|
2012
|
Change
|
2013
|
2012
|
Change
|
|||||||||||||||||
|
Research and development
|
$
|
10.9
|
|
$
|
10.0
|
|
$
|
0.9
|
|
$
|
33.1
|
|
$
|
31.2
|
|
$
|
1.9
|
|
|||||
|
% of net revenues
|
6.6
|
%
|
7.3
|
%
|
6.9
|
%
|
7.5
|
%
|
|||||||||||||||
Research and development expense includes the personnel-related costs and outside consulting expenses associated with the research and development of new products and enhancements to existing products, corporate allocations, facility and facility related costs and stock-based compensation expense.
30
Research and development expense during the three and nine months ended
September 30, 2013
, compared to the same period in 2012 increased slightly primarily due to of higher compensation costs of $0.7 million and $1.4 million, respectively.
Impairment of goodwill (in millions):
|
|
Three Months Ended September 30,
|
Nine Months Ended September 30,
|
|||||||||||||||||||||
|
|
2013
|
2012
|
Change
|
2013
|
2012
|
Change
|
|||||||||||||||||
|
Impairment of goodwill
|
$
|
—
|
|
$
|
24.7
|
|
$
|
(24.7
|
)
|
$
|
40.7
|
|
$
|
24.7
|
|
$
|
16.0
|
|
|||||
|
% of net revenues
|
—
|
%
|
18.1
|
%
|
8.4
|
%
|
5.9
|
%
|
|||||||||||||||
There was no goodwill impairment charge recorded in the third quarter of 2013.
During the nine months ended September 30, 2013, we recorded $40.7 million for the impairment of goodwill. In the first quarter of 2013, we determined that the goodwill for our SCCS reporting unit should be tested for impairment between annual tests since an event occurred or circumstances changed that would more likely than not reduce the fair value of our SCCS reporting unit below its carrying amount. As a result of our analysis, we recorded a goodwill impairment charge of $40.7 million in the first quarter of 2013, none of which was deductible for tax purposes. Refer to Note 5 for details of the impairment analysis.
Impairment of long-lived assets (in millions):
|
|
Three Months Ended September 30,
|
Nine Months Ended September 30,
|
|||||||||||||||||||||
|
|
2013
|
2012
|
Change
|
2013
|
2012
|
Change
|
|||||||||||||||||
|
Impairment of long-lived assets
|
$
|
—
|
|
$
|
—
|
|
$
|
—
|
|
$
|
26.3
|
|
$
|
—
|
|
$
|
26.3
|
|
|||||
|
% of net revenues
|
—
|
%
|
—
|
%
|
5.5
|
%
|
—
|
%
|
|||||||||||||||
There was no impairment of long-lived assets recorded in the third quarter of 2013.
During the nine months ended September 30, 2013, we recorded $26.3 million related to the impairment of long-lived assets. This impairment was recorded in the first quarter of 2013 as a result of changes in the competitive environment of our intra-oral scanners, which included announcements of new low-priced scanners targeted at orthodontists and general practitioner dentists in North America, which caused us to lower our expectations for growth and profitability for our SCCS reporting unit. Therefore, we determined that the carrying value of the long-lived assets was not recoverable and recorded an impairment charge of $26.3 million. Refer to Note 5 for details of the impairment analysis.
Interest and other income (expense), net (in millions):
|
|
Three Months Ended September 30,
|
Nine Months Ended September 30,
|
|||||||||||||||||||||
|
|
2013
|
2012
|
Change
|
2013
|
2012
|
Change
|
|||||||||||||||||
|
Interest and other income (expense), net
|
$
|
0.5
|
|
$
|
(0.4
|
)
|
$
|
0.9
|
|
$
|
(0.9
|
)
|
$
|
(0.6
|
)
|
$
|
(0.3
|
)
|
|||||
Interest and other income (expense), net, includes interest income earned on cash, cash equivalents and investment balances, foreign currency translation gains and losses and other miscellaneous charges.
Interest and other income (expense) for the three months ended
September 30, 2013
increased compared to the same period in 2012 reflecting higher foreign exchange gains primarily due to the weakening of the U.S. dollar to the Euro.
Interest and other income (expense) for the nine months ended
September 30, 2013
compared to the same period in 2012 increased reflecting higher foreign exchange losses primarily due to the strengthening of the U.S. dollar to the Euro and the weakening of the Australian dollar to the Euro.
31
Income tax (in millions):
|
|
Three Months Ended September 30,
|
Nine Months Ended September 30,
|
|||||||||||||||||||||
|
|
2013
|
2012
|
Change
|
2013
|
2012
|
Change
|
|||||||||||||||||
|
Provision for income taxes
|
$
|
7.4
|
|
$
|
4.5
|
|
$
|
2.9
|
|
$
|
18.5
|
|
$
|
18.8
|
|
$
|
(0.3
|
)
|
|||||
|
Effective tax rates
|
17.6
|
%
|
108.3
|
%
|
45.9
|
%
|
27.6
|
%
|
|||||||||||||||
Our provision for income taxes was
$7.4 million
and
$4.5 million
for the three months ended September 30, 2013 and 2012, respectively. This represents effective tax rates of
17.6%
and
108.3%
, respectively. The increase in provision for income taxes was primarily due to higher pre-tax income, which was partially offset by a $1.3 million discrete benefit related to the filing of our 2012 U.S. tax return as well as a jurisdictional shift in forecasted earnings from the U.S. to lower-tax non-U.S. jurisdictions. The effective tax rate for the three months ended September 30, 2012 reflects a non-deductible goodwill impairment charge of $24.7 million.
Our provision for income taxes was
$18.5 million
and
$18.8 million
for the nine months ended September 30, 2013 and 2012, respectively. This represents effective tax rates of
45.9%
and
27.6%
, respectively. The decrease in provision for income taxes was primarily due to a jurisdictional shift in forecasted earnings from the U.S. to lower-tax non-U.S. jurisdictions and a $1.3 million discrete benefit related to the filing of our 2012 U.S. tax return, partially offset by a
$5.8 million
tax expense related to the impairment of goodwill and long-lived assets. The
$5.8 million
, which was recorded as a discrete item during the three months ended March 31, 2013, was comprised of a
$9.7 million
tax expense due to a non-deductible goodwill impairment charge offset by a
$3.9 million
tax benefit associated with the impairment of long-lived assets. The effective tax rate for the nine months ended September 30, 2013 reflects a non-deductible goodwill impairment charge of $40.7 million recorded during the three months ended March 31, 2013
On January 2, 2013, the American Taxpayer Relief Act of 2012 (H.R. 8, as amended) was signed into law. This Act extends the federal research and development credit through December 31, 2013. The federal research and development credit was reinstated retroactively to January 1, 2012. The tax benefit of the federal research and development credit for the twelve months ended December 31, 2012 resulted in a discrete tax benefit of $0.5 million in the first quarter of fiscal year 2013, the period in which the reinstatement was enacted into law.
We exercise significant judgment in regards to estimates of future market growth, forecasted earnings and projected taxable income, in determining the provision for income taxes, and for purposes of assessing our ability to utilize any future benefit from deferred tax assets.
As of
September 30, 2013
, we maintained a valuation allowance of $30.3 million against deferred tax assets primarily related to foreign net operating loss carryforwards and capital loss carryforwards. These net operating and capital loss carryforwards would result in an income tax benefit if we were to conclude it is more likely than not that the related deferred tax assets will be realized.
During the three months ended September 30, 2013, the change in our gross unrecognized tax benefits was not material. The total amount of gross unrecognized tax benefits was
$23.7 million
as of
September 30, 2013
, all of which would impact our effective tax rate if recognized. We have elected to recognize interest and penalties related to unrecognized tax benefits as a component of income taxes. The change in accrued interest and penalties during the three months ended September 30, 2013, was not material. We do not expect any significant changes to the amount of unrecognized tax benefit within the next twelve months.
We are subject to taxation in the U.S., and various states and foreign jurisdictions. All of our tax years will be open to examination by the U.S. federal and most state tax authorities due to our net operating loss and overall credit carryforward position. With few exceptions, we are no longer subject to examination by foreign tax authorities for years before 2006. Our subsidiaries in Israel and Germany are under audit by the local tax authorities for calendar years 2006 through 2011 and 2007 through 2011, respectively.
Liquidity and Capital Resources
We fund our operations from product sales and the proceeds from the sale of our common stock. As of
September 30, 2013
and
December 31, 2012
, we had the following cash, cash equivalents, and short-term and long-term investments (in thousands):
32
|
September 30,
2013
|
December 31,
2012
|
||||||
|
Cash and cash equivalents
|
$
|
175,839
|
|
$
|
306,386
|
|
|
|
Marketable securities, short-term
|
147,740
|
|
28,485
|
|
|||
|
Marketable securities, long-term
|
76,836
|
|
21,252
|
|
|||
|
Total
|
$
|
400,415
|
|
$
|
356,123
|
|
|
Cash flows
(in thousands):
|
|
Nine Months Ended September 30,
|
|||||||
|
|
2013
|
2012
|
||||||
|
Net cash flow provided by (used in) :
|
||||||||
|
Operating activities
|
$
|
118,864
|
|
$
|
83,020
|
|
||
|
Investing activities
|
(199,989
|
)
|
(65,648
|
)
|
||||
|
Financing activities
|
(48,902
|
)
|
46,819
|
|
||||
|
Effects of exchange rate changes on cash and cash equivalents
|
(520
|
)
|
41
|
|
||||
|
Net increase (decrease) in cash and cash equivalents
|
$
|
(130,547
|
)
|
$
|
64,232
|
|
||
As of
September 30, 2013
, we had
$400.4 million
of cash, cash equivalents and short-term and long-term marketable securities. Cash equivalents and marketable securities are comprised of money market funds and debt instruments which include commercial paper, corporate bonds, U.S. government agency bonds, U.S. dollar dominated foreign corporate bonds, U.S. government treasury bonds, municipal securities and asset-backed securities.
As of
September 30, 2013
, approximately $194.2 million of cash, cash equivalents and short-term and long-term marketable securities was held by our foreign subsidiaries. Amounts held by foreign subsidiaries are generally subject to U.S. income taxation on repatriation to the U.S. The costs to repatriate our foreign earnings to the U.S. would likely be material; however, our intent is to permanently reinvest our earnings from foreign operations, and our current plans do not require us to repatriate them to fund our U.S. operations as we generate sufficient domestic operating cash flow and have access to external funding under our current revolving line of credit.
Operating Activities
For the nine months ended
September 30, 2013
, cash flows from operations of
$118.9 million
resulted primarily from our net income of approximately $21.9 million along with the following significant reasons:
Significant non-cash activities
|
•
|
Impairment of goodwill of $40.7 million.
|
|
•
|
Impairment of long-lived assets of $26.3 million.
|
|
•
|
Excess tax benefits from our share-based compensation arrangements of $21.8 million.
|
|
•
|
Stock-based compensation of $21.3 million related to equity incentive compensation awards granted to our employees.
|
|
•
|
Depreciation and amortization of property, plant and equipment and intangibles of $12.6 million.
|
|
•
|
Release of deferred taxes of $14.5 million primarily due to the utilization of our deferred tax assets.
|
|
•
|
Provisions for allowances for doubtful accounts, credit reserves and returns of $1.2 million.
|
33
Significant changes in working capital
|
•
|
Accounts receivable increased by $5.9 million due to the increase in net revenues, reducing our cash inflow from operations.
|
|
•
|
Deferred revenues increased by $8.4 million primarily due to higher product sales during the first three quarters of 2013 along with additional deferrals as a result of our mid-course correction policy change in June 2013, increasing our cash inflow from operating activities.
|
For the nine months ended September 30, 2012, cash flows from operations of $83.0 million resulted primarily from our net profit of approximately $49.1 million and the following significant reasons:
Significant non-cash activities
|
•
|
Release of deferred taxes of $13.2 million primarily due to the utilization of our deferred tax assets.
|
|
•
|
Depreciation and amortization of property, plant and equipment and intangibles of $12.5 million.
|
|
•
|
Stock-based compensation was $15.5 million related to equity incentive compensation granted to employees.
|
|
•
|
Excess tax benefit from our share-based compensation arrangement were $18.1 million.
|
|
•
|
Impairment of goodwill was $24.7 million.
|
|
•
|
Provisions for allowances for doubtful accounts, credit reserves and returns of $2.7 million.
|
Significant changes in working capital
|
•
|
Accounts receivable increased by $17.4 million due to the increase in net revenues, reducing our cash inflows from operating activities.
|
|
•
|
Inventories increased by $5.7 million which was primarily due to increased production volumes for our intra-oral scanner products in preparation for the move into our new facility in Israel, reducing our cash inflow from operating activities.
|
|
•
|
Prepaid expenses and other assets increased $1.6 million primarily due to the timing of software license and insurance policy renewals, reducing our cash inflow from operations.
|
|
•
|
Accounts payable decreased by $3.9 million during the first three quarters of 2012, reducing our cash inflow from operating activities.
|
|
•
|
Deferred revenues increased by $12.7 million primarily due to higher product sales during the first three quarters of 2012, increasing our cash inflow from operating activities.
|
Investing Activities
Net cash used in investing activities was $200.0 million for the nine months ended
September 30, 2013
primarily consisted of purchases of marketable securities of $214.0 million, property, plant and equipment purchases of $15.2 million, the acquisition of ICA for $7.7 million, net of cash acquired, and other investing activities of $2.3 million. These uses were partially offset by $39.2 million of maturities and sales of our marketable securities.
Net cash used in investing activities was $65.6 million for the nine months ended September 30, 2012 primarily consisted of our purchase of marketable securities of $53.9 million and property, plant and equipment purchases of $31.5 million. These costs were partially offset by $17.4 million of maturities and sales of our marketable securities and other investing activities of $2.4 million.
Although we believe our current investment portfolio has little risk of impairment, we cannot predict future market conditions or market liquidity and can provide no assurance that our investment portfolio will remain unimpaired.
34
Financing Activities
Net cash used by financing activities was $48.9 million for the nine months ended
September 30, 2013
primarily resulting from $95.1 million of common stock repurchases and $3.9 million of payroll taxes paid for vesting of restricted stock units through share withholdings. These costs were partially offset by $28.3 million in proceeds from the issuance of our common stock and $21.8 million from excess tax benefit from our share-based compensation arrangements.
Net cash provided by financing activities was $46.8 million for the nine months ended September 30, 2012 primarily resulting from $40.2 million in proceeds from the issuance of our common stock and $18.1 million from excess tax benefit from our share-based compensation arrangements. These costs were partially offset by $9.8 million of common stock repurchases and $1.8 million of payroll taxes paid for vesting of restricted stock units through share withholdings.
Contractual Obligations
Our contractual obligations have not significantly changed since December 31, 2012. We believe that our current cash, cash equivalents and short-term marketable securities combined with our existing borrowing capacity will be sufficient to fund our operations for at least the next 12 months. If we are unable to generate adequate operating cash flows and need more funds beyond those available under our credit facility, we may need to seek additional sources of capital through equity or debt financing, collaborative or other arrangements with other companies, bank financing and other sources in order to realize our objectives and to continue our operations. There can be no assurance that we will be able to obtain additional debt or equity financing on terms acceptable to us, or at all. If adequate funds are not available, we may need to make business decisions that could adversely affect our operating results such as modifications to our pricing policy, business structure or operations. Accordingly, the failure to obtain sufficient funds on acceptable terms when needed could have a material adverse effect on our business, results of operations and financial condition.
Off-Balance Sheet Arrangements
As of
September 30, 2013
, we had no off-balance sheet arrangements that have, or are reasonably likely to have, a current or future material effect on our consolidated financial condition, results of operations, liquidity, capital expenditures or capital resources.
Indemnification Provisions
In the normal course of business to facilitate transactions in our services and products, we indemnify certain parties: customers, vendors, lessors and other parties with respect to certain matters, including, but not limited to, services to be provided by us and intellectual property infringement claims made by third parties. In addition, we have entered into indemnification agreements with our directors and certain of our officers that will require us, among other things, to indemnify them against certain liabilities that may arise by reason of their status or service as directors or officers. Several of these agreements limit the time within which an indemnification claim can be made and the amount of the claim.
It is not possible to make a reasonable estimate of the maximum potential amount under these indemnification agreements due to the unique facts and circumstances involved in each particular agreement. Additionally, we have a limited history of prior indemnification claims and the payments we have made under such agreements have not had a material adverse effect on our results of operations, cash flows, or financial position. However, to the extent that valid indemnification claims arise in the future, future payments by us could be significant and could have a material adverse effect on our results of operations or cash flows in a particular period. As of
September 30, 2013
, we did not have any material indemnification claims that were probable or reasonably possible.
Critical Accounting Policies and Estimates
Management’s discussion and analysis of our financial condition and results of operations is based upon our Condensed Consolidated Financial Statements, which have been prepared in accordance with accounting principles generally accepted in the United States of America. The preparation of condensed consolidated financial statements requires our management to make estimates and judgments that affect the reported amounts of assets and liabilities, net revenues and expenses and disclosures at the date of the financial statements. We evaluate our estimates on an on-going basis, including those related to revenue recognition, accounts receivable, intangible assets, legal contingencies, impairment of goodwill and income taxes. We use authoritative pronouncements, historical experience and other assumptions as the basis for making estimates. Actual results could differ from those estimates.
35
We believe the following critical accounting policies reflect our most significant estimates, judgments and assumptions used in the preparation of our consolidated financial statements. These critical accounting policies and related disclosures appear in our Annual Report on Form 10-K for the year ended December 31, 2012:
|
•
|
Revenue recognition;
|
|
•
|
Stock-based compensation expense;
|
|
•
|
Long-lived assets, including finite-lived purchased intangible assets;
|
|
•
|
Deferred tax valuation allowance;
|
|
•
|
Goodwill; and
|
|
•
|
Impairment of goodwill and long-lived assets.
|
Recent Accounting Pronouncements
See Note 1 “Summary of Significant Accounting Policies” of the Notes to Condensed Consolidated Financial Statements for a discussion of recent accounting pronouncements.
ITEM 3.
QUANTITATIVE AND QUALITATIVE DISCLOSURES ABOUT MARKET RISK
For quantitative and qualitative disclosures about market risk affecting us, see Item 7A, “Quantitative and Qualitative Disclosures About Market Risk,” in our Annual Report on Form 10-K for the year ended December 31, 2012, which is incorporated herein by reference. Our exposure to market risk has not changed materially since December 31, 2012.
ITEM 4.
CONTROLS AND PROCEDURES
Evaluation of disclosure controls and procedures.
Under the supervision and with the participation of our management, including our Chief Executive Officer and our Chief Financial Officer, we have evaluated the effectiveness of the design and operation of our disclosure controls and procedures (as defined in Rules 13a-15(e) and 15d-15(e) under the Exchange Act) as of the end of the period covered by this Quarterly Report on Form 10-Q. Based upon that evaluation, our Chief Executive Officer and our Chief Financial Officer have concluded that our disclosure controls and procedures are effective as of
September 30, 2013
, to provide reasonable assurance that information required to be disclosed by us in the reports that we file or submit under the Exchange Act is accumulated and communicated to our management, including our Chief Executive Officer and our Chief Financial Officer, as appropriate, to allow timely decisions regarding required disclosure, and that such information is recorded, processed, summarized and reported within the time periods specified in the SEC rules and forms.
Changes in internal control over financial reporting.
There were no changes in our internal control over financial reporting that occurred during the period covered by this report that have materially affected, or are reasonably likely to materially affect, our internal control over financial reporting.
36
Securities Class Action Lawsuit
On November 28, 2012, plaintiff City of Dearborn Heights Act 345 Police & Fire Retirement System filed a lawsuit against Align, Thomas M. Prescott (“Mr. Prescott”), Align's President and Chief Executive Officer, and Kenneth B. Arola (“Mr. Arola”), Align's former Vice President, Finance and Chief Financial Officer, in the United States District Court for the Northern District of California on behalf of a purported class of purchasers of our common stock (the "Securities Action"). On July 11, 2013, an amended complaint was filed, which names the same defendants, on behalf of a purported class of purchasers of our common stock between January 31, 2012 and October 17, 2012. The amended complaint alleges that Align, Mr. Prescott and Mr. Arola violated Section 10(b) of the Securities Exchange Act of 1934 and Rule 10b-5 promulgated thereunder, and that Mr. Prescott and Mr. Arola violated Section 20(a) of the Securities Exchange Act of 1934. Specifically, the amended complaint alleges that during the purported class period defendants failed to take an appropriate goodwill impairment charge related to the April 29, 2011 acquisition of Cadent Holdings, Inc. in the fourth quarter of 2011, the first quarter of 2012 or the second quarter of 2012, which rendered our financial statements and projections of future earnings materially false and misleading and in violation of GAAP. The amended complaint seeks monetary damages in an unspecified amount, costs and attorney's fees. Align filed a motion to dismiss the amended complaint on August 22, 2013. The hearing on this motion has been scheduled for November 20, 2013. Align intends to vigorously defend itself against these allegations. Align is currently unable to predict the outcome of this amended complaint and therefore cannot determine the likelihood of loss nor estimate a range of possible loss.
Shareholder Derivative Lawsuit
On February 1, 2013, plaintiff Gary Udis filed a shareholder derivative lawsuit against several of Align's current and former officers and directors in the Superior Court of California, County of Santa Clara. The complaint alleges that our reported income and earnings were materially overstated because of a failure to timely write down goodwill related to the April 29, 2011 acquisition of Cadent Holdings, Inc., and that defendants made allegedly false statements concerning our forecasts. The complaint asserts various state law causes of action, including claims of breach of fiduciary duty, unjust enrichment, and insider trading, among others. The complaint seeks unspecified damages on behalf of Align, which is named solely as nominal defendant against whom no recovery is sought. The complaint also seeks an order directing Align to reform and improve its corporate governance and internal procedures, and seeks restitution in an unspecified amount, costs, and attorney's fees. On July 8, 2013, an Order was entered staying this derivative lawsuit until there is an initial ruling on our first motion to dismiss the Securities Action. Align is currently unable to predict the outcome of this complaint and therefore cannot determine the likelihood of loss nor estimate a range of possible losses.
In addition, in the course of Align's operations, Align is involved in a variety of claims, suits, investigations, and proceedings, including actions with respect to intellectual property claims, patent infringement claims, government investigations, labor and employment claims, breach of contract claims, tax, and other matters. Regardless of the outcome, these proceedings can have an adverse impact on us because of defense costs, diversion of management resources, and other factors. Although the results of complex legal proceedings are difficult to predict and Align's view of these matters may change in the future as litigation and events related thereto unfold; Align currently does not believe that these matters, individually or in the aggregate, will materially affect Align's financial position, results of operations or cash flows.
ITEM 1A.
RISK FACTORS
We depend on the sale of the Invisalign system for the vast majority of our net revenues, and any decline in sales of Invisalign treatment for any reason, a continued weakness in general economic conditions, or a decline in average selling prices would adversely affect net revenues, gross margin and net income.
We expect that net revenues from the sale of the Invisalign system, primarily Invisalign Full and Invisalign Teen, will continue to account for the vast majority of our total net revenues for the foreseeable future. Continued and widespread market acceptance of Invisalign by orthodontists, GPs and consumers is critical to our future success. If orthodontists and GPs experience a reduction in consumer demand for orthodontic services, if consumers prove unwilling to adopt Invisalign as rapidly as we anticipate or in the volume that we anticipate, if orthodontists or GPs choose to use a competitive product rather than Invisalign or if the average selling price of our product declines, our operating results would be harmed.
37
Demand for our products may not increase as rapidly as we anticipate due to a variety of factors including a continued weakness in general economic conditions.
Consumer spending habits are affected by, among other things, prevailing economic conditions, levels of employment, salaries and wage rates, gas prices, consumer confidence and consumer perception of economic conditions. A general slowdown in the U.S. economy and certain international economies or an uncertain economic outlook would adversely affect consumer spending habits which may, among other things, result in a decrease in the number of overall orthodontic case starts, reduced the patient traffic in dentists’ offices, reduction in consumer spending on higher value procedures or a reduction in the demand for dental services generally, each of which would have a material adverse effect on our sales and operating results. Continued weakness in the global economy results in a challenging environment for selling dental technologies and dentists may postpone investments in capital equipment, such as intra-oral scanners. In addition, Invisalign treatment, which currently accounts for the vast majority of our net revenues, represents a significant change from traditional orthodontic treatment, and customers and consumers may be reluctant to accept it or may not find it preferable to traditional treatment. We have generally received positive feedback from orthodontists, GPs and consumers regarding Invisalign treatment as both an alternative to braces and as a clinical method for treatment of malocclusion, but a number of dental professionals believe that Invisalign treatment is appropriate for only a limited percentage of their patients. Increased market acceptance of all of our products will depend in part upon the recommendations of dental professionals, as well as other factors including effectiveness, safety, ease of use, reliability, aesthetics, and price compared to competing products.
The frequency of use of the Invisalign system by orthodontists or GPs may not increase at the rate that we anticipate or at all.
One of our key objectives is to continue to increase utilization, or the adoption and frequency of use, of the Invisalign system by new and existing customers. If utilization of the Invisalign system by our existing and newly trained orthodontists or GPs does not occur or does not occur as quickly as we anticipate, our operating results could be harmed.
We may experience declines in average selling prices of our products which may decrease our net revenues.
In response to challenges in our business, including increased competition, we have in the past reduced the list price of our products. We also provide volume based discount programs to our doctors. In addition, we sell a number of products at different list prices. If we introduce any price reductions or consumer rebate programs; if we expand our discount programs in the future or participation in these programs increases; if our product mix shifts to lower priced products or products that have a higher percentage of deferred revenue; or if sales by our distributors grows at a faster pace than our direct sales, our average selling prices would be adversely affected and our net revenues, gross profit, gross margin and net income may be reduced. Furthermore, although the U.S. dollar is our reporting currency, a portion of our net revenues and net income are generated in foreign currencies. Net revenues and net income generated by subsidiaries operating outside of the U.S. are translated into U.S. dollars using exchange rates effective during the respective period and are affected by changes in exchange rates. As a result, negative movements in currency exchange rates against the U.S. dollar will adversely affect our average selling price and consequently the amount of net revenues and net income in our consolidated financial statements.
As we continue to grow, we are subject to growth related risks, including risks related to capacity constraints at our existing facilities.
We are subject to growth related risks, including capacity constraints and pressure on our internal systems and personnel. In order to manage current operations and future growth effectively, we will need to continue to implement and improve our operational, financial and management information systems and to hire, train, motivate, manage and retain employees. We may be unable to manage such growth effectively. Any such failure could have a material adverse impact on our business, operations and prospects. In addition, in order to meet the demands from expected volumes and continued international expansion, we opened a new manufacturing facility in Juarez, Mexico at the end of 2011. We completed the transition of virtually all our scanner distribution, repair and CAD/CAM services from our New Jersey facility to this facility in Juarez, Mexico in the third quarter of 2012. In addition, in October 2012, we transitioned our intra-oral scanner research and development and manufacturing operations in Or Yehuda, Israel into a new, larger facility in the same city. Expansion can inherently include additional costs and start-up inefficiencies, as well as the inability to successfully integrate additional facilities or incremental capacity and to realize anticipated synergies, economies of scale or other value. Periods of contraction or reduced net sales, or other factors affecting particular sites, create other challenges.
38
Because we cannot always immediately adapt our production capacity and related cost structures to changing market conditions, our manufacturing capacity may at times exceed or fall short of our production requirements. In addition, if product demand decreases or we fail to forecast demand accurately, we could be required to write off inventory or record excess capacity charges, which would lower our gross margin. Any or all of these problems could result in the loss of customers, provide an opportunity for competing products to gain market acceptance and otherwise harm our business and financial results.
We may never achieve the anticipated benefits from our acquisitions which may have an adverse effect on our business.
We acquired Cadent Holdings, Inc. in April 2011. We acquired Cadent for their people, their technology and their existing revenue streams such as, OrthoCAD iRecord and OrthoCAD iCast in addition to their intra-oral scanning technology. This acquisition is expected to strengthen our ability to drive adoption of the Invisalign system by integrating Invisalign treatment more fully with mainstream tools and procedures in doctors’ practices. In addition, we believe that the combination of the two companies will help accelerate the use of intra-oral scanning in the dental industry by leveraging Align’s global sales reach, extensive professional and consumer marketing capabilities and large customer base. We completed the acquisition of our Asia Pacific distributor on April 30, 2013. We may experience difficulties in achieving the anticipated financial or strategic benefits of these acquisitions. Potential risks include:
|
•
|
slower adoption or lack of acceptance for intra-oral scanning products in general or our chairside features;
|
|
•
|
our inability to increase utilization by integrating Invisalign treatment more fully with intra-oral scanners;
|
|
•
|
difficulty in integrating the technology, operations, internal accounting controls or work force of the acquired business with our existing business;
|
|
•
|
diversion of management resources and focus from ongoing business matters;
|
|
•
|
retention of key employees following the acquisition;
|
|
•
|
continued changes in the competitive environment, including recent announcements from competitors of new lower-priced scanners which we expect will lengthen the customer evaluation process and may result in price reductions and/or loss of sales;
|
|
•
|
difficulty dealing with tax, employment, logistics, and other related issues unique to international operations in Israel and the Asia Pacific region;
|
|
•
|
possible impairment of relationships with employees and customers as a result of the integration;
|
|
•
|
possible inconsistencies in standards, controls, procedures and policies among the acquired businesses and Align, which may make it more difficult to implement and harmonize worldwide financial reporting, accounting, billing, information technology and other systems;
|
|
•
|
a large portion of Cadent’s operations are located in Israel, accordingly, any increase in hostilities in the Middle East involving Israel may cause interruption or suspension of business operations without warning; and
|
|
•
|
negative impact on our results of operations and financial condition from acquisition-related charges, further impairment of goodwill, impairment of intangible assets and/or asset impairment charges.
|
If we cannot successfully integrate the acquired business with our existing business, our results of operations and financial condition could be adversely affected.
If we fail to sustain or increase profitability or revenue growth in future periods, the market price for our common stock may decline.
If we are to sustain or increase profitability in future periods, we will need to continue to increase our net revenues, while controlling our expenses. Because our business is evolving, it is difficult to predict our future operating results or levels of growth, and we have in the past not been and may in the future not be able to sustain our historical growth rates. If we do not increase profitability or revenue growth or otherwise meet the expectations of securities analysts or investors, the market price of our common stock will likely decline.
39
Our financial results have fluctuated in the past and may fluctuate in the future which may cause volatility in our stock price.
Our operating results have fluctuated in the past and we expect our future quarterly and annual operating results to fluctuate as we focus on increasing doctor and consumer demand for our products. These fluctuations could cause our stock price to decline or significantly fluctuate. Some of the factors that could cause our operating results to fluctuate include:
|
•
|
limited visibility into and difficulty predicting the level of activity in our customers’ practices from quarter to quarter;
|
|
•
|
weakness in consumer spending as a result of the slowdown in the U.S. economy and global economies;
|
|
•
|
changes in relationships with our distributors;
|
|
•
|
changes in the timing of receipt of case product orders during a given quarter which, given our cycle time and the delay between case receipts and case shipments, could have an impact on which quarter revenue can be recognized;
|
|
•
|
fluctuations in currency exchange rates against the U.S. dollar;
|
|
•
|
changes in product mix;
|
|
•
|
our inability to predict from period to period the number of trainers or the availability of doctors required to complete intra-oral scanner installations, which may impact the timing of when revenue is recognized;
|
|
•
|
if participation in our customer rebate program increases our average selling price will be adversely affected;
|
|
•
|
seasonal fluctuations in the number of doctors in their offices and their availability to take appointments;
|
|
•
|
success of or changes to our marketing programs from quarter to quarter;
|
|
•
|
our reliance on our contract manufacturers for the production of sub-assemblies for our intra-oral scanners;
|
|
•
|
timing of industry tradeshows;
|
|
•
|
changes in the timing of when revenue is recognized, including as a result of the introduction of new products or promotions or as a result of changes to critical accounting estimates or new accounting pronouncements;
|
|
•
|
changes to our effective tax rate;
|
|
•
|
unanticipated delays in production caused by insufficient capacity or availability of raw materials;
|
|
•
|
any disruptions in the manufacturing process, including unexpected turnover in the labor force or the introduction of new production processes, power outages or natural or other disasters beyond our control;
|
|
•
|
the development and marketing of directly competitive products by existing and new competitors;
|
|
•
|
major changes in available technology or the preferences of customers may cause our current product offerings to become less competitive or obsolete;
|
|
•
|
aggressive price competition from competitors;
|
|
•
|
costs and expenditures in connection with litigation;
|
|
•
|
the timing of new product introductions by us and our competitors, as well as customer order deferrals in anticipation of enhancements or new products;
|
|
•
|
disruptions to our business due to political, economic or other social instability, including the impact of an epidemic any of which results in changes in consumer spending habits, consumers unable or unwilling to visit the orthodontist or general practitioners office, as well as any impact on workforce absenteeism;
|
|
•
|
inaccurate forecasting of net revenues, production and other operating costs; and
|
|
•
|
investments in research and development to develop new products and enhancements.
|
40
To respond to these and other factors, we may need to make business decisions that could adversely affect our operating results such as modifications to our pricing policy, business structure or operations. Most of our expenses, such as employee compensation and lease payment obligations, are relatively fixed in the short term. Moreover, our expense levels are based, in part, on our expectations regarding future revenue levels. As a result, if our net revenues for a particular period fall below our expectations, whether caused by changes in consumer spending, consumer preferences, weakness in the U.S. or global economies, changes in customer behavior related to advertising and prescribing our product, or other factors, we may be unable to adjust spending quickly enough to offset any shortfall in net revenues. Due to these and other factors, we believe that quarter-to-quarter comparisons of our operating results may not be meaningful. You should not rely on our results for any one quarter as an indication of our future performance.
Our future success may depend on our ability to develop, successfully introduce and achieve market acceptance of new products.
Our future success may depend on our ability to develop, manufacture, market, and obtain regulatory approval or clearance of new products. There can be no assurance that we will be able to successfully develop, sell and achieve market acceptance of these and other new products and applications and enhanced versions of our existing product or software. The extent of, and rate at which, market acceptance and penetration are achieved by future products is a function of many variables, which include, among other things, our ability to:
|
•
|
correctly identify customer needs and preferences and predict future needs and preferences;
|
|
•
|
include functionality and features that address customer requirements;
|
|
•
|
ensure compatibility of our computer operating systems and hardware configurations with those of our customers;
|
|
•
|
allocate our research and development funding to products with higher growth prospects;
|
|
•
|
anticipate and respond to our competitors’ development of new products and technological innovations;
|
|
•
|
differentiate our offerings from our competitors’ offerings;
|
|
•
|
innovate and develop new technologies and applications;
|
|
•
|
the availability of third-party reimbursement of procedures using our products;
|
|
•
|
obtain adequate intellectual property rights; and
|
|
•
|
encourage customers to adopt new technologies.
|
If we fail to accurately predict customer needs and preferences or fail to produce viable technologies, we may invest heavily in research and development of products that do not lead to significant revenue. Even if we successfully innovate and develop new products and produce enhancements, we may incur substantial costs in doing so, and our profitability may suffer. In addition, even if our new products are successfully introduced, it is unlikely that they will rapidly gain market share and acceptance primarily due to the relatively long period of time it takes to successfully treat a patient with the Invisalign system. Since it takes approximately 12 to 24 months to treat a patient, our customers may be unwilling to rapidly adopt our new products until they successfully complete at least one case or until more historical clinical results are available.
Our ability to market and sell new products may also be subject to government regulation, including approval or clearance by the United States Food and Drug Administration (“FDA”), and foreign government agencies. Any failure in our ability to successfully develop and introduce or achieve market acceptance of our new products or enhanced versions of existing products could have a material adverse effect on our operating results and could cause our net revenues to decline.
A disruption in the operations of our primary freight carrier or higher shipping costs could cause a decline in our net revenues or a reduction in our earnings.
We are dependent on commercial freight carriers, primarily UPS, to deliver our products to our customers. If the operations of these carriers are disrupted for any reason, we may be unable to deliver our products to our customers on a timely basis. If we cannot deliver our products in an efficient and timely manner, our customers may reduce their orders from us and our net revenues and operating profits could materially decline. In a rising fuel cost environment, our freight costs will increase. If freight costs materially increase and we are unable to pass that increase along to our customers for any reason or otherwise offset such increases in our cost of net revenues, our gross margin and financial results could be adversely affected.
41
We are dependent on our international operations, which exposes us to foreign operational, political and other risks that may harm our business.
Our key production steps are performed in operations located outside of the U.S. At our facility in Costa Rica, technicians use a sophisticated, internally developed computer-modeling program to prepare digital treatment plans, which are then transmitted electronically to Juarez, Mexico. These digital files form the basis of the ClinCheck treatment plan and are used to manufacture aligner molds. Our order acquisition, aligner fabrication and shipping operations are conducted in Juarez, Mexico. In addition to the research and development efforts conducted in our San Jose, California facility, we also carry out research and development at locations in San Jose, Costa Rica and Moscow, Russia. In addition, our customer-care, accounts receivable, credit and collections and customer event registration organizations are located at our facility in Costa Rica. We also have operations in Israel where the design and wand assembly, intra-oral scanner manufacturing and digital modeling of our intra-oral scanners occurs. Our reliance on international operations exposes us to risks and uncertainties that may affect our business or results of operation, including:
|
•
|
difficulties in hiring and retaining employees generally, as well as difficulties in hiring and retaining employees with the necessary skills to perform the more technical aspects of our operations;
|
|
•
|
difficulties in managing international operations;
|
|
•
|
fluctuations in currency exchange rates;
|
|
•
|
import and export license requirements and restrictions;
|
|
•
|
controlling production volume and quality of the manufacturing process;
|
|
•
|
political, social and economic instability, including as a result of increased levels of violence in Juarez, Mexico or the Middle East;
|
|
•
|
acts of terrorism and acts of war;
|
|
•
|
interruptions and limitations in telecommunication services;
|
|
•
|
product or material transportation delays or disruption, including as a result of health epidemics restricting travel to and from our international locations or as a result of natural disasters, such as earthquakes or volcanic eruptions;
|
|
•
|
burdens of complying with a wide variety of local country and regional laws;
|
|
•
|
trade restrictions and changes in tariffs; and
|
|
•
|
potential adverse tax consequences.
|
If any of these risks materialize in the future, we could experience production delays and lost or delayed revenue.
We earn an increasingly larger portion of our total revenues from international sales and face risks attendant to those operations.
We earn an increasingly larger portion of our total revenues from international sales generated through our foreign direct and indirect operations. As a result of these sales operations, we face a variety of risks, including:
|
•
|
local political and economic instability;
|
|
•
|
the engagement of activities by our employees, contractors, partners and agents, especially in countries with developing economies, that are prohibited by international and local trade and labor laws and other laws prohibiting corrupt payments to government officials, including the Foreign Corrupt Practices Act, the UK Bribery Act of 2010 and export control laws, in spite of our policies and procedures designed to ensure compliance with these laws;
|
|
•
|
although it is our intention to permanently reinvest earnings outside the U.S., restrictions on the transfer of funds held by our foreign subsidiaries, including with respect to restrictions on our ability to repatriate foreign cash to the U.S at favorable tax rates;
|
42
|
•
|
fluctuations in currency exchange rates; and
|
|
•
|
increased expense of developing, testing and making localized versions of our products.
|
Any of these factors, either individually or in combination, could materially impact our international operations and adversely affect our business as a whole.
A key step in our manufacturing process relies on sophisticated computer technology that requires new technicians to undergo a relatively long training process. If we are unable to accurately predict our volume growth, and fail to hire a sufficient number of technicians in advance of such demand, the delivery time of our products could be delayed which could adversely affect our results of operations.
Training production technicians takes approximately 90 to 120 days. As a result, if we are unable to accurately predict our volume growth, we may not have a sufficient number of trained technicians to deliver our products within the timeframe our customers expect. Such a delay could cause us to lose existing customers or fail to attract new customers. This could cause a decline in our net revenues and net income and could adversely affect our results of operations.
Our headquarters, digital dental modeling processes, and other manufacturing processes are principally located in regions that are subject to earthquakes and other natural disasters.
Our digital dental modeling is processed in our facility located in San Jose, Costa Rica. The operations team in Costa Rica creates ClinCheck treatment plans using sophisticated computer software. In addition, our customer facing operations are located in Costa Rica. Our aligner molds and finished aligners are fabricated in Juarez, Mexico. Both Costa Rica and Mexico are in earthquake zones and may be subject to other natural disasters. If there is a major earthquake or any other natural disaster in a region where one of these facilities is located, our ability to create ClinCheck treatment plans, respond to customer inquiries or manufacture and ship our aligners could be compromised which could result in our customers experiencing a significant delay in receiving their completed aligners and a decrease in service levels for a period of time. In addition, our headquarters facility is located in the San Francisco Bay Area. An earthquake or other natural disaster in this region could result in a disruption in our operations. Any such business interruption could materially and adversely affect our business, financial condition and results of operations.
Competition in the markets for our products is intense and we expect aggressive competition from existing competitors and other companies that may introduce new technologies in the future.
Currently, our products compete directly against products manufactured and distributed by various companies, both within and outside the United States. Many of these manufacturers, including Danaher Corporation, 3M, Sirona Dental Systems, Inc. and Dentsply International, have substantially greater financial resources and manufacturing and marketing experience than we do and may, in the future, attempt to develop an orthodontic system similar to ours or combine technologies that make our product economically unattractive. The expiration of key certain patents commencing in 2017 owned by us may result in additional competition. Large consumer product companies may also enter the orthodontic supply market. Furthermore, we may face competition in the future from new companies that may introduce new technologies. We may be unable to compete with these competitors and one or more of these competitors may render our technology obsolete or economically unattractive. If we are unable to compete effectively with existing products or respond effectively to any products developed by new or existing competitors, our business could be harmed. Increased competition has resulted in the past and may in the future result in volume discounting and price reductions, reduced gross margins, reduced profitability and loss of market share, and reduce dental professionals’ efforts and commitment to expand their use of our products, any of which could have a material adverse effect on our net revenues, volume growth, net income (losses) and stock price. We cannot assure you that we will be able to compete successfully against our current or future competitors or that competitive pressures will not have a material adverse effect on our business, results of operations and financial condition.
Our information technology systems are critical to our business. System integration and implementation issues and system security risks could disrupt our operations, which could have a material adverse impact on our business and operating results.
43
We rely on the efficient and uninterrupted operation of complex information technology systems. All information technology systems are vulnerable to damage or interruption from a variety of sources. As our business has grown in size and complexity, the growth has placed, and will continue to place, significant demands on our information technology systems. To effectively manage this growth, our information systems and applications require an ongoing commitment of significant resources to maintain, protect and enhance existing systems and develop new systems to keep pace with continuing changes in information processing technology, evolving industry and regulatory standards and changing customer preferences. If the information we rely upon to run our businesses were to be found to be inaccurate or unreliable, if we fail to properly maintain our information systems and data integrity, or if we fail to develop new capabilities to meet our business needs in a timely manner, we could have operational disruptions, have customer disputes, lose our ability to produce timely and accurate reports, have regulatory or other legal problems, have increases in operating and administrative expenses, lose existing customers, have difficulty in attracting new customers or in implementing our growth strategies, or suffer other adverse consequences. In addition, experienced computer programmers and hackers may be able to penetrate our network security and misappropriate our confidential information or that of third parties, create system disruptions or cause shutdowns. Furthermore, sophisticated hardware and operating system software and applications that we either internally develop or procure from third parties may contain defects in design and manufacture, including “bugs” and other problems that can unexpectedly interfere with the operation of the system. The costs to eliminate or alleviate security problems, viruses and bugs could be significant, and the efforts to address these problems could result in interruptions that may have a material adverse impact on our operations, net revenues and operating results.
We are currently focused on adding more functionality into our business enterprise systems to more efficiently integrate these systems with our other system applications, such as customer facing and manufacturing tools, and intend to continue this effort for the foreseeable future. System upgrades and enhancements require significant expenditures and allocation of valuable employee resources. Delays in integration or disruptions to our business from implementation of these new or upgraded systems could have a material adverse impact on our financial condition and operating results.
Additionally, we continuously upgrade our customer facing software applications, specifically the ClinCheck and MyAligntech software. Software applications frequently contain errors or defects, especially when they are first introduced or when new versions are released. The discovery of a defect or error or the incompatibility with the computer operating system and hardware configurations of customers in a new upgraded version or the failure of our primary information systems may result in the following consequences, among others: loss of revenue or delay in market acceptance, damage to our reputation or increased service costs, any of which could have a material adverse effect on our business, financial condition or results of operations.
Furthermore, our business requires the secure transmission of confidential information over public networks. Because of the confidential health information we store and transmit, security breaches could expose us to a risk of regulatory action, litigation, possible liability and loss. Our security measures may be inadequate to prevent security breaches, and our business operations and profitability would be adversely affected by, among other things, loss of customers and potential criminal and civil sanctions if they are not prevented.
There can be no assurance that our process of improving existing systems, developing new systems to support our expanding operations, integrating new systems, protecting confidential patient information, and improving service levels will not be delayed or that additional systems issues will not arise in the future. Failure to adequately protect and maintain the integrity of our information systems and data may result in a material adverse effect on our financial position, results of operations and cash flows.
If the security of our customer and patient information is compromised, patient care could suffer, and we could be liable for related damages, and our reputation could be impaired.
We retain confidential customer and patient information in our processing centers. Therefore, it is critical that our facilities and infrastructure remain secure and that our facilities and infrastructure are perceived by the marketplace and our customers to be secure. Despite the implementation of security measures, our infrastructure may be vulnerable to physical break-ins, computer viruses, programming errors, attacks by third parties or similar disruptive problems. If we fail to meet our clients’ expectations regarding the security of healthcare information, we could be liable for damages and our reputation could be impaired. In addition, patient care could suffer, and we could be liable if our systems fail to deliver correct information in a timely manner. Our insurance may not protect us from this risk.
Our success depends in part on our proprietary technology, and if we are unable to successfully enforce our intellectual property rights, our competitive position may be harmed. Litigating claims of this type is costly and could distract our management and cause a decline in our results of operations and stock price.
44
Our success will depend in part on our ability to maintain existing intellectual property and to obtain and maintain further intellectual property protection for our products, both in the U.S. and in other countries. Our inability to do so could harm our competitive position. As of
September 30, 2013
, we had issued 304 U.S. patents, 101 pending U.S. patent applications, and 234 foreign issued patents, and 100 pending foreign patent applications.
We intend to rely on our portfolio of issued and pending patent applications in the U.S. and in other countries to protect a large part of our intellectual property and our competitive position. However, our currently pending or future patent filings may not result in the issuance of patents. Additionally, any patents issued to us may be challenged, invalidated, held unenforceable, circumvented, or may not be sufficiently broad to prevent third parties from producing competing products similar in design to our products. In addition, any protection afforded by foreign patents may be more limited than that provided under U.S. patents and intellectual property laws. We also rely on protection of our copyrights, trade secrets, know-how and proprietary information. We generally enter into confidentiality agreements with our employees, consultants and our collaborative partners upon commencement of a relationship with us. However, these agreements may not provide meaningful protection against the unauthorized use or disclosure of our trade secrets or other confidential information, and adequate remedies may not exist if unauthorized use or disclosure were to occur. Our inability to maintain the proprietary nature of our technology through patents, copyrights or trade secrets would impair our competitive advantages and could have a material adverse effect on our operating results, financial condition and future growth prospects. In particular, a failure to protect our proprietary rights might allow competitors to copy our technology, which could adversely affect our pricing and market share. In addition, in an effort to protect our intellectual property we have in the past been and may in the future be involved in litigation. The potential effects on our business operations resulting from litigation that we may participate in the future, whether or not ultimately determined in our favor or settled by us, are costly and divert the efforts and attention of our management and technical personnel from normal business operations.
Litigation is subject to inherent uncertainties and unfavorable rulings could occur. An unfavorable ruling could include monetary damages or, in cases where injunctive relief is sought, an injunction prohibiting us from selling our products. Any of these results from our litigation could adversely affect our results of operations and stock price.
While we believe we currently have adequate internal control over financial reporting, we are required to assess our internal control over financial reporting on an annual basis and any future adverse results from such assessment could result in a loss of investor confidence in our financial reports and have an adverse effect on our stock price.
Pursuant to the Sarbanes-Oxley Act of 2002 and the rules and regulations promulgated by the SEC, we are required to furnish in our Form 10-K a report by our management regarding the effectiveness of our internal control over financial reporting. The report includes, among other things, an assessment of the effectiveness of our internal control over financial reporting as of the end of our fiscal year, including a statement as to whether or not our internal control over financial reporting is effective. This assessment must include disclosure of any material weaknesses in our internal control over financial reporting identified by management. While we believe our internal control over financial reporting is currently effective, the effectiveness of our internal controls to future periods is subject to the risk that our controls may become inadequate because of changes in conditions, and, as a result, the degree of compliance of our internal control over financial reporting with the policies or procedures may deteriorate. Establishing, testing and maintaining an effective system of internal control over financial reporting requires significant resources and time commitments on the part of our management and our finance staff, may require additional staffing and infrastructure investments, and would increase our costs of doing business. If we are unable to assert that our internal control over financial reporting is effective in any future period (or if our auditors are unable to express an opinion on the effectiveness of our internal controls or conclude that our internal controls are ineffective), we could lose investor confidence in the accuracy and completeness of our financial reports, which could have an adverse effect on our stock price.
If our goodwill or long-lived assets become impaired, we may be required to record a significant charge to earnings.
Under Generally Accepted Accounting Principles in the United States (“U.S. GAAP”), we review our goodwill and asset group for impairment when events or changes in circumstances indicate the carrying value may not be recoverable. Additionally, goodwill is required to be tested for impairment at least annually. The valuations used to determine the fair values used to test goodwill and the undiscounted cash flows used to evaluate the recoverability of the asset group are dependent upon various assumptions and reflect management’s best estimates. Changes in certain assumptions including revenue growth rates, discount rates, earnings multiples and future cash flows may cause a change in circumstances indicating that the carrying value of goodwill or the asset group may be impaired. We may be required to record a significant charge to earnings in the financial statements during the period in which any impairment of goodwill or asset group are determined.
45
Recent changes in the competitive environment, including announcements in March 2013 of new lower-priced scanners targeted at Orthodontists and GPs in North America caused us to lower our expectations for growth and profitability for SCCS business. As a result, we conducted an impairment analysis of long-lived assets and goodwill related to the SCCS reporting unit. Based on these analyses, we recorded a $26.3 million impairment of our long-lived assets and $40.7 million impairment of goodwill in the first quarter of 2013.
If we lose our key personnel or are unable to attract and retain key personnel, we may be unable to pursue business opportunities or develop our products.
We are highly dependent on the key employees in our clinical engineering, technology development, sales, training and marketing personnel and management teams. The loss of the services provided by those individuals may significantly delay or prevent the achievement of our product development and other business objectives and could harm our business. Our future success will also depend on our ability to identify, recruit, train and retain additional qualified personnel, including orthodontists. Few orthodontists are accustomed to working in a manufacturing environment since they are generally trained to work in private practices, universities and other research institutions. Thus, we may be unable to attract and retain personnel with the advanced qualifications necessary for the further development of our business. Furthermore, we may not be successful in retaining our key personnel or their services. If we are unable to attract and retain key personnel, our business could be materially harmed. In August 2013, we announced the appointment of two executive officers, including a new Chief Financial Officer. With these new appointments, there is the risk of uncertainty and instability relating to transition the duties and responsibilities to new key executives in an orderly, effective and efficient manner. In addition, our ability to recognize revenue on the direct sales of our intra-oral scanners depends in part upon our ability to schedule and staff trainings. The loss of the services provided by these individuals or our ability to timely hire such personnel in sufficient numbers based on our volume growth, may harm our business. If we are unable to retain our trainers or replace such individuals with persons having equivalent technical expertise and qualifications, or if we are unable to successfully instill such technical expertise in newly hired personnel or accurately predict the number of such personnel needed, our net revenues could be materially harmed.
If we infringe the patents or proprietary rights of other parties or are subject to a patent infringement claim, our ability to grow our business may be severely limited.
Extensive litigation over patents and other intellectual property rights is common in the medical device industry. We have been sued for infringement of third party’s patents in the past and we may be the subject of patent or other litigation in the future. From time to time, we have received and may in the future receive letters from third parties drawing our attention to their patent rights. While we do not believe that we infringe upon any valid and enforceable rights that have been brought to our attention, there may be other more pertinent rights of which we are presently unaware. The defense and prosecution of intellectual property suits, interference proceedings and related legal and administrative proceedings could result in substantial expense to us and significant diversion of effort by our technical and management personnel. An adverse determination of any litigation or interference proceeding to which we may become a party could subject us to significant liabilities. An adverse determination of this nature could also put our patents at risk of being invalidated or interpreted narrowly or require us to seek licenses from third parties. Licenses may not be available on commercially reasonable terms or at all, in which event, our business would be materially adversely affected.
We maintain single supply relationships for certain of our key machines and materials technologies, and our business and operating results could be harmed if supply is restricted or ends or the price of raw materials used in our manufacturing process increases.
46
We are highly dependent on manufacturers of specialized scanning equipment, rapid prototyping machines, resin and other advanced materials, as well as the optics, electronic and other mechanical components of our intra-oral scanners. We maintain single supply relationships for many of these machines and materials technologies. In particular, our CT scanning and stereolithography equipment used in our aligner manufacturing and many of the critical components for the optics of our scanners are provided by single suppliers. We are also committed to purchasing all of our resin and polymer, the primary raw materials used in our manufacturing process for clear aligners, from a single source. If these or other suppliers encounter financial, operating or other difficulties or if our relationship with them changes, we might not be able to quickly establish or qualify replacement sources of supply and could face production interruptions, delays and inefficiencies. In addition, technology changes by our vendors could disrupt access to required manufacturing capacity or require expensive, time consuming development efforts to adapt and integrate new equipment or processes. Our growth may exceed the capacity of one or more of these manufacturers to produce the needed equipment and materials in sufficient quantities to support our growth. Conversely, in order to secure supplies for production of products, we sometimes enter into non-cancelable purchase commitments with vendors, which could impact our ability to adjust our inventory to reflect declining market demands. If demand for our products is less than we expect, we may experience additional excess and obsolete inventories and be forced to incur additional charges and our profitability may suffer. In the event of technology changes, delivery delays, or shortages of or increases in price for these items, our business and growth prospects may be harmed.
We depend on a single contract manufacturer and supplier of parts used in our iTero scanner and any disruption in this relationship may cause us to fail to meet the demands of our customers and damage our customer relationships.
We rely on a third party manufacturer in Israel to assemble our iTero scanner. As a result, if this third party manufacturer fails to deliver its components or if we lose its services, we may be unable to deliver our products in a timely manner and our business may be harmed. Any difficulties encountered by the third party manufacturer with respect to hiring personnel, and maintaining acceptable manufacturing standards, controls, procedures and policies could disrupt our ability to deliver our products in a timely manner. Finding a substitute manufacturer may be expensive, time-consuming or impossible and could result in a significant interruption in the supply of our intra-oral scanning products. Any failure by our contract manufacturer that results in delays in our fulfillment of customer orders may cause us to lose revenues and suffer damage to our customer relationships.
We primarily rely on our direct sales force to sell our products, and any failure to maintain our direct sales force could harm our business.
Our ability to sell our products and generate revenues primarily depends upon our direct sales force within our North American and international markets. As of
September 30, 2013
, our North American sales organization consisted of approximately 250 people. Internationally, we had approximately 100 people engaged in sales and sales support as of
September 30, 2013
. We do not have any long-term employment contracts with the members of our direct sales force. The loss of the services provided by these key personnel may harm our business. If we are unable to retain our direct sales force personnel or replace them with individuals of equivalent technical expertise and qualifications, or if we are unable to successfully instill such technical expertise or if we fail to establish strong relationships with our customers within a relatively short period of time, our net revenues and our ability to maintain market share could be materially harmed. In addition, due to our large and fragmented customer base, we may not be able to provide all of our customers with product support immediately upon the launch of a new product. As a result, adoption of new products by our customers may be slower than anticipated and our ability to grow market share and increase our net revenues may be harmed.
If our distributor relationships are not successful, our ability to market and sell our products would be harmed and our financial performance will be adversely affected.
We depend on relationships with distributors for the marketing and sales of our products in various geographic regions, and we have a limited ability to influence their efforts. Relying on distributors for our sales and marketing could harm our business for various reasons, including:
|
•
|
agreements with distributors may terminate prematurely due to disagreements or may result in litigation between the partners;
|
|
•
|
we may not be able to renew existing distributor agreements on acceptable terms;
|
|
•
|
our distributors may not devote sufficient resources to the sale of products;
|
|
•
|
our distributors may be unsuccessful in marketing our products;
|
47
|
•
|
our existing relationships with distributors may preclude us from entering into additional future arrangements with other distributors; and
|
|
•
|
we may not be able to negotiate future distributor agreements on acceptable terms.
|
Complying with regulations enforced by the FDA and other regulatory authorities is an expensive and time-consuming process, and any failure to comply could result in substantial penalties.
Our products are medical devices and are subject to extensive regulation in the U.S. and internationally. FDA regulations are wide ranging and govern, among other things:
|
•
|
product design, development, manufacturing and testing;
|
|
•
|
product labeling;
|
|
•
|
product storage;
|
|
•
|
pre-market clearance or approval;
|
|
•
|
advertising and promotion; and
|
|
•
|
product sales and distribution.
|
Our failure to comply with applicable regulatory requirements could result in enforcement action by the FDA or state agencies, which may include any of the following sanctions:
|
•
|
warning letters, fines, injunctions, consent decrees and civil penalties;
|
|
•
|
repair, replacement, refunds, recall or seizure of our products;
|
|
•
|
operating restrictions or partial suspension or total shutdown of production;
|
|
•
|
refusing our requests for 510(k) clearance or pre-market approval of new products, new intended uses, or modifications to existing products;
|
|
•
|
withdrawing clearance or pre-market approvals that have already been granted; and
|
|
•
|
criminal prosecution.
|
If any of these events were to occur, they could harm our business. We must comply with facility registration and product listing requirements of the FDA and adhere to applicable Quality System regulations. The FDA enforces its Quality System regulations through periodic unannounced inspections. Our failure to take satisfactory corrective action in response to an adverse inspection or the failure to comply with applicable manufacturing regulations could result in enforcement action, and we may be required to find alternative manufacturers, which could be a long and costly process. Any FDA enforcement action could have a material adverse effect on us.
Before we can sell a new medical device in the U.S., or market a new use of or claim for an existing product we must obtain FDA clearance or approval, unless an exemption applies. Obtaining regulatory clearances or approvals can be a lengthy and time-consuming process. Even though the devices we market have obtained the necessary clearances from the FDA, we may be unable to maintain such clearances in the future. Furthermore, we may be unable to obtain the necessary clearances for new devices that we intend to market in the future. Our inability to maintain or obtain regulatory clearances or approvals could materially harm our business.
48
If compliance with healthcare regulations becomes costly and difficult for our customers or for us, we may not be able to grow our business.
Participants in the healthcare industry are subject to extensive and frequently changing regulations under numerous laws administered by governmental entities at the federal, state and local levels, some of which are, and others of which may be, applicable to our business. In response to perceived increases in health care costs in recent years, Congress recently passed health care reform legislation that President Obama signed into law in March 2010. The enacted legislation contains many provisions designed to generate the revenues necessary to fund the coverage expansions. The most relevant of these provisions are those that impose fees or taxes on certain health-related industries, including medical device manufacturers. Beginning in 2013, each medical device manufacturer will have to pay an excise tax in an amount equal to 2.3 percent of the price for which such manufacturer sells its medical devices in the U.S. This tax applies to all medical devices, including our products, which could have a material, negative impact on our results of operations and our cash flows.
Furthermore, our healthcare provider customers are also subject to a wide variety of laws and regulations that could affect the nature and scope of their relationships with us. The healthcare market itself is highly regulated and subject to changing political, economic and regulatory influences. Regulations implemented pursuant to the Health Insurance Portability and Accountability Act (HIPAA), including regulations affecting the security and privacy of patient healthcare information held by healthcare providers and their business associates may require us to make significant and unplanned enhancements of software applications or services, result in delays or cancellations of orders, or result in the revocation of endorsement of our products and services by healthcare participants. The effect of HIPAA and newly enforced regulations on our business is difficult to predict, and there can be no assurance that we will adequately address the business risks created by HIPAA and its implementation or that we will be able to take advantage of any resulting business opportunities.
Extensive and changing government regulation of the healthcare industry may be expensive to comply with and exposes us to the risk of substantial government penalties.
In addition to medical device laws and regulations, numerous state and federal healthcare-related laws regulate our business, covering areas such as:
|
•
|
storage, transmission and disclosure of medical information and healthcare records;
|
|
•
|
prohibitions against the offer, payment or receipt of remuneration to induce referrals to entities providing healthcare services or goods or to induce the order, purchase or recommendation of our products; and
|
|
•
|
the marketing and advertising of our products.
|
Complying with these laws and regulations could be expensive and time-consuming, and could increase our operating costs or reduce or eliminate certain of our sales and marketing activities or our revenues.
We face risks related to our international sales, including the need to obtain necessary foreign regulatory clearance or approvals.
Outside of North America, we currently sell our products in Europe, Asia Pacific, Latin America and the Middle East and may expand into other countries from time to time. For sales of our products outside the U.S., we are subject to foreign regulatory requirements that vary widely from country to country. The time required to obtain clearances or approvals required by other countries may be longer than that required for FDA clearance or approval, and requirements for such approvals may differ from FDA requirements. We may be unable to obtain regulatory approvals in one or more of the other countries in which we do business or in which we may do business in the future. We may also incur significant costs in attempting to obtain and maintain foreign regulatory approvals. If we experience delays in receipt of approvals to market our products outside of the U.S., or if we fail to receive these approvals, we may be unable to market our products or enhancements in international markets in a timely manner, if at all.
49
Our business exposes us to potential product liability claims, and we may incur substantial expenses if we are subject to product liability claims or litigation.
Medical devices involve an inherent risk of product liability claims and associated adverse publicity. We may be held liable if any product we develop or any product that uses or incorporates any of our technologies causes injury or is otherwise found unsuitable. Although we intend to continue to maintain product liability insurance, adequate insurance may not be available on acceptable terms, if at all, and may not provide adequate coverage against potential liabilities. A product liability claim, regardless of its merit or eventual outcome, could result in significant legal defense costs. These costs would have the effect of increasing our expenses and diverting management’s attention away from the operation of our business, and could harm our business.
Historically, the market price for our common stock has been volatile.
The market price of our common stock could be subject to wide price fluctuations in response to various factors, many of which are beyond our control. The factors include:
|
•
|
quarterly variations in our results of operations and liquidity;
|
|
•
|
changes in recommendations by the investment community or in their estimates of our net revenues or operating results;
|
|
•
|
speculation in the press or investment community concerning our business and results of operations;
|
|
•
|
strategic actions by our competitors, such as product announcements or acquisitions;
|
|
•
|
announcements of technological innovations or new products by us, our customers or competitors; and
|
|
•
|
general economic market conditions.
|
In addition, the stock market in general, and the market for technology and medical device companies in particular, have experienced extreme price and volume fluctuations that have often been unrelated to or disproportionate to the operating performance of those companies. These broad market and industry factors may seriously harm the market price of our common stock, regardless of our operating performance. Historically, class action litigation is often brought against an issuing company following periods of volatility in the market price of a company’s securities.
Future sales of significant amounts of our common stock may depress our stock price.
A large percentage of our outstanding common stock is currently owned by a small number of significant stockholders. These stockholders have sold in the past, and may sell in the future, large amounts of common stock over relatively short periods of time. Sales of substantial amounts of our common stock in the public market by our existing stockholders may adversely affect the market price of our common stock. Such sales could create public perception of difficulties or problems with our business and may depress our stock price.
Changes in, or interpretations of, accounting rules and regulations, could result in unfavorable accounting charges.
We prepare our consolidated financial statements in conformity with U.S. GAAP. These principles are subject to interpretation by the Securities and Exchange Commission ("SEC") and various bodies formed to interpret and create appropriate accounting policies. A change in these policies can have a significant effect on our reported results and may even retroactively affect previously reported transactions. Our accounting policies that recently have been or may be affected by changes in the accounting rules are as follows:
|
•
|
revenue recognition; and
|
|
•
|
leases.
|
50
If we fail to manage our exposure to global financial and securities market risk successfully, our operating results and financial statements could be materially impacted.
The primary objective of most of our investment activities is to preserve principal. To achieve this objective, a majority of our marketable investments are investment grade, liquid, short-term fixed-income securities and money market instruments denominated in U.S. dollars. If the carrying value of our investments exceeds the fair value, and the decline in fair value is deemed to be other-than-temporary, we will be required to write down the value of our investments, which could materially harm our results of operations and financial condition. Moreover, the performance of certain securities in our investment portfolio correlates with the credit condition of the U.S. financial sector. In an current unstable credit environment, we might incur significant realized, unrealized or impairment losses associated with these investments.
We have adopted a shareholders rights’ plan to limit the possibility that we are acquired, which may mean that a transaction that shareholders are in favor of or are benefited by may be prevented.
Our board of directors has the authority to issue up to 5,000,000 shares of preferred stock and to determine the rights, preferences, privileges and restrictions of such shares without any further vote or action by our shareholders. To date, our board of directors has designated 200,000 shares as Series A participating preferred stock in connection with our shareholder rights’ plan. The issuance of preferred stock under certain circumstances could have the effect of delaying or preventing an acquisition of Align or otherwise adversely affecting the rights of the holders of our stock. The shareholder rights’ plan may have the effect of rendering more difficult or discouraging an acquisition of our company which is deemed undesirable by our board of directors. The shareholder rights’ plan may cause substantial dilution to a person or group attempting to acquire us on terms or in a manner not approved by our board of directors, except pursuant to an offer conditioned on the negation, purchase or redemption of the rights issued under the shareholder rights’ plan.
Our effective tax rate may vary significantly from period to period.
Various internal and external factors may have favorable or unfavorable effects on our future effective tax rate. These factors include, but are not limited to, changes in tax laws, regulations and/or rates, non-deductible goodwill impairments, changing interpretations of existing tax laws or regulations, changes in the relative proportions of revenues and income before taxes in the various jurisdictions in which we operate that have differing statutory tax rates, the future levels of tax benefits of stock option deductions relating to incentive stock options and employee stock purchase plans, settlement of income tax audits, and changes in overall levels of pretax earnings. During the first quarter of 2013, we incurred a $40.7 million impairment of goodwill which was not deductible for tax purposes.
In June 2009, the Costa Rica Ministry of Foreign Trade, an agency of the Government of Costa Rica, granted a twelve year extension of various income tax incentives, which had been previously granted to us in 2002. The incentive tax rates will expire in various years beginning in 2017. Under these incentives, all of the income we earn in Costa Rica during the twelve year incentive period is exempt from Costa Rica income tax. In order to receive the benefit of these incentives, we must hire specified numbers of employees and maintain certain minimum levels of fixed asset investments in Costa Rica. If we do not fulfill these conditions for any reason, our incentive could lapse, and our income in Costa Rica would be subject to taxation at higher rates, which could have a negative impact on our operating results. The Costa Rica Corporate income tax rate that would apply, absent the incentives, is
30%
for 2013. As a result of these incentives, the provision for income taxes were reduced by
$18.0 million
and
$17.0 million
for the nine months ended September 30, 2013 and 2012, respectively, representing a benefit to diluted net income per share of
$0.22
and
$0.20
in 2013 and 2012, respectively. For the three months ended September 30, 2013 and 2012, the provision for income taxes was reduced by
$6.1 million
and
$6.9 million
, respectively, representing a benefit to diluted net income per share of
$0.08
and
$0.08
, respectively. Our subsidiaries in Israel and Germany are under audit by the local tax authorities for calendar years 2006 through 2011 and 2007 through 2011, respectively.
ITEM 2.
UNREGISTERED SALES OF EQUITY SECURITIES AND USE OF PROCEEDS
Not applicable.
ITEM 3.
DEFAULTS UPON SENIOR SECURITIES
Not applicable.
ITEM 4.
MINE SAFETY DISCLOSURES
Not applicable.
51
None
(a) Exhibits:
|
Exhibit
Number
|
Description
|
Filing
|
Date
|
Exhibit
Number
|
Filed here with
|
|||||
|
10.1
|
Employment Agreement between Align Technology, Inc. and David L. White.
|
Form 8-K
|
8/5/2013
|
10.1
|
||||||
|
31.1
|
Certification of Chief Executive Officer pursuant to 18 U.S.C. Section 1350, as adopted pursuant to Section 302 of the Sarbanes-Oxley Act of 2002.
|
*
|
||||||||
|
31.2
|
Certification of Chief Financial Officer pursuant to 18 U.S.C. Section 1350, as adopted pursuant to Section 302 of the Sarbanes-Oxley Act of 2002.
|
*
|
||||||||
|
32.1
|
Certification of Chief Executive Officer and Chief Financial Officer pursuant to 18 U.S.C. Section 1350, as adopted pursuant to Section 906 of the Sarbanes-Oxley Act of 2002.
|
*
|
||||||||
|
101.INS
|
XBRL Instance Document
|
*
|
||||||||
|
101.SCH
|
XBRL Taxonomy Extension Schema Document
|
*
|
||||||||
|
101.CAL
|
XBRL Taxonomy Extension Calculation Linkbase Document
|
*
|
||||||||
|
101.DEF
|
XBRL Taxonomy Extension Definition Linkbase Document
|
*
|
||||||||
|
101.LAB
|
XBRL Taxonomy Extension Label Linkbase Document
|
*
|
||||||||
|
101.PRE
|
XBRL Taxonomy Extension Presentation Linkbase Document
|
*
|
||||||||
52
SIGNATURES
Pursuant to the requirements of the Securities Exchange Act of 1934, as amended, the registrant has duly caused this report to be signed on its behalf by the undersigned thereunto duly authorized.
|
|
ALIGN TECHNOLOGY, INC.
|
|
|
November 1, 2013
|
By:
|
/S/ THOMAS M. PRESCOTT
|
|
Thomas M. Prescott
President and Chief Executive Officer
|
||
|
By:
|
/S/ DAVID L. WHITE
|
|
|
David L. White
Chief Financial Officer
|
||
53
EXHIBIT INDEX
|
Exhibit
Number
|
Description
|
Filing
|
Date
|
Exhibit
Number
|
Filed here with
|
|||||
|
10.1
|
Employment Agreement between Align Technology, Inc. and David L. White.
|
Form 8-K
|
8/5/2013
|
10.1
|
||||||
|
31.1
|
Certification of Chief Executive Officer pursuant to 18 U.S.C. Section 1350, as adopted pursuant to Section 302 of the Sarbanes-Oxley Act of 2002.
|
*
|
||||||||
|
31.2
|
Certification of Chief Financial Officer pursuant to 18 U.S.C. Section 1350, as adopted pursuant to Section 302 of the Sarbanes-Oxley Act of 2002.
|
*
|
||||||||
|
32.1
|
Certification of Chief Executive Officer and Chief Financial Officer pursuant to 18 U.S.C. Section 1350, as adopted pursuant to Section 906 of the Sarbanes-Oxley Act of 2002.
|
*
|
||||||||
|
101.INS
|
XBRL Instance Document
|
*
|
||||||||
|
101.SCH
|
XBRL Taxonomy Extension Schema Document
|
*
|
||||||||
|
101.CAL
|
XBRL Taxonomy Extension Calculation Linkbase Document
|
*
|
||||||||
|
101.DEF
|
XBRL Taxonomy Extension Definition Linkbase Document
|
*
|
||||||||
|
101.LAB
|
XBRL Taxonomy Extension Label Linkbase Document
|
*
|
||||||||
|
101.PRE
|
XBRL Taxonomy Extension Presentation Linkbase Document
|
*
|
||||||||
54
TABLE OF CONTENTS
Part I Financial InformationItem 1 Financial StatementsNote 1. Summary Of Significant Accounting PoliciesNote 2. Marketable Securities and Fair Value MeasurementsNote 3. Balance Sheet ComponentsNote 4. Business CombinationsNote 5. Goodwill and Long-lived AssetsNote 6. Credit FacilitiesNote 7. Legal ProceedingsNote 8. Commitments and ContingenciesNote 9. Stock-based CompensationNote 10. Common Stock Repurchase ProgramNote 11. Accounting For Income TaxesNote 12. Net Income (loss) Per ShareNote 13. Segments and Geographical InformationItem 2. Management S Discussion and Analysis Of Financial Condition and Results Of OperationsItem 3. Quantitative and Qualitative Disclosures About Market RiskItem 4. Controls and ProceduresPart II Other InformationItem 1. Legal ProceedingsItem 1A. Risk FactorsItem 2. Unregistered Sales Of Equity Securities and Use Of ProceedsItem 3. Defaults Upon Senior SecuritiesItem 4. Mine Safety DisclosuresItem 5. Other InformationItem 6. Exhibits