ALIGN TECHNOLOGY INC
10-Ks and 10-Qs
|
|
|
|
|
|
|
|
|
|
|
|
|
|
|
|
|
|
|
|
|
|
|
|
|
|
|
|
|
|
|
|
|
|
|
|
|
|
|
|
|
|
|
|
|
|
|
|
|
|
|
|
|
|
|
|
UNITED STATES
SECURITIES AND EXCHANGE COMMISSION
Washington, D.C. 20549
____________________________
FORM 10-Q
____________________________
(Mark One)
|
x
|
QUARTERLY REPORT PURSUANT TO SECTION 13 OR 15(d) OF THE SECURITIES EXCHANGE ACT OF 1934
|
For the quarterly period ended
June 30, 2018
OR
|
¨
|
TRANSITION REPORT PURSUANT TO SECTION 13 OR 15(d) OF THE SECURITIES EXCHANGE ACT OF 1934
|
For the transition period from to
Commission file number: 0-32259
____________________________
ALIGN TECHNOLOGY, INC.
(Exact name of registrant as specified in its charter)
____________________________
|
Delaware
|
94-3267295
|
|
(State or other jurisdiction of
incorporation or organization)
|
(I.R.S. Employer
Identification Number)
|
2820 Orchard Parkway
San Jose, California 95134
(Address of principal executive offices)
(408) 470-1000
(Registrant’s telephone number, including area code)
____________________________
Indicate by check mark whether the registrant (1) has filed all reports required to be filed by Section 13 or 15(d) of the Securities Exchange Act of 1934 during the preceding 12 months (or for such shorter period that the registrant was required to file such reports), and (2) has been subject to such filing requirements for the past 90 days. Yes
x
No
¨
Indicate by check mark whether the registrant has submitted electronically and posted on its corporate Web site, if any, every Interactive Data File required to be submitted and posted pursuant to Rule 405 of Regulation S-T (§232.405 of this chapter) during the preceding 12 months (or for such shorter period that the registrant was required to submit and post such files). Yes
x
No
¨
Indicate by check mark whether the registrant is a large accelerated filer, an accelerated filer, a non-accelerated filer, a smaller reporting company or an emerging growth company. See definitions of “large accelerated filer,” “accelerated filer,” “smaller reporting company” and “emerging growth company” in Rule 12b-2 of the Exchange Act. (Check one):
|
Large accelerated filer
|
x
|
Accelerated filer
|
¨
|
|
Non-accelerated filer
|
o
(Do not check if a smaller reporting company)
|
Smaller reporting company
|
¨
|
|
Emerging growth company
|
¨
|
||
|
If an emerging growth company, indicate by check mark if the registrant has elected not to use the extended transition period for complying with any new or revised financial accounting standards provided pursuant to Section 7(a)(2)(B) of the Securities Act.
|
|||
Indicate by check mark whether the registrant is a shell company (as defined in Rule 12b-2 of the Exchange Act). Yes
¨
No
x
The number of shares outstanding of the registrant’s Common Stock, $0.0001 par value, as of
July 27, 2018
was
80,320,082
.
1
ALIGN TECHNOLOGY, INC.
INDEX
|
PART I
|
||
|
ITEM 1.
|
||
|
ITEM 2.
|
||
|
ITEM 3.
|
||
|
ITEM 4.
|
||
|
PART II
|
||
|
ITEM 1.
|
||
|
ITEM 1A.
|
||
|
ITEM 2.
|
||
|
ITEM 3.
|
||
|
ITEM 4.
|
||
|
ITEM 5.
|
||
|
ITEM 6.
|
||
Invisalign, Align, the Invisalign logo, ClinCheck, Made to Move, Invisalign Assist, Invisalign Teen, Invisalign Go, Vivera, SmartForce, SmartTrack, SmartStage, iTero, iTero Element, Orthocad, iCast and iRecord, among others, are trademarks and/or service marks of Align Technology, Inc. or one of its subsidiaries or affiliated companies and may be registered in the United States and/or other countries.
2
ALIGN TECHNOLOGY, INC.
(in thousands, except per share data)
(unaudited)
|
Three Months Ended
June 30, |
Six Months Ended
June 30, |
||||||||||||||
|
|
2018
|
2017
|
2018
|
2017
|
|||||||||||
|
Net revenues
|
$
|
490,259
|
|
$
|
356,482
|
|
$
|
927,183
|
|
$
|
666,823
|
|
|||
|
Cost of net revenues
|
124,677
|
|
85,565
|
|
234,193
|
|
160,281
|
|
|||||||
|
Gross profit
|
365,582
|
|
270,917
|
|
692,990
|
|
506,542
|
|
|||||||
|
Operating expenses:
|
|||||||||||||||
|
Selling, general and administrative
|
212,087
|
|
162,964
|
|
411,712
|
|
314,112
|
|
|||||||
|
Research and development
|
30,804
|
|
24,384
|
|
60,395
|
|
47,188
|
|
|||||||
|
Total operating expenses
|
242,891
|
|
187,348
|
|
472,107
|
|
361,300
|
|
|||||||
|
Income from operations
|
122,691
|
|
83,569
|
|
220,883
|
|
145,242
|
|
|||||||
|
Interest income
|
1,917
|
|
1,441
|
|
4,093
|
|
2,636
|
|
|||||||
|
Other income (expense), net
|
(7,099
|
)
|
1,771
|
|
(6,922
|
)
|
2,221
|
|
|||||||
|
Net income before provision for income taxes and equity in losses of investee
|
117,509
|
|
86,781
|
|
218,054
|
|
150,099
|
|
|||||||
|
Provision for income taxes
|
7,703
|
|
15,387
|
|
10,605
|
|
8,164
|
|
|||||||
|
Equity in losses of investee, net of tax
|
3,701
|
|
2,215
|
|
5,478
|
|
3,336
|
|
|||||||
|
Net income
|
$
|
106,105
|
|
$
|
69,179
|
|
$
|
201,971
|
|
$
|
138,599
|
|
|||
|
Net income per share:
|
|||||||||||||||
|
Basic
|
$
|
1.32
|
|
$
|
0.86
|
|
$
|
2.52
|
|
$
|
1.73
|
|
|||
|
Diluted
|
$
|
1.30
|
|
$
|
0.85
|
|
$
|
2.48
|
|
$
|
1.70
|
|
|||
|
Shares used in computing net income per share:
|
|||||||||||||||
|
Basic
|
80,216
|
|
80,188
|
|
80,127
|
|
80,047
|
|
|||||||
|
Diluted
|
81,471
|
|
81,631
|
|
81,575
|
|
81,668
|
|
|||||||
The accompanying notes are an integral part of these unaudited condensed consolidated financial statements.
3
ALIGN TECHNOLOGY, INC.
CONDENSED CONSOLIDATED STATEMENTS OF COMPREHENSIVE INCOME
(in thousands)
(unaudited)
|
Three Months Ended
June 30, |
Six Months Ended
June 30, |
|||||||||||||||
|
|
2018
|
2017
|
2018
|
2017
|
||||||||||||
|
Net income
|
$
|
106,105
|
|
$
|
69,179
|
|
$
|
201,971
|
|
$
|
138,599
|
|
||||
|
Net change in foreign currency translation adjustment
|
759
|
|
1,199
|
|
(283
|
)
|
740
|
|
||||||||
|
Change in unrealized (losses) gains on investments, net of tax
|
(186
|
)
|
27
|
|
(57
|
)
|
42
|
|
||||||||
|
Other comprehensive income (loss)
|
573
|
|
1,226
|
|
(340
|
)
|
782
|
|
||||||||
|
Comprehensive income
|
$
|
106,678
|
|
$
|
70,405
|
|
$
|
201,631
|
|
$
|
139,381
|
|
||||
The accompanying notes are an integral part of these unaudited condensed consolidated financial statements.
4
ALIGN TECHNOLOGY, INC.
(in thousands, except per share data)
(unaudited)
|
June 30,
2018 |
December 31,
2017 |
||||||
|
ASSETS
|
|||||||
|
Current assets:
|
|||||||
|
Cash and cash equivalents
|
$
|
547,993
|
|
$
|
449,511
|
|
|
|
Marketable securities, short-term
|
164,629
|
|
272,031
|
|
|||
|
Accounts receivable, net of allowance for doubtful accounts of $2,729 and $5,814, respectively
|
374,371
|
|
324,189
|
|
|||
|
Inventories
|
47,252
|
|
31,688
|
|
|||
|
Prepaid expenses and other current assets
|
126,754
|
|
80,948
|
|
|||
|
Total current assets
|
1,260,999
|
|
1,158,367
|
|
|||
|
Marketable securities, long-term
|
8,061
|
|
39,948
|
|
|||
|
Property, plant and equipment, net
|
447,933
|
|
348,793
|
|
|||
|
Equity method investments
|
49,128
|
|
54,606
|
|
|||
|
Goodwill and intangible assets, net
|
85,307
|
|
89,068
|
|
|||
|
Deferred tax assets
|
45,859
|
|
49,334
|
|
|||
|
Other assets
|
19,302
|
|
43,893
|
|
|||
|
Total assets
|
$
|
1,916,589
|
|
$
|
1,784,009
|
|
|
|
LIABILITIES AND STOCKHOLDERS’ EQUITY
|
|||||||
|
Current liabilities:
|
|||||||
|
Accounts payable
|
$
|
48,744
|
|
$
|
36,776
|
|
|
|
Accrued liabilities
|
196,754
|
|
195,562
|
|
|||
|
Deferred revenues
|
321,148
|
|
267,713
|
|
|||
|
Total current liabilities
|
566,646
|
|
500,051
|
|
|||
|
Income tax payable
|
115,701
|
|
114,091
|
|
|||
|
Other long-term liabilities
|
15,283
|
|
15,579
|
|
|||
|
Total liabilities
|
697,630
|
|
629,721
|
|
|||
|
Commitments and contingencies (Notes 8 and 9)
|
|
|
|||||
|
Stockholders’ equity:
|
|||||||
|
Preferred stock, $0.0001 par value (5,000 shares authorized; none issued)
|
—
|
|
—
|
|
|||
|
Common stock, $0.0001 par value (200,000 shares authorized; 80,313 and 80,040 issued and outstanding, respectively)
|
8
|
|
8
|
|
|||
|
Additional paid-in capital
|
844,599
|
|
886,435
|
|
|||
|
Accumulated other comprehensive income (loss), net
|
911
|
|
571
|
|
|||
|
Retained earnings
|
373,441
|
|
267,274
|
|
|||
|
Total stockholders’ equity
|
1,218,959
|
|
1,154,288
|
|
|||
|
Total liabilities and stockholders’ equity
|
$
|
1,916,589
|
|
$
|
1,784,009
|
|
|
The accompanying notes are an integral part of these unaudited condensed consolidated financial statements.
5
ALIGN TECHNOLOGY, INC.
(in thousands)
(unaudited
)
|
|
Six Months Ended
June 30, |
||||||
|
|
2018
|
2017
|
|||||
|
CASH FLOWS FROM OPERATING ACTIVITIES:
|
|||||||
|
Net income
|
$
|
201,971
|
|
$
|
138,599
|
|
|
|
Adjustments to reconcile net income to net cash provided by operating activities:
|
|||||||
|
Deferred taxes
|
3,667
|
|
6,145
|
|
|||
|
Depreciation and amortization
|
24,066
|
|
16,743
|
|
|||
|
Stock-based compensation
|
32,720
|
|
29,057
|
|
|||
|
Equity in losses of investee
|
5,478
|
|
3,336
|
|
|||
|
Other non-cash operating activities
|
4,543
|
|
5,837
|
|
|||
|
Changes in assets and liabilities, net of effects of acquisitions:
|
|||||||
|
Accounts receivable
|
(44,266
|
)
|
(52,038
|
)
|
|||
|
Inventories
|
(15,586
|
)
|
(8,616
|
)
|
|||
|
Prepaid expenses and other assets
|
(9,366
|
)
|
388
|
|
|||
|
Accounts payable
|
10,743
|
|
4,410
|
|
|||
|
Accrued and other long-term liabilities
|
(53,442
|
)
|
(14,802
|
)
|
|||
|
Long-term income tax payable
|
1,610
|
|
(551
|
)
|
|||
|
Deferred revenues
|
54,983
|
|
29,580
|
|
|||
|
Net cash provided by operating activities
|
217,121
|
|
158,088
|
|
|||
|
CASH FLOWS FROM INVESTING ACTIVITIES:
|
|||||||
|
Acquisitions, net of cash acquired
|
—
|
|
(8,953
|
)
|
|||
|
Purchase of property, plant and equipment
|
(115,295
|
)
|
(78,045
|
)
|
|||
|
Purchase of marketable securities
|
(78,405
|
)
|
(212,226
|
)
|
|||
|
Proceeds from maturities of marketable securities
|
207,475
|
|
173,094
|
|
|||
|
Proceeds from sales of marketable securities
|
9,560
|
|
32,352
|
|
|||
|
Loan advances to equity investee
|
—
|
|
(15,000
|
)
|
|||
|
Loan repayment from equity investee
|
30,000
|
|
—
|
|
|||
|
Other investing activities
|
668
|
|
(2,940
|
)
|
|||
|
Net cash provided by (used in) investing activities
|
54,003
|
|
(111,718
|
)
|
|||
|
CASH FLOWS FROM FINANCING ACTIVITIES:
|
|||||||
|
Proceeds from issuance of common stock
|
8,585
|
|
7,521
|
|
|||
|
Common stock repurchases
|
(100,000
|
)
|
(38,793
|
)
|
|||
|
Equity forward contract related to accelerated share repurchase
|
—
|
|
(15,000
|
)
|
|||
|
Employees’ taxes paid upon the vesting of restricted stock units
|
(79,330
|
)
|
(37,968
|
)
|
|||
|
Net cash used in financing activities
|
(170,745
|
)
|
(84,240
|
)
|
|||
|
Effect of foreign exchange rate changes on cash, cash equivalents, and restricted cash
|
(1,923
|
)
|
3,640
|
|
|||
|
Net increase (decrease) in cash, cash equivalents, and restricted cash
|
98,456
|
|
(34,230
|
)
|
|||
|
Cash, cash equivalents, and restricted cash at beginning of the period
|
450,125
|
|
393,019
|
|
|||
|
Cash, cash equivalents, and restricted cash at end of the period
|
$
|
548,581
|
|
$
|
358,789
|
|
|
|
SUPPLEMENTAL CASH FLOW INFORMATION:
|
|||||||
|
Accounts payable or accrued liabilities related to property, plant and equipment
|
20,854
|
|
20,291
|
|
|||
|
Conversion of convertible notes receivable into equity securities
|
4,862
|
|
—
|
|
|||
The accompanying notes are an integral part of these unaudited condensed consolidated financial statements.
6
ALIGN TECHNOLOGY, INC.
NOTES TO CONDENSED CONSOLIDATED FINANCIAL STATEMENTS
(unaudited)
Basis of Presentation
The accompanying unaudited Condensed Consolidated Financial Statements have been prepared by Align Technology, Inc. (“we”, “our”, or “Align”) in accordance with the rules and regulations of the Securities and Exchange Commission (“SEC”) and contains all adjustments, including normal recurring adjustments, necessary to state fairly our results of operations for the
three and six
months ended
June 30, 2018
and
2017
, our comprehensive income for the
three and six
months ended
June 30, 2018
and
2017
, our financial position as of
June 30, 2018
and our cash flows for the
six months ended
June 30, 2018
and
2017
. The Condensed Consolidated Balance Sheet as of
December 31, 2017
was derived from the
December 31, 2017
audited financial statements and have been recast to reflect the adoption of accounting standards as described below. It does not include all disclosures required by accounting principles generally accepted in the United States of America (“U.S.”).
During the first quarter of fiscal year 2018, we adopted the Accounting Standards Codification (“ASC”) 606, “
Revenues from Contracts with Customers,
” using the full retrospective method and Accounting Standards Update (“ASU”) 2016-18,
“
Statement of Cash Flows - Restricted Cash,
”
on a retrospective basis. The Condensed Consolidated Balance Sheet as of
December 31, 2017
and the Condensed Consolidated Statement of Cash Flow for the
six months ended
June 30, 2017
have been recast to comply with the adoption of these standards.
The results of operations for the three and six months ended
June 30, 2018
are not necessarily indicative of the results that may be expected for the year ending December 31, 2018 or any other future period, and we make no representations related thereto. The information included in this Quarterly Report on Form 10-Q should be read in conjunction with “Management’s Discussion and Analysis of Financial Condition and Results of Operations,” “Quantitative and Qualitative Disclosures About Market Risk” and the Consolidated Financial Statements and notes thereto included in Items 7, 7A and 8, respectively, in our Annual Report on Form 10-K for the year ended
December 31, 2017
.
Use of Estimates
The preparation of financial statements in conformity with generally accepted accounting principles (“GAAP”) in the U.S. requires our management to make estimates and assumptions that affect the amounts reported in the consolidated financial statements and accompanying notes. Actual results could differ materially from those estimates. On an ongoing basis, we evaluate our estimates, including those related to the fair values of financial instruments, valuation of investments in privately held companies, useful lives of intangible assets and property and equipment, revenue recognition, stock-based compensation, long-lived assets and goodwill, income taxes and contingent liabilities, among others. We base our estimates on historical experience and on various other assumptions that are believed to be reasonable, the results of which form the basis for making judgments about the carrying values of assets and liabilities.
Significant Accounting Policies
Our significant accounting policies are described in Note 1 “Summary of Significant Accounting Policies” of the Notes to Consolidated Financial Statements included in our Annual Report on Form 10-K. Significant changes to the Revenue Recognition policy and Investments in Privately Held Companies policy are discussed below:
Revenue Recognition
Our revenues are derived primarily from the sale of aligners, scanners, and services from our Clear Aligner and Scanner segments. We enter into sales contracts that may consist of multiple distinct performance obligations where certain performance obligations of the sales contract are not delivered in one reporting period. We measure and allocate revenue according to ASC 606-10, “
Revenues from Contracts with Customers.
”
We identify a performance obligation as distinct if both of the following criteria are true: the customer can benefit from the good or service either on its own or together with other resources that are readily available to the customer and the entity’s promise to transfer the good or service to the customer is separately identifiable from other promises in the contract. Determining the standalone selling price (“SSP”) and allocation of consideration from a contract to the individual performance obligations, and the appropriate timing of revenue recognition, is the result of significant qualitative and quantitative judgments. Management considers a variety of factors such as historical sales, usage rates, costs, and expected margin, which may vary over time depending
7
upon the unique facts and circumstances related to each performance obligation in making these estimates. While changes in the allocation of the SSP between performance obligations will not affect the amount of total revenue recognized for a particular contract, any material changes could impact the timing of revenue recognition, which would have a material effect on our financial position and result of operations. This is because the contract consideration is allocated to each performance obligation, delivered or undelivered, at the inception of the contract based on the SSP of each distinct performance obligation.
Clear Aligner
We enter into contracts (“treatment plan(s)”) that involve multiple future performance obligations. Invisalign Full, Invisalign Teen, and Invisalign Assist products include optional additional aligners at no charge for a period of up to five years after initial shipment and Invisalign Go includes optional additional aligners at no charge for a period of up to two years after initial shipment. Invisalign Teen also includes up to six optional replacement aligners in the price of the product and may be ordered by the dental professional any time throughout treatment. Invisalign Lite includes one optional case refinement in the price of the product. Case refinement is a finishing tool used to adjust a patient’s teeth to the desired final position and may be elected by the dental professional at any time during treatment; however, it is generally ordered in the last stages of orthodontic treatment.
We determined that our treatment plans comprise the following performance obligations that also represent distinct deliverables: initial aligners, additional aligners, case refinement, and replacement aligners. We elected to take the practical expedient to consider shipping and handling costs as activities to fulfill the performance obligation. We allocate revenue for each treatment plan based on each unit’s SSP and recognize the revenue over the manufacturing period, typically
1
to
3
days, as the aligners do not have an alternative use and we have enforceable rights to payment. As we collect most consideration upfront, we considered whether a significant financing component exists; however, as the delivery of the performance obligations are at the customer’s discretion, we concluded that no significant financing component exists.
Scanner
We sell intraoral scanners and computer-aided design/computer-aided manufacturing (“CAD/CAM”) services through both our direct sales force and distribution partners. The intraoral scanner sales price includes one year of warranty and unlimited scanning services. The customer may, for additional fees, also select extended warranty and unlimited scanning services for periods beyond the initial year. When intraoral scanners are sold with an unlimited scanning service agreement and/or extended warranty, we allocate revenue based on each element’s SSP. We estimate the SSP of each element, taking into consideration historical prices as well as our discounting strategies. Revenue is then recognized over time as the monthly services are rendered and upon shipment for the scanner, as that is when we deem the customer to have obtained control. Most consideration is collected upfront and in cases where there are payment plans, consideration is collected by the 1 year mark and therefore, there are no significant financing components.
Warranties
For both Clear Aligner and Scanner segments, we offer an assurance warranty which provides the customer assurance that the product will function as the parties intended because it complies with agreed-upon specifications, and thus is not treated as a separate performance obligation and will continue to be accrued in accordance with the Financial Accounting Standards Board (“FASB”) guidance on guarantees.
Volume Discounts
In certain situations, we offer promotions in which the discount will increase depending upon the volume purchased over time. We concluded that in these situations, the promotions can represent either variable consideration or options, depending upon the specifics of the promotion. In the event the promotion contains an option, the option is considered a material right and, therefore, included in the accounting for the initial arrangement. We estimate the average anticipated discount over the lifetime of the promotion or contract, and apply that discount to each unit as it is sold. On a quarterly basis, we review our estimates and, if needed, updates are made and changes are applied prospectively.
Costs to Obtain a Contract
We offer a variety of commission plans to our salesforce; each plan has multiple components. To match the costs to obtain a contract to the associated revenue, we evaluate the individual components and capitalize the eligible components, recognizing the costs over the treatment period.
8
Unfulfilled Performance Obligations for Clear Aligners and Scanners
Our unfilled performance obligations as of June 30, 2018 and the estimated revenue expected to be recognized in the future related to these performance obligations are
$358.0 million
. This includes performance obligations from the Clear Aligner segment, primarily the shipment of additional aligners, which are fulfilled over
1
to
5
years, and performance obligations from the iTero scanner segment, primarily contracted deliveries of additional scanners and support, which are fulfilled over 1 to 5 years. The estimate includes both product and service unfulfilled performance obligations and the time range reflects our best estimate of when we will transfer control to the customer and may change based on customer usage patterns, timing of shipments, readiness of customers’ facilities for installation, and manufacturing availability.
Contract Balances
The timing of revenue recognition results in deferred revenues being recognized on the Condensed Consolidated Balance Sheet. For both aligners and scanners, we usually collect the total consideration owed prior to all performance obligations being performed and payment terms vary from net 30 to net 90 days. Contract liabilities are recorded as deferred revenue balances, which are generated based upon timing of invoices and recognition patterns, not payments. If the revenue recognition exceeds the billing, the exceeded amount is considered unbilled receivable and a contract asset. Conversely, if the billing occurs prior to the revenue recognition, the amount is considered deferred revenue and a contract liability.
Investments in Privately Held Companies
Investments in privately held companies in which we can exercise significant influence but do not own a majority equity interest or otherwise control are accounted for under ASC 323, “
Investments—Equity Method and Joint Ventures.
” Equity securities qualified as equity method investments are reported on our Condensed Consolidated Balance Sheet as a single amount, and we record our share of their operating results within equity in losses of investee, net of tax, in our Condensed Consolidated Statement of Operations. Investments in privately held companies in which we can not exercise significant influence and do not own a majority equity interest or otherwise control are accounted for under ASC 321, “
Investments—Equity Securities.
” The equity securities without readily determinable fair values are recorded at cost and adjusted for impairments and observable price changes with a same or similar security from the same issuer (“Measurement Alternative”). Equity securities under ASC 321 are reported on our Condensed Consolidated Balance Sheet as other assets, and we record a change in carrying value of our equity securities, if any, in other income (expense), net in our Condensed Consolidated Statement of Operations.
Equity securities are evaluated for impairment as events or circumstances indicate that there is an other-than-temporary loss in value. The decrease in value is recognized in the period the impairment occurs and recorded in other income (expense), net in the Condensed Consolidated Statement of Operations.
Recent Accounting Pronouncements
(i) New Accounting Updates Recently Adopted
In May 2014, the FASB released ASU 2014-09, “
Revenue from Contracts with Customers,
” (Topic 606) to supersede nearly all existing revenue recognition guidance under GAAP. The core principle of the standard is to recognize revenues when promised goods or services are transferred to customers in an amount that reflects the consideration that is expected to be received for the goods or services. We adopted the guidance in the first quarter of fiscal year 2018 by applying the full retrospective method. The impact of adoption was primarily related to the Clear Aligner segment. Our disaggregation of revenue can be found in Note 14 “Segments and Geographical Information.” We elected to take the practical expedient to exclude from the transaction price all taxes assessed by a governmental authority. In preparation for adoption of the standard, we have reviewed and, where necessary, implemented additional key system functionalities and internal controls to enable the preparation of financial information. Prior periods have been retrospectively adjusted, and we recognized cumulative effect of adopting the guidance as an adjustment to our opening balance of retained earnings as of January 1, 2016.
9
The adoption of ASU 2014-09 did not have a material impact on our Condensed Consolidated Statements of Operations, Condensed Consolidated Statements of Comprehensive Income or Condensed Consolidated Statements of Cash Flows for the historical periods presented in the Item 1 Financial Statements section. Consolidated Balance Sheet line items, which reflect the adoption of the ASU 2014-09 are as follows (in thousands):
|
December 31, 2017
|
||||||||||||
|
As Previously Reported
|
Adjustment
|
As Adjusted
|
||||||||||
|
Asset Accounts:
|
||||||||||||
|
Accounts receivable, net
|
$
|
322,825
|
|
$
|
1,364
|
|
$
|
324,189
|
|
|||
|
Deferred tax assets
|
50,059
|
|
(725
|
)
|
49,334
|
|
||||||
|
Other assets
|
38,379
|
|
5,514
|
|
43,893
|
|
||||||
|
Liability and Stockholders’ Equity Accounts:
|
||||||||||||
|
Accrued liabilities
|
$
|
194,198
|
|
$
|
1,364
|
|
$
|
195,562
|
|
|||
|
Deferred revenues
|
266,842
|
|
871
|
|
267,713
|
|
||||||
|
Retained earnings
|
263,356
|
|
3,918
|
|
267,274
|
|
||||||
In August 2016, the FASB issued ASU 2016-15,
“Classification of Certain Cash Receipts and Cash Payments,”
which clarifies the presentation and classification of certain cash receipts and cash payments in the statements of cash flows. The amendments are effective for fiscal years and interim periods within those years beginning after December 15, 2017.
We adopted the standard in the first quarter of fiscal year 2018 on a retrospective basis, and it did not have an impact on our Condensed Consolidated Statements of Cash Flows.
In November 2016, the FASB issued ASU 2016-18,
“Statement of Cash Flows—Restricted Cash,”
which provides guidance to address the classification and presentation of changes in restricted cash in the statements of cash flows
. The amendments are effective for fiscal years and interim periods within those years beginning after December 15, 2017 on a retrospective basis. We adopted the guidance in the first quarter of fiscal year 2018 on a retrospective basis and presented the changes in the total of cash, cash equivalents, and restricted cash in the Condensed Consolidated Statements of Cash Flows. Condensed Consolidated Statement of Cash Flows line items, which reflect the adoption of the ASU 2016-18, are as follows (in thousands):
|
Six Months Ended
June 30, 2017 |
||||||||||||
|
As Previously Reported
|
Adjustment
|
As Adjusted
|
||||||||||
|
Cash Flows from Investing Activities
|
||||||||||||
|
Other investing activities
|
$
|
224
|
|
$
|
(3,164
|
)
|
$
|
(2,940
|
)
|
|||
|
Net cash used in investing activities
|
(108,554
|
)
|
(3,164
|
)
|
(111,718
|
)
|
||||||
|
Effect of foreign exchange rate changes on cash, cash equivalents, and restricted cash
|
3,613
|
|
27
|
|
3,640
|
|
||||||
|
Net decrease in cash, cash equivalents, and restricted cash
|
(31,093
|
)
|
(3,137
|
)
|
(34,230
|
)
|
||||||
|
Cash, cash equivalents, and restricted cash at beginning of the period
|
389,275
|
|
3,744
|
|
393,019
|
|
||||||
|
Cash, cash equivalents, and restricted cash at end of the period
|
$
|
358,182
|
|
$
|
607
|
|
$
|
358,789
|
|
|||
In May 2017, the FASB issued ASU 2017-09, “
Compensation
—
Stock Compensation (Topic 718): Scope of Modification Accounting,”
to clarify when to account for a change to the terms or conditions of a share-based payment award as a modification.
The amendments are effective for fiscal years and interim periods within those years beginning after December 15, 2017 on a prospective basis. We adopted the standard in the first quarter of fiscal year 2018 on a prospective basis which did not have an impact on our condensed consolidated financial statements and related disclosures.
(ii) Recent Accounting Updates Not Yet Effective
In February 2016, the FASB issued ASU 2016-02, “
Leases
” (Topic 842) to increase transparency and comparability among organizations by recognizing lease assets and lease liabilities on the balance sheet and disclosing key information about leasing arrangements. The updated guidance is effective for annual periods beginning after December 15, 2018, including interim periods within those fiscal years. We plan to adopt the standard in the first quarter of fiscal year 2019 by electing the package of practical expedients available in the standard. We are in the process of evaluating changes to our systems, processes and controls in order
10
to adopt the new standard in the first quarter of fiscal year 2019. While we are currently evaluating the impact of the adoption of this guidance on our consolidated financial statements, we expect the adoption will have a material increase in assets and liabilities on our consolidated balance sheet.
In June 2016, the FASB issued ASU 2016-13, “
Financial Instruments - Credit Losses
” (Topic 326)
.
The FASB issued this update to provide financial statement users with more decision-useful information about the expected credit losses on financial instruments and other commitments to extend credit held by a reporting entity at each reporting date. The amendments in this update replace the existing guidance of incurred loss impairment methodology with an approach that reflects expected credit losses and requires consideration of a broader range of reasonable and supportable information to inform credit loss estimates.
The updated guidance is effective for annual periods beginning after December 15, 2019, including interim periods within those fiscal years. Early adoption of the update is permitted in fiscal years beginning after December 15, 2018, including interim periods within those fiscal years.
We are currently evaluating the impact of this guidance on our consolidated financial statements and related disclosures.
In January 2017, the FASB issued ASU 2017-04,
“Intangibles—Goodwill and Other (Topic 350): Simplifying the Test for Goodwill Impairment,”
to simplify the subsequent measurement of goodwill by eliminating step two from the goodwill impairment test. Under the amendments, an entity will recognize an impairment charge for the amount by which the carrying value exceeds the fair value. The amendments are effective for fiscal years and interim periods within those years beginning after December 15, 2019 on a prospective basis and early adoption is permitted. We are currently evaluating the impact of this guidance on our consolidated financial statements and related disclosures.
In February 2018, the FASB issued ASU 2018-02,
“Income Statement - Reporting Comprehensive Income (Topic 220): Reclassification of Certain Tax Effects from Accumulated Other Comprehensive Income,”
which gives entities the option to reclassify to retained earnings the tax effects resulting from the U.S. Tax Cuts and Jobs Act (the “TCJA”) related to items in accumulated other comprehensive income. The amendments are effective for fiscal years and interim periods within those years beginning after December 15, 2018 on a retrospective basis and early adoption is permitted. We are currently evaluating the impact of this guidance on our consolidated financial statements and related disclosures.
Marketable Securities
As of
June 30, 2018
and
December 31, 2017
, the estimated fair value of our short-term and long-term marketable securities, classified as available for sale, are as follows (in thousands):
Short-term
|
June 30, 2018
|
Amortized
Cost
|
Gross
Unrealized
Gains
|
Gross
Unrealized
Losses
|
Fair Value
|
||||||||||||
|
Commercial paper
|
$
|
32,656
|
|
$
|
—
|
|
$
|
—
|
|
$
|
32,656
|
|
||||
|
Corporate bonds
|
84,246
|
|
1
|
|
(205
|
)
|
84,042
|
|
||||||||
|
U.S. government agency bonds
|
14,013
|
|
—
|
|
(41
|
)
|
13,972
|
|
||||||||
|
U.S. government treasury bonds
|
32,953
|
|
3
|
|
(19
|
)
|
32,937
|
|
||||||||
|
Certificates of deposit
|
1,022
|
|
—
|
|
—
|
|
1,022
|
|
||||||||
|
Total marketable securities, short-term
|
$
|
164,890
|
|
$
|
4
|
|
$
|
(265
|
)
|
$
|
164,629
|
|
||||
Long-term
|
June 30, 2018
|
Amortized
Cost
|
Gross
Unrealized
Gains
|
Gross
Unrealized
Losses
|
Fair Value
|
||||||||||||
|
U.S. government agency bonds
|
$
|
7,006
|
|
$
|
—
|
|
$
|
(74
|
)
|
$
|
6,932
|
|
||||
|
Corporate bonds
|
1,128
|
|
1
|
|
—
|
|
1,129
|
|
||||||||
|
Total marketable securities, long-term
|
$
|
8,134
|
|
$
|
1
|
|
$
|
(74
|
)
|
$
|
8,061
|
|
||||
11
Short-term
|
December 31, 2017
|
Amortized
Cost
|
Gross
Unrealized
Gains
|
Gross
Unrealized
Losses
|
Fair Value
|
||||||||||||
|
Commercial paper
|
$
|
58,503
|
|
$
|
—
|
|
$
|
(1
|
)
|
$
|
58,502
|
|
||||
|
Corporate bonds
|
145,728
|
|
3
|
|
(174
|
)
|
145,557
|
|
||||||||
|
U.S. government agency bonds
|
3,013
|
|
—
|
|
(7
|
)
|
3,006
|
|
||||||||
|
U.S. government treasury bonds
|
60,650
|
|
—
|
|
(70
|
)
|
60,580
|
|
||||||||
|
Certificates of deposit
|
4,386
|
|
—
|
|
—
|
|
4,386
|
|
||||||||
|
Total marketable securities, short-term
|
$
|
272,280
|
|
$
|
3
|
|
$
|
(252
|
)
|
$
|
272,031
|
|
||||
Long-term
|
December 31, 2017
|
Amortized
Cost
|
Gross
Unrealized
Gains
|
Gross
Unrealized
Losses
|
Fair Value
|
||||||||||||
|
U.S. government agency bonds
|
$
|
15,023
|
|
$
|
—
|
|
$
|
(68
|
)
|
$
|
14,955
|
|
||||
|
Corporate bonds
|
25,067
|
|
2
|
|
(76
|
)
|
24,993
|
|
||||||||
|
Total marketable securities, long-term
|
$
|
40,090
|
|
$
|
2
|
|
$
|
(144
|
)
|
$
|
39,948
|
|
||||
Cash equivalents are not included in the table above as the gross unrealized gains and losses are not material. We have no short-term or long-term investments that have been in a continuous material unrealized loss position for greater than twelve months as of
June 30, 2018
and
December 31, 2017
. Amounts reclassified to earnings from accumulated other comprehensive income (loss), net related to unrealized gains or losses were not material for the
three and six
months ended
June 30, 2018
and 2017. For the
three and six
months ended
June 30, 2018
and 2017, realized gains or losses were not material.
Our fixed-income securities investment portfolio consists of investments that have a maximum effective maturity of
40
months on any individual security. The securities that we invest in are generally deemed to be low risk based on their credit ratings from the major rating agencies. The longer the duration of these securities, the more susceptible they are to changes in market interest rates and bond yields. As interest rates increase, those securities purchased at a lower yield show a mark-to-market unrealized loss. The unrealized losses are due primarily to changes in credit spreads and interest rates. We expect to realize the full value of all these investments upon maturity or sale. The weighted average remaining duration of these securities was approximately
five
months and
six
months as of
June 30, 2018
and
December 31, 2017
, respectively.
As the carrying value approximates the fair value for our short-term and long-term marketable securities shown in the tables above, the following table summarizes the fair value of our short-term and long-term marketable securities classified by contractual maturity as of
June 30, 2018
and
December 31, 2017
(in thousands):
|
June 30,
2018
|
December 31,
2017
|
||||||
|
One year or less
|
$
|
164,629
|
|
$
|
272,031
|
|
|
|
Due in greater than one year
|
8,061
|
|
39,948
|
|
|||
|
Total available for sale short-term and long-term marketable securities
|
$
|
172,690
|
|
$
|
311,979
|
|
|
Investments in Privately Held Companies
Our investments in privately held companies as of
June 30, 2018
and December 31, 2017 are as follows (in thousands):
|
June 30,
2018
|
December 31,
2017
|
||||||
|
Equity securities under the equity method investment
1
|
$
|
49,128
|
|
$
|
54,606
|
|
|
|
Equity securities without readily determinable fair values
2
|
$
|
4,862
|
|
$
|
—
|
|
|
1
Refer to Note 4 “Equity Method Investments” of the Notes to Condensed Consolidated Financial Statements
for more information.
2
In April 2018, the convertible notes receivable (recurring level 3 investment) was converted into equity securities as a result of qualified financing secured by the private company in accordance with ASC 321,
“Investments—Equity Securities.”
The equity securities issued upon conversion are reported as a nonrecurring investment within “Other Assets” in our Condensed Consolidated Balance Sheet. From the date of conversion through June 30, 2018, there were no fair value adjustments.
12
Fair Value Measurements
We measure the fair value of financial assets as the price that would be received from selling an asset or paid to transfer a liability in an orderly transaction between market participants at the measurement date. We use the GAAP fair value hierarchy that prioritizes the inputs to valuation techniques used to measure fair value. This hierarchy requires an entity to maximize the use of observable inputs and minimize the use of unobservable inputs when measuring fair value. The three levels of inputs that may be used to measure fair value:
Level 1
— Quoted (unadjusted) prices in active markets for identical assets or liabilities.
Level 2
— Observable inputs other than quoted prices included in Level 1, such as quoted prices for similar assets or liabilities in active markets, quoted prices for identical or similar assets or liabilities in markets that are not active, or other inputs that are observable or can be corroborated by observable market data for substantially the full term of the asset or liability. We obtain fair values for our Level 2 investments. Our custody bank and asset managers independently use professional pricing services to gather pricing data which may include quoted market prices for identical or comparable financial instruments, or inputs other than quoted prices that are observable either directly or indirectly, and we are ultimately responsible for these underlying estimates.
Level 3
— Unobservable inputs to the valuation methodology that are supported by little or no market activity and that are significant to the measurement of the fair value of the assets or liabilities. Level 3 assets and liabilities include those whose fair value measurements are determined using pricing models, discounted cash flow methodologies or similar valuation techniques, as well as significant management judgment or estimation.
The following tables summarize our financial assets measured at fair value on a recurring basis as of
June 30, 2018
and
December 31, 2017
(in thousands):
|
Description
|
Balance as of
June 30, 2018
|
Level 1
|
Level 2
|
Level 3
|
||||||||||||
|
Cash equivalents:
|
||||||||||||||||
|
Money market funds
|
$
|
390,103
|
|
$
|
390,103
|
|
$
|
—
|
|
$
|
—
|
|
||||
|
Short-term investments:
|
||||||||||||||||
|
Commercial paper
|
32,656
|
|
—
|
|
32,656
|
|
—
|
|
||||||||
|
Corporate bonds
|
84,042
|
|
—
|
|
84,042
|
|
—
|
|
||||||||
|
U.S. government agency bonds
|
13,972
|
|
—
|
|
13,972
|
|
—
|
|
||||||||
|
U.S. government treasury bonds
|
32,937
|
|
32,937
|
|
—
|
|
—
|
|
||||||||
|
Certificates of deposit
|
1,022
|
|
—
|
|
1,022
|
|
—
|
|
||||||||
|
Long-term investments:
|
||||||||||||||||
|
U.S. government agency bonds
|
6,932
|
|
—
|
|
6,932
|
|
—
|
|
||||||||
|
Corporate bonds
|
1,129
|
|
—
|
|
1,129
|
|
—
|
|
||||||||
|
Prepaid expenses and other current assets:
|
||||||||||||||||
|
Israeli funds
|
3,099
|
|
—
|
|
3,099
|
|
—
|
|
||||||||
|
$
|
565,892
|
|
$
|
423,040
|
|
$
|
142,852
|
|
$
|
—
|
|
|||||
13
|
Description
|
Balance as of
December 31, 2017
|
Level 1
|
Level 2
|
Level 3
|
||||||||||||
|
Cash equivalents:
|
||||||||||||||||
|
Money market funds
|
$
|
253,155
|
|
$
|
253,155
|
|
$
|
—
|
|
$
|
—
|
|
||||
|
Commercial paper
|
7,246
|
|
—
|
|
7,246
|
|
—
|
|
||||||||
|
Corporate bonds
|
2,016
|
|
—
|
|
2,016
|
|
—
|
|
||||||||
|
Short-term investments:
|
||||||||||||||||
|
Commercial paper
|
58,502
|
|
—
|
|
58,502
|
|
—
|
|
||||||||
|
Corporate bonds
|
145,557
|
|
—
|
|
145,557
|
|
—
|
|
||||||||
|
U.S. government agency bonds
|
3,006
|
|
—
|
|
3,006
|
|
—
|
|
||||||||
|
U.S. government treasury bonds
|
60,580
|
|
60,580
|
|
—
|
|
—
|
|
||||||||
|
Certificates of deposit
|
4,386
|
|
—
|
|
4,386
|
|
—
|
|
||||||||
|
Long-term investments:
|
||||||||||||||||
|
U.S. government agency bonds
|
14,955
|
|
—
|
|
14,955
|
|
—
|
|
||||||||
|
Corporate bonds
|
24,993
|
|
—
|
|
24,993
|
|
—
|
|
||||||||
|
Prepaid expenses and other current assets:
|
||||||||||||||||
|
Israeli funds
|
3,075
|
|
—
|
|
3,075
|
|
—
|
|
||||||||
|
Short-term notes receivable
|
4,476
|
|
—
|
|
—
|
|
4,476
|
|
||||||||
|
$
|
581,947
|
|
$
|
313,735
|
|
$
|
263,736
|
|
$
|
4,476
|
|
|||||
Derivative Financial Instruments
In March 2018, we began entering into foreign currency forward contracts to minimize the short-term impact of foreign currency exchange rate fluctuations on certain trade and intercompany receivables and payables. These forward contracts are classified within Level 2 of the fair value hierarchy. The gain from the settlement of foreign currency forward contracts during both the
three and six
months ended
June 30, 2018
was
$5.4 million
. As of
June 30, 2018
, the fair value of foreign exchange forward contracts outstanding was not material.
The following table presents the gross notional value of all our foreign exchange forward contracts outstanding as of
June 30, 2018
(in thousands):
|
June 30, 2018
|
|||||
|
Local Currency Amount
|
Notional Contract Amount (USD)
|
||||
|
Euro
|
€64,400
|
$
|
75,322
|
|
|
|
Chinese Yuan
|
¥150,000
|
22,574
|
|
||
|
Canadian Dollar
|
C$28,000
|
21,277
|
|
||
|
British Pound
|
£13,000
|
17,159
|
|
||
|
Japanese Yen
|
¥1,513,000
|
13,670
|
|
||
|
Brazilian Real
|
R$37,300
|
9,582
|
|
||
|
Australian Dollar
|
A$7,300
|
5,390
|
|
||
|
$
|
164,974
|
|
|||
14
Inventories
Inventories consist of the following (in thousands):
|
June 30,
2018 |
December 31,
2017 |
||||||
|
Raw materials
|
$
|
22,976
|
|
$
|
12,721
|
|
|
|
Work in process
|
12,396
|
|
12,157
|
|
|||
|
Finished goods
|
11,880
|
|
6,810
|
|
|||
|
Total inventories
|
$
|
47,252
|
|
$
|
31,688
|
|
|
Other Assets
Other assets consist of the following (in thousands):
|
June 30,
2018 |
December 31,
2017 |
||||||
|
Capitalized commissions
|
$
|
7,947
|
|
$
|
5,515
|
|
|
|
Equity securities
|
4,862
|
|
—
|
|
|||
|
Security deposits
|
3,734
|
|
3,557
|
|
|||
|
Loan receivable from equity investee
|
—
|
|
30,000
|
|
|||
|
Other long-term assets
|
2,759
|
|
4,821
|
|
|||
|
Total other assets
|
$
|
19,302
|
|
$
|
43,893
|
|
|
Accrued Liabilities
Accrued liabilities consist of the following (in thousands):
|
June 30,
2018 |
December 31,
2017 |
||||||
|
Accrued payroll and benefits
|
$
|
87,697
|
|
$
|
103,004
|
|
|
|
Accrued expenses
|
36,776
|
|
27,318
|
|
|||
|
Accrued fixed assets
|
12,889
|
|
11,362
|
|
|||
|
Accrued customer credits
|
11,552
|
|
5,373
|
|
|||
|
Accrued income taxes
|
7,764
|
|
12,405
|
|
|||
|
Accrued warranty
|
7,286
|
|
5,929
|
|
|||
|
Accrued professional fees
|
6,876
|
|
6,316
|
|
|||
|
Accrued sales tax and value added tax
|
5,955
|
|
5,503
|
|
|||
|
Accrued sales return reserve
1
|
5,554
|
|
1,364
|
|
|||
|
Accrued sales rebate
|
3,772
|
|
11,209
|
|
|||
|
Other accrued liabilities
|
10,633
|
|
5,779
|
|
|||
|
Total accrued liabilities
|
$
|
196,754
|
|
$
|
195,562
|
|
|
1
December 31, 2017 balance has been reclassified from accounts receivable, net to reflect the adoption of ASU 2014-09 (
Refer to Note 1 “Summary of Significant Accounting Policies” of the Notes to Condensed Consolidated Financial Statements
for more information).
Warranty
We regularly review the balance for accrued warranty and update based on historical warranty trends. Actual warranty costs incurred have not materially differed from those accrued; however, future actual warranty costs could differ from the estimated amounts.
15
Warranty accrual as of
June 30, 2018
and
2017
consists of the following activity (in thousands):
|
Six Months Ended
June 30, |
|||||||
|
|
2018
|
2017
|
|||||
|
Balance at beginning of period
|
$
|
5,929
|
|
$
|
3,841
|
|
|
|
Charged to cost of revenues
|
5,728
|
|
3,690
|
|
|||
|
Actual warranty expenditures
|
(4,371
|
)
|
(2,503
|
)
|
|||
|
Balance at end of period
|
$
|
7,286
|
|
$
|
5,028
|
|
|
Deferred Revenues
Deferred revenues consist of the following (in thousands):
|
June 30,
2018 |
December 31,
2017 |
||||||
|
Deferred revenues - current
|
$
|
321,148
|
|
$
|
267,713
|
|
|
|
Deferred revenues - long-term
1
|
7,625
|
|
4,588
|
|
|||
1
Included in other long-term liabilities on our Condensed Consolidated Balance Sheet.
During the three months ended
June 30, 2018
and
June 30, 2017
, we recognized revenue of
$490.3 million
and
$356.5 million
, respectively, of which
$102.0 million
and
$61.3 million
were included in the deferred revenue balance at
December 31, 2017
and
December 31, 2016
, respectively.
During the
six months ended
June 30, 2018
and
June 30, 2017
, we recognized revenue of
$927.2 million
and
$666.8 million
, respectively, of which
$187.7 million
and
$112.8 million
were included in the deferred revenues balance at
December 31, 2017
and
December 31, 2016
, respectively.
On July 25, 2016, we acquired a
17%
equity interest, on a fully diluted basis, in SmileDirectClub, LLC (“SDC”) for
$46.7 million
. The investment is accounted for under an equity method investment and the investee, SDC, is considered a related party. The investment is reported in our Condensed Consolidated Balance Sheet under equity method investments, and we record our proportional share of SDC’s losses within equity in losses of investee, net of tax, in our Condensed Consolidated Statement of Operations. On July 24, 2017, we purchased an additional
2%
equity interest in SDC for
$12.8 million
. As a result of this purchase, we hold a
19%
equity interest in SDC on a fully diluted basis. As of
June 30, 2018
and
December 31, 2017
, the balance of our equity method investments was
$49.1 million
and
$54.6 million
, respectively.
Concurrently with the investment on July 25, 2016, we also entered into a supply agreement with SDC to manufacture clear aligners for SDC’s doctor-led, at-home program for simple teeth straightening. The term of the supply agreement expires on December 31, 2019. We commenced supplying aligners to SDC in October 2016. The sale of aligners to SDC and the income from the supply agreement are reported in our Clear Aligner business segment. We eliminate unrealized profit on outstanding intercompany transactions. As of
June 30, 2018
and
December 31, 2017
, the balance of accounts receivable due from SDC was
$11.8 million
and
$14.3 million
, respectively. For the three months ended
June 30, 2018
and
2017
, net revenues recognized from SDC were
$8.6 million
and
$3.0 million
, respectively, and for the
six months ended
June 30, 2018
and
2017
, net revenues recognized from SDC were
$13.9 million
and
$3.6 million
, respectively.
On July 25, 2016, we entered into a Loan and Security Agreement (the “Loan Agreement”) with SDC and amended on July 24, 2017 where we agreed to provide SDC a loan of up to
$30.0 million
in one or more advances. On February 7, 2018,
$30.0 million
of outstanding loan advances and related accrued interest were repaid in full, and the Loan Agreement was terminated (
Refer to Note 8 “Legal Proceedings” of the Notes to Condensed Consolidated Financial Statements
for SDC legal proceedings discussion).
16
During the first quarter of 2017, we completed the acquisitions of certain of our distributors for the total cash consideration of approximately
$9.5 million
including cash acquired. We recorded
$1.9 million
of net tangible liabilities,
$8.2 million
of identifiable intangible assets and
$3.2 million
of goodwill. The goodwill is primarily related to the benefit we expect to obtain from direct sales as we believe that the transition from our distributor arrangements to a direct sales model will increase our net revenues in the region as we will experience higher average sales prices (“ASP”) compared to our discounted ASP under the distribution agreements. The goodwill is not deductible for tax purposes.
Pro forma results of operations for these acquisitions have not been presented as they were not material to our results of operations, either individually or in aggregate, for the
three and six
months ended June 30, 2017.
Goodwill
The change in the carrying value of goodwill for the
six
months ended
June 30, 2018
, all attributable to our Clear Aligner reporting unit, is as follows (in thousands):
|
Total
|
|||
|
Balance as of December 31, 2017
|
$
|
64,614
|
|
|
Adjustments
1
|
(434
|
)
|
|
|
Balance as of June 30, 2018
|
$
|
64,180
|
|
1
The adjustments to goodwill during the period were a result of foreign currency translation.
During the fourth quarter of fiscal 2017, we performed the annual goodwill impairment testing and found
no
impairment as the fair value of our Clear Aligner reporting unit was significantly in excess of the carrying value.
Intangible Long-Lived Assets
Acquired intangible long-lived assets are being amortized as follows (in thousands):
|
Weighted Average Amortization Period (in years)
|
Gross Carrying Amount as of
June 30, 2018 |
Accumulated
Amortization
|
Accumulated
Impairment Loss
|
Net Carrying
Value as of June 30, 2018 |
|||||||||||||
|
Trademarks
|
15
|
$
|
7,100
|
|
$
|
(1,838
|
)
|
$
|
(4,179
|
)
|
$
|
1,083
|
|
||||
|
Existing technology
|
13
|
12,600
|
|
(4,986
|
)
|
(4,328
|
)
|
3,286
|
|
||||||||
|
Customer relationships
|
11
|
33,500
|
|
(15,612
|
)
|
(10,751
|
)
|
7,137
|
|
||||||||
|
Reacquired rights
|
3
|
7,500
|
|
(2,894
|
)
|
—
|
|
4,606
|
|
||||||||
|
Patents
|
8
|
6,796
|
|
(1,919
|
)
|
—
|
|
4,877
|
|
||||||||
|
Other
|
2
|
618
|
|
(480
|
)
|
—
|
|
138
|
|
||||||||
|
Total intangible assets
|
$
|
68,114
|
|
$
|
(27,729
|
)
|
$
|
(19,258
|
)
|
$
|
21,127
|
|
|||||
|
Weighted Average Amortization Period (in years)
|
Gross Carrying
Amount as of
December 31, 2017
|
Accumulated
Amortization
|
Accumulated Impairment Loss
|
Net Carrying
Value as of
December 31, 2017
|
|||||||||||||
|
Trademarks
|
15
|
$
|
7,100
|
|
$
|
(1,769
|
)
|
$
|
(4,179
|
)
|
$
|
1,152
|
|
||||
|
Existing technology
|
13
|
12,600
|
|
(4,704
|
)
|
(4,328
|
)
|
3,568
|
|
||||||||
|
Customer relationships
|
11
|
33,500
|
|
(14,681
|
)
|
(10,751
|
)
|
8,068
|
|
||||||||
|
Reacquired rights
|
3
|
7,500
|
|
(1,356
|
)
|
—
|
|
6,144
|
|
||||||||
|
Patents
|
8
|
6,798
|
|
(1,504
|
)
|
—
|
|
5,294
|
|
||||||||
|
Other
|
2
|
618
|
|
(390
|
)
|
—
|
|
228
|
|
||||||||
|
Total intangible assets
|
$
|
68,116
|
|
$
|
(24,404
|
)
|
$
|
(19,258
|
)
|
$
|
24,454
|
|
|||||
17
The total estimated annual future amortization expense for these acquired intangible assets as of
June 30, 2018
is as follows (in thousands):
|
Fiscal Year Ending December 31,
|
Amortization
|
|||
|
Remainder of 2018
|
$
|
3,149
|
|
|
|
2019
|
6,184
|
|
||
|
2020
|
3,855
|
|
||
|
2021
|
3,389
|
|
||
|
2022
|
2,116
|
|
||
|
Thereafter
|
2,434
|
|
||
|
Total
|
$
|
21,127
|
|
|
Amortization for the three months ended
June 30, 2018
and
2017
was
$1.5 million
and
$1.8 million
, respectively, and amortization for the
six months ended
June 30, 2018
and
2017
was
$3.0 million
and
$3.2 million
, respectively.
On February 27, 2018, we entered into a new credit facility for a
$200.0 million
revolving line of credit, with a
$50.0 million
letter of credit sublimit, and a maturity date of February 27, 2021, replacing the existing credit facility which provided for a
$50.0 million
revolving line of credit with a
$10.0 million
letter of credit. The credit facility requires us to comply with specific financial conditions and performance requirements. The loans bear interest, at our option, at either a rate based on the reserve adjusted LIBOR for the applicable interest period or a base rate, in each case plus a margin. The base rate is the highest of the credit facility’s publicly announced prime rate, the federal funds rate plus
0.50%
and one month LIBOR plus
1.0%
. The margin ranges from
1.25%
to
1.75%
for LIBOR loans and
0.25%
to
0.75%
for base rate loans. Interest on the loans is payable quarterly in arrears with respect to base rate loans and at the end of an interest period (and at three month intervals if the interest period exceeds three months) in the case of LIBOR loans. Principal, together with accrued and unpaid interest, is due on the maturity date. As of
June 30, 2018
, we had
no
outstanding borrowings under this credit facility and were in compliance with the conditions and performance requirements.
Patent Infringement Lawsuit
On November 14, 2017, Align filed
six
patent infringement lawsuits asserting
26
patents against 3Shape A/S, a Danish corporation, and a related U.S. corporate entity, asserting that 3Shape’s Trios intraoral scanning system and Dental System software infringe Align patents. Align filed
two
Section 337 complaints with the U.S. International Trade Commission (“ITC”) alleging that 3Shape violates U.S. trade laws by selling for importation and importing its infringing Trios intraoral scanning system and Dental System software. Align’s ITC complaints seek cease and desist orders and exclusion orders prohibiting the importation of 3Shape’s Trios scanning system and Dental System software products into the U.S. Align also filed
four
separate complaints in the United States District Court for the District of Delaware alleging patent infringement by 3Shape’s Trios intraoral scanning system and Dental System software. All of these district court complaints seek monetary damages and injunctive relief against further infringement.
SDC Dispute
On April 5, 2018, SDC Financial LLC, SmileDirectClub LLC, and the Members of SDC Financial LLC other than Align (collectively, the "SDC Entities") initiated proceedings that seek, among other forms of relief, to preliminarily and permanently enjoin all activities related to the Invisalign store pilot project, require Align to close the existing Invisalign stores, prohibit Align from opening any additional stores, and allow the SDC Entities to exercise a right to repurchase all of Align's SDC Financial LLC membership interests for a purchase price equal to the current capital account balance. On June 29, 2018, the Chancery Court for Davidson County, Tennessee, denied the SDC Entities’ request for a temporary injunction to prevent Align from opening additional Invisalign stores. Align continues to dispute the allegations that it has breached its obligations to the SDC Entities under applicable law and will oppose and vigorously defend itself at the arbitration proceedings currently scheduled for December 2018. This dispute does not impact Align’s existing supply agreement with SDC which remains in place through 2019 and includes a minimum volume commitment. We are currently unable to predict the outcome of this dispute and therefore cannot determine the likelihood of loss, if any, nor estimate a range of possible loss.
18
In addition, in the course of Align’s operations, Align is involved in a variety of claims, suits, investigations, and proceedings, including actions with respect to intellectual property claims, patent infringement claims, government investigations, labor and employment claims, breach of contract claims, tax, and other matters. Regardless of the outcome, these proceedings can have an adverse impact on us because of defense costs, diversion of management resources, and other factors. Although the results of complex legal proceedings are difficult to predict and Align’s view of these matters may change in the future as litigation and events related thereto unfold; Align currently does not believe that these matters, individually or in the aggregate, will materially affect Align’s financial position, results of operations or cash flows.
Operating Leases
As of
June 30, 2018
, minimum future lease payments for non-cancelable operating leases are as follows (in thousands):
|
Fiscal Year Ending December 31,
|
Operating Leases
|
|||
|
Remainder of 2018
|
$
|
9,213
|
|
|
|
2019
|
17,350
|
|
||
|
2020
|
13,503
|
|
||
|
2021
|
11,827
|
|
||
|
2022
|
9,617
|
|
||
|
Thereafter
|
20,738
|
|
||
|
Total minimum future lease payments
|
$
|
82,248
|
|
|
Sublease income is not material and excluded from the table above.
Other Commitments
On July 25, 2016, we entered into a Loan and Security Agreement (the “Loan Agreement”) with SDC and subsequently amended on July 24, 2017 to provide a loan of up to
$30.0 million
in one or more advances to SDC (the “Loan Facility”). On February 7, 2018,
$30.0 million
of outstanding advances and related accrued interest were repaid in full, and the Loan Agreement was terminated (
Refer to Note 4 “Equity Method Investments” of the Notes to Condensed Consolidated Financial Statements
for more information on our investments in SDC).
On November 27, 2017, we entered into a Purchase Agreement with one of our existing single source suppliers. Under the terms of the original agreement, we are required to purchase a minimum approximately
$305.2 million
of aligner materials over the next
4 years
. On May 29, 2018, we entered into an amendment to the Purchase Agreement with the existing single source supplier to increase the original term of the agreement to
5 years
and total minimum purchase amount to approximately
$425.9 million
.
Off-Balance Sheet Arrangements
As of
June 30, 2018
, we had no material off-balance sheet arrangements that have, or are reasonably likely to have, a current or future material effect on our consolidated financial condition, results of operations, liquidity, capital expenditures or capital resources other than certain items disclosed in Note 9 “Commitments and Contingencies” of the Notes to Consolidated Financial Statements included in our Annual Report on Form 10-K.
Indemnification Provisions
In the normal course of business to facilitate transactions in our services and products, we indemnify certain parties: customers, vendors, lessors, and other parties with respect to certain matters, including, but not limited to, services to be provided by us and intellectual property infringement claims made by third parties. In addition, we have entered into indemnification agreements with our directors and our executive officers that will require us, among other things, to indemnify them against certain liabilities that may arise by reason of their status or service as directors or officers. Several of these agreements limit the time within which an indemnification claim can be made and the amount of the claim.
It is not possible to make a reasonable estimate of the maximum potential amount under these indemnification agreements due to the unique facts and circumstances involved in each particular agreement. Additionally, we have a limited history of prior indemnification claims and the payments we have made under such agreements have not had a material adverse effect on our
19
results of operations, cash flows or financial position. However, to the extent that valid indemnification claims arise in the future, future payments by us could be significant and could have a material adverse effect on our results of operations or cash flows in a particular period. As of
June 30, 2018
, we did not have any material indemnification claims that were probable or reasonably possible.
Summary of Stock-Based Compensation Expense
As of
June 30, 2018
, the 2005 Incentive Plan (as amended) has a total reserve of
27,783,379
shares of which
6,066,597
shares are available for issuance.
Stock-based compensation is based on the estimated fair value of awards, net of estimated forfeitures, and recognized over the requisite service period. Estimated forfeitures are based on historical experience at the time of grant and may be revised, if necessary, in subsequent periods if actual forfeitures differ from those estimates. The stock-based compensation related to all of our stock-based awards and employee stock purchases for the
three and six
months ended
June 30, 2018
and
2017
is as follows (in thousands):
|
|
Three Months Ended
June 30, |
Six Months Ended
June 30, |
|||||||||||||
|
|
2018
|
2017
|
2018
|
2017
|
|||||||||||
|
Cost of net revenues
|
$
|
900
|
|
$
|
768
|
|
$
|
1,781
|
|
$
|
1,693
|
|
|||
|
Selling, general and administrative
|
13,216
|
|
11,218
|
|
25,794
|
|
22,934
|
|
|||||||
|
Research and development
|
2,774
|
|
2,259
|
|
5,145
|
|
4,430
|
|
|||||||
|
Total stock-based compensation
|
$
|
16,890
|
|
$
|
14,245
|
|
$
|
32,720
|
|
$
|
29,057
|
|
|||
Stock Options
We have not granted options since 2011 and all outstanding options were fully vested and associated stock-based compensation expenses was recognized as of December 31, 2015. Activity for the
six months ended
June 30, 2018
under the stock option plans is set forth below:
|
Number of Shares
Underlying
Stock Options
(in thousands)
|
Weighted
Average
Exercise
Price per Share
|
Weighted Average
Remaining
Contractual Term (in years)
|
Aggregate
Intrinsic
Value
(in thousands)
|
|||||||||
|
Outstanding as of December 31, 2017
|
75
|
|
$
|
11.36
|
|
|||||||
|
Exercised
|
(61
|
)
|
12.13
|
|
||||||||
|
Cancelled or expired
|
—
|
|
—
|
|
||||||||
|
Outstanding as of June 30, 2018
|
14
|
|
$
|
7.96
|
|
0.62
|
$
|
4,651
|
|
|||
|
Vested at June 30, 2018
|
14
|
|
$
|
7.96
|
|
0.62
|
$
|
4,651
|
|
|||
|
Exercisable at June 30, 2018
|
14
|
|
$
|
7.96
|
|
0.62
|
$
|
4,651
|
|
|||
Restricted Stock Units (“RSUs”)
The fair value of RSUs is based on our closing stock price on the date of grant. A summary for the
six months ended
June 30, 2018
is as follows:
|
Shares
Underlying RSUs
(in thousands)
|
Weighted Average Grant Date Fair Value
|
Weighted
Remaining
Contractual Term (in years)
|
Aggregate
Intrinsic
Value
(in thousands)
|
|||||||||
|
Nonvested as of December 31, 2017
|
1,341
|
|
$
|
82.30
|
|
|||||||
|
Granted
|
214
|
|
256.85
|
|
||||||||
|
Vested and released
|
(491
|
)
|
71.93
|
|
||||||||
|
Forfeited
|
(65
|
)
|
98.99
|
|
||||||||
|
Nonvested as of June 30, 2018
|
999
|
|
$
|
123.73
|
|
1.44
|
$
|
341,829
|
|
|||
20
As of
June 30, 2018
, we expect to recognize
$98.3 million
of total unamortized compensation cost, net of estimated forfeitures, related to RSUs over a weighted average period of
2.3
years.
Market-performance Based Restricted Stock Units (“MSUs”)
We grant MSUs to our executive officers. Each MSU represents the right to one share of Align’s common stock. The actual number of MSUs which will be eligible to vest will be based on the performance of Align’s stock price relative to the performance of a stock market index over the vesting period, and certain MSU grants are also based on Align’s stock price at the end of the performance period. Generally, the vesting period of MSUs is
two
to
three
years. For MSUs granted during the
six months ended
June 30, 2018
, the maximum number of MSUs which will be eligible to vest are between
250%
to
300%
of the MSUs initially granted.
The following table summarizes the MSU performance for the
six months ended
June 30, 2018
:
|
Number of Shares
Underlying MSUs
(in thousands)
|
Weighted Average Grant Date Fair Value
|
Weighted Average
Remaining
Contractual Term (in years)
|
Aggregate
Intrinsic
Value
(in thousands)
|
|||||||||
|
Nonvested as of December 31, 2017
|
428
|
|
$
|
78.53
|
|
|||||||
|
Granted
|
208
|
|
261.86
|
|
||||||||
|
Vested and released
|
(312
|
)
|
62.41
|
|
||||||||
|
Forfeited
|
—
|
|
—
|
|
||||||||
|
Nonvested as of June 30, 2018
|
324
|
|
$
|
211.91
|
|
1.66
|
$
|
110,922
|
|
|||
As of
June 30, 2018
, we expect to recognize
$48.6 million
of total unamortized compensation cost, net of estimated forfeitures, related to MSUs over a weighted average period of
1.7
years.
Employee Stock Purchase Plan (“ESPP”)
In May 2010, our shareholders approved the 2010 Employee Stock Purchase Plan (the “2010 Purchase Plan”) which will continue until terminated by either the Board of Directors or its administrator. The maximum number of shares available for purchase under the 2010 Purchase Plan is
2,400,000
shares. As of
June 30, 2018
, we have
647,363
shares available for future issuance.
The fair value of the option component of the 2010 Purchase Plan shares was estimated at the grant date using the Black-Scholes option pricing model with the following weighted average assumptions:
|
|
Six Months Ended
June 30, |
||||||
|
|
2018
|
2017
|
|||||
|
Expected term (in years)
|
1.3
|
|
1.2
|
|
|||
|
Expected volatility
|
35.7
|
%
|
26.1
|
%
|
|||
|
Risk-free interest rate
|
1.9
|
%
|
0.9
|
%
|
|||
|
Expected dividends
|
—
|
|
—
|
|
|||
|
Weighted average fair value at grant date
|
$
|
78.38
|
|
$
|
26.09
|
|
|
As of
June 30, 2018
, there was
$1.6 million
of total unamortized compensation costs related to employee stock purchases which we expect to be recognized over a weighted average period of
0.4
year.
April 2014 Repurchase Program
In January 2017, we repurchased on the open market approximately
0.04 million
shares of our common stock at an average price of
$96.37
per share, including commission for an aggregate purchase price of approximately
$3.8 million
, completing the April 2014 Repurchase Program.
21
April 2016 Repurchase Program
On April 28, 2016, we announced that our Board of Directors had authorized a plan to repurchase up to
$300.0 million
of our common stock (“April 2016 Repurchase Program”).
In May 2017, we entered into an accelerated share repurchase agreement ("2017 ASR") to repurchase
$50.0 million
of our common stock. The 2017 ASR was completed in August 2017. We received a total of approximately
0.4 million
shares for an average share price of
$146.48
. In November 2017, we repurchased on the open market approximately
0.2 million
shares of our common stock at an average price of
$243.40
per share, including commissions, for an aggregate purchase price of approximately
$50.0 million
.
In February 2018, we repurchased on the open market approximately
0.4 million
shares of our common stock at an average price of
$252.24
per share, including commission for an aggregate purchase price of approximately
$100.0 million
.
In July 2018, we repurchased on the open market approximately
0.3 million
shares of our common stock at an average price of
$350.08
per share, including commissions for an aggregate purchase price of approximately
$100.0 million
, completing the April 2016 Repurchase Program.
May 2018 Repurchase Program
On May 23, 2018, we announced that our Board of Directors had authorized a plan to repurchase up to
$600.0 million
of our common stock (“May 2018 Repurchase Program”).
As of
June 30, 2018
, we have not made any stock repurchases under the May 2018 Repurchase Program.
Our provision for income taxes was $
7.7 million
and $
15.4 million
for the three months ended
June 30, 2018
and
2017
, respectively, representing effective tax rates of
6.6%
and
17.7%
, respectively. Our provision for income taxes was
$10.6 million
and
$8.2 million
for the six months ended
June 30, 2018
and
2017
, respectively, representing effective tax rates of
4.9%
and
5.4%
, respectively. As a result of the enactment of the TCJA, the U.S. federal statutory tax rate decreased from 35% to 21% effective January 1, 2018. Our effective tax rate differs from the statutory federal income tax rate of
21%
and
35%
for both the
three and six
months ended
June 30, 2018
and
2017
, respectively, mainly as a result of recognition of excess tax benefits related to stock-based compensation and certain foreign earnings, primarily from the Netherlands and Costa Rica, being taxed at lower tax rates. The decrease in effective tax rate for the
three and six
months ended
June 30, 2018
compared to the same periods in
2017
is primarily attributable to the decrease in the corporate tax rate from 35% to 21% pursuant to the enactment of the TCJA, offset in part by reduced benefits from foreign earnings being taxed at a lower tax rate, and the increase in excess tax benefits related to stock-based compensation.
For the
three and six
months ended
June 30, 2018
, we recognized excess tax benefits of
$16.6 million
and
$39.9 million
, respectively, in our provision for income taxes.
We exercise significant judgment in regards to estimates of future market growth, forecasted earnings and projected taxable income in determining the provision for income taxes and for purposes of assessing our ability to utilize any future benefit from deferred tax assets.
We file U.S. federal, U.S. state, and non-U.S. income tax returns. Our major tax jurisdictions include U.S. federal, the State of California and the Netherlands. For U.S. federal and state tax returns, we are no longer subject to tax examinations for years before
2000
. We are currently under examination by the Internal Revenue Service for tax year 2015. With few exceptions, we are no longer subject to examination by foreign tax authorities for years before
2010
.
Our total gross unrecognized tax benefits, excluding interest and penalties, was
$53.2 million
and
$47.7 million
as of
June 30, 2018
and
December 31, 2017
, respectively, all of which would impact our effective tax rate if recognized. Our total interest and penalties accrued as of
June 30, 2018
was
$3.6 million
. We have elected to recognize interest and penalties related to unrecognized tax benefits as a component of income taxes. The timing and resolution of income tax examinations is uncertain, and the amounts ultimately paid, if any, upon resolution of issues raised by the taxing authorities may differ materially from the amounts accrued for each year. It is reasonably possible that the gross unrecognized tax benefits related to the years that are subject to examination could decrease, whether by payment, release, or a combination of both, in the next 12 months by
$28.0 million
, which would impact our effective tax rate.
22
In June 2017, the Costa Rica Ministry of Foreign Trade, an agency of the Government of Costa Rica, granted an extension of certain income tax incentives for an additional
twelve
year period. Under these incentives, all of the income in Costa Rica is subject to a reduced tax rate. In order to receive the benefit of these incentives, we must hire specified numbers of employees and maintain certain minimum levels of fixed asset investment in Costa Rica. If we do not fulfill these conditions for any reason, our incentive could lapse and our income in Costa Rica would be subject to taxation at higher rates which could have a negative impact on our operating results. The Costa Rica corporate income tax rate that would apply, absent the incentives, is
30%
for
2018
and
2017
. For the three and six months ended
June 30, 2018
, the reduction in income taxes due to the reduced tax rate was minimal.
As of
December 31, 2017
, undistributed earnings of the Company totaled
$606.5 million
. We reassessed our capital needs and investment strategy with regard to the indefinite reinvestment of the undistributed earnings from certain of our foreign subsidiaries as a result of the one-time transition tax on cumulative foreign earnings under the TCJA. During the fourth quarter of
2017
, we determined that approximately
$591.9 million
of the total undistributed foreign earnings are no longer considered to be indefinitely reinvested outside the U.S. As a result, in the fourth quarter of 2017, we recorded a deferred tax liability of approximately
$3.3 million
, which represents the provisional amount of U.S. state income taxes that would be due in the event these foreign earnings are distributed. The remaining amount of undistributed foreign earnings of approximately
$14.7 million
continues to be indefinitely reinvested in our international operations. Since U.S. federal income tax has already been provided under the provisions of the TCJA, the additional tax impact of the distribution of such foreign earnings to the U.S. parent would be limited to U.S. state income and withholding taxes and is not significant.
As of
December 31, 2017
, we recorded a provisional tax charge for the estimated impact of the TCJA of
$84.3 million
, of which
$73.9 million
was related to a provisional transition tax liability on the mandatory deemed repatriation of foreign earnings and
$10.4 million
was related to the remeasurement of certain deferred tax assets and liabilities. During the
six months ended
June 30, 2018
, the additional provisional tax charge recorded was
$0.5 million
, primarily resulting from further analysis of our cumulative foreign earnings balances affecting the transition tax liability and the corresponding state tax impact. As we complete our analysis of the TJCA, we may make further adjustments to the provisional amounts, which may impact our provision for income taxes in the period in which the adjustments are made.
The TCJA subjects a U.S. shareholder to tax on global intangible low-taxed income (“GILTI”) earned by certain foreign subsidiaries. The FASB Staff Q&A, Topic 740, No. 5, Accounting for Global Intangible Low-Taxed Income, states that an entity can make an accounting policy election to either recognize deferred taxes for temporary basis differences expected to reverse as GILTI in future years or provide for the tax expense related to GILTI in the year the tax is incurred as a period expense only. Given the complexity of the GILTI provisions, we are still evaluating the effects of the GILTI provisions and have not yet determined our accounting policy. As of
June 30, 2018
, we are still evaluating the GILTI provisions and our analysis of future taxable income that is subject to GILTI. We have included GILTI related to current-year operations only in our estimated annual effective tax rate and have not provided additional GILTI on deferred items.
Basic net income per share is computed using the weighted average number of shares of common stock outstanding during the period. Diluted net income per share is computed using the weighted average number of shares of common stock, adjusted for any dilutive effect of potential common stock. Potential common stock, computed using the treasury stock method, includes RSUs, MSUs, stock options and our ESPP.
23
The following table sets forth the computation of basic and diluted net income per share attributable to common stock (in thousands, except per share amounts):
|
|
Three Months Ended
June 30, |
Six Months Ended
June 30, |
|||||||||||||
|
|
2018
|
2017
|
2018
|
2017
|
|||||||||||
|
Numerator:
|
|||||||||||||||
|
Net income
|
$
|
106,105
|
|
$
|
69,179
|
|
$
|
201,971
|
|
$
|
138,599
|
|
|||
|
Denominator:
|
|||||||||||||||
|
Weighted-average common shares outstanding, basic
|
80,216
|
|
80,188
|
|
80,127
|
|
80,047
|
|
|||||||
|
Dilutive effect of potential common stock
|
1,255
|
|
1,443
|
|
1,448
|
|
1,621
|
|
|||||||
|
Total shares, diluted
|
81,471
|
|
81,631
|
|
81,575
|
|
81,668
|
|
|||||||
|
Net income per share, basic
|
$
|
1.32
|
|
$
|
0.86
|
|
$
|
2.52
|
|
$
|
1.73
|
|
|||
|
Net income per share, diluted
|
$
|
1.30
|
|
$
|
0.85
|
|
$
|
2.48
|
|
$
|
1.70
|
|
|||
For the
three and six
months ended
June 30, 2018
and
2017
, potentially anti-dilutive shares excluded from diluted net income per share related to RSUs, MSUs, stock options and ESPP were not material.
Segment Information
Operating segments are defined as components of an enterprise for which separate financial information is available that is evaluated regularly by the Chief Operating Decision Maker (“CODM”), or decision-making group, in deciding how to allocate resources and in assessing performance. Our CODM is our Chief Executive Officer. We report segment information based on the management approach. The management approach designates the internal reporting used by CODM for decision making and performance assessment as the basis for determining our reportable segments. The performance measures of our reportable segments include net revenues, gross profit and income from operations. Income from operations for each segment includes all geographic revenues, related cost of net revenues and operating expenses directly attributable to the segment. Certain operating expenses are attributable to operating segments and each allocation is measured differently based on the specific facts and circumstances of the costs being allocated. Costs not specifically allocated to segment income from operations include various corporate expenses such as stock-based compensation and costs related to IT, facilities, human resources, accounting and finance, legal and regulatory, and other separately managed general and administrative costs outside the operating segments.
We group our operations into
two
reportable segments: Clear Aligner segment and Scanner segment.
|
•
|
Our Clear Aligner segment consists of Comprehensive Products, Non-Comprehensive Products and Non-Case revenues as defined below:
|
|
•
|
Comprehensive Products include our Invisalign Full, Teen and Assist products.
|
|
•
|
Non-Comprehensive Products include our Invisalign Express, Invisalign Lite, Invisalign i7 and Invisalign Go products in addition to revenues from the sale of aligners to SDC under our supply agreement.
|
|
•
|
Non-Case includes our Vivera retainers along with our training and ancillary products for treating malocclusion.
|
|
•
|
Our Scanner segment consists of intraoral scanning systems and additional services available with the intraoral scanners that provide digital alternatives to the traditional cast models. This segment includes our iTero scanner and OrthoCAD services.
|
24
These reportable operating segments are based on how our CODM views and evaluates our operations as well as allocation of resources. The following information relates to these segments (in thousands):
|
|
Three Months Ended
June 30, |
Six Months Ended
June 30, |
|||||||||||||
|
Net revenues
|
2018
|
2017
|
2018
|
2017
|
|||||||||||
|
Clear Aligner
|
$
|
433,241
|
|
$
|
321,036
|
|
$
|
818,746
|
|
$
|
603,435
|
|
|||
|
Scanner
|
57,018
|
|
35,446
|
|
108,437
|
|
63,388
|
|
|||||||
|
Total net revenues
|
$
|
490,259
|
|
$
|
356,482
|
|
$
|
927,183
|
|
$
|
666,823
|
|
|||
|
Gross profit
|
|||||||||||||||
|
Clear Aligner
|
$
|
331,612
|
|
$
|
250,814
|
|
$
|
628,588
|
|
$
|
470,761
|
|
|||
|
Scanner
|
33,970
|
|
20,103
|
|
64,402
|
|
35,781
|
|
|||||||
|
Total gross profit
|
$
|
365,582
|
|
$
|
270,917
|
|
$
|
692,990
|
|
$
|
506,542
|
|
|||
|
Income from operations
|
|||||||||||||||
|
Clear Aligner
|
$
|
190,287
|
|
$
|
133,916
|
|
$
|
351,741
|
|
$
|
248,650
|
|
|||
|
Scanner
|
17,670
|
|
8,795
|
|
33,752
|
|
14,799
|
|
|||||||
|
Unallocated corporate expenses
|
(85,266
|
)
|
(59,142
|
)
|
(164,610
|
)
|
(118,207
|
)
|
|||||||
|
Total income from operations
|
$
|
122,691
|
|
$
|
83,569
|
|
$
|
220,883
|
|
$
|
145,242
|
|
|||
|
Depreciation and amortization
|
|||||||||||||||
|
Clear Aligner
|
$
|
6,759
|
|
$
|
5,600
|
|
$
|
13,143
|
|
$
|
9,963
|
|
|||
|
Scanner
|
1,169
|
|
1,082
|
|
2,273
|
|
2,119
|
|
|||||||
|
Unallocated corporate depreciation and amortization
|
4,704
|
|
2,194
|
|
8,650
|
|
4,661
|
|
|||||||
|
Total depreciation and amortization
|
$
|
12,632
|
|
$
|
8,876
|
|
$
|
24,066
|
|
$
|
16,743
|
|
|||
The following table reconciles total segment income from operations in the table above to net income before provision for income taxes and equity losses of investee (in thousands):
|
|
Three Months Ended
June 30, |
Six Months Ended
June 30, |
|||||||||||||
|
2018
|
2017
|
2018
|
2017
|
||||||||||||
|
Total segment income from operations
|
$
|
207,957
|
|
$
|
142,711
|
|
$
|
385,493
|
|
$
|
263,449
|
|
|||
|
Unallocated corporate expenses
|
(85,266
|
)
|
(59,142
|
)
|
(164,610
|
)
|
(118,207
|
)
|
|||||||
|
Total income from operations
|
122,691
|
|
83,569
|
|
220,883
|
|
145,242
|
|
|||||||
|
Interest income
|
1,917
|
|
1,441
|
|
4,093
|
|
2,636
|
|
|||||||
|
Other income (expense), net
|
(7,099
|
)
|
1,771
|
|
(6,922
|
)
|
2,221
|
|
|||||||
|
Net income before provision for income taxes and equity in losses of investee
|
$
|
117,509
|
|
$
|
86,781
|
|
$
|
218,054
|
|
$
|
150,099
|
|
|||
Geographical Information
Net revenues are presented below by geographic area (in thousands):
|
|
Three Months Ended
June 30, |
Six Months Ended
June 30, |
|||||||||||||
|
|
2018
|
2017
|
2018
|
2017
|
|||||||||||
|
Net revenues
1
:
|
|||||||||||||||
|
United States
|
$
|
254,020
|
|
$
|
207,021
|
|
$
|
491,123
|
|
$
|
390,294
|
|
|||
|
The Netherlands
|
156,428
|
|
109,532
|
|
295,959
|
|
209,331
|
|
|||||||
|
Other International
|
79,811
|
|
39,929
|
|
140,101
|
|
67,198
|
|
|||||||
|
Total net revenues
|
$
|
490,259
|
|
$
|
356,482
|
|
$
|
927,183
|
|
$
|
666,823
|
|
|||
1
Net revenues are attributed to countries based on location of where revenue is recognized.
25
Tangible long-lived assets are presented below by geographic area (in thousands):
|
|
June 30,
2018 |
December 31, 2017
|
|||||
|
Long-lived assets
2
:
|
|||||||
|
The Netherlands
|
$
|
190,130
|
|
$
|
143,673
|
|
|
|
United States
|
129,837
|
|
128,171
|
|
|||
|
Costa Rica
|
61,609
|
|
30,738
|
|
|||
|
Mexico
|
31,289
|
|
25,090
|
|
|||
|
China
|
16,393
|
|
5,480
|
|
|||
|
Other International
|
18,675
|
|
15,641
|
|
|||
|
Total long-lived assets
|
$
|
447,933
|
|
$
|
348,793
|
|
|
2
Long-lived assets are attributed to countries based on entity that owns the assets.
26
ITEM 2.
MANAGEMENT’S DISCUSSION AND ANALYSIS OF FINANCIAL CONDITION AND RESULTS OF OPERATIONS.
In addition to historical information, this quarterly report on Form 10-Q contains forward-looking statements within the meaning of Section 27A of the Securities Act of 1933 and Section 21E of the Securities Exchange Act of 1934. These statements include, among other things, our expectations regarding the anticipated impact of our new products and product enhancements will have on doctor utilization and our market share, our expectations regarding product mix and product adoption, our expectations regarding the existence and impact of seasonality, our expectations regarding the sales growth of our intra-oral scanner sales in international markets, our expectations regarding the financial and strategic benefits of establishing regional order acquisition, treatment planning and manufacturing facilities, as well as the anticipated timing of such facilities being operational, our expectations regarding the continued expansion of our international markets, our intention to open additional Invisalign stores, impact of the U.S. Tax Cuts and Jobs Act, the level of our operating expenses and gross margins and other factors beyond our control, as well as other statements regarding our future operations, financial condition and prospects and business strategies. These statements may contain words such as “expects,” “anticipates,” “intends,” “plans,” “believes,” “estimates,” or other words indicating future results. These forward-looking statements are subject to certain risks and uncertainties that could cause actual results to differ materially from those reflected in the forward-looking statements. Factors that could cause or contribute to such differences include, but are not limited to, those discussed in Item 2 “Management’s Discussion and Analysis of Financial Condition and Results of Operations,” and in particular, the risks discussed below in Part 2, Item 1A “Risk Factors.” We undertake no obligation to revise or update these forward-looking statements. Given these risks and uncertainties, readers are cautioned not to place undue reliance on such forward-looking statements.
The following discussion and analysis of our financial condition and results of operations should be read together with our condensed consolidated financial statements and related notes included elsewhere in this Quarterly Report on Form 10-Q and with our audited consolidated financial statements included in our Annual Report on Form 10-K for the year ended December 31, 2017, as filed with the Securities and Exchange Commission.
Overview
Our goal is to establish Invisalign clear aligners as the standard method for treating malocclusion and to establish the iTero intraoral scanner as the preferred scanning device for 3D digital scans, ultimately driving increased product adoption by dental professionals. We intend to achieve this by continued focus and execution of our strategic growth drivers set forth in the
Business Strategy
section in our Annual Report on Form 10-K.
The successful execution of our business strategy in 2018 and beyond may be affected by a number of other factors including:
|
•
|
New Invisalign Product Portfolio and Pricing
. In July 2018, we launched a new expanded Invisalign product portfolio which includes new options and greater flexibility to treat a broader range of patients. The new Invisalign product portfolio offers doctors more choices by extending desirable features across the entire portfolio and creating new Invisalign treatment packages, as well as new options to treat young patients with early mixed dentition (with a mixture of primary/baby and permanent teeth). The new end-to-end Invisalign product portfolio will include clear aligner product offerings for almost every patient age group and case complexity to make it easier for our doctors to tailor treatment planning to the needs of each patient. Pricing and availability for the new Invisalign product offerings and the associated terms and conditions will vary by region.
|
|
•
|
New Invisalign Products and Feature Enhancements
. Product innovation drives greater treatment predictability, clinical applicability and ease of use for our customers which supports adoption of Invisalign treatment in their practices. Our focus is to develop solutions and features to treat a wide range of cases from simple to complex.
|
|
◦
|
In March 2017, we announced Invisalign Teen with mandibular advancement, the first clear aligner solution for Class II correction in growing tween and teen patients. This offering combines the benefits of the most advanced clear aligner system in the world with features for moving the lower jaw forward while simultaneously aligning the teeth. Invisalign Teen with mandibular advancement is available in Canada and in select Europe, Middle East and Africa (“EMEA”), Asia Pacific (“APAC”) and Latin America (“LATAM”) countries. Invisalign Teen with mandibular advancement is pending 510(k) clearance and is not yet available in the United States (“U.S.”).
|
|
◦
|
Beginning July 2018, Invisalign First clear aligners are commercially available to Invisalign-trained doctors in the U.S., Canada, Australia, New Zealand, Japan, and the EMEA region. Invisalign First clear aligners, a treatment option designed with features specifically for younger patients with early mixed dentition. Phase 1 treatment is early interceptive orthodontic treatment for young patients, traditionally done through arch expanders, or partial
|
27
metal braces, before all permanent teeth have erupted, typically at ages 6 through 10 years. Invisalign First clear aligners are designed specifically to address a broad range of younger patients’ malocclusions, including shorter clinical crowns, management of erupting dentition, and predictable dental arch expansion.
|
◦
|
In April 2018, we announced a new Invisalign Go product with more user-friendly iTero digital chairside experience and greater flexibility to treat a wider range of mild to moderate cases, such as crowded or gap teeth that require teeth straightening prior to restorative treatments. Invisalign Go also incorporates new data-driven clinical protocols for predictable tooth movement and automated case assessments that leverages our Invisalign patients treated to date. These improvements make it easier for dentists to tailor their treatment plans to the individual needs of each patient.
|
We believe that over the long-term, clinical solutions and treatment tools will increase adoption of Invisalign and increase sales of our intraoral scanners; however, it is difficult to predict the rate of adoption which may vary by region and channel.
|
•
|
New iTero Products and Technology Innovation.
The iTero scanner is an important component to customer experience and is central to a digital approach as well as overall customer utilization of Invisalign.
|
|
◦
|
In April 2018, we expanded the iTero Element portfolio with the launch of the iTero Element 2 and the iTero Element Flex scanners. These additions build on the existing high precision, full-color imaging and fast scan times of the iTero Element portfolio while streamlining orthodontic and restorative workflows. The next-generation iTero Element 2 is designed for greater performance with 2X faster start-up and 25% faster scan processing time compared to the iTero Element. The new iTero Element Flex wand-only configuration is a portable scanner for easy transport from office to office. iTero Element 2 and iTero Element Flex scanners are available in Canada, the U.S., the majority of European countries, including France, Germany, Italy, Spain, and the United Kingdom as well as select APAC markets. The existing iTero Element scanner will continue to be available in all markets.
|
|
◦
|
On April 25, 2018, we announced that we received market approval for the iTero Element intra-oral scanner from the China Food and Drug Administration, and we began offering this scanner in China. The iTero Element scanner launch in China not only supports growth of our base Invisalign clear aligner business but also represents a major milestone for digital dentistry in China. As we continue to expand the markets into which we sell our intra-oral scanners, we expect continued growth for the foreseeable future due to the size of the market opportunity and our relatively low market penetration of these regions.
|
The use of iTero and other digital scanners for Invisalign case submission in place of PVS impressions continues to grow and remains a positive catalyst for Invisalign utilization. For the second quarter of 2018, total Invisalign cases submitted with a digital scanner in the Americas increased to 69.3%, up from 67.3% in the first quarter of 2018. International scans increased to 47.3%, up from 43.2% in the first quarter of 2018. While we believe that over the long-term, technology innovation and added features and functionality of our iTero scanners will increase adoption of Invisalign and increase sales of our intraoral scanners; it is, however, difficult to predict the rate of adoption which may vary by region and channel.
28
|
•
|
Invisalign Adoption.
Our goal is to establish Invisalign as the treatment of choice for treating malocclusion ultimately driving increased product adoption and frequency of use by dental professionals, also known as “utilization rates.” Our quarterly utilization rates for the last 9 quarters are as follows:
|
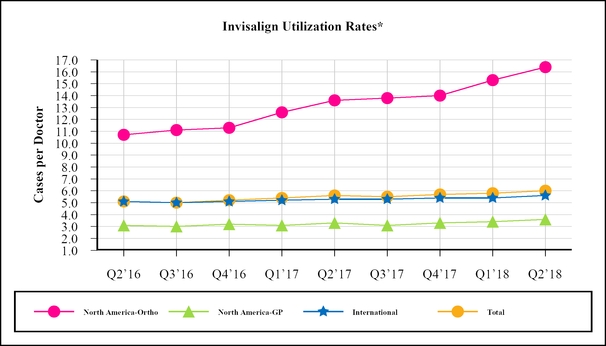
*
Invisalign utilization rates = # of cases shipped divided by # of doctors cases were shipped to. Beginning in the first quarter of 2018, we report International region to include EMEA and APAC. LATAM is excluded from above chart as it is not material. Our historical utilization numbers have been recasted to reflect this new classification.
|
◦
|
Total utilization in the second quarter of 2018 increased to 6.0 cases per doctor compared to 5.6 in the second quarter of 2017.
|
|
▪
|
North America:
Utilization among our North American orthodontist customers reached an all time high in the second quarter of 2018 at 16.4 cases per doctor. Compared to 13.6 cases per doctor utilized in the second quarter of 2017, the increase in North American orthodontist utilization in the second quarter of 2018 reflects improvements in product and technology which continues to strengthen our doctors’ clinical confidence such that they now utilize Invisalign more often and on more complex cases, including their teenage patients.
|
|
▪
|
International:
International doctor utilization was 5.6 cases per doctor in the second quarter of 2018 compared to 5.3 in the second quarter of 2017. The increase in International utilization reflects growth in both the EMEA and APAC regions due to increasing adoption of the product due in part to its ability to treat more complex cases.
|
We expect that over the long-term our utilization rates will gradually improve as a result of advancements in product and technology, which continue to strengthen our doctors’ clinical confidence in the use of Invisalign. In addition, since the teenage and younger market makes up 75% of the 12 million total orthodontic case starts each year, and as we continue to drive adoption of teenage and younger patients through sales and marketing programs, we expect our utilization rate to improve. Our utilization rates, however, may fluctuate from period to period due to a variety of factors, including seasonal trends in our business along with adoption rates of new products and features.
|
•
|
Number of New Invisalign Doctors Trained.
We continue to expand our Invisalign customer base through the training of new doctors. In 2017, Invisalign growth was driven primarily by increased utilization across all regions as well as by the continued expansion of our customer base as we trained a total of 16,500 new Invisalign doctors, of which 62% were trained in the International region. During the six months ended June 30, 2018, we trained 9,345 new Invisalign doctors of which 3,400 were trained in the Americas region and 5,945 in the International region.
|
|
•
|
International Invisalign Growth.
We continue to focus our efforts towards increasing Invisalign clear aligner adoption by dental professionals in our direct EMEA and APAC markets. On a year-over-year basis, our International Invisalign
|
29
volume increased 45.4% driven primarily by increased adoption as well as expansion of our customer base in both EMEA and APAC regions. We continue to see growth from our international orthodontists and general practitioner (“GP”) customers and are seeing more positive traction in the GP channel from segmenting our sales and marketing resources and programs specifically around each channel. In addition, we believe that continuous product introductions and feature improvements, such as Invisalign treatment with mandibular advancement, provide our customers with continued confidence in treating complex cases as well as teen-aged patients with Invisalign clear aligners. In 2018, we are continuing to expand in our existing markets through targeted investments in sales coverage and professional marketing and education programs, along with consumer marketing in selected country markets. We expect International revenues to continue to grow at a faster rate than the Americas for the foreseeable future due to our continued investment in international market expansion, the size of the market opportunity, and our relatively low market penetration of these regions (Refer to
Item 1A Risk Factors - “We are exposed to fluctuations in currency exchange rates, which could negatively affect our financial condition and results of operations.”
for information on related risk factors).
|
•
|
Establish Regional Order Acquisition, Treatment Planning and Manufacturing Operations.
We will continue to establish and expand additional order acquisition, treatment planning and manufacturing operations closer to our international customers in order to improve our operational efficiency and to provide doctors confidence in using Invisalign clear aligners to treat more patients and more often. In July 2018, we moved into new facilities in Costa Rica in order to support our expanding treatment planning as well as other support functions. In 2018, we expect to open a treatment planning facility in Madrid, Spain, a manufacturing facility in Ziyang, China as well as another new facility in Costa Rica to support treatment planning and administrative activities (Refer
to
Item 1A Risk Factors - “As we continue to grow, we are subject to growth related risks, including risks related to excess or constrained capacity at our existing facilities.”
for information on related risk factors).
|
|
•
|
Expenses.
We expect expenses to increase in fiscal year 2018 due in part to:
|
|
◦
|
Investments in international expansion in new country markets;
|
|
◦
|
Product and technology innovation to enhance product efficiency and operational productivity;
|
|
◦
|
Investments in manufacturing capacity and facilities to enhance our regional capabilities;
|
|
◦
|
Increases in legal expenses primarily related to the continued protection of our intellectual property rights, including our patents; and
|
|
◦
|
Increases in sales, marketing, advertising and customer support resources.
|
We believe that these investments will position us to increase our revenue and continue to grow our market share.
|
•
|
Stock Repurchases:
|
|
◦
|
April 2016 Repurchase Program.
In February 2018, we repurchased $100.0 million of our common stock on the open market. In July 2018, we repurchased $100.0 million of our common stock on the open market, completing the April 2016 Repurchase Program.
|
|
◦
|
May 2018 Repurchase Program.
In May 2018, we announced that our Board of Directors had authorized a plan to repurchase up to $600.0 million of our common stock. As of
June 30, 2018
, we have $600.0 million remaining under the May 2018 Repurchase Program (
Refer to Note 11 “Common Stock Repurchase Programs” of the Notes to Condensed Consolidated Financial Statements
for details on our stock repurchase programs).
|
|
•
|
U.S. Tax Cuts and Jobs Act.
The U.S. Tax Cuts and Jobs Act (the “TCJA”) was enacted into law on December 22, 2017 and impacted our effective tax rate. The TCJA made significant changes to the Internal Revenue Code, including, but not limited to, a corporate tax rate decrease from 35% to 21% effective for tax years beginning after December 31, 2017, the transition of U.S. international taxation from a worldwide tax system to a territorial system, and a one-time transition tax on the mandatory deemed repatriation of cumulative foreign earnings. We recorded a provisional one-time transition tax liability of $73.9 million in the fourth quarter of 2017 and an additional $0.5 million during the six months ended June 30, 2018. Additional work is necessary for a more detailed analysis of our historical foreign earnings as well as potential correlative adjustments. Any subsequent adjustment to these amounts will be recorded to provision from income taxes throughout the fiscal year of 2018 when the analysis is complete.
|
|
•
|
SmileDirectClub.
On April 5, 2018, SDC Financial LLC, SmileDirectClub LLC, and the Members of SDC Financial LLC other than Align (collectively, the "SDC Entities") initiated proceedings that seek, among other forms of relief, to preliminarily and permanently enjoin all activities related to the Invisalign store pilot project, require Align to close the
|
30
existing Invisalign stores, prohibit Align from opening any additional stores, and allow the SDC Entities to exercise a right to repurchase all of Align's SDC Financial LLC membership interests for a purchase price equal to the current capital account balance. On June 29, 2018, the Chancery Court for Davidson County, Tennessee, denied the SDC Entities’ request for a temporary injunction to prevent Align from opening additional Invisalign stores. Align continues to dispute the allegations that it has breached its obligations to the SDC Entities under applicable law and will oppose and vigorously defend itself at the arbitration proceedings currently scheduled for December 2018. This dispute does not impact Align’s existing supply agreement with SDC which remains in place through 2019 and includes a minimum volume commitment. We are currently unable to predict the outcome of this dispute and therefore cannot determine the likelihood of loss, if any, nor estimate a range of possible loss.
Results of Operations
Net Revenues by Reportable Segment
We group our operations into two reportable segments: Clear Aligner segment and Scanner segment.
|
•
|
Our Clear Aligner segment consists of Comprehensive Products, Non-Comprehensive Products and Non-Case revenues as defined below:
|
|
•
|
Comprehensive Products include our Invisalign Full, Teen and Assist products.
|
|
•
|
Non-Comprehensive Products include our Invisalign Express, Invisalign Lite, Invisalign i7 and Invisalign Go products in addition to revenues from the sale of aligners to SmileDirectClub (“SDC”) under our supply agreement.
|
|
•
|
Non-Case includes our Vivera retainers along with our training and ancillary products for treating malocclusion.
|
|
•
|
Our Scanner segment consists of intraoral scanning systems and additional services available with the intraoral scanners that provide digital alternatives to the traditional cast models. This segment includes our iTero scanner and OrthoCAD services.
|
Effective in the first quarter of 2018, Americas region includes North America and LATAM. International region includes EMEA and APAC. Historical data has been recasted to reflect the change.
Net revenues for our Clear Aligner and Scanner segments by region for the three and six months ended
June 30, 2018
and
2017
are as follows (in millions):
|
|
Three Months Ended
June 30, |
Six Months Ended
June 30, |
|||||||||||||||||||||||||||
|
Net Revenues
|
2018
|
2017
|
Net
Change
|
%
Change
|
2018
|
2017
|
Net
Change
|
%
Change
|
|||||||||||||||||||||
|
Clear Aligner revenues:
|
|||||||||||||||||||||||||||||
|
Americas
|
$
|
234.0
|
|
$
|
188.6
|
|
$
|
45.4
|
|
24.1
|
%
|
$
|
443.6
|
|
$
|
354.2
|
|
$
|
89.4
|
|
25.2
|
%
|
|||||||
|
International
|
173.0
|
|
111.8
|
|
61.1
|
|
54.7
|
%
|
324.7
|
|
210.7
|
|
114.0
|
|
54.1
|
%
|
|||||||||||||
|
Non-case
|
26.2
|
|
20.6
|
|
5.6
|
|
27.4
|
%
|
50.4
|
|
38.5
|
|
11.9
|
|
31.0
|
%
|
|||||||||||||
|
Total Clear Aligner net revenues
|
$
|
433.2
|
|
$
|
321.0
|
|
$
|
112.2
|
|
35.0
|
%
|
$
|
818.7
|
|
$
|
603.4
|
|
$
|
215.3
|
|
35.7
|
%
|
|||||||
|
Scanner net revenues
|
57.0
|
|
35.4
|
|
21.6
|
|
60.9
|
%
|
108.4
|
|
63.4
|
|
45.0
|
|
71.1
|
%
|
|||||||||||||
|
Total net revenues
|
$
|
490.3
|
|
$
|
356.5
|
|
$
|
133.8
|
|
37.5
|
%
|
$
|
927.2
|
|
$
|
666.8
|
|
$
|
260.4
|
|
39.0
|
%
|
|||||||
Changes and percentages are based on actual values. Certain tables may not sum or recalculate due to rounding.
31
Clear Aligner Case Volume by Region
Case volume data which represents Clear Aligner case shipments by region for the three and six months ended
June 30, 2018
and
2017
is as follows (in thousands):
|
|
Three Months Ended
June 30, |
Six Months Ended
June 30, |
|||||||||||||||||||||
|
Region
|
2018
|
2017
|
Net
Change
|
%
Change
|
2018
|
2017
|
Net
Change
|
%
Change
|
|||||||||||||||
|
Americas
|
198.0
|
|
156.6
|
|
41.4
|
|
26.4
|
%
|
374.5
|
|
294.3
|
|
80.2
|
|
27.3
|
%
|
|||||||
|
International
|
121.3
|
|
83.4
|
|
37.8
|
|
45.4
|
%
|
226.8
|
|
157.0
|
|
69.8
|
|
44.4
|
%
|
|||||||
|
Total case volume
|
319.2
|
|
240.0
|
|
79.2
|
|
33.0
|
%
|
601.3
|
|
451.3
|
|
150.0
|
|
33.2
|
%
|
|||||||
Changes and percentages are based on actual values. Certain tables may not sum or recalculate due to rounding.
For the three and six months ended
June 30, 2018
, total net revenues increased by
$133.8 million
and
$260.4 million
as compared to the same periods in
2017
primarily as a result of Clear Aligner case volume growth across all regions as well as increased non-case revenues.
Clear Aligner - Americas
For the three months ended
June 30, 2018
, Americas net revenues increased by
$45.4 million
as compared to the same period in 2017 primarily due to case volume growth across all channels and products which increased net revenues by $49.8 million. This increase was offset in part by lower average selling prices (“ASP”) which reduced net revenues by $4.4 million. The ASP decline was a result of higher promotional discounts and a shift in product mix primarily driven by increased SDC revenues, which carry a lower ASP, which collectively reduced revenue by $9.3 million. These factors were partially offset by increased secondary revenue and the impact from acquiring certain distributors as we now recognize direct sales at full ASP rather than the discounted ASP, which increased net revenue by $4.8 million, among other factors.
For the six months ended
June 30, 2018
, Americas net revenues increased by
$89.4 million
as compared to the same period in 2017 primarily due to case volume growth across all channels and products which increased net revenues by $96.6 million. This increase was offset in part by lower ASP which reduced net revenues by $7.2 million. The ASP decline was a result of higher promotional discounts and a shift in product mix primarily driven by increased SDC revenues which carry a lower ASP, which combined to reduce net revenue by $20.8 million. These factors were partially offset by price increases in our Comprehensive Products, which increased net revenue by $9.8 million, among other factors.
Clear Aligner - International
For the three months ended
June 30, 2018
, International net revenues increased by $
61.1 million
as compared to the same period in 2017 primarily driven by case volume growth across all channels and products which increased net revenues by $50.7 million. Additionally, higher ASP contributed $10.4 million to net revenues. This increase was primarily due to the favorable foreign exchange rates of $11.3 million and $4.9 million related to price increases on our Comprehensive Products effective July 2017, partially offset by increased additional aligner deferrals and higher promotional discounts, which collectively reduced net revenues by $7.0 million.
For the six months ended
June 30, 2018
, International net revenues increased by $
114.0 million
as compared to the same period in 2017 primarily driven by case volume growth across all channels and products which increased net revenues by $94.7 million. Additionally, higher ASP contributed $19.3 million to net revenues. This increase was primarily due to the favorable foreign exchange rates of $25.5 million and $9.5 million related to price increases on our Comprehensive Products effective July 2017, partially offset by increased aligner deferrals and higher promotional discounts, which collectively reduced net revenues by $16.3 million.
Clear Aligner - Non-Case
For the three and six months ended
June 30, 2018
, non-case net revenues, consisting of training fees and ancillary product revenues, increased by $
5.6 million
and $
11.9 million
, respectively, compared to the same periods in 2017 primarily due to increased Vivera volume and increased training revenue in both Americas and International.
32
Scanner
For the three months ended June 30, 2018, scanner and services net revenues increased by $21.6 million as compared to the same period in 2017. Scanner and services net revenues increased for the three months ended June 30, 2018 as compared to the same period in 2017 primarily due to an increase in the number of scanners recognized which increased revenue by $13.0 million. Additionally, higher computer-aided design/computer-aided manufacturing (“CAD/CAM”) services resulting from a larger installed base of scanners increased revenue by $4.8 million and an increase in scanner ASP contributed $2.1 million.
For the six months ended June 30, 2018, scanner and services net revenues increased by $45.0 million as compared to the same period in 2017. Scanner and services net revenues increased for the six months ended June 30, 2018 as compared to the same period in 2017 primarily due to an increase in the number of scanners recognized which increased revenue by $36.1 million. Additionally, higher CAD/CAM services resulting from a larger installed base of scanners and increased revenue from ancillary products collectively increased revenue $12.1 million, These factors were partially offset by a decrease in scanner ASP which reduced revenue by $3.2 million.
Cost of net revenues and gross profit (in millions):
|
|
Three Months Ended
June 30, |
Six Months Ended
June 30, |
|||||||||||||||||||||
|
|
2018
|
2017
|
Change
|
2018
|
2017
|
Change
|
|||||||||||||||||
|
Clear Aligner
|
|||||||||||||||||||||||
|
Cost of net revenues
|
$
|
101.6
|
|
$
|
70.2
|
|
$
|
31.4
|
|
$
|
190.2
|
|
$
|
132.7
|
|
$
|
57.5
|
|
|||||
|
% of net segment revenues
|
23.5
|
%
|
21.9
|
%
|
23.2
|
%
|
22.0
|
%
|
|||||||||||||||
|
Gross profit
|
$
|
331.6
|
|
$
|
250.8
|
|
$
|
80.8
|
|
$
|
628.6
|
|
$
|
470.8
|
|
$
|
157.8
|
|
|||||
|
Gross margin %
|
76.5
|
%
|
78.1
|
%
|
76.8
|
%
|
78.0
|
%
|
|||||||||||||||
|
Scanner
|
|||||||||||||||||||||||
|
Cost of net revenues
|
$
|
23.0
|
|
$
|
15.3
|
|
$
|
7.7
|
|
$
|
44.0
|
|
$
|
27.6
|
|
$
|
16.4
|
|
|||||
|
% of net segment revenues
|
40.4
|
%
|
43.3
|
%
|
40.6
|
%
|
43.6
|
%
|
|||||||||||||||
|
Gross profit
|
$
|
34.0
|
|
$
|
20.1
|
|
$
|
13.9
|
|
$
|
64.4
|
|
$
|
35.8
|
|
$
|
28.6
|
|
|||||
|
Gross margin %
|
59.6
|
%
|
56.7
|
%
|
59.4
|
%
|
56.4
|
%
|
|||||||||||||||
|
Total cost of net revenues
|
$
|
124.7
|
|
$
|
85.6
|
|
$
|
39.1
|
|
$
|
234.2
|
|
$
|
160.3
|
|
$
|
73.9
|
|
|||||
|
% of net revenues
|
25.4
|
%
|
24.0
|
%
|
25.3
|
%
|
24.0
|
%
|
|||||||||||||||
|
Gross profit
|
$
|
365.6
|
|
$
|
270.9
|
|
$
|
94.7
|
|
$
|
693.0
|
|
$
|
506.5
|
|
$
|
186.4
|
|
|||||
|
Gross margin %
|
74.6
|
%
|
76.0
|
%
|
74.7
|
%
|
76.0
|
%
|
|||||||||||||||
Changes and percentages are based on actual values. Certain tables may not sum or recalculate due to rounding.
Cost of net revenues for our Clear Aligner and Scanner segments includes personnel-related costs including payroll and stock-based compensation for staff involved in the production process, the cost of materials, packaging, shipping costs, depreciation on capital equipment and facilities used in the production process, amortization of acquired intangible assets and training costs.
Clear Aligner
For the three and six months ended
June 30, 2018
, gross margin percentage decreased as compared to the same periods in 2017 primarily due to higher manufacturing spend driven by operational expansion activities and an increase in aligners per case driven by additional aligners, offset in part by a higher ASP.
Scanner
For the three months ended
June 30, 2018
, gross margin increased compared to the same period in 2017 primarily driven by manufacturing efficiencies and higher ASP.
For the six months ended
June 30, 2018
, gross margin increased compared to the same period in 2017 primarily driven by manufacturing efficiencies offset in part by a lower ASP.
33
Selling, general and administrative (in millions):
|
|
Three Months Ended
June 30, |
Six Months Ended
June 30, |
|||||||||||||||||||||
|
|
2018
|
2017
|
Change
|
2018
|
2017
|
Change
|
|||||||||||||||||
|
Selling, general and administrative
|
$
|
212.1
|
|
$
|
163.0
|
|
$
|
49.1
|
|
$
|
411.7
|
|
$
|
314.1
|
|
$
|
97.6
|
|
|||||
|
% of net revenues
|
43.3
|
%
|
45.7
|
%
|
44.4
|
%
|
47.1
|
%
|
|||||||||||||||
Changes and percentages are based on actual values. Certain tables may not sum or recalculate due to rounding.
Selling, general and administrative expense includes personnel-related costs including payroll, commissions and stock-based compensation for our sales force, marketing and administration in addition to media and advertising expenses, clinical education, trade shows and industry events, product marketing, outside service costs, legal costs, equipment and maintenance costs, depreciation and amortization expense and allocations of corporate overhead expenses including facilities and Information Technology (“IT”).
For the three months ended
June 30, 2018
, selling, general and administrative expense increased compared to the same period in 2017 primarily due to higher compensation related costs of $24.1 million mainly as a result of increased headcount resulting in higher salaries expense, incentive bonuses and fringe benefits. We also incurred higher expenses from advertising and marketing of $8.1 million, equipment, software and maintenance costs of $7.7 million and $6.4 million of legal and outside service costs.
For the six months ended
June 30, 2018
, selling, general and administrative expense increased compared to the same period in 2017 primarily due to higher compensation related costs of $50.8 million mainly as a result of increased headcount resulting in higher salaries expense, incentive bonuses and fringe benefits. We also incurred higher expenses from advertising and marketing of $16.5 million and equipment, software and maintenance costs of $14.1 million.
Research and development (in millions):
|
|
Three Months Ended
June 30, |
Six Months Ended
June 30, |
|||||||||||||||||||||
|
|
2018
|
2017
|
Change
|
2018
|
2017
|
Change
|
|||||||||||||||||
|
Research and development
|
$
|
30.8
|
|
$
|
24.4
|
|
$
|
6.4
|
|
$
|
60.4
|
|
$
|
47.2
|
|
$
|
13.2
|
|
|||||
|
% of net revenues
|
6.3
|
%
|
6.8
|
%
|
6.5
|
%
|
7.1
|
%
|
|||||||||||||||
Changes and percentages are based on actual values. Certain tables may not sum or recalculate due to rounding.
Research and development expense includes the personnel-related costs including payroll and stock-based compensation and outside consulting expenses associated with the research and development of new products and enhancements to existing products and allocations of corporate overhead expenses including facilities and IT.
For the three and six months ended
June 30, 2018
, research and development expense increased compared to the same periods in
2017
primarily due to higher compensation costs as a result of increased headcount resulting in higher salaries expense, incentive bonuses and fringe benefits.
34
Income from operations (in millions):
|
|
Three Months Ended
June 30, |
Six Months Ended
June 30, |
|||||||||||||||||||||
|
|
2018
|
2017
|
Change
|
2018
|
2017
|
Change
|
|||||||||||||||||
|
Clear Aligner
|
|||||||||||||||||||||||
|
Income from operations
|
$
|
190.3
|
|
$
|
133.9
|
|
$
|
56.4
|
|
$
|
351.7
|
|
$
|
248.7
|
|
$
|
103.1
|
|
|||||
|
Operating margin %
|
43.9
|
%
|
41.7
|
%
|
43.0
|
%
|
41.2
|
%
|
|||||||||||||||
|
Scanner
|
|||||||||||||||||||||||
|
Income from operations
|
$
|
17.7
|
|
$
|
8.8
|
|
$
|
8.9
|
|
$
|
33.8
|
|
$
|
14.8
|
|
$
|
19.0
|
|
|||||
|
Operating margin %
|
31.0
|
%
|
24.8
|
%
|
31.1
|
%
|
23.3
|
%
|
|||||||||||||||
|
Total income from operations
1
|
$
|
122.7
|
|
$
|
83.6
|
|
$
|
39.1
|
|
$
|
220.9
|
|
$
|
145.2
|
|
$
|
75.6
|
|
|||||
|
Operating margin %
|
25.0
|
%
|
23.4
|
%
|
23.8
|
%
|
21.8
|
%
|
|||||||||||||||
Changes and percentages are based on actual values. Certain tables may not sum or recalculate due to rounding.
1
Refer to Note 14 “Segments and Geographical Information” of the Notes to Condensed Consolidated Financial Statements
for details on unallocated corporate expenses and the reconciliation to Consolidated Income from Operations.
Clear Aligner
For the three months ended
June 30, 2018
, operating margin percentage increased compared to the same period in 2017 as we leveraged our operating expenses on higher Clear Aligner revenues and, to a lesser extent, higher ASP. This was partially offset by higher manufacturing spend driven by operational expansion activities and an increase in aligners per case driven by additional aligners.
For the six months ended
June 30, 2018
, operating margin percentage increased compared to the same period in 2017 as we leveraged our operating expenses on higher Clear Aligner revenues and, to a lesser extent, higher ASP. This was partially offset by operational expansion activities.
Scanner
For the three months ended
June 30, 2018
, operating margin percentage increased compared to the same period in 2017 as we leveraged our operating expenses on higher Scanner revenues and higher ASP in addition to manufacturing efficiencies.
For the six months ended
June 30, 2018
, operating margin percentage increased compared to the same period in 2017 as we leveraged our operating expenses on higher Scanner revenues and manufacturing efficiencies partially offset by a lower ASP.
Interest income (in millions):
|
|
Three Months Ended
June 30, |
Six Months Ended
June 30, |
|||||||||||||||||||||
|
|
2018
|
2017
|
Change
|
2018
|
2017
|
Change
|
|||||||||||||||||
|
Interest income
|
$
|
1.9
|
|
$
|
1.4
|
|
$
|
0.5
|
|
$
|
4.1
|
|
$
|
2.6
|
|
$
|
1.5
|
|
|||||
Changes and percentages are based on actual values. Certain tables may not sum or recalculate due to rounding.
Interest includes interest income earned on cash, cash equivalents and investment balances.
For the three and six months ended
June 30, 2018
, interest increased compared to the same periods in 2017 is mainly due to higher interest rates.
35
Other income (expense), net (in millions):
|
|
Three Months Ended
June 30, |
Six Months Ended
June 30, |
|||||||||||||||||||||
|
|
2018
|
2017
|
Change
|
2018
|
2017
|
Change
|
|||||||||||||||||
|
Other income (expense), net
|
$
|
(7.1
|
)
|
$
|
1.8
|
|
$
|
(8.9
|
)
|
$
|
(6.9
|
)
|
$
|
2.2
|
|
$
|
(9.1
|
)
|
|||||
Changes and percentages are based on actual values. Certain tables may not sum or recalculate due to rounding.
Other income (expense), net, includes foreign exchange gains and losses, gains and losses on foreign currency forward contracts, interest expense and other miscellaneous charges.
For the three and six months ended
June 30, 2018
, other income (expense), net decreased compared to the same periods in 2017 mainly due to foreign exchange losses partially offset by gains on foreign currency forward contracts.
Equity in losses of investee, net of tax (in millions):
|
|
Three Months Ended
June 30, |
Six Months Ended
June 30, |
|||||||||||||||||||||
|
|
2018
|
2017
|
Change
|
2018
|
2017
|
Change
|
|||||||||||||||||
|
Equity in losses of investee, net of tax
|
$
|
3.7
|
|
$
|
2.2
|
|
$
|
1.5
|
|
$
|
5.5
|
|
$
|
3.3
|
|
$
|
2.1
|
|
|||||
Changes and percentages are based on actual values. Certain tables may not sum or recalculate due to rounding.
For the three and six months ended
June 30, 2018
, equity in losses of investee, net of tax increased compared to the same periods in 2017 due to higher losses attributable from our equity method investments including a higher proportional share of the losses due to our additional investment made in the third quarter of 2017 (
Refer to Note 4 “Equity Method Investments” of the Notes to Condensed Consolidated Financial Statements
for details on equity method investments).
Provision for income taxes (in millions):
|
|
Three Months Ended
June 30, |
Six Months Ended
June 30, |
|||||||||||||||||||||
|
|
2018
|
2017
|
Change
|
2018
|
2017
|
Change
|
|||||||||||||||||
|
Provision for income taxes
|
$
|
7.7
|
|
$
|
15.4
|
|
$
|
(7.7
|
)
|
$
|
10.6
|
|
$
|
8.2
|
|
$
|
2.4
|
|
|||||
|
Effective tax rates
|
6.6
|
%
|
17.7
|
%
|
4.9
|
%
|
5.4
|
%
|
|||||||||||||||
Changes and percentages are based on actual values. Certain tables may not sum or recalculate due to rounding.
For the three months ended
June 30, 2018
and 2017, provision for income taxes was $
7.7 million
and $
15.4 million
, respectively, representing effective tax rates of
6.6%
and
17.7%
, respectively. For the six months ended
June 30, 2018
and 2017, provision for income taxes was $
10.6 million
and $
8.2 million
, respectively, representing effective tax rates of
4.9%
and
5.4%
, respectively. As a result of the enactment of the TCJA, the U.S. federal statutory tax rate decreased from 35% to 21% effective January 1, 2018. The decrease in effective tax rate for both the three and six months ended
June 30, 2018
compared to the same periods in 2017 is primarily attributable to the decrease in the corporate tax rate from 35% to 21% pursuant to the enactment of the TCJA, offset in part by reduced benefits from foreign earnings being taxed at a lower tax rate, and the increase in excess tax benefits related to stock-based compensation. For the three and six months ended
June 30, 2018
, we recognized excess tax benefits of $16.6 million and $39.9 million, respectively, in our provision for income taxes.
In June 2017, the Costa Rica Ministry of Foreign Trade, an agency of the Government of Costa Rica, granted an extension of certain income tax incentives for an additional twelve year period. Under these incentives, all of the income in Costa Rica is subject to a reduced tax rate. In order to receive the benefit of these incentives, we must hire specified numbers of employees and maintain certain minimum levels of fixed asset investment in Costa Rica. If we do not fulfill these conditions for any reason, our incentive could lapse, and our income in Costa Rica would be subject to taxation at higher rates which could have a negative impact on our operating results. The Costa Rica corporate income tax rate that would apply, absent the incentives, is 30% for 2018 and 2017. For the three and six months ended June 30, 2018, the reduction in income taxes due to the reduced tax rate was minimal. (
Refer to Note 12 "Accounting for Income Taxes" of the Notes to Condensed Consolidated Financial Statements
for details on income taxes).
36
Liquidity and Capital Resources
We fund our operations from product sales. As of
June 30, 2018
and December 31, 2017, we had the following cash and cash equivalents, and short-term and long-term marketable securities (in thousands):
|
June 30,
|
December 31,
|
|||||||
|
2018
|
2017
|
|||||||
|
Cash and cash equivalents
|
$
|
547,993
|
|
$
|
449,511
|
|
||
|
Marketable securities, short-term
|
164,629
|
|
272,031
|
|
||||
|
Marketable securities, long-term
|
8,061
|
|
39,948
|
|
||||
|
Total
|
$
|
720,683
|
|
$
|
761,490
|
|
||
As of
June 30, 2018
, we had
$720.7 million
in cash, cash equivalents and short-term and long-term marketable securities. Cash equivalents and marketable securities are comprised of money market funds and highly liquid debt instruments which primarily include commercial paper, corporate bonds, U.S. government agency bonds, U.S. government treasury bonds and certificates of deposit.
As of
June 30, 2018
, approximately $382.6 million of cash, cash equivalents and short-term and long-term marketable securities was held by our foreign subsidiaries. The TCJA enacted into law on December 22, 2017 included a one-time transition tax on the mandatory deemed repatriation of foreign earnings. Under this provision, we recorded a provisional amount of liability for this deemed repatriation of $73.9 million in the fourth quarter of 2017 and an additional $0.5 million during the six months ended June 30, 2018, which will be paid over the next eight years. We repatriated $200.0 million to the U.S. during the six months ended June 30, 2018 and we may further repatriate funds in the future to invest in market expansion opportunities, provide additional working capital, and have greater flexibility to fund our stock repurchase programs (
Refer to Note 12 "Accounting for Income Taxes" of the Notes to Condensed Consolidated Financial Statements
for details).
Cash flows
(in thousands):
|
|
Six Months Ended
June 30, |
|||||||
|
|
2018
|
2017
|
||||||
|
Net cash flow provided by (used in):
|
||||||||
|
Operating activities
|
$
|
217,121
|
|
$
|
158,088
|
|
||
|
Investing activities
|
54,003
|
|
(111,718
|
)
|
||||
|
Financing activities
|
(170,745
|
)
|
(84,240
|
)
|
||||
|
Effect of exchange rate changes on cash, cash equivalents, and restricted cash
|
(1,923
|
)
|
3,640
|
|
||||
|
Net increase (decrease) in cash, cash equivalents, and restricted cash
|
$
|
98,456
|
|
$
|
(34,230
|
)
|
||
Operating Activities
For the six months ended
June 30, 2018
, cash flows from operations of
$217.1 million
resulted primarily from our net income of approximately $202.0 million as well as the following:
Significant non-cash activities
|
•
|
Stock-based compensation was
$32.7 million
related to equity incentive compensation granted to employees and directors;
|
|
•
|
Depreciation and amortization of
$24.1 million
related to our property, plant and equipment and intangible assets; and
|
|
•
|
Equity in losses of investee of $5.5 million.
|
Significant changes in working capital
|
•
|
Increase of
$55.0 million
in deferred revenues corresponding to the increase in case shipments;
|
|
•
|
Decrease of
$53.4 million
in accrued and other long-term liabilities due to timing of payments and activities; and
|
|
•
|
Increase of
$44.3 million
in accounts receivable which is primarily a result of the increase in net revenues.
|
37
Investing Activities
Net cash provided by investing activities was
$54.0 million
for the six months ended
June 30, 2018
primarily consisted of maturities and sales of marketable securities of
$217.0 million
and loan repayment from equity investee of
$30.0 million
. These inflows were partially offset by property and plant and equipment purchases of
$115.3 million
and purchases of marketable securities of
$78.4 million
.
For the remainder of 2018, we expect to invest an additional $100.0 million to $120.0 million in capital expenditures primarily related to additional manufacturing capacity to support our international expansion. Although we believe our current investment portfolio has little risk of impairment, we cannot predict future market conditions or market liquidity and can provide no assurance that our investment portfolio will remain unimpaired
Financing Activities
Net cash used in financing activities was
$170.7 million
for the six months ended
June 30, 2018
primarily resulting from common stock repurchases of
$100.0 million
and payroll taxes paid for vesting of restricted stock units through share withholdings of
$79.3 million
. These outflows were offset in part by
$8.6 million
from proceeds from the issuance of common stock.
Common Stock Repurchases
In February 2018, we repurchased on the open market approximately 0.4 million shares of our common stock at an average price of $252.24 per share, including commissions, for an aggregate purchase price of approximately $100.0 million. As of
June 30, 2018
, we had $600.0 million remaining under the May 2018 Repurchase Program (
Refer to Note 11 “Common Stock Repurchase Programs” of the Notes to Condensed Consolidated Financial Statements
for details on our stock repurchase programs). In July 2018, we repurchased on the open market approximately 0.3 million shares of our common stock at an average price of $350.08 per share, including commissions, for an aggregate purchase price of approximately $100.0 million, completing the April 2016 Repurchase Program.
Contractual Obligations
Our contractual obligations have not significantly changed since December 31, 2017 as disclosed in our Annual Report on Form 10-K, other than obligations described in the Form 10-Q herein. We believe that our current cash, cash equivalents and short-term marketable securities combined with our existing borrowing capacity will be sufficient to fund our operations for at least the next 12 months. If we are unable to generate adequate operating cash flows and need more funds beyond our available liquid investments and those available under our credit facility, we may need to suspend our stock repurchase programs or seek additional sources of capital through equity or debt financing, collaborative or other arrangements with other companies, bank financing and other sources in order to realize our objectives and to continue our operations. There can be no assurance that we will be able to obtain additional debt or equity financing on terms acceptable to us, or at all. If adequate funds are not available, we may need to make business decisions that could adversely affect our operating results such as modifications to our pricing policy, business structure or operations. Accordingly, the failure to obtain sufficient funds on acceptable terms when needed could have a material adverse effect on our business, results of operations and financial condition.
Off-Balance Sheet Arrangements
As of
June 30, 2018
, we had no off-balance sheet arrangements that have, or are reasonably likely to have, a current or future material effect on our consolidated financial condition, results of operations, liquidity, capital expenditures or capital resources other than certain items disclosed in Note 9 “Commitments and Contingencies” of the Notes to Consolidated Financial Statements included in our Annual Report on Form 10-K.
Critical Accounting Policies and Estimates
Management’s discussion and analysis of our financial condition and results of operations is based upon our Condensed Consolidated Financial Statements, which have been prepared in accordance with accounting principles generally accepted in the United States of America. The preparation of condensed consolidated financial statements requires management to make estimates and judgments that affect the reported amounts of assets and liabilities, revenues and expenses and disclosures at the date of the financial statements. We evaluate our estimates on an on-going basis, including those related to revenue recognition, stock-based compensation, goodwill and finite-lived assets and related impairment, and income taxes. We use authoritative pronouncements, historical experience and other assumptions as the basis for making estimates. Actual results could differ from those estimates.
38
Other than the adoption of the new revenue recognition accounting standard (“ASC 606”) on January 1, 2018 and updates on investments in privately held companies policy, there have been no material changes to our critical accounting policies and estimates from the information provided in the “Critical Accounting Policies and Estimates” section of our Management’s Discussion and Analysis of Financial Condition and Results of Operations included in our Annual Report on Form 10-K for the year ended December 31, 2017. Significant changes to the Revenue Recognition policy and Investments in Privately Held Companies policy are discussed in Note 1 “Summary of Significant Accounting Policies” of the Notes to Condensed Consolidated Financial Statements.
Recent Accounting Pronouncements
See Note 1 “Summary of Significant Accounting Policies” of the Notes to Condensed Consolidated Financial Statements for a discussion of recent accounting pronouncements.
ITEM 3.
QUANTITATIVE AND QUALITATIVE DISCLOSURES ABOUT MARKET RISK
In the normal course of business, we are exposed to foreign currency exchange rate and interest rate risks that could impact our financial position and results of operations.
Interest Rate Risk
Changes in interest rates could impact our anticipated interest income on our cash equivalents and investments in marketable securities. Our cash equivalents and investments are fixed-rate short-term and long-term securities. Fixed-rate securities may have their fair market value adversely impacted due to a rise in interest rates, and, as a result, our future investment income may fall short of expectations due to changes in interest rates or we may suffer losses in principal if forced to sell securities which have declined in market value due to changes in interest rates. As of
June 30, 2018
, we had approximately $172.7 million invested in available-for-sale marketable securities. An immediate 10% change in interest rates would not have a material adverse impact on our future operating results and cash flows.
We do not enter into investments for trading or speculative purposes and have not used any derivative financial instruments to manage our interest rate risk exposure. We do not have interest bearing liabilities as of
June 30, 2018
, and, therefore, we are not subject to risks from immediate interest rate increases.
Currency Rate Risk
As a result of our international business activities, our financial results could be affected by factors such as changes in foreign currency exchange rates or economic conditions in foreign markets, and there is no assurance that exchange rate fluctuations will not harm our business in the future. We generally sell our products in the local currency of the respective countries. This provides some natural hedging because most of the subsidiaries’ operating expenses are generally denominated in their local currencies as discussed further below. Regardless of this natural hedging, our results of operations may be adversely impacted by exchange rate fluctuations.
In March 2018, we started entering into foreign currency forward contracts to minimize the short-term impact of foreign currency exchange rate fluctuations on cash and certain trade and intercompany receivables and payables. These forward contracts are not designated as hedging instruments and do not subject us to material balance sheet risk due to fluctuations in foreign currency exchange rates. The gains and losses on these forward contracts are intended to offset the gains and losses in the underlying foreign currency denominated monetary assets and liabilities being economically hedged. These instruments are marked to market through earnings every period and generally are one month in original maturity. We do not enter into foreign currency forward contracts for trading or speculative purposes. As our international operations grow, we will continue to reassess our approach to managing the risks relating to fluctuations in currency rates. It is difficult to predict the impact forward contracts could have on our results of operations. The fair value of foreign exchange forward contracts outstanding as of
June 30, 2018
was not material.
Although we will continue to monitor our exposure to currency fluctuations, and, where appropriate, may use forward contracts to minimize the effect of these fluctuations, the impact of an aggregate change of 10% in foreign currency exchange rates relative to the U.S. dollar on our results of operations and financial position could be material.
39
ITEM 4.
CONTROLS AND PROCEDURES
Evaluation of disclosure controls and procedures.
Under the supervision and with the participation of our management, including our Chief Executive Officer and our Chief Financial Officer, we have evaluated the effectiveness of the design and operation of our disclosure controls and procedures (as defined in Rules 13a-15(e) and 15d-15(e) under the Exchange Act) as of the end of the period covered by this Quarterly Report on Form 10-Q. Based upon that evaluation, our Chief Executive Officer and our Chief Financial Officer have concluded that our disclosure controls and procedures are effective as of
June 30, 2018
, to provide reasonable assurance that information required to be disclosed by us in the reports that we file or submit under the Exchange Act is accumulated and communicated to our management, including our Chief Executive Officer and our Chief Financial Officer, as appropriate, to allow timely decisions regarding required disclosure, and that such information is recorded, processed, summarized and reported within the time periods specified in the Securities and Exchange Commission rules and forms.
Changes in internal control over financial reporting.
There were no changes in our internal control over financial reporting during the quarter ended June 30, 2018 that have materially affected, or are reasonably likely to materially affect, our internal control over financial reporting.
40
Patent Infringement Lawsuit
On November 14, 2017, Align filed six patent infringement lawsuits asserting 26 patents against 3Shape A/S, a Danish corporation, and a related U.S. corporate entity, asserting that 3Shape’s Trios intraoral scanning system and Dental System software infringe Align patents. Align filed two Section 337 complaints with the U.S. International Trade Commission (“ITC”) alleging that 3Shape violates U.S. trade laws by selling for importation and importing its infringing Trios intraoral scanning system and Dental System software. Align’s ITC complaints seek cease and desist orders and exclusion orders prohibiting the importation of 3Shape’s Trios scanning system and Dental System software products into the U.S. Align also filed four separate complaints in the United States District Court for the District of Delaware alleging patent infringement by 3Shape’s Trios intraoral scanning system and Dental System software. All of these district court complaints seek monetary damages and injunctive relief against further infringement.
SDC Dispute
On April 5, 2018, SDC Financial LLC, SmileDirectClub LLC, and the Members of SDC Financial LLC other than Align (collectively, the "SDC Entities") initiated proceedings that seek, among other forms of relief, to preliminarily and permanently enjoin all activities related to the Invisalign store pilot project, require Align to close the existing Invisalign stores, prohibit Align from opening any additional stores, and allow the SDC Entities to exercise a right to repurchase all of Align's SDC Financial LLC membership interests for a purchase price equal to the current capital account balance. On June 29, 2018, the Chancery Court for Davidson County, Tennessee, denied the SDC Entities’ request for a temporary injunction to prevent Align from opening additional Invisalign stores. Align continues to dispute the allegations that it has breached its obligations to the SDC Entities under applicable law and will oppose and vigorously defend itself at the arbitration proceedings currently scheduled for December 2018. This dispute does not impact Align’s existing supply agreement with SDC which remains in place through 2019 and includes a minimum volume commitment. We are currently unable to predict the outcome of this dispute and therefore cannot determine the likelihood of loss, if any, nor estimate a range of possible loss.
In the course of Align’s operations, Align is involved in a variety of claims, suits, investigations, and proceedings, including actions with respect to intellectual property claims, patent infringement claims, government investigations, labor and employment claims, breach of contract claims, tax, and other matters. Regardless of the outcome, these proceedings can have an adverse impact on us because of defense costs, diversion of management resources, and other factors. Although the results of complex legal proceedings are difficult to predict and Align’s view of these matters may change in the future as litigation and events related thereto unfold; Align currently does not believe that these matters, individually or in the aggregate, will materially affect Align’s financial position, results of operations or cash flows (
Refer to Note 8 “Legal Proceedings” of the Notes to the Condensed Consolidated Financial Statement
s for details on legal proceedings).
41
ITEM 1A.
RISK FACTORS
We depend on the sale of the Invisalign System for the vast majority of our net revenues, and any decline in sales of Invisalign treatment for any reason, or a decline in average selling prices would adversely affect net revenues, gross margin and net income.
We expect that net revenues from the sale of the Invisalign System, primarily Invisalign Full and Invisalign Teen, will continue to account for the vast majority of our total net revenues for the foreseeable future. Continued and widespread market acceptance of Invisalign by orthodontists, GPs and consumers is critical to our future success. If orthodontists and GPs experience a reduction in consumer demand for orthodontic services, if consumers prove unwilling to adopt Invisalign as rapidly as we anticipate or in the volume that we anticipate, if orthodontists or GPs choose to use a competitive product rather than Invisalign or if the average selling price of our product declines for any reason, including as a result of a shift in product mix towards lower priced products, our operating results would be harmed.
Competition in the markets for our products is intense and we expect aggressive competition from existing competitors and other companies that may introduce new technologies in the future.
Currently, our products compete directly against products manufactured and distributed by various companies, both within and outside the U.S. In addition, as a result of the expiration of certain key patents owned by us, which began in 2017, competitors such as Danaher Corporation, Dentsply Sirona Inc., Straumann AG, 3M, 3Shape, Henry Schein, Great Lakes and Angel Align as well as new entrants into the clear aligner market such as start-ups began offering an orthodontic system more similar to ours. Several of these competitors will likely have greater resources as well as the ability to leverage their existing channels in the dental market to compete directly with us, and, therefore, our share of the clear aligner market could decline which would likely have a material adverse effect on our business, results of operation and financial condition. In addition, corresponding foreign patents started to expire in 2018 which will likely result in increased competition in some of the markets outside the U.S. Large consumer product companies may also enter the orthodontic supply market. Furthermore, we also face competition from companies that now offer clear aligner therapy directly to the consumer eliminating the need for the consumer to visit a dental office. In addition, we may also face competition in the future from new companies that may introduce new technologies. We may be unable to compete with these competitors and one or more of these competitors may render our technology obsolete or economically unattractive. If we are unable to compete effectively with existing products or respond effectively to any products developed by new or existing competitors, our business could be harmed. Increased competition has resulted in the past and may in the future result in volume discounting and price reductions, reduced gross margins, reduced profitability and loss of market share, and reduce dental professionals’ efforts and commitment to expand their use of our products, any of which could have a material adverse effect on our net revenues, volume growth, net income and stock price. We cannot assure that we will be able to compete successfully against our current or future competitors or that competitive pressures will not have a material adverse effect on our business, results of operations and financial condition.
We are dependent on our international operations, which exposes us to foreign operational, political and other risks that may harm our business.
Our key production steps are performed in operations located outside of the U.S. In San Jose, Costa Rica, technicians use a sophisticated, internally developed computer-modeling program to prepare digital treatment plans, which are then transmitted electronically to Juarez, Mexico. These digital files form the basis of the ClinCheck treatment plan and are used to manufacture aligner molds. In June 2017 and May 2018, we opened new treatment planning facilities in Chengdu, China and Cologne, Germany, respectively, to support our customers within these regions. In July 2018, we moved into the new facilities in Costa Rica in order to support our expanding treatment planning as well as other support functions. In 2018, we expect to open a treatment planning facility in Madrid, Spain, a manufacturing facility in Ziyang, China as well as another new facility in Costa Rica to support treatment planning and administrative activities. Our order acquisition, aligner fabrication and shipping operations are conducted in Juarez, Mexico, and we also have order acquisition for the EMEA region in Amsterdam, the Netherlands. We will continue to establish additional order acquisition and treatment planning facilities closer to our international customers in order to improve our operational efficiency. In addition to the research and development efforts conducted in our North America facilities, we also carry out research and development in Moscow, Russia. We also have customer-care, accounts receivable, customer event registration and accounts payable organizations located in San Jose, Costa Rica. In addition, we have operations in Israel where we design and assemble wands, and our intraoral scanner is manufactured. Our reliance on international operations exposes us to risks and uncertainties that may affect our business or results of operation, including:
|
•
|
difficulties in hiring and retaining employees generally, as well as difficulties in hiring and retaining employees with the necessary skills to perform the more technical aspects of our operations;
|
42
|
•
|
difficulties in managing international operations, including any travel restrictions to or from our facilities;
|
|
•
|
fluctuations in currency exchange rates;
|
|
•
|
import and export controls, license requirements and restrictions;
|
|
•
|
controlling production volume and quality of the manufacturing process;
|
|
•
|
political, social and economic instability, including increased levels of violence in Juarez, Mexico or the Middle East. We cannot predict the effect on us of any future armed conflict, political instability or violence in these regions. In addition, some of our employees in Israel are obligated to perform annual reserve duty in the Israeli military and are subject to being called for additional active duty under emergency circumstances. We cannot predict the full impact of these conditions on us in the future, particularly if emergency circumstances or an escalation in the political situation occurs. If many of our employees are called for active duty, our operations in Israel and our business may not be able to function at full capacity;
|
|
•
|
acts of terrorism and acts of war;
|
|
•
|
general geopolitical instability and the responses to it, such as the possibility of additional sanctions against Russia which continue to bring uncertainty to this region;
|
|
•
|
interruptions and limitations in telecommunication services;
|
|
•
|
product or material transportation delays or disruption, including as a result of customs clearance, increased levels of violence, acts of terrorism, acts of war or health epidemics restricting travel to and from our international locations or as a result of natural disasters, such as earthquakes or volcanic eruptions;
|
|
•
|
burdens of complying with a wide variety of local country and regional laws, including the risks associated with the Foreign Corrupt Practices Act and local anti-bribery compliance;
|
|
•
|
trade restrictions and changes in tariffs; and
|
|
•
|
potential adverse tax consequences.
|
If any of these risks materialize in the future, we could experience production delays and lost or delayed revenue.
We earn an increasingly larger portion of our total revenues from international sales and face risks attendant to those operations.
We earn an increasingly larger portion of our total revenues from international sales generated through our foreign direct and indirect operations. Since our growth strategy depends in part on our ability to further penetrate markets outside the U.S. and increase the localization of our products and services, we expect to continue to increase our sales and presence outside the U.S., particularly in the high-growth markets. Our international operations are subject to risks that are customarily encountered in non-U.S. operations, including:
|
•
|
local political and economic instability;
|
|
•
|
the engagement of activities by our employees, contractors, partners and agents, especially in countries with developing economies, that are prohibited by international and local trade and labor laws and other laws prohibiting corrupt payments to government officials, including the Foreign Corrupt Practices Act, the United Kingdom (“UK”) Bribery Act of 2010 and export control laws, in spite of our policies and procedures designed to ensure compliance with these laws;
|
|
•
|
fluctuations in currency exchange rates; and
|
|
•
|
increased expense of developing, testing and making localized versions of our products.
|
Any of these factors, either individually or in combination, could materially impact our international operations and adversely affect our business as a whole.
43
We face risks related to our international sales, including the need to obtain necessary foreign regulatory clearance or approvals.
We currently sell our products outside of North America. As a result, we are subject to foreign regulatory requirements that vary widely from country to country. The time required to obtain clearances or approvals required by other countries may be longer than that required for FDA clearance or approval, and requirements for such approvals may differ from FDA requirements. We may be unable to obtain regulatory approvals in one or more of the other countries in which we do business or in which we may do business in the future. We may also incur significant costs in attempting to obtain and maintain foreign regulatory approvals. If we experience delays in receipt of approvals to market our products outside of the U.S., or if we fail to receive these approvals, we may be unable to market our products or enhancements in international markets in a timely manner, if at all, which could materially impact our international operations and adversely affect our business as a whole.
Demand for our products may not increase as rapidly as we anticipate due to a variety of factors including a weakness in general economic conditions.
Consumer spending habits are affected by, among other things, prevailing economic conditions, levels of employment, salaries and wage rates, gas prices, consumer confidence and consumer perception of economic conditions. A general slowdown in the U.S. economy and certain international economies or an uncertain economic outlook would adversely affect consumer spending habits which may, among other things, result in a decrease in the number of overall orthodontic case starts, reduced patient traffic in dentists’ offices, reduction in consumer spending on elective or higher value procedures or a reduction in the demand for dental services generally, each of which would have a material adverse effect on our sales and operating results. Weakness in the global economy results in a challenging environment for selling dental technologies and dentists may postpone investments in capital equipment, such as intraoral scanners. In addition, Invisalign treatment, which currently accounts for the vast majority of our net revenues, represents a significant change from traditional orthodontic treatment, and customers and consumers may be reluctant to accept it or may not find it preferable to traditional treatment. We have generally received positive feedback from orthodontists, GPs and consumers regarding Invisalign treatment as both an alternative to braces and as a clinical method for the treatment of malocclusion, but a number of dental professionals believe that the Invisalign treatment is appropriate for only a limited percentage of their patients. Increased market acceptance of all of our products will depend in part upon the recommendations of dental professionals, as well as other factors including effectiveness, safety, ease of use, reliability, aesthetics, and price compared to competing products.
Our future success may depend on our ability to develop, successfully introduce and achieve market acceptance of new products.
Our future success may depend on our ability to develop, manufacture, market and obtain regulatory approval or clearance of new products. There can be no assurance that we will be able to successfully develop, sell and achieve market acceptance of these and other new products and applications and enhanced versions of our existing product or software. The extent of, and rate at which, market acceptance and penetration are achieved by future products is a function of many variables, which include, among other things, our ability to:
|
•
|
correctly identify customer needs and preferences and predict future needs and preferences;
|
|
•
|
include functionality and features that address customer requirements;
|
|
•
|
ensure compatibility of our computer operating systems and hardware configurations with those of our customers;
|
|
•
|
allocate our research and development funding to products with higher growth prospects;
|
|
•
|
anticipate and respond to our competitors’ development of new products and technological innovations;
|
|
•
|
differentiate our offerings from our competitors’ offerings;
|
|
•
|
innovate and develop new technologies and applications;
|
|
•
|
the availability of third-party reimbursement of procedures using our products;
|
|
•
|
obtain adequate intellectual property rights; and
|
|
•
|
encourage customers to adopt new technologies.
|
If we fail to accurately predict customer needs and preferences or fail to produce viable technologies, we may invest heavily in research and development of products that do not lead to significant revenue. Even if we successfully innovate and develop
44
new products and produce enhancements, we may incur substantial costs in doing so and our profitability may suffer. In addition, even if our new products are successfully introduced, it is unlikely that they will rapidly gain market share and acceptance primarily due to the relatively long period of time it takes to successfully treat a patient with Invisalign. Since it typically takes approximately 12 to 24 months to treat a patient, our customers may be unwilling to rapidly adopt our new products until they successfully complete at least one case or until more historical clinical results are available.
Our ability to market and sell new products may also be subject to government regulation, including approval or clearance by the FDA and foreign government agencies. Any failure in our ability to successfully develop and introduce or achieve market acceptance of our new products or enhanced versions of existing products could have a material adverse effect on our operating results and could cause our net revenues to decline.
The frequency of use of the Invisalign System by orthodontists or GPs may not increase at the rate that we anticipate or at all.
One of our key objectives is to continue to increase utilization, or the adoption and frequency of use, of the Invisalign System by new and existing customers. If utilization of the Invisalign System by our existing and newly trained orthodontists or GPs does not occur or does not occur as quickly as we anticipate, our operating results could be harmed.
We may experience declines in average selling prices of our products which may decrease our net revenues.
We provide volume-based discount programs to our doctors. In addition, we sell a number of products at different list prices. If we change the volume-based discount programs affecting our average selling prices; if we introduce any price reductions or consumer rebate programs; if we expand our discount programs in the future or participation in these programs increases; or if our product mix shifts to lower priced products or to products that have a higher percentage of deferred revenue, our average selling prices would be adversely affected and our net revenues, gross profit, gross margin and net income may be reduced.
We are exposed to fluctuations in currency exchange rates, which could negatively affect our financial condition and results of operations.
Although the U.S. dollar is our reporting currency, a portion of our net revenues and net income are generated in foreign currencies. Net revenues and net income generated by subsidiaries operating outside of the U.S. are translated into U.S. dollars using exchange rates effective during the respective period and are affected by changes in exchange rates. As a result, negative movements in currency exchange rates against the U.S. dollar will adversely affect our net revenues and net income in our consolidated financial statements. The exchange rate between the U.S. dollar and foreign currencies has fluctuated substantially in recent years and may continue to fluctuate substantially in the future. As a result, we enter into currency forward contract transactions in an effort to cover some of our exposure to foreign currency exchange fluctuations. These transactions may not operate to fully or effectively hedge our exposure to currency fluctuations, and, under certain circumstances, these transactions could have an adverse effect on our financial condition.
As we continue to grow, we are subject to growth related risks, including risks related to excess or constrained capacity at our existing facilities.
We are subject to growth related risks, including excess or constrained capacity and pressure on our internal systems and personnel. In order to manage current operations and future growth effectively, we will need to continue to implement and improve our operational, financial and management information systems and to hire, train, motivate, manage and retain employees. We may be unable to manage such growth effectively. Any such failure could have a material adverse impact on our business, operations and prospects. We are establishing additional order acquisition, treatment planning and manufacturing facilities closer to our international customers in order to improve our operational efficiency and provide doctors with a better experience to further improve their confidence in using Invisalign to treat more patients, more often. Our ability to plan, construct and equip additional order acquisition, treatment planning and manufacturing facilities is subject to significant risk and uncertainty, including risks inherent in the establishment of a facility, such as hiring and retaining employees and delays and cost overruns as a result of a number of factors, any of which may be out of our control. If the transition into these additional facilities is significantly delayed or demand for our product exceeds our current expectations, we may not be able to fulfill orders timely, which may negatively impact our financial results and overall business. In addition, because we cannot immediately adapt our production capacity and related cost structures to changing market conditions, our facility capacity may at times exceed or fall short of our production requirements. In addition, if product demand decreases or we fail to forecast demand accurately, we could be required to write off inventory or record excess capacity charges, which would lower our gross margin. Production of our intraoral scanners may also be limited by capacity constraints due to a variety of factors, including our dependency on third party vendors for key components in addition to limited production yields. Any or all of these problems could result in the loss of customers, provide an opportunity for competing products to gain market acceptance and otherwise harm our business and financial results
.
45
If we fail to sustain or increase profitability or revenue growth in future periods, the market price for our common stock may decline.
If we are to sustain or increase profitability in future periods, we will need to continue to increase our net revenues, while controlling our expenses. Because our business is evolving, it is difficult to predict our future operating results or levels of growth, and we have not in the past and may not in the future be able to sustain our historical growth rates. If we do not increase profitability or revenue growth or otherwise meet the expectations of securities analysts or investors, the market price of our common stock will likely decline.
Our financial results have fluctuated in the past and may fluctuate in the future which may cause volatility in our stock price.
Our operating results have fluctuated in the past and we expect our future quarterly and annual operating results to fluctuate as we focus on increasing doctor and consumer demand for our products. These fluctuations could cause our stock price to decline or significantly fluctuate. Some of the factors that could cause our operating results to fluctuate include:
|
•
|
limited visibility into and difficulty predicting from quarter to quarter, the level of activity in our customers’ practices including limited visibility into the number of aligners purchased by SmileDirectClub, LLC (“SDC”) under the supply agreement;
|
|
•
|
weakness in consumer spending as a result of a slowdown in the global, U.S. or other economies;
|
|
•
|
changes in relationships with our distributors;
|
|
•
|
changes in the timing of receipt of Invisalign case product orders during a given quarter which, given our cycle time and the delay between case receipts and case shipments, could have an impact on which quarter revenue can be recognized;
|
|
•
|
fluctuations in currency exchange rates against the U.S. dollar;
|
|
•
|
changes in product mix;
|
|
•
|
our inability to scale production of our iTero Element scanner to meet customer demand;
|
|
•
|
if participation in our customer rebate or discount programs increases, our average selling price will be adversely affected;
|
|
•
|
seasonal fluctuations in the number of doctors in their offices and their availability to take appointments;
|
|
•
|
success of or changes to our marketing programs from quarter to quarter;
|
|
•
|
our reliance on our contract manufacturers for the production of sub-assemblies for our intraoral scanners;
|
|
•
|
timing of industry tradeshows;
|
|
•
|
changes in the timing of when revenue is recognized, including as a result of the introduction of new products or promotions, modifications to our terms and conditions or as a result of changes to critical accounting estimates or new accounting pronouncements;
|
|
•
|
changes to our effective tax rate;
|
|
•
|
unanticipated delays in production caused by insufficient capacity or availability of raw materials;
|
|
•
|
any disruptions in the manufacturing process, including unexpected turnover in the labor force or the introduction of new production processes, power outages or natural or other disasters beyond our control;
|
|
•
|
the development and marketing of directly competitive products by existing and new competitors;
|
|
•
|
disruptions to our business as a result of our agreement to manufacture clear aligners for SDC, including market acceptance of the SDC business model and product, possible adverse customer reaction and negative publicity about us and our products;
|
|
•
|
impairments in the value of our investments in SDC and other privately held companies could be material;
|
46
|
•
|
major changes in available technology or the preferences of customers may cause our current product offerings to become less competitive or obsolete;
|
|
•
|
aggressive price competition from competitors;
|
|
•
|
costs and expenditures in connection with litigation;
|
|
•
|
the timing of new product introductions by us and our competitors, as well as customer order deferrals in anticipation of enhancements or new products;
|
|
•
|
unanticipated delays in our receipt of patient records made through an intraoral scanner for any reason;
|
|
•
|
disruptions to our business due to political, economic or other social instability, including the impact of an epidemic any of which results in changes in consumer spending habits, consumers unable or unwilling to visit the orthodontist or general practitioners office, as well as any impact on workforce absenteeism;
|
|
•
|
inaccurate forecasting of net revenues, production and other operating costs,
|
|
•
|
investments in research and development to develop new products and enhancements;
|
|
•
|
changes in accounting standards, policies and estimates including changes made by our equity investee; and
|
|
•
|
our ability to successfully hedge against a portion of our foreign currency-denominated assets and liabilities.
|
To respond to these and other factors, we may need to make business decisions that could adversely affect our operating results such as modifications to our pricing policy, business structure or operations. Most of our expenses, such as employee compensation and lease payment obligations, are relatively fixed in the short term. Moreover, our expense levels are based, in part, on our expectations regarding future revenue levels. As a result, if our net revenues for a particular period fall below our expectations, whether caused by changes in consumer spending, consumer preferences, weakness in the U.S. or global economies, changes in customer behavior related to advertising and prescribing our product or other factors, we may be unable to adjust spending quickly enough to offset any shortfall in net revenues. Due to these and other factors, we believe that quarter-to-quarter comparisons of our operating results may not be meaningful. You should not rely on our results for any one quarter as an indication of our future performance.
A disruption in the operations of our primary freight carrier or higher shipping costs could cause a decline in our net revenues or a reduction in our earnings.
We are dependent on commercial freight carriers, primarily UPS, to deliver our products to our customers. If the operations of these carriers are disrupted for any reason, we may be unable to deliver our products to our customers on a timely basis. If we cannot deliver our products in an efficient and timely manner, our customers may reduce their orders from us and our net revenues and gross margin could materially decline. In a rising fuel cost environment, our freight costs will increase. If freight costs materially increase and we are unable to pass that increase along to our customers for any reason or otherwise offset such increases in our cost of net revenues, our gross margin and financial results could be adversely affected.
If we are unable to accurately predict our volume growth, and fail to hire a sufficient number of technicians in advance of such demand, the delivery time of our products could be delayed which could adversely affect our results of operations.
Treatment planning is a key step leading to our manufacturing process which relies on sophisticated computer technology requiring new technicians to undergo a relatively long training process. Training production technicians takes approximately 90 to 120 days. As a result, if we are unable to accurately predict our volume growth, we may not have a sufficient number of trained technicians to deliver our products within the time frame our customers expect. Such a delay could cause us to lose existing customers or fail to attract new customers. This could cause a decline in our net revenues and net income and could adversely affect our results of operations.
Our headquarters, digital dental modeling processes, and other manufacturing processes are principally located in regions that are subject to earthquakes and other natural disasters.
Our digital dental modeling is primarily processed in our facility located in San Jose, Costa Rica. The operations team in Costa Rica creates ClinCheck treatment plans using sophisticated computer software. In addition, our customer facing operations are located in Costa Rica. Our aligner molds and finished aligners are fabricated in Juarez, Mexico. Both locations in Costa Rica and Mexico are in earthquake zones and may be subject to other natural disasters. If there is a major earthquake or any other natural
47
disaster in a region where one of these facilities is located, our ability to create ClinCheck treatment plans, respond to customer inquiries or manufacture and ship our aligners could be compromised which could result in our customers experiencing a significant delay in receiving their completed aligners and a decrease in service levels for a period of time. In addition, our corporate headquarters in California is located in the San Francisco Bay Area. An earthquake or other natural disaster in this region could result in a disruption in our operations. Any such business interruption could materially and adversely affect our business, financial condition and results of operations.
Our information technology systems are critical to our business. System integration and implementation issues and system security risks could disrupt our operations, which could have a material adverse impact on our business and operating results.
We rely on the efficient and uninterrupted operation of complex information technology systems. All information technology systems are vulnerable to damage or interruption from a variety of sources. As our business has grown in size and complexity, the growth has placed, and will continue to place, significant demands on our information technology systems. To effectively manage this growth, our information systems and applications require an ongoing commitment of significant resources to maintain, protect and enhance existing systems and develop new systems to keep pace with continuing changes in information processing technology, evolving industry and regulatory standards and changing customer preferences. We are in a multi-year, company-wide program to transform certain business processes, extend established processes and/or implement additional functionality in our enterprise resource planning (“ERP”) software system which entails certain risks, including difficulties with changes in business processes that could disrupt our operations, such as our ability to track orders and timely ship products, manage our supply chain and aggregate financial and operational data.
System upgrades and enhancements require significant expenditures and allocation of valuable employee resources. Delays in integration or disruptions to our business from implementation of these new or upgraded systems could have a material adverse impact on our financial condition and operating results.
Additionally, we continuously upgrade our customer facing software applications, specifically the ClinCheck and MyAligntech software. Software applications frequently contain errors or defects, especially when they are first introduced or when new versions are released. The discovery of a defect or error or the incompatibility with the computer operating system and hardware configurations of customers in a new upgraded version or the failure of our primary information systems may result in the following consequences, among others: loss of revenue or delay in market acceptance, damage to our reputation or increased service costs, any of which could have a material adverse effect on our business, financial condition or results of operations.
If the information we rely upon to run our businesses were to be found to be inaccurate or unreliable, if we fail to properly maintain our information systems and data integrity, or if we fail to develop new capabilities to meet our business needs in a timely manner, we could have operational disruptions, have customer disputes, lose our ability to produce timely and accurate reports, have regulatory or other legal problems, have increases in operating and administrative expenses, lose existing customers, have difficulty in attracting new customers or in implementing our growth strategies, or suffer other adverse consequences. In addition, experienced computer programmers and hackers may be able to penetrate our network security or our cloud-based software servers hosted by third party and misappropriate our confidential information or that of third parties, create system disruptions or cause shutdowns. Furthermore, sophisticated hardware and operating system software and applications that we either internally develop or procure from third parties which we depend upon may contain defects in design and manufacture, including “bugs” and other problems that can unexpectedly interfere with the operation of the system. The costs to eliminate or alleviate security problems, viruses and bugs could be significant, and the efforts to address these problems could result in interruptions that may have a material adverse impact on our operations, net revenues and operating results.
Furthermore, our business requires the secure transmission of confidential information over public networks. Because of the confidential health information we store and transmit, security breaches could expose us to a risk of regulatory action, litigation, possible liability and loss. We have experienced such breaches in the past and our security measures may be inadequate to prevent security breaches, and our business operations and profitability would be adversely affected by, among other things, loss of customers and potential criminal and civil sanctions if they are not prevented.
There can be no assurance that our process of improving existing systems, developing new systems to support our expanding operations, integrating new systems, protecting confidential patient information, and improving service levels will not be delayed or that additional systems issues will not arise in the future. Failure to adequately protect and maintain the integrity of our information systems and data may result in a material adverse effect on our financial position, results of operations and cash flows.
48
If the security of our customer and patient information is compromised, patient care could suffer, and we could be liable for related damages, and our reputation could be impaired.
We retain confidential customer and patient information in our processing centers. Therefore, it is critical that our facilities and infrastructure remain secure and are also perceived by the marketplace and our customers to be secure. Despite the implementation of security measures, we have experienced such breaches in the past and our infrastructure may be vulnerable to physical break-ins, computer viruses, programming errors or other technical malfunctions, hacking or phishing attacks by third parties, employee error or malfeasance or similar disruptive problems. If we fail to meet our customer and patient’s expectations regarding the security of healthcare information, we could be liable for damages and our reputation and competition position could be impaired. Affected parties could initiate legal or regulatory action against us, which could cause us to incur significant expense and liability or result in orders forcing us to modify our business practices. Concerns over our privacy practices could adversely affect others’ perception of us and deter customers, advertisers and partners from using our products. In addition, patient care could suffer, and we could be liable if our systems fail to deliver correct information in a timely manner. Our insurance may not protect us from this risk.
We are also subject to several federal, state and foreign laws and regulations, including ones relating to privacy, data protection, content regulation, and consumer protection. These laws and regulations are constantly evolving and may be interpreted, applied, created or amended in a manner that could adversely affect our business.
In addition, we must comply with numerous data protection requirements that span from individual state and national laws in the U.S. to multinational requirements in the EU. In the EU, Align must comply with the General Data Protection Regulation (“GDPR”), which became effective on May 25, 2018 and serves as a harmonization of European data-privacy laws. We believe we have designed our product and service offerings to be compliant with the requirements of applicable data protection laws and regulations. Maintaining systems that are compliant with these laws and regulations is costly and could require complex changes in the way we do business or provide services to our customers and their patients. Additionally, our success may be dependent on the success of healthcare providers in managing data protection requirements.
Our success depends in part on our proprietary technology, and if we are unable to successfully enforce our intellectual property rights, our competitive position may be harmed. Litigating claims of this type is costly and could distract our management and cause a decline in our results of operations and stock price.
Our success will depend in part on our ability to maintain existing intellectual property and to obtain and maintain further intellectual property protection for our products, both in the U.S. and in other countries. Our inability to do so could harm our competitive position. As of June 30, 2018, we had 432 active U.S. patents, 384 active foreign patents, and 444 pending global patent applications.
We intend to rely on our portfolio of issued and pending patent applications in the U.S. and in other countries to protect a large part of our intellectual property and our competitive position; however, our currently pending or future patent filings may not result in the issuance of patents. Additionally, any patents issued to us may be challenged, invalidated, held unenforceable, circumvented, or may not be sufficiently broad to prevent third parties from producing competing products similar in design to our products. In addition, any protection afforded by foreign patents may be more limited than that provided under U.S. patents and intellectual property laws. Certain of our key patents began to expire in 2017, which may result in increased competition or less expensive alternatives to our products. We also rely on protection of our copyrights, trade secrets, know-how and proprietary information. We generally enter into confidentiality agreements with our employees, consultants and our collaborative partners upon commencement of a relationship with us; however, these agreements may not provide meaningful protection against the unauthorized use or disclosure of our trade secrets or other confidential information, and adequate remedies may not exist if unauthorized use or disclosure were to occur. Our inability to maintain the proprietary nature of our technology through patents, copyrights or trade secrets would impair our competitive advantages and could have a material adverse effect on our operating results, financial condition and future growth prospects. In particular, a failure to protect our proprietary rights might allow competitors to copy our technology, which could adversely affect our pricing and market share. In addition, in an effort to protect our intellectual property we have in the past been and may in the future be involved in litigation. The potential effects on our business operations resulting from litigation that we may participate in the future, whether or not ultimately determined in our favor or settled by us, are costly and divert the efforts and attention of our management and technical personnel from normal business operations.
Litigation, interferences, oppositions, re-exams, inter partes reviews, post grant reviews or other proceedings are, have been and may in the future be necessary in some instances to determine the validity and scope of certain of our proprietary rights, and in other instances to determine the validity, scope or non-infringement of certain patent rights claimed by third parties to be pertinent to the manufacture, use or sale of our products. Litigation, interference, oppositions, re-exams, inter partes reviews, post grant
49
reviews, administrative challenges or other similar types of proceedings are unpredictable and may be protracted, expensive and distracting to management. The outcome of such proceedings could adversely affect the validity and scope of our patent or other proprietary rights, hinder our ability to manufacture and market our products, require us to seek a license for the infringed product or technology or result in the assessment of significant monetary damages. An unfavorable ruling could include monetary damages or, in cases where injunctive relief is sought, an injunction prohibiting us from selling our products. Any of these results from our litigation could adversely affect our results of operations and stock price.
While we believe we currently have adequate internal control over financial reporting, we are required to assess our internal control over financial reporting on an annual basis and any future adverse results from such assessment could result in a loss of investor confidence in our financial reports and have an adverse effect on our stock price.
Pursuant to the Sarbanes-Oxley Act of 2002 and the rules and regulations promulgated by the SEC, we are required to furnish in our Form 10-K a report by our management regarding the effectiveness of our internal control over financial reporting. The report includes, among other things, an assessment of the effectiveness of our internal control over financial reporting as of the end of our fiscal year, including a statement as to whether or not our internal control over financial reporting is effective. This assessment must include disclosure of any material weaknesses in our internal control over financial reporting identified by management. While we believe our internal control over financial reporting is currently effective, the effectiveness of our internal controls in future periods is subject to the risk that our controls may become inadequate because of changes in conditions including our transition of further business operations into our ERP software system, and, as a result, the degree of compliance of our internal control over financial reporting with the existing policies or procedures may become ineffective. Establishing, testing and maintaining an effective system of internal control over financial reporting requires significant resources and time commitments on the part of our management and our finance staff, may require additional staffing and infrastructure investments and would increase our costs of doing business. If we are unable to assert that our internal control over financial reporting is effective in any future period (or if our auditors are unable to express an opinion on the effectiveness of our internal controls or conclude that our internal controls are ineffective), we could lose investor confidence in the accuracy and completeness of our financial reports, which could have an adverse effect on our stock price.
If we lose our key personnel or are unable to attract and retain key personnel, we may be unable to pursue business opportunities or develop our products.
We are highly dependent on the key employees in our clinical engineering, technology development, sales, training and marketing personnel and management teams. The loss of the services provided by those individuals may significantly delay or prevent the achievement of our product development and other business objectives and could harm our business. Our future success will also depend on our ability to identify, recruit, train and retain additional qualified personnel, including orthodontists and production technicians in our treat facilities. Few orthodontists are accustomed to working in a manufacturing environment since they are generally trained to work in private practices, universities and other research institutions. Thus, we may be unable to attract and retain personnel with the advanced qualifications necessary for the further development of our business. Furthermore, we may not be successful in retaining our key personnel or their services. If we are unable to attract and retain key personnel, our business could be materially harmed.
If we infringe the patents or proprietary rights of other parties or are subject to a patent infringement claim, our ability to grow our business may be severely limited.
Extensive litigation over patents and other intellectual property rights is common in the medical device industry. We have been sued for infringement of third party’s patents in the past and we may be the subject of patent or other litigation in the future. From time to time, we have received and may in the future receive letters from third parties drawing our attention to their patent rights. While we do not believe that we infringe upon any valid and enforceable rights that have been brought to our attention, there may be other more pertinent rights of which we are presently unaware. The defense and prosecution of intellectual property suits, interference proceedings and related legal and administrative proceedings could result in substantial expense to us and significant diversion of effort by our technical and management personnel. An adverse determination of any litigation or interference proceeding to which we may become a party could subject us to significant liabilities. An adverse determination of this nature could also put our patents at risk of being invalidated or interpreted narrowly or require us to seek licenses from third parties. Licenses may not be available on commercially reasonable terms or at all, in which event, our business would be materially adversely affected.
We maintain single supply relationships for certain of our key machines and materials technologies, and our business and operating results could be harmed if supply is restricted or ends or the price of raw materials used in our manufacturing process increases.
We are highly dependent on manufacturers of specialized scanning equipment, rapid prototyping machines, resin and other
50
advanced materials, as well as the optics, electronic and other mechanical components of our intraoral scanners. We maintain single supply relationships for many of these machines and materials technologies. In particular, our CT scanning and stereolithography equipment used in our aligner manufacturing and many of the critical components for the optics of our scanners are provided by single suppliers. We are also committed to purchasing the vast majority of our resin and polymer, the primary raw materials used in our manufacturing process for clear aligners, from a single source. If these or other suppliers encounter financial, operating or other difficulties or if our relationship with them changes, we might not be able to quickly establish or qualify replacement sources of supply and could face production interruptions, delays and inefficiencies. In addition, technology changes by our vendors could disrupt access to required manufacturing capacity or require expensive, time consuming development efforts to adapt and integrate new equipment or processes. Our growth may exceed the capacity of one or more of these manufacturers to produce the needed equipment and materials in sufficient quantities to support our growth. Conversely, in order to secure supplies for production of products, we sometimes enter into non-cancelable minimum purchase commitments with vendors, which could impact our ability to adjust our inventory to reflect declining market demands. If demand for our products is less than we expect, we may experience additional excess and obsolete inventories and be forced to incur additional charges and our profitability may suffer. In the event of technology changes, delivery delays, or shortages of or increases in price for these items, our business and growth prospects may be harmed.
We depend on a single contract manufacturer and supplier of parts used in our iTero scanner and any disruption in this relationship may cause us to fail to meet the demands of our customers and damage our customer relationships.
We rely on a third party manufacturer to supply key sub-assemblies for our iTero Element scanner. As a result, if this third party manufacturer fails to deliver its components, if we lose its services or if we fail to negotiate acceptable terms, we may be unable to deliver our products in a timely manner and our business may be harmed. Any difficulties encountered by the third party manufacturer with respect to hiring personnel and maintaining acceptable manufacturing standards, controls, procedures and policies could disrupt our ability to deliver our products in a timely manner. Finding a substitute manufacturer may be expensive, time-consuming or impossible and could result in a significant interruption in the supply of our intraoral scanning products. Any failure by our contract manufacturer that results in delays in our fulfillment of customer orders may cause us to lose revenues and suffer damage to our customer relationships.
We primarily rely on our direct sales force to sell our products, and any failure to maintain our direct sales force could harm our business.
Our ability to sell our products and generate revenues primarily depends upon our direct sales force within our Americas and International markets. We do not have any long-term employment contracts with the members of our direct sales force. The loss of the services provided by these key personnel may harm our business. If we are unable to retain our direct sales force personnel or replace them with individuals of equivalent technical expertise and qualifications, or if we are unable to successfully instill such technical expertise or if we fail to establish and maintain strong relationships with our customers within a relatively short period of time, our net revenues and our ability to maintain market share could be materially harmed. In addition, due to our large and fragmented customer base, we may not be able to provide all of our customers with product support immediately upon the launch of a new product. As a result, adoption of new products by our customers may be slower than anticipated and our ability to grow market share and increase our net revenues may be harmed.
If our distributor relationships are not successful, our ability to market and sell our products would be harmed and our financial performance will be adversely affected.
We depend on relationships with distributors for the marketing and sales of our products in various geographic regions, and we have a limited ability to influence their efforts. Relying on distributors for our sales and marketing could harm our business for various reasons, including:
|
•
|
agreements with distributors may terminate prematurely due to disagreements or may result in litigation between the partners;
|
|
•
|
we may not be able to renew existing distributor agreements on acceptable terms;
|
|
•
|
our distributors may not devote sufficient resources to the sale of products;
|
|
•
|
our distributors may be unsuccessful in marketing our products;
|
|
•
|
our existing relationships with distributors may preclude us from entering into additional future arrangements with other distributors; and
|
|
•
|
we may not be able to negotiate future distributor agreements on acceptable terms.
|
51
Complying with regulations enforced by the FDA and other regulatory authorities is an expensive and time-consuming process, and any failure to comply could result in substantial penalties.
Our products are considered medical devices and are subject to extensive regulation in the U.S. and internationally. FDA regulations are wide ranging and govern, among other things:
|
•
|
product design, development, manufacturing and testing;
|
|
•
|
product labeling;
|
|
•
|
product storage;
|
|
•
|
pre-market clearance or approval;
|
|
•
|
complaint handling and corrective actions;
|
|
•
|
advertising and promotion; and
|
|
•
|
product sales and distribution.
|
Our failure to comply with applicable regulatory requirements could result in enforcement action by the FDA or state agencies, which may include any of the following sanctions:
|
•
|
warning letters, fines, injunctions, consent decrees and civil penalties;
|
|
•
|
repair, replacement, refunds, recall or seizure of our products;
|
|
•
|
operating restrictions or partial suspension or total shutdown of production;
|
|
•
|
refusing our requests for 510(k) clearance or pre-market approval of new products, new intended uses, or modifications to existing products;
|
|
•
|
withdrawing clearance or pre-market approvals that have already been granted; and
|
|
•
|
criminal prosecution.
|
If any of these events were to occur, they could harm our business. We must comply with facility registration and product listing requirements of the FDA and adhere to applicable Quality System regulations. The FDA enforces its Quality System regulations through periodic unannounced inspections. Our failure to take satisfactory corrective action in response to an adverse inspection or the failure to comply with applicable manufacturing regulations could result in enforcement action, and we may be required to find alternative manufacturers, which could be a long and costly process. Any FDA enforcement action could have a material adverse effect on us.
Before we can sell a new medical device in the U.S., or market a new use of or claim for an existing product, we must obtain FDA clearance or approval unless an exemption applies. Obtaining regulatory clearances or approvals can be a lengthy and time-consuming process. Even though the devices we market have obtained the necessary clearances from the FDA, we may be unable to maintain such clearances in the future. Furthermore, we may be unable to obtain the necessary clearances for new devices that we intend to market in the future. Our inability to maintain or obtain regulatory clearances or approvals could materially harm our business.
In addition, as part of the Dodd-Frank Wall Street Reform and Consumer Protection Act, the SEC adopted disclosure requirements regarding the use of certain minerals, known as conflict minerals, which are mined from the Democratic Republic of Congo and adjoining countries, as well as procedures regarding a manufacturer’s efforts to identify and discourage the sourcing of such minerals and metals produced from those minerals. Additional reporting obligations are being proposed by the European Union. The U.S. requirements and any additional requirements in Europe could affect the sourcing and availability of metals used in the manufacture of a limited number of parts (if any) contained in our products. For example, these disclosure requirements may decrease the number of suppliers capable of supplying our needs for certain metals, thereby negatively affecting our ability to obtain products in sufficient quantities or at competitive prices. Our material sourcing is broad based and multi-tiered, and we may be unable to conclusively verify the origins for all metals used in our products. We may suffer financial and reputational harm if customers require, and we are unable to deliver, certification that our products are conflict free. Regardless, we will incur additional costs associated with compliance with these disclosure requirements, including time-consuming and costly efforts to determine the source of any conflict minerals used in our products.
52
If compliance with healthcare regulations becomes costly and difficult for our customers or for us, we may not be able to grow our business.
Participants in the healthcare industry are subject to extensive and frequently changing regulations under numerous laws administered by governmental entities at the federal, state and local levels, some of which are, and others of which may be, applicable to our business.
Furthermore, our healthcare provider customers are also subject to a wide variety of laws and regulations that could affect the nature and scope of their relationships with us. The healthcare market itself is highly regulated and subject to changing political, economic and regulatory influences. Regulations implemented pursuant to the Health Insurance Portability and Accountability Act (“HIPAA”), including regulations affecting the security and privacy of patient healthcare information held by healthcare providers and their business associates may require us to make significant and unplanned enhancements of software applications or services, result in delays or cancellations of orders, or result in the revocation of endorsement of our products and services by healthcare participants. The effect of HIPAA and newly enforced regulations on our business is difficult to predict, and there can be no assurance that we will adequately address the business risks created by HIPAA and its implementation or that we will be able to take advantage of any resulting business opportunities.
Extensive and changing government regulation of the healthcare industry may be expensive to comply with and exposes us to the risk of substantial government penalties.
In addition to medical device laws and regulations, numerous state and federal healthcare-related laws regulate our business, covering areas such as:
|
•
|
storage, transmission and disclosure of medical information and healthcare records;
|
|
•
|
prohibitions against the offer, payment or receipt of remuneration to induce referrals to entities providing healthcare services or goods or to induce the order, purchase or recommendation of our products; and
|
|
•
|
the marketing and advertising of our products.
|
Complying with these laws and regulations could be expensive and time-consuming, and could increase our operating costs or reduce or eliminate certain of our sales and marketing activities or our revenues.
Our business exposes us to potential product liability claims, and we may incur substantial expenses if we are subject to product liability claims or litigation.
Medical devices involve an inherent risk of product liability claims and associated adverse publicity. We may be held liable if any product we develop or any product that uses or incorporates any of our technologies causes injury or is otherwise found unsuitable. Although we intend to continue to maintain product liability insurance, adequate insurance may not be available on acceptable terms, if at all, and may not provide adequate coverage against potential liabilities. A product liability claim, regardless of its merit or eventual outcome, could result in significant legal defense costs. These costs would have the effect of increasing our expenses and diverting management’s attention away from the operation of our business, and could harm our business.
Historically, the market price for our common stock has been volatile.
The market price of our common stock could be subject to wide price fluctuations in response to various factors, many of which are beyond our control. The factors include:
|
•
|
quarterly variations in our results of operations and liquidity;
|
|
•
|
changes in recommendations by the investment community or in their estimates of our net revenues or operating results;
|
|
•
|
speculation in the press or investment community concerning our business and results of operations;
|
|
•
|
strategic actions by our competitors, such as product announcements or acquisitions;
|
|
•
|
announcements of technological innovations or new products by us, our customers or competitors; and
|
|
•
|
general economic market conditions.
|
53
In addition, the stock market, in general, and the market for technology and medical device companies, in particular, have experienced extreme price and volume fluctuations that have often been unrelated to or disproportionate to the operating performance of those companies. These broad market and industry factors may seriously harm the market price of our common stock, regardless of our operating performance. Historically, class action litigation is often brought against an issuing company following periods of volatility in the market price of a company’s securities.
Future sales of significant amounts of our common stock may depress our stock price.
A large percentage of our outstanding common stock is currently owned by a small number of significant stockholders. These stockholders have sold in the past, and may sell in the future, large amounts of common stock over relatively short periods of time. Sales of substantial amounts of our common stock in the public market by our existing stockholders may adversely affect the market price of our common stock. Such sales could create public perception of difficulties or problems with our business and may depress our stock price.
We are subject to risks associated with our strategic investments. Impairments in the value of our investments and receivables could negatively impact our financial results.
We have invested in SDC and other privately held companies for strategic reasons and to support key business initiatives, and we may not realize a return on our strategic investments. Many of such companies generate net losses and the market for their products, services or technologies may be slow to develop. Further, valuations of privately held companies are inherently complex due to the lack of readily available market data. If we determine that our investments and receivables in SDC or investments in other privately held companies have experienced a decline in value, we may be required to record impairments which could be material and could have an adverse impact on our financial results.
On July 1, 2016, we changed our corporate structure; however, if we are unable to maintain this structure or if it is challenged by U.S. or foreign tax authorities, we may be unable to realize tax savings which could materially and adversely affect our operating results.
We implemented a new international corporate structure on July 1, 2016. This corporate structure may reduce our overall effective tax rate over time through changes in the structure of our international procurement and sales operations, as well as realignment of the ownership and use of intellectual property among our wholly-owned subsidiaries.
The structure includes legal entities located in jurisdictions with income tax rates lower than the U.S. federal statutory tax rate. Such intercompany arrangements would be designed to result in income earned by such entities in accordance with arm’s-length principles and commensurate with functions performed, risks assumed and ownership of valuable corporate assets. We believe that income taxed in certain foreign jurisdictions at a lower rate relative to the U.S. federal statutory rate will have a beneficial impact on our worldwide effective tax rate over the medium to long term.
If the structure is challenged by U.S. or foreign tax authorities, if changes in domestic and international and statutory tax laws negatively impact the structure, including the U.S. Tax Cuts and Jobs Act (“TCJA”) enacted into law on December 22, 2017, or if we do not operate our business in a manner consistent with the structure and applicable regulatory provisions, we may fail to achieve the financial and operational efficiencies that we anticipate as a result of the structure, and our business, financial condition and net income may be materially and adversely affected.
Changes in, or interpretations of, accounting rules and regulations, could result in unfavorable accounting charges.
We prepare our consolidated financial statements in conformity with GAAP. These principles are subject to interpretation by the SEC and various bodies formed to interpret and create appropriate accounting policies. A change in these policies can have a significant effect on our reported results and may even retroactively affect previously reported transactions. Our accounting policies that recently have been, or may be affected by changes in the accounting rules relate to revenue recognition and leases.
If we fail to manage our exposure to global financial and securities market risk successfully, our operating results and financial statements could be materially impacted.
The primary objective of our investment activities is to preserve principal. To achieve this objective, a majority of our marketable investments are investment grade, liquid, fixed-income securities and money market instruments denominated in U.S. dollars. If the carrying value of our investments exceeds the fair value, and the decline in fair value is deemed to be other-than-temporary, we will be required to write down the value of our investments, which could materially harm our results of operations and financial condition. Moreover, the performance of certain securities in our investment portfolio correlates with the credit condition of the U.S. financial sector. In an unstable credit environment, we might incur significant realized, unrealized or
54
impairment losses associated with these investments.
If our goodwill or long-lived assets become impaired, we may be required to record a significant charge to earnings.
Under Generally Accepted Accounting Principles in the United States (“GAAP”), we review our goodwill and long-lived asset group for impairment when events or changes in circumstances indicate the carrying value may not be recoverable. Additionally, goodwill is required to be tested for impairment at least annually. The qualitative and quantitative analysis used to test goodwill are dependent upon various assumptions and reflect management’s best estimates. Changes in certain assumptions including revenue growth rates, discount rates, earnings multiples and future cash flows may cause a change in circumstances indicating that the carrying value of goodwill or the asset group may be impaired. We may be required to record a significant charge to earnings in the financial statements during the period in which any impairment of goodwill or asset group are determined.
Our effective tax rate may vary significantly from period to period.
Various internal and external factors may have favorable or unfavorable effects on our future effective tax rate. These factors include, but are not limited to, changes in tax laws, regulations and/or rates, new or changes to accounting pronouncements, non-deductible goodwill impairments, changing interpretations of existing tax laws or regulations, changes in the relative proportions of revenues and income before taxes in the various jurisdictions in which we operate that have differing statutory tax rates, the future levels of tax benefits of stock-based compensation, settlement of income tax audits, and changes in overall levels of pretax earnings. As a result of the adoption of Accounting Standards Update (“ASU”) 2016-09 in 2017, we anticipate our effective tax rate to vary significantly in our first quarter due to the timing of when the majority of our equity compensation vests each year. Other quarters can also be impacted depending on the timing of equity vests.
Changes in tax laws or tax rulings could negatively impact our income tax provision and net income.
As a U.S. multinational corporation, we are subject to changing tax laws both within and outside of the U.S. Changes in tax laws or tax rulings, or changes in interpretations of existing tax laws, could affect our income tax provision and net income or require us to change the manner in which we operate our business. On December 22, 2017, the U.S. enacted significant tax reform, and certain provisions of the new law may adversely affect us. In addition, governmental tax authorities are increasingly scrutinizing the tax positions of companies. Many countries in Europe, as well as a number of other countries and organizations, have recently proposed or recommended changes to existing tax laws or have enacted new laws. For example, the Organization for Economic Cooperation and Development (“OECD”) has been working on a “Base Erosion and Profit Shifting Project,” which is focused on a number of issues, including the shifting of profits between affiliated entities in different tax jurisdictions. In 2015, the OECD issued and is expected to continue to issue, guidelines and proposals that may change various aspects of the existing framework under which our tax obligations are determined in many of the countries in which we do business.
55
ITEM 2.
UNREGISTERED SALES OF EQUITY SECURITIES AND USE OF PROCEEDS
Following is a summary of stock repurchases for the three months ended
June 30, 2018
:
|
Period
|
Total Number of Shares Repurchased
|
Average Price Paid per Share
|
Total Number of Shares Repurchased as Part of Publicly Announced Program
|
Approximate Dollar Value of Shares that May Yet Be Repurchased Under the Programs
1
|
||||||||||
|
April 1, 2018 through April 30, 2018
|
—
|
|
$
|
—
|
|
—
|
|
$
|
100,000,000
|
|
||||
|
May 1, 2018 through May 31, 2018
|
—
|
|
$
|
—
|
|
—
|
|
$
|
700,000,000
|
|
||||
|
June 1, 2018 through June 30, 2018
|
—
|
|
$
|
—
|
|
—
|
|
$
|
700,000,000
|
|
||||
1
Stock Repurchase Programs
|
◦
|
April 2016 Repurchase Program.
In February 2018, we repurchased $100.0 million of our common stock on the open market. In July 2018, we repurchased $100.0 million of our common stock on the open market, completing the April 2016 Repurchase Program.
|
|
◦
|
May 2018 Repurchase Program.
In May 2018, we announced that our Board of Directors had authorized a plan to repurchase up to $600.0 million of our common stock. As of
June 30, 2018
, we have $600.0 million remaining under the May 2018 Repurchase Program (
Refer to Note 11 “Common Stock Repurchase Programs” of the Notes to Condensed Consolidated Financial Statements
for details on our stock repurchase programs).
|
ITEM 3.
DEFAULTS UPON SENIOR SECURITIES
Not applicable.
ITEM 4.
MINE SAFETY DISCLOSURES
Not applicable.
ITEM 5.
OTHER INFORMATION
None
56
|
ITEM 6.
|
EXHIBITS
|
(a) Exhibits:
|
Exhibit
Number
|
Description
|
Filing
|
Date
|
Exhibit
Number
|
Filed here with
|
|||||
|
10.1
|
Form 8-K
|
6/25/2018
|
10.1
|
|||||||
|
31.1
|
*
|
|||||||||
|
31.2
|
*
|
|||||||||
|
32.1
|
*
|
|||||||||
|
101.INS
|
XBRL Instance Document
|
*
|
||||||||
|
101.SCH
|
XBRL Taxonomy Extension Schema Document
|
*
|
||||||||
|
101.CAL
|
XBRL Taxonomy Extension Calculation Linkbase Document
|
*
|
||||||||
|
101.DEF
|
XBRL Taxonomy Extension Definition Linkbase Document
|
*
|
||||||||
|
101.LAB
|
XBRL Taxonomy Extension Label Linkbase Document
|
*
|
||||||||
|
101.PRE
|
XBRL Taxonomy Extension Presentation Linkbase Document
|
*
|
||||||||
57
SIGNATURES
Pursuant to the requirements of the Securities Exchange Act of 1934, as amended, the registrant has duly caused this report to be signed on its behalf by the undersigned thereunto duly authorized.
|
|
ALIGN TECHNOLOGY, INC.
|
|
|
August 2, 2018
|
By:
|
/s/ JOSEPH M. HOGAN
|
|
Joseph M. Hogan
President and Chief Executive Officer
|
||
|
By:
|
/s/ JOHN F. MORICI
|
|
|
John F. Morici
Chief Financial Officer and Senior Vice President, Global Finance
|
||
58
TABLE OF CONTENTS
Part I Financial InformationItem 1 Financial StatementsNote 1. Summary Of Significant Accounting PoliciesNote 2. Investments and Fair Value MeasurementsNote 3. Balance Sheet ComponentsNote 4. Equity Method InvestmentsNote 5. Business CombinationsNote 6. Goodwill and Intangible AssetsNote 7. Credit FacilitiesNote 8. Legal ProceedingsNote 9. Commitments and ContingenciesNote 10. Stockholders EquityNote 11. Common Stock Repurchase ProgramsNote 12. Accounting For Income TaxesNote 13. Net Income Per ShareNote 14. Segments and Geographical InformationItem 2. Management S Discussion and Analysis Of Financial Condition and Results Of OperationsItem 3. Quantitative and Qualitative Disclosures About Market RiskItem 4. Controls and ProceduresPart II Other InformationItem 1. Legal ProceedingsItem 1A. Risk FactorsItem 2. Unregistered Sales Of Equity Securities and Use Of ProceedsItem 3. Defaults Upon Senior SecuritiesItem 4. Mine Safety DisclosuresItem 5. Other InformationItem 6. Exhibits