ALLEGIANT TRAVEL CO
10-Ks and 10-Qs
|
|
|
|
|
|
|
|
|
|
|
|
|
|
|
|
|
|
|
|
|
|
|
|
|
|
|
|
|
|
|
|
|
|
|
|
|
|
|
|
|
|
|
|
|
|
|
|
|
|
|
|
|
SECURITIES AND EXCHANGE COMMISSION
Washington, D.C. 20549
FORM 10-K
(Mark One)
|
ý
|
ANNUAL REPORT PURSUANT TO SECTION 13 OR 15(d) OF THE SECURITIES EXCHANGE ACT OF 1934
|
|
For the fiscal year ended December 31, 2015
|
|
|
OR
|
|
|
o
|
TRANSITION REPORT PURSUANT TO SECTION 13 OR 15(d) OF THE SECURITIES EXCHANGE ACT OF 1934
|
For the transition period from ____ to ____
Commission File Number 001-33166

Allegiant Travel Company
(Exact Name of Registrant as Specified in Its Charter)
|
Nevada
|
20-4745737
|
|
(State or Other Jurisdiction of Incorporation or Organization)
|
(IRS Employer Identification No.)
|
|
1201 North Town Center Drive
|
|
|
Las Vegas, Nevada
|
89144
|
|
(Address of Principal Executive Offices)
|
(Zip Code)
|
Registrant’s Telephone Number, Including Area Code:
(702) 851-7300
Securities registered pursuant to Section 12(b) of the Act:
|
Title of each class
|
Name of each exchange on which registered
|
|
Common Stock, $0.001 Par Value
|
Nasdaq Global Select Market
|
Securities registered pursuant to Section 12(g) of the Act:
None
Indicate by check mark if the registrant is a well-known seasoned issuer, as defined in Rule 405 of the Securities Act. Yes
ý
No
o
Indicate by check mark if the registrant is not required to file reports pursuant to Section 13 or Section 15(d) of the Act. Yes
o
No
ý
Indicate by check mark whether the registrant (1) has filed all reports required to be filed by Section 13 or 15(d) of the Securities Exchange Act of 1934 during the preceding 12 months (or for such shorter period that the registrant was required to file such reports), and (2) has been subject to such filing requirements for the past 90 days. Yes
ý
No
o
Indicate by check mark whether the registrant has submitted electronically and posted on its corporate website, if any, every Interactive Data File required to be submitted and posted pursuant to Rule 405 of Regulation S-T (§ 229.405 of this chapter) during the preceding 12 months (or for such shorter period that the registrant was required to submit and post such files). Yes
ý
No
o
Indicate by check mark if disclosure of delinquent filers pursuant to Item 405 of Regulation S-K (§229.405 of this chapter) is not contained herein, and will not be contained, to the best of registrant’s knowledge, in definitive proxy or information statements incorporated by reference in Part III of this Form 10-K or any amendment to this Form 10-K.
o
Indicate by check mark whether the registrant is a large accelerated filer, an accelerated filer, a non-accelerated filer, or a smaller reporting company. See definitions of “large accelerated filer,” “accelerated filer,” and “smaller reporting company” in Rule 12b-2 of the Exchange Act. (Check one):
|
Large accelerated filer
x
|
Accelerated filer
o
|
|
Non-accelerated filer
o
|
Smaller reporting company
o
|
|
(Do not check if a smaller reporting company)
|
|
Indicate by check mark whether the registrant is a shell company (as defined in Rule 12b-2 of the Exchange Act). Yes
o
No
ý
The aggregate market value of common equity held by non-affiliates of the registrant was approximately $2.4 billion computed by reference to the closing sale price of the common stock on the Nasdaq Global Select Market on June 30, 2015, the last trading day of the registrant’s most recently completed second fiscal quarter.
The number of shares of the registrant’s common stock outstanding as of the close of business on February 1, 2016 was 16,799,460.
DOCUMENTS INCORPORATED BY REFERENCE
Portions of the Proxy Statement to be used in connection with the solicitation of proxies to be voted at the registrant’s annual meeting to be held on
June 21, 2016
, and to be filed with the Commission subsequent to the date hereof, are incorporated by reference into Part III of this Report on Form 10-K.
EXHIBIT INDEX IS LOCATED ON PAGE 69.
Allegiant Travel Company
Form 10-K
For the Year Ended December 31, 2015
Table of Contents
|
PART I
|
|
|
|
ITEM 1.
|
||
|
ITEM 1A.
|
||
|
ITEM 1B.
|
||
|
ITEM 2.
|
||
|
ITEM 3.
|
||
|
ITEM 4.
|
||
|
PART II
|
||
|
ITEM 5.
|
||
|
ITEM 6.
|
||
|
ITEM 7.
|
||
|
ITEM 7A.
|
||
|
ITEM 8.
|
||
|
ITEM 9.
|
||
|
ITEM 9A.
|
||
|
ITEM 9B.
|
||
|
|
||
|
PART III
|
||
|
ITEM 10.
|
||
|
ITEM 11.
|
||
|
ITEM 12.
|
||
|
ITEM 13.
|
||
|
ITEM 14.
|
||
|
PART IV
|
||
|
ITEM 15.
|
||
3
DISCLOSURE REGARDING FORWARD-LOOKING STATEMENTS
We have made forward-looking statements in this annual report on Form 10-K, and in the section entitled “Management’s Discussion and Analysis of Financial Condition and Results of Operations,” that are based on our management’s beliefs and assumptions, and on information currently available to our management. Forward-looking statements include information concerning our possible or assumed future results of operations, business strategies, fleet plan, financing plans, competitive position, industry environment, potential growth opportunities, future service to be provided and the effects of future regulation and competition. Forward-looking statements include all statements that are not historical facts and can be identified by the use of forward-looking terminology such as the words “believe,” “expect,” “anticipate,” “intend,” “plan,” “estimate,” “project” or similar expressions.
Forward-looking statements involve risks, uncertainties and assumptions. Actual results may differ materially from those expressed in the forward-looking statements. Important risk factors that could cause our results to differ materially from those expressed in the forward-looking statements may be found in this annual report on Form 10-K and in our other periodic reports filed with the Securities and Exchange Commission at
www.sec.gov.
These risk factors include, without limitation, an accident involving or problems with our aircraft, our reliance on automation systems, volatility of fuel costs, labor issues and costs, the ability to obtain regulatory approvals as needed, the effect of economic conditions on leisure travel, debt covenants, terrorist attacks, risks inherent to airlines, demand for air services to our leisure destinations from the markets served by us, our dependence on our leisure destination markets, the competitive environment, our reliance on third parties who provide facilities or services to us, the possible loss of key personnel, economic and other conditions in markets in which we operate, aging aircraft and other governmental regulation, increases in maintenance costs and cyclical and seasonal fluctuations to our operating results.
Any forward-looking statements are based on information available to us today and we undertake no obligation to publicly update any forward-looking statements, whether as a result of future events, new information or otherwise.
Overview
We are a leisure travel company focused on providing travel services and products to residents of under-served cities in the United States. We were founded in 1997 and, in conjunction with our initial public offering in 2006, we incorporated in the state of Nevada. Our unique business model provides diversified revenue streams from various travel service and product offerings which distinguish us from other travel companies. We operate a low-cost passenger airline marketed to leisure travelers in under-served cities, allowing us to sell air transportation both on a stand-alone basis and bundled with the sale of air-related and third party services and products. In addition, we provide air transportation under fixed fee flying arrangements. Our developed route network, pricing philosophy, advertising, and product offerings built around relationships with premier leisure companies, are all intended to appeal to leisure travelers and make it attractive for them to purchase air travel and related services and products from us.
A brief description of the travel services and products we provide to our customers:
Scheduled service air transportation.
We provide scheduled air transportation on limited-frequency nonstop flights predominantly between under-served cities and popular leisure destinations. As of
February 1, 2016
, our operating fleet consisted of
51
MD-80 aircraft, 26 A320 series aircraft, and
five
Boeing 757-200 aircraft providing service on
294
routes to
104
cities. Based on recent announcements, we expect service will expand to 322 routes and 111 cities by August 2016.
Air-related ancillary products and services.
We provide unbundled air-related services and products in conjunction with air transportation for an additional cost to customers. These optional air-related services and products include a customer convenience fee, baggage fees, advance seat assignments, our own travel protection product, change fees, use of our call center for purchases, priority boarding, food and beverage purchases on board, and other air-related services.
Third party ancillary products and services.
We offer third party travel products such as hotel rooms, ground transportation (rental cars and hotel shuttle products) and attractions (show tickets) for sale to our passengers.
Fixed fee contract air transportation.
We provide air transportation through fixed fee agreements and charter service on a year-round and ad-hoc basis.
4
Other revenue.
We currently, and may choose to in the future, temporarily act as a lessor as an avenue to opportunistically acquire aircraft or engines. Upon the expiration of a lease, we would expect to operate the asset(s) ourselves.
Our principal executive offices are located at 1201 N. Town Center Drive, Las Vegas, Nevada 89144. Our telephone number is (702) 851-7300. Our website address is http://www.allegiant.com. We have not incorporated by reference into this annual report the information on our website and investors should not consider it to be a part of this document. Our website address is included in this document for reference only. Our annual report, quarterly reports, current reports and amendments to those reports are made available free of charge through the investor relations section on our website as soon as reasonably practicable after electronically filed with or furnished to the Securities and Exchange Commission (“SEC”).
Unique Business Model
We have developed a unique business model that focuses on leisure travelers in small and medium-sized cities. The business model has evolved as our experienced management team has looked differently at the traditional way business has been conducted in the airline and travel industries. Our focus on the leisure customer allows us to eliminate the costly complexities burdening others in our industry in their goal to be all things to all customers, particularly most other airlines which target the business customer.
|
Traditional Airline Approach
|
|
Allegiant Approach
|
||
|
•
|
Focus on business travelers
|
|
•
|
Focus on leisure travelers
|
|
•
|
Provide high frequency service from big cities
|
|
•
|
Provide low frequency service from small and medium-sized cities
|
|
•
|
Use smaller aircraft to provide connecting service from smaller markets through hubs
|
|
•
|
Use larger jet aircraft to provide nonstop service from under-served cities direct to leisure destinations
|
|
•
|
Bundled pricing
|
•
|
Unbundled pricing of air-related services and products
|
|
|
•
|
Sell through various intermediaries
|
|
•
|
Sell only directly to travelers
|
|
•
|
Offer flight connections
|
|
•
|
No connecting flights offered
|
|
•
|
Use code-share arrangements to increase passenger traffic
|
|
•
|
Do not use code-share arrangements
|
We have established a route network with a national footprint, providing service on
294
routes between
87
under-served cities and
17
leisure destinations, and serving
41
states as of
February 1, 2016
. In most of these cities, we provide service to more than one of our leisure destinations. We currently provide service to the popular leisure destinations of Las Vegas, NV; Orlando, FL; Phoenix, AZ; Tampa/St. Petersburg, FL; Los Angeles, CA; Ft. Lauderdale, FL; Punta Gorda, FL; the San Francisco Bay Area, CA; Honolulu, HI; Palm Springs, CA; Austin, TX; New Orleans, LA; Jacksonville, FL; Savannah/Hilton Head, GA; and West Palm Beach, FL. We also provide service on a seasonal basis to San Diego, CA, and Myrtle Beach, SC, and will commence service to Baltimore/Washington, DC and Destin, FL in the spring of 2016.
The geographic diversity of our route network protects us from regional variations in the economy and helps insulate us from competitive actions, as it would be difficult for a competitor to materially impact our business by targeting one city or region. Our widespread route network also contributes to the continued growth of our customer base.
In developing a unique business model, our ancillary offerings, including the sale of third party products and services, have been a significant source of our total operating revenue growth. We have increased ancillary revenue per passenger from $5.87 in 2004 to
$50.72
in
2015
. We own and manage our own air reservation system, giving us the ability to modify our system to enhance product offerings based on specific needs, without being dependent on non-customized product upgrades from outside suppliers. We believe the control of our automation systems has allowed us to be innovators in the industry by providing our customers with a variety of different travel services and products.
We believe the following strengths from our unique business model allow us to maintain a competitive advantage in the markets we serve:
Leisure customers in under-served cities
We believe small and medium-sized cities represent a large, under-served, market, especially for leisure travel. Prior to the initiation of our service, leisure travelers from these markets had limited desirable options to reach leisure destinations because
5
existing carriers are generally focused on connecting business customers through their hub-and-spoke networks. In 2014, we began serving selected medium-sized cities, to which major carriers have reduced service, creating a void for us to fill with limited or no direct nonstop competition on each route.
We believe our nonstop service, along with our low prices and leisure company relationships, make it attractive for leisure travelers to purchase our travel services and products. The size of the markets we serve, and our focus on the leisure customer, allow us to adequately serve our markets with less frequency, and to vary our air transportation capacity to match seasonal and day of the week demand patterns.
By focusing on under-served cities and routes, we believe we avoid the intense competition in high traffic domestic air corridors. In most of our small and medium-sized city markets, travelers previously faced high airfares and cumbersome connections or long drives to major airports in order to reach our leisure destinations. Based on published data from the U.S. Department of Transportation (“DOT”), we believe the initiation of our service stimulates demand because there is typically a substantial increase in traffic subsequent to new service beginning. Our market strategy is neither hostile to legacy carriers, whose historical focus has been connecting small cities to business markets with regional jets, nor to traditional low cost or ultra-low cost carriers generally focused on larger markets. Additionally, many major carriers have reduced service to medium-sized cities, which are not usually considered core hubs for these carriers.
Capacity management
Although the current low cost fuel environment has allowed us to increase flying during periods of lower demand, our core business model manages seat capacity by increased utilization of our aircraft during periods of high leisure demand and decreased utilization in low leisure demand periods. In 2015, during our peak demand period in March, we averaged 6.9 system block hours per aircraft per day while in September, our lowest month for demand, we averaged 4.2 system block hours per aircraft per day. Our management of seat capacity also includes changes in weekly frequency of certain markets based on identified peak and off-peak travel demand throughout the year. For example, the leisure destination of Palm Springs, CA, is more desirable for our customers from Bellingham, WA during winter months. Therefore, we seasonally decrease the frequency of our Bellingham-Palm Springs flights in the summer, and increase flights per week in the winter. Unlike other carriers which provide a fairly consistent number of flights every day of the week, we concentrate our flights on high demand leisure travel days and fly a smaller portion of our schedule on low demand days such as Tuesdays and Wednesdays.
Our strong ancillary revenue production, coupled with the ability to spread costs over a larger number of passengers, has allowed us to operate profitably throughout periods of high fuel prices and economic recession. We manage our capacity with a goal of being profitable on each route. Low aircraft ownership costs facilitate our ability to adjust service levels quickly, and maintain profitability during difficult economic times.
Low cost structure
We believe a low cost structure is essential to competitive success in the airline industry. Excluding a one-time impairment charge of $43.3 million taken in 2014, our operating expense per available seat mile ("CASM") decreased from
10.47¢
in 2014 to
8.45¢
in
2015
. Excluding the cost of fuel and the above impairment charge, our operating CASM decreased from
6.13¢
in
2014
to
5.81¢
in
2015
.
We continue to focus on maintaining low operating costs through the following tactics and strategies:
Cost-driven schedule.
We design our flight schedule to concentrate our aircraft each night at our crew bases which allows us to better utilize personnel, airport facilities, aircraft, spare parts inventory, and other assets. We believe leisure travelers are generally less concerned about departure and arrival times than business travelers, so we are able to schedule flights at times that enable us to reduce costs while remaining desirable to our leisure customers.
Low aircraft ownership costs.
We believe we properly balance low aircraft ownership costs (we have purchased all of our aircraft used) and operating costs to minimize our total costs. As of
February 1, 2016
, our operating fleet consists of
51
MD-80 series aircraft,
26
Airbus A320 series aircraft, and
five
Boeing 757-200 aircraft.
We continue to view the used Airbus A320 series aircraft market as being similar to the market we experienced when we began adding MD-80 aircraft to our fleet in 2001. We believe that future availability of used Airbus A320 series aircraft will be driven by high production rates of new current engine option aircraft, and re-fleeting strategies for new engine option ("NEO") narrow body aircraft by both air carriers and aircraft lessors. The addition of used Airbus A320 series aircraft has allowed us to
6
maintain low aircraft ownership costs consistent with our business model. In this document, references to Airbus A320 series aircraft are intended to describe Airbus A319 and/or A320 aircraft.
Simple product.
We believe offering a simple product is critical to achieving low operating costs. As such, we sell only nonstop flights; we do not code-share or interline with other carriers; we have a single class cabin; we do not provide any free catered items - everything on board is for sale; we do not overbook our flights; we do not provide cargo or mail services; and we do not offer other perks such as airport lounges.
Low distribution costs.
Our nontraditional marketing approach results in very low distribution costs. We do not sell our product through outside sales channels, thus avoiding the fees charged by travel web sites (Expedia, Orbitz or Travelocity) and traditional global distribution systems (“GDS”) (Sabre or Worldspan). Our customers can only purchase travel at our airport ticket counters or, for a fee, on our website or through our telephone reservation center. The purchase of travel through our website is the least expensive form of distribution for us and accounted for
95.1 percent
of our scheduled service revenue during
2015
.
Small and medium-sized city market airports.
Our business model focuses on residents of small and medium-sized cities in the United States. Typically, the airports in these cities have lower operating costs than airports in larger cities. These lower costs are driven by less expensive passenger facilities, landing, and ground service charges. In addition to inexpensive airport costs, many of our airports provide marketing support which results in lower marketing costs.
Ancillary product offerings
We believe most leisure travelers are concerned primarily with purchasing air travel for the least expensive price. As such, we have unbundled the air transportation product by charging fees for services many U.S. airlines have historically bundled in their product offering. We offer a simple base product at an attractive low fare, which enables us to stimulate demand and generate incremental revenue as customers pay additional amounts only for conveniences they value. For example, we do not offer complimentary advance seat assignments; however, customers who value this product can purchase advance seat assignments for a small incremental cost. In addition, snacks and beverages are sold individually on the aircraft, allowing passengers to purchase only items they value.
Our third party product offerings give our customers the opportunity to purchase hotel rooms, rental cars, airport shuttle service, show tickets, and other attractions. Our third party offerings are available to customers based on our agreements with various travel and leisure companies. For example, we have an exclusive agreement with Enterprise Holdings Inc. for the sale of rental cars packaged with air travel, which made up over 50 percent of our third party products ancillary revenue in 2015. The pricing of each product and our margin can be adjusted based on customer demand because our customers purchase travel through our booking engine without any intermediaries.
Strong financial position
As of
December 31, 2015
, we had
$397.4 million
of unrestricted cash, cash equivalents and investment securities, and total debt of
$641.7 million
. As we have been able to consistently generate cash from operations due to our profitability, we believe we have more than adequate resources to invest in the growth of our fleet, information technology, infrastructure, and development, while meeting short-term obligations.
Training and development
We are committed to investing in the development of adaptive learning courses for our employees, with a current focus on our operating groups. This progressive approach to training focuses on concept mastery, recognizing that individuals learn at varying paces, through different styles, and is designed to ensure the trainee fully understands each module before moving on to more advanced training. We also expect program development to facilitate recurrent training and to contribute to cost savings in the future, and we are in the process of seeking approval from the Federal Aviation Administration for various aspects of this training program.
7
Routes and schedules
Our current scheduled air service (including seasonal service) predominantly consists of limited frequency, nonstop flights into Las Vegas, Orlando, Phoenix and other Florida and California destinations from under-served cities across the continental United States. Our scheduled service route network as of
February 1, 2016
is summarized below:
|
Routes to Orlando
|
59
|
|
|
|
Routes to Las Vegas
|
50
|
|
|
|
Routes to Tampa/St. Petersburg
|
47
|
|
|
|
Routes to Phoenix
|
36
|
|
|
|
Routes to Punta Gorda
|
28
|
|
|
|
Routes to Los Angeles
|
22
|
|
|
|
Other routes
|
52
|
|
|
|
Total routes
|
294
|
|
|
Marketing and Distribution
Our website is our primary distribution method, and we also sell through our call center and at our airport ticket counters. This distribution mix creates significant cost savings and enables us to continue to build loyalty with our customers through increased interaction with them. We are also able to utilize customer email addresses in our database, which provides multiple cost effective opportunities to market products and services, including at the time of travel purchase, between purchase and travel, and after travel is complete. In addition, we market products and services to our customers during their flight. We believe the breadth of options we offer allows us to provide a “one-stop” shopping solution to enhance our customer's travel experience. More recently, we have run a national ad campaign in certain markets. In addition, when we enter new markets, we may advertise in local print publications, radio and/or television to introduce our new service to the community. These activities are sometimes supported by the local airport authority which has sought our initiation of service to the community.
We continue to enhance our automation, including the upgrade of our current distribution platform, and we have fully integrated all Internet traffic to our booking engine. We expect the continuous improvement to our website and other automation enhancements will create additional revenue opportunities by allowing us to capitalize on customer loyalty with additional product offerings.
Our low cost distribution strategy results in reduced expenses by avoiding the fees associated with the use of GDS distribution points. This distribution strategy also permits us to closely manage ancillary product offerings and pricing while developing and maintaining a direct relationship with our customers. We believe this continuous communication will result in substantial benefits over time. With our own automation system, we have the ability to continually change ancillary product offerings and pricing points, which allows us to find the optimal pricing levels for our various offerings. We believe this would be difficult and impractical to achieve through the use of the GDS.
Competition
The airline industry is highly competitive. Passenger demand and fare levels have historically been influenced by, among other things, the general state of the economy, international events, fuel prices, industry capacity, and pricing actions taken by other airlines. The principal competitive factors in the airline industry are price, schedule, customer service, routes served, types of aircraft, safety record and reputation, code-sharing relationships, and frequent flyer programs.
Our competitors include legacy airlines, low cost carriers ("LCCs"), ultra-low cost carriers ("ULCC"), regional airlines, and new entrant airlines. Many of these airlines are larger, have significantly greater financial resources, are more well known, and have more established reputations than us. In a limited number of cases, following our entry into a market, competitors have chosen to add service, reduce their fares, or both. In a few cases, other airlines have entered after we have developed a market.
We believe our under-served city strategy has reduced the intensity of competition we might otherwise face. As of
February 1, 2016
, we are the only domestic scheduled carrier operating out of the Orlando Sanford International Airport, Phoenix-Mesa Gateway Airport, and Punta Gorda Airport. Although no other domestic scheduled carriers operate in these airports, most U.S. airlines serve the major airports for Orlando, Phoenix, and Ft. Myers. In addition, many U.S. airlines serve our other leisure destinations. As a result, there is potential for increased competition on our routes.
8
As of
February 1, 2016
, we face mainline competition on only 48 of our
294
routes. We compete with Southwest Airlines on 33 routes, Delta Airlines on eight routes, Frontier Airlines on six routes, American Airlines on five routes, Spirit Airlines on three routes, Hawaiian Airlines and JetBlue Airlines on two routes each, and Alaska Airlines and United Airlines on one route each. We will also experience additional competition on recently announced routes.
Indirectly, we compete with Southwest, American, Delta, and other carriers that provide nonstop service to our leisure destinations from airports near our markets. We also face indirect competition from legacy carriers offering hub-and-spoke connections to our markets, although these fares tend to be substantially higher, with much longer elapsed travel times. Several airlines also offer competitive one-stop service from the medium-sized cities we serve.
We also face indirect competition from automobile travel in our short-haul markets, primarily in our Florida leisure destinations. We believe our low cost pricing model and the convenience of air transportation help us compete favorably against automobile travel.
In our fixed fee operations, we compete with other scheduled airlines in addition to independent passenger charter airlines. We also compete with aircraft owned or controlled by large tour companies. The basis of competition in the fixed fee market is cost, equipment capabilities, service, and reputation.
Aircraft Fuel
Fuel has historically been our largest operating expense. The cost of fuel is volatile, as it is subject to many economic and geopolitical factors we can neither control nor predict. Significant increases in fuel costs could materially affect our operating results and profitability. We do not currently use financial derivative products to hedge our exposure to fuel price volatility.
In an effort to reduce our fuel costs, we have a wholly-owned subsidiary which entered into a limited liability company operating agreement with an affiliate of Orlando Sanford International Airport to engage in contract fueling transactions for the provision of aviation fuel to airline users at that airport. In addition, we have invested in fuel storage units and fuel transportation facilities involved in the fuel distribution process. By reason of these activities, we could potentially incur material liabilities, including possible environmental liabilities, to which we would not otherwise be subject.
Employees
As of
December 31, 2015
, we employed
2,846
full-time equivalent employees, which consisted of
2,674
full-time and
344
part-time employees. Full-time equivalent employees consisted of
625
pilots,
841
flight attendants,
176
airport operations personnel,
264
mechanics,
146
reservation agents,
72
flight dispatchers, and
722
management and other personnel.
Salary and benefits expense is our second largest expense, having represented approximately
26 percent
of total operating expenses for
2015
, 20 percent in
2014
and 19 percent in
2013
.
We have two employee groups which elected union representation, consisting of approximately half of our total employees. We are in negotiations for collective bargaining agreements with the labor organizations representing these employee groups. As of February 2016, the flight attendant group is in the midst of an election to determine whether they will remain unionized.
Our relations with these labor organizations are governed by the Railway Labor Act ("RLA"). Under this act, if direct negotiations do not result in an agreement, either party may request the National Mediation Board ("NMB") to appoint a federal mediator. If no agreement is reached in these mediated discussions, the NMB may offer binding arbitration to the parties. If either party rejects binding arbitration, a “cooling off” period begins. At the end of this “cooling-off” period, the parties may engage in self-help, which among other events, could result in a strike from employees or for us to hire new employees to replace any striking workers. The table below identifies the status of these initial collective bargaining agreements:
|
Employee Group
|
|
Representative
|
|
Status of Agreement
|
|
|
|
|
|
|
|
Pilots
|
|
International Brotherhood of Teamsters, Airline Division
|
|
Elected representation in August 2012. In mediation phase of the negotiation process.
|
|
Flight Attendants
|
|
Transport Workers Union
|
|
Elected representation in December 2010. In mediation phase of the negotiation process. Election pending to determine whether they will remain unionized. Results of election will be known after February 25, 2016.
|
9
In January 2015, the International Brotherhood of Teamsters ("IBT") asked the NMB to make a proffer of arbitration with respect to the pilot negotiations, which is a precursor to the parties being released into self-help. In response, we met with the NMB and expressed our position that the IBT’s request was unwarranted and an abuse of the NMB's processes, and that the parties should remain in negotiations. The NMB declined to grant the IBT's request and resumed mediated negotiations between the parties. Shortly thereafter, the IBT threatened to call a strike on the ground that Allegiant allegedly was in violation of the RLA's status quo obligations. We successfully requested the United States District Court for the District of Nevada to enjoin the strike. In late September 2015, the IBT renewed its request for a proffer with the NMB, which we, again, opposed. The NMB did not grant IBT’s request and instead ordered the parties back to negotiations.
If we are unable to reach a labor agreement with these employee groups, they may seek to institute work interruptions or stoppages. We have not previously experienced any work interruptions or stoppages from our non-unionized or unionized employee groups.
Aircraft Maintenance
We have a Federal Aviation Administration ("FAA") approved maintenance program, which is administered by our maintenance department headquartered in Las Vegas. Technicians employed by us have appropriate experience and hold required licenses issued by the FAA. We provide them with comprehensive training and maintain our aircraft in accordance with FAA regulations. The maintenance performed on our aircraft can be divided into three general categories: line maintenance, major maintenance, and component and engine overhaul and repair. Line maintenance is generally performed by our personnel. We contract with outside organizations to provide major maintenance and component and engine overhaul and repair. We have chosen not to invest in facilities or equipment to perform our own major maintenance, engine overhaul or component work. Our management closely supervises all maintenance functions performed by our personnel and contractors employed by us, and by outside organizations. In addition to the maintenance contractors we presently utilize, we believe there are sufficient qualified alternative providers of maintenance services that we can use to satisfy our ongoing maintenance needs.
Community Involvement
We have worked with the Make-A-Wish Foundation since 2012 by flying "wish kids" and their families to their desired destinations, at no cost, and donating the proceeds from our in-flight Wingz Snack Pack program to the Foundation. In 2015, we flew approximately 1 million miles in connection with providing travel for granted wishes for these children and their families.
Insurance
We maintain insurance policies we believe are of types customary in the airline industry and as required by the DOT, and are in amounts we believe to be adequate to protect us against material loss. The policies principally provide coverage for public liability, passenger liability, baggage and cargo liability, property damage, including coverages for loss or damage to our flight equipment, directors and officers, and workers’ compensation insurance. There is no assurance, however, that the amount of insurance we carry will be sufficient to protect us from material loss in all cases.
Through the 2003 Emergency Wartime Supplemental Appropriations Act (the “Wartime Act”), the federal government has previously provided war-risk insurance coverage to commercial carriers, including coverage for losses from terrorism, for passengers, third parties (ground damage), and the aircraft hull. However, since the government-provided supplemental coverage from the Wartime Act was set to expire on September 30, 2014, we proactively canceled our government provided war-risk insurance coverage prior to that date and purchased comparable coverage via the commercial insurance marketplace. Available commercial insurance in the future could be more expensive, could have material differences in coverage than is currently provided, and may not be adequate to protect us from risk of loss from future acts of terrorism.
Government Regulation
We are subject to federal, state and local laws affecting the airline industry and to extensive regulation by the DOT, the FAA, and other governmental agencies.
DOT.
The DOT primarily regulates economic issues affecting air transportation such as certification and fitness of carriers, insurance requirements, consumer protection, competitive practices, and statistical reporting. The DOT also regulates requirements for accommodation of passengers with disabilities. The DOT has the authority to promulgate regulations and to investigate and institute proceedings to enforce its regulations and related federal statutes, and may assess civil penalties,
10
suspend or revoke operating authority, and seek criminal sanctions. The DOT also has authority to restrict or prohibit a carrier’s cessation of service to a particular community if such cessation would leave the community without scheduled airline service.
We hold DOT certificates of public convenience and necessity authorizing us to engage in scheduled air transportation of passengers, property, and mail within the United States, its territories and possessions, and between the United States and all countries that maintain a liberal aviation trade relationship with the United States (known as “open skies” countries). We also hold DOT authority to engage in charter air transportation of passengers, property, and mail on a domestic and international basis.
FAA.
The FAA primarily regulates flight operations and safety, including matters such as airworthiness and maintenance requirements for aircraft, pilot, mechanic, dispatcher and flight attendant training and certification, flight and duty time limitations, and air traffic control. The FAA requires each commercial airline to obtain and hold an FAA air carrier certificate. This certificate, in combination with operation specifications issued to the airline by the FAA, authorizes the airline to operate at specific airports using aircraft certificated by the FAA. We have and maintain in effect FAA certificates of airworthiness for all of our aircraft, and we hold the necessary FAA authority to fly to all of the cities we currently serve. Like all U.S. certificated carriers, our provision of scheduled service to certain destinations may require specific governmental authorization. The FAA has the authority to investigate all matters within its purview, to modify, suspend or revoke our authority to provide air transportation, to approve or disapprove the addition of aircraft to our operation specifications, or to modify, suspend, or revoke FAA licenses issued to individual personnel, for failure to comply with FAA regulations. The FAA can assess civil penalties for such failures and institute proceedings for the collection of monetary fines after notice and hearing. The FAA also has authority to seek criminal sanctions. The FAA can suspend or revoke our authority to provide air transportation on an emergency basis, without notice and hearing, if, in the FAA’s judgment, safety requires such action. A legal right to an independent, expedited review of such FAA action exists. Emergency suspensions or revocations have been upheld with few exceptions. The FAA monitors our compliance with maintenance, flight operations, and safety regulations on an ongoing basis, maintains a continuous working relationship with our operations and maintenance management personnel, and performs pre-scheduled inspections as well as frequent spot inspections of our aircraft, employees and records.
The FAA also has the authority to promulgate rules and regulations and issue maintenance directives and other mandatory orders relating to, among other things, inspection, repair and modification of aircraft and engines, increased security precautions, aircraft equipment requirements, noise abatement, mandatory removal and replacement of aircraft parts and components, mandatory retirement of aircraft, and operational requirements and procedures. Such rules, regulations and directives are normally issued after an opportunity for public comment, however, they may be issued without advance notice or opportunity for comment if, in the FAA’s judgment, safety requires such action.
We believe we are operating in compliance with applicable DOT and FAA regulations, interpretations and policies and we hold all necessary operating and airworthiness authorizations, certificates, and licenses.
Security.
Within the United States, civil aviation security functions, including review and approval of the content and implementation of air carriers’ security programs, passenger and baggage screening, cargo security measures, airport security, assessment and distribution of intelligence, threat response, and security research and development are the responsibility of the Transportation Security Administration (“TSA”) of the Department of Homeland Security. The TSA has enforcement powers similar to the DOT’s and FAA’s described above. It also has the authority to issue regulations, including in cases of emergency, the authority to do so without advance notice, including issuance of a grounding order as occurred on September 11, 2001.
Aviation Taxes and Fees.
The authority of the federal government to collect most types of aviation taxes, which are used, in part, to finance the nation’s airport and air traffic control systems, and the authority of the FAA to expend those funds must be periodically reauthorized by the U.S. Congress. On September 30, 2015, Congress enacted the Airport and Airway Extension Act of 2015, which extended certain commercial aviation taxes (known generally as Federal Excise Taxes or "FET") through March 31, 2016. All carriers are required to collect these taxes from passengers and pass them through to the federal government.
In addition to FET, there are federal fees related to services provided by the TSA, and, in the case of international flights, the U.S. Customs and Border Protection ("CBP"), the U.S Immigration and Naturalization Service ("INS"), and the U.S. Department of Agriculture's Animal and Plant Health Inspection Service ("APHIS"). There are also FAA-approved Passenger Facility Charges ("PFCs") imposed by most of the airports we serve. Like FET, air carriers collect these fees from passengers and pass them through to the respective federal agency or airport authority. These fees do not need to be reauthorized, although their amounts may be revised periodically.
11
In 2016, Congress may consider reauthorization legislation that could increase the amount of FET and/or one or more of the other government fees identified above. By thus increasing the overall price charged to passengers, such action could lessen demand for air travel or force carriers, including us, to lower fares to maintain demand. Concurrently, Congress also may consider privatization of the U.S air traffic control ("ATC") system with user fee based funding. The effect of such action, if adopted as law, on our operating costs is unknown. Additionally, federal funding to airports and/or airport bond financing could be affected through future deficit reduction legislation, which could result in higher fees, rates, and charges at many of the airports we serve.
Environmental.
We are subject to various federal, state and local laws and regulations relating to the protection of the environment and affecting matters such as aircraft engine emissions, aircraft noise emissions, and the discharge or disposal of materials and chemicals, which laws and regulations are administered by numerous state and federal agencies. These agencies have enforcement powers similar to the DOT’s and FAA’s described above. In addition, we may be required to conduct an environmental review of the effects projected from the addition of our service at airports.
Federal law recognizes the right of airport operators with special noise problems to implement local noise abatement procedures so long as those procedures do not interfere unreasonably with interstate and foreign commerce and the national air transportation system. These restrictions can include limiting nighttime operations, directing specific aircraft operational procedures during takeoff and initial climb, and limiting the overall number of flights at an airport. None of the airports we serve currently imposes restrictions on the number of flights or hours of operation that have a meaningful impact on our operations. It is possible one or more such airports may impose additional future restrictions with or without advance notice, which may impact our operations.
Foreign Ownership.
To maintain our DOT and FAA certificates, our airline operating subsidiary and we (as the airline’s holding company) must qualify continuously as citizens of the United States within the meaning of U.S. aeronautical laws and regulations. This means we must be under the actual control of U.S. citizens and we must satisfy certain other requirements, including that our president/Chief Executive Officer ("CEO") and at least two-thirds of our board of directors and other managing officers are U.S. citizens, and that not more than 25 percent of our voting stock is owned or controlled by non-U.S. citizens. The amount of non-voting stock that may be owned or controlled by non-U.S. citizens is strictly limited as well. We believe we are in compliance with these ownership and control criteria.
Other Regulations.
Air carriers are subject to certain provisions of federal laws and regulations governing communications because of their extensive use of radio and other communication facilities, and are required to obtain an aeronautical radio license from the Federal Communications Commission (“FCC”). To the extent we are subject to FCC requirements, we intend to continue to comply with those requirements.
The quality of water used for drinking and hand-washing aboard aircraft is subject to regulation by the Environmental Protection Agency (“EPA”). To the extent we are subject to EPA requirements, we intend to continue to comply with those requirements.
Working conditions of cabin crewmembers while onboard aircraft are subject to regulation by the Occupational Safety and Health Administration ("OSHA") of the Department of Labor. To the extent we are subject to OSHA requirements, we intend to continue to comply with those requirements.
Our operations may become subject to additional federal requirements in the future under certain circumstances. During a period of past fuel scarcity, air carrier access to jet fuel was subject to allocation regulations promulgated by the Department of Energy. Changes to the federal excise tax and other government fees imposed on air transportation have been proposed and implemented from time to time and may result in an increased tax burden for airlines and their passengers.
We are also subject to state and local laws, regulations, and ordinances at locations where we operate and to the rules and regulations of various local authorities that operate the airports we serve. None of the airports in the cities in which we operate have slot control, gate availability, or curfews that pose meaningful limitations on our operations. However, some airports we serve have short runways that require us to operate some flights at less than full capacity.
International air transportation, whether provided on a scheduled or charter basis, is subject to the laws, rules, regulations, and licensing requirements of the foreign countries to, from and over which the international flights operate. Foreign laws, rules, regulations and licensing requirements governing air transportation are generally similar, in principle, to the regulatory scheme of the United States as described above, although in some cases foreign requirements are comparatively less onerous and in others, more onerous. We must comply with the laws, rules and regulations of each country to, from, or over which we operate.
12
International flights are also subject to U.S. Customs and Border Protection, Immigration and Agriculture requirements and the requirements of equivalent foreign governmental agencies.
Future Laws and Regulations.
Congress, the DOT, the FAA, the TSA, and other governmental agencies have under consideration, and in the future may consider and adopt, new laws, regulations, interpretations and policies regarding a wide variety of matters that could affect, directly or indirectly, our operations, ownership, and profitability. We cannot predict what other matters might be considered in the future by the FAA, the DOT, the TSA, other agencies, or Congress, nor can we judge what impact, if any, the implementation of any of these proposals or changes might have on our business.
Civil Reserve Air Fleet.
We are a participant in the Civil Reserve Air Fleet (“CRAF”) Program which affords the U.S. Department of Defense the right to charter our aircraft during national emergencies when the need for military airlift exceeds the capability of available military resources. During the Persian Gulf War of 1990-91 and on other occasions, CRAF carriers were required to permit the military to use their aircraft in this manner. As a result of our CRAF participation, we are eligible to bid on and be awarded peacetime airlift contracts with the military.
Readers should carefully consider the risks described below before making an investment decision. Our business, financial condition or results of operations could be materially and adversely affected by any of these risks. The trading price of our common stock could decline due to any of these risks, and investors may lose all or part of their investment.
Risks Related to Allegiant
Our reputation and financial results could be harmed in the event of an accident or restrictions affecting aircraft in our fleet.
As of
February 1, 2016
, our operating fleet consists of
51
MD-80 series aircraft,
26
A320 series aircraft, and
five
Boeing 757-200 aircraft. All of our aircraft were acquired used and range from 10 to 30 years from their manufacture date at
February 1, 2016
.
An accident involving one of our aircraft, even if fully insured, could cause a public perception that we are less safe or reliable than other airlines, which would harm our business. Further, there is no assurance that the amount of insurance we carry would be sufficient to protect us from material loss. Because we are smaller than most airlines, an accident would likely adversely affect us to a greater degree than a larger, more established airline.
In-flight emergencies affecting our aircraft, and resulting media attention, could also contribute to a public perception regarding safety concerns and a loss of business.
The FAA could suspend or restrict the use of our aircraft in the event of actual or perceived mechanical problems or safety issues, whether involving our aircraft or another U.S. or foreign airline’s aircraft, while it conducts its own investigation. Our business could also be significantly harmed if the public avoids flying our aircraft due to an adverse perception of the aircraft we utilize because of safety concerns or other problems, whether real or perceived, or in the event of an accident involving these aircraft.
We rely heavily on automated systems to operate our business and any failure of these systems could harm our business.
We depend on automated systems to operate our business, including our air reservation system, telecommunication systems, our website, and other automated systems. Our continuing work on enhancing the capabilities of our automated systems could increase the risk of automation failures. Any failure by us to handle our automation needs could negatively affect our internet sales (on which we rely heavily) and customer service, and result in lost revenues and increased costs.
Our website and reservation system must be able to accommodate a high volume of traffic and deliver necessary functionality to support our operations. Our automated systems cannot be completely protected against events that are beyond our control, such as natural disasters, telecommunications failures, computer viruses, security breaches or hacking attacks. Although we have implemented security measures and have disaster recovery plans in place, we cannot assure investors that these measures are adequate to prevent disruptions. Substantial or repeated website, reservations system, or telecommunication system failures could decrease the attractiveness of our services. Any disruption to these systems could result in the loss of important data and revenue, increase in expenses, and harm to our business.
13
We receive, retain, and transmit certain personal information about our customers. Our on-line operations also rely on the secure transmission of this customer data. We use third-party systems, software, and tools in order to protect the customer data we obtain through the course of our business. Although we use these security measures to protect this customer information, a compromise of our physical or network security systems through a cyber-security attack would create the risk that our customers’ personal information might be obtained by unauthorized persons. A compromise in our security systems could adversely affect our reputation, disrupt operations, and could also result in litigation or the imposition of penalties. In addition, it could be costly to remediate.
The way businesses handle customer data is increasingly subject to legislation and regulation typically intended to protect the privacy of customer data received, retained, and transmitted. We could be adversely affected if we fail to comply with existing rules or practices, or if legislation or regulations are expanded to require changes in our business practices. These privacy developments are difficult to anticipate and could adversely affect our business, financial condition, and results of operations.
Increases in fuel prices or unavailability of fuel would harm our business and profitability.
Fuel costs constitute a significant portion of our total operating expenses, representing approximately
31.3 percent
,
39.6 percent
and
45.8 percent
during
2015
,
2014
and
2013
, respectively. Significant increases in fuel costs have negatively affected our operating results in the past, and future fuel cost volatility could materially affect our financial condition and results of operations.
Both the cost and availability of aircraft fuel are subject to many economic and political factors and events occurring throughout the world over which we have no control. Meteorological events may also result in short-term disruptions in the fuel supply. Aircraft fuel availability is also subject to periods of market surplus and shortage, and is affected by demand for heating oil, gasoline, and other petroleum products. Due to the effect of these events on the price and availability of aircraft fuel, our ability to control this cost is limited, and the price and future availability of fuel cannot be predicted with any degree of certainty. Due to the high percentage of our operating costs represented by fuel, a relatively small increase in the price of fuel could have a significantly negative impact on our operating costs. A fuel supply shortage or higher fuel prices could possibly result in reduction of our service during the period affected.
We have made a business decision not to purchase financial derivatives to hedge against increases in the cost of fuel. This decision may make our operating results more vulnerable to the impact of fuel price increases.
Increased labor costs could result from industry conditions and could be impacted by labor-related disruptions.
Labor costs constitute a significant percentage of our total operating costs and are our largest non-fuel cost. Industry demand for pilots and the supply of available pilots will impact our labor costs as we seek to retain our employees and compete against other airlines for qualified personnel.
Further, we have two employee groups (pilots and flight attendants) which have elected union representation. These groups represent approximately half of our employees. We are currently in negotiations for initial collective bargaining agreements with the unions representing each of these employee groups. However, negotiations with the flight attendants are currently on hold because they are in the midst of an election to determine whether or not they will continue to be unionized. Union contracts could also put pressure on our labor costs.
If we are unable to reach agreement on the terms of collective bargaining agreements in the future, or we experience wide-spread employee dissatisfaction, we could be subject to work slowdowns or stoppages. Any of these events could have an adverse effect on our operations and future results.
FAA limitations could impact our ability to grow in the future.
As with all airlines, the FAA must approve all aircraft and cities to be added to our operation specifications. In 2015, we received notice from our local FAA office indicating we were under heightened surveillance as a result of what they referred to as labor unrest. For a period of time, the FAA discontinued approvals of additional aircraft and cities. Although these restrictions are not in place at the current time, future limitations from the FAA could potentially hinder our growth.
Unfavorable economic conditions may adversely affect travel from our markets to our leisure destinations.
The airline industry is particularly sensitive to changes in economic conditions. Unfavorable U.S. economic conditions have historically driven changes in travel patterns and have resulted in reduced discretionary spending for leisure travel. Unfavorable
14
economic conditions could impact demand for airline travel in our small and medium-sized cities to our leisure destinations. During difficult economic times, we may be unable to raise prices in response to fuel cost increases, labor, or other operating costs, which could adversely affect our results of operations and financial condition.
The indenture governing our senior unsecured notes contains various covenants limiting the discretion of our management in operating our business and could prevent us from capitalizing on business opportunities and taking some corporate actions.
The indenture governing our senior unsecured notes imposes significant operating and financial restrictions on us. These restrictions limit or restrict, among other things, our ability, and the ability of our restricted subsidiaries, to:
|
•
|
incur additional indebtedness;
|
|
•
|
incur liens;
|
|
•
|
make restricted payments (including paying dividends on, redeeming, repurchasing, or retiring our capital stock);
|
|
•
|
make investments; and
|
|
•
|
consolidate, merge, or sell all or substantially all of our assets.
|
These covenants are subject to exceptions and qualifications which are described in the indenture we have filed with the Securities and Exchange Commission. At maturity, or in the event of an acceleration of payment obligations, we may be unable to pay our outstanding indebtedness with our cash and cash equivalents then on hand. In such event, we would be required to seek alternative sources of funding, which may not be available on commercially reasonable terms, terms as favorable as our current agreements, or at all. If we are unable to refinance our indebtedness or find alternative means of financing our operations, we may be required to take actions that are inconsistent with our current business practices or strategy.
Our maintenance costs may increase as our fleet ages.
In general, the cost to maintain aircraft increases as they age and exceeds the cost to maintain newer aircraft. FAA regulations, including the Aging Aircraft Airworthiness Directives, require additional and enhanced maintenance inspections for older aircraft. These regulations can directly impact the frequency of inspections as an aircraft ages, and vary by aircraft or engine type depending on the unique characteristics of each aircraft and/or engine.
In addition, we may be required to comply with any future law changes, regulations, or airworthiness directives. We cannot assure investors our maintenance costs will not exceed our expectations.
We believe our aircraft are, and will continue to be, mechanically reliable. We cannot ensure our aircraft will continue to be sufficiently reliable over longer periods of time. Furthermore, given the age of our fleet, any public perception that our aircraft are less than completely reliable, could have an adverse effect on our bookings and profitability.
Our business is heavily dependent on the attractiveness of our leisure destinations and a reduction in demand for air travel to these markets could harm our business.
A substantial proportion of our scheduled flights have Las Vegas, Orlando, Phoenix, Tampa/St. Petersburg, Los Angeles, or Punta Gorda as either their destination or origin. Our business could be harmed by any circumstances causing a reduction in demand for air transportation to one or more of these markets, or our other leisure destinations, such as adverse changes in local economic conditions, negative public perception of the particular city, significant price increases, or the impact of future terrorist attacks or natural disasters.
We rely on third parties to provide us with facilities and services that are integral to our business.
We have entered into agreements with third-party contractors to provide certain facilities and services required for our operations, such as aircraft maintenance, ground handling, baggage services, and ticket counter space. Our reliance on others to provide essential services on our behalf also gives us less control over costs and the efficiency, timeliness and quality of contract services.
We also rely on the owners of aircraft under contract, and on the lessees under aircraft leases, to be able to deliver, or redeliver, aircraft in accordance with the terms of executed agreements on a timely basis. Our planned initiation of service with these aircraft in future years could be adversely affected if the third parties fail to perform as contractually obligated.
15
Our business could be harmed if we lose the services of our key personnel.
Our business depends upon the efforts of our chief executive officer, Maurice J. Gallagher, Jr., and a small number of senior management and operating personnel. We do not currently maintain key-man life insurance on Mr. Gallagher or any other executives. We may have difficulty replacing management or other key personnel who leave and, therefore, the loss of the services of any of these individuals could harm our business.
Risks Associated with the Airline and Travel Industry
The airline industry is highly competitive and future competition in our under-served markets could harm our business.
The airline industry is highly competitive. The smaller cities we serve on a scheduled basis have traditionally attracted considerably less attention from our potential competitors than larger markets, and in most of our small city markets, we are the only provider of nonstop service to our leisure destinations. In 2014, we began service to medium-sized cities which we believe to be under-served for nonstop service to our leisure destinations. If other airlines begin to provide nonstop services to and from these markets, or otherwise target these markets, the increase in the amount of direct or indirect competition could cause us to reconsider service to affected markets and could harm our profitability.
A future act of terrorism, the threat of such acts, or escalation of U.S. military involvement overseas could adversely affect our industry.
Even if not directed at the airline industry, a future act of terrorism, the threat of such acts, or escalation of U.S. military involvement overseas could have an adverse effect on the airline industry. In the event of a terrorist attack, the industry would likely experience significantly reduced demand for travel services. These actions, or consequences resulting from these actions, would likely harm our business and the airline and travel industry.
Changes in government laws and regulations imposing additional requirements and restrictions on our operations could increase our operating costs.
Airlines are subject to extensive regulatory and legal compliance requirements, both domestically and internationally, that involve significant costs. In the last several years, the FAA has issued a number of directives and other regulations relating to the maintenance and operation of aircraft that have required us to make significant expenditures. FAA requirements cover, among other things, retirement of older aircraft, fleet integration of newer aircraft, security measures, collision avoidance systems, airborne windshear avoidance systems, noise abatement, weight and payload limits, assumed average passenger weight, and increased inspection and maintenance procedures to be conducted on aging aircraft. The future cost of complying with these and other laws, rules and regulations, including new federal legislative and DOT regulatory requirements in the consumer-protection area, cannot be predicted and could significantly increase our costs of doing business.
FAA aging-aircraft regulations obligate aircraft design approval holders (typically the aircraft manufacturer or its successor) to establish a limit of validity ("LOV") of the engineering data that supports the aircraft’s structural maintenance program, demonstrate that widespread fatigue damage will not occur in aircraft of that type prior to reaching LOV, and establish or revise airworthiness limitations applicable to that aircraft type to include LOV. Once an LOV has been established for a given aircraft type, LOV-related maintenance actions must be incorporated into the operator’s maintenance program, and commercial operation of the aircraft beyond the LOV is prohibited unless an extended LOV is obtained for the aircraft. Based on the LOVs established for the aircraft types we operate, the number of flight cycles on our aircraft, and our annual usage of these aircraft, we do not believe the LOV rules will limit use of any of our aircraft before we retire them from our fleet in years to come. Nevertheless, it is not yet possible to predict the future cost of complying with aging aircraft requirements.
In recent years, the DOT has adopted revisions and expansions to a variety of its consumer protection regulations, including certain rules coming into effect in 2016. Additional new regulations may be proposed in 2016 as well. We are not able to predict the impact of any new consumer protection rules on our business, though we are monitoring the progress of potential rulings. We could be subject to fines or other enforcement actions if the DOT believes we are not in compliance with these or other rules or regulations or with the federal consumer protection laws administered by the DOT. Even if our practices were found to be in compliance with the DOT rules, we could incur substantial costs defending our practices.
In November 2013, the FAA proposed revisions to the method by which air carriers calculate and control aircraft weight-and-balance. The proposal is based on a continuing increase in the average weight of persons in the United States. If the revisions are adopted as proposed by the FAA, the ability of carriers to rely on average weights for this purpose will be complicated significantly, additional costs may result, and we may be required to carry less than full loads on certain flights.
16
In 2016, Congress may consider legislation that could increase the amount of Federal Excise Tax and/or one or more of the other government fees imposed on air travel. By increasing the overall price charged to passengers, any additional taxes or fees could lessen the demand for air travel or force carriers to lower fares to maintain demand. Congress also may consider privatization of the U.S. Air Traffic Control system with user fee based funding; the potential effect on our operating costs is unknown. Additionally, federal funding to airports and/or airport bond financing could be affected through future deficit reduction legislation, which could result in higher fees, rates, and charges at many of the airports we serve.
In the past, legislation to address climate change issues has been introduced in the U.S. Congress, including a proposal to require transportation fuel producers and importers to acquire market-based allowances to offset the emissions resulting from combustion of their fuels. We cannot predict whether this or any similar legislation will be introduced or pass the Congress or, if enacted into law, how it would apply to the airline industry. In addition, the EPA has concluded that current and projected concentrations of greenhouse gases in the atmosphere threaten public health and welfare. The EPA's finding could ultimately result in strict regulation of commercial aircraft emissions, as has taken effect for operations within the European Union under EU legislation. Binding international restrictions adopted under the auspices of the International Civil Aviation Organization (a specialized agency of the United Nations) may become effective within several years. These developments and any additional legislation or regulations addressing climate change are likely to increase our costs of doing business in the future and the increases could be material.
With respect to aging aircraft, aircraft weight-and-balance, consumer protection, climate change, taxation, and other matters affecting the airline industry, whether the source of new requirements is legislative or regulatory, increased costs will adversely affect our profitability if we are unable to pass the costs on to our customers or adjust our operations to offset the new costs.
Airlines are often affected by factors beyond their control, including air traffic congestion, weather conditions, increased security measures, and the outbreak of disease, any of which could harm our operating results and financial condition.
Like other airlines, we are subject to delays caused by factors beyond our control, including air traffic congestion at airports and en route, adverse weather conditions, increased security measures, and the outbreak of disease. Delays frustrate passengers and increase costs, which in turn could affect profitability. During periods of fog, snow, rain, storms or other adverse weather conditions, flights may be canceled or significantly delayed. Cancellations or delays due to weather conditions, traffic control problems, and breaches in security could harm our operating results and financial condition. Contagious illness and fear of contagion could have a material adverse impact on the airline industry. Any general reduction in airline passenger traffic as a result of an outbreak of disease or other travel advisories could dampen demand for our services even if not applicable to our markets. Resulting decreases in passenger volume would harm our load factors, could increase our cost per passenger and adversely affect our profitability.
Risks Related to Our Stock Price
The market price of our common stock may be volatile, which could cause the value of an investment in our stock to decline.
The market price of our common stock may fluctuate substantially due to a variety of factors, many of which are beyond our control, including:
|
•
|
fuel price volatility, and the effect of economic and geopolitical factors and worldwide oil supply and consumption on fuel availability
|
|
•
|
announcements concerning our competitors, the airline industry, or the economy in general
|
|
•
|
strategic actions by us or our competitors, such as acquisitions or restructurings
|
|
•
|
media reports and publications about the safety of our aircraft or the aircraft types we operate
|
|
•
|
new regulatory pronouncements and changes in regulatory guidelines
|
|
•
|
announcements concerning our business strategy
|
|
•
|
general and industry-specific economic conditions
|
|
•
|
changes in financial estimates or recommendations by securities analysts
|
|
•
|
substantial sales of our common stock or other actions by investors with significant shareholdings
|
|
•
|
additional issuances of our common stock
|
|
•
|
labor work actions
|
|
•
|
general market conditions
|
17
The stock markets in general have experienced substantial volatility that has often been unrelated to the operating performance of particular companies. These types of broad market fluctuations may adversely affect the trading price of our common stock.
In the past, stockholders have sometimes instituted securities class action litigation against companies following periods of volatility in the market price of their securities. Any similar litigation against us could result in substantial costs, divert management’s attention and resources, and harm our business or results of operations.
Our stock price could be adversely impacted if we are unable to continue to grow.
Network growth could become a challenge in the future as we continue to add more under-served cities to our network. If we are unable to continue to grow as rapidly as the market anticipates, our stock price could be negatively affected.
We may not be able to maintain or grow our ancillary revenues
.
Our business strategy includes expanding our ancillary products and services. We cannot ensure that passengers will pay for additional ancillary products and services we offer in the future, or that they will continue to pay for the ancillary products and services we currently offer. Regulatory changes could also adversely affect our ancillary revenue opportunities. Failure to maintain our ancillary revenues could have a material adverse effect on our results of operations, financial condition and stock price. If we are unable to maintain and grow these revenues, we may be unable to execute our strategy to continue to offer low base fares in order to stimulate demand.
Other companies may have difficulty acquiring us, even if doing so would benefit our stockholders, due to provisions under our corporate charter and bylaws, as well as Nevada law.
Provisions in our articles of incorporation, our bylaws, and under Nevada law could make it more difficult for other companies to acquire us, even if doing so would benefit our stockholders. Our articles of incorporation and bylaws contain the following provisions, among others, which may inhibit an acquisition of our company by a third party:
|
•
|
advance notification procedures for matters to be brought before stockholder meetings
|
|
•
|
a limitation on who may call stockholder meetings
|
|
•
|
the ability of our board of directors to issue up to 5,000,000 shares of preferred stock without a stockholder vote
|
We are also subject to provisions of Nevada law that prohibit us from engaging in any business combination with any “interested stockholder,” meaning generally that a stockholder who beneficially owns 10 percent or more of our stock cannot acquire us for a period of time after the date this person became an interested stockholder, unless various conditions are met, such as approval of the transaction by our board of directors and stockholders.
Under U.S. laws and the regulations of the DOT, U.S. citizens must effectively control us. As a result, our president and at least two-thirds of our board of directors must be U.S. citizens and not more than 25 percent of our voting stock may be owned by non-U.S. citizens (although subject to DOT approval, the percent of foreign economic ownership may be as high as 49 percent). Any of these restrictions could have the effect of delaying or preventing a change in control.
Our corporate charter and bylaws include provisions limiting voting by non-U.S. citizens.
To comply with restrictions imposed by federal law on foreign ownership of U.S. airlines, our articles of incorporation and bylaws restrict voting of shares of our capital stock by non-U.S. citizens. The restrictions imposed by federal law currently require no more than 25 percent of our stock be voted, directly or indirectly, by persons who are not U.S. citizens, and that our president and at least two-thirds of the members of our board of directors be U.S. citizens. Our bylaws provide no shares of our capital stock may be voted by or at the direction of non-U.S. citizens unless such shares are registered on a separate stock record, which we refer to as the foreign stock record. Our bylaws further provide no shares of our capital stock will be registered on the foreign stock record if the amount so registered would exceed the foreign ownership restrictions imposed by federal law. Registration on the foreign stock record is made in chronological order based on the date we receive a written request for registration. Non-U.S. citizens will be able to own and vote shares of our common stock only if the combined ownership by all non-U.S. citizens does not violate these requirements.
Not Applicable.
18
Aircraft
The following table summarizes our total in-service aircraft as of
February 1, 2016
:
|
Aircraft Type
|
Owned (1)
|
Seating Capacity
(per aircraft) |
Age range (years)
|
Average Age
in Years |
||||||
|
MD-83/88
|
51
|
|
166
|
|
20-30
|
26.0
|
||||
|
Boeing 757-200
|
5
|
|
215
|
|
22-24
|
22.8
|
||||
|
Airbus A319 (2)
|
10
|
|
156
|
|
10-12
|
11.0
|
||||
|
Airbus A320
|
16
|
|
177
|
|
14-19
|
15.9
|
||||
|
Total aircraft
|
82
|
|
|
|
||||||
|
(1)
|
Refer to Item 8 – Financial Statements and Supplementary Data – Notes to Consolidated Financial Statements – Note 5 – Long-Term Debt for discussion of notes payable collateralized by our aircraft.
|
|
(2)
|
Does not include 12 owned aircraft currently on lease to a European carrier until 2018 or one aircraft being prepared for revenue service as of the date indicated.
|
As of
February 1, 2016
, we have entered into forward purchase agreements for 11 Airbus A320 series aircraft for which we have not yet taken delivery. We expect delivery of seven aircraft in 2016 and the remaining four in the first half of 2017.
The below table includes the number of aircraft expected in service by the end of 2016:
|
MD-80
|
46
|
|
|
|
B757-200
|
5
|
|
|
|
A319
|
17
|
|
|
|
A320
|
16
|
|
|
|
Total
|
84
|
|
|
Ground Facilities
We lease facilities at the majority of our leisure destinations and several other airports we serve. Our leases for terminal passenger services facilities, which include ticket counter and gate space, and operations support areas, generally have a term ranging from month-to-month to several years, and may typically be terminated with a 30 to 90 day notice. We have also entered into use agreements at each of the airports we serve which provide for non-exclusive use of runways, taxiways, and other facilities. Landing fees under these agreements are based on the number of landings and weight of the aircraft.
We have operational bases at airports for many of the leisure destinations we serve, as well as Bellingham International Airport, Pittsburgh International Airport, Cincinnati/Northern Kentucky International Airport, and Asheville Regional Airport. Our operational bases in Myrtle Beach and Los Angeles are maintained on a seasonal basis.
We use leased facilities at our operational bases to perform line maintenance, overnight parking of aircraft, and other operations support. We lease additional space in cargo areas at the McCarran International Airport, Orlando Sanford International Airport and the Phoenix-Mesa Gateway Airport for our primary line maintenance operations. We also lease additional warehouse space in Las Vegas, Orlando Sanford, and Phoenix-Mesa for aircraft parts and supplies.
19
The following details the airport locations we utilize as operational bases as of February 1, 2016:
|
Airport
|
|
Location
|
|
|
|
|
|
Asheville Regional Airport
|
Fletcher, North Carolina
|
|
|
Bellingham International Airport
|
|
Bellingham, Washington
|
|
Cincinnati/Northern Kentucky International Airport
|
Hebron, Kentucky
|
|
|
Ft. Lauderdale-Hollywood International Airport
|
|
Ft. Lauderdale, Florida
|
|
Honolulu International Airport
|
|
Honolulu, Hawaii
|
|
Los Angeles International Airport
|
Los Angeles, California
|
|
|
McCarran International Airport
|
|
Las Vegas, Nevada
|
|
Myrtle Beach International Airport
|
Myrtle Beach, South Carolina
|
|
|
Oakland International Airport
|
|
Oakland, California
|
|
Orlando Sanford International Airport
|
|
Sanford, Florida
|
|
Phoenix-Mesa Gateway Airport
|
|
Mesa, Arizona
|
|
Pittsburgh International Airport
|
Pittsburgh, Pennsylvania
|
|
|
Punta Gorda Airport
|
|
Punta Gorda, Florida
|
|
St. Petersburg-Clearwater International Airport
|
|
St. Petersburg, Florida
|
We believe we have sufficient access to gate space for current and presently contemplated future operations at all airports we serve.
Our primary corporate offices are located in Las Vegas, where we own approximately 11 acres of property containing approximately 211,000 square feet of office space. To date, we occupy approximately 109,000 square feet and the remaining space will be used for growth and expansion as needed.
We also lease two other facilities in Las Vegas with approximately
10,000
and 87,000 square feet of space which are used for corporate and training purposes.
In November 2013, the International Brotherhood of Teamsters ("IBT") commenced an action in the United States District Court for the District of Nevada on behalf of Allegiant Air's pilots, claiming that we unilaterally changed existing work rules in violation of what it alleged was an obligation we had under the Railway Labor Act (RLA) to maintain the status quo during contract negotiations with IBT. The suit focused, in large part, on our implementation of a new flight duty crew scheduling system to comply with revised FAA pilot flight, duty, and rest regulations that became effective in January 2014. The court issued a preliminary injunction in July 2014 requiring us to make certain changes to our policies to be consistent with prior practices affecting the pilots. On appeal, the U.S. Court of Appeals for the Ninth Circuit issued a decision in June 2015 vacating the injunction on the grounds that we were not under any obligation to maintain the status quo during negotiations with the IBT. IBT has agreed to dismiss the underlying lawsuit in light of the appellate decision.
On March 30, 2015, concerned about rumors of a threatened strike by our pilots, we commenced an action in the United States District for the District of Nevada seeking to enjoin the pilots from striking, on the grounds that such an action would be unlawful under the RLA. The court granted our motion and enjoined the threatened strike. After IBT appealed that order, the appellate court issued its decision in the litigation described above, which removed the legal basis for IBT’s theory that it could lawfully strike. IBT thus withdrew its appeal in this matter, and we have agreed to dismiss the underlying lawsuit.
In January 2015, we filed a declaratory judgment action in the Nevada District Court in Clark County, Nevada, against Windmill Durango Office, LLC in connection with our exercise of the early termination option with respect to our ten year lease of our former Company headquarters. The lawsuit sought clarification as to the amount of unamortized costs owed to the landlord on lease termination, and whether the early termination option was properly exercised. Our chairman of the board and another director own a 30 percent and 11.4 percent interest in the landlord entity, respectively, but neither has ever had the right to direct or participate in the management of the company. In January 2016, the lawsuit was settled by our payment of $1.3 million to the landlord and agreement that the lease has been terminated.
20
We are subject to certain other legal and administrative actions we consider routine to our business activities. We believe the ultimate outcome of any pending legal or administrative matters will not have a material adverse effect on our financial position, liquidity, or results of operations.
Not applicable.
21
Market for our common stock
Our common stock is quoted on the Nasdaq Global Select Market (symbol: ALGT). On
February 1, 2016
, the last sale price of our common stock was
$166.65
per share. The following table sets forth the range of high and low sale prices for our common stock for the periods indicated.
|
Period
|
High
|
Low
|
||||||
|
2015
|
|
|
||||||
|
1st Quarter
|
$
|
199.20
|
|
$
|
144.51
|
|
||
|
2nd Quarter
|
$
|
191.40
|
|
$
|
151.04
|
|
||
|
3rd Quarter
|
$
|
238.13
|
|
$
|
175.00
|
|
||
|
4th Quarter
|
$
|
228.79
|
|
$
|
166.59
|
|
||
|
2014
|
|
|
|
|
||||
|
1st Quarter
|
$
|
112.44
|
|
$
|
81.19
|
|
||
|
2nd Quarter
|
$
|
124.61
|
|
$
|
109.02
|
|
||
|
3rd Quarter
|
$
|
128.55
|
|
$
|
113.79
|
|
||
|
4th Quarter
|
$
|
152.14
|
|
$
|
104.52
|
|
||
As of
February 1, 2016
, there were
101
holders of record of our common stock. Because many of our shares are held by brokers and other institutions on behalf of shareholders, we are unable to estimate the total number of beneficial holders.
Securities Authorized for Issuance under Equity Compensation Plans
The following table provides information regarding options, warrants and other rights to acquire equity securities under our equity compensation plans as of
December 31, 2015
:
|
|
Number of Securities to be Issued upon Exercise of Outstanding Options, Warrants and Rights (a)
|
Weighted-Average Exercise Price of Outstanding Options, Warrants and Rights
|
Number of Securities Remaining Available for Future Issuance under Equity Compensation Plans (b)
|
|||||||
|
Equity compensation plans approved by security holders (c)
|
48,781
|
|
$
|
86.65
|
|
1,145,540
|
|
|||
|
(a)
|
The shares shown as being issuable under equity compensation plans approved by our security holders excludes unvested restricted stock awards of
82,957
as all restricted stock awards are deemed to have been issued, and excludes all outstanding stock appreciation rights ("SARs") which are settled in cash.
|
|
(b)
|
The shares shown as remaining available for future issuance under equity compensation plans is reduced by the number of outstanding cash-settled SARs. Although these cash-settled SARs will not result in the issuance of shares, the number of cash-settled SARs awarded reduces the number of shares available for other awards.
|
|
(c)
|
There are no securities to be issued under any equity compensation plans not approved by our security holders.
|
Dividend Policy
In
2015
, we commenced the payment of a regular quarterly dividend. The initial dividend was set at $0.25 per share per quarter which was increased to $0.30 per share per quarter in third quarter 2015. In December 2015, our Board of Directors also declared a special dividend of $1.65 per share, increasing the total dividends declared in 2015 to
$2.75
per share. We paid dividends of
$2.50
per share in
2014
and
$2.25
per share in
2013
. In addition to our regular cash dividends, our Board of
22
Directors intends to periodically consider the payment of special cash dividends based on our results of operations, cash flow generation, liquidity, capital commitments, loan covenant compliance and other relevant factors.
The indenture governing our senior unsecured notes contains limitations on restricted payments, which includes stock repurchases and cash dividends. However, no limit applies if we maintain certain financial ratios. For the year ended December 31, 2015, we complied with such ratios and, as a result, we are not currently limited on the payment of cash dividends or stock repurchases. The calculation is to be made on a quarterly basis based on the trailing 12 months. There can be no assurance we will be able to maintain compliance with these financial ratios indefinitely in the future and, if not, our ability to pay cash dividends or repurchase stock may be limited.
Our Repurchases of Equity Securities
The following table reflects our repurchases of our common stock during the fourth quarter of
2015
:
|
Period
|
Total Number of Shares Purchased
|
Average Price Paid per Share
|
Total Number of
Shares Purchased as Part of Publicly Announced Plans or Programs |
Approximate Dollar Value of Shares that
May Yet be Purchased Under the Plans or Programs (in thousands) |
||||||||||
|
October
|
37,400
|
|
$
|
203.67
|
|
37,400
|
|
|
|
|||||
|
November
|
None
|
|
N/A
|
|
None
|
|
|
|
||||||
|
December
|
None
|
|
N/A
|
|
None
|
|
|
|
||||||
|
Total
|
37,400
|
|
$
|
203.67
|
|
37,400
|
|
$
|
54,085
|
|
||||
23
Stock Price Performance Graph
The following graph compares the cumulative total shareholder return on our common stock with the cumulative total return on the Nasdaq Composite Index and the AMEX Airline Index since December 31, 2010. The graph assumes that the value of the investment in our common stock and each index was $100 on December 31, 2010 and the reinvestment of all dividends. Stock price performance presented for the period from December 31, 2010 to December 31, 2015 is not necessarily indicative of future results.
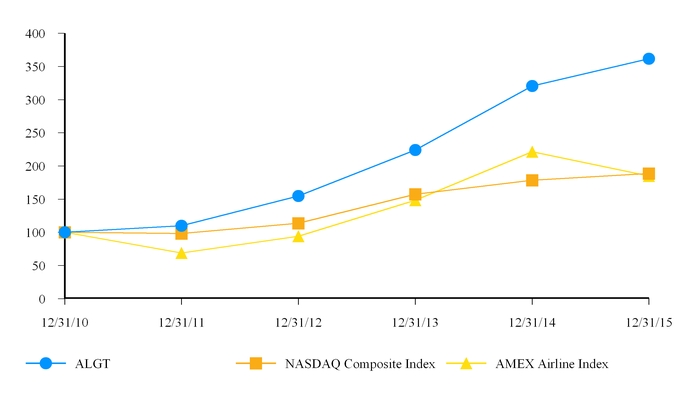
|
|
12/31/2010
|
12/31/2011
|
12/31/2012
|
12/31/2013
|
12/31/2014
|
12/31/2015
|
||||||||||||||||||
|
ALGT
|
$
|
100.00
|
|
$
|
109.85
|
|
$
|
154.67
|
|
$
|
224.29
|
|
$
|
320.53
|
|
$
|
361.66
|
|
||||||
|
Nasdaq Composite Index
|
$
|
100.00
|
|
$
|
98.20
|
|
$
|
113.82
|
|
$
|
157.44
|
|
$
|
178.53
|
|
$
|
188.75
|
|
||||||
|
AMEX Airline Index
|
$
|
100.00
|
|
$
|
68.99
|
|
$
|
94.11
|
|
$
|
148.34
|
|
$
|
221.57
|
|
$
|
184.99
|
|
||||||
The stock price performance graph shall not be deemed incorporated by reference by any general statement incorporating by reference this annual report on Form 10-K into any filing under the Securities Act of 1933 or under the Securities Exchange Act of 1934, except to the extent that we specifically incorporate this information by reference, and shall not otherwise be deemed filed under such Acts.
24
The following financial information for each of the five years ended December 31, has been derived from our consolidated financial statements. Readers should consider the selected consolidated financial data set forth below along with “Management’s Discussion and Analysis of Financial Condition and Results of Operations” and our consolidated financial statements and related notes. Certain presentation changes and reclassifications have been made to prior year consolidated financial information to conform to
2015
classifications.
|
|
For the Year Ended December 31,
|
|||||||||||||||||||
|
FINANCIAL DATA
(in thousands except per share amounts)
:
|
2015
|
2014
|
2013
|
2012
|
2011
|
|||||||||||||||
|
Total operating revenue
|
$
|
1,262,188
|
|
$
|
1,137,046
|
|
$
|
996,150
|
|
$
|
908,719
|
|
$
|
779,117
|
|
|||||
|
Total operating expenses
|
890,486
|
|
979,701
|
|
841,413
|
|
776,415
|
|
693,673
|
|
||||||||||
|
Operating income
|
371,702
|
|
157,345
|
|
154,737
|
|
132,304
|
|
85,444
|
|
||||||||||
|
Total other expense
|
24,983
|
|
20,214
|
|
8,057
|
|
7,657
|
|
5,930
|
|
||||||||||
|
Income before income taxes
|
346,719
|
|
137,131
|
|
146,680
|
|
124,647
|
|
79,514
|
|
||||||||||
|
Net income
|
220,330
|
|
86,303
|
|
91,779
|
|
78,414
|
|
49,398
|
|
||||||||||
|
Net loss attributable to noncontrolling interest
|
(44
|
)
|
(386
|
)
|
(494
|
)
|
(183
|
)
|
—
|
|
||||||||||
|
Net income attributable to Allegiant Travel Company
|
$
|
220,374
|
|
$
|
86,689
|
|
$
|
92,273
|
|
$
|
78,597
|
|
$
|
49,398
|
|
|||||
|
Earnings per share to common stockholders
(1)
:
|
|
|
|
|
|
|
|
|
|
|
||||||||||
|
Basic
|
$
|
12.97
|
|
$
|
4.87
|
|
$
|
4.85
|
|
$
|
4.10
|
|
$
|
2.59
|
|
|||||
|
Diluted
|
$
|
12.94
|
|
$
|
4.86
|
|
$
|
4.82
|
|
$
|
4.06
|
|
$
|
2.57
|
|
|||||
|
Cash dividends declared per share
|
$
|
2.75
|
|
$
|
2.50
|
|
$
|
2.25
|
|
$
|
2.00
|
|
$
|
—
|
|
|||||
|
Cash and cash equivalents
|
$
|
87,112
|
|
$
|
89,610
|
|
$
|
97,711
|
|
$
|
89,557
|
|
$
|
150,740
|
|
|||||
|
Investment securities
|
310,335
|
|
327,207
|
|
289,415
|
|
263,169
|
|
168,786
|
|
||||||||||
|
Total assets
(2)
|
1,351,662
|
|
1,235,080
|
|
927,917
|
|
796,480
|
|
704,658
|
|
||||||||||
|
Long-term debt
(2)
|
567,609
|
|
536,189
|
|
236,574
|
|
152,566
|
|
148,154
|
|
||||||||||
|
Stockholders' equity
|
350,005
|
|
294,065
|
|
377,317
|
|
401,724
|
|
351,504
|
|
||||||||||
|
Operating margin %
|
29.4
|
%
|
13.8
|
%
|
15.5
|
%
|
14.6
|
%
|
11.0
|
%
|
||||||||||
|
Cash provided by (used in):
|
|
|
|
|
|
|
|
|
|
|
||||||||||
|
Operating activities
|
$
|
365,367
|
|
$
|
269,781
|
|
$
|
196,888
|
|
$
|
176,772
|
|
$
|
129,911
|
|
|||||
|
Investing activities
|
(234,218
|
)
|
(315,248
|
)
|
(192,832
|
)
|
(208,827
|
)
|
(208,223
|
)
|
||||||||||
|
Financing activities
|
(133,647
|
)
|
37,366
|
|
4,098
|
|
(29,128
|
)
|
115,759
|
|
||||||||||
|
Consolidated statements of income data excluding special charge
(3)
:
|
||||||||||||||||||||
|
Operating income excluding special charge
|
$
|
371,702
|
|
$
|
200,625
|
|
$
|
154,737
|
|
$
|
132,304
|
|
$
|
85,444
|
|
|||||
|
Net income excluding special charge
|
220,330
|
|
113,526
|
|
91,779
|
|
78,414
|
|
49,398
|
|
||||||||||
|
(1)
|
Our unvested restricted stock awards are considered participating securities as they receive non-forfeitable rights to cash dividends at the same rate as common stock. The Basic and Diluted earnings per share for the periods presented reflect the two-class method mandated by accounting guidance for the calculation of earnings per share. The two-class method adjusts both the net income and shares used in the calculation. Application of the two-class method did not have a significant impact on the Basic or Diluted earnings per share for the periods presented.
|
|
(2)
|
Historical amounts have been reclassified to align with current presentation. See Note 2 to the Consolidated Financial Statements - Summary of Significant Accounting Policies - Recent Accounting Pronouncements for further information.
|
|
(3)
|
Special charge is a non-cash impairment charge of $43.3 million taken on our six Boeing 757 aircraft, engines and related assets in the fourth quarter of 2014. Refer to Note 2 - Summary of Significant Accounting Policies - Measurement of Impairment of Long-Lived Assets for further discussion.
|
25
|
|
For the Year Ended December 31,
|
||||||||||||||||||
|
OPERATING DATA:
|
2015
|
2014
|
2013
|
2012
|
2011
|
||||||||||||||
|
Total system statistics:
|
|
|
|
|
|
||||||||||||||
|
Passengers
|
9,500,611
|
|
8,154,357
|
|
7,241,063
|
|
6,987,324
|
|
6,175,808
|
|
|||||||||
|
Revenue passenger miles (RPMs) (thousands)
|
8,944,952
|
|
7,825,962
|
|
7,129,416
|
|
6,514,056
|
|
5,640,577
|
|
|||||||||
|
Available seat miles (ASMs) (thousands)
|
10,526,610
|
|
8,945,616
|
|
8,146,135
|
|
7,487,276
|
|
6,364,243
|
|
|||||||||
|
Load factor
|
85.0
|
%
|
87.5
|
%
|
87.5
|
%
|
87.0
|
%
|
88.6
|
%
|
|||||||||
|
Operating expense per ASM (CASM) (cents)
|
8.45
|
|
10.95
|
|
10.33
|
|
10.37
|
|
10.90
|
|
|||||||||
|
Fuel expense per ASM (cents)
|
2.64
|
|
4.34
|
|
4.73
|
|
5.05
|
|
5.20
|
|
|||||||||
|
Operating CASM, excluding fuel (cents)
|
5.81
|
|
6.61
|
|
5.60
|
|
5.32
|
|
5.70
|
|
|||||||||
|
ASMs per gallon of fuel
|
70.20
|
|
69.38
|
|
67.62
|
|
63.00
|
|
59.10
|
|
|||||||||
|
Departures
|
68,653
|
|
56,961
|
|
51,083
|
|
53,615
|
|
49,360
|
|
|||||||||
|
Block hours
|
160,431
|
|
135,572
|
|
125,449
|
|
124,610
|
|
113,691
|
|
|||||||||
|
Average stage length (miles)
|
900
|
|
918
|
|
933
|
|
872
|
|
858
|
|
|||||||||
|
Average number of operating aircraft during period
|
74.3
|
|
68.8
|
|
62.9
|
|
60.2
|
|
52.2
|
|
|||||||||
|
Average block hours per aircraft per day
|
5.9
|
|
5.4
|
|
5.5
|
|
5.7
|
|
6.0
|
|
|||||||||
|
Full-time equivalent employees at end of period
|
2,846
|
|
2,411
|
|
2,065
|
|
1,821
|
|
1,595
|
|
|||||||||
|
Fuel gallons consumed (thousands)
|
149,951
|
|
128,933
|
|
120,476
|
|
118,839
|
|
107,616
|
|
|||||||||
|
Average fuel cost per gallon
|
$
|
1.86
|
|
$
|
3.01
|
|
$
|
3.20
|
|
$
|
3.18
|
|
$
|
3.07
|
|
||||
|
Scheduled service statistics:
|
|
|
|
|
|
|
|
|
|
|
|||||||||
|
Passengers
|
9,355,097
|
|
8,017,442
|
|
7,103,375
|
|
6,591,707
|
|
5,776,462
|
|
|||||||||
|
Revenue passenger miles (RPMs) (thousands)
|
8,821,908
|
|
7,711,696
|
|
7,015,108
|
|
6,220,320
|
|
5,314,976
|
|
|||||||||
|
Available seat miles (ASMs) (thousands)
|
10,236,075
|
|
8,693,631
|
|
7,892,896
|
|
6,954,408
|
|
5,797,753
|
|
|||||||||
|
Load factor
|
86.2
|
%
|
88.7
|
%
|
88.9
|
%
|
89.4
|
%
|
91.7
|
%
|
|||||||||
|
Departures
|
65,683
|
|
54,440
|
|
48,389
|
|
46,995
|
|
42,586
|
|
|||||||||
|
Block hours
|
155,403
|
|
131,210
|
|
120,620
|
|
113,671
|
|
101,980
|
|
|||||||||
|
Total scheduled service revenue per ASM (TRASM)* (cents)
|
11.82
|
|
12.66
|
|
12.37
|
|
12.33
|
|
12.50
|
|
|||||||||
|
Average fare - scheduled service
|
$
|
78.63
|
|
$
|
91.30
|
|
$
|
91.69
|
|
$
|
88.90
|
|
$
|
89.15
|
|
||||
|
Average fare - ancillary air-related charges
|
$
|
46.43
|
|
$
|
41.37
|
|
$
|
40.52
|
|
$
|
35.72
|
|
$
|
31.18
|
|
||||
|
Average fare - ancillary third party products
|
$
|
4.29
|
|
$
|
4.56
|
|
$
|
5.21
|
|
$
|
5.48
|
|
$
|
5.18
|
|
||||
|
Average fare - total
|
$
|
129.35
|
|
$
|
137.23
|
|
$
|
137.42
|
|
$
|
130.10
|
|
$
|
125.51
|
|
||||
|
Average stage length (miles)
|
915
|
|
934
|
|
952
|
|
918
|
|
901
|
|
|||||||||
|
Fuel gallons consumed (thousands)
|
145,654
|
|
125,173
|
|
116,370
|
|
109,257
|
|
96,999
|
|
|||||||||
|
Average fuel cost per gallon
|
$
|
1.87
|
|
$
|
3.05
|
|
$
|
3.25
|
|
$
|
3.37
|
|
$
|
3.30
|
|
||||
|
Percent of sales through website during period
|
95.1
|
%
|
93.8
|
%
|
92.0
|
%
|
90.1
|
%
|
88.8
|
%
|
|||||||||
|
*
|
Various components of this measure do not have a direct correlation to ASMs. These figures are provided on a per ASM basis so as to facilitate comparisons with airlines reporting revenues on a per ASM basis.
|
The following terms used in this section and elsewhere in this annual report have the meanings indicated below:
“
Available seat miles
” or “
ASMs
” represents the number of seats available for passengers multiplied by the number of miles the seats are flown.
“
Average fuel cost per gallon
” represents total aircraft fuel expense for our total system or for scheduled service, divided by the total number of fuel gallons consumed in our total system or in scheduled service, as applicable.
“
Average stage length
” represents the average number of miles flown per flight.
“Block hours”
represents the number of hours during which the aircraft is in revenue service, measured from the time of gate departure until the time of gate arrival at the destination.
26
“
Load factor
” represents the percentage of aircraft seating capacity that is actually utilized (revenue passenger miles divided by available seat miles).
“
Operating expense per ASM
” or “
CASM
” represents operating expenses divided by available seat miles.
“
Operating CASM, excluding fuel
” represents operating expenses, less aircraft fuel, divided by available seat miles. Although Operating CASM, excluding fuel is not a calculation based on generally accepted accounting principles and should not be considered as an alternative to Operating Expenses as an indicator of our financial performance, this statistic provides management and investors the ability to measure and monitor our cost performance absent fuel price volatility. Both the cost and availability of fuel are subject to many economic and political factors and therefore are beyond our control.
“
Passengers
” represents the total number of passengers flown on all flight segments.
“
Revenue passenger miles
” or
“RPMs”
represents the number of miles flown by revenue passengers.
“Total scheduled service revenue per ASM”
or
“TRASM”
represents scheduled service revenue and total ancillary revenue divided by scheduled service available seat miles.
The following discussion and analysis presents factors that had a material effect on our results of operations during the years ended
December 31, 2015
,
2014
and
2013
. Also discussed is our financial position as of
December 31, 2015
and
2014
. Investors should read this discussion in conjunction with our consolidated financial statements, including the notes thereto, appearing elsewhere in this annual report. This discussion and analysis contains forward-looking statements. Please refer to the section entitled “Disclosure Regarding Forward-Looking Statements” at the beginning of this annual report on Form 10-K for a discussion of the uncertainties, risks and assumptions associated with these statements.
YEAR IN REVIEW
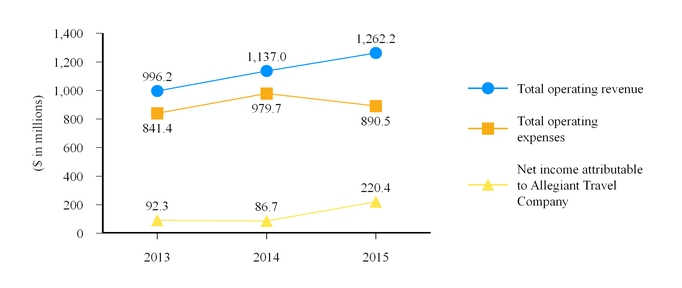
Notable 2015 highlights:
|
•
|
Total operating revenue increase of $125.1 million, or
11.0 percent
;
|
|
•
|
operating margin of
29.4 percent
;
|
|
•
|
increase in net income of $107.2 million over 2014, excluding the after tax effect of a one-time non-cash impairment charge of $43.3 million;
|
|
•
|
$12.94
earnings per share (fully diluted);
|
|
•
|
selling of 296 routes at December 31, 2015 versus 233 in 2014;
|
|
•
|
addition of 13 Airbus A320 series aircraft into revenue service and signing of contracts which will increase the number of owned Airbus aircraft to 50;
|
27
|
•
|
establishment of a quarterly cash dividend;
|
|
•
|
return of
$129.5 million
to shareholders through stock repurchases, as well as
$18.7 million
paid as recurring cash dividends and $27.7 million special cash dividends paid in January 2016, bringing total 2015 dividends declared to
$2.75
per share;
|
|
•
|
signing of a seven year co-brand credit card agreement effective in 2016 and;
|
|
•
|
signing of a four year charter agreement with Apple Vacations to provide travel to destinations including Cancun, Mexico and Punta Cana, Dominican Republic.
|
Overview
Our average number of aircraft in revenue service increased 8.0 percent compared to 2014. We also increased utilization by
9.3 percent
to
5.9
hours per day during 2015, which allowed us to continue to increase scheduled service capacity and grow departures. We also retired two MD-80 aircraft and one Boeing 757-200 aircraft as part of our long-term fleet strategy.
Ancillary revenue optimization efforts, as well as an increase to our customer convenience fee, led to a
30.9 percent
increase in ancillary air-related revenue and a
9.4 percent
increase in total ancillary revenue per ASM in
2015
over
2014
.
Favorable fuel prices and cost control allowed us to accelerate our growth and decrease unitized costs compared to 2014. Excluding a one-time impairment charge of $43.3 million taken in 2014, operating expense per available seat mile or "CASM" decreased 19.2 percent in 2015 from 2014, which was largely attributable to a drop in system average price per gallon.
Our strong liquidity position continues to provide us the ability to invest in the growth of our fleet while returning cash to shareholders.
As of December 31, 2015
, we have acquired 27 Airbus A320 series aircraft, eight of which remain unencumbered. In addition, we also own 12 Airbus A319 aircraft for future inclusion in our fleet, which are currently on lease to a European carrier.
AIRCRAFT
Operating Fleet
The following table sets forth the number and type of aircraft in service and operated by us as of the dates indicated:
|
December 31, 2015
|
December 31, 2014
|
December 31, 2013
|
||||||
|
MD83/88
|
51
|
|
53
|
|
52
|
|
||
|
B757-200
|
5
|
|
6
|
|
6
|
|
||
|
A319 (1)
|
10
|
|
4
|
|
3
|
|
||
|
A320 (1)
|
14
|
|
7
|
|
5
|
|
||
|
Total
|
80
|
|
70
|
|
66
|
|
||
(1) Does not include aircraft acquired but not yet in revenue service or temporarily stored as of the date indicated.
As of
February 22, 2016
, we have entered into purchase agreements for 11 additional Airbus A320 series aircraft which we expect to be delivered in 2016 and 2017. We also have 12 Airbus A319 aircraft on lease to a European carrier until 2018, which we plan to subsequently add to our operating fleet.
We believe our current fleet count, coupled with the purchase and acquisition of additional used Airbus A320 series aircraft under contract, will meet our aircraft needs to support planned growth beyond
2017
. Refer to Part I - Item 2-Properties for further detail. We continuously consider other aircraft acquisitions on an opportunistic basis.
NETWORK
We use profitability management tools to manage capacity and route expansion through optimization of our flight schedule to, among other things, better match demand in certain markets. We continually adjust our network through the addition of new markets and routes, adjusting the frequencies into existing markets, and exiting under-performing markets, as we seek to achieve and maintain profitability on each route we serve.
28
TRASM decreased to
11.82¢
in
2015
from
12.66¢
in
2014
due to our significant capacity growth in the current year. Our increased capacity growth was the result of a 37.3 percent increase year-over-year in off-peak flying (day of the week and seasonally), and new markets (those operating for less than one year) accounted for 11.6 percent of our total growth, both of which had a negative effect on unit revenue. However, our profitability increased year over year as our operating expense per passenger decreased by 22 percent compared to 2014.
Although the current fuel environment has enabled us to grow capacity substantially and increase off-peak flying, in the long-term, we continue to focus on operating a higher percentage of our flights during peak days of the week, adjusting as needed for seasonality. If fuel prices were to rise in the future, we would discontinue unprofitable off-peak flying. We believe this capacity optimization strategy will continue to contribute to the achievement of our profitability goals.
During
2015
, we added service to four leisure destinations, commenced service on 69 new routes, and discontinued service on under-performing routes. Based on our currently published schedule through August 2016, we plan to increase total routes to 322, increase the number of leisure destinations served to 19, and increase the number of cities served to 92. The following table shows the number of leisure destinations and cities served as of the dates indicated (includes cities served seasonally):
|
December 31, 2015
|
December 31, 2014
|
December 31, 2013
|
||||||
|
Leisure destinations
|
17
|
|
13
|
|
14
|
|
||
|
Under-served cities
|
88
|
|
83
|
|
86
|
|
||
|
Total cities
|
105
|
|
96
|
|
100
|
|
||
|
Total routes
|
296
|
|
233
|
|
226
|
|
||
TRENDS
Favorable fuel prices throughout 2015, and continuing into 2016, have allowed us to profitably increase capacity, including additional off-peak flying, and pursue further expansion into markets we have not previously serviced. Fuel costs, in the long-term, remain uncertain and cost volatility could materially affect our future operating expenses.
We retired one of our six Boeing 757 aircraft in fourth quarter 2015 and expect to retire the remaining five by the end of the 2017 winter holiday period. Although our MD-80 fleet remains part of our future fleet plan, we plan to systematically retire these aircraft as A320 series aircraft are placed in service and as our flight schedule needs permit.
We continue to add service from medium-sized cities which are not usually considered core hubs for legacy carriers, and to which many major carriers have reduced service, creating a void for us to fill with limited or no direct nonstop competition. In general, we define medium-sized cities as those with origin and destination statistics between the 20th and 70th largest U.S. cities. Additionally, with our network expansion, our East Coast markets now represent more than 50 percent of our routes.
Although we believe our nonstop service and low prices make it attractive for leisure travelers to purchase our travel services and products, we may, in the future, experience increased competition following the entrance into these larger markets.
We have two employee groups which have voted for union representation: pilots and flight attendants. These employees make up approximately half of our total employee base. Any labor actions following an inability to reach collective bargaining agreements with these employee groups could materially impact our operations during the continuance of any such activity.
Our Operating Expenses
A brief description of the items included in our operating expense line items follows.
Aircraft fuel expense includes the cost of aircraft fuel, fuel taxes, into plane fees and airport fuel flowage, storage or through-put fees. Under our largest fixed fee contract, our customer reimburses us for fuel costs. These amounts are netted against our fuel expense.
Salary and benefits expense includes wages, salaries, and employee bonuses, sales commissions for in-flight personnel, as well as expenses associated with employee benefit plans, stock compensation expense related to equity grants, and employer payroll taxes.
29
Station operations expense includes the fees charged by airports for the use or lease of airport facilities and fees charged by third party vendors for ground handling services, commissary expenses and other related services.
Maintenance and repairs expense includes all parts, materials and spares required to maintain our aircraft. Also included are fees for repairs performed by third party vendors.
Sales and marketing expense includes all advertising, promotional expenses, travel agent commissions and debit and credit card processing fees associated with the sale of scheduled service and air-related ancillary charges, net of credit card fee reimbursement charges collected from customers.
Aircraft lease rentals expense consists of the cost of leasing aircraft under operating leases with third parties as well as costs for sub-service contracted out.
Depreciation and amortization expense includes the depreciation of all fixed assets, including owned aircraft and engines.
Other expense includes travel and training expenses for crews and ground personnel, facility lease expenses, professional fees, personal property taxes, information technology consulting, the cost of passenger liability insurance, aircraft hull insurance and all other insurance policies excluding employee welfare insurance. Additionally, this expense includes loss on disposals of aircraft and other equipment disposals, and all other administrative and operational overhead expenses not included in other line items above.
RESULTS OF OPERATIONS
2015
compared to
2014
Operating Revenue
Scheduled service revenue.
Scheduled service revenue for
2015
increased by
$3.5 million
compared with
2014
. The increase was primarily driven by a
16.7 percent
increase in the number of scheduled service passengers, which was impacted by a
2.5 percent
decrease in load factor attributable to more off-peak flying. This, as well as additional flying into new markets (those operating for less than one year), has put pressure on our base fares and led to a
13.9 percent
decrease in scheduled service average base fare. Our fares were also impacted by increased government mandated taxes which contributed to the decrease in per-passenger scheduled service revenue for 2015 compared to 2014, as we have not been able to pass on the entire increase to the customer without impacting demand.
Ancillary air-related revenue.
Ancillary air-related revenue for
2015
increased
$102.6
million, or
30.9 percent
, compared with
2014
, due mostly to the
16.7 percent
increase in scheduled service passengers as well as continued revenue optimization efforts. In addition, an increase to our customer convenience fee, and effective yield management of other existing products, drove a
12.2 percent
increase in average ancillary air-related fare per passenger.
Ancillary third party revenue.
The following table details the calculation of ancillary revenue from third party products. Third party products consist of revenue from the sale of hotel rooms, ground transportation (rental cars and hotel shuttle products), attraction and show tickets, and fees we receive from other merchants selling products through our website:
|
|
For the Year Ended December 31,
|
Percentage
|
|||||||||
|
(in thousands except room nights and rental car days)
|
2015
|
2014
|
Change
|
||||||||
|
Gross ancillary revenue - third party products
|
$
|
132,441
|
|
$
|
121,444
|
|
9.1
|
%
|
|||
|
Cost of goods sold
|
(90,827
|
)
|
(83,053
|
)
|
9.4
|
|
|||||
|
Transaction costs (a)
|
(1,437
|
)
|
(1,804
|
)
|
(20.3
|
)
|
|||||
|
Ancillary revenue - third party products
|
$
|
40,177
|
|
$
|
36,587
|
|
9.8
|
|
|||
|
As percent of gross ancillary revenue - third party
|
30.3
|
%
|
30.1
|
%
|
0.2 pp
|
|
|||||
|
Hotel room nights
|
452,272
|
|
528,329
|
|
(14.4
|
)%
|
|||||
|
Rental car days
|
1,204,982
|
|
916,640
|
|
31.5
|
%
|
|||||
(a) Includes payment expenses and travel agency commissions.
30
Ancillary third party revenue increased
$3.6 million
in
2015
from
2014
. This was due primarily to the
16.7 percent
increase in scheduled service passengers which drove a
31.5 percent
increase in rental car days sold, mostly serving our East Coast destinations. Hotel room night sales have slowed in the current year mostly due to our network shift away from Las Vegas (our largest hotel market) to East Coast cities where hotel room night sales are weaker. Additionally, weakness in the Canadian dollar has led to a decrease in Canadian passengers who have historically comprised a significant percentage of our hotel room night sales.
Fixed fee contract revenue.
Fixed fee contract revenue for
2015
increased
$2.3 million
, or
13.5 percent
, compared with
2014
, due to additional charter activity in the current year.
Other revenue.
Other revenue for
2015
increased
$13.0 million
compared with
2014
, primarily from aircraft lease revenue related to the 12 Airbus A320 series aircraft acquired in June 2014, which remain on lease to a European carrier.
Operating Expenses
We primarily evaluate our expense management by comparing our costs per passenger and per available seat mile ("ASM") across different periods, which enables us to assess trends in each expense category. The following table presents operating expense per passenger for the indicated periods. The table also presents operating expense per passenger, excluding fuel, a statistic which provides management and investors the ability to measure and monitor our cost performance absent fuel price volatility. Both the cost and availability of fuel are subject to many economic and political factors beyond our control.
|
|
For the Year Ended December 31,
|
Percentage
|
||||||||
|
|
2015
|
2014
|
Change
|
|||||||
|
Aircraft fuel
|
$
|
29.30
|
|
$
|
47.61
|
|
(38.5
|
)%
|
||
|
Salary and benefits
|
24.19
|
|
23.71
|
|
2.0
|
|
||||
|
Station operations
|
10.77
|
|
10.38
|
|
3.8
|
|
||||
|
Maintenance and repairs
|
9.74
|
|
10.64
|
|
(8.5
|
)
|
||||
|
Sales and marketing
|
2.25
|
|
3.49
|
|
(35.5
|
)
|
||||
|
Aircraft lease rentals
|
0.24
|
|
1.96
|
|
(87.8
|
)
|
||||
|
Depreciation and amortization
|
10.33
|
|
10.23
|
|
1.0
|
|
||||
|
Other
|
6.91
|
|
6.81
|
|
1.5
|
|
||||
|
Special charge
|
—
|
|
5.32
|
|
NM
|
|
||||
|
Operating expense per passenger
|
$
|
93.73
|
|
$
|
120.15
|
|
(22.0
|
)%
|
||
|
Operating expense per passenger, excluding fuel
|
$
|
64.43
|
|
$
|
72.54
|
|
(11.2
|
)%
|
||
The following table presents unit costs on a per ASM basis, or CASM, for the indicated periods. As on a per-passenger basis, excluding fuel on a per ASM basis provides management and investors the ability to measure and monitor our cost performance absent fuel price volatility.
|
|
For the Year Ended December 31,
|
|
Percentage
|
|||||||
|
|
2015
|
2014
|
|
Change
|
||||||
|
Aircraft fuel
|
2.64
|
|
¢
|
4.34
|
|
¢
|
(39.2
|
)%
|
||
|
Salary and benefits
|
2.18
|
|
|
2.16
|
|
|
0.9
|
|
||
|
Station operations
|
0.97
|
|
|
0.95
|
|
|
2.1
|
|
||
|
Maintenance and repairs
|
0.88
|
|
|
0.97
|
|
|
(9.3
|
)
|
||
|
Sales and marketing
|
0.20
|
|
|
0.32
|
|
|
(37.5
|
)
|
||
|
Aircraft lease rentals
|
0.02
|
|
|
0.18
|
|
|
(88.9
|
)
|
||
|
Depreciation and amortization
|
0.93
|
|
|
0.93
|
|
|
—
|
|
||
|
Other
|
0.63
|
|
|
0.62
|
|
|
1.6
|
|
||
|
Special charge
|
—
|
|
0.48
|
|
NM
|
|
||||
|
Operating expense per ASM (CASM)
|
8.45
|
|
¢
|
10.95
|
|
¢
|
(22.8
|
)%
|
||
|
CASM, excluding fuel
|
5.81
|
|
¢
|
6.61
|
|
¢
|
(12.1
|
)%
|
||
31
Aircraft fuel expense.
Aircraft fuel expense for
2015
decreased
$109.8 million
, or
28.3 percent
, compared with
2014
. The decrease was primarily the result of a
38.2 percent
decrease in system average cost per gallon. This was offset by a
16.3 percent
increase in system fuel gallons consumed. As we add additional Airbus aircraft, which are more fuel efficient than our MD-80 aircraft, we anticipate our fuel efficiency will continue to improve. Airbus aircraft flew 32.6 percent of scheduled service ASMs in 2015, compared to 21.1 percent in 2014.
Salary and benefits expense.
Excluding a one-time expense of $7.3 million related to the departure of our former President and COO in September 2014, salary and benefits expense for
2015
increased
$43.8 million
, or
23.5 percent
, compared with
2014
. The increase is primarily attributable to an
18.0 percent
increase in the number of full-time equivalent employees ("FTEs") needed to support an
8.0 percent
increase in average number of aircraft in service. In addition, a year over year increase in profitability drove a $15.1 million increase in our bonus accrual, and our pilots entered a higher pay-band in May 2015. Salary and benefits expense on a per ASM basis was relatively flat year over year.
Station operations expense.
Station operations expense for
2015
increased
$17.6 million
, or
20.8 percent
on a
20.7 percent
increase in scheduled service departures compared with the same period in
2014
.
Maintenance and repairs expense.
Maintenance and repairs expense for
2015
increased
$5.8 million
, or
6.7 percent
compared with
2014
. The increase is due mostly to an
8.0 percent
increase in the average number of operating aircraft in service. Our total major maintenance events decreased by one when compared to 2014 due to the regular rotation of scheduled events for our MD-80 aircraft; additionally, the increase in average number of operating aircraft was related to Airbus A320 series aircraft, which have yet to experience major maintenance events.
Sales and marketing expense.
Sales and marketing expense for
2015
decreased
$7.1 million
, or
25.1 percent
, compared to
2014
, primarily due to a reduction in credit card fees paid by us. We implemented a credit card fee reimbursement charge, at zero margin, in the fourth quarter 2014, which is applied as a reduction to this expense.
Aircraft lease rentals expense.
Aircraft lease rentals expense decreased
$13.6 million
for
2015
compared with
2014
, as our need for sub-service flights decreased in the current year. We do not currently lease any aircraft.
Depreciation and amortization expense.
Depreciation and amortization expense for
2015
increased
$14.7 million
, or
17.6 percent
, compared with
2014
due mainly to an
8.0 percent
increase in average number of operating aircraft (all Airbus aircraft), and was flat on a per ASM basis. Our Airbus aircraft will continue to comprise a larger percentage of total depreciation expense as more are added to revenue service and as our MD-80 fleet nears full depreciation. Additionally, during the second quarter of 2014, we began depreciating 12 Airbus A320 series aircraft on lease to a European carrier, which are non-ASM producing aircraft.
Other expense.
Other expense for
2015
increased by
$10.1 million
, or
18.1 percent
, compared with
2014
, due primarily to increased flight crew training needed to support our growing operating fleet, as well as expenses incurred to support improvement and development of our information technology initiatives.
Other (Income) Expense
Other expense for
2015
increased by
$4.8 million
compared with
2014
, due to additional interest expense from higher borrowings, primarily driven by the issuance of $300.0 million of senior unsecured notes which did not occur until June 2014.
Income Tax Expense
Our effective income tax rate remained relatively flat at
36.5 percent
for
2015
compared to
37.1 percent
for
2014
. While we expect our tax rate to be fairly consistent in the near term, it will vary depending on recurring items such as the amount of income we earn in each state and the state tax rate applicable to such income. Discrete items during interim periods may also affect our tax rates.
2014 compared to 2013
Operating Revenue
Scheduled service revenue.
Scheduled service revenue for 2014 increased by $80.7 million, or 12.4 percent, compared with 2013. The increase was primarily driven by a 12.9 percent increase in scheduled service passengers, and a relatively flat
32
average base fare year over year. Passenger growth was driven by a 12.5 percent increase in the number of scheduled service departures, as we increased the average number of aircraft in service by 9.4 percent from 2013.
Ancillary air-related revenue.
Ancillary air-related revenue for 2014 increased $43.8 million, or 15.2 percent, compared with 2013, primarily due to the increase in scheduled service passengers and our optimization efforts related to certain ancillary products and fees. Our efforts included a focus on seat assignment fees, priority boarding, and boarding pass printing fees, as well as certain policy initiatives such as trip cancellation and itinerary changes.
Ancillary third party revenue.
The following table details the calculation of ancillary revenue from third party products. Third party products consist of revenue from the sale of hotel rooms, ground transportation (rental cars and hotel shuttle products), attraction and show tickets, and fees we receive from other merchants selling products through our website:
|
|
For the Year Ended December 31,
|
Percentage
|
|||||||||
|
(in thousands except room nights and rental car days)
|
2014
|
2013
|
Change
|
||||||||
|
Gross ancillary revenue - third party products
|
$
|
121,444
|
|
$
|
120,730
|
|
0.6
|
%
|
|||
|
Cost of goods sold
|
(83,053
|
)
|
(81,904
|
)
|
1.4
|
|
|||||
|
Transaction costs (a)
|
(1,804
|
)
|
(1,796
|
)
|
0.4
|
|
|||||
|
Ancillary revenue - third party products
|
$
|
36,587
|
|
$
|
37,030
|
|
(1.2
|
)
|
|||
|
As percent of gross ancillary revenue - third party
|
30.1
|
%
|
30.7
|
%
|
(0.6) pp
|
|
|||||
|
Hotel room nights
|
528,329
|
|
595,697
|
|
(11.3
|
)%
|
|||||
|
Rental car days
|
916,640
|
|
844,858
|
|
8.5
|
%
|
|||||
(a) Includes payment expenses and travel agency commissions.
Third party ancillary revenue decreased slightly in 2014 from 2013, due to a decrease of 11.3 percent in hotel room nights sold, offset by an 8.5 percent increase in rental car days sold. The reduction in hotel room sales was driven by a decline in Las Vegas nights sold, primarily due to a 2013 change in a pre-purchase agreement for discounted room rates. The increase in rental car days sold was driven by an increase in scheduled service passengers to those markets where a higher percentage of rental car days are typically sold, such as Florida and Phoenix.
Fixed fee contract revenue.
Fixed fee contract revenue for 2014 remained relatively flat compared with 2013 as no significant changes were made to existing flying agreements.
Other revenue.
Other revenue for 2014 increased $16.9 million compared with 2013, due mostly to aircraft lease revenue related to the 12 Airbus A320 series aircraft acquired in June 2014, which are on lease to a European carrier.
33
Operating Expenses
We primarily evaluate our expense management by comparing our costs per passenger and per ASMs across different periods, which enables us to assess trends in each expense category. The following table presents operating expense per passenger for the indicated periods.
|
|
For the Year Ended December 31,
|
Percentage
|
||||||||
|
|
2014
|
2013
|
Change
|
|||||||
|
Aircraft fuel
|
$
|
47.61
|
|
$
|
53.25
|
|
(10.6
|
)%
|
||
|
Salary and benefits
|
23.71
|
|
21.91
|
|
8.2
|
|
||||
|
Station operations
|
10.38
|
|
10.80
|
|
(3.9
|
)
|
||||
|
Maintenance and repairs
|
10.64
|
|
10.06
|
|
5.8
|
|
||||
|
Sales and marketing
|
3.49
|
|
2.99
|
|
16.7
|
|
||||
|
Aircraft lease rentals
|
1.96
|
|
1.27
|
|
54.3
|
|
||||
|
Depreciation and amortization
|
10.23
|
|
9.57
|
|
6.9
|
|
||||
|
Other
|
6.81
|
|
6.35
|
|
7.2
|
|
||||
|
Special charge
|
5.32
|
|
—
|
|
NM
|
|
||||
|
Operating expense per passenger
|
$
|
120.15
|
|
$
|
116.20
|
|
3.4
|
%
|
||
|
Operating expense per passenger, excluding fuel
|
$
|
72.54
|
|
$
|
62.95
|
|
15.2
|
%
|
||
The following table presents unit costs on a per ASM basis, or CASM, for the indicated periods.
|
|
For the Year Ended December 31,
|
|
Percentage
|
|||||||
|
|
2014
|
2013
|
|
Change
|
||||||
|
Aircraft fuel
|
4.34
|
|
¢
|
4.73
|
|
¢
|
(8.2
|
)%
|
||
|
Salary and benefits
|
2.16
|
|
|
1.95
|
|
|
10.8
|
|
||
|
Station operations
|
0.95
|
|
|
0.96
|
|
|
(1.0
|
)
|
||
|
Maintenance and repairs
|
0.97
|
|
|
0.89
|
|
|
9.0
|
|
||
|
Sales and marketing
|
0.32
|
|
|
0.27
|
|
|
18.5
|
|
||
|
Aircraft lease rentals
|
0.18
|
|
|
0.11
|
|
|
63.6
|
|
||
|
Depreciation and amortization
|
0.93
|
|
|
0.85
|
|
|
9.4
|
|
||
|
Other
|
0.62
|
|
|
0.56
|
|
|
10.7
|
|
||
|
Special charge
|
0.48
|
|
—
|
|
NM
|
|
||||
|
Operating expense per ASM (CASM)
|
10.95
|
|
¢
|
10.32
|
|
¢
|
6.1
|
%
|
||
|
CASM, excluding fuel
|
6.61
|
|
¢
|
5.59
|
|
¢
|
18.2
|
%
|
||
Aircraft fuel expense.
Aircraft fuel expense for 2014 increased $2.7 million, or 0.7 percent, compared with 2013. We consumed 7.0 percent more system fuel gallons, which was offset by a 5.9 percent decrease in the average cost per gallon. Fuel efficiency was positively impacted by a 2.6 percent increase in total system ASMs per gallon, to approximately 70 ASMs per gallon in 2014.
Salary and benefits expense.
Salary and benefits expense for 2014 increased $34.7 million, or 21.9 percent, compared with 2013. The increase is primarily attributable to a 16.8 percent increase in the number of full-time equivalent employees related to company growth, as well as crew training constraints that negatively affected our productivity. We also experienced a one-time expense in 2014 of $7.3 million related to the departure of our former President and COO.
Station operations expense.
Station operations expense for 2014 increased $6.4 million, or just 8.2 percent on a 12.5 percent increase in scheduled service departures. This was due to East Coast network growth during 2014 as Florida per-departure costs, on average, were 61.6 percent less than Las Vegas.
Maintenance and repairs expense.
Maintenance and repairs expense for 2014 increased $14.0 million, or 19.2 percent, compared with 2013. Our major check expense related to our MD-80 aircraft increased $5.5 million, or 22.9 in 2014, resulting
34
from an approximate 30 percent increase in shop visits year over year, the majority of which were scheduled. Additionally, the increase is partially due to a 9.4 percent increase in the average number of operating aircraft in service from the addition of Airbus A320 series aircraft, which have yet to experience major maintenance events.
Sales and marketing expense.
Sales and marketing expense for 2014 increased $6.8 million, or 31.4 percent, compared with 2013. The increase is partially due to additional processing fees resulting from a shift to credit card usage from debit cards, and a 12.7 percent increase in total passenger revenue. Additionally, during 2014, we paid $2.8 million for the production and distribution of the inflight syndicated game show, "The GamePlane," which was filmed on our flights as part of our national branding campaign.
Aircraft lease rentals expense.
Aircraft lease rentals expense increased $6.7 million for 2014 compared with 2013. Throughout 2014, we experienced continued crew training delays requiring sub-service flying to meet our scheduled service needs, which led to a $10.1 million expense increase year over year. This was offset by a $3.4 million decrease in aircraft operating lease rental expense. In the second quarter of 2014, we purchased the two Airbus A320 series aircraft under operating lease since 2013, and do not currently lease any aircraft in our fleet.
Depreciation and amortization expense.
Depreciation and amortization expense for 2014 increased $14.1 million, or 20.4 percent, compared with 2013. The increase was primarily driven by a 9.4 percent increase in the average number of aircraft in service. Additionally, we began depreciating 12 Airbus A320 series aircraft in June 2014 which are on lease to a European carrier, and are non-ASM producing aircraft.
Other expense.
Other expense for 2014 increased by $9.6 million, or 20.8 percent, compared with 2013. The increase was primarily attributable to $3.5 million in training costs required to prepare for 2015 crew staffing needs, as well as $3.6 million related to information technology services to support our continuing growth.
Special charge.
We incurred a $43.3 million non-cash impairment charge to our Boeing 757-200 series aircraft, engines and related assets, triggered in the fourth quarter of 2014.
Other (Income) Expense
Other expense for 2014 increased by $12.2 million compared with 2013 due to higher interest expense on our outstanding debt, which more than doubled from December 31, 2013 to December 31, 2014.
Income Tax Expense
Our effective income tax rate remained relatively flat at 37.1 percent for 2014 compared to 37.4 percent for 2013. While we expect our tax rate to be fairly consistent in the near term, it will vary depending on recurring items such as the amount of income we earn in each state and the state tax rate applicable to such income. Discrete items during interim periods may also affect our tax rates.
LIQUIDITY AND CAPITAL RESOURCES
During
2015
, our primary source of funds was
$365.4 million
generated by our operations in addition to
$121.0 million
in proceeds from notes payable, both of which have allowed us to invest in the growth of our fleet and information technology infrastructure and development, while meeting short-term obligations, returning cash to shareholders, and maintaining our cash position. Our future capital needs are primarily for the acquisition of additional aircraft to meet growth and operational needs.
Cash, restricted cash and investment securities (short-term and long-term) were
$407.8 million
and
$428.8 million
at
December 31, 2015
and 2014, respectively. Restricted cash represents escrowed funds under fixed fee contracts and cash collateralized against letters of credit required by hotel properties for guaranteed room availability, airports, and certain other parties. Under our fixed fee flying contracts, we require customers to prepay for flights, and the cash is escrowed until the flight is completed. Prepayments are recorded as restricted cash and a corresponding amount is recorded as air traffic liability. Investment securities represent liquid marketable securities which are available-for-sale.
During
2015
, we paid
$62.4 million
in cash dividends to our shareholders and repurchased
$129.5 million
in common stock. In addition to our quarterly cash dividend, we plan to continue to repurchase our stock in the open market and consider special cash dividends from time to time, subject to availability of cash resources and compliance with our note covenants.
35
As of
December 31, 2015
, we had
$168.5
million of obligations under existing aircraft purchase agreements. We believe we have more than adequate liquidity resources through our operating cash flows, cash balances and available funds on our senior secured revolving credit facility, to meet our future contractual obligations. Our practice has been to acquire used aircraft using our cash balances and then to opportunistically consider financing the aircraft after purchase to the extent that financing on favorable terms is available.
Sources and Uses of Cash
Operating Activities.
O
perating cash inflows are primarily derived from providing air transportation to customers for which the vast majority of tickets are purchased prior to the day travel is provided. Operating cash outflows are related to the recurring expenses of our operations.
During
2015
, our operating activities provided
$365.4 million
of cash compared to
$269.8 million
during
2014
. The increase in cash was primarily the result of an increase in earnings after adjustments made for non-cash items such as depreciation and amortization expense (
$14.7 million
higher in 2015) and change in deferred income taxes (
$16.3 million
higher in 2015).
During
2014
, our operating activities provided
$269.8 million
of cash compared to
$196.9 million
in 2013. This increase was primarily the result of an increase in our income after adjustments made for non-cash items such as depreciation and amortization expense ($14.1 million higher in 2014), one time impairment charge ($43.3 million in 2014) and stock based compensation ($6.9 million higher in 2014).
Investing Activities.
Cash used in investing activities for
2015
was
$234.2 million
compared to
$315.2 million
in
2014
. During
2015
, our primary use of cash was for the purchase of property and equipment of
$252.7 million
, which was slightly offset by proceeds from the maturity of investment securities, net of purchases, of
$16.3 million
. Purchase of property and equipment during
2015
and 2014 consisted primarily of the purchase of Airbus A320 series aircraft and induction costs.
During
2014
, our primary use of cash was for the purchase of property and equipment of
$279.4 million
and the purchase of investment securities, net of maturities, of
$36.6 million
.
During 2013, our primary use of cash was for the purchase of property and equipment of $177.5 million and the purchase of investment securities, net of maturities, of $26.2 million. These investing activities were offset by cash provided by returned aircraft deposits of $10.2 million.
Financing Activities.
Cash used in financing activities in
2015
was
$133.6 million
. The primary use of cash was for stock repurchases of
$129.5 million
, debt repayments of
$67.9 million
, and cash dividends paid to shareholders of
$62.4 million
. These were offset by
$121.0 million
in proceeds from the issuance of long-term debt.
In
2014
, cash provided by financing activities was
$37.4 million
, the majority of which was related to
$385.3 million
in proceeds from the issuance of long-term debt, offset by principal debt payments of
$168.8 million
, and
$139.1 million
of stock repurchases.
In 2013, cash provided by financing activities was $4.1 million, the majority of which was related to $106.0 million in proceeds from the issuance of notes payable, offset by $83.6 million of stock repurchases, and principal debt payments of $22.7 million.
Debt
Our long-term debt obligations increased from
$588.8 million
as of
December 31, 2014
to
$641.7 million
as of
December 31, 2015
. As of
December 31, 2015
, we had eight unencumbered owned aircraft.
36
OFF-BALANCE SHEET ARRANGEMENTS, COMMITMENTS AND CONTRACTUAL OBLIGATIONS
The following table discloses aggregate information about our contractual cash obligations and off-balance sheet arrangements as of December 31, 2015 and the periods in which payments are due (in thousands):
|
|
Total
|
Less than 1 year
|
2-3 years
|
4-5 years
|
More than 5 years
|
|||||||||||||||
|
Long-term debt obligations (1)
|
$
|
670,240
|
|
$
|
85,667
|
|
$
|
223,883
|
|
$
|
360,690
|
|
$
|
—
|
|
|||||
|
Operating lease obligations (2) (5)
|
17,293
|
|
5,081
|
|
5,939
|
|
2,927
|
|
3,346
|
|
||||||||||
|
Aircraft purchase obligations (3) (5)
|
168,517
|
|
105,117
|
|
63,400
|
|
—
|
|
—
|
|
||||||||||
|
Airport fees under use and lease agreements (4) (5)
|
17,717
|
|
11,023
|
|
6,655
|
|
39
|
|
—
|
|
||||||||||
|
Total future payments under contractual obligations
|
$
|
873,767
|
|
$
|
206,888
|
|
$
|
299,877
|
|
$
|
363,656
|
|
$
|
3,346
|
|
|||||
|
(1)
|
Long-term debt obligations include scheduled interest payments (using rates in effect at December 31, 2015) and excludes debt issuance costs.
|
|
(2)
|
Operating lease obligations include the lease and use of gate space and areas surrounding gates, operating support areas in airport terminals under use and lease agreements, and leases of office, warehouse and other space.
|
|
(3)
|
Aircraft purchase obligations under existing aircraft purchase agreements.
|
|
(4)
|
Obligations for common and joint use space in the airport terminal facilities under use and lease agreements.
|
|
(5)
|
Not reflected on our balance sheet.
|
CRITICAL ACCOUNTING POLICIES AND ESTIMATES
The discussion and analysis of our financial condition and results of operations is based on our consolidated financial statements, which have been prepared in accordance with accounting principles generally accepted in the United States. The preparation of these financial statements requires us to make estimates and judgments that affect the reported amount of assets and liabilities, revenues and expenses, and related disclosure of contingent assets and liabilities at the date of our financial statements based on events and transactions occurring during the periods reported. Note 2 to our Consolidated Financial Statements provides a detailed discussion of our significant accounting policies.
Critical accounting policies are defined as those policies that reflect significant judgments about matters that are inherently uncertain. Our actual results may differ from these estimates under different assumptions or conditions. We believe our critical accounting policies are limited to those described below.
Revenue Recognition
Scheduled service revenue consists of passenger revenue generated from nonstop flights in our route network, recognized either when the travel-related service or transportation is provided or when the itinerary expires unused. Nonrefundable scheduled itineraries expire on the date of the intended flight, unless the date is extended by notification from the customer in advance. Itineraries sold for transportation not yet used, as well as unexpired credits, are included in air traffic liability.
Various taxes and fees, assessed on the sale of tickets to customers, are collected by us serving as an agent, and remitted to taxing authorities. These taxes and fees are presented on a net basis in our consolidated statements of income and recorded as a liability until remitted to the appropriate taxing authority.
Fixed fee contract revenue consists of agreements to provide charter service on a year-round and ad hoc basis. Fixed fee contract revenue is recognized when the transportation is provided.
Ancillary air-related revenue is generated from fees paid by ticketed passengers and consists of baggage fees, the use of our website to purchase scheduled service transportation, advance seat assignments, and other services. Revenues from air-related charges are recognized when the transportation is provided if the product is not deemed independent of the original ticket sale. Change and cancellation fees for nonrefundable itineraries are air-related charges deemed independent of the original ticket sale, and are recognized as revenue when the sale occurs.
Ancillary revenue is also generated from the sale of third party products such as hotel rooms, rental cars, ticket attractions, and other items. Revenue from the sale of third party products is recognized at the time the product is utilized, such as the time a purchased hotel room is occupied. We follow accounting standards for revenue arrangements with multiple deliverables to
37
determine the amount of revenue to be recognized for each element of a bundled sale involving air-related charges and third party products in addition to airfare. Revenue from the sale of third party products is recorded net of amounts paid to wholesale providers, travel agent commissions, and transaction costs.
Other revenue is generated from leased out aircraft and flight equipment, and other miscellaneous sources. Lease revenue is recognized pro-rata over the lease term.
Investment Securities
We maintain a liquid portfolio of investment securities available for current operations and to satisfy on-going obligations. We have classified these investments as “available for sale” and accordingly, unrealized gains and/or losses are reported as a component of other comprehensive income in shareholders’ equity.
Accounting for Long-Lived Assets
We record impairment losses on long-lived assets used in operations, consisting principally of property and equipment, when events or changes in circumstances indicate, in management’s judgment, that the assets might be impaired and the undiscounted cash flows estimated to be generated by those assets are less than the carrying amount of those assets. In making these determinations, we utilize certain assumptions, including, but not limited to: (i) estimated fair market value of the assets; and (ii) estimated future cash flows expected to be generated by these assets, which are based on additional assumptions such as asset utilization, length of service the asset will be used in operations, and estimated salvage values.
In estimating the useful lives and residual values of our aircraft, we have primarily relied upon actual experience with the same or similar aircraft types, current and projected future market information, and recommendations from other industry sources. Subsequent revisions to these estimates could be caused by changing market prices of our aircraft, changes in utilization of the aircraft, and other fleet events. We evaluate these estimates used for each reporting period and adjust when deemed necessary. To the extent a change in estimate for useful lives or salvage values of our property and equipment occurs, there could be an acceleration of depreciation expense associated with the change in estimate.
Aircraft Maintenance and Repair Costs
We account for non-major maintenance and repair costs incurred under the direct expense method. Under this method, maintenance and repair costs for owned and leased aircraft, excluding major maintenance activities, are charged to operating expenses as incurred. Maintenance and repair costs include all parts, materials, line maintenance, and non-major maintenance activities required to maintain our multiple fleet types.
We account for major maintenance costs for MD-80 airframes and the related JT8 engines using the direct expense method. Under this method, major maintenance costs are charged to expense as incurred. This method can result in expense volatility between quarterly and annual periods, depending on the number and type of major maintenance activities performed. Scheduled maintenance activities are the most extensive in scope and are primarily based on time and usage intervals, including, but not limited to, airframe and engine overhauls. We have not experienced major maintenance events for the Airbus A320 series or 757-200 fleets and as such, have not yet applied a method to account for major maintenance for these aircraft types.
Share-based Compensation
We issue common stock-based awards, including restricted stock, stock options and stock appreciation rights (“SARs”) to certain officers, directors and employees.
We recognize share-based compensation expense over the requisite service period using a fair value approach. Determining fair value requires judgment, and we use the Black-Scholes valuation model for stock options and SARs issued. Cash-settled SARs are liability-based awards and fair value is updated monthly using the Black-Scholes valuation model for outstanding awards. Significant judgment is required to establish the assumptions to be used in the model. These assumptions are for the volatility of our common stock price, estimated term over which our stock options and SARs will be outstanding, interest rate, and dividend yield to be applied. We use our closing stock price on the grant date as the fair value for issuances of restricted stock.
Expected volatilities used are based on the historical volatility of our common stock price.
38
Expected term represents the weighted average time between the award’s grant date and its exercise date. We estimate our expected term assumption using historical award exercise activity and employee termination activity.
The risk-free interest rate for periods equal to the expected term of the award is based on a blended historical rate using Federal Reserve rates for U.S. Treasury securities.
The dividend yield reflects the effect that paying a dividend has on the fair value of our stock.
RECENT ACCOUNTING PRONOUNCEMENTS
See related disclosure at Item 8-Financial Statements and Supplementary Data-Notes to Consolidated Financial Statements-Note 2-Summary of Significant Accounting Policies.
We are subject to foreign currency translation risk associated with the forecasted lease revenue from 12 Airbus A320 series aircraft leased to a European-based company. We currently utilize a foreign currency swap to exchange cash flows based on specified underlying notional amounts, assets, and/or indices to help manage foreign currency exchange rate risk with respect to cash flows from the lease revenue.
We are also subject to certain market risks, including changes in interest rates and commodity prices (specifically, aircraft fuel). The adverse effects of changes in markets could pose potential loss, as discussed below. The sensitivity analysis does not consider the effects that such adverse changes may have on overall economic activity, nor does it consider additional actions we may take to mitigate our exposure to such changes. Actual results may differ. See the notes to our consolidated financial statements in this annual report on Form 10-K for a description of our significant accounting policies and additional information.
Aircraft Fuel
Our results of operations can be significantly impacted by changes in the price and availability of aircraft fuel. Aircraft fuel expense for the years ended
December 31, 2015
,
2014
and
2013
represented
31.3 percent
,
39.6 percent
and
45.8 percent
of our operating expenses, respectively. Increases in fuel prices or a shortage of supply could have a material effect on our operations and operating results. Based on our
2015
fuel consumption, a hypothetical ten percent increase in the average price per gallon of aircraft fuel would have increased fuel expense by approximately
$27.8 million
,
$38.7 million
and
$38.5 million
for the years ended
December 31, 2015
,
2014
and
2013
, respectively. We have not hedged fuel price risk in recent years.
Interest Rates
We have market risk associated with changing interest rates due to the short-term nature of our cash and investment securities at
December 31, 2015
, which totaled
$87.1 million
in cash and cash equivalents,
$245.6 million
in short-term investments and
$64.8 million
in long-term investments. We invest available cash in government and corporate debt securities, investment grade commercial paper, and other highly rated financial instruments. Because of the short-term nature of these investments, the returns earned closely parallel short-term floating interest rates. A hypothetical 100 basis point change in interest rates for the years ended
December 31, 2015
,
2014
and
2013
, would have affected interest income from cash and investment securities by
$4.1 million
,
$4.0 million
and
$3.7 million
, respectively.
As of
December 31, 2015
and 2014, respectively, we had $301.9 million and $246.6 million of variable-rate debt including current maturities and excluding related costs. A hypothetical 100 basis point change in interest rates would have affected interest expense by $2.7 million in 2015 and $1.2 million in 2014.
As of
December 31, 2015
, we had $344.3 million of fixed-rate debt, including current maturities and excluding related costs, which had a fair value of $342.5 million. At December 31, 2014, we had $346.5 million of fixed-rate debt, including current maturities and excluding related costs, which had a fair value of $347.6 million. A hypothetical 100 basis point change in market interest rates as of December 31, 2015 or 2014, would not impact interest expense or have a material effect on the fair value of our fixed-rate debt instruments as of such dates.
39
Selected Quarterly Financial Data (Unaudited)
Quarterly results of operations for the years ended
December 31, 2015
and
2014
are summarized below (in thousands, except for per share amounts).
|
March 31
|
June 30
|
September 30
|
December 31
|
||||||||||||
|
2015
|
|||||||||||||||
|
Operating revenues
|
$
|
329,241
|
|
$
|
322,102
|
|
$
|
299,956
|
|
$
|
310,889
|
|
|||
|
Operating income
|
108,099
|
|
92,756
|
|
77,082
|
|
93,765
|
|
|||||||
|
Net income attributable to Allegiant Travel Company
|
64,867
|
|
54,339
|
|
44,458
|
|
56,710
|
|
|||||||
|
Earnings per share to common stockholders:
|
|||||||||||||||
|
Basic
|
3.75
|
|
3.19
|
|
2.63
|
|
3.38
|
|
|||||||
|
Diluted
|
3.74
|
|
3.18
|
|
2.62
|
|
3.38
|
|
|||||||
|
2014
|
|||||||||||||||
|
Operating revenues
|
$
|
302,524
|
|
$
|
290,541
|
|
$
|
265,029
|
|
$
|
278,950
|
|
|||
|
Operating income
|
57,271
|
|
56,413
|
|
28,867
|
|
14,790
|
|
|||||||
|
Net income attributable to Allegiant Travel Company
|
34,222
|
|
33,499
|
|
14,172
|
|
4,794
|
|
|||||||
|
Earnings per share to common stockholders:
|
|||||||||||||||
|
Basic
|
1.87
|
|
1.87
|
|
0.80
|
|
0.29
|
|
|||||||
|
Diluted
|
1.86
|
|
1.86
|
|
0.80
|
|
0.27
|
|
|||||||
The sum of the quarterly earnings per share amounts does not equal the annual amount reported as per share amounts are computed independently for each quarter and for the full year, based on respective weighted average common shares outstanding and other potentially dilutive common shares.
The Company's income and earnings per share in the fourth quarter 2014 were impacted by a non-cash impairment charge of
$43.3 million
on its Boeing 757 fleet.
40
Report of Independent Registered Public Accounting Firm
The Board of Directors and Shareholders of
Allegiant Travel Company
We have audited the accompanying consolidated balance sheets of Allegiant Travel Company and subsidiaries as of December 31, 2015 and 2014, and the related consolidated statements of income, and comprehensive income, shareholders' equity and cash flows for each of the three years in the period ended December 31, 2015. These financial statements are the responsibility of the Company's management. Our responsibility is to express an opinion on these financial statements based on our audits.
We conducted our audits in accordance with the standards of the Public Company Accounting Oversight Board (United States). Those standards require that we plan and perform the audit to obtain reasonable assurance about whether the financial statements are free of material misstatement. An audit includes examining, on a test basis, evidence supporting the amounts and disclosures in the financial statements. An audit also includes assessing the accounting principles used and significant estimates made by management, as well as evaluating the overall financial statement presentation. We believe that our audits provide a reasonable basis for our opinion.
In our opinion, the financial statements referred to above present fairly, in all material respects, the consolidated financial position of Allegiant Travel Company and subsidiaries at December 31, 2015 and 2014, and the consolidated results of its operations and its cash flows for each of the three years in the period ended December 31, 2015, in conformity with U.S. generally accepted accounting principles.
As discussed in Note 2 to the consolidated financial statements, the Company changed its method of classifying deferred income tax assets and liabilities effective December 31, 2015.
We also have audited, in accordance with the standards of the Public Company Accounting Oversight Board (United States), Allegiant Travel Company’s internal control over financial reporting as of December 31, 2015, based on criteria established in Internal Control-Integrated Framework issued by the Committee of Sponsoring Organizations of the Treadway Commission (2013 Framework) and our report dated February 22, 2016, expressed an unqualified opinion thereon.
/s/ Ernst & Young LLP
Las Vegas, Nevada
February 22, 2016
41
Report of Independent Registered Public Accounting Firm
The Board of Directors and Shareholders of
Allegiant Travel Company
We have audited Allegiant Travel Company and subsidiaries’ (the “Company”) internal control over financial reporting as of December 31, 2015, based on criteria established in Internal Control-Integrated Framework issued by the Committee of Sponsoring Organizations of the Treadway Commission (2013 Framework) (the COSO criteria). Allegiant Travel Company and subsidiaries’ management is responsible for maintaining effective internal control over financial reporting, and for its assessment of the effectiveness of internal control over financial reporting included in the accompanying “Management’s Annual Report on Internal Control over Financial Reporting.” Our responsibility is to express an opinion on the Company’s internal control over financial reporting based on our audit.
We conducted our audit in accordance with the standards of the Public Company Accounting Oversight Board (United States). Those standards require that we plan and perform the audit to obtain reasonable assurance about whether effective internal control over financial reporting was maintained in all material respects. Our audit included obtaining an understanding of internal control over financial reporting, assessing the risk that a material weakness exists, testing and evaluating the design and operating effectiveness of internal control based on the assessed risk, and performing such other procedures as we considered necessary in the circumstances. We believe that our audit provides a reasonable basis for our opinion.
A company’s internal control over financial reporting is a process designed to provide reasonable assurance regarding the reliability of financial reporting and the preparation of financial statements for external purposes in accordance with generally accepted accounting principles. A company’s internal control over financial reporting includes those policies and procedures that (1) pertain to the maintenance of records that, in reasonable detail, accurately and fairly reflect the transactions and dispositions of the assets of the company; (2) provide reasonable assurance that transactions are recorded as necessary to permit preparation of financial statements in accordance with generally accepted accounting principles, and that receipts and expenditures of the company are being made only in accordance with authorizations of management and directors of the company; and (3) provide reasonable assurance regarding prevention or timely detection of unauthorized acquisition, use, or disposition of the Company’s assets that could have a material effect on the financial statements.
Because of its inherent limitations, internal control over financial reporting may not prevent or detect misstatements. Also, projections of any evaluation of effectiveness to future periods are subject to the risk that controls may become inadequate because of changes in conditions, or that the degree of compliance with the policies or procedures may deteriorate.
In our opinion, Allegiant Travel Company and subsidiaries maintained, in all material respects, effective internal control over financial reporting as of December 31, 2015, based on
the COSO criteria
.
We also have audited, in accordance with the standards of the Public Company Accounting Oversight Board (United States), the consolidated balance sheets of the Company as of December 31, 2015 and 2014, and the related consolidated statements of income, comprehensive income, shareholders’ equity, and cash flows for each of the three years in the period ended December 31, 2015 and our report dated February 22, 2016, expressed an unqualified opinion thereon.
/s/ Ernst & Young LLP
Las Vegas, Nevada
February 22, 2016
42
ALLEGIANT TRAVEL COMPANY
(in thousands, except share amounts)
|
December 31, 2015
|
December 31, 2014
|
||||||
|
CURRENT ASSETS:
|
|||||||
|
Cash and cash equivalents
|
$
|
87,112
|
|
$
|
89,610
|
|
|
|
Restricted cash
|
10,358
|
|
12,021
|
|
|||
|
Short-term investments
|
245,583
|
|
269,817
|
|
|||
|
Accounts receivable
|
15,146
|
|
14,216
|
|
|||
|
Expendable parts, supplies and fuel, net
|
15,583
|
|
16,980
|
|
|||
|
Prepaid expenses
|
18,276
|
|
24,306
|
|
|||
|
Deferred income taxes
|
—
|
|
6,271
|
|
|||
|
Other current assets
|
3,185
|
|
406
|
|
|||
|
TOTAL CURRENT ASSETS
|
395,243
|
|
433,627
|
|
|||
|
Property and equipment, net
|
885,942
|
|
738,783
|
|
|||
|
Long-term investments
|
64,752
|
|
57,390
|
|
|||
|
Deposits and other assets
|
5,725
|
|
5,280
|
|
|||
|
TOTAL ASSETS
|
$
|
1,351,662
|
|
$
|
1,235,080
|
|
|
|
CURRENT LIABILITIES:
|
|||||||
|
Accounts payable
|
$
|
6,801
|
|
$
|
13,232
|
|
|
|
Accrued liabilities
|
109,462
|
|
110,802
|
|
|||
|
Air traffic liability
|
198,136
|
|
185,315
|
|
|||
|
Current maturities of long-term debt, net of related costs
|
74,069
|
|
52,605
|
|
|||
|
TOTAL CURRENT LIABILITIES
|
388,468
|
|
361,954
|
|
|||
|
LONG-TERM DEBT AND OTHER LONG-TERM LIABILITIES:
|
|||||||
|
Long-term debt, net of current maturities and related costs
|
567,609
|
|
536,189
|
|
|||
|
Deferred income taxes
|
45,580
|
|
42,872
|
|
|||
|
TOTAL LIABILITIES
|
1,001,657
|
|
941,015
|
|
|||
|
SHAREHOLDERS' EQUITY:
|
|||||||
|
Common stock, par value $.001, 100,000,000 shares authorized; 22,250,210 and 22,174,241 shares issued; 16,802,897 and 17,413,307 shares outstanding, as of December 31, 2015 and 2014, respectively
|
22
|
|
22
|
|
|||
|
Treasury stock, at cost, 5,447,313 and 4,760,934 shares at December 31, 2015 and 2014, respectively
|
(453,415
|
)
|
(325,396
|
)
|
|||
|
Additional paid in capital
|
228,945
|
|
221,257
|
|
|||
|
Accumulated other comprehensive income, net
|
834
|
|
1,211
|
|
|||
|
Retained earnings
|
573,619
|
|
395,783
|
|
|||
|
TOTAL ALLEGIANT TRAVEL COMPANY SHAREHOLDERS' EQUITY
|
350,005
|
|
292,877
|
|
|||
|
Noncontrolling interest
|
—
|
|
1,188
|
|
|||
|
TOTAL EQUITY
|
350,005
|
|
294,065
|
|
|||
|
TOTAL LIABILITIES AND SHAREHOLDERS' EQUITY
|
$
|
1,351,662
|
|
$
|
1,235,080
|
|
|
The accompanying notes are an integral part of these consolidated financial statements.
43
ALLEGIANT TRAVEL COMPANY
(in thousands, except per share amounts)
|
|
Year ended December 31,
|
||||||||||
|
|
2015
|
2014
|
2013
|
||||||||
|
OPERATING REVENUE:
|
|
||||||||||
|
Scheduled service revenue
|
$
|
735,563
|
|
$
|
732,020
|
|
$
|
651,318
|
|
||
|
Ancillary revenue:
|
|||||||||||
|
Air-related charges
|
434,317
|
|
331,689
|
|
287,857
|
|
|||||
|
Third party products
|
40,177
|
|
36,587
|
|
37,030
|
|
|||||
|
Total ancillary revenue
|
474,494
|
|
368,276
|
|
324,887
|
|
|||||
|
Fixed fee contract revenue
|
19,747
|
|
17,403
|
|
17,462
|
|
|||||
|
Other revenue
|
32,384
|
|
19,347
|
|
2,483
|
|
|||||
|
Total operating revenue
|
1,262,188
|
|
1,137,046
|
|
996,150
|
|
|||||
|
OPERATING EXPENSES:
|
|||||||||||
|
Aircraft fuel
|
278,394
|
|
388,216
|
|
385,558
|
|
|||||
|
Salary and benefits
|
229,802
|
|
193,345
|
|
158,627
|
|
|||||
|
Station operations
|
102,294
|
|
84,667
|
|
78,231
|
|
|||||
|
Maintenance and repairs
|
92,575
|
|
86,781
|
|
72,818
|
|
|||||
|
Sales and marketing
|
21,349
|
|
28,492
|
|
21,678
|
|
|||||
|
Aircraft lease rentals
|
2,326
|
|
15,945
|
|
9,227
|
|
|||||
|
Depreciation and amortization
|
98,097
|
|
83,409
|
|
69,264
|
|
|||||
|
Other
|
65,649
|
|
55,566
|
|
46,010
|
|
|||||
|
Special charge
|
—
|
|
43,280
|
|
—
|
|
|||||
|
Total operating expenses
|
890,486
|
|
979,701
|
|
841,413
|
|
|||||
|
OPERATING INCOME
|
371,702
|
|
157,345
|
|
154,737
|
|
|||||
|
OTHER (INCOME) EXPENSE:
|
|||||||||||
|
Interest income
|
(1,391
|
)
|
(774
|
)
|
(1,043
|
)
|
|||||
|
Interest expense
|
26,510
|
|
21,205
|
|
9,493
|
|
|||||
|
Other, net
|
(136
|
)
|
(217
|
)
|
(393
|
)
|
|||||
|
Total other expense
|
24,983
|
|
20,214
|
|
8,057
|
|
|||||
|
INCOME BEFORE INCOME TAXES
|
346,719
|
|
137,131
|
|
146,680
|
|
|||||
|
PROVISION FOR INCOME TAXES
|
126,389
|
|
50,828
|
|
54,901
|
|
|||||
|
NET INCOME
|
220,330
|
|
86,303
|
|
91,779
|
|
|||||
|
Net loss attributable to noncontrolling interest
|
(44
|
)
|
(386
|
)
|
(494
|
)
|
|||||
|
NET INCOME ATTRIBUTABLE TO ALLEGIANT TRAVEL COMPANY
|
$
|
220,374
|
|
$
|
86,689
|
|
$
|
92,273
|
|
||
|
Earnings per share to common shareholders:
|
|||||||||||
|
Basic
|
$
|
12.97
|
|
$
|
4.87
|
|
$
|
4.85
|
|
||
|
Diluted
|
$
|
12.94
|
|
$
|
4.86
|
|
$
|
4.82
|
|
||
|
Shares used for computation:
|
|||||||||||
|
Basic
|
16,923
|
|
17,729
|
|
18,936
|
|
|||||
|
Diluted
|
16,962
|
|
17,782
|
|
19,050
|
|
|||||
|
Cash dividends declared per share:
|
$
|
2.75
|
|
$
|
2.50
|
|
$
|
2.25
|
|
||
The accompanying notes are an integral part of these consolidated financial statements.
44
ALLEGIANT TRAVEL COMPANY
CONSOLIDATED STATEMENTS OF COMPREHENSIVE INCOME
(in thousands)
|
|
Year ended December 31,
|
||||||||||
|
|
2015
|
2014
|
2013
|
||||||||
|
NET INCOME
|
$
|
220,330
|
|
$
|
86,303
|
|
$
|
91,779
|
|
||
|
OTHER COMPREHENSIVE INCOME:
|
|||||||||||
|
Unrealized gain (loss) on available-for-sale securities, net of tax effect of $104, $78 and ($34) for 2015, 2014 and 2013, respectively
|
(185
|
)
|
(124
|
)
|
57
|
|
|||||
|
Foreign currency translation adjustment, net of tax effect
|
226
|
|
176
|
|
—
|
|
|||||
|
Unrealized gain on derivatives, net of tax effect of ($252), ($687) and $- for 2015, 2014 and 2013, respectively
|
874
|
|
1,171
|
|
—
|
|
|||||
|
Reclassification of derivative gains into Other revenue
|
(1,292
|
)
|
—
|
|
—
|
|
|||||
|
Total other comprehensive (loss) income
|
(377
|
)
|
1,223
|
|
57
|
|
|||||
|
TOTAL COMPREHENSIVE INCOME
|
219,953
|
|
87,526
|
|
91,836
|
|
|||||
|
Comprehensive loss attributable to noncontrolling interest
|
(44
|
)
|
(386
|
)
|
(494
|
)
|
|||||
|
COMPREHENSIVE INCOME ATTRIBUTABLE TO ALLEGIANT TRAVEL COMPANY
|
$
|
219,997
|
|
$
|
87,912
|
|
$
|
92,330
|
|
||
The accompanying notes are an integral part of these consolidated financial statements.
45
ALLEGIANT TRAVEL COMPANY
CONSOLIDATED STATEMENTS OF SHAREHOLDERS’ EQUITY
(in thousands)
|
Total
|
||||||||||||||||||||||||||||||||||
|
Allegiant
|
||||||||||||||||||||||||||||||||||
|
Accumulated
|
Travel
|
|||||||||||||||||||||||||||||||||
|
Common
|
Additional
|
other
|
Company
|
|
Total
|
|||||||||||||||||||||||||||||
|
stock
|
Par
|
paid-in
|
comprehensive
|
Retained
|
Treasury
|
shareholders'
|
Noncontrolling
|
shareholders'
|
||||||||||||||||||||||||||
|
outstanding
|
value
|
capital
|
income (loss)
|
earnings
|
shares
|
equity
|
interest
|
equity
|
||||||||||||||||||||||||||
|
Balance at December 31, 2012
|
19,334
|
|
$
|
22
|
|
$
|
201,012
|
|
$
|
(69
|
)
|
$
|
302,325
|
|
$
|
(102,829
|
)
|
$
|
400,461
|
|
$
|
1,263
|
|
$
|
401,724
|
|
||||||||
|
Share-based compensation expense
|
—
|
|
—
|
|
4,430
|
|
—
|
|
—
|
|
—
|
|
4,430
|
|
—
|
|
4,430
|
|
||||||||||||||||
|
Issuance of restricted stock
|
85
|
|
—
|
|
—
|
|
—
|
|
—
|
|
—
|
|
—
|
|
—
|
|
—
|
|
||||||||||||||||
|
Exercises of stock options and stock-settled SARs
|
56
|
|
—
|
|
2,082
|
|
—
|
|
—
|
|
—
|
|
2,082
|
|
—
|
|
2,082
|
|
||||||||||||||||
|
Tax benefit from share-based compensation
|
—
|
|
—
|
|
1,689
|
|
—
|
|
—
|
|
—
|
|
1,689
|
|
—
|
|
1,689
|
|
||||||||||||||||
|
Assets sold in acquisition of ownership interest in subsidiary
|
—
|
|
—
|
|
—
|
|
—
|
|
—
|
|
—
|
|
—
|
|
(1,225
|
)
|
(1,225
|
)
|
||||||||||||||||
|
Assets acquired and services rendered in sale of ownership interest in subsidiary
|
—
|
|
—
|
|
—
|
|
—
|
|
—
|
|
—
|
|
—
|
|
2,030
|
|
2,030
|
|
||||||||||||||||
|
Cancellation of restricted stock
|
(4
|
)
|
—
|
|
—
|
|
—
|
|
—
|
|
—
|
|
—
|
|
—
|
|
—
|
|
||||||||||||||||
|
Shares repurchased by the Company and held as treasury shares
|
(927
|
)
|
—
|
|
—
|
|
—
|
|
—
|
|
(83,462
|
)
|
(83,462
|
)
|
—
|
|
(83,462
|
)
|
||||||||||||||||
|
Cash dividends declared, $2.25 per share
|
—
|
|
—
|
|
—
|
|
—
|
|
(41,787
|
)
|
—
|
|
(41,787
|
)
|
—
|
|
(41,787
|
)
|
||||||||||||||||
|
Unrealized gain on short-term investments, net of tax
|
—
|
|
—
|
|
—
|
|
57
|
|
—
|
|
—
|
|
57
|
|
—
|
|
57
|
|
||||||||||||||||
|
Net income (loss)
|
—
|
|
—
|
|
—
|
|
—
|
|
92,273
|
|
—
|
|
92,273
|
|
(494
|
)
|
91,779
|
|
||||||||||||||||
|
Balance at December 31, 2013
|
18,544
|
|
$
|
22
|
|
$
|
209,213
|
|
$
|
(12
|
)
|
$
|
352,811
|
|
$
|
(186,291
|
)
|
$
|
375,743
|
|
$
|
1,574
|
|
$
|
377,317
|
|
||||||||
|
Share-based compensation expense
|
—
|
|
—
|
|
6,362
|
|
—
|
|
—
|
|
—
|
|
6,362
|
|
—
|
|
6,362
|
|
||||||||||||||||
|
Issuance of restricted stock
|
55
|
|
—
|
|
—
|
|
—
|
|
—
|
|
—
|
|
—
|
|
—
|
|
—
|
|
||||||||||||||||
|
Exercises of stock options and stock-settled SARs
|
93
|
|
—
|
|
2,240
|
|
—
|
|
—
|
|
—
|
|
2,240
|
|
—
|
|
2,240
|
|
||||||||||||||||
|
Tax benefit from share-based compensation
|
—
|
|
—
|
|
3,442
|
|
—
|
|
—
|
|
—
|
|
3,442
|
|
—
|
|
3,442
|
|
||||||||||||||||
|
Cancellation of restricted stock
|
(11
|
)
|
—
|
|
—
|
|
—
|
|
—
|
|
—
|
|
—
|
|
—
|
|
—
|
|
||||||||||||||||
|
Shares repurchased by the Company and held as treasury shares
|
(1,268
|
)
|
—
|
|
—
|
|
—
|
|
—
|
|
(139,105
|
)
|
(139,105
|
)
|
—
|
|
(139,105
|
)
|
||||||||||||||||
|
Cash dividends declared, $2.50 per share
|
—
|
|
—
|
|
—
|
|
—
|
|
(43,717
|
)
|
—
|
|
(43,717
|
)
|
—
|
|
(43,717
|
)
|
||||||||||||||||
|
Other comprehensive income (loss)
|
—
|
|
—
|
|
—
|
|
1,223
|
|
—
|
|
—
|
|
1,223
|
|
—
|
|
1,223
|
|
||||||||||||||||
|
Net income (loss)
|
—
|
|
—
|
|
—
|
|
—
|
|
86,689
|
|
—
|
|
86,689
|
|
(386
|
)
|
86,303
|
|
||||||||||||||||
|
Balance at December 31, 2014
|
17,413
|
|
$
|
22
|
|
$
|
221,257
|
|
$
|
1,211
|
|
$
|
395,783
|
|
$
|
(325,396
|
)
|
$
|
292,877
|
|
$
|
1,188
|
|
$
|
294,065
|
|
||||||||
|
Share-based compensation expense
|
—
|
|
—
|
|
5,383
|
|
—
|
|
—
|
|
—
|
|
5,383
|
|
—
|
|
5,383
|
|
||||||||||||||||
|
Issuance of restricted stock
|
48
|
|
—
|
|
—
|
|
—
|
|
—
|
|
—
|
|
—
|
|
—
|
|
—
|
|
||||||||||||||||
|
Exercises of stock options
|
37
|
|
—
|
|
1,924
|
|
—
|
|
—
|
|
—
|
|
1,924
|
|
—
|
|
1,924
|
|
||||||||||||||||
|
Tax benefit from share-based compensation
|
—
|
|
—
|
|
3,865
|
|
—
|
|
—
|
|
—
|
|
3,865
|
|
—
|
|
3,865
|
|
||||||||||||||||
|
Liquidation of ownership interest in subsidiary
|
—
|
|
—
|
|
(3,484
|
)
|
—
|
|
3,926
|
|
—
|
|
442
|
|
(1,144
|
)
|
(702
|
)
|
||||||||||||||||
|
Cancellation of restricted stock
|
(8
|
)
|
—
|
|
—
|
|
—
|
|
—
|
|
—
|
|
—
|
|
—
|
|
—
|
|
||||||||||||||||
|
Shares repurchased by the Company and held as treasury shares
|
(695
|
)
|
—
|
|
—
|
|
—
|
|
—
|
|
(129,455
|
)
|
(129,455
|
)
|
—
|
|
(129,455
|
)
|
||||||||||||||||
|
Stock issued under employee stock purchase plan
|
8
|
|
—
|
|
—
|
|
—
|
|
—
|
|
1,436
|
|
1,436
|
|
—
|
|
1,436
|
|
||||||||||||||||
|
Cash dividends declared, $2.75 per share
|
—
|
|
—
|
|
—
|
|
—
|
|
(46,464
|
)
|
—
|
|
(46,464
|
)
|
—
|
|
(46,464
|
)
|
||||||||||||||||
|
Other comprehensive income (loss)
|
—
|
|
—
|
|
—
|
|
(377
|
)
|
—
|
|
—
|
|
(377
|
)
|
—
|
|
(377
|
)
|
||||||||||||||||
|
Net income (loss)
|
—
|
|
—
|
|
—
|
|
—
|
|
220,374
|
|
—
|
|
220,374
|
|
(44
|
)
|
220,330
|
|
||||||||||||||||
|
Balance at December 31, 2015
|
16,803
|
|
$
|
22
|
|
$
|
228,945
|
|
$
|
834
|
|
$
|
573,619
|
|
$
|
(453,415
|
)
|
$
|
350,005
|
|
$
|
—
|
|
$
|
350,005
|
|
||||||||
The accompanying notes are an integral part of these consolidated financial statements.
46
ALLEGIANT TRAVEL COMPANY
(in thousands)
|
|
Year ended December 31,
|
||||||||||
|
|
2015
|
2014
|
2013
|
||||||||
|
OPERATING ACTIVITIES:
|
|
|
|||||||||
|
Net income
|
$
|
220,330
|
|
$
|
86,303
|
|
$
|
91,779
|
|
||
|
Adjustments to reconcile net income to cash provided by operating activities:
|
|||||||||||
|
Depreciation and amortization
|
98,097
|
|
83,409
|
|
69,264
|
|
|||||
|
Loss on aircraft and other equipment disposals
|
4,630
|
|
7,100
|
|
8,000
|
|
|||||
|
Special charge
|
—
|
|
43,280
|
|
—
|
|
|||||
|
Provision for obsolescence of expendable parts, supplies and fuel
|
1,604
|
|
1,301
|
|
827
|
|
|||||
|
Amortization of deferred financing costs
|
1,099
|
|
2,215
|
|
612
|
|
|||||
|
Share-based compensation expense
|
10,474
|
|
16,723
|
|
9,818
|
|
|||||
|
Deferred income taxes
|
8,979
|
|
(7,353
|
)
|
(1,945
|
)
|
|||||
|
Excess tax benefits from share-based compensation
|
(3,865
|
)
|
(3,442
|
)
|
(1,689
|
)
|
|||||
|
Changes in certain assets and liabilities:
|
|||||||||||
|
Accounts receivable
|
(930
|
)
|
2,641
|
|
1,778
|
|
|||||
|
Prepaid expenses
|
6,030
|
|
8,591
|
|
(8,526
|
)
|
|||||
|
Accounts payable
|
(6,431
|
)
|
851
|
|
3,140
|
|
|||||
|
Accrued liabilities
|
13,910
|
|
11,309
|
|
3,695
|
|
|||||
|
Air traffic liability
|
12,821
|
|
17,927
|
|
19,474
|
|
|||||
|
Other, net
|
(1,381
|
)
|
(1,074
|
)
|
661
|
|
|||||
|
Net cash provided by operating activities
|
365,367
|
|
269,781
|
|
196,888
|
|
|||||
|
INVESTING ACTIVITIES:
|
|||||||||||
|
Purchase of investment securities
|
(357,546
|
)
|
(334,538
|
)
|
(351,616
|
)
|
|||||
|
Proceeds from maturities of investment securities
|
373,816
|
|
297,968
|
|
325,367
|
|
|||||
|
Purchase of property and equipment, including pre-delivery deposits
|
(252,686
|
)
|
(279,418
|
)
|
(177,516
|
)
|
|||||
|
Change in deposits and other assets
|
125
|
|
506
|
|
10,233
|
|
|||||
|
Other investing activities
|
2,073
|
|
234
|
|
700
|
|
|||||
|
Net cash used in investing activities
|
(234,218
|
)
|
(315,248
|
)
|
(192,832
|
)
|
|||||
|
FINANCING ACTIVITIES:
|
|||||||||||
|
Cash dividends paid to shareholders
|
(62,439
|
)
|
(41,787
|
)
|
—
|
|
|||||
|
Excess tax benefits from share-based compensation
|
3,865
|
|
3,442
|
|
1,689
|
|
|||||
|
Proceeds from the exercise of stock options
|
1,924
|
|
2,240
|
|
2,083
|
|
|||||
|
Proceeds from the issuance of long-term debt
|
121,000
|
|
385,300
|
|
106,000
|
|
|||||
|
Repurchase of common stock
|
(129,455
|
)
|
(139,105
|
)
|
(83,607
|
)
|
|||||
|
Principal payments on long-term debt
|
(67,930
|
)
|
(168,794
|
)
|
(22,656
|
)
|
|||||
|
Other financing activities
|
(612
|
)
|
(3,930
|
)
|
589
|
|
|||||
|
Net cash (used in) provided by financing activities
|
(133,647
|
)
|
37,366
|
|
4,098
|
|
|||||
|
Net change in cash and cash equivalents
|
(2,498
|
)
|
(8,101
|
)
|
8,154
|
|
|||||
|
CASH AND CASH EQUIVALENTS AT BEGINNING OF PERIOD
|
89,610
|
|
97,711
|
|
89,557
|
|
|||||
|
CASH AND CASH EQUIVALENTS AT END OF PERIOD
|
$
|
87,112
|
|
$
|
89,610
|
|
$
|
97,711
|
|
||
|
SUPPLEMENTAL DISCLOSURE:
|
|||||||||||
|
Cash payments for:
|
|||||||||||
|
Interest, net of amount capitalized
|
$
|
23,574
|
|
$
|
19,270
|
|
$
|
8,710
|
|
||
|
Income taxes, net of refunds
|
$
|
111,399
|
|
$
|
55,501
|
|
$
|
53,220
|
|
||
|
Non-cash transactions:
|
|||||||||||
|
Assets acquired in sale of ownership interest in subsidiary
|
$
|
—
|
|
$
|
—
|
|
$
|
530
|
|
||
|
Assets sold in acquisition of ownership interest in subsidiary
|
$
|
—
|
|
$
|
—
|
|
$
|
1,225
|
|
||
|
Long-term debt assumed for aircraft
|
$
|
—
|
|
$
|
141,960
|
|
$
|
—
|
|
||
The accompanying notes are an integral part of these consolidated financial statements.
47
ALLEGIANT TRAVEL COMPANY
NOTES TO CONSOLIDATED FINANCIAL STATEMENTS
For the years ended
December 31, 2015
,
2014
and
2013
Allegiant Travel Company (the “Company”) is a leisure travel company focused on providing travel services and products to residents of under-served cities in the United States. The Company operates a low-cost passenger airline which sells air transportation both on a stand-alone basis and bundled with the sale of air-related and third party services and products. The Company also provides air transportation under fixed fee flying arrangements, and generates aircraft lease revenue. Scheduled service and fixed fee air transportation services have similar operating margins, economic characteristics, production processes (check-in, baggage handling and flight services) which target the same class of customers, and are subject to the same regulatory environment. As a result, the Company believes it operates in one reportable segment and does not separately track expenses for scheduled service and fixed fee air transportation services.
Basis of Presentation
The accompanying consolidated financial statements include the accounts of Allegiant Travel Company and its majority-owned operating subsidiaries. The Company's investments in unconsolidated affiliates, which are
50 percent
or less owned, are accounted for under the equity method. All intercompany balances and transactions have been eliminated in consolidation.
Certain reclassifications, including those related to the adoption of Accounting Standard Update ("ASU") 2015-03, have been made to the prior period financial statements to conform to 2015 classifications. These reclassifications had no effect on previously reported net income.
Use of Estimates
The preparation of financial statements in conformity with U.S. GAAP requires management to make estimates and assumptions that affect the reported amounts of assets and liabilities, and disclosure of contingent assets and liabilities, at the date of the financial statements based on events and transactions occurring during the periods reported, and the reported amounts of revenues and expenses during the reporting period. Actual results could differ from these estimates.
Cash and Cash Equivalents
Cash and cash equivalents include investments and interest bearing instruments with maturities of three months or less at the balance sheet date. Such investments are carried at cost which approximates fair value.
Restricted Cash
Restricted cash represents escrowed funds under fixed fee contracts, and cash collateral against letters of credit required by hotel properties for guaranteed room availability, airports and certain other parties.
Accounts Receivable
Accounts receivable are carried at face amount which approximates fair value. They consist primarily of amounts due from credit card companies associated with the sale of tickets for future travel, and amounts due related to fixed fee charter agreements. If deemed necessary, the Company records an allowance for doubtful accounts for amounts not expected to be collected. The Company did not record an allowance for doubtful accounts as of
December 31, 2015
or
2014
.
Investment Securities
The Company’s investments in marketable securities are classified as available-for-sale and are reported at fair market value with the net unrealized gain or (loss) reported as a component of accumulated other comprehensive income in shareholders’ equity. Investment securities are classified as cash equivalents, short-term investments and long-term investments based on maturity date as of the balance sheet date. Cash equivalents have maturities of three months or less, short-term investments have maturities of greater than three months but equal to or less than one year, and long-term investments are those with a maturity date greater than one year. As of
December 31, 2015
, the Company’s long-term investments consisted of corporate
48
debt securities, government debt securities and municipal debt securities with contractual maturities of less than 24 months. Investment securities consisted of the following (in thousands):
|
As of December 31, 2015
|
As of December 31, 2014
|
||||||||||||||||||||||||||||||
|
Net Unrealized
|
Net Unrealized
|
||||||||||||||||||||||||||||||
|
Cost
|
Gains
|
(Losses)
|
Market Value
|
Cost
|
Gains
|
(Losses)
|
Market Value
|
||||||||||||||||||||||||
|
Money market funds
|
$
|
781
|
|
$
|
—
|
|
$
|
—
|
|
$
|
781
|
|
$
|
8,377
|
|
$
|
—
|
|
$
|
—
|
|
$
|
8,377
|
|
|||||||
|
Certificates of deposit
|
—
|
|
—
|
|
—
|
|
—
|
|
10,049
|
|
2
|
|
—
|
|
10,051
|
|
|||||||||||||||
|
Commercial paper
|
83,155
|
|
—
|
|
(1
|
)
|
83,154
|
|
47,941
|
|
3
|
|
(4
|
)
|
47,940
|
|
|||||||||||||||
|
Municipal debt securities
|
52,669
|
|
2
|
|
(1
|
)
|
52,670
|
|
105,933
|
|
14
|
|
(2
|
)
|
105,945
|
|
|||||||||||||||
|
US Treasury bond
|
1,607
|
|
—
|
|
(1
|
)
|
1,606
|
|
24,028
|
|
—
|
|
(31
|
)
|
23,997
|
|
|||||||||||||||
|
Corporate debt securities
|
108,485
|
|
50
|
|
(154
|
)
|
108,381
|
|
134,770
|
|
1
|
|
(106
|
)
|
134,665
|
|
|||||||||||||||
|
Federal agency debt securities
|
73,783
|
|
—
|
|
(80
|
)
|
73,703
|
|
4,711
|
|
—
|
|
(1
|
)
|
4,710
|
|
|||||||||||||||
|
Total
|
$
|
320,480
|
|
$
|
52
|
|
$
|
(237
|
)
|
$
|
320,295
|
|
$
|
335,809
|
|
$
|
20
|
|
$
|
(144
|
)
|
$
|
335,685
|
|
|||||||
The amortized cost of investment securities sold is determined by the specific identification method with any realized gains or losses reflected in other (income) expense. The Company had minimal realized losses during the years ended
December 31, 2015
,
2014
, and
2013
. The Company believes unrealized losses related to debt securities are not other-than-temporary and does not intend to sell these securities prior to amortized cost recoverability.
The Company attempts to minimize its concentration risk with regard to its cash, cash equivalents, and investment portfolio. This is accomplished by diversifying and limiting amounts among different counterparties, the type of investment, and the amount invested in any individual security, commercial paper, or money market fund.
Expendable Parts, Supplies and Fuel
Expendable parts, supplies and fuel inventories are valued at cost using the first-in, first-out method. Such inventories are charged to expense as they are used in operations. An obsolescence allowance for expendable parts is accrued based on the estimated lives of corresponding fleet type and salvage values. The allowance for expendable inventories was
$4.6 million
and
$3.0 million
at
December 31, 2015
and
2014
respectively. Fuel inventory was
$3.9 million
and
$5.5 million
at
December 31, 2015
and
2014
, respectively. Rotable aircraft parts inventories are included in flight equipment.
Software Capitalization
The Company capitalizes certain internal and external costs related to the acquisition and development of computer software during the application development stage of projects. Costs incurred during the preliminary and post-implementation stages are expensed as incurred. The Company amortizes these capitalized costs using the straight-line method over the estimated useful life of the software, which typically ranges from three to five years. The Company had unamortized computer software development costs of
$38.2 million
and
$31.8 million
as of
December 31, 2015
and
2014
, respectively. Amortization expense related to computer software was
$10.0 million
,
$6.7 million
and
$3.3 million
for the years ended
December 31, 2015
,
2014
and
2013
, respectively.
49
Property and Equipment
Property and equipment are recorded at cost and depreciated using the straight-line method over their estimated useful lives less an estimated salvage value. Aircraft and engines have an estimated average residual value of
14.7 percent
of original cost as of
December 31, 2015
; other property and equipment are assumed to have no residual value. The depreciable lives used for the principal depreciable asset classifications are:
|
Aircraft and related flight equipment:
|
|
|
MD83/88
|
3-9 years
|
|
Boeing 757-200
|
2 years
|
|
Airbus A320 Series
|
10-15 years
|
|
Rotable parts
|
7 years
|
|
Buildings
|
25 years
|
|
Equipment and leasehold improvements
|
3-7 years
|
|
Computer hardware and software
|
3-5 years
|
In estimating the useful lives and residual values of its aircraft, the Company primarily has relied upon actual experience with the same or similar aircraft types, current and projected future market information, and recommendations from other industry sources. Subsequent revisions to these estimates could be caused by changing market prices of the Company’s aircraft, changes in utilization of the aircraft, and other fleet events. These estimates are evaluated each reporting period and adjusted if necessary. Changes in the estimate for useful lives or residual values of the Company’s property and equipment could result in an acceleration of depreciation expense.
Interest attributable to funds used to finance the refurbishment of aircraft prior to revenue service is capitalized as an additional cost of the related asset, provided that the refurbishment is extensive or requires an extended period of time to complete, generally longer than 90 days. Interest is capitalized at the Company’s average interest rate on long-term debt and ceases when the asset is ready for service.
Leased Aircraft Return Costs
The Company has been party to operating lease agreements which contain aircraft return provisions. These provisions require the Company to compensate the lessor based on specific time remaining on certain aircraft and engine components between scheduled maintenance events. A liability associated with returning leased aircraft is accrued when it is probable that a cash payment will be made and that amount is reasonably estimable. Any accrual is based on the time remaining on the lease, planned aircraft usage and other provisions included in the lease agreement, although the actual amount due to any lessor upon return is not known with certainty until lease termination. Two previously leased Airbus A320 series aircraft were purchased in 2014, at which time the lease return condition accrual of
$1.4 million
as of December 31, 2013 was reversed. As of
December 31, 2015
, the Company has no remaining aircraft under lease agreements.
Aircraft Maintenance and Repair Costs
The Company accounts for non-major maintenance and repair costs incurred under the direct expense method. Under this method, maintenance and repair costs for owned and leased aircraft, excluding major maintenance activities, are charged to operating expenses as incurred. Maintenance and repair costs includes all parts, materials, line maintenance, and non-major maintenance activities required to maintain the Company's multiple fleet types.
The Company accounts for major maintenance costs for MD-80 airframes and the related JT8 engines using the direct expense method. Under this method, major maintenance costs are charged to expense as incurred. This method can result in expense volatility between quarterly and annual periods, depending on the number and type of major maintenance activities performed. Scheduled maintenance activities are the most extensive in scope and are primarily based on time and usage intervals, including, but not limited to, airframe and engine overhauls. The Company has not experienced major maintenance events for its Airbus A320 series or 757-200 fleets and as such, has not yet applied a method to account for major maintenance for these aircraft types.
50
Measurement of Impairment of Long-Lived Assets
The Company records impairment losses on long-lived assets used in operations, consisting principally of property and equipment, when events or changes in circumstances indicate, in management’s judgment, that the assets might be impaired, and the undiscounted future cash flows estimated to be generated by those assets are less than the carrying amount of those assets. In making these determinations, the Company utilizes certain assumptions, including, but not limited to: (i) estimated fair market value of the assets; and (ii) estimated future cash flows expected to be generated by these assets, which are based on additional assumptions such as asset utilization, length of service for which the asset will be used in operations, and estimated salvage values.
For the years ended
December 31, 2015
,
2014
and
2013
, the Company incurred impairment losses on spare engine parts of
$1.1 million
,
$3.4 million
and
$5.3 million
, respectively.
In the fourth quarter 2014, the Company recorded a non-cash impairment charge of
$43.3 million
on its fleet of Boeing 757 aircraft, engines, and related assets as a result of its review of fleet value. The review was based on factors such as the Company's ability or intent to operate fleet types through their estimated useful lives, potential changes to the fleet residual values based on changes in market conditions for used aircraft, spare engines and parts, and potential changes to the scheduled revenue network based on competition trends and operational performance. Refer to Note 8 – Fair Value Measurements for further discussion.
Revenue Recognition
Scheduled service revenue consists of passenger revenue generated from nonstop flights in the Company’s route network, recognized either when the travel-related service or transportation is provided or when the itinerary expires unused. Nonrefundable scheduled itineraries expire on the date of the intended flight, unless the date is extended by notification from the customer in advance. Itineraries sold for transportation not yet used, as well as unexpired credits, are included in air traffic liability.
Various taxes and fees, assessed on the sale of tickets to customers, are collected by the Company serving as an agent, and remitted to taxing authorities. These taxes and fees are presented on a net basis in the Company’s consolidated statements of income and recorded as a liability until remitted to the appropriate taxing authority.
Fixed fee contract revenue consists of agreements to provide charter service on a year-round and ad hoc basis. Fixed fee contract revenue is recognized when the transportation is provided.
Ancillary air-related revenue is generated from fees paid by ticketed passengers and consists of baggage fees, the use of the Company’s website to purchase scheduled service transportation, advance seat assignments, and other services. Revenues from air-related charges are recognized when the transportation is provided if the product is not deemed independent of the original ticket sale. Change and cancellation fees for nonrefundable itineraries are air-related charges deemed independent of the original ticket sale, and are recognized as revenue when the sale occurs.
Ancillary revenue is also generated from the sale of third party products such as hotel rooms, rental cars, ticket attractions, and other items. Revenue from the sale of third party products is recognized at the time the product is utilized, such as the time a purchased hotel room is occupied. The Company follows accounting standards for revenue arrangements with multiple deliverables to determine the amount of revenue to be recognized for each element of a bundled sale involving air-related charges and third party products in addition to airfare. Revenue from the sale of third party products is recorded net of amounts paid to wholesale providers, travel agent commissions, and transaction costs.
Other revenue is generated from leased out aircraft and flight equipment, and other miscellaneous sources. Lease revenue is recognized pro-rata over the lease term.
Advertising Costs
Advertising costs are charged to expense in the period incurred. Advertising expense was
$12.7 million
,
$6.0 million
and
$4.2 million
for the years ended
December 31, 2015
,
2014
and
2013
, respectively.
51
Earnings per Share
Basic and diluted earnings per share are computed pursuant to the two-class method. Under this method, the Company attributes net income to two classes, common stock and unvested restricted stock awards. Unvested restricted stock awards granted to employees under the Company’s Long-Term Incentive Plan are considered participating securities because they receive non-forfeitable rights to cash dividends at the same rate as common stock.
Diluted net income per share is calculated using the more dilutive of two methods. Under both methods, the exercise of employee stock options and stock-settled stock appreciation rights are assumed using the treasury stock method. The assumption of vesting of restricted stock, however, differs as described below:
|
1.
|
Assume vesting of restricted stock using the treasury stock method.
|
|
2.
|
Assume unvested restricted stock awards are not vested, and allocate earnings to common shares and unvested restricted stock awards using the two-class method.
|
For the years ended
December 31, 2015
,
2014
and
2013
, the second method above was used in the computation because it was more dilutive than the first method. The following table sets forth the computation of net income per share on a basic and diluted basis for the periods indicated (in thousands, except per share amounts):
|
|
Year ended December 31,
|
||||||||||
|
|
2015
|
2014
|
2013
|
||||||||
|
Basic:
|
|
|
|||||||||
|
Net income attributable to Allegiant Travel Company
|
$
|
220,374
|
|
$
|
86,689
|
|
$
|
92,273
|
|
||
|
Less net income allocated to participating securities
|
(961
|
)
|
(293
|
)
|
(381
|
)
|
|||||
|
Net income attributable to common stock
|
$
|
219,413
|
|
$
|
86,396
|
|
$
|
91,892
|
|
||
|
Net income per share, basic
|
$
|
12.97
|
|
$
|
4.87
|
|
$
|
4.85
|
|
||
|
Weighted-average shares outstanding
|
16,923
|
|
17,729
|
|
18,936
|
|
|||||
|
Diluted:
|
|
|
|
|
|||||||
|
Net income attributable to Allegiant Travel Company
|
$
|
220,374
|
|
$
|
86,689
|
|
$
|
92,273
|
|
||
|
Less net income allocated to participating securities
|
(958
|
)
|
(292
|
)
|
(378
|
)
|
|||||
|
Net income attributable to common stock
|
$
|
219,416
|
|
$
|
86,397
|
|
$
|
91,895
|
|
||
|
Net income per share, diluted
|
$
|
12.94
|
|
$
|
4.86
|
|
$
|
4.82
|
|
||
|
Weighted-average shares outstanding
|
16,923
|
|
17,729
|
|
18,936
|
|
|||||
|
Dilutive effect of stock options, restricted stock and stock-settled stock appreciation rights
|
69
|
|
88
|
|
154
|
|
|||||
|
Adjusted weighted-average shares outstanding under treasury stock method
|
16,992
|
|
17,817
|
|
19,090
|
|
|||||
|
Participating securities excluded under two-class method
|
(30
|
)
|
(35
|
)
|
(40
|
)
|
|||||
|
Adjusted weighted-average shares outstanding under two-class method
|
16,962
|
|
17,782
|
|
19,050
|
|
|||||
Stock awards outstanding of
28,789
,
75,233
, and
91,028
shares for
2015
,
2014
, and
2013
, respectively, were excluded from the computation of diluted earnings per share as they were antidilutive.
Share-Based Compensation
The Company accounts for share-based compensation in accordance with accounting standards which require the compensation cost related to share-based payment transactions be recognized in the Company’s consolidated statements of income. The cost is measured at the grant date, based on the calculated fair value of the award using the Black-Scholes option pricing model for stock options and cash-settled SARs, and is remeasured monthly for cash-settled SARs. Cost is based on the closing share price of the Company’s stock on the grant date for restricted stock awards. The cost is recognized as an expense over the employee’s requisite service period, the vesting period of the award, which is generally three years. The Company’s share-based employee compensation plan is more fully discussed in Note 12—Employee Benefit Plans.
52
Income Taxes
The Company recognizes deferred income taxes based on the asset and liability method required by accounting standards. Deferred tax assets and liabilities are determined based on the timing differences between book basis for financial reporting purposes and tax basis of the asset and liability and measured using the enacted tax rates. A valuation allowance for deferred tax assets is provided if it is more likely than not that some portion or all of the deferred tax assets will not be realized. The Company determines the net non-current deferred tax assets or liabilities separately for federal, state, foreign and other local jurisdictions.
The Company’s income tax returns are subject to examination by the Internal Revenue Service (“IRS”) and other tax authorities in the jurisdictions where the Company operates. The Company assesses potentially unfavorable outcomes of such examinations based on the criteria set forth in uncertain tax position accounting standards. The accounting standards prescribe a minimum recognition threshold a tax position is required to meet before being recognized in the financial statements.
Accounting standards for income taxes utilize a two-step approach for evaluating tax positions. Recognition (Step I) occurs when the Company concludes that a tax position, based on its technical merits, is more likely than not to be sustained upon examination. Measurement (Step II) is only addressed if the position is deemed to be more likely than not to be sustained. Under Step II, the tax benefit is measured as the largest amount of benefit that is greater than 50 percent likely of being realized upon settlement.
The tax positions failing to qualify for initial recognition are recognized in the first subsequent interim period they meet the “more likely than not” standard. If it is subsequently determined that a previously recognized tax position no longer meets the “more likely than not” standard, it is required that the tax position be derecognized. As applicable, the Company will recognize accrued penalties and interest related to unrecognized tax benefits in the provision for income taxes.
Recent Accounting Pronouncements
In May 2014, the Financial Accounting Standards Board ("FASB") issued ASU 2014-09, intended to create a unified model to determine when and how revenue is recognized. The core principle is that a company should recognize revenue to depict the transfer of promised goods or services to customers in an amount that reflects the consideration to which the entity expects to be entitled in exchange for those goods or services. In July 2015, the FASB deferred the effective date by one year, to December 15, 2017, for annual and interim periods beginning after that date. Early adoption is also permitted but not before the original effective date of annual periods beginning after December 15, 2016. The Company is evaluating the impact on its financial statements of adopting this new accounting standard and plans to provide additional information regarding its expected financial impact at a later date.
In April 2015, the FASB issued ASU 2015-03, which amends existing guidance and requires the presentation of debt issuance costs on the balance sheet as a reduction of the carrying amount of the related debt liability rather than as a deferred charge, effective for fiscal years, and interim periods within those years beginning on or after December 15, 2015 and early adoption is permitted. The Company retrospectively adopted this standard as of December 31, 2015. Debt issuance costs previously reflected on the balance sheet in deposits and other assets, are now reflected as a reduction to long-term debt, in the amount of
$4.5 million
and
$4.3 million
as of December 31, 2015 and December 31, 2014, respectively.
In November 2015, the FASB issued ASU 2015-17, requiring all deferred tax assets and liabilities, and any related valuation allowance, to be classified as non-current on the balance sheet, effective for fiscal years, and interim periods within those years, beginning on or after December 15, 2016 and early adoption is permitted. The purpose of the classification change is to simplify the presentation of deferred income taxes on the Consolidated Balance Sheet. The Company has elected to prospectively adopt this accounting principle as of December 31, 2015. Prior periods in the consolidated financial statements have not been retrospectively adjusted.
53
Property and equipment consisted of the following (in thousands):
|
|
As of December 31, 2015
|
As of December 31, 2014
|
|||||
|
Flight equipment
|
$
|
1,123,115
|
|
$
|
947,082
|
|
|
|
Computer hardware and software
|
78,200
|
|
58,173
|
|
|||
|
Ground property and equipment
|
72,078
|
|
42,743
|
|
|||
|
Total property and equipment
|
1,273,393
|
|
1,047,998
|
|
|||
|
Less accumulated depreciation and amortization
|
(387,451
|
)
|
(309,215
|
)
|
|||
|
Property and equipment, net
|
$
|
885,942
|
|
$
|
738,783
|
|
|
The following table summarizes the Company's total in-service aircraft fleet as of
December 31, 2015
:
|
Aircraft Type
|
Owned (1)
|
Seating Capacity
(per aircraft) |
Average Age
in Years |
|||||
|
MD-83/88
|
51
|
|
166
|
|
26.0
|
|||
|
Boeing 757-200
|
5
|
|
215
|
|
22.8
|
|||
|
Airbus A319 (2)
|
10
|
|
156
|
|
11.0
|
|||
|
Airbus A320 (3)
|
14
|
|
177
|
|
15.9
|
|||
|
Total aircraft
|
80
|
|
|
|
||||
|
(1)
|
Refer to Note 5 – Long-Term Debt for discussion of the Company's notes payable secured by aircraft.
|
|
(2)
|
Does not include
12
Airbus A319 aircraft currently on lease to a European carrier until 2018 or
one
Airbus 319 aircraft being prepared for revenue service.
|
|
(3)
|
Does not include
two
Airbus A320 aircraft being prepared for revenue service.
|
Accrued liabilities consisted of the following (in thousands):
|
|
As of December 31, 2015
|
As of December 31, 2014
|
|||||
|
Salaries, wages and benefits
|
$
|
37,545
|
|
$
|
30,949
|
|
|
|
Dividends
|
27,728
|
|
43,703
|
|
|||
|
Station expenses
|
11,668
|
|
7,683
|
|
|||
|
Maintenance and repairs
|
7,287
|
|
4,727
|
|
|||
|
Passenger fees
|
9,007
|
|
8,219
|
|
|||
|
Passenger taxes
|
1,415
|
|
705
|
|
|||
|
Interest
|
7,900
|
|
8,875
|
|
|||
|
Other accruals
|
6,912
|
|
5,941
|
|
|||
|
Total accrued liabilities
|
$
|
109,462
|
|
$
|
110,802
|
|
|
As of December 31, 2015
, the increase in salaries, wages and benefits payable was mostly due to an increase to the bonus accrual as the Company achieved higher profits in
2015
compared to
2014
. Dividends payable decreased year over year as the Company declared a
$1.65
per share dividend in December
2015
compared to
$2.50
per share in
2014
, in each case, paid in January of the following year.
54
Long-term debt consisted of the following (in thousands):
|
|
As of December 31, 2015
|
As of December 31, 2014
|
|||||
|
Fixed-rate notes payable due through 2020
|
$
|
341,738
|
|
$
|
343,625
|
|
|
|
Variable-rate notes payable due through 2020
|
299,940
|
|
245,169
|
|
|||
|
Total long-term debt, net of related costs
|
641,678
|
|
588,794
|
|
|||
|
Less current maturities
|
74,069
|
|
52,605
|
|
|||
|
Long-term debt, net of current maturities and related costs
|
$
|
567,609
|
|
$
|
536,189
|
|
|
Maturities of long-term debt, as of December 31, 2015, for the next five years and thereafter, in the aggregate, are: 2016 -
$74.1 million
; 2017 -
$76.4 million
; 2018 -
$133.1 million
; 2019 -
$336.9 million
; 2020 -
$21.2 million
; and
none
thereafter.
Secured Debt
In December 2015, the Company borrowed
$28.0 million
secured by
two
A319 aircraft. The notes bear interest at a floating rate based on LIBOR plus
1.70 percent
and are payable in quarterly installments through December 2020.
In September 2015, the Company borrowed
$29.0 million
secured by
two
A319 aircraft. The notes bear interest at a floating rate based on LIBOR plus
1.75 percent
and are payable in quarterly installments through September 2020.
In June 2015, the Company borrowed
$26.5 million
secured by
two
A319 aircraft. The notes bear interest at a floating rate based on LIBOR plus
1.70 percent
and are payable in quarterly installments through June 2020.
In March 2015, the Company borrowed
$30.0 million
secured by
two
A319 aircraft. The notes bear interest at a floating rate based on LIBOR plus
1.70 percent
, and are payable in quarterly installments through March 2020.
In March 2015, the Company borrowed
$7.5 million
secured by the real estate purchased by the Company in October 2014. The note bears a fixed interest rate of
2.86 percent
per annum, and provides for a 25-year amortization and a five-year term.
In June 2014, the Company assumed
$142.0 million
of debt in connection with the acquisition of
12
separate special purpose companies, each owning
one
Airbus A319 aircraft. The notes payable assumed bear interest based on LIBOR plus
3.08 percent
and are payable in monthly installments through November 2018, at which time a balloon payment is due.
In May 2014, the Company borrowed
$40.0 million
secured by all
six
of the Company's Boeing 757-200 aircraft. The notes bear interest at LIBOR plus
2.95 percent
and are payable in monthly installments through May 2018, at which time a balloon payment is due. In October 2015, in connection with its retirement, the Company prepaid
$4.6 million
due on the note payable for
one
Boeing 757-200 aircraft.
In April 2014, the Company borrowed
$45.3 million
under a loan agreement secured by all of the Company's MD-80 aircraft. The note payable issued under the loan agreement bears interest at LIBOR plus
2.95 percent
and is payable in monthly installments through April 2018, at which time a balloon payment is due. Concurrently, the Company prepaid the remaining
$121.1 million
balance of its senior secured term loan facility (the "Term Loan"). The original maturity date of the Term Loan was March 2017 and it bore interest based on LIBOR with a LIBOR floor of
1.50 percent
.
In the second quarter 2014, the Company prepaid, in full, the
$8.5 million
balance owed on its note payable secured by
two
Boeing 757-200 aircraft originally due in July 2016.
Senior Secured Revolving Credit Facility
In December 2015, the Company, through a wholly owned subsidiary, entered into a senior secured revolving credit facility under which it will be able to borrow up to
$56.0 million
. The amount that may be drawn under the facility and the outstanding debt balance are based on the value of Airbus A320 series aircraft which the Company may choose to place in the collateral pool. The facility has a term of 24 months and may be extended for two further one-year periods at the lender’s option. Any
55
notes under the facility will bear interest at a floating rate based on LIBOR plus
1.85 percent
. An individual aircraft may remain in the collateral pool for up to one year. As of December 31, 2015, no amount had been borrowed against this credit facility.
General Unsecured Senior Notes
In June 2014, the Company completed an offering of
$300.0 million
aggregate principal amount of senior unsecured obligations (the "Notes") which will mature in July 2019. The Notes constitute general unsecured senior obligations of the Company and rank equally in right of payment with all existing and future senior unsecured indebtedness and liabilities (including trade payables) of the Company. The Notes are effectively junior to the Company’s existing and future secured indebtedness. The Notes are guaranteed by all of the Company’s wholly-owned domestic subsidiaries and rank equally in right of payment with all existing and future unsecured indebtedness and liabilities (including trade payables) of the Company’s guarantor subsidiaries, but effectively junior to the guarantors’ existing and future secured indebtedness.
The Notes bear interest at a rate of
5.5 percent
per year, payable in cash semi-annually, on January 15 and July 15 of each year, and will mature on July 15, 2019.
At any time, the Company may redeem the Notes, in whole or in part, at a price equal to 100 percent of the principal amount of the Notes, plus accrued and unpaid interest, plus a “make-whole premium.” The occurrence of specific kinds of changes in control will be a triggering event requiring the Company to offer to purchase, from holders, all or a portion of the Notes at a price equal to 101 percent of the principal amount, together with accrued and unpaid interest to the date of purchase.
The indenture pursuant to which the Notes were issued includes operating and financial restrictions on the Company. These restrictions limit or restrict, among other things, the Company’s ability and the ability of its restricted subsidiaries to (i) incur additional indebtedness; (ii) incur liens; (iii) make restricted payments (including paying dividends on, redeeming, repurchasing or retiring capital stock); (iv) make investments; and (v) consolidate, merge or sell all or substantially all of its assets. These covenants are subject to various exceptions and qualifications under the terms of the indenture. As of December 31, 2015, management believes the Company is in compliance with all covenants under the indenture.
The Company has leased aircraft, engines and other assets, including office facilities, airport and terminal facilities, and office equipment for which the majority have terms extending through 2020. Total rental expense for operating leases for the years ended
December 31, 2015
,
2014
and
2013
was
$7.9 million
,
$8.8 million
and
$13.1 million
, respectively.
Included in total rental expense is
$1.0 million
and
$5.5 million
in 2014 and 2013, respectively, of aircraft lease rentals expense for
two
Airbus A320 series aircraft which were purchased in 2014; no such expense was incurred in 2015. Additionally, aircraft sub-service expense was
$2.1 million
,
$14.8 million
, and
$4.2 million
in 2015, 2014 and 2013, respectively.
Aircraft leases
In August 2014, the Company entered into an agreement with the lessor of
eight
Airbus A320 series aircraft to terminate its existing operating leases (
two
aircraft had been delivered) and simultaneously entered into a purchase agreement with the lessor for the purchase of the same aircraft. The Company performed a valuation of this acquisition and, concluding that the purchase price was stated at fair value, recognized no associated impairment or lease termination costs.
Airport and other facilities leases
Office facilities under lease include approximately
10,000
and
87,000
square feet of space used for corporate and training purposes, with expiration dates ranging between 2018 and 2020. The Company is responsible for its share of common area maintenance charges under both leases. An additional
70,000
square feet of corporate office space was under lease through May 2015.
Airport and terminal facility leases are entered into with a number of local governments and other third parties. These lease arrangements have a variety of terms and conditions.
56
Scheduled future minimum lease payments
At
December 31, 2015
, scheduled future minimum lease payments under operating leases with initial or remaining non-cancelable lease terms in excess of one year are: 2016 -
$5.1 million
; 2017 -
$3.6 million
; 2018 -
$2.3 million
; 2019 -
$1.7 million
; 2020 -
$1.3 million
; and thereafter -
$3.3 million
.
In addition, scheduled future minimum airport fee payments under airport use and lease agreements with fixed and remaining non-cancelable terms in excess of one year are:
2016
-
$11.0 million
;
2017
-
$5.9 million
; and thereafter -
$0.8 million
.
The Company is authorized by its Board of Directors to acquire the Company’s stock through open market and private purchases under its share repurchase program. As repurchase authority is used, the Board of Directors has, to date, authorized additional expenditures for share repurchases.
Share repurchases consisted of the following during the periods indicated:
|
Twelve Months Ended December 31,
|
|||||||||||
|
2015
|
2014
|
2013
|
|||||||||
|
Shares repurchased
|
694,685
|
|
1,268,289
|
|
927,006
|
|
|||||
|
Average price per share
|
$
|
186.35
|
|
$
|
109.68
|
|
$
|
90.03
|
|
||
|
Total (in thousands)
|
$
|
129,455
|
|
$
|
139,105
|
|
$
|
83,462
|
|
||
As of
December 31, 2015
, the Company had
$54.1 million
in unused share repurchase authority remaining under the Board approved program.
During 2015, the Board declared quarterly cash dividends of
$1.10
per share for a total of
$18.7 million
paid by the Company during the year. Prior to year-end, the Board declared a special cash dividend of
$1.65
per share on outstanding common stock payable to shareholders of record on December 18, 2015. On January 8, 2016, the Company paid
$27.7 million
to these shareholders.
On December 3, 2014, the Board declared a special cash dividend of
$2.50
per share on its outstanding common stock payable to shareholders of record on December 19, 2014. On January 6, 2015, the Company paid
$43.7 million
to these shareholders.
On November 14, 2013, the Board declared a special cash dividend of
$2.25
per share on its outstanding common stock payable to shareholders of record on December 13, 2013. On January 3, 2014, the Company paid
$41.8 million
to these shareholders.
Investments
The Company measures certain financial assets and liabilities at fair value on a recurring basis. Fair value is an exit price, representing the amount that would be received to sell an asset or paid to transfer a liability in an orderly transaction between market participants. Accounting standards pertaining to fair value measurements establish a three-tier fair value hierarchy, which prioritizes the inputs used in measuring fair value as follows:
Level 1 - Defined as observable inputs such as quoted prices in active markets for identical assets or liabilities
Level 2 - Defined as inputs other than Level 1 inputs that are either directly or indirectly observable
Level 3 - Defined as unobservable inputs for which little or no market data exists, therefore requiring an entity to develop its own assumptions
The Company uses the market approach valuation technique to determine fair value for investment securities. The assets classified as Level 1 consist of money market funds for which original cost approximates fair value. The assets classified as Level 2 consist of certificates of deposit, commercial paper, municipal debt securities, federal agency debt securities,
57
government debt securities, corporate debt securities, and US treasury bonds, which are valued using quoted market prices or alternative pricing sources including transactions involving identical or comparable assets and models utilizing market observable inputs. The Company has no investment securities classified as Level 3.
For those assets classified as Level 2 that are not in active markets, the Company obtains fair value from pricing sources using quoted market prices for identical or comparable instruments, and uses pricing models which include all significant observable inputs: maturity dates, issue dates, settlement dates, benchmark yields, reported trades, broker-dealer quotes, issue spreads, benchmark securities, bids, offers and other market related data. These inputs are observable or can be derived from, or corroborated by, observable market data for substantially the full term of the asset.
The fair value of the Company's derivative instrument is determined using standard valuation models. The significant inputs used in these models are readily available in public markets or can be derived from observable market transactions and therefore have been classified as Level 2. Inputs used in these standard valuation models for derivative instruments include the applicable exchange and interest rates.
Financial instruments measured at fair value on a recurring basis (in thousands):
|
Description
|
As of
December 31, 2015 |
Level 1
|
Level 2
|
|||||||||
|
Cash equivalents
|
|
|
|
|||||||||
|
Commercial paper
|
$
|
8,426
|
|
$
|
—
|
|
$
|
8,426
|
|
|||
|
Money market funds
|
781
|
|
781
|
|
—
|
|
||||||
|
Municipal debt securities
|
754
|
|
—
|
|
754
|
|
||||||
|
Total cash equivalents
|
9,961
|
|
781
|
|
9,180
|
|
||||||
|
Short-term
|
|
|
|
|
|
|
||||||
|
Corporate debt securities
|
80,957
|
|
—
|
|
80,957
|
|
||||||
|
Municipal debt securities
|
47,073
|
|
—
|
|
47,073
|
|
||||||
|
Commercial paper
|
74,728
|
|
—
|
|
74,728
|
|
||||||
|
Federal agency debt securities
|
42,825
|
|
—
|
|
42,825
|
|
||||||
|
Total short-term
|
245,583
|
|
—
|
|
245,583
|
|
||||||
|
Long-term
|
|
|
|
|
|
|
||||||
|
Federal agency debt securities
|
30,878
|
|
—
|
|
30,878
|
|
||||||
|
Corporate debt securities
|
27,425
|
|
—
|
|
27,425
|
|
||||||
|
Municipal debt securities
|
4,843
|
|
—
|
|
4,843
|
|
||||||
|
Derivative instruments
|
2,480
|
|
—
|
|
2,480
|
|
||||||
|
US Treasury Bond
|
1,606
|
|
—
|
|
1,606
|
|
||||||
|
Total long-term
|
67,232
|
|
—
|
|
67,232
|
|
||||||
|
Total financial instruments
|
$
|
322,776
|
|
$
|
781
|
|
$
|
321,995
|
|
|||
58
|
Description
|
As of
December 31, 2014 |
Level 1
|
Level 2
|
|||||||||
|
Cash equivalents
|
||||||||||||
|
Money market funds
|
$
|
8,377
|
|
$
|
8,377
|
|
$
|
—
|
|
|||
|
Municipal debt securities
|
101
|
|
—
|
|
101
|
|
||||||
|
Total cash equivalents
|
8,478
|
|
8,377
|
|
101
|
|
||||||
|
Short-term
|
|
|
|
|
|
|
||||||
|
Corporate debt securities
|
103,961
|
|
—
|
|
103,961
|
|
||||||
|
Municipal debt securities
|
103,155
|
|
—
|
|
103,155
|
|
||||||
|
Commercial paper
|
47,940
|
|
—
|
|
47,940
|
|
||||||
|
Certificates of deposit
|
10,051
|
|
—
|
|
10,051
|
|
||||||
|
Federal agency debt securities
|
4,710
|
|
—
|
|
4,710
|
|
||||||
|
Total short-term
|
269,817
|
|
—
|
|
269,817
|
|
||||||
|
Long-term
|
|
|
|
|
|
|
||||||
|
Corporate debt securities
|
30,704
|
|
—
|
|
30,704
|
|
||||||
|
Government debt securities
|
23,997
|
|
—
|
|
23,997
|
|
||||||
|
Municipal debt securities
|
2,689
|
|
—
|
|
2,689
|
|
||||||
|
Derivative instruments
|
1,858
|
|
—
|
|
1,858
|
|
||||||
|
Total long-term
|
59,248
|
|
—
|
|
59,248
|
|
||||||
|
Total financial instruments
|
$
|
337,543
|
|
$
|
8,377
|
|
$
|
329,166
|
|
|||
There were no significant transfers between Level 1 and Level 2 assets for the years ended
December 31, 2015
or
2014
.
Long-term Debt
The fair value of the Company’s publicly held long-term debt is determined based on inputs that are readily available in public markets or can be derived from information available in publicly quoted markets; therefore, the Company has categorized its publicly held debt as Level 2. The remaining debt agreements are not publicly held. The Company has determined the estimated fair value of these notes to be Level 3, as certain inputs used to determine the fair value of these agreements are unobservable and, therefore, could be sensitive to changes in inputs. The Company utilizes the discounted cash flow method to estimate the fair value of Level 3 debt.
Carrying value and estimated fair value of long-term debt, including current maturities (in thousands):
|
As of December 31, 2015
|
As of December 31, 2014
|
|||||||||||||||||
|
Carrying value
|
Estimated fair value
|
Carrying value
|
Estimated Fair Value
|
Level
|
||||||||||||||
|
Publicly held debt
|
$
|
300,000
|
|
$
|
299,250
|
|
$
|
300,000
|
|
$
|
304,875
|
|
2
|
|||||
|
Non-publicly held debt
|
346,179
|
|
327,321
|
|
293,099
|
|
270,490
|
|
3
|
|||||||||
|
Total long-term debt
|
$
|
646,179
|
|
$
|
626,571
|
|
$
|
593,099
|
|
$
|
575,365
|
|
||||||
Aircraft
In the fourth quarter 2014, the Company recorded a non-cash impairment charge of
$43.3 million
on its fleet of Boeing 757 aircraft, engines, and related assets as a result of a review of fleet value. The Company concluded that the carrying value of these aircraft and related assets was no longer fully recoverable when compared to the estimated remaining future undiscounted cash flows from these assets. Therefore, an adjustment to their fair value with inputs classified as Level 3 was recorded.
Other
Due to the short term nature, carrying amounts of cash, cash equivalents, restricted cash, accounts receivable and accounts payable approximate fair value.
59
In 2014, the Company entered into a foreign currency swap in order to mitigate the foreign currency exchange rate risk associated with the forecasted lease revenue from
12
Airbus A320 series aircraft leased to a European carrier until 2018. The Company uses a cash flow hedge to minimize the variability in cash flows of assets or liabilities or forecasted transactions caused by fluctuations in foreign currency exchange rates. At
December 31, 2015
and 2014 respectively, the change in fair value recorded in accumulated other comprehensive income related to the net unrealized gain on the hedge was
$0.9 million
and
$1.2 million
.
At inception, the Company formally designated and documented this financial instrument as a hedge of a specific underlying exposure, the risk management objective, and the strategy for undertaking the hedge transaction. The Company also assessed whether the financial instrument used in the hedging transactions was effective at offsetting changes in either the fair values or cash flows of the related underlying exposures. This assessment is monitored on at least a quarterly basis, and the change in fair market value of any ineffective portion of a financial instrument would be immediately recognized into earnings. In 2015, the Company realized
$1.3 million
in net gains from its cash flow hedge in Other revenue from amounts settled under the forward contract. As of
December 31, 2015
it is expected that
$0.7 million
will be reclassified from Other comprehensive income into Other revenue within the next 12 months. The Company did not realize net gains into Other revenue in 2014.
At
December 31, 2015
and 2014 respectively, the fair value of the Company's derivative instrument was
$2.5 million
and
$1.9 million
and is reported in the Company's consolidated balance sheet within Deposits and other assets. Refer to Note 8 - Fair Value Measurements for additional information related to the estimated fair value.
The Company is subject to income taxation in the United States, foreign countries and various state jurisdictions in which it operates. In accordance with income tax reporting accounting standards, the Company recognizes tax benefits or expense on the temporary differences between the financial reporting and tax bases of its assets and liabilities.
Components of Income/(Loss) Before Income Taxes from Continuing Operations
The components of income before taxes for domestic and foreign operations consisted of the following (in thousands):
|
Twelve Months Ended December 31,
|
||||||||||||
|
2015
|
2014
|
2013
|
||||||||||
|
Domestic
|
$
|
331,813
|
|
$
|
129,553
|
|
$
|
146,680
|
|
|||
|
Foreign
|
14,906
|
|
7,578
|
|
—
|
|
||||||
|
Total
|
$
|
346,719
|
|
$
|
137,131
|
|
$
|
146,680
|
|
|||
60
Income Tax Provision/(Benefit)
The provision for income taxes is composed of the following (in thousands):
|
Year Ended December 31,
|
|||||||||||
|
2015
|
2014
|
2013
|
|||||||||
|
Current:
|
|||||||||||
|
Federal
|
$
|
108,119
|
|
$
|
53,156
|
|
$
|
52,732
|
|
||
|
State
|
6,501
|
|
4,645
|
|
4,114
|
|
|||||
|
Foreign
|
996
|
|
854
|
|
—
|
|
|||||
|
Total current
|
115,616
|
|
58,655
|
|
56,846
|
|
|||||
|
Deferred:
|
|||||||||||
|
Federal
|
9,458
|
|
(8,557
|
)
|
(1,811
|
)
|
|||||
|
State
|
125
|
|
(247
|
)
|
(134
|
)
|
|||||
|
Foreign
|
1,190
|
|
977
|
|
—
|
|
|||||
|
Total deferred
|
10,773
|
|
(7,827
|
)
|
(1,945
|
)
|
|||||
|
Total income tax provision
|
$
|
126,389
|
|
$
|
50,828
|
|
$
|
54,901
|
|
||
Reconciliation of Effective Tax Rate
The effective tax rate on income before income taxes differed from the federal statutory income tax rate as follows (in thousands):
|
Year Ended December 31,
|
|||||||||||
|
2015
|
2014
|
2013
|
|||||||||
|
Income tax expense at federal statutory rate
|
$
|
120,847
|
|
$
|
48,007
|
|
$
|
51,362
|
|
||
|
State income taxes, net of federal income tax benefit
|
4,293
|
|
2,587
|
|
2,654
|
|
|||||
|
Other
|
1,249
|
|
234
|
|
885
|
|
|||||
|
Total income tax expense
|
$
|
126,389
|
|
$
|
50,828
|
|
$
|
54,901
|
|
||
61
Deferred Taxes
The major components of the Company’s net deferred tax assets and liabilities are as follows (in thousands):
|
As of December 31,
|
|||||||
|
2015
|
2014
|
||||||
|
Deferred tax assets:
|
|||||||
|
Accrued vacation
|
$
|
1,339
|
|
$
|
1,149
|
|
|
|
Accrued bonus
|
8,189
|
|
4,633
|
|
|||
|
State taxes
|
2,396
|
|
1,484
|
|
|||
|
Accrued property taxes
|
1,149
|
|
1,329
|
|
|||
|
Other
|
6,940
|
|
2,619
|
|
|||
|
Stock-based compensation expense
|
2,923
|
|
2,936
|
|
|||
|
Federal net operating loss
|
—
|
|
1,063
|
|
|||
|
Less: valuation allowance
|
—
|
|
(1,330
|
)
|
|||
|
Total deferred tax assets
|
22,936
|
|
13,883
|
|
|||
|
Deferred tax liabilities:
|
|||||||
|
Prepaid expenses
|
5,314
|
|
5,482
|
|
|||
|
Depreciation
|
60,979
|
|
44,116
|
|
|||
|
Foreign deferred
|
2,223
|
|
909
|
|
|||
|
Total deferred tax liabilities
|
68,516
|
|
50,507
|
|
|||
|
Net deferred tax liabilities
|
$
|
45,580
|
|
$
|
36,624
|
|
|
Tax Credit Carryforwards
The Company recognized a federal net operating loss ("NOL") carryforward of
$0
,
$3.1 million
and
$1.9 million
for the years ended December 31, 2015, 2014 and 2013, respectively. As of December 31, 2015, a subsidiary of the Company which previously recognized the NOL was liquidated. In addition, the Company recognized a foreign tax credit carryforward of
$0
and
$0.3 million
for the years ended December 31, 2015 and 2014, respectively, as well as a federal capital loss carryforward of
$1.3 million
which begins to expire in 2021.
The Company previously entered into lease agreements for approximately
70,000
and
10,000
square feet of office space in buildings in which the Company’s Chairman and CEO, and an additional member of its Board of Directors, own minority interests as limited partners. Under the terms of these agreements, the Company made rent payments of
$1.2 million
and
$3.1 million
in
2015
and
2014
, respectively. The Company exercised its option to terminate the lease for
70,000
square feet of office space effective in May 2015. In connection with the termination of this lease, the Company accrued
$1.3 million
for unamortized expenses which were subsequently paid, in settlement of litigation, in January 2016. Additionally, as of January 2016, payments for the remaining
10,000
square feet of space will no longer be made to a related party entity as the lender has taken ownership of the property.
Game Plane, LLC, a wholly owned subsidiary of the Company, partnered with Alpine Labs, LLC to produce and distribute game shows filmed on Company flights. The Company’s Chairman and CEO owns a
25 percent
interest in, and is on the managing board of, Alpine Labs, LLC. The Company made payments of
$0.4 million
and
$2.8 million
in 2015 and 2014, respectively, to Alpine Labs, LLC. No additional shows are being filmed and the Company does not expect any further expenses related to this project.
During 2015 and 2014 respectively, the Company made payments totaling
$2.9 million
and
$0.8 million
to entities owned or controlled by the Company's Chairman and CEO for the building of corporate training content, with a current focus on the Company's operating groups. This approach to training focuses on concept mastery, recognizing that individuals learn at varying paces, through different styles, and is designed to ensure the trainee fully understands each module before moving on to more advanced training. The Company also expects program development to facilitate recurrent training and to contribute to cost savings in the future, and is in the process of seeking approval from the Federal Aviation Administration on various aspects of this training program. In October 2015, the Company's Board of Directors approved an additional commitment of
$3.5 million
for this project, which is expected to conclude in 2016.
62
GMS Racing LLC competes in the NASCAR Camping World Truck Series and ARCA Racing Series. The Company's Chairman and CEO owns a controlling interest in GMS Racing LLC. During 2015, the Company made sponsorship payments totaling
$2.5 million
, and none in 2014. No future payments are anticipated.
In September 2014, as part of its stock repurchase plan, the Company repurchased all of its former Chief Operating Officer's unvested shares of restricted stock (
23,623
shares at
$124.05
) and all of his unexercised stock options (options to purchase
127,512
shares at exercise prices between
$36.97
per share and
$108.59
per share) for a total payment of
$8.5 million
. Also in September 2014, the Company repurchased
200,000
shares of its common stock from its Chairman and CEO at
$126.20
per share, for a total purchase price of
$25.2 million
. The repurchase prices of the common stock listed above were based on the average closing market price of the Company's stock over the five trading days prior to each sale date.
401(k) Plan
The Company has a defined contribution plan covering all eligible employees. Under the plan, employees may contribute up to 90 percent of their eligible annual compensation with the Company making matching contributions on employee deferrals of up to
5 percent
of eligible employee wages. The Company recognized expense under this plan of
$4.2 million
,
$3.4 million
and
$2.9 million
for the years ended
December 31, 2015
,
2014
and
2013
, respectively.
Share-based employee compensation
In 2006, the Board of Directors adopted, and the shareholders approved, a Long-Term Incentive Plan (the “2006 Plan”) and reserved
3,000,000
shares of common stock for the Company to grant stock options, restricted stock, SARs and other stock-based awards to certain officers, directors and employees of the Company. The 2006 Plan is administered by the Company’s compensation committee of the Board of Directors.
Employee Stock Purchase Plan
In 2014, the Company adopted the 2014 Employee Stock Purchase Plan ("ESPP") and reserved
1,000,000
shares of common stock for employee purchases under the plan. Shares are purchased semi-annually, at a 10 percent discount, based on the market value at period-end. Employees may contribute up to 25 percent of their base pay per offering period, not to exceed $25,000 each calendar year, for the purchase of common stock. The ESPP is a compensatory plan under accounting guidance and results in the recognition of compensation expense. Employees purchased
8,306
shares in 2015 under the ESPP.
Compensation expense
For the years ended
December 31, 2015
,
2014
and
2013
, the Company recorded compensation expense of
$10.5 million
,
$16.7 million
and
$9.8 million
respectively, related to stock options, restricted stock, and cash-settled SARs.
The unrecognized compensation cost, and weighted-average period over which the cost is expected to be recognized for non-vested awards as of
December 31, 2015
, are presented below:
|
Unrecognized Compensation Cost (thousands)
|
Weighted Average Period (years)
|
||||
|
Restricted stock
|
$
|
6,760
|
|
1.69
|
|
|
Cash-settled SARs
|
3,685
|
|
1.38
|
||
|
Stock options
|
340
|
|
1.13
|
||
|
Total
|
$
|
10,785
|
|
1.57
|
|
Fair value
The closing price of the Company's stock on the date of grant is used as the fair value for the issuances of restricted stock.
63
The fair value of stock options granted is estimated as of the grant date using the Black-Scholes option pricing model. Cash-settled SARs are liability-based awards for which the fair value and compensation expense recognized are updated monthly, also using the Black-Scholes option pricing model.
The following range of assumptions in the Black-Scholes option pricing model was used to determine fair value at the years ended below:
|
2015
|
2014
|
2013
|
||||||
|
Weighted-average volatility
|
30.2
|
%
|
29.3
|
%
|
30.5
|
%
|
||
|
Expected term (in years)
|
0.3 - 2.5
|
|
1.4 - 2.5
|
|
0.3 - 2.5
|
|
||
|
Risk-free interest rate
|
0.3% - 1.2%
|
|
0.4% - 0.9%
|
|
0.3% - 0.5%
|
|
||
|
Dividend yield
|
0.49% - 2.22%
|
|
1.80
|
%
|
—
|
|
||
Expected volatilities used for award valuation in 2015, 2014 and 2013 are based on the historical volatility of the Company's common stock price.
Expected term represents the weighted average time between the award’s grant date and its exercise date. The Company estimated the expected term assumption in 2015, 2014 and 2013 using historical award exercise activity and employee termination activity.
The risk-free interest rate for periods equal to the expected term of an award is based on a blended historical rate using Federal Reserve rates for U.S. Treasury securities.
The dividend yield reflects the effect that paying a dividend has on the fair value of the Company's stock.
The contractual terms of the Company’s stock option and cash-settled SARs awards granted range from five to ten years.
Stock options
A summary of option activity as of
December 31, 2015
, 2014 and 2013, and changes during the years then ended, is presented below:
|
Options
|
Weighted Average Exercise Price
|
Weighted Average Remaining Contractual Life (years)
|
Aggregate Intrinsic Value (thousands)
|
|||||||||
|
Outstanding at December 31, 2012
|
228,690
|
|
$
|
36.89
|
|
|||||||
|
Granted
|
108,041
|
|
81.77
|
|
||||||||
|
Exercised
|
(53,100
|
)
|
38.03
|
|
||||||||
|
Outstanding at December 31, 2013
|
283,631
|
|
49.48
|
|
3.38
|
$
|
14,507
|
|
||||
|
Granted
|
50,630
|
|
108.59
|
|
||||||||
|
Exercised (1)
|
(237,912
|
)
|
38.39
|
|
||||||||
|
Forfeited
|
(7,600
|
)
|
20.42
|
|
||||||||
|
Outstanding at December 31, 2014
|
88,749
|
|
69.43
|
|
3.29
|
$
|
7,180
|
|
||||
|
Exercised
|
(36,968
|
)
|
52.06
|
|
||||||||
|
Forfeited
|
(3,000
|
)
|
3.50
|
|
||||||||
|
Outstanding at December 31, 2015
|
48,781
|
|
$
|
86.65
|
|
2.62
|
$
|
3,960
|
|
|||
|
Fully vested and expected to vest at December 31, 2015
|
39,710
|
|
$
|
81.71
|
|
2.50
|
$
|
3,245
|
|
|||
|
Exercisable at December 31, 2015
|
19,250
|
|
$
|
58.11
|
|
1.98
|
$
|
1,119
|
|
|||
(1) Includes
127,512
options purchased from the Company's former Chief Operating Officer in connection with his separation agreement in 2014. Refer to Note 11 - Related Party Transactions for further discussion.
64
During the years ended
December 31, 2015
,
2014
and
2013
, the total intrinsic value of options exercised was
$5.8 million
,
$9.4 million
and
$3.3 million
, respectively. Cash received from option exercises for the years ended
December 31, 2015
,
2014
and
2013
was
$1.9 million
,
$2.2 million
and
$2.1 million
, respectively.
Restricted stock awards
A summary of the status of the Company’s non-vested restricted stock grants during the years ended
December 31, 2015
, 2014 and 2013 is presented below:
|
Shares
|
Weighted Average Grant Date Fair Value
|
|||||
|
Non-vested at December 31, 2012
|
128,029
|
|
$
|
52.63
|
|
|
|
Granted
|
85,196
|
|
84.36
|
|
||
|
Vested
|
(64,426
|
)
|
52.57
|
|
||
|
Forfeited
|
(3,567
|
)
|
82.87
|
|
||
|
Non-vested at December 31, 2013
|
145,232
|
|
62.61
|
|
||
|
Granted
|
54,731
|
|
109.66
|
|
||
|
Vested (1)
|
(90,567
|
)
|
75.31
|
|
||
|
Forfeited
|
(10,614
|
)
|
79.36
|
|
||
|
Non-vested at December 31, 2014
|
98,782
|
|
91.15
|
|
||
|
Granted
|
47,810
|
|
178.68
|
|
||
|
Vested
|
(54,825
|
)
|
83.35
|
|
||
|
Forfeited
|
(8,810
|
)
|
130.35
|
|
||
|
Non-vested at December 31, 2015
|
82,957
|
|
$
|
155.30
|
|
|
(1) Includes
23,623
shares of previously unvested restricted stock purchased from the Company's former Chief Operating Officer in connection with his separation agreement in 2014. Refer to Note 11 - Related Party Transactions for further discussion.
The total fair value of restricted stock that vested during the years ended
December 31, 2015
,
2014
and
2013
was
$4.6 million
,
$6.8 million
and
$3.4 million
, respectively.
65
Cash-settled SARs
A summary of cash-settled SARs awards activity during the year ended
December 31, 2015
is presented below:
|
Cash-Settled SARs
|
Weighted Average Grant Date Fair Value
|
|||||
|
3/25/11 Grant
|
||||||
|
Outstanding at January 1, 2015
|
23,893
|
|
$
|
19.01
|
|
|
|
Exercised
|
(10,108
|
)
|
19.01
|
|
||
|
Forfeited
|
—
|
|
—
|
|
||
|
Outstanding at December 31, 2015
|
13,785
|
|
$
|
19.01
|
|
|
|
Exercisable at December 31, 2015
|
13,785
|
|
$
|
19.01
|
|
|
|
3/8/13 Grant
|
||||||
|
Outstanding at January 1, 2015
|
46,545
|
|
$
|
20.92
|
|
|
|
Exercised
|
(24,283
|
)
|
20.92
|
|
||
|
Forfeited
|
(4,554
|
)
|
20.92
|
|
||
|
Outstanding at December 31, 2015
|
17,708
|
|
$
|
20.92
|
|
|
|
Exercisable at December 31, 2015
|
3,035
|
|
$
|
20.92
|
|
|
|
3/6/14 Grant
|
||||||
|
Outstanding at January 1, 2015
|
49,075
|
|
$
|
25.68
|
|
|
|
Exercised
|
(9,055
|
)
|
25.68
|
|
||
|
Forfeited
|
(7,790
|
)
|
25.68
|
|
||
|
Outstanding at December 31, 2015
|
32,230
|
|
$
|
25.68
|
|
|
|
Exercisable at December 31, 2015
|
7,302
|
|
25.68
|
|
||
|
2/25/15 Grant
|
||||||
|
Outstanding at January 1, 2015
|
—
|
|
$
|
—
|
|
|
|
Granted
|
77,396
|
|
34.53
|
|
||
|
Forfeited
|
(9,378
|
)
|
34.53
|
|
||
|
Outstanding at December 31, 2015
|
68,018
|
|
$
|
34.53
|
|
|
|
Exercisable at December 31, 2015
|
—
|
|
—
|
|
||
As of
December 31, 2015
, the accrued liability related to these awards was
$4.9 million
.
The Company is subject to certain legal and administrative actions it considers routine to its business activities. The Company believes the ultimate outcome of any pending legal or administrative matters will not have a material adverse impact on its financial position, liquidity or results of operations.
During 2015, the Company entered into purchase agreements for
eight
Airbus A320 series aircraft yet to be purchased as of December 31, 2015. The remaining obligation of the Company under these agreements as of December 31, 2015 was approximately
$129.1 million
, to be paid between 2016 and 2017. During 2014, the Company entered into purchase agreements for
nine
Airbus A320 series aircraft yet to be purchased at the end of that year.
Six
of these aircraft were acquired in 2015 and the remaining
three
are scheduled to be acquired in 2016, for which the remaining obligation is approximately
$39.4 million
.
In January 2016, the Company received funding for notes secured by
two
A319 aircraft for
$28.0 million
, executed in December, 2015. The notes bear interest at a floating rate based on LIBOR plus
1.75 percent
and are payable in quarterly installments through January 2021.
66
Not applicable.
Evaluation of disclosure controls and procedures.
As of the end of the period covered by this report, under the supervision and with the participation of our management, including our CEO and chief financial officer (“CFO”), we evaluated the design and operation of our disclosure controls and procedures (as defined in Rules 13a-15(e) and 15d-15(e) of the Securities Exchange Act of 1934, as amended, or the “Exchange Act”). Based on this evaluation, our management, including our CEO and CFO, has concluded that our disclosure controls and procedures are designed, and are effective, to give reasonable assurance that the information we are required to disclose is recorded, processed, summarized and reported within the time periods specified in the SEC’s rules and forms. Based upon this evaluation, the CEO and CFO concluded that our disclosure controls and procedures are effective in providing reasonable assurance that information required to be disclosed in our reports filed with or submitted to the SEC under the Exchange Act is accumulated and communicated to management, including the CEO and CFO, as appropriate to allow timely decisions regarding required disclosure.
Management’s Annual Report on Internal Control over Financial Reporting.
Our management is responsible for establishing and maintaining adequate internal control over financial reporting, as defined in Rules 13a-15(f) and 15d-15(f) of the Exchange Act. Our internal control over financial reporting is designed to provide reasonable assurance regarding the reliability of financial reporting and the preparation of financial statements for external purposes in accordance with generally accepted accounting principles and includes those policies and procedures that:
|
—
|
pertain to the maintenance of records that in reasonable detail accurately and fairly reflect the transactions and dispositions of our assets;
|
|
—
|
provide reasonable assurance that transactions are recorded as necessary to permit preparation of financial statements in accordance with generally accepted accounting principles, and that our receipts and expenditures are being made only in accordance with authorizations of our management and directors; and
|
|
—
|
provide reasonable assurance regarding prevention or timely detection of unauthorized acquisition, use or disposition of our assets that could have a material effect on the financial statements.
|
The effectiveness of our or any system of controls and procedures is subject to certain limitations, including the exercise of judgment in designing, implementing and evaluating the controls and procedures, the assumptions used in identifying the likelihood of future events, and the inability to eliminate misconduct completely. Our management, including our CEO and CFO, does not expect that our disclosure controls and procedures or our internal controls will prevent all errors and all fraud. A control system, no matter how well designed and operated, can provide only reasonable, not absolute, assurance that the objectives of the control system are met. Further, the design of a control system must reflect the fact that there are resource constraints, and the benefits of controls must be considered relative to their costs. Because of the inherent limitations in all control systems, no evaluation of controls can provide absolute assurance that all control issues and instances of fraud, if any, within our company have been detected.
Our management has assessed the effectiveness of our internal control over financial reporting as of
December 31, 2015
. In making this assessment, our management used the criteria set forth by the Committee of Sponsoring Organizations of the Treadway Commission (“COSO”) Internal Control- Integrated Framework (2013 Framework). Based on our assessment, management has concluded that, as of
December 31, 2015
, our internal control over financial reporting was effective based on those criteria.
Ernst & Young, LLP, the independent registered public accounting firm who audited our consolidated financial statements included in this Form 10-K, has issued a report on our internal control over financial reporting, which is included herein.
Changes in internal controls.
There were no changes in our internal control over financial reporting that occurred during the fourth quarter of our year ended
December 31, 2015
, that have materially affected, or are reasonably likely to materially affect, our internal control over financial reporting.
Not applicable.
67
The information required by this Item is incorporated herein by reference to the data under the headings “ELECTION OF DIRECTORS,” “EXECUTIVE OFFICERS” and “Section 16(a) Beneficial Ownership Reporting Compliance” in the Proxy Statement to be used in connection with the solicitation of proxies for our annual meeting of stockholders to be held
June 21, 2016
, which Proxy Statement is to be filed with the Commission.
The information required by this Item is incorporated herein by reference to the data under the headings “EXECUTIVE COMPENSATION” and “REPORT OF THE COMPENSATION COMMITTEE” in the Proxy Statement to be used in connection with the solicitation of proxies for our annual meeting of stockholders to be held
June 21, 2016
, which Proxy Statement is to be filed with the Commission.
The information required by this Item is incorporated herein by reference to the data under the heading “STOCK OWNERSHIP” in the Proxy Statement to be used in connection with the solicitation of proxies for our annual meeting of stockholders to be held
June 21, 2016
, which Proxy Statement is to be filed with the Commission. The information required by this item with respect to securities authorized for issuance under our equity compensation plans is included in Part II, Item 5 of this Annual Report on Form 10-K.
The information required by this Item is incorporated herein by reference to the data under the heading “RELATED PARTY TRANSACTIONS” and “Director Independence” in the Proxy Statement to be used in connection with the solicitation of proxies for our annual meeting of stockholders to be held
June 21, 2016
, which Proxy Statement is to be filed with the Commission.
The information required by this Item is incorporated herein by reference to the data under the heading “PRINCIPAL ACCOUNTANT FEES AND SERVICES” in the Proxy Statement to be used in connection with the solicitation of proxies for our annual meeting of stockholders to be held
June 21, 2016
, which Proxy Statement is to be filed with the Commission.
68
|
—
|
Financial Statements and Supplementary Data. The financial statements included in Item 8 - Financial Statements and Supplementary Data above are filed as part of this annual report.
|
|
—
|
Financial Statement Schedules. Schedules are not submitted because they are not required or are not applicable, or the required information is shown in the consolidated financial statements or notes thereto.
|
|
—
|
Exhibits. The Exhibits listed below are filed or incorporated by reference as part of this Form 10-K. Where so indicated by footnote, exhibits which were previously filed are incorporated by reference.
|
69
|
Exhibit
Number
|
|
Description
|
|
|
3.1
|
|
Articles of Incorporation of Allegiant Travel Company. (Incorporated by reference to Exhibit 3.1 to Registration Statement No. 333-134145 filed with the Commission on July 6, 2006).
|
|
|
3.2
|
|
Bylaws of Allegiant Travel Company as amended on January 28, 2013. (Incorporated by reference to Exhibit 3.2 to the Annual Report on Form 10-K for the year ended December 31, 2012, filed with the Commission on February 26, 2013).
|
|
|
3.3
|
|
Specimen Stock Certificate (incorporated by reference to Exhibit 3.3 to the Form 8-A filed with the Commission on November 22, 2006).
|
|
|
4.1
|
|
Indenture dated as of June 13, 2014 between the Company and Wells Fargo Bank, National Association, as trustee. (Incorporated by reference to Exhibit 4.1 to the Quarterly Report on Form 10-Q for the quarter ended June 30, 2014, filed with the Commission on August 8, 2014).
|
|
|
4.2
|
|
Supplemental Indenture dated as of June 25, 2014 among the Company, the guarantors named therein and Wells Fargo Bank, National Association, as trustee (including the Form of Note). (Incorporated by reference to Exhibit 4.2 to the Quarterly Report on Form 10-Q for the quarter ended June 30, 2014, filed with the Commission on August 8, 2014).
|
|
|
4.3
|
|
Form of 5.50% Notes due 2019 (included as Exhibit A in Exhibit 4.2 incorporated by reference).
|
|
|
10.1
|
|
2006 Long-Term Incentive Plan, as amended on July 19, 2009.(1) (Incorporated by reference to Exhibit 10.1 to the Quarterly Report on Form 10-Q for the quarter ended September 30, 2009, filed with the Commission on November 9, 2009-SEC File No. 001-33166).
|
|
|
10.2
|
|
Form of Restricted Stock Agreement used for Directors of the Company.(1) (Incorporated by reference to Exhibit 10.4 to the Annual Report on Form 10-K for the year ended December 31, 2008, filed with the Commission on March 3, 2009-SEC File No. 001-33166.)
|
|
|
10.3
|
|
Form of Indemnification Agreement. (Incorporated by reference to Exhibit 10.4 to the Annual Report on Form 10-K for the year ended December 31, 2012, filed with the Commission on February 26, 2013).
|
|
|
10.4
|
|
Lease dated June 23, 2008 between Windmill Durango Office II, LLC and Allegiant Air, LLC. (Incorporated by reference to Exhibit 10.18 to the Annual Report on Form 10-K for the year ended December 31, 2008, filed with the Commission on March 3, 2009-SEC File No. 001-33166.)
|
|
|
10.5
|
|
Addendum to Lease between Windmill Durango Office II, LLC and Allegiant Air, LLC signed on June 17, 2009. (Incorporated by reference to Exhibit 10.1 to the Quarterly Report on Form 10-Q for the quarter ended June 30, 2009 filed with the Commission on August 7, 2009-SEC File No. 001-33166).
|
|
|
10.6
|
|
Airport Use and Lease Agreement signed on March 17, 2011 between the Company and Clark County Department of Aviation. (Incorporated by reference to Exhibit 10.20 to the Annual Report on Form 10-K for the year ended December 31, 2011, filed with the Commission on February 27, 2012.)
|
|
|
10.7
|
|
Form of Stock Option Agreement used for Officers of the Company. (1) (Incorporated by reference to Exhibit 10.2 to the Quarterly Report on Form 10-Q for the quarter ended March 31, 2013, filed with the Commission on May 8, 2013).
|
|
|
10.8
|
|
Form of Restricted Stock Agreement used for Officers of the Company.(1) (Incorporated by reference to Exhibit 10.3 to the Quarterly Report on Form 10-Q for the quarter ended March 31, 2013, filed with the Commission on May 8, 2013).
|
|
70
|
Exhibit
Number |
|
Description
|
|
|
10.9
|
|
Form of Stock Appreciation Rights Agreement used for Officers of the Company.(1) (Incorporated by reference to Exhibit 10.3 to the Quarterly Report on Form 10-Q for the quarter ended March 31, 2013, filed with the Commission on May 8, 2013).
|
|
|
10.10
|
|
Aircraft Sale and Purchase Agreement dated August 5, 2014, between Sunrise Asset Management, LLC and NAS Investments 3, Inc. as amended by Amendment No. 1 to the Aircraft Sale and Purchase Agreement dated September 17, 2014. (2) (Incorporated by reference to Exhibit 10.1 to the Quarterly Report on Form 10-Q for the quarter ended September 30, 2014, filed with the Commission on November 10, 2014).
|
|
|
10.11
|
|
Separation Agreement and Mutual Release of All Claims effective as of September 30, 2014, between the Company and Andrew C. Levy. (Incorporated by reference to Exhibit 10.1 to the Quarterly Report on Form 10-Q for the quarter ended September 30, 2014, filed with the Commission on November 10, 2014).
|
|
|
12
|
|
Calculation of Ratio of Earnings to Fixed Charges of Allegiant Travel Company.
|
|
|
21.1
|
|
List of Subsidiaries
|
|
|
23.1
|
|
Consent of Ernst & Young LLP, independent registered public accounting firm
|
|
|
31.1
|
|
Rule 13a-14(a)/15d-14(a) Certification of Chief Executive Officer
|
|
|
31.2
|
|
Rule 13a-14(a)/15d-14(a) Certification of Chief Financial Officer
|
|
|
32
|
|
Section 1350 Certifications
|
|
|
101
|
|
The following financial information from the Company’s Annual Report on Form 10-K for the year ended December 31, 2015 filed with the SEC on February 22, 2016, formatted in XBRL includes (i) Consolidated Balance Sheets as of December 31, 2015 and December 31, 2014 (ii) Consolidated Statements of Income for the years ended December 31, 2015, 2014 and 2013 (iii) Consolidated Statements of Comprehensive Income for the years ended December 31, 2015, 2014 and 2013 (iv) Consolidated Statements of Shareholders’ Equity for the years ended December 31, 2015, 2014 and 2013 (v) Consolidated Cash Flow Statements for the years ended December 31, 2015, 2014 and 2013 (vi) the Notes to the Consolidated Financial Statements. (3)
|
|
|
(1)
|
Management contract or compensation plan or agreement required to be filed as an Exhibit to this Report on Form 10-K pursuant to Item 15(b) of Form 10-K.
|
|
(2)
|
Portions of the indicated document have been omitted pursuant to a grant of confidential treatment and the document indicated has been filed separately with the Commission as required by Rule 24b-2 of the Securities Exchange Act of 1934, as amended.
|
|
(3)
|
Pursuant to Rule 406 of Regulation S-T, the XBRL related information in Exhibit 101 to this annual report on Form 10-K shall be deemed to be not filed for purposes of Section 18 of the Exchange Act, or otherwise subject to the liability of that section, and shall not be deemed part of a registration statement, prospectus or other document filed under the Securities Act or the Exchange Act, except as shall be expressly set forth by specific reference in such filing.
|
71
Signatures
Pursuant to the requirements of Section 13 or 15(d) of the Securities Exchange Act of 1934, the registrant has duly caused this report to be signed on its behalf by the undersigned, thereunto duly authorized in the City of Las Vegas, State of Nevada on
February 22, 2016
.
|
|
Allegiant Travel Company
|
|
|
|
|
|
|
|
By:
|
/s/ Scott Sheldon
|
|
|
|
Scott Sheldon
|
|
|
|
Chief Financial Officer
|
POWERS OF ATTORNEY
Each person whose signature appears below hereby appoints Scott Sheldon and Maurice J. Gallagher, Jr., and each of them acting alone, as his or her true and lawful attorneys-in-fact and agent, with full power of substitution and resubstitution, for him or her and in his or her name, place and stead, in any and all capacities, to sign any and all amendments to this annual report on Form 10-K, and to file the same, with all exhibits thereto and all other documents in connection therewith, with the Commission, granting unto said attorneys-in-fact and agents full power and authority to perform each and every act and thing appropriate or necessary to be done, as fully and for all intents and purposes as he or she might or could do in person, hereby ratifying and confirming all that said attorneys-in-fact and agents or their substitute or substitutes may lawfully do or cause to be done by virtue hereof.
Pursuant to the requirements of the Securities Exchange Act of 1934, this report has been signed below by the following persons on behalf of the Registrant and in the capacities and on the dates indicated.
|
Signature
|
Title
|
Date
|
||
|
|
|
|
||
|
/s/ Maurice J. Gallagher, Jr.
|
Chief Executive Officer and Director
|
February 22, 2016
|
||
|
Maurice J. Gallagher, Jr.
|
(Principal Executive Officer)
|
|
||
|
|
|
|
||
|
/s/ Scott Sheldon
|
Chief Financial Officer
|
February 22, 2016
|
||
|
Scott Sheldon
|
(Principal Financial Officer)
|
|
||
|
|
|
|
||
|
/s/ Gregory Anderson
|
Principal Accounting Officer
|
February 22, 2016
|
||
|
Gregory Anderson
|
|
|||
|
/s/ Montie Brewer
|
Director
|
February 22, 2016
|
||
|
Montie Brewer
|
|
|
||
|
|
|
|
||
|
/s/ Gary Ellmer
|
Director
|
February 22, 2016
|
||
|
Gary Ellmer
|
|
|
||
|
|
|
|
||
|
/s/ Linda Marvin
|
Director
|
February 22, 2016
|
||
|
Linda Marvin
|
|
|
||
|
|
|
|
||
|
/s/ Charles W. Pollard
|
Director
|
February 22, 2016
|
||
|
Charles W. Pollard
|
|
|
||
|
/s/ John Redmond
|
Director
|
February 22, 2016
|
||
|
John Redmond
|
||||
72
TABLE OF CONTENTS
Part IItem 1. BusinessItem 1A. Risk FactorsItem 1B. Unresolved Staff CommentsItem 2. PropertiesItem 3. Legal ProceedingsItem 4. Mine Safety DisclosuresPart IIItem 5. Market For Registrant S Common Equity, Related Stockholder Matters, and Issuer Purchases Of Equity SecuritiesItem 6. Selected Financial DataItem 7. Management S Discussion and Analysis Of Financial Condition and Results Of OperationsItem 7A. Quantitative and Qualitative Disclosures About Market RiskItem 8. Financial Statements and Supplementary DataNote 1 Organization and Business Of CompanyNote 2 Summary Of Significant Accounting PoliciesNote 3 Property and EquipmentNote 4 Accrued LiabilitiesNote 5 Long-term DebtNote 6 LeasesNote 7 Shareholders EquityNote 8 Fair Value MeasurementsNote 9 Derivative InstrumentsNote 10 Income TaxesNote 11 Related Party TransactionsNote 12 Employee Benefit PlansNote 13 Commitments and ContingenciesNote 14 Subsequent EventsItem 9. Changes in and Disagreements with Accountants on Accounting and Financial DisclosureItem 9A. Controls and ProceduresItem 9B. Other InformationPart IIIItem 10. Directors, Executive Officers, and Corporate GovernanceItem 11. Executive CompensationItem 12. Security Ownership Of Certain Beneficial Owners and Management and Related Stockholder MattersItem 13. Certain Relationships and Related Transactions, and Director IndependenceItem 14. Principal Accountant Fees and ServicesPart IVItem 15. Exhibits and Financial Statement Schedules