ALLEGIANT TRAVEL CO
10-Ks and 10-Qs
|
|
|
|
|
|
|
|
|
|
|
|
|
|
|
|
|
|
|
|
|
|
|
|
|
|
|
|
|
|
|
|
|
|
|
|
|
|
|
|
|
|
|
|
|
|
|
|
|
|
|
|
|
SECURITIES AND EXCHANGE COMMISSION
Washington, D.C. 20549
FORM 10-Q
(Mark One)
|
ý
|
QUARTERLY REPORT PURSUANT TO SECTION 13 OR 15(d) OF THE SECURITIES EXCHANGE ACT OF 1934
|
|
For the quarterly period ended September 30, 2016
|
|
|
OR
|
|
|
o
|
TRANSITION REPORT PURSUANT TO SECTION 13 OR 15(d) OF THE SECURITIES EXCHANGE ACT OF 1934
|
For the transition period from to
Commission File Number 001-33166

Allegiant Travel Company
(Exact Name of Registrant as Specified in Its Charter)
|
Nevada
|
20-4745737
|
|
(State or Other Jurisdiction of Incorporation or Organization)
|
(IRS Employer Identification No.)
|
|
1201 North Town Center Drive
|
|
|
Las Vegas, Nevada
|
89144
|
|
(Address of Principal Executive Offices)
|
(Zip Code)
|
Registrant’s Telephone Number, Including Area Code:
(702) 851-7300
Indicate by check mark whether the registrant (1) has filed all reports required to be filed by Section 13 or 15(d) of the Securities Exchange Act of 1934 during the preceding 12 months (or for such shorter period that the registrant was required to file such reports), and (2) has been subject to such filing requirements for the past 90 days. Yes
ý
No
o
Indicate by check mark whether the registrant has submitted electronically and posted on its corporate website, if any, every Interactive Data File required to be submitted and posted pursuant to Rule 405 of Regulation S-T (§ 232.405 of this chapter) during the preceding 12 months (or for such shorter period that the registrant was required to submit and post such files). Yes
ý
No
o
Indicate by check mark whether the registrant is a large accelerated filer, an accelerated filer, a non-accelerated filer, or a smaller reporting company. See definitions of “large accelerated filer,” “accelerated filer,” and “smaller reporting company” in Rule 12b-2 of the Exchange Act. (Check one):
|
Large accelerated filer
x
|
Accelerated filer
o
|
|
Non-accelerated filer
o
|
Smaller reporting company
o
|
|
(Do not check if a smaller reporting company)
|
|
Indicate by check mark whether the registrant is a shell company (as defined in Rule 12b-2 of the Exchange Act). Yes
o
No
ý
The number of shares of the registrant’s common stock outstanding as of the close of business on October 14, 2016 was 16,546,142.
Allegiant Travel Company
Form 10-Q
Table of Contents
|
PART I.
|
FINANCIAL INFORMATION
|
|
|
|
|
|
|
ITEM 1.
|
||
|
|
|
|
|
ITEM 2.
|
||
|
|
|
|
|
ITEM 3.
|
||
|
|
|
|
|
ITEM 4.
|
||
|
|
|
|
|
PART II.
|
OTHER INFORMATION
|
|
|
|
|
|
|
ITEM 1.
|
||
|
|
|
|
|
ITEM 1A.
|
||
|
|
|
|
|
ITEM 2.
|
||
|
ITEM 3.
|
||
|
ITEM 4.
|
||
|
ITEM 5.
|
||
|
|
|
|
|
ITEM 6.
|
||
2
ALLEGIANT TRAVEL COMPANY
(in thousands)
|
September 30, 2016
|
December 31, 2015
|
||||||
|
(unaudited)
|
|||||||
|
CURRENT ASSETS:
|
|||||||
|
Cash and cash equivalents
|
$
|
48,718
|
|
$
|
87,112
|
|
|
|
Restricted cash
|
13,787
|
|
10,358
|
|
|||
|
Short-term investments
|
269,341
|
|
245,583
|
|
|||
|
Accounts receivable
|
28,173
|
|
15,146
|
|
|||
|
Expendable parts, supplies and fuel, net
|
16,627
|
|
15,583
|
|
|||
|
Prepaid expenses
|
15,129
|
|
18,276
|
|
|||
|
Other current assets
|
1,654
|
|
3,185
|
|
|||
|
TOTAL CURRENT ASSETS
|
393,429
|
|
395,243
|
|
|||
|
Property and equipment, net
|
1,066,108
|
|
885,942
|
|
|||
|
Long-term investments
|
65,247
|
|
64,752
|
|
|||
|
Other assets
|
10,030
|
|
5,725
|
|
|||
|
TOTAL ASSETS
|
$
|
1,534,814
|
|
$
|
1,351,662
|
|
|
|
CURRENT LIABILITIES:
|
|||||||
|
Accounts payable
|
$
|
11,021
|
|
$
|
6,801
|
|
|
|
Accrued liabilities
|
106,876
|
|
109,462
|
|
|||
|
Air traffic liability
|
220,527
|
|
198,136
|
|
|||
|
Current maturities of long-term debt, net of related costs
|
137,452
|
|
74,069
|
|
|||
|
TOTAL CURRENT LIABILITIES
|
475,876
|
|
388,468
|
|
|||
|
Long-term debt, net of current maturities and related costs
|
561,493
|
|
567,609
|
|
|||
|
Deferred income taxes
|
47,740
|
|
45,580
|
|
|||
|
Other noncurrent liabilities
|
7,417
|
|
—
|
|
|||
|
TOTAL LIABILITIES
:
|
1,092,526
|
|
1,001,657
|
|
|||
|
SHAREHOLDERS' EQUITY:
|
|||||||
|
Common stock, par value $.001
|
22
|
|
22
|
|
|||
|
Treasury stock
|
(515,821
|
)
|
(453,415
|
)
|
|||
|
Additional paid in capital
|
234,298
|
|
228,945
|
|
|||
|
Accumulated other comprehensive income, net
|
57
|
|
834
|
|
|||
|
Retained earnings
|
723,732
|
|
573,619
|
|
|||
|
TOTAL EQUITY
|
442,288
|
|
350,005
|
|
|||
|
TOTAL LIABILITIES AND SHAREHOLDERS' EQUITY
|
$
|
1,534,814
|
|
$
|
1,351,662
|
|
|
The accompanying notes are an integral part of these consolidated financial statements.
3
ALLEGIANT TRAVEL COMPANY
(in thousands, except per share amounts)
(
unaudited)
|
|
Three Months Ended September 30,
|
Nine Months Ended September 30,
|
|||||||||||||
|
|
2016
|
2015
|
2016
|
2015
|
|||||||||||
|
OPERATING REVENUE:
|
|||||||||||||||
|
Scheduled service revenue
|
$
|
177,361
|
|
$
|
170,002
|
|
$
|
568,089
|
|
$
|
556,842
|
|
|||
|
Ancillary revenue:
|
|||||||||||||||
|
Air-related charges
|
127,301
|
|
107,554
|
|
376,944
|
|
326,055
|
|
|||||||
|
Third party products
|
11,259
|
|
9,890
|
|
34,482
|
|
31,663
|
|
|||||||
|
Total ancillary revenue
|
138,560
|
|
117,444
|
|
411,426
|
|
357,718
|
|
|||||||
|
Fixed fee contract revenue
|
9,183
|
|
4,640
|
|
22,690
|
|
11,993
|
|
|||||||
|
Other revenue
|
8,377
|
|
7,870
|
|
24,743
|
|
24,745
|
|
|||||||
|
Total operating revenue
|
333,481
|
|
299,956
|
|
1,026,948
|
|
951,298
|
|
|||||||
|
OPERATING EXPENSES:
|
|||||||||||||||
|
Aircraft fuel
|
69,305
|
|
68,272
|
|
182,969
|
|
216,985
|
|
|||||||
|
Salary and benefits
|
73,424
|
|
58,968
|
|
211,185
|
|
171,119
|
|
|||||||
|
Station operations
|
32,252
|
|
26,454
|
|
96,313
|
|
74,768
|
|
|||||||
|
Maintenance and repairs
|
26,263
|
|
25,369
|
|
82,016
|
|
70,488
|
|
|||||||
|
Depreciation and amortization
|
25,881
|
|
24,346
|
|
75,962
|
|
73,597
|
|
|||||||
|
Sales and marketing
|
5,650
|
|
4,053
|
|
16,774
|
|
16,907
|
|
|||||||
|
Aircraft lease rentals
|
472
|
|
695
|
|
924
|
|
2,092
|
|
|||||||
|
Other
|
23,394
|
|
14,717
|
|
58,363
|
|
47,402
|
|
|||||||
|
Total operating expenses
|
256,641
|
|
222,874
|
|
724,506
|
|
673,358
|
|
|||||||
|
OPERATING INCOME
|
76,840
|
|
77,082
|
|
302,442
|
|
277,940
|
|
|||||||
|
OTHER (INCOME) EXPENSE:
|
|||||||||||||||
|
Interest expense
|
6,938
|
|
6,687
|
|
21,567
|
|
20,531
|
|
|||||||
|
Interest income
|
(1,028
|
)
|
(301
|
)
|
(2,932
|
)
|
(948
|
)
|
|||||||
|
Other, net
|
(61
|
)
|
(67
|
)
|
(142
|
)
|
(117
|
)
|
|||||||
|
Total other expense
|
5,849
|
|
6,319
|
|
18,493
|
|
19,466
|
|
|||||||
|
INCOME BEFORE INCOME TAXES
|
70,991
|
|
70,763
|
|
283,949
|
|
258,474
|
|
|||||||
|
PROVISION FOR INCOME TAXES
|
25,538
|
|
26,305
|
|
105,669
|
|
94,853
|
|
|||||||
|
NET INCOME
|
45,453
|
|
44,458
|
|
178,280
|
|
163,621
|
|
|||||||
|
Net loss attributable to noncontrolling interest
|
—
|
|
—
|
|
—
|
|
(44
|
)
|
|||||||
|
NET INCOME ATTRIBUTABLE TO ALLEGIANT TRAVEL COMPANY
|
$
|
45,453
|
|
$
|
44,458
|
|
$
|
178,280
|
|
$
|
163,665
|
|
|||
|
Earnings per share to common stockholders:
|
|||||||||||||||
|
Basic
|
$
|
2.76
|
|
$
|
2.63
|
|
$
|
10.74
|
|
$
|
9.57
|
|
|||
|
Diluted
|
$
|
2.75
|
|
$
|
2.62
|
|
$
|
10.73
|
|
$
|
9.55
|
|
|||
|
Shares used for computation:
|
|||||||||||||||
|
Basic
|
16,389
|
|
16,831
|
|
16,493
|
|
17,010
|
|
|||||||
|
Diluted
|
16,406
|
|
16,869
|
|
16,514
|
|
17,050
|
|
|||||||
|
Cash dividend declared per share:
|
$
|
0.70
|
|
$
|
0.30
|
|
$
|
1.70
|
|
$
|
0.80
|
|
|||
The accompanying notes are an integral part of these consolidated financial statements.
4
ALLEGIANT TRAVEL COMPANY
CONSOLIDATED STATEMENTS OF COMPREHENSIVE INCOME
(in thousands)
(unaudited)
|
|
Three Months Ended September 30,
|
Nine Months Ended September 30,
|
|||||||||||||
|
|
2016
|
2015
|
2016
|
2015
|
|||||||||||
|
Net income
|
$
|
45,453
|
|
$
|
44,458
|
|
$
|
178,280
|
|
$
|
163,621
|
|
|||
|
Other comprehensive (loss) income:
|
|
|
|
|
|||||||||||
|
Change in available for sale securities, net of tax
|
(101
|
)
|
(21
|
)
|
336
|
|
377
|
|
|||||||
|
Foreign currency translation adjustment
|
238
|
|
(32
|
)
|
176
|
|
230
|
|
|||||||
|
Change in derivatives, net of tax
|
(208
|
)
|
171
|
|
(533
|
)
|
712
|
|
|||||||
|
Reclassification of derivative gains into Other revenue
|
(247
|
)
|
(260
|
)
|
(756
|
)
|
(1,003
|
)
|
|||||||
|
Total other comprehensive (loss) income
|
(318
|
)
|
(142
|
)
|
(777
|
)
|
316
|
|
|||||||
|
TOTAL COMPREHENSIVE INCOME
|
45,135
|
|
44,316
|
|
177,503
|
|
163,937
|
|
|||||||
|
Comprehensive loss attributable to noncontrolling interest
|
—
|
|
—
|
|
—
|
|
(44
|
)
|
|||||||
|
COMPREHENSIVE INCOME ATTRIBUTABLE TO ALLEGIANT TRAVEL COMPANY
|
$
|
45,135
|
|
$
|
44,316
|
|
$
|
177,503
|
|
$
|
163,981
|
|
|||
The accompanying notes are an integral part of these consolidated financial statements.
5
ALLEGIANT TRAVEL COMPANY
(in thousands)
(unaudited)
|
|
Nine Months Ended September 30,
|
||||||
|
|
2016
|
2015
|
|||||
|
OPERATING ACTIVITIES:
|
|||||||
|
Net income
|
$
|
178,280
|
|
$
|
163,621
|
|
|
|
Adjustments to reconcile net income to net cash provided by operating activities:
|
|||||||
|
Depreciation and amortization
|
75,962
|
|
73,597
|
|
|||
|
Loss on aircraft and other equipment disposals
|
3,510
|
|
3,043
|
|
|||
|
Provision for obsolescence of expendable parts, supplies and fuel
|
1,803
|
|
1,183
|
|
|||
|
Amortization of deferred financing costs
|
1,154
|
|
945
|
|
|||
|
Share-based compensation expense
|
4,342
|
|
10,736
|
|
|||
|
Deferred income taxes
|
2,336
|
|
2,659
|
|
|||
|
Excess tax benefits from share-based compensation
|
—
|
|
(3,869
|
)
|
|||
|
Changes in certain assets and liabilities:
|
|||||||
|
Accounts receivable
|
(13,027
|
)
|
(1,495
|
)
|
|||
|
Prepaid expenses
|
3,147
|
|
1,489
|
|
|||
|
Accounts payable
|
4,220
|
|
(1,775
|
)
|
|||
|
Accrued liabilities
|
26,153
|
|
(2,228
|
)
|
|||
|
Air traffic liability
|
22,391
|
|
24,410
|
|
|||
|
Other, net
|
(2,178
|
)
|
(4,706
|
)
|
|||
|
Net cash provided by operating activities
|
308,093
|
|
267,610
|
|
|||
|
INVESTING ACTIVITIES:
|
|||||||
|
Purchase of investment securities
|
(291,954
|
)
|
(272,970
|
)
|
|||
|
Proceeds from maturities of investment securities
|
268,037
|
|
293,181
|
|
|||
|
Aircraft pre-delivery deposits
|
(113,771
|
)
|
—
|
|
|||
|
Purchase of property and equipment, including capitalized interest
|
(150,314
|
)
|
(173,926
|
)
|
|||
|
Other investing activities
|
3,999
|
|
687
|
|
|||
|
Net cash used by investing activities
|
(284,003
|
)
|
(153,028
|
)
|
|||
|
FINANCING ACTIVITIES:
|
|||||||
|
Cash dividends paid to shareholders
|
(55,895
|
)
|
(57,410
|
)
|
|||
|
Excess tax benefits from share-based compensation
|
—
|
|
3,869
|
|
|||
|
Proceeds from the issuance of long-term debt
|
120,410
|
|
93,000
|
|
|||
|
Repurchase of common stock
|
(63,363
|
)
|
(121,119
|
)
|
|||
|
Principal payments on long-term debt
|
(63,478
|
)
|
(46,447
|
)
|
|||
|
Other financing activities
|
(158
|
)
|
2,460
|
|
|||
|
Net cash used by financing activities
|
(62,484
|
)
|
(125,647
|
)
|
|||
|
Net change in cash and cash equivalents
|
(38,394
|
)
|
(11,065
|
)
|
|||
|
CASH AND CASH EQUIVALENTS AT BEGINNING OF PERIOD
|
87,112
|
|
89,610
|
|
|||
|
CASH AND CASH EQUIVALENTS AT END OF PERIOD
|
$
|
48,718
|
|
$
|
78,545
|
|
|
|
SUPPLEMENTAL DISCLOSURES OF CASH FLOW INFORMATION:
|
|||||||
|
CASH PAYMENTS FOR:
|
|||||||
|
Interest paid, net of amount capitalized
|
$
|
17,070
|
|
$
|
18,568
|
|
|
|
Income taxes paid, net of refunds
|
$
|
79,818
|
|
$
|
85,996
|
|
|
The accompanying notes are an integral part of these consolidated financial statements.
6
ALLEGIANT TRAVEL COMPANY
NOTES TO CONSOLIDATED FINANCIAL STATEMENTS
(unaudited)
Basis of Presentation
The accompanying unaudited consolidated financial statements include the accounts of Allegiant Travel Company (the “Company”) and its majority-owned operating subsidiaries. The Company has no independent assets or operations, and all guarantees of the Company's publicly held debt are full and unconditional and joint and several. Investments in affiliates in which the Company’s ownership interest ranges from
20
to
50
percent and in which the Company has the ability to exercise significant influence over operating and financial policies are accounted for under the equity method. All intercompany balances and transactions have been eliminated.
These unaudited consolidated financial statements reflect all normal recurring adjustments which management believes are necessary to present fairly the financial position, results of operations, and cash flows of the Company for the respective periods presented. Certain information and footnote disclosures normally included in the annual consolidated financial statements prepared in accordance with U.S. generally accepted accounting principles ("U.S. GAAP") have been omitted pursuant to the rules and regulations of the Securities and Exchange Commission for Form 10-Q. These unaudited interim consolidated financial statements should be read in conjunction with the audited consolidated financial statements of the Company and notes thereto included in the annual report of the Company on Form 10-K for the year ended December 31, 2015, filed with the Securities and Exchange Commission.
The preparation of financial statements in conformity with U.S. GAAP requires management to make estimates and assumptions that affect the reported amounts of assets and liabilities, and disclosure of contingent assets and liabilities, at the date of the financial statements, and the reported amounts of revenues and expenses during the reporting period. Actual results may differ from these estimates.
Recent Accounting Pronouncements
In May 2014, the Financial Accounting Standards Board ("FASB") issued Accounting Standards Update ("ASU") 2014-09, intended to create a unified model to determine when and how revenue is recognized. Under this ASU and subsequently issued amendments, the core principle is that a company should recognize revenue to depict the transfer of promised goods or services to customers in an amount that reflects the consideration for which the entity expects to be entitled in exchange for those goods or services. Under the new standard, revenue related to certain air-related ancillary fees directly related to ticket revenue, such as seat fees and baggage fees, will likely no longer be considered distinct performance obligations separate from passenger travel. In addition, change fees previously recognized when received, will likely be recognized when air travel is provided.
The standard is effective for annual and interim periods beginning after December 15, 2017. Early adoption of the standard is permitted, but not before December 15, 2016. The Company is evaluating the impact on its financial statements of adopting this new accounting standard.
In August 2016, the FASB issued ASU 2016-15, which amends the guidance in Accounting Standards Codification ("ASC") 230 on the classification of certain cash receipts and payments in the statement of cash flows. The primary purpose of the ASU is to reduce the diversity in practice that has resulted from the lack of consistency on this topic. The standard is effective for annual and interim periods beginning after December 15, 2017. Early adoption is permitted. The Company does not expect significant classification modifications as a result of this ASU.
In March 2016, the FASB issued ASU 2016-09 which is intended to simplify various aspects related to how share-based payments are accounted for and presented in the financial statements. This ASU is effective for fiscal years, and interim periods within those years, beginning on or after December 15, 2016 and early adoption is permitted. The Company has adopted the changes related to income taxes and cash flow presentation for excess tax benefits as of March 31, 2016 on a prospective basis, and prior periods have not been retrospectively adjusted. The remaining provisions of this ASU do not have an impact on the Company's consolidated financial statements.
In February 2016, the FASB issued ASU 2016-02 related to leases. This standard will require leases with durations greater than twelve months to be recognized on the balance sheet, and is effective for interim and annual reporting periods beginning after December 15, 2018 with early adoption permitted. The Company is assessing the impact of this new standard, specifically on
7
its consolidated balance sheets, and does not expect adoption to significantly change the recognition, measurement or presentation of lease expense within the consolidated statements of income or cash flows.
Prior to the quarter ended June 30, 2016, the Company's Airbus A320 series aircraft (and Boeing 757-200) had not experienced any major maintenance events, so a method to account for major maintenance events had not yet been applied. The first major maintenance events for the Airbus A320 series aircraft occurred during the second quarter 2016.
The Company accounts for major maintenance costs for its MD-80 airframes and the related JT8D-219 engines using the direct expense method. Under this method, major maintenance costs are charged to expense as incurred. The Company accounts for major maintenance costs for its Airbus airframes and the related CFM engines using the deferral method. Under this method, the Company capitalizes the cost of major maintenance events, which are amortized, as a component of depreciation and amortization expense, over the estimated period until the next scheduled major maintenance event. The Company has not experienced any major maintenance events for the Boeing 757-200 fleet.
On September 1, 2016, the Company launched the Allegiant World MasterCard issued by Bank of America. This is a co-branded credit card program providing cardholder benefits, which generates points based on dollar spend to be converted into dollars for items sold on the website such as flights, hotel rooms, car rentals and show tickets. The Company accounts for this new program using the relative selling price approach in accordance with ASU 2009-13 "Revenue Recognition (Topic 605) Multiple-Deliverable Arrangements." A portion of the revenue under the program is recognized monthly over the term of the arrangement as various marketing related services are performed by the Company. The remainder is deferred and recognized as points are redeemed for travel or other program benefits.
The Company’s investments in marketable securities are classified as available-for-sale and are reported at fair market value with the unrealized gain or loss reported as a component of accumulated other comprehensive income ("AOCI") in shareholders’ equity. Excluded from the following table is the change in fair value attributable to the foreign currency risk being hedged. Refer to Note 7 - Derivative Instruments for additional information related to the Company's foreign currency hedge. Investment securities are classified as cash equivalents, short-term investments, and long-term investments based on maturity date. Cash equivalents have maturities of three months or less, short-term investments have maturities of greater than three months but equal to or less than one year, and long-term investments are those with a maturity date greater than one year.
Investment securities (in thousands):
|
As of September 30, 2016
|
As of December 31, 2015
|
||||||||||||||||||||||||||||||
|
Unrealized
|
Unrealized
|
||||||||||||||||||||||||||||||
|
Cost
|
Gains
|
(Losses)
|
Market Value
|
Cost
|
Gains
|
(Losses)
|
Market Value
|
||||||||||||||||||||||||
|
Commercial paper
|
$
|
128,714
|
|
$
|
8
|
|
$
|
(136
|
)
|
$
|
128,586
|
|
$
|
83,155
|
|
$
|
—
|
|
$
|
(1
|
)
|
$
|
83,154
|
|
|||||||
|
Corporate debt securities
|
107,649
|
|
10
|
|
(92
|
)
|
107,567
|
|
108,485
|
|
50
|
|
(154
|
)
|
108,381
|
|
|||||||||||||||
|
Federal agency debt securities
|
58,460
|
|
$
|
9
|
|
$
|
(38
|
)
|
$
|
58,431
|
|
73,783
|
|
—
|
|
(80
|
)
|
73,703
|
|
||||||||||||
|
Municipal debt securities
|
35,678
|
|
1
|
|
(29
|
)
|
35,650
|
|
52,669
|
|
2
|
|
(1
|
)
|
52,670
|
|
|||||||||||||||
|
US Treasury Bonds
|
4,607
|
|
3
|
|
—
|
|
4,610
|
|
1,607
|
|
—
|
|
(1
|
)
|
1,606
|
|
|||||||||||||||
|
Money market funds
|
36
|
|
—
|
|
—
|
|
36
|
|
781
|
|
—
|
|
—
|
|
781
|
|
|||||||||||||||
|
Total
|
$
|
335,144
|
|
$
|
31
|
|
$
|
(295
|
)
|
$
|
334,880
|
|
$
|
320,480
|
|
$
|
52
|
|
$
|
(237
|
)
|
$
|
320,295
|
|
|||||||
8
Property and equipment (in thousands):
|
As of September 30, 2016
|
As of December 31, 2015
|
||||||
|
Flight equipment, including pre-delivery deposits
|
$
|
1,335,364
|
|
$
|
1,123,115
|
|
|
|
Computer hardware and software
|
96,027
|
|
78,200
|
|
|||
|
Ground property and equipment
|
78,203
|
|
72,078
|
|
|||
|
Total property and equipment
|
1,509,594
|
|
1,273,393
|
|
|||
|
Less accumulated depreciation and amortization
|
(443,486
|
)
|
(387,451
|
)
|
|||
|
Property and equipment, net
|
$
|
1,066,108
|
|
$
|
885,942
|
|
|
Long-term debt (in thousands):
|
|
As of September 30, 2016
|
As of December 31, 2015
|
|||||
|
Fixed-rate notes payable due through 2020
|
$
|
334,951
|
|
$
|
341,738
|
|
|
|
Variable-rate notes payable due through 2021
|
363,994
|
|
299,940
|
|
|||
|
Total long-term debt, net of related costs
|
698,945
|
|
641,678
|
|
|||
|
Less current maturities
|
137,452
|
|
74,069
|
|
|||
|
Long-term debt, net of current maturities and related costs
|
$
|
561,493
|
|
$
|
567,609
|
|
|
Maturities of long-term debt for the remainder of
2016
and for the next four years and thereafter, in the aggregate (in thousands):
|
As of September 30, 2016
|
|||
|
Remaining in 2016
|
$
|
59,723
|
|
|
2017
|
99,952
|
|
|
|
2018
|
145,152
|
|
|
|
2019
|
350,973
|
|
|
|
2020
|
35,374
|
|
|
|
Thereafter
|
7,771
|
|
|
|
Total
|
$
|
698,945
|
|
Secured Debt - 2016 Transactions
In July 2016, the Company drew down
$50.4 million
under a senior secured revolving credit facility entered into during the second quarter 2016. The notes for the amounts borrowed under the facility bear interest at a floating rate based on LIBOR plus
1.85 percent
and are due on December 31, 2017.
Also in July 2016, the Company borrowed
$42.0 million
under a loan agreement secured by
three
Airbus A319 aircraft. The notes bear interest at a floating rate based on LIBOR plus
1.70 percent
and are payable in quarterly installments through July 2021.
In January 2016, the Company received
$28.0 million
of proceeds from notes executed in December 2015. The notes bear interest at a floating rate based on LIBOR plus
1.75 percent
, are payable in quarterly installments through January 2021, and are secured by
two
Airbus A319 aircraft.
9
The Company measures certain financial assets and liabilities at fair value on a recurring basis. Fair value is an exit price, representing the amount that would be received by selling an asset or paid to transfer a liability in an orderly transaction between market participants.
Accounting standards pertaining to fair value measurements establish a three-tier fair value hierarchy, which prioritizes the inputs used in measuring fair value. These tiers include: Level 1, defined as observable inputs such as quoted prices in active markets for identical assets or liabilities; Level 2, defined as inputs other than Level 1 inputs that are either directly or indirectly observable; and Level 3, defined as unobservable inputs for which little or no market data exists, therefore requiring an entity to develop its own assumptions.
The Company uses the market approach valuation technique to determine fair value for investment securities. The assets classified as Level 1 consist of money market funds for which original cost approximates fair value. The assets classified as Level 2 consist of commercial paper, municipal debt securities, federal agency debt securities, US Treasury Bonds, and corporate debt securities, which are valued using quoted market prices or alternative pricing sources including transactions involving identical or comparable assets and models utilizing market observable inputs. The Company has no investment securities classified as Level 3.
For those assets classified as Level 2 that are not in active markets, the Company obtains fair value from pricing sources using quoted market prices for identical or comparable instruments, and uses pricing models which include all significant observable inputs: maturity dates, issue dates, settlement dates, benchmark yields, reported trades, broker-dealer quotes, issue spreads, benchmark securities, bids, offers and other market related data. These inputs are observable or can be derived from, or corroborated by, observable market data for substantially the full term of the asset.
The fair value of the Company's derivative instrument is determined using standard valuation models. The significant inputs used in these models are readily available in public markets or can be derived from observable market transactions and therefore have been classified as Level 2. Inputs used in these standard valuation models for derivative instruments include the applicable exchange and interest rates.
Financial instruments measured at fair value on a recurring basis (in thousands):
|
As of September 30, 2016
|
As of December 31, 2015
|
||||||||||||||||||||||
|
Total
|
Level 1
|
Level 2
|
Total
|
Level 1
|
Level 2
|
||||||||||||||||||
|
Cash equivalents
|
|
|
|
||||||||||||||||||||
|
Municipal debt securities
|
$
|
256
|
|
$
|
—
|
|
$
|
256
|
|
$
|
754
|
|
$
|
—
|
|
$
|
754
|
|
|||||
|
Money market funds
|
36
|
|
36
|
|
—
|
|
781
|
|
781
|
|
—
|
|
|||||||||||
|
Commercial paper
|
—
|
|
—
|
|
—
|
|
8,426
|
|
—
|
|
8,426
|
|
|||||||||||
|
Total cash equivalents
|
292
|
|
36
|
|
256
|
|
9,961
|
|
781
|
|
9,180
|
|
|||||||||||
|
Short-term
|
|
|
|
|
|
|
|
|
|
|
|||||||||||||
|
Commercial paper
|
128,586
|
|
—
|
|
128,586
|
|
74,728
|
|
—
|
|
74,728
|
|
|||||||||||
|
Corporate debt securities
|
95,479
|
|
—
|
|
95,479
|
|
80,957
|
|
—
|
|
80,957
|
|
|||||||||||
|
Federal agency debt securities
|
21,914
|
|
—
|
|
21,914
|
|
42,825
|
|
—
|
|
42,825
|
|
|||||||||||
|
Municipal debt securities
|
21,757
|
|
—
|
|
21,757
|
|
47,073
|
|
—
|
|
47,073
|
|
|||||||||||
|
US Treasury Bonds
|
1,605
|
|
—
|
|
1,605
|
|
—
|
|
—
|
|
—
|
|
|||||||||||
|
Total short-term
|
269,341
|
|
—
|
|
269,341
|
|
245,583
|
|
—
|
|
245,583
|
|
|||||||||||
|
Long-term
|
|
|
|
|
|
|
|
|
|
|
|
|
|||||||||||
|
Federal agency debt securities
|
36,517
|
|
—
|
|
36,517
|
|
30,878
|
|
—
|
|
30,878
|
|
|||||||||||
|
Municipal debt securities
|
13,637
|
|
—
|
|
13,637
|
|
4,843
|
|
—
|
|
4,843
|
|
|||||||||||
|
Corporate debt securities
|
12,088
|
|
—
|
|
12,088
|
|
27,425
|
|
—
|
|
27,425
|
|
|||||||||||
|
US Treasury Bonds
|
3,005
|
|
—
|
|
3,005
|
|
1,606
|
|
—
|
|
1,606
|
|
|||||||||||
|
Derivative instruments
|
1,487
|
|
—
|
|
1,487
|
|
2,480
|
|
—
|
|
2,480
|
|
|||||||||||
|
Total long-term
|
66,734
|
|
—
|
|
66,734
|
|
67,232
|
|
—
|
|
67,232
|
|
|||||||||||
|
Total financial instruments
|
$
|
336,367
|
|
$
|
36
|
|
$
|
336,331
|
|
$
|
322,776
|
|
$
|
781
|
|
$
|
321,995
|
|
|||||
10
The fair value of the Company’s publicly held long-term debt is determined based on inputs that are readily available in public markets or can be derived from information available in publicly quoted markets; therefore, the Company has categorized its publicly held debt as Level 2. The remaining debt agreements are not publicly held. The Company has determined the estimated fair value of these notes to be Level 3, as certain inputs used to determine the fair value of these agreements are unobservable and, therefore, could be sensitive to changes in inputs. The Company utilizes the discounted cash flow method to estimate the fair value of Level 3 debt.
Carrying value and estimated fair value of long-term debt, including current maturities and excluding related costs (in thousands):
|
As of September 30, 2016
|
As of December 31, 2015
|
||||||||||||||||
|
Carrying Value
|
Estimated Fair Value
|
Carrying Value
|
Estimated Fair Value
|
Hierarchy Level
|
|||||||||||||
|
Publicly held debt
|
$
|
300,000
|
|
$
|
312,750
|
|
$
|
300,000
|
|
$
|
299,250
|
|
2
|
||||
|
Non-publicly held debt
|
403,101
|
|
378,445
|
|
346,179
|
|
327,321
|
|
3
|
||||||||
|
Total long-term debt
|
$
|
703,101
|
|
$
|
691,195
|
|
$
|
646,179
|
|
$
|
626,571
|
|
|||||
Due to the short-term nature, carrying amounts of cash, cash equivalents, restricted cash, accounts receivable and accounts payable approximate fair value.
The Company entered into a foreign currency swap in order to mitigate the foreign currency exchange rate risk associated with the forecasted lease revenue from
12
Airbus A320 series aircraft leased to a European carrier until 2018. The Company uses a cash flow hedge to minimize the variability in cash flows of assets, liabilities and forecasted transactions caused by fluctuations in foreign currency exchange rates. For the
nine
months ended
September 30, 2016
, the net change in fair value recorded in accumulated other comprehensive income related to the unrealized loss on the hedge was
$0.5 million
compared to an unrealized gain of
$0.7 million
for the
nine
months ended
September 30, 2015
.
At inception, the Company formally designated and documented this financial instrument as a hedge of a specific underlying exposure, the risk management objective, and the strategy for undertaking the hedge transaction. The Company also assessed whether the financial instrument used in the hedging transactions was effective at offsetting changes in either the fair values or cash flows of the related underlying exposures. This assessment is monitored on at least a quarterly basis, and the change in fair market value of any ineffective portion of a financial instrument would be immediately recognized into earnings. For the
nine
months ended
September 30, 2016
, the Company realized
$0.8 million
in gains from its cash flow hedge into Other revenue, compared to
$1.0 million
for the
nine
months ended
September 30, 2015
. As of
September 30, 2016
, the Company expects
$0.6 million
to be reclassified from Other comprehensive income into Other revenue within the next 12 months.
At
September 30, 2016
, the fair value of the Company's derivative instrument was
$1.5 million
compared to
$2.5 million
at December 31, 2015, and is reported in the Company's consolidated balance sheet within other assets. Refer to Note 6 - Fair Value Measurements for additional information related to the estimated fair value.
The Company is authorized by the Board of Directors to acquire its stock through open market purchases under its share repurchase program. As repurchase authority is used, the Board of Directors has, to date, authorized additional expenditures for share repurchases.
11
Share repurchases consisted of the following during the periods indicated:
|
Three Months Ended September 30,
|
Nine Months Ended September 30,
|
||||||||||
|
2016
|
2015
|
2016
|
2015
|
||||||||
|
Shares repurchased (not in thousands)
|
—
|
|
175,142
|
|
369,997
|
|
644,603
|
|
|||
|
Average price per share
|
—
|
|
$218.67
|
$166.70
|
$185.43
|
||||||
|
Total (in thousands)
|
—
|
|
$38,298
|
$61,679
|
$119,530
|
||||||
During the three months ended
September 30, 2016
, the Company declared and paid recurring cash dividends of
$0.70
per share, or
$11.5 million
. During the
nine
months ended
September 30, 2016
, the Company declared and paid recurring cash dividends of
$1.70
per share, or
$28.2 million
.
Basic and diluted earnings per share are computed pursuant to the two-class method. Under this method, the Company attributes net income to two classes: common stock and unvested restricted stock. Unvested restricted stock awards granted to employees under the Company’s Long-Term Incentive Plan are considered participating securities as they receive non-forfeitable rights to cash dividends at the same rate as common stock.
Diluted net income per share is calculated using the more dilutive of the two methods. Under both methods, the exercise of employee stock options is assumed using the treasury stock method. The assumption of vesting of restricted stock, however, differs:
|
1.
|
Assume vesting of restricted stock using the treasury stock method.
|
|
2.
|
Assume unvested restricted stock awards are not vested, and allocate earnings to common shares and unvested restricted stock awards using the two-class method.
|
For the three and
nine
months ended
September 30, 2016
, the second method, which assumes unvested awards are not vested, was used in the computation because it was more dilutive than the first method.
12
The following table sets forth the computation of net income per share, on a basic and diluted basis, for the periods indicated (share count and dollar amounts in table are in thousands):
|
Three Months Ended September 30,
|
Nine Months Ended September 30,
|
||||||||||||||
|
2016
|
2015
|
2016
|
2015
|
||||||||||||
|
Basic:
|
|
|
|||||||||||||
|
Net income attributable to Allegiant Travel Company
|
$
|
45,453
|
|
$
|
44,458
|
|
$
|
178,280
|
|
$
|
163,665
|
|
|||
|
Less net income allocated to participating securities
|
(298
|
)
|
(199
|
)
|
(1,074
|
)
|
(802
|
)
|
|||||||
|
Net income attributable to common stock
|
$
|
45,155
|
|
$
|
44,259
|
|
$
|
177,206
|
|
$
|
162,863
|
|
|||
|
Net income per share, basic
|
$
|
2.76
|
|
$
|
2.63
|
|
$
|
10.74
|
|
$
|
9.57
|
|
|||
|
Weighted-average shares outstanding
|
16,389
|
|
16,831
|
|
16,493
|
|
17,010
|
|
|||||||
|
Diluted:
|
|
|
|
|
|
|
|
|
|||||||
|
Net income attributable to Allegiant Travel Company
|
$
|
45,453
|
|
$
|
44,458
|
|
$
|
178,280
|
|
$
|
163,665
|
|
|||
|
Less net income allocated to participating securities
|
(297
|
)
|
(198
|
)
|
(1,073
|
)
|
(800
|
)
|
|||||||
|
Net income attributable to common stock
|
$
|
45,156
|
|
$
|
44,260
|
|
$
|
177,207
|
|
$
|
162,865
|
|
|||
|
Net income per share, diluted
|
$
|
2.75
|
|
$
|
2.62
|
|
$
|
10.73
|
|
$
|
9.55
|
|
|||
|
Weighted-average shares outstanding
|
16,389
|
|
16,831
|
|
16,493
|
|
17,010
|
|
|||||||
|
Dilutive effect of stock options and restricted stock
|
26
|
|
68
|
|
34
|
|
68
|
|
|||||||
|
Adjusted weighted-average shares outstanding under treasury stock method
|
16,415
|
|
16,899
|
|
16,527
|
|
17,078
|
|
|||||||
|
Participating securities excluded under two-class method
|
(9
|
)
|
(30
|
)
|
(13
|
)
|
(28
|
)
|
|||||||
|
Adjusted weighted-average shares outstanding under two-class method
|
16,406
|
|
16,869
|
|
16,514
|
|
17,050
|
|
|||||||
For the three and
nine
months ended
September 30, 2016
, anti-dilutive shares excluded from the calculation of earnings per share were
24,986
and
69,377
, respectively (shares not in thousands).
The Company is subject to certain legal and administrative actions it considers routine to business activities. The Company believes the ultimate outcome of any pending legal or administrative matters will not have a material adverse impact on its financial position, liquidity or results of operations.
As of
September 30, 2016
, the Company had firm commitments to purchase the following aircraft:
|
Aircraft Type
|
Number of Aircraft Under Contract
|
|
|
Airbus A319
|
6
|
|
|
Airbus A320
|
27
|
|
13
Future minimum fixed payments for the Company's commitments related to the acquisition of aircraft, airport fees under use and lease agreements, and other operating lease obligations are as follows (in thousands):
|
As of September 30, 2016
|
|||
|
Remaining in 2016
|
$
|
34,860
|
|
|
2017
|
397,691
|
|
|
|
2018
|
116,962
|
|
|
|
2019
|
78,932
|
|
|
|
2020
|
41,473
|
|
|
|
Thereafter
|
3,613
|
|
|
|
Total commitments
|
$
|
673,531
|
|
The Company previously entered into lease agreements for approximately
70,000
and
10,000
square feet of office space in buildings for which the Company’s Chairman and Chief Executive Officer ("CEO") and the Company's President owned minority interests as limited partners. For the
nine
months ended
September 30,
2015
, the Company made rent payments of
$1.1 million
under the terms of these agreements. Beginning in 2016, payments for the
10,000
square feet of office space are no longer being made to a related party entity as the lender has taken ownership of the property. Additionally, the Company exercised its option to terminate the lease for
70,000
square feet of space effective in May 2015. The Company paid
$1.3 million
in January 2016 in settlement of litigation in connection with the termination of this lease.
Game Plane, LLC, a wholly owned subsidiary of the Company, partnered with Alpine Labs, LLC to produce and distribute game shows filmed on Company flights. The Company’s Chairman and CEO owns a
25 percent
interest in, and is on the managing board of, Alpine Labs, LLC. For the
nine
months ended
September 30,
2015
, the Company made payments of
$0.4 million
to Alpine Labs, LLC.
No
payments were made for the
nine
months ended
September 30, 2016
, as no additional shows are being filmed. The Company does not expect any further expenses related to this project.
GMS Racing, LLC competes in the NASCAR Camping World Truck Series and ARCA Racing Series. The Company's Chairman and CEO owns a controlling interest in GMS Racing, LLC. During the
nine
months ended
September 30, 2015
, the Company made sponsorship payments totaling
$2.3 million
to GMS Racing, LLC.
No
payments were made for the
nine
months ended
September 30, 2016
and no future payments are anticipated.
Entities owned or controlled by the Company's Chairman and CEO have been paid for the building of corporate training content, with a current focus on the Company's operating groups. This approach to training focuses on concept mastery, recognizing that individuals learn at varying paces, through different styles, and is designed to ensure the trainee fully understands each module before moving on to more advanced training. The Company also expects program development to facilitate recurrent training and to contribute to cost savings in the future, and is in the process of seeking approval from the Federal Aviation Administration ("FAA") on various aspects of this training program. During the
nine
months ended
September 30, 2015
and
2016
, the Company made payments to these entities of
$2.1 million
and
$1.4 million
, respectively. The project is expected to conclude in 2017.
During the second quarter 2016, the Company recorded
$8.3 million
in fuel tax refunds which have been received as of October 2016. These refunds were reflected as a decrease to Aircraft fuel expense on the Company's consolidated statements of income for the second quarter 2016.
The following discussion and analysis presents factors that had a material effect on our results of operations during the
three and nine
months ended
September 30, 2016
and
2015
. Also discussed is our financial position as of
September 30, 2016
and
December 31, 2015
. You should read this discussion in conjunction with our unaudited consolidated financial statements, including the notes thereto, appearing elsewhere in this Form 10-Q and our consolidated financial statements appearing in our annual report on Form 10-K for the year ended
December 31, 2015
. This discussion and analysis contains forward-looking
14
statements. Please refer to the section below entitled “Cautionary Note Regarding Forward-Looking Statements” for a discussion of the uncertainties, risks and assumptions associated with these statements.
THIRD QUARTER REVIEW
Financial highlights:
|
•
|
Total operating revenue increase of
$33.5 million
over
third
quarter 2015,
|
|
•
|
operating margin of
23.0 percent
,
|
|
•
|
$2.75
earnings per share (fully diluted),
|
|
•
|
operating 337 routes as of quarter end versus 271 at the same point in 2015, and 29 new routes currently scheduled to begin within the next two quarters,
|
|
•
|
payment of quarterly recurring cash dividends of
$11.5 million
during the quarter,
$28.2 million
year to date
|
Overview
In September 2016, we appointed John Redmond as President of the Company. Mr. Redmond served as an independent member of our board of directors since 2007 (excluding one year while attending to business obligations overseas) and will continue to serve as a member of the board. His prior experience as chief executive officer of MGM entities and extensive experience with other premier leisure organizations provides valuable travel industry knowledge.
Also in September, we launched the Allegiant World MasterCard issued by Bank of America. This is a co-branded credit card program that provides cardholder benefits and generates points based on dollar spend which can be converted into purchases for items sold on our website such as flights, hotel rooms, car rentals and show tickets. This program gives our customers more opportunities to travel, and we expect it will be accretive to earnings in the long-term.
In July 2016, we signed a purchase agreement to acquire 12 newly manufactured Airbus A320 series aircraft expected to enter service in 2017 and 2018. Although these aircraft will have higher purchase prices, we expect the benefits of a greater number of seats, better fuel efficiency, lower maintenance costs, and longer depreciable lives will make these aircraft efficient additions to our fleet.
The tentative agreement reached with the International Brotherhood of Teamsters ("IBT") for a collective bargaining agreement with our pilots was ratified in July 2016 and became effective on August 1, 2016.
Capacity grew by nearly 19 percent over third quarter 2015 as a result of market growth, in addition to opportunities for increased profitable off-peak flying due to lower fuel prices. Our average number of aircraft in service also increased (all Airbus aircraft) by
12.4 percent
, as we continue our move toward a single fleet type. Operating expense per available seat mile ("CASM") decreased quarter over quarter, largely attributable to the decrease in system average price per gallon of fuel as well as the improved fuel efficiency of our fleet.
AIRCRAFT
The following table sets forth the aircraft in service and operated by us as of the dates indicated:
|
September 30, 2016
|
December 31, 2015
|
September 30, 2015
|
||||||
|
MD83/88
|
48
|
|
51
|
|
51
|
|
||
|
B757-200
|
4
|
|
5
|
|
6
|
|
||
|
A319 (1)
|
15
|
|
10
|
|
7
|
|
||
|
A320
|
16
|
|
14
|
|
10
|
|
||
|
Total
|
83
|
|
80
|
|
74
|
|
||
(1) Excludes 12 A319 aircraft on lease to a European carrier until 2018.
We have solidified our plan for the full retirement of our MD-80 fleet in 2019 as we continue to transition to a single fleet type of Airbus A320 series aircraft. As of September 30, 2016, we have firm commitments to purchase 33 new and used Airbus A320 series aircraft which we expect to be delivered between 2016 and 2020. In addition, we expect to add to our operating
15
fleet 12 owned Airbus A320 series aircraft currently on lease to a European carrier. We will continue to purchase used Airbus A320 series aircraft on an opportunistic basis.
Fleet Plan
The below table indicates the number of aircraft expected to be in service by the end of 2016 based on currently scheduled additions to, and retirements from, our operating fleet.
|
As of December 31, 2016
|
||
|
MD-80
|
48
|
|
|
B757-200
|
4
|
|
|
A319
|
17
|
|
|
A320
|
16
|
|
|
Total
|
85
|
|
NETWORK
The following illustrates our network as of the dates indicated (includes cities served seasonally):
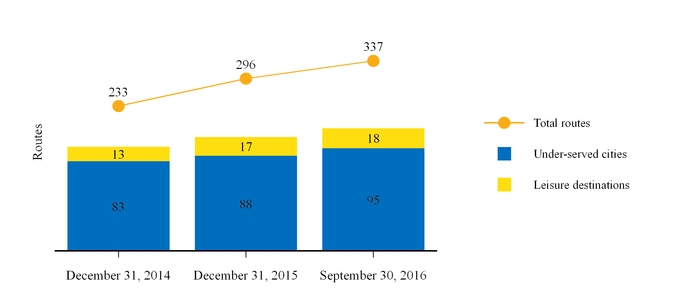
Our network as of the end of third quarter 2016 represents a 24.4 percent increase in the number of routes flown compared to the end of the same quarter in 2015. Mid-sized cities (included in number of under-served cities in chart above) served as of December 31, 2014, December 31, 2015 and September 30, 2016 were zero, 17 and 19, respectively.
Including recent service announcements, we were selling 366 routes at September 30, 2016, including one new destination: San Juan, Puerto Rico (while discontinuing service to Palm Beach, Florida) and one new under-served city: Trenton, New Jersey. We also announced our move from Akron-Canton Airport to Cleveland Hopkins International Airport to better service the Cleveland, Ohio area.
TRENDS
We are systematically retiring our MD-80 and Boeing 757-200 fleets as we transition to the Airbus A320 series aircraft as our single fleet type. Our ability to grow service and profitability during the period of fleet transition will be limited. Although this fleet transition will result in operating cost pressure in the short-term, we expect the long-term benefits of better fuel efficiency, lower maintenance costs, and longer depreciable lives of an all-Airbus fleet will more than offset the additional costs incurred in the transition. We plan to place two additional A320 series aircraft into service prior to the end of 2016, and retired one MD-80 and one Boeing 757-200 aircraft in third quarter 2016.
16
Although Airbus aircraft are significantly more fuel efficient than our other fleet types, in the long-term, fuel costs remain uncertain and volatility could materially affect our future operating costs.
The collective bargaining agreement with our pilots was ratified in July 2016, and provides for enhancements to pay scales, benefits, and work rules conducive to our unique operating schedule. Estimated incremental expense in the first year of the contract is expected to be approximately $44.5 million and an estimated increase in total cost of $290.0 million is expected over the five-year agreement term which became effective on August 1, 2016.
In August 2016, our flight attendants, represented by the Transport Workers Union, reached a tentative collective-bargaining agreement with us. The flight attendants chose not to approve this agreement and the parties will continue negotiations. Any labor agreement reached following negotiations would likely increase our operating costs.
In October 2016, our flight dispatchers voted in favor of representation by the IBT Local 986. We are in the initial stages of the process and a negotiating committee has yet to be formed.
In the current low-cost fuel environment, we expect competitive capacity trends will continue to put pressure on our yields in competitive markets. Based on published schedules by us and other carriers, we expect there will be mainline competition on 66 of the 360 routes we expect to be operating by the end of 2016.
RESULTS OF OPERATIONS
Comparison of three months ended
September 30, 2016
to three months ended
September 30, 2015
Operating Revenue
Scheduled service revenue
.
Scheduled service revenue for the
third
quarter
2016
increased by 4.3 percent compared to
2015
. The increase was primarily driven by a
21.8 percent
increase in scheduled service passengers, offset by a
14.4 percent
decrease in scheduled service average base fare which was adversely affected by capacity growth into newer markets and increased off-peak flying to capitalize on the current low-cost fuel environment.
Ancillary air-related charges
.
Ancillary air-related charges for the
third
quarter
2016
increased 18.4 percent compared to
2015
, due mostly to the increase in scheduled service passengers resulting from capacity growth. These effects were diluted by a
2.9 percent
decrease in ancillary air-related charges per passenger as items such as bag fees tend to decrease in correlation with reduced stage length.
Ancillary third party products
.
The following table details the calculation of ancillary revenue from third party products. Third party products consist of revenue from the sale of hotel rooms, ground transportation (rental cars and hotel shuttle products), attraction and show tickets, and fees we receive from other merchants selling products through our website:
|
|
Three Months Ended September 30,
|
Percent
|
||||||||
|
(dollars in thousands)
|
2016
|
2015
|
Change
|
|||||||
|
Gross ancillary revenue - third party products
|
$
|
36,701
|
|
$
|
31,319
|
|
17.2
|
%
|
||
|
Cost of goods sold
|
(25,163
|
)
|
(21,148
|
)
|
19.0
|
|
||||
|
Transaction costs (1)
|
(279
|
)
|
(281
|
)
|
(0.7
|
)
|
||||
|
Ancillary revenue - third party products
|
$
|
11,259
|
|
$
|
9,890
|
|
13.8
|
|
||
|
As percent of gross ancillary revenue - third party
|
30.7
|
%
|
31.6
|
%
|
(0.9) pp
|
|
||||
|
Hotel room nights
|
114,185
|
|
103,750
|
|
10.1
|
|
||||
|
Rental car days
|
399,859
|
|
305,750
|
|
30.8
|
%
|
||||
(1) Includes payment expenses and travel agency commissions.
Ancillary third party revenue increased
13.8 percent
for the
third
quarter 2016 compared to 2015 as a result of our increase in scheduled service passengers, which was offset by a
6.5 percent
decrease in ancillary third party revenue per passenger largely attributable to a quarter over quarter decrease in hotel revenue margin.
17
Fixed fee contract revenue.
Fixed fee contract revenue for the
third
quarter
2016
increased
$4.5 million
from
2015
due mostly to the Apple Vacations charter which began in December 2015 as well as increased flying for the Department of Defense. The effects of this activity were slightly offset by the discontinuation of Peppermill Resorts charter service in January 2016.
Other revenue
.
Other revenue for the
third
quarter
2016
increased slightly compared with
2015
, due mostly to foreign currency exchange rates impacting aircraft lease revenue related to 12 Airbus A320 series aircraft.
Operating Expenses
We primarily evaluate our expense management by comparing our costs per passenger and per ASM across different periods, which enables us to assess trends in each expense category. The following table presents operating expense per passenger for the indicated periods. The table also presents operating expense per passenger, excluding fuel, a statistic which gives management and investors the ability to measure and monitor our cost performance absent fuel price volatility. Both the cost and availability of fuel are subject to many economic and political factors beyond our control.
|
|
Three Months Ended September 30,
|
Percent
|
||||||||
|
|
2016
|
2015
|
Change
|
|||||||
|
Aircraft fuel
|
$
|
23.58
|
|
$
|
28.20
|
|
(16.4
|
)%
|
||
|
Salaries and benefits
|
24.98
|
|
24.36
|
|
2.5
|
|
||||
|
Station operations
|
10.97
|
|
10.93
|
|
0.4
|
|
||||
|
Maintenance and repairs
|
8.94
|
|
10.48
|
|
(14.7
|
)
|
||||
|
Depreciation and amortization
|
8.81
|
|
10.06
|
|
(12.4
|
)
|
||||
|
Sales and marketing
|
1.92
|
|
1.67
|
|
15.0
|
|
||||
|
Aircraft lease rentals
|
0.16
|
|
0.29
|
|
(44.8
|
)
|
||||
|
Other
|
7.96
|
|
6.08
|
|
30.9
|
|
||||
|
Operating expense per passenger
|
$
|
87.32
|
|
$
|
92.07
|
|
(5.2
|
)%
|
||
|
Operating expense per passenger, excluding fuel
|
$
|
63.74
|
|
$
|
63.87
|
|
(0.2
|
)%
|
||
The following table presents unit costs on a per ASM basis, or CASM, for the indicated periods. As on a per-passenger basis, excluding fuel on a per ASM basis provides management and investors the ability to measure and monitor our cost performance absent fuel price volatility.
|
|
Three Months Ended September 30,
|
Percent
|
||||||||
|
|
2016
|
2015
|
Change
|
|||||||
|
Aircraft fuel
|
|
2.22
|
¢
|
|
2.63
|
¢
|
(15.6
|
)%
|
||
|
Salaries and benefits
|
2.35
|
|
2.27
|
|
3.5
|
|
||||
|
Station operations
|
1.03
|
|
1.02
|
|
1.0
|
|
||||
|
Maintenance and repairs
|
0.84
|
|
0.98
|
|
(14.3
|
)
|
||||
|
Depreciation and amortization
|
0.83
|
|
0.94
|
|
(11.7
|
)
|
||||
|
Sales and marketing
|
0.18
|
|
0.16
|
|
12.5
|
|
||||
|
Aircraft lease rentals
|
0.02
|
|
0.03
|
|
(33.3
|
)
|
||||
|
Other
|
0.75
|
|
0.55
|
|
36.4
|
|
||||
|
CASM
|
|
8.22
|
¢
|
|
8.58
|
¢
|
(4.2
|
)%
|
||
|
Operating CASM, excluding fuel
|
|
6.00
|
¢
|
|
5.95
|
¢
|
0.8
|
%
|
||
Aircraft fuel expense.
Aircraft fuel expense increased 1.5 percent for the
third
quarter
2016
compared to
2015
, as the system average fuel cost per gallon decreased by
13.7 percent
, offsetting the effect of a
17.8 percent
increase in system fuel gallons consumed (resulting from a
20.2 percent
increase in system capacity).
Additionally, ASMs per gallon increased over
third
quarter 2015 as Airbus aircraft flew 49.0 percent of scheduled service ASMs in the
third
quarter 2016, compared to 32.5 percent for the same period in 2015. We anticipate our fuel efficiency will continue to improve as we transition to an all Airbus fleet.
18
Salary and benefits expense.
Salary and benefits expense increased 24.5 percent for the
third
quarter
2016
when compared to the same period last year. The increase is primarily attributable to a
23.9 percent
increase in the number of full-time equivalent employees needed to support an increase in aircraft in service and the transition to a single fleet type. A quarter over quarter decline in our stock price led to a $3.1 million decrease in stock compensation expense.
The collective bargaining agreement for our pilots also went into effect on August 1, 2016, increasing salary and benefits expense for this work group by approximately $4.5 million over the same quarter 2015. Salary and benefits expense is expected to continue to increase at a higher rate than employee growth due to the increased costs associated with this agreement.
Station operations expense.
Station operations expense for the
third
quarter
2016
increased
21.9 percent
compared to the same period in
2015
due primarily to a
23.4 percent
increase in system departures.
Maintenance and repairs expense
.
Maintenance and repairs expense for the
third
quarter
2016
increased by
3.5 percent
compared to the same period in
2015
despite a
12.4 percent
increase in the average number of aircraft in service, due to fewer MD-80 aircraft major maintenance events quarter over quarter. Additionally, major maintenance events for the MD-80 aircraft are expected to continue to decline as we retire aircraft consistent with our fleet retirement plan.
Depreciation and amortization expense
.
Depreciation and amortization expense for the
third
quarter
2016
increased
6.3 percent
compared to
2015
, on a
12.4 percent
increase in the average number of aircraft in service. The effect of the increase in fleet size was diluted due to reduced depreciation on our MD-80 fleet as it nears full depreciation. However, we expect depreciation expense to increase in the fourth quarter 2016 and full-year 2017 as a result of our condensed MD-80 retirement schedule.
Sales and marketing expense.
Sales and marketing expense for the
third
quarter
2016
increased
$1.6 million
compared to the same period in
2015
. This is primarily due to increased advertising efforts for our expanding network, as well as expenses related to a national advertising campaign to support new market growth. The full effect of these increases was slightly offset by a decrease in credit card fee expense. We charge for credit card fee reimbursement, at zero margin, which is applied as a reduction to sales and marketing expense, and the net amount paid by us for credit card fees is reduced. Credit card fee reimbursements for the third quarter 2016 and 2015, were $6.2 million and $5.6 million respectively.
Other operating expense.
Other operating expense for the
third
quarter
2016
increased
$8.7 million
compared to
2015
. The increase is due to flight crew training needed to support our growing operating fleet, information technology expenses, increased property taxes, as well as additional crew costs due to irregular operations.
Income Tax Expense
Our effective tax rate decreased slightly quarter over quarter, at 36.0 percent for the three months ended
September 30, 2016
, compared to 37.1 percent for the three months ended
September 30, 2015
. The effective tax rate for 2016 differed from the statutory federal income tax rate of 35.0 percent primarily due to state and foreign taxes, the early adoption of ASU 2016-09 related to share-based payments, as well as executive compensation deduction limitations. The effective tax rate for the same period in 2015 differed from the federal tax rate due to state and foreign taxes, the effect of which was reduced by a one-time tax benefit related to the liquidation of a subsidiary.
While we expect our tax rate to be fairly consistent in the near term, it will vary depending on recurring items such as the amount of income we earn in each state and the state tax rate applicable to such income. Discrete items during interim periods may also affect our tax rates.
Comparison of
nine
months ended
September 30, 2016
to
nine
months ended
September 30, 2015
Operating Revenue
Scheduled service revenue
.
Scheduled service revenue for the
nine
months ended
September 30, 2016
increased 2.0 percent compared with 2015. The increase was mostly the result of an
18.3 percent
increase in scheduled service passengers offset by a
13.8 percent
decrease in scheduled service average base fare, which was affected by capacity growth into new markets and increased off-peak flying to capitalize on the current low-cost fuel environment.
Ancillary air-related charges
.
Ancillary air-related charges for the
nine
months ended
September 30, 2016
increased 15.6 percent compared with 2015 due mostly to the increase in scheduled service passengers. These effects were diluted by a 2.3
19
percent decrease in ancillary air-related charges per passenger as items such as bag fees tend to decrease in correlation with reduced stage length.
Ancillary third party products
.
The following table details the calculation of ancillary revenue from third party products. Third party products consist of revenue from the sale of hotel rooms, ground transportation (rental cars and hotel shuttle products), attraction and show tickets, and fees we receive from other merchants selling products through our website:
|
|
Nine Months Ended September 30,
|
Percent
|
||||||||
|
(dollars in thousands)
|
2016
|
2015
|
Change
|
|||||||
|
Gross ancillary revenue - third party products
|
$
|
112,309
|
|
$
|
104,612
|
|
7.4
|
%
|
||
|
Cost of goods sold
|
(76,915
|
)
|
(71,798
|
)
|
7.1
|
|
||||
|
Transaction costs (1)
|
(912
|
)
|
(1,151
|
)
|
(20.8
|
)
|
||||
|
Ancillary revenue - third party products
|
$
|
34,482
|
|
$
|
31,663
|
|
8.9
|
|
||
|
As percent of gross ancillary revenue - third party
|
30.7
|
%
|
30.3
|
%
|
0.4 pp
|
|
||||
|
Hotel room nights
|
339,504
|
|
362,592
|
|
(6.4
|
)
|
||||
|
Rental car days
|
1,168,544
|
|
939,888
|
|
24.3
|
%
|
||||
(1) Includes payment expenses and travel agency commissions.
Ancillary third party products revenue for the
nine
months ended
September 30, 2016
increased
$2.8 million
over the same period in 2015. This was due to the increase in scheduled service passengers and offset by an
8.0 percent
decrease in ancillary third party products revenue per passenger, largely attributable to lower hotel room take rate.
Fixed fee contract revenue.
Fixed fee contract revenue for the
nine
months ended
September 30, 2016
increased
$10.7 million
compared with 2015, due to increased charter services for the Department of Defense and the commencement of charter service for Apple Vacations (contract began in December 2015), resulting in a combined $14.5 million of revenue during the first
nine
months of 2016. The effects of these agreements were partially offset by the discontinuation of Peppermill Resorts charter service in January 2016.
Operating Expenses
The following table presents operating expense per passenger for the indicated periods:
|
|
Nine Months Ended September 30,
|
Percent
|
||||||||
|
|
2016
|
2015
|
Change
|
|||||||
|
Aircraft fuel*
|
$
|
21.76
|
|
$
|
30.39
|
|
(28.4
|
)%
|
||
|
Salaries and benefits
|
25.11
|
|
23.97
|
|
4.8
|
|
||||
|
Station operations
|
11.45
|
|
10.47
|
|
9.4
|
|
||||
|
Maintenance and repairs
|
9.75
|
|
9.87
|
|
(1.2
|
)
|
||||
|
Depreciation and amortization
|
9.03
|
|
10.31
|
|
(12.4
|
)
|
||||
|
Sales and marketing
|
1.99
|
|
2.37
|
|
(16.0
|
)
|
||||
|
Aircraft lease rentals
|
0.11
|
|
0.29
|
|
(62.1
|
)
|
||||
|
Other
|
6.94
|
|
6.64
|
|
4.5
|
|
||||
|
Operating expense per passenger*
|
$
|
86.14
|
|
$
|
94.31
|
|
(8.7
|
)%
|
||
|
Operating expense per passenger, excluding fuel
|
$
|
64.38
|
|
$
|
63.92
|
|
0.7
|
%
|
||
*Includes effect of $8.3 million fuel tax refunds in the second quarter of 2016.
20
The following table presents unit costs, defined as Operating CASM, for the indicated periods:
|
|
Nine Months Ended September 30,
|
Percent
|
||||||||
|
|
2016
|
2015
|
Change
|
|||||||
|
Aircraft fuel*
|
|
1.97
|
¢
|
|
2.78
|
¢
|
(29.1
|
)%
|
||
|
Salaries and benefits
|
2.27
|
|
2.19
|
|
3.7
|
|
||||
|
Station operations
|
1.04
|
|
0.96
|
|
8.3
|
|
||||
|
Maintenance and repairs
|
0.88
|
|
0.90
|
|
(2.2
|
)
|
||||
|
Depreciation and amortization
|
0.82
|
|
0.94
|
|
(12.8
|
)
|
||||
|
Sales and marketing
|
0.18
|
|
0.22
|
|
(18.2
|
)
|
||||
|
Aircraft lease rentals
|
0.01
|
|
0.03
|
|
(66.7
|
)
|
||||
|
Other
|
0.62
|
|
0.60
|
|
3.3
|
|
||||
|
CASM*
|
|
7.79
|
¢
|
|
8.62
|
¢
|
(9.6
|
)%
|
||
|
Operating CASM, excluding fuel
|
|
5.82
|
¢
|
|
5.84
|
¢
|
(0.3
|
)%
|
||
*Includes effect of $8.3 million fuel tax refunds in the second quarter of 2016.
Aircraft fuel expense.
Aircraft fuel expense decreased 15.7 percent for the
nine
months ended
September 30, 2016
compared to the same period in 2015. Excluding the effect of one-time $8.3 million in fuel tax refunds, fuel expense decreased 11.9 percent compared to 2015. The system average fuel cost per gallon declined by
24.2 percent
compared to 2015 (excluding the fuel tax refunds), which was offset by a
16.1 percent
increase in system fuel gallons consumed due to an increase in total system capacity of
19.0 percent
.
ASMs per gallon increased
2.6 percent
for the
nine
months ended
September 30, 2016
compared to the same period in 2015 as Airbus aircraft flew 47.4 percent of scheduled service ASMs in the first nine months of 2016, compared to 30.2 percent for the same period in 2015. We anticipate our fuel efficiency will continue to improve as we transition to an all Airbus fleet.
Salary and benefits expense.
Salary and benefits expense increased 23.4 percent for the
nine
months ended
September 30, 2016
compared to the same period in 2015. The increase is mostly attributable to a
23.9 percent
increase in the number of full-time equivalent employees associated with an increase in average number of aircraft in service and the transition to a single fleet type. A year-over-year decline in our stock price led to a $6.4 million decrease in stock compensation expense.
The collective bargaining agreement for our pilots also went into effect on August 1, 2016, increasing salary and benefits expense for our pilots by approximately $4.5 million over the same period in 2015.
Station operations expense.
Station operations expense for the
nine
months ended
September 30, 2016
increased
28.8 percent
compared to the same period in 2015, which outpaced a
20.2 percent
increase in system departures. Station expense per departure increased 7.2 percent year over year partially because we are serving more medium-sized cities in 2016 compared to 2015, and these airports typically have higher ground handling fees than the smaller airports we serve. We have also experienced overall rate increases at numerous stations and increased inconvenienced traveler expenses due to irregular operations this summer.
Maintenance and repairs expense
.
Maintenance and repairs expense for the
nine
months ended
September 30, 2016
increased
16.4 percent
compared with the same period in 2015, due to a
13.3 percent
increase in average number of aircraft in service over 2015.
Depreciation and amortization expense
. Depreciation and amortization expense for the
nine
months ended
September 30, 2016
increased by
3.2 percent
, compared to the same period in 2015 despite a
13.3 percent
increase in average number of aircraft in service. The effect of the increase in fleet size was diluted due to reduced depreciation on our MD-80 fleet as it nears full depreciation. However, we expect depreciation expense to increase in the fourth quarter 2016 and full-year 2017 as a result of our condensed MD-80 retirement schedule.
Sales and marketing expense.
Sales and marketing expense for the
nine
months ended
September 30, 2016
decreased minimally compared to the same period in 2015. We incurred increased expenses in the current year related to a national advertising campaign which launched in late September 2015, the effects of which were offset by the decrease in credit card fee expense. We charge for credit card fee reimbursement, at zero margin, which is applied as a reduction to sales and marketing expense, and the net amount paid by us for credit card fees is reduced. Credit card fee reimbursements for the nine months ended
September 30, 2016
and 2015 were $19.4 million and $16.1 million respectively.
21
Other expense.
Other expense for the
nine
months ended
September 30, 2016
increased 23.1 percent compared to 2015. This is primarily due to increased crew training in 2016 to support our fleet and network growth. We also had increased expenses related to irregular operations and various information technology initiatives.
Income Tax Expense
Our effective tax rate was
37.2 percent
for the
nine
months ended
September 30, 2016
, up slightly from
36.7 percent
for the same period in 2015. The effective tax rate for 2016 differed from the statutory federal income tax rate of 35.0 percent primarily due to state and foreign taxes, the early adoption of ASU 2016-09 as well as executive compensation deduction limitations. The effective tax rate for the same period in 2015 differed from the federal statutory rate due to state and foreign taxes, and was reduced by the effect of a one-time tax benefit related to the liquidation of a subsidiary.
While we expect our tax rate to be fairly consistent in the near term, it will vary depending on recurring items such as the amount of income we earn in each state and the state tax rate applicable to such income. Discrete items during interim periods may also affect our tax rates.
22
Comparative Consolidated Operating Statistics
The following tables set forth our operating statistics for the periods indicated:
|
Three Months Ended September 30,
|
Percent
|
Nine Months Ended September 30,
|
Percent
|
||||||||||||||||||
|
2016
|
2015
|
Change*
|
2016
|
2015
|
Change*
|
||||||||||||||||
|
Operating statistics (unaudited):
|
|
|
|
|
|
|
|||||||||||||||
|
Total system statistics:
|
|
|
|
|
|
|
|||||||||||||||
|
Passengers
|
2,939,055
|
|
2,420,819
|
|
21.4
|
|
8,410,422
|
|
7,139,876
|
|
17.8
|
|
|||||||||
|
Revenue passenger miles (RPMs) (thousands)
|
2,645,533
|
|
2,235,683
|
|
18.3
|
|
7,831,436
|
|
6,734,217
|
|
16.3
|
|
|||||||||
|
Available seat miles (ASMs) (thousands)
|
3,121,762
|
|
2,597,658
|
|
20.2
|
|
9,302,051
|
|
7,814,146
|
|
19.0
|
|
|||||||||
|
Load factor
|
84.7
|
%
|
86.1
|
%
|
(1.4
|
)
|
84.2
|
%
|
86.2
|
%
|
(2.0
|
)
|
|||||||||
|
Operating expense per ASM (CASM) (cents)***
|
8.22
|
|
8.58
|
|
(4.2
|
)
|
7.79
|
|
8.62
|
|
(9.6
|
)
|
|||||||||
|
Fuel expense per ASM (cents)***
|
2.22
|
|
2.63
|
|
(15.6
|
)
|
1.97
|
|
2.78
|
|
(29.1
|
)
|
|||||||||
|
Operating CASM, excluding fuel (cents)
|
6.00
|
|
5.95
|
|
0.8
|
|
5.82
|
|
5.84
|
|
(0.3
|
)
|
|||||||||
|
ASMs per gallon of fuel
|
70.6
|
|
69.2
|
|
2.0
|
|
71.6
|
|
69.8
|
|
2.6
|
|
|||||||||
|
Departures
|
21,384
|
|
17,330
|
|
23.4
|
|
61,271
|
|
50,976
|
|
20.2
|
|
|||||||||
|
Block hours
|
47,739
|
|
39,347
|
|
21.3
|
|
142,515
|
|
118,999
|
|
19.8
|
|
|||||||||
|
Average stage length (miles)
|
864
|
|
878
|
|
(1.6
|
)
|
896
|
|
900
|
|
(0.4
|
)
|
|||||||||
|
Average number of operating aircraft during period
|
84.0
|
|
74.7
|
|
12.4
|
|
83.4
|
|
73.6
|
|
13.3
|
|
|||||||||
|
Average block hours per aircraft per day
|
6.2
|
|
5.7
|
|
8.8
|
|
6.2
|
|
5.9
|
|
5.1
|
|
|||||||||
|
Full-time equivalent employees at end of period
|
3,287
|
|
2,654
|
|
23.9
|
|
3,287
|
|
2,654
|
|
23.9
|
|
|||||||||
|
Fuel gallons consumed (thousands)
|
44,187
|
|
37,518
|
|
17.8
|
|
129,862
|
|
111,881
|
|
16.1
|
|
|||||||||
|
Average fuel cost per gallon***
|
$
|
1.57
|
|
$
|
1.82
|
|
(13.7
|
)
|
$
|
1.41
|
|
$
|
1.94
|
|
(27.3
|
)
|
|||||
|
Scheduled service statistics:
|
|
|
|||||||||||||||||||
|
Passengers
|
2,904,295
|
|
2,383,556
|
|
21.8
|
|
8,321,716
|
|
7,034,244
|
|
18.3
|
|
|||||||||
|
Revenue passenger miles (RPMs) (thousands)
|
2,603,849
|
|
2,204,760
|
|
18.1
|
|
7,714,172
|
|
6,647,978
|
|
16.0
|
|
|||||||||
|
Available seat miles (ASMs) (thousands)
|
2,997,529
|
|
2,526,292
|
|
18.7
|
|
8,967,614
|
|
7,612,202
|
|
17.8
|
|
|||||||||
|
Load factor
|
86.9
|
%
|
87.3
|
%
|
(0.4
|
)
|
86.0
|
%
|
87.3
|
%
|
(1.3
|
)
|
|||||||||
|
Departures
|
20,398
|
|
16,563
|
|
23.2
|
|
58,744
|
|
48,833
|
|
20.3
|
|
|||||||||
|
Block hours
|
45,740
|
|
38,094
|
|
20.1
|
|
137,066
|
|
115,434
|
|
18.7
|
|
|||||||||
|
Total scheduled service revenue per ASM (TRASM) (cents)**
|
10.54
|
|
11.38
|
|
(7.4
|
)
|
10.92
|
|
12.01
|
|
(9.1
|
)
|
|||||||||
|
Average fare - scheduled service
|
$
|
61.07
|
|
$
|
71.32
|
|
(14.4
|
)
|
$
|
68.27
|
|
$
|
79.16
|
|
(13.8
|
)
|
|||||
|
Average fare - ancillary air-related charges
|
$
|
43.83
|
|
$
|
45.12
|
|
(2.9
|
)
|
$
|
45.30
|
|
$
|
46.35
|
|
(2.3
|
)
|
|||||
|
Average fare - ancillary third party products
|
$
|
3.88
|
|
$
|
4.15
|
|
(6.5
|
)
|
$
|
4.14
|
|
$
|
4.50
|
|
(8.0
|
)
|
|||||
|
Average fare - total
|
$
|
108.78
|
|
$
|
120.59
|
|
(9.8
|
)
|
$
|
117.71
|
|
$
|
130.01
|
|
(9.5
|
)
|
|||||
|
Average stage length (miles)
|
869
|
|
894
|
|
(2.8
|
)
|
901
|
|
915
|
|
(1.5
|
)
|
|||||||||
|
Fuel gallons consumed (thousands)
|
42,439
|
|
36,458
|
|
16.4
|
|
125,291
|
|
108,837
|
|
15.1
|
|
|||||||||
|
Average fuel cost per gallon***
|
$
|
1.59
|
|
$
|
1.83
|
|
(13.1
|
)
|
$
|
1.41
|
|
$
|
1.96
|
|
(28.1
|
)
|
|||||
|
Percent of sales through website during period
|
94.6
|
%
|
95.2
|
%
|
(0.6
|
)
|
94.3
|
%
|
95.1
|
%
|
(0.8
|
)
|
|||||||||
* Except load factor and percent of sales through website during period, which are presented as a percentage point change.
** Various components of this measure do not have a direct correlation to ASMs. This measure is provided on a per ASM basis so as to facilitate comparison with airlines reporting revenues on a per ASM basis.
*** Nine month statistics include effect of $8.3 million fuel tax refunds in the second quarter of 2016.
23
LIQUIDITY AND CAPITAL RESOURCES
Current liquidity
Cash, restricted cash and investment securities (short-term and long-term) decreased from
$407.8 million
at
December 31, 2015
to
$397.1 million
at
September 30, 2016
. Restricted cash represents escrowed funds under fixed fee contracts and cash collateral against letters of credit required by hotel properties for guaranteed room availability, airports and certain other parties. Under our fixed fee flying contracts, we require our customers to prepay for flights to be provided by us. The prepayments are escrowed until the flight is completed and are recorded as restricted cash with a corresponding amount as air traffic liability. Investment securities represent highly liquid marketable securities which are available-for-sale. As of
September 30, 2016
, our unrestricted cash and investment securities balance (including short-term and long-term investments) was
$383.3 million
.
During the first nine months of
2016
, our primary source of funds was
$308.1 million
generated by operations as well as
$120.4 million
in proceeds from long-term debt issuance. Our operating cash flows and borrowings have allowed us to return value to shareholders and invest in the growth of our fleet. Our future capital needs are primarily for the acquisition of additional aircraft, including our existing Airbus A320 series aircraft commitments and pre-delivery deposits. We believe we have more than adequate liquidity resources through our operating cash flows, borrowings, and cash balances, to meet our future contractual obligations. We expect to finance a significant portion of the purchase price of our new Airbus aircraft order and believe the financing will be available on acceptable terms. In addition, we continue to consider raising funds through debt financing on an opportunistic basis.
In addition to our recurring quarterly cash dividend, we plan to continue repurchasing our stock in the open market subject to availability of cash resources and compliance with our debt covenants. As of
September 30, 2016
, our authority under our board-approved stock repurchase program was
$92.3 million
. There is no expiration date for the program.
Debt
Our long-term debt obligations, without reduction for related costs, increased from $646.2 million as of
December 31, 2015
to $703.1 million as of
September 30, 2016
as we borrowed additional funds during 2016, while making scheduled repayments on our existing debt. During the third quarter 2016, we borrowed $42.0 million secured by three Airbus A320 series aircraft as well as $50.4 million against our senior secured revolving credit facility.
Sources and Uses of Cash
Operating Activities.
During the
nine
months ended
September 30, 2016
, our operating activities provided
$308.1 million
of cash compared to
$267.6 million
during the same period of
2015
. Operating cash inflows are primarily derived from providing air transportation and related ancillary products and services to customers, for which the vast majority of tickets are purchased prior to the day travel occurs. The year-over-year increase in reported cash inflows is primarily due to a
$14.7 million
increase in net income and changes in the amounts of certain current assets and liabilities.
Investing Activities.
Cash used in investing activities was
$284.0 million
for the
nine
months ended
September 30, 2016
compared to
$153.0 million
for the same period in
2015
. The year-over-year increase is mainly due to
$113.8 million
paid in aircraft pre-delivery deposits during the third quarter 2016 and
$150.3 million
of other property and equipment purchases. No aircraft pre-delivery deposits were paid in 2015 and other property and equipment purchases totaled
$173.9 million
. Our net cash used to purchase investment securities (net of proceeds from maturities) was
$23.9 million
in 2016 compared to
$20.2 million
net cash received from proceeds of investment maturities (net of purchases) in 2015.
Financing Activities.
Cash used in financing activities for the
nine
months ended
September 30, 2016
was
$62.5 million
compared to
$125.6 million
for the same period in
2015
. During the
nine
months ended
September 30, 2016
, we repurchased common stock for
$63.4 million
and paid cash dividends of
$55.9 million
, including the special dividend declared in 2015. We also had
$56.9 million
of cash inflows related to debt proceeds, net of principal debt payments. During the same period in
2015
, our primary use of cash was also the repurchase of common stock for
$121.1 million
and payment of cash dividends of
$57.4 million
. These uses were offset by
$46.6 million
of proceeds from the issuance of debt, net of principal payments.
CAUTIONARY NOTE REGARDING FORWARD-LOOKING STATEMENTS
We have made forward-looking statements in this quarterly report on Form 10-Q, and in the section entitled “Management’s Discussion and Analysis of Financial Condition and Results of Operations,” that are based on our management’s beliefs and
24
assumptions, and on information currently available to our management. Forward-looking statements include information concerning our possible or assumed future results of operations, business strategies, fleet plan, financing plans, competitive position, industry environment, potential growth opportunities, future service to be provided and the effects of future regulation and competition. Forward-looking statements include all statements that are not historical facts and can be identified by the use of forward-looking terminology such as the words “believe,” “expect,” “anticipate,” “intend,” “plan,” “estimate,” “project” or similar expressions.
Forward-looking statements involve risks, uncertainties and assumptions. Actual results may differ materially from those expressed in the forward-looking statements. Important risk factors that could cause our results to differ materially from those expressed in the forward-looking statements may be found in our periodic reports filed with the Securities and Exchange Commission at www.sec.gov. These risk factors include, without limitation, an accident involving or problems with our aircraft, our reliance on automation systems, volatility of fuel costs, labor issues and costs, the ability to obtain regulatory approvals as needed, the effect of economic conditions on leisure travel, debt covenants, terrorist attacks, risks inherent to airlines, demand for air services to our leisure destinations from the markets served by us, our dependence on our leisure destination markets, the competitive environment, our reliance on third parties who provide facilities or services to us, the possible loss of key personnel, economic and other conditions in markets in which we operate, governmental regulation, increases in maintenance costs and cyclical and seasonal fluctuations to our operating results.
Any forward-looking statements are based on information available to us today and we undertake no obligation to publicly update any forward-looking statements, whether as a result of future events, new information or otherwise.
CRITICAL ACCOUNTING POLICIES AND ESTIMATES
A description of our critical accounting policies is included in Item 7 of our Annual Report on Form 10-K for the year ended
December 31, 2015
and as supplemented by disclosure in Part I - Notes to Consolidated Financial Statements, Note 2.
We are subject to certain market risks, including commodity prices (specifically aircraft fuel). The adverse effects of changes in these markets could pose potential losses as discussed below. The sensitivity analysis provided does not consider the effects that such adverse changes may have on overall economic activity, nor does it consider additional actions we may take to mitigate our exposure to such changes. Actual results may differ.
Aircraft Fuel
. Our results of operations can be significantly impacted by changes in the price and availability of aircraft fuel. Aircraft fuel expense represented
25.3 percent
of our operating expenses for the
nine
months ended
September 30, 2016
. Increases in fuel prices, or a shortage of supply, could have a material impact on our operations and operating results. Based on our fuel consumption for the three and
nine
months ended
September 30, 2016
, a hypothetical ten percent increase in the average price per gallon of fuel (excluding the effect of the fuel tax refunds for the nine months then ended) would have increased fuel expense by $7.0 million and $18.8 million, respectively.
Interest Rates
. As of
September 30, 2016
, we had a total of $366.4 million in variable-rate debt, including current maturities, and excluding related costs. A hypothetical 100 basis point change in market interest rates for the three months ended
September 30, 2016
would not have had a significant effect on interest expense, and would have increased interest expense by approximately $1.8 million for the
nine
months then ended.
As of
September 30, 2016
, we had a total of $336.7 million in fixed-rate debt, including current maturities, and without reduction for related costs, which had a fair value of $347.4 million. A hypothetical 100 basis point change in market interest rates as of
September 30, 2016
would not have impacted interest expense or have a material effect on the fair value of our fixed-rate debt instruments as of such date.
We have market risk associated with changing interest rates due to the short-term nature of our cash, cash equivalents, and investment securities, which totaled
$383.3 million
at
September 30, 2016
. Because of the short-term nature of these investments, the returns earned closely parallel short-term floating interest rates. A hypothetical 100 basis point change in market interest rates for the three months ended
September 30, 2016
would not have had a significant effect on interest income and would have increased interest income by approximately $2.4 million for the
nine
months then ended.
See Item 7A "Quantitative and Qualitative Disclosures About Market Risk" in the Company's Annual Report on Form 10-K for the year ended December 31, 2015, for further information about market risk.
25
(a)
Evaluation of disclosure controls and procedures.
As of the end of the period covered by this report, under the supervision and with the participation of our management, including our chief executive officer (“CEO”) and chief financial officer (“CFO”), we evaluated the design and operation of our disclosure controls and procedures (as defined in Rules 13a-15(e) and 15d-15(e) of the Securities Exchange Act of 1934, as amended, or the “Exchange Act”). Based on this evaluation, our management, including our CEO and CFO, has concluded that our disclosure controls and procedures are designed, and are effective, to give reasonable assurance that the information we are required to disclose is recorded, processed, summarized and reported within the time periods specified in the SEC’s rules and forms. Based upon this evaluation, the CEO and CFO concluded that our disclosure controls and procedures are effective in providing reasonable assurance that information required to be disclosed in our reports filed with or submitted to the SEC under the Exchange Act is accumulated and communicated to management, including the CEO and CFO, as appropriate to allow timely decisions regarding required disclosure.
(b)
Changes in internal controls.
There were no changes in our internal control over financial reporting that occurred during the quarter ending
September 30, 2016
, that have materially affected, or are reasonably likely to materially affect, our internal control over financial reporting.
We are subject to certain legal and administrative actions we consider routine to our business activities. We believe the ultimate outcome of any pending legal or administrative matters will not have a material adverse impact on our financial position, liquidity or results of operations.
We have evaluated our risk factors and determined the following changes to our risk factors set forth in Part I, Item 1A in the Form 10-K since we filed our Annual Report on Form 10-K on February 22, 2016.
Increased labor costs could result from industry conditions and could be impacted by labor-related disruptions.
Labor costs constitute the largest percentage of our total operating costs. Industry demand for pilots and the supply of available pilots will impact our labor costs as we seek to retain our employees and compete against other airlines for qualified personnel.
Further, we have three employee groups (pilots, flight attendants and flight dispatchers) which have elected union representation. These groups represent approximately half of our employees. We recently reached a collective bargaining agreement with the International Brotherhood of Teamsters which was ratified by our pilots and became effective as of August 1, 2016. The agreement provides for enhancements to pay scales, benefits, and limited work rules. Estimated expenses over the five-year agreement term are expected to have a significant impact on our results of operations.
Although we reached a tentative agreement with the Transport Workers Union for the flight attendant group, that agreement was not ratified by the flight attendant work group. We are also in the initial stages of the process with our flight dispatchers and a negotiating committee has not yet been formed.
Union contracts with our flight attendants and flight dispatchers could put pressure on our labor costs.
If we are unable to reach agreement on the terms of collective bargaining agreements in the future, or we experience wide-spread employee dissatisfaction, we could be subject to work slowdowns or stoppages. Any of these events could have an adverse effect on our operations and future results.
A
ny inability to obtain financing for aircraft under contract could harm our fleet retirement and growth plan.
We typically finance our aircraft through debt financing. Although we believe debt financing will be available for the aircraft we will acquire, we cannot assure you we will be able to secure such financing on terms attractive to us or at all. To the extent we cannot secure such financing on acceptable terms or at all, we may be required to modify our aircraft acquisition and retirement plans, incur higher than anticipated financing costs or use more of our cash balances for aircraft acquisitions than we currently expect.
26
Our plan to retire our older fleet types will limit our growth until replacement and additional aircraft are added to our operating fleet.
Our current fleet plan calls for the retirement of all of our MD-80 aircraft and B757-200 aircraft in 2019. The full retirement of our MD-80 fleet on this schedule will depend on our ability to close on the acquisition of Airbus aircraft now under contract and to source and acquire additional used Airbus aircraft which we have yet to identify or for which we have yet to negotiate contracts. The retirement of these aircraft will limit our network growth until such time as we have replaced these aircraft and added additional aircraft for service growth. If we are unable to close on Airbus aircraft now under contract or acquire additional Airbus aircraft not yet under contract by the end of 2019, our fleet replacement may be delayed and we may be limited in our ability to significantly grow revenues and profitability in the interim.
Our Repurchases of Equity Securities
The following table reflects the repurchases of our common stock during the
third
quarter
2016
:
|
Period
|
Total Number of Shares Purchased (1)
|
Average Price Paid per Share
|
Total Number of
Shares Purchased as Part of our Publicly Announced Plan |
Approximate Dollar Value of Shares that
May Yet be Purchased Under the Plans or Programs (in thousands) (2) |
||||||||||
|
July
|
315
|
|
$
|
139.26
|
|
None
|
|
|||||||
|
August
|
—
|
|
—
|
|
None
|
|
||||||||
|
September
|
—
|
|
—
|
|
None
|
|
||||||||
|
Total
|
315
|
|
$
|
139.26
|
|
—
|
|
$
|
92,330
|
|
||||
|
(1)
|
Total number of shares purchased during the quarter represents shares repurchased from employees who vested a portion of their restricted stock grants. These share repurchases were made at the election of each employee pursuant to an offer to repurchase by us. In each case, the shares repurchased constituted the portion of vested shares necessary to satisfy income tax withholding requirements.
|
|
(2)
|
Represents the remaining dollar amount of open market purchases of our common stock which has been authorized by the Board under a share repurchase program.
|
None
Not applicable
None
27
|
3.1
|
Articles of Incorporation. (1)
|
|
3.2
|
Bylaws of the Company as amended on February 17, 2015.
|
|
10.1
|
Purchase Agreement dated July 26, 2016 between Allegiant Air, LLC and Airbus S.A.S. and related Letter Agreements. (2)
|
|
10.2
|
General Terms Agreement dated July 26, 2016, among CFM International, Inc., Allegiant Air, LC and Sunshine Asset Management, LLC and related Letter Agreement No. 3. (2)
|
|
10.3
|
Employment Agreement dated as of September 9, 2016, between the Company and John Redmond.
|
|
10.4
|
Stock Appreciation Rights Agreement dated September 9, 2016, between the Company and John Redmond.
|
|
10.5
|
Restricted Stock Agreement dated September 9, 2016, between the Company and John Redmond.
|
|
10.6
|
2016 Long-Term Incentive Plan.
|
|
10.7
|
Form of Restricted Stock Agreement used for Directors of the Company.
|
|
10.8
|
Form of Stock Option Agreement used for Employees of the Company.
|
|
10.9
|
Form of Restricted Stock Agreement used for Employees of the Company.
|
|
10.10
|
Form of Stock Appreciation Rights Agreement used for Employees of the Company.
|
|
12
|
Calculation of Ratio of Earnings to Fixed Charges of Allegiant Travel Company.
|
|
31.1
|
Rule 13a - 14(a) / 15d - 14(a) Certification of Principal Executive Officer
|
|
31.2
|
Rule 13a - 14(a) / 15d - 14(a) Certification of Principal Financial Officer
|
|
32
|
Section 1350 Certifications
|
|
101.INS
|
XBRL Instance Document
|
|
101.SCH
|
XBRL Taxonomy Extension Schema Document
|
|
101.CAL
|
XBRL Taxonomy Extension Calculation Linkbase Document
|
|
101.DEF
|
XBRL Taxonomy Extension Definition Linkbase Document
|
|
101.LAB
|
XBRL Taxonomy Extension Labels Linkbase Document
|
|
101.PRE
|
XBRL Taxonomy Extension Presentation Linkbase Document
|
|
(1)
|
Incorporated by reference to Exhibit filed with Registration Statement #333-134145 filed by the Company with the Commission and amendments thereto.
|
|
(2)
|
Portions of the indicated document have been omitted pursuant to a request for confidential treatment and the document indicated has been filed separately with the Commission as required by Rule 24b-2 of the Securities Exchange Act of 1934, as amended.
|
28
SIGNATURES
Pursuant to the requirements of the Securities Exchange Act of 1934, the Registrant has duly caused this report to be signed on its behalf by the undersigned thereunto duly authorized.
|
ALLEGIANT TRAVEL COMPANY
|
|||
|
Date:
|
November 1, 2016
|
By:
|
/s/ Scott Sheldon
|
|
Scott Sheldon, as duly authorized officer of the Company (Chief Financial Officer) and as Principal Financial Officer
|
|||
29
TABLE OF CONTENTS
Part I. Financial InformationItem 1. Consolidated Financial StatementsNote 1 Summary Of Significant Accounting PoliciesNote 2 Update To Accounting PoliciesNote 3 Investment SecuritiesNote 4 Property and EquipmentNote 5 Long-term DebtNote 6 Fair Value MeasurementsNote 7 Derivative InstrumentsNote 8 Shareholders EquityNote 9 Earnings Per ShareNote 10 Commitments and ContingenciesNote 11 Related Party TransactionsNote 12 Fuel Tax RefundsItem 2. Management S Discussion and Analysis Of Financial Condition and Results Of OperationsItem 3. Quantitative and Qualitative Disclosures About Market RiskItem 4. Controls and ProceduresPart II. Other InformationItem 1. Legal ProceedingsItem 1A. Risk FactorsItem 2. Unregistered Sales Of Equity Securities and Use Of ProceedsItem 3. Defaults Upon Senior SecuritiesItem 4. Mine Safety DisclosuresItem 5. Other InformationItem 6. Exhibits