ALASKA AIR GROUP, INC.
10-Ks and 10-Qs
|
|
|
|
|
|
|
|
|
|
|
|
|
|
|
|
|
|
|
|
|
|
|
|
|
|
|
|
|
|
|
|
|
|
|
|
|
|
|
|
|
|
|
|
|
|
|
|
|
|
|
|
|
UNITED STATES
SECURITIES AND EXCHANGE COMMISSION
WASHINGTON, DC 20549
FORM 10-K
(Mark One)
T
ANNUAL REPORT PURSUANT TO SECTION 13 OR 15(d) OF THE SECURITIES EXCHANGE ACT OF 1934
[NO FEE REQUIRED]
For the fiscal year ended
December 31, 2010
OR
£
TRANSITION REPORT PURSUANT TO SECTION 13 OR 15(d) OF THE SECURITIES EXCHANGE ACT OF 1934
[NO FEE REQUIRED]
For the transition period from to
Commission File Number 1-8957
ALASKA AIR GROUP, INC.
A Delaware Corporation
|
91-1292054
|
19300 International Boulevard, Seattle, Washington 98188
|
|
|
(I.R.S. Employer Identification No.)
|
Telephone: (206) 392-5040
|
Securities registered pursuant to Section 12(b) of the Act:
|
Title of Each Class
|
Name of Each Exchange on Which Registered
|
|
|
Common Stock, $1.00 Par Value
|
New York Stock Exchange
|
Securities registered pursuant to Section 12(g) of the Act: None
Indicate by check mark if the registrant is a well-known seasoned issuer, as defined in Rule 405 of the Securities Act. Yes
T
No
£
Indicate by check mark if the registrant is not required to file reports pursuant to Section 13 or Section 15(d) of the Act. Yes
£
No
T
Indicate by check mark whether the registrant (1) has filed all reports required to be filed by Section 13 or 15(d) of the Securities Exchange Act of 1934 during the preceding 12 months (or for such shorter period that the registrant was required to file such reports), and (2) has been subject to such filing requirements for the past 90 days. Yes
T
No
£
Indicate by check mark whether the registrant has submitted electronically and posted on its corporate Web site, if any, every Interactive Data File required to be submitted and posted pursuant to Rule 405 of Regulation S-T (§232.405 of this chapter) during the preceding 12 months (or for such shorter period that the registrant was required to submit and post such files). Yes
T
No
£
Indicate by check mark if disclosure of delinquent filers pursuant to Item 405 of Regulation S-K is not contained herein, and will not be contained, to the best of registrant’s knowledge, in definitive proxy or information statements incorporated by reference in Part III of this Form 10-K or any amendment to this Form 10-K.
£
Indicate by check mark whether the registrant is a large accelerated filer, an accelerated filer, a non-accelerated filer or a smaller reporting company. See definitions of “large accelerated filer”, "accelerated filer" and "smaller reporting company" in Rule 12b-2 of the Exchange Act (Check one):
Large accelerated filer
T
Accelerated filer
£
Non-accelerated filer
£
Smaller reporting company
£
Indicate by check mark whether the registrant is a shell company (as defined in Rule 12b-2 of the Exchange Act.): Yes
£
No
T
As of
January 31, 2011
, shares of common stock outstanding totaled 35,831,543. The aggregate market value of the shares of common stock of Alaska Air Group, Inc. held by nonaffiliates on
June 30, 2010
, was approximately $1.6 billion (based on the closing price of $44.95 per share on the New York Stock Exchange on that date).
DOCUMENTS INCORPORATED BY REFERENCE
|
Title of Document
|
Part Hereof Into Which Document is to be Incorporated
|
|
|
Definitive Proxy Statement Relating to
2011 Annual Meeting of Shareholders
|
Part III
|
ALASKA AIR GROUP, INC.
ANNUAL REPORT ON FORM 10-K FOR THE YEAR ENDED
DECEMBER 31, 2010
TABLE OF CONTENTS
|
|
||
|
|
||
|
|
||
|
|
||
|
|
||
|
|
||
|
|
||
|
|
||
|
|
||
|
|
||
|
|
||
|
|
||
|
|
||
|
|
||
|
|
||
|
|
||
|
|
||
|
|
||
|
|
||
|
|
||
|
|
||
|
|
||
|
|
||
|
REMOVED AND RESERVED
|
||
|
|
||
|
|
||
|
|
||
|
|
||
|
|
||
|
|
||
|
|
||
|
|
ALASKA AIRLINES
|
2
|
|
HORIZON AIR
|
|
|
|
CONSOLIDATED NONOPERATING INCOME (EXPENSE)
|
|
|
|
CONSOLIDATED INCOME TAX EXPENSE (BENEFIT)
|
|
|
|
||
|
|
ALASKA AIRLINES
|
|
|
|
HORIZON AIR
|
|
|
|
CONSOLIDATED NONOPERATING INCOME (EXPENSE)
|
|
|
|
CONSOLIDATED INCOME TAX EXPENSE (BENEFIT)
|
|
|
|
||
|
|
||
|
|
||
|
|
||
|
|
CONTRACTUAL OBLIGATIONS
AND COMMITMENTS
|
|
|
|
||
|
|
||
|
|
||
|
|
||
|
|
||
|
|
||
|
|
||
|
|
||
|
|
||
|
|
||
|
|
||
|
|
||
|
|
||
|
|
||
|
|
||
As used in this Form 10-K, the terms “Air Group,” “our,” “we” and the “Company” refer to Alaska Air Group, Inc. and its subsidiaries, unless the context indicates otherwise. Alaska Airlines, Inc. and Horizon Air Industries, Inc. are referred to as “Alaska” and “Horizon,” respectively, and together as our “airlines.”
3
CAUTIONARY NOTE REGARDING FORWARD-LOOKING STATEMENTS
In addition to historical information, this Form 10-K contains forward-looking statements within the meaning of Section 27A of the Securities Act of 1933, as amended, Section 21E of the Securities Exchange Act of 1934, as amended, and the Private Securities Litigation Reform Act of 1995. Forward-looking statements are those that predict or describe future events or trends and that do not relate solely to historical matters. You can generally identify forward-looking statements as statements containing the words “believe,” “expect,” “will,” “anticipate,” “intend,” “estimate,” “project,” “assume” or other similar expressions, although not all forward-looking statements contain these identifying words. Forward-looking statements involve risks and uncertainties that could cause actual results to differ materially from historical experience or the Company’s present expectations.
You should not place undue reliance on our forward-looking statements because the matters they describe are subject to known and unknown risks, uncertainties and other unpredictable factors, many of which are beyond our control.
Our forward-looking statements are based on the information currently available to us and speak only as of the date on which this report was filed with the SEC. We expressly disclaim any obligation to issue any updates or revisions to our forward-looking statements, even if subsequent events cause our expectations to change regarding the matters discussed in those statements. Over time, our actual results, performance or achievements will likely differ from the anticipated results, performance or achievements that are expressed or implied by our forward-looking statements, and such differences might be significant and materially adverse to our shareholders. For a discussion of these and other risk factors in this Form 10-K, see “Item 1A: Risk Factors.” Please consider our forward-looking statements in light of those risks as you read this report.
4
|
|
Alaska Air Group, Inc. (Air Group, the Company, we or us) is a Delaware corporation incorporated in 1985 and we have two principal subsidiaries: Alaska Airlines, Inc. (Alaska) and Horizon Air Industries, Inc. (Horizon). Through these subsidiaries, we provide passenger air service to more than 23 million passengers per year to more than 90 destinations. We also provide freight and mail services, primarily to and within the state of Alaska and on the West Coast. Although Alaska and Horizon both operate as airlines, their business plans, competition, and economic risks differ substantially. Alaska is a major airline that operates an all-jet fleet with an average passenger trip length in
2010
of 1,232 miles. Horizon is a regional airline, operates turboprop and jet aircraft, and its average passenger trip length in
2010
was 359 miles. Individual financial information about Alaska and Horizon is in Note 12 to the consolidated financial statements and throughout this report, specifically in “Management’s Discussion and Analysis of Financial Condition and Results of Operations.”
Both of our airlines continue to distinguish themselves from competitors by providing award-winning customer service and differentiating amenities. Our outstanding employees and excellent service in the form of advance seat assignments, expedited check-in with Airport of the Future®, web check-in, flight alerts, an award-winning frequent flyer program, well-maintained aircraft, a first-class section aboard Alaska aircraft, and other amenities are regularly recognized by independent studies, awards, and surveys of air travelers. For example, Alaska has ranked “Highest in Customer Satisfaction among Traditional Network Carriers” in 2010, 2009 and 2008 by J.D. Power and Associates, was named "Top-Performing Airline" in 2010 by Aviation Week Magazine, was recognized for having the "Best Loyalty Credit Card" in North America in 2010 at the Frequent Traveler Awards, and won the “Program of the Year” Freddie award for 2008 and 2007 for our Mileage Plan program. We are very proud of these awards and we continue to strive to offer the best customer service in the industry.
|
ALASKA RANKED “HIGHEST IN CUSTOMER SATISFACTION AMONG TRADITIONAL NETWORK CARRIERS” IN 2010, 2009 AND 2008 BY J.D. POWER AND ASSOCIATES.
|
WHERE YOU CAN FIND MORE INFORMATION
Our filings with the Securities and Exchange Commission, including our annual report on Form 10-K, quarterly reports on Form 10-Q, current reports on Form 8-K and amendments to those reports are available on our website at
www.alaskaair.com,
free of charge, as soon as reasonably practicable after the electronic filing of these reports with the Securities and Exchange Commission. The information contained on our website is not a part of this annual report on Form 10-K.
OUR AIRLINES
ALASKA
Alaska Airlines is an Alaska corporation that was organized in 1932 and incorporated in 1937. We offer extensive north/south service within the western U.S., Canada and Mexico, and passenger and dedicated cargo services to and within the state of Alaska. We also provide long-haul east/west service to Hawaii and thirteen cities in the mid-continental and eastern U.S., primarily from Seattle, where we have our largest concentration of departures; although we do offer long-haul departures from other cities as well.
In
2010
, we carried over 16.5 million revenue passengers in our mainline operations, and we carry more passengers between Alaska and the U.S. mainland than any other airline. Based on the number of passengers carried in
2010
, Alaska’s leading airports are Seattle, Los Angeles, Anchorage and Portland. Based on
2010
revenues, the leading nonstop routes are Seattle-Anchorage, Seattle-Los Angeles, and Seattle-Las Vegas. At
December 31, 2010
, Alaska’s operating fleet consisted of 114 jet aircraft, compared to 115 aircraft as of
December 31, 2009
.
5
Alaska’s passenger traffic by market is presented below:
|
|
2010
|
2009
|
|||
|
West Coast
|
33
|
%
|
36
|
%
|
|
|
Within Alaska and between Alaska and the U.S. mainland
|
19
|
%
|
21
|
%
|
|
|
Transcon/midcon
|
24
|
%
|
23
|
%
|
|
|
Hawaii
|
14
|
%
|
9
|
%
|
|
|
Mexico
|
8
|
%
|
9
|
%
|
|
|
Canada
|
2
|
%
|
2
|
%
|
|
|
Total
|
100
|
%
|
100
|
%
|
|
HORIZON
Horizon Air Industries is a Washington corporation that first began service and was incorporated in 1981. Horizon was acquired by Air Group in 1986. It is the largest regional airline in the Pacific Northwest and serves a number of cities in six states, five destinations in Canada, and two destinations in Mexico.
In
2010
, Horizon carried over 6.8 million revenue passengers. Approximately 91% of Horizon’s revenue passenger miles in
2010
were flown domestically, primarily in the states of Washington, Oregon, Idaho and California, compared to 90% in
2009
. The Canada markets accounted for 8% of revenue passenger miles in both
2010
and
2009
. Flying to Mexico accounted for about 1% of total traffic in
2010
compared to about 2% in
2009
.
Based on
2010
passenger enplanements, Horizon’s leading airports are Seattle, Portland, Spokane, and Boise. Based on revenues in
2010
, the leading nonstop routes are Portland-Seattle, Spokane-Seattle, and Portland-San Francisco. At
December 31, 2010
, Horizon’s operating fleet consisted of 13 jets and 41 turboprop aircraft. Horizon flights are listed under Alaska's designator code in airline reservation systems.
Alaska and Horizon integrate their flight schedules to provide convenient, competitive connections between most points served by their systems. In
2010
and
2009
, approximately 29% and 22%, respectively, of Horizon’s passengers connected to flights operated by Alaska. Beginning January 1, 2011, Horizon will operate 100% of its flights under a capacity purchase arrangement with Alaska, whereby Alaska will pay Horizon an agreed-upon rate based on the operated capacity.
INDUSTRY CONDITIONS
GENERAL
The airline industry is highly competitive and has historically been characterized by low profit margins and high fixed costs, primarily for wages, aircraft fuel, aircraft ownership, and facilities rents. Because expenses of a flight do not vary significantly with the number of passengers carried, a relatively small change in the number of passengers or in pricing has a disproportionate effect on an airline’s operating and financial results. In other words, a minor shortfall in expected revenue levels could cause a disproportionately negative impact on our results of operations. Passenger demand and ticket prices are, to a large measure, influenced by the general state of the economy, current global economic and political events and total available airline seat capacity.
2010
2010 was a banner year in the industry in many respects. Many in the industry, including us, reported record earnings and passenger load factors. The year was characterized by industry capacity discipline with an increase in passenger traffic. This allowed for better pricing performance and stronger earnings. In order to maximize revenue, airlines continued to add or increase ancillary fees for checked baggage, buy-on-board items, ticket fees, etc. These fees have significantly helped lift the industry out of its downturn and into the current recovery. One significant area of concern, however, is the rising cost of fuel toward the latter half of the year and into the first part of 2011.
During 2010, our key initiative was to optimize revenue. We continued to redeploy capacity to better match demand, and the new markets we have entered are performing well. Our revenue initiatives, combined with lower non-fuel unit costs, our continued focus on customer service and our strong operational performance resulted in record financial results that again were among the best in the industry.
6
|
OUR REVENUE INITIATIVES, COMBINED WITH LOWER NON-FUEL UNIT COSTS, OUR CONTINUED FOCUS ON CUSTOMER SERVICE AND OUR STRONG OPERATIONAL PERFORMANCE RESULTED IN 2010 RECORD FINANCIAL RESULTS THAT WERE AGAIN AMONG THE BEST IN THE INDUSTRY.
|
FUEL
Our business and financial results are highly affected by the price and, potentially, the availability of jet fuel. Fuel prices have been extremely volatile over the past few years. The price of crude oil spiked in 2008 with a high of nearly $150 per barrel in July 2008 and dropped significantly to an average of $62 per barrel in 2009. We saw upward pressure on fuel prices again in 2010 with an average crude oil price of just over $80 per barrel and currently over $85. For us, a $1 per barrel increase in the price of oil equates to approximately $9 million of additional fuel cost annually. Said another way, a one-cent change in our fuel price per gallon will impact our expected annual fuel cost by approximately $4 million per year.
We refer to the price we pay for fuel at the airport, including applicable taxes, as our “raw” fuel price. Raw fuel prices are impacted by world oil prices and refining costs, which can vary by region in the U.S. Generally, West Coast jet fuel prices are somewhat higher and more volatile than prices in the Gulf Coast or on the East Coast, putting our airlines at a slight competitive disadvantage. Historically, fuel costs have generally represented 10% to 15% of an airline’s operating costs, but due to volatility in prices over the past few years, fuel costs have been in the range of 20% to 40% of total operating costs. Both the crude oil and refining cost components of jet fuel are volatile and outside of our control, and they can have a significant and immediate impact on our operating results.
Our average raw fuel cost per gallon increased 27% in
2010
, declined 43% in
2009
, and increased 42% in
2008
.
We use crude oil call options and jet fuel refining margin swap contracts as hedges to decrease our exposure to the volatility of jet fuel prices. Call options effectively cap our pricing on the crude oil component of fuel prices, limiting our exposure to increasing fuel prices for about half of our planned fuel consumption. With these call option contracts, we still benefit from the decline in crude oil prices, as there is no future cash exposure above the premiums we pay to enter into the contracts.
|
OUR AIRCRAFT ARE AMONG THE MOST FUEL-EFFICIENT IN THEIR RESPECTIVE CLASSES.
|
We believe that operating fuel-efficient aircraft is the best hedge against high fuel prices. Alaska operates an all-Boeing 737 fleet. Horizon is currently undergoing a transition to an all-Q400 turboprop fleet, with expected completion in 2011. Because of these changes, Alaska’s fuel burn expressed in available seat miles flown per gallon (ASMs/g) improved from 65.9 ASMs/g in 2006 to 76.5 ASMs/g in
2010
. Similarly, Horizon’s fuel burn has improved from 51.7 ASMs/g in 2006 to 56.1 ASMs/g in
2010
.
These reductions have not only reduced our fuel cost, but also the amount of greenhouse gases and other pollutants that our operations emit.
MARKETING AND COMPETITION
ALLIANCES WITH OTHER AIRLINES
We have marketing alliances with a number of airlines that provide reciprocal frequent flyer mileage credit and redemption privileges as well as code sharing on certain flights as shown in the table below. Alliances are an important part of our strategy and enhance our revenues by:
|
•
|
offering our customers more travel destinations and better mileage credit/redemption opportunities;
|
|
•
|
giving our Mileage Plan program a competitive advantage because of our partnership with carriers from two major global alliances (Oneworld and Skyteam);
|
|
•
|
giving us access to more connecting traffic from other airlines; and
|
|
•
|
providing members of our alliance partners’ frequent flyer programs an opportunity to travel on Alaska and Horizon while earning mileage credit in our partners’ programs.
|
Most of our codeshare relationships are free-sell codeshares, where the marketing carrier sells seats on the operating carrier’s flights from the operating carrier’s inventory, but takes no inventory risk. Our marketing agreements have various termination
7
dates, and at any time, one or more may be in the process of renegotiation.
Our marketing alliances with other airlines as of
December 31, 2010
are as follows:
|
|
Frequent
Flyer
Agreement
|
Codeshare—
Alaska
Flight #
on Flights
Operated by
Other Airline
|
Codeshare—
Other Airline
Flight # On
Flights
Operated by
Alaska/
Horizon
|
|||
|
Major U.S. or International Airlines
|
||||||
|
American Airlines/American Eagle
|
Yes
|
Yes
|
Yes
|
|||
|
Air France
|
Yes
|
No
|
Yes
|
|||
|
British Airways
|
Yes
|
No
|
No
|
|||
|
Cathay Pacific Airways
|
Yes
|
No
|
Yes
|
|||
|
Delta Air Lines/DeltaConnection (1)
|
Yes
|
Yes
|
Yes
|
|||
|
Icelandair
|
Yes
|
No
|
Yes
|
|||
|
KLM
|
Yes
|
No
|
Yes
|
|||
|
Korean Air
|
Yes
|
No
|
Yes
|
|||
|
Lan S.A.
|
Yes
|
No
|
Yes
|
|||
|
Air Pacific (2)
|
Yes
|
No
|
Yes
|
|||
|
Qantas
|
Yes
|
No
|
Yes
|
|||
|
Regional Airlines
|
|
|
|
|||
|
Era Alaska (2)
|
Yes
|
Yes
|
No
|
|||
|
PenAir (2)
|
Yes
|
Yes
|
No
|
|||
|
Kenmore Air (2)
|
Yes
|
No
|
No
|
|
(1)
|
Alaska has codeshare agreements with the Delta Connection carriers Skywest, ASA, Pinnacle, Mesaba, Comair and Compass as part of its agreement with Delta.
|
|
(2)
|
These airlines do not have their own frequent flyer program. However, Alaska’s Mileage Plan members can earn and redeem miles on these airlines’ route systems.
|
COMPETITION
Competition in the airline industry is intense. We believe the principal competitive factors in the industry that are important to customers are:
|
•
|
safety record and reputation,
|
|
•
|
fares,
|
|
•
|
flight schedules,
|
|
•
|
customer service,
|
|
•
|
routes served,
|
|
•
|
frequent flyer programs,
|
|
•
|
on-time arrivals,
|
|
•
|
baggage handling,
|
|
•
|
on-board amenities,
|
|
•
|
type of aircraft, and
|
8
|
•
|
code-sharing relationships.
|
Together, Alaska and Horizon carry approximately 3.7% of all U.S. domestic passenger traffic. We compete with one or more domestic or foreign airlines on most of our routes, including Southwest Airlines, United Airlines, Delta Air Lines, American Airlines, US Airways, jetBlue Airways, Virgin America, Allegiant and regional affiliates associated with some of these carriers.
Due to its short-haul markets, Horizon also competes with ground transportation in many markets, including train, bus and automobile transportation. Both carriers, to some extent, also compete with technology such as video conferencing and internet-based meeting tools that have changed the need or frequency of face-to-face business meetings.
TICKET DISTRIBUTION
Airline tickets are distributed through three primary channels:
|
•
|
Alaskaair.com:
It is less expensive for us to sell through this direct channel and, as a result, we continue to take steps to drive more business to our website. In addition, we believe this channel is preferable from a branding and customer-relationship standpoint in that we can establish ongoing communication with the customer and tailor offers accordingly.
|
|
•
|
Traditional and online travel agencies:
Both traditional and online travel agencies typically use Global Distribution Systems (GDS), such as Sabre, to obtain their fare and inventory data from airlines. Bookings made through these agencies result in a fee that is charged to the airline. Many of our large corporate customers require us to use these agencies. Some of our competitors do not use this distribution channel and, as a result, have lower ticket distribution costs.
|
|
•
|
Reservation call centers:
These call centers are located in Phoenix, AZ, Kent, WA, and Boise, ID. We generally charge a $15 fee for booking reservations through these call centers.
|
Our sales by channel are as follows:
|
|
2010
|
2009
|
|||
|
Alaskaair.com
|
48
|
%
|
48
|
%
|
|
|
Traditional and online travel agencies
|
43
|
%
|
42
|
%
|
|
|
Reservation call centers
|
8
|
%
|
9
|
%
|
|
|
All other channels
|
1
|
%
|
1
|
%
|
|
|
Total
|
100
|
%
|
100
|
%
|
|
EMPLOYEES
Labor costs have historically made up 30% to 40% of an airline’s total operating costs. Most major airlines, including ours, have employee groups that are covered by collective bargaining agreements. Airlines with unionized work forces have higher labor costs than carriers without unionized work forces, and they may not have the ability to adjust labor costs downward quickly enough to respond to new competition. New entrants into the U.S. airline industry generally do not have unionized work forces, which can be a competitive advantage for those airlines.
We had 12,039 (9,013 at Alaska and 3,026 at Horizon) active full-time and part-time employees at
December 31, 2010
, compared to 12,440 (9,046 at Alaska and 3,394 at Horizon) at
December 31, 2009
. Wages, salaries and benefits (including variable incentive pay) represented approximately 43% of our total non-fuel operating expenses in both
2010
and
2009
.
At
December 31, 2010
, labor unions represented 82% of Alaska’s and 47% of Horizon’s employees. Our relations with our U.S. labor organizations are governed by the Railway Labor Act (RLA). Under this act, collective bargaining agreements do not expire but instead become amendable as of a stated date. If either party wishes to modify the terms of any such agreement, it must notify the other party in the manner prescribed by the RLA and/or described in the agreement. After receipt of such notice, the parties must meet for direct negotiations, and if no agreement is reached, either party may request the National Mediation Board (NMB) to initiate a process including mediation, arbitration, and a potential “cooling off” period that must be followed before either party may engage in self-help.
9
Alaska’s union contracts at
December 31, 2010
were as follows:
|
Union
|
Employee Group
|
Number of
Active Employees
|
Contract Status
|
||||
|
Air Line Pilots Association International (ALPA)
|
Pilots
|
1,286
|
|
Amendable 4/1/2013
|
|||
|
Association of Flight Attendants (AFA)
|
Flight attendants
|
2,397
|
|
Amendable 4/27/2012
|
|||
|
International Association of Machinists and Aerospace Workers (IAM)
|
Ramp service and stock clerks
|
674
|
|
Amendable 7/17/2012
|
|||
|
IAM
|
Clerical, office and passenger service
|
2,302
|
|
Amendable 1/1/2014
|
|||
|
Aircraft Mechanics FraternalAssociation (AMFA)
|
Mechanics, inspectors and cleaners
|
623
|
|
Amendable 10/17/2011
|
|||
|
Mexico Workers Association of Air Transport
|
Mexico airport personnel
|
81
|
|
Amendable 12/28/2011
|
|||
|
Transport Workers Union of America (TWU)
|
Dispatchers
|
36
|
|
In Negotiations
|
|||
Horizon’s union contracts at
December 31, 2010
were as follows:
|
Union
|
Employee Group
|
Number of
Active Employees
|
Contract Status
|
||||
|
International Brotherhood of Teamsters (IBT)
|
Pilots
|
536
|
|
Amendable 12/14/2015
|
|||
|
AFA
|
Flight attendants
|
493
|
|
Amendable 12/21/2011
|
|||
|
IBT
|
Mechanics and related classifications
|
320
|
|
Amendable 12/16/2014
|
|||
|
TWU
|
Dispatchers
|
14
|
|
Amendable 8/26/2014
|
|||
|
National Automobile, Aerospace, Transportation and General Workers
|
Station personnel in Vancouver and Victoria, BC, Canada
|
53
|
|
Expires 2/13/2013
|
|||
EXECUTIVE OFFICERS
The executive officers of Alaska Air Group, Inc. and executive officers of Alaska and Horizon who have significant decision-making responsibilities, their positions and their respective ages (as of February 1, 2011) are as follows:
|
Name
|
Position
|
Age
|
Air Group
or Subsidiary
Officer Since
|
||||
|
William S. Ayer
|
Chairman, President and Chief Executive Officer of Alaska Air Group, Inc., Chairman and Chief Executive Officer of Alaska Airlines, Inc. and Chairman and Chief Executive Officer of Horizon Air Industries, Inc.
|
56
|
|
1985
|
|||
|
Brandon S. Pedersen
|
Vice President/Finance and Chief Financial Officer of Alaska Air Group, Inc. and Alaska Airlines, Inc.
|
44
|
|
2003
|
|||
|
Keith Loveless
|
Vice President/Legal and Corporate Affairs, General Counsel and Corporate Secretary of Alaska Air Group, Inc. and Alaska Airlines, Inc.
|
54
|
|
1996
|
|||
|
Bradley D. Tilden
|
President of Alaska Airlines, Inc.
|
50
|
|
1994
|
|||
|
Glenn S. Johnson
|
President of Horizon Air Industries, Inc.
|
52
|
|
1991
|
|||
|
Benito Minicucci
|
Executive Vice President/Operations and Chief Operating Officer of Alaska Airlines, Inc.
|
44
|
|
2004
|
|||
|
Kelley Dobbs
|
Vice President/Human Resources and Labor Relations of Alaska Airlines, Inc.
|
44
|
|
2004
|
|||
Mr. Ayer
has been Air Group's President since February 2003 and became Chairman and Chief Executive Officer in May 2003. He has also served as Alaska Airlines’ Chairman since February 2003, as Chief Executive Officer since January 2002 and was President from November 1997 to December 2008. He has served as Horizon Air Industries' Chairman and Chief Executive Officer since June 2010. Prior to that, he was Sr. Vice President/Customer Service, Marketing and Planning of Alaska Airlines from January 1997, and Vice President/Marketing and Planning from August 1995. Prior thereto, he served as Sr. Vice President/Operations of Horizon Air Industries from January 1995. Mr. Ayer serves on the boards of Alaska Airlines, Puget
10
Energy, Inc., the Alaska Airlines Foundation, Angel Flight West, Inc., and the Museum of Flight. He also serves on the University of Washington Business School Advisory Board, and as a director of the Seattle branch of the Federal Reserve Board.
Mr. Pedersen
joined Alaska Airlines in 2003 as Staff Vice President/Finance and Controller of Alaska Air Group and Alaska Airlines and was elected Vice President/Finance and Controller for both entities in 2006. He was elected Vice President/Finance and Chief Financial Officer of Alaska Air Group and Alaska Airlines in June 2010. He is a member of Air Group's Management Executive Committee.
Mr. Loveless
became Corporate Secretary and Assistant General Counsel of Alaska Air Group and Alaska Airlines in 1996. In 1999, he was named Vice President/Legal and Corporate Affairs, General Counsel and Corporate Secretary of Alaska Air Group and Alaska Airlines. He is a member of Air Group’s Management Executive Committee.
Mr. Tilden
joined Alaska Airlines in 1991, became Controller of Alaska Air Group and Alaska Airlines in 1994, Chief Financial Officer in February 2000, Executive Vice President/Finance in January 2002, Executive Vice President/Finance and Planning in 2007, and President of Alaska Airlines in December 2008. He is a member of Air Group’s Management Executive Committee and was elected to the Air Group board in late 2010.
Mr. Johnson
joined Alaska Airlines in 1982, became Vice President/Controller and Treasurer of Horizon Air Industries in 1991 and Vice President/Customer Services in 2002. He returned to Alaska Airlines in 2003 where he has served in several roles, including Vice President/Finance and Controller and Vice President/Finance and Treasurer. He served as Senior Vice President/Customer Service – Airports from January 2006 through April 2007 and in April 2007, he was elected Executive Vice President/Airports and Maintenance and Engineering. He was elected Executive Vice President/Finance and Chief Financial Officer of Alaska Air Group and Alaska Airlines in December 2008. He was elected President of Horizon Air Industries in June 2010. He is a member of Air Group’s Management Executive Committee.
Mr. Minicucci
joined Alaska Airlines in 2004 as Staff Vice President of Maintenance and Engineering and was promoted to Vice President of Seattle Operations in June 2008. In December 2008 he was elected Executive Vice President/Operations and Chief Operating Officer of Alaska Airlines. He is a member of Air Group’s Management Executive Committee.
Ms. Dobbs
joined Alaska Airlines in 1987, became Staff Vice President/Human Resources – Staffing and Development in 2004, Vice President/Human Resources – Strategy, Culture and Inclusion in June 2007, and Vice President/Human Resources and Labor Relations in 2009. She is a member of Air Group’s Management Executive Committee.
REGULATION
GENERAL
The airline industry is highly regulated.
The Department of Transportation (DOT), the Federal Aviation Administration (FAA) and the Transportation Security Administration (TSA) exercise significant regulatory authority over air carriers.
|
•
|
DOT:
In order to provide passenger and cargo air transportation in the U.S., a domestic airline is required to hold a certificate of public convenience and necessity issued by the DOT. Subject to certain individual airport capacity, noise and other restrictions, this certificate permits an air carrier to operate between any two points in the U.S. Certificates do not expire, but may be revoked for failure to comply with federal aviation statutes, regulations, orders or the terms of the certificates. In addition, the DOT has jurisdiction over the approval of international codeshare agreements, alliance agreements between domestic major airlines, international route authorities and certain consumer protection matters, such as advertising, denied boarding compensation and baggage liability. International treaties may also contain restrictions or requirements for flying outside of the U.S.
|
|
•
|
FAA:
The FAA, through Federal Aviation Regulations (FARs), generally regulates all aspects of airline operations, including establishing personnel, maintenance and flight operation standards. Domestic airlines are required to hold a valid air carrier operating certificate issued by the FAA. Pursuant to these regulations we have established, and the FAA has approved, our operations specifications and a maintenance program for each type of aircraft we operate. The maintenance program provides for the ongoing maintenance of such aircraft, ranging from frequent routine inspections to major overhauls. From time to time the FAA issues airworthiness directives (ADs) that must be incorporated into our aircraft maintenance program and operations. All airlines are subject to enforcement actions that are brought by the FAA
|
11
from time to time for alleged violations of FARs or ADs. At this time, we are not aware of any enforcement proceedings that could either materially affect our financial position or impact our authority to operate.
|
•
|
TSA:
Airlines serving the U.S. must hold a TSA-approved Aircraft Operator Standard Security Program (AOSSP), and comply with TSA Security Directives (SDs) and regulations. Airlines are subject to enforcement actions that are brought by the TSA from time to time for alleged violations of the AOSSP, SDs or security regulations. We are not aware of any enforcement proceedings that could either materially affect our financial position or impact our authority to operate. We are also required to collect a September 11 Security Fee of $2.50 per enplanement from passengers and remit that sum to the government to fund aviation security measures. Carriers also pay the TSA a security infrastructure fee to cover passenger and property screening costs. These security infrastructure fees amounted to $12.6 million each year in 2010, 2009 and 2008.
|
The Department of Justice and DOT have jurisdiction over airline antitrust matters. The U.S. Postal Service has jurisdiction over certain aspects of the transportation of mail and related services. Labor relations in the air transportation industry are regulated under the Railway Labor Act. To the extent we continue to fly to foreign countries and pursue alliances with international carriers, we may be subject to certain regulations of foreign agencies.
AIRLINE FARES
Airlines are permitted to establish their own domestic fares without governmental regulation, and the industry is characterized by vigorous price competition. The DOT maintains authority over international (generally outside of North America) fares, rates and charges. International fares and rates are also subject to the jurisdiction of the governments of the foreign countries we serve. Although air carriers are required to file and adhere to international fare and rate tariffs, substantial commissions, overrides and discounts given to travel agents, brokers and wholesalers characterize many international markets.
ENVIRONMENTAL MATTERS
We are subject to various laws and government regulations concerning environmental matters and employee safety and health in the U.S. and other countries. U.S. federal laws that have a particular effect on us include the Airport Noise and Capacity Act of 1990, the Clean Air Act, the Resource Conservation and Recovery Act, the Clean Water Act, the Safe Drinking Water Act, and the Comprehensive Environmental Response, Compensation and Liability Act, or Superfund Act. We are also subject to the oversight of the Occupational Safety and Health Administration (OSHA) concerning employee safety and health matters. The U.S. Environmental Protection Agency, OSHA, and other federal agencies have been authorized to create and enforce regulations that have an impact on our operations. In addition to these federal activities, various states have been delegated certain authorities under these federal statutes. Many state and local governments have adopted environmental and employee safety and health laws and regulations. We maintain our safety, health and environmental programs in order to meet or exceed these requirements.
It is expected that there will be legislation in the future to reduce carbon and other greenhouse gas emissions. Alaska and Horizon have transitioned or are transitioning to more fuel-efficient aircraft fleets, thereby greatly reducing our total emissions.
The Airport Noise and Capacity Act recognizes the rights of airport operators with noise problems to implement local noise abatement programs so long as they do not interfere unreasonably with interstate or foreign commerce or the national air transportation system. Authorities in several cities have established aircraft noise reduction programs, including the imposition of nighttime curfews. We believe we have sufficient scheduling flexibility to accommodate local noise restrictions.
Although we do not currently anticipate that these regulatory matters, individually or collectively, will have a material effect on our financial condition, results of operations or cash flows, new regulations or compliance issues that we do not currently anticipate could have the potential to harm our financial condition, results of operations or cash flows in future periods.
CUSTOMER SERVICE
Along with other domestic airlines, we have implemented a customer service commitment plan to address a number of service goals and regulatory requirements, including, but not limited to, goals relating to lowest fare availability, delays, cancellations and diversions, baggage delivery and liability, guaranteed fares and ticket refunds. As a testament to our service, Alaska has won the JD Power and Associates award for "Highest in Customer Satisfaction Among Traditional Network Carriers" for the past three years.
In December 2009, the DOT adopted new rules effective in April 2010 that set fines of as much as $27,500 per violation when
12
airlines leave passengers on the aircraft for more than three hours while on the ground or violate other rules aimed at consumer protection. These new rules are in response to recent incidents involving other airlines that resulted in lengthy tarmac delays. Bills have been introduced in several states, including the state of Washington, which propose to regulate airlines when operating in those specific states. However, we believe these bills would be preempted by federal law.
MILEAGE PLAN PROGRAM
All major airlines have developed frequent flyer programs as a way of increasing passenger loyalty. Alaska’s Mileage Plan allows members to earn mileage by flying on Alaska, Horizon and other participating airlines and by using the services of non-airline partners, which include a credit card partner, a telephone company, hotels, car rental agencies, and other businesses. Alaska is paid by non-airline partners for the miles it credits to member accounts. With advance notice, Alaska has the ability to change the Mileage Plan terms, conditions, partners, mileage credits, and award levels or to terminate the program.
Mileage can be redeemed for free or discounted travel and for various other awards. Mileage Plan accounts are generally deleted after two years of inactivity in a member’s account. Over 88% of the free flight awards on Alaska and Horizon in
2010
were subject to capacity-controlled seating.
As of
December 31, 2010
and
2009
, approximately 2.9 million and 3.0 million, respectively, round-trip flight awards were eligible for redemption by Mileage Plan members. Of those eligible awards, we estimate that approximately 88% will ultimately be redeemed. For the years
2010
,
2009
and
2008
, approximately 1,666,000, 1,451,000 and 527,000 one-way flight awards were redeemed and flown on Alaska and Horizon. In addition, approximately 566,000 round-trip awards were redeemed and flown on Alaska and Horizon in 2008. These awards represent approximately 9%, 8%, and 9% for
2010
,
2009
, and
2008
, respectively, of the total passenger miles flown on Alaska and Horizon. For the years
2010
,
2009
, and
2008
, approximately 167,000, 181,000, and 214,000, respectively, round-trip flight awards were redeemed and flown on airline partners. In November 2008, we began charging a $25 administrative fee for awards redeemed on our airline partners.
We also have awards that allow members to redeem miles to purchase a ticket at a discounted fare. Our members redeemed approximately 430,000, 730,000, and 620,000 one-way equivalent awards under this program in
2010
,
2009
, and
2008
, respectively.
We sell mileage credits to our non-airline partners, the vast majority of which are sold to our affinity credit card bank partner. We defer a majority of the sales proceeds and recognize revenue when award transportation is provided.
OTHER INFORMATION
SEASONALITY AND OTHER FACTORS
Our results of operations for any interim period are not necessarily indicative of those for the entire year because our business is subject to seasonal fluctuations. Our profitability is generally lowest during the first and fourth quarters due principally to lower traffic. It typically increases in the second quarter and then reaches its highest level during the third quarter as a result of vacation travel, including increased activity in the state of Alaska. However, we have taken steps over the past few years to reduce the seasonality of our operations by adding flights to leisure destinations in Hawaii and Mexico.
In addition to passenger loads, factors that could cause our quarterly operating results to vary include:
|
•
|
general economic conditions and resulting changes in passenger demand,
|
• pricing initiatives by us and our competitors,
|
•
|
changes in fuel costs,
|
|
•
|
the timing and amount of maintenance expenditures (both planned and unplanned),
|
|
•
|
increases or decreases in passenger and volume-driven variable costs, and
|
|
•
|
labor actions.
|
In addition to those factors listed above, seasonal variations in traffic, the timing of various expenditures and adverse weather conditions may affect our operating results from quarter to quarter. Many of the markets we serve experience inclement
13
weather conditions in the winter, causing increased costs associated with deicing aircraft, canceled flights and reaccommodation of displaced passengers. Due to our geographic area of operations, we can be more susceptible to adverse weather conditions (particularly in the state of Alaska and the Pacific Northwest) than some of our competitors, who may be better able to spread weather-related risks over larger route systems.
No material part of our business or that of our subsidiaries is dependent upon a single customer, or upon a few high-volume customers.
INSURANCE
We carry Airline Hull, Spares and Comprehensive Legal Liability Insurance in amounts and of the type generally consistent with industry practice to cover damage to aircraft, spare parts and spare engines, as well as bodily injury and property damage to passengers and third parties. Since the September 11, 2001 attacks, this insurance program excludes coverage for War and Allied Perils, including hijacking, terrorism, malicious acts, strikes, riots, civil commotion and other identified perils. So, like other airlines, the company has purchased war risk coverage for such events through the U.S. government.
We believe that our emphasis on safety and our state-of-the-art flight deck safety technology help to control the cost of aviation insurance.
|
|
If any of the following occurs, our business, financial condition and results of operations could suffer. In such case, the trading price of our common stock could also decline. We operate in a continually changing business environment. In this environment, new risks may emerge and already identified risks may vary significantly in terms of impact and likelihood of occurrence. Management cannot predict such developments, nor can it assess the impact, if any, on our business of such new risk factors or of events described in any forward-looking statements.
We have adopted an enterprise Risk Analysis and Oversight Program designed to identify the various risks faced by the organization, assign responsibility for managing those risks to individual executives within management ranks as well as align these risks with appropriate board level oversight. These enterprise level identified risks have been aligned to the risk factors discussed below.
SAFETY, COMPLIANCE AND OPERATIONAL EXCELLENCE
Our reputation and financial results could be harmed in the event of an airline accident or incident.
An accident or incident involving one of our aircraft could involve a significant loss of life and result in a loss of confidence in our airlines by the flying public. We could experience significant potential claims from injured passengers and surviving relatives, as well as costs for the repair or replacement of a damaged aircraft and its consequential temporary or permanent loss from service. We maintain liability insurance in amounts and of the type generally consistent with industry practice. However, the amount of such coverage may not be adequate to fully cover all claims and we may be forced to bear substantial losses from an accident. Substantial claims resulting from an accident in excess of our related insurance coverage would harm our business and financial results. Moreover, any aircraft accident or incident, even if fully insured and even if it does not involve one of our airlines, could cause a public perception that our airlines or the equipment they fly is less safe or reliable than other transportation alternatives, which would harm our business.
Changes in government regulation imposing additional requirements and restrictions on our operations or on the airports at which we operate could increase our operating costs and result in service delays and disruptions.
Airlines are subject to extensive regulatory and legal requirements, both domestically and internationally, that involve significant compliance costs. In the last several years, Congress has passed laws, and the U.S. DOT, the TSA and the FAA have issued regulations that have required significant expenditures relating to the maintenance and operation of airlines. Similarly, many aspects of an airline’s operations are subject to increasingly stringent federal, state and local laws protecting the environment.
Because of significantly higher security and other costs incurred by airports since September 11, 2001, many airports have increased their rates and charges to air carriers. Additional laws, regulations, taxes, and airport rates and charges have been proposed from time to time that could significantly increase the cost of airline operations or reduce the demand for air travel.
14
Although lawmakers may impose these additional fees and view them as “pass-through” costs, we believe that a higher total ticket price will influence consumer purchase and travel decisions and may result in an overall decline in passenger traffic, which would harm our business.
The airline industry continues to face potential security concerns and related costs.
The terrorist attacks of September 11, 2001 and their aftermath negatively affected the airline industry, including our company. Additional terrorist attacks, the fear of such attacks or other hostilities involving the U.S. could have a further significant negative effect on the airline industry, including us, and could:
|
•
|
significantly reduce passenger traffic and yields as a result of a potentially dramatic drop in demand for air travel;
|
|
•
|
significantly increase security and insurance costs;
|
|
•
|
make war risk or other insurance unavailable or extremely expensive;
|
|
•
|
increase fuel costs and the volatility of fuel prices;
|
|
•
|
increase costs from airport shutdowns, flight cancellations and delays resulting from security breaches and perceived safety threats; and
|
|
•
|
result in a grounding of commercial air traffic by the FAA.
|
The occurrence of any of these events would harm our business, financial condition and results of operations.
Our operations are often affected by factors beyond our control, including delays, cancellations, and other conditions, which could harm our financial condition and results of operations.
Like other airlines, our operations often are affected by delays, cancellations and other conditions caused by factors largely beyond our control.
Other conditions that might impact our operations include:
|
•
|
air traffic congestion at airports or other air traffic control problems;
|
|
•
|
adverse weather conditions;
|
|
•
|
increased security measures or breaches in security;
|
|
•
|
international or domestic conflicts or terrorist activity; and
|
|
•
|
other changes in business conditions.
|
Due to our geographic area of operations, we believe a large portion of our operation is more susceptible to adverse weather conditions than that of many of our competitors. A general reduction in airline passenger traffic as a result of any of the above-mentioned factors could harm our business, financial condition and results of operations.
STRATEGY
We depend on a few key markets to be successful.
Our strategy is to focus on serving a few key markets, including Seattle, Portland, Los Angeles and Anchorage. A significant portion of our flights occurs to and from our Seattle hub. In
2010
, passengers to and from Seattle accounted for 63% of our total passengers.
We believe that concentrating our service offerings in this way allows us to maximize our investment in personnel, aircraft, and ground facilities, as well as to gain greater advantage from sales and marketing efforts in those regions. As a result, we remain highly dependent on our key markets. Our business could be harmed by any circumstances causing a reduction in demand for air transportation in our key markets. An increase in competition in our key markets could also cause us to reduce fares or take
15
other competitive measures that could harm our business, financial condition and results of operations.
We rely on third-party vendors for certain critical activities.
We have historically relied on outside vendors for a variety of services and functions critical to our business, including airframe and engine maintenance, ground handling, fueling, computer reservation system hosting and software maintenance. As part of our cost-reduction efforts, our reliance on outside vendors has increased and may continue to do so in the future. In recent years, Alaska has subcontracted its heavy aircraft maintenance, fleet service, facilities maintenance, and ground handling services at certain airports, including Seattle-Tacoma International Airport, to outside vendors.
Our use of outside vendors increases our exposure to several risks. In the event that one or more vendors goes into bankruptcy, ceases operation or fails to perform as promised, replacement services may not be readily available at competitive rates, or at all. If one of our vendors fails to perform adequately we may experience increased costs, delays, maintenance issues, safety issues or negative public perception of our airline. Vendor bankruptcies, unionization, regulatory compliance issues or significant changes in the competitive marketplace among suppliers could adversely affect vendor services or force Alaska to renegotiate existing agreements on less favorable terms. These events could result in disruptions in Alaska’s operations or increases in its cost structure.
We are dependent on a limited number of suppliers for aircraft and parts.
Alaska is dependent on Boeing as its sole supplier for aircraft and many aircraft parts. Horizon is similarly dependent on Bombardier. Additionally, each carrier is dependent on sole suppliers for aircraft engines. As a result, we are more vulnerable to any problems associated with the supply of those aircraft and parts, including design defects, mechanical problems, contractual performance by the manufacturers, or adverse perception by the public that would result in customer avoidance or in actions by the FAA resulting in an inability to operate our aircraft.
We rely on partner airlines for codeshare and frequent flyer marketing arrangements.
Alaska and Horizon are parties to marketing agreements with a number of domestic and international air carriers, or “partners," including, but not limited to, American Airlines and Delta Air Lines. These agreements provide that certain flight segments operated by us are held out as partner “codeshare” flights and that certain partner flights are held out for sale as Alaska codeshare flights. In addition, the agreements generally provide that members of Alaska’s Mileage Plan program can earn miles on or redeem miles for partner flights and vice versa. We receive a significant amount of revenue from flights sold under codeshare arrangements. In addition, we believe that the frequent flyer arrangements are an important part of our Mileage Plan program. The loss of a significant partner or certain partner flights could have a negative effect on our revenues or the attractiveness of our Mileage Plan, which we believe is a source of competitive advantage.
FINANCIAL CONDITION AND FINANCIAL MARKETS
Our failure to successfully meet cost reduction goals could harm our business.
We continue to strive toward aggressive cost-reduction goals that are an important part of our business strategy of offering the best value to passengers through competitive fares while achieving acceptable profit margins and return on capital. If we are unable to reduce our non-fuel unit costs over the long-term and achieve sustained targeted return on invested capital, we will likely not be able to grow our business in the future and therefore our financial results may suffer.
Our business, financial condition, and results of operations are substantially exposed to the volatility of jet fuel prices. Increases in jet fuel costs would harm our business.
Fuel costs constitute a significant portion of our total operating expenses, accounting for 27% and 21% of total operating expenses for the years ended
December 31, 2010
and
2009
, respectively. Significant increases in average fuel costs during the past several years have negatively affected our results of operations.
Future increases in the price of jet fuel will harm our financial condition and results of operations, unless we are able to increase fares or add additional ancillary fees to attempt to recover increasing fuel costs.
Economic uncertainty or another recession would likely impact demand for our product and could harm our financial condition and results of operations.
16
The 2008 and 2009 economic recession resulted in a decline in demand for air travel. If a similar situation recurs, we will likely need to adjust our capacity plans, which could harm our business, financial condition and results of operations.
Our indebtedness and other fixed obligations could increase the volatility of earnings and otherwise restrict our activities and potentially lead to liquidity constraints.
Although we have reduced our long-term debt balance significantly over the past year, we have, and will continue to have for the foreseeable future, a significant amount of debt. Due to our high fixed costs, including aircraft lease commitments and debt service, a decrease in revenues results in a disproportionately greater decrease in earnings.
Our outstanding long-term debt and other fixed obligations could have important consequences. For example, they could:
|
•
|
limit our ability to obtain additional financing to fund our future capital expenditures, acquisitions, working capital or other purposes;
|
|
•
|
require us to dedicate a material portion of our operating cash flow to fund lease payments and interest payments on indebtedness, thereby reducing funds available for other purposes; and
|
|
•
|
limit our ability to withstand competitive pressures and reduce our flexibility in responding to changing business and economic conditions, including reacting to the current economic slowdown.
|
Although we have historically been able to generate sufficient cash flow from our operations to pay our debt and other fixed obligations as they become due, we cannot ensure we will be able to do so in the future. If we fail to do so, our business could be harmed.
Alaska is required to comply with specific financial covenants in certain agreements. We cannot be certain that Alaska will be able to comply with these covenants or provisions or that these requirements will not limit our ability to finance our future operations or capital needs.
See “Liquidity and Capital Resources” for more detailed information about our obligations and commitments.
Our continuing obligation to fund our traditional defined-benefit pension plans could negatively affect our ability to compete in the marketplace.
Our defined-benefit pension plan assets are subject to market risk. If market returns are poor in the future, any future obligation to make additional cash contributions in accordance with the Pension Protection Act of 2006 could increase and harm our liquidity. Poor market returns also lead to higher pension expense in our statement of operations. The calculation of pension expense is dependent on many assumptions that are more fully described in “Critical Accounting Estimates” and Note 1 to our consolidated financial statements.
Increases in insurance costs or reductions in insurance coverage would harm our business, financial condition and results of operations.
Aviation insurers could increase their premiums in the event of additional terrorist attacks, hijackings, airline accidents or other events adversely affecting the airline industry. Furthermore, the full hull and liability war risk insurance provided by the government is currently mandated through September 30, 2011. Although the government may again extend the deadline for providing such coverage, we cannot be certain that any extension will occur, or if it does, for how long the extension will last. It is expected that, should the government stop providing such coverage to the airline industry, the premiums charged by aviation insurers for this coverage will be substantially higher than the premiums currently charged by the government and the coverage will be much more limited, including smaller aggregate limits and shorter cancellation periods. Significant increases in insurance premiums would adversely affect our business, financial condition and results of operations.
INFORMATION TECHNOLOGY
We rely heavily on automated systems to operate our business, and a failure of these systems or by their operators could harm our business.
We depend on automated systems to operate our business, including our airline reservation system, our telecommunication systems, our website, our maintenance systems, our kiosk check-in terminals, and other systems. Substantially all of our tickets
17
are issued to passengers as electronic tickets and the majority of our customers check in using our website or our airport kiosks. We depend on our reservation system to be able to issue, track and accept these electronic tickets. In order for our operations to work efficiently, our website, reservation system, and check-in systems must be able to accommodate a high volume of traffic, maintain secure information, and deliver important flight information. Substantial or repeated website, reservations system or telecommunication systems failures could reduce the attractiveness of our services and cause our customers to purchase tickets from another airline. In addition, we rely on other automated systems for crew scheduling, flight dispatch, and other operational needs. Disruption in, changes to, or a breach of these systems could result in the loss of important data, an increase of our expenses and a possible temporary cessation of our operations.
If we do not maintain the privacy and security of customer-related information, we could damage our reputation, incur substantial additional costs and become subject to litigation.
We receive, retain, and transmit certain personal information about our customers. In addition, our online operations at alaskaair.com depend on the secure transmission of confidential information over public networks, including credit card information. A compromise of our security systems or those of other business partners that results in our customers’ personal information being obtained by unauthorized persons could adversely affect our reputation with our customers and others, as well as our operations, results of operations, financial position and liquidity, and could result in litigation against us or the imposition of penalties. In addition, a security breach could require that we expend significant additional resources related to the security of information systems and could result in a disruption of our operations, particularly our online sales operations.
Additionally, the use of individually identifiable data by our business and our business partners is regulated at the international, federal and state levels. Privacy and information security laws and regulations change, and compliance with them may result in cost increases due to necessary systems changes and the development of new administrative processes.
BRAND AND REPUTATION
The rebranding of the Horizon brand may result in some loss of brand recognition.
With this change in structure in 2011, the external Horizon brand will be phased out and the Horizon fleet will be rebranded with Alaska livery. As the Q400 fleet begins flying into new markets, such as in the state of Alaska, we may be subject to certain operational disruptions or subject to severe weather conditions that does not impact jet operation as heavily. Furthermore, with the Horizon brand phase out, there is a potential that we may lose some brand recognition from our customers in areas that Horizon has historically served.
LABOR RELATIONS AND LABOR STRATEGY
A significant increase in labor costs or change in key personnel could adversely affect our business and results of operations.
We compete against the major U.S. airlines and other businesses for labor in many highly skilled positions. If we are unable to hire, train and retain qualified employees at a reasonable cost, or if we lose the services of key personnel, we may be unable to grow or sustain our business. In such case, our operating results and business prospects could be harmed. We may also have difficulty replacing management or other key personnel who leave and, therefore, the loss of any of these individuals could harm our business.
Labor costs are a significant component of our total expenses, accounting for approximately 31% and 34% of our total operating expenses in
2010
and
2009
, respectively. As of
December 31, 2010
, labor unions represented approximately 82% of Alaska’s and 47% of Horizon’s employees. Each of our represented employee groups has a separate collective bargaining agreement, and could make demands that would increase our operating expenses and adversely affect our financial performance if we agree to them. Although we have been successful in negotiating new contracts or extending existing contracts with all of our represented groups in recent years, future uncertainty around open contracts could be a distraction to many employees, reduce employee engagement in our business and divert management’s attention from other projects and issues.
18
|
|
None
|
|
AIRCRAFT
The following tables describe the aircraft we operate and their average age at
December 31, 2010
:
|
Aircraft Type
|
Passenger
Capacity
|
Owned
|
Leased
|
Total
|
Average
Age in
Years
|
||||||||||
|
Alaska Airlines
|
|
|
|
|
|
||||||||||
|
Boeing:
|
|
|
|
|
|
|
|
|
|
|
|||||
|
737-400
|
144
|
|
3
|
|
21
|
|
24
|
|
15.0
|
|
|||||
|
737-400C*
|
72
|
|
5
|
|
—
|
|
5
|
|
18.3
|
|
|||||
|
737-400F*
|
—
|
|
1
|
|
—
|
|
1
|
|
11.8
|
|
|||||
|
737-700
|
124
|
|
17
|
|
—
|
|
17
|
|
10.5
|
|
|||||
|
737-800
|
157
|
|
45
|
|
10
|
|
55
|
|
3.1
|
|
|||||
|
737-900
|
172
|
|
12
|
|
—
|
|
12
|
|
8.4
|
|
|||||
|
Total
|
|
|
83
|
|
31
|
|
114
|
|
8.0
|
|
|||||
|
Horizon Air
|
|
|
|
|
|
|
|
|
|
|
|||||
|
Bombardier:
|
|
|
|
|
|
|
|
|
|
|
|||||
|
Q400
|
76
|
|
25
|
|
16
|
|
41
|
|
6.1
|
|
|||||
|
CRJ-700
|
70
|
|
2
|
|
11
|
|
13
|
|
8.0
|
|
|||||
|
Total
|
|
|
27
|
|
27
|
|
54
|
|
6.5
|
|
|||||
* C=Combination freighter/passenger; F=Freighter
Part II, Item 7, “Management’s Discussion and Analysis of Financial Condition and Results of Operations," discusses future orders and options for additional aircraft.
Most of our owned aircraft secure long-term debt arrangements or collateralize our revolving credit facility. See further discussion in “Liquidity and Capital Resources."
Alaska’s leased 737-400 and 737-800 aircraft have lease expiration dates between 2012 and 2016, and between 2015 and 2021, respectively. Horizon’s leased Q400 and CRJ-700 aircraft have expiration dates in 2018 and between 2018 and 2020, respectively. Horizon also has a Q400 aircraft on short-term lease which expires in May 2011. Horizon also has 16 leased Q200 aircraft and 3 leased CRJ-700 aircraft that are subleased to third-party carriers. Alaska and Horizon have the option to extend most of the leases for additional periods, or the right to purchase the aircraft at the end of the lease term, usually at the then-fair-market value of the aircraft.
Alaska completed its transition to an all-Boeing operating fleet during 2008. Horizon expects to complete its transition to an all-Q400 operating fleet by June of 2011. The remaining 13 CRJ-700 aircraft will be leased or sub-leased to a third-party carrier upon removal from the operating fleet.
19
The following table displays the currently anticipated fleet counts for Alaska and Horizon as of the end of each quarter in
2011
:
|
|
31-Mar-11
|
|
30-Jun-11
|
|
30-Sep-11
|
|
31-Dec-11
|
|
|||
|
Alaska Airlines
|
|
|
|
|
|||||||
|
737-400
|
24
|
|
24
|
|
24
|
|
24
|
|
|||
|
737-400C*
|
5
|
|
5
|
|
5
|
|
5
|
|
|||
|
737-400F*
|
1
|
|
1
|
|
1
|
|
1
|
|
|||
|
737-700
|
17
|
|
17
|
|
17
|
|
17
|
|
|||
|
737-800
|
58
|
|
58
|
|
58
|
|
58
|
|
|||
|
737-900
|
12
|
|
12
|
|
12
|
|
12
|
|
|||
|
Totals
|
117
|
|
117
|
|
117
|
|
117
|
|
|||
|
Horizon Air
|
|
|
|
|
|
|
|
|
|||
|
Q400
|
46
|
|
48
|
|
48
|
|
48
|
|
|||
|
CRJ-700
|
9
|
|
—
|
|
—
|
|
—
|
|
|||
|
Totals
|
55
|
|
48
|
|
48
|
|
48
|
|
|||
* C=Combination freighter/passenger; F=Freighter
In January 2011, Alaska announced an agreement with Boeing for 15 new B737 aircraft with deliveries in 2012 through 2014. See further discussion in "Aircraft Purchase Commitments" under "Contractual Obligations and Commitments".
GROUND FACILITIES AND SERVICES
Alaska and Horizon lease ticket counters, gates, cargo and baggage space, office space, and other support areas at the majority of the airports they serve. Alaska also owns terminal buildings in various cities in the state of Alaska.
Alaska has centralized operations in several buildings located at or near Seattle-Tacoma International Airport (Sea-Tac) near Seattle, WA. These include a five-bay hangar and shops complex (used primarily for line maintenance), a flight operations and training center, an air cargo facility, an information technology office and datacenter, an office building, and corporate headquarters complex. Alaska also leases a stores warehouse, and office space for a customer service and reservation facility in Kent, WA. Alaska’s major facilities outside of Seattle include a regional headquarters building, an air cargo facility and a hangar/office facility in Anchorage, AK, as well as leased reservations facilities in Phoenix, AZ. and Boise, ID. Alaska uses its own employees for ground handling services at most of our airports in the state of Alaska. At other airports throughout our system, those services are contracted to various third-party vendors.
Horizon owns its Seattle corporate headquarters building. It leases an operations, training, and aircraft maintenance facility in Portland as well as line maintenance stations in Boise, Spokane, Eugene, Los Angeles, Seattle, Redmond, and Medford.
|
|
We are a party to routine litigation matters incidental to our business. Management believes the ultimate disposition of these matters is not likely to materially affect our financial position or results of operations. This forward-looking statement is based on management’s current understanding of the relevant law and facts, and it is subject to various contingencies, including the potential costs and risks associated with litigation and the actions of judges and juries.
The Securities and Exchange Commission is conducting an inquiry into trading in the securities of Puget Energy Inc. ("PSE") by Donald Smith & Co., an investment firm. William Ayer, our Chief Executive Officer, serves on the board of PSE. Mr. Ayer and the Company are cooperating voluntarily in that inquiry. Mr. Ayer has stated that he never provided any non-public information about PSE to Donald Smith & Co.
|
|
None
20
|
|
As of
December 31, 2010
, there were 35,923,968 shares of common stock of Alaska Air Group, Inc. issued and outstanding and 3,235 shareholders of record. We also held 1,086,172 treasury shares at a cost of $46.0 million. We have not paid dividends on the common stock since 1992 and have no plans to do so in the immediate future. Our common stock is listed on the New York Stock Exchange (symbol: ALK).
The following table shows the trading range of Alaska Air Group, Inc. common stock on the New York Stock Exchange.
|
|
2010
|
2009
|
|||||||||||||
|
|
High
|
Low
|
High
|
Low
|
|||||||||||
|
First Quarter
|
$
|
42.59
|
|
$
|
31.24
|
|
$
|
30.95
|
|
$
|
13.61
|
|
|||
|
Second Quarter
|
54.13
|
|
37.03
|
|
22.08
|
|
14.53
|
|
|||||||
|
Third Quarter
|
54.66
|
|
42.00
|
|
27.99
|
|
17.93
|
|
|||||||
|
Fourth Quarter
|
59.59
|
|
44.86
|
|
36.48
|
|
24.91
|
|
|||||||
SALES OF NON-REGISTERED SECURITIES
None
PURCHASES OF EQUITY SECURITIES BY THE ISSUER AND AFFILIATED PURCHASERS
|
Total Number of
Shares Purchased
|
Average Price
Paid per Share
|
Total Number of Shares (or units) Purchased as Part of Publicly Announced Plans or Programs
|
Maximum remaining
dollar value of shares
that can be purchased
under the plan
|
||||||||||
|
October 1, 2010 – October 31, 2010 (1)
|
42,000
|
|
48.88
|
|
42,000
|
|
|||||||
|
November 1, 2010 – November 30, 2010 (1)
|
57,000
|
|
54.33
|
|
57,000
|
|
|||||||
|
December 1, 2010 – December 31, 2010 (1)
|
154,000
|
|
56.50
|
|
154,000
|
|
|||||||
|
Total
|
253,000
|
|
$
|
54.75
|
|
253,000
|
|
$
|
31,190,995
|
|
|||
(1) Purchased pursuant to a $50 million repurchase plan authorized by the Board of Directors in June 2010. The plan expires in June 2011.
21
PERFORMANCE GRAPH
The following graph compares our cumulative total stockholder return since December 31, 2005 with the S&P 500 Index and the Dow Jones U.S. Airlines Index. The graph assumes that the value of the investment in our common stock and each index (including reinvestment of dividends) was $100 on December 31, 2005.
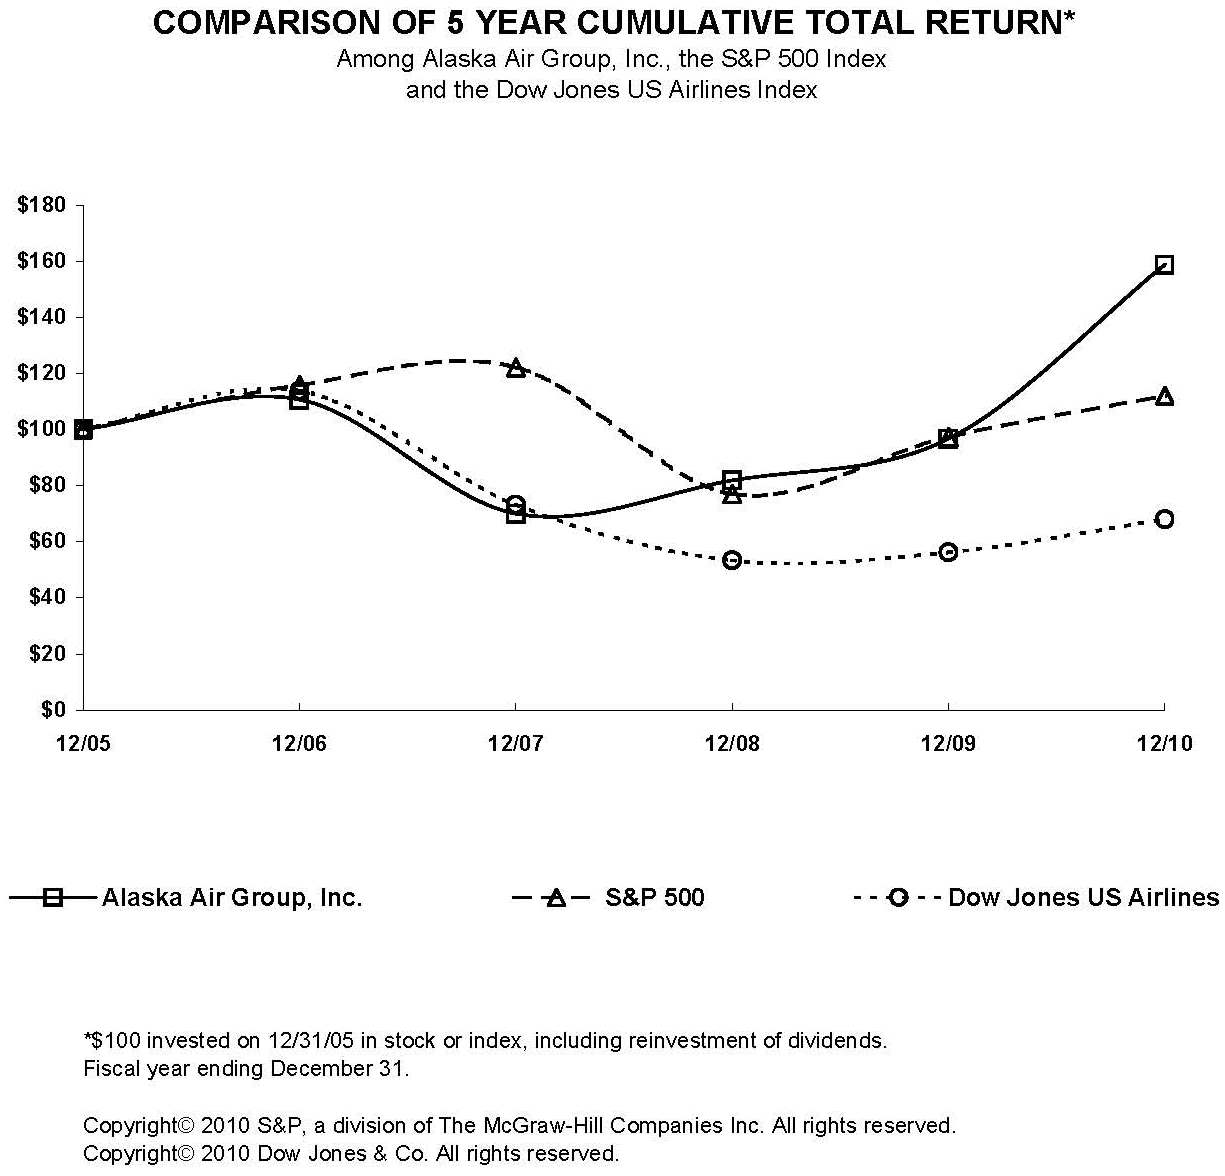
22
|
|
|
|||||||||||||||||||||||
|
|
2010
|
|
2009
|
|
2008
|
|
2007
|
|
2006
|
|
2005
|
|
||||||||||||
|
CONSOLIDATED OPERATING RESULTS
(audited)
|
|
|
|
|
|
|
|
|
|
|
|
|
||||||||||||
|
Year Ended December 31 (in millions, except per share amounts):
|
|
|
|
|
|
|
|
|
|
|
|
|
||||||||||||
|
Operating Revenues
|
$
|
3,832.3
|
|
|
$
|
3,399.8
|
|
|
$
|
3,662.6
|
|
|
$
|
3,506.0
|
|
|
$
|
3,334.4
|
|
|
$
|
2,975.3
|
|
|
|
Operating Expenses
|
3,360.7
|
|
|
3,132.4
|
|
|
3,834.8
|
|
|
3,295.1
|
|
|
3,424.6
|
|
|
2,808.8
|
|
|
||||||
|
Operating Income (Loss)
|
471.6
|
|
|
267.4
|
|
|
(172.2
|
)
|
210.9
|
|
|
(90.2
|
)
|
166.5
|
|
|
||||||||
|
Nonoperating income (expense), net of interest capitalized (a)
|
(65.7
|
)
|
(64.5
|
)
|
(41.0
|
)
|
(10.4
|
)
|
(0.5
|
)
|
(29.3
|
)
|
||||||||||||
|
Income (loss) before income tax and accounting change
|
405.9
|
|
|
202.9
|
|
|
(213.2
|
)
|
200.5
|
|
(90.7
|
)
|
137.2
|
|
||||||||||
|
Income (loss) before accounting change
|
251.1
|
|
|
121.6
|
|
|
(135.9
|
)
|
124.3
|
|
(54.5
|
)
|
84.5
|
|
||||||||||
|
Net Income (Loss)
|
$
|
251.1
|
|
|
$
|
121.6
|
|
|
$
|
(135.9
|
)
|
$
|
124.3
|
|
$
|
(54.5
|
)
|
$
|
(5.9
|
)
|
||||
|
Average basic shares outstanding
|
35.822
|
|
|
35.815
|
|
|
36.343
|
|
40.125
|
|
37.939
|
|
27.609
|
|
||||||||||
|
Average diluted shares outstanding
|
36.786
|
|
|
36.154
|
|
|
36.343
|
|
40.424
|
|
37.939
|
|
33.917
|
|
||||||||||
|
Basic earnings (loss) per share before accounting change
|
$
|
7.01
|
|
|
$
|
3.39
|
|
|
$
|
(3.74
|
)
|
$
|
3.10
|
|
$
|
(1.44
|
)
|
$
|
3.06
|
|
||||
|
Basic earnings (loss) per share
|
7.01
|
|
|
3.39
|
|
|
(3.74
|
)
|
3.10
|
|
(1.44
|
)
|
(0.21
|
)
|
||||||||||
|
Diluted earnings (loss) per share before accounting change
|
6.83
|
|
|
3.36
|
|
|
(3.74
|
)
|
3.07
|
|
(1.44
|
)
|
2.65
|
|
||||||||||
|
Diluted earnings (loss) per share
|
6.83
|
|
|
3.36
|
|
|
(3.74
|
)
|
3.07
|
|
|
(1.44
|
)
|
(0.01
|
)
|
|||||||||
|
CONSOLIDATED FINANCIAL POSITION
(audited)
|
|
|
|
|
|
|
|
|
|
|
|
|
|
|
|
|
|
|||||||
|
At End of Period (in millions, except ratio):
|
|
|
|
|
|
|
|
|
|
|
|
|
|
|
|
|
|
|||||||
|
Total assets
|
$
|
5,016.6
|
|
|
$
|
4,996.2
|
|
|
$
|
4,835.6
|
|
$
|
4,490.9
|
|
|
$
|
4,077.1
|
|
|
$
|
3,792.0
|
|
|
|
|
Long-term debt and capital lease obligations, net of current portion
|
1,313.0
|
|
|
1,699.2
|
|
|
1,596.3
|
|
1,124.6
|
|
|
1,031.7
|
|
|
969.1
|
|
|
|||||||
|
Shareholders' equity
|
1,105.4
|
|
|
872.1
|
|
|
661.9
|
|
1,025.4
|
|
|
886.5
|
|
|
827.6
|
|
|
|||||||
|
Ratio of earnings to fixed charges (b)
(unaudited)
|
2.87
|
|
|
1.92
|
|
|
(0.10
|
)
|
1.83
|
|
|
0.40
|
|
|
1.72
|
|
|
|||||||
|
STATISTICS
(unaudited)
|
|
|
|
|
|
|
|
|
|
|
|
|
|
|
|
|
|
|
||||||
|
Alaska Airlines Mainline Operating Data:
|
|
|
|
|
|
|
|
|
|
|
|
|
|
|
|
|
|
|
||||||
|
Revenue passengers (000)
|
16,514
|
|
|
15,561
|
|
|
16,809
|
|
|
17,558
|
|
|
17,165
|
|
|
16,759
|
|
|
||||||
|
Revenue passenger miles (RPM) (000,000)
|
20,350
|
|
|
18,362
|
|
|
18,712
|
|
|
18,451
|
|
|
17,822
|
|
|
16,915
|
|
|
||||||
|
Available seat miles (ASM) (000,000)
|
24,434
|
|
|
23,144
|
|
|
24,218
|
|
|
24,208
|
|
|
23,278
|
|
|
22,292
|
|
|
||||||
|
Revenue passenger load factor
|
83.3
|
|
%
|
79.3
|
|
%
|
77.3
|
|
%
|
76.2
|
|
%
|
76.6
|
|
%
|
75.9
|
|
%
|
||||||
|
Yield per passenger mile
|
13.58
|
|
¢
|
13.28
|
|
¢
|
14.13
|
|
¢
|
13.81
|
|
¢
|
13.76
|
|
¢
|
12.91
|
|
¢
|
||||||
|
Operating revenues per ASM
|
12.66
|
|
¢
|
11.74
|
|
¢
|
12.06
|
|
¢
|
11.52
|
|
¢
|
11.50
|
|
¢
|
10.76
|
|
¢
|
||||||
|
Operating expenses per ASM
|
10.96
|
|
¢
|
10.78
|
|
¢
|
12.54
|
|
¢
|
10.55
|
|
¢
|
11.93
|
|
¢
|
10.14
|
|
¢
|
||||||
|
Operating expenses per ASM, excluding fuel and noted items (d)
|
7.85
|
|
¢
|
8.26
|
|
¢
|
7.49
|
|
¢
|
7.50
|
|
¢
|
7.76
|
|
¢
|
7.90
|
|
¢
|
||||||
|
Average number of full-time equivalent employees
|
8,651
|
|
|
8,915
|
|
|
9,628
|
|
|
9,679
|
|
|
9,322
|
|
|
9,065
|
|
|
||||||
|
Operating fleet at period-end
|
114
|
|
|
115
|
|
|
110
|
|
|
115
|
|
|
114
|
|
|
110
|
|
|
||||||
|
Horizon Air Operating Data (c):
|
|
|
|
|
|
|
|
|
|
|
|
|
|
|
|
|
|
|
||||||
|
Revenue passengers (000)
|
6,820
|
|
|
6,759
|
|
|
7,390
|
|
|
7,552
|
|
|
6,860
|
|
|
6,481
|
|
|
||||||
|
Revenue passenger miles (RPM) (000,000)
|
2,450
|
|
|
2,408
|
|
|
2,635
|
|
|
2,918
|
|
|
2,691
|
|
|
2,475
|
|
|
||||||
|
Available seat miles (ASM) (000,000)
|
3,235
|
|
|
3,292
|
|
|
3,617
|
|
|
3,978
|
|
|
3,632
|
|
|
3,400
|
|
|
||||||
|
Revenue passenger load factor
|
75.7
|
|
%
|
73.1
|
|
%
|
72.9
|
|
%
|
73.4
|
|
%
|
74.1
|
|
%
|
72.8
|
|
%
|
||||||
|
Yield per passenger mile
|
27.30
|
|
¢
|
26.73
|
|
¢
|
27.43
|
|
¢
|
24.30
|
|
¢
|
23.53
|
|
¢
|
21.98
|
|
¢
|
||||||
|
Operating revenues per ASM
|
21.02
|
|
¢
|
19.88
|
|
¢
|
20.29
|
|
¢
|
18.06
|
|
¢
|
17.73
|
|
¢
|
16.36
|
|
¢
|
||||||
|
Operating expenses per ASM
|
20.27
|
|
¢
|
18.64
|
|
¢
|
21.42
|
|
¢
|
18.07
|
|
¢
|
17.41
|
|
¢
|
15.50
|
|
¢
|
||||||
|
Operating expenses per ASM, excluding fuel and noted items (d)
|
15.52
|
|
¢
|
15.33
|
|
¢
|
14.52
|
|
¢
|
14.58
|
|
¢
|
14.20
|
|
¢
|
13.36
|
|
¢
|
||||||
|
Average number of full-time equivalent employees
|
3,045
|
|
|
3,308
|
|
|
3,699
|
|
|
3,897
|
|
|
3,611
|
|
|
3,456
|
|
|
||||||
|
Operating fleet at period-end
|
54
|
|
|
58
|
|
|
59
|
|
|
70
|
|
|
69
|
|
|
65
|
|
|
||||||
(a) Includes capitalized interest of $
6.2
million, $7.6 million, $23.2 million, $27.8 million, $24.7 million, $8.9 million, $1.7 million, $2.3 million, $2.7 million, $10.6 million, and $17.7 million for 2010, 2009, 2008, 2007, 2006, 2005, 2004, 2003, 2002, 2001, and 2000, respectively.
(b) For 2008, 2006, 2004, 2002, 2001, and 2000 earnings are inadequate to cover fixed charges by $236.4 million, $115.4 million, $17.4 million, $99.5 million, $69.1 million, and $44.6 million, respectively. See Exhibit 12.1 to this Form 10-K.
23
|
|
||||||||||||||||||||
|
|
2004
|
|
2003
|
|
2002
|
|
2001
|
|
2000
|
|
||||||||||
|
CONSOLIDATED OPERATING RESULTS
(audited)
|
|
|
|
|
|
|
|
|
|
|
||||||||||
|
Year Ended December 31 (in millions, except per share amounts):
|
|
|
|
|
|
|
|
|
|
|
|
|
|
|
|
|||||
|
Operating Revenues
|
$
|
2,723.8
|
|
|
$
|
2,444.8
|
|
|
$
|
2,224.1
|
|
|
$
|
2,152.8
|
|
|
$
|
2,194.0
|
|
|
|
Operating Expenses
|
2,718.1
|
|
|
2,455.9
|
|
|
2,317.3
|
|
|
2,279.1
|
|
|
2,227.1
|
|
|
|||||
|
Operating Income (Loss)
|
5.7
|
|
|
(11.1
|
)
|
(93.2
|
)
|
(126.3
|
)
|
(33.1
|
)
|
|||||||||
|
Nonoperating income (expense), net of interest capitalized (a)
|
(26.3
|
)
|
40.1
|
|
(8.6
|
)
|
62.8
|
|
6.2
|
|
||||||||||
|
Income (loss) before income tax and accounting change
|
(20.6
|
)
|
29.0
|
|
(101.8
|
)
|
(63.5
|
)
|
(26.9
|
)
|
||||||||||
|
Income (loss) before accounting change
|
(15.3
|
)
|
13.5
|
|
(67.2
|
)
|
(43.4
|
)
|
(20.4
|
)
|
||||||||||
|
Net Income (Loss)
|
$
|
(15.3
|
)
|
$
|
13.5
|
|
$
|
(118.6
|
)
|
$
|
(43.4
|
)
|
$
|
(67.2
|
)
|
|||||
|
Average basic shares outstanding
|
|
|
|
|
|
|
|
|
|
|
||||||||||
|
Average diluted shares outstanding
|
26.859
|
|
26.648
|
|
26.546
|
|
26.499
|
|
26.440
|
|
||||||||||
|
Basic earnings (loss) per share before accounting change
|
26.859
|
|
26.730
|
|
|
26.546
|
|
26.499
|
|
26.440
|
|
|||||||||
|
Basic earnings (loss) per share
|
$
|
(0.57
|
)
|
$
|
0.51
|
|
|
$
|
(2.53
|
)
|
$
|
(1.64
|
)
|
$
|
(0.77
|
)
|
||||
|
Diluted earnings (loss) per share before accounting change
|
(0.57
|
)
|
0.51
|
|
|
(4.47
|
)
|
(1.64
|
)
|
(2.54
|
)
|
|||||||||
|
Diluted earnings (loss) per share
|
(0.57
|
)
|
0.51
|
|
|
(2.53
|
)
|
(1.64
|
)
|
(0.77
|
)
|
|||||||||
|
CONSOLIDATED FINANCIAL POSITION
(audited)
|
(0.57
|
)
|
0.51
|
|
|
(4.47
|
)
|
(1.64
|
)
|
(2.54
|
)
|
|||||||||
|
At End of Period (in millions, except ratio):
|
|
|
|
|
|
|
|
|
|
|
|
|
|
|
|
|||||
|
Total assets
|
$
|
3,335.0
|
|
|
$
|
3,259.2
|
|
|
$
|
2,880.7
|
|
|
$
|
2,950.5
|
|
|
$
|
2,528.1
|
|
|
|
Long-term debt and capital lease obligations, net of current portion
|
989.6
|
|
|
906.9
|
|
|
856.7
|
|
|
852.2
|
|
|
509.2
|
|
|
|||||
|
Shareholders' equity
|
664.8
|
|
|
674.2
|
|
|
655.7
|
|
|
851.3
|
|
|
895.1
|
|
|
|||||
|
Ratio of earnings to fixed charges (b)
(unaudited)
|
0.89
|
|
|
1.22
|
|
|
0.28
|
|
|
0.48
|
|
|
0.66
|
|
|
|||||
|
STATISTICS
(unaudited)
|
|
|
|
|
|
|
|
|
|
|
|
|
|
|
|
|||||
|
Alaska Airlines Mainline Operating Data:
|
|
|
|
|
|
|
|
|
|
|
|
|
|
|
|
|||||
|
Revenue passengers (000)
|
16,295
|
|
|
15,047
|
|
|
14,154
|
|
|
13,668
|
|
|
13,525
|
|
|
|||||
|
Revenue passenger miles (RPM) (000,000)
|
16,231
|
|
|
14,554
|
|
|
13,186
|
|
|
12,249
|
|
|
11,986
|
|
|
|||||
|
Available seat miles (ASM) (000,000)
|
22,276
|
|
|
20,804
|
|
|
19,360
|
|
|
17,919
|
|
|
17,315
|
|
|
|||||
|
Revenue passenger load factor
|
72.9
|
|
%
|
70.0
|
|
%
|
68.1
|
|
%
|
68.4
|
|
%
|
69.2
|
|
%
|
|||||
|
Yield per passenger mile
|
12.47
|
|
¢
|
12.65
|
|
¢
|
12.65
|
|
¢
|
13.12
|
|
¢
|
13.56
|
|
¢
|
|||||
|
Operating revenues per ASM
|
10.02
|
|
¢
|
9.74
|
|
¢
|
9.47
|
|
¢
|
9.84
|
|
¢
|
10.20
|
|
¢
|
|||||
|
Operating expenses per ASM
|
10.07
|
|
¢
|
9.81
|
|
¢
|
9.87
|
|
¢
|
10.24
|
|
¢
|
10.35
|
|
¢
|
|||||
|
Operating expenses per ASM, excluding fuel and noted items (d)
|
7.92
|
|
¢
|
8.34
|
|
¢
|
8.52
|
|
¢
|
8.73
|
|
¢
|
8.54
|
|
¢
|
|||||
|
Average number of full-time equivalent employees
|
9,968
|
|
|
10,040
|
|
|
10,142
|
|
|
10,115
|
|
|
9,611
|
|
|
|||||
|
Operating fleet at period-end
|
108
|
|
|
109
|
|
|
102
|
|
|
101
|
|
|
95
|
|
|
|||||
|
Horizon Air Operating Data (c):
|
|
|
|
|
|
|
|
|
|
|
|
|
|
|
||||||
|
Revenue passengers (000)
|
5,930
|
|
|
4,934
|
|
|
4,815
|
|
|
4,668
|
|
|
5,044
|
|
|
|||||
|
Revenue passenger miles (RPM) (000,000)
|
2,155
|
|
|
1,640
|
|
|
1,514
|
|
|
1,350
|
|
|
1,428
|
|
|
|||||
|
Available seat miles (ASM) (000,000)
|
3,107
|
|
|
2,569
|
|
|
2,428
|
|
|
2,148
|
|
|
2,299
|
|
|
|||||
|
Revenue passenger load factor
|
69.3
|
|
%
|
63.9
|
|
%
|
62.4
|
|
%
|
62.8
|
|
%
|
62.1
|
|
%
|
|||||
|
Yield per passenger mile
|
22.61
|
|
¢
|
26.96
|
|
¢
|
26.02
|
|
¢
|
28.15
|
|
¢
|
29.82
|
|
¢
|
|||||
|
Operating revenues per ASM
|
16.20
|
|
¢
|
18.06
|
|
¢
|
17.29
|
|
¢
|
19.02
|
|
¢
|
19.27
|
|
¢
|
|||||
|
Operating expenses per ASM
|
15.57
|
|
¢
|
17.79
|
|
¢
|
17.87
|
|
¢
|
21.02
|
|
¢
|
19.53
|
|
¢
|
|||||
|
Operating expenses per ASM, excluding fuel and noted items (d)
|
13.58
|
|
¢
|
15.80
|
|
¢
|
15.99
|
|
¢
|
18.48
|
|
¢
|
16.48
|
|
¢
|
|||||
|
Average number of full-time equivalent employees
|
3,423
|
|
|
3,361
|
|
|
3,476
|
|
|
3,764
|
|
|
3,795
|
|
|
|||||
|
Operating fleet at period-end
|
65
|
|
|
62
|
|
|
63
|
|
|
60
|
|
|
62
|
|
|
|||||
(c) Includes Horizon services operated as Frontier JetExpress in 2004 through 2007 and flights operated under the Capacity Purchase Agreement with Alaska in 2007 through 2010.
(d) See reconciliation of this measure to the most directly related GAAP measure in the "Results of Operations" section for both Alaska and Horizon.
24
|
|
OVERVIEW
The following Management’s Discussion and Analysis of Financial Condition and Results of Operations (MD&A) is intended to help the reader understand the Company, our operations and our present business environment. MD&A is provided as a supplement to – and should be read in conjunction with – our consolidated financial statements and the accompanying notes. All statements in the following discussion that are not statements of historical information or descriptions of current accounting policy are forward-looking statements. Please consider our forward-looking statements in light of the risks referred to in this report’s introductory cautionary note and the risks mentioned in Part I, “Item 1A. Risk Factors.” This overview summarizes the MD&A, which includes the following sections:
|
•
|
Year in Review
—highlights from
2010
outlining some of the major events that happened during the year and how they affected our financial performance.
|
|
•
|
Results of Operations
—an in-depth analysis of the results of operations of Alaska and Horizon for the three years presented in our consolidated financial statements. We believe this analysis will help the reader better understand our consolidated statements of operations. Financial and statistical data for Alaska and Horizon are also included here. This section includes forward-looking statements regarding our view of
2011
.
|
|
•
|
Critical Accounting Estimates
—a discussion of our accounting estimates that involve significant judgment and uncertainties.
|
|
•
|
Prospective Accounting Pronouncements
—a discussion of recently issued and proposed accounting pronouncements.
|
|
•
|
Liquidity and Capital Resources
—an analysis of cash flows, sources and uses of cash, contractual obligations, commitments and off-balance sheet arrangements, an overview of financial position and the impact of inflation and changing prices.
|
YEAR IN REVIEW
Our
2010
consolidated pretax income was
$405.9 million
compared to
$202.9 million
in
2009
. The $203.0 million improvement in our pretax earnings was primarily due to the $432.5 million increase in operating revenues, partially offset by a $242.8 million increase in aircraft fuel expense. The increase in operating revenues was driven by a 9.8% increase in passenger traffic on relatively flat yield for the year. Fuel cost increased over the prior year primarily due to to a 27% increase in our raw fuel cost per gallon on relatively flat consumption for the year.
See “Results of Operations” below for further discussion of changes in revenues and operating expenses for both Alaska and Horizon.
Accomplishments and Highlights
Accomplishments and highlights from
2010
include:
|
•
|
We reported record earnings for 2010.
|
|
•
|
Both companies continued their excellent operational performance again in 2010 as measured by on-time arrivals and completion rate as reported to the Department of Transportation (DOT). At Alaska, we led the ten largest carriers in on-time performance for the year.
|
|
•
|
For the third year in a row, Alaska Airlines ranked “Highest in Customer Satisfaction among Traditional Network Carriers” in 2010 by J.D. Power and Associates. Alaska was also named "Top Performing Airline" by Aviation Week magazine, and recognized for having the "Best Loyalty Credit Card" in North America in 2010 at the Frequent Travel Awards.
|
|
•
|
Alaska Airlines announced an agreement to purchase 15 new Boeing 737 aircraft, including 13 B737-900ER aircraft, for deliver in 2012 through 2014. In addition, Horizon Air announced its final transition to all-Q400 fleet in 2011.
|
25
|
•
|
During the year, we reached agreements with several of our labor groups that provide for improved productivity and a common gain-sharing formula. See “Update on Labor Negotiations” below for further discussion.
|
|
•
|
For the year, our employees earned
$92.0 million
in incentive pay for meeting certain operational and financial goals. We also contributed $145.6 million to Alaska’s defined benefit pension plans.
|
Aircraft Purchase Commitments
In January 2011, we entered into an aircraft purchase agreement with Boeing to purchase 15 new B737 aircraft, including two B737-800 aircraft and 13 B737-900ER aircraft, with deliveries beginning in late 2012 and continuing through 2014. The agreement also includes options to purchase 15 additional B737-900ER aircraft with delivery positions in 2016 and 2017. Based on the current list prices, the total value of this contract is approximately $1.3 billion.
Update on Labor Negotiations
Both Alaska and Horizon have had success recently with amended bargaining agreements or contract extensions with a number of labor unions. All of the new agreements or extensions ratified in 2010 include participation by the represented employees in Air Group’s Performance-Based Pay (PBP) incentive plan as approved by the Compensation Committee of the Board of Directors. PBP is described in Note 6 to the consolidated financial statements. With these recent contracts, virtually all of our employees now participate in PBP.
Alaska Labor Contracts
Alaska reached a tentative agreement in December 2010 on a three-year contract with its largest represented group—the clerical, office and passenger service employees. This agreement was ratified in the first quarter of 2011 and included participation in the PBP incentive plan, a $1,500 signing bonus per employee and annual wage increases.
Horizon Labor Contracts
In the fourth quarter of 2010, Horizon reached labor agreements with its pilots and mechanics. Both agreements include participation in the PBP plan for represented employees. The pilot agreement includes a contract signing bonus and a provision for wage arbitration on the first and third anniversary date of the contract.
Horizon Restructuring and Fleet Transition
In 2010, we made several structural changes to the Horizon business as follows:
|
•
|
We outsourced the remaining heavy maintenance functions for Horizon aircraft in the third quarter of 2010. We believe this change will result in approximately $3 million in cost savings annually. This resulted in the reduction of approximately 100 mechanics and other personnel through voluntary furlough or early retirement. We recorded a $2.9 million charge associated with related separation pay, all of which was paid during the third quarter of 2010.
|
|
•
|
We are completing our transition to an all-Q400 fleet. In 2010, Horizon transferred five CRJ-700 aircraft to third parties through either sublease or lease assignment. We recorded a charge of $10.3 million associated with these transactions. We have 13 CRJ-700 aircraft remaining in our operating fleet as of December 31, 2010. We have signed a letter of intent to dispose of eight of the remaining CRJ-700 aircraft in 2011 through either sublease or lease assignment to a third-party carrier. The remaining five aircraft will be flown by SkyWest Airlines on behalf of Alaska Airlines pursuant to a capacity purchase arrangement. We expect charges of up to $3 million at the cease-use date per aircraft for each of those 13 aircraft.
|
26
New Markets
In 2010, Alaska added several new cities and non-stop routes to our overall network as follows:
|
New Non-Stop Routes Between
|
Frequency (Weekly)
|
Start Date
|
||
|
San Jose and Maui
|
3 x weekly
|
3/11/2010
|
||
|
San Jose and Kona
|
4 x weekly
|
3/12/2010
|
||
|
Sacramento and Maui
|
Daily
|
3/26/2010
|
||
|
Portland and Honolulu
|
Daily
|
9/20/2010
|
||
|
San Diego and Maui
|
Daily
|
10/1/2010
|
||
|
San Diego and Puerto Vallarta
|
Daily (seasonal)
|
11/12/2010
|
||
|
Portland and Kona
|
4 x weekly (seasonal)
|
11/12/2010
|
||
|
San Jose and Los Cabos
|
2 x weekly
|
12/4/2010
|
||
|
Seattle and St. Louis
|
Daily
|
9/27/2010
|
||
|
San Jose and Guadalajara
|
4 x weekly
|
12/15/2010
|
||
|
Sacramento and Guadalajara
|
3 x weekly
|
12/16/2010
|
In addition to these markets, Alaska began daily service between Bellingham and Honolulu in January 7, 2011 and will begin daily service between San Jose and Kauai and between Oakland and Kauai in March 2011.
Horizon also expanded service to include new non-stop routes between Bellingham and Portland six times weekly beginning on June 18, 2010 and non-stop routes between between Los Angeles and San Jose three times weekly beginning on August 23, 2010.
The changes above, when combined with the significant number of network changes over the last few years, have diversified our network and made us less dependent on our historical markets in the State of Alaska and up and down the West Coast. We believe our smaller size makes us more nimble than some of our larger competitors, gives us a closer connection with our customers and allows us to identify and respond to market opportunities quickly.
Stock Repurchase
In June 2009, our Board of Directors authorized the Company to repurchase up to $50 million of our common stock. Under this program, we repurchased 1,970,326 shares of our common stock. This program expired in June 2010.
In June 2010, our Board of Directors authorized the Company to repurchase up to $50 million of our common stock. Through December 31, 2010, we repurchased 355,000 shares of common stock for approximately $18.8 million under this program. This program will expire in June 2011.
Outlook
Our primary focus every year is to run safe, compliant and reliable operations at our airlines. In addition to our primary objective, our key initiative in 2011 is to maintain our focus on optimizing revenue. Our specific focus will be on the way we merchandise fares and ancillary products and services on our website and through mobile applications.
Our biggest concern for 2011 is the rising cost of fuel. However, with our fuel-efficient aircraft and our fuel hedge portfolio, we believe we are better prepared to handle those rising costs than others in the industry.
For the first quarter of 2011, our advance booked load factors are up slightly compared to 2010 on significant increases in capacity.
RESULTS
OF OPERATIONS
2010
COMPARED WITH
2009
Our consolidated net income for
2010
was a record
$251.1 million
, or
$6.83
per diluted share, compared to net income of
27
$121.6 million
, or
$3.36
per share, in
2009
. Items that impact the comparability between the periods are as follows:
|
•
|
Both periods include adjustments to reflect timing of gain and loss recognition resulting from mark-to-market fuel hedge accounting. For
2010
, we recognized net mark-to-market losses of $
5.3
million ($
3.3
million after tax, or $
0.09
per share), compared to net gains of $88.8 million ($55.2 million after tax, or $1.53 per share) in
2009
.
|
|
•
|
2010 included Horizon restructuring and fleet transition costs of $13.2 million ($8.2 million after tax, or $
0.22
per share).
|
|
•
|
2009 included the new Alaska pilot contract transition costs of $35.8 million ($22.3 million after tax, or $0.62 per share).
|
ADJUSTED (NON-GAAP) RESULTS AND
PER-SHARE AMOUNTS
We believe disclosure of earnings excluding the impact of these individual charges is useful information to investors because:
|
•
|
It is consistent with how we present information in our quarterly earnings press releases;
|
|
•
|
We believe it is the basis by which we are evaluated by industry analysts;
|
|
•
|
Our results excluding these items are most often used in internal management and board reporting and decision-making;
|
|
•
|
Our results excluding these adjustments serve as the basis for our various employee incentive plans, thus the information allows investors to better understand the changes in variable incentive pay expense in our consolidated statements of operations; and
|
|
•
|
It is useful to monitor performance without these items as it improves a reader’s ability to compare our results to those of other airlines.
|
Although we are presenting these non-GAAP amounts for the reasons above, investors and other readers should not necessarily conclude that these amounts are non-recurring, infrequent, or unusual in nature.
Excluding the items noted above, and as shown in the following table, our consolidated net income for
2010
was a record
$262.6
million, or
$7.14
per diluted share, compared to $88.7 million, or $2.45 per diluted share, in
2009
.
|
|
Years Ended December 31
|
|||||||||||||||
|
|
2010
|
2009
|
||||||||||||||
|
(in millions except per share amounts)
|
Dollars
|
Diluted EPS
|
Dollars
|
Diluted EPS
|
||||||||||||
|
Net income and diluted EPS, excluding noted items
|
$
|
262.6
|
|
$
|
7.14
|
|
$
|
88.7
|
|
$
|
2.45
|
|
||||
|
New pilot contract transition costs, net of tax
|
—
|
|
—
|
|
(22.3
|
)
|
(0.62
|
)
|
||||||||
|
Horizon restructuring and CRJ-700 fleet transition costs, net of tax
|
(8.2
|
)
|
(0.22
|
)
|
—
|
|
—
|
|
||||||||
|
Mark-to-market fuel hedge adjustments, net of tax
|
(3.3
|
)
|
(0.09
|
)
|
55.2
|
|
1.53
|
|
||||||||
|
Net income and diluted EPS as reported
|
$
|
251.1
|
|
$
|
6.83
|
|
$
|
121.6
|
|
$
|
3.36
|
|
||||
INDIVIDUAL SUBSIDIARY RESULTS
Our consolidated results are primarily driven by the results of our two operating carriers. Alaska and Horizon reported pretax income of
$401.6 million
and
$7.6 million
, respectively, in
2010
. Financial and statistical data and an in-depth discussion of the results of Alaska and Horizon are on the following pages. For a reconciliation of these subsidiary results to the consolidated results of Air Group, see Note 12 in the consolidated financial statements.
28
ALASKA AIRLINES FINANCIAL AND STATISTICAL DATA
|
|
Three Months Ended December 31
|
|
Year Ended December 31
|
|
|||||||||||||||||||||||||
|
Financial Data
(in millions)
:
|
2010
|
|
2009
|
|
% Change
|
|
2010
|
|
2009
|
|
% Change
|
|
2008
|
|
% Change
|
|
|||||||||||||
|
Operating Revenues:
|
|
|
|
|
|
|
|
|
|
|
|
|
|
|
|
|
|||||||||||||
|
Passenger
|
694.9
|
|
|
$
|
594.5
|
|
|
16.9
|
|
2,763.4
|
|
|
$
|
2,438.8
|
|
|
13.3
|
|
$
|
2,643.7
|
|
|
(7.8
|
)
|
|
||||
|
Freight and mail
|
24.6
|
|
|
22.5
|
|
|
9.3
|
|
|
101.9
|
|
|
91.5
|
|
|
11.4
|
|
99.3
|
|
|
(7.9
|
)
|
|
||||||
|
Other - net
|
57.3
|
|
|
50.8
|
|
|
12.8
|
|
|
228.8
|
|
|
187.3
|
|
|
22.2
|
|
135.2
|
|
|
38.5
|
|
|||||||
|
Change in Mileage Plan terms
|
—
|
|
|
—
|
|
|
NM
|
|
|
—
|
|
|
—
|
|
|
NM
|
|
42.3
|
|
|
NM
|
|
|||||||
|
Total mainline operating revenues
|
776.8
|
|
|
667.8
|
|
|
16.3
|
|
|
3,094.1
|
|
|
2,717.6
|
|
|
13.9
|
|
2,920.5
|
|
|
(6.9
|
)
|
|||||||
|
Passenger - purchased capacity
|
83.6
|
|
|
77.0
|
|
|
8.6
|
|
|
332.5
|
|
|
288.4
|
|
|
15.3
|
|
300.8
|
|
|
(4.1
|
)
|
|||||||
|
Total Operating Revenues
|
860.4
|
|
|
744.8
|
|
|
15.5
|
|
|
3,426.6
|
|
|
3,006.0
|
|
|
14.0
|
|
3,221.3
|
|
|
(6.7
|
)
|
|||||||
|
Operating Expenses:
|
|
|
|
|
|
|
|
|
|||||||||||||||||||||
|
Wages and benefits
|
191.3
|
|
|
197.7
|
|
|
(3.2
|
)
|
|
767.2
|
|
|
792.6
|
|
|
(3.2
|
)
|
742.7
|
|
|
6.7
|
|
|||||||
|
Variable incentive pay
|
23.0
|
|
|
17.6
|
|
|
30.7
|
|
|
75.0
|
|
|
61.6
|
|
|
21.8
|
|
15.8
|
|
|
289.9
|
|
|||||||
|
Aircraft fuel, including hedging gains and losses
|
186.3
|
|
|
143.1
|
|
|
30.2
|
|
760.6
|
|
|
549.0
|
|
|
38.5
|
|
1,162.4
|
|
|
(52.8
|
)
|
||||||||
|
Aircraft maintenance
|
34.9
|
|
|
40.5
|
|
|
(13.8
|
)
|
|
159.1
|
|
|
169.9
|
|
|
(6.4
|
)
|
150.6
|
|
|
12.8
|
|
|||||||
|
Aircraft rent
|
22.9
|
|
|
27.2
|
|
|
(15.8
|
)
|
|
97.1
|
|
|
109.0
|
|
|
(10.9
|
)
|
106.2
|
|
|
2.6
|
|
|||||||
|
Landing fees and other rentals
|
43.6
|
|
|
42.4
|
|
|
2.8
|
|
|
173.3
|
|
|
166.8
|
|
|
3.9
|
|
167.7
|
|
|
(0.5
|
)
|
|||||||
|
Contracted services
|
33.0
|
|
|
31.8
|
|
|
3.8
|
|
|
127.1
|
|
|
124.9
|
|
|
1.8
|
|
130.2
|
|
|
(4.1
|
)
|
|||||||
|
Selling expenses
|
30.8
|
|
|
27.9
|
|
|
10.4
|
|
|
124.5
|
|
|
104.7
|
|
|
18.9
|
|
116.0
|
|
|
(9.7
|
)
|
|||||||
|
Depreciation and amortization
|
47.9
|
|
|
45.9
|
|
|
4.4
|
|
|
188.5
|
|
|
178.5
|
|
|
5.6
|
|
165.9
|
|
|
7.6
|
|
|||||||
|
Food and beverage service
|
14.7
|
|
|
12.8
|
|
|
14.8
|
|
|
55.2
|
|
|
47.7
|
|
|
15.7
|
|
48.3
|
|
|
(1.2
|
)
|
|||||||
|
Other
|
41.3
|
|
|
40.4
|
|
|
2.2
|
|
|
149.9
|
|
|
155.2
|
|
|
(3.4
|
)
|
170.3
|
|
|
(8.9
|
)
|
|||||||
|
New pilot contract transition costs
|
—
|
|
|
—
|
|
|
NM
|
|
|
—
|
|
|
35.8
|
|
|
NM
|
|
—
|
|
|
NM
|
|
|
||||||
|
Restructuring charges
|
—
|
|
|
—
|
|
|
NM
|
|
|
—
|
|
|
—
|
|
|
NM
|
|
12.9
|
|
|
NM
|
|
|
||||||
|
Fleet transition costs - MD-80
|
—
|
|
|
—
|
|
|
NM
|
|
|
—
|
|
|
—
|
|
|
NM
|
|
47.5
|
|
|
NM
|
|
|
||||||
|
Total mainline operating expenses
|
669.7
|
|
|
627.3
|
|
|
6.8
|
|
2,677.5
|
|
|
2,495.7
|
|
|
7.3
|
|
3,036.5
|
|
|
(17.8
|
)
|
|
|||||||
|
Purchased capacity costs
|
77.4
|
|
|
75.2
|
|
|
2.9
|
|
298.9
|
|
|
281.5
|
|
|
6.2
|
|
313.7
|
|
|
(10.3
|
)
|
|
|||||||
|
Total Operating Expenses
|
747.1
|
|
|
702.5
|
|
|
6.3
|
|
2,976.4
|
|
|
2,777.2
|
|
|
7.2
|
|
3,350.2
|
|
|
(17.1
|
)
|
|
|||||||
|
Operating Income (Loss)
|
113.3
|
|
|
42.3
|
|
NM
|
|
|
450.2
|
|
|
228.8
|
|
NM
|
|
|
(128.9
|
)
|
|
NM
|
|
|
|||||||
|
Interest income
|
7.8
|
|
|
9.4
|
|
|
|
|
34.8
|
|
|
38.6
|
|
|
|
|
51.3
|
|
|
|
|
|
|||||||
|
Interest expense
|
(24.2
|
)
|
(21.4
|
)
|
|
|
|
(96.5
|
)
|
(91.7
|
)
|
|
|
|
(94.8
|
)
|
|
|
|
||||||||||
|
Interest capitalized
|
1.0
|
|
1.6
|
|
|
|
|
5.7
|
|
7.3
|
|
|
|
|
20.2
|
|
|
|
|
||||||||||
|
Other - net
|
3.0
|
|
3.3
|
|
|
|
|
7.4
|
|
0.8
|
|
|
|
|
(1.1
|
)
|
|
|
|
||||||||||
|
|
(12.4
|
)
|
(7.1
|
)
|
|
|
|
(48.6
|
)
|
(45.0
|
)
|
|
|
|
(24.4
|
)
|
|
|
|
|
|||||||||
|
Income (Loss) Before Income Tax
|
100.9
|
|
$
|
35.2
|
|
NM
|
|
|
401.6
|
|
|
$
|
183.8
|
|
NM
|
|
|
$
|
(153.3
|
)
|
|
NM
|
|
|
|||||
|
Mainline Operating Statistics:
|
|
|
|
|
|
|
|
|
|
|
|
|
|
|
|||||||||||||||
|
Revenue passengers (000)
|
4,141
|
|
|
3,765
|
|
|
10.0
|
|
16,514
|
|
|
15,561
|
|
|
6.1
|
|
16,809
|
|
|
(7.4
|
)
|
||||||||
|
RPMs (000,000) "traffic"
|
5,226
|
|
|
4,550
|
|
|
14.9
|
|
|
20,350
|
|
|
18,362
|
|
|
10.8
|
|
18,712
|
|
|
(1.9
|
)
|
|
||||||
|
ASMs (000,000) "capacity"
|
6,237
|
|
|
5,675
|
|
|
9.9
|
|
|
24,434
|
|
|
23,144
|
|
|
5.6
|
|
24,218
|
|
|
(4.4
|
)
|
|
||||||
|
Passenger load factor
|
83.8
|
|
%
|
80.2
|
|
%
|
3.6
|
|
pts
|
83.3
|
|
%
|
79.3
|
|
%
|
4.0
|
|
pts
|
77.3
|
|
%
|
2.0
|
|
pts
|
|||||
|
Yield per passenger mile
|
13.30
|
|
¢
|
13.07
|
|
¢
|
1.8
|
|
13.58
|
|
¢
|
13.28
|
|
¢
|
2.3
|
|
14.13
|
|
¢
|
(6.0
|
)
|
|
|||||||
|
Operating revenues per ASM "RASM"
|
12.45
|
|
¢
|
11.77
|
|
¢
|
5.8
|
|
12.66
|
|
¢
|
11.74
|
|
¢
|
7.8
|
|
12.06
|
|
¢
|
(2.7
|
)
|
|
|||||||
|
Change in Mileage Plan terms per ASM
|
—
|
|
¢
|
—
|
|
¢
|
NM
|
|
—
|
|
¢
|
—
|
|
¢
|
NM
|
|
0.17
|
|
¢
|
NM
|
|
|
|||||||
|
Passenger revenue per ASM “PRASM”
|
11.14
|
|
¢
|
10.48
|
|
¢
|
6.3
|
|
11.31
|
|
¢
|
10.54
|
|
¢
|
7.3
|
|
10.92
|
|
¢
|
(3.5
|
)
|
|
|||||||
|
Operating expenses per ASM
|
10.74
|
|
¢
|
11.05
|
|
¢
|
(2.8
|
)
|
10.96
|
|
¢
|
10.78
|
|
¢
|
1.7
|
|
12.54
|
|
¢
|
(14.0
|
)
|
|
|||||||
|
Operating expenses per ASM, excluding fuel, new pilot contract transition costs, restructuring charges and fleet transition costs
|
7.75
|
|
¢
|
8.53
|
|
¢
|
(9.1
|
)
|
7.85
|
|
¢
|
8.26
|
|
¢
|
(5.0
|
)
|
7.49
|
|
¢
|
10.3
|
|
||||||||
|
Aircraft fuel cost per gallon
|
$
|
2.27
|
|
$
|
1.91
|
|
18.8
|
|
$
|
2.38
|
|
$
|
1.81
|
|
31.5
|
|
$
|
3.48
|
|
(48.0
|
)
|
||||||||
|
Economic fuel cost per gallon
|
$
|
2.56
|
|
$
|
2.26
|
|
13.3
|
|
$
|
2.37
|
|
$
|
2.05
|
|
15.6
|
|
$
|
3.00
|
|
(31.7
|
)
|
||||||||
|
Fuel gallons (000,000)
|
82.2
|
|
75.0
|
|
9.6
|
|
319.6
|
|
304.9
|
|
4.8
|
|
333.8
|
|
(8.7
|
)
|
|||||||||||||
|
Average number of full-time equivalent employees
|
8,711
|
|
8,701
|
|
0.1
|
|
8,651
|
|
8,915
|
|
(3.0
|
)
|
9,628
|
|
(7.4
|
)
|
|||||||||||||
|
Aircraft utilization (blk hrs/day)
|
10.1
|
|
9.3
|
|
8.6
|
|
10.0
|
|
9.8
|
|
2.0
|
|
10.6
|
|
(7.5
|
)
|
|||||||||||||
|
Average aircraft stage length (miles)
|
1,104
|
|
1,058
|
|
4.3
|
|
|
1,085
|
|
1,034
|
|
4.9
|
|
979
|
|
5.6
|
|
|
|||||||||||
|
Operating fleet at period-end
|
114
|
|
115
|
|
(1
|
)
|
a/c
|
114
|
|
115
|
|
(1
|
)
|
a/c
|
110
|
|
5
|
|
a/c
|
||||||||||
|
Purchased Capacity Operating Statistics:
|
|
|
|
|
|||||||||||||||||||||||||
|
RPMs (000,000)
|
289
|
|
276
|
|
4.7
|
|
|
1,152
|
|
1,053
|
|
9.4
|
|
1,100
|
|
(4.3
|
)
|
|
|||||||||||
|
ASMs (000,000)
|
378
|
|
373
|
|
1.3
|
|
|
1,505
|
|
1,431
|
|
5.2
|
|
1,469
|
|
(2.6
|
)
|
|
|||||||||||
|
Passenger load factor
|
76.5
|
|
%
|
74.0
|
|
%
|
2.5
|
|
pts
|
76.5
|
|
%
|
73.6
|
|
%
|
2.9
|
|
pts
|
74.9
|
|
%
|
(1.3
|
)
|
pts
|
|||||
|
Yield per passenger mile
|
28.93
|
|
¢
|
27.90
|
|
¢
|
3.7
|
|
28.86
|
|
¢
|
27.39
|
|
¢
|
5.4
|
|
|
27.35
|
|
¢
|
0.1
|
|
|
||||||
|
RASM
|
22.12
|
|
¢
|
20.64
|
|
¢
|
7.2
|
|
22.09
|
|
¢
|
20.15
|
|
¢
|
9.6
|
|
20.48
|
|
¢
|
(1.6
|
)
|
|
|||||||
|
Operating expenses per ASM
|
20.48
|
|
¢
|
20.16
|
|
¢
|
1.6
|
|
19.86
|
|
¢
|
19.67
|
|
¢
|
1.0
|
|
21.35
|
|
¢
|
(7.9
|
)
|
|
|||||||
29
ALASKA AIRLINES
Alaska reported record pretax income of
$401.6
million in
2010
compared to pretax income of $183.8 million in
2009
.
Excluding certain items as noted in the table below, Alaska would have reported record pretax income of
$404.9
million in
2010
, compared to $145.9 million in
2009
. See the previous discussion under “Adjusted Non-GAAP Earnings and Per-Share Amounts” for additional information about these non-GAAP measures.
|
|
Years Ended December 31
|
||||||
|
(in millions)
|
2010
|
2009
|
|||||
|
Income before income taxes, excluding items below
|
$
|
404.9
|
|
$
|
145.9
|
|
|
|
New pilot contract transition costs
|
—
|
|
(35.8
|
)
|
|||
|
Mark-to-market fuel hedge adjustments
|
(3.3
|
)
|
73.7
|
|
|||
|
Income before income taxes as reported
|
$
|
401.6
|
|
$
|
183.8
|
|
|
The discussion below outlines significant variances between the two periods.
ALASKA REVENUES
Total operating revenues increased
$420.6
million, or
14.0%
, during
2010
compared to
2009
. The changes are summarized in the following table:
|
|
Years Ended December 31
|
||||||||
|
(in millions)
|
2010
|
2009
|
%Change
|
||||||
|
Passenger revenue—mainline
|
$
|
2,763.4
|
|
$
|
2,438.8
|
|
13.3
|
||
|
Freight and mail
|
101.9
|
|
91.5
|
|
11.4
|
||||
|
Other—net
|
228.8
|
|
187.3
|
|
22.2
|
||||
|
Total mainline operating revenues
|
$
|
3,094.1
|
|
$
|
2,717.6
|
|
13.9
|
||
|
Passenger revenue—purchased capacity
|
332.5
|
|
288.4
|
|
15.3
|
||||
|
Total operating revenues
|
$
|
3,426.6
|
|
$
|
3,006.0
|
|
14.0
|
||
Operating Revenues – Mainline
Mainline passenger revenue for 2010 improved by
13.3%
on a
5.6%
increase in capacity and a
7.3%
increase in passenger revenue per available seat mile (PRASM) compared to 2009. The increase in PRASM was driven by a
2.3%
rise in ticket yield and a
4.0
-point increase in load factor compared to prior year due to an increase in passengers.
Ancillary revenue included in passenger revenue increased from $131.8 million in 2009 to $179.7 million in 2010. The increase is primarily due to the implementation of our first checked bag fee in the third quarter of 2009 and growth in the number of passengers.
Freight and mail revenue increased
$10.4
million, or
11.4%
, primarily as a result of higher volumes and yield and higher security and freight fuel surcharges.
Other—net revenue increased
$41.5
million, or
22.2%
, from
2009
. The increase is primarily due to Mileage Plan revenues rising by $31.8 million stemming from a larger number of miles sold to our affinity card partner and a contractual rate increase for those sold miles.
Passenger Revenue – Purchased Capacity
Passenger revenue—purchased capacity flying increased by
$44.1
million or 15.3% compared to 2009 due to a
5.2%
rise in capacity combined with a
9.6%
increase in unit revenue. Unit revenue increased as a result of a
2.9
-point improvement in load factor and a
5.4%
increase in ticket yield.
ALASKA EXPENSES
For
2010
, total operating expenses increased
$199.2
million, or
7.2
%, compared to
2009
mostly as a result of higher aircraft
30
fuel costs. We believe it is useful to summarize operating expenses as follows, which is consistent with the way expenses are reported internally and evaluated by management:
|
|
Years Ended December 31
|
|||||||||
|
(in millions)
|
2010
|
2009
|
%Change
|
|||||||
|
Mainline fuel expense
|
$
|
760.6
|
|
$
|
549.0
|
|
38.5
|
|
||
|
Mainline non-fuel expenses
|
1,916.9
|
|
1,946.7
|
|
(1.5
|
)
|
||||
|
Mainline operating expenses
|
$
|
2,677.5
|
|
$
|
2,495.7
|
|
7.3
|
|
||
|
Purchased capacity costs
|
298.9
|
|
281.5
|
|
6.2
|
|
||||
|
Total Operating Expenses
|
$
|
2,976.4
|
|
$
|
2,777.2
|
|
7.2
|
|
||
Mainline Operating Expenses
Total mainline operating expenses increased
$181.8
million, or
7.3%
, during
2010
compared to the prior year. The increase was mostly due to the
$211.6 million
increase in aircraft fuel expense, partially offset by charges for the pilot contract recorded in 2009. Significant operating expense variances from
2009
are more fully described below.
Wages and Benefits
Wages and benefits decreased by
$25.4
million, or
3.2%
, compared to
2009
. The primary components of wages and benefits are shown in the following table:
|
|
Years Ended December 31
|
|||||||||
|
(in millions)
|
2010
|
2009
|
%Change
|
|||||||
|
Wages
|
$
|
544.2
|
|
$
|
540.4
|
|
0.7
|
|
||
|
Pension and defined-contribution retirement benefits
|
84.2
|
|
114.8
|
|
(26.7
|
)
|
||||
|
Medical benefits
|
87.9
|
|
83.3
|
|
5.5
|
|
||||
|
Other benefits and payroll taxes
|
50.9
|
|
54.1
|
|
(5.9
|
)
|
||||
|
Total wages and benefits
|
$
|
767.2
|
|
$
|
792.6
|
|
(3.2
|
)
|
||
Wages were relatively flat on a reduction in full time equivalent employees (FTE) compared to
2009
. Wages have not declined in step with the FTE reduction because of higher wage rates for the pilot group in connection with their new contract effective April 1, 2009 and higher average wages for certain other employees after 2009 and early 2010 furloughs, which are generally seniority-based. However, productivity as measured by the number of passengers per FTE increased 9.4% compared to 2009.
The
26.7%
decline in pension and other retirement-related benefits is primarily due to a significant reduction in our defined-benefit pension cost driven by the improved funded status at the end of 2009 as compared to the previous year and the closing of the defined-benefit pension plans to new pilot entrants with their new contract in 2009.
Medical benefits increased
5.5%
from the prior year primarily as a result of an increase in employee healthcare costs partially offset by a decrease in post-retirement medical expense for the pilot group
We expect wages and benefits to be higher in
2011
as compared to
2010
because of an increase in the number of FTEs as we bring back furloughed employees to handle the expected growth in 2011. In addition, we expect increases related to annual wages and the cost of healthcare.
Variable Incentive Pay
Variable incentive pay expense increased from $61.6 million in
2009
to
$75.0
million in
2010
. The increase is partially due to the fact that in 2010, our financial and operational results exceeded targets established by our Board more so than in 2009. In 2010, additional workgroups were included to the PBP plan, resulting in higher earnings than the profit sharing plan in which they previously participated.
Over the long term, our plan is designed to pay at target, although we may meet, not meet, or exceed those targets in any single year. At target, we estimate the PBP expense would be $39 million and aggregate incentive pay for all plans, including OPR, would be approximately $51 million for
2011
, which would be lower than in
2010
.
31
Aircraft Fuel
Aircraft fuel expense includes both
raw fuel expense
(as defined below) plus the effect of mark-to-market adjustments to our fuel hedge portfolio included in our consolidated statement of operations as the value of that portfolio increases and decreases. Our aircraft fuel expense is very volatile, even between quarters, because it includes these gains or losses in the value of the underlying instrument as crude oil prices and refining margins increase or decrease.
Raw fuel expense
is defined as the price that we generally pay at the airport, or the “into-plane” price, including taxes and fees. Raw fuel prices are impacted by world oil prices and refining costs, which can vary by region in the U.S.
Raw fuel expense
approximates cash paid to suppliers and does not reflect the effect of our fuel hedges.
Aircraft fuel expense increased
$211.6
million, or
38.5%
, compared to
2009
. The elements of the change are illustrated in the following table:
|
|
Years Ended December 31
|
||||||||
|
(in millions, except per-gallon amounts)
|
2010
|
2009
|
%Change
|
||||||
|
Fuel gallons consumed
|
319.6
|
|
304.9
|
|
4.8
|
||||
|
Raw price per gallon
|
$
|
2.38
|
|
$
|
1.88
|
|
26.6
|
||
|
Total raw fuel expense
|
$
|
760.1
|
|
$
|
572.3
|
|
32.8
|
||
|
Net impact on fuel expense from (gains) and losses arising from fuel-hedging activities
|
0.5
|
|
(23.3
|
)
|
NM
|
||||
|
Aircraft fuel expense
|
$
|
760.6
|
|
$
|
549.0
|
|
38.5
|
||
NM = Not Meaningful
Fuel gallons consumed increased
4.8%
, primarily as a result of a 2.4% increase in block hours, partially offset by better fuel efficiency stemming from longer average stage lengths.
The raw fuel price per gallon rose
26.6%
as a result of higher West Coast jet fuel prices driven by higher crude oil costs and refining margins.
We also evaluate economic fuel expense, which we define as raw fuel expense less the cash we receive from hedge counterparties for hedges that settle during the period, offset by the premium expense that we paid for those contracts. A key difference between aircraft fuel expense and economic fuel expense is the timing of gain or loss recognition on our hedge portfolio. When we refer to economic fuel expense, we include gains and losses only when they are realized for those contracts that were settled during the period based on their original contract terms. We believe this is the best measure of the effect that fuel prices are currently having on our business because it most closely approximates the net cash outflow associated with purchasing fuel for our operations. Accordingly, many industry analysts evaluate our results using this measure, and it is the basis for most internal management reporting and incentive pay plans.
Our
economic fuel expense
is calculated as follows:
|
|
Years Ended December 31
|
||||||||
|
(in millions, except per-gallon amounts)
|
2010
|
2009
|
%Change
|
||||||
|
Raw fuel expense
|
$
|
760.1
|
|
$
|
572.3
|
|
32.8
|
||
|
Plus or minus: net of cash received from settled hedges and premium expense recognized
|
(2.8
|
)
|
50.4
|
|
NM
|
||||
|
Economic fuel expense
|
$
|
757.3
|
|
$
|
622.7
|
|
21.6
|
||
|
Fuel gallons consumed
|
319.6
|
|
304.9
|
|
4.8
|
||||
|
Economic fuel cost per gallon
|
$
|
2.37
|
|
$
|
2.05
|
|
15.6
|
||
NM = Not Meaningful
As noted above, the total net benefit recognized for hedges that settled during the period was
$2.8
million in
2010
, compared to a net expense of
$50.4 million
in
2009
. These amounts represent the net of the premium expense recognized for those hedges and any cash received or paid upon settlement.
We currently expect our economic fuel price per gallon to be approximately $2.80 in the first quarter of
2011
due to the rising cost of crude oil. As oil prices are volatile, we are unable to forecast the full year cost with any certainty.
32
Aircraft Maintenance
Aircraft maintenance declined by
$10.8
million, or
6.4%
, compared to the prior year primarily because of less expensive events, lower component costs, and decreased costs associated with aircraft returns. We expect aircraft maintenance to remain relatively flat in
2011
.
Aircraft Rent
Aircraft rent declined
$11.9 million
, or
10.9%
, compared to
2009
as a result of the return of five leased aircraft in 2010. We expect aircraft rent to be lower in 2011 as we annualize lease returns from 2010. We currently do not expect any leased aircraft to be returned in 2011, nor do we expect to lease any new aircraft.
Landing Fees and Other Rents
Landing fees and other rents increased
$6.5 million
, or
3.9%
, compared to
2009
. The increase is attributable to higher rates in many airports across our network and more departures. We expect landing fees to be higher in 2011 due to increased departure volume.
Selling Expenses
Selling expenses increased by
$19.8
million, or
18.9%
, compared to
2009
as a result of higher credit card and travel agency commissions and ticket distribution costs resulting from the increase in passenger revenue.
We expect selling expenses will be higher in
2011
as compared to
2010
, primarily due to higher revenue-related expenses.
Depreciation and Amortization
Depreciation and amortization increased
$10.0
million, or
5.6%
, compared to
2009
. This is primarily due to the four B737-800 aircraft delivered in
2010
and a full period of depreciation for aircraft delivered in
2009
.
We expect depreciation and amortization to be higher in
2011
due to the full-year impact of aircraft that were delivered in
2010
and for expected 2011 aircraft deliveries.
Food and Beverage Service
Food and beverage costs increased
$7.5 million
, or
15.7%
, from 2009 due to an increased number of passengers, the higher cost of some of our fresh food items served on board, and increased costs associated with food delivery. We expect food and beverage costs to increase in 2011 due to increased passenger and departure volume.
Other Operating Expenses
Other operating expenses declined
$5.3
million, or
3.4%
, compared to the prior year. The decline is primarily driven by a reduction in outside professional services costs and lower personnel non-wage costs, partially offset by higher property taxes. We expect other operating expenses to be higher in 2011.
New Pilot Contract Transition Costs
During 2009, in connection with a new four-year contract, Alaska's pilots received a one-time aggregate bonus of $20.3 million. We also recorded transition expense associated with establishing the new sick-leave payout program which totaled $15.5 million, bringing the total pilot contract transition cost to $35.8 million.
33
Mainline Operating Costs per Available Seat Mile (CASM)
Our mainline operating costs per mainline ASM are summarized below:
|
|
Years Ended December 31
|
|||||||
|
|
2010
|
|
2009
|
|
% Change
|
|||
|
Total mainline operating expenses per ASM (CASM)
|
10.96
|
|
¢
|
10.78
|
|
¢
|
1.7
|
|
|
Less the following components:
|
|
|
|
|
|
|
||
|
Aircraft fuel costs per ASM
|
3.11
|
|
¢
|
2.37
|
|
¢
|
31.2
|
|
|
New pilot contract transition costs per ASM
|
—
|
|
0.15
|
|
¢
|
NM
|
|
|
|
CASM, excluding fuel and noted items
|
7.85
|
|
¢
|
8.26
|
|
¢
|
(5.0
|
)
|
NM = Not Meaningful
We have listed separately in the above table our fuel costs per ASM and our unit costs, excluding fuel and other noted items. These amounts are included in CASM, but for internal purposes we consistently use unit cost metrics that exclude fuel and certain special items to measure our cost-reduction progress. We believe that such analysis may be important to investors and other readers of these financial statements for the following reasons:
|
•
|
By eliminating fuel expense and certain special items from our unit cost metrics, we believe that we have better visibility into the results of our non-fuel cost-reduction initiatives. Our industry is highly competitive and is characterized by high fixed costs, so even a small reduction in non-fuel operating costs can result in a significant improvement in operating results. In addition, we believe that all domestic carriers are similarly impacted by changes in jet fuel costs over the long run, so it is important for management (and thus investors) to understand the impact of (and trends in) company-specific cost drivers such as labor rates and productivity, airport costs, maintenance costs, etc., which are more controllable by management.
|
|
•
|
Cost per ASM excluding fuel and certain special items is one of the most important measures used by our management and by our Board of Directors in assessing quarterly and annual cost performance. For Alaska, these decision-makers evaluate operating results of the “mainline” operation, which includes the operation of the B737 fleet branded in Alaska Airlines livery. The revenue and expenses associated with purchased capacity are evaluated separately.
|
|
•
|
Cost per ASM excluding fuel (and other items as specified in our incentive pay plan documents) is an important metric for the PBP incentive plan that covers our employees.
|
|
•
|
Cost per ASM excluding fuel and certain special items is a measure commonly used by industry analysts, and we believe it is the basis by which they compare our airlines to others in the industry. The measure is also the subject of frequent questions from investors.
|
|
•
|
Disclosure of the individual impact of certain noted items provides investors the ability to measure and monitor performance both with and without these special items. We believe that disclosing the impact of certain items such as fleet transition costs, new pilot contract transition costs, and restructuring charges is important because it provides information on significant items that are not necessarily indicative of future performance. Industry analysts and investors consistently measure our performance without these items for better comparability between periods and among other airlines.
|
|
•
|
Although we disclose our “mainline” passenger unit revenue for Alaska, we do not (nor are we able to) evaluate mainline unit revenue excluding the impact that changes in fuel costs have had on ticket prices. Fuel expense represents a large percentage of our total mainline operating expenses. Fluctuations in fuel prices often drive changes in unit revenue in the mid-to-long term. Although we believe it is useful to evaluate non-fuel unit costs for the reasons noted above, we would caution readers of these financial statements not to place undue reliance on unit costs excluding fuel as a measure or predictor of future profitability because of the significant impact of fuel costs on our business.
|
We currently forecast our mainline costs per ASM excluding fuel and other special items for the first quarter and full year of
2011
to be down 5% to 6% and 3% respectively, compared to
2010
. The expected decline in unit cost stems from expected capacity growth of 13% in the first quarter and 8% to 9% for the full year, partially offset by higher non-fuel operating costs as described in the preceding pages. Historical cost per ASM excluding fuel and other special items can be found in Item 6,
34
“Selected Consolidated Financial and Operating Data.”
Purchased Capacity Costs
Purchased capacity costs increased
$17.4
million compared to
2009
. Of the total, $
274.4
million was paid to Horizon under the Capacity Purchase Agreement (CPA) for 1.4 billion ASMs. This expense is eliminated in consolidation. For 2011, the amount recorded as purchased capacity cost will increase significantly as Horizon discontinued its "brand flying" effective January 1, 2011 and moved to an all-CPA model.
35
HORIZON AIR FINANCIAL AND STATISTICAL DATA
|
|
Three Months Ended December 31
|
|
Year Ended December 31
|
|
|||||||||||||||||||||||||
|
Financial Data
(in millions)
:
|
2010
|
|
2009
|
|
% Change
|
|
2010
|
|
2009
|
|
% Change
|
|
2008
|
|
% Change
|
|
|||||||||||||
|
Operating Revenues:
|
|
|
|
|
|
|
|
|
|
|
|
|
|
|
|
|
|||||||||||||
|
Passenger - brand flying
|
$
|
95.1
|
|
|
$
|
98.2
|
|
|
(3.2
|
)
|
$
|
394.5
|
|
|
$
|
381.9
|
|
|
3.3
|
|
$
|
429.2
|
|
|
(11.0
|
)
|
|
||
|
Passenger - capacity purchase arrangements (a)
|
71.6
|
|
|
70.5
|
|
|
1.6
|
|
274.4
|
|
|
261.7
|
|
|
4.9
|
|
293.7
|
|
|
(10.9
|
)
|
||||||||
|
Total passenger revenue
|
166.7
|
|
|
168.7
|
|
|
(1.2
|
)
|
668.9
|
|
|
643.6
|
|
|
3.9
|
|
722.9
|
|
|
(11.0
|
)
|
||||||||
|
Freight and mail
|
0.6
|
|
|
0.7
|
|
|
(14.3
|
)
|
2.5
|
|
|
2.7
|
|
|
(7.4
|
)
|
2.7
|
|
|
—
|
|
||||||||
|
Other - net
|
2.3
|
|
|
2.1
|
|
|
9.5
|
|
8.6
|
|
|
8.1
|
|
|
6.2
|
|
8.3
|
|
|
(2.4
|
)
|
||||||||
|
Total Operating Revenues
|
169.6
|
|
|
171.5
|
|
|
(1.1
|
)
|
680.0
|
|
|
654.4
|
|
|
3.9
|
|
733.9
|
|
|
(10.8
|
)
|
||||||||
|
Operating Expenses:
|
|
|
|
|
|
|
|
|
|
|
|
|
|
|
|
|
|
|
|
|
|
||||||||
|
Wages and benefits
|
47.8
|
|
|
48.2
|
|
|
(0.8
|
)
|
183.0
|
|
|
185.2
|
|
|
(1.2
|
)
|
194.1
|
|
|
(4.6
|
)
|
||||||||
|
Variable incentive pay
|
6.5
|
|
|
6.2
|
|
|
4.8
|
|
17.0
|
|
|
14.4
|
|
|
18.1
|
|
5.6
|
|
|
157.1
|
|
||||||||
|
Aircraft fuel, including hedging gains and losses
|
31.4
|
|
|
29.4
|
|
|
6.8
|
|
140.3
|
|
|
109.1
|
|
|
28.6
|
|
236.0
|
|
|
(53.8
|
)
|
||||||||
|
Aircraft maintenance
|
15.5
|
|
|
13.6
|
|
|
14.0
|
|
57.4
|
|
|
53.2
|
|
|
7.9
|
|
58.2
|
|
|
(8.6
|
)
|
||||||||
|
Aircraft rent
|
9.7
|
|
|
11.1
|
|
|
(12.6
|
)
|
41.8
|
|
|
44.7
|
|
|
(6.5
|
)
|
56.9
|
|
|
(21.4
|
)
|
||||||||
|
Landing fees and other rentals
|
15.9
|
|
|
15.3
|
|
|
3.9
|
|
60.7
|
|
|
57.7
|
|
|
5.2
|
|
57.2
|
|
|
0.9
|
|
||||||||
|
Contracted services
|
8.3
|
|
|
8.3
|
|
|
—
|
|
33.3
|
|
|
32.1
|
|
|
3.7
|
|
29.1
|
|
|
10.3
|
|
||||||||
|
Selling expenses
|
6.9
|
|
|
6.6
|
|
|
4.5
|
|
29.3
|
|
|
27.1
|
|
|
8.1
|
|
31.1
|
|
|
(12.9
|
)
|
||||||||
|
Depreciation and amortization
|
10.4
|
|
|
10.7
|
|
|
(2.8
|
)
|
41.0
|
|
|
39.5
|
|
|
3.8
|
|
37.5
|
|
|
5.3
|
|
||||||||
|
Food and beverage service
|
0.6
|
|
|
0.6
|
|
|
—
|
|
2.3
|
|
|
2.4
|
|
|
(4.2
|
)
|
2.6
|
|
|
(7.7
|
)
|
||||||||
|
Other
|
10.0
|
|
|
10.4
|
|
|
(3.8
|
)
|
36.3
|
|
|
39.4
|
|
|
(7.9
|
)
|
42.7
|
|
|
(7.7
|
)
|
||||||||
|
Fleet transition costs - CRJ-700
|
—
|
|
|
—
|
|
|
NM
|
|
13.2
|
|
|
—
|
|
|
NM
|
|
13.5
|
|
|
NM
|
|
||||||||
|
Fleet transition costs - Q200
|
—
|
|
|
—
|
|
|
NM
|
|
—
|
|
|
8.8
|
|
|
NM
|
|
10.2
|
|
|
NM
|
|
||||||||
|
Total Operating Expenses
|
163.0
|
|
|
160.4
|
|
|
1.6
|
|
655.6
|
|
|
613.6
|
|
|
6.8
|
|
774.7
|
|
|
(20.8
|
)
|
||||||||
|
Operating Income (Loss)
|
6.6
|
|
|
11.1
|
|
NM
|
|
|
24.4
|
|
|
40.8
|
|
NM
|
|
(40.8
|
)
|
NM
|
|
||||||||||
|
Interest income
|
1.0
|
|
|
0.5
|
|
|
|
|
3.6
|
|
|
2.0
|
|
|
|
5.4
|
|
|
|
||||||||||
|
Interest expense
|
(4.7
|
)
|
(3.8
|
)
|
|
|
|
(20.5
|
)
|
(20.1
|
)
|
|
|
(23.8
|
)
|
|
|
||||||||||||
|
Interest capitalized
|
0.5
|
|
—
|
|
|
|
|
0.5
|
|
0.3
|
|
|
|
3.0
|
|
|
|
||||||||||||
|
Other - net
|
(0.1
|
)
|
(0.1
|
)
|
|
|
|
(0.4
|
)
|
(0.2
|
)
|
|
|
0.4
|
|
|
|
||||||||||||
|
|
(3.3
|
)
|
(3.4
|
)
|
|
|
|
(16.8
|
)
|
(18.0
|
)
|
|
|
(15.0
|
)
|
|
|
||||||||||||
|
Income (Loss) Before Income Tax
|
$
|
3.3
|
|
|
$
|
7.7
|
|
NM
|
|
|
$
|
7.6
|
|
|
$
|
22.8
|
|
NM
|
|
$
|
(55.8
|
)
|
NM
|
|
|||||
|
Combined Operating Statistics:
|
|
|
|
|
|
|
|
|
|
|
|
|
|
|
|
|
|
|
|
|
|
|
|||||||
|
Revenue passengers (000)
|
1,704
|
|
|
1,704
|
|
|
—
|
|
|
6,820
|
|
|
6,759
|
|
|
0.9
|
|
7,390
|
|
|
(8.5
|
)
|
|||||||
|
RPMs (000,000) "traffic"
|
593
|
|
|
609
|
|
|
(2.6
|
)
|
|
2,450
|
|
|
2,408
|
|
|
1.7
|
|
2,635
|
|
|
(8.6
|
)
|
|||||||
|
ASMs (000,000) "capacity"
|
774
|
|
|
822
|
|
|
(5.8
|
)
|
|
3,235
|
|
|
3,292
|
|
|
(1.7
|
)
|
3,617
|
|
|
(9.0
|
)
|
|||||||
|
Passenger load factor
|
76.6
|
|
%
|
74.1
|
|
%
|
2.5
|
|
pts
|
75.7
|
|
%
|
73.1
|
|
%
|
2.6
|
|
pts
|
72.9
|
|
%
|
0.2
|
|
pts
|
|||||
|
Yield per passenger mile
|
28.11
|
|
¢
|
27.70
|
|
¢
|
1.5
|
|
27.30
|
|
¢
|
26.73
|
|
¢
|
2.1
|
|
27.43
|
|
¢
|
(2.6
|
)
|
|
|||||||
|
RASM
|
21.91
|
|
¢
|
20.86
|
|
¢
|
5.0
|
|
21.02
|
|
¢
|
19.88
|
|
¢
|
5.7
|
|
20.29
|
|
¢
|
(2.0
|
)
|
|
|||||||
|
PRASM
|
21.54
|
|
¢
|
20.52
|
|
¢
|
5.0
|
|
20.68
|
|
¢
|
19.55
|
|
¢
|
5.8
|
|
19.99
|
|
¢
|
(2.2
|
)
|
|
|||||||
|
Operating expenses per ASM
|
21.06
|
|
¢
|
19.51
|
|
¢
|
7.9
|
|
20.27
|
|
¢
|
18.64
|
|
¢
|
8.7
|
|
21.42
|
|
¢
|
(13.0
|
)
|
|
|||||||
|
Aircraft fuel cost per ASM
|
4.06
|
|
¢
|
3.57
|
|
¢
|
13.7
|
|
4.34
|
|
¢
|
3.31
|
|
¢
|
31.1
|
|
6.53
|
|
¢
|
(49.3
|
)
|
|
|||||||
|
CRJ-700 fleet transition costs per ASM
|
—
|
|
¢
|
—
|
|
¢
|
NM
|
|
0.41
|
|
¢
|
—
|
|
¢
|
NM
|
|
0.37
|
|
¢
|
NM
|
|
|
|||||||
|
Operating expenses per ASM, excluding fuel and CRJ-700 fleet transition costs
|
17.00
|
|
¢
|
15.94
|
|
¢
|
6.6
|
|
15.52
|
|
¢
|
15.33
|
|
¢
|
1.2
|
|
14.52
|
|
¢
|
5.5
|
|
||||||||
|
Q200 fleet transition costs per ASM
|
—
|
|
¢
|
—
|
|
¢
|
NM
|
|
—
|
|
¢
|
0.27
|
|
¢
|
NM
|
|
0.28
|
|
¢
|
NM
|
|
||||||||
|
Aircraft fuel cost per gallon
|
$
|
2.25
|
|
|
$
|
1.96
|
|
|
14.8
|
|
$
|
2.43
|
|
|
$
|
1.82
|
|
|
33.5
|
|
$
|
3.53
|
|
|
(48.4
|
)
|
|||
|
Economic fuel cost per gallon
|
$
|
2.57
|
|
|
$
|
2.32
|
|
|
10.8
|
|
$
|
2.40
|
|
|
$
|
2.07
|
|
|
15.9
|
|
$
|
3.05
|
|
|
(32.1
|
)
|
|||
|
Fuel gallons (000,000)
|
14.0
|
|
|
15.0
|
|
|
(6.7
|
)
|
57.7
|
|
|
60.1
|
|
|
(4.0
|
)
|
66.9
|
|
|
(10.2
|
)
|
||||||||
|
Average number of full-time equivalent employees
|
2,938
|
|
|
3,275
|
|
|
(10.3
|
)
|
3,045
|
|
|
3,308
|
|
|
(8.0
|
)
|
3,699
|
|
|
(10.6
|
)
|
||||||||
|
Aircraft utilization (blk hrs/day)
|
8.1
|
|
|
8.1
|
|
|
—
|
|
8.0
|
|
|
8.3
|
|
|
(3.6
|
)
|
8.3
|
|
|
—
|
|
||||||||
|
Average aircraft stage length (miles)
|
331
|
|
|
330
|
|
|
0.3
|
|
|
333
|
|
|
327
|
|
|
1.8
|
|
|
322
|
|
|
1.6
|
|
||||||
|
Operating fleet at period-end
|
54
|
|
|
58
|
|
|
(4
|
)
|
a/c
|
54
|
|
|
58
|
|
|
(4
|
)
|
a/c
|
59
|
|
|
(1
|
)
|
a/c
|
|||||
NM = Not Meaningful
36
HORIZON AIR
Horizon reported pretax income of
$7.6
million in
2010
compared to pretax income of $22.8 million in
2009
. The decline in earnings is primarily due to higher aircraft fuel expense and higher restructuring and fleet transition costs, partially offset by an increase in operating revenue.
Excluding the items noted in the table below, Horizon would have reported pretax income of
$22.8
million in
2010
compared to
$7.7 million
in
2009
. See the previous discussion under “Adjusted Non-GAAP Earnings and Per-Share Amounts” for additional information about these non-GAAP measures.
|
|
Year Ended December 31
|
||||||
|
(in millions)
|
2010
|
2009
|
|||||
|
Income before income taxes, excluding items below
|
$
|
22.8
|
|
$
|
7.7
|
|
|
|
Fleet transition costs – CRJ-700
|
(13.2
|
)
|
—
|
|
|||
|
Mark-to-market fuel hedge adjustments
|
(2.0
|
)
|
15.1
|
|
|||
|
Income before income taxes as reported
|
$
|
7.6
|
|
$
|
22.8
|
|
|
HORIZON REVENUES
During 2010, operating revenues increased
3.9%
compared to
2009
. Horizon’s passenger revenues are summarized in the following table:
|
(dollars in millions)
|
Years Ended December 31
|
||||||||||||
|
2010
|
2009
|
||||||||||||
|
Revenues
|
% ASMs
|
Revenues
|
% ASMs
|
||||||||||
|
Passenger revenue from Horizon “brand” flying
|
$
|
394.5
|
|
59
|
|
$
|
381.9
|
|
59
|
|
|||
|
Revenue from capacity purchase arrangements (CPA) with Alaska
|
274.4
|
|
41
|
|
261.7
|
|
41
|
|
|||||
|
Total passenger revenue and % of ASMs
|
$
|
668.9
|
|
100
|
%
|
$
|
643.6
|
|
100
|
%
|
|||
Line-of-business information is presented in the table below. Beginning January 1, 2011, all of the flying performed by Horizon will be under a CPA arrangement with Alaska.
|
|
Year Ended December 31, 2010
|
|||||||||||||||||||||||||
|
|
Capacity and Mix
|
Load Factor
|
Yield
|
RASM
|
||||||||||||||||||||||
|
|
Actual
(in millions)
|
% Change
Y-O-Y
|
Current %
Total
|
Actual
|
Point
Change
Y-O-Y
|
Actual
|
|
% Change
Y-O-Y
|
Actual
|
|
% Change
Y-O-Y
|
|||||||||||||||
|
Brand Flying
|
1,797
|
|
(6.7
|
)
|
56
|
|
74.4
|
%
|
2.0
|
|
29.51
|
|
¢
|
7.8
|
|
22.58
|
|
¢
|
10.8
|
|
||||||
|
Alaska CPA
|
1,438
|
|
5.3
|
|
44
|
|
NM
|
|
NM
|
|
NM
|
|
|
NM
|
|
19.08
|
|
¢
|
(0.5
|
)
|
||||||
|
System Total
|
3,235
|
|
(1.7
|
)
|
100
|
|
75.7
|
%
|
2.6
|
|
27.30
|
|
¢
|
2.1
|
|
21.02
|
|
¢
|
5.7
|
|
||||||
NM = Not Meaningful
Passenger revenue from Horizon brand flying increased $
12.6
million, or
3.3%
, on a 10.8% increase in passenger unit revenues, partially offset by a
6.7
% decline in brand capacity. The increase in unit revenue is due to a
2.0
-point improvement in load factor and a
7.8
% increase in ticket yield.
Revenue from CPA flying performed on behalf of Alaska totaled
$274.4 million
during
2010
compared to $261.7 million during
2009
. The increase is primarily due to a
5.3
% increase in capacity provided under this arrangement. This revenue is eliminated in consolidation.
HORIZON EXPENSES
Total operating expenses increased $
42.0
million, or
6.8%
, as compared to
2009
. Significant period-over-period changes in the components of operating expenses are as follows.
37
Aircraft Fuel
Aircraft fuel increased $
31.2
million, or
28.6%
, compared to the same period in
2009
. The elements of the change are illustrated in the following table:
|
|
Years Ended December 31
|
|||||||||
|
(in millions, except per-gallon amounts)
|
2010
|
2009
|
%Change
|
|||||||
|
Fuel gallons consumed
|
57.7
|
|
60.1
|
|
(4.0
|
)
|
||||
|
Raw price per gallon
|
$
|
2.41
|
|
$
|
1.90
|
|
26.8
|
|
||
|
Total raw fuel expense
|
$
|
138.8
|
|
$
|
113.9
|
|
21.9
|
|
||
|
Net impact on fuel expense from (gains) and losses arising from fuel-hedging activities
|
1.5
|
|
(4.8
|
)
|
NM
|
|
||||
|
Aircraft fuel expense
|
$
|
140.3
|
|
$
|
109.1
|
|
28.6
|
|
||
NM = Not Meaningful
Fuel gallons consumed declined by 4% due to a 1.7% decline in capacity and improved fuel burn as we continue our transition to the more fuel-efficient Q400 aircraft. The raw fuel price per gallon increased by
26.8
% as a result of higher West Coast jet fuel prices.
Our
economic fuel expense
is calculated as follows:
|
|
Years Ended December 31
|
|||||||||
|
(in millions, except per-gallon amounts)
|
2010
|
2009
|
%Change
|
|||||||
|
Raw fuel expense
|
$
|
138.8
|
|
$
|
113.9
|
|
21.9
|
|
||
|
Plus or minus: net of cash received from settled hedges and premium expense recognized
|
(0.5
|
)
|
10.3
|
|
NM
|
|
||||
|
Economic fuel expense
|
$
|
138.3
|
|
$
|
124.2
|
|
11.4
|
|
||
|
Fuel gallons consumed
|
57.7
|
|
60.1
|
|
(4.0
|
)
|
||||
|
Economic fuel cost per gallon
|
$
|
2.40
|
|
$
|
2.07
|
|
15.9
|
|
||
NM = Not Meaningful
The total net benefit recognized for hedges that settled during the period was
$0.5 million
in
2010
, compared to a net expense of $10.3 million in
2009
. These amounts represent the net of the premium expense recognized for those hedges and any cash received or paid upon settlement.
Restructuring and Fleet Transition Costs
We recorded $10.3 million in 2010 related to the removal of five CRJ-700 aircraft from our operations under sublease or lease assignment to third-party carriers. We also recorded $2.9 million of restructuring charges associated with the voluntary separation of a number of employees resulting from the decision to outsource the remaining aircraft heavy maintenance function to a third party.
In 2009, fleet transition costs associated with the removal of Q200 aircraft from the operating fleet were $8.8 million as the final Q200 aircraft were removed from operation.
All Other Operating Expenses
All other operating expenses increased by $6.4 million due primarily to a $4.2 million increase in aircraft maintenance expense driven by higher engine events and a $3.0 million increase in landing fees and rents from higher rates in many airports. These increases were partially offset by a $2.9 million decline in aircraft rent due to the removal of five leased CRJ-700 aircraft during the year, and a $3.1 million decline in other operating expenses.
38
Operating Costs per Available Seat Mile (CASM)
Our operating costs per ASM are summarized below:
|
|
Years Ended December 31
|
|||||||
|
|
2010
|
|
2009
|
|
%Change
|
|||
|
Total operating expenses per ASM (CASM)
|
20.27
|
|
¢
|
18.64
|
|
¢
|
8.7
|
|
|
CASM includes the following components:
|
|
|
|
|
|
|
|
|
|
Fuel costs per ASM
|
4.34
|
|
¢
|
3.31
|
|
¢
|
31.1
|
|
|
CRJ-700 fleet transition costs per ASM
|
0.41
|
|
¢
|
—
|
|
NM
|
|
|
|
CASM, excluding fuel and noted items
|
15.52
|
|
¢
|
15.33
|
|
¢
|
1.2
|
|
|
Q200 fleet transition costs per ASM
|
—
|
|
0.27
|
|
¢
|
NM
|
|
|
NM = Not Meaningful
CONSOLIDATED NONOPERATING INCOME (EXPENSE)
Net nonoperating expense was
$65.7 million
in
2010
compared to
$64.5 million
in
2009
. Interest expense increased $4.0 million primarily due to the write-off of deferred financing costs and prepayment penalties on debt prepaid in 2010, partially offset by lower average interest rates on our variable-rate debt and a lower average debt balance. Other—net nonoperating income (expense) improved by $6.6 million compared to
2009
primarily due to larger realized gains on the sale of marketable securities.
CONSOLIDATED INCOME TAX EXPENSE (BENEFIT)
Our consolidated effective income tax rate on pretax income for
2010
was 38.1%, compared to 40.1% for
2009
. The difference between the effective tax rates for both periods and our marginal tax rate of approximately 37.9% is due to nondeductible expenses, such as employee per-diem costs and stock-based compensation expense recorded for certain stock awards.
Our effective tax rate can vary significantly between quarters and for the full year, depending on the magnitude of non-deductible expenses in proportion to pretax results.
2009 COMPARED WITH 2008
Our consolidated net income for 2009 was $121.6 million, or $3.36 per diluted share, compared to a net loss of $135.9 million, or $3.74 per share, in 2008. Items that impact the comparability between the periods are as follows:
|
•
|
Both periods include adjustments to reflect timing of gain and loss recognition resulting from mark-to-market fuel hedge accounting. For 2009, we recognized net mark-to-market gains of $88.8 million ($55.2 million after tax, or $1.53 per share), compared to net losses of $142.3 million ($89.2 million after tax, or $2.46 per share) in 2008.
|
|
•
|
2009 included the new pilot contract transition costs of $35.8 million ($22.3 million after tax, or $0.62 per share).
|
|
•
|
2008 included fleet transition costs of $61.0 million ($38.2 million after tax, or $1.05 per share) related to the ongoing transitions out of the MD-80 and CRJ-700 fleets.
|
|
•
|
2008 included realized losses on the early termination of fuel-hedge contracts originally scheduled to settle in 2009 and 2010 of $50 million ($31.3 million after tax, or $0.86 per share).
|
|
•
|
2008 included a $42.3 million benefit ($26.5 million after tax, or $0.73 per share) related to a change in the terms of our Mileage Plan program.
|
|
•
|
2008 included restructuring charges of $12.9 million ($8.1 million after tax, or $0.22 per share) related to the reduction in work force at Alaska.
|
39
ADJUSTED (NON-GAAP) RESULTS AND
PER-SHARE AMOUNTS
Excluding the items noted above, and as shown in the following table, our consolidated net income for 2009 was $88.7 million, or $2.45 per diluted share, compared to $4.4 million, or $0.12 per diluted share, in 2008.
|
|
Years Ended December 31
|
|||||||||||||||
|
|
2009
|
2008
|
||||||||||||||
|
(in millions except per share amounts)
|
Dollars
|
Diluted EPS
|
Dollars
|
Diluted EPS
|
||||||||||||
|
Net income and diluted EPS, excluding noted items
|
$
|
88.7
|
|
$
|
2.45
|
|
$
|
4.4
|
|
$
|
0.12
|
|
||||
|
Change in Mileage Plan terms, net of tax
|
--
|
|
--
|
|
26.5
|
|
0.73
|
|
||||||||
|
New pilot contract transition costs, net of tax
|
(22.3
|
)
|
(0.62
|
)
|
--
|
|
--
|
|
||||||||
|
Restructuring charges, net of tax
|
--
|
|
--
|
|
(8.1
|
)
|
(0.22
|
)
|
||||||||
|
Fleet transition costs – MD-80, net of tax
|
--
|
|
--
|
|
(29.8
|
)
|
(0.82
|
)
|
||||||||
|
Fleet transition costs – CRJ-700, net of tax
|
--
|
|
--
|
|
(8.4
|
)
|
(0.23
|
)
|
||||||||
|
Mark-to-market fuel hedge adjustments, net of tax
|
55.2
|
|
1.53
|
|
(89.2
|
)
|
(2.46
|
)
|
||||||||
|
Realized losses on hedge portfolio restructuring, net of tax
|
--
|
|
--
|
|
(31.3
|
)
|
(0.86
|
)
|
||||||||
|
Net income and diluted EPS as reported
|
$
|
121.6
|
|
$
|
3.36
|
|
$
|
(135.9
|
)
|
$
|
(3.74
|
)
|
||||
ALASKA AIRLINES
Alaska reported income before income taxes of $183.8 million in 2009 compared to a loss before income taxes of $153.3 million in 2008.
Excluding certain items as noted in the table below, Alaska would have reported income before income taxes of $145.9 million in 2009, compared to $25.2 million in 2008. See the previous discussion under “Adjusted Non-GAAP Earnings and Per-Share Amounts” for additional information about these non-GAAP measures.
|
|
Years Ended December 31
|
||||||
|
(in millions)
|
2009
|
2008
|
|||||
|
Income before income taxes, excluding items below
|
$
|
145.9
|
|
$
|
25.2
|
|
|
|
Change in Mileage Plan terms
|
—
|
|
42.3
|
|
|||
|
New pilot contract transition costs
|
(35.8
|
)
|
—
|
|
|||
|
Restructuring charges
|
—
|
|
(12.9
|
)
|
|||
|
Fleet transition costs – MD-80
|
—
|
|
(47.5
|
)
|
|||
|
Mark-to-market fuel hedge adjustments
|
73.7
|
|
(118.9
|
)
|
|||
|
Realized losses on hedge portfolio restructuring
|
—
|
|
(41.5
|
)
|
|||
|
Income (loss) before income taxes as reported
|
$
|
183.8
|
|
$
|
(153.3
|
)
|
|
The discussion below outlines significant variances between the two periods.
ALASKA REVENUES
Total operating revenues declined $215.3 million, or 6.7%, during 2009 compared to 2008. The changes are summarized in the following table:
|
|
Years Ended December 31
|
|||||||||
|
(in millions)
|
2009
|
2008
|
%Change
|
|||||||
|
Passenger revenue—mainline
|
$
|
2,438.8
|
|
$
|
2,643.7
|
|
(7.8
|
)
|
||
|
Freight and mail
|
91.5
|
|
99.3
|
|
(7.9
|
)
|
||||
|
Other—net
|
187.3
|
|
135.2
|
|
38.5
|
|
||||
|
Change in Mileage Plan terms
|
—
|
|
42.3
|
|
NM
|
|
||||
|
Total mainline operating revenues
|
$
|
2,717.6
|
|
$
|
2,920.5
|
|
(6.9
|
)
|
||
|
Passenger revenue—purchased capacity
|
288.4
|
|
300.8
|
|
(4.1
|
)
|
||||
|
Total operating revenues
|
$
|
3,006.0
|
|
$
|
3,221.3
|
|
(6.7
|
)
|
||
NM = Not Meaningful
40
Operating Revenues – Mainline
Mainline passenger revenue in 2009 fell by 7.8% on a 4.4% reduction in capacity. There was a 3.5% decline in PRASM, which was driven by a 6.0% drop in ticket yield compared to 2008, partially offset by a two-point increase in load factor.
Passenger revenues were also bolstered by the implementation of our first-checked-bag fee in the third quarter of 2009 ($34.5 million) and the full-year impact of our second-checked-bag fee implemented in the third quarter of 2008, partially offset by a decline in other fees that resulted from fewer passengers.
Freight and mail revenue decreased $7.8 million, or 7.9%, primarily as a result of lower mail volumes and yield and lower freight fuel surcharges because of the decline in fuel prices in 2009, partially offset by higher freight volumes and better freight pricing.
Other—net revenue increased $52.1 million, or 38.5%, from 2008. Mileage Plan revenue increased by $50.0 million primarily because of an increase in the rate paid to us by our credit card partner under the affinity card agreement and an increase in the number of miles needed to redeem a travel award.
Passenger Revenue – Purchased Capacity
Passenger revenue—purchased capacity flying fell by $12.4 million compared to 2008 because of a 2.6% decline in capacity combined with a 1.6% decrease in unit revenue compared to the prior year. Unit revenue dropped as a result of a 1.3-point decline in load factor on flat ticket yield.
ALASKA EXPENSES
For 2009, total operating expenses decreased $573.0 million or 17.1% compared to 2008 as a result of lower mainline operating costs, most notably aircraft fuel and fleet transition charges, partially offset by higher wages and benefits and new pilot contract transition costs.
We believe it is useful to summarize operating expenses as follows, which is consistent with the way expenses are reported internally and evaluated by management:
|
|
Years Ended December 31
|
|||||||||
|
(in millions)
|
2009
|
2008
|
%Change
|
|||||||
|
Mainline fuel expense
|
$
|
549.0
|
|
$
|
1,162.4
|
|
(52.8
|
)
|
||
|
Mainline non-fuel expenses
|
1,946.7
|
|
1,874.1
|
|
3.9
|
|
||||
|
Mainline operating expenses
|
$
|
2,495.7
|
|
$
|
3,036.5
|
|
(17.8
|
)
|
||
|
Purchased capacity costs
|
281.5
|
|
313.7
|
|
(10.3
|
)
|
||||
|
Total Operating Expenses
|
$
|
2,777.2
|
|
$
|
3,350.2
|
|
(17.1
|
)
|
||
Mainline Operating Expenses
Total mainline operating expenses declined $540.8 million or 17.8% during 2009 compared to 2008. Significant operating expense variances from 2008 are more fully described below.
Wages and Benefits
Wages and benefits were up $49.9 million, or 6.7%, compared to 2008. The primary components of wages and benefits are shown in the following table:
|
|
Years Ended December 31
|
|||||||||
|
(in millions)
|
2009
|
2008
|
%Change
|
|||||||
|
Wages
|
$
|
540.4
|
|
$
|
547.1
|
|
(1.2
|
)
|
||
|
Pension and defined-contribution retirement benefits
|
114.8
|
|
68.7
|
|
67.1
|
|
||||
|
Medical benefits
|
83.3
|
|
72.3
|
|
15.2
|
|
||||
|
Other benefits and payroll taxes
|
54.1
|
|
54.6
|
|
(0.9
|
)
|
||||
|
Total wages and benefits
|
$
|
792.6
|
|
$
|
742.7
|
|
6.7
|
|
||
41
Wages declined 1.2% on a 7.4% reduction in FTEs compared to 2008. Wages did not decline in step with the FTE reduction because of higher wage rates for the pilot group in connection with their new contract and increased average wages for certain other employees stemming from higher average seniority.
The 67.1% increase in pension and other retirement-related benefits was primarily due to a $45.0 million increase in our defined-benefit pension cost driven by the significant decline in the market value of pension assets at the end of 2008.
Medical benefits increased 15.2% from the prior year primarily as a result of an increase in the post-retirement medical expense for the pilot group in connection with their new contract and an increase in overall medical costs.
Variable Incentive Pay
Variable incentive pay expense increased from $15.8 million in 2008 to $61.6 million in 2009. The increase is partially due to the fact that in 2009, our financial and operational results exceeded targets established by our Board. In 2008, our performance fell short of targets. The increase can also be attributed to the addition of Alaska's pilots, flight attendants and mechanics to the PBP incentive plan.
Aircraft Fuel
Aircraft fuel expense declined $613.4 million, or 52.8%, compared to 2008. The elements of the change are illustrated in the following table:
|
|
Years Ended December 31
|
|||||||||
|
(in millions, except per-gallon amounts)
|
2009
|
2008
|
%Change
|
|||||||
|
Fuel gallons consumed
|
304.9
|
|
333.8
|
|
(8.7
|
)
|
||||
|
Raw price per gallon
|
$
|
1.88
|
|
$
|
3.31
|
|
(43.2
|
)
|
||
|
Total raw fuel expense
|
$
|
572.3
|
|
$
|
1,103.8
|
|
(48.2
|
)
|
||
|
Net impact on fuel expense from (gains) and losses arising from fuel-hedging activities
|
(23.3
|
)
|
58.6
|
|
NM
|
|
||||
|
Aircraft fuel expense
|
$
|
549.0
|
|
$
|
1,162.4
|
|
(52.8
|
)
|
||
NM = Not Meaningful
Fuel gallons consumed declined 8.7%, primarily as a result of a 6.6% reduction in aircraft flight hours and the improved fuel efficiency of our fleet as we completed the transition to newer, more fuel-efficient B737-800 aircraft in the second half of 2008.
The raw fuel price per gallon declined 43.2% as a result of lower West Coast jet fuel prices driven by lower crude oil costs and refining margins.
Our
economic fuel expense
is calculated as follows:
|
|
Years Ended December 31
|
|||||||||
|
(in millions, except per-gallon amounts)
|
2009
|
2008
|
%Change
|
|||||||
|
Raw fuel expense
|
$
|
572.3
|
|
$
|
1,103.8
|
|
(48.2
|
)
|
||
|
Plus or minus: net of cash received from settled hedges and premium expense recognized
|
50.4
|
|
(101.8
|
)
|
NM
|
|
||||
|
Economic fuel expense
|
$
|
622.7
|
|
$
|
1,002.0
|
|
(37.9
|
)
|
||
|
Fuel gallons consumed
|
304.9
|
|
333.8
|
|
(8.7
|
)
|
||||
|
Economic fuel cost per gallon
|
$
|
2.05
|
|
$
|
3.00
|
|
(31.7
|
)
|
||
NM = Not Meaningful
As noted above, the total net expense recognized for hedges that settled during the period was $50.4 million in 2009, compared to a net cash benefit of $101.8 million in 2008. These amounts represent the net of the premium expense recognized for those hedges and any cash received or paid upon settlement. The decrease is primarily due to the significant drop in crude oil prices from 2008.
Aircraft Maintenance
Aircraft maintenance increased by $19.3 million, or 12.8%, compared to the prior year primarily because of a higher average cost of airframe maintenance events and a new power-by-the-hour (PBH) maintenance agreement on our B737-700 and B737-900 aircraft engines, partially offset by the benefits of our fleet transition, as we have replaced all of our aging MD-80s
42
with newer B737-800s, and lower PBH costs associated with our 737-400 aircraft engines that resulted from a decline in flight hours.
Contracted Services
Contracted services declined by $5.3 million, or 4.1%, compared to 2008 as a result of the reduction in the number of flights operated throughout our system to ports where vendors are used and a reduction in project contract labor.
Selling Expenses
Selling expenses declined by $11.3 million, or 9.7%, compared to 2008 as a result of lower revenue-related expenses such as credit card costs, travel agency commissions and ticket distribution costs that resulted from the decline in passenger traffic. Mileage Plan expenses were also lower because the estimated incremental cost of providing free travel was lower because of the decline in fuel costs. These declines were partially offset by higher advertising costs.
Depreciation and Amortization
Depreciation and amortization increased $12.6 million, or 7.6%, compared to 2008. This is primarily due to the ten B737-800 aircraft delivered in 2009, partially offset by the sale-leaseback of six B737-800 aircraft in the first quarter of 2009.
Other Operating Expenses
Other operating expenses declined $15.1 million, or 8.9%, compared to the prior year. The decline is primarily driven by a reduction in outside professional services costs and flight crew-related costs such as hotels and per-diems.
New Pilot Contract Transition Costs
As mentioned previously, we recorded $35.8 million in connection with the new four-year contract ratified by Alaska’s pilots in the second quarter.
Restructuring Charges and Fleet Transition Costs
In the third quarter of 2008, we announced work force reductions among union and non-union employees. The affected non-union employees were terminated in the third quarter, resulting in a $1.6 million severance charge. For union personnel, we recorded an $11.3 million charge in 2008.
During 2008, we retired four MD-80 aircraft that were under long-term lease arrangements and placed them in temporary storage at an aircraft storage facility. The $47.5 million charge in 2008 represented the remaining discounted lease payments under the lease contracts and our estimate of maintenance costs that will be incurred in the future to meet the minimum return conditions under the lease requirements.
Mainline Operating Costs per Available Seat Mile (CASM)
Our mainline operating costs per mainline ASM are summarized below:
|
|
Years Ended December 31
|
|||||||
|
|
2009
|
|
2008
|
|
% Change
|
|||
|
Total mainline operating expenses per ASM (CASM)
|
10.78
|
|
¢
|
12.54
|
|
¢
|
(14.0
|
)
|
|
Less the following components:
|
|
|
|
|
|
|
|
|
|
Aircraft fuel costs per ASM
|
2.37
|
|
¢
|
4.80
|
|
¢
|
(50.6
|
)
|
|
New pilot contract transition costs per ASM
|
0.15
|
|
¢
|
—
|
|
|
NM
|
|
|
Restructuring costs per ASM
|
—
|
|
|
0.05
|
|
¢
|
NM
|
|
|
Fleet transition charges per ASM
|
—
|
|
|
0.20
|
|
¢
|
NM
|
|
|
CASM, excluding fuel and noted items
|
8.26
|
|
¢
|
7.49
|
|
¢
|
10.2
|
|
NM = Not Meaningful
CASM, excluding fuel and noted items increased from the prior-year period because of the increase in wages and benefits and other expenses as discussed above, partially offset by a 4.4% reduction in capacity.
43
Purchased Capacity Costs
Purchased capacity costs decreased $32.2 million compared to 2008. Of the total, $261.7 million was paid to Horizon under the CPA for 1.4 billion ASMs. This expense is eliminated in consolidation.
HORIZON AIR
Horizon reported pretax income of $22.8 million in 2009 compared to a pretax loss of $55.8 million in 2008. The improvement is primarily due to declines in aircraft fuel costs and non-fuel operating expenses, partially offset by a $79.5 million decline in operating revenues.
Excluding the items noted in the table below, Horizon would have reported pretax income of $7.7 million in 2009 compared to a pretax loss of $10.4 million in 2008. See the previous discussion under “Adjusted Non-GAAP Earnings and Per-Share Amounts” for additional information about these non-GAAP measures.
|
|
Year Ended December 31
|
||||||
|
(in millions)
|
2009
|
2008
|
|||||
|
Income (loss) before income taxes, excluding items below
|
$
|
7.7
|
|
$
|
(10.4
|
)
|
|
|
Fleet transition costs – CRJ-700
|
—
|
|
(13.5
|
)
|
|||
|
Mark-to-market fuel hedge adjustments
|
15.1
|
|
(23.4
|
)
|
|||
|
Realized losses on hedge portfolio restructuring
|
—
|
|
(8.5
|
)
|
|||
|
Income (loss) before income taxes as reported
|
$
|
22.8
|
|
$
|
(55.8
|
)
|
|
HORIZON REVENUES
During 2009, operating revenues decreased 10.8% compared to 2008. Horizon’s passenger revenues are summarized in the following table:
|
(dollars in millions)
|
Years Ended December 31
|
||||||||||||
|
2009
|
2008
|
||||||||||||
|
Revenues
|
% ASMs
|
Revenues
|
% ASMs
|
||||||||||
|
Passenger revenue from Horizon “brand”flying
|
$
|
381.9
|
|
59
|
|
$
|
429.2
|
|
59
|
|
|||
|
Revenue from capacity purchase arrangements (CPA) with Alaska
|
261.7
|
|
41
|
|
293.7
|
|
41
|
|
|||||
|
Total passenger revenue and % of ASMs
|
$
|
643.6
|
|
100
|
%
|
$
|
722.9
|
|
100
|
%
|
|||
Line-of-business information is presented in the table below:
|
|
Year Ended December 31, 2009
|
|||||||||||||||||||||||||
|
|
Capacity and Mix
|
Load Factor
|
Yield
|
RASM
|
||||||||||||||||||||||
|
|
Actual
(in millions)
|
% Change
Y-O-Y
|
Current %
Total
|
Actual
|
Point
Change
Y-O-Y
|
Actual
|
|
% Change
Y-O-Y
|
Actual
|
|
% Change
Y-O-Y
|
|||||||||||||||
|
Brand Flying
|
1,927
|
|
(13.2
|
)
|
59
|
|
72.4
|
%
|
1.3
|
|
27.36
|
|
¢
|
0.6
|
|
20.38
|
|
¢
|
2.8
|
|
||||||
|
Alaska CPA
|
1,365
|
|
(2.2
|
)
|
41
|
|
NM
|
|
NM
|
|
NM
|
|
|
NM
|
|
19.17
|
|
¢
|
(8.9
|
)
|
||||||
|
System Total
|
3,292
|
|
(9.0
|
)
|
100
|
|
73.1
|
%
|
0.2
|
|
26.73
|
|
¢
|
(2.6
|
)
|
19.88
|
|
¢
|
(2.0
|
)
|
||||||
NM = Not Meaningful
Passenger revenue from Horizon brand flying fell $47.3 million, or 11.0%, on a 13.2% reduction in brand capacity, partially offset by a 2.8% improvement in unit revenue. The increase in unit revenue was due to the slight improvements in both load factor and ticket yield.
Revenue from CPA flying performed on behalf of Alaska totaled $261.7 million during 2009 compared to $293.7 million during 2008. The decrease was primarily due to a 2.2% reduction in capacity provided under this arrangement and a significant decline in the associated fuel cost, which was reimbursed by Alaska. This revenue is eliminated in consolidation.
HORIZON EXPENSES
Total operating expenses decreased $161.1 million, or 20.8%, as compared to 2008. The sharp decline in fuel costs was the primary driver of the overall decrease. Significant period-over-period changes in the components of operating expenses are as follows.
44
Wages and Benefits
Wages and benefits declined $8.9 million, or 4.6%, compared to 2008. The primary components of wages and benefits are shown in the following table:
|
|
Years Ended December 31
|
|||||||||
|
(in millions)
|
2009
|
2008
|
%Change
|
|||||||
|
Wages
|
$
|
132.3
|
|
$
|
142.2
|
|
(7.0
|
)
|
||
|
Medical benefits
|
20.6
|
|
19.5
|
|
5.6
|
|
||||
|
Other benefits and payroll taxes
|
32.3
|
|
32.4
|
|
(0.3
|
)
|
||||
|
Total wages and benefits
|
$
|
185.2
|
|
$
|
194.1
|
|
(4.6
|
)
|
||
Wages declined 7% primarily as a result of a 10.6% decline in the number of full-time equivalent employees, partially offset by slightly higher wages per employee. The increase in average wages per employee is due to a higher average employee seniority level as furloughs involved less senior employees.
Variable Incentive Pay
Variable incentive pay expense increased to $14.4 million during 2009 from $5.6 million in 2008, of which $8.6 million and $1 million was related to PBP in 2009 and 2008, respectively. Variable pay increased for the same performance reasons cited in the Alaska discussion and the addition of Horizon’s flight attendants and non-represented employees into Air Group’s PBP plan.
Aircraft Fuel
Aircraft fuel declined $126.9 million, or 53.8%, compared to the same period in 2008. The elements of the change are illustrated in the following table:
|
|
Years Ended December 31
|
|||||||||
|
(in millions, except per-gallon amounts)
|
2009
|
2008
|
%Change
|
|||||||
|
Fuel gallons consumed
|
60.1
|
|
66.9
|
|
(10.2
|
)
|
||||
|
Raw price per gallon
|
$
|
1.90
|
|
$
|
3.36
|
|
(43.5
|
)
|
||
|
Total raw fuel expense
|
$
|
113.9
|
|
$
|
225.0
|
|
(49.4
|
)
|
||
|
Net impact on fuel expense from (gains) and losses arising from fuel-hedging activities
|
(4.8
|
)
|
11.0
|
|
NM
|
|
||||
|
Aircraft fuel expense
|
$
|
109.1
|
|
$
|
236.0
|
|
(53.8
|
)
|
||
NM = Not Meaningful
The 10.2% reduction in gallons consumed is primarily a function of the capacity reductions in 2009 compared to the prior year.
The raw fuel price per gallon declined by 43.5% as a result of the drop in crude oil prices and refining margins.
Our
economic fuel expense
is calculated as follows:
|
|
Years Ended December 31
|
|||||||||
|
(in millions, except per-gallon amounts)
|
2009
|
2008
|
%Change
|
|||||||
|
Raw fuel expense
|
$
|
113.9
|
|
$
|
225.0
|
|
(49.4
|
)
|
||
|
Plus or minus: net of cash received from settled hedges and premium expense recognized
|
10.3
|
|
(20.9
|
)
|
NM
|
|
||||
|
Economic fuel expense
|
$
|
124.2
|
|
$
|
204.1
|
|
(39.1
|
)
|
||
|
Fuel gallons consumed
|
60.1
|
|
66.9
|
|
(10.2
|
)
|
||||
|
Economic fuel cost per gallon
|
$
|
2.07
|
|
$
|
3.05
|
|
(32.1
|
)
|
||
NM = Not Meaningful
The total net expense recognized for hedges that settled during the period was $10.3 million in 2009, compared to a net cash benefit of $20.9 million in 2008. These amounts represent the net of the premium expense recognized for those hedges and any cash received or paid upon settlement.
45
Aircraft Rent
Aircraft rent expense declined $12.2 million, or 21.4%, as a result of the complete transition out of the Q200 fleet, all of which were leased, and the sublease of two CRJ-700 aircraft in late 2008.
Fleet Transition Costs
Fleet transition costs associated with the removal of Q200 aircraft from the operating fleet were $8.8 million during 2009 compared to $10.2 million in 2008. All Q200 aircraft have been removed from the operating fleet.
During 2008, as a result of our decision to retire the CRJ-700 fleet earlier than expected, we recorded a $5.5 million impairment charge associated with the two owned CRJ-700 aircraft and related spare parts, $6.7 million associated with a net loss on the sublease arrangement for two leased CRJ-700 aircraft, and a $1.3 million severance charge associated with the fleet reduction.
Operating Costs per Available Seat Mile (CASM)
Our operating costs per ASM are summarized below:
|
|
Years Ended December 31
|
|||||||
|
|
2009
|
|
2008
|
|
%Change
|
|||
|
Total operating expenses per ASM (CASM)
|
18.64
|
|
¢
|
21.42
|
|
¢
|
(13.0
|
)
|
|
CASM includes the following components:
|
|
|
|
|
|
|
|
|
|
Fuel costs per ASM
|
3.31
|
|
¢
|
6.53
|
|
¢
|
(49.3
|
)
|
|
CRJ-700 fleet transition costs per ASM
|
—
|
|
|
0.37
|
|
¢
|
NM
|
|
|
CASM, excluding fuel and noted items
|
15.33
|
|
¢
|
14.52
|
|
¢
|
5.5
|
|
|
Q200 fleet transition costs per ASM
|
0.27
|
|
¢
|
0.28
|
|
¢
|
NM
|
|
NM = Not Meaningful
CONSOLIDATED NONOPERATING INCOME (EXPENSE)
Net nonoperating expense was $64.5 million in 2009 compared to $41.0 million in 2008. Interest income declined $9.8 million compared to 2008 primarily as a result of lower average portfolio returns, partially offset by a higher average balance of cash and marketable securities. Interest expense declined $0.5 million on lower average interest rates on our variable-rate debt on a relatively stable average debt balance. Capitalized interest was $15.6 million lower than in 2008 because of lower advance aircraft purchase deposits and the deferred future aircraft deliveries.
CONSOLIDATED INCOME TAX EXPENSE (BENEFIT)
Our consolidated effective income tax rate on pretax income or loss for 2009 was 40.1%, compared to 36.3% for 2008. The difference between the effective tax rates for both periods and our 2009 marginal tax rate of approximately 37.9% is primarily the magnitude of nondeductible expenses, such as employee per-diem costs and stock-based compensation expense recorded for certain stock awards.
CRITICAL ACCOUNTING ESTIMATES
The discussion and analysis of our financial position and results of operations in this MD&A is based upon our consolidated financial statements. The preparation of these financial statements requires us to make estimates and judgments that affect our financial position and results of operations. See Note 1 to the consolidated financial statements for a description of our significant accounting policies.
Critical accounting estimates are defined as those that are reflective of significant judgment and uncertainties and that potentially may result in materially different results under varying assumptions and conditions. Management has identified the following critical accounting estimates and has discussed the development, selection and disclosure of these policies with our audit committee.
46
MILEAGE PLAN
Our Mileage Plan loyalty program awards miles to member passengers who fly on our airlines and many of our travel partners. Additionally, we sell miles to third parties, such as our bank partner, for cash. In either case, the outstanding miles may be redeemed for travel on our airlines or any of our travel partners. As long as the Mileage Plan is in existence, we have an obligation to provide this future travel.
For miles earned by passengers who fly on us or our travel partners, we recognize a liability and a corresponding selling expense for the obligation to provide travel in the future. For miles sold to third parties, the majority of the sales proceeds are recorded as deferred revenue and recognized when the award transportation is provided. The commission component of these sales proceeds (defined as the proceeds we receive from the sale of mileage credits minus the amount we defer) is recorded as other-net revenue in the period that miles are sold and represents services provided by the Company to its business partners and relates primarily to the use of the Company's logo and trademarks along with access to the Company's Mileage Plan members. Commission revenue recognized for the years ended December 31, 2010, 2009 and 2008 was $123.7 million, $96.8 million and $57.0 million, respectively. The deferred revenue is recognized as passenger revenue when awards are issued and flown on one of our airlines, and as other-net revenue for awards issued and flown on partner airlines.
At
December 31, 2010
, we had approximately 117 billion miles outstanding, resulting in an aggregate liability and deferred revenue balance of $673.9 million. Both the liability and the deferred revenue are determined based on several assumptions that require significant management judgment to estimate and formulate. There are uncertainties inherent in estimates; therefore, an incorrect assumption could greatly affect the amount and/or timing of revenue recognition or Mileage Plan expenses. The most significant assumptions in accounting for the Mileage Plan are described below.
|
1.
|
The rate at which we defer sales proceeds from sold miles:
|
We defer an amount that represents our estimate of the fair value of a free travel award by looking to the sales prices of comparable paid travel. As our estimates of fair value change, the amount we defer changes, resulting in the recognition of a higher or lower portion of the cash proceeds from the sale of miles as commission revenue in any given period. A 1% increase in the estimated fair value of travel awards (and related deferral rate) would decrease commission revenue by approximately $2 million. This amount would instead be recognized in a future period when award travel takes place.
|
2.
|
The number of miles that will not be redeemed for travel (breakage):
|
The liability for outstanding Mileage Plan mileage credits includes all mileage credits that are expected to be redeemed, including mileage credits earned by members whose mileage account balances have not yet reached the minimum mileage credit level to redeem an award. Our estimates of the number of miles that will not be redeemed (breakage) consider historical activity in our members’ accounts and other factors. A hypothetical 1.0% change in our estimate of breakage (currently 12% in the aggregate) has approximately a $7.0 million effect on the liability.
|
3.
|
The number of miles used per award (i.e., free ticket):
|
We estimate how many miles will be used per award. For example, our members may redeem credit for free travel to various locations or choose between a highly restricted award and an unrestricted award. Our estimates are based on the current requirements in our Mileage Plan program and historical travel redemption patterns.
|
4.
|
The number of awards redeemed for travel on our airlines versus other airlines:
|
The cost for us to carry an award passenger is typically lower than the cost we will pay to our travel partners. We estimate the number of awards that will be redeemed on our airlines versus on our travel partners and accrue the estimated costs based on historical redemption patterns. If the number of awards redeemed on our travel partner is higher or lower than estimated, we may need to adjust our liability and corresponding expense.
|
5.
|
The costs that will be incurred to provide award travel:
|
When a frequent flyer travels on his or her award ticket on one of our airlines, incremental costs such as food, fuel and insurance are incurred to carry that passenger. We estimate what these costs will be (excluding any contribution to overhead and profit) and accrue a liability. If the passenger travels on another airline on an award ticket, we often must pay the other airline for carrying the passenger. The other airline costs are based on negotiated agreements and are often
47
substantially higher than the costs we would incur to carry that passenger. We estimate how much we will pay to other airlines for future travel awards based on historical redemptions and settlements with other carriers and accrue a liability accordingly. The costs actually incurred by us or paid to other airlines may be higher or lower than the costs that were estimated and accrued, and therefore we may need to adjust our liability and recognize a corresponding expense.
We regularly review significant Mileage Plan assumptions and change our assumptions if facts and circumstances indicate that a change is necessary. Any such change in assumptions could have a significant effect on our financial position and results of operations.
PENSION PLANS
Accounting rules require recognition of the overfunded or underfunded status of an entity’s defined-benefit pension and other postretirement plans as an asset or liability in the financial statements and requires recognition of the funded status in other comprehensive income. Pension expense is recognized on an accrual basis over employees’ approximate service periods and is generally independent of funding decisions or requirements. We recognized expense for our qualified defined-benefit pension plans of
$50.2 million
,
$93.0 million
, and
$48.0 million
in
2010
,
2009
, and
2008
, respectively. We expect the
2011
expense to be approximately $44 million.
The calculation of pension expense and the corresponding liability requires the use of a number of important assumptions, including the expected long-term rate of return on plan assets and the assumed discount rate. Changes in these assumptions can result in different expense and liability amounts, and future actual experience can differ from these assumptions.
Pension expense increases as the expected rate of return on pension plan assets decreases. As of
December 31, 2010
, we estimate that the pension plan assets will generate a long-term rate of return of 7.75%. This rate was developed using historical data, the current value of the underlying assets, as well as long-term inflation assumptions. We regularly review the actual asset allocation and periodically rebalance investments as appropriate. This expected long-term rate of return on plan assets at
December 31, 2010
is based on an allocation of U.S. and non-U.S. equities and U.S. fixed-income securities. Decreasing the expected long-term rate of return by 0.5% (from 7.75% to 7.25%) would increase our estimated
2011
pension expense by approximately $5.7 million.
Pension liability and future pension expense increase as the discount rate is reduced. We discounted future pension obligations using a rate of 5.55% and 5.85% at
December 31, 2010
and
2009
, respectively. The discount rate at
December 31, 2010
was determined using current rates earned on high-quality long-term bonds with maturities that correspond with the estimated cash distributions from the pension plans. Decreasing the discount rate by 0.5% (from 5.55% to 5.05%) would increase our projected benefit obligation at
December 31, 2010
by approximately $97.7 million and increase estimated
2011
pension expense by approximately $9.1 million.
All of our defined-benefit pension plans are now closed to new entrants.
Future changes in plan asset returns, assumed discount rates and various other factors related to the participants in our pension plans will impact our future pension expense and liabilities. We cannot predict what these factors will be in the future.
LONG-LIVED ASSETS
As of
December 31, 2010
, we had approximately
$3.1 billion
of property and equipment and related assets, net of accumulated depreciation. In accounting for these long-lived assets, we make estimates about the expected useful lives of the assets, changes in fleet plans, the expected residual values of the assets, and the potential for impairment based on the fair value of the assets and the cash flows they generate. Factors indicating potential impairment include, but are not limited to, significant decreases in the market value of the long-lived assets, management decisions regarding the future use of the assets, a significant change in the long-lived assets condition, and operating cash flow losses associated with the use of the long-lived asset.
In 2008, Horizon announced plans to ultimately exit its CRJ-700 fleet and transition to an all-Q400 fleet. As a result of the decision, we determined that the two owned CRJ-700s were impaired and recorded an impairment charge on the aircraft and their related spare parts of $5.5 million in 2008 to reduce the carrying value of these assets to their estimated fair value.
There is inherent risk in estimating the fair value of our aircraft and related parts and their salvage values at the time of impairment. Actual proceeds upon disposition of the aircraft or related parts could be materially less than expected, resulting in additional loss. Our estimate of salvage value at the time of disposal could also change, requiring us to increase the depreciation expense on the affected aircraft.
48
PROSPECTIVE ACCOUNTING PRONOUNCEMENTS
In September 2009, the Financial Accounting Standards Board (“FASB”) issued ASU 2009-13,
Multiple Deliverable Revenue Arrangements - A Consensus of the FASB Emerging Issues Task Force.
This update provides application guidance on whether multiple deliverables exist, how the deliverables should be separated and how the consideration should be allocated to one or more units of accounting. This guidance also eliminates the residual method of allocation and requires that arrangement consideration be allocated at the inception of the arrangement to all deliverables using the relative selling price method. This accounting standard is effective for revenue arrangements entered into or materially modified in fiscal years beginning on or after June 15, 2010. This guidance is effective for us on January 1, 2011 and will change our accounting for recognition of revenue associated with frequent flyer credits. Management does not believe that there will be an immediate significant impact of this new standard on the Company's financial position, results of operations, cash flows, or disclosures.
Recently, the Financial Accounting Standards Board (FASB) has issued a number of proposed Accounting Standards Updates (ASUs). Those proposed ASUs are as follows:
|
•
|
Proposed ASU -
Revenue Recognition
- was issued in June 2010 and continues to evolve. We believe that a new revenue recognition standard could significantly impact the Company's accounting for the Company's Mileage Plan miles earned by passengers who fly on us or our partners, or miles sold to third parties.
|
|
•
|
Proposed ASU -
Leases
- was issued in August 2010. This proposed standard overhauls accounting for leases and will apply a “right-of-use” model in accounting for nearly all leases. For lessees, this will result in recognizing an asset representing the lessee's right to use the leased asset for the lease term and a liability to make lease payments. This proposed standard eliminates the operating lease concept from an accounting perspective, thereby eliminating rent expense from the income statement. This proposed standard, if adopted, will significantly impact the Company's statement of operations, financial position, and disclosures. For example, we estimate the capitalized value of airplane leases to be approximately $1.0 billion using a seven times annual rent factor.
|
These proposed ASUs are currently in comment period and are subject to change. There are no effective dates assigned to these proposals.
In July 2010, the FASB also issued an initial draft of new financial statement presentation requirements. These new requirements, as currently drafted, would substantially change the way financial statements are presented by disaggregating information in financial statements to explain the components of its financial position and financial performance. These changes will impact the presentation of the financial statements only and are not expected to impact the Company's overall financial position, results of operations, or cash flows.
LIQUIDITY AND CAPITAL RESOURCES
Our primary sources of liquidity are:
|
•
|
Our existing cash and marketable securities balance of
$1.2 billion
(which represents
32%
of trailing 12 months revenue) and our expected cash from operations;
|
|
•
|
Aircraft financing – the 18 unencumbered aircraft in our operating fleet that could be financed, if necessary;
|
|
•
|
Our combined $200 million bank line-of-credit facilities (currently nothing outstanding);
|
|
•
|
Other potential sources such as a “forward sale” of mileage credits to our bank partner.
|
Because of the recent economic recession, we intentionally increased our cash and marketable securities to current levels (roughly 32% of trailing 12 months revenues). In 2010, we paid off outstanding debt associated with six B737-800 aircraft and a portion of a seventh aircraft loan totaling $169.2 million. Subsequent to the end of 2010, we paid off outstanding balances on two additional aircraft loans totaling $51.8 million. In addition, we repurchased
$45.1 million
of our common stock in 2010 and have $31.2 million remaining to repurchase under our existing $50 million Board authorization. Finally, we made a voluntary contribution to our defined-benefit pension plans of $100 million in December 2010, bringing our total pension contributions to $145.6 million in 2010. We will continue to focus on preserving a strong liquidity position and evaluate our cash needs as conditions change.
49
We believe that our current cash and marketable securities balance combined with future cash flows from operations and other sources of liquidity will be sufficient to fund our operations for the foreseeable future.
In our cash and marketable securities portfolio, we invest only in U.S. government securities, certain asset-backed obligations and corporate debt securities. We do not invest in equities or auction-rate securities. As of
December 31, 2010
, we had a $12.8 million net unrealized gain on our
$1.2 billion
cash and marketable securities balance.
Our overall investment strategy for our marketable securities portfolio has a primary goal of maintaining and securing its investment principal. Our investment portfolio is managed by reputable financial institutions and is continually reviewed to ensure that the investments are aligned with our strategy.
The table below presents the major indicators of financial condition and liquidity:
|
(in millions, except per-share and debt-to-capital amounts)
|
December 31, 2010
|
December 31, 2009
|
Change
|
||||||||
|
Cash and marketable securities
|
$
|
1,208.2
|
|
$
|
1,192.1
|
|
$
|
16.1
|
|
||
|
Cash and marketable securities as a percentage of trailing twelve months revenue
|
32
|
%
|
35
|
%
|
(3) pts
|
|
|||||
|
Long-term debt, net of current portion
|
1,313.0
|
|
1,699.2
|
|
(386.2
|
)
|
|||||
|
Shareholders’ equity
|
1,105.4
|
|
872.1
|
|
233.3
|
|
|||||
|
Long-term debt-to-capital assuming aircraft operating leases are capitalized at seven times annualized rent
|
67%:33%
|
|
76%:24%
|
|
(9) pts
|
|
|||||
The following discussion summarizes the primary drivers of the increase in our cash and marketable securities balance and our expectation of future cash requirements.
ANALYSIS OF OUR CASH FLOWS
Cash Provided by Operating Activities
During
2010
, net cash provided by operating activities was
$553.7 million
, compared to
$292.5 million
during
2009
. The $261.2 million increase was primarily driven by higher revenues, growth in the air traffic liability and a decline in paid income taxes compared to the prior year. The increases were partially offset by the payment of 2009 incentive pay in the first quarter of 2010, which was significantly larger than the payment of 2008 incentive pay in 2009.
We typically generate positive cash flows from operations, but historically have consumed substantially all of that cash plus additional debt proceeds for capital expenditures and debt payments. In 2010, however, we had much lower capital expenditures than in the past several years due to fewer aircraft deliveries.
Cash Used in Investing Activities
Our investing activities are primarily made up of capital expenditures and, to a lesser extent, purchases and sales of marketable securities. Cash used in investing activities was
$295.2 million
during
2010
, compared to
$657.4 million
in
2009
. Our capital expenditures were
$183.0 million
, or $255.4 million lower than in 2009 due to fewer aircraft purchases and advance deposits.
We currently expect capital expenditures for 2011 to be as follows (in millions):
|
2011
|
|
||
|
Aircraft-related
|
$
|
330
|
|
|
Non-aircraft
|
55
|
|
|
|
Total Air Group
|
$
|
385
|
|
The expected increase in capital expenditures from 2010 is due to payments associated with the deliveries of three B737-800 aircraft, eight Q400 aircraft, and the advance deposits related to the new Boeing aircraft order discussed later under "Aircraft Purchase Commitments". We preliminarily expect 2012 capital expenditures to be approximately $370 million.
Cash Provided by Financing Activities
Net cash used by financing activities was
$333.2 million
during
2010
compared to net cash provided of
$246.0 million
during
2009
. The change is primarily due to proceeds from the sale-leaseback transactions on six B737-800 aircraft and debt proceeds
50
in 2009 compared to no borrowings in 2010, combined with $169.2 million of debt prepayment in 2010. Additionally, we repurchased $45.1 million of our common stock in 2010, compared to $23.8 million repurchased in 2009.
We plan to meet our capital and operating commitments through internally generated funds from operations and cash and marketable securities on hand, along with additional debt financing if necessary.
Bank Line-of-Credit Facility
We terminated our previous $185 million credit facility effective March 30, 2010. That facility was replaced with two new $100 million credit facilities. Both facilities have variable interest rates based on LIBOR plus a specified margin. Borrowings on one of the $100 million facilities, which expires in March 2013, are secured by aircraft. Borrowings on the other $100 million facility, which expires in March 2014, are secured by certain accounts receivable, spare engines, spare parts and ground service equipment. There are no outstanding balances on these facilities at
December 31, 2010
. We have no immediate plans to borrow using either of these facilities. See Note 4 in the consolidated financial statements for further discussion.
Pre-delivery Payment Facility
We terminated our pre-delivery payment facility in the second quarter of 2010. There were no outstanding borrowings under this facility at the time of termination. See Note 4 in the consolidated financial statements for further discussion.
CONTRACTUAL OBLIGATIONS AND COMMITMENTS
Aircraft Purchase Commitments
In January 2011, we executed an aircraft purchase agreement with Boeing for 15 new B737 aircraft, two 737-800 aircraft and 13 new B737-900ER aircraft, with deliveries starting late in 2012 and going through 2014. The agreement also includes options for 15 additional B737-900ER aircraft with delivery positions in 2016 and 2017. The firm orders mentioned above were inclusive of the conversion of eleven existing options.
For purposes of the aircraft purchase commitment table below, we are including the recent aircraft transactions and their related obligations. All other obligations are as of
December 31, 2010
. Overall, we had firm orders to purchase
36
aircraft requiring future aggregate payments of approximately
$1,150.9 million
, as set forth below. Alaska has options to acquire 42 additional B737s and Horizon has options to acquire 10 Q400s.
The following table summarizes aircraft purchase commitments and payments by year, including the January aircraft order:
|
Aircraft
|
Delivery Period - Firm Orders
|
|||||||||||||||||||||||
|
2011
|
2012
|
2013
|
2014
|
Beyond 2014
|
Total
|
|||||||||||||||||||
|
Boeing 737-800
|
3
|
|
6
|
|
3
|
|
1
|
|
2
|
|
15
|
|
||||||||||||
|
Boeing 737-900ER
|
—
|
|
—
|
|
6
|
|
7
|
|
—
|
|
13
|
|
||||||||||||
|
Bombardier Q400
|
8
|
|
—
|
|
—
|
|
—
|
|
—
|
|
8
|
|
||||||||||||
|
Total
|
11
|
|
6
|
|
9
|
|
8
|
|
2
|
|
36
|
|
||||||||||||
|
Payments (millions)*
|
$
|
331.8
|
|
$
|
315.0
|
|
$
|
297.7
|
|
$
|
167.0
|
|
$
|
39.4
|
|
$
|
1,150.9
|
|
||||||
*
Includes pre-delivery payments to Boeing and Bombardier as well as final aircraft payments.
We expect to pay for the three B737-800 aircraft deliveries in 2011 with cash on hand and the eight Q400 aircraft with long-term debt financing. We expect to pay for firm orders beyond 2011 and the option aircraft, if exercised, through internally generated cash, long-term debt, or operating lease arrangements.
51
Contractual Obligations
The following table provides a summary of our principal payments under current and long-term debt obligations, operating lease commitments, aircraft purchase commitments and other obligations as of
December 31, 2010
. The aircraft purchase commitments in the table below do not reflect the January 2011 aircraft order:
|
(in millions)
|
2011
|
2012
|
2013
|
2014
|
2015
|
Beyond 2015
|
Total
|
||||||||||||||||||||
|
Current and long-term debt obligations
|
$
|
221.2
|
|
$
|
216.9
|
|
$
|
175.7
|
|
$
|
141.9
|
|
$
|
128.2
|
|
$
|
650.3
|
|
$
|
1,534.2
|
|
||||||
|
Operating lease commitments (1)
|
214.5
|
|
197.4
|
|
157.8
|
|
140.0
|
|
106.7
|
|
285.5
|
|
1,101.9
|
|
|||||||||||||
|
Aircraft purchase commitments
|
238.4
|
|
112.5
|
|
79.7
|
|
59.6
|
|
34.6
|
|
4.8
|
|
529.6
|
|
|||||||||||||
|
Interest obligations (2)
|
77.4
|
|
69.8
|
|
58.0
|
|
49.7
|
|
42.8
|
|
111.1
|
|
408.8
|
|
|||||||||||||
|
Other obligations (3)
|
51.9
|
|
52.2
|
|
42.2
|
|
54.3
|
|
—
|
|
—
|
|
200.6
|
|
|||||||||||||
|
Total
|
$
|
803.4
|
|
$
|
648.8
|
|
$
|
513.4
|
|
$
|
445.5
|
|
$
|
312.3
|
|
$
|
1,051.7
|
|
$
|
3,775.1
|
|
||||||
|
(1)
|
Operating lease commitments generally include aircraft operating leases, airport property and hangar leases, office space, and other equipment leases. The aircraft operating leases include lease obligations for 16 leased Q200 aircraft and three CRJ-700 aircraft, all of which are no longer in our operating fleets. We have accrued for these lease commitments based on their discounted future cash flows as we remain obligated under the existing lease contracts on these aircraft.
|
|
(2)
|
For variable-rate debt, future obligations are shown above using interest rates in effect as of
December 31, 2010
.
|
|
(3)
|
Includes minimum obligations under our long-term power-by-the-hour maintenance agreements for all B737 engines other than the B737-800.
|
Pension Obligations
The table above excludes contributions to our various pension plans, which could be approximately $35 million to $50 million per year based on our historical funding practice, although there is no minimum required contribution in 2011. In both 2010 and 2009, we made year-end voluntary supplemental pension contributions of $100 million, bringing the funding total in both years to approximately $300 million. The unfunded liability for our qualified defined-benefit pension plans was
$200.3
million at
December 31, 2010
compared to $272.9 million at
December 31, 2009
. This results in a
85.1%
funded status on a projected benefit obligation basis compared to 76.9% funded as of
December 31, 2009
.
Los Angeles International Airport Improvements
In 2009, we announced plans to move from Terminal 3 to Terminal 6 at Los Angeles International Airport (LAX). As part of this move, we have agreed to manage and fund up to $175 million of the project during the design and construction phase. The project is estimated to cost approximately $250 million and is expected to be completed in 2012. We expect Los Angeles World Airports and the Transportation Security Administration to reimburse us for the majority of the construction costs either during the course of, or upon the completion of, construction. We are currently working with the City of Los Angeles and Los Angeles World Airports on a funding agreement and expect to have it finalized in the near future. We anticipate that our proprietary share will be approximately $25 million of the total cost of the project. As of December 31, 2010, we capitalized $34 million associated with this project, which represents total project costs to date.
Credit Card Agreements
We have agreements with a number of credit card companies to process the sale of tickets and other services. Under these agreements, there are material adverse change clauses that, if triggered, could result in the credit card companies holding back a reserve from our credit card receivables. Under one such agreement, we could be required to maintain a reserve if our credit rating is downgraded to or below a rating specified by the agreement. Under another such agreement, we would be obligated to maintain a reserve if our cash balance fell below $350 million. We are not currently required to maintain any reserve under these agreements, but if we were, our financial position and liquidity could be materially harmed.
EFFECT OF INFLATION AND PRICE CHANGES
Inflation and price changes other than for aircraft fuel do not have a significant effect on our operating revenues, operating expenses and operating income and did not have such an effect in the last three fiscal years.
52
RETURN ON INVESTED CAPITAL
We strive to provide a return to our investors that exceeds the cost of the capital employed in our business. Our target return on invested capital (ROIC) is 10%. We surpassed this goal in 2010, but have not historically reached this threshold on average over our business cycle. Our strategic plan is built on the premise of providing an appropriate return to all capital providers, which we believe is a 10% average return.
|
|
We have interest-rate risk on our variable-rate debt obligations and our available-for-sale marketable investment portfolio, and commodity-price risk in jet fuel required to operate our aircraft fleet. We purchase the majority of our jet fuel at prevailing market prices and seek to manage market risk through execution of our hedging strategy and other means. We have market-sensitive instruments in the form of fixed-rate debt instruments, and financial derivative instruments used to hedge our exposure to jet-fuel price increases and interest-rate increases. We do not purchase or hold any derivative financial instruments for trading purposes.
Market Risk – Aircraft Fuel
Currently, our fuel-hedging portfolio consists of crude oil call options and jet fuel refining margin swap contracts. We utilize the contracts in our portfolio as hedges to decrease our exposure to the volatility of jet fuel prices. Call options are designed to effectively cap our cost of the crude oil component of fuel prices, allowing us to limit our exposure to increasing fuel prices. With these call option contracts, we still benefit from the decline in crude oil prices, as there is no downward exposure other than the premiums that we pay to enter into the contracts. We believe there is risk in not hedging against the possibility of fuel price increases. We estimate that a 10% increase or decrease in crude oil prices as of
December 31, 2010
would increase or decrease the fair value of our crude oil hedge portfolio by approximately $56.6 million and $47.5 million, respectively.
Our portfolio of fuel hedge contracts was worth
$131.3
million at
December 31, 2010
, for which we have paid $108.6 million of premiums to counterparties, compared to a portfolio value of
$117.0
million at
December 31, 2009
. We do not have any collateral held by counterparties to these agreements as of
December 31, 2010
.
We continue to believe that our fuel hedge program is an important part of our strategy to reduce our exposure to volatile fuel prices. We expect to continue to enter into these types of contracts prospectively, although significant changes in market conditions could affect our decisions. For more discussion, see Note 3 to our consolidated financial statements.
Financial Market Risk
We have exposure to market risk associated with changes in interest rates related primarily to our debt obligations and short-term investment portfolio. Our debt obligations include variable-rate instruments, which have exposure to changes in interest rates. This exposure is somewhat mitigated through our variable-rate investment portfolio. A hypothetical 10% change in the average interest rates incurred on variable-rate debt during
2010
would correspondingly change our net earnings and cash flows associated with these items by approximately $0.8 million. In order to help mitigate the risk of interest rate fluctuations, we have fixed the interest rates on certain existing variable-rate debt agreements over the past several years. Our variable-rate debt is approximately 20% of our total long-term debt at
December 31, 2010
compared to 22% at
December 31, 2009
.
We also have investments in marketable securities, which are exposed to market risk associated with changes in interest rates. If short-term interest rates were to average 1% more than they did in
2010
, interest income would increase by approximately $11.9 million.
53
|
|
SELECTED QUARTERLY CONSOLIDATED FINANCIAL INFORMATION (unaudited)
|
|
1st Quarter
|
2nd Quarter
|
3rd Quarter
|
4th Quarter
|
|||||||||||||||||||||||||||
|
(in millions, except per share)
|
2010
|
2009
|
2010
|
2009
|
2010
|
2009
|
2010
|
2009
|
|||||||||||||||||||||||
|
Operating revenues
|
$
|
829.9
|
|
$
|
742.4
|
|
$
|
976.4
|
|
$
|
843.9
|
|
$
|
1,067.5
|
|
$
|
967.4
|
|
$
|
958.5
|
|
$
|
846.1
|
|
|||||||
|
Operating income (loss)
|
26.0
|
|
(11.9
|
)
|
109.9
|
|
66.7
|
|
216.4
|
|
159.8
|
|
119.3
|
|
52.8
|
|
|||||||||||||||
|
Net income (loss)
|
5.3
|
|
(19.2
|
)
|
58.6
|
|
29.1
|
|
122.4
|
|
87.6
|
|
64.8
|
|
24.1
|
|
|||||||||||||||
|
Basic earnings (loss) per share*
|
0.15
|
|
(0.53
|
)
|
1.64
|
|
0.80
|
|
3.41
|
|
2.48
|
|
1.80
|
|
0.68
|
|
|||||||||||||||
|
Diluted earnings (loss) per per share*
|
0.15
|
|
(0.53
|
)
|
1.60
|
|
0.79
|
|
3.32
|
|
2.46
|
|
1.75
|
|
0.67
|
|
|||||||||||||||
*
For earnings per share, the sum of the quarters may not equal the total for the full year.
54
REPORT OF INDEPENDENT REGISTERED PUBLIC ACCOUNTING FIRM
The Board of Directors and Shareholders
Alaska Air Group, Inc.:
We have audited the accompanying consolidated balance sheets of Alaska Air Group, Inc. and subsidiaries as of December 31, 2010 and 2009, and the related consolidated statements of operations, shareholders' equity, and cash flows for each of the years in the three-year period ended December 31, 2010. In connection with our audits of the consolidated financial statements, we also have audited financial statement schedule II. These consolidated financial statements and financial statement schedule are the responsibility of the Company's management. Our responsibility is to express an opinion on these consolidated financial statements and financial statement schedule based on our audits.
We conducted our audits in accordance with the standards of the Public Company Accounting Oversight Board (United States). Those standards require that we plan and perform the audit to obtain reasonable assurance about whether the financial statements are free of material misstatement. An audit includes examining, on a test basis, evidence supporting the amounts and disclosures in the financial statements. An audit also includes assessing the accounting principles used and significant estimates made by management, as well as evaluating the overall financial statement presentation. We believe that our audits provide a reasonable basis for our opinion.
In our opinion, the consolidated financial statements referred to above present fairly, in all material respects, the financial position of Alaska Air Group, Inc. and subsidiaries as of December 31, 2010 and 2009, and the results of their operations and their cash flows for each of the years in the three-year period ended December 31, 2010, in conformity with U.S. generally accepted accounting principles. Also in our opinion, the related financial statement schedule, when considered in relation to the basic consolidated financial statements taken as a whole, present fairly, in all material respects, the information set forth therein.
We also have audited, in accordance with the standards of the Public Company Accounting Oversight Board (United States), Alaska Air Group, Inc.'s internal control over financial reporting as of December 31, 2010, based on criteria established in
Internal Control - Integrated Framework
issued by the Committee of Sponsoring Organizations of the Treadway Commission (COSO), and our report dated February 22, 2011 expressed an unqualified opinion on the effectiveness of the Company's internal control over financial reporting.
/s/ KPMG LLP
Seattle, Washington
February 22, 2011
55
|
As of December 31
(in millions)
|
2010
|
2009
|
||||||
|
ASSETS
|
|
|
||||||
|
Current Assets
|
|
|
||||||
|
Cash and cash equivalents
|
$
|
89.5
|
|
$
|
164.2
|
|
||
|
Marketable securities
|
1,118.7
|
|
1,027.9
|
|
||||
|
Total cash and marketable securities
|
1,208.2
|
|
1,192.1
|
|
||||
|
Receivables - less allowance for doubtful accounts of $0.9 and $1.5
|
120.1
|
|
111.8
|
|
||||
|
Inventories and supplies - net
|
45.1
|
|
45.8
|
|
||||
|
Deferred income taxes
|
120.5
|
|
120.3
|
|
||||
|
Fuel hedge contracts
|
61.4
|
|
66.2
|
|
||||
|
Prepaid expenses and other current assets
|
106.7
|
|
98.1
|
|
||||
|
Total Current Assets
|
1,662.0
|
|
1,634.3
|
|
||||
|
Property and Equipment
|
|
|
|
|
||||
|
Aircraft and other flight equipment
|
3,807.6
|
|
3,660.1
|
|
||||
|
Other property and equipment
|
616.5
|
|
631.3
|
|
||||
|
Deposits for future flight equipment
|
202.5
|
|
215.5
|
|
||||
|
|
4,626.6
|
|
4,506.9
|
|
||||
|
Less accumulated depreciation and amortization
|
1,509.5
|
|
1,339.0
|
|
||||
|
Total Property and Equipment - Net
|
3,117.1
|
|
3,167.9
|
|
||||
|
Fuel Hedge Contracts
|
69.9
|
|
50.8
|
|
||||
|
Other Assets
|
167.6
|
|
143.2
|
|
||||
|
Total Assets
|
$
|
5,016.6
|
|
$
|
4,996.2
|
|
||
See accompanying notes to consolidated financial statements.
56
CONSOLIDATED BALANCE SHEETS -
(continued)
|
As of December 31
(in millions except share amounts)
|
2010
|
2009
|
||||||
|
LIABILITIES AND SHAREHOLDERS' EQUITY
|
|
|
||||||
|
Current Liabilities
|
|
|
||||||
|
Accounts payable
|
$
|
60.2
|
|
$
|
63.3
|
|
||
|
Accrued aircraft rent
|
43.1
|
|
54.0
|
|
||||
|
Accrued wages, vacation and payroll taxes
|
176.6
|
|
155.4
|
|
||||
|
Other accrued liabilities
|
501.2
|
|
474.5
|
|
||||
|
Air traffic liability
|
422.4
|
|
366.3
|
|
||||
|
Current portion of long-term debt
|
221.2
|
|
156.0
|
|
||||
|
Total Current Liabilities
|
1,424.7
|
|
1,269.5
|
|
||||
|
Long-Term Debt, Net of Current Portion
|
1,313.0
|
|
1,699.2
|
|
||||
|
Other Liabilities and Credits
|
|
|
|
|
||||
|
Deferred income taxes
|
279.9
|
|
151.1
|
|
||||
|
Deferred revenue
|
403.5
|
|
435.1
|
|
||||
|
Obligation for pension and postretirement medical benefits
|
367.1
|
|
421.0
|
|
||||
|
Other liabilities
|
123.0
|
|
148.2
|
|
||||
|
|
1,173.5
|
|
1,155.4
|
|
||||
|
Commitments and Contingencies
|
|
|
|
|
||||
|
Shareholders' Equity
|
|
|
|
|
||||
|
Preferred stock, $1 par value Authorized: 5,000,000 shares, none issued or outstanding
|
—
|
|
—
|
|
||||
|
Common stock, $1 par value Authorized: 100,000,000 shares, Issued: 2010 - 37,010,140 shares; 2009 - 35,843,092 shares
|
37.0
|
|
35.8
|
|
||||
|
Capital in excess of par value
|
815.5
|
|
767.0
|
|
||||
|
Treasury stock (common), at cost: 2010 - 1,086,172; 2009 - 252,084 shares
|
(46.0
|
)
|
(5.7
|
)
|
||||
|
Accumulated other comprehensive loss
|
(267.2
|
)
|
(240.0
|
)
|
||||
|
Retained earnings
|
566.1
|
|
315.0
|
|
||||
|
|
1,105.4
|
|
872.1
|
|
||||
|
Total Liabilities and Shareholders' Equity
|
$
|
5,016.6
|
|
$
|
4,996.2
|
|
||
See accompanying notes to consolidated financial statements.
|
Year Ended December 31
(in millions except per share amounts)
|
2010
|
2009
|
2008
|
|||||||||
|
Operating Revenues
|
|
|
|
|||||||||
|
Passenger
|
$
|
3,472.9
|
|
$
|
3,092.1
|
|
$
|
3,355.8
|
|
|||
|
Freight and mail
|
106.2
|
|
95.9
|
|
103.6
|
|
||||||
|
Other - net
|
253.2
|
|
211.8
|
|
160.9
|
|
||||||
|
Change in Mileage Plan terms
|
—
|
|
—
|
|
42.3
|
|
||||||
|
Total Operating Revenues
|
3,832.3
|
|
3,399.8
|
|
3,662.6
|
|
||||||
|
Operating Expenses
|
|
|
|
|
|
|
||||||
|
Wages and benefits
|
960.9
|
|
988.1
|
|
943.7
|
|
||||||
|
Variable incentive pay
|
92.0
|
|
76.0
|
|
21.4
|
|
||||||
|
Aircraft fuel, including hedging gains and losses
|
900.9
|
|
658.1
|
|
1,398.4
|
|
||||||
|
Aircraft maintenance
|
216.5
|
|
223.1
|
|
208.8
|
|
||||||
|
Aircraft rent
|
138.9
|
|
153.7
|
|
163.1
|
|
||||||
|
Landing fees and other rentals
|
232.8
|
|
223.2
|
|
223.7
|
|
||||||
|
Contracted services
|
163.0
|
|
150.6
|
|
166.1
|
|
||||||
|
Selling expenses
|
153.8
|
|
131.8
|
|
147.1
|
|
||||||
|
Depreciation and amortization
|
230.5
|
|
219.2
|
|
204.6
|
|
||||||
|
Food and beverage service
|
57.5
|
|
50.1
|
|
50.9
|
|
||||||
|
Other
|
200.7
|
|
213.9
|
|
222.9
|
|
||||||
|
New pilot contract transition costs
|
—
|
|
35.8
|
|
—
|
|
||||||
|
Restructuring charges
|
—
|
|
—
|
|
12.9
|
|
||||||
|
Horizon restructuring and CRJ-700 fleet transition costs
|
13.2
|
|
—
|
|
—
|
|
||||||
|
Fleet transition costs - MD-80
|
—
|
|
—
|
|
47.5
|
|
||||||
|
Fleet transition costs - CRJ-700
|
—
|
|
—
|
|
13.5
|
|
||||||
|
Fleet transition costs - Q200
|
—
|
|
8.8
|
|
10.2
|
|
||||||
|
Total Operating Expenses
|
3,360.7
|
|
3,132.4
|
|
3,834.8
|
|
||||||
|
Operating Income (Loss)
|
471.6
|
|
267.4
|
|
(172.2
|
)
|
||||||
|
Nonoperating Income (Expense)
|
|
|
|
|
|
|
||||||
|
Interest income
|
29.4
|
|
32.6
|
|
42.4
|
|
||||||
|
Interest expense
|
(108.3
|
)
|
(104.3
|
)
|
(104.8
|
)
|
||||||
|
Interest capitalized
|
6.2
|
|
7.6
|
|
23.2
|
|
||||||
|
Other - net
|
7.0
|
|
(0.4
|
)
|
(1.8
|
)
|
||||||
|
|
(65.7
|
)
|
(64.5
|
)
|
(41.0
|
)
|
||||||
|
Income (loss) before income tax
|
405.9
|
|
202.9
|
|
(213.2
|
)
|
||||||
|
Income tax expense (benefit)
|
154.8
|
|
81.3
|
|
(77.3
|
)
|
||||||
|
Net Income (Loss)
|
$
|
251.1
|
|
$
|
121.6
|
|
$
|
(135.9
|
)
|
|||
|
Basic Earnings (Loss) Per Share:
|
$
|
7.01
|
|
$
|
3.39
|
|
$
|
(3.74
|
)
|
|||
|
Diluted Earnings (Loss) Per Share:
|
$
|
6.83
|
|
$
|
3.36
|
|
$
|
(3.74
|
)
|
|||
|
Shares used for computation:
|
|
|
|
|
||||||||
|
Basic
|
35.822
|
|
35.815
|
|
36.343
|
|
||||||
|
Diluted
|
36.786
|
|
36.154
|
|
36.343
|
|
||||||
See accompanying notes to consolidated financial statements.
57
CONSOLIDATED STATEMENTS OF SHAREHOLDER'S EQUITY
|
|
Common
|
|
Capital in
|
Treasury
|
Accumulated Other
|
|
|
||||||||||||||||||||
|
|
Shares
|
Common
|
Excess of
|
Stock,
|
Comprehensive
|
Retained
|
|
||||||||||||||||||||
|
(in millions)
|
Outstanding
|
Stock
|
Par Value
|
at Cost
|
Loss
|
Earnings
|
Total
|
||||||||||||||||||||
|
Balances at December 31, 2007
|
38.051
|
|
$
|
42.8
|
|
$
|
899.1
|
|
$
|
(112.5
|
)
|
$
|
(133.3
|
)
|
$
|
329.3
|
|
$
|
1,025.4
|
|
|||||||
|
2008 net loss
|
|
|
|
|
|
|
|
|
|
|
(135.9
|
)
|
(135.9
|
)
|
|||||||||||||
|
Other comprehensive income (loss):
|
|
|
|
|
|
|
|
|
|
|
|
|
|
|
|||||||||||||
|
Related to marketable securities:
|
|
|
|
|
|
|
|
|
|
|
|
|
|
|
|||||||||||||
|
Change in fair value
|
|
|
|
|
|
|
|
|
(8.7
|
)
|
|
|
|
|
|||||||||||||
|
Reclassification to earnings
|
|
|
|
|
|
|
|
|
(0.2
|
)
|
|
|
|
|
|||||||||||||
|
Income tax effect
|
|
|
|
|
|
|
|
|
3.3
|
|
|
|
|
|
|||||||||||||
|
|
|
|
|
|
|
|
|
|
(5.6
|
)
|
|
|
(5.6
|
)
|
|||||||||||||
|
Related to employee benefit plans:
|
|
|
|
|
|
|
|
|
|
|
|
|
|
|
|||||||||||||
|
Pension liability adjustment, net of $113.5 tax effect
|
|
|
|
|
|
|
|
|
(188.9
|
)
|
|
|
(188.9
|
)
|
|||||||||||||
|
Postretirement medical liability adjustment, net of $0.5 tax effect
|
|
|
|
|
|
|
|
|
(0.8
|
)
|
|
|
(0.8
|
)
|
|||||||||||||
|
Officers supplemental retirement plan, net of $0.1 tax effect
|
|
|
|
|
|
|
|
|
0.3
|
|
|
|
0.3
|
|
|||||||||||||
|
Total comprehensive loss
|
|
|
|
|
|
|
|
|
|
|
|
|
(330.9
|
)
|
|||||||||||||
|
Purchase of treasury stock
|
(2.126
|
)
|
—
|
|
—
|
|
(48.9
|
)
|
|
|
|
|
(48.9
|
)
|
|||||||||||||
|
Stock-based compensation
|
—
|
|
—
|
|
13.4
|
|
—
|
|
|
|
|
|
13.4
|
|
|||||||||||||
|
Treasury stock issued under stock plans
|
0.001
|
|
—
|
|
—
|
|
—
|
|
|
|
|
|
—
|
|
|||||||||||||
|
Stock issued for employee stock purchase plan
|
0.169
|
|
0.2
|
|
3.0
|
|
—
|
|
|
|
|
|
3.2
|
|
|||||||||||||
|
Stock issued under stock plans
|
0.180
|
|
0.2
|
|
(0.5
|
)
|
—
|
|
|
|
|
|
(0.3
|
)
|
|||||||||||||
|
Balances at December 31, 2008
|
36.275
|
|
$
|
43.2
|
|
$
|
915.0
|
|
$
|
(161.4
|
)
|
$
|
(328.3
|
)
|
$
|
193.4
|
|
$
|
661.9
|
|
|||||||
|
2009 net income
|
|
|
|
|
|
|
|
|
|
|
121.6
|
|
121.6
|
|
|||||||||||||
|
Other comprehensive income (loss):
|
|
|
|
|
|
|
|
|
|
|
|
|
|
|
|||||||||||||
|
Related to marketable securities:
|
|
|
|
|
|
|
|
|
|
|
|
|
|
|
|||||||||||||
|
Change in fair value
|
|
|
|
|
|
|
|
|
20.4
|
|
|
|
|
|
|||||||||||||
|
Reclassification to earnings
|
|
|
|
|
|
|
|
|
(2.5
|
)
|
|
|
|
|
|||||||||||||
|
Income tax effect
|
|
|
|
|
|
|
|
|
(6.7
|
)
|
|
|
|
|
|||||||||||||
|
|
|
|
|
|
|
|
|
|
11.2
|
|
|
|
11.2
|
|
|||||||||||||
|
Related to employee benefit plans:
|
|
|
|
|
|
|
|
|
|
|
|
|
|
|
|||||||||||||
|
Pension liability adjustment, net of $42.3 tax effect
|
|
|
|
|
|
|
|
|
71.9
|
|
|
|
71.9
|
|
|||||||||||||
|
Postretirement medical liability adjustment, net of $2.3 tax effect
|
|
|
|
|
|
|
|
|
3.9
|
|
|
|
3.9
|
|
|||||||||||||
|
Officers supplemental retirement plan, net of $0.2 tax effect
|
|
|
|
|
|
|
|
|
(0.2
|
)
|
|
|
(0.2
|
)
|
|||||||||||||
|
Related to interest rate derivative instruments:
|
|
|
|
|
|
|
|
|
|
|
|
|
|
|
|||||||||||||
|
Change in fair value
|
|
|
|
|
|
|
|
|
2.4
|
|
|
|
|
|
|||||||||||||
|
Income tax effect
|
|
|
|
|
|
|
|
|
(0.9
|
)
|
|
|
|
|
|||||||||||||
|
|
|
|
|
|
|
|
|
|
1.5
|
|
|
|
1.5
|
|
|||||||||||||
|
Total comprehensive income
|
|
|
|
|
|
|
|
|
|
|
|
|
209.9
|
|
|||||||||||||
|
Purchase of treasury stock
|
(1.325
|
)
|
—
|
|
—
|
|
(23.8
|
)
|
|
|
|
|
(23.8
|
)
|
|||||||||||||
|
Stock-based compensation
|
—
|
|
—
|
|
11.9
|
|
—
|
|
|
|
|
|
11.9
|
|
|||||||||||||
|
Treasury stock issued under stock plans
|
0.069
|
|
—
|
|
—
|
|
1.5
|
|
|
|
|
|
1.5
|
|
|||||||||||||
|
Delisting of treasury shares
|
—
|
|
(7.9
|
)
|
(170.1
|
)
|
178.0
|
|
|
|
|
|
—
|
|
|||||||||||||
|
Stock issued for employee stock purchase plan
|
0.185
|
|
0.2
|
|
2.9
|
|
—
|
|
|
|
|
|
3.1
|
|
|||||||||||||
|
Stock issued under stock plans, including $0.3 million tax benefit
|
0.387
|
|
0.3
|
|
7.3
|
|
—
|
|
|
|
|
|
7.6
|
|
|||||||||||||
|
Balances at December 31, 2009
|
35.591
|
|
$
|
35.8
|
|
$
|
767.0
|
|
$
|
(5.7
|
)
|
$
|
(240.0
|
)
|
$
|
315.0
|
|
$
|
872.1
|
|
|||||||
See accompanying notes to consolidated financial statements.
58
CONSOLIDATED STATEMENTS OF SHAREHOLDERS' EQUITY - (continued)
|
|
Common
|
|
Capital in
|
Treasury
|
Accumulated Other
|
|
|
||||||||||||||||||||
|
|
Shares
|
Common
|
Excess of
|
Stock,
|
Comprehensive
|
Retained
|
|
||||||||||||||||||||
|
(In millions)
|
Outstanding
|
Stock
|
Par Value
|
at Cost
|
Loss
|
Earnings
|
Total
|
||||||||||||||||||||
|
Balances at December 31, 2009
|
35.591
|
|
$
|
35.8
|
|
$
|
767.0
|
|
$
|
(5.7
|
)
|
$
|
(240.0
|
)
|
$
|
315.0
|
|
$
|
872.1
|
|
|||||||
|
2010 net income
|
|
|
|
|
|
|
|
|
|
|
251.1
|
|
251.1
|
|
|||||||||||||
|
Other comprehensive income (loss):
|
|
|
|
|
|
|
|
|
|
|
|
|
|
|
|||||||||||||
|
Related to marketable securities:
|
|
|
|
|
|
|
|
|
|
|
|
|
|
|
|||||||||||||
|
Change in fair value
|
|
|
|
|
|
|
|
|
7.2
|
|
|
|
|
|
|||||||||||||
|
Reclassification to earnings
|
|
|
|
|
|
|
|
|
(8.3
|
)
|
|
|
|
|
|||||||||||||
|
Income tax effect
|
|
|
|
|
|
|
|
|
0.4
|
|
|
|
|
|
|||||||||||||
|
|
|
|
|
|
|
|
|
|
(0.7
|
)
|
|
|
(0.7
|
)
|
|||||||||||||
|
Related to employee benefit plans:
|
|
|
|
|
|
|
|
|
|
|
|
|
|
|
|||||||||||||
|
Pension liability adjustment, net of $8.5 tax effect
|
|
|
|
|
|
|
|
|
(14.2
|
)
|
|
|
(14.2
|
)
|
|||||||||||||
|
Postretirement medical liability adjustment, net of $1.7 tax effect
|
|
|
|
|
|
|
|
|
(2.9
|
)
|
|
|
(2.9
|
)
|
|||||||||||||
|
Officers supplemental retirement plan, net of $1.5 tax effect
|
|
|
|
|
|
|
|
|
(2.4
|
)
|
|
|
(2.4
|
)
|
|||||||||||||
|
Related to interest rate derivative instruments:
|
|
|
|
|
|
|
|
|
|
|
|
|
|
|
|||||||||||||
|
Change in fair value
|
|
|
|
|
|
|
|
|
(11.2
|
)
|
|
|
|
|
|||||||||||||
|
Income tax effect
|
|
|
|
|
|
|
|
|
4.2
|
|
|
|
|
|
|||||||||||||
|
|
|
|
|
|
|
|
|
|
(7.0
|
)
|
|
|
(7.0
|
)
|
|||||||||||||
|
Total comprehensive income
|
|
|
|
|
|
|
|
|
|
|
|
|
223.9
|
|
|||||||||||||
|
Purchase of treasury stock
|
(1.001
|
)
|
—
|
|
—
|
|
(45.1
|
)
|
|
|
|
|
(45.1
|
)
|
|||||||||||||
|
Stock-based compensation
|
—
|
|
—
|
|
13.7
|
|
—
|
|
|
|
|
|
13.7
|
|
|||||||||||||
|
Treasury stock issued under stock plans
|
0.167
|
|
—
|
|
—
|
|
4.8
|
|
|
|
|
|
4.8
|
|
|||||||||||||
|
Stock issued for employee stock purchase plan
|
0.016
|
|
—
|
|
—
|
|
—
|
|
|
|
|
|
—
|
|
|||||||||||||
|
Stock issued under stock plans, including $5.8 million tax benefit
|
1.151
|
|
1.2
|
|
34.8
|
|
—
|
|
|
|
|
|
36.0
|
|
|||||||||||||
|
Balances at December 31, 2010
|
35.924
|
|
$
|
37.0
|
|
$
|
815.5
|
|
$
|
(46.0
|
)
|
$
|
(267.2
|
)
|
$
|
566.1
|
|
$
|
1,105.4
|
|
|||||||
See accompanying notes to consolidated financial statements.
|
Year Ended December 31
(in millions)
|
2010
|
2009
|
2008
|
|||||||||
|
Cash flows from operating activities:
|
|
|
|
|||||||||
|
Net income (loss)
|
$
|
251.1
|
|
$
|
121.6
|
|
$
|
(135.9
|
)
|
|||
|
Adjustments to reconcile net income (loss) to net cash provided by operating activities:
|
|
|
|
|
|
|
||||||
|
Non-cash impact of pilot contract transition costs
|
—
|
|
15.5
|
|
—
|
|
||||||
|
Restructuring charges
|
13.2
|
|
8.8
|
|
84.1
|
|
||||||
|
Depreciation and amortization
|
230.5
|
|
219.2
|
|
204.6
|
|
||||||
|
Stock-based compensation
|
13.7
|
|
11.9
|
|
13.4
|
|
||||||
|
Changes in fair values of open fuel hedge contracts
|
(14.3
|
)
|
(88.7
|
)
|
84.2
|
|
||||||
|
Changes in deferred income taxes
|
145.3
|
|
84.1
|
|
(61.0
|
)
|
||||||
|
(Increase) decrease in receivables - net
|
(8.3
|
)
|
4.9
|
|
21.3
|
|
||||||
|
Increase in prepaid expenses and other current assets
|
(9.7
|
)
|
(10.3
|
)
|
(8.6
|
)
|
||||||
|
Increase (decrease) in air traffic liability
|
56.1
|
|
(6.4
|
)
|
8.2
|
|
||||||
|
Increase (decrease) in other current liabilities
|
25.1
|
|
8.1
|
|
(40.7
|
)
|
||||||
|
Increase (decrease) in deferred revenue and other-net
|
(149.0
|
)
|
(76.2
|
)
|
2.9
|
|
||||||
|
Net cash provided by operating activities
|
553.7
|
|
292.5
|
|
172.5
|
|
||||||
|
Cash flows from investing activities:
|
|
|
|
|
|
|
||||||
|
Property and equipment additions:
|
|
|
|
|
|
|
||||||
|
Aircraft and aircraft purchase deposits
|
(138.6
|
)
|
(367.2
|
)
|
(317.1
|
)
|
||||||
|
Other flight equipment
|
(27.2
|
)
|
(30.6
|
)
|
(56.5
|
)
|
||||||
|
Other property and equipment
|
(17.2
|
)
|
(40.6
|
)
|
(39.2
|
)
|
||||||
|
Total property and equipment additions
|
(183.0
|
)
|
(438.4
|
)
|
(412.8
|
)
|
||||||
|
Proceeds from disposition of assets
|
7.2
|
|
6.7
|
|
9.6
|
|
||||||
|
Purchases of marketable securities
|
(1,022.0
|
)
|
(942.6
|
)
|
(766.0
|
)
|
||||||
|
Sales and maturities of marketable securities
|
931.0
|
|
725.0
|
|
579.6
|
|
||||||
|
Restricted deposits and other
|
(28.4
|
)
|
(8.1
|
)
|
8.3
|
|
||||||
|
Net cash used in investing activities
|
(295.2
|
)
|
(657.4
|
)
|
(581.3
|
)
|
||||||
|
Cash flows from financing activities:
|
|
|
|
|
|
|
||||||
|
Proceeds from issuance of long-term debt
|
—
|
|
275.0
|
|
883.9
|
|
||||||
|
Proceeds from sale-leaseback transactions, net
|
—
|
|
230.0
|
|
—
|
|
||||||
|
Long-term debt payments
|
(321.0
|
)
|
(261.0
|
)
|
(343.2
|
)
|
||||||
|
Purchase of treasury stock
|
(45.1
|
)
|
(23.8
|
)
|
(48.9
|
)
|
||||||
|
Proceeds and tax benefit from issuance of common stock
|
36.5
|
|
13.0
|
|
4.0
|
|
||||||
|
Other financing activities
|
(3.6
|
)
|
12.8
|
|
(8.2
|
)
|
||||||
|
Net cash (used in) provided by financing activities
|
(333.2
|
)
|
246.0
|
|
487.6
|
|
||||||
|
Net change in cash and cash equivalents
|
(74.7
|
)
|
(118.9
|
)
|
78.8
|
|
||||||
|
Cash and cash equivalents at beginning of year
|
164.2
|
|
283.1
|
|
204.3
|
|
||||||
|
Cash and cash equivalents at end of year
|
$
|
89.5
|
|
$
|
164.2
|
|
$
|
283.1
|
|
|||
|
Supplemental disclosure of cash paid (refunded) during the year for:
|
|
|
|
|
|
|
||||||
|
Interest (net of amount capitalized)
|
$
|
106.0
|
|
$
|
94.6
|
|
$
|
71.0
|
|
|||
|
Income taxes
|
0.4
|
|
(8.8
|
)
|
(0.6
|
)
|
||||||
See accompanying notes to consolidated financial statements.
59
NOTES TO CONSOLIDATED FINANCIAL STATEMENTS
Alaska Air Group, Inc.
December 31, 2010
Organization and Basis of Presentation
The consolidated financial statements include the accounts of Alaska Air Group, Inc. (Air Group or the Company) and its subsidiaries, Alaska Airlines, Inc. (Alaska) and Horizon Air Industries, Inc. (Horizon), through which the Company conducts substantially all of its operations. All significant intercompany balances and transactions have been eliminated. These financial statements have been prepared in conformity with accounting principles generally accepted in the United States of America and their preparation requires the use of management’s estimates. Actual results may differ from these estimates. Certain reclassifications have been made to confirm the prior year data to the current format.
Nature of Operations
Alaska and Horizon operate as airlines. However, their business plans, competition, and economic risks differ substantially. For more detailed information about the Company’s operations, see Item 1. “Our Business” in this Form 10-K.
The Company’s operations and financial results are subject to various uncertainties, such as general economic conditions, volatile fuel prices, industry instability, intense competition, a largely unionized work force, the need to finance large capital expenditures and the related availability of capital, government regulation, and potential aircraft incidents.
Approximately 73% of Air Group’s employees are covered by collective bargaining agreements, including approximately 10% that are covered under agreements that are currently in negotiations or become amendable prior to
December 31, 2011
.
The airline industry is characterized by high fixed costs. Small fluctuations in load factors and yield (a measure of ticket prices) can have a significant impact on operating results. The Company has been and continues working to reduce unit costs to better compete with carriers that have lower cost structures.
Substantially all sales occur in the United States. See Note 12 for operating segment information and geographic concentrations.
Cash and Cash Equivalents
Cash equivalents consist of highly liquid investments with original maturities of three months or less. They are carried at cost, which approximates market value. The Company reduces cash balances when checks are disbursed. Due to the time delay in checks clearing the banks, the Company normally maintains a negative balance in its cash disbursement accounts, which is reported as a current liability. The amount of the negative cash balance was $23.3 million and $26.9 million at
December 31, 2010
and
2009
, respectively, and is included in accounts payable.
Receivables
Receivables consist primarily of airline traffic (including credit card) receivables, amounts from customers, Mileage Plan partners, government tax authorities, and other miscellaneous amounts due to the Company, and are net of an allowance for doubtful accounts. Management determines the allowance for doubtful accounts based on known troubled accounts and historical experience applied to an aging of accounts.
Inventories and Supplies—net
Expendable aircraft parts, materials and supplies are stated at average cost and are included in inventories and supplies
—
net. An obsolescence allowance for expendable parts is accrued based on estimated lives of the corresponding fleet type and salvage values. Surplus inventories are carried at their net realizable value. The allowance for all non-surplus expendable inventories was $29.0 million and $26.0 million at
December 31, 2010
and
2009
, respectively. Inventory and supplies
—
net also includes fuel inventory of $20.2 million and $14.0 million at
December 31, 2010
and
2009
, respectively. Repairable and rotable aircraft parts inventories are included in flight equipment.
Property, Equipment and Depreciation
Property and equipment are recorded at cost and depreciated using the straight-line method over their estimated useful lives, which are as follows:
|
Aircraft and related flight equipment:
|
|
|
Boeing 737-400/700/800/900
|
20 years
|
|
Bombardier Q400
|
15 years
|
|
Buildings
|
25-30 years
|
|
Minor building and land improvements
|
10 years
|
|
Capitalized leases and leasehold improvements
|
Shorter of lease term or
estimated useful life
|
|
Computer hardware and software
|
3-5 years
|
|
Other furniture and equipment
|
5-10 years
|
As a result of the planned early retirement of the CRJ-700 fleet, all remaining flight equipment is depreciated down to their expected salvage values. The estimated useful lives are aligned with the fleet’s average expected retirement date.
“Related flight equipment” includes rotable and repairable spare inventories, which are depreciated over the associated fleet life unless otherwise noted.
Maintenance and repairs, other than engine maintenance on B737-400, -700 and -900 engines, are expensed when incurred. Major modifications that extend the life or improve the usefulness of aircraft are capitalized and depreciated over their estimated period of use. Maintenance on B737-400, -700 and -900 engines is covered under power-by-the-hour agreements with third parties, whereby the Company pays a determinable amount, and transfers risk, to a third party. The Company expenses the contract amounts based on engine usage.
The Company evaluates long-lived assets to be held and used for impairment whenever events or changes in circumstances indicate that the total carrying amount of an asset or asset group may not be recoverable. The Company groups assets for purposes of such reviews at the lowest level for which identifiable cash flows of the asset group are largely independent of the cash flows of other groups of assets and liabilities. An impairment loss is considered when estimated future undiscounted cash flows expected to result from the use of the asset or asset group and its eventual disposition are less than its carrying amount. If the asset or asset group is not considered recoverable, a write- down equal to the excess of the carrying amount over the fair value will be recorded. The Company determined that its two owned CRJ-700 aircraft and the fleet’s related spare parts were impaired during 2008. See Note 7 for further discussion of this impairment and other fleet transition costs.
Internally Used Software Costs
The Company capitalizes costs to develop internal-use software that are incurred in the application development stage. Amortization commences when the software is ready for its intended use and the amortization period is the estimated useful life of the software, generally three to five years. Capitalized costs primarily include contract labor and payroll costs of the individuals dedicated to the development of internal-use software. The Company capitalized software development costs of $0.7 million in both 2010 and 2009, and $1.0 million in
2008
.
Workers Compensation and Employee Health-Care Accruals
The Company uses a combination of self-insurance and insurance programs to provide for workers compensation claims and employee health care benefits. Liabilities associated with the risks that are retained by the Company are not discounted and are estimated, in part, by considering historical claims experience, severity factors and other actuarial assumptions. The estimated accruals for these liabilities could be significantly affected if future occurrences and claims differ from these assumptions and historical trends. The accrual is part of other current and long-term liabilities, and was $42.4 million and $41.9 million as of
December 31, 2010
and
December 31, 2009
, respectively.
Deferred Revenue
Deferred revenue results primarily from the sale of Mileage Plan miles to third-parties. This revenue is recognized when award transportation is provided or over the term of the applicable agreement.
Operating Leases
The Company leases aircraft, airport and terminal facilities, office space, and other equipment under operating leases. Some of these lease agreements contain rent escalation clauses or rent holidays. For scheduled rent escalation clauses during the lease terms or for rental payments commencing at a date other than the date of initial occupancy, the Company records minimum rental expenses on a straight-line basis over the terms of the leases in the consolidated statements of operations.
Leased Aircraft Return Costs
Cash payments associated with returning leased aircraft are accrued when it is probable that a cash payment will be made and that amount is reasonably estimable. Any accrual is based on the time remaining on the lease, planned aircraft usage and the provisions included in the lease agreement, although the actual amount due to any lessor upon return will not be known with certainty until lease termination.
As leased aircraft are returned, any payments are charged against the established accrual. The accrual is part of other current and long-term liabilities, and was $2.9 million and $9.2 million as of
December 31, 2010
and
December 31, 2009
, respectively.
Revenue Recognition
Passenger revenue is recognized when the passenger travels. Tickets sold but not yet used are reported as air traffic liability until travel or date of expiration. Commissions to travel agents and related fees are expensed when the related revenue is recognized. Passenger traffic commissions and related fees not yet recognized are included as a prepaid expense. Due to complex pricing structures, refund and exchange policies, and interline agreements with other airlines, certain amounts are recognized as revenue using estimates regarding both the timing of the revenue recognition and the amount of revenue to be recognized. These estimates are generally based on the Company’s historical data.
Passenger revenue also includes certain “ancillary” or non-ticket revenue such as reservations fees, ticket change fees, and baggage service charges. These fees are recognized as revenue when the related services are provided.
Freight and mail revenues are recognized when service is provided.
Other
—
net revenues are primarily related to the Mileage Plan and they are recognized as described in the “Mileage Plan” paragraph below. Other—net also includes certain ancillary revenues such as on-board food and beverage sales, and to a much lesser extent commissions from car and hotel vendors, and from the sales of travel insurance. These items are recognized as revenue when the services are provided. Boardroom (airport lounges) memberships are recognized as revenue over the membership period.
Mileage Plan
Alaska operates a frequent flyer program (“Mileage Plan”) that provides travel awards to members based on accumulated mileage. For miles earned by flying on Alaska or Horizon and through airline partners, the estimated cost of providing free travel awards is recognized as a selling expense and accrued as a liability as miles are earned and accumulated.
Alaska also sells miles to non-airline partners such as hotels, car rental agencies, and a major bank that offers Alaska Airlines affinity credit cards. The Company defers the portion of the sales proceeds that represents the estimated fair value of the award transportation and recognizes that amount as revenue when the award transportation is provided. The deferred proceeds are recognized as passenger revenue for awards redeemed and flown on Alaska or Horizon, and as other-net revenue for awards redeemed and flown on other airlines (less the cost paid to the other airline). The portion of the sales proceeds not deferred is recognized as commission income in the period that the mileage credits are sold and included in other revenue
—
net in the consolidated statements of operations.
60
Alaska’s Mileage Plan deferred revenue and liabilities are included under the following consolidated balance sheet captions at December 31 (in millions):
|
2010
|
2009
|
||||||
|
Current Liabilities:
|
|
|
|||||
|
Other accrued liabilities
|
$
|
278.0
|
|
$
|
267.9
|
|
|
|
Other Liabilities and Credits:
|
|
|
|
|
|||
|
Deferred revenue
|
382.1
|
|
410.6
|
|
|||
|
Other liabilities
|
13.8
|
|
13.2
|
|
|||
|
Total
|
$
|
673.9
|
|
$
|
691.7
|
|
|
The amounts recorded in other accrued liabilities relate primarily to deferred revenue expected to be realized within one year, including $43.0 million and $41.6 million at
December 31, 2010
and
2009
, respectively, associated with Mileage Plan awards issued but not yet flown.
Alaska’s Mileage Plan revenue is included under the following consolidated statements of operations captions for the years ended December 31 (in millions):
|
|
2010
|
2009
|
2008
|
||||||||
|
Passenger revenues
|
$
|
189.5
|
|
$
|
182.1
|
|
$
|
144.2
|
|
||
|
Other-net revenues
|
183.3
|
|
151.5
|
|
101.5
|
|
|||||
|
Change in Mileage Plan terms
|
—
|
|
—
|
|
42.3
|
|
|||||
|
Total Mileage Plan revenues
|
$
|
372.8
|
|
$
|
333.6
|
|
$
|
288.0
|
|
||
During 2008, the Company changed the terms of its Mileage Plan program regarding the expiration of award miles, whereby Mileage Plan accounts with no activity for two years are now deleted. As a result of the deletion of a number of accounts, the Company reduced its liability for future travel awards by $42.3 million, which was recorded in the consolidated statements of operations as “Change in Mileage Plan terms.” Other
—
net revenues includes commission revenue of $123.7 million, $96.8 million and $57.0 million in 2010, 2009 and 2008.
Aircraft Fuel
Aircraft fuel includes raw jet fuel and associated “into-plane” costs, fuel taxes, oil, and all of the gains and losses associated with fuel hedge contracts.
Contracted Services
Contracted services includes expenses for ground handling, security, navigation fees, temporary employees, data processing fees, and other similar services.
Selling Expenses
Selling expenses include credit card fees, global distribution systems charges, the estimated cost of Mileage Plan free travel awards earned through air travel, advertising, promotional costs, commissions, and incentives. Advertising production costs are expensed the first time the advertising takes place. Advertising expense was $16.0 million, $16.8 million, and $14.0 million during the years ended
December 31, 2010
,
2009
, and
2008
, respectively.
Capitalized Interest
Interest is capitalized on flight equipment purchase deposits as a cost of the related asset, and is depreciated over the estimated useful life of the asset. The capitalized interest is based on the Company’s weighted-average borrowing rate.
Derivative Financial Instruments
The Company accounts for financial derivative instruments as prescribed under the accounting standards for derivatives and hedging activity. See Note 2 and Note 3 for further discussion.
Income Taxes
The Company uses the asset and liability approach for accounting and reporting income taxes. Deferred tax assets and liabilities are recognized for future tax consequences attributable to differences between the financial statement carrying amounts of existing assets and liabilities and their respective tax bases, and for operating loss and tax credit carryforwards. Deferred tax assets and liabilities are measured using enacted tax rates expected to apply to taxable income in the years in which those temporary differences are expected to be recovered or settled. The effect on deferred tax assets and liabilities of a change in tax rates is recognized in the period that includes the enactment date. A valuation allowance would be established, if necessary, for the amount of any tax benefits that, based on available evidence, are not expected to be realized. The Company accounts for unrecognized tax benefits in accordance with the accounting standards. See Note 11 for further discussion.
Taxes Collected from Passenger
s
Taxes collected from passengers, including sales taxes, airport and security fees and other fees, are recorded on a net basis within passenger revenue in the consolidated statements of operations.
Stock-Based Compensation
Accounting standards require companies to recognize as expense the fair value of stock options and other equity-based compensation issued to employees as of the grant date. These standards apply to all stock awards that the Company grants to employees as well as the Company’s Employee Stock Purchase Plan (ESPP), which features a look-back provision and allows employees to purchase stock at a 15% discount. All stock-based compensation expense is recorded in wages and benefits in the consolidated statements of operations.
Accounting Pronouncements Adopted in 2009
Effective July 2, 2009, the Accounting Standards Codification (ASC) of the Financial Accounting Standards Board (FASB) became the single official source of authoritative, nongovernmental GAAP in the United States. Although the Company's accounting policies were not affected by the conversion to ASC, references to specific accounting standards in these notes to the consolidated financial statements have been changed to eliminate references to previous standards.
In March 2008, the FASB issued new standards regarding disclosures about derivatives instruments and hedging. These new standards require entities that use derivative instruments to provide certain qualitative disclosures about their objectives and strategies for using such instruments, amounts and location of the derivatives in the financial statements, among other disclosures. This standard was adopted as of January 1, 2009. The required disclosures are included in Note 3 and Note 12. The adoption of this standard did not have a material impact on the disclosures historically provided.
In April 2009, the FASB issued a new standard that clarifies the determination of fair value for assets and liabilities that may be involved in transactions that would not be considered orderly as defined in the position statement. In April 2009, the FASB also issued new accounting standards that provide additional guidance in determining whether a debt security is other-than-temporarily impaired and how entities should record the impairment in the financial statements. The standard requires credit losses, as defined, to be recorded through the statement of operations and the remaining impairment loss to be recorded through accumulated other comprehensive income. Both of these standards were effective for the Company as of June 30, 2009. See Note 5 and Note 12 for a discussion of the impact of these new positions to the Company's financial statements.
In April 2009, the FASB issued new accounting standards that require companies to provide, on an interim basis, disclosures that were previously only required in annual statements for the fair value of financial instruments. This new standard was effective for the Company as of June 30, 2009. The required disclosures impacted the Company's Form 10Q filings for the second and third quarters in 2009. The new standards did not have an impact on annual financial statements.
In December 2008, the FASB issued new accounting standards regarding disclosure about pension and other postretirement benefits which, among other things, expands the disclosure regarding assets in an employer's pension and postretirement benefit plans. The standard requires the Company to add the fair value hierarchy disclosures required by the accounting standards as it relates to the investments of the pension and postretirement benefit plans. This statement is effective for annual financial statements for fiscal years ending after December 15, 2009. See Note 6 for the disclosures required by this standard. This position had no impact on the Company's financial position or results of operations.
61
Fourth Quarter Adjustments
There were no significant adjustments in the fourth quarters of
2010
,
2009
and
2008
.
Fair Value Measurements
Accounting standards define fair value as the exchange price that would be received for an asset or paid to transfer a liability (an exit price) in the principal or most advantageous market for the asset or liability in an orderly transaction between market participants on the measurement date. The standards also establish a fair value hierarchy, which requires an entity to maximize the use of observable inputs and minimize the use of unobservable inputs when measuring fair value. There are three levels of inputs that may be used to measure fair value:
Level 1
- Quoted prices in active markets for identical assets or liabilities.
Level 2
- Observable inputs other than Level 1 prices such as quoted prices for similar assets or liabilities; quoted prices in markets that are not active; or other inputs that are observable or can be corroborated by observable market data for substantially the full term of the assets or liabilities.
Level 3
- Unobservable inputs that are supported by little or no market activity and that are significant to the fair value of the assets or liabilities.
Cash, Cash Equivalents and Marketable Securities
The Company uses the “market approach” in determining the fair value of its cash, cash equivalents and marketable securities. The securities held by the Company are valued based on observable prices in active markets.
Amounts measured at fair value as of
December 31, 2010
are as follows (in millions):
|
|
Level 1
|
Level 2
|
Level 3
|
Total
|
|||||||||||
|
Cash and cash equivalents
|
$
|
89.5
|
|
$
|
—
|
|
$
|
—
|
|
$
|
89.5
|
|
|||
|
Marketable securities
|
254.8
|
|
863.9
|
|
—
|
|
1,118.7
|
|
|||||||
|
Total
|
$
|
344.3
|
|
$
|
863.9
|
|
$
|
—
|
|
$
|
1,208.2
|
|
|||
Amounts measured at fair value as of
December 31, 2009
are as follows (in millions):
|
|
Level 1
|
Level 2
|
Level 3
|
Total
|
|||||||||||
|
Cash and cash equivalents
|
$
|
164.2
|
|
$
|
—
|
|
$
|
—
|
|
$
|
164.2
|
|
|||
|
Marketable securities
|
108.9
|
|
919.0
|
|
—
|
|
1,027.9
|
|
|||||||
|
Total
|
$
|
273.1
|
|
$
|
919.0
|
|
$
|
—
|
|
$
|
1,192.1
|
|
|||
All of the Company’s marketable securities are classified as available-for-sale. The securities are carried at fair value, with the unrealized gains and losses reported in shareholders’ equity under the caption “accumulated other comprehensive loss” (AOCL). Realized gains and losses are included in other nonoperating income (expense) in the consolidated statements of operations.
The cost of securities sold is based on the specific identification method. Interest and dividends on marketable securities are included in interest income in the consolidated statements of operations.
The Company’s overall investment strategy has a primary goal of maintaining and securing its investment principal. The Company’s investment portfolio is managed by well-known financial institutions and continually reviewed to ensure that the investments are aligned with the Company’s documented strategy.
62
Marketable securities consisted of the following at December 31 (in millions):
|
|
2010
|
2009
|
|||||
|
Amortized Cost:
|
|
|
|||||
|
U.S. government securities
|
$
|
514.8
|
|
$
|
376.7
|
|
|
|
Asset-backed obligations
|
176.8
|
|
215.4
|
|
|||
|
Other corporate obligations
|
414.2
|
|
421.8
|
|
|||
|
|
$
|
1,105.8
|
|
$
|
1,013.9
|
|
|
|
Fair value:
|
|
|
|
|
|||
|
U.S. government securities
|
$
|
518.5
|
|
$
|
381.2
|
|
|
|
Asset-backed obligations
|
176.7
|
|
214.7
|
|
|||
|
Other corporate obligations
|
423.5
|
|
432.0
|
|
|||
|
|
$
|
1,118.7
|
|
$
|
1,027.9
|
|
|
Activity for marketable securities for the years ended
December 31, 2010
,
2009
and 2008 is as follows:
|
|
2010
|
2009
|
2008
|
||||||||
|
Proceeds from sales and maturities
|
$
|
931.0
|
|
$
|
725.0
|
|
$
|
579.6
|
|
||
|
Gross realized gains
|
10.4
|
|
7.0
|
|
7.2
|
|
|||||
|
Gross realized losses
|
2.3
|
|
2.3
|
|
3.8
|
|
|||||
Of the marketable securities on hand at
December 31, 2010
, 23% mature in 2011, 29% in 2012, and 48% thereafter.
Some of the Company’s asset-backed securities held at
December 31, 2010
had credit losses, as defined in the accounting standards. Based on a future cash flow analysis, the Company determined that it does not expect to recover the full amortized cost basis of certain asset-backed obligations. This analysis estimated the expected future cash flows by using a discount rate equal to the effective interest rate implicit in the securities at the date of acquisition. The inputs used to estimate future cash flows included the default, foreclosure, and bankruptcy rates on the underlying mortgages and expected home pricing trends. The Company also looked at the average credit scores of the individual mortgage holders and the average loan-to-value percentage. These credit losses of $2.2 million were recorded in 2009 in other nonoperating expenses.
Management does not believe the securities associated with the remaining $3.4 million unrealized loss recorded in AOCL are “other-than-temporarily” impaired, as defined in the accounting standards, based on the current facts and circumstances. Management currently does not intend to sell these securities prior to their recovery nor does it believe that it will be more-likely-than-not that the Company would need to sell these securities for liquidity or other reasons.
During 2008, the Company determined that certain corporate debt securities were other-than-temporarily impaired. As such, the Company recorded a $3.5 million loss in other
—
net nonoperating expense in 2008 representing the difference between the estimated fair market value and the amortized cost of the securities.
Gross unrealized gains and losses at
December 31, 2010
are presented in the table below (in millions):
|
|
|
Unrealized Losses
|
|
|
|||||||||||||||||||||||||||
|
|
Unrealized Gains
|
Less than 12 months
|
Greater than 12 months
|
Total Unrealized Losses
|
Less: Credit Loss Recorded in Earnings
|
Net Unrealized Losses in AOCL
|
Net Unrealized Gains/(Losses) in AOCL
|
Fair Value of Securities with Unrealized Losses
|
|||||||||||||||||||||||
|
U.S. Government Securities
|
$
|
5.1
|
|
$
|
(1.3
|
)
|
$
|
—
|
|
$
|
(1.3
|
)
|
$
|
—
|
|
$
|
(1.3
|
)
|
$
|
3.8
|
|
$
|
163.7
|
|
|||||||
|
Asset-backed obligations
|
1.3
|
|
(0.5
|
)
|
(3.2
|
)
|
(3.7
|
)
|
(2.2
|
)
|
(1.5
|
)
|
(0.2
|
)
|
77.7
|
|
|||||||||||||||
|
Other corporate obligations
|
9.8
|
|
(0.6
|
)
|
—
|
|
(0.6
|
)
|
—
|
|
(0.6
|
)
|
9.2
|
|
62.4
|
|
|||||||||||||||
|
Total
|
$
|
16.2
|
|
$
|
(2.4
|
)
|
$
|
(3.2
|
)
|
$
|
(5.6
|
)
|
$
|
(2.2
|
)
|
$
|
(3.4
|
)
|
$
|
12.8
|
|
$
|
303.8
|
|
|||||||
63
Gross unrealized gains and losses at
December 31, 2009
are presented in the table below (in millions):
|
|
|
Unrealized Losses
|
|
|
|||||||||||||||||||||||||||
|
|
Unrealized Gains
|
Less than 12 months
|
Greater than 12 months
|
Total Unrealized Losses
|
Less: Credit Loss Recorded in Earnings
|
Net Unrealized Losses in AOCL
|
Net Unrealized Gains/(Losses) in AOCL
|
Fair Value of Securities with Unrealized Losses
|
|||||||||||||||||||||||
|
U.S. Government Securities
|
$
|
4.7
|
|
$
|
(0.2
|
)
|
$
|
—
|
|
$
|
(0.2
|
)
|
$
|
—
|
|
$
|
(0.2
|
)
|
$
|
4.5
|
|
$
|
76.8
|
|
|||||||
|
Asset-backed obligations
|
2.4
|
|
(0.2
|
)
|
(5.1
|
)
|
(5.3
|
)
|
(2.2
|
)
|
(3.1
|
)
|
(0.7
|
)
|
61.2
|
|
|||||||||||||||
|
Other corporate obligations
|
10.4
|
|
(0.2
|
)
|
—
|
|
(0.2
|
)
|
—
|
|
(0.2
|
)
|
10.2
|
|
37.7
|
|
|||||||||||||||
|
Total
|
$
|
17.5
|
|
$
|
(0.6
|
)
|
$
|
(5.1
|
)
|
$
|
(5.7
|
)
|
$
|
(2.2
|
)
|
$
|
(3.5
|
)
|
$
|
14.0
|
|
$
|
175.7
|
|
|||||||
Fair Value of Financial Instruments
The majority of the Company’s financial instruments are carried at fair value. Those include cash, cash equivalents and marketable securities (Note 2), restricted deposits (Note 9), fuel hedge contracts (Note 3), and interest rate swap agreements (Note 3). The Company’s long-term fixed-rate debt is not carried at fair value.
The estimated fair value of the Company’s long-term debt was as follows (in millions):
|
|
Carrying
Amount
|
Fair
Value
|
|||||
|
Long-term debt at December 31, 2010
|
$
|
1,534.2
|
|
$
|
1,531.0
|
|
|
|
Long-term debt at December 31, 2009
|
$
|
1,855.2
|
|
$
|
1,821.3
|
|
|
The fair value of cash equivalents approximates carrying values due to the short maturity of these instruments. The fair value of marketable securities is based on market prices. The fair value of fuel hedge contracts is based on commodity exchange prices. The fair value of restricted deposits approximates the carrying amount. The fair value of interest rate swap agreements is based on quoted market swap rates. The fair value of long-term debt is based on a discounted cash flow analysis using the Company’s current borrowing rate.
Concentrations of Credit
The Company continually monitors its positions with, and the credit quality of, the financial institutions that are counterparties to its fuel-hedging contracts and interest rate swap agreements and does not anticipate nonperformance by the counterparties.
The Company could realize a loss in the event of nonperformance by any single counterparty to these contracts. However, the Company enters into transactions only with large, well-known financial institution counterparties that have strong credit ratings. In addition, the Company limits the amount of investment credit exposure with any one institution.
The Company’s trade receivables do not represent a significant concentration of credit risk at
December 31, 2010
due to the frequency that settlement takes place and the dispersion across many industry and government segments.
Fuel Hedge Contracts
The Company’s operations are inherently dependent upon the price and availability of aircraft fuel. To manage economic risks associated with fluctuations in aircraft fuel prices, the Company periodically enters into call options for crude oil and swap agreements for jet fuel refining margins, among other initiatives. The Company records these instruments on the balance sheet at their fair value. Changes in the fair value of these fuel hedge contracts are recorded each period in aircraft fuel expense.
64
The following table summarizes the components of aircraft fuel expense for the years ended
December 31, 2010
,
2009
and
2008
(in millions):
|
|
2010
|
2009
|
2008
|
||||||||
|
Raw or “into-plane” fuel cost
|
$
|
898.9
|
|
$
|
686.2
|
|
$
|
1,328.8
|
|
||
|
(Gains) or losses in value and settlements of fuel hedge contracts
|
2.0
|
|
(28.1
|
)
|
69.6
|
|
|||||
|
Aircraft fuel expense
|
$
|
900.9
|
|
$
|
658.1
|
|
$
|
1,398.4
|
|
||
The cash received, net of premiums expensed, in
2010
and
2008
was $3.3 million and $122.7 million, respectively. The premiums expensed, net of any cash received, for hedges that settled during
2009
totaled $60.7 million. The Company also realized losses of $50 million on fuel hedge contracts terminated in the fourth quarter of 2008 that had scheduled settlement dates in 2009 and 2010. These amounts represent the difference between the cash paid or received at settlement and the amount of premiums paid for the contracts at origination.
The Company uses the “market approach” in determining the fair value of its hedge portfolio. The Company’s fuel hedging contracts consist of over-the-counter contracts, which are not traded on an exchange. The fair value of these contracts is determined based on observable inputs that are readily available in active markets or can be derived from information available in active, quoted markets. Therefore, the Company has categorized these contracts as Level 2 in the fair value hierarchy described in Note 2.
Outstanding fuel hedge positions as of
December 31, 2010
are as follows:
|
|
Approximate % of
Expected Fuel
Requirements
|
Gallons Hedged
(in millions)
|
Approximate Crude Oil
Price per Barrel
|
Approximate Premium Price per Barrel
|
||
|
First Quarter 2011
|
50
|
%
|
47.0
|
|
$87
|
$11
|
|
Second Quarter 2011
|
50
|
%
|
49.4
|
|
$86
|
$10
|
|
Third Quarter 2011
|
50
|
%
|
51.9
|
|
$86
|
$11
|
|
Fourth Quarter 2011
|
50
|
%
|
48.6
|
|
$86
|
$11
|
|
Full Year 2011
|
50
|
%
|
196.9
|
|
$86
|
$11
|
|
First Quarter 2012
|
41
|
%
|
40.1
|
|
$86
|
$12
|
|
Second Quarter 2012
|
34
|
%
|
34.8
|
|
$88
|
$13
|
|
Third Quarter 2012
|
30
|
%
|
32.0
|
|
$90
|
$13
|
|
Fourth Quarter 2012
|
26
|
%
|
26.2
|
|
$88
|
$13
|
|
Full Year 2012
|
33
|
%
|
133.1
|
|
$88
|
$13
|
|
First Quarter 2013
|
21
|
%
|
21.0
|
|
$88
|
$13
|
|
Second Quarter 2013
|
16
|
%
|
16.6
|
|
$86
|
$14
|
|
Third Quarter 2013
|
11
|
%
|
11.7
|
|
$89
|
$15
|
|
Fourth Quarter 2013
|
5
|
%
|
5.4
|
|
$92
|
$14
|
|
Full Year 2013
|
13
|
%
|
54.7
|
|
$88
|
$14
|
As of
December 31, 2010
and
2009
, the net fair values of the Company's fuel hedge positions were as follows (in millions):
|
December 31, 2010
|
|
December 31, 2009
|
|
|||
|
Crude oil call options or “caps”
|
$
|
129.3
|
|
$
|
115.9
|
|
|
Refining margin swap contracts
|
2.0
|
|
1.1
|
|
||
|
Total
|
$
|
131.3
|
|
$
|
117.0
|
|
The balance sheet amounts include capitalized premiums paid to enter into the contracts of $108.6 million and $88.9 million at
December 31, 2010
and
2009
, respectively.
Interest Rate Swap Agreements
The Company has interest rate swap agreements with a third party designed to hedge the volatility of the underlying variable interest rate in the Company's aircraft lease agreements for six B737-800 aircraft. The agreements stipulate that the Company pay a fixed interest rate over the term of the contract and receive a floating interest rate. All significant terms of the swap agreement match the terms of the lease agreements, including interest-rate index, rate reset dates, termination dates and underlying notional values. The agreements expire from September 2020 through March 2021 to coincide with the lease termination dates.
The Company has formally designated these swap agreements as hedging instruments and records the effective portion of the hedge as an adjustment to aircraft rent in the consolidated statement of operations in the period of contract settlement. The effective portion of the changes in fair value for instruments that settle in the future is recorded in AOCL in the condensed consolidated balance sheets.
At
December 31, 2010
and
2009
, the Company had a liability of $8.8 million and an asset of $2.4 million, respectively, associated with these contracts, with the corresponding unrealized loss or gain in accumulated other comprehensive loss. The Company expects that $6 million will be reclassified into earnings within the next twelve months. The fair value of these contracts is determined based on the difference between the fixed interest rate in the agreements and the observable LIBOR-based interest forward rates at period end, multiplied by the total notional value. As such, the Company places these contracts in Level 2 of the fair value hierarchy.
At
December 31, 2010
and
2009
, long-term debt obligations were as follows (in millions):
|
|
2010
|
2009
|
|||||
|
Fixed-rate notes payable due through 2024*
|
$
|
1,233.6
|
|
$
|
1,440.2
|
|
|
|
Variable-rate notes payable due through 2024*
|
300.6
|
|
415.0
|
|
|||
|
Long-term debt
|
1,534.2
|
|
1,855.2
|
|
|||
|
Less current portion
|
(221.2
|
)
|
(156.0
|
)
|
|||
|
|
$
|
1,313.0
|
|
$
|
1,699.2
|
|
|
* The weighted-average fixed-interest rate was 6.0% as of
December 31, 2010
and
2009
. The weighted-average variable-interest rate was 1.8% and 2.5% as of
December 31, 2010
and
2009
, respectively.
At
December 31, 2010
, all of the Company’s borrowings were secured by flight equipment.
During
2010
, the Company had no new debt borrowings and made scheduled debt payments of $151.8 million. The Company also prepaid the full debt balance on six outstanding aircraft debt agreements and a partial payment on a seventh totaling $169.2 million. Subsequent to
December 31, 2010
, the Company prepaid the full balance on two additional aircraft debt agreements totaling $51.8 million. This amount is included in the current portion of long-term debt in the consolidated balance sheet.
At
December 31, 2010
, long-term debt principal payments for the next five years are as follows (in millions):
|
|
Total
|
||
|
2011
|
$
|
221.2
|
|
|
2012
|
216.9
|
|
|
|
2013
|
175.7
|
|
|
|
2014
|
141.9
|
|
|
|
2015
|
128.2
|
|
|
|
Thereafter
|
650.3
|
|
|
|
Total principal payments
|
$
|
1,534.2
|
|
Bank Line of Credit
The Company has two $100 million credit facilities. Both facilities have variable interest rates based on LIBOR plus a specified margin. Borrowings on one of the $100 million facilities, which expires in March 2013, are secured by aircraft. Borrowings on the other $100 million facility, which expires in March 2014, are secured by certain accounts receivable, spare engines, spare parts and ground service equipment. The Company has no immediate plans to borrow using either of these facilities. These facilities have a requirement to maintain a minimum unrestricted cash and marketable securities balance of $500 million. The Company is in compliance with this covenant at
December 31, 2010
.
The Company had a $185 million credit facility with a syndicate of financial institutions that expired on March 31, 2010.
Pre-delivery Payment Facility
Effective March 31, 2010, the Company terminated its variable-rate pre-delivery payment facility that had been used to provide a portion of the pre-delivery funding requirements for the purchase of new Boeing 737-800 aircraft. There were no borrowings on this facility at December 31, 2009, or the date of termination.
Lease Commitments
At
December 31, 2010
, the Company had lease contracts for 77 aircraft, which have remaining noncancelable lease terms of less than one year to over ten years. Of these aircraft, 19 are non-operating (i.e. not in our fleet) and subleased to third party carriers. The majority of airport and terminal facilities are also leased. Total rent expense was $294.5 million, $303.1 million, and $313.5 million, in
2010
,
2009
, and
2008
, respectively.
Future minimum lease payments with noncancelable terms in excess of one year as of
December 31, 2010
are shown below (in millions):
|
|
Operating Leases
|
||||||
|
|
Aircraft
|
Facilities
|
|||||
|
2011
|
153.2
|
|
61.3
|
|
|||
|
2012
|
143.3
|
|
54.1
|
|
|||
|
2013
|
131.3
|
|
26.5
|
|
|||
|
2014
|
117.1
|
|
22.9
|
|
|||
|
2015
|
93.9
|
|
12.8
|
|
|||
|
Thereafter
|
185.9
|
|
99.6
|
|
|||
|
Total lease payments
|
$
|
824.7
|
|
$
|
277.2
|
|
|
Aircraft Commitments
In 2005, Alaska entered into an aircraft purchase agreement to acquire B737-800 aircraft with deliveries beginning in January 2006 and continuing through April 2011. As of
December 31, 2010
, Alaska was committed to purchasing 13 B737-800 aircraft, three of which will be delivered in 2011. Subsequent to
December 31, 2010
, the Company entered into an agreement with Boeing for 15 B737 aircraft, two B737-800 aircraft and 13 B737-900ER aircraft, with deliveries in late 2012 through 2014. Giving consideration to this agreement, Alaska is committed to purchasing 28 B737 aircraft and has options to purchase an additional 42 B737 aircraft.
Horizon entered into an aircraft purchase agreement in 2007 for 15 Q400 aircraft. As of
December 31, 2010
, Horizon was committed to purchasing eight Q400 aircraft, all of which will be delivered in 2011. Horizon has options to purchase an additional ten Q400 aircraft.
At
December 31, 2010
, the Company had firm aircraft purchase commitments requiring future aggregate payments of approximately $530 million. Giving consideration to the aircraft order in January 2011, the Company has firm commitments for 36 aircraft requiring aggregate payments of $1.2 billion.
The Company expects to pay for the 2011 B737-800 deliveries with cash on hand and expects to debt finance the Q400 aircraft deliveries. The Company expects to pay for firm orders beyond 2011 and the option aircraft, if exercised, through internally generated cash, long-term debt, or operating lease arrangements.
Four defined-benefit and five defined-contribution retirement plans cover various employee groups of Alaska and Horizon. The defined-benefit plans provide benefits based on an employee’s term of service and average compensation for a specified period of time before retirement. The qualified defined-benefit pension plans are closed to new entrants.
Alaska also maintains an unfunded, noncontributory defined-benefit plan for certain elected officers and an unfunded, non-
65
contributory defined-contribution plan for other elected officers.
Accounting standards require recognition of the overfunded or underfunded status of an entity’s defined-benefit pension and other postretirement plan as an asset or liability in the financial statements and requires recognition of the funded status in other comprehensive income.
Qualified Defined-Benefit Pension Plans
The Company’s pension plans are funded as required by the Employee Retirement Income Security Act of 1974 (ERISA).
The defined-benefit plan assets consist primarily of marketable equity and fixed-income securities. The Company uses a December 31 measurement date for these plans.
Weighted average assumptions used to determine benefit obligations as of December 31:
Discount rates of 5.55% and 5.85% were used as of
December 31, 2010
and
2009
, respectively. For
2010
, the rate of compensation increase used varied from 2.99% to 4.35%, depending on the related workgroup. For 2009, the rate of compensation increases was 3.21% to 4.53%.
Weighted average assumptions used to determine net periodic benefit cost for the years ended December 31:
Discount rates of 5.85%, 6.20%, and 6.00% were used for the years ended
December 31, 2010
,
2009
, and
2008
, respectively. For all three years, the expected return on plan assets used was 7.75%, and the rate of compensation increase used varied from 3.21% to 4.53%, depending on the plan and the related workgroup.
In determining the discount rate used, the Company’s policy is to use the rates at the end of the year on high-quality long-term bonds with maturities that closely match the expected timing of future cash distributions from the plan. In determining the expected return on plan assets, the Company assesses the current level of expected returns on risk-free investments (primarily government bonds), the historical level of the risk premium associated with the other asset classes in which the portfolio is invested and the expectations for future returns of each asset class. The expected return for each asset class is then weighted based on the target asset allocation to develop the expected long-term rate of return on assets assumption for the portfolio.
Plan assets are invested in common commingled trust funds invested in equity and fixed income securities. The asset allocation of the funds in the qualified defined-benefit plans, by asset category, is as follows as of the end of
2010
and
2009
:
|
|
2010
|
2009
|
|||
|
Asset category:
|
|
|
|||
|
Money market fund
|
2
|
%
|
10
|
%
|
|
|
Domestic equity securities
|
51
|
%
|
45
|
%
|
|
|
Non-U.S. equity securities
|
18
|
%
|
18
|
%
|
|
|
Fixed income securities
|
29
|
%
|
27
|
%
|
|
|
Plan assets
|
100
|
%
|
100
|
%
|
|
The Company’s investment policy focuses on achieving maximum returns at a reasonable risk for pension assets over a full market cycle. The Company uses a fund manager and invests in various asset classes to diversify risk. Target allocations for the primary asset classes are approximately:
|
Domestic equities:
|
50
|
%
|
|
Non-U.S. equities:
|
20
|
%
|
|
Fixed income:
|
30
|
%
|
Pension assets are rebalanced periodically to maintain these target asset allocations. An individual equity investment will not exceed 10% of the entire equity portfolio. Fixed-income securities carry a minimum “A” rating by Moody’s and/or Standard and Poor’s and the average life of the bond portfolio may not exceed ten years. The Company does not currently intend to invest plan assets in the Company’s common stock.
The Company made a $100 million contribution to the plan in December 2009. The majority of that contribution was invested in a money market account at year-end and was distributed to the other investment categories throughout 2010 in accordance
66
with the target asset allocations. The Company also made a $100 million contribution to the plan in December 2010, the majority of which was distributed immediately to investments in accordance with the target asset allocations.
As of
December 31, 2010
, other than the money market fund, all assets were invested in common commingled trust funds. The Company uses the net asset values of these funds to determine fair value as allowed using the practical expediency method outlined in the accounting standards. The fund categories included in plan assets as of
December 31, 2010
and
2009
, their amounts, and their fair value hierarchy level are as follows (dollars in millions):
|
|
2010
|
2009
|
Level
|
|||||||
|
Fund type:
|
|
|
|
|||||||
|
Money market fund
|
$
|
27.7
|
|
$
|
90.6
|
|
1
|
|
||
|
U.S. equity market fund
|
561.9
|
|
408.0
|
|
2
|
|
||||
|
Non-U.S. equity fund
|
210.0
|
|
164.4
|
|
2
|
|
||||
|
U.S. debt index fund
|
135.0
|
|
147.6
|
|
2
|
|
||||
|
Government/credit bond index fund
|
208.1
|
|
96.3
|
|
2
|
|
||||
|
Plan assets
|
$
|
1,142.7
|
|
$
|
906.9
|
|
|
|
||
Nonqualified Defined-Benefit Pension Plan
Alaska also maintains an unfunded, noncontributory defined-benefit plan for certain elected officers. This plan uses a December 31 measurement date.
Weighted average assumptions used to determine benefit obligations as of December 31:
Discount rates of 5.55% and 5.85% were used as of
December 31, 2010
and
2009
respectively. The rate of compensation increase used was 5.00% as of
December 31, 2010
and
2009
.
Weighted average assumptions used to determine net periodic benefit cost for the years ended December 31:
Discount rates of 5.85%, 6.20%, and 6.00% were used for the years ended
December 31, 2010
,
2009
, and
2008
, respectively. The rate of compensation increase used was 5.00% for all three years presented.
67
Combined Disclosures for Defined-Benefit Pension Plans
The following table sets forth the status of the plans for
2010
and
2009
(in millions):
|
|
Qualified
|
Nonqualified
|
|||||||||||||
|
|
2010
|
2009
|
2010
|
2009
|
|||||||||||
|
Projected benefit obligation (PBO)
|
|
|
|
|
|||||||||||
|
Beginning of year
|
$
|
1,179.8
|
|
$
|
1,094.9
|
|
$
|
37.3
|
|
$
|
36.0
|
|
|||
|
Service cost
|
32.3
|
|
44.2
|
|
0.8
|
|
0.7
|
|
|||||||
|
Interest cost
|
67.7
|
|
66.9
|
|
2.1
|
|
2.2
|
|
|||||||
|
Plan amendments
|
—
|
|
(29.6
|
)
|
—
|
|
—
|
|
|||||||
|
Actuarial loss
|
101.0
|
|
47.3
|
|
4.1
|
|
0.6
|
|
|||||||
|
Transfer to pilot long-term disability plan
|
—
|
|
(3.0
|
)
|
—
|
|
—
|
|
|||||||
|
Benefits paid
|
(37.8
|
)
|
(40.9
|
)
|
(3.2
|
)
|
(2.2
|
)
|
|||||||
|
End of year
|
$
|
1,343.0
|
|
$
|
1,179.8
|
|
$
|
41.1
|
|
$
|
37.3
|
|
|||
|
Plan assets at fair value
|
|
|
|
|
|
|
|
|
|||||||
|
Beginning of year
|
$
|
906.9
|
|
$
|
650.0
|
|
$
|
—
|
|
$
|
—
|
|
|||
|
Actual return on plan assets
|
128.0
|
|
150.0
|
|
—
|
|
—
|
|
|||||||
|
Employer contributions
|
145.6
|
|
147.8
|
|
3.2
|
|
2.2
|
|
|||||||
|
Benefits paid
|
(37.8
|
)
|
(40.9
|
)
|
(3.2
|
)
|
(2.2
|
)
|
|||||||
|
End of year
|
$
|
1,142.7
|
|
$
|
906.9
|
|
$
|
—
|
|
$
|
—
|
|
|||
|
Funded status (unfunded)
|
$
|
(200.3
|
)
|
$
|
(272.9
|
)
|
$
|
(41.1
|
)
|
$
|
(37.3
|
)
|
|||
|
Percent funded
|
85.1
|
%
|
76.9
|
%
|
—
|
|
—
|
|
|||||||
Of the total
$1.3 billion
PBO for the qualified plans, approximately 57% represents the obligation of the plan covering Alaska’s pilots. The accumulated benefit obligation for the combined qualified defined-benefit pension plans was $1,232.1 million and $1,102.5 million at
December 31, 2010
and
2009
, respectively. The accumulated benefit obligation for the nonqualified defined-benefit plan was $40.4 million and $36.9 million at
December 31, 2010
and
2009
, respectively.
The plan amendment and the transfer to the pilot long-term disability plan in 2009 were the result of plan changes in the new pilot collective bargaining agreement ratified during the year. See further discussion under “Pilot Long-term Disability Benefits” below.
As of
December 31, 2010
and
2009
, the amounts recognized in the consolidated balance sheets were as follows (in millions):
|
|
2010
|
2009
|
|||||||||||||
|
|
Qualified
|
Nonqualified
|
Qualified
|
Nonqualified
|
|||||||||||
|
Accrued benefit liability-current
|
$
|
—
|
|
$
|
2.3
|
|
$
|
—
|
|
$
|
2.5
|
|
|||
|
Accrued benefit liability-long term
|
200.3
|
|
38.8
|
|
272.9
|
|
34.8
|
|
|||||||
|
Total liability recognized
|
$
|
200.3
|
|
$
|
41.1
|
|
$
|
272.9
|
|
$
|
37.3
|
|
|||
68
AMOUNTS NOT YET REFLECTED IN NET PERIODIC BENEFIT COST AND INCLUDED IN ACCUMULATED OTHER COMPREHENSIVE INCOME OR LOSS (AOCI):
|
|
2010
|
2009
|
|||||||||||||
|
|
Qualified
|
Nonqualified
|
Qualified
|
Nonqualified
|
|||||||||||
|
Prior service cost (credit)
|
$
|
(16.7
|
)
|
$
|
0.1
|
|
$
|
(17.5
|
)
|
$
|
0.1
|
|
|||
|
Net loss
|
417.0
|
|
8.7
|
|
395.0
|
|
4.8
|
|
|||||||
|
Amount recognized in AOCI (pretax)
|
$
|
400.3
|
|
$
|
8.8
|
|
$
|
377.5
|
|
$
|
4.9
|
|
|||
The expected amortization of prior service credit and net loss from AOCI in 2011 is $1.0 million and $24.3 million, respectively, for the qualified defined-benefit pension plans. For the nonqualified defined-benefit pension plans, the expected combined amortization of prior service cost and net loss from AOCI in 2011 is $0.5 million.
Net pension expense for the defined-benefit plans included the following components for
2010
,
2009
, and
2008
(in millions):
|
|
Qualified
|
Nonqualified
|
|||||||||||||||||||||
|
|
2010
|
2009
|
2008
|
2010
|
2009
|
2008
|
|||||||||||||||||
|
Service cost
|
$
|
32.3
|
|
$
|
44.2
|
|
$
|
46.6
|
|
$
|
0.8
|
|
$
|
0.7
|
|
$
|
0.9
|
|
|||||
|
Interest cost
|
67.7
|
|
66.9
|
|
62.7
|
|
2.1
|
|
2.2
|
|
2.1
|
|
|||||||||||
|
Expected return on assets
|
(70.9
|
)
|
(51.3
|
)
|
(71.8
|
)
|
—
|
|
—
|
|
—
|
|
|||||||||||
|
Amortization of prior service cost
|
(0.9
|
)
|
4.3
|
|
4.4
|
|
0.1
|
|
0.1
|
|
0.1
|
|
|||||||||||
|
Curtailment loss
|
—
|
|
—
|
|
0.5
|
|
—
|
|
—
|
|
—
|
|
|||||||||||
|
Recognized actuarial loss
|
22.0
|
|
28.9
|
|
5.6
|
|
0.1
|
|
0.1
|
|
0.2
|
|
|||||||||||
|
Net pension expense
|
$
|
50.2
|
|
$
|
93.0
|
|
$
|
48.0
|
|
$
|
3.1
|
|
$
|
3.1
|
|
$
|
3.3
|
|
|||||
Historically, the Company’s practice has been to contribute to the qualified defined-benefit pension plans in an amount equal to the greater of 1) the minimum required by law, 2) the Pension Protection Act (PPA) target liability, or 3) the service cost as actuarially calculated. There are no current funding requirements for the Company’s plans in
2011
. However, the Company anticipates that it will continue with its historical funding practice, which would result in funding of approximately $35 million. The Company expects to contribute approximately $2.2 million to the nonqualified defined-benefit pension plans during
2011
.
Future benefits expected to be paid over the next ten years under the defined-benefit pension plans from the assets of those plans as of
December 31, 2010
are as follows (in millions):
|
|
Qualified
|
Nonqualified
|
|||||
|
2011
|
$
|
46.4
|
|
$
|
2.3
|
|
|
|
2012
|
50.7
|
|
2.4
|
|
|||
|
2013
|
59.6
|
|
2.4
|
|
|||
|
2014
|
65.7
|
|
2.6
|
|
|||
|
2015
|
74.7
|
|
2.9
|
|
|||
|
2016– 2020
|
451.5
|
|
17.9
|
|
|||
Postretirement Medical Benefits
The Company allows retirees to continue their medical, dental, and vision benefits by paying all or a portion of the active employee plan premium until eligible for Medicare, currently age 65. This results in a subsidy to retirees, because the premiums received by the Company are less than the actual cost of the retirees’ claims. The accumulated postretirement benefit obligation (APBO) for this subsidy is unfunded. This liability was determined using an assumed discount rate of 5.55% and 5.85% at
December 31, 2010
and
2009
, respectively. The Company does not believe the U.S. Health Care Reform: The Patient Protection and Affordable Care Act and The Health Care and Education Reconciliation Act will have a significant impact.
69
|
(in millions)
|
2010
|
2009
|
|||||
|
Accumulated postretirement benefit obligation
|
|
|
|||||
|
Beginning of year
|
$
|
117.3
|
|
$
|
109.9
|
|
|
|
Service cost
|
5.3
|
|
5.6
|
|
|||
|
Interest cost
|
6.7
|
|
7.8
|
|
|||
|
Plan amendments
|
—
|
|
4.1
|
|
|||
|
Actuarial (gain) loss
|
4.9
|
|
(6.7
|
)
|
|||
|
Transfer to pilot long-term disability plan
|
—
|
|
(0.6
|
)
|
|||
|
Benefits paid
|
(1.7
|
)
|
(2.8
|
)
|
|||
|
End of year
|
$
|
132.5
|
|
$
|
117.3
|
|
|
|
Plan assets at fair value
|
|
|
|
|
|||
|
Beginning of year
|
$
|
—
|
|
$
|
—
|
|
|
|
Employer contributions
|
1.7
|
|
2.8
|
|
|||
|
Benefits paid
|
(1.7
|
)
|
(2.8
|
)
|
|||
|
End of year
|
$
|
—
|
|
$
|
—
|
|
|
|
Funded status (unfunded)
|
$
|
(132.5
|
)
|
$
|
(117.3
|
)
|
|
The plan amendment and the transfer to the pilot long-term disability plan in
2010
were the result of plan changes in the new pilot collective bargaining agreement ratified during the year. See further discussion under "Pilot Long-term Disability Benefits" below.
As of
December 31, 2010
and
2009
, the amounts recognized in the consolidated balance sheets were as follows (in millions):
|
|
2010
|
2009
|
|||||
|
Accrued benefit liability-current
|
$
|
4.9
|
|
$
|
4.2
|
|
|
|
Accrued benefit liability-long term
|
127.6
|
|
113.1
|
|
|||
|
Total liability recognized
|
$
|
132.5
|
|
$
|
117.3
|
|
|
AMOUNTS NOT YET REFLECTED IN NET PERIODIC BENEFIT COST AND INCLUDED IN AOCI:
|
(in millions)
|
2010
|
2009
|
|||||
|
Prior service cost
|
$
|
2.5
|
|
$
|
2.6
|
|
|
|
Net loss
|
20.3
|
|
15.7
|
|
|||
|
Amount recognized in AOCI (pretax)
|
$
|
22.8
|
|
$
|
18.3
|
|
|
The expected combined amortization of prior service cost and net loss from AOCI in 2011 is $1.5 million.
The Company uses a December 31 measurement date to assess obligations associated with the subsidy of retiree medical costs. Net periodic benefit cost for the postretirement medical plans included the following components for
2010
,
2009
and
2008
(in millions):
|
|
2010
|
2009
|
2008
|
||||||||
|
Service cost
|
$
|
5.3
|
|
$
|
5.6
|
|
$
|
4.2
|
|
||
|
Interest cost
|
6.7
|
|
7.8
|
|
5.6
|
|
|||||
|
Amortization of prior service cost
|
—
|
|
2.9
|
|
(0.3
|
)
|
|||||
|
Recognized actuarial loss
|
0.3
|
|
0.8
|
|
0.5
|
|
|||||
|
Net periodic benefit cost
|
$
|
12.3
|
|
$
|
17.1
|
|
$
|
10.0
|
|
||
This is an unfunded plan. The Company expects to contribute approximately $4.9 million to the postretirement medical benefits plan in
2011
, which is equal to the expected benefit payments.
70
Future benefits expected to be paid over the next ten years under the postretirement medical benefits plan as of
December 31, 2010
are as follows (in millions):
|
2011
|
$
|
4.9
|
|
|
2012
|
5.5
|
|
|
|
2013
|
6.2
|
|
|
|
2014
|
7.1
|
|
|
|
2015
|
8.2
|
|
|
|
2016 - 2020
|
56.1
|
|
|
The assumed health care cost trend rates to determine the expected 2011 benefits cost are 8.9%, 8.9%, 5.0% and 4.0% for medical, prescription drugs, dental and vision costs, respectively. The assumed trend rate declines steadily through 2028 where the ultimate assumed trend rates are 4.7% for medical, prescription drugs and dental, and 4.0% for vision.
A 1% higher or lower trend rate in health care costs has the following effect on the Company’s postretirement medical plans during
2010
,
2009
and
2008
(in millions):
|
|
2010
|
2009
|
2008
|
||||||||
|
Change in service and interest cost
|
|
|
|
||||||||
|
1% higher trend rate
|
$
|
1.8
|
|
$
|
2.1
|
|
$
|
1.4
|
|
||
|
1% lower trend rate
|
(1.5
|
)
|
(1.7
|
)
|
(1.2
|
)
|
|||||
|
Change in year-end postretirement benefit obligation
|
|
|
|
|
|
|
|||||
|
1% higher trend rate
|
$
|
16.0
|
|
$
|
14.4
|
|
$
|
13.3
|
|
||
|
1% lower trend rate
|
(13.8
|
)
|
(12.4
|
)
|
(11.5
|
)
|
|||||
Defined-Contribution Plans
The defined-contribution plans are deferred compensation plans under section 401(k) of the Internal Revenue Code. All of these plans require Company contributions. Total expense for the defined-contribution plans was $40.0 million, $28.6 million, and $27.5 million in
2010
,
2009
, and
2008
, respectively. The increase in 2010 is due to pilots that elected to freeze or reduce their service credits in the defined-benefit pension plan receiving a higher Company contribution under the new collective bargaining agreement.
The Company also has a noncontributory, unfunded defined-contribution plan for certain elected officers of the Company who are ineligible for the nonqualified defined-benefit pension plan. Amounts recorded as liabilities under the plan are not material to the consolidated balance sheet at
December 31, 2010
and
2009
.
Pilot Long-term Disability Benefits
The collective bargaining agreement with Alaska’s pilots calls for the removal of long-term disability benefits from the defined-benefit plan for any pilot that was not already receiving long-term disability payments prior to January 1, 2010. As a result of this plan change, the PBO of $32.6 million associated with assumed future disability payments was removed from the overall defined-benefit pension plan liability in 2009, $29.6 million of which was recorded through AOCI. Furthermore, the removal of the plan from the defined-benefit pension plan reduced the accumulated postretirement benefit obligation for medical costs as the new plan no longer considers long-term disability to be “retirement” from the Company.
The new long-term disability plan removes the service requirement that was in place under the former defined-benefit plan. Therefore, the liability is calculated based on estimated future benefit payments associated with pilots that were assumed to be disabled on a long-term basis as of
December 31, 2010
and does not include any assumptions for future disability. The liability includes the discounted expected future benefit payments and medical costs. The total liability at
December 31, 2010
is $5.0 million, which is recorded net of a prefunded trust account of $0.5 million, and is included in long-term other liabilities on the consolidated balance sheets.
Employee Incentive-Pay Plans
Alaska and Horizon have employee incentive plans that pay employees based on certain financial and operational metrics. The aggregate expense under these plans in
2010
,
2009
and
2008
was $92.0 million, $76.0 million, and $21.4 million, respectively.
71
The plans are summarized below:
|
•
|
Performance-Based Pay
(PBP) is a program that rewards virtually all employees. The program is based on four separate metrics related to: (1) Air Group profitability, (2) safety, (3) achievement of unit-cost goals, and (4) employee engagement as measured by customer satisfaction.
|
|
•
|
The
Operational Performance Rewards Program
entitles all Air Group employees to quarterly payouts of up to $300 per person if certain operational and customer service objectives are met.
|
Horizon Restructuring and Fleet Transition
Horizon Restructuring Charges
During the third quarter of 2010, the Company announced its decision to outsource the remaining heavy maintenance functions for Horizon aircraft. As a result of this decision, Horizon eliminated approximately 100 positions in the maintenance division through either early-out packages or voluntary furloughs. These actions resulted in a charge of $2.9 million for separation pay, all of which was paid during the third quarter of 2010.
Horizon Transition to All-Q400 Fleet
Horizon is transitioning to an all-Q400 fleet. As of December 31, 2010, Horizon operated 13 CRJ-700 aircraft, which the Company has agreements in place to remove from its fleet in 2011. During 2010, the Company removed five CRJ-700 aircraft through either a sublease or lease assignment to third parties. The total charge associated with removing these aircraft from operations was $10.3 million in 2010.
The Company has signed a letter of intent to deliver the remaining CRJ-700 aircraft to a third-party carrier through either sublease or lease assignment during 2011. As a result, the Company has accelerated the delivery of eight new Bombardier Q-400 aircraft from 2012 and 2013 into the first half of 2011. Depending on the ultimate disposition of the thirteen remaining CRJ-700 aircraft in the operating fleet, there will likely be further fleet transition charges up to $3 million per aircraft at cease-use date.
During 2009 and 2008, Horizon had either terminated its Q200 leases or subleased Q200 aircraft to a third party. The total charge associated with removing these aircraft from operations in 2009 and 2008 was $8.8 million and $10.2 million, respectively.
Horizon has 16 Q200 aircraft that are subleased to a third-party carrier, for which an accrual for the estimated sublease loss has been recorded. The Company is evaluating alternatives to the existing sublease arrangements for these aircraft. The Company may be required to record a charge if the original lease or sublease arrangements are modified in the future. However, the nature, timing or amount of any such charge cannot be reasonably estimated at this time.
Alaska Restructuring Charges
In 2008, Alaska announced reductions in work force among union and non-union employees and recorded a $12.9 million charge representing the severance payments and estimated medical coverage obligation for the affected employees.
The following table displays the activity and balance of the severance and related cost components of the Company’s restructuring accrual as of and for the years ended
December 31, 2009
and
2008
(in millions):
|
Accrual for Severance and Related Costs
|
2009
|
2008
|
|||||
|
Balance at beginning of year
|
$
|
7.2
|
|
$
|
0.7
|
|
|
|
Restructuring charges and adjustments
|
—
|
|
12.9
|
|
|||
|
Cash payments
|
(7.2
|
)
|
(6.4
|
)
|
|||
|
Balance at end of year
|
$
|
—
|
|
$
|
7.2
|
|
|
Alaska Transition to All-Boeing 737 Fleet
In March 2006, the Company's Board of Directors approved a plan to accelerate the retirement of its MD-80 fleet (15 owned and 11 leased aircraft at the time) and remove those aircraft from service by the end of 2008. As a result, the Company recorded a $47.5 million charge in 2008 reflecting the remaining discounted future lease payments and other contract-related costs associated with the removal of the remaining MD-80 aircraft from operations. All MD-80 lease arrangements have been terminated and the Company no longer has any related obligation.
On May 19, 2009, Alaska announced that its pilots, represented by the Air Line Pilots Association, ratified a new four-year contract. Among other items, the contract has a provision that allows for pilots to receive, at retirement, a cash payment equal to 25% of their accrued sick leave balance multiplied by their hourly rate. The transition expense associated with establishing this sick-leave payout program was $15.5 million. Pilots also received a one-time cash bonus following ratification of the contract of $20.3 million in the aggregate. These items have been combined and reported as “New pilot contract transition costs” in the consolidated statements of operations.
Receivables
Receivables consisted of the following at December 31 (in millions):
|
|
2010
|
2009
|
|||||
|
Airline traffic receivables
|
$
|
53.6
|
|
$
|
55.2
|
|
|
|
Mileage Plan receivables
|
37.9
|
|
31.9
|
|
|||
|
Receivables from fuel-hedging counterparties
|
5.5
|
|
1.1
|
|
|||
|
Other receivables
|
24.0
|
|
25.1
|
|
|||
|
Allowance for doubtful accounts
|
(0.9
|
)
|
(1.5
|
)
|
|||
|
|
$
|
120.1
|
|
$
|
111.8
|
|
|
Prepaid Expenses and Other Current Assets
Prepaid expenses and other current assets consisted of the following at December 31 (in millions):
|
|
2010
|
2009
|
|||||
|
Prepaid aircraft rent
|
$
|
42.5
|
|
$
|
47.9
|
|
|
|
Prepaid fuel
|
12.6
|
|
10.8
|
|
|||
|
Prepaid engine maintenance
|
28.7
|
|
13.3
|
|
|||
|
Other
|
22.9
|
|
26.1
|
|
|||
|
|
$
|
106.7
|
|
$
|
98.1
|
|
|
Other Assets
Other assets consisted of the following at December 31 (in millions):
|
|
2010
|
2009
|
|||||
|
Restricted deposits (primarily restricted investments)
|
$
|
83.6
|
|
$
|
86.7
|
|
|
|
Long-term asset related to Terminal 6 at LAX airport
|
31.3
|
|
—
|
|
|||
|
Deferred costs and other*
|
52.7
|
|
56.5
|
|
|||
|
|
$
|
167.6
|
|
$
|
143.2
|
|
|
*
Deferred costs and other includes deferred financing costs, long-term prepaid rent, lease deposits and other items.
In 2009, the Company announced plans to move from Terminal 3 to Terminal 6 at Los Angeles International Airport (LAX). As part of this move, the Company has agreed to manage and fund up to $175 million of the project during the design and construction phase. The project is estimated to cost approximately $250 million and is expected to be completed in 2012. The Company expects Los Angeles World Airports and the Transportation Security Administration to reimburse the Company for the majority of the construction costs either during the course of, or upon the completion of, construction. The Company is currently working with the City of Los Angeles and Los Angeles World Airports on a funding agreement and expects to have it finalized in the near future. The Company expects that its proprietary share will be approximately $25 million of the total cost of the project. As of December 31, 2010, we capitalized $34 million associated with this project, which represents total project costs to date.
At
December 31, 2010
, the Company’s restricted deposits were primarily restricted investments used to guarantee various letters of credit and workers compensation self-insurance programs. The restricted investments consist of highly liquid securities with original maturities of three months or less. They are carried at cost, which approximates fair value.
Other Accrued Liabilities (current)
Other accrued liabilities consisted of the following at December 31 (in millions):
|
|
2010
|
2009
|
|||||
|
Mileage Plan current liabilities
|
$
|
278.0
|
|
$
|
267.9
|
|
|
|
Pension liability (nonqualified plans)
|
2.3
|
|
2.5
|
|
|||
|
Postretirement medical benefits liability
|
4.9
|
|
4.2
|
|
|||
|
Other*
|
216.0
|
|
199.9
|
|
|||
|
|
$
|
501.2
|
|
$
|
474.5
|
|
|
* Other consists of property and transportation taxes collected but not yet remitted and accruals for ground operations, facilities rent, maintenance, and fuel, among other items.
Other Liabilities (noncurrent)
Other liabilities consisted of the following at December 31 (in millions):
|
|
2010
|
2009
|
|||||
|
Mileage Plan liability
|
$
|
13.8
|
|
$
|
13.2
|
|
|
|
Uncertain tax position liability (see Note 11)
|
1.5
|
|
1.3
|
|
|||
|
Aircraft rent-related
|
36.2
|
|
63.2
|
|
|||
|
Other*
|
71.5
|
|
70.5
|
|
|||
|
|
$
|
123.0
|
|
$
|
148.2
|
|
|
* Other consists of accrued workers' compensation and deferred credits on aircraft purchases, among other items.
Accumulated Other Comprehensive Loss
Accumulated other comprehensive loss consisted of the following at December 31 (in millions, net of tax):
|
|
2010
|
2009
|
|||||
|
Unrealized loss (gain) on marketable securities considered available-for-sale
|
$
|
(8.0
|
)
|
$
|
(8.7
|
)
|
|
|
Related to pension plans
|
255.4
|
|
238.8
|
|
|||
|
Related to postretirement medical benefits
|
14.3
|
|
11.4
|
|
|||
|
Related to interest rate derivatives
|
5.5
|
|
(1.5
|
)
|
|||
|
|
$
|
267.2
|
|
$
|
240.0
|
|
|
The Company has stock awards outstanding under a number of long-term incentive equity plans, one of which (the 2008 Long-Term Incentive Equity Plan) continues to provide for the granting of stock awards to directors, officers and employees of the Company and its subsidiaries. Compensation expense is recorded over the shorter of the vesting period or the period between grant date and the date the employee becomes retirement-eligible as defined in the applicable plan. All stock-based compensation expense is recorded in wages and benefits in the consolidated statements of operations.
Stock Options
Under the various plans, options for 8,429,228 shares have been granted and, at
December 31, 2010
, 796,192 shares were available for future grant of either options or stock awards. Under all plans, the stock options granted have terms of up to ten years. For all plans except the 1997 Long-term Incentive Equity Plan (1997 Plan), when options are exercised, new common shares are issued. When options granted under the 1997 Plan are exercised, shares are issued from the Company’s treasury shares. The total number of outstanding options from the 1997 Plan as of
December 31, 2010
is 8,500. Substantially all
72
grantees are 25% vested after one year, 50% after two years, 75% after three years, and 100% after four years.
The tables below summarize stock option activity for the year ended
December 31, 2010
:
|
|
Shares
|
Weighted-
Average
Exercise
Price
Per Share
|
Weighted-
Average
Contractual
Life (Years)
|
Aggregate
Intrinsic
Value (in
millions)
|
|||||||||
|
Outstanding, December 31, 2009
|
2,318,823
|
|
$
|
29.54
|
|
|
|
||||||
|
Granted
|
129,970
|
|
33.26
|
|
|
|
|||||||
|
Exercised
|
(1,276,469
|
)
|
29.26
|
|
|
|
|||||||
|
Forfeited or expired
|
(25,804
|
)
|
29.85
|
|
|
|
|||||||
|
Outstanding, December 31, 2010
|
1,146,520
|
|
$
|
30.27
|
|
6.4
|
|
$
|
30.3
|
|
|||
|
Exercisable at December 31, 2010
|
507,012
|
|
$
|
32.16
|
|
4.9
|
|
$
|
12.4
|
|
|||
The fair value of each option grant was estimated on the date of grant using the Black-Scholes option-pricing model with the following weighted-average assumptions used for grants in
2010
,
2009
, and
2008
:
|
|
2010
|
2009
|
2008
|
||||||||
|
Expected volatility
|
55
|
%
|
52
|
%
|
42
|
%
|
|||||
|
Expected term
|
6 years
|
|
6 years
|
5.8 years
|
|||||||
|
Risk-free interest rate
|
2.78
|
%
|
2.01
|
%
|
2.96
|
%
|
|||||
|
Expected dividend yield
|
—
|
|
—
|
|
—
|
|
|||||
|
Weighted-average fair value of options granted
|
$
|
18.05
|
|
$
|
14.00
|
|
$
|
11.12
|
|
||
The expected market price volatility of the common stock is based on the historical volatility over a time period commensurate with the expected term of the awards. The risk-free interest rate is based on the U.S. Treasury yield curve in effect for the term nearest the expected term of the option at the time of grant. The dividend yield is zero as the Company does not pay dividends and has no plans to do so in the immediate future. The expected term of the options and the expected forfeiture rates are based on historical experience for various homogenous employee groups.
The Company recorded stock-based compensation expense related to stock options of $4.0 million, $4.3 million, and $5.1 million in
2010
,
2009
, and
2008
, respectively. The total intrinsic value of options exercised during
2010
was $22.8 million. Cash received by the Company from option exercises during 2010 totaled $37.4 million. A total of 263,525 options vested during
2010
with an aggregate fair value of $3.9 million. As of
December 31, 2010
, $2.6 million of compensation cost associated with unvested stock option awards attributable to future service had not yet been recognized. This amount will be recognized as expense over a weighted-average period of 1.8 years.
The following table summarizes stock options outstanding and exercisable at
December 31, 2010
with their weighted-average exercise prices and remaining contractual lives:
|
Range of Exercise prices
|
Remaining Life (years)
|
Shares
|
Price Per Share
|
|||
|
Outstanding:
|
|
|
|
|||
|
$10 to $20
|
6.4
|
61,383
|
|
$
|
19.05
|
|
|
$21 to $28
|
6.6
|
638,234
|
|
27.31
|
|
|
|
$29 to $34
|
6.7
|
248,205
|
|
32.67
|
|
|
|
$35 to $45
|
5.5
|
198,698
|
|
40.24
|
|
|
|
Options outstanding
|
6.4
|
1,146,520
|
|
$
|
30.27
|
|
73
|
Range of Exercise prices
|
Shares
|
Price Per Share
|
|
||
|
Exercisable:
|
|
|
|||
|
$10 to $20
|
19,191
|
|
$
|
18.82
|
|
|
$21 to $28
|
198,104
|
|
27.02
|
|
|
|
$29 to $34
|
121,150
|
|
32.06
|
|
|
|
$35 to $45
|
168,567
|
|
39.78
|
|
|
|
Options exercisable
|
507,012
|
|
$
|
32.16
|
|
Restricted Stock Awards
The Company has restricted stock units (RSUs) outstanding under the 2004 and 2008 Long-term Incentive Equity Plans. As of
December 31, 2010
, 1,301,985 total RSUs have been granted under these plans. The RSUs are non-voting and are not eligible for dividends. The fair value of the RSU awards is based on the closing price of the Company’s common stock on the date of grant. Compensation cost for RSUs is generally recognized over the shorter of three years from the date of grant as the awards “cliff vest” after three years, or the period from the date of grant to the employee’s retirement eligibility. The Company recorded stock-based compensation expense related to RSUs of $6.2 million, $5.8 million, and $6.8 million in
2010
,
2009
, and
2008
, respectively. These amounts are included in wages and benefits in the consolidated statements of operations.
The following table summarizes information about outstanding RSUs:
|
|
Number
of Units
|
Weighted-
Average
Grant
Date Fair
Value
|
||||
|
Non-vested at December 31, 2009
|
602,694
|
|
$
|
26.21
|
|
|
|
Granted
|
176,194
|
|
37.75
|
|
||
|
Vested
|
(84,069
|
)
|
34.73
|
|
||
|
Forfeited
|
(33,195
|
)
|
25.07
|
|
||
|
Non-vested at December 31, 2010
|
661,624
|
|
$
|
28.27
|
|
|
As of
December 31, 2010
, $5.0 million of compensation cost associated with unvested restricted stock awards attributable to future service had not yet been recognized. This amount will be recognized as expense over a weighted-average period of 1.7 years.
Performance Stock Awards
From time to time, the Company issues Performance Share Unit awards (PSUs) to certain executives. PSUs are similar to RSUs, but vesting is based on performance or market conditions.
Currently outstanding PSUs were granted in 2008 and in 2010. There are several tranches of PSUs that vest based on differing performance conditions including achieving a specified pretax margin, a market condition tied to the Company's total shareholder return relative to an airline peer group, and based on certain performance goals established by the Compensation Committee of the Board of Directors. The total grant-date fair value of PSUs issued in 2010 was $3.6 million.
The Company recorded $2.6 million of compensation expense related to PSUs in
2010
. No compensation expense was recorded in
2009
and a $0.4 million credit was recorded in
2008
.
Deferred Stock Awards
In
2010
, the Company awarded 6,753 Deferred Stock Unit awards (DSUs) to members of its Board of Directors as part of their retainers. The underlying common shares are issued upon retirement from the Board, but require no future service period. As a result, the entire intrinsic value of the awards on the date of grant was expensed in
2010
. The total amount of compensation expense recorded in each of
2010
, 2009 and 2008 was $0.3 million.
74
Employee Stock Purchase Plan
The Company sponsors an ESPP, which qualifies under Section 423 of the Internal Revenue Code. Under the terms of the ESPP, employees can purchase Company common stock at 85% of the closing market price on the first day of the offering period or the specified purchase date, whichever is lower. Because of these attributes, the ESPP is considered compensatory under accounting standards and as such, compensation cost is recognized. This plan was discontinued in February 2010 and a new Employee Stock Purchase Plan was approved by the shareholders at the Company's 2010 annual meeting and began in October 2010. Compensation cost for the Company’s ESPP was $0.6 million, $1.5 million and $1.6 million in
2010
,
2009
and
2008
, respectively. The grant date fair value is calculated using the Black-Scholes model in the same manner as the Company’s option awards for 85% of the share award plus the intrinsic value of the 15% discount. Proceeds received from the issuance of shares are credited to stockholders’ equity in the period in which the shares are issued. In
2010
and
2009
, 15,549 shares and 184,488 shares, respectively, were purchased by Company employees under the ESPP, resulting in cash proceeds of $0.1 million and $3.1 million, respectively.
Summary of Stock-Based Compensation
The table below summarizes the components of total stock-based compensation for the years ended
December 31, 2010
,
2009
and
2008
(in millions):
|
2010
|
2009
|
2008
|
|||||||||
|
Stock options
|
$
|
4.0
|
|
$
|
4.3
|
|
$
|
5.1
|
|
||
|
Restricted stock units
|
6.2
|
|
5.8
|
|
6.8
|
|
|||||
|
Performance share units
|
2.6
|
|
—
|
|
(0.4
|
)
|
|||||
|
Deferred stock awards
|
0.3
|
|
0.3
|
|
0.3
|
|
|||||
|
Employee stock purchase plan
|
0.6
|
|
1.5
|
|
1.6
|
|
|||||
|
Total stock-based compensation
|
$
|
13.7
|
|
$
|
11.9
|
|
$
|
13.4
|
|
||
Deferred Income Taxes
Deferred income taxes reflect the impact of temporary differences between the carrying amounts of assets and liabilities for financial reporting purposes and such amounts for tax purposes.
Deferred tax (assets) and liabilities comprise the following at December 31 (in millions):
|
|
2010
|
2009
|
|||||
|
Excess of tax over book depreciation
|
$
|
660.0
|
|
$
|
603.9
|
|
|
|
Fuel hedge contracts
|
8.7
|
|
10.8
|
|
|||
|
Other—net
|
16.9
|
|
11.3
|
|
|||
|
Gross deferred tax liabilities
|
685.6
|
|
626.0
|
|
|||
|
Mileage Plan
|
(237.2
|
)
|
(252.6
|
)
|
|||
|
AMT and other tax credits
|
(57.5
|
)
|
(56.8
|
)
|
|||
|
Inventory obsolescence
|
(16.5
|
)
|
(16.9
|
)
|
|||
|
Deferred gains
|
(15.9
|
)
|
(17.8
|
)
|
|||
|
Employee benefits
|
(179.1
|
)
|
(197.7
|
)
|
|||
|
Loss carryforwards*
|
(4.1
|
)
|
(30.2
|
)
|
|||
|
Other—net
|
(15.9
|
)
|
(23.2
|
)
|
|||
|
Gross deferred tax assets
|
(526.2
|
)
|
(595.2
|
)
|
|||
|
Net deferred tax (assets) liabilities
|
$
|
159.4
|
|
$
|
30.8
|
|
|
|
Current deferred tax asset
|
$
|
(120.5
|
)
|
$
|
(120.3
|
)
|
|
|
Noncurrent deferred tax liability
|
279.9
|
|
151.1
|
|
|||
|
Net deferred tax (asset) liability
|
$
|
159.4
|
|
$
|
30.8
|
|
|
* State loss carryforwards of $79.8 million ($4.1 million tax effected) expire beginning in 2013 and ending in 2030.
75
The Company has concluded that it is more likely than not that its deferred tax assets will be realizable and thus no valuation allowance has been recorded as of
December 31, 2010
. This conclusion is based on the expected future reversals of existing taxable temporary differences, anticipated future taxable income, and the potential for future tax planning strategies to generate taxable income, if needed. The Company will continue to reassess the need for a valuation allowance during each future reporting period.
Components of Income Tax Expense (Benefit)
The components of income tax expense (benefit) were as follows (in millions):
|
|
2010
|
2009
|
2008
|
||||||||
|
Current tax expense (benefit):
|
|
|
|
||||||||
|
Federal
|
$
|
7.4
|
|
$
|
(3.4
|
)
|
$
|
(13.4
|
)
|
||
|
State
|
2.7
|
|
(1.3
|
)
|
—
|
|
|||||
|
Total current
|
10.1
|
|
(4.7
|
)
|
(13.4
|
)
|
|||||
|
Deferred tax expense (benefit):
|
|
|
|
|
|
|
|||||
|
Federal
|
131.5
|
|
76.7
|
|
(56.1
|
)
|
|||||
|
State
|
13.2
|
|
9.3
|
|
(7.8
|
)
|
|||||
|
Total deferred
|
144.7
|
|
86.0
|
|
(63.9
|
)
|
|||||
|
Total tax expense (benefit) related to income (loss)
|
$
|
154.8
|
|
$
|
81.3
|
|
$
|
(77.3
|
)
|
||
Income Tax Rate Reconciliation
Income tax expense (benefit) reconciles to the amount computed by applying the U.S. federal rate of 35% to income (loss) before income tax and accounting change as follows (in millions):
|
|
2010
|
2009
|
2008
|
||||||||
|
Income (loss) before income tax
|
$
|
405.9
|
|
$
|
202.9
|
|
$
|
(213.2
|
)
|
||
|
Expected tax expense (benefit)
|
142.1
|
|
71.0
|
|
(74.6
|
)
|
|||||
|
Nondeductible expenses
|
1.8
|
|
3.1
|
|
3.4
|
|
|||||
|
State income taxes
|
10.7
|
|
5.5
|
|
(5.1
|
)
|
|||||
|
Other—net
|
0.2
|
|
1.7
|
|
(1.0
|
)
|
|||||
|
Actual tax expense (benefit)
|
$
|
154.8
|
|
$
|
81.3
|
|
$
|
(77.3
|
)
|
||
|
Effective tax rate
|
38.1
|
%
|
40.1
|
%
|
36.3
|
%
|
|||||
Uncertain Tax Positions
The Company has identified its federal tax return and its state tax returns in Alaska, Oregon, and California as “major” tax jurisdictions. The periods subject to examination for the Company's federal and Alaska income tax returns are the 2003 to 2009 tax years; however, the 2003 to 2006 tax returns are subject to examination only to a limited extent due to net operating losses carried forward from and carried back to those periods. In Oregon, the income tax years 2002 to 2009 remain open to examination. The 2002 to 2006 Oregon tax returns are subject to examination only to the extent of net operating loss carryforwards from those years that were utilized in 2007 and later years. In California, the income tax years 2002 to 2009 remain open to examination. The 2002 to 2005 tax returns are subject to examination only to the extent of the net operating loss carryforwards from those years that were utilized in 2006 and later years.
At December 31, 2010, the total amount of unrecognized tax benefits of $1.5 million is recorded as a liability, all of which would impact the effective tax rate.
No interest or penalties related to these tax positions were accrued as of
December 31, 2010
.
76
Changes in the liability for unrecognized tax benefits during
2009
and
2010
are as follows (in millions):
|
Balance at December 31, 2008
|
$
|
23.7
|
|
|
Gross decreases—tax positions in prior period
|
(22.5
|
)
|
|
|
Gross increases—current-period tax positions
|
0.1
|
|
|
|
|
|
|
|
|
Balance at December 31, 2009
|
$
|
1.3
|
|
|
Gross increases—current-period tax positions
|
0.2
|
|
|
|
|
|
|
|
|
Balance at December 31, 2010
|
$
|
1.5
|
|
Accounting standards require that a public company report annual and interim financial and descriptive information about its reportable operating segments. Operating segments, as defined, are components of an enterprise about which separate financial information is available that is evaluated regularly by the chief operating decision-maker in deciding how to allocate resources and in assessing performance. Historically, the Company has had two primary operating and reporting segments, consisting of Alaska and Horizon, for which financial information is presented below. These segments are more fully described in Note 1.
|
(in millions)
|
2010
|
2009
|
2008
|
||||||||
|
Operating revenues:
|
|
|
|
||||||||
|
Alaska—mainline (1)
|
$
|
3,094.1
|
|
$
|
2,717.6
|
|
$
|
2,920.5
|
|
||
|
Alaska—purchased capacity (1)
|
332.5
|
|
288.4
|
|
300.8
|
|
|||||
|
Total Alaska
|
$
|
3,426.6
|
|
$
|
3,006.0
|
|
$
|
3,221.3
|
|
||
|
Horizon – brand flying
|
405.6
|
|
392.7
|
|
440.2
|
|
|||||
|
Horizon –capacity purchase arrangement with Alaska
|
274.4
|
|
261.7
|
|
293.7
|
|
|||||
|
Total Horizon
|
$
|
680.0
|
|
$
|
654.4
|
|
$
|
733.9
|
|
||
|
Other (2)
|
1.1
|
|
1.1
|
|
1.1
|
|
|||||
|
Elimination of inter-company revenues
|
(275.4
|
)
|
(261.7
|
)
|
(293.7
|
)
|
|||||
|
Consolidated
|
$
|
3,832.3
|
|
$
|
3,399.8
|
|
$
|
3,662.6
|
|
||
|
Depreciation and amortization expense:
|
|
|
|
|
|
|
|||||
|
Alaska (3)
|
$
|
188.5
|
|
$
|
178.5
|
|
$
|
165.9
|
|
||
|
Horizon
|
41.0
|
|
39.5
|
|
37.5
|
|
|||||
|
Other (2)
|
1.0
|
|
1.2
|
|
1.2
|
|
|||||
|
Consolidated
|
$
|
230.5
|
|
$
|
219.2
|
|
$
|
204.6
|
|
||
|
Interest income:
|
|||||||||||
|
Alaska (3)
|
$
|
34.8
|
|
$
|
38.6
|
|
$
|
51.3
|
|
||
|
Horizon
|
3.6
|
|
2.0
|
|
5.4
|
|
|||||
|
Other (2)
|
0.1
|
|
—
|
|
—
|
|
|||||
|
Elimination of inter-company accounts
|
(9.1
|
)
|
(8.0
|
)
|
(14.3
|
)
|
|||||
|
Consolidated
|
$
|
29.4
|
|
$
|
32.6
|
|
$
|
42.4
|
|
||
|
Interest expense:
|
|
|
|
|
|
|
|||||
|
Alaska (3)
|
$
|
96.5
|
|
$
|
91.7
|
|
$
|
94.8
|
|
||
|
Horizon
|
20.5
|
|
20.1
|
|
23.8
|
|
|||||
|
Other (2)
|
0.4
|
|
0.5
|
|
0.5
|
|
|||||
|
Elimination of inter-company accounts
|
(9.1
|
)
|
(8.0
|
)
|
(14.3
|
)
|
|||||
|
Consolidated
|
$
|
108.3
|
|
$
|
104.3
|
|
$
|
104.8
|
|
||
|
Income (loss) before income tax and accounting change:
|
|
|
|
|
|
|
|||||
|
Alaska—mainline
|
$
|
368.0
|
|
$
|
176.9
|
|
$
|
(140.4
|
)
|
||
|
Alaska—purchased capacity
|
33.6
|
|
6.9
|
|
(12.9
|
)
|
|||||
|
Total Alaska
|
$
|
401.6
|
|
$
|
183.8
|
|
$
|
(153.3
|
)
|
||
|
Horizon
|
7.6
|
|
22.8
|
|
(55.8
|
)
|
|||||
|
Other (2)
|
(3.3
|
)
|
(3.7
|
)
|
(4.1
|
)
|
|||||
|
Consolidated
|
$
|
405.9
|
|
$
|
202.9
|
|
$
|
(213.2
|
)
|
||
|
Capital expenditures (4):
|
|||||||||||
|
Alaska (3)
|
$
|
163.9
|
|
$
|
357.5
|
|
$
|
323.8
|
|
||
|
Horizon
|
19.1
|
|
80.9
|
|
89.0
|
|
|||||
|
Consolidated
|
$
|
183.0
|
|
$
|
438.4
|
|
$
|
412.8
|
|
||
|
Total assets at end of period:
|
|
|
|
|
|
|
|||||
|
Alaska (3)
|
$
|
4,610.2
|
|
$
|
4,541.3
|
|
|||||
|
Horizon
|
747.2
|
|
735.3
|
|
|||||||
|
Other (2)
|
1,375.6
|
|
1,052.4
|
|
|||||||
|
Elimination of inter-company accounts
|
(1,716.4
|
)
|
(1,332.8
|
)
|
|||||||
|
Consolidated
|
$
|
5,016.6
|
|
$
|
4,996.2
|
|
|||||
|
(1)
|
Alaska mainline revenue represents revenue from passengers aboard Alaska jets, freight and mail revenue, and all other revenue. Purchased capacity revenue represents that revenue earned by Alaska on capacity provided by Horizon and a small third party under a capacity purchase arrangement.
|
|
(2)
|
Includes the parent company, Alaska Air Group, Inc., including its investments in Alaska and Horizon, which are eliminated in consolidation.
|
|
(3)
|
There are no interest or depreciation expenses associated with purchased capacity flying at Alaska, nor are there any associated assets or capital expenditures.
|
|
(4)
|
Capital expenditures include aircraft deposits, net of deposits returned.
|
Common Stock Repurchase
In March 2008, the Board of Directors authorized the Company to repurchase up to $50 million of its common stock. Under the plan, the Company repurchased 605,700 shares for approximately $11.7 million. No further repurchases were made under this program. This program expired in March 2009.
In June 2009, the Board of Directors authorized the Company to repurchase up to $50 million of its common stock. Under the program, the Company repurchased 1,970,326 shares of its common stock, of which 645,748 shares were purchased for $26.3 million during 2010. This program expired in June 2010.
In June 2010, the Board of Directors authorized the Company to repurchase up to an additional $50 million of its common stock. Under this program, the Company has repurchased 355,000 shares of its common stock for $18.8 million through December 31, 2010. This program expires in June 2011.
Delisting of Common Shares
In October 2009, the Company retired 7,900,000 common shares that had been held in treasury. This action did not impact the total number of common shares outstanding.
Diluted EPS is calculated by dividing net income (loss) by the average common shares outstanding plus additional common shares that would have been outstanding assuming the exercise of in-the-money stock options and restricted stock units, using the treasury-stock method. In
2010
and
2009
, 0.1 milli
on and 2.1 million stock options, respectively, were excluded from the calculation of diluted EPS because they were antidilutive. As the Company reported a net loss in
2008
, no outstanding stock options or restricted stock units were used in the calculation of diluted weighted average shares as the effect would have been antidilutive.
Grievance with International Association of Machinists
In June 2005, the International Association of Machinists (IAM) filed a grievance under its Collective Bargaining Agreement (CBA) with Alaska alleging that Alaska violated the CBA by, among other things, subcontracting the ramp service operation in Seattle. The dispute was referred to an arbitrator and hearings on the grievance commenced in January 2007, with a final hearing date in August 2007. In July 2008, the arbitrator issued a final decision regarding basic liability in the matter. In that ruling, the arbitrator found that Alaska had violated the CBA and instructed Alaska and the IAM to negotiate a remedy. In February 2010, the arbitrator issued a final decision. The decision does not require Alaska to alter the existing subcontracting arrangements for ramp service in Seattle. The award sustains the right to subcontract other operations in the future so long as the requirements of the CBA are met. The award imposed monetary remedies which were not significant.
Other items
The Company is a party to routine litigation matters incidental to its business and with respect to which no material liability is expected. Management believes the ultimate disposition of the matters discussed above is not likely to materially affect the Company's financial position or results of operations. This forward-looking statement is based on management's current understanding of the relevant law and facts, and it is subject to various contingencies, including the potential costs and risks associated with litigation and the actions of arbitrators, judges and juries.
The Securities and Exchange Commission is conducting an inquiry into trading in the securities of Puget Energy, Inc. ("PSE") by Donald Smith & Co., an investment firm. William Ayer, our Chief Executive Officer serves on the board of PSE. Mr. Ayer and the Company are cooperating voluntarily in that inquiry. Mr. Ayer has stated that he never provided any non-public information about PSE to Donald Smith & Co.
77
|
|
None
|
|
EVALUATION OF DISCLOSURE CONTROLS AND PROCEDURES
As of
December 31, 2010
, an evaluation was performed under the supervision and with the participation of our management, including our chief executive officer and chief financial officer (collectively, our “certifying officers”), of the effectiveness of the design and operation of our disclosure controls and procedures. These disclosure controls and procedures are designed to ensure that the information required to be disclosed by us in our current and periodic reports filed with or submitted to the Securities and Exchange Commission (the SEC) is recorded, processed, summarized and reported within the time periods specified by the SEC’s rules and forms, and that the information is accumulated and communicated to our management, including our certifying officers, on a timely basis. Our certifying officers concluded, based on their evaluation, that disclosure controls and procedures were effective as of
December 31, 2010
.
CHANGES IN INTERNAL CONTROL OVER FINANCIAL REPORTING
There were no changes to the Company's internal control over financial reporting identified in management's evaluation during the year ended
December 31, 2010
, that have materially affected, or are reasonably likely to materially affect, our internal control over financial reporting.
MANAGEMENT’S REPORT ON INTERNAL CONTROL OVER FINANCIAL REPORTING
Our management is responsible for establishing and maintaining adequate internal control over financial reporting, as such term is defined in Exchange Act Rule 13a-15(f). Under the supervision and with the participation of our management, including our principal executive officer and principal financial officer, we conducted an evaluation of the effectiveness of our internal control over financial reporting based on the framework in Internal Control – Integrated Framework issued by the Committee of Sponsoring Organizations of the Treadway Commission (the COSO Framework). Based on our evaluation, our management concluded that our internal control over financial reporting was effective as of
December 31, 2010
.
We intend to regularly review and evaluate the design and effectiveness of our disclosure controls and procedures and internal control over financial reporting on an ongoing basis and to improve these controls and procedures over time and to correct any deficiencies that we may discover in the future. While we believe the present design of our disclosure controls and procedures and internal control over financial reporting are effective, future events affecting our business may cause us to modify our controls and procedures.
The Company's independent registered public accounting firm has issued an attestation report regarding its assessment of the effectiveness of the Company's internal control over financial reporting as of
December 31, 2010
.
78
REPORT OF INDEPENDENT REGISTERED PUBLIC ACCOUNTING FIRM
The Board of Directors and Shareholders
Alaska Air Group, Inc.:
We have audited Alaska Air Group, Inc.'s internal control over financial reporting as of December 31, 2010, based on criteria established in
Internal Control - Integrated Framework
issued by the Committee of Sponsoring Organizations of the Treadway Commission (COSO). Alaska Air Group, Inc.'s management is responsible for maintaining effective internal control over financial reporting and for its assessment of the effectiveness of internal control over financial reporting, included in the accompanying Management's Report on Internal Control over Financial Reporting (included in Item 9A). Our responsibility is to express an opinion on the Company's internal control over financial reporting based on our audit.
We conducted our audit in accordance with the standards of the Public Company Accounting Oversight Board (United States). Those standards require that we plan and perform the audit to obtain reasonable assurance about whether effective internal control over financial reporting was maintained in all material respects. Our audit included obtaining an understanding of internal control over financial reporting, assessing the risk that a material weakness exists, and testing and evaluating the design and operating effectiveness of internal control based on the assessed risk. Our audit also included performing such other procedures as we considered necessary in the circumstances. We believe that our audit provides a reasonable basis for our opinion.
A company's internal control over financial reporting is a process designed to provide reasonable assurance regarding the reliability of financial reporting and the preparation of financial statements for external purposes in accordance with generally accepted accounting principles. A company's internal control over financial reporting includes those policies and procedures that (1) pertain to the maintenance of records that, in reasonable detail, accurately and fairly reflect the transactions and dispositions of the assets of the company; (2) provide reasonable assurance that transactions are recorded as necessary to permit preparation of financial statements in accordance with generally accepted accounting principles, and that receipts and expenditures of the company are being made only in accordance with authorizations of management and directors of the company; and (3) provide reasonable assurance regarding prevention or timely detection of unauthorized acquisition, use, or disposition of the company's assets that could have a material effect on the financial statements.
Because of its inherent limitations, internal control over financial reporting may not prevent or detect misstatements. Also, projections of any evaluation of effectiveness to future periods are subject to the risk that controls may become inadequate because of changes in conditions, or that the degree of compliance with the policies or procedures may deteriorate.
In our opinion, Alaska Air Group, Inc. maintained, in all material respects, effective internal control over financial reporting as of December 31, 2010, based on criteria established in
Internal Control - Integrated Framework
issued by the Committee of Sponsoring Organizations of the Treadway Commission.
We also have audited, in accordance with the standards of the Public Company Accounting Oversight Board (United States), the consolidated balance sheets of Alaska Air Group, Inc. and subsidiaries as of December 31, 2010 and 2009, and the related consolidated statements of operations, shareholders' equity, and cash flows for each of the years in the three-year period ended December 31, 2010, and our report dated February 22, 2011 expressed an unqualified opinion on those consolidated financial statements.
/s/ KPMG LLP
Seattle, Washington
February 22, 2011
79
|
|
None
|
|
See “Executive Officers of the Registrant” under Item 1, “Our Business,” in Part I of this Form 10-K for information on the executive officers of Air Group and its subsidiaries. Except as provided herein, the remainder of the information required by this item is incorporated herein by reference from the definitive Proxy Statement for Air Group's
2011
Annual Meeting of Stockholders to be filed with the Securities and Exchange Commission within 120 days after the end of the fiscal year ended
December 31, 2010
(hereinafter referred to as our “
2011
Proxy Statement”).
|
|
The information required by this item is incorporated herein by reference from our
2011
Proxy Statement.
|
|
The information required by this item is incorporated herein by reference from our
2011
Proxy Statement.
|
|
The information required by this item is incorporated herein by reference from our
2011
Proxy Statement.
|
|
The information required by this item is incorporated herein by reference from our
2011
Proxy Statement.
|
|
The following documents are filed as part of this report:
|
1.
|
Financial Statement Schedules:
Financial Statement Schedule II, Valuation and Qualifying Accounts, for the years ended
December 31, 2010
,
2009
and
2008
.
|
|
2.
|
Exhibits:
See Exhibit Index.
|
80
SIGNATURES
Pursuant to the requirements of Section 13 or 15(d) of the Securities Exchange Act of 1934, the registrant has duly caused this report to be signed on its behalf by the undersigned, thereunto duly authorized.
|
|
|
|
|
|
|
ALASKA AIR GROUP, INC.
|
|
|||
|
|
|
|
||
|
By:
|
/s/ WILLIAM S. AYER
|
|
Date:
|
February 23, 2011
|
|
|
William S. Ayer,
|
|
|
|
|
|
Chairman and Chief Executive Officer
|
|
|
|
Pursuant to the requirements of the Securities Exchange Act of 1934, this report has been signed below by the following persons on
February 23, 2011
on behalf of the registrant and in the capacities indicated.
|
|
|
|
|
|
|
/S/ WILLIAM S. AYER
William S. Ayer
|
Chairman, Chief Executive Officer and Director
(Principal Executive Officer)
|
|
|
|
|
/S/ BRANDON S. PEDERSEN
Brandon S. Pedersen
|
Vice President/Finance and Chief Financial Officer
(Principal Financial and Accounting Officer)
|
|
|
|
|
/S/ PATRICIA M. BEDIENT
Patricia M. Bedient
|
Director
|
|
|
|
|
/S/ MARION C. BLAKEY
Marion C. Blakey
|
Director
|
|
|
|
|
/S/ PHYLLIS J. CAMPBELL
Phyllis J. Campbell
|
Director
|
|
|
|
|
/S/ JESSIE J. KNIGHT, JR
.
Jessie J. Knight, Jr.
|
Director
|
|
|
|
|
/S/ R. MARC LANGLAND
R. Marc Langland
|
Director
|
|
|
|
|
/S/ DENNIS F. MADSEN
Dennis F. Madsen
|
Director
|
|
|
|
|
/S/ BYRON I. MALLOTT
Byron I. Mallott
|
Director
|
|
|
|
|
/S/ J. KENNETH THOMPSON
J. Kenneth Thompson
|
Director
|
|
/S/ BRADLEY D. TILDEN
Bradley D. Tilden
|
Director
|
81
EXHIBIT INDEX
Certain of the following exhibits have heretofore been filed with the Securities and Exchange Commission and are incorporated by reference from the documents described in parentheses. Certain others are filed herewith. The exhibits are numbered in accordance with Item 601 of Regulation S-K.
|
3.1
|
Amended and Restated Certificate of Incorporation of Registrant (Filed as Exhibit 3(i) to Registrants Quarterly Report on Form 10-Q for the period ended June 30, 2006, filed on August 8, 2006 and incorporated herein by reference.)
|
|
|
|
|
3.2
|
Bylaws of Registrant, as amended April 30, 2010 (Filed as Exhibit 3.2 to Registrant’s Current Report on Form 8-K, filed on May 3, 2010 and incorporated herein by reference.)
|
|
|
|
|
10.1#
|
Credit Agreement, dated October 19, 2005, among Alaska Airlines, Inc., as borrower, HSH Nordbank AG New York Branch, as security agent, and other loan participants (Filed as Exhibit 10.2 to Registrant’s Quarterly Report on Form 10-Q for the period ended September 30, 2005, filed on November 9, 2005 and incorporated herein by reference.)
|
|
|
|
|
10.1.1#
|
First Amendment to October 19, 2005 Credit Agreement, dated March 27, 2007 (Filed as Exhibit 10.2.1 to Registrant’s Annual Report on Form 10-K for the year ended December 31, 2007, filed on February 20, 2008 and incorporated herein by reference.)
|
|
|
|
|
10.1.2#
|
Second Amendment to October 19, 2005 Credit Agreement, dated November 26, 2007 (Filed as Exhibit 10.2.2 to Registrant’s Annual Report on Form 10-K for the year ended December 31, 2007, filed on February 20, 2008 and incorporated herein by reference.)
|
|
|
|
|
10.1.3#
|
Third Amendment to October 19, 2005 Credit Agreement, dated May 29, 2009 (Filed as Exhibit 10.1 to Registrant’s Quarterly Report on Form 10-Q for the period ended September 30, 2009, filed on November 6, 2009 and incorporated herein by reference.)
|
|
10.2#
|
Credit Agreement, dated March 31, 2010, among Alaska Airlines, Inc., as borrower, Wells Fargo Capital Finance, LLC as agent, U.S. Bank National Association as documentation agent, and other lenders (Filed as Exhibit 10.1 to Registrant’s Amendment to its Quarterly Report on Form 10-Q for the period ended March 31, 2010, filed on August 11, 2010 and incorporated herein by reference.)
|
|
10.3#
|
Credit Agreement, dated March 31, 2010, among Alaska Airlines, Inc., as borrower, Citibank, N.A., as administrative agent, Bank of America, N.A., as syndication agent, and other lenders (Filed as Exhibit 10.2 to Registrant’s Quarterly Report on Form 10-Q for the period ended March 31, 2010, filed on May 5, 2010 and incorporated herein by reference.)
|
|
10.4#
|
Aircraft General Terms Agreement, dated June 15, 2005, between the Boeing Company and Alaska Airlines, Inc. (Filed as Exhibit 10.1 to Registrant’s Quarterly Report on Form 10-Q for the period ended June 30, 2005, filed on August 5, 2005 and incorporated herein by reference.)
|
|
|
|
|
10.5#
|
Purchase Agreement No. 2497, dated June 15, 2005, between the Boeing Company and Alaska Airlines, Inc. (Filed as Exhibit 10.2 to Registrant’s Quarterly Report on Form 10-Q for the period ended June 30, 2005, filed on August 5, 2005 and incorporated herein by reference.)
|
|
10.6#
|
Supplement to Master Purchase Agreement, dated October 18, 2005, between Horizon Air Industries, Inc. and Bombardier Inc. (Filed as Exhibit 10.1 to Registrant’s Quarterly Report on Form 10-Q for the period ended September 30, 2005, filed on November 9, 2005 and incorporated herein by reference.)
|
|
|
|
|
10.7#
|
Lease Agreement, dated January 22, 1990, between International Lease Finance Corporation and Alaska Airlines, Inc., summaries of 19 substantially identical lease agreements and Letter Agreement #1, dated January 22, 1990 (Filed as Exhibit 10-14 to Registrant’s Annual Report on Form 10-K for the year ended December 31, 1990, filed on April 11, 1991 and incorporated herein by reference.)
|
|
|
|
|
10.8*
|
Alaska Air Group Performance Based Pay Plan (formerly “Management Incentive Plan”), as amended and restated December 2, 2009 (Filed as Exhibit 10.1 to Registrant’s Current Report on Form 8-K, filed on February 1, 2010 and incorporated herein by reference.)
|
|
|
|
|
10.9*
|
Alaska Air Group, Inc. 2008 Performance Incentive Plan (Filed as Exhibit 10.1 to Registrant’s Current Report on Form 8-K, filed on May 22, 2008 and incorporated herein by reference.)
|
|
|
|
|
10.9.1*
|
Alaska Air Group, Inc. 2008 Performance Incentive Plan Form of Nonqualified Stock Option Agreement (Filed as Exhibit 10.2 to Registrant’s Current Report on Form 8-K, filed on May 22, 2008 and incorporated herein by reference.)
|
|
|
|
|
10.9.2*
|
Alaska Air Group, Inc. 2008 Performance Incentive Plan Form of Stock Unit Award Agreement (Filed as Exhibit 10.3 to Registrant’s Current Report on Form 8-K, filed on May 22, 2008 and incorporated herein by reference.)
|
|
|
|
|
10.9.3*
|
Alaska Air Group, Inc. 2008 Performance Incentive Plan Form of Director Deferred Stock Unit Award Agreement (Filed as Exhibit 10.4 to Registrant’s Current Report on Form 8-K, filed on May 22, 2008 and incorporated herein by reference.)
|
|
|
|
|
10.9.4*
|
Alaska Air Group, Inc. 2008 Performance Incentive Plan Nonqualified Stock Option Agreement—Incentive Award (Filed as Exhibit 10.1 to Registrant’s Current Report on Form 8-K, filed on February 2, 2009 and incorporated herein by reference.)
|
|
|
|
82
|
10.9.5*
|
Alaska Air Group, Inc. 2008 Performance Incentive Plan Stock Unit Award Agreement—Incentive Award (Filed as Exhibit 10.2 to Registrant’s Current Report on Form 8-K, filed on February 2, 2009 and incorporated herein by reference.)
|
|
|
|
|
10.9.6*
|
Alaska Air Group, Inc. 2008 Performance Incentive Plan Stock Unit Award Agreement (Filed as Exhibit 10.1 to Registrant’s Current Report on Form 8-K, filed on February 5, 2010 and incorporated herein by reference.)
|
|
|
|
|
10.9.7*
|
Alaska Air Group, Inc. 2008 Performance Incentive Plan Nonqualified Stock Option Agreement (Filed as Exhibit 10.2 to Registrant’s Current Report on Form 8-K, filed on February 5, 2010 and incorporated herein by reference.)
|
|
10.10*
|
Alaska Air Group, Inc. 2004 Long-Term Incentive Plan and original form of stock option and restricted stock unit agreements (Filed as Exhibit 10.2 to Registrant’s Annual Report on Form 10-K for the year ended December 31, 2004, filed on February 25, 2005 and incorporated herein by reference.)
|
|
|
|
|
10.10.1*
|
Alaska Air Group, Inc. 2004 Long-Term Incentive Plan Nonqualified Stock Option Agreement (Filed as Exhibit 10.8.1 to Registrant’s Annual Report on Form 10-K for the year ended December 31, 2007, filed on February 20, 2008 and incorporated herein by reference.)
|
|
|
|
|
10.10.2*
|
Alaska Air Group, Inc. 2004 Long-Term Incentive Plan Stock Unit Award Agreement (Filed as Exhibit 10.8.2 to Registrant’s Annual Report on Form 10-K for the year ended December 31, 2007, filed on February 20, 2008 and incorporated herein by reference.)
|
|
|
|
|
10.10.3*
|
Alaska Air Group, Inc. 2004 Long-Term Incentive Plan Performance Stock Unit Award Agreement (Filed as Exhibit 10.3 to Registrant’s Current Report on Form 8-K, filed on February 14, 2008 and incorporated herein by reference.)
|
|
|
|
|
10.11*
|
Alaska Air Group, Inc. 1999 Long-Term Incentive Equity Plan (Filed as Exhibit 99.1 to Registrant’s Registration Statement on Form S-8, Registration No. 333-87563, filed on September 22, 1999 and incorporated herein by reference.)
|
|
|
|
|
10.12*
|
Alaska Air Group, Inc. 1997 Non Officer Long-Term Incentive Equity Plan (Filed as Exhibit 99.2 to Registrant’s Registration Statement on Form S-8, Registration No. 333-39889, filed on November 10, 1997 and incorporated herein by reference.)
|
|
|
|
|
10.13*
|
Alaska Air Group, Inc. 1996 Long-Term Incentive Equity Plan (Filed as Exhibit 99.1 to Registrant’s Registration Statement on Form S-8, Registration No. 333-09547, filed on August 5, 1996 and incorporated herein by reference.)
|
|
|
|
|
10.14*
|
Alaska Air Group, Inc. Non Employee Director Stock Plan (Filed as Exhibit 99.1 to Registrant’s Registration Statement on Form S-8, Registration No. 333-33727, filed on August 15, 1997 and incorporated herein by reference.)
|
|
|
|
|
10.15*
|
Alaska Airlines, Inc. and Alaska Air Group, Inc. Supplementary Retirement Plan for Elected Officers, as amended November 7, 1994 (Filed as Exhibit 10.15 to Registrant’s Annual Report on Form 10-K for the year ended December 31, 1997, filed on February 10, 1998 and incorporated herein by reference.)
|
|
|
|
|
10.16*
|
Alaska Air Group, Inc. 1995 Elected Officers Supplementary Retirement Plan, as amended by First Amendment to the Alaska Air Group, Inc. 1995 Elected Officers Supplementary Retirement Plan and Second Amendment to the Alaska Air Group, Inc. 1995 Elected Officers Supplementary Retirement Plan (Filed as Exhibit 10.13 to Amendment No. 1 to Registrant’s Registration Statement on Form S-1, Registration No. 333-107177, filed on September 23, 2003 and incorporated herein by reference.)
|
|
|
|
|
10.17*
|
Form of Alaska Air Group, Inc. Change of Control Agreement for named executive officers, as amended and restated November 28, 2007 (Filed as Exhibit 10.16 to Registrant’s Annual Report on Form 10-K for the year ended December 31, 2007, filed on February 20, 2008 and incorporated herein by reference.)
|
|
|
|
|
10.18*
|
Alaska Air Group, Inc. Nonqualified Deferred Compensation Plan, as amended and restated on December 1, 2005 (Filed as Exhibit 10.17 to Registrant’s Annual Report on Form 10-K for the year ended December 31, 2007, filed on February 20, 2008 and incorporated herein by reference.)
|
|
|
|
|
10.19*
|
Agreement between Jeff Pinneo and Horizon Air Industries, Inc. dated June 9, 2010 (Filed as Exhibit 10.1 to Registrant’s Current Report on Form 8-K, filed on June 14, 2010 and incorporated herein by reference.)
|
|
|
|
|
10.2
|
Agreement dated as of July 30, 2010, between Alaska Air Group, Inc. and Glenn Johnson (filed as Exhibit 10.1 to Registrant's Quarterly Report on Form 10-Q for the quarter ended June 30, 2010 filed on August 5, 2010 and incorporated herein by reference.
|
|
12.1†
|
Statement of Computation of Ratio of Earnings to Fixed Charges
|
|
|
|
|
21†
|
Subsidiaries of Registrant
|
|
|
|
|
23.1†
|
Consent of Independent Registered Public Accounting Firm (KPMG LLP)
|
83
|
31.1†
|
Certification of Chief Executive Officer Pursuant to Section 302 of the Sarbanes-Oxley Act of 2002
|
|
|
|
|
31.2†
|
Certification of Chief Financial Officer Pursuant to Section 302 of the Sarbanes-Oxley Act of 2002
|
|
|
|
|
32.1†
|
Certification of Chief Executive Officer Pursuant to 18 U.S.C. Section 1350, as adopted pursuant to Section 906 of the Sarbanes-Oxley Act of 2002
|
|
|
|
|
32.2†
|
Certification of Chief Financial Officer Pursuant to 18 U.S.C. Section 1350, as adopted pursuant to Section 906 of the Sarbanes-Oxley Act of 2002
|
|
†
|
Filed herewith.
|
|
*
|
Indicates management contract or compensatory plan or arrangement.
|
|
#
|
Pursuant to 17 CFR 240.24b-2, confidential information has been omitted and filed separately with the Securities and Exchange Commission pursuant to a Confidential Treatment Application filed with the Commission.
|
84
Schedule II
ALASKA AIR GROUP, INC.
VALUATION AND QUALIFYING ACCOUNTS
|
(in millions)
|
Beginning
Balance
|
Additions
Charged
to Expense
|
Deductions
|
Ending
Balance
|
|||||||||||
|
Year Ended December 31, 2008
|
|
|
|
|
|||||||||||
|
Reserve deducted from asset to which it applies:
|
|
|
|
|
|||||||||||
|
Allowance for doubtful accounts
|
$
|
1.6
|
|
$
|
1.5
|
|
$
|
(1.6
|
)
|
$
|
1.5
|
|
|||
|
Obsolescence allowance for flight equipment spare parts (a)
|
$
|
24.6
|
|
$
|
5.8
|
|
$
|
(9.0
|
)
|
$
|
21.4
|
|
|||
|
Year Ended December 31, 2009
|
|
|
|
|
|
|
|
|
|||||||
|
Reserve deducted from asset to which it applies:
|
|
|
|
|
|
|
|
|
|||||||
|
Allowance for doubtful accounts
|
$
|
1.5
|
|
$
|
1.4
|
|
$
|
(1.4
|
)
|
$
|
1.5
|
|
|||
|
Obsolescence allowance for flight equipment spare parts
|
$
|
21.4
|
|
$
|
4.8
|
|
$
|
(0.2
|
)
|
$
|
26.0
|
|
|||
|
Year Ended December 31, 2010
|
|
|
|
|
|
|
|
|
|||||||
|
Reserve deducted from asset to which it applies:
|
|
|
|
|
|
|
|
|
|||||||
|
Allowance for doubtful accounts
|
$
|
1.5
|
|
$
|
0.9
|
|
$
|
(1.5
|
)
|
$
|
0.9
|
|
|||
|
Obsolescence allowance for flight equipment spare parts
|
$
|
26.0
|
|
$
|
4.8
|
|
$
|
(1.3
|
)
|
$
|
29.5
|
|
|||
|
(a)
|
Deductions in 2008 are primarily related to the write off of the MD-80 and B737-200 parts allowances against their respective costs bases.
|
85
TABLE OF CONTENTS
Part IItem 1. Our BusinessItem 1A. Risk FactorsItem 1B. Unresolved Staff CommentsItem 2. PropertiesItem 3. Legal ProceedingsItem 4. Removed and ReservedPart IIItem 5. Market For The Registrant S Common Equity, Related Stockholder Matters, and Issuer Purchases Of Equity SecuritiesItem 6. Selected Consolidated Financial and Operating DataItem 6. Selected Consolidated Financial and Operating Data - (continued)Item 6. Selected Consolidated Financial and Operating Data -Item 7. Management S Discussion and Analysis Of Financial Condition and Results Of OperationsItem 7A. Quantitative and Qualitative Disclosure About Market RiskItem 8. Consolidated Financial Statements and Supplementary DataNote 1. General and Summary Of Significant Accounting PoliciesNote 2. Fair Value Of Financial InstrumentsNote 3. Derivative InstrumentsNote 4. Long-term DebtNote 5. CommitmentsNote 6. Employee Benefit PlansNote 7. Restructuring and Fleet TransitionNote 8. New Pilot Contract Transition CostsNote 9. Detail Of Other Financial Statement CaptionsNote 10. Stock-based Compensation PlansNote 11. Income TaxesNote 12. Operating Segment InformationNote 13. Shareholder S EquityNote 14. Earnings (loss) Per Share (eps)Note 15. ContingenciesItem 9. Changes in and Disagreements with Accountants on Accounting and Financial DisclosureItem 9A. Controls and ProceduresItem 9B. Other InformationPart IIIItem 10. Directors, Executive Officers and Corporate GovernanceItem 11. Executive CompensationItem 12. Security Ownership Of Certain Beneficial Owners and Management, and Related Stockholder MattersItem 13. Certain Relationships and Related Transactions, and Director IndependenceItem 14. Principal Accountant Fees and ServicesPart IVItem 15. Exhibits, Consolidated Financial Statement Schedules