ALASKA AIR GROUP, INC.
10-Ks and 10-Qs
|
|
|
|
|
|
|
|
|
|
|
|
|
|
|
|
|
|
|
|
|
|
|
|
|
|
|
|
|
|
|
|
|
|
|
|
|
|
|
|
|
|
|
|
|
|
|
|
|
|
|
|
|
UNITED STATES
SECURITIES AND EXCHANGE COMMISSION
WASHINGTON, DC 20549
FORM 10-K
|
T
|
ANNUAL REPORT PURSUANT TO SECTION 13 OR 15(d) OF THE SECURITIES EXCHANGE ACT OF 1934
|
For the fiscal year ended
December 31, 2014
OR
|
£
|
TRANSITION REPORT PURSUANT TO SECTION 13 OR 15(d) OF THE SECURITIES EXCHANGE ACT OF 1934
|
For the transition period from to
Commission File Number 1-8957
ALASKA AIR GROUP, INC.
|
Delaware
|
91-1292054
|
|
|
(State of Incorporation)
|
(I.R.S. Employer Identification No.)
|
|
|
19300 International Boulevard, Seattle, Washington 98188
|
|
Telephone: (206) 392-5040
|
Securities registered pursuant to Section 12(b) of the Act:
|
Common Stock, $0.01 Par Value
|
New York Stock Exchange
|
Securities registered pursuant to Section 12(g) of the Act:
None
Indicate by check mark if the registrant is a well-known seasoned issuer, as defined in Rule 405 of the Securities Act. Yes
T
No
£
Indicate by check mark if the registrant is not required to file reports pursuant to Section 13 or Section 15(d) of the Act. Yes
£
No
T
Indicate by check mark whether the registrant (1) has filed all reports required to be filed by Section 13 or 15(d) of the Securities Exchange Act of 1934 during the preceding 12 months (or for such shorter period that the registrant was required to file such reports), and (2) has been subject to such filing requirements for the past 90 days. Yes
T
No
£
Indicate by check mark whether the registrant has submitted electronically and posted on its corporate Web site, if any, every Interactive Data File required to be submitted and posted pursuant to Rule 405 of Regulation S-T (§232.405 of this chapter) during the preceding 12 months (or for such shorter period that the registrant was required to submit and post such files). Yes
T
No
£
Indicate by check mark if disclosure of delinquent filers pursuant to Item 405 of Regulation S-K is not contained herein, and will not be contained, to the best of registrant’s knowledge, in definitive proxy or information statements incorporated by reference in Part III of this Form 10-K or any amendment to this Form 10-K.
T
Indicate by check mark whether the registrant is a large accelerated filer, an accelerated filer, a non-accelerated filer or a smaller reporting company. See definitions of “large accelerated filer”, "accelerated filer" and "smaller reporting company" in Rule 12b-2 of the Exchange Act:
Large accelerated filer
T
Accelerated filer
£
Non-accelerated filer
£
Smaller reporting company
£
Indicate by check mark whether the registrant is a shell company (as defined in Rule 12b-2 of the Exchange Act.): Yes
£
No
T
As of
January 31, 2015
, shares of common stock outstanding totaled
131,284,654
. The aggregate market value of the shares of common stock of Alaska Air Group, Inc. held by nonaffiliates on
June 30, 2014
, was approximately
$6.4 billion
(based on the closing price of
$47.29
per share on the New York Stock Exchange on that date).
DOCUMENTS INCORPORATED BY REFERENCE
Portions of Definitive Proxy Statement relating to
2015
Annual Meeting of Shareholders are incorporated by reference in Part III.
ALASKA AIR GROUP, INC.
ANNUAL REPORT ON FORM 10-K FOR THE YEAR ENDED
DECEMBER 31, 2014
TABLE OF CONTENTS
As used in this Form 10-K, the terms “Air Group,” the "Company," “our,” “we” and "us," refer to Alaska Air Group, Inc. and its subsidiaries, unless the context indicates otherwise. Alaska Airlines, Inc. and Horizon Air Industries, Inc. are referred to as “Alaska” and “Horizon,” respectively, and together as our “airlines.”
2
CAUTIONARY NOTE REGARDING FORWARD-LOOKING STATEMENTS
In addition to historical information, this Form 10-K contains forward-looking statements within the meaning of Section 27A of the Securities Act of 1933, as amended, Section 21E of the Securities Exchange Act of 1934, as amended, and the Private Securities Litigation Reform Act of 1995. Forward-looking statements are those that predict or describe future events or trends and that do not relate solely to historical matters. You can generally identify forward-looking statements as statements containing the words “believe,” “expect,” “will,” “anticipate,” “intend,” “estimate,” “project,” “assume” or other similar expressions, although not all forward-looking statements contain these identifying words. Forward-looking statements involve risks and uncertainties that could cause actual results to differ materially from historical experience or the Company’s present expectations.
You should not place undue reliance on our forward-looking statements because the matters they describe are subject to known and unknown risks, uncertainties and other unpredictable factors, many of which are beyond our control.
Our forward-looking statements are based on the information currently available to us and speak only as of the date on which this report was filed with the SEC. We expressly disclaim any obligation to issue any updates or revisions to our forward-looking statements, even if subsequent events cause our expectations to change regarding the matters discussed in those statements. Over time, our actual results, performance or achievements will likely differ from the anticipated results, performance or achievements that are expressed or implied by our forward-looking statements, and such differences might be significant and materially adverse to our shareholders. For a discussion of these and other risk factors in this Form 10-K, see “Item 1A: Risk Factors.” Please consider our forward-looking statements in light of those risks as you read this report.
3
|
|
Alaska Air Group ("Air Group") operates Alaska Airlines ("Alaska") and Horizon Air ("Horizon"), which together with its partner regional airlines serve more than 100 cities through an expansive network in Alaska, the Lower 48, Hawaii, Canada and Mexico. During
2014
, we carried
29 million
passengers while earning record full-year adjusted earnings of
$571 million
.
Our objective is to be one of the most respected U.S. airlines by our customers, employees, and shareholders. We believe our success depends on our ability to provide safe air transportation, develop relationships with customers by providing exceptional customer service and low fares, and maintain a competitive cost structure to compete effectively. It is important to us that we achieve our objective as a socially responsible company that values not just our performance, but also our people, our community, and our environment.
While aircraft and technology enable us to provide air transportation, we recognize this is fundamentally a people business. Our employees maintain and strengthen our relationships with our customers, and our success depends on our employees working together to successfully execute on our strategy. In
2014
, Alaska Airlines ranked "Highest in Customer Satisfaction among Traditional Network Carriers" by J.D. Power for the seventh year in a row. Alaska Airlines also held the No. 1 spot in the Wall Street Journal's "Middle Seat" scorecard for U.S. airlines for two years in a row. We have been the leader in the industry for on-time performance among major airlines for the past five years. For achieving safety, customer service, operational and financial goals, we rewarded our employees with a record
$116 million
in incentive pay.
In support of the communities that we serve, we strive to be an industry leader in environmental and community stewardship. In
2014
, Air Group improved fuel efficiency by
2.1%
from the prior year. Air Group donated $9.5 million to approximately 1,200 charitable organizations and our employees volunteered more than 21,000 hours of community service. We pledged $1.5 million in grants to support job training for workers at Seattle-Tacoma airport, voluntarily increased wages to $12 per hour for certain vendors in Seattle, sponsored $2.5 million for Seattle's bike-share program, and pledged $2.5 million to Seattle's Museum of Flight to guide students toward a future in science, technology, engineering, and math. For all of the efforts that we have made in our communities, Seattle Business Magazine awarded Alaska Air Group with the 2014 Community Impact Award.
We earned record financial results in 2014, marking our
eleventh
consecutive annual profit on an adjusted basis. We achieved an after-tax return on invested capital of
18.6%
, more than double our weighted average cost of capital. Strong earnings improved our cash flow and strengthened our balance sheet resulting in a debt-to-capital ratio of
31%
, which compares favorably with other high-quality industrial transport companies. Due to our strong financial health, we are now one of only two U.S. airlines with investment grade credit ratings. With the cash generated by the continued success we have had in the past decade, we were able to invest in our business for profitable growth and to enhance the customer experience. All of our 737-800/900/900ER aircraft now feature innovative Recaro seats with power at every seat, and in December 2014, we debuted our Wi-Fi enabled in-flight entertainment system and our branded in-flight experience, Alaska Beyond™. In addition, we have invested in our core market, Seattle, by adding six new non-stop destinations and increasing capacity by 4% in 2014. For 2015, we are committed to increasing capacity in Seattle by 10%.
As we look to the future, we will build on the success of the past few years by executing our strategic plan — the Five Focus Areas:
Safety and Compliance
We have an unwavering commitment to run a safe and compliant operation, and we will not compromise this commitment in the pursuit of other initiatives. Alaska and Horizon, in coordination with the FAA, are implementing a Safety Management System (SMS) to better identify and manage risk. Both airlines are in the final phase of SMS implementation and are on track for completion and final FAA-certification in 2015. During the current year, 100% of our Alaska and Horizon aircraft technicians completed the requirements for the FAA's "Diamond Certificate of Excellence" award. This is the 13th consecutive year Alaska Airlines has received the award and the 13th time in the last 15 years for Horizon. In 2014, we launched Ready, Safe, Go - a safety campaign designed to increase safety awareness across the Air Group System.
People Focus
Our success depends on our employees. Higher employee engagement drives higher productivity, superior execution, and better customer service, which is why we listen to our employees for feedback in shaping our strategy. In 2014, our employee
4
engagement was at 82% in our annual employee survey, up from 79% in the prior year. To help develop and train our people on core leadership principles and promote engagement across our airlines, all of Air Group's leaders participated in a multi-day workshop called "Gear Up". We plan to sponsor "Gear Up 2" in 2015 to further increase employee engagement.
We understand that aligning our employees' goals with the company's goals is important in achieving success. All employees participate in our Performance-Based Pay (PBP) and Operational Performance Rewards (OPR) programs, which encourage employees to work together to achieve metrics related to safety, profitability, on-time performance, low costs and customer satisfaction. Over the last five years, our incentive programs have paid out on average, 8.7% of annual pay, or more than one month's pay, for most employees. This is consistent with one of our guiding principles that we want to pay our people well with a goal of reaching the industry’s best productivity over time. To that end, we signed four long-term agreements with various labor groups during the year, which provide the company, employees, and investors with long-term stability.
Hassle-Free Customer Experience
We want to be the easiest airline to fly. In each step of the customer's journey, from booking a ticket to check-in, from flying in our aircraft to claiming baggage at the final destination, we want to provide a hassle-free experience for our customers. Our industry-leading on-time performance for the past five years make us reliable to our customers, and we are the only airline that guarantees checked baggage delivery to the carousel within 20 minutes. Customers can tag their own bags at airport kiosks, or in some cases at their homes, and we now have fingerprint scan entry to our airport lounges (Boardrooms). We lead the travel industry in mobile innovation with iPhone, Android, and Microsoft apps that allow passengers to purchase tickets, check-in, upgrade seats, and reserve food for the flight - all with helpful notifications that inform customers when there are changes to their flights. The Transportation Security Administration (TSA) Pre-Check Program is available in 28 of our locations, which allows eligible customers to opt-in for reduced screening requirements. We also introduced the Alaska Listens survey with five simple questions designed to get timely feedback from our customers - and we guarantee a response within 72 hours if there is an issue that needs to be resolved. As passengers take more control of their travel experience, we are able to reduce the time it takes a customer to move from the airport curb to the aircraft.
Energetic and Compelling Brand
We want to be recognized as the preferred airline to fly. With our message, "Calling All Explorers," we want our customers to choose us whether they are exploring new destinations or traveling to familiar cities, because flying on Alaska is an adventure in itself. Our Alaska Beyond™ flight experience, launched in 2014, features Beyond Entertainment™, Beyond Delicious™, Beyond Comfort™, and Beyond Service™, which together create a unique Alaska experience that is designed to go above and beyond customer expectations. Customers can now stream in-flight entertainment to their personal devices, enjoy gourmet Tom Douglas signature entrées, rest comfortably in our Recaro seats with power, enhanced space, and six-way adjustable headrests, and fly with our flight crews that provide J.D. Power award-winning customer service. We will refresh the visuals at our gates to communicate a consistent message to our customers and will roll out more airport and in-flight enhancements in 2015.
Due to the increased competition in 2014, we focused our marketing efforts to defend our Seattle market. We launched our TV advertising campaign in partnership with Russell Wilson, the quarterback for the Seattle Seahawks and Alaska Airline's Chief Football Officer. The Alaska Air blog was introduced in 2014 to better connect with our customers and provide Alaska news stories in an informal and authentic way. We remain focused on strengthening our relationship with our customers in all of our markets through our energetic brand message and exceptional in-flight experience. We are currently planning to refresh all of our airport stations at over 100 destinations with our new brand image in 2015.
Low Fares, Low Costs and Network Growth
We believe that in order to provide low fares for customers in a growing network of destinations, while returning value to our shareholders, we must maintain a competitive cost structure. In
2014
, we lowered our unit costs, excluding fuel, by
1.3%
on a consolidated basis, representing the fifth consecutive year of annual reduction. We achieved this through a continued focus on productivity, cost management, and network growth. We increased employee productivity by
2.0%
in 2014 and will continue to focus on that metric as we leverage growth. We also manage fuel costs by flying larger, more fuel-efficient aircraft, which have increased our fuel efficiency as measured by available seat miles flown per gallon by
4.5%
over the last five years. Additionally, we have added split-scimitar winglets to 48 aircraft, which are expected to increase fuel efficiency by 1.5% per aircraft. Looking forward, we have committed to purchasing
42
737-900ER and
37
737-MAX aircraft with deliveries from
2015
to
2022
, and
three
Q400 aircraft with deliveries from
2015
to
2017
. In addition, we will increase regional capacity by having SkyWest operate seven E-175s with deliveries from 2015 to 2016. The capacity increase with the new B737s, Q400s, and E175s position us for growth and ensure that we will continue to operate the most fuel-efficient aircraft available for the foreseeable future.
5
In
2014
, we added 16 new markets to our network and exited five as we continued to better match supply with demand. We strengthened our Seattle network in 2014 by offering non-stop flights to markets like Albuquerque, Baltimore, Cancun, Detroit, New Orleans, and Tampa, and began 7 non-stop routes out of Salt Lake City. New routes in 2015 will include Seattle to Milwaukee, Oklahoma City, and Washington D.C. (Dulles), from Las Vegas to Mammoth Lakes, from San Diego to Kona, and from Portland to St. Louis.
AIR GROUP
Alaska Air Group is a Delaware corporation incorporated in 1985 and the holding company of Alaska Airlines and Horizon Air. Although Alaska and Horizon both operate as airlines, their business plans, competition, and economic risks differ substantially. Alaska Airlines is an Alaska corporation that was organized in 1932 and incorporated in 1937. Horizon Air Industries is a Washington corporation that first began service and was incorporated in 1981. Horizon was acquired by Air Group in 1986. Alaska operates a fleet of passenger jets (mainline) and contracts with Horizon, SkyWest Airlines, Inc. (SkyWest) and Peninsula Airways, Inc. (PenAir) for regional capacity such that Alaska receives all passenger revenue from those flights. Horizon operates a fleet of turboprop aircraft and sells all of its capacity to Alaska pursuant to a capacity purchase arrangement. The majority of our revenues are generated by transporting passengers, but in recent years we have focused on growing our ancillary revenues. The percentage of revenues by category is as follows:
|
|
2014
|
2013
|
2012
|
2011
|
2010
|
|||||||||
|
Mainline passenger revenue
|
70
|
%
|
70
|
%
|
71
|
%
|
69
|
%
|
68
|
%
|
||||
|
Regional passenger revenue
|
15
|
%
|
16
|
%
|
16
|
%
|
17
|
%
|
17
|
%
|
||||
|
Other revenue
|
13
|
%
|
12
|
%
|
11
|
%
|
12
|
%
|
12
|
%
|
||||
|
Freight and Mail revenue
|
2
|
%
|
2
|
%
|
2
|
%
|
2
|
%
|
3
|
%
|
||||
|
Total
|
100
|
%
|
100
|
%
|
100
|
%
|
100
|
%
|
|
100
|
%
|
|||
We attempt to deploy aircraft into the network in ways that best optimize our revenues and profitability, and reduce our seasonality.
The percentage of our capacity by region is as follows:
|
|
2014
|
2013
|
2012
|
2011
|
2010
|
|||||||||
|
West Coast
|
36
|
%
|
34
|
%
|
35
|
%
|
37
|
%
|
41
|
%
|
||||
|
Transcon/midcon
|
22
|
%
|
22
|
%
|
19
|
%
|
19
|
%
|
19
|
%
|
||||
|
Hawaii
|
18
|
%
|
19
|
%
|
20
|
%
|
16
|
%
|
11
|
%
|
||||
|
Alaska
|
15
|
%
|
16
|
%
|
17
|
%
|
18
|
%
|
19
|
%
|
||||
|
Mexico
|
6
|
%
|
7
|
%
|
7
|
%
|
9
|
%
|
8
|
%
|
||||
|
Canada
|
3
|
%
|
2
|
%
|
2
|
%
|
1
|
%
|
2
|
%
|
||||
|
Total
|
100
|
%
|
100
|
%
|
100
|
%
|
100
|
%
|
100
|
%
|
||||
MAINLINE
We offer extensive north/south service within the western U.S., Canada and Mexico, and passenger and dedicated cargo services to and within the state of Alaska. We also provide long-haul east/west service to Hawaii and 24 cities in the mid-continental and eastern U.S., primarily from Seattle, where we have our largest concentration of departures; although we do offer long-haul departures from other cities as well.
In
2014
, we carried
21 million
revenue passengers in our mainline operations. At
December 31, 2014
, Alaska’s operating fleet consisted of
137
Boeing 737 jet aircraft, compared to
131
B737 aircraft as of
December 31, 2013
.
6
The percentage of mainline passenger capacity by region and average stage length is presented below:
|
|
2014
|
2013
|
2012
|
2011
|
2010
|
|||||||||
|
West Coast
|
31
|
%
|
28
|
%
|
29
|
%
|
31
|
%
|
33
|
%
|
||||
|
Transcon/midcon
|
25
|
%
|
25
|
%
|
22
|
%
|
21
|
%
|
24
|
%
|
||||
|
Hawaii
|
20
|
%
|
21
|
%
|
22
|
%
|
18
|
%
|
13
|
%
|
||||
|
Alaska
|
16
|
%
|
18
|
%
|
18
|
%
|
20
|
%
|
21
|
%
|
||||
|
Mexico
|
7
|
%
|
7
|
%
|
8
|
%
|
8
|
%
|
7
|
%
|
||||
|
Canada
|
1
|
%
|
1
|
%
|
1
|
%
|
2
|
%
|
2
|
%
|
||||
|
Total
|
100
|
%
|
100
|
%
|
100
|
%
|
100
|
%
|
100
|
%
|
||||
|
Average Stage Length
|
1,182
|
|
|
1,177
|
|
1,161
|
|
1,114
|
|
1,085
|
|
|||
REGIONAL
Our regional operations consist of flights operated by Horizon, SkyWest and PenAir. In
2014
, our regional operations carried approximately
8.3 million
revenue passengers, primarily in the states of Washington, Oregon, Idaho and California. Horizon is the largest regional airline in the Pacific Northwest and carries about 90% of Air Group's regional revenue passengers. In 2014, we increased regional jet flying provided by SkyWest and amended our capacity purchase agreement to start flying Embraer E-175s, which will support new markets such as Seattle-Milwaukee, Seattle-Oklahoma City, and Portland-St. Louis in 2015.
Based on
2014
passenger enplanements on regional aircraft, our leading airports are Seattle and Portland. At
December 31, 2014
, Horizon’s operating fleet consisted of
51
Bombardier Q400 turboprop aircraft. Horizon flights are listed under Alaska's designator code in airline reservation systems, and in customer-facing locations.
The percentage of regional passenger capacity by region and average stage length is presented below:
|
|
2014
|
2013
|
2012
|
2011
|
2010
|
|||||||||
|
West Coast
|
66
|
%
|
66
|
%
|
68
|
%
|
68
|
%
|
71
|
%
|
||||
|
Pacific Northwest
|
19
|
%
|
21
|
%
|
20
|
%
|
19
|
%
|
17
|
%
|
||||
|
Canada
|
8
|
%
|
9
|
%
|
9
|
%
|
9
|
%
|
9
|
%
|
||||
|
Alaska
|
4
|
%
|
2
|
%
|
2
|
%
|
2
|
%
|
2
|
%
|
||||
|
Midcon
|
2
|
%
|
1
|
%
|
—
|
%
|
—
|
%
|
—
|
%
|
||||
|
Mexico
|
1
|
%
|
1
|
%
|
1
|
%
|
2
|
%
|
1
|
%
|
||||
|
Total
|
100
|
%
|
100
|
%
|
100
|
%
|
100
|
%
|
100
|
%
|
||||
|
Average Stage Length
|
339
|
|
329
|
|
332
|
|
329
|
|
333
|
|
||||
MILEAGE PLAN
The Alaska Airlines Mileage Plan™ program provides a comprehensive suite of frequent flier benefits. Miles can be earned by flying on Alaska or on one of our 14 airline partners, or by using the Alaska Airlines Visa Signature card, or through other non-airline partners. Our extensive list of airline partners includes carriers associated with two of the three major global alliances (Oneworld and SkyTeam), making it easier for our members to earn miles and reach preferred status in our Mileage Plan™, and have access to a large network of travel destinations. Further, members can receive 25,000 bonus miles upon signing up for the Alaska Airlines Visa Signature card and earn triple miles on purchases made on Alaska Airlines flights or on alaskaair.com. Alaska Airlines Visa Signature cardholders also receive an annual companion ticket that allows members to purchase an additional ticket for $99 plus tax, with no restrictions or black-out dates. Earned miles can be redeemed for flights on Alaska Airlines or on any of our partner airlines, or for upgrades to First Class on Alaska Airlines for as low as 15,000 miles. All of these benefits give our Mileage Plan™ members more value for their travel on Alaska Airlines, which led to our Mileage Plan™ receiving the highest rank by frequent fliers in the first-ever J.D. Power Airline Loyalty/Rewards Program Satisfaction Report in 2014.
Mileage Plan™ revenues represent approximately 10% of Air Group's total revenues. Furthermore, our Mileage Plan™ helps drive more revenue through attaining new customers and building customer loyalty through the benefits that we provide. The
7
Mileage Plan™ provides more value per dollar spent on the Alaska Airlines Visa Signature card, in comparison to other comparable frequent flier programs in the industry. Summary of the benefits provided in comparison to some of our competitors are as follows:
|
Alaska Airlines Signature Visa
|
Platinum Select AAdvantage
|
Gold Delta SkyMiles
|
United Mileage Plus Explorer
|
Southwest Rapid Rewards Premier
|
||||||
|
Bonus miles upon approval
|
Yes
|
No
|
No
|
No
|
No
|
|||||
|
Bonus miles awarded
|
25,000 upon approval
|
30,000 after spending $1,000 in 3 months
|
30,000 after spending $1,000 in 3 months
|
30,000 after spending $1,000 in 3 months
|
50,000 after spending $2,000 in 3 months
|
|||||
|
Annual fee
|
$75
|
$95
|
$95
|
$95
|
$99
|
|||||
|
Miles for "on" spend
|
3x
|
2x
|
2x
|
2x
|
2x
|
|||||
|
Companion fare
|
Yes - annual companion fare purchased for $99 plus tax.
|
No
|
No
|
No
|
No
|
|||||
|
First bag free
|
No
|
Yes
|
Yes
|
Yes
|
No bag fees
|
|||||
AGREEMENTS WITH OTHER AIRLINES
Our agreements fall into three different categories: Frequent Flier, Codeshare, and Interline agreements. Frequent Flier Agreements offer mileage credits and redemptions for our Mileage Plan™ members. Alaska offers one of the most comprehensive frequent flier programs for our Mileage Plan™ members through our frequent flier partnerships with 14 domestic and international carriers.
Codeshare agreements allow one or more marketing carriers to sell seats on a single operating carrier that services passengers under multiple flight numbers. The sale of codeshare seats can vary depending on the sale arrangement. For example, in a free-sale arrangement, the marketing carrier sells the operating carrier's inventory without any restriction; whereas in a block space arrangement, a fixed amount of seats are sold to the marketing carrier by the operating carrier. The interchangeability of the flight code between carriers provides a greater selection of flights for customers, along with increased flexibility for mileage accrual and redemption.
Interline agreements allow airlines to jointly offer a competitive, single-fare itinerary to customers traveling via multiple carriers to a final destination. An interline itinerary offered by one airline may not necessarily be offered by the other, and the fares collected from passengers are prorated and distributed to interline partners according to preexisting agreements between the carriers. Frequent Flier, Codeshare, and Interline agreements help increase our traffic and revenue by providing more route choices to customers.
We have marketing alliances with a number of airlines that provide frequent flier and codesharing opportunities. Alliances are an important part of our strategy and enhance our revenues by:
|
•
|
offering our customers more travel destinations and better mileage credit/redemption opportunities, including elite qualifying miles on all of our major U.S. and international airline partners;
|
|
•
|
giving our Mileage Plan™ program a competitive advantage because of our partnership with carriers from two of the three major global alliances (Oneworld and SkyTeam);
|
|
•
|
giving us access to more connecting traffic from other airlines; and
|
|
•
|
providing members of our alliance partners’ frequent flier programs an opportunity to travel on Alaska and its regional affiliates while earning mileage credit in our partners’ programs.
|
8
Most of our codeshare relationships are free-sale codeshares, where the marketing carrier sells seats on the operating carrier’s flights from the operating carrier’s inventory, but takes no inventory risk. Our marketing agreements have various termination dates, and at any time, one or more may be in the process of renegotiation.
The comprehensive summary of alliances with other airlines is as follows:
|
|
Frequent
Flier
Agreement
|
Codeshare —
Alaska Flight # on
Flights Operated by
Other Airline
|
Codeshare —
Other Airline Flight #
on Flights Operated by
Alaska / Horizon / SkyWest
|
||
|
Major U.S. or International Airlines
|
|||||
|
Aeromexico
|
Yes
|
No
|
Yes
|
||
|
American Airlines/Envoy
|
Yes
|
Yes
|
Yes
|
||
|
Air France
|
Yes
|
No
|
Yes
|
||
|
British Airways
|
Yes
|
No
|
No
|
||
|
Cathay Pacific Airways
|
Yes
|
No
|
Yes
|
||
|
Delta Air Lines
(a)
|
Yes
|
Yes
|
Yes
|
||
|
Emirates
|
Yes
|
No
|
No
|
||
|
KLM
|
Yes
|
No
|
Yes
|
||
|
Korean Air
|
Yes
|
No
|
Yes
|
||
|
LAN S.A.
|
Yes
|
No
|
Yes
|
||
|
Fiji Airways
(b)
|
Yes
|
No
|
Yes
|
||
|
Qantas
|
Yes
|
No
|
Yes
|
||
|
Regional Airlines
|
|
|
|
||
|
SkyWest
(b)
|
No
|
Yes
|
No
|
||
|
Era Alaska
|
Yes
|
Yes
|
No
|
||
|
PenAir
(b)
|
Yes
|
Yes
|
No
|
||
|
(a)
|
Alaska has codeshare agreements with the Delta Connection carriers SkyWest, ExpressJet, Endeavor, and Compass as part of its agreement with Delta.
|
|
(b)
|
These airlines do not have their own frequent flier program. However, Alaska’s Mileage Plan™ members can earn and redeem miles on these airlines’ route systems.
|
The following is the financial impact of our marketing alliances:
|
2014
|
2013
|
2012
|
2011
|
2010
|
|||||
|
Air Group Marketed Revenues
|
90.6%
|
90.0%
|
90.2%
|
89.3%
|
89.9%
|
||||
|
Codeshare Agreements:
|
|||||||||
|
American Airlines
|
2.9%
|
2.6%
|
2.7%
|
3.4%
|
3.1%
|
||||
|
Delta Air Lines
|
2.3%
|
3.8%
|
3.4%
|
3.6%
|
3.7%
|
||||
|
Others
|
0.9%
|
0.9%
|
0.8%
|
0.8%
|
0.8%
|
||||
|
Interline Agreements:
|
|||||||||
|
Domestic Interline
|
2.5%
|
1.9%
|
2.1%
|
2.2%
|
1.9%
|
||||
|
International Interline
|
0.8%
|
0.8%
|
0.8%
|
0.7%
|
0.6%
|
||||
|
Total Operating Revenue
|
100.0%
|
100.0%
|
100.0%
|
100.0%
|
100.0%
|
||||
9
OTHER REVENUE
Other revenue consists of freight and mail revenue, and ancillary revenue such as bag fees, change fees, on-board food and beverage, and Boardroom membership. Total other revenue, excluding Mileage Plan™ revenue, represents about 3% of our total revenues. In recent years, we have seen growth in our ancillary revenue as we expand services on-board such as Tom Douglas signature meals, in-flight entertainment, and Wi-Fi. We have increased our bag fees to better match industry average prices, but we also offer a 20-minute bag guarantee so that we deliver value to our customers through fast, reliable service. As we focus on ways to better serve our customers, we expect our ancillary revenues will continue to grow.
GENERAL
The airline industry is highly competitive, subject to various uncertainties, and has historically been characterized by low profit margins. Uncertainties include general economic conditions, volatile fuel prices, industry instability, new competition, a largely unionized work force, the need to finance large capital expenditures and the related availability of capital, government regulation, and potential aircraft incidents. Airlines have high fixed costs, primarily for wages, aircraft fuel, aircraft ownership, and facilities rents. Because expenses of a flight do not vary significantly based on the number of passengers carried, a relatively small change in the number of passengers or in pricing has a disproportionate effect on an airline’s operating and financial results. In other words, a minor shortfall in expected revenue levels could cause a disproportionately negative impact on our operating and financial results. Passenger demand and ticket prices are, to a large measure, influenced by the general state of the economy, current global economic and political events, and total available airline seat capacity.
In
2014
, the airline industry reported record revenues and profits as the global economy continued to recover and oil prices were stable for most of the year, with a significant decline in the fourth quarter. As the industry strengthens, airlines are now making significant investments in airports, in new planes, and in new services to differentiate their customer service offering. Thus, the level of competition is expected to increase.
FUEL
Our business and financial results are highly affected by the price and, potentially, the availability of aircraft fuel. The cost of aircraft fuel is volatile and outside of our control, and it can have a significant and immediate impact on our operating results. Over the past five years, aircraft fuel expense ranged from
27%
to
35%
of operating expenses. Fuel prices are impacted by changes in both the price of crude oil and refining margins, and can vary by region in the U.S.
The average annual price of crude oil in the last five years has increased from a low of
$80
per barrel in
2010
to a high of
$98
in 2013. Although the price of crude oil was $53 per barrel at the end of 2014, the full-year average was
$93
per barrel. For us, a $1 per barrel change in the price of oil equates to approximately
$11 million
of fuel cost annually. Said another way, a one-cent change in our fuel price per gallon will impact our expected annual fuel cost by approximately
$5 million
per year.
Refining margins, which represent the price of refining crude oil into aircraft fuel, are a smaller portion of the overall price of jet fuel, but also contributed to the price volatility in recent years. Refining margin prices have fluctuated between
$14
per barrel and
$36
per barrel in the last five years, and averaged $23 in 2014.
Generally, West Coast aircraft fuel prices are somewhat higher and more volatile than prices in the Gulf Coast or on the East Coast, putting our operation at a competitive disadvantage. Our average raw fuel cost per gallon
decreased
6%
in
2014
, decreased 4% in
2013
, and increased 2% in
2012
.
10
The percentages of our aircraft fuel expense by crude and refining margins, as well as the percentage of our aircraft fuel expense of operating expenses are as follows:
|
|
2014
|
2013
|
2012
|
2011
|
2010
|
|||||||||
|
Crude oil
|
72
|
%
|
71
|
%
|
65
|
%
|
70
|
%
|
79
|
%
|
||||
|
Refining margins
|
18
|
%
|
19
|
%
|
25
|
%
|
24
|
%
|
14
|
%
|
||||
|
Other
(a)
|
10
|
%
|
10
|
%
|
10
|
%
|
6
|
%
|
7
|
%
|
||||
|
Total
|
100
|
%
|
100
|
%
|
100
|
%
|
100
|
%
|
100
|
%
|
||||
|
Aircraft fuel expense
|
32
|
%
|
34
|
%
|
35
|
%
|
34
|
%
|
27
|
%
|
||||
|
(a)
|
Other includes gains and losses on settled fuel hedges, unrealized mark-to-market fuel hedge gains or losses, taxes and other into-plane costs.
|
We use crude oil call options as hedges to decrease our exposure to the volatility of jet fuel prices. Historically, we have had jet fuel refining margin swap contracts, but we discontinued the use of the refining margin swaps in the third quarter of 2014. Call options effectively cap our pricing for the crude oil, limiting our exposure to increasing fuel prices for about half of our planned fuel consumption. With call options, we are hedged against volatile crude oil price increases, and during a period of decline in crude oil prices, we only forfeit cash previously paid for hedge premiums. Currently, we hedge approximately 18 months in advance of crude oil consumption.
We believe that operating fuel-efficient aircraft is the best hedge against high fuel prices. Alaska operates an all-Boeing 737 fleet and Horizon operates an all-Bombardier Q400 turboprop fleet. Air Group's fuel-efficiency rate expressed in available seat miles flown per gallon (ASMs/g) improved from
73.6
ASMs/g in
2010
to
76.9
ASMs/g in
2014
. These improvements have not only reduced our fuel consumption rate, but also the amount of greenhouse gases and other pollutants that our operations emit.
COMPETITION
Competition in the airline industry is intense and unpredictable. Our competitors consist primarily of other airlines and, to a lesser extent, other forms of transportation. Competition can be direct, in the form of another carrier flying the exact non-stop route, or indirect, where a carrier serves the same two cities non-stop from an alternative airport in that city or via an itinerary requiring a connection at another airport. Our five principal competitors, in order of competitive overlap, are Delta, United, Southwest, American, and Hawaiian. Delta significantly increased their capacity at Sea-Tac in 2014, and we expect them to continue to do so in 2015. Based on schedules filed with the U.S. Department of Transportation, we expect the amount of competitive capacity overlap from these carriers to increase more than 12% in 2015, weighted based on our network. We also compete with several other domestic and international carriers, but to a lesser extent than with our principal competitors.
We believe that the following principal competitive factors are important to our customers:
|
•
|
Safety record
|
|
•
|
Customer service and reputation
|
We compete with other airlines in areas of customer service such as on-time performance, passenger amenities - including first class seating, quality of buy-on-board products, aircraft type, and comfort. In
2014
, Alaska Airlines ranked “Highest in Customer Satisfaction among Traditional Network Carriers” by J.D. Power and Associates for the
seventh
year in a row. All of our 2014 mainline aircraft deliveries included the Boeing Sky Interior, and we launched the new Alaska Beyond™ in-flight experience, which features our streaming in-flight entertainment, gourmet food designed by Tom Douglas, and comfortable seats with additional space and power as part of our exceptional, above and beyond flight experience.
|
•
|
Fares and ancillary services
|
The pricing of fares is a significant competitive factor in the airline industry, and the increased availability of fare information on the Internet allows travelers to easily compare fares and identify competitor promotions and discounts. Pricing is driven by a variety of factors including, but not limited to, market-specific capacity, market share per route/geographic area, cost structure, fare vs. ancillary revenue strategies, and demand.
11
For example, airlines often discount fares to drive traffic in new markets or to stimulate traffic when necessary to improve load factors. In addition, traditional network carriers have been able to reduce their operating costs through bankruptcies and mergers, while low-cost carriers have continued to grow their fleets and expand their networks, potentially enabling them to better control costs per available seat mile (the average cost to fly an aircraft seat one mile), which in turn may enable them to lower their fares. These factors can reduce our pricing power and that of the airline industry as a whole.
Domestic airline capacity is dominated by four large carriers, representing approximately 85% of total seats. Accordingly, if these carriers discount their fares or enter into our core markets, we must match those fares in order to maintain our load factors, often resulting in year-over-year decreases in our yields. We will defend our core markets vigorously, and if necessary redeploy capacity to better match supply with demand. We believe the restructuring we've completed over the past decade has decreased our costs to the point we can offer competitive fares while still earning appropriate pre-tax margins.
|
•
|
Routes served, flight schedules, codesharing and interline relationships, and frequent flier programs
|
We also compete with other airlines based on markets served, the frequency of service to those markets, and frequent flier opportunities. Some airlines have more extensive route structures than we do, and they offer significantly more international routes. In order to expand opportunities for our customers, we enter into codesharing and interline relationships with other airlines that provide reciprocal frequent flier mileage credit and redemption privileges. These relationships allow us to offer our customers access to more destinations than we can on our own, gain exposure in markets we don't serve and allow our customers more opportunities to earn and redeem frequent flier miles. Our Mileage Plan™ offers one of the most comprehensive benefits to our members with the ability to earn and redeem miles on 14 of our partner carriers.
In addition to domestic or foreign airlines that we compete with on most of our routes, we also compete with ground transportation in our short-haul markets in the regional operations. Both carriers, to some extent, also compete with technology such as video conferencing and internet-based meeting tools that have changed the need for, or frequency of face-to-face business meetings.
TICKET DISTRIBUTION
Airline tickets are distributed through three primary channels:
|
•
|
Alaskaair.com:
It is less expensive for us to sell through this direct channel and, as a result, we continue to take steps to drive more business to our website. In addition, we believe this channel is preferable from a branding and customer-relationship standpoint in that we can establish ongoing communication with the customer and tailor offers accordingly.
|
|
•
|
Traditional and online travel agencies:
Both traditional and online travel agencies typically use Global Distribution Systems (GDS), such as Sabre, to obtain their fare and inventory data from airlines. Bookings made through these agencies result in a fee that is charged to the airline. Many of our large corporate customers require us to use these agencies. Some of our competitors do not use this distribution channel and, as a result, have lower ticket distribution costs.
|
|
•
|
Reservation call centers:
These call centers are located in Phoenix, AZ, Kent, WA, and Boise, ID. We generally charge a $15 fee for booking reservations through these call centers.
|
Our sales by channel are as follows:
|
|
2014
|
2013
|
2012
|
2011
|
2010
|
|||||||||
|
Alaskaair.com
|
57
|
%
|
55
|
%
|
54
|
%
|
51
|
%
|
48
|
%
|
||||
|
Traditional agencies
|
25
|
%
|
27
|
%
|
27
|
%
|
28
|
%
|
28
|
%
|
||||
|
Online travel agencies
|
12
|
%
|
13
|
%
|
13
|
%
|
13
|
%
|
15
|
%
|
||||
|
Reservation call centers
|
6
|
%
|
5
|
%
|
6
|
%
|
8
|
%
|
9
|
%
|
||||
|
Total
|
100
|
%
|
100
|
%
|
100
|
%
|
100
|
%
|
100
|
%
|
||||
12
SEASONALITY AND OTHER FACTORS
Our results of operations for any interim period are not necessarily indicative of those for the entire year because our business is subject to seasonal fluctuations. Our profitability is generally lowest during the first and fourth quarters due principally to lower traffic. Profitability typically increases in the second quarter and then reaches its highest level during the third quarter as a result of vacation travel, including increased activity in the state of Alaska. However, we have taken steps over the past few years to better manage the seasonality of our operations by adding flights to leisure destinations, like Hawaii, and expanding to cities in the mid-continental and eastern U.S.
In addition to passenger loads, factors that could cause our quarterly operating results to vary include:
|
•
|
general economic conditions and resulting changes in passenger demand,
|
• changes in fuel costs,
|
•
|
pricing initiatives by us or our competitors,
|
|
•
|
increases in competition at our primary airports, and
|
|
•
|
increases or decreases in passenger and volume-driven variable costs.
|
Many of the markets we serve experience inclement weather conditions in the winter, causing increased costs associated with deicing aircraft, canceling flights, and reaccommodating displaced passengers. Due to our geographic area of operations, we can be more susceptible to adverse weather conditions, particularly in the state of Alaska and the Pacific Northwest, than some of our competitors, who may be better able to spread weather-related risks over larger route systems.
No material part of our business or that of our subsidiaries is dependent upon a single customer, or upon a few high-volume customers.
EMPLOYEES
Our business is labor intensive. As of
December 31, 2014
, we employed
13,952
(
10,846
at Alaska and
3,106
at Horizon) active full-time and part-time employees. Wages and benefits, including variable incentive pay, represented approximately
41%
of our total non-fuel operating expenses in both
2014
and
2013
.
Most major airlines, including ours, have employee groups that are covered by collective bargaining agreements. Airlines with unionized work forces have higher labor costs than carriers without unionized work forces, and they may not have the ability to adjust labor costs downward quickly enough to respond to new competition or slowing demand. At
December 31, 2014
, labor unions represented
83%
of Alaska’s and
48%
of Horizon’s employees. Our relations with our U.S. labor organizations are governed by the Railway Labor Act (RLA). Under this act, collective bargaining agreements do not expire but instead become amendable as of a stated date. If either party wishes to modify the terms of any such agreement, it must notify the other party in the manner prescribed by the RLA and/or described in the agreement. After receipt of such notice, the parties must meet for direct negotiations, and if no agreement is reached, either party may request the National Mediation Board (NMB) to initiate a process including mediation, arbitration, and a potential “cooling off” period that must be followed before either party may engage in self-help.
13
Alaska’s union contracts at
December 31, 2014
were as follows:
|
Union
|
Employee Group
|
Number of Employees
|
Contract Status
|
||||
|
Air Line Pilots Association International (ALPA)
|
Pilots
|
1,562
|
|
Amendable 03/31/2018
|
|||
|
Association of Flight Attendants (AFA)
|
Flight attendants
|
3,374
|
|
Amendable 12/17/2019
|
|||
|
International Association of Machinists and Aerospace Workers (IAM)
|
Ramp service and stock clerks
|
613
|
|
Amendable 7/19/2018
|
|||
|
IAM
|
Clerical, office and passenger service
|
2,717
|
|
Amendable 1/1/2019
|
|||
|
Aircraft Mechanics Fraternal Association (AMFA)
|
Mechanics, inspectors and cleaners
|
630
|
|
Amendable 10/17/2016
|
|||
|
Mexico Workers Association of Air Transport
|
Mexico airport personnel
|
85
|
|
Amendable 9/29/2014
|
|||
|
Transport Workers Union of America (TWU)
|
Dispatchers
|
41
|
|
Amendable 3/24/2015
|
|||
Horizon’s union contracts at
December 31, 2014
were as follows:
|
Union
|
Employee Group
|
Number of Employees
|
Contract Status
|
||||
|
International Brotherhood of Teamsters (IBT)
|
Pilots
|
607
|
|
Amendable 12/14/2018
|
|||
|
AFA
|
Flight attendants
|
550
|
|
Amendable 07/18/18
|
|||
|
IBT
|
Mechanics and related classifications
|
272
|
|
Amendable 12/16/2020
|
|||
|
National Automobile, Aerospace, Transportation and General Workers
|
Station personnel in
Vancouver and Victoria, BC, Canada |
50
|
|
Amendable 2/14/2016
|
|||
EXECUTIVE OFFICERS
The executive officers of Alaska Air Group, Inc. and executive officers of Alaska and Horizon who have significant decision-making responsibilities, their positions and their respective ages are as follows:
|
Name
|
Position
|
Age
|
Air Group
or Subsidiary
Officer Since
|
|||
|
Bradley Tilden
|
Chairman, President and Chief Executive Officer of Alaska Air Group, Inc. and Alaska Airlines, Inc. and Chief Executive Officer of Horizon Air Industries, Inc.
|
54
|
1994
|
|||
|
Benito Minicucci
|
Executive Vice President/Operations and Chief Operating Officer of Alaska Airlines, Inc.
|
48
|
2004
|
|||
|
Brandon Pedersen
|
Executive Vice President/Finance and Chief Financial Officer of Alaska Air Group, Inc. and Alaska Airlines, Inc.
|
48
|
2003
|
|||
|
Andrew Harrison
|
Senior Vice President of Planning and Revenue Management of Alaska Air Group, Inc. and Alaska Airlines, Inc.
|
44
|
2008
|
|||
|
Dave Campbell
|
President and Chief Operating Officer of Horizon Air Industries, Inc.
|
53
|
2014
|
|||
|
Herman Wacker
|
Chief Ethics & Compliance Officer, General Counsel, and Vice President of Legal at Alaska Air Group, Inc.
|
66
|
2014
|
|||
Mr. Tilden
joined Alaska Airlines in 1991, became Controller of Alaska Air Group, Inc. and Alaska Airlines in 1994, Chief Financial Officer in February 2000, Executive Vice President/Finance and Chief Financial Officer in January 2002, Executive
14
Vice President/Finance and Planning in 2007, and President of Alaska Airlines in December 2008. He is a member of Air Group’s Management Executive Committee and was elected to the Air Group Board in 2010. He was elected Chief Executive Officer of Alaska Air Group, Inc., Alaska Airlines and Horizon Air Industries in May 2012, and was elected Chairman of the Board in November 2013.
Mr. Minicucci
joined Alaska Airlines in 2004 as Staff Vice President of Maintenance and Engineering and was promoted to Vice President of Seattle Operations in June 2008. He was elected Executive Vice President/Operations and Chief Operating Officer of Alaska Airlines in December 2008. He is a member of Air Group’s Management Executive Committee.
Mr. Pedersen
joined Alaska Airlines in 2003 as Staff Vice President/Finance and Controller of Alaska Air Group and Alaska Airlines and was elected Vice President/Finance and Controller for both entities in 2006. He was elected Vice President/Finance and Chief Financial Officer of Alaska Air Group and Alaska Airlines in June 2010, and elected as Executive Vice President/Finance and Chief Financial Officer in 2014. He is a member of Air Group's Management Executive Committee.
Mr. Harrison
joined Alaska Airlines in 2003 as the Managing Director of Internal Audit and was elected Vice President of Planning and Revenue Management in 2008. He was elected Senior Vice President of Planning and Revenue Management in 2014. He is a member of Air Group's Management Executive Committee.
Mr. Campbell
joined Horizon Air in 2014 as President and Chief Operating Officer. Prior to joining Horizon, Mr. Campbell served more than 25 years of experience in maintenance and flight operations. Most recently, he served as the vice president of maintenance and engineering at jetBlue Airways from January 2014 to August 2014, and prior to that, he served as vice president of safety and operational performance at American Airlines. He joined American in 1988 after serving for four years in the U.S. Air Force and has overseen maintenance, quality, technical operations and safety. He is a member of Air Group's Management Executive Committee.
Mr. Wacker
has been Chief Ethics & Compliance Officer at Alaska Air Group, Inc. and Alaska Airlines, Inc. since May 2014 and was elected General Counsel in October 2014. Mr. Wacker has been Vice President of Legal at Alaska Air Group, Inc. since February 2014 and served as its Managing Director of Labor & Employment Law from June 2007 to February 2014. He served as an Associate General Counsel of Alaska Airlines Inc. and Alaska Air Group Inc. since June 2007. He is a member of Air Group's Management Executive Committee.
REGULATION
GENERAL
The airline industry is highly regulated. The Department of Transportation (DOT), the Federal Aviation Administration (FAA) and the Transportation Security Administration (TSA) exercise significant regulatory authority over air carriers.
|
•
|
DOT:
In order to provide passenger and cargo air transportation in the U.S., a domestic airline is required to hold a certificate of public convenience and necessity issued by the DOT. Subject to certain individual airport capacity, noise and other restrictions, this certificate permits an air carrier to operate between any two points in the U.S. Certificates do not expire, but may be revoked for failure to comply with federal aviation statutes, regulations, orders or the terms of the certificates. While airlines are permitted to establish their own fares without governmental regulation,
the DOT has jurisdiction over the approval of international codeshare agreements, marketing alliance agreements between major domestic carriers, international and some domestic route authorities, Essential Air Service market subsidies, carrier liability for personal or property damage, and certain airport rates and charges disputes. International treaties may also contain restrictions or requirements for flying outside of the U.S. and impose different carrier liability limits than those applicable to domestic flights. The DOT has been active in implementing a variety of “passenger protection” regulations, covering subjects such as advertising, passenger communications, denied boarding compensation and tarmac delay response.
|
|
•
|
FAA:
The FAA, through Federal Aviation Regulations (FARs), generally regulates all aspects of airline operations, including establishing personnel, maintenance and flight operation standards. Domestic airlines are required to hold a valid air carrier operating certificate issued by the FAA. Pursuant to these regulations we have established, and the FAA has approved, our operations specifications and a maintenance program for each type of aircraft we operate. The maintenance program provides for the ongoing maintenance of such aircraft, ranging from frequent routine inspections to major overhauls. From time to time the FAA issues airworthiness directives (ADs) that must be incorporated into our aircraft maintenance program and operations. All airlines are subject to enforcement actions that are brought by the FAA
|
15
from time to time for alleged violations of FARs or ADs. At this time, we are not aware of any enforcement proceedings that could either materially affect our financial position or impact our authority to operate.
|
•
|
TSA:
Airlines serving the U.S. must operate a TSA-approved Aircraft Operator Standard Security Program (AOSSP), and comply with TSA Security Directives (SDs) and regulations. Airlines are subject to enforcement actions that are brought by the TSA from time to time for alleged violations of the AOSSP, SDs or security regulations. We are not aware of any enforcement proceedings that could either materially affect our financial position or impact our authority to operate. Under TSA authority, we are required to collect a September 11 Security Fee of $5.60 per one-way trip from passengers and remit that sum to the government to fund aviation security me
asures. Through September 2014, carriers also paid the TSA a security infrastructure fee to cover passenger and property screening costs. These security infrastructure fees amounted to
$10 million
in 2014 and
$13 million
each year in
2013
and
2012
.
|
The Department of Justice and DOT have jurisdiction over airline antitrust matters. The U.S. Postal Service has jurisdiction over certain aspects of the transportation of mail and related services. Labor relations in the air transportation industry are regulated under the Railway Labor Act. To the extent we continue to fly to foreign countries and pursue alliances with international carriers, we may be subject to certain regulations of foreign agencies and international treaties.
ENVIRONMENTAL AND OCCUPATIONAL SAFETY MATTERS
We are subject to various laws and government regulations concerning environmental matters and employee safety and health in the U.S. and other countries. U.S. federal laws that have a particular effect on us include the Airport Noise and Capacity Act of 1990, the Clean Air Act, the Resource Conservation and Recovery Act, the Clean Water Act, the Safe Drinking Water Act, and the Comprehensive Environmental Response, Compensation and Liability Act, Superfund Amendments and Reauthorization Act, and the Oil Pollution Control Act. We are also subject to the oversight of the Occupational Safety and Health Administration (OSHA) concerning employee safety and health matters. The U.S. Environmental Protection Agency, OSHA, and other federal agencies have been authorized to create and enforce regulations that have an impact on our operations. In addition to these federal activities, various states have been delegated certain authorities under these federal statutes. Many state and local governments have adopted environmental and employee safety and health laws and regulations. We maintain our safety, health and environmental programs in order to meet or exceed these requirements.
We expect there will be legislation in the future to reduce carbon and other greenhouse gas emissions. Alaska and Horizon have transitioned to more fuel-efficient aircraft fleets.
The Airport Noise and Capacity Act recognizes the rights of airport operators with noise problems to implement local noise abatement programs so long as they do not interfere unreasonably with interstate or foreign commerce or the national air transportation system. Authorities in several cities have established aircraft noise reduction programs, including the imposition of nighttime curfews. We believe we have sufficient scheduling flexibility to accommodate local noise restrictions.
Although we do not currently anticipate that these regulatory matters, individually or collectively, will have a material effect on our financial condition, results of operations or cash flows, new regulations or compliance issues that we do not currently anticipate could have the potential to harm our financial condition, results of operations or cash flows in future periods.
INSURANCE
We carry Airline Hull, Spares and Comprehensive Legal Liability Insurance in amounts and of the type generally consistent with industry practice to cover damage to aircraft, spare parts and spare engines, as well as bodily injury and property damage to passengers and third parties. We also have coverage for War and Allied Perils, including hijacking, terrorism, malicious acts, strikes, riots, civil commotion and other identified perils.
We believe that our emphasis on safety and our state-of-the-art flight deck safety technology help to control the cost of aviation insurance.
WHERE YOU CAN FIND MORE INFORMATION
Our filings with the Securities and Exchange Commission, including our annual report on Form 10-K, quarterly reports on Form 10-Q, current reports on Form 8-K and amendments to those reports are available on our website at
www.alaskaair.com,
free of charge, as soon as reasonably practicable after the electronic filing of these reports with the Securities and Exchange Commission. The information contained on our website is not a part of this annual report on Form 10-K.
16
|
|
If any of the following occurs, our business, financial condition and results of operations could suffer. In such case, the trading price of our common stock could also decline. We operate in a continually changing business environment. In this environment, new risks may emerge and already identified risks may vary significantly in terms of impact and likelihood of occurrence. Management cannot predict such developments, nor can it assess the impact, if any, on our business of such new risk factors or of events described in any forward-looking statements.
We have adopted an enterprise wide Risk Analysis and Oversight Program designed to identify the various risks faced by the organization, assign responsibility for managing those risks to individual executives as well as align these risks with Board oversight. These enterprise-level identified risks have been aligned to the risk factors discussed below.
SAFETY, COMPLIANCE AND OPERATIONAL EXCELLENCE
Our reputation and financial results could be harmed in the event of an airline accident or incident.
An accident or incident involving one of our aircraft or an aircraft operated by one of our codeshare partners or CPA carriers could involve a significant loss of life and result in a loss of confidence in our airlines by the flying public and/or aviation authorities. We could experience significant claims from injured passengers, by-standers and surviving relatives, as well as costs for the repair or replacement of a damaged aircraft and its consequential temporary or permanent loss from service. We maintain liability insurance in amounts and of the type generally consistent with industry practice, as do our codeshare partners and CPA carriers. However, the amount of such coverage may not be adequate to fully cover all claims and we may be forced to bear substantial economic losses from an accident. Substantial claims resulting from an accident in excess of our related insurance coverage would harm our business and financial results. Moreover, any aircraft accident or incident, even if fully insured and even if it does not involve one of our aircraft, could cause a public perception that our airlines or the equipment they fly are less safe or reliable than other transportation alternatives, which would harm our business.
Changes in government regulation imposing additional requirements and restrictions on our operations or on the airports at which we operate could increase our operating costs and result in service delays and disruptions.
Airlines are subject to extensive regulatory and legal requirements, both domestically and internationally, that involve significant compliance costs. In the last several years, Congress has passed laws, and the U.S. DOT, the TSA and the FAA have issued regulations that have required significant expenditures relating to the maintenance and operation of airlines and establishment of consumer protections.
Similarly, there are a number of legislative and regulatory initiatives and reforms at the federal, state, and local level, including increasingly stringent laws protecting the environment, minimum wage requirements, and health care mandates that could affect our relationship with our workforce and cause our expenses to increase without an ability to pass through these costs.
Almost all commercial service airports are owned and/or operated by units of local or state governments. Airlines are largely dependent on these governmental entities to provide adequate airport facilities and capacity at an affordable cost. Many airports have increased their rates and charges to air carriers related to higher security costs, increased costs related to updated infrastructures, and other costs. Additional laws, regulations, taxes, and airport rates and charges have been proposed from time to time that could significantly increase the cost of airline operations or reduce the demand for air travel. Although lawmakers may impose these additional fees and view them as “pass-through” costs, we believe that a higher total ticket price will influence consumer purchase and travel decisions and may result in an overall decline in passenger traffic, which would harm our business.
The airline industry continues to face potential security concerns and related costs.
The terrorist attacks of September 11, 2001 and their aftermath negatively affected the airline industry, including our company. Additional terrorist attacks, the fear of such attacks or other hostilities involving the U.S. could have a further significant negative effect on the airline industry, including us, and could:
|
•
|
significantly reduce passenger traffic and yields as a result of a potentially dramatic drop in demand for air travel;
|
|
•
|
significantly increase security and insurance costs;
|
17
|
•
|
make war risk or other insurance unavailable or extremely expensive;
|
|
•
|
increase fuel costs and the volatility of fuel prices;
|
|
•
|
increase costs from airport shutdowns, flight cancellations and delays resulting from security breaches and perceived safety threats; and
|
|
•
|
result in a grounding of commercial air traffic by the FAA.
|
The occurrence of any of these events would harm our business, financial condition and results of operations.
We rely on third-party vendors for certain critical activities.
We have historically relied on outside vendors for a variety of services and functions critical to our business, including airframe and engine maintenance, ground handling, fueling, computer reservation system hosting, telecommunication systems, and information technology infrastructure and services. As part of our cost-reduction efforts, our reliance on outside vendors has increased and may continue to do so in the future, especially since we rely on timely and effective third-party performance in conjunction with many of our technology-related initiatives. In addition, in recent years, Alaska and Horizon have subcontracted their heavy aircraft maintenance, fleet service, facilities maintenance, and ground handling services at certain airports, including Seattle-Tacoma International Airport, to outside vendors.
Even though we strive to formalize agreements with these vendors that define expected service levels, our use of outside vendors increases our exposure to several risks. In the event that one or more vendors go into bankruptcy, ceases operation or fails to perform as promised, replacement services may not be readily available at competitive rates, or at all. If one of our vendors fails to perform adequately, we may experience increased costs, delays, maintenance issues, safety issues or negative public perception of our airline. Vendor bankruptcies, unionization, regulatory compliance issues or significant changes in the competitive marketplace among suppliers could adversely affect vendor services or force us to renegotiate existing agreements on less favorable terms. These events could result in disruptions in our operations or increases in our cost structure.
Our operations are often affected by factors beyond our control, including delays, cancellations, and other conditions, which could harm our business, financial condition and results of operations.
Like other airlines, our operations often are affected by delays, cancellations and other conditions caused by factors largely beyond our control.
Other conditions that might impact our operations include:
|
•
|
lack of a national airline policy;
|
|
•
|
lack of operational approval (e.g. new routes, aircraft deliveries, etc.) due to government shutdown;
|
|
•
|
congestion at airports or air traffic control problems;
|
|
•
|
adverse weather conditions;
|
|
•
|
increased security measures or breaches in security;
|
|
•
|
contagious illness and fear of contagion;
|
|
•
|
international or domestic conflicts or terrorist activity; and
|
|
•
|
other changes in business conditions.
|
Due to our concentration of flights in the Pacific Northwest and Alaska, we believe a large portion of our operation is more susceptible to adverse weather conditions. A general reduction in airline passenger traffic as a result of any of the above-mentioned factors could harm our business, financial condition and results of operations.
18
STRATEGY
The airline industry is highly competitive and susceptible to price discounting and changes in capacity, which could have a material adverse effect on the Company. If we cannot successfully compete in the marketplace, our business, financial condition and operating results will be materially adversely affected.
The U.S. airline industry is characterized by substantial price competition. In recent years, the market share held by low-cost carriers has increased significantly and is expected to continue to increase. Airlines also compete for market share by increasing or decreasing their capacity, including route systems and the number of markets served. Several of our competitors have increased their capacity in markets we serve, particularly on the West Coast, therefore increasing competition for those destinations. This increased competition in both domestic and international markets may have a material adverse effect on the Company’s results of operations, financial condition or liquidity.
We continue to strive toward aggressive cost-reduction goals that are an important part of our business strategy of offering the best value to passengers through competitive fares while achieving acceptable profit margins and return on capital. If we are unable to reduce our costs over the long-term and achieve sustained targeted return on invested capital, we will likely not be able to grow our business in the future or weather industry downturns and therefore our financial results may suffer.
The airline industry may undergo further restructuring, consolidation, or the creation or modification of alliances or joint ventures, any of which could have a material adverse effect on our business, financial condition and results of operations.
We continue to face strong competition from other carriers due to restructuring, consolidation, and the creation and modification of alliances and joint ventures. Since deregulation, both the U.S. and international airline industries have experienced consolidation through a number of mergers and acquisitions. Carriers may improve their competitive positions through airline alliances, slot swaps/acquisitions, and/or joint ventures. Certain airline joint ventures further competition by allowing airlines to coordinate routes, pool revenues and costs, and enjoy other mutual benefits, achieving many of the benefits of consolidation.
We depend on a few key markets to be successful.
Our strategy is to focus on serving a few key markets, including Seattle, Los Angeles, Anchorage, Portland, Hawaii and San Diego. A significant portion of our flights occur to and from our Seattle hub. In
2014
, passengers to and from Seattle accounted for
61%
of our total passengers.
We believe that concentrating our service offerings in this way allows us to maximize our investment in personnel, aircraft, and ground facilities, as well as to gain greater advantage from sales and marketing efforts in those regions. As a result, we remain highly dependent on our key markets. Our business could be harmed by any circumstances causing a reduction in demand for air transportation in our key markets. An increase in competition in our key markets could also cause us to reduce fares or take other competitive measures that could harm our business, financial condition and results of operations.
Economic uncertainty or another recession would likely impact demand for our product and could harm our financial condition and results of operations.
The airline industry, which is subject to relatively high fixed costs and highly variable and unpredictable demand, is particularly sensitive to changes in economic conditions. We are also highly dependent on U.S. consumer confidence and the health of the U.S. economy. Unfavorable U.S. economic conditions have historically driven changes in travel patterns and have resulted in reduced spending for both leisure and business travel. For some consumers, leisure travel is a discretionary expense, and shorthaul travelers, in particular, have the option to replace air travel with surface travel. Businesses are able to forgo air travel by using communication alternatives such as videoconferencing and the Internet or may be more likely to purchase less expensive tickets to reduce costs, which can result in a decrease in average revenue per seat. Unfavorable economic conditions also hamper the ability of airlines to raise fares to counteract increased fuel, labor, and other costs. Unfavorable or even uncertain economic conditions could negatively affect our financial condition and results of operations.
19
We are dependent on a limited number of suppliers for aircraft and parts.
Alaska is dependent on Boeing as its sole supplier for aircraft and many aircraft parts. Horizon is similarly dependent on Bombardier. Additionally, each carrier is dependent on sole suppliers for aircraft engines. As a result, we are more vulnerable to any problems associated with the supply of those aircraft and parts, including design defects, mechanical problems, contractual performance by the manufacturers, or adverse perception by the public that would result in customer avoidance or in actions by the FAA resulting in an inability to operate our aircraft.
We rely on partner airlines for codeshare and frequent flier marketing arrangements.
Alaska and Horizon are parties to marketing agreements with a number of domestic and international air carriers, or “partners," including, but not limited to, American Airlines and Delta Air Lines. These agreements provide that certain flight segments operated by us are held out as partner “codeshare” flights and that certain partner flights are held out for sale as Alaska codeshare flights. In addition, the agreements generally provide that members of Alaska’s Mileage Plan™ program can earn miles on or redeem miles for partner flights and vice versa. We receive revenue from flights sold under codeshare and from interline arrangements. In addition, we believe that the frequent flier arrangements are an important part of our Mileage Plan™ program. The loss of a significant partner through bankruptcy, consolidation, or otherwise, could have a negative effect on our revenues or the attractiveness of our Mileage Plan™, which we believe is a source of competitive advantage.
There is ongoing speculation that further airline consolidation or reorganization could occur in the future. We routinely engage in analysis and discussions regarding our own strategic position, including alliances, codeshare arrangements, interline arrangements, frequent flier program enhancements, and may have future discussions with other airlines regarding similar activities. If other airlines participate in consolidation or reorganization, those airlines may significantly improve their cost structures or revenue generation capabilities, thereby potentially making them stronger competitors of ours and potentially impairing our ability to realize expected benefits from our own strategic relationships.
INFORMATION TECHNOLOGY
We rely heavily on automated systems to operate our business, and a failure to invest in new technology, or a disruption of our current systems or their operators could harm our business.
We depend on automated systems to operate our business, including our airline reservation system, our telecommunication systems, our website, our maintenance systems, our check-in kiosks, and other systems. Substantially all of our tickets are issued to passengers as electronic tickets and the majority of our customers check in using our website or our airport kiosks. We depend on our reservation system to be able to issue, track and accept these electronic tickets. In order for our operations to work efficiently, we must continue to invest in new technology to ensure that our website, reservation system, and check-in systems are able to accommodate a high volume of traffic, maintain secure information, and deliver important flight information. Substantial or repeated website, reservations system or telecommunication systems failures or service disruptions could reduce the attractiveness of our services and cause our customers to do business with another airline. In addition, we rely on other automated systems for crew scheduling, flight dispatch, and other operational needs. Disruptions, untimely recovery, or a breach of these systems could result in the loss of important data, an increase of our expenses, an impact on our operational performance, or a possible temporary cessation of our operations.
If we do not maintain the privacy and security of our information, we could damage our reputation and incur substantial legal and regulatory costs.
We accept, store, and transmit information about our customers, our employees, our business partners and our business. In addition, we frequently rely on third-party hosting sites and data processors, including cloud providers. Our sensitive information relies on secure transmission over public and private networks. A compromise of our systems, the security of our infrastructure, or those of other business partners that result in our information being accessed or stolen by unauthorized persons could adversely affect our operations and our reputation.
20
FINANCIAL CONDITION AND FINANCIAL MARKETS
Our business, financial condition, and results of operations are substantially exposed to the volatility of jet fuel prices. Significant increases in jet fuel costs would harm our business.
Fuel costs constitute a significant portion of our total operating expenses, accounting for
32%
,
34%
and
35%
of total operating expenses for the years ended
2014
,
2013
and
2012
, respectively. Future increases in the price of jet fuel may harm our business, financial condition and results of operations, unless we are able to increase fares and fees, or add additional ancillary fees to attempt to recover increasing fuel costs.
Certain of the Company’s financing agreements have covenants that impose operating and financial restrictions on the Company and its subsidiaries.
Certain of our credit facilities and indentures governing our secured borrowings impose certain operating and financial covenants on us. Such covenants require us to maintain, depending on the particular agreement, minimum liquidity and/or minimum collateral coverage ratios, and other negative covenants customary for such financings. A decline in the value of collateral could result in a situation where we may not be able to maintain the required collateral coverage ratio.
Our ability to comply with these covenants may be affected by events beyond our control, including the overall industry revenue environment and the level of fuel costs, and we may be required to seek waivers or amendments of covenants, repay all or a portion of the debt or find alternative sources of financing.
Our maintenance costs will increase as our fleet ages, and we will periodically incur substantial maintenance costs due to the maintenance schedules of our aircraft fleet.
As of
December 31, 2014
, the average age of our NextGen aircraft (B737-800, -900, -900ERs) was approximately
6.1
years, and the average age of our Q400 aircraft was approximately
8.1
years. Our relatively new aircraft require less maintenance now than they will in the future. Any significant increase in maintenance expenses could have a material adverse effect on our results of operations.
BRAND AND REPUTATION
As we evolve our brand to appeal to a changing demographic and grow into new markets, we will engage in strategic initiatives that may not be favorably received by all customers.
We continue to focus on strategic initiatives designed to increase our brand appeal to a diverse and evolving demographic of airline travelers. These efforts could include significant improvements to our in-airport and on-board environments, increasing our direct customer relationships through improvements to our purchasing portals (digital and mobile), and optimization of our customer loyalty programs.
In pursuit of these efforts we may negatively affect our reputation with some of our existing customer base.
LABOR RELATIONS AND LABOR STRATEGY
A significant increase in labor costs, unsuccessful attempts to strengthen our relationships with union employees, or loss of key personnel could adversely affect our business and results of operations.
Labor costs are a significant component of our total expenses, accounting for approximately
41%
,
42%
and
42%
of our non-fuel operating expenses in
2014
,
2013
and
2012
, respectively. Each of our represented employee groups has a separate collective bargaining agreement, and could make demands that would increase our operating expenses and adversely affect our financial performance if we agree to them. The same result could apply if we experience a significant increase in vendor labor costs that ultimately flow through to us.
As of
December 31, 2014
, labor unions represented approximately
83%
of Alaska’s and
48%
of Horizon’s employees. Although we have been successful in maturing communications, negotiating approaches, and other strategies to enhance workforce engagement in the Company's long-term vision, future uncertainty around open contracts could be a distraction, affecting employee focus in our business and diverting management’s attention from other projects and issues.
21
We compete against the major U.S. airlines and other businesses for labor in many highly skilled positions. If we are unable to hire, train and retain qualified employees at a reasonable cost, sustain employee engagement in the Company's strategic vision, or if we are unsuccessful at implementing succession plans for our key staff, we may be unable to grow or sustain our business. In recent years, there have been pilot shortages in the regional market. Attrition beyond normal levels could negatively impact our operating results and our business prospects could be harmed.
|
|
None
|
|
AIRCRAFT
The following table describes the aircraft we operate and their average age at
December 31, 2014
:
|
Aircraft Type
|
Seats
|
Owned
|
Leased
|
Total
|
Average
Age in
Years
|
||||||||
|
B737 Freighters & Combis
|
0/72
|
6
|
|
—
|
|
6
|
|
21.2
|
|
||||
|
B737-400/700
|
144/124
|
17
|
|
18
|
|
35
|
|
16.9
|
|
||||
|
B737-800/900/900ER
|
163/181/181
|
86
|
|
10
|
|
96
|
|
6.1
|
|
||||
|
Total Mainline Fleet
|
109
|
|
28
|
|
137
|
|
9.5
|
|
|||||
|
Q400
|
76
|
36
|
|
15
|
|
51
|
|
8.1
|
|
||||
|
CRJ-700
(a)
|
70
|
2
|
|
6
|
|
8
|
|
12.3
|
|
||||
|
Total Regional Fleet
|
38
|
|
21
|
|
59
|
|
8.7
|
|
|||||
|
Total
|
147
|
|
49
|
|
196
|
|
9.3
|
|
|||||
|
(a)
|
We also have eight leased CRJ-700s currently subleased to a third party to be operated for other carriers.
|
“Management’s Discussion and Analysis of Financial Condition and Results of Operations" discusses future orders and options for additional aircraft.
71
of our owned aircraft secure long-term debt arrangements or collateralize our revolving credit facility. See further discussion in “Liquidity and Capital Resources."
Alaska’s leased B737 aircraft have lease expiration dates between
2015
and
2022
. Horizon’s leased Q400 aircraft have expiration dates in
2018
, and the leases on the
14
CRJ-700 aircraft have expiration dates between
2018
and
2020
. Alaska and Horizon have the option to extend most of the leases for additional periods, or the right to purchase the aircraft at the end of the lease term, usually at the then-fair-market value of the aircraft.
GROUND FACILITIES AND SERVICES
We own terminal buildings in various cities in the state of Alaska and several buildings located at or near Seattle-Tacoma International Airport (Sea-Tac) near Seattle, WA. These include a multi-bay hangar and shops complex (used primarily for line maintenance), a flight operations and training center, an air cargo facility, an information technology office and datacenter, and various other commercial office buildings.
We lease ticket counters, gates, cargo and baggage space, ground equipment, office space, and other support areas at the majority of the airports they serve. We also lease operations, training, and aircraft maintenance facilities in Portland and Spokane, as well as line maintenance stations in Boise, Bellingham, Eugene, San Jose, Medford, Redmond, Seattle, and Spokane. Further, we lease call center facilities in Phoenix, AZ and Boise, ID.
22
|
|
We are a party to routine litigation matters incidental to our business. Management believes the ultimate disposition of these matters is not likely to materially affect our financial position or results of operations. This forward-looking statement is based on management’s current understanding of the relevant law and facts, and it is subject to various contingencies, including the potential costs and risks associated with litigation and the actions of judges and juries.
|
|
Not applicable.
|
|
As of
December 31, 2014
, there were
131,556,573
shares of common stock of Alaska Air Group, Inc. issued and
131,481,473
shares outstanding and
2,555
shareholders of record. In
2014
, we paid quarterly dividends of
$0.125
per share in March, June, September, and December. Our common stock is listed on the New York Stock Exchange (symbol: ALK). The following table shows the trading range of Alaska Air Group, Inc. common stock on the New York Stock Exchange:
|
|
2014
|
2013
|
|||||||||||||
|
|
High
|
Low
|
High
|
Low
|
|||||||||||
|
First Quarter
|
$
|
46.66
|
|
$
|
36.48
|
|
$
|
31.98
|
|
$
|
21.97
|
|
|||
|
Second Quarter
|
50.04
|
|
44.56
|
|
33.74
|
|
25.21
|
|
|||||||
|
Third Quarter
|
49.64
|
|
42.60
|
|
32.11
|
|
25.83
|
|
|||||||
|
Fourth Quarter
|
59.77
|
|
41.49
|
|
39.10
|
|
30.59
|
|
|||||||
SALES OF NON-REGISTERED SECURITIES
None
PURCHASES OF EQUITY SECURITIES BY THE ISSUER AND AFFILIATED PURCHASERS
|
Total Number of
Shares Purchased
|
Average Price
Paid per Share
|
Total Number of Shares (or units) Purchased as Part of Publicly Announced Plans or Programs
|
Maximum remaining
dollar value of shares
that can be purchased
under the plan
(in millions)
|
||||||||||
|
October 1, 2014 – October 31, 2014
|
853,906
|
|
$
|
45.81
|
|
853,906
|
|
||||||
|
November 1, 2014 – November 30, 2014
|
584,947
|
|
55.58
|
|
584,947
|
|
|||||||
|
December 1, 2014 – December 31, 2014
|
619,851
|
|
57.08
|
|
619,851
|
|
|||||||
|
Total
|
2,058,704
|
|
$
|
52.82
|
|
2,058,704
|
|
$
|
384
|
|
|||
Purchased pursuant to a
$650 million
repurchase plan authorized by the Board of Directors in
May 2014
.
23
PERFORMANCE GRAPH
The following graph compares our cumulative total stockholder return since
December 31, 2009
with the S&P 500 Index and the Dow Jones U.S. Airlines Index. The graph assumes that the value of the investment in our common stock and each index (including reinvestment of dividends) was $100 on
December 31, 2009
.
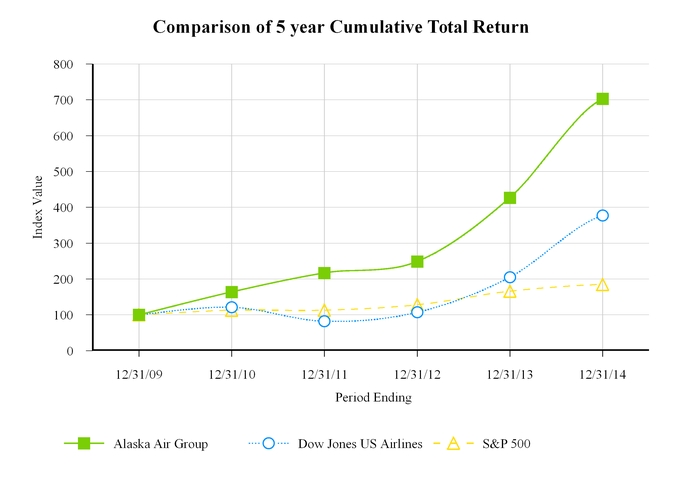
24
|
|
|||||||||||||||||||
|
2014
|
2013
|
2012
|
2011
|
2010
|
|||||||||||||||
|
CONSOLIDATED OPERATING RESULTS
(audited)
|
|
|
|
|
|
|
|
|
|
||||||||||
|
Year Ended December 31 (in millions, except per-share amounts):
|
|
|
|
|
|
|
|
|
|
||||||||||
|
Operating Revenues
(a)
|
$
|
5,368
|
|
|
$
|
5,156
|
|
|
$
|
4,657
|
|
|
$
|
4,318
|
|
$
|
3,832
|
|
|
|
Operating Expenses
|
4,406
|
|
|
4,318
|
|
|
4,125
|
|
|
3,869
|
|
3,361
|
|
||||||
|
Operating Income
|
962
|
|
|
838
|
|
|
532
|
|
|
449
|
|
471
|
|
||||||
|
Nonoperating income (expense), net of interest capitalized
(b)
|
13
|
|
(22
|
)
|
(18
|
)
|
(55
|
)
|
(65
|
)
|
|||||||||
|
Income before income tax
|
975
|
|
|
816
|
|
|
514
|
|
|
394
|
|
406
|
|
||||||
|
Net Income
|
$
|
605
|
|
|
$
|
508
|
|
|
$
|
316
|
|
|
$
|
245
|
|
$
|
251
|
|
|
|
Average basic shares outstanding
|
135.445
|
|
|
139.910
|
|
|
141.416
|
|
|
143.510
|
|
143.288
|
|
||||||
|
Average diluted shares outstanding
|
136.801
|
|
|
141.878
|
|
|
143.568
|
|
|
146.842
|
|
147.142
|
|
||||||
|
Basic earnings per share
|
4.47
|
|
|
3.63
|
|
|
2.23
|
|
|
1.71
|
|
1.75
|
|
||||||
|
Diluted earnings per share
|
4.42
|
|
|
3.58
|
|
|
2.20
|
|
|
1.66
|
|
1.71
|
|
||||||
|
Cash dividend declared per share
|
$
|
0.50
|
|
0.20
|
|
—
|
|
—
|
|
—
|
|
||||||||
|
CONSOLIDATED FINANCIAL POSITION
(audited)
|
|
|
|
|
|
|
|
|
|
|
|
|
|
||||||
|
At End of Period (in millions):
|
|
|
|
|
|
|
|
|
|
|
|
|
|
||||||
|
Total assets
|
6,181
|
|
|
5,838
|
|
|
5,505
|
|
|
5,167
|
|
5,017
|
|
||||||
|
Long-term debt, including current portion
|
803
|
|
|
871
|
|
|
1,032
|
|
|
1,307
|
|
1,534
|
|
||||||
|
Shareholders' equity
|
2,127
|
|
|
2,029
|
|
|
1,421
|
|
|
1,174
|
|
1,106
|
|
||||||
|
OPERATING STATISTICS
(unaudited)
|
|
|
|
|
|
|
|
|
|
|
|
|
|
|
|||||
|
Consolidated:
(c)
|
|||||||||||||||||||
|
Revenue passengers (000)
|
29,278
|
|
|
27,414
|
|
25,896
|
|
24,790
|
|
23,334
|
|
||||||||
|
Revenue passenger miles (RPM) (000,000) "traffic"
|
30,718
|
|
|
28,833
|
|
27,007
|
|
25,032
|
|
22,841
|
|
||||||||
|
Available seat miles (ASM) (000,000) "capacity"
|
36,078
|
|
|
33,672
|
|
31,428
|
|
29,627
|
|
27,736
|
|
||||||||
|
Load factor
|
85.1
|
%
|
85.6
|
%
|
85.9
|
%
|
84.5
|
%
|
82.4
|
%
|
|||||||||
|
Yield
|
|
14.91
|
¢
|
|
14.80
|
¢
|
|
14.92
|
¢
|
|
14.81
|
¢
|
|
14.30
|
¢
|
||||
|
Passenger revenues per ASM (PRASM)
|
|
12.69
|
¢
|
|
12.67
|
¢
|
|
12.82
|
¢
|
|
12.51
|
¢
|
|
11.78
|
¢
|
||||
|
Operating revenues per ASM (RASM)
(d)
|
|
14.88
|
¢
|
|
14.74
|
¢
|
|
14.82
|
¢
|
|
14.57
|
¢
|
|
13.82
|
¢
|
||||
|
Operating expenses per ASM, excluding fuel and noted items (CASMex)
(d)
|
|
8.36
|
¢
|
|
8.47
|
¢
|
|
8.48
|
¢
|
|
8.55
|
¢
|
|
8.82
|
¢
|
||||
|
Mainline:
|
|||||||||||||||||||
|
Revenue passengers (000)
|
20,972
|
|
19,737
|
|
18,526
|
|
17,810
|
|
16,514
|
|
|||||||||
|
RPMs (000,000) "traffic"
|
27,778
|
|
26,172
|
|
24,417
|
|
22,586
|
|
20,350
|
|
|||||||||
|
ASMs (000,000) "capacity"
|
32,430
|
|
30,411
|
|
28,180
|
|
26,517
|
|
24,434
|
|
|||||||||
|
Load factor
|
85.7
|
%
|
86.1
|
%
|
86.6
|
%
|
85.2
|
%
|
83.3
|
%
|
|||||||||
|
Yield
|
|
13.58
|
¢
|
|
13.33
|
¢
|
|
13.45
|
¢
|
|
13.26
|
¢
|
|
12.75
|
¢
|
||||
|
PRASM
|
|
11.64
|
¢
|
|
11.48
|
¢
|
|
11.65
|
¢
|
|
11.29
|
¢
|
|
10.62
|
¢
|
||||
|
CASMex
(d)
|
|
7.45
|
¢
|
|
7.54
|
¢
|
|
7.56
|
¢
|
|
7.60
|
¢
|
|
7.85
|
¢
|
||||
|
Regional:
|
|||||||||||||||||||
|
Revenue passengers (000)
|
8,306
|
|
7,677
|
|
7,371
|
|
6,980
|
|
6,820
|
|
|||||||||
|
RPMs (000,000) "traffic"
|
2,940
|
|
2,661
|
|
2,590
|
|
2,446
|
|
2,491
|
|
|||||||||
|
ASMs (000,000) "capacity"
|
3,648
|
|
3,261
|
|
3,247
|
|
3,110
|
|
3,302
|
|
|||||||||
|
Load factor
|
80.6
|
%
|
81.6
|
%
|
79.8
|
%
|
78.6
|
%
|
75.4
|
%
|
|||||||||
|
Yield
|
|
27.40
|
¢
|
|
29.20
|
¢
|
|
28.81
|
¢
|
|
29.13
|
¢
|
|
26.95
|
¢
|
||||
|
PRASM
|
|
22.08
|
¢
|
|
23.83
|
¢
|
|
22.98
|
¢
|
|
22.94
|
¢
|
|
20.33
|
¢
|
||||
|
(a)
|
In the third quarter of
2013
, the Company adopted Accounting Standards Update 2009-13, "Multiple-Deliverable Revenue Arrangements - a consensus of the FASB Emerging Issues Task Force" (ASU 2009-13).
|
|
(b)
|
Capitalized interest was
$20 million
,
$21 million
,
$18 million
,
$12 million
, and
$6 million
for
2014
,
2013
,
2012
,
2011
, and
2010
, respectively.
|
|
(c)
|
Includes flights under Capacity Purchase Agreements operated by PenAir and by SkyWest beginning in May 2011.
|
|
(d)
|
See reconciliation of RASM and CASMex to the most directly related GAAP measure in the "Results of Operations" section.
|
25
|
|
OVERVIEW
The following Management’s Discussion and Analysis of Financial Condition and Results of Operations (MD&A) is intended to help the reader understand the Company, our operations and our present business environment. MD&A is provided as a supplement to – and should be read in conjunction with – our consolidated financial statements and the accompanying notes. All statements in the following discussion that are not statements of historical information or descriptions of current accounting policy are forward-looking statements. Please consider our forward-looking statements in light of the risks referred to in this report’s introductory cautionary note and the risks mentioned in Part I, “Item 1A. Risk Factors.” This overview summarizes the MD&A, which includes the following sections:
|
•
|
Year in Review
—highlights from
2014
outlining some of the major events that happened during the year and how they affected our financial performance.
|
|
•
|
Results of Operations
—an in-depth analysis of our revenues by segment and our expenses from a consolidated perspective for the three years presented in our consolidated financial statements. To the extent material to the understanding of segment profitability, we more fully describe the segment expenses per financial statement line item. We believe this analysis will help the reader better understand our consolidated statements of operations. Financial and statistical data is also included here. This section also includes forward-looking statements regarding our view of
2015
.
|
|
•
|
Liquidity and Capital Resources
—an analysis of cash flows, sources and uses of cash, contractual obligations, commitments and off-balance sheet arrangements, and an overview of financial position.
|
|
•
|
Critical Accounting Estimates
—a discussion of our accounting estimates that involve significant judgment and uncertainties.
|
YEAR IN REVIEW
Our
2014
consolidated pretax income was
$975 million
compared to
$816 million
in
2013
. The
$159 million
improvement was primarily due to the net increase of
$212 million
in revenues, a decrease of $49 million in our fuel expense, and $13 million in non-operating income compared to a non-operating loss of $22 million in the prior year. Partially offsetting these benefits was an increase in non-fuel operating expenses of
$167 million
, or
6%
, to support the increased capacity of
7%
.
The growth in revenues of
$212 million
was primarily due to an increase in passenger revenue of
$312 million
resulting from a
6.5%
increase in traffic and
0.7%
higher ticket yields, partially offset by a special mileage plan revenue item of $192 million resulting from the adoption of new accounting standards in the prior year. The increase in operating expenses was primarily due to increases in wages and benefits, contracted services and depreciation expense as we expanded our fleet and entered into new markets where we almost exclusively use vendors for our station operations.
See “Results of Operations” below for further discussion of changes in revenues and operating expenses and our reconciliation of Non-GAAP measures to the most directly comparable GAAP measure.
Accomplishments and Highlights
Financial highlights from
2014
include:
|
•
|
Reported record full-year net income, excluding special items, of
$571 million
, or
$4.18
per diluted share, compared to
$383 million
, or
$2.70
per diluted share in
2013
.
|
|
•
|
Reported net income for the full year under GAAP of
$605 million
, or
$4.42
per diluted share, compared to net income of
$508 million
, or
$3.58
per diluted share in
2013
.
|
|
•
|
Declared a $0.20 per share dividend, up 60% from the prior quarter. The dividend will be paid on March 10, to shareholders of record as of February 24, 2015.
|
|
•
|
Paid
$0.125
per-share quarterly cash dividend on December 3, bringing total dividend payments in
2014
to
$68 million
.
|
26
|
•
|
Repurchased
7,316,731
shares of common stock for an average price of $47.23 during
2014
for
$348 million
, or 6.9% of market capitalization at the beginning of
2014
. Since 2007, Air Group has used
$827 million
to repurchase
49 million
shares at an average price of $16.85.
|
|
•
|
Grew passenger revenues by
8%
compared to the
fourth
quarter of
2013
, and by
7%
compared to full-year
2013
.
|
|
•
|
Generated record full-year adjusted pretax margin of
17.2%
in 2014 compared to
12.4%
in
2013
.
|
|
•
|
Achieved return on invested capital of
18.6%
in
2014
, compared to
13.6%
in
2013
.
|
|
•
|
Generated over
$1.0 billion
in operating cash flows and
$336 million
in free cash flows in
2014
.
|
|
•
|
Lowered adjusted debt-to-total capitalization ratio to
31%
as of
December 31, 2014
.
|
|
•
|
Held
$1.2 billion
in unrestricted cash and marketable securities as of
December 31, 2014
.
|
|
•
|
Became one of only two U.S. airlines with investment grade credit ratings.
|
|
•
|
Named "Top Dividend Stock of the Dow Transports" at Dividend Channel with 1.2% yield.
|
Year-to-date highlights of Alaska Air Group's five-year strategic plan:
Safety & Compliance
|
•
|
Launched Ready, Safe, Go safety campaign designed to increase safety awareness across the Air Group System.
|
People Focus
|
•
|
Awarded a record
$116 million
in incentive pay to employees for
2014
, or more than one month's pay for most employees. Over the last five years, employees have earned more than
$473 million
in incentive pay, averaging 8.7% of annual pay.
|
|
•
|
Signed a five-year agreement with Alaska Airline's Flight Attendants in December 2014.
|
|
•
|
Signed a six-year contract with Horizon's aircraft technicians and fleet service agents in June 2014.
|
|
•
|
Signed a five-year contract with Alaska's clerical, office, and passenger service employees in April 2014.
|
|
•
|
Signed a four-year contract with Horizon's dispatchers in April 2014.
|
|
•
|
Completed "Gear Up" - an intensive leadership workshop for over 1,200 leaders at Alaska and Horizon.
|
Hassle-free Customer Experience
|
•
|
Ranked "Highest in Customer Satisfaction Among Traditional Network Carriers" by J.D. Power and Associates for the seventh year in a row.
|
|
•
|
Ranked as the best airline in the U.S. by The Wall Street Journal's "Middle Seat" scorecard for two consecutive years.
|
|
•
|
Ranked highest by frequent fliers in the first-ever J.D. Power Airline Loyalty/Rewards Program Satisfaction Report.
|
|
•
|
Held the top spot in U.S. Department of Transportation on-time performance among largest eight U.S. airlines for the twelve months ended November 2014.
|
|
•
|
Named No. 1 on-time carrier in North America for the fifth year in a row by FlightStats in January 2015.
|
|
•
|
Launched online self-tag baggage options for passengers flying from Seattle to San Diego, Anchorage, and Juneau.
|
|
•
|
Became the launch customer of Boeing's new, innovative, high-capacity 737 Space Bins, which will increase bag capacity in the cabin by 48%.
|
Energetic & Compelling Brand
|
•
|
Launched Alaska Beyond™ in-flight experience featuring gourmet Tom Douglas signature meals, new streaming in-flight entertainment, and power at every seat on our 737-800/900/900ER aircraft.
|
|
•
|
Received the 2014 Community Impact Award from Seattle Business Magazine.
|
|
•
|
Celebrated the opening of the Alaska Airlines Center sports complex at the University of Alaska Anchorage.
|
27
|
•
|
Committed over $7 million to support local communities, including job training for workers at the Seattle-Tacoma airport, STEM-focused education programs at Seattle's Museum of Flight, and Seattle's new bicycle sharing program.
|
|
•
|
Flew 13 relief flights to Los Cabos, Loreto, and Mazatlan, Mexico and transported approximately 2,000 passengers to safety following Hurricane Odile.
|
Low Fares, Low Costs, and Network Growth
|
•
|
Delivered ten additional Boeing 737-900ERs, which will further strengthen Alaska's fuel-efficient fleet.
|
|
•
|
Exercised options for two Q400 aircraft to be delivered in 2017, and ordered an additional Q400.
|
|
•
|
Added new Recaro seats and power at every seat for 95 aircraft.
|
|
•
|
Increased fuel efficiency (as measured by seat-miles per gallon) by
2.1%
over
2013
.
|
|
•
|
Added split-scimitar winglets to 48 planned aircraft, which are expected to improve fuel efficiency by 1.5% per aircraft.
|
|
•
|
Lowered unit costs excluding fuel and special items for the fifth consecutive year, to the lowest level ever.
|
|
•
|
Grew Seattle departures by 4% in 2014 and expect to grow Seattle departures by 10% in 2015.
|
|
•
|
New routes launched and announced in
2014
are as follows:
|
|
New Non-Stop Routes (Launched)
|
Frequency
|
Start Date
|
|
Salt Lake City to Portland
|
2x Daily
|
6/9/2014
|
|
Salt Lake City to San Diego
|
2x Daily
|
6/10/2014
|
|
Salt Lake City to Los Angeles
|
Daily
|
6/11/2014
|
|
Salt Lake City to San Jose
|
Daily
|
6/12/2014
|
|
Salt Lake City to Boise
|
Daily
|
6/16/2014
|
|
Salt Lake City to Las Vegas
|
2x Daily
|
6/16/2014
|
|
Salt Lake City to San Francisco
|
Daily
|
6/18/2014
|
|
Portland to Kalispell
|
Daily, Seasonal
|
6/9/2014
|
|
Seattle to New Orleans
|
Daily
|
6/12/2014
|
|
Seattle to Tampa
|
Daily
|
6/20/2014
|
|
Seattle to Baltimore
|
Daily
|
9/2/2014
|
|
Seattle to Detroit
|
Daily
|
9/4/2014
|
|
Seattle to Albuquerque
|
Daily
|
9/18/2014
|
|
Portland to Puerto Vallarta, Mexico
|
3x Weekly (Seasonal)
|
11/4/2014
|
|
Seattle to Cancun, Mexico
|
Daily (Seasonal0
|
11/6/2014
|
|
Portland to Los Cabos, Mexico
|
4x Weekly (Seasonal)
|
11/20/2014
|
|
New Non-Stop Routes (Announced)
|
Frequency
|
Start Date
|
|
Las Vegas to Mammoth Lakes
|
2x Weekly (Seasonal)
|
1/15/2015
|
|
San Diego to Kona
|
3x Weekly
|
3/5/2015
|
|
Seattle to Washington D.C. (Dulles)
|
Daily
|
3/11/2015
|
|
Seattle to Milwaukee
|
Daily
|
7/1/2015
|
|
Seattle to Oklahoma City
|
Daily
|
7/1/2015
|
|
Portland to St. Louis
|
Daily
|
7/1/2015
|
Capital Allocation
In
2014
, we repurchased
7,316,731
shares of our common stock for
$348 million
under the share repurchase programs authorized by our Board of Directors. Since 2007, we have repurchased
49 million
shares of common stock under such programs for
$827 million
for an average price of approximately
$17
per share. In
2014
, we increased our quarterly dividend 25% from $0.10 per share to $0.125 per share, and subsequent to
December 31, 2014
, we announced a 60% increase to $0.20 per share. Overall, we returned $416 million to shareholders during 2014 and expect to exceed that amount in 2015.
28
Outlook
Our primary focus every year is to run safe, compliant and reliable operations at our airlines. In addition to our primary objective, we will remain focused on providing a hassle-free experience for our customers, and building a compelling brand to support network growth. Specifically, we will continue to improve our in-flight experience with our Alaska Beyond™ in-flight experience featuring Tom Douglas signature meals, new streaming in-flight entertainment, comfortable Recaro seats with power at every seat, and our award-winning customer service.
Currently, we see strong demand for 2015, and because of our strong balance sheet and the structure of our fleet, we will flex our fleet to meet demand and allocate capacity in the markets that meet our return objectives. This includes our expectation to grow departures out of Seattle by 10% in 2015. Additionally, competitive capacity is expected to be 15% higher in the first quarter and 12% higher in 2015 based on current schedules. We expect Delta Air Lines, our largest direct competitor, to increase its overlapping capacity from 41% in 2014 to 50% in 2015.
Long-term, we plan to vigorously defend our markets through great customer service, Mileage Plan™ promotions, schedule changes, community events, and additional advertising efforts. We will also continue to focus on lowering unit costs so that we can compete more effectively. Furthermore, the significant decline in fuel prices over the past several months improves our financial outlook as fuel is one of our largest operating expenses.
Given our current fleet plan, we expect capacity to increase approximately 11% in the first quarter of 2015 and between 9% and 10% for the full-year 2015.
RESULTS
OF OPERATIONS
2014
COMPARED WITH
2013
Our consolidated net income for
2014
was
$605 million
, or
$4.42
per diluted share, compared to net income of
$508 million
, or
$3.58
per diluted share, in
2013
. Significant items impacting the comparability between the periods are as follows:
|
•
|
Both periods include adjustments to reflect the timing of net unrealized mark-to-market gains or losses related to our fuel hedge positions. For
2014
, we recognized net mark-to-market adjustments of
$23 million
(
$15 million
after tax, or
$0.11
per diluted share) compared to gains of
$8 million
(
$5 million
after tax, or
$0.03
per share) in
2013
.
|
|
•
|
In
2014
, we recognized a one-time, non-cash benefit from the curtailment of certain post-retirement benefit plans of
$20 million
and a one-time gain associated with the settlement of a legal matter of
$10 million
. The aggregate $30 million (
$19 million
in aggregate after tax, or
$0.13
per diluted share) is included in Special items in the consolidated statement of operations.
|
|
•
|
In
2013
, we recognized a one-time, non-cash Special mileage plan revenue item of
$192 million
(
$120 million
after tax, or
$0.85
per diluted share) that resulted from the application of new accounting rules associated with the modified Bank of America Affinity Card Agreement, and the effect of an increase in the estimate of the number of frequent flier miles expected to expire unused.
|
ADJUSTED (NON-GAAP) RESULTS AND
PER-SHARE AMOUNTS
We believe disclosure of earnings excluding the impact of mark-to-market gains or losses or other individual revenues or expenses is useful information to investors because:
|
•
|
We believe it is the basis by which we are evaluated by industry analysts;
|
|
•
|
By eliminating fuel expense and certain special items from our unit metrics, we believe that we have better visibility into the results of our non-fuel continuing operations. Our industry is highly competitive and is characterized by high fixed costs, so even a small reduction in non-fuel operating costs can result in a significant improvement in operating results. In addition, we believe that all domestic carriers are similarly impacted by changes in jet fuel costs over the long run, so it is important for management (and thus investors) to understand the impact of (and trends in) company-specific cost drivers such as labor rates and productivity, airport costs, maintenance costs, etc., which are more controllable by management;
|
29
|
•
|
Prior year Operating revenue per ASM (RASM) excludes a favorable, one-time, non-cash Special mileage plan revenue item of $192 million primarily related to our modified affinity card agreement with Bank of America, executed in July 2013. In accordance with accounting standards, we recorded this item in the third quarter of 2013, and it reflects a non-cash adjustment of the value of miles outstanding in the program. We believe it is appropriate to exclude this special revenue item from recurring revenues from operations;
|
|
•
|
CASM excluding fuel and special items is one of the most important measures used by management and by the
|
Air Group Board of Directors in assessing quarterly and annual cost performance;
|
•
|
Our results excluding fuel expense and special items serve as the basis for our various employee incentive plans, thus the information allows investors to better understand the changes in variable incentive pay expense in our consolidated statements of operations; and
|
|
•
|
It is useful to monitor performance without these items as it improves a reader’s ability to compare our results to those of other airlines.
|
Although we are presenting these non-GAAP amounts for the reasons above, investors and other readers should not necessarily conclude that these amounts are non-recurring, infrequent, or unusual in nature.
Excluding the impact of mark-to-market fuel hedge adjustments, special items, and the one-time Special mileage plan revenue item, our adjusted consolidated net income for
2014
was
$571 million
, or
$4.18
per diluted share, compared to an adjusted consolidated net income of
$383 million
, or
$2.70
per share, in
2013
.
|
|
Twelve Months Ended December 31,
|
||||||||||||||
|
|
2014
|
2013
|
|||||||||||||
|
(in millions, except per-share amounts)
|
Dollars
|
Diluted EPS
|
Dollars
|
Diluted EPS
|
|||||||||||
|
Net income and diluted EPS as reported
|
$
|
605
|
|
$
|
4.42
|
|
$
|
508
|
|
$
|
3.58
|
|
|||
|
Mark-to-market fuel hedge adjustments, net of tax
|
(15
|
)
|
(0.11
|
)
|
(5
|
)
|
(0.03
|
)
|
|||||||
|
Special items, net of tax
|
(19
|
)
|
(0.14
|
)
|
—
|
|
—
|
|
|||||||
|
Special mileage plan revenue, net of tax
|
—
|
|
—
|
|
(120
|
)
|
(0.85
|
)
|
|||||||
|
Non-GAAP adjusted income and per-share amounts
|
$
|
571
|
|
$
|
4.18
|
|
$
|
383
|
|
$
|
2.70
|
|
|||
Revenues adjusted for the one-time Special mileage plan item are as follows:
|
Twelve Months Ended December 31,
|
|||||||||
|
2014
|
2013
|
% Change
|
|||||||
|
Total operating revenues
|
$
|
5,368
|
|
$
|
5,156
|
|
4.1
|
||
|
Less: Special mileage plan revenue
|
—
|
|
192
|
|
NM
|
||||
|
Adjusted Revenue
|
$
|
5,368
|
|
$
|
4,964
|
|
8.1
|
||
|
Consolidated ASMs
|
36,078
|
|
|
33,672
|
|
7.1
|
|||
|
RASM
|
|
14.88
|
¢
|
|
14.74
|
¢
|
0.9
|
||
NM - Not Meaningful
30
Our operating costs per ASM (CASM) are summarized below:
|
|
Twelve Months Ended December 31,
|
|||||||||
|
|
2014
|
|
2013
|
|
% Change
|
|||||
|
Consolidated:
|
||||||||||
|
Total operating expenses per ASM (CASM)
|
|
12.21
|
¢
|
|
12.82
|
¢
|
(4.8
|
)
|
||
|
Less the following components:
|
|
|
|
|
||||||
|
Aircraft fuel, including hedging gains and losses
|
3.93
|
|
4.35
|
|
(9.7
|
)
|
||||
|
Special items
|
(0.08
|
)
|
—
|
|
NM
|
|
||||
|
CASM, excluding fuel and fleet transition costs
|
|
8.36
|
¢
|
|
8.47
|
¢
|
(1.3
|
)
|
||
|
|
|
|||||||||
|
Mainline:
|
||||||||||
|
Total mainline operating expenses per ASM (CASM)
|
|
11.15
|
¢
|
|
11.77
|
¢
|
(5.3
|
)
|
||
|
Less the following components:
|
|
|
|
|
||||||
|
Aircraft fuel, including hedging gains and losses
|
3.79
|
|
4.23
|
|
(10.4
|
)
|
||||
|
Special items
|
(0.09
|
)
|
—
|
|
NM
|
|
||||
|
CASM, excluding fuel
|
|
7.45
|
¢
|
|
7.54
|
¢
|
(1.2
|
)
|
||
NM - Not meaningful
31
OPERATING STATISTICS SUMMARY (unaudited)
Alaska Air Group, Inc.
Below are operating statistics we use to measure performance. We often refer to unit revenues and adjusted unit costs, which is a non-GAAP measure.
|
Twelve Months Ended December 31,
|
|||||||||
|
2014
|
2013
|
Change
|
2012
|
Change
|
|||||
|
Consolidated Operating Statistics:
(a)
|
|||||||||
|
Revenue passengers (000)
|
29,278
|
27,414
|
6.8%
|
25,896
|
5.9%
|
||||
|
RPMs (000,000) "traffic"
|
30,718
|
28,833
|
6.5%
|
27,007
|
6.8%
|
||||
|
ASMs (000,000) "capacity"
|
36,078
|
33,672
|
7.1%
|
31,428
|
7.1%
|
||||
|
Load factor
|
85.1%
|
85.6%
|
(0.5) pts
|
85.9%
|
(0.3) pts
|
||||
|
Yield
|
14.91¢
|
14.80¢
|
0.7%
|
14.92¢
|
(0.8)%
|
||||
|
PRASM
|
12.69¢
|
12.67¢
|
0.2%
|
12.82¢
|
(1.2)%
|
||||
|
RASM
(b)
|
14.88¢
|
14.74¢
|
0.9%
|
14.82¢
|
(0.5)%
|
||||
|
CASM excluding fuel and fleet transition costs
(b)
|
8.36¢
|
8.47¢
|
(1.3)%
|
8.48¢
|
(0.1)%
|
||||
|
Economic fuel cost per gallon
(b)
|
$3.08
|
$3.30
|
(6.7)%
|
$3.37
|
(2.1)%
|
||||
|
Fuel gallons (000,000)
|
469
|
447
|
4.9%
|
422
|
5.9%
|
||||
|
ASM's per gallon
|
76.9
|
75.3
|
2.1%
|
74.5
|
1.1%
|
||||
|
Average number of full-time equivalent employees (FTEs)
|
12,739
|
12,163
|
4.7%
|
11,955
|
1.7%
|
||||
|
Mainline Operating Statistics:
|
|||||||||
|
Revenue passengers (000)
|
20,972
|
19,737
|
6.3%
|
18,526
|
6.5%
|
||||
|
RPMs (000,000) "traffic"
|
27,778
|
26,172
|
6.1%
|
24,417
|
7.2%
|
||||
|
ASMs (000,000) "capacity"
|
32,430
|
30,411
|
6.6%
|
28,180
|
7.9%
|
||||
|
Load factor
|
85.7%
|
86.1%
|
(0.4) pts
|
86.6%
|
(0.5) pts
|
||||
|
Yield
|
13.58¢
|
13.33¢
|
1.9%
|
13.45¢
|
(0.9)%
|
||||
|
PRASM
|
11.64¢
|
11.48¢
|
1.4%
|
11.65¢
|
(1.5)%
|
||||
|
CASM excluding fuel
(b)
|
7.45¢
|
7.54¢
|
(1.2)%
|
7.56¢
|
(0.3)%
|
||||
|
Economic fuel cost per gallon
(b)
|
$3.07
|
$3.30
|
(7.0)%
|
$3.36
|
(1.8)%
|
||||
|
Fuel gallons (000,000)
|
407
|
393
|
3.6%
|
368
|
6.8%
|
||||
|
ASM's per gallon
|
79.7
|
77.4
|
3.0%
|
76.6
|
1.0%
|
||||
|
Average number of FTE's
|
9,910
|
9,493
|
4.4%
|
9,178
|
3.4%
|
||||
|
Aircraft utilization
|
10.5
|
10.6
|
(0.9)%
|
10.7
|
(0.9)%
|
||||
|
Average aircraft stage length
|
1,182
|
1,177
|
0.4%
|
1,161
|
1.4%
|
||||
|
Mainline operating fleet at period-end
|
137 a/c
|
131 a/c
|
6 a/c
|
124 a/c
|
7 a/c
|
||||
|
Regional Operating Statistics:
(c)
|
|||||||||
|
Revenue passengers (000)
|
8,306
|
7,677
|
8.2%
|
7,371
|
4.2%
|
||||
|
RPMs (000,000) "traffic"
|
2,940
|
2,661
|
10.5%
|
2,590
|
2.7%
|
||||
|
ASMs (000,000) "capacity"
|
3,648
|
3,261
|
11.9%
|
3,247
|
0.4%
|
||||
|
Load factor
|
80.6%
|
81.6%
|
(1.0) pts
|
79.8%
|
1.8 pts
|
||||
|
Yield
|
27.40¢
|
29.20¢
|
(6.2)%
|
28.81¢
|
1.4%
|
||||
|
PRASM
|
22.08¢
|
23.83¢
|
(7.3)%
|
22.98¢
|
3.7%
|
||||
|
(a)
|
Except for FTEs, data includes information related to regional CPA flying with Horizon, SkyWest and PenAir.
|
|
(b)
|
See reconciliation of this measure to the most directly related GAAP measure in the "Results of Operations" section.
|
|
(c)
|
Data presented includes information related to regional CPAs.
|
32
OPERATING REVENUES
Total operating revenues
increased
$212 million
, or
4%
, during
2014
compared to the same period in
2013
. Adjusted for the Special mileage plan revenue item recognized in 2013, operating revenues increased
$404 million
, or
8%
during 2014. The changes are summarized in the following table:
|
|
Twelve Months Ended December 31,
|
||||||||
|
(in millions)
|
2014
|
2013
|
% Change
|
||||||
|
Passenger
|
|||||||||
|
Mainline
|
$
|
3,774
|
|
$
|
3,490
|
|
8
|
||
|
Regional
|
805
|
|
777
|
|
4
|
||||
|
Total passenger revenue
|
$
|
4,579
|
|
$
|
4,267
|
|
7
|
||
|
Freight and mail
|
114
|
|
113
|
|
1
|
||||
|
Other - net
|
675
|
|
584
|
|
16
|
||||
|
Special mileage plan revenue
|
—
|
|
192
|
|
NM
|
||||
|
Total operating revenues
|
$
|
5,368
|
|
$
|
5,156
|
|
4
|
||
NM - Not meaningful
Passenger Revenue – Mainline
Mainline passenger revenue for
2014
increased
by
8%
on a
6.6%
increase
in capacity and a
1.4%
increase
in PRASM compared to
2013
. The increase in capacity was driven by new routes, seats added to our existing fleet as part of our cabin improvement project, and delivery of 10 737-900ERs in
2014
. The
increase
in PRASM was driven by a
1.9%
increase
in ticket yield, partially offset by a
0.4 point
decrease
in load factor compared to the prior year. Increase in yield was due to reallocation of capacity to markets with stronger demand and by a change in revenue allocation between Mainline and Regional service because of certain industry pricing changes. Without the industry change, Mainline yields would have increased by 0.9%.
We expect competitive pressures on unit revenues to continue into 2015. However, we expect total passenger revenue to increase with the expected 8% growth in our capacity.
Passenger Revenue – Regional
Regional passenger revenue
increased
by
$28 million
, or
4%
, compared to
2013
on an
11.9%
increase
in capacity, partially offset by a
7.3%
decrease
in PRASM compared to
2013
. The
decrease
in PRASM was due to a
6.2%
decrease
in ticket yield coupled with a
1.0 point
decrease
in load factor compared to the prior year. The decline in yield was driven mostly by a change in revenue allocation between Mainline and Regional service because of certain industry pricing changes. Without the revenue allocation adjustment, yield would have decreased 1.7%. Additionally, the average trip length for our Regional flights increased 3%, which also put downward pressure on yields.
We expect Regional passenger revenue to increase in 2015, primarily due to our expanded capacity purchase agreement with SkyWest to fly E-175 regional aircraft beginning in the third quarter of 2015. These aircraft will offer three booking classes.
Other – Net
Other—net revenue
increased
$91 million
, or
16%
, from
2013
. This is primarily due to an increase in our Mileage Plan™ revenues of
$39 million
or
15%
, due to increase in miles sold and an increase in cash received per mile. Additionally, bag fees and ticket change fees are up 23% and 12%, respectively, due to changes in our fee structure that took effect in November 2013.
We expect our Other—net revenue to increase in 2015 as we provide more product offerings and have more passengers.
Special Mileage Plan Revenue
In 2013, we modified and extended our co-branded credit card agreement with Bank of America Corporation (BAC). In connection with this agreement and as a result of applying related accounting standards, we recorded a one-time, non-cash Special mileage plan revenue item of $192 million primarily related to our revaluation of the deferred revenue liability related to miles previously sold to BAC.
33
OPERATING EXPENSES
Total operating expenses
increased
$88 million
, or
2%
, compared to
2013
, primarily driven by higher non-fuel costs due to increased capacity. We believe it is useful to summarize operating expenses as follows, which is consistent with the way expenses are reported internally and evaluated by management:
|
|
Twelve Months Ended December 31,
|
|||||||||
|
(in millions)
|
2014
|
2013
|
% Change
|
|||||||
|
Fuel expense
|
$
|
1,418
|
|
$
|
1,467
|
|
(3
|
)
|
||
|
Non-fuel expenses
|
3,018
|
|
2,851
|
|
6
|
|
||||
|
Special items
|
(30
|
)
|
—
|
|
NM
|
|
||||
|
Total Operating Expenses
|
$
|
4,406
|
|
$
|
4,318
|
|
2
|
|
||
NM - Not Meaningful
Significant operating expense variances from
2013
are more fully described below.
Wages and Benefits
Wages and benefits
increased
during
2014
by
$50 million
, or
5%
, compared to
2013
. The primary components of wages and benefits are shown in the following table:
|
|
Twelve Months Ended December 31,
|
|||||||||
|
(in millions)
|
2014
|
2013
|
% Change
|
|||||||
|
Wages
|
$
|
862
|
|
$
|
788
|
|
9
|
|
||
|
Medical and other benefits
|
150
|
|
145
|
|
3
|
|
||||
|
Defined contribution plans
|
53
|
|
44
|
|
20
|
|
||||
|
Pension - Defined benefit plans
|
9
|
|
50
|
|
(82
|
)
|
||||
|
Payroll taxes
|
62
|
|
59
|
|
5
|
|
||||
|
Total wages and benefits
|
$
|
1,136
|
|
$
|
1,086
|
|
5
|
|
||
Wages
increased
9%
, primarily due to annualization of new labor contracts that included higher rates, a
4.7%
increase in full-time employee equivalents, and an $8 million signing bonus paid to Alaska's flight attendants in December 2014 when a new collective bargaining agreement was ratified. The increase in FTEs is to support the growth in our business.
Defined contribution plans
increased
20%
due to an increase in the number of employees participating in the plans and an increase in the employer contribution for non-union employees previously in the pension plan.
Pension expense
decreased
82%
, compared to the same period in the prior year. The decline is due to having a lower accumulated loss to amortize as a result of higher plan assets, a higher discount rate at December 31, 2013 compared to December 31, 2012, and the freezing of plan benefits for our non-union employees beginning January 1, 2014.
We expect wages and benefits to be higher in
2015
compared to
2014
on a 3% to 4% increase in FTEs and higher pension expense of approximately $20 million.
Variable Incentive Pay
Variable incentive pay expense
increased
from
$105 million
in
2013
to
$116 million
in
2014
. The increase is due to actual results exceeding our targets for financial and operational performance more so than in the prior year in addition to a higher wage base.
We expect variable incentive pay in
2015
to be lower due to changes to our incentive pay metrics to reflect our improving performance. However, actual amounts could differ based on 2015 performance.
34
Aircraft Fuel
Aircraft fuel expense includes both
raw fuel expense
(as defined below) plus the effect of mark-to-market adjustments to our fuel hedge portfolio included in our consolidated statement of operations as the value of that portfolio increases and decreases. Our aircraft fuel expense is very volatile, even between quarters, because it includes these gains or losses in the value of the underlying instrument as crude oil prices and refining margins increase or decrease.
Raw fuel expense
is defined as the price that we generally pay at the airport, or the “into-plane” price, including taxes and fees. Raw fuel prices are impacted by world oil prices and refining costs, which can vary by region in the U.S.
Raw fuel expense
approximates cash paid to suppliers and does not reflect the effect of our fuel hedges.
Aircraft fuel expense
decreased
$49 million
, or
3%
compared to
2013
. The elements of the change are illustrated in the following table:
|
Twelve Months Ended December 31,
|
|||||||||||||||
|
2014
|
|
2013
|
|||||||||||||
|
(in millions, except for per gallon amounts)
|
Dollars
|
|
Cost/Gal
|
|
Dollars
|
|
Cost/Gal
|
||||||||
|
Raw or "into-plane" fuel cost
|
$
|
1,400
|
|
$
|
2.99
|
|
|
$
|
1,423
|
|
$
|
3.19
|
|
||
|
(Gains) losses on settled hedges
|
41
|
|
0.09
|
|
|
52
|
|
0.11
|
|
||||||
|
Consolidated economic fuel expense
|
$
|
1,441
|
|
$
|
3.08
|
|
|
$
|
1,475
|
|
$
|
3.30
|
|
||
|
Mark-to-market fuel hedge adjustments
|
(23
|
)
|
(0.05
|
)
|
|
(8
|
)
|
(0.02
|
)
|
||||||
|
GAAP fuel expense
|
$
|
1,418
|
|
$
|
3.03
|
|
|
$
|
1,467
|
|
$
|
3.28
|
|
||
|
Fuel gallons
|
469
|
|
|
|
447
|
|
|
||||||||
Fuel gallons consumed increased
4.9%
in line with the increase in departures and capacity, partially offset by a
2.1%
improvement in fuel efficiency as measured by ASMs per gallon.
The raw fuel price per gallon decreased
6.3%
as a result of lower West Coast jet fuel prices. West Coast jet fuel prices are impacted by both the price of crude oil, as well as refining margins associated with the conversion of crude oil to jet fuel. The decrease in raw fuel price per gallon during
2014
was due to a decrease in average crude oil prices of
5.2%
and decrease in refining margins of
15.7%
, as compared to the prior year.
We also evaluate economic fuel expense, which we define as raw fuel expense adjusted for the cash we receive from, or pay to, hedge counterparties for hedges that settle during the period, and for the premium expense that we paid for those contracts. A key difference between aircraft fuel expense and economic fuel expense is the timing of gain or loss recognition on our hedge portfolio. When we refer to economic fuel expense, we include gains and losses only when they are realized for those contracts that were settled during the period based on their original contract terms. We believe this is the best measure of the effect that fuel prices are currently having on our business because it most closely approximates the net cash outflow associated with purchasing fuel for our operations. Accordingly, many industry analysts evaluate our results using this measure, and it is the basis for most internal management reporting and incentive pay plans.
Losses recognized for hedges that settled during the year were
$41 million
in
2014
, compared to losses of
$52 million
in
2013
. These amounts represent the cash received, or paid, net of the premium expense recognized for those hedges.
In the third quarter of
2014
, we discontinued the hedge program for refining margins. We currently expect our economic fuel price per gallon to be approximately
41.0%
lower in the first quarter of
2015
than the
first
quarter of
2014
due to lower West Coast jet fuel prices and the decrease in premium costs related to our fuel hedge program. As both oil prices and refining margins are volatile, we are unable to forecast the full-year cost with any certainty.
Aircraft Maintenance
Aircraft maintenance
decreased
by
$18 million
, or
7%
, compared to the prior year. The decrease is primarily due to a $22 million reduction in our power-by-the-hour (PBH) expense, $11 million in lower lease return costs, and five fewer unscheduled engine checks for our Q400 aircraft. Offsetting these decreases was an $11 million increase in engine maintenance expense primarily related to our 737-400 engines, and slightly higher airframe checks for both our 737 and Q400 fleet.
The decrease in our PBH expense is due to fewer engines covered by the contracts in the current year, along with reduced flying on the engines that are still under the current contract. The decrease is return costs is due to the four aircraft we returned
35
during the current year and two aircraft we returned at the end of the prior year with no lease return costs expected for lease returns in 2015.
We expect aircraft maintenance to be 10% to 15% higher in
2015
due to an increase in our engine maintenance expense for both fleet types.
Landing Fees and Other Rentals
Landing fees and other rental expenses increased
$17 million
, or
6%
, primarily due to increased flying in 2014 as we increased capacity and entered into new markets.
We expect landing fees and other rental expenses to increase in
2015
due to the expected capacity growth.
Contracted Services
Contracted services
increased
$33 million
, or
15%
, including $15 million additional purchased capacity from SkyWest and $15 million increased contract ramp and passenger handling costs resulting from new stations and rate increases in Seattle.
We expect contracted services to be higher in
2015
, as we expand into new stations and start E-175 flying with SkyWest.
Selling Expenses
Selling expenses
increased
by
$20 million
, or
11%
, compared to
2013
, mostly due to increased promotional and advertising activities in Seattle and increased credit card commissions from higher revenue.
We expect selling expense to increase in
2015
, reflecting our growth in passengers.
Depreciation and Amortization
Depreciation and amortization expenses
increased
by
$24 million
, or
9%
, due to increased number of aircraft in our fleet.
We expect depreciation and amortization expense to increase approximately 15% in the next year as we continue to purchase aircraft and make other customer focused investments.
Food and Beverage Service
Food and beverage service expenses
increased
by
$9 million
, or
11%
, due to the increased number of passengers, and more premium product offerings.
We expect food and beverage expenses to outpace passenger growth in
2015
, as we invest more in our onboard product.
Other Operating Expenses
Other operating expenses
increased
$30 million
, or
11%
, compared to
2013
. The increase is primarily driven by IT project costs, higher professional fees, and flight crew hotel costs.
We expect other operating expenses to be higher in
2015
due to additional training costs, and other personnel expenses.
Special Items
In the fourth quarter of 2014, we recorded special items for
$30 million
. This is primarily due to a $20 million non-cash curtailment gain related to certain post-retirement benefits that were reduced in 2014. The remaining gain is related to a one-time cash settlement related to a legal matter.
Consolidated Nonoperating Income (Expense)
During 2014, we recorded nonoperating income of
$13 million
, compared to an expense of
$22 million
in 2013. The
$35 million
favorable change is due to gains recorded in the current year related to the sale of certain equity securities and reduced
36
interest expense due to lower average debt levels. Additionally, in the prior year, we incurred costs of $12 million to overhaul and repair three aircraft that were previously subleased to another carrier.
Operating Costs per Available Seat Mile
We are presenting our line-item expenses below both in absolute dollars and on an ASM basis to highlight areas in which costs have increased or decreased either more or less than capacity.
|
Twelve Months Ended December 31,
|
||||||||||||||||||
|
2014
|
2013
|
2014
|
2013
|
%Change
|
||||||||||||||
|
(in millions, except CASM)
|
Amount
|
Amount
|
CASM
|
CASM
|
CASM
|
|||||||||||||
|
Wages and benefits
|
$
|
1,136
|
|
$
|
1,086
|
|
|
3.16
|
¢
|
|
3.23
|
¢
|
(2.2
|
)%
|
||||
|
Variable incentive pay
|
116
|
|
105
|
|
0.32
|
|
0.31
|
|
3.2
|
%
|
||||||||
|
Aircraft maintenance
|
229
|
|
247
|
|
0.63
|
|
0.73
|
|
(13.7
|
)%
|
||||||||
|
Aircraft rent
|
110
|
|
119
|
|
0.30
|
|
0.35
|
|
(14.3
|
)%
|
||||||||
|
Landing fees and other rentals
|
279
|
|
262
|
|
0.77
|
|
0.78
|
|
(1.3
|
)%
|
||||||||
|
Contracted services
|
254
|
|
221
|
|
0.70
|
|
0.66
|
|
6.1
|
%
|
||||||||
|
Selling expenses
|
199
|
|
179
|
|
0.55
|
|
0.53
|
|
3.8
|
%
|
||||||||
|
Depreciation and amortization
|
294
|
|
270
|
|
0.81
|
|
0.80
|
|
1.3
|
%
|
||||||||
|
Food and beverage service
|
93
|
|
84
|
|
0.26
|
|
0.25
|
|
4.0
|
%
|
||||||||
|
Other
|
308
|
|
278
|
|
0.86
|
|
0.83
|
|
3.6
|
%
|
||||||||
|
Non-fuel Expenses
(a)
|
$
|
3,018
|
|
$
|
2,851
|
|
|
8.36
|
¢
|
|
8.47
|
¢
|
(1.3
|
)%
|
||||
|
(a)
|
Excludes special items recorded in 2014.
|
Additional Segment Information
Refer to the Notes of the Consolidated Financial Statements for a detailed description of each segment. Below is a summary of each segments' profitability.
Alaska Mainline
Pretax profit for Alaska Mainline was
$834 million
in
2014
compared to
$530 million
in
2013
. The
$284 million
increase in Mainline passenger revenue is described previously. Mainline operating expense excluding fuel increased by
$124 million
, due to increased capacity, departures, expanding to new locations, and higher advertising and promotional activity in Seattle and our new locations. Additionally, we increased spending on IT infrastructure projects, and incurred more depreciation as we continue to purchase aircraft. Economic fuel cost as defined above decreased due to a decline in the economic price per gallon, and increased fuel efficiency, slightly offset by an increase in consumption.
Alaska Regional
Pretax profit for Alaska Regional was
$74 million
in
2014
compared to
$69 million
in
2013
. The
$28 million
increase in Alaska Regional passenger revenue is described previously. The increased Regional revenue was offset by higher expenses to support additional capacity. Additionally, we recorded a $12 million loss in 2013 related to overhaul and repair of three aircraft that were previously subleased to another carrier.
Horizon
Pretax profit for Horizon was
$17 million
in
2014
compared to
$20 million
in
2013
. CPA Revenues (100% of which are from Alaska and eliminated in consolidation) increased due to additional capacity in the state of Alaska. The
$8 million
increase in Horizon's non-fuel operating expenses was driven by increased wages to support additional aircraft in the fleet, higher pilot training costs, and increased depreciation and amortization due to the three additional Q400 aircraft added in Q4 of 2013.
37
2013
COMPARED WITH
2012
Our consolidated net income for
2013
was
$508 million
, or
$3.58
per diluted share, compared to net income of
$316 million
, or
$2.20
per diluted share, in
2012
. Significant items impacting the comparability between the periods are as follows:
|
•
|
Both periods include adjustments to reflect the timing of net unrealized mark-to-market gains or losses related to our fuel hedge positions. For
2013
, we recognized net mark-to-market gains of
$8 million
(
$5 million
after tax, or
$0.03
per diluted share) compared to losses of
$38 million
(
$23 million
after tax, or
$0.17
per share) in
2012
.
|
|
•
|
In
2013
, we recognized a one-time, non-cash Special mileage plan revenue item of
$192 million
(
$120 million
after tax, or
$0.85
per diluted share) that resulted from the application of new accounting rules associated with the modified Bank of America Affinity Card Agreement, and the effect of an increase in the estimate of the number of frequent flier miles expected to expire unused.
|
Excluding the mark-to-market fuel hedge adjustments, and the one-time Special mileage plan revenue item, our adjusted consolidated net income for
2013
was
$383 million
, or
$2.70
per diluted share, compared to an adjusted consolidated net income of
$339 million
, or
$2.37
per share, in
2012
.
|
|
Twelve Months Ended December 31,
|
||||||||||||||
|
|
2013
|
2012
|
|||||||||||||
|
(in millions, except per-share amounts)
|
Dollars
|
Diluted EPS
|
Dollars
|
Diluted EPS
|
|||||||||||
|
Net income and diluted EPS as reported
|
$
|
508
|
|
$
|
3.58
|
|
$
|
316
|
|
$
|
2.20
|
|
|||
|
Mark-to-market fuel hedge adjustments, net of tax
|
(5
|
)
|
(0.03
|
)
|
23
|
|
0.17
|
|
|||||||
|
Special mileage plan revenue
|
(120
|
)
|
(0.85
|
)
|
—
|
|
—
|
|
|||||||
|
Non-GAAP adjusted income and per-share amounts
|
$
|
383
|
|
$
|
2.70
|
|
$
|
339
|
|
$
|
2.37
|
|
|||
Revenues adjusted for the one-time Special mileage plan item is as follows:
|
Twelve Months Ended December 31,
|
||||||||||
|
2013
|
2013
|
% Change
|
||||||||
|
Total operating revenues
|
$
|
5,156
|
|
$
|
4,657
|
|
10.7
|
|
||
|
Less: Special mileage plan revenue
|
192
|
|
—
|
|
NM
|
|
||||
|
Adjusted Revenue
|
$
|
4,964
|
|
$
|
4,657
|
|
6.6
|
|
||
|
Consolidated ASMs
|
33,672
|
|
|
31,428
|
|
7.1
|
|
|||
|
RASM
|
|
14.74
|
¢
|
|
14.82
|
¢
|
(0.5
|
)
|
||
NM - Not meaningful
Our operating costs per ASM are summarized below:
|
|
Twelve Months Ended December 31,
|
|||||||||
|
|
2013
|
|
2012
|
|
% Change
|
|||||
|
Consolidated:
|
||||||||||
|
Total operating expenses per ASM (CASM)
|
|
12.82
|
¢
|
|
13.12
|
¢
|
(2.3
|
)
|
||
|
Less the following components:
|
|
|
||||||||
|
Aircraft fuel, including hedging gains and losses
|
4.35
|
|
4.64
|
|
(6.3
|
)
|
||||
|
CASM, excluding fuel and fleet transition costs
|
|
8.47
|
¢
|
|
8.55
|
¢
|
(0.9
|
)
|
||
|
Mainline:
|
||||||||||
|
Total mainline operating expenses per ASM (CASM)
|
|
11.77
|
¢
|
|
12.09
|
¢
|
(2.6
|
)
|
||
|
Less the following components:
|
|
|
||||||||
|
Aircraft fuel, including hedging gains and losses
|
4.23
|
|
4.53
|
|
(6.6
|
)
|
||||
|
CASM, excluding fuel
|
|
7.54
|
¢
|
|
7.56
|
¢
|
(0.3
|
)
|
||
NM - Not Meaningful
38
OPERATING REVENUES
Total operating revenues
increased
$499 million
, or
11%
, during
2013
compared to the same period in
2012
. The changes are summarized in the following table:
|
|
Twelve Months Ended December 31,
|
||||||||
|
(in millions)
|
2013
|
2012
|
% Change
|
||||||
|
Passenger
|
|||||||||
|
Mainline
|
$
|
3,490
|
|
$
|
3,284
|
|
6
|
||
|
Regional
|
777
|
|
746
|
|
4
|
||||
|
Total passenger revenue
|
$
|
4,267
|
|
$
|
4,030
|
|
6
|
||
|
Freight and mail
|
113
|
|
111
|
|
2
|
||||
|
Other - net
|
584
|
|
516
|
|
13
|
||||
|
Special mileage plan revenue
|
192
|
|
—
|
|
NM
|
||||
|
Total operating revenues
|
$
|
5,156
|
|
$
|
4,657
|
|
11
|
||
NM - Not meaningful
Passenger Revenue – Mainline
Mainline passenger revenue for
2013
increased
by
6%
on a 7.9% increase in capacity and a 1.5% increase in PRASM compared to
2012
. The increase in capacity was driven by new routes added in
2013
and larger aircraft. The decrease in PRASM was driven by a 0.9% decrease in ticket yield and a 0.5 point decrease in load factor compared to the prior year. Increased competition in the state of Alaska and along the west coast put downward pressures on yield and load factor.
Passenger Revenue – Regional
Regional passenger revenue
increased
by
$31 million
, or
4%
, compared to
2012
on a 0.4% increase in capacity and 3.7% increase in PRASM compared to
2012
. The increase in PRASM was due to a 1.4% increase in ticket yield coupled with a 1.8 point increase in load factor compared to the prior year. The increase in regional revenues is due to better matching the right aircraft with the right market to avoid over-supply of capacity and maintaining yields and load factors.
Freight and Mail
Freight and mail revenue
increased
$2 million
, or
2%
, primarily due to increased freight volumes.
Other – Net
Other
–
net revenue
increased
$68 million
, or
13%
, from
2012
. This is primarily due to an increase in our Mileage Plan™ revenues of $47 million or 22%, as a result of a higher rate per mile sold to Bank of America Corporation (BAC) under our new affinity card program and growth in the Mileage Plan™ program. Additionally, bag fees increased by 7.8%, and change fees increased by 7.3%, due to increases in the number of passengers.
Special Mileage Plan Revenue
In 2013, we modified and extended our co-branded credit card agreement with BAC. In connection with this agreement and as a result of applying related accounting standards, we recorded a one-time, non-cash Special mileage plan revenue item of $192 million primarily related to our revaluation of the deferred revenue liability related to miles previously sold to BAC.
39
OPERATING EXPENSES
Total operating expenses
increased
$193 million
, or
5%
, compared to
2012
, primarily driven by wages and variable incentive pay. Fuel expense remained flat due to a decrease in fuel cost per gallon offset by an increase in fuel consumption. We believe it is useful to summarize operating expenses as follows, which is consistent with the way expenses are reported internally and evaluated by management:
|
|
Twelve Months Ended December 31,
|
||||||||
|
(in millions)
|
2013
|
2011
|
% Change
|
||||||
|
Fuel expense
|
$
|
1,467
|
|
$
|
1,459
|
|
1
|
||
|
Non-fuel expenses
|
2,851
|
|
2,666
|
|
7
|
||||
|
Total Operating Expenses
|
$
|
4,318
|
|
$
|
4,125
|
|
5
|
||
Significant operating expense variances from
2012
are more fully described below.
Wages and Benefits
Wages and benefits
increased
during
2013
by
$48 million
, or
5%
, compared to
2012
. The primary components of wages and benefits are shown in the following table:
|
|
Twelve Months Ended December 31,
|
|||||||||
|
(in millions)
|
2013
|
2012
|
% Change
|
|||||||
|
Wages
|
$
|
788
|
|
$
|
742
|
|
6
|
|
||
|
Pension - Defined benefit plans
|
50
|
|
57
|
|
(12
|
)
|
||||
|
Defined contribution plans
|
44
|
|
43
|
|
2
|
|
||||
|
Medical and other benefits
|
145
|
|
138
|
|
5
|
|
||||
|
Payroll taxes
|
59
|
|
58
|
|
2
|
|
||||
|
Total wages and benefits
|
$
|
1,086
|
|
$
|
1,038
|
|
5
|
|
||
Wages
increased
6%
, primarily due to a ratified contract with Alaska's pilots that was effective April 1, 2013. Additionally, we hired 2% more FTEs to support increased flying and other strategic initiatives, such as IT and hassle-free projects.
Pension expense
decreased
12%
, compared to the same period in the prior year. The decline is due to having a lower accumulated loss to amortize as a result of higher plan assets and improved funded status compared to the prior year.
Medical benefits
increased
5%
from the prior year primarily due to an increase in employee health-care claims and an increase in the cost of health care services.
Variable Incentive Pay
Variable incentive pay expense
increased
from
$88 million
in
2012
to
$105 million
in
2013
. The increase is due to actual results exceeding our target results of financial and operational performance more so than in the prior year.
40
Aircraft Fuel
Aircraft fuel expense
increased
$8 million
, or
1%
compared to
2012
. The elements of the change are illustrated in the following table:
|
Twelve Months Ended December 31,
|
|||||||||||||||
|
2013
|
2012
|
||||||||||||||
|
(in millions, except for per gallon amounts)
|
Dollars
|
|
Cost/Gal
|
|
Dollars
|
|
Cost/Gal
|
||||||||
|
Raw or "into-plane" fuel cost
|
$
|
1,423
|
|
$
|
3.19
|
|
|
$
|
1,397
|
|
$
|
3.31
|
|
||
|
Gains on settled hedges
|
52
|
|
0.11
|
|
|
24
|
|
0.06
|
|
||||||
|
Consolidated economic fuel expense
|
$
|
1,475
|
|
$
|
3.30
|
|
|
$
|
1,421
|
|
$
|
3.37
|
|
||
|
Mark-to-mark fuel hedge adjustments
|
(8
|
)
|
(0.02
|
)
|
|
38
|
|
0.09
|
|
||||||
|
GAAP fuel expense
|
$
|
1,467
|
|
$
|
3.28
|
|
|
$
|
1,459
|
|
$
|
3.46
|
|
||
|
Fuel gallons
|
447
|
|
|
|
422
|
|
|
||||||||
Fuel gallons consumed increased 5.9% in line with the increase in departures and capacity.
The raw fuel price per gallon decreased 3.6% as a result of lower West Coast jet fuel prices. The decrease in raw fuel price per gallon during 2013 was due to a decline in refining margins of 27%, offset by the increase in average crude oil prices of 4%, as compared to the prior year.
Losses recognized for hedges that settled during the year were $52 million in 2013, compared to losses of $24 million in 2012. These amounts represent the cash received, or paid, net of the premium expense recognized for those hedges.
Aircraft Maintenance
Aircraft maintenance
increased
by
$25 million
, or
11%
, compared to the prior year, primarily due to a $14 million increase in lease return provisions. During the year we modified one of our power-by-the-hour agreements and terminated another related to our B737 fleet, resulting in a decrease in expense under those agreements but an increase in engine events and related expense that we are now responsible for. For our B737 and Q400 fleets, we also experienced heavier, more expensive checks, on flat volumes.
Landing Fees and Other Rentals
Landing fees and other rentals
increased
$19 million
, or
8%
, primarily due to the increase in rates from the Port of Seattle lease signed in late 2013. Additionally, we experienced increased rates throughout our network with increased departures and passengers.
Contracted Services
Contracted services
increased
$21 million
, or
11%
, primarily due to more capacity purchase flying with SkyWest and higher rates with PenAir. Additionally, we experienced higher passenger and ramp handling costs, and other services as a result of an increase in the number of flights to airports where outside vendors are used.
Selling Expenses
Selling expenses
increased
by
$11 million
, or
6%
, compared to
2012
as a result of higher commissions with credit cards and interline commissions related to international routes.
Other Operating Expenses
Other operating expenses
increased
$30 million
, or
13%
, compared to
2012
. The increase is driven by a variety of factors such as higher professional fees, IT costs, losses on the disposal of assets, property taxes, and new uniforms.
Consolidated Nonoperating Income (Expense)
Net nonoperating expense increased $4 million from 2012. This is due to the overhaul and repair of three aircraft that were previously subleased to another carrier. Partially offsetting the sublease loss was a gain on the sale of equity securities.
41
Operating Costs per Available Seat Mile
|
Twelve Months Ended December 31,
|
||||||||||||||||||
|
2013
|
2012
|
2013
|
2012
|
%Change
|
||||||||||||||
|
(in millions, except CASM)
|
Amount
|
Amount
|
CASM
|
CASM
|
CASM
|
|||||||||||||
|
Wages and benefits
|
$
|
1,086
|
|
$
|
1,038
|
|
|
3.23
|
¢
|
|
3.30
|
¢
|
(2.1
|
)%
|
||||
|
Variable incentive pay
|
105
|
|
88
|
|
0.31
|
|
0.28
|
|
10.7
|
%
|
||||||||
|
Aircraft maintenance
|
247
|
|
222
|
|
0.73
|
|
0.71
|
|
2.8
|
%
|
||||||||
|
Aircraft rent
|
119
|
|
116
|
|
0.35
|
|
0.37
|
|
(5.4
|
)%
|
||||||||
|
Landing fees and other rentals
|
262
|
|
243
|
|
0.78
|
|
0.77
|
|
1.3
|
%
|
||||||||
|
Contracted services
|
221
|
|
200
|
|
0.66
|
|
0.64
|
|
3.1
|
%
|
||||||||
|
Selling expenses
|
179
|
|
168
|
|
0.53
|
|
0.53
|
|
—
|
%
|
||||||||
|
Depreciation and amortization
|
270
|
|
264
|
|
0.80
|
|
0.84
|
|
(4.8
|
)%
|
||||||||
|
Food and beverage service
|
84
|
|
79
|
|
0.25
|
|
0.25
|
|
—
|
%
|
||||||||
|
Other
|
278
|
|
248
|
|
0.83
|
|
0.79
|
|
5.1
|
%
|
||||||||
|
Non-fuel Expenses
|
$
|
2,851
|
|
$
|
2,666
|
|
|
8.47
|
¢
|
|
8.48
|
¢
|
(0.1
|
)%
|
||||
Additional Segment Information
Refer to the Notes of the Consolidated Financial Statements for a detailed description of each segment. Below is a summary of each segments' profitability.
Alaska Mainline
Pretax profit for Alaska Mainline was $530 million in 2013 compared to $466 million in 2012. The $206 million increase in Mainline passenger revenue is described previously, as well as the increased revenues from the modified credit card agreement. Mainline operating expense excluding fuel increased by $162 million, driven mainly by increased wages and incentive pay, increased rates and volumes on landing fees and rents, and increased other expenses to support our growth in operations. Economic fuel cost as defined above increased due to a 6.8% increase in consumption, on a slight decrease in the economic price per gallon.
Alaska Regional
Pretax profit for Alaska Regional was $69 million in 2013 compared to $62 million in 2012. The $31 million increase in Alaska Regional passenger revenue is described previously. Alaska Regional expenses were slightly higher due to additional flying by SkyWest and higher rates from PenAir, and increased landing fees and rents due to increased flying and higher rates. Also impacting pretax profit is the $12 million loss due to the overhaul and repair of three aircraft that were previously subleased to another carrier.
Horizon
Pretax profit for Horizon was $20 million in 2013 compared to $24 million in 2012. CPA Revenues (100% of which are from Alaska and eliminated in consolidation) decreased due to lower operational incentives being met. The $3 million increase in Horizon's non-fuel operating expenses was driven by wages and incentive pay, and an increase in airframe checks and other unscheduled events.
42
LIQUIDITY AND CAPITAL RESOURCES
Our primary sources of liquidity are:
|
•
|
Our existing cash and marketable securities balance of
$1.2 billion
, and our expected cash from operations;
|
|
•
|
Our
76
unencumbered aircraft in our operating fleet as of
December 31, 2014
, that could be financed, if necessary;
|
|
•
|
Our combined $200 million bank line-of-credit facilities, with none currently outstanding;
|
In
2014
, we took free and clear delivery of ten B737-900ER aircraft. We made debt payments totaling
$119 million
. In addition, we continued to return capital to our shareholders by repurchasing
$348 million
of our common stock in
2014
, and paid dividends totaling
$68 million
. Because of our strong balance sheet and financial performance, in
2014
we became one of only two airlines in the U.S. with investment grade credit ratings. We will continue to focus on preserving a strong liquidity position and evaluate our cash needs as conditions change.
We believe that our current cash and marketable securities balance combined with future cash flows from operations and other sources of liquidity will be sufficient to fund our operations for the foreseeable future.
In our cash and marketable securities portfolio, we invest only in securities that meet our primary investment strategy of maintaining and securing investment principal. Our investment portfolio is managed by reputable firms that adhere to our investment policy that sets forth investment objectives, approved and prohibited investments, and duration and credit quality guidelines. Our policy and the portfolio managers are continually reviewed to ensure that the investments are aligned with our strategy.
The table below presents the major indicators of financial condition and liquidity:
|
(in millions, except per share and debt-to-capital amounts)
|
December 31, 2014
|
December 31, 2013
|
Change
|
||||||||
|
Cash and marketable securities
|
$
|
1,217
|
|
$
|
1,330
|
|
$
|
(113
|
)
|
||
|
Cash, marketable securities, and unused lines of credit as a percentage of trailing twelve months revenue
(a)
|
26
|
%
|
31
|
%
|
(5
|
) pts
|
|||||
|
Long-term debt, net of current portion
|
686
|
|
754
|
|
(68
|
)
|
|||||
|
Shareholders’ equity
|
2,127
|
|
2,029
|
|
98
|
|
|||||
|
Long-term debt-to-capital ratio
(b)
|
31%:69%
|
|
35%:65%
|
|
(4
|
) pts
|
|||||
|
(a)
|
Excludes Special mileage plan revenue item.
|
|
(b)
|
Calculated using the present value of remaining aircraft lease payments for aircraft that are in our operating fleet as of the balance sheet date.
|
The following discussion summarizes the primary drivers of the increase in our cash and marketable securities balance and our expectation of future cash requirements.
ANALYSIS OF OUR CASH FLOWS
Cash Provided by Operating Activities
In
2014
, we generated over
$1 billion
in operating cash flows compared to
$981 million
in
2013
. The increase of
$49 million
is primarily due to an increase in earnings, an increase in our advance ticket sales, and a decrease in pension contributions, partially offset by a $177 million increase in payments for income taxes.
Cash provided by operating activities was
$981 million
in
2013
, compared to
$753 million
in
2012
. The $228 million increase is primarily due to an increase in revenues, excluding Special mileage plan revenue item, an increase in cash receipts related to our Mileage Plan™ program, decrease in pension contributions, and cash savings in 2013 as we shortened the tenor of our fuel hedge program. Partially offsetting these increases were additional cash paid in taxes, and an increase in operating expenses to support the growth in revenues.
43
We typically generate positive cash flows from operations, and expect to use a portion to invest in capital expenditures and increasing shareholder value by stock repurchases and dividends.
Cash Used in Investing Activities
Cash used in investing activities was
$541 million
during
2014
, compared to
$698 million
in
2013
. Our capital expenditures were
$694 million
, or
$128 million
higher than in
2013
. This is due to the delivery of ten B737-900ERs, the completion of our B737 cabin improvement project, and the exercise of 16 B737 options, two Q400 options, and deposits for an incremental Q400. This compares to the delivery of nine B737-900ERs and three Q400s in the prior year.
As of December 31, 2014, we had firm commitments for
73
B737 aircraft through
2022
with options to acquire up to
48
additional 737 NextGen (NG) aircraft and MAX aircraft in
2017
through
2024
. We also have options to acquire five Q400 aircraft with deliveries from 2018 to 2019. The options for all fleet types give us the flexibility, but not the obligation, to grow the fleet assuming profitability and return on invested capital targets can be met.
The table below reflects total expected capital expenditures and the additional expenditures if options were exercised. Included in the table are six new aircraft, two of which are options exercises and four of which are expected new aircraft orders approved by the Board of Directors on February 10, 2015. These aircraft are expected to be delivered in 2016 and 2017. Additional options will be exercised only if we believe return on invested capital targets can be met:
|
|
2014 Actuals
|
2015
|
2016
|
2017
|
2018
|
||||||||||||||
|
Aircraft and aircraft purchase deposits - firm
|
$
|
498
|
|
$
|
580
|
|
$
|
535
|
|
$
|
485
|
|
$
|
405
|
|
||||
|
Other flight equipment
|
131
|
|
50
|
|
35
|
|
25
|
|
25
|
|
|||||||||
|
Other property and equipment
|
65
|
|
120
|
|
80
|
|
80
|
|
80
|
|
|||||||||
|
Total property and equipment additions
|
$
|
694
|
|
$
|
750
|
|
$
|
650
|
|
$
|
590
|
|
$
|
510
|
|
||||
|
Option aircraft and aircraft deposits, if exercised
|
$
|
—
|
|
$
|
—
|
|
$
|
35
|
|
$
|
145
|
|
$
|
315
|
|
||||
Cash used in investing activities was $698 million during 2013, compared to $645 million in 2012. Our capital expenditures were $566 million, or $48 million higher than in 2012. This is due to the delivery of nine B737-900ER aircraft, and three Q400 aircraft, compared to four B737-900ER aircraft, three B737-800 aircraft, and two Q400 aircraft in the prior year.
Cash Used by Financing Activities
Cash used by financing activities was
$462 million
during
2014
, compared to
$325 million
in
2013
. During the current year, we made debt payments of
$119 million
, stock repurchases of
$348 million
, and cash dividend payments of
$68 million
, partially offset by proceeds from debt of
$51 million
. In
2013
, we made debt payments of
$161 million
, stock repurchases of
$159 million
, and cash dividend payments of $28 million. In 2012, we made debt payments of
$275 million
and stock repurchases of $60 million, which was offset by proceeds from a reimbursement for our Los Angeles International Airport T6 project of $178 million.
We plan to meet our capital and operating commitments through internally generated funds from operations and cash and marketable securities on hand, along with additional debt financing if necessary.
Bank Line-of-Credit Facility
The Company has two $100 million credit facilities. Both facilities have variable interest rates based on LIBOR plus a specified margin. One of the
$100 million
facilities, which expires in
September 2017
, is secured by aircraft. The other
$100 million
facility is secured by certain accounts receivable, spare engines, spare parts and ground service equipment, and expires
March 2017
. The Company has no immediate plans to borrow using either of these facilities.
CONTRACTUAL OBLIGATIONS AND COMMITMENTS
Aircraft Purchase Commitments
At December 31, 2014, we had firm orders to purchase
76
aircraft. In addition, we had options to acquire 48 additional B737 aircraft and options to acquire
five
Q400 aircraft. Also, we have options to add regional capacity by having SkyWest operate up to
16
more E-175 aircraft than the seven aircraft we already have committed.
44
The following table summarizes our projected fleet count by year, as of
February 11, 2015
:
|
|
Actual Fleet Count
|
Expected Fleet Activity
(a)
|
|||||||||||||||
|
Aircraft
|
Dec 31, 2013
|
Dec 31, 2014
|
2015 Changes
|
Dec 31, 2015
|
2016 - 2017 Changes
|
Dec 31, 2017
|
|||||||||||
|
B737 Freighters & Combis
|
6
|
|
6
|
|
—
|
|
6
|
|
(3
|
)
|
3
|
|
|||||
|
B737 Passenger Aircraft
(b)
|
125
|
|
131
|
|
10
|
|
141
|
|
9
|
|
150
|
|
|||||
|
Total Mainline Fleet
|
131
|
|
137
|
|
10
|
|
147
|
|
6
|
|
153
|
|
|||||
|
Q400
|
51
|
|
51
|
|
1
|
|
52
|
|
2
|
|
54
|
|
|||||
|
E-175
(c)
|
—
|
|
—
|
|
5
|
|
5
|
|
2
|
|
7
|
|
|||||
|
CRJ700
(c)
|
8
|
|
8
|
|
—
|
|
8
|
|
—
|
|
8
|
|
|||||
|
Total Regional Fleet
|
59
|
|
59
|
|
6
|
|
65
|
|
4
|
|
69
|
|
|||||
|
Total
|
190
|
|
196
|
|
16
|
|
212
|
|
10
|
|
222
|
|
|||||
|
(a)
|
The expected fleet counts at
December 31, 2015
,
2016
, and
2017
are subject to change.
|
|
(b)
|
2015 changes include the expected delivery of 11 Boeing 737-900ER aircraft offset by the scheduled return of one 737-400 aircraft to the lessor.
|
|
(c)
|
Aircraft are operated under capacity purchase agreements with a third party.
|
For future firm orders and option exercises, we may finance the aircraft through internally generated cash, long-term debt, or lease arrangements.
Future Fuel Hedge Positions
All of our future oil positions are call options, which are designed to effectively cap the cost of the crude oil component of our jet fuel purchases. With call options, we are hedged against volatile crude oil price increases; and, during a period of decline in crude oil prices, we only forfeit cash previously paid for hedge premiums. Our crude oil positions are as follows:
|
|
Approximate % of Expected Fuel Requirements
|
Weighted-Average Crude Oil Price per Barrel
|
Average Premium Cost per Barrel
|
||
|
First Quarter 2015
|
50%
|
$105
|
$4
|
||
|
Second Quarter 2015
|
50%
|
$97
|
$3
|
||
|
Third Quarter 2015
|
40%
|
$98
|
$3
|
||
|
Fourth Quarter 2015
|
30%
|
$94
|
$3
|
||
|
Full Year 2015
|
42%
|
$99
|
$3
|
||
|
First Quarter 2016
|
20%
|
$88
|
$3
|
||
|
Second Quarter 2016
|
10%
|
$73
|
$4
|
||
|
Full Year 2016
|
7%
|
$83
|
$3
|
||
45
Contractual Obligations
The following table provides a summary of our principal payments under current and long-term debt obligations, operating lease commitments, aircraft purchase commitments and other obligations as of
December 31, 2014
.
|
(in millions)
|
2015
|
2016
|
2017
|
2018
|
2019
|
Beyond 2019
|
Total
|
||||||||||||||||||||
|
Current and long-term debt obligations
|
$
|
117
|
|
$
|
115
|
|
$
|
121
|
|
$
|
151
|
|
$
|
114
|
|
$
|
185
|
|
$
|
803
|
|
||||||
|
Operating lease commitments
(a)
|
206
|
|
195
|
|
161
|
|
98
|
|
86
|
|
360
|
|
1,106
|
|
|||||||||||||
|
Aircraft purchase commitments
|
516
|
|
496
|
|
471
|
|
430
|
|
393
|
|
653
|
|
2,959
|
|
|||||||||||||
|
Interest obligations
(b)
|
37
|
|
33
|
|
28
|
|
21
|
|
14
|
|
13
|
|
146
|
|
|||||||||||||
|
Other obligations
(c)
|
61
|
|
56
|
|
60
|
|
42
|
|
31
|
|
245
|
|
495
|
|
|||||||||||||
|
Total
|
$
|
937
|
|
$
|
895
|
|
$
|
841
|
|
$
|
742
|
|
$
|
638
|
|
$
|
1,456
|
|
$
|
5,509
|
|
||||||
|
(a)
|
Operating lease commitments generally include aircraft operating leases, airport property and hangar leases, office space, and other equipment leases. Included here are seven E-175 aircraft that will be operated by SkyWest under a capacity purchase agreement beginning in 2015.
|
|
(b)
|
For variable-rate debt, future obligations are shown above using interest rates in effect as of
December 31, 2014
.
|
|
(c)
|
Includes minimum obligations under our long-term power-by-the-hour maintenance agreements and obligations associated with third-party CPAs with SkyWest and PenAir. Refer to the "Commitments" note in the consolidated financial statements for further information.
|
Defined Benefit Pensions
The table above excludes contributions to our various pension plans, which could be approximately $30 to $35 million in 2015, although there is no minimum required contribution. The unfunded liability for our qualified defined-benefit pension plans was
$133 million
at
December 31, 2014
, compared to a
$60 million
overfunded position at
December 31, 2013
. This results in a
94%
funded status on a projected benefit obligation basis compared to
104%
funded as of
December 31, 2013
.
Credit Card Agreements
We have agreements with a number of credit card companies to process the sale of tickets and other services. Under these agreements, there are material adverse change clauses that, if triggered, could result in the credit card companies holding back a reserve from our credit card receivables. Under one such agreement, we could be required to maintain a reserve if our credit rating is downgraded to or below a rating specified by the agreement or our cash and marketable securities balance fell below $500 million. Under another such agreement, we could be required to maintain a reserve if our cash and marketable securities balance fell below $500 million. We are not currently required to maintain any reserve under these agreements, but if we were, our financial position and liquidity could be materially harmed.
Deferred Income Taxes
For federal income tax purposes, the majority of our assets, as measured by value, are fully depreciated over a seven-year life using an accelerated depreciation method or bonus depreciation if available. For financial reporting purposes, the majority of our assets are depreciated over 15 to 20 years to an estimated salvage value using the straight-line basis. This difference has created a significant deferred tax liability. At some point in the future the depreciation basis will reverse, potentially resulting in an increase in income taxes paid.
While it is possible that we could have material cash obligations for this deferred liability at some point in the future, we cannot estimate the timing of long-term cash flows with reasonable accuracy. Taxable income and cash taxes payable in the short term are impacted by many items, including the amount of book income generated, which can be volatile depending on revenue and fuel prices, level of pension funding (which is generally not known until late each year), whether "bonus depreciation" provisions are available, as well as other legislative changes that are beyond our control.
In
2014
, we made tax payments of
$326 million
, and had an effective tax rate of
37.9%
. In early
2015
, we will receive a tax refund of approximately $80 million primarily due to an overpayment of estimated tax prior to bonus depreciation legislation enacted late in
2014
. We believe that we have the liquidity to make our future tax payments.
46
CRITICAL ACCOUNTING ESTIMATES
The discussion and analysis of our financial position and results of operations in this MD&A are based upon our consolidated financial statements. The preparation of these financial statements requires us to make estimates and judgments that affect our financial position and results of operations. See Note 1 to the consolidated financial statements for a description of our significant accounting policies.
Critical accounting estimates are defined as those that reflect significant management judgment and uncertainties and that potentially may result in materially different results under varying assumptions and conditions. Management has identified the following critical accounting estimates and has discussed the development, selection and disclosure of these policies with our audit committee.
MILEAGE PLAN
Our Mileage Plan™ loyalty program awards miles to member passengers who fly on our airlines and many of our travel partners. We also sell services, including miles for transportation, to non-airline partners, such as hotels, car rental agencies, and a major bank that offers Alaska Airlines affinity credit cards. In either case, the outstanding miles may be redeemed for travel on our airlines or any of our travel partners. As long as the Mileage Plan™ is in existence, we have an obligation to provide this future travel.
For miles earned by passengers who fly on us or our travel partners, we recognize a liability and a corresponding selling expense representing the incremental cost associated with the obligation to provide travel in the future. For services sold through one of our non-airline partners, the sales proceeds that represent award transportation and certificates for discounted companion travel are deferred and recognized when the transportation is delivered, and the remaining components are recorded as commission in other-net revenue in the period the services are performed. Commission revenue recognized for the years ended
December 31, 2014
,
2013
and
2012
was
$261 million
,
$213 million
and
$143 million
, respectively. The deferred revenue is recognized as passenger revenue when awards are issued and flown on one of our airlines or expire, and as other-net revenue for awards issued and flown on partner airlines.
At
December 31, 2014
, we had approximately 146 billion miles outstanding, resulting in an aggregate liability and deferred revenue balance of
$730 million
. Both the liability and the deferred revenue are determined based on several assumptions that require significant management judgment to estimate and formulate. There are uncertainties inherent in these estimates; therefore, different assumptions could affect the amount and/or timing of revenue recognition or Mileage Plan™ expenses. The most significant assumptions in accounting for the Mileage Plan™ are described below.
|
1.
|
The rate at which we defer sales proceeds related to services sold through non-airline partners:
|
We defer sales proceeds under two accounting methodologies: the relative selling price method, which represents approximately 94% of sold miles, and the residual accounting method, which represents the remaining 6%. For contracts that were modified after the effective date of Accounting Standards Update 2009-13, "Multiple-Deliverable Revenue Arrangements - a consensus of the FASB Emerging Issues Task Force" (ASU 2009-13), we determined our best estimate of selling price by considering multiple inputs and methods including, but not limited to, the estimated selling price of comparable travel, discounted cash flows, brand value, published selling prices, number of miles awarded and the number of miles redeemed. We estimated the selling prices and volumes over the terms of the agreements in order to determine the allocation of proceeds to each of the multiple deliverables. This relative allocation is evaluated annually and updated according to changes in the assumptions of the volume of related deliverables. A 1% shift between the allocation of cash proceeds to travel deliverables from marketing deliverables would defer the timing of revenue recognition by approximately $4 million.
For remaining contracts that continue to be accounted for under the residual method, as our estimates of selling price change, the amount we defer changes, resulting in the recognition of a higher or lower portion of the cash proceeds to commission revenue in any given period. A 10% increase in the estimated selling price of travel (and related deferral rate) would decrease commission revenue by approximately $2 million in the period cash is received. This amount would instead be recognized in a future period when award travel takes place.
47
|
2.
|
The number of miles that will not be redeemed for travel (breakage):
|
The liability for outstanding Mileage Plan™ mileage credits includes all mileage credits that are expected to be redeemed, including mileage credits earned by members whose mileage account balances have not yet reached the minimum mileage credit level to redeem an award. Our estimate of the number of miles that will not be redeemed (breakage) considers historical activity in our members’ accounts and other factors. Based on statistical analysis of historical data, our current breakage rate is 17.4%. A hypothetical 1% change in our estimate of breakage has approximately a $6 million effect on the liability.
|
3.
|
The number of miles used per award:
|
We estimate how many miles will be used per award. For example, our members may redeem credit for award travel to various locations or choose between a highly restricted award and an unrestricted award. Our estimates are based on the current requirements in our Mileage Plan™ program and historical award redemption patterns.
|
4.
|
The number of awards redeemed for travel on our airlines versus other airlines:
|
The cost for us to carry an award passenger is typically lower than the cost we will pay to our travel partners. We estimate the number of awards that will be redeemed on our airlines versus on our travel partners, and accrue the estimated costs based on historical redemption patterns. If the number of awards redeemed on our travel partner is higher or lower than estimated, we may need to adjust our liability and corresponding expense.
|
5.
|
The costs that will be incurred to provide award travel:
|
When a frequent flier travels on his or her award ticket on one of our airlines, incremental costs such as food, fuel and insurance are incurred to carry that passenger. We estimate what these costs will be (excluding any contribution to overhead and profit) and accrue a liability. If the passenger travels on another airline on an award ticket, we often must pay the other airline for carrying the passenger. The other airline costs are based on negotiated agreements and are often substantially higher than the costs we would incur to carry that passenger. We estimate how much we will pay to other airlines for future travel awards based on historical redemptions and settlements with other carriers and accrue a liability accordingly. The costs actually incurred by us or paid to other airlines may be higher or lower than the costs that were estimated and accrued, and therefore we may need to adjust our liability and recognize a corresponding expense.
We regularly review significant Mileage Plan™ assumptions and change our assumptions if facts and circumstances indicate that a change is necessary. Any such change in assumptions could have a significant effect on our financial position and results of operations.
PENSION PLANS
Accounting rules require recognition of the overfunded or underfunded status of an entity’s defined-benefit pension and other postretirement plans as an asset or liability in the consolidated financial statements and requires recognition of the changes in funded status in other comprehensive income. Pension expense is recognized on an accrual basis over employees’ approximate service periods and is generally independent of funding decisions or requirements. We recognized expense for our qualified defined-benefit pension plans of
$9 million
,
$50 million
, and
$57 million
in
2014
,
2013
, and
2012
, respectively. We expect the
2015
expense to be approximately
$28 million
, as a result of a lower discount rate, a lower expected return on assets, and an increase in estimated participant longevity assumptions.
The calculation of pension expense and the corresponding liability requires the use of a number of important assumptions, including the expected long-term rate of return on plan assets and the assumed discount rate. Changes in these assumptions can result in different expense and liability amounts, and future actual experience can differ from these assumptions.
Pension liability and future pension expense decrease as the discount rate increases. We discounted future pension obligations using a rate of
4.20%
and
4.85%
at
December 31, 2014
and
2013
, respectively. The discount rate was determined using current rates earned on high-quality, long-term bonds with maturities that correspond with the estimated cash distributions from the pension plans. At
December 31, 2014
, we refined the yield curve to use a pool of higher-yielding bonds estimated to be more reflective of settlement rates, as we are taking steps to ultimately terminate or settle plans that are frozen and move toward freezing benefits in active plans in the future. If the discount rate decreased by
0.5%
(from
4.20%
to
3.70%
), our projected benefit obligation at
December 31, 2014
would increase by approximately
$152 million
and our estimated
2015
pension expense would increase by approximately
$10 million
.
48
Pension liability and future pension expense can increase or decrease as assumptions in the actuarial data changes. In
December 31, 2014
, new mortality tables became available using more recent participant data. The new tables are intended to update and replace the RP-2000 tables that have been used in actuarial valuations since 2000. We have elected to apply proprietary mortality tables provided by a third party actuary which is segregated into industry-specific mortality information and includes actual participant data from our plans. As expected, the tables reflect the longer expected lifespans of employees. Generally speaking, the new tables reflect an 11% - 12% longer life expectancy of people age 65 than the 2000 tables. The change in the assumption increased our projected benefit obligation by approximately $80 million at
December 31, 2014
.
Pension expense normally increases as the expected rate of return on pension plan assets decreases. As of
December 31, 2014
, we estimate that the pension plan assets will generate a long-term rate of return of
6.50%
, which decreased 0.25% from the rate at
December 31, 2013
. The decrease in rate is due to the shift of our pension asset portfolio into more fixed income investments that better match the cash flows of our expected benefit payments and reduce the volatility of future returns. We regularly review the actual asset allocation and periodically rebalance investments as appropriate. This expected long-term rate of return on plan assets at
December 31, 2014
is based on an allocation of U.S. and non-U.S. equities and U.S. fixed-income securities. A decrease in the expected long-term rate of return of
0.5%
(from
6.50%
to
6.00%
) would increase our estimated
2015
pension expense by approximately
$10 million
.
All of our defined-benefit pension plans are now closed to new entrants. Additionally, benefits in our non-union defined-benefit plans were frozen January 1, 2014.
Future changes in plan asset returns, assumed discount rates and various other factors related to the participants in our pension plans will impact our future pension expense and liabilities. We cannot predict what these factors will be in the future.
LONG-LIVED ASSETS
As of
December 31, 2014
, we had approximately
$4.3 billion
of property and equipment and related assets, net of accumulated depreciation. In accounting for these long-lived assets, we make estimates about the expected useful lives of the assets, changes in fleet plans, the expected residual values of the assets, and the potential for impairment based on the fair value of the assets and the cash flows they generate. Factors indicating potential impairment include, but are not limited to, significant decreases in the market value of the long-lived assets, management decisions regarding the future use of the assets, a significant change in the long-lived assets condition, and operating cash flow losses associated with the use of the long-lived asset.
There is inherent risk in estimating the fair value of our aircraft and related parts and their salvage values at the time of impairment. Actual proceeds upon disposition of the aircraft or related parts could be materially less than expected, resulting in additional loss. Our estimate of salvage value at the time of disposal could also change, requiring us to increase the depreciation expense on the affected aircraft.
|
|
We have interest-rate risk on our variable-rate debt obligations and our available-for-sale marketable investment portfolio, and commodity-price risk in jet fuel required to operate our aircraft fleet. We purchase the majority of our jet fuel at prevailing market prices and seek to manage market risk through execution of our hedging strategy and other means. We have market-sensitive instruments in the form of fixed-rate debt instruments, and financial derivative instruments used to hedge our exposure to jet-fuel price increases and interest-rate increases. We do not purchase or hold any derivative financial instruments for trading purposes.
Aircraft Fuel
Currently, our fuel-hedging portfolio consists of crude oil call options. Historically, we have had jet fuel refining margin swap contracts, but we have discontinued the use of the refining margin swaps in the third quarter of 2014. Call options effectively cap our pricing for the crude oil, limiting our exposure to increasing fuel prices for about half of our planned fuel consumption. With call options, we are hedged against volatile crude oil price increases, and during a period of decline in crude oil prices, we only forfeit cash previously paid for hedge premiums. We believe there is risk in not hedging against the possibility of fuel price increases. We estimate that a 10% increase or decrease in crude oil prices as of
December 31, 2014
would increase or decrease the fair value of our crude oil hedge portfolio by approximately
$3 million
.
49
Our portfolio value of fuel hedge contracts was
$7
million at
December 31, 2014
compared to a portfolio value of
$16
million at
December 31, 2013
. We do not have any collateral held by counterparties to these agreements as of
December 31, 2014
.
We continue to believe that our fuel hedge program is an important part of our strategy to reduce our exposure to volatile fuel prices. We expect to continue to enter into these types of contracts prospectively, although significant changes in market conditions could affect our decisions. For more discussion, see the "Derivative Instruments" note in our consolidated financial statements.
Interest Rates
We have exposure to market risk associated with changes in interest rates related primarily to our debt obligations and short-term investment portfolio. Our debt obligations include variable-rate instruments, which have exposure to changes in interest rates. This exposure is somewhat mitigated through our variable-rate investment portfolio. A hypothetical 10% change in the average interest rates incurred on variable-rate debt during
2014
would correspondingly change our net earnings and cash flows associated with these items by less than $1 million. In order to help mitigate the risk of interest rate fluctuations, we have fixed the interest rates on certain existing variable-rate debt agreements. Our variable-rate debt is approximately
24%
of our total long-term debt at
December 31, 2014
compared to
19%
at
December 31, 2013
.
We also have investments in marketable securities, which are exposed to market risk associated with changes in interest rates. If short-term interest rates were to average 1% more than they did in
2014
, interest income would increase by approximately
$14 million
.
|
|
SELECTED QUARTERLY CONSOLIDATED FINANCIAL INFORMATION (unaudited)
|
|
First Quarter
|
Second Quarter
|
Third Quarter
|
Fourth Quarter
|
|||||||||||||||||||||||||||
|
(in millions, except per share)
|
2014
|
2013
|
2014
|
2013
|
2014
|
2013
|
2014
|
2013
|
|||||||||||||||||||||||
|
Operating revenues
(a)
|
$
|
1,222
|
|
$
|
1,133
|
|
$
|
1,375
|
|
$
|
1,256
|
|
$
|
1,465
|
|
$
|
1,557
|
|
$
|
1,306
|
|
$
|
1,210
|
|
|||||||
|
Operating income
|
141
|
|
64
|
|
263
|
|
174
|
|
316
|
|
470
|
|
242
|
|
130
|
|
|||||||||||||||
|
Net income
|
94
|
|
37
|
|
165
|
|
104
|
|
198
|
|
289
|
|
148
|
|
78
|
|
|||||||||||||||
|
Basic earnings per share
(b)
|
0.69
|
|
0.26
|
|
1.20
|
|
0.75
|
|
1.47
|
|
2.07
|
|
1.12
|
|
0.56
|
|
|||||||||||||||
|
Diluted earnings per share
(b)
|
0.68
|
|
0.26
|
|
1.19
|
|
0.74
|
|
1.45
|
|
2.04
|
|
1.11
|
|
0.56
|
|
|||||||||||||||
|
(a)
|
In the third quarter of
2013
, the Company adopted Accounting Standards Update 2009-13, "Multiple-Deliverable Revenue Arrangements - a consensus of the FASB Emerging Issues Task Force" (ASU 2009-13).
|
|
(b)
|
For earnings per share, the sum of the quarters may not equal the total for the full year due to rounding.
|
50
REPORT OF INDEPENDENT REGISTERED PUBLIC ACCOUNTING FIRM
The Board of Directors and Shareholders
Alaska Air Group, Inc.:
We have audited the accompanying consolidated balance sheets of Alaska Air Group, Inc. and subsidiaries as of December 31, 2014 and 2013, and the related consolidated statements of operations, comprehensive operations, shareholders’ equity, and cash flows for each of the years in the three‑year period ended December 31, 2014. These consolidated financial statements are the responsibility of the Company’s management. Our responsibility is to express an opinion on these consolidated financial statements based on our audits.
We conducted our audits in accordance with the standards of the Public Company Accounting Oversight Board (United States). Those standards require that we plan and perform the audit to obtain reasonable assurance about whether the financial statements are free of material misstatement. An audit includes examining, on a test basis, evidence supporting the amounts and disclosures in the financial statements. An audit also includes assessing the accounting principles used and significant estimates made by management, as well as evaluating the overall financial statement presentation. We believe that our audits provide a reasonable basis for our opinion.
In our opinion, the consolidated financial statements referred to above present fairly, in all material respects, the financial position of Alaska Air Group, Inc. and subsidiaries as of December 31, 2014 and 2013, and the results of their operations and their cash flows for each of the years in the three‑year period ended December 31, 2014, in conformity with U.S. generally accepted accounting principles.
As discussed in Note 11 to the consolidated financial statements, the Company’s affinity card agreement was materially modified effective July 2, 2013. As a result, the Company changed its method of accounting for consideration received under this agreement in accordance with Accounting Standards Update No. 2009-13, Multiple Deliverable Revenue Arrangements, in 2013.
We also have audited, in accordance with the standards of the Public Company Accounting Oversight Board (United States), Alaska Air Group, Inc.’s internal control over financial reporting as of December 31, 2014, based on criteria established in
Internal Control - Integrated Framework
(2013)
issued by the Committee of Sponsoring Organizations of the Treadway Commission (COSO), and our report dated February 11, 2015 expressed an unqualified opinion on the effectiveness of the Company’s internal control over financial reporting.
/s/ KPMG LLP
Seattle, Washington
February 11, 2015
51
|
As of December 31
(in millions)
|
2014
|
2013
|
||||||
|
ASSETS
|
|
|
||||||
|
Current Assets
|
|
|
||||||
|
Cash and cash equivalents
|
$
|
107
|
|
$
|
80
|
|
||
|
Marketable securities
|
1,110
|
|
1,250
|
|
||||
|
Total cash and marketable securities
|
1,217
|
|
1,330
|
|
||||
|
Receivables - less allowance for doubtful accounts of $1 and $1
|
259
|
|
152
|
|
||||
|
Inventories and supplies - net
|
58
|
|
60
|
|
||||
|
Deferred income taxes
|
117
|
|
113
|
|
||||
|
Prepaid expenses and other current assets
|
105
|
|
107
|
|
||||
|
Total Current Assets
|
1,756
|
|
1,762
|
|
||||
|
Property and Equipment
|
|
|
|
|
||||
|
Aircraft and other flight equipment
|
5,165
|
|
4,677
|
|
||||
|
Other property and equipment
|
896
|
|
838
|
|
||||
|
Deposits for future flight equipment
|
555
|
|
446
|
|
||||
|
|
6,616
|
|
5,961
|
|
||||
|
Less accumulated depreciation and amortization
|
2,317
|
|
2,068
|
|
||||
|
Total Property and Equipment - Net
|
4,299
|
|
3,893
|
|
||||
|
Other Assets
|
126
|
|
183
|
|
||||
|
Total Assets
|
$
|
6,181
|
|
$
|
5,838
|
|
||
See accompanying notes to consolidated financial statements.
52
CONSOLIDATED BALANCE SHEETS -
(continued)
|
As of December 31
(in millions except share amounts)
|
2014
|
2013
|
||||||
|
LIABILITIES AND SHAREHOLDERS' EQUITY
|
|
|
||||||
|
Current Liabilities
|
|
|
||||||
|
Accounts payable
|
62
|
|
64
|
|
||||
|
Accrued wages, vacation and payroll taxes
|
232
|
|
211
|
|
||||
|
Air traffic liability
|
631
|
|
564
|
|
||||
|
Other accrued liabilities
|
629
|
|
624
|
|
||||
|
Current portion of long-term debt
|
117
|
|
117
|
|
||||
|
Total Current Liabilities
|
1,671
|
|
1,580
|
|
||||
|
Long-Term Debt, Net of Current Portion
|
686
|
|
754
|
|
||||
|
Other Liabilities and Credits
|
|
|
|
|
||||
|
Deferred income taxes
|
750
|
|
709
|
|
||||
|
Deferred revenue
|
374
|
|
335
|
|
||||
|
Obligation for pension and postretirement medical benefits
|
246
|
|
123
|
|
||||
|
Other liabilities
|
327
|
|
308
|
|
||||
|
|
1,697
|
|
1,475
|
|
||||
|
Commitments and Contingencies
|
|
|
|
|
||||
|
Shareholders' Equity
|
|
|
|
|
||||
|
Preferred stock, $0.01 par value Authorized: 5,000,000 shares, none issued or outstanding
|
—
|
|
—
|
|
||||
|
Common stock, $0.01 par value Authorized: 200,000,000 shares, Issued: 2014 - 131,556,573 shares; 2013 - 137,533,382 shares, Outstanding: 2014 - 131,481,473 shares; 2013 - 137,491,906 shares
|
1
|
|
1
|
|
||||
|
Capital in excess of par value
|
296
|
|
606
|
|
||||
|
Treasury stock (common), at cost: 2014 - 75,100 shares; 2013 - 41,476 shares
|
(4)
|
|
(2)
|
|
||||
|
Accumulated other comprehensive loss
|
(310)
|
|
(183)
|
|
||||
|
Retained earnings
|
2,144
|
|
1,607
|
|
||||
|
|
2,127
|
2,029
|
||||||
|
Total Liabilities and Shareholders' Equity
|
$
|
6,181
|
|
$
|
5,838
|
|
||
See accompanying notes to consolidated financial statements.
53
|
Year Ended December 31
(in millions, except per-share amounts)
|
2014
|
2013
|
2012
|
||||||||
|
Operating Revenues
|
|
|
|
||||||||
|
Passenger
|
|||||||||||
|
Mainline
|
$
|
3,774
|
|
$
|
3,490
|
|
$
|
3,284
|
|
||
|
Regional
|
805
|
|
777
|
|
746
|
|
|||||
|
Total passenger revenue
|
4,579
|
|
4,267
|
|
4,030
|
|
|||||
|
Freight and mail
|
114
|
|
113
|
|
111
|
|
|||||
|
Other - net
|
675
|
|
584
|
|
516
|
|
|||||
|
Special mileage plan revenue
|
—
|
|
192
|
|
—
|
|
|||||
|
Total Operating Revenues
|
5,368
|
|
5,156
|
|
4,657
|
|
|||||
|
Operating Expenses
|
|
|
|
|
|
|
|||||
|
Wages and benefits
|
1,136
|
|
1,086
|
|
1,038
|
|
|||||
|
Variable incentive pay
|
116
|
|
105
|
|
88
|
|
|||||
|
Aircraft fuel, including hedging gains and losses
|
1,418
|
|
1,467
|
|
1,459
|
|
|||||
|
Aircraft maintenance
|
229
|
|
247
|
|
222
|
|
|||||
|
Aircraft rent
|
110
|
|
119
|
|
116
|
|
|||||
|
Landing fees and other rentals
|
279
|
|
262
|
|
243
|
|
|||||
|
Contracted services
|
254
|
|
221
|
|
200
|
|
|||||
|
Selling expenses
|
199
|
|
179
|
|
168
|
|
|||||
|
Depreciation and amortization
|
294
|
|
270
|
|
264
|
|
|||||
|
Food and beverage service
|
93
|
|
84
|
|
79
|
|
|||||
|
Other
|
308
|
|
278
|
|
248
|
|
|||||
|
Special items
|
(30
|
)
|
—
|
|
—
|
|
|||||
|
Total Operating Expenses
|
4,406
|
|
4,318
|
|
4,125
|
|
|||||
|
Operating Income
|
962
|
|
838
|
|
532
|
|
|||||
|
Nonoperating Income (Expense)
|
|
|
|
|
|
|
|||||
|
Interest income
|
21
|
|
18
|
|
19
|
|
|||||
|
Interest expense
|
(48
|
)
|
(56
|
)
|
(64
|
)
|
|||||
|
Interest capitalized
|
20
|
|
21
|
|
18
|
|
|||||
|
Other - net
|
20
|
|
(5
|
)
|
9
|
|
|||||
|
|
13
|
|
(22
|
)
|
(18
|
)
|
|||||
|
Income before income tax
|
975
|
|
816
|
|
514
|
|
|||||
|
Income tax expense
|
370
|
|
308
|
|
198
|
|
|||||
|
Net Income
|
$
|
605
|
|
$
|
508
|
|
$
|
316
|
|
||
|
Basic Earnings Per Share:
|
$
|
4.47
|
|
$
|
3.63
|
|
$
|
2.23
|
|
||
|
Diluted Earnings Per Share:
|
$
|
4.42
|
|
$
|
3.58
|
|
$
|
2.20
|
|
||
|
Shares used for computation:
|
|
|
|
|
|||||||
|
Basic
|
135.445
|
|
139.910
|
|
141.416
|
|
|||||
|
Diluted
|
136.801
|
|
141.878
|
|
143.568
|
|
|||||
|
Cash dividend declared per share
|
$
|
0.50
|
|
$
|
0.20
|
|
$
|
—
|
|
||
See accompanying notes to consolidated financial statements.
54
CONSOLIDATED STATEMENTS OF COMPREHENSIVE OPERATIONS
|
Year Ended December 31 (in millions)
|
2014
|
2013
|
2012
|
||||||||
|
Net Income
|
$
|
605
|
|
$
|
508
|
|
$
|
316
|
|
||
|
Other Comprehensive Income (Loss):
|
|||||||||||
|
Related to marketable securities:
|
|||||||||||
|
Unrealized holding gains (losses) arising during the period
|
2
|
|
(9
|
)
|
9
|
|
|||||
|
Reclassification of (gains) losses into Other-net nonoperating income (expense)
|
(2
|
)
|
(2
|
)
|
(7
|
)
|
|||||
|
Income tax benefit (expense)
|
—
|
|
4
|
|
(1
|
)
|
|||||
|
Total
|
—
|
|
(7
|
)
|
1
|
|
|||||
|
Related to employee benefit plans:
|
|||||||||||
|
Actuarial gains/(losses) related to pension and other post retirement benefit plans
|
(210
|
)
|
358
|
|
(107
|
)
|
|||||
|
Reclassification of net pension expense into Wages and benefits
|
9
|
|
42
|
|
39
|
|
|||||
|
Income tax benefit (expense)
|
76
|
|
(150
|
)
|
25
|
|
|||||
|
Total
|
(125
|
)
|
250
|
|
(43
|
)
|
|||||
|
Related to interest rate derivative instruments:
|
|||||||||||
|
Unrealized holding gains (losses) arising during the period
|
(8
|
)
|
10
|
|
(10
|
)
|
|||||
|
Reclassification of (gains) losses into Aircraft rent
|
6
|
|
6
|
|
6
|
|
|||||
|
Income tax benefit (expense)
|
—
|
|
(6
|
)
|
—
|
|
|||||
|
Total
|
(2
|
)
|
10
|
|
(4
|
)
|
|||||
|
Other Comprehensive Income (Loss)
|
(127
|
)
|
253
|
|
(46
|
)
|
|||||
|
Comprehensive Income
|
$
|
478
|
|
$
|
761
|
|
$
|
270
|
|
||
See accompanying notes to consolidated financial statements.
55
CONSOLIDATED STATEMENTS OF SHAREHOLDERS' EQUITY
|
(in millions)
|
Common Stock Outstanding
|
Common Stock
|
Capital in Excess of Par Value
|
Treasury Stock
|
Accumulated Other Comprehensive Income (Loss)
|
Retained Earnings
|
Total
|
|||||||||||||||||||
|
Balances at December 31, 2011
|
141.900
|
|
$
|
1
|
|
$
|
877
|
|
$
|
(125
|
)
|
$
|
(390
|
)
|
$
|
811
|
|
$
|
1,174
|
|
||||||
|
2012 net income
|
—
|
|
—
|
|
—
|
|
—
|
|
—
|
|
316
|
|
316
|
|
||||||||||||
|
Other comprehensive income/(loss)
|
—
|
|
—
|
|
—
|
|
—
|
|
(46
|
)
|
—
|
|
(46
|
)
|
||||||||||||
|
Common stock repurchase
|
(3.372
|
)
|
—
|
|
(60
|
)
|
—
|
|
—
|
|
—
|
|
(60
|
)
|
||||||||||||
|
Stock-based compensation
|
—
|
|
—
|
|
15
|
|
—
|
|
—
|
|
—
|
|
15
|
|
||||||||||||
|
Retirement of treasury stock
|
—
|
|
—
|
|
(125
|
)
|
125
|
|
—
|
|
—
|
|
—
|
|
||||||||||||
|
Stock issued for employee stock purchase plan
|
0.314
|
|
—
|
|
4
|
|
—
|
|
—
|
|
—
|
|
4
|
|
||||||||||||
|
Stock issued under stock plans
|
1.912
|
|
—
|
|
18
|
|
—
|
|
—
|
|
—
|
|
18
|
|
||||||||||||
|
Balances at December 31, 2012
|
140.754
|
|
1
|
|
729
|
|
—
|
|
(436
|
)
|
1,127
|
|
1,421
|
|
||||||||||||
|
2013 net income
|
—
|
|
—
|
|
—
|
|
—
|
|
—
|
|
508
|
|
508
|
|
||||||||||||
|
Other comprehensive income/(loss)
|
—
|
|
—
|
|
—
|
|
—
|
|
253
|
|
—
|
|
253
|
|
||||||||||||
|
Common stock repurchase
|
(4.984
|
)
|
—
|
|
(157
|
)
|
(2
|
)
|
—
|
|
—
|
|
(159
|
)
|
||||||||||||
|
Stock-based compensation
|
—
|
|
—
|
|
16
|
|
—
|
|
—
|
|
—
|
|
16
|
|
||||||||||||
|
Cash dividend declared
|
—
|
|
—
|
|
—
|
|
—
|
|
—
|
|
(28
|
)
|
(28
|
)
|
||||||||||||
|
Stock issued for employee stock purchase plan
|
0.342
|
|
—
|
|
6
|
|
—
|
|
—
|
|
—
|
|
6
|
|
||||||||||||
|
Stock issued under stock plans
|
1.380
|
|
—
|
|
12
|
|
—
|
|
—
|
|
—
|
|
12
|
|
||||||||||||
|
Balances at December 31, 2013
|
137.492
|
|
1
|
|
606
|
|
(2
|
)
|
(183
|
)
|
1,607
|
|
2,029
|
|
||||||||||||
|
2014 net income
|
—
|
|
—
|
|
—
|
|
—
|
|
—
|
|
605
|
|
605
|
|
||||||||||||
|
Other comprehensive income/(loss)
|
—
|
|
—
|
|
—
|
|
—
|
|
(127
|
)
|
—
|
|
(127
|
)
|
||||||||||||
|
Common stock repurchase
|
(7.317
|
)
|
—
|
|
(346
|
)
|
(2
|
)
|
—
|
|
—
|
|
(348
|
)
|
||||||||||||
|
Stock-based compensation
|
—
|
|
—
|
|
16
|
|
—
|
|
—
|
|
—
|
|
16
|
|
||||||||||||
|
Cash dividend declared
|
—
|
|
—
|
|
—
|
|
—
|
|
—
|
|
(68
|
)
|
(68
|
)
|
||||||||||||
|
Stock issued for employee stock purchase plan
|
0.299
|
|
—
|
|
9
|
|
—
|
|
—
|
|
—
|
|
9
|
|
||||||||||||
|
Stock issued under stock plans
|
1.007
|
|
—
|
|
11
|
|
—
|
|
—
|
|
—
|
|
11
|
|
||||||||||||
|
Balances at December 31, 2014
|
131.481
|
|
$
|
1
|
|
$
|
296
|
|
$
|
(4
|
)
|
$
|
(310
|
)
|
$
|
2,144
|
|
$
|
2,127
|
|
||||||
See accompanying notes to consolidated financial statements.
56
|
Year Ended December 31
(in millions)
|
2014
|
2013
|
2012
|
|||||||||
|
Cash flows from operating activities:
|
|
|
|
|||||||||
|
Net income
|
$
|
605
|
|
$
|
508
|
|
$
|
316
|
|
|||
|
Adjustments to reconcile net income to net cash provided by operating activities:
|
|
|
|
|
|
|
||||||
|
Special mileage plan accounting adjustment
|
—
|
|
(192
|
)
|
—
|
|
||||||
|
Depreciation and amortization
|
294
|
|
270
|
|
264
|
|
||||||
|
Stock-based compensation and other
|
6
|
|
32
|
|
10
|
|
||||||
|
Changes in certain assets and liabilities:
|
||||||||||||
|
Changes in deferred tax provision
|
114
|
|
146
|
|
94
|
|
||||||
|
(Increase) decrease in accounts receivable
|
(110
|
)
|
(19
|
)
|
9
|
|
||||||
|
Increase (decrease) in air traffic liability
|
67
|
|
29
|
|
45
|
|
||||||
|
Increase (decrease) in deferred revenue
|
40
|
|
84
|
|
33
|
|
||||||
|
Changes in pension and other postretirement benefits
|
(18
|
)
|
62
|
|
71
|
|
||||||
|
Other - net
|
32
|
|
148
|
|
25
|
|
||||||
|
Pension contribution
|
—
|
|
(87
|
)
|
(114
|
)
|
||||||
|
Net cash provided by operating activities
|
1,030
|
|
981
|
|
753
|
|
||||||
|
Cash flows from investing activities:
|
|
|
|
|
|
|
||||||
|
Property and equipment additions:
|
|
|
|
|
|
|
||||||
|
Aircraft and aircraft purchase deposits
|
(498
|
)
|
(487
|
)
|
(455
|
)
|
||||||
|
Other flight equipment
|
(131
|
)
|
(41
|
)
|
(24
|
)
|
||||||
|
Other property and equipment
|
(65
|
)
|
(38
|
)
|
(39
|
)
|
||||||
|
Total property and equipment additions
|
(694
|
)
|
(566
|
)
|
(518
|
)
|
||||||
|
Assets constructed for others (Terminal 6 at LAX)
|
—
|
|
—
|
|
(56
|
)
|
||||||
|
Purchases of marketable securities
|
(949
|
)
|
(1,218
|
)
|
(1,130
|
)
|
||||||
|
Sales and maturities of marketable securities
|
1,092
|
|
1,089
|
|
1,048
|
|
||||||
|
Proceeds from disposition of assets and changes in restricted deposits
|
10
|
|
(3
|
)
|
11
|
|
||||||
|
Net cash used in investing activities
|
(541
|
)
|
(698
|
)
|
(645
|
)
|
||||||
|
Cash flows from financing activities:
|
|
|
|
|
|
|
||||||
|
Proceeds from issuance of long-term debt
|
51
|
|
—
|
|
—
|
|
||||||
|
Long-term debt payments
|
(119
|
)
|
(161
|
)
|
(275
|
)
|
||||||
|
Common stock repurchases
|
(348
|
)
|
(159
|
)
|
(60
|
)
|
||||||
|
Cash dividend paid
|
(68
|
)
|
(28
|
)
|
—
|
|
||||||
|
Proceeds and tax benefit from issuance of common stock
|
27
|
|
24
|
|
31
|
|
||||||
|
Terminal 6 at LAX reimbursement
|
—
|
|
2
|
|
178
|
|
||||||
|
Other financing activities
|
(5
|
)
|
(3
|
)
|
38
|
|
||||||
|
Net cash used in financing activities
|
(462
|
)
|
(325
|
)
|
(88
|
)
|
||||||
|
Net increase (decrease) in cash and cash equivalents
|
27
|
|
(42
|
)
|
20
|
|
||||||
|
Cash and cash equivalents at beginning of year
|
80
|
|
122
|
|
102
|
|
||||||
|
Cash and cash equivalents at end of year
|
$
|
107
|
|
$
|
80
|
|
$
|
122
|
|
|||
|
Supplemental disclosure:
|
|
|
|
|
|
|
||||||
|
Cash paid during the year for:
|
||||||||||||
|
Interest
|
$
|
28
|
|
$
|
35
|
|
$
|
46
|
|
|||
|
Income taxes
|
326
|
|
149
|
|
78
|
|
||||||
See accompanying notes to consolidated financial statements.
57
NOTES TO CONSOLIDATED FINANCIAL STATEMENTS
Alaska Air Group, Inc.
December 31, 2014
Organization and Basis of Presentation
The consolidated financial statements include the accounts of Alaska Air Group, Inc. (Air Group or the Company) and its subsidiaries, Alaska Airlines, Inc. (Alaska) and Horizon Air Industries, Inc. (Horizon), through which the Company conducts substantially all of its operations. All significant intercompany balances and transactions have been eliminated. These financial statements have been prepared in conformity with accounting principles generally accepted in the United States of America and their preparation requires the use of management’s estimates. Actual results may differ from these estimates.
Certain reclassifications, such as changes in our equity structure, have been made to prior year financial statements to conform to classifications used in the current year.
Cash and Cash Equivalents
Cash equivalents consist of highly liquid investments with original maturities of three months or less, such as money market funds, commercial paper and certificates of deposit. They are carried at cost, which approximates market value. The Company reduces cash balances when funds are disbursed. Due to the time delay in funds clearing the banks, the Company normally maintains a negative balance in its cash disbursement accounts, which is reported as a current liability. The amount of the negative cash balance was
$7 million
and
$11 million
at
December 31, 2014
and
2013
, respectively, and is included in accounts payable, with the change in the balance during the year included in other financing activities in the consolidated statements of cash flows.
The Company has restricted cash balances primarily used to guarantee various letters of credit, self-insurance programs, or other contractual rights. Restricted cash consists of highly liquid securities with original maturities of three months or less. They are carried at cost, which approximates fair value.
Marketable Securities
Investments with original maturities of greater than three months and remaining maturities of less than one year are classified as short-term investments. Investments with maturities beyond one year may be classified as short-term based on their highly liquid nature and because such marketable securities represent the investment of cash that is available for current operations. All cash equivalents and short-term investments are classified as available-for-sale and realized gains and losses are recorded using the specific identification method. Changes in market value, excluding other-than-temporary impairments, are reflected in accumulated other comprehensive loss (AOCL).
Investments are considered to be impaired when a decline in fair value is judged to be other-than-temporary. The Company uses a systematic methodology that considers available quantitative and qualitative evidence in evaluating potential impairment. If the cost of an investment exceeds its fair value, management evaluates, among other factors, general market conditions, credit quality of debt instrument issuers, the duration and extent to which the fair value is less than cost, our intent and ability to hold, or plans to sell, the investment. Once a decline in fair value is determined to be other-than-temporary, an impairment charge is recorded to Other-net in the consolidated statements of operations and a new cost basis in the investment is established.
Receivables
Receivables are due on demand and consist primarily of airline traffic (including credit card) receivables, Mileage Plan™ partners, amounts due from other airlines related to interline agreements, government tax authorities, and other miscellaneous amounts due to the Company, and are net of an allowance for doubtful accounts. Management determines the allowance for doubtful accounts based on known troubled accounts and historical experience applied to an aging of accounts.
58
Inventories and Supplies—net
Expendable aircraft parts, materials and supplies are stated at average cost and are included in inventories and supplies
—
net. An obsolescence allowance for expendable parts is accrued based on estimated lives of the corresponding fleet type and salvage values. The allowance for all non-surplus expendable inventories was $
34 million
and
$30 million
at
December 31, 2014
and
2013
, respectively. Inventory and supplies
—
net also includes fuel inventory of $
21 million
and
$23 million
at
December 31, 2014
and
2013
, respectively. Repairable and rotable aircraft parts inventories are included in flight equipment.
Property, Equipment and Depreciation
Property and equipment are recorded at cost and depreciated using the straight-line method over their estimated useful lives less an estimated salvage value, which are as follows:
|
Aircraft and related flight equipment:
|
|
|
Boeing 737 aircraft
|
20 years
|
|
Bombardier Q400
|
15 years
|
|
Buildings
|
25-30 years
|
|
Minor building and land improvements
|
10 years
|
|
Capitalized leases and leasehold improvements
|
Shorter of lease term or
estimated useful life
|
|
Computer hardware and software
|
3-5 years
|
|
Other furniture and equipment
|
5-10 years
|
Salvage values used for aircraft are 10% of the fair value, but as aircraft near the end of their useful lives, we update the salvage value estimates based on current market conditions and expected use of the aircraft. “Related flight equipment” includes rotable and repairable spare inventories, which are depreciated over the associated fleet life unless otherwise noted.
Capitalized interest is based on the Company’s weighted-average borrowing rate, is added to the cost of the related asset, and is depreciated over the estimated useful life of the asset.
Maintenance and repairs, other than engine maintenance on some B737-700 and -900 engines, are expensed when incurred. Major modifications that extend the life or improve the usefulness of aircraft are capitalized and depreciated over their estimated period of use. Maintenance on some B737-700 and -900 engines is covered under power-by-the-hour agreements with third parties, whereby the Company pays a determinable amount, and transfers risk, to a third party. The Company expenses the contract amounts based on engine usage.
The Company evaluates long-lived assets to be held and used for impairment whenever events or changes in circumstances indicate that the total carrying amount of an asset or asset group may not be recoverable. The Company groups assets for purposes of such reviews at the lowest level for which identifiable cash flows of the asset group are largely independent of the cash flows of other groups of assets and liabilities. An impairment loss is considered when estimated future undiscounted cash flows expected to result from the use of the asset or asset group and its eventual disposition are less than its carrying amount. If the asset or asset group is not considered recoverable, a write-down equal to the excess of the carrying amount over the fair value will be recorded.
Internally Used Software Costs
The Company capitalizes costs to develop internal-use software that are incurred in the application development stage. Amortization commences when the software is ready for its intended use and the amortization period is the estimated useful life of the software, generally three to five years. Capitalized costs primarily include contract labor and payroll costs of the individuals dedicated to the development of internal-use software.
Deferred Revenue
Deferred revenue results primarily from the sale of Mileage Plan™ miles to third-parties. This revenue is recognized when award transportation is provided or over the term of the applicable agreement.
59
Operating Leases
The Company leases aircraft, airport and terminal facilities, office space, and other equipment under operating leases. Some of these lease agreements contain rent escalation clauses or rent holidays. For scheduled rent escalation clauses during the lease terms or for rental payments commencing at a date other than the date of initial occupancy, the Company records minimum rental expenses on a straight-line basis over the terms of the leases in the consolidated statements of operations.
Leased Aircraft Return Costs
Cash payments associated with returning leased aircraft are accrued when it is probable that a cash payment will be made and that amount is reasonably estimable. Any accrual is based on the time remaining on the lease, planned aircraft usage and the provisions included in the lease agreement, although the actual amount due to any lessor upon return will not be known with certainty until lease termination.
As leased aircraft are returned, any payments are charged against the established accrual. The accrual is part of other current and long-term liabilities, and was
$1 million
and
$15 million
as of
December 31, 2014
and
December 31, 2013
, respectively.
Revenue Recognition
Passenger revenue is recognized when the passenger travels. Tickets sold but not yet used are reported as air traffic liability until travel or date of expiration. Air traffic liability includes approximately
$33 million
and
$26 million
related to travel credits for future travel, as of
December 31, 2014
and
December 31, 2013
, respectively. These credits are recognized into revenue either when the passenger travels or the date of expiration, which is twelve months from issuance. Commissions to travel agents and related fees are expensed when the related revenue is recognized. Passenger traffic commissions and related fees not yet recognized are included as a prepaid expense. Taxes collected from passengers, including transportation excise taxes, airport and security fees and other fees, are recorded on a net basis within passenger revenue in the consolidated statements of operations. Due to complex pricing structures, refund and exchange policies, and interline agreements with other airlines, certain amounts are recognized as revenue using estimates regarding both the timing of the revenue recognition and the amount of revenue to be recognized. These estimates are based on the Company’s historical data.
Freight and mail revenues are recognized when service is provided.
Other - net revenues are primarily related to the Mileage Plan™ and they are recognized as described in the “Mileage Plan” paragraph below. Other - net also includes certain ancillary or non-ticket revenues, such as checked-bag fees, reservations fees, ticket change fees, on-board food and beverage sales, and to a much lesser extent commissions from car and hotel vendors, and from the sales of travel insurance. These items are recognized as revenue when the related services are provided. Boardroom (airport lounge) memberships are recognized as revenue over the membership period.
Mileage Plan
Alaska operates a frequent flier program (“Mileage Plan™”) that provides travel awards to members based on accumulated mileage. For miles earned by flying on Alaska or Horizon and through airline partners, the estimated cost of providing award travel is recognized as a selling expense and accrued as a liability as miles are earned and accumulated.
Alaska also sells services, including miles for transportation, to non-airline partners, such as hotels, car rental agencies, and a major bank that offers Alaska Airlines affinity credit cards. The Company defers passenger revenue related to air transportation and certificates for discounted companion travel until the transportation is delivered. The deferred proceeds are recognized as passenger revenue for awards redeemed and flown on Alaska or Horizon, and as Other-net revenue for awards redeemed and flown on other airlines (less the cost paid to the other airlines based on contractual agreements). For the elements that represent use of the Alaska Airlines brand and access to frequent flier member lists and advertising, it is recognized as commission income in the period that those elements are sold and included in Other - net revenue in the consolidated statements of operations.
60
Alaska’s Mileage Plan™ deferred revenue and liabilities on the consolidated balance sheets (in millions):
|
2014
|
2013
|
||||||
|
Current Liabilities:
|
|
|
|||||
|
Other accrued liabilities
|
$
|
343
|
|
$
|
314
|
|
|
|
Other Liabilities and Credits:
|
|
|
|
|
|||
|
Deferred revenue
|
367
|
|
323
|
|
|||
|
Other liabilities
|
20
|
|
19
|
|
|||
|
Total
|
$
|
730
|
|
$
|
656
|
|
|
The amounts recorded in other accrued liabilities relate primarily to deferred revenue expected to be realized within one year, which includes Mileage Plan™ awards that have been issued but not yet flown for $
33 million
and
$31 million
at
December 31, 2014
and
2013
, respectively.
Alaska’s Mileage Plan™ revenue included in the consolidated statements of operations (in millions):
|
|
2014
|
2013
|
2012
|
||||||||
|
Passenger revenues
|
$
|
246
|
|
$
|
208
|
|
$
|
183
|
|
||
|
Other-net revenues
|
295
|
|
256
|
|
209
|
|
|||||
|
Special mileage plan revenue
(a)
|
—
|
|
192
|
|
—
|
|
|||||
|
Total Mileage Plan revenues
|
$
|
541
|
|
$
|
656
|
|
$
|
392
|
|
||
|
(a)
|
Refer to Note 11 for further information.
|
Other
—
net revenue includes commission revenues of
$261 million
,
$213 million
, and
$143 million
in
2014
,
2013
, and
2012
, respectively.
Selling Expenses
Selling expenses include credit card fees, global distribution systems charges, the estimated cost of Mileage Plan™ travel awards earned through air travel, advertising, promotional costs, commissions, and incentives. Advertising production costs are expensed the first time the advertising takes place. Advertising expense was $
49 million
,
$28 million
, and
$26 million
during the years ended
December 31, 2014
,
2013
, and
2012
, respectively.
Derivative Financial Instruments
The Company's operations are significantly impacted by changes in aircraft fuel prices and interest rates. In an effort to manage our exposure to these risks, the Company periodically enters into fuel and interest rate derivative instruments. These derivative instruments are recognized at fair value on the balance sheet and changes in the fair value is recognized in AOCL or in the consolidated statements of operations, depending on the nature of the instrument.
The Company does not hold or issue derivative fuel hedge contracts for trading purposes and does not apply hedge accounting. For cash flow hedges related to our interest rate swaps, the effective portion of the derivative represents the change in fair value of the hedge that offsets the change in fair value of the hedged item. To the extent the change in the fair value of the hedge does not perfectly offset the change in the fair value of the hedged item, the ineffective portion of the hedge is immediately recognized in interest expense.
Fair Value Measurements
Accounting standards define fair value as the exchange price that would be received for an asset or paid to transfer a liability (an exit price) in the principal or most advantageous market for the asset or liability in an orderly transaction between market participants on the measurement date. The standards also establish a fair value hierarchy, which requires an entity to maximize the use of observable inputs and minimize the use of unobservable inputs when measuring fair value. There are three levels of inputs that may be used to measure fair value:
Level 1
- Quoted prices in active markets for identical assets or liabilities.
61
Level 2
- Observable inputs other than Level 1 prices such as quoted prices for similar assets or liabilities, quoted prices in markets that are not active, or other inputs that are observable or can be corroborated by observable market data for substantially the full term of the assets or liabilities.
Level 3
- Unobservable inputs that are supported by little or no market activity and that are significant to the fair value of the assets or liabilities.
The Company has elected not to use the Fair Value Option for non-financial instruments, and accordingly those assets and liabilities are carried at amortized cost. For financial instruments, those assets and liabilities are carried at fair value and are determined based on the market approach or income approach depending upon the level of inputs used.
Income Taxes
The Company uses the asset and liability approach for accounting and reporting income taxes. Deferred tax assets and liabilities are recognized for future tax consequences attributable to differences between the financial statement carrying amounts of existing assets and liabilities and their respective tax bases, and for operating loss and tax credit carryforwards. Deferred tax assets and liabilities are measured using enacted tax rates expected to apply to taxable income in the years in which those temporary differences are expected to be recovered or settled. The effect on deferred tax assets and liabilities of a change in tax rates is recognized in the period that includes the enactment date. A valuation allowance would be established, if necessary, for the amount of any tax benefits that, based on available evidence, are not expected to be realized. The Company accounts for unrecognized tax benefits in accordance with the accounting standards.
Stock-Based Compensation
Accounting standards require companies to recognize as expense the fair value of stock options and other equity-based compensation issued to employees as of the grant date. These standards apply to all stock awards that the Company grants to employees as well as the Company’s Employee Stock Purchase Plan (ESPP), which features a look-back provision and allows employees to purchase stock at a
15%
discount. All stock-based compensation expense is recorded in wages and benefits in the consolidated statements of operations.
Earnings Per Share (EPS)
Diluted EPS is calculated by dividing net income by the average common shares outstanding plus additional common shares that would have been outstanding assuming the exercise of in-the-money stock options and restricted stock units, using the treasury-stock method. In
2014
,
2013
, and
2012
, antidilutive stock options excluded from the calculation of EPS were not material.
Recently Issued Accounting Pronouncements
In May 2014, the FASB issued Accounting Standard Update 2014-09, "Revenue from Contracts with Customers" (ASU 2014-09), which requires an entity to recognize the amount of revenue to which it expects to be entitled for the transfer of promised goods or services to customers. The ASU will replace most existing revenue recognition guidance in U.S. GAAP when it becomes effective. The new standard is effective for the Company on January 1, 2017. Early adoption is not permitted. The standard permits the use of either the retrospective or cumulative effect transition method. The Company is evaluating the effect that ASU 2014-09 will have on its consolidated financial statements and related disclosures. The Company has not yet selected a transition method nor has it determined the effect of the standard on its ongoing financial reporting.
62
Components for cash, cash equivalents and marketable securities (in millions):
|
December 31, 2014
|
Cost Basis
|
Unrealized Gains
|
Unrealized Losses
|
Fair Value
|
|||||||||||
|
Cash
|
$
|
4
|
|
$
|
—
|
|
$
|
—
|
|
$
|
4
|
|
|||
|
Cash equivalents
|
103
|
|
—
|
|
—
|
|
103
|
|
|||||||
|
Cash and cash equivalents
|
107
|
|
—
|
|
—
|
|
107
|
|
|||||||
|
U.S. government and agency securities
|
166
|
|
—
|
|
—
|
|
166
|
|
|||||||
|
Foreign government bonds
|
25
|
|
—
|
|
—
|
|
25
|
|
|||||||
|
Asset-backed securities
|
130
|
|
—
|
|
—
|
|
130
|
|
|||||||
|
Mortgage-backed securities
|
127
|
|
—
|
|
(1
|
)
|
126
|
|
|||||||
|
Corporate notes and bonds
|
644
|
|
3
|
|
(2
|
)
|
645
|
|
|||||||
|
Municipal securities
|
18
|
|
—
|
|
—
|
|
18
|
|
|||||||
|
Marketable securities
|
1,110
|
|
3
|
|
(3
|
)
|
1,110
|
|
|||||||
|
Total
|
$
|
1,217
|
|
$
|
3
|
|
$
|
(3
|
)
|
$
|
1,217
|
|
|||
|
December 31, 2013
|
Cost Basis
|
Unrealized Gains
|
Unrealized Losses
|
Fair Value
|
|||||||||||
|
Cash
|
$
|
9
|
|
$
|
—
|
|
$
|
—
|
|
$
|
9
|
|
|||
|
Cash equivalents
|
71
|
|
—
|
|
—
|
|
71
|
|
|||||||
|
Cash and cash equivalents
|
80
|
|
—
|
|
—
|
|
80
|
|
|||||||
|
U.S. government and agency securities
|
295
|
|
1
|
|
(2
|
)
|
294
|
|
|||||||
|
Foreign government bonds
|
11
|
|
—
|
|
—
|
|
11
|
|
|||||||
|
Asset-backed securities
|
146
|
|
—
|
|
—
|
|
146
|
|
|||||||
|
Mortgage-backed securities
|
144
|
|
1
|
|
(2
|
)
|
143
|
|
|||||||
|
Corporate notes and bonds
|
628
|
|
4
|
|
(2
|
)
|
630
|
|
|||||||
|
Municipal securities
|
26
|
|
—
|
|
—
|
|
26
|
|
|||||||
|
Marketable securities
|
1,250
|
|
6
|
|
(6
|
)
|
1,250
|
|
|||||||
|
Total
|
$
|
1,330
|
|
$
|
6
|
|
$
|
(6
|
)
|
$
|
1,330
|
|
|||
Unrealized losses from fixed-income securities are primarily attributable to changes in interest rates. Management does not believe any remaining unrealized losses represent other-than-temporary impairments based on our evaluation of available evidence as of
December 31, 2014
.
Activity for marketable securities (in millions):
|
|
2014
|
2013
|
2012
|
||||||||
|
Proceeds from sales and maturities
|
$
|
1,092
|
|
$
|
1,089
|
|
$
|
1,048
|
|
||
|
Gross realized gains
|
4
|
|
4
|
|
9
|
|
|||||
|
Gross realized losses
|
(2
|
)
|
(2
|
)
|
(2
|
)
|
|||||
Maturities for marketable securities (in millions):
|
December 31, 2014
|
Cost Basis
|
Fair Value
|
|||||
|
Due in one year or less
|
$
|
141
|
|
$
|
140
|
|
|
|
Due after one year through five years
|
958
|
|
959
|
|
|||
|
Due after five years through 10 years
|
10
|
|
10
|
|
|||
|
Due after 10 years
|
1
|
|
1
|
|
|||
|
Total
|
$
|
1,110
|
|
$
|
1,110
|
|
|
63
Fuel Hedge Contracts
The Company’s operations are inherently dependent upon the price and availability of aircraft fuel. To manage economic risks associated with fluctuations in aircraft fuel prices, the Company periodically enters into call options for crude oil.
As of
December 31, 2014
, the Company had fuel hedge contracts outstanding covering
246 million
gallons of crude oil that will be settled from
January 2015
to
June 2016
. Refer to the contractual obligations and commitments section of Item 7 for further information.
Interest Rate Swap Agreements
The Company has interest rate swap agreements with a third party designed to hedge the volatility of the underlying variable interest rate in the Company's aircraft lease agreements for
six
Boeing 737-800 aircraft. The agreements stipulate that the Company pay a fixed interest rate over the term of the contract and receive a floating interest rate. All significant terms of the swap agreement match the terms of the lease agreements, including interest-rate index, rate reset dates, termination dates and underlying notional values. The agreements expire from
February 2020
through
March 2021
to coincide with the lease termination dates.
Fair Values of Derivative Instruments
Fair values of derivative instruments on the consolidated balance sheet (in millions):
|
2014
|
2013
|
||||||
|
Derivative Instruments Not Designated as Hedges
|
|||||||
|
Fuel hedge contracts
|
|||||||
|
Fuel hedge contracts, current assets
|
$
|
3
|
|
$
|
12
|
|
|
|
Fuel hedge contracts, noncurrent assets
|
4
|
|
4
|
|
|||
|
Derivative Instruments Designated as Hedges
|
|||||||
|
Interest rate swaps
|
|||||||
|
Other accrued liabilities
|
(6
|
)
|
(7
|
)
|
|||
|
Other liabilities
|
(13
|
)
|
(10
|
)
|
|||
|
Losses in accumulated other comprehensive loss (AOCL)
|
(19
|
)
|
(17
|
)
|
|||
The net cash received (paid) for new positions and settlements was
$(9) million
,
$5 million
, and
$(19) million
during
2014
,
2013
, and
2012
, respectively.
Pretax effect of derivative instruments on earnings and AOCL (in millions):
|
2014
|
2013
|
2012
|
|||||||||
|
Derivative Instruments Not Designated as Hedges
|
|||||||||||
|
Fuel hedge contracts
|
|||||||||||
|
Gains (losses) recognized in aircraft fuel expense
|
$
|
(18
|
)
|
$
|
(44
|
)
|
$
|
(62
|
)
|
||
|
Derivative Instruments Designated as Hedges
|
|||||||||||
|
Interest rate swaps
|
|||||||||||
|
Gains (losses) recognized in aircraft rent
|
(6
|
)
|
(6
|
)
|
(6
|
)
|
|||||
|
Gains (losses) recognized in other comprehensive income (OCI)
|
(8
|
)
|
10
|
|
(10
|
)
|
|||||
The amounts shown as recognized in aircraft rent for cash flow hedges (interest rate swaps) represent the realized losses transferred out of AOCL to aircraft rent. The amounts shown as recognized in OCI are prior to the losses recognized in aircraft rent during the period. The Company expects
$6 million
to be reclassified from OCI to aircraft rent within the next twelve months.
64
Credit Risk and Collateral
The Company is exposed to credit losses in the event of non-performance by counterparties to these derivative instruments. To mitigate exposure, the Company periodically reviews the risk of counterparty nonperformance by monitoring the absolute exposure levels and credit ratings. The Company maintains security agreements with a number of its counterparties which may require the Company to post collateral if the fair value of the selected derivative instruments fall below specified mark-to-market thresholds. The posted collateral does not offset the fair value of the derivative instruments and is included in "Prepaid expenses and other current assets" on the consolidated balance sheet.
The Company posted collateral of
$3 million
,
$7 million
and
$15 million
as of
December 31, 2014
,
2013
and
2012
, respectively. The collateral was provided to a counterparty associated with the net liability position of the interest rate swap agreements offset by the net asset position of the fuel hedge contracts under a master netting arrangement.
Fair Value of Financial Instruments on a Recurring Basis
Fair values of financial instruments on the consolidated balance sheet (in millions):
|
December 31, 2014
|
Level 1
|
Level 2
|
Total
|
||||||||
|
Assets
|
|||||||||||
|
Marketable securities
|
|||||||||||
|
U.S. government and agency securities
|
$
|
166
|
|
$
|
—
|
|
$
|
166
|
|
||
|
Foreign government bonds
|
—
|
|
25
|
|
25
|
|
|||||
|
Asset-backed securities
|
—
|
|
130
|
|
130
|
|
|||||
|
Mortgage-backed securities
|
—
|
|
126
|
|
126
|
|
|||||
|
Corporate notes and bonds
|
—
|
|
645
|
|
645
|
|
|||||
|
Municipal securities
|
—
|
|
18
|
|
18
|
|
|||||
|
Derivative instruments
|
|||||||||||
|
Fuel hedge contracts
|
|||||||||||
|
Call options
|
—
|
|
7
|
|
7
|
|
|||||
|
Liabilities
|
|||||||||||
|
Derivative instruments
|
|||||||||||
|
Interest rate swap agreements
|
—
|
|
(19
|
)
|
(19
|
)
|
|||||
65
|
December 31, 2013
|
Level 1
|
Level 2
|
Total
|
||||||||
|
Assets
|
|||||||||||
|
Marketable securities
|
|||||||||||
|
U.S. government and agency securities
|
$
|
294
|
|
$
|
—
|
|
$
|
294
|
|
||
|
Foreign government bonds
|
—
|
|
11
|
|
11
|
|
|||||
|
Asset-backed securities
|
—
|
|
146
|
|
146
|
|
|||||
|
Mortgage-backed securities
|
—
|
|
143
|
|
143
|
|
|||||
|
Corporate notes and bonds
|
—
|
|
630
|
|
630
|
|
|||||
|
Municipal securities
|
—
|
|
26
|
|
26
|
|
|||||
|
Derivative instruments
|
|||||||||||
|
Fuel hedge contracts
|
|||||||||||
|
Call options
|
—
|
|
16
|
|
16
|
|
|||||
|
Liabilities
|
|||||||||||
|
Derivative instruments
|
|||||||||||
|
Interest rate swap agreements
|
—
|
|
(17
|
)
|
(17
|
)
|
|||||
The Company uses the market and income approach to determine the fair value of marketable securities. U.S. government securities are Level 1 as the fair value is based on quoted prices in active markets. Foreign government bonds, asset-backed securities, mortgage-backed securities, corporate notes and bonds, and municipal securities are Level 2 as the fair value is based on standard valuation models that are calculated based on observable inputs such as quoted interest rates, yield curves, credit ratings of the security and other observable market information.
The Company uses the market approach and the income approach to determine the fair value of derivative instruments. Fuel hedge contracts that are not traded on a public exchange are Level 2 as the fair value is primarily based on inputs which are readily available in active markets or can be derived from information available in active markets. The fair value for call options is determined utilizing an option pricing model based on inputs that are readily available in active markets, or can be derived from information available in active markets. In addition, the fair value considers the exposure to credit losses in the event of non-performance by counterparties. Interest rate swap agreements are Level 2 as the fair value of these contracts is determined based on the difference between the fixed interest rate in the agreements and the observable LIBOR-based interest forward rates at period end, multiplied by the total notional value.
The Company has no other financial assets that are measured at fair value on a nonrecurring basis at
December 31, 2014
.
Fair Value of Other Financial Instruments
The Company used the following methods and assumptions to determine the fair value of financial instruments that are not recognized at fair value as described below.
Cash and Cash Equivalents
: Carried at amortized costs which approximate fair value.
Debt
: The carrying amounts of the Company's variable-rate debt approximate fair values. For fixed-rate debt, the Company uses the income approach to determine the estimated fair value, by discounting cash flows using borrowing rates for comparable debt over the weighted life of the outstanding debt. The estimated fair value of the fixed-rate debt is Level 3 as certain inputs used are unobservable.
Fixed-rate debt that is not carried at fair value on the consolidated balance sheet and the estimated fair value of long-term fixed-rate debt (in millions):
|
2014
|
2013
|
||||||
|
Carrying Amount
|
$
|
614
|
|
$
|
703
|
|
|
|
Fair value
|
666
|
|
762
|
|
|||
66
In March 2012, the Company placed into service assets constructed for others (Terminal 6 at LAX), including a new baggage system, additional gates, new common use systems, expansion of security screening checkpoints, and a new ticket lobby, all of which were constructed for the City of Los Angeles and Los Angeles World Airports (LAWA). For accounting and financial reporting purposes, the Company is considered to be the owners of the assets constructed for others and did not qualify for sale and leaseback accounting when the non-proprietary assets were transferred to the City of Los Angeles due to the Company's continuing involvement with the project. The assets are depreciated over the life of the lease based on the straight-line method, while the liability is amortized on the effective interest method based on the lease rental payments. At December 31, 2014, the net asset was
$178 million
, and the liability was
$174 million
.
Future minimum payments related to the Terminal 6 lease are included in facility leases described in the "Commitments and Contingencies" note.
Long-term debt obligations (in millions):
|
|
2014
|
2013
|
|||||
|
Fixed-rate notes payable due through 2024
|
$
|
614
|
|
$
|
703
|
|
|
|
Variable-rate notes payable due through 2025
|
189
|
|
168
|
|
|||
|
Long-term debt
|
803
|
|
871
|
|
|||
|
Less current portion
|
117
|
|
117
|
|
|||
|
|
$
|
686
|
|
$
|
754
|
|
|
|
Weighted-average fixed-interest rate
|
5.7
|
%
|
5.7
|
%
|
|||
|
Weighted-average variable-interest rate
|
1.6
|
%
|
1.7
|
%
|
|||
All of the Company’s borrowings are secured by aircraft.
During
2014
, the Company issued
$51 million
in debt and made debt payments of
$119 million
. As of
December 31, 2014
, none of the Company's borrowings were restricted by financial covenants.
Long-term debt principal payments for the next five years and thereafter (in millions):
|
|
Total
|
||
|
2015
|
$
|
117
|
|
|
2016
|
115
|
|
|
|
2017
|
121
|
|
|
|
2018
|
151
|
|
|
|
2019
|
114
|
|
|
|
Thereafter
|
185
|
|
|
|
Total principal payments
|
$
|
803
|
|
Bank Line of Credit
The Company has
two
$100 million credit facilities. Both facilities have variable interest rates based on LIBOR plus a specified margin. One of the
$100 million
facilities, which expires in September 2017, is secured by aircraft. The other
$100 million
facility, which expires in March 2017, is secured by certain accounts receivable, spare engines, spare parts and ground service equipment. The Company has no immediate plans to borrow using either of these facilities. These facilities have a requirement to maintain a minimum unrestricted cash and marketable securities balance of
$500 million
. The Company was in compliance with this covenant at
December 31, 2014
.
67
Deferred Income Taxes
Deferred income taxes reflect the impact of temporary differences between the carrying amounts of assets and liabilities for financial reporting purposes and such amounts for tax purposes. Primarily due to differences in depreciation rates for federal income tax purposes and for financial reporting purposes, the Company has generated a net deferred tax liability.
Deferred tax (assets) and liabilities comprise the following (in millions):
|
|
2014
|
2013
|
|||||
|
Excess of tax over book depreciation
|
$
|
1,042
|
|
$
|
919
|
|
|
|
Other—net
|
22
|
|
21
|
|
|||
|
Gross deferred tax liabilities
|
1,064
|
|
940
|
|
|||
|
Mileage Plan
|
(206
|
)
|
(185
|
)
|
|||
|
Inventory obsolescence
|
(20
|
)
|
(18
|
)
|
|||
|
Deferred gains
|
(10
|
)
|
(12
|
)
|
|||
|
Employee benefits
|
(166
|
)
|
(85
|
)
|
|||
|
Fuel hedge contracts
|
(5
|
)
|
(14
|
)
|
|||
|
Other—net
|
(24
|
)
|
(30
|
)
|
|||
|
Gross deferred tax assets
|
(431
|
)
|
(344
|
)
|
|||
|
Net deferred tax liabilities
|
633
|
|
596
|
|
|||
|
Current deferred tax asset
|
(117
|
)
|
(113
|
)
|
|||
|
Noncurrent deferred tax liability
|
750
|
|
709
|
|
|||
|
Net deferred tax liability
|
$
|
633
|
|
$
|
596
|
|
|
The Company has concluded that it is more likely than not that its deferred tax assets will be realizable and thus no valuation allowance has been recorded as of
December 31, 2014
. This conclusion is based on the expected future reversals of existing taxable temporary differences, anticipated future taxable income, and the potential for future tax planning strategies to generate taxable income, if needed. The Company will continue to reassess the need for a valuation allowance during each future reporting period.
Components of Income Tax Expense
The components of income tax expense were as follows (in millions):
|
|
2014
|
2013
|
2012
|
||||||||
|
Current tax expense:
|
|
|
|
||||||||
|
Federal
|
$
|
229
|
|
145
|
|
$
|
83
|
|
|||
|
State
|
27
|
|
17
|
|
11
|
|
|||||
|
Total current
|
256
|
|
162
|
|
94
|
|
|||||
|
Deferred tax expense:
|
|
|
|
|
|
|
|||||
|
Federal
|
103
|
|
131
|
|
94
|
|
|||||
|
State
|
11
|
|
15
|
|
10
|
|
|||||
|
Total deferred
|
114
|
|
146
|
|
104
|
|
|||||
|
Income tax expense
|
$
|
370
|
|
$
|
308
|
|
$
|
198
|
|
||
68
Income Tax Rate Reconciliation
Income tax expense reconciles to the amount computed by applying the U.S. federal rate of
35%
to income before income tax and accounting change as follows (in millions):
|
|
2014
|
2013
|
2012
|
||||||||
|
Income before income tax
|
$
|
975
|
|
$
|
816
|
|
$
|
514
|
|
||
|
Expected tax expense
|
341
|
|
286
|
|
180
|
|
|||||
|
Nondeductible expenses
|
4
|
|
4
|
|
3
|
|
|||||
|
State income taxes
|
25
|
|
21
|
|
14
|
|
|||||
|
Other—net
|
—
|
|
(3
|
)
|
1
|
|
|||||
|
Actual tax expense
|
$
|
370
|
|
$
|
308
|
|
$
|
198
|
|
||
|
Effective tax rate
|
37.9
|
%
|
37.7
|
%
|
38.5
|
%
|
|||||
Uncertain Tax Positions
The Company has identified its federal tax return and its state tax returns in Alaska, Oregon, and California as “major” tax jurisdictions. A summary of the Company's jurisdictions and the periods that are subject to examination are as follows:
|
Jurisdiction
|
Period
|
|
Federal
|
2011 to 2013
|
|
Alaska
|
2011 to 2013
|
|
California
|
2010 to 2013
|
|
Oregon
|
2007 to 2013
|
The 2002 to 2007 Oregon tax returns are subject to examination only to the extent of net operating loss carryforwards from those years that were utilized in 2010 and later years.
At
December 31, 2014
, the total amount of unrecognized tax benefits is recorded as a liability, all of which impact the effective tax rate. Unrecognized tax benefits on uncertain tax positions were not material as of December 31,
2014
,
2013
and
2012
. No interest or penalties related to these tax positions were accrued as of
December 31, 2014
.
Four
defined-benefit and
five
defined-contribution retirement plans cover various employee groups of Alaska and Horizon. The defined-benefit plans provide benefits based on an employee’s term of service and average compensation for a specified period of time before retirement. The qualified defined-benefit pension plans are closed to new entrants.
Accounting standards require recognition of the overfunded or underfunded status of an entity’s defined-benefit pension and other postretirement plan as an asset or liability in the consolidated financial statements and requires recognition of the funded status in AOCL.
Qualified Defined-Benefit Pension Plans
The Company’s pension plans are funded as required by the Employee Retirement Income Security Act of 1974 (ERISA).
The defined-benefit plan assets consist primarily of marketable equity and fixed-income securities. The Company uses a December 31 measurement date for these plans.
Weighted average assumptions used to determine benefit obligations:
|
|
2014
|
2013
|
|
|
Discount rate
|
4.20%
|
4.85%
|
|
|
Rate of compensation increases
(a)
|
2.85% to 3.91%
|
2.90% to 3.93%
|
|
|
(a)
|
Varies by plan and related work group.
|
69
Weighted average assumptions used to determine net periodic benefit cost:
|
|
2014
|
2013
|
2012
|
||
|
Discount rate
|
4.85%
|
3.95%
|
4.65%
|
||
|
Expected return on plan assets
|
6.75%
|
7.25%
|
7.25%
|
||
|
Rate of compensation increases
(a)
|
2.90% to 3.93%
|
3.05% to 4.02%
|
2.94% to 4.17%
|
||
|
(a)
|
Varies by plan and related work group.
|
The discount rate was determined using current rates earned on high-quality, long-term bonds with maturities that correspond with the estimated cash distributions from the pension plans. At
December 31, 2014
, the Company selected a discount rate using a pool of higher-yielding bonds estimated to be more reflective of settlement rates, as management has taken steps to ultimately terminate or settle plans that are frozen and move toward freezing benefits in active plans in the future. In determining the expected return on plan assets, the Company assesses the current level of expected returns on risk-free investments (primarily government bonds), the historical level of the risk premium associated with the other asset classes in which the portfolio is invested and the expectations for future returns of each asset class. The expected return for each asset class is then weighted based on the target asset allocation to develop the expected long-term rate of return on assets assumption for the portfolio.
Plan assets are invested in common commingled trust funds invested in equity and fixed income securities. The asset allocation of the funds in the qualified defined-benefit plans, by asset category, is as follows:
|
|
2014
|
2013
|
|||
|
Asset category:
|
|
|
|||
|
Money market fund
|
—
|
%
|
3
|
%
|
|
|
Domestic equity securities
|
33
|
%
|
39
|
%
|
|
|
Non-U.S. equity securities
|
14
|
%
|
17
|
%
|
|
|
Fixed income securities
|
53
|
%
|
41
|
%
|
|
|
Plan assets
|
100
|
%
|
100
|
%
|
|
The Company’s investment policy focuses on achieving maximum returns at a reasonable risk for pension assets over a full market cycle. The Company uses a fund manager and invests in various asset classes to diversify risk.
Target allocations for the primary asset classes based on current funded status are approximately:
|
Domestic equities:
|
27% - 38%
|
|
Non-U.S. equities:
|
11% - 19%
|
|
Fixed income:
|
48% - 58%
|
The Company determines the strategic allocation between equity and fixed income based on current funded status and other characteristics of the plan. As the funded status improves, the Company increases the fixed income allocation of the portfolio, and decreases the equity allocation. Actual asset allocations are reviewed regularly and periodically rebalanced as appropriate.
As of
December 31, 2014
, all assets were invested in common commingled trust funds. The Company uses the net asset values of these funds to determine fair value as allowed using the practical expediency method outlined in the accounting standards.
70
Plan asset by fund category and fair value hierarchy level (in millions):
|
|
2014
|
2013
|
Level
|
|||||||
|
Fund type:
|
|
|
|
|||||||
|
Money market fund
|
$
|
—
|
|
$
|
45
|
|
1
|
|
||
|
U.S. equity market fund
|
634
|
|
684
|
|
2
|
|
||||
|
Non-U.S. equity fund
|
272
|
|
301
|
|
2
|
|
||||
|
Credit bond index fund
|
190
|
|
127
|
|
2
|
|
||||
|
Government/credit bond index fund
|
821
|
|
612
|
|
2
|
|
||||
|
Plan assets
|
$
|
1,917
|
|
$
|
1,769
|
|
|
|
||
The following table sets forth the status of the qualified defined-benefit pension plans (in millions):
|
|
2014
|
2013
|
|||||
|
Projected benefit obligation (PBO)
|
|
|
|||||
|
Beginning of year
|
$
|
1,709
|
|
$
|
1,873
|
|
|
|
Service cost
|
33
|
|
46
|
|
|||
|
Interest cost
|
81
|
|
73
|
|
|||
|
Plan settlement
|
—
|
|
—
|
|
|||
|
Actuarial (gain) loss
|
298
|
|
(226
|
)
|
|||
|
Benefits paid
|
(71
|
)
|
(57
|
)
|
|||
|
End of year
|
$
|
2,050
|
|
$
|
1,709
|
|
|
|
Plan assets at fair value
|
|
|
|
|
|||
|
Beginning of year
|
$
|
1,769
|
|
$
|
1,538
|
|
|
|
Actual return on plan assets
|
219
|
|
205
|
|
|||
|
Employer contributions
|
—
|
|
83
|
|
|||
|
Plan settlements
|
—
|
|
—
|
|
|||
|
Benefits paid
|
(71
|
)
|
(57
|
)
|
|||
|
End of year
|
$
|
1,917
|
|
$
|
1,769
|
|
|
|
Funded status (unfunded)
|
$
|
(133
|
)
|
$
|
60
|
|
|
|
Percent funded
|
94
|
%
|
104
|
%
|
|||
The accumulated benefit obligation for the combined qualified defined-benefit pension was
$1.9 billion
and
$1.6 billion
at
December 31, 2014
, and
2013
, respectively.
The amounts recognized in the consolidated balance sheets (in millions):
|
|
2014
|
2013
|
|||||
|
Plan assets-long term (within long term Other Assets)
|
$
|
—
|
|
$
|
60
|
|
|
|
Accrued benefit liability-long term
|
133
|
|
—
|
|
|||
|
Total liability recognized
|
$
|
133
|
|
$
|
—
|
|
|
The amounts not yet reflected in net periodic benefit cost and included in AOCL:
|
|
2014
|
2013
|
|||||
|
Prior service credit
|
$
|
(12
|
)
|
$
|
(14
|
)
|
|
|
Net loss
|
514
|
|
331
|
|
|||
|
Amount recognized in AOCL (pretax)
|
$
|
502
|
|
$
|
317
|
|
|
The expected amortization of prior service credit and net loss from AOCL in
2015
is
$1 million
and
$26 million
, respectively, for the qualified defined-benefit pension plans.
71
Net pension expense for the qualified defined-benefit plans included the following components (in millions):
|
|
2014
|
2013
|
2012
|
||||||||
|
Service cost
|
$
|
33
|
|
$
|
46
|
|
$
|
38
|
|
||
|
Interest cost
|
81
|
|
73
|
|
73
|
|
|||||
|
Expected return on assets
|
(117
|
)
|
(111
|
)
|
(93
|
)
|
|||||
|
Amortization of prior service cost
|
(1
|
)
|
(1
|
)
|
(1
|
)
|
|||||
|
Recognized actuarial loss
|
13
|
|
43
|
|
40
|
|
|||||
|
Net pension expense
|
$
|
9
|
|
$
|
50
|
|
$
|
57
|
|
||
Historically, the Company’s practice has been to contribute to the qualified defined-benefit pension plans an amount equal to the greater of 1) the minimum required by law, 2) the Pension Protection Act (PPA) target liability, or 3) the service cost as actuarially calculated. There are no current funding requirements for the Company’s plans in
2015
. The Company expects to contribute between
$30 million
and
$35 million
to the qualified defined-benefit pension plans during
2015
. The Company expects to contribute approximately
$4 million
to the nonqualified defined-benefit pension plans during
2015
.
Future benefits expected to be paid over the next ten years under the qualified defined-benefit pension plans from the assets of those plans (in millions):
|
2015
|
$
|
78
|
|
|
2016
|
86
|
|
|
|
2017
|
93
|
|
|
|
2018
|
93
|
|
|
|
2019
|
104
|
|
|
|
2020 - 2024
|
600
|
|
|
Nonqualified Defined-Benefit Pension Plan
Alaska also maintains an unfunded, noncontributory defined-benefit plan for certain elected officers. This plan uses a December 31 measurement date. The assumptions used to determine benefit obligations and the net period benefit cost for the nonqualified defined-benefit pension plan are similar to those used to calculate the qualified defined-benefit pension plan. The plan's unfunded status, PBO, accumulated benefit obligation is immaterial. The net pension expense in prior year and expected future expense is also immaterial.
Postretirement Medical Benefits
The Company allows certain retirees to continue their medical, dental, and vision benefits by paying all or a portion of the active employee plan premium until eligible for Medicare, currently age 65. This results in a subsidy to retirees, because the premiums received by the Company are less than the actual cost of the retirees’ claims. The accumulated postretirement benefit obligation (APBO) for this subsidy is unfunded. This liability was determined using an assumed discount rate of
4.20%
and
4.85%
at
December 31, 2014
and
2013
, respectively. The Company does not believe the U.S. Health Care Reform: The Patient Protection and Affordable Care Act and The Health Care and Education Reconciliation Act will have a significant impact on the Company's cost for postretirement medical benefits.
During
2014
, the Company made changes to the postretirement medical benefits for non-union personnel and certain labor groups to sunset the postretirement medical benefits beginning in 2015. As a result of these changes, the Company recognized a partial curtailment gain of
$25 million
during
December 31, 2014
. The curtailment gain included
$5 million
associated with an embedded sick leave subsidy. This subsidy was used to establish a new compensated absence liability. The net impact of the curtailment gain of
$20 million
is included in special items in the income statement.
72
|
(in millions)
|
2014
|
2013
|
|||||
|
Accumulated postretirement benefit obligation
|
|
|
|||||
|
Beginning of year
|
$
|
89
|
|
$
|
117
|
|
|
|
Service cost
|
3
|
|
5
|
|
|||
|
Interest cost
|
4
|
|
4
|
|
|||
|
Curtailment gain
|
(25
|
)
|
—
|
|
|||
|
Actuarial loss (gain)
|
12
|
|
(35
|
)
|
|||
|
Benefits paid
|
(2
|
)
|
(2
|
)
|
|||
|
End of year
|
$
|
81
|
|
$
|
89
|
|
|
|
Plan assets at fair value
|
|
|
|
|
|||
|
Beginning of year
|
$
|
—
|
|
$
|
—
|
|
|
|
Employer contributions
|
2
|
|
2
|
|
|||
|
Benefits paid
|
(2
|
)
|
(2
|
)
|
|||
|
End of year
|
$
|
—
|
|
$
|
—
|
|
|
|
Funded status (unfunded)
|
$
|
(81
|
)
|
$
|
(89
|
)
|
|
The amounts recognized in the consolidated balance sheets (in millions):
|
|
2014
|
2013
|
|||||
|
Accrued benefit liability-current
|
$
|
4
|
|
$
|
3
|
|
|
|
Accrued benefit liability-long term
|
77
|
|
86
|
|
|||
|
Total liability recognized
|
$
|
81
|
|
$
|
89
|
|
|
AMOUNTS NOT YET REFLECTED IN NET PERIODIC BENEFIT COST AND INCLUDED IN AOCL:
|
(in millions)
|
2014
|
2013
|
|||||
|
Prior service cost
|
$
|
—
|
|
$
|
1
|
|
|
|
Net gain
|
(32
|
)
|
(48
|
)
|
|||
|
Amount recognized in AOCL (pretax)
|
$
|
(32
|
)
|
$
|
(47
|
)
|
|
The Company uses a December 31 measurement date to assess obligations associated with the subsidy of retiree medical costs. Net periodic benefit cost for the postretirement medical plans included the following components (in millions):
|
|
2014
|
2013
|
2012
|
||||||||
|
Service cost
|
$
|
3
|
|
$
|
5
|
|
$
|
5
|
|
||
|
Interest cost
|
4
|
|
4
|
|
5
|
|
|||||
|
Amortization of prior service cost
|
1
|
|
1
|
|
1
|
|
|||||
|
Recognized actuarial (gain) loss
|
(3
|
)
|
(2
|
)
|
(1
|
)
|
|||||
|
Curtailment gain
|
(25
|
)
|
—
|
|
—
|
|
|||||
|
Net periodic benefit (gain) cost
|
$
|
(20
|
)
|
$
|
8
|
|
$
|
10
|
|
||
This is an unfunded plan. The Company expects to contribute approximately
$4 million
to the postretirement medical benefits plan in
2015
, which is equal to the expected benefit payments.
73
Future benefits expected to be paid over the next ten years under the postretirement medical benefits plan (in millions):
|
2015
|
$
|
4
|
|
|
2016
|
4
|
|
|
|
2017
|
5
|
|
|
|
2018
|
5
|
|
|
|
2019
|
5
|
|
|
|
2020 - 2024
|
28
|
|
|
The assumed health care cost trend rates to determine the expected
2015
benefits cost are
7.7%
,
7.7%
,
5.0%
and
4.0%
for medical, prescription drugs, dental and vision costs, respectively. The assumed trend rate declines steadily through
2028
where the ultimate assumed trend rates are
4.7%
for medical, prescription drugs and dental, and
4.0%
for vision.
A 1% higher or lower trend rate in health care costs has the following effect on the Company’s postretirement medical plans (in millions):
|
|
2014
|
2013
|
2012
|
||||||||
|
Change in service and interest cost
|
|
|
|
||||||||
|
1% higher trend rate
|
$
|
1
|
|
$
|
1
|
|
$
|
2
|
|
||
|
1% lower trend rate
|
(1
|
)
|
(1
|
)
|
(1
|
)
|
|||||
|
Change in year-end postretirement benefit obligation
|
|
|
|
|
|
|
|||||
|
1% higher trend rate
|
$
|
9
|
|
$
|
10
|
|
$
|
14
|
|
||
|
1% lower trend rate
|
(8
|
)
|
(9
|
)
|
(12
|
)
|
|||||
Defined-Contribution Plans
The defined-contribution plans are deferred compensation plans under section 401(k) of the Internal Revenue Code. All of these plans require Company contributions. Total expense for the defined-contribution plans was
$54 million
,
$44 million
, and
$43 million
in
2014
,
2013
, and
2012
, respectively.
The Company also has a noncontributory, unfunded defined-contribution plan for certain elected officers of the Company who are ineligible for the nonqualified defined-benefit pension plan. Amounts recorded as liabilities under the plan are not material to the consolidated balance sheet at
December 31, 2014
and
2013
.
Pilot Long-term Disability Benefits
Alaska maintains a long-term disability plan for its pilots. The long-term disability plan does not have a service requirement. Therefore, the liability is calculated based on estimated future benefit payments associated with pilots that were assumed to be disabled on a long-term basis as of
December 31, 2014
and does not include any assumptions for future disability. The liability includes the discounted expected future benefit payments and medical costs. The total liability was
$16 million
and
$12 million
, which was recorded net of a prefunded trust account of
$2 million
and
$1 million
, and included in long-term other liabilities on the consolidated balance sheets as of
December 31, 2014
and
December 31, 2013
, respectively.
Employee Incentive-Pay Plans
Alaska and Horizon have employee incentive plans that pay employees based on certain financial and operational metrics. These metrics are set and approved annually by the Compensation Committee of the Board of Directors. The aggregate expense under these plans in
2014
,
2013
and
2012
was
$116 million
,
$105 million
, and
$88 million
, respectively. The plans are summarized below:
|
•
|
Performance-Based Pay
(PBP) is a program that rewards all employees. The program is based on four separate metrics related to Air Group profitability, safety, achievement of unit-cost goals, and employee engagement as measured by customer satisfaction.
|
|
•
|
The
Operational Performance Rewards Program
entitles all Air Group employees to quarterly payouts of up to
$300
per person if certain operational and customer service objectives are met.
|
74
Future minimum fixed payments for commitments as of
December 31, 2014
(in millions):
|
|
Aircraft Leases
|
Facility Leases
|
Aircraft Commitments
|
Capacity Purchase Agreements
|
Engine Maintenance
|
||||||||||||||
|
2015
|
$
|
111
|
|
$
|
95
|
|
$
|
516
|
|
$
|
51
|
|
$
|
10
|
|
||||
|
2016
|
102
|
|
93
|
|
496
|
|
56
|
|
—
|
|
|||||||||
|
2017
|
72
|
|
89
|
|
471
|
|
60
|
|
—
|
|
|||||||||
|
2018
|
57
|
|
41
|
|
430
|
|
42
|
|
—
|
|
|||||||||
|
2019
|
46
|
|
40
|
|
393
|
|
31
|
|
—
|
|
|||||||||
|
Thereafter
|
164
|
|
196
|
|
653
|
|
245
|
|
—
|
|
|||||||||
|
Total
|
$
|
552
|
|
$
|
554
|
|
$
|
2,959
|
|
$
|
485
|
|
$
|
10
|
|
||||
Lease Commitments
At
December 31, 2014
, the Company had lease contracts for
64
aircraft, which have remaining noncancelable lease terms ranging from
2015
to
2028
. Of these aircraft,
14
are subleased to a third-party carrier, and
seven
aircraft are E-175 regional jets, of which
five
aircraft will begin operations under a CPA with SkyWest during
2015
. The majority of airport and terminal facilities are also leased. Rent expense was
$288 million
,
$290 million
, and
$275 million
, in
2014
,
2013
, and
2012
, respectively.
Aircraft Commitments
As of
December 31, 2014
, the Company is committed to purchasing
73
B737 aircraft (
36
B737-900ER aircraft and
37
B737 MAX aircraft, with deliveries in
2015
through
2022
) and
three
Q400 aircraft, with deliveries in
2015
through
2017
. In addition, the Company has options to purchase an additional
48
B737 aircraft and
five
Q400 aircraft, and options to increase capacity with
16
E-175 aircraft through our CPA with SkyWest.
Capacity Purchase Agreements (CPAs)
In November
2014
, Alaska amended its CPA with SkyWest, which includes a 12-year lease for seven Embraer E-175s. The
seven
aircraft have delivery dates ranging from June 2015 to February 2016. The future minimum lease payments related to the aircraft in the amended contract are included in the aircraft leases column and the minimum lease payments associated with operating the flights are included in the capacity purchase agreements column of the commitments table.
At
December 31, 2014
, Alaska had CPAs with
three
carriers, including the Company's wholly-owned subsidiary, Horizon. Horizon sells
100%
of its capacity under a CPA with Alaska. In addition, Alaska has a CPA with PenAir to fly certain routes in the state of Alaska. Under these agreements, Alaska pays the carriers an amount which is based on a determination of their cost of operating those flights and other factors intended to approximate market rates for those services. Future payments (excluding Horizon) are based on minimum levels of flying by the third-party carriers, which could differ materially due to variable payments based on actual levels of flying and certain costs associated with operating flights such as fuel.
Engine Maintenance
The Company has a power-by-the-hour (PBH) maintenance agreement for some of the B737-700 and B737-900 engines. This agreement transfers risk to a third-party service provider and fixes the amount the Company pays per flight hour in exchange for maintenance and repairs under a predefined maintenance program. Future payments are based on minimum flight hours.
Contingencies
The Company is a party to routine litigation matters incidental to its business and with respect to which no material liability is expected. Management believes the ultimate disposition of these matters is not likely to materially affect the Company's financial position or results of operations. This forward-looking statement is based on management's current understanding of the relevant law and facts, and it is subject to various contingencies, including the potential costs and risks associated with litigation and the actions of arbitrators, judges and juries.
75
Common Stock Changes
During the second quarter of 2014, shareholders voted to increase the number of authorized shares from
100 million
to
200 million
shares, and reduce the par value of common stock from
$1
per share to
$0.01
per share, and the Board of Directors declared a two-for-one stock split by means of a stock distribution. The additional shares were distributed on July 9, 2014, to the shareholders of record on June 23, 2014. All historical share and per share information has been recast to reflect the changes in the Company's equity structure.
Dividends
During
2014
, the Board of Directors declared dividends of
$0.50
per share. The Company paid dividends of
$68 million
to shareholders of record during
2014
.
Subsequent to year-end, the Board of Directors declared a quarterly cash dividend of
$0.20
per share to be paid on March 10, 2015 to shareholders of record as of February 24, 2015. This is a
60%
increase from the most recent quarterly dividends of
$0.125
per share.
Common Stock Repurchase
In
May 2014
, the Board of Directors authorized a
$650 million
share repurchase program, which does not have a set expiration date. In
September 2012
, the Board of Directors authorized a
$250 million
share repurchase program, which was completed in July 2014. In
February 2012
, the Board of Directors authorized a
$50 million
share repurchase program, which was completed in
September 2012
. In
June 2011
, the Board of Directors authorized a
$50 million
share repurchase program, which was completed in
January 2012
.
Share repurchase activity (in millions, except shares):
|
2014
|
2013
|
2012
|
||||||||||||||||||
|
|
Shares
|
Amount
|
Shares
|
Amount
|
Shares
|
Amount
|
||||||||||||||
|
2014 $650 million Repurchase Program
|
5,497,427
|
|
$
|
265
|
|
—
|
|
$
|
—
|
|
—
|
|
$
|
—
|
|
|||||
|
2012 $250 million Repurchase Program
|
1,819,304
|
|
83
|
|
4,984,186
|
|
159
|
|
405,020
|
|
8
|
|
||||||||
|
2012 $50 million Repurchase Program
|
—
|
|
—
|
|
—
|
|
—
|
|
2,874,202
|
|
50
|
|
||||||||
|
2011 $50 million Repurchase Program
|
—
|
|
—
|
|
—
|
|
—
|
|
92,680
|
|
2
|
|
||||||||
|
Total
|
7,316,731
|
|
$
|
348
|
|
4,984,186
|
|
$
|
159
|
|
3,371,902
|
|
$
|
60
|
|
|||||
Retirement of Treasury Shares
In
2014
, the Company retired
7,283,107
common shares that had been held in treasury. At
December 31, 2014
, the Company held
75,100
shares in treasury.
Accumulated Other Comprehensive Loss (AOCL)
AOCL consisted of the following (in millions, net of tax):
|
|
2014
|
2013
|
|||||
|
Related to marketable securities
|
—
|
|
—
|
|
|||
|
Related to employee benefit plans
|
(298
|
)
|
(173
|
)
|
|||
|
Related to interest rate derivatives
|
(12
|
)
|
(10
|
)
|
|||
|
|
$
|
(310
|
)
|
$
|
(183
|
)
|
|
76
Special Mileage Plan Revenue
In the third quarter of 2013, the Company modified its Affinity Card Agreement (Agreement) with Bank of America Corporation (BAC), through which the Company sells miles and other items to BAC and the Company's loyalty program members accrue frequent flyer miles based on purchases using credit cards issued by BAC. As a result of the execution of the Agreement, consideration received as part of this agreement is subject to Accounting Standards Update 2009-13, "Multiple-Deliverable Revenue Arrangements - a consensus of the FASB Emerging Issues Task Force" (ASU 2009-13).
The Company followed the rollforward transition approach of ASU 2009-13, which required that the Company's existing deferred revenue balance be adjusted to reflect the value, on a relative selling price basis, of any undelivered element remaining at the date of contract modification as if the Company had been applying ASU 2009-13 since inception of the Agreement. The relative selling price of the undelivered element (air transportation) is lower than the rate at which it had been deferred under the previous contract and the Company recorded a one-time, non-cash adjustment to decrease frequent flyer deferred revenue and increase Special mileage plan revenue. The amount recorded for the year ended December 31, 2013 was
$192 million
.
Also during the third quarter of 2013, as part of the Company's ongoing evaluation of Mileage Plan program assumptions, the Company performed a statistical analysis of historical data, which refined its estimate of the amount of breakage in the mileage population. This new refinement enables the Company to better identify historical differences between certain of its mileage breakage estimates and the amounts that have actually been experienced. As a result, the Company increased its estimate of the number of frequent flyer miles expected to expire unused from
12.0%
to
17.4%
. Included in the Special mileage plan revenue item above is
$44 million
of additional revenue related to the effect of the change on the deferred revenue balance.
Special Items
Refer to Note 8. Employee Benefit Plans for detailed information about the one-time benefit related to the curtailment of certain postretirement benefit plans. In the fourth quarter of 2014, we recorded a one-time gain of
$10 million
associated with the settlement of a legal matter.
The table below summarizes the components of total stock-based compensation (in millions):
|
2014
|
2013
|
2012
|
|||||||||
|
Stock options
|
$
|
3
|
|
$
|
3
|
|
$
|
2
|
|
||
|
Stock awards
|
10
|
|
10
|
|
11
|
|
|||||
|
Deferred stock awards
|
1
|
|
1
|
|
1
|
|
|||||
|
Employee stock purchase plan
|
2
|
|
2
|
|
1
|
|
|||||
|
Stock-based compensation
|
$
|
16
|
|
$
|
16
|
|
$
|
15
|
|
||
|
Tax benefit related to stock-based compensation
|
$
|
6
|
|
$
|
6
|
|
$
|
5
|
|
||
Unrecognized stock-based compensation for non-vested options and awards and the weighted-average period the expense will be recognized (in millions):
|
Amount
|
Weighted-
Average
Period
|
||||
|
Stock options
|
$
|
2
|
|
0.8
|
|
|
Stock awards
|
8
|
|
0.6
|
||
|
Unrecognized stock-based compensation
|
$
|
10
|
|
0.7
|
|
The Company has various equity incentive plans under which it may grant stock awards to directors, officers and employees. The Company also has an employee stock purchase plan (ESPP).
77
The Company is authorized to issue
36 million
shares of common stock under these plans, of which
16,914,785
shares remain available for future grants of either options or stock awards as of
December 31, 2014
.
Stock Options
Stock options to purchase common stock are granted at the fair market value of the stock on the date of grant. The stock options granted have terms of up to ten years.
The fair value of each option grant was estimated on the date of grant using the Black-Scholes option-pricing model with the following weighted-average assumptions used for grants:
|
|
2014
|
2013
|
2012
|
||||||||
|
Expected volatility
|
65
|
%
|
67
|
%
|
55
|
%
|
|||||
|
Expected term
|
6 years
|
|
6 years
|
|
6 years
|
|
|||||
|
Risk-free interest rate
|
1.87
|
%
|
1.10
|
%
|
1.08
|
%
|
|||||
|
Expected dividend yield
|
1.25
|
|
—
|
|
—
|
|
|||||
|
Weighted-average grant date fair value per share
|
$
|
21.70
|
|
$
|
14.74
|
|
$
|
8.62
|
|
||
|
Estimated fair value of options granted (millions)
|
$
|
3
|
|
$
|
3
|
|
$
|
2
|
|
||
The expected market price volatility is based on the historical volatility. The expected term is based on the estimated period of time until exercise based on historical experience. The risk-free interest rate is based on the U.S. Treasury yield curve in effect at the time of the grant. The expected dividend yield is based on the estimated weighted average dividend yield over the expected term. The expected forfeiture rates are based on historical experience.
The tables below summarize stock option activity:
|
|
Shares
|
Weighted-
Average
Exercise
Price
Per Share
|
Weighted-
Average
Contractual
Life (Years)
|
Aggregate
Intrinsic
Value (in
millions)
|
||||||||
|
Outstanding, December 31, 2013
|
1,143,684
|
|
$
|
14.25
|
|
6.6
|
$
|
26
|
|
|||
|
Granted
|
143,050
|
|
40.01
|
|
|
|
||||||
|
Exercised
|
(573,140
|
)
|
11.39
|
|
|
|
||||||
|
Forfeited or expired
|
(5,906
|
)
|
38.76
|
|
|
|
||||||
|
Outstanding, December 31, 2014
|
707,688
|
|
$
|
21.57
|
|
6.4
|
$
|
27
|
|
|||
|
Exercisable, December 31, 2014
|
243,726
|
|
$
|
12.32
|
|
5.4
|
$
|
12
|
|
|||
|
Vested or expected to vest, December 31, 2014
|
706,748
|
|
$
|
21.56
|
|
6.4
|
$
|
27
|
|
|||
|
(in millions)
|
2014
|
2013
|
2012
|
||||||||
|
Intrinsic value of option exercises
|
$
|
20
|
|
$
|
19
|
|
$
|
11
|
|
||
|
Cash received from stock option exercises
|
6
|
|
8
|
|
7
|
|
|||||
|
Tax benefit related to stock option exercises
|
7
|
|
7
|
|
4
|
|
|||||
|
Fair value of options vested
|
2
|
|
3
|
|
4
|
|
|||||
Stock Awards
Restricted Stock Units (RSUs) are awarded to eligible employees and entitle the grantee to receive shares of common stock at the end of the vest period. The fair value of the RSUs is based on the stock price on the date of grant. The RSUs “cliff vest” after three years, or the period from the date of grant to the employee’s retirement eligibility, and expense is recognized accordingly. Performance Share Units (PSUs) are awarded to certain executives to receive shares of common stock if specific performance goals and market conditions are achieved. There are several tranches of PSUs which vest when performance goals and market conditions are met.
78
The following table summarizes information about outstanding stock awards:
|
|
Number
of Units
|
Weighted-
Average
Grant
Date Fair
Value
|
Weighted-
Average
Contractual
Life (Years)
|
Aggregate
Intrinsic
Value (in
millions)
|
||||||||
|
Non-vested, December 31, 2013
|
1,278,430
|
|
$
|
19.58
|
|
0.6
|
$
|
47
|
|
|||
|
Granted
|
400,650
|
|
31.85
|
|
|
|
|
|||||
|
Vested
|
(630,390
|
)
|
16.53
|
|
|
|
|
|||||
|
Forfeited
|
(21,300
|
)
|
19.48
|
|
|
|
|
|||||
|
Non-vested, December 31, 2014
|
1,027,390
|
|
$
|
26.19
|
|
0.6
|
$
|
61
|
|
|||
Deferred Stock Awards
Deferred Stock Units (DSUs) are awarded to members of its Board of Directors as part of their retainers. The underlying common shares are issued upon retirement from the Board, but require no future service period. As a result, the entire intrinsic value of the awards is expensed on the date of grant.
Employee Stock Purchase Plan (ESPP)
The ESPP allows employees to purchase common stock at
85%
of the stock price on the first day of the offering period or the specified purchase date, whichever is lower. Employees may contribute up to
10%
of their base earnings during the offering period to purchase stock. Employees purchased
298,283
,
171,227
, and
157,373
shares in
2014
,
2013
, and
2012
under the ESPP.
79
Air Group has two operating airlines - Alaska Airlines and Horizon Air. Each is a regulated airline with separate management teams. To manage the two operating airlines and the revenues and expenses associated with the CPAs, management views the business in three operating segments.
Alaska Mainline
- The Boeing 737 part of Alaska's business.
Alaska Regional
- Alaska's shorter distance network. In this segment, Alaska Regional records actual on board passenger revenue, less costs such as fuel, distribution costs, and payments made to Horizon, SkyWest and PenAir under CPAs. Additionally, Alaska Regional includes a small allocation of corporate overhead such as IT, finance and other administrative costs incurred by Alaska and on behalf of the regional operations.
Horizon
- Horizon operates regional aircraft. All of Horizon's capacity is sold to Alaska under a CPA. Expenses included those typically borne by regional airlines such as crew costs, ownership costs, and maintenance costs.
Additionally, the following table reports “Air Group Adjusted,” which is not a measure determined in accordance with GAAP. The Company's chief operating decision-makers and others in management use this measure to evaluate operational performance and determine resource allocations. Adjustments are further explained below in reconciling to consolidated GAAP results.
Operating segment information is as follows (in millions):
|
Alaska
|
|||||||||||||||||||||||||||
|
Year Ended December 31, 2014
|
Mainline
|
Regional
|
Horizon
|
Consolidating
|
Air Group Adjusted
(a)
|
Special Items
(b)
|
Consolidated
|
||||||||||||||||||||
|
Operating revenues
|
|
|
|
||||||||||||||||||||||||
|
Passenger
|
|||||||||||||||||||||||||||
|
Mainline
|
$
|
3,774
|
|
$
|
—
|
|
$
|
—
|
|
$
|
—
|
|
$
|
3,774
|
|
$
|
—
|
|
$
|
3,774
|
|
||||||
|
Regional
|
—
|
|
805
|
|
—
|
|
—
|
|
805
|
|
—
|
|
805
|
|
|||||||||||||
|
Total passenger revenues
|
3,774
|
|
805
|
|
—
|
|
—
|
|
4,579
|
|
—
|
|
4,579
|
|
|||||||||||||
|
CPA revenues
|
—
|
|
—
|
|
371
|
|
(371
|
)
|
—
|
|
—
|
|
—
|
|
|||||||||||||
|
Freight and mail
|
109
|
|
5
|
|
—
|
|
|
|
114
|
|
—
|
|
114
|
|
|||||||||||||
|
Other-net
|
592
|
|
78
|
|
5
|
|
|
|
675
|
|
|
|
675
|
|
|||||||||||||
|
Total operating revenues
|
4,475
|
|
888
|
|
376
|
|
(371
|
)
|
5,368
|
|
—
|
|
5,368
|
|
|||||||||||||
|
Operating expenses
|
|||||||||||||||||||||||||||
|
Operating expenses, excluding fuel
|
2,417
|
|
623
|
|
349
|
|
(371
|
)
|
3,018
|
|
(30
|
)
|
2,988
|
|
|||||||||||||
|
Economic fuel
|
1,251
|
|
190
|
|
—
|
|
—
|
|
1,441
|
|
(23
|
)
|
1,418
|
|
|||||||||||||
|
Total operating expenses
|
3,668
|
|
813
|
|
349
|
|
(371
|
)
|
4,459
|
|
(53
|
)
|
4,406
|
|
|||||||||||||
|
Nonoperating income (expense)
|
|||||||||||||||||||||||||||
|
Interest income
|
20
|
|
—
|
|
—
|
|
1
|
|
21
|
|
—
|
|
21
|
|
|||||||||||||
|
Interest expense
|
(32
|
)
|
—
|
|
(12
|
)
|
(4
|
)
|
(48
|
)
|
—
|
|
(48
|
)
|
|||||||||||||
|
Other
|
39
|
|
(1
|
)
|
2
|
|
—
|
|
40
|
|
—
|
|
40
|
|
|||||||||||||
|
27
|
|
(1
|
)
|
(10
|
)
|
(3
|
)
|
13
|
|
—
|
|
13
|
|
||||||||||||||
|
Income (loss) before income tax
|
$
|
834
|
|
$
|
74
|
|
$
|
17
|
|
$
|
(3
|
)
|
$
|
922
|
|
$
|
53
|
|
$
|
975
|
|
||||||
80
|
Alaska
|
|||||||||||||||||||||||||||
|
Year Ended December 31, 2013
|
Mainline
|
Regional
|
Horizon
|
Consolidating
|
Air Group Adjusted
(a)
|
Special Items
(b)
|
Consolidated
|
||||||||||||||||||||
|
Operating revenues
|
|
|
|
||||||||||||||||||||||||
|
Passenger
|
|||||||||||||||||||||||||||
|
Mainline
|
$
|
3,490
|
|
$
|
—
|
|
$
|
—
|
|
$
|
—
|
|
$
|
3,490
|
|
$
|
—
|
|
$
|
3,490
|
|
||||||
|
Regional
|
—
|
|
777
|
|
—
|
|
—
|
|
777
|
|
—
|
|
777
|
|
|||||||||||||
|
Total passenger revenues
|
3,490
|
|
777
|
|
—
|
|
—
|
|
4,267
|
|
—
|
|
4,267
|
|
|||||||||||||
|
CPA revenues
|
—
|
|
—
|
|
368
|
|
(368
|
)
|
—
|
|
—
|
|
—
|
|
|||||||||||||
|
Freight and mail
|
109
|
|
4
|
|
—
|
|
|
|
113
|
|
—
|
|
113
|
|
|||||||||||||
|
Other-net
|
513
|
|
66
|
|
5
|
|
|
|
584
|
|
192
|
|
776
|
|
|||||||||||||
|
Total operating revenues
|
4,112
|
|
847
|
|
373
|
|
(368
|
)
|
4,964
|
|
192
|
|
5,156
|
|
|||||||||||||
|
Operating expenses
|
|||||||||||||||||||||||||||
|
Operating expenses, excluding fuel
|
2,293
|
|
585
|
|
341
|
|
(368
|
)
|
2,851
|
|
—
|
|
2,851
|
|
|||||||||||||
|
Economic fuel
|
1,294
|
|
181
|
|
—
|
|
—
|
|
1,475
|
|
(8
|
)
|
1,467
|
|
|||||||||||||
|
Total operating expenses
|
3,587
|
|
766
|
|
341
|
|
(368
|
)
|
4,326
|
|
(8
|
)
|
4,318
|
|
|||||||||||||
|
Nonoperating income (expense)
|
|||||||||||||||||||||||||||
|
Interest income
|
18
|
|
—
|
|
—
|
|
—
|
|
18
|
|
—
|
|
18
|
|
|||||||||||||
|
Interest expense
|
(38
|
)
|
—
|
|
(14
|
)
|
(4
|
)
|
(56
|
)
|
—
|
|
(56
|
)
|
|||||||||||||
|
Other
|
25
|
|
(12
|
)
|
2
|
|
1
|
|
16
|
|
—
|
|
16
|
|
|||||||||||||
|
5
|
|
(12
|
)
|
(12
|
)
|
(3
|
)
|
(22
|
)
|
—
|
|
(22
|
)
|
||||||||||||||
|
Income (loss) before income tax
|
$
|
530
|
|
$
|
69
|
|
$
|
20
|
|
$
|
(3
|
)
|
$
|
616
|
|
$
|
200
|
|
$
|
816
|
|
||||||
|
Alaska
|
|||||||||||||||||||||||||||
|
Year Ended December 31, 2012
|
Mainline
|
Regional
|
Horizon
|
Consolidating
|
Air Group Adjusted
(a)
|
Special Items
(b)
|
Consolidated
|
||||||||||||||||||||
|
Operating revenues
|
|
|
|
||||||||||||||||||||||||
|
Passenger
|
|||||||||||||||||||||||||||
|
Mainline
|
$
|
3,284
|
|
$
|
—
|
|
$
|
—
|
|
$
|
—
|
|
$
|
3,284
|
|
$
|
—
|
|
$
|
3,284
|
|
||||||
|
Regional
|
—
|
|
746
|
|
—
|
|
—
|
|
746
|
|
—
|
|
746
|
|
|||||||||||||
|
Total passenger revenues
|
3,284
|
|
746
|
|
—
|
|
—
|
|
4,030
|
|
—
|
|
4,030
|
|
|||||||||||||
|
CPA revenues
|
—
|
|
—
|
|
369
|
|
(369
|
)
|
—
|
|
—
|
|
—
|
|
|||||||||||||
|
Freight and mail
|
107
|
|
4
|
|
—
|
|
—
|
|
111
|
|
—
|
|
111
|
|
|||||||||||||
|
Other-net
|
448
|
|
61
|
|
7
|
|
—
|
|
516
|
|
—
|
|
516
|
|
|||||||||||||
|
Total operating revenues
|
3,839
|
|
811
|
|
376
|
|
(369
|
)
|
4,657
|
|
—
|
|
4,657
|
|
|||||||||||||
|
Operating expenses
|
|||||||||||||||||||||||||||
|
Operating expenses, excluding fuel
|
2,131
|
|
566
|
|
338
|
|
(369
|
)
|
2,666
|
|
—
|
|
2,666
|
|
|||||||||||||
|
Economic fuel
|
1,238
|
|
183
|
|
—
|
|
—
|
|
1,421
|
|
38
|
|
1,459
|
|
|||||||||||||
|
Total operating expenses
|
3,369
|
|
749
|
|
338
|
|
(369
|
)
|
4,087
|
|
38
|
|
4,125
|
|
|||||||||||||
|
Nonoperating income (expense)
|
|||||||||||||||||||||||||||
|
Interest income
|
19
|
|
—
|
|
—
|
|
—
|
|
19
|
|
—
|
|
19
|
|
|||||||||||||
|
Interest expense
|
(47
|
)
|
—
|
|
(16
|
)
|
(1
|
)
|
(64
|
)
|
—
|
|
(64
|
)
|
|||||||||||||
|
Other
|
24
|
|
—
|
|
2
|
|
1
|
|
27
|
|
—
|
|
27
|
|
|||||||||||||
|
(4
|
)
|
—
|
|
(14
|
)
|
—
|
|
(18
|
)
|
—
|
|
(18
|
)
|
||||||||||||||
|
Income (loss) before income tax
|
$
|
466
|
|
$
|
62
|
|
$
|
24
|
|
$
|
—
|
|
$
|
552
|
|
$
|
(38
|
)
|
$
|
514
|
|
||||||
|
(a)
|
The adjusted column represents the financial information that is reviewed by management to assess performance of operations and determine capital allocations and does not include certain income and charges.
|
|
(b)
|
Includes accounting adjustments related to Special mileage plan revenue, mark-to-market fuel-hedge accounting charges, non-cash curtailment gain, and a one-time gain related to a legal matter.
|
81
|
2014
|
2013
|
2012
|
|||||||||
|
Depreciation:
|
|||||||||||
|
Alaska
(a)
|
$
|
243
|
|
223
|
|
$
|
217
|
|
|||
|
Horizon
|
51
|
|
47
|
|
47
|
|
|||||
|
Parent company
|
—
|
|
—
|
|
—
|
|
|||||
|
Consolidated
|
$
|
294
|
|
$
|
270
|
|
$
|
264
|
|
||
|
Capital expenditures:
|
|||||||||||
|
Alaska
(a)
|
$
|
659
|
|
$
|
494
|
|
$
|
477
|
|
||
|
Horizon
|
35
|
|
72
|
|
41
|
|
|||||
|
Consolidated
|
$
|
694
|
|
$
|
566
|
|
$
|
518
|
|
||
|
Total assets at end of period:
|
|
|
|
|
|
|
|||||
|
Alaska
(a)
|
$
|
6,772
|
|
$
|
5,832
|
|
|||||
|
Horizon
|
818
|
|
840
|
|
|||||||
|
Parent company
|
3,552
|
|
2,762
|
|
|||||||
|
Elimination of inter-company accounts
|
(4,961
|
)
|
(3,596
|
)
|
|||||||
|
Consolidated
|
$
|
6,181
|
|
$
|
5,838
|
|
|||||
|
(a)
|
There are no depreciation expenses, capital expenditures or assets associated with purchased capacity flying at Alaska Regional.
|
|
|
None
|
|
EVALUATION OF DISCLOSURE CONTROLS AND PROCEDURES
The Company’s management, with the participation of the Principal Executive Officer and Principal Financial Officer, conducted an evaluation of the effectiveness of the Company’s disclosure controls and procedures (as defined in Exchange Act Rule 13a-15(e)) as of the end of the period covered by this report. Based on that evaluation, the Principal Executive Officer and Principal Financial Officer concluded that the Company’s disclosure controls and procedures were effective as of the end of the period covered by this report.
CHANGES IN INTERNAL CONTROL OVER FINANCIAL REPORTING
There have been no changes in the Company’s internal controls over financial reporting during the fourth quarter of
2014
that have materially affected, or are reasonably likely to materially affect, the Company’s internal control over financial reporting.
82
MANAGEMENT’S REPORT ON INTERNAL CONTROL OVER FINANCIAL REPORTING
Our management is responsible for establishing and maintaining adequate internal control over financial reporting, as such term is defined in Exchange Act Rule 13a-15(f). Under the supervision and with the participation of our management, including our principal executive officer and principal financial officer, we conducted an evaluation of the effectiveness of our internal control over financial reporting based on the 2013 framework in Internal Control – Integrated Framework issued by the Committee of Sponsoring Organizations of the Treadway Commission (the COSO Framework). Based on our evaluation, our management concluded that our internal control over financial reporting was effective as of
December 31, 2014
.
We intend to regularly review and evaluate the design and effectiveness of our disclosure controls and procedures and internal control over financial reporting on an ongoing basis and to improve these controls and procedures over time and to correct any deficiencies that we may discover in the future. While we believe the present design of our disclosure controls and procedures and internal control over financial reporting are effective, future events affecting our business may cause us to modify our controls and procedures.
The Company's independent registered public accounting firm has issued an attestation report regarding its assessment of the effectiveness of the Company's internal control over financial reporting as of
December 31, 2014
.
83
REPORT OF INDEPENDENT REGISTERED PUBLIC ACCOUNTING FIRM
The Board of Directors and Shareholders
Alaska Air Group, Inc.:
We have audited Alaska Air Group, Inc.’s internal control over financial reporting as of December 31, 2014, based on
criteria established in
Internal Control - Integrated Framework (2013)
issued by the Committee of Sponsoring Organizations of the Treadway Commission (COSO). Alaska Air Group, Inc.’s management is responsible for maintaining effective internal control over financial reporting and for its assessment of the effectiveness of internal control over financial reporting, included in the accompanying Management’s Report on Internal Control over Financial Reporting (included in Item 9A). Our responsibility is to express an opinion on the Company’s internal control over financial reporting based on our audit.
We conducted our audit in accordance with the standards of the Public Company Accounting Oversight Board (United States). Those standards require that we plan and perform the audit to obtain reasonable assurance about whether effective internal control over financial reporting was maintained in all material respects. Our audit included obtaining an understanding of internal control over financial reporting, assessing the risk that a material weakness exists, and testing and evaluating the design and operating effectiveness of internal control based on the assessed risk. Our audit also included performing such other procedures as we considered necessary in the circumstances. We believe that our audit provides a reasonable basis for our opinion.
A company’s internal control over financial reporting is a process designed to provide reasonable assurance regarding the reliability of financial reporting and the preparation of financial statements for external purposes in accordance with generally accepted accounting principles. A company’s internal control over financial reporting includes those policies and procedures that (1) pertain to the maintenance of records that, in reasonable detail, accurately and fairly reflect the transactions and dispositions of the assets of the company; (2) provide reasonable assurance that transactions are recorded as necessary to permit preparation of financial statements in accordance with generally accepted accounting principles, and that receipts and expenditures of the company are being made only in accordance with authorizations of management and directors of the company; and (3) provide reasonable assurance regarding prevention or timely detection of unauthorized acquisition, use, or disposition of the company’s assets that could have a material effect on the financial statements.
Because of its inherent limitations, internal control over financial reporting may not prevent or detect misstatements. Also, projections of any evaluation of effectiveness to future periods are subject to the risk that controls may become inadequate because of changes in conditions, or that the degree of compliance with the policies or procedures may deteriorate.
In our opinion, Alaska Air Group, Inc. maintained, in all material respects, effective internal control over financial reporting as of December 31, 2014, based on criteria established in
Internal Control - Integrated Framework
(2013)
issued by the Committee of Sponsoring Organizations of the Treadway Commission.
We also have audited, in accordance with the standards of the Public Company Accounting Oversight Board (United States), the consolidated balance sheets of Alaska Air Group, Inc. and subsidiaries as of December 31, 2014 and 2013, and the related consolidated statements of operations, comprehensive operations, shareholders’ equity, and cash flows for each of the years in the three-year period ended December 31, 2014, and our report dated February 11, 2015 expressed an unqualified opinion on those consolidated financial statements.
/s/ KPMG LLP
Seattle, Washington
February 11, 2015
84
|
|
None.
|
|
See “Executive Officers of the Registrant” under Item 1, “Our Business,” in Part I of this Form 10-K for information on the executive officers of Air Group and its subsidiaries. Except as provided herein, the remainder of the information required by this item is incorporated herein by reference from the definitive Proxy Statement for Air Group's
2015
Annual Meeting of Stockholders to be filed with the Securities and Exchange Commission within 120 days after the end of the fiscal year ended
December 31, 2014
(hereinafter referred to as our “
2015
Proxy Statement”).
|
|
The information required by this item is incorporated herein by reference from our
2015
Proxy Statement.
|
|
Securities Authorized for Issuance Under Equity Compensation Plans
|
Number of securities to be issued upon exercise of outstanding options, warrants and rights
|
Weighted-average exercise price of outstanding options, warrants and rights
|
Number of securities remaining available for future issuance under equity compensation plans (excluding securities reflected in column (a))
|
|||||
|
Plan category
|
(a)
|
(b)
|
(c)
|
||||
|
Equity compensation plans approved by security holders
|
1,920,362
(1)
|
|
$21.57
(2)
|
16,914,785
(3)
|
|
||
|
Equity compensation plans not approved by security holders
|
—
|
|
Not applicable
|
—
|
|
||
|
Total
|
1,920,362
|
|
$21.57
|
16,914,785
|
|
||
|
(1)
|
Of these shares, 670,368 subject to options then outstanding under the 2008 Plan, and 1,212,674 were subject to outstanding restricted, performance and deferred stock unit awards granted under the 2008 Plan. In addition, 37,320 were subject to options then outstanding under the 2004 Plan. Outstanding performance awards are reflected in the table assuming that the target level of performance will be achieved. No new award of grants may be made under the 2004 Plan.
|
|
(2)
|
This number does not reflect the 1,212,674 shares that were subject to outstanding stock unit awards granted under the 2008 Plan.
|
|
(3)
|
Of the aggregate number of shares that remained available for future issuance, 10,200,360 shares were available under the 2008 Plan and 6,795,273 shares were available under the ESPP. Subject to certain express limits of the 2008 Plan, shares available for award purposes under the 2008 Plan generally may be used for any type of award authorized under that plan including options, stock appreciation rights, and other forms of awards granted or denominated in shares of our common stock including, without limitation, stock bonuses, restricted stock, restricted stock units and performance shares. Full-value shares issued under the 2008 Plan are counted against the share limit as 1.7 shares for every one share issued. This table does not give effect to that rule.
|
Other information required by this item is set forth under the heading “Beneficial Ownership of Securities” in our
2015
Proxy Statement and is incorporated by reference.
85
|
|
The information required by this item is incorporated herein by reference from our
2015
Proxy Statement.
|
|
The information required by this item is incorporated herein by reference from our
2015
Proxy Statement.
|
|
The following documents are filed as part of this report:
|
1.
|
Exhibits:
See Exhibit Index.
|
86
SIGNATURES
Pursuant to the requirements of Section 13 or 15(d) of the Securities Exchange Act of 1934, the registrant has duly caused this report to be signed on its behalf by the undersigned, thereunto duly authorized.
|
|
|
|
|
|
|
ALASKA AIR GROUP, INC.
|
|
|||
|
|
|
|
||
|
By:
|
/s/ BRADLEY D. TILDEN
|
|
Date:
|
February 11, 2015
|
|
|
Bradley D. Tilden
|
|
|
|
|
|
President and Chief Executive Officer
|
|
|
|
Pursuant to the requirements of the Securities Exchange Act of 1934, this report has been signed below by the following persons on
February 11, 2015
on behalf of the registrant and in the capacities indicated.
87
|
/s/ BRADLEY D. TILDEN
|
Chairman, President, and Chief Executive Officer
(Principal Executive Officer)
|
|
|
Bradley D. Tilden
|
||
|
|
|
|
|
/s/ BRANDON S. PEDERSEN
|
Executive Vice President/Finance and Chief Financial Officer
(Principal Financial and Accounting Officer)
|
|
|
Brandon S. Pedersen
|
||
|
/s/ PATRICIA M. BEDIENT
|
Director
|
|
|
Patricia M. Bedient
|
||
|
|
|
|
|
/s/ MARION C. BLAKEY
|
Director
|
|
|
Marion C. Blakey
|
||
|
|
|
|
|
/s/ PHYLLIS J. CAMPBELL
|
Director
|
|
|
Phyllis J. Campbell
|
||
|
/s/ DHIREN R. FONSECA
|
Director
|
|
|
Dhiren R. Fonseca
|
||
|
|
|
|
|
/s/ JESSIE J. KNIGHT, JR.
|
Director
|
|
|
Jessie J. Knight, Jr.
|
||
|
|
|
|
|
/s/ DENNIS F. MADSEN
|
Director
|
|
|
Dennis F. Madsen
|
||
|
|
|
|
|
/s/ HELVI K. SANDVIK
|
Director
|
|
|
Helvi K. Sandvik
|
||
|
/s/ KATHERINE J. SAVITT
|
Director
|
|
|
Katherine J. Savitt
|
||
|
/s/ J. KENNETH THOMPSON
|
Director
|
|
|
J. Kenneth Thompson
|
||
|
/s/ ERIC K. YEAMAN
|
Director
|
|
|
Eric K. Yeaman
|
||
88
EXHIBIT INDEX
Certain of the following exhibits have heretofore been filed with the Securities and Exchange Commission and are incorporated by reference from the documents below. Certain others are filed herewith. The exhibits are numbered in accordance with Item 601 of Regulation S-K.
|
Exhibit
Number
|
Exhibit
Description
|
Form
|
Date of
First Filing
|
Exhibit
Number
|
File
Number
|
|
3.1
|
Amended and Restated Certificate of Incorporation of Registrant
|
10-Q
|
August 6, 2014
|
3.1
|
|
|
3.2
|
Bylaws of Registrant, as amended April 30, 2010
|
8-K
|
May 3, 2010
|
3.2
|
|
|
10.1#
|
Aircraft General Terms Agreement, dated June 15, 2005, between the Boeing Company and Alaska Airlines, Inc.
|
10-Q
|
August 5, 2005
|
10.1
|
|
|
10.2#
|
Purchase Agreement No. 2497, dated June 15, 2005, between the Boeing Company and Alaska Airlines, Inc.
|
10-Q
|
August 5, 2005
|
10.2
|
|
|
10.3#
|
Supplemental Agreement No. 23 to Purchase Agreement No. 2497 between The Boeing Company and Alaska Airlines, Inc.
|
10-Q/A
|
August 2, 2011
|
10.1
|
|
|
10.4#
|
Supplemental Agreement No. 29 to Purchase Agreement No. 2497 between The Boeing Company and Alaska Airlines, Inc.
|
10-K
|
February 14, 2013
|
10.1
|
|
|
10.5#
|
Purchase Agreement No. 3866 between The Boeing Company and Alaska Airlines, Inc.
|
10-K
|
February 14, 2013
|
10.2
|
|
|
10.6*
|
Alaska Air Group Performance Based Pay Plan (formerly "Management Incentive Plan"), as amended and restated February 11, 2014
|
10-Q
|
May 9, 2014
|
10.1
|
|
|
10.7*†
|
Alaska Air Group Performance Based Pay Plan Annex
|
10-K
|
February 11, 2015
|
||
|
10.8*
|
Alaska Air Group, Inc. 2004 Long-Term Incentive Plan Nonqualified Stock Option Agreement
|
10-K
|
February 20, 2008
|
10.8.1
|
|
|
10.9*
|
Alaska Air Group, Inc. 2008 Performance Incentive Plan, Form of Nonqualified Stock Option Agreement
|
10-Q
|
August 4, 2011
|
10.3
|
|
|
10.10*
|
Alaska Air Group, Inc. 2008 Performance Incentive Plan, Form of Performance Stock Unit Award Agreement
|
10-Q
|
August 4, 2011
|
10.4
|
|
|
10.11*
|
Alaska Air Group, Inc. 2008 Performance Incentive Plan, Form of Stock Unit Award Agreement
|
10-Q
|
August 4, 2011
|
10.5
|
|
|
10.12*
|
Alaska Air Group, Inc. 2008 Performance Incentive Plan, Form of Stock Unit Award Agreement Incentive Award
|
10-Q
|
August 4, 2011
|
10.6
|
|
|
10.13*†
|
Alaska Air Group, Inc. 2008 Performance Incentive Plan, Amended for Stock-Split
|
10-K
|
February 11, 2015
|
||
|
10.14*†
|
Alaska Air Group, Inc. 2010 Employee Stock Purchase Plan, Amended for Stock-Split
|
10-K
|
February 11, 2015
|
||
|
10.15*†
|
Alaska Air Group, Inc. Stock Deferral Plan for Non-Employee Directors
|
10-K
|
February 11, 2015
|
||
|
10.16*
|
Alaska Air Group, Inc. Nonqualified Deferred Compensation Plan, as amended
|
10-Q
|
August 4, 2011
|
10.1
|
|
|
10.17*
|
1995 Elected Officers Supplementary Retirement Plan, as amended
|
10-Q
|
August 4, 2011
|
10.2
|
|
|
10.18*†
|
Form of Alaska Air Group, Inc. Change of Control Agreement for named executive officers, as amended and restated October 16, 2014
|
10-K
|
February 11, 2015
|
||
|
21†
|
Subsidiaries of Registrant
|
||||
|
23.1†
|
Consent of Independent Registered Public Accounting Firm (KPMG LLP)
|
||||
|
31.1†
|
Certification of Chief Executive Officer Pursuant to Section 302 of the Sarbanes-Oxley Act of 2002
|
||||
|
31.2†
|
Certification of Chief Financial Officer Pursuant to Section 302 of the Sarbanes-Oxley Act of 2002
|
||||
|
32.1†
|
Certification of Chief Executive Officer Pursuant to 18 U.S.C. Section 1350, as adopted pursuant to Section 906 of the Sarbanes-Oxley Act of 2002
|
||||
|
32.2†
|
Certification of Chief Financial Officer Pursuant to 18 U.S.C. Section 1350, as adopted pursuant to Section 906 of the Sarbanes-Oxley Act of 2002
|
||||
|
101.INS†
|
XBRL Instance Document
|
||||
|
101.SCH†
|
XBRL Taxonomy Extension Schema Document
|
||||
|
101.CAL†
|
XBRL Taxonomy Extension Calculation Linkbase Document
|
||||
89
|
101.DEF†
|
XBRL Taxonomy Extension Definition Linkbase Document
|
||||
|
101.LAB†
|
XBRL Taxonomy Extension Label Linkbase Document
|
||||
|
101.PRE†
|
XBRL Taxonomy Extension Presentation Linkbase Document
|
||||
|
†
|
Filed herewith
|
||||
|
*
|
Indicates management contract or compensatory plan or arrangement.
|
||||
|
#
|
Pursuant to 17 CFR 240.24b-2, confidential information has been omitted and filed separately with the Securities and Exchange Commission pursuant to a Confidential Treatment Application filed with the Commission.
|
||||
90
TABLE OF CONTENTS
Part IItem 1. Our BusinessItem 1A. Risk FactorsItem 1B. Unresolved Staff CommentsItem 2. PropertiesItem 3. Legal ProceedingsItem 4. Mine Safety DisclosuresPart IIItem 5. Market For The Registrant S Common Equity, Related Stockholder Matters, and Issuer Purchases Of Equity SecuritiesItem 6. Selected Financial and Operating DataItem 7. Management S Discussion and Analysis Of Financial Condition and Results Of OperationsItem 7A. Quantitative and Qualitative Disclosure About Market RiskItem 8. Consolidated Financial Statements and Supplementary DataNote 1. General and Summary Of Significant Accounting PoliciesNote 2. Cash, Cash Equivalents and Marketable SecuritiesNote 3. Derivative InstrumentsNote 4. Fair Value MeasurementsNote 5. Assets Constructed For OthersNote 6. Long-term DebtNote 7. Income TaxesNote 8. Employee Benefit PlansNote 9. Commitments and ContingenciesNote 10. Shareholders' EquityNote 11. Special ItemsNote 12. Stock-based Compensation PlansNote 13. Operating Segment InformationItem 9. Changes in and Disagreements with Accountants on Accounting and Financial DisclosureItem 9A. Controls and ProceduresItem 9B. Other InformationPart IIIItem 10. Directors, Executive Officers and Corporate GovernanceItem 11. Executive CompensationItem 12. Security Ownership Of Certain Beneficial Owners and Management, and Related Stockholder MattersItem 13. Certain Relationships and Related Transactions, and Director IndependenceItem 14. Principal Accountant Fees and ServicesPart IVItem 15. Exhibits